annual report - welcome to minotaur exploration ... resources ltd and its exploration assets in...
TRANSCRIPT

M I N O T A U R E X P L O R A T I O N L I M I T E D
O C T O B E R 2 0 1 4
w w w . m i n o t a u r e x p l o r a t i o n . c o m . a u
Chairman’s Review, p.1 Review of Operations, p.8
ANNUALREPORT
Forward Outlook, p.11
MINOTAUREXPLORATION
MINOTAUR EXPLORATION LIMITED
ACN 108 483 601
ASX CODE MEP
DIRECTORS
Mr Derek Carter Chairman
Mr Andrew Woskett Managing Director
Dr Antonio Belperio Executive Director
Mr Richard Bonython Non-Executive Director
Mr John Atkins Non-Executive Director(Appointed 20 November 2013)
COMPANY SECRETARY
Mr Donald Stephens
REGISTERED OFFICE
c/o HLB Mann Judd (SA) Pty Ltd
169 Fullarton Road
DULWICH SA 5065
PRINCIPAL PLACE OF BUSINESS
Level 1, 8 Beulah Road
NORWOOD SA 5067
SHARE REGISTER
Computershare Investor Securities Pty Ltd
Level 5, 115 Grenfell Street
ADELAIDE SA 5000
LEGAL ADVISORS
O’Loughlins Lawyers
Level 2, 99 Frome Street
ADELAIDE SA 5000
BANKERS
National Australia Bank
22-28 King William Street
ADELAIDE SA 5000
AUDITORS
Grant Thornton Audit Pty Ltd
Level 1, 67 Greenhill Road
WAYVILLE SA 5034
www.minotaurexploration.com.au
CONTENTS
Chairman’s Review 1
Managing Director’s Report 3
Directors’ Report 7
Auditor’s Independence Declaration 17
Corporate Governance 18
Financial Report 23
ASX Additional Information 61
Interests in Mining Tenements 61
Information on Shareholdings 64
This annual report covers both Minotaur Exploration Ltd (ABN 35 108 483 601) as an individual entity and the consolidatedgroup (‘Group’) comprising Minotaur Exploration Ltd and its subsidiaries. The Group’s functional and presentation currency is Australian dollars.
A description of the Group’s operations and of its principal activities is included in the review of operations and activities in the Directors’ Report on pages 8 to 10. The Directors’ Report is not part of the financial report.
PAGE 3Managing Director’s Report
PAGE 7Directors’ Report
PAGE 23Financial Report
CORPORATE DIRECTORY
MINOTAUREXPLORATION

CHAIRMAN’SREview
D E R E K C A R T E R C H A I R M A N M I N O T A U R E X P L O R A T I O N L I M I T E D
Minotaur entered an expansionaryperiod in the 2014 financial year,the benefits of which have swiftlybeen realised. Integration of Breakaway Resources Ltd and its exploration assets in December2013 significantly contributed to an uplift in Minotaur’s enterprisevalue.
Minotaur moved immediately to implement two new joint ventures onBreakaway’s tenements. The impactof those actions was pronounced and positive. Early gold explorationresults on tenements near Leinsterwere encouraging and geophysicalsurveys over the Eloise area revealeda trove of strong anomalies.
A detailed review of nickel prospec-tivity in the Leinster area quicklyhighlighted the untapped potentialavailable due to the quality, but incomplete, historic exploration byBreakaway and its predecessors. The rising nickel price coincidednicely with that assessment and gaveus cause to elevate nickel explorationoptions into the planning mix for 2014-15.
Results flowed rapidly at Eloise. Drilltesting of a number of geophysicaltargets resulted in the ‘Artemis’ copper-gold-silver-zinc discovery,where high-grade massive sulphidemineralisation was intersected in three drill holes to 200m depthbelow surface. Work continues tooutline the scale of this deposit, theproof of which will be uncovered during the new financial year.
I am pleased to acknowledge thecontribution of GFR, our Eloise Copper joint venture partner, which is sole funding exploration on thatproject.
The market’s reaction to the discovery news was confirmation that speculative investment support is available for explorers.
Minotaur’s share price, having increased 105% over the day of the discovery announcement, gave it due recognition, althoughyour directors were subsequently bemused by the 35% drop in value prompted by the 3rd and still high-grade drill result.
As shareholders too, directors takethe view that the market continues to under-value the discovery andlook with interest towards a moresupportive rating as exploration news emerges.
The Artemis mineralisation, which lies in a similar geological setting tothe nearby Eloise and Sandy Creekdeposits, highlights the prospectivityof the region.
Many EM targets are yet to be drilledand the joint venture is preparing to intensify the work level on the tenements.
This could result in our joint venturepartner reaching its 50% earn-in ceiling two years earlier than originally envisaged, which woulddemonstrate tangible evidence of the project’s potential.
“The Breakaway
acquisition
gives Minotaur
exposure to
the goldfields of
Western Australia
and opens up
a range of
new exploration
options.”
1
Eloise-style copper mineralisation.

2
CHAIRMAN’SREviewMinotaur holds other copper-goldprospective tenements around Cloncurry, either 100% held or in joint venture with JOGMEC whosestrong project investment supportcontinues, and for which we are most appreciative. We are keen toreplicate the Artemis success for JOGMEC and on our own ground into 2015.
The directors continue to assess theCompany’s asset portfolio. We haveprogressively reduced our investmentexposure to fellow listed explorers as they mature their own businessplans. In addition, we are deliberatelypositioning non-core industrial minerals assets for possible divestment. These moves are part ofthe strategy to re-position Minotauras a focused copper-gold-nickel explorer with development ambitionsdirected to its own discoveries.
The year ahead shows great promise for Minotaur to deliver onthose objectives.
I wish to thank all our staff for theircontinuing efforts and to acknowledge our shareholders, including the new ex Breakawayshareholders, whose support enables the Company to operate.
Yours truly,Derek CarterChairman
MINOTAUREXPLORATION
Investing in Copper-GoldExploration
Cloncurry Cu-Au exploration joint ventures/opportunities
• Ernest (242 km2)
• Naraku (651 km2)
• Osborne (2,228 km2)
• Eloise (399 km2)
Each project is focussed around a known Cu-Au mineralisation centre.
Minotaur has a proven track record in managingexploration joint ventures on behalf of investorswith resultant exploration success and mutuallybeneficial outcomes.

ManagingDIRECTOR’SREPORT
A N D R E W W O S K E T T M A N A G I N G D I R E C T O R M I N O T A U R E X P L O R A T I O N L I M I T E D
3
Reflecting on Minotaur’s key achievements through the 2014 financial year provides context for the year ahead. In December 2013the all-scrip acquisition of BreakawayResources Limited concluded. Breakaway shareholder support was very strong and the transactionresulted in significant uplift in Minotaur’s market capitalisation,about twice the effective purchasecost, from which it can be concludedthe deal was value accretive to theenlarged group.
We moved quickly to extract valuefrom Breakaway’s assets, initiatingnew joint venture activity over boththe copper-gold prospective Eloisetenements (Queensland) and the Leinster to Scotia nickel-goldprospective tenements (Western Australia). In each case, the supportof our new joint venture partner wasrewarded with credible success andidentification of forward prospects.
Integration of Breakaway’s projectsbrought focus to Minotaur’s businessplans. We purposefully articulated the progression of base metals-goldexploration in those regions as theCompany’s key tenets, while down-grading the portfolio importance ofperipheral assets such as industrialminerals and magnetite iron.
Coincidentally, fortune accompaniedthat message: the nickel price rose toabout US$19,000 per tonne and theArtemis copper-gold-silver discoveryunfolded. These events helped catapault the Company’s marketvalue by over 200% in July 2014.
With that background, our work activity level going into the new financial year warrants scaling up. We see multiple opportunities to convert risk into reward and promiseinto reality within our key projectareas. While some of our peers areforced to reduce their explorationspend Minotaur’s Board firmly believes the Company should activelypursue its mandate.
We understand that the only wayshareholders in like companies can be rewarded for their investment isthrough discovery success and transition to production. Minotaur aspires to both outcomes.
As the Company approaches its tenthanniversary as an ASX listed entity (in February 2015) the motivation tosucceed is stronger than ever.
• Breakaway Resources was removed from the ASX official list after Minotaur’s takeovercompleted.
“We understand
that the only way
shareholders in
like companies can
be rewarded for
their investment
is through
discovery success
and transition to
production.”
Artemis copper gold zinc mineralisation
Business REVIEW
corporate HIGHLIGHTS
ManagingDIRECTOR’SREPORT
4
corporate HIGHLIGHTS
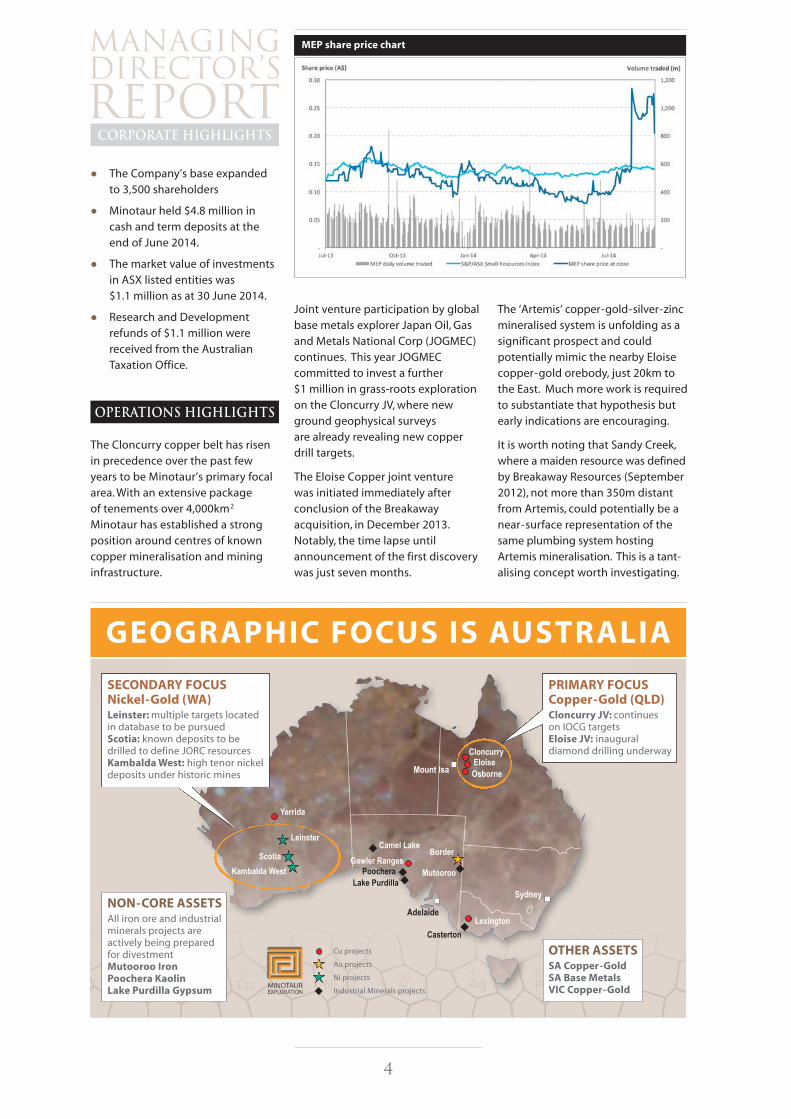
• The Company’s base expanded to 3,500 shareholders
• Minotaur held $4.8 million in cash and term deposits at the end of June 2014.
• The market value of investmentsin ASX listed entities was $1.1 million as at 30 June 2014.
• Research and Development refunds of $1.1 million were received from the Australian Taxation Office.
The Cloncurry copper belt has risen in precedence over the past few years to be Minotaur’s primary focalarea. With an extensive package of tenements over 4,000km2
Minotaur has established a strong position around centres of known copper mineralisation and mining infrastructure.
Joint venture participation by globalbase metals explorer Japan Oil, Gasand Metals National Corp (JOGMEC)continues. This year JOGMEC committed to invest a further $1 million in grass-roots explorationon the Cloncurry JV, where newground geophysical surveys are already revealing new copper drill targets.
The Eloise Copper joint venture was initiated immediately after conclusion of the Breakaway acquisition, in December 2013. Notably, the time lapse until announcement of the first discoverywas just seven months.
The ‘Artemis’ copper-gold-silver-zincmineralised system is unfolding as asignificant prospect and could potentially mimic the nearby Eloisecopper-gold orebody, just 20km tothe East. Much more work is requiredto substantiate that hypothesis butearly indications are encouraging.
It is worth noting that Sandy Creek,where a maiden resource was definedby Breakaway Resources (September2012), not more than 350m distantfrom Artemis, could potentially be anear-surface representation of thesame plumbing system hostingArtemis mineralisation. This is a tant-alising concept worth investigating.
operations HIGHLIGHTS
Mount Isa
CloncurryEloiseOsborne
CastertonLexington
Gawler RangesCamel Lake
Border
MutoorooPoocheraLake Purdilla
Leinster
Kambalda WestScotia
Yerrida
Adelaide
Sydney
Cu projects
Au projects
Ni projects
Industrial Minerals projects
GEOGRAPHIC FOCUS IS AUSTRALIA
NON-CORE ASSETSAll iron ore and industrial minerals projects are actively being prepared for divestmentMutooroo IronPoochera KaolinLake Purdilla Gypsum
OTHER ASSETSSA Copper-GoldSA Base MetalsVIC Copper-Gold
SECONDARY FOCUS Nickel-Gold (WA)Leinster: multiple targets located in database to be pursuedScotia: known deposits to be drilled to define JORC resourcesKambalda West: high tenor nickeldeposits under historic mines
PRIMARY FOCUS Copper-Gold (QLD)Cloncurry JV: continues on IOCG targetsEloise JV: inaugural diamond drilling underway
MEP share price chart

5
Minotaur Cu-Au projects in the Cloncurry region.
The Eloise Project, one of four Minotaur Cu-Au projects in the Cloncurry region, includingEloise Copper Joint Venture tenements.
Artemis discovery core.
Jim Kouvoussis (Financial Controller) and Ella Renfrey (Administrative Assistant).
Diamond drilling, Cloncurry.

In Western Australia’s renowned eastern goldfields, Minotaur acquiredan enviable ground position.
The Company’s tenement packagesand mineral interests sit along thefertile nickel ultramafic belt betweenLeinster and Kambalda, where nickel-gold mineralisation is well documented and yet where activityon these tenements over recent yearshas been inadequate or incomplete.
We see excellent potential, within the extensive exploration databaseinherited from Breakaway, to locatemultiple new prospects and also theopportunity to convert known nickeldeposits into contemporary JORC resource assets through systematicfollow-on exploration. With enduringstrength in the nickel metal priceMinotaur will seek to unlock valuefrom its nickel assets and their oftenco-related gold occurrences.
Andrew WoskettManaging Director
Competent Persons’ Statements
Information in this section that relates to Exploration Results, Mineral Resources or Ore Reserves is based on information compiled by Dr A. P. Belperio, a director and full-time employee of the Company and a Fellow of the Australasian Institute of Mining and Metallurgy (AusIMM). Dr Belperio has sufficient experience relevant to the style of mineralisation and type of depositunder consideration and to the activity that he is undertaking to qualify as a Competent Person asdefined in the 2004 Edition of the Australasian Code for Reporting of Exploration Results, MineralResources and Ore Reserves (JORC Code). Dr Belperio consents to inclusion in this document of the information in the form and context in which it appears.
Tenement holdings and interests in Western Australia.
ManagingDIRECTOR’SREPORT
operations HIGHLIGHTS
Leinster drilling
6

DIRECTORS’REPORT
M I N O T A U R E X P L O R A T I O N L I M I T E D
7
Your Directors present their reporton the consolidated group for thefinancial year ended 30 June 2014.
DIRECTOR DETAILS
The names of the Directors in officeat any time during, or since the endof, the year are:
Mr Derek CarterChairman
Mr Andrew WoskettManaging Director
Dr Antonio BelperioExecutive Director
Mr Richard BonythonNon-Executive Director
Mr John AtkinsNon-Executive Director(Appointed 20 November 2013)
Directors have been in office sincethe start of the financial year to the date of this report unless otherwise stated.
Names, qualifications, experienceand special responsibilites
Mr Derek Carter BSc, MSc, FAusIMM (CP)
(Chairman)
Derek Carter has over 40 years experience in exploration and mininggeology and management. He heldsenior positions in the Shell Group of Companies and Burmine Ltd before founding Minotaur Gold Ltd in 1993.
He is currently Chairman of MinotaurExploration Ltd and Highfield Resources Ltd and a former Chairmanof Petratherm Ltd (resigned 31 March2014). He is a board member ofMithril Resources Ltd and BlackthornResources Ltd and a former boardmember of Toro Energy Ltd (resigned28 November 2012), all ASX listedcompanies. Mr Carter is a formerPresident and Vice President of theSouth Australian Chamber of Minesand Energy, former board member of the Australian Gold Council, is a member of the South Australian Resources Development Board and the South Australian Mineralsand Petroleum Experts Group, and a former Chairman of the Minerals Exploration Advisory Group.
He was awarded AMEC’s Prospectorof the Year Award (jointly) in 2003and is a Centenary Medallist. As Chairman of Minotaur ExplorationLtd, he is responsible for the management of the board as well as the general strategic direction of the Company.
Mr Andrew Woskett B Eng, M Comm Law
(Managing Director)
Andrew Woskett has over 30 yearsproject and corporate experience in the mining industry. He held senior responsibility for a variety of Australian mining landmarks, including development of the Kalgoorlie Super Pit, Kanowna Belle and Marymia gold mines and numerous expansions of theBougainville copper-gold mine. As Managing Director of BallaratGoldfields NL, he instituted underground development of thelong-dormant Ballarat goldfield. He prepared development strategies for the proposed open pitdevelopment of the Olympic Dammine and formulated several newiron ore projects in Western Australia.
Andrew is a Fellow of the AustralasianInstitute of Mining and Metallurgy.
review of operations
8
DIRECTOR DETAILS
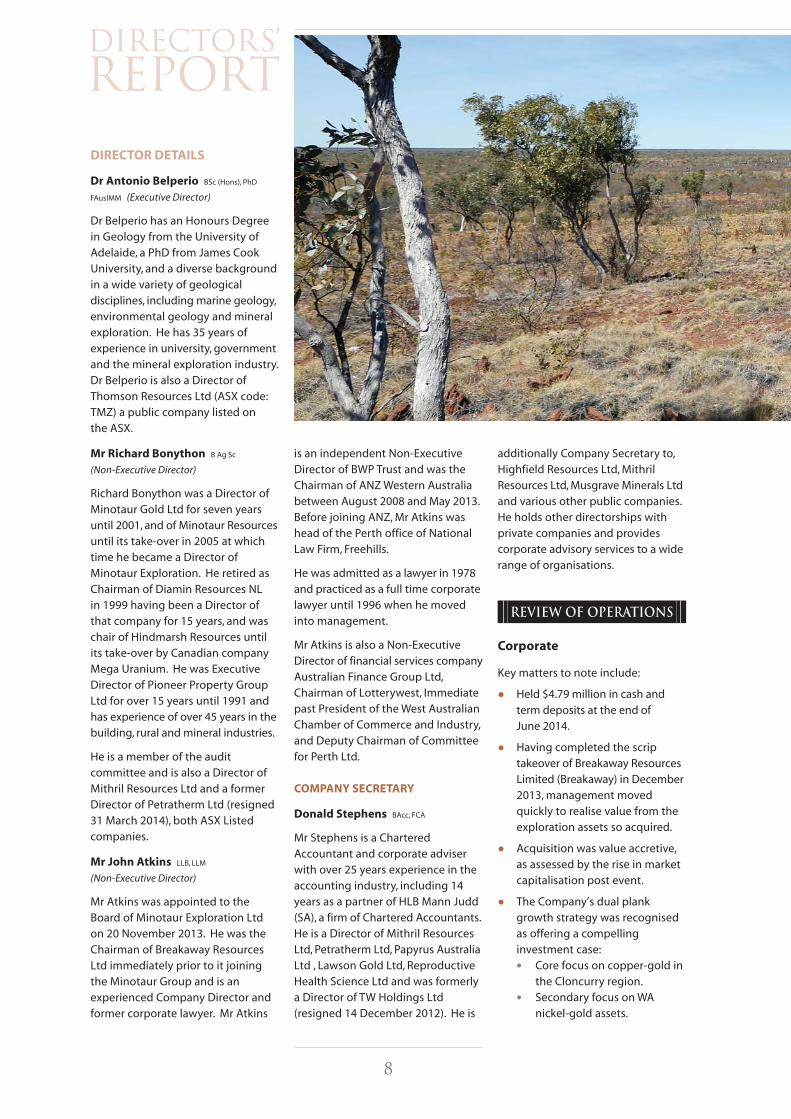
Dr Antonio Belperio BSc (Hons), PhD
FAusIMM (Executive Director)
Dr Belperio has an Honours Degree in Geology from the University ofAdelaide, a PhD from James CookUniversity, and a diverse backgroundin a wide variety of geological disciplines, including marine geology,environmental geology and mineralexploration. He has 35 years of experience in university, governmentand the mineral exploration industry.Dr Belperio is also a Director of Thomson Resources Ltd (ASX code:TMZ) a public company listed on the ASX.
Mr Richard Bonython B Ag Sc
(Non-Executive Director)
Richard Bonython was a Director ofMinotaur Gold Ltd for seven yearsuntil 2001, and of Minotaur Resourcesuntil its take-over in 2005 at whichtime he became a Director of Minotaur Exploration. He retired asChairman of Diamin Resources NL in 1999 having been a Director of that company for 15 years, and waschair of Hindmarsh Resources until its take-over by Canadian companyMega Uranium. He was Executive Director of Pioneer Property GroupLtd for over 15 years until 1991 andhas experience of over 45 years in thebuilding, rural and mineral industries.
He is a member of the audit committee and is also a Director ofMithril Resources Ltd and a former Director of Petratherm Ltd (resigned31 March 2014), both ASX Listed companies.
Mr John Atkins LLB, LLM
(Non-Executive Director)
Mr Atkins was appointed to the Board of Minotaur Exploration Ltd on 20 November 2013. He was theChairman of Breakaway ResourcesLtd immediately prior to it joining the Minotaur Group and is an experienced Company Director andformer corporate lawyer. Mr Atkins
is an independent Non-Executive Director of BWP Trust and was theChairman of ANZ Western Australiabetween August 2008 and May 2013.Before joining ANZ, Mr Atkins washead of the Perth office of NationalLaw Firm, Freehills.
He was admitted as a lawyer in 1978and practiced as a full time corporatelawyer until 1996 when he movedinto management.
Mr Atkins is also a Non-Executive Director of financial services companyAustralian Finance Group Ltd, Chairman of Lotterywest, Immediatepast President of the West AustralianChamber of Commerce and Industry,and Deputy Chairman of Committeefor Perth Ltd.
COMPANY SECRETARY
Donald Stephens BAcc, FCA
Mr Stephens is a Chartered Accountant and corporate adviserwith over 25 years experience in theaccounting industry, including 14years as a partner of HLB Mann Judd(SA), a firm of Chartered Accountants.He is a Director of Mithril ResourcesLtd, Petratherm Ltd, Papyrus AustraliaLtd , Lawson Gold Ltd, ReproductiveHealth Science Ltd and was formerlya Director of TW Holdings Ltd (resigned 14 December 2012). He is
additionally Company Secretary to,Highfield Resources Ltd, Mithril Resources Ltd, Musgrave Minerals Ltdand various other public companies.He holds other directorships with private companies and provides corporate advisory services to a widerange of organisations.
Corporate
Key matters to note include:
• Held $4.79 million in cash andterm deposits at the end of June 2014.
• Having completed the scriptakeover of Breakaway ResourcesLimited (Breakaway) in December2013, management movedquickly to realise value from theexploration assets so acquired.
• Acquisition was value accretive, as assessed by the rise in marketcapitalisation post event.
• The Company’s dual plank growth strategy was recognisedas offering a compelling investment case:
• Core focus on copper-gold inthe Cloncurry region.
• Secondary focus on WAnickel-gold assets.
DIRECTORS’REPORT

The joint venture committed to a new budget of $1 million from Julythrough to March 2015. Drilling plansare being drawn up.
At the new Eloise Copper joint venture (MEP 100% and diluting) several ground EM surveys over recent airborne EM generated targets resolved numerous anomalies requiring drill follow up. An inauguraldrilling campaign commenced inJune and one such target delivered anew copper-gold-zinc discoverynamed ‘Artemis’.
A new joint venture over the Leinsternickel-gold tenements in WA (MEP 100% and diluting) received immediate field attention with aircore drilling of 7 target zones completed. Several anomalous goldintersections were reported, warranting follow-up. Lag and soilsampling over new gold prospectiveareas was underway at the end of the financial year.
Breakaway’s extensive explorationdatabase, for the Leinster and Scotiaareas, was evaluated for nickelprospectivity. Multiple targets wereselected for investigation. Theserange from grass roots to early to late stage prospects plus several
advanced projects where deposits ofknown mineralisation included high-tenor massive sulphides in ultramafic rocks. The nickel prospectsare generally coincident with gold mineralisation and warrant, especially in view of the current highnickel metal price of circa US$18,500per tonne, intensive exploration attention.
At West Kambalda, Minotaur retainsnickel rights on ten tenementsowned by Tychean Resources Ltd plus a royalty on minerals other thannickel. Recent RC drilling by Tycheanbeneath the historic 5B mine returned strong nickel and gold results. A production sized declineinto the mineralised zone and belowprovides an ideal platform for resource drilling.
In Victoria, work on porphyry copperprospective tenements in the Stavely - Ararat district (MEP 100%)was put on hold while newly listedneighbours, Stavely Minerals Ltd andNavarre Minerals Ltd, conduct theirdrill programmes. Exploration successfor Stavely and/or Navarre will promote the value of and investmentcase for further work on Minotaur’sground.
9
Exploration
Exploration activity primarily focusedon copper-gold in New South Wales,South Australia and Queensland andon newly acquired gold prospects inWestern Australia.
At the Arthurville porphyry copperprospect in New South Wales, severaltargets were drilled but failed to deliver strong porphyry style alteration. The joint venture with Mitsubishi was terminated by mutualagreement.
Gold and base metals IP targets inSouth Australia, west of Broken Hill,were drilled with encouraging gold intersections reported on two anomalies at the Bonython Hill tenement. Further mapping and sampling indicates the potential forsignificant strike outcrop of BrokenHill style mineralisation.
Several copper-gold projects in the Cloncurry region, western Queensland, formed the core of thecompany’s exploration focus. At the Cloncurry joint venture (MEP49% and diluting, JOGMEC 51%) new EM surveys were carried out andseveral IOCG style targets identified.

10
review of operations
Project Development
Poochera Kaolin Project
Market assessment of kaolin properties and market openings continued, including ongoing discussions with several off-shorekaolin consumers and kaolin producers. The Company is steadilyworking towards a trade sale or engaging an in-bound investmentpartner to fund project development.
OPERATING RESULTS
The consolidated loss of the Group after providing for income tax amountedto $2,666,811 (2013: $3,127,675).
INTERESTS IN THE SHARES AND OPTIONS OF THE COMPANY ANDRELATED BODIES CORPORATE
As at the date of this report, the interests of the Directors in the shares and options of Minotaur Exploration Ltd were:
DIVIDENDS PAID OR RECOMMENDED
No dividends were paid or declared since the start of the financial year. No recommendation for payment of dividends has been made.
PRINCIPAL ACTIVITIES
The principal activities of the consolidated Group during the financial year were:
• To secure new tenements with potential for mineralisation; and
• To evaluate results achieved through surface sampling, drilling and geophysical surveys carried out during the year.
RISK MANAGEMENT
The Group takes a proactive approach to risk management. The Board is responsible for ensuring that risks, and also opportunities, are identified on atimely basis and that the Group’s objectives and activities are aligned withthe risks and opportunities identified by the Board.
The Group believes that it is crucial for all Board members to be a part of this process, and as such, the Board has not established a separate riskmanagement committee.
The Board has a number of mechanisms in place to ensure that manage-ment’s objectives and activities are aligned with the risks identified by theBoard. These include the following:
• Board approval of a strategic plan designed to meet stakeholders’ needsand manage business risk.
• Implementation of Board approved operating plans and budgets and Board monitoring of progress against these budgets, including the establishment and monitoring of performance indicators of both a financial and non-financial nature.
SIGNIFICANT CHANGES IN THE STATE OF AFFAIRS
An ‘off-market’ takeover offer to acquire all of the issued shares of BreakawayResources Ltd (Breakaway) was successfully made and concluded during the period. Breakaway was an ASX listed junior exploration Company basedin Western Australia with exploration licences in both Western Australia and Queensland. The offer closed on 18 October 2013 with Minotaur having received acceptances for over 91% of Breakaway’s shares.
Information in this report that relates to
Exploration Results, Mineral Resources
or Ore Reserves is based on information
compiled by Dr A. P. Belperio, who is a
full-time employee of the Company and
a Fellow of the Australasian Institute of
Mining and Metallurgy. Dr A. P. Belperio
has a minimum of 5 years experience
which is relevant to the style of
mineralisation and type of deposit
under consideration and to the activity
which he is undertaking to qualify as a
Competent Person as defined in the
2012 Edition of the “Australasian Code
for Reporting of Exploration Results,
Mineral Resources and Ore Reserves”.
Dr A. P. Belperio consents to the inclusion
in the report of the matters based on his
information in the form and context in
which it appears.
Number of Number of Options overOrdinary Shares Ordinary Shares
John Atkins 98,661 -
Derek Carter 2,156,805 1,200,000
Antonio Belperio 838,062 900,000
Richard Bonython 1,502,000 900,000
Andrew Woskett - 2,000,000
DIRECTORS’REPORT

Minotaur then moved to compulsorilyacquire the outstanding shares with Minotaur gaining 100% ownership of Breakaway on 5 December 2013.Subsequently Breakaway was removed from the ASX’s Official List.
No other significant changes occurred during the year.
FORWARD OUTLOOK
Minotaur’s focus is narrowing ontotwo key assets: Cloncurry copper-gold prospects and WA nickel-goldprospects. Discovery of the ArtemisCu-Au-Zn-Ag deposit from 85mbelow surface, using ground EM techniques, validates the Company’sexploration methodology. Numerous,similar geophysical anomaliesabound across the tenement package and the work scope will bebroadened onto other project areasin the region. While additional discovery is the objective, the under-lying imperative is to locate economicdeposits that can convert into mineable propositions.
In Western Australia Minotaur nowhas extensive exposure to nickel sulphide mineralisation hosted in fertile Yilgarn ultramafic rocks. Work by past owners ceded a
strategic package of tenements alongthe nickel belt, a zone recognised as hosting Tier 1 deposits. Their extensive work, diligently recorded, is a valuable database from whichMinotaur can generate new targets,test known anomalies, assess knownmineralisation and follow up on multiple drill intersections showingdisseminated to massive sulphides.
Much of the previous work, whilefirst-class, failed to pursue an economic outcome, leaving lowhanging fruit for later owners. Minotaur is fortunate to find itself inthat position and is taking immediatesteps to unlock value from these elements of the Breakaway legacy.
ENVIRONMENTAL REGULATIONS
The Group is aware of its responsibilityto impact as little as possible on theenvironment and, where there is anydisturbance, to rehabilitate sites.
During the year the majority of workcarried out was in Western Australiaand Queensland and the Group followed procedures and pursued objectives in line with guidelinespublished by both the Western Australian and Queensland
Governments. These guidelines are quite detailed and encompass the impact on owners and land users, heritage, health and safety and proper restoration practices.The Group adheres to regulatoryguidelines, and any local conditionsapplicable, both in South Australiaand elsewhere. The Group has notbeen in breach of any State or Commonwealth environmental rulesor regulations during the period.
The Company’s Canadian operationsfollow regulations outlined in the Nova Scotia Mining Laws. The Company is in compliance withthe relevant environmental laws inNova Scotia.
EVENTS SINCE THE END OF THEREPORTING PERIOD
No matter or circumstance has arisen since 30 June 2014 that hassignificantly affected the Group’s operations, results or state of affairs,or may do so in the future.
UNISSUED SHARES
At the date of this report, the following unlisted options to acquireordinary shares in the Company wereon issue:
11
Net Issued/ (Exercised or Issue Date Expiry Date Exercise Price Balance at 1 July 2013 expired) during the Year Balance at 30 June 2014
08/12/2008 02/12/2013 $0.25 410,000 (410,000) -
10/05/2010 17/05/2015 $0.40 4,300,000 - 4,300,000
10/05/2010 30/08/2015 $0.40 1,000,000 - 1,000,000
10/05/2010 27/02/2016 $0.55 1,000,000 - 1,000,000
30/09/2011 29/09/2016 $0.21 1,740,000 (175,000) 1,565,000
04/07/2012 03/07/2017 $0.25 2,420,000 (325,000) 2,095,000
05/07/2013 04/07/2018 $0.30 - 2,083,333 2,083,333
10,870,000 1,173,333 12,043,333

12
SHARE OPTIONS
Shares issued as a result of exercise of options
No shares were issued during the financial year as a result of the exercise of options (2013: Nil).
Lapse of options
On 13 December 2013, 410,000 unlisted options issued under theCompany’s employee share optionplan were unexercised and expired. In addition, 500,000 options issuedunder the Company’s employee share option plan expired during the year due to the resignation of two employees.
New options issued
On 5 July 2013, the Company issued2,083,333 unlisted options in accordance with the Subscription and Alliance Agreement with GoldenFields Resources Pty Ltd executed on 13 June 2013. The options are exercisable at $0.30 and expire on 4 July 2018.
INDEMNIFICATION AND INSURANCE OF DIRECTORSAND OFFICERS
To the extent permitted by law, the Company has indemnified (fully insured) each Director and the Secretary of the Company for an annual premium of $19,449.
The liabilities insured include costsand expenses that may be incurred in defending civil or criminal proceedings (that may be brought)against the officers in their capacityas officers of the Company or a related body, and any other paymentsarising from liabilities incurred by the officers in connection with suchproceedings, other than where such liabilities arise out of conduct involving a wilful breach of duty by the officers or the improper use by the officers of their position or of information to gain advantage forthemselves or someone else or tocause detriment to the Company.
DIRECTORS’REPORT
MINOTAUREXPLORATION
! Cash in the bank, no debt, solid Top 5 shareholders
! Experienced, credible managementand technical team
! Significant exploration potentialaround Australia
! Diversity in mineralswith focus on Copper, Gold and Nickel
! Portfolio diversificationspreads risk
! Moving non-core assets towards monetisation
! Continuing Joint Ventureswith large international groups
! Leveraging our technical expertisebeyond Minotaur’s own balance sheet capabilities
Differentiating the investment case
w w w . m i n o t a u r e x p l o r a t i o n . c o m . a u

This report outlines the remunerationarrangements in place for Directorsand other key management personnelof Minotaur Exploration Ltd.
Remuneration philosophy
The Board is responsible for determining remuneration policiesapplicable to Directors and seniorexecutives of the Group. The broadpolicy is to ensure that remunerationproperly reflects the individuals’ duties and responsibilities and thatremuneration is competitive in attracting, retaining and motivatingpeople with appropriate skills and experience. At the time of determining remuneration consideration is given by the Board to the Group’s financial performance.
Employment contracts
The employment conditions of the Managing Director, Mr AndrewWoskett, are formalised in a consultancy agreement. Mr Woskett commenced as a consultant to Minotaur on 1 March 2010 and hisannual retainer is $355,675 perannum, exclusive of GST. The Company may terminate the consultancy agreement withoutcause by providing three (3) monthswritten notice and paying a severance amount equal to nine (9)months’ retainer. Termination payments are generally not payableon resignation or dismissal for seriousmisconduct. In the instance of serious misconduct the Company can terminate the agreement at any time.
The employment conditions of theExecutive Director, Dr Antonio Belperio, are formalised in a contractof employment. Dr Belperio commenced employment on 1 January 2005 and his gross salary,inclusive of the 9.25% superannuationguarantee as at 30 June 2014, is$281,875 per annum. The Companymay terminate the employment contract without cause by providingsix (6) months written notice or making payment in lieu of notice,based on the annual salary component. Termination paymentsare generally not payable on
resignation or dismissal for seriousmisconduct. In the instance of serious misconduct the Company canterminate employment at any time.
The employment conditions of theGeneral Manager of Exploration, Mr Ian Garsed, are formalised in acontract of employment. Mr Garsedcommenced employment on 15 March 2011 and his gross salary,inclusive of the 9.25% superannua-tion guarantee as at 30 June 2014, is$195,000 per annum. The Companymay terminate the employment contract without cause by providingone (1) month written notice or making payment in lieu of notice,based on the annual salary component. Termination paymentsare generally not payable on resignation or dismissal for seriousmisconduct. In the instance of serious misconduct the Company canterminate employment at any time.
The employment conditions of the Commercial Manager, Mr VarisLidums, are formalised in a contract of employment. Mr Lidums commenced employment on 1 March2011 and his gross salary, inclusive ofthe 9.25% superannuation guaranteeas at 30 June 2014, is $195,000 perannum. The Company may terminatethe employment contract withoutcause by providing one (1) monthwritten notice or making payment inlieu of notice, based on the annualsalary component. Termination payments are generally not payableon resignation or dismissal for seriousmisconduct. In the instance of serious misconduct the Company canterminate employment at any time.
Key management personnel remuneration and equity holdings
The Board currently determines thenature and amount of remunerationfor Board members and senior executives of the Group. The policy is to align director and executive objectives with shareholder and business objectives by providing afixed remuneration component andoffering specific long-term incentives.
The Non-Executive Directors andother Executives receive a superannuation guarantee contribu-tion required by the government,which is currently 9.25% as at 30 June2014 (9.5% for future periods), and do not receive any other retirementbenefits. Some individuals, however,may choose to sacrifice part of theirsalary to increase payments towardssuperannuation.
All remuneration paid to Directorsand other key management personnel is expensed as incurred.Key management are also entitled to participate in the Group’s share option scheme. Options arevalued using the Black-Scholesmethodology.
The board policy is to remunerateNon-Executive Directors at marketrates based on comparable companies for time, commitment and responsibilities.
The Board determines payments to Non-Executive Directors and reviewstheir remuneration annually, basedon market practice, duties and accountability. Independent externaladvice is sought when required.
13
remuneration report (audited)

14
Bonuses
During the 2014 financial year a number of Minotaur’s key manage-ment personnel received a cashbonus in respect of meeting key performance targets agreed by the Board. Bonuses are paid at the discretion of the Board. 63% of
available bonuses to directors andother key management personnelwere paid during the year and 37%were forfeited.
Share-based remuneration
Options may be granted to Key Management Personnel at the discretion of the Board under an
Employee Share Option Plan. All options refer to options over ordinary shares of the Company,which are exercisable on a one-for-one basis under the terms of the agreements. All options expire on the earlier of their expiry date or termination of the individual’s employment.
remuneration report (audited)
Short Term Employee Benefits Post Employment Share-based Payments Totals Performance Based
Salary & Fees Bonus Superannuation Options $ % of Remuneration
John Atkins* 2014 26,474 - 2,449 - 28,923 -2013 - - - - - -
Derek Carter 2014 91,560 - - - 91,560 -2013 86,520 - 5,040 - 91,560 -
Antonio Belperio 2014 261,155 20,399 26,044 - 307,598 72013 252,294 41,284 26,422 - 320,000 13
Richard Bonython 2014 43,999 - 4,070 - 48,069 -2013 48,069 - - - 48,069 -
Andrew Woskett 2014 349,069 26,453 - - 375,522 72013 347,953 65,000 - - 412,953 16
Total 2014 772,257 46,852 32,563 - 851,672 62013 734,836 106,284 31,462 - 872,582 12
Director remuneration for the year ended 30 June 2014 and 30 June 2013
Short Term Employee Benefits Post Employment Share-based Payments Totals Performance Based
Salary & Fees Bonus Superannuation Options $ % of Remuneration
Ian Garsed 2014 172,490 12,013 23,622 - 208,125 62013 170,606 20,642 23,752 23,375 238,375 9
Varis Lidums 2014 178,490 14,016 17,807 - 210,313 72013 176,606 27,522 18,372 23,375 245,875 11
Donald Stephens* 2014 - - - - - -2013 - - - - - -
Total 2014 350,980 26,029 41,429 - 418,438 62013 347,212 48,164 42,124 46,750 484,520 10
Remuneration of other key management personnel for the year ended 30 June 2014 and 30 June 2013

15
Options held by key management personel for the year ended 30 June 2014
Shares held by key management personel for the year ended 30 June 2014
USE OF REMUNERATION CONSULTANTS
During the financial year, there wereno remuneration recommendationsmade in relation to key managementpersonnel for the Company by any remuneration consultants.
VOTING AND COMMENTS MADE AT THE COMPANY’S 2013 ANNUAL GENERAL MEETING
Minotaur Exploration Ltd receivedmore than 97.5% of “yes” votes on its remuneration report for the 2013financial year by proxy.
The Company did not receive anyfeedback at the Annual GeneralMeeting on its remuneration report.
End of audited remuneration report.
Balance at Granted Net change Balance at Expiry FirstDirectors beginning of period as remuneration Exercised other end of period date exercise date
John Atkins - - - - - - -
Derek Carter 1,200,000 - - - 1,200,000 17/05/15 18/05/10
Antonio Belperio 900,000 - - - 900,000 17/05/15 18/05/10
Richard Bonython 900,000 - - - 900,000 17/05/15 18/05/10
Andrew Woskett 1,000,000 - - - 1,000,000 30/08/15 30/08/10
Andrew Woskett 1,000,000 - - - 1,000,000 27/02/16 28/02/11
Other key management
Ian Garsed 250,000 - - - 250,000 29/09/16 30/09/12
Ian Garsed 250,000 - - - 250,000 03/07/17 04/07/12
Varis Lidums 250,000 - - - 250,000 29/09/16 30/09/12
Varis Lidums 250,000 - - - 250,000 03/07/17 04/07/12
Donald Stephens 400,000 - - - 400,000 17/05/15 18/05/10
Balance at On exercise Net change BalanceDirectors 1 July 2013 of options other 30 June 2014
John Atkins - - 98,661 98,661
Derek Carter 2,156,805 - - 2,156,805
Antonio Belperio 830,306 - 7,756 838,062
Richard Bonython 1,502,000 - - 1,502,000
Andrew Woskett - - - -
Other key management
Ian Garsed - - - -
Varis Lidums - - - -
Donald Stephens 305,000 - - 305,000
Leinster drilling.

Directors’ Meetings Audit Committee
Director Eligible Attended Eligible Attended
Derek Carter 6 6 - -
Andrew Woskett 6 6 - -
Richard Bonython 6 5 2 2
Antonio Belperio 6 6 2 2
John Atkins 4 4 - -
DIRECTORS’ MEETINGS
The number of meetings of directors (including meetings of committees of directors) held during the year and the number of meetings attended byeach director were as follows:
PROCEEDINGS ON BEHALF OF THE GROUP
No person has applied for leave of Court to bring proceedings on behalf ofthe Group or intervene in any proceedings to which the Group is a party for the purpose of taking responsibility on behalf of the Group for all or anypart of those proceedings.
NON-AUDIT SERVICES
During the year, Grant Thornton, the Company’s auditors, performed certainother services in addition to their statutory audit duties.
The Board has considered the non-audit services provided during the year by the auditor and is satisfied that the provision of those non-audit services during the year is compatible with, and did not compromise, the auditor independence requirements of the Corporations Act 2001 for the following reasons:
• all non-audit services were subject to the corporate governance procedures adopted by the Company to ensure they do not impact upon the impartiality and objectivity of the auditor; and
• the non-audit services do not undermine the general principles relatingto auditor independence as set out in APES 110 Code of Ethics for Professional Accountants, as they did not involve reviewing or auditingthe auditor’s own work, acting in a management or decision-making capacity for the Company, acting as an advocate for the Company orjointly sharing risks and rewards.
Details of the amounts paid to the auditors of the Company, Grant Thornton,and its related practices for audit and non-audit services provided during the year are set out in Note 26 to the Financial Statements.
A copy of the Auditor’s Independence Declaration as required under s307Cof the Corporations Act 2001 is included on page 17 of this financial reportand forms part of this Directors’ Report.Signed in accordance with a resolution of the Directors:
Derek CarterChairman
Dated this 19th day of August 2014
16
DIRECTORS’REPORT
MASSIVE SULPHIDECOMPRISING SPHALERITE
(BLACK), CHALCOPYRITE
(YELLOW), GALENA
(BLUE-GREY) AND PYRRHOTITE
(BRONZE)

17
auditor’sindependencedeclaration
T O T H E D I R E C T O R S O F M I N O T A U R E X P L O R A T I O N L I M I T E D
AUDITOR’S INDEPENDENCE DECLARATION TO THE DIRECTORS OF MINOTAUR EXPLORATION LIMITED
In accordance with the requirements of section 307C of the Corporations Act 2001, as lead auditor for the audit of Minotaur Exploration Limited for the year ended 30 June 2014, I declare that, to the best of my knowledge and belief, there have been:
a no contraventions of the auditor independence requirements of the Corporations Act 2001 in relation to
the audit; and
b no contraventions of any applicable code of professional conduct in relation to the audit.
GRANT THORNTON AUDIT PTY LTDChartered Accountants
J L HumphreyPartner – Audit & Assurance
Adelaide, 19 August 2014
Level 1,67 Greenhill RdWayville SA 5034
Correspondence to:GPO Box 1270Adelaide SA 5001
T 61 8 8372 6666F 61 8 8372 6677E [email protected] www.grantthornton.com.au
Grant Thornton Audit Pty Ltd ACN 130 913 594a subsidiary or related entity of Grant Thornton Australia Ltd ABN 41 127 556 389
‘Grant Thornton’ refers to the brand under which the Grant Thornton member firms provide assurance, tax and advisory services to their clients and/or refers to one or more member firms, as thecontext requires. Grant Thornton Australia Ltd is a member firm of Grant Thornton International Ltd (GTIL). GTIL and the member firms are not a worldwide partnership. GTIL and each member firmis a separate legal entity. Services are delivered by the member firms. GTIL does not provide services to clients. GTIL and its member firms are not agents of, and do not obligate one another andare not liable for one another’s acts or omissions. In the Australian context only, the use of the term ‘Grant Thornton’ may refer to Grant Thornton Australia Limited ABN 41 127 556 389 and itsAustralian subsidiaries and related entities. GTIL is not an Australian related entity to Grant Thornton Australia Limited.
Liability limited by a scheme approved under Professional Standards Legislation. Liability is limited in those States where a current scheme applies.

18
CORPORATEGOVERNANCE
M I N O T A U R E X P L O R A T I O N L I M I T E D
INTRODUCTION
The Board is committed to achievingand demonstrating the highest standards of corporate governance.As such, Minotaur Exploration Ltd(the “Company”) and its ControlledEntities (the “Group”) have adopted a corporate governance frameworkand practices to ensure they meet the interests of shareholders.
The Group complies with the Australian Securities Exchange Corporate Governance Council’s Corporate Governance Principles and Recommendations 2nd Edition (the “ASX Principles”).
This statement incorporates the disclosures required by the ASX Principles under the headings of the eight (8) core principles. All ofthese practices, unless otherwisestated, were in place for the full reporting period.
Some of the charters and policiesthat form the basis of the corporategovernance practices of the Groupmay be located on the Group’s website at www.minotaurexploration.com.au.
Lay solid foundations for management and oversight
Board Responsibilities
The Board is accountable to theShareholders for the performance ofthe Group and has overall responsi-bility for its operations. Day to daymanagement of the Group’s affairsand the implementation of the corporate strategy and policy initiatives, are formally delegated bythe Board to the Managing Directorand ultimately to senior executives.
The key responsibilities of the Boardinclude:
• Approving the strategic directionand related objectives of theGroup and monitoring management performance in theachievement of these objectives;
• Adopting budgets and monitoring the financial performance of the Group;
• Reviewing annually the performance of the Managing Director and senior executivesagainst the objectives and performance indicators established by the Board;
• Overseeing the establishmentand maintenance of adequate internal controls and effective monitoring systems;
• Overseeing the implementationand management of effectivesafety and environmental performance systems;
• Ensuring all major business risksare identified and effectivelymanaged; and
• Ensuring that the Group meets its legal and statutory obligations.
For the purposes of the proper performance of their duties, the Directors are entitled to seek independent professional advice atthe Group’s expense, unless theBoard determines otherwise. The Board schedules meetings on aregular basis and other meetings asand when required.
The Board has not publicly discloseda statement of matters reserved forthe Board, or the Board charter andtherefore the Group has not complied with recommendation 1.3of the Corporate Governance Council.Given the experience and skills of theBoard of Directors, the Group has notconsidered it necessary to formulatea Board charter.
principle 1
19
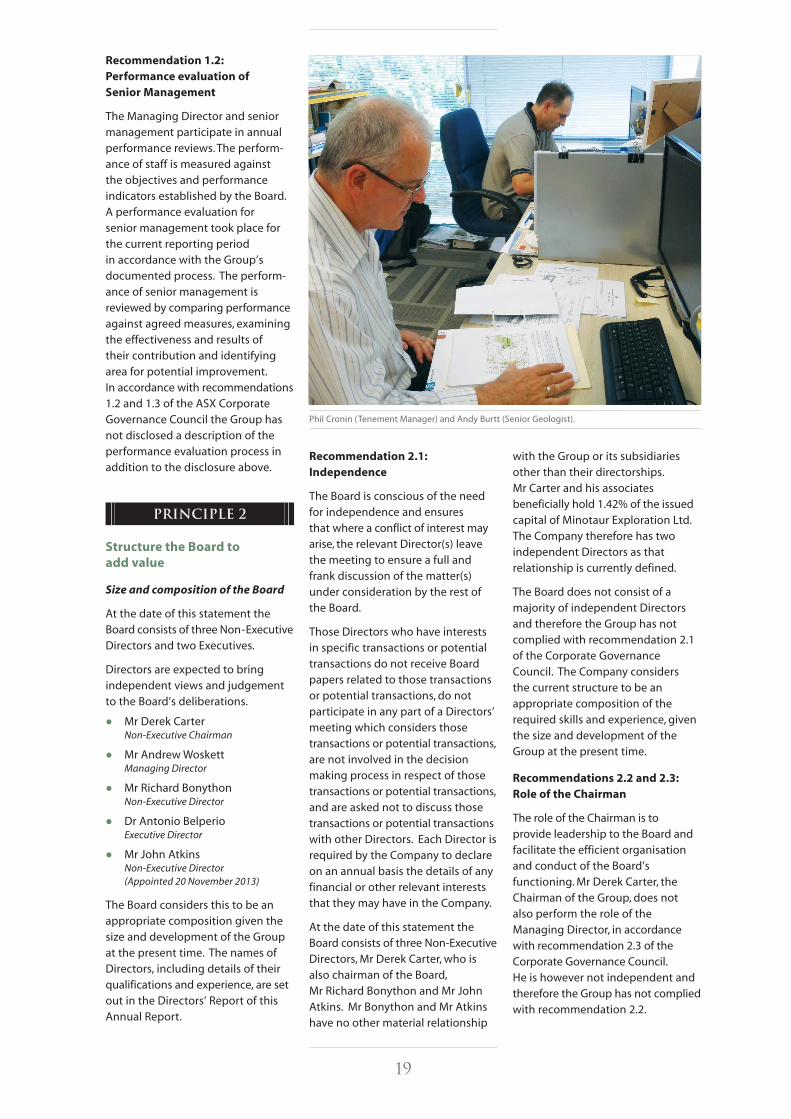
Recommendation 1.2: Performance evaluation of Senior Management
The Managing Director and seniormanagement participate in annualperformance reviews. The perform-ance of staff is measured against the objectives and performance indicators established by the Board.A performance evaluation for senior management took place forthe current reporting period in accordance with the Group’s documented process. The perform-ance of senior management is reviewed by comparing performanceagainst agreed measures, examiningthe effectiveness and results of their contribution and identifyingarea for potential improvement. In accordance with recommendations1.2 and 1.3 of the ASX Corporate Governance Council the Group hasnot disclosed a description of theperformance evaluation process inaddition to the disclosure above.
Structure the Board to add value
Size and composition of the Board
At the date of this statement theBoard consists of three Non-ExecutiveDirectors and two Executives.
Directors are expected to bring independent views and judgement to the Board’s deliberations.
• Mr Derek Carter Non-Executive Chairman
• Mr Andrew Woskett Managing Director
• Mr Richard Bonython Non-Executive Director
• Dr Antonio Belperio Executive Director
• Mr John Atkins Non-Executive Director (Appointed 20 November 2013)
The Board considers this to be an appropriate composition given thesize and development of the Group at the present time. The names of Directors, including details of theirqualifications and experience, are setout in the Directors’ Report of thisAnnual Report.
Recommendation 2.1: Independence
The Board is conscious of the needfor independence and ensures that where a conflict of interest mayarise, the relevant Director(s) leavethe meeting to ensure a full and frank discussion of the matter(s)under consideration by the rest of the Board.
Those Directors who have interests in specific transactions or potentialtransactions do not receive Board papers related to those transactionsor potential transactions, do not participate in any part of a Directors’meeting which considers those transactions or potential transactions,are not involved in the decision making process in respect of thosetransactions or potential transactions,and are asked not to discuss thosetransactions or potential transactionswith other Directors. Each Director isrequired by the Company to declareon an annual basis the details of anyfinancial or other relevant intereststhat they may have in the Company.
At the date of this statement theBoard consists of three Non-ExecutiveDirectors, Mr Derek Carter, who is also chairman of the Board, Mr Richard Bonython and Mr JohnAtkins. Mr Bonython and Mr Atkinshave no other material relationship
with the Group or its subsidiariesother than their directorships. Mr Carter and his associates beneficially hold 1.42% of the issuedcapital of Minotaur Exploration Ltd.The Company therefore has two independent Directors as that relationship is currently defined.
The Board does not consist of a majority of independent Directorsand therefore the Group has notcomplied with recommendation 2.1of the Corporate Governance Council. The Company considers the current structure to be an appropriate composition of the required skills and experience, giventhe size and development of theGroup at the present time.
Recommendations 2.2 and 2.3:Role of the Chairman
The role of the Chairman is to provide leadership to the Board andfacilitate the efficient organisationand conduct of the Board’s functioning. Mr Derek Carter, theChairman of the Group, does not also perform the role of the Managing Director, in accordancewith recommendation 2.3 of the Corporate Governance Council. He is however not independent and therefore the Group has not compliedwith recommendation 2.2.
principle 2
Phil Cronin (Tenement Manager) and Andy Burtt (Senior Geologist).

CORPORATEGOVERNANCE
principle 2
20
Recommendation 2.4: Nomination, retirement and appointment of Directors
The Board has not established a nomination and remuneration committee in accordance with recommendation 2.4 of the Corporate Governance Council. The Board takes ultimate responsibility for these matters andcontinues to monitor the composition of the committee andthe roles and responsibilities of themembers. Accordingly, the Group has not established remunerationand nomination committee charter in accordance with recommendations2.4 and 2.6 of the ASX Corporate Governance Council.
Recommendation 2.5: Evaluationof Board performance
The Board continues to review performance against appropriatemeasures and identify ways to improve performance.
A performance evaluation of theBoard, its committees and individualDirectors took place for the currentreporting period. The Board has notformally disclosed the process in accordance with recommendations2.5 and 2.6 of the ASX Corporate Governance Council. The Board takes ultimate responsibility for these matters and does not considerthe disclosure of the performanceevaluation necessary at this stage.
Recommendation 2.6: Additionalinformation concerning the Boardand Directors
The disclosures required by Recommendation 2.6 are included in this annual report. There are procedures in place, agreed by theBoard, to enable Directors, in furtherance of their duties, to seek independent professional advice atthe Company’s expense.
Promote ethical and responsible decision making
Recommendation 3.1: Code of Conduct
The Board recognises the need for Directors and employees to observethe highest standards of behaviourand business ethics when engagingin corporate activity. The Group intends to maintain a reputation forintegrity and is highly committed todemonstrating appropriate corporatepractices and decision making. TheGroup’s officers and employees arerequired to act in accordance withthe law and with the highest ethicalstandards.
The Board has not adopted and disclosed a formal code of conductapplying to the Board and all employees in accordance with recommendations 3.1 and 3.3 of theCorporate Governance Council. TheBoard takes ultimate responsibilityfor these matters and does not consider the disclosure of the codenecessary at this stage.
Securities Trading Policy
The Company has established a policy concerning trading in theCompany’s shares by the Company’sofficers, employees and contractorsand consultants to the Companywhile engaged in work for the Company (Representatives).
This policy provides that it is the responsibility of each Representativeto ensure they do not breach the insider trading prohibition in the Corporations Act. Breaches of the insider trading prohibition will resultin disciplinary action being taken bythe Company.
Representatives must also obtainwritten consent from the Chairman(or, in the case of the Chairman, fromthe Board) prior to trading in theCompany’s securities.
Subject to these restrictions, the policy provides that Directors, theCompany Secretary and employeesof, or contractors to, the Companythat have access to the Company’s financial information or drilling results are permitted to trade in theCompany’s securities throughout the year except during the followingperiods:
a) the period between the end ofthe March, June, September andDecember quarters and the release of the Company’s quarterly report to ASX for solong as the Company is requiredby the Listing Rules to lodgequarterly reports; and
b) 24 hours after the followingevents:i) Any major announcements;ii) The release of the Company’s
quarterly, half yearly and annual financial results to the ASX; and
iii) the Annual General Meeting and all other General Meetings.
principle 3

21
In exceptional circumstances theBoard may waive the requirements of the Share trading Policy to allowRepresentatives to trade in the shares of the Company, provided todo so would not be illegal.
Directors must advise the CompanySecretary of changes to their shareholdings in the Company withintwo (2) business days of the change.
Recommendations 3.2 and 3.3: Diversity Policy
The ASX Corporate GovernanceCouncil has released amendmentsdated 30 June 2010 to the 2nd edition Corporate Governance Principles and Recommendations in relation to diversity. For the purpose of the amendments diversity includes, but is not limitedto, gender, age, ethnicity and cultural background.
The Company continues to strive towards achieving objectives established towards increasing gender diversity.
The Company will assess all staff and Board appointments on theirmerits with consideration to diversity a driver in decision making.The Company has not yet developedor disclosed a formal diversity policyand therefore has not complied withthe recommendations 3.2 and 3.3 ofthe Corporate Governance Council effective from 1 January 2011.
The Board is ultimately responsiblefor reviewing the achievement of this policy.
Recommendations 3.4 and 3.5: Reporting in Annual Report
At the date of this Annual Report, theCompany employs 15 staff members(excluding the Non-Executive Directors), of which three are female. The Board of Directors consists of five male Directors. The Company has disclosed the information suggested in Recommendation 3.5 in this Annual Report.
Safeguard integrity in financialreporting
The Group has structured financialmanagement to independently verifyand safeguard the integrity of their financial reporting. The structure established by the Group includes:
• Review and consideration of thefinancial statements by the auditcommittee;
• A process to ensure the independence and competenceof the Group’s external auditors.
Recommendations 4.1, 4.2 and 4.3:Audit Committee
The audit, risk and compliance committee comprises Mr RichardBonython (Chairman) and Dr AntonioBelperio. Mr Richard Bonython is considered independent. The Boardwill annually confirm the member-ship of the committee.
The committee’s primary responsibilities are to:
• oversee the existence and maintenance of internal controlsand accounting systems;
• oversee the management of riskwithin the Group;
• oversee the financial reportingprocess;
• review the annual and half-year financial reports and recommendthem for approval by the Board of Directors;
• nominate external auditors;
• review the performance of the external auditors and existingaudit arrangements; and
• ensure compliance with laws,regulations and other statutory or professional requirements,and the Group’s governance policies.
The Group has not complied with recommendation 4.2 of the Corporate Governance Council because it does not consist of a majority of independent Directorsand only has two committee members. Given the skills and experience of the audit committee,the Board believes the structure and process to be adequate. The Board continues to monitor thecomposition of the committee and the roles and responsibilities of the members.
In addition, the Board has notadopted and disclosed a formal committee charter in accordancewith recommendations 4.3 and 4.4 of the Corporate GovernanceCouncil.
Make timely and balanced disclosure
The Group has a policy that all shareholders and investors haveequal access to the Group’s information. The Board ensures thatall price sensitive information is disclosed to the ASX in accordancewith the continuous disclosure requirements of the Corporation’s Actand ASX Listing Rules. The companysecretary has primary responsibilityfor all communications with the ASXand is accountable to the Boardthrough the chair for all governancematters.
Recommendations 5.1: Disclosure policy
The Group has not publicly disclosed a formal disclosure policy in accordance with recommendations5.1 and 5.2 of the Corporate Governance Council. The Board takes ultimate responsibility for these matters and does not considerdisclosure of a disclosure policy to be appropriate at this stage.
principle 4
principle 5

CORPORATEGOVERNANCE
22
Respect the rights of shareholders
The Board strives to ensure thatShareholders are provided with sufficient information to assess theperformance of the Group and its Directors and to make well-informedinvestment decisions.
Recommendations 6.1: Communications policy
Information is communicated toShareholders through:
• annual, half-yearly and quarterlyfinancial reports;
• annual and other general meetings convened for Shareholder review and approval of Board proposals;
• continuous disclosure of materialchanges to ASX for open access to the public; and
• the Group maintains a websitewhere all ASX announcements,notices and financial reports are published as soon as possibleafter release to ASX.
All information disclosed to the ASXis posted on the Group’s website atwww.minotaurexploration.com.au
The auditor is required to attend the annual general meeting of Shareholders. The Chairman will permit Shareholders to ask questionsabout the conduct of the audit andthe preparation and content of theaudit report.
The Group has not publicly disclosed a communications policy in accordance with recommendations6.1 and 6.2 of the Corporate Governance Council. The Board takes ultimate responsibility for these matters and does not considerdisclosure of a communications policy to be appropriate at this stage.
Recognise and manage risk
The Board has identified the significant areas of potential businessand legal risk of the Group. In addition the Board has developedthe culture, processes and structuresof the company to encourage a framework of risk managementwhich identifies, monitors and manages the material risks facing the organisation.
Recommendations 7.1 and 7.2:Risk management policy
The identification, monitoring and,where appropriate, the reduction ofsignificant risk to the Group is the responsibility of the Managing Director and the Board. The Boardhas also established the audit, riskand compliance committee which addresses the risks of the Group.
The Board reviews and monitors theparameters under which such riskswill be managed. Management accounts are prepared and reviewedwith the Managing Director at subsequent Board meetings. Budgetsare prepared and compared againstactual results. Management and theBoard monitor the Group’s materialbusiness risks and reports are considered at regular meetings.
The Group has not publicly disclosed a policy for the oversight and management of material businessrisks in accordance with recommen-dations 7.1 and 7.4 of the CorporateGovernance Council. The Board takes ultimate responsibility for these matters and does not considerdisclosure of a risk management policy to be appropriate at this stage.
Recommendations 7.3: Statementfrom Managing Director and Company Secretary
The Managing Director and the Company Secretary are required tostate in writing to the Board that the Company’s financial reports present a true and fair view, in all material respects, of the Company’sfinancial condition and operationalresults are in accordance with relevant accounting standards.
Included in this statement is a confirmation that the Company’s risk management and internal controls are operating efficiently and effectively. This statement hasbeen received for the year ended 30 June 2014.
Remunerate fairly and responsibly
The Chairman and the Non-ExecutiveDirectors are entitled to draw Directors fees and receive reimburse-ment of reasonable expenses for attendance at meetings. The Group is required to disclose in its annual report details of remuneration to Directors. The maximum aggregateannual remuneration which may be paid to Non-Executive Directors is $300,000. This amount cannot be increased without the approval of the Group’s shareholders. Pleaserefer to the remuneration reportwithin the Directors’ Report for details regarding the remunerationstructure of the Managing Directorand senior management.
Recommendation 8.1: Remuneration Committee
The Board has not established a remuneration committee or disclosed a committee charter on the Company website and therefore has not complied with recommendations 8.1 and 8.3 of the Corporate Governance Council. The Board takes ultimate responsibility for these matters anddoes not consider a remunerationcommittee to be appropriate at this stage.
principle 6
principle 7
principle 8
23
financialREPORT
F O R T H E Y E A R E N D E D 3 0 J U N E 2 0 1 4
CONTENTS
Consolidated Statement of Profit or Loss and Other Comprehensive Income 24
Consolidated Statement of Financial Position 25
Consolidated Statement of Changes in Equity 26
Consolidated Statement of Cash Flows 27
Notes to the Consolidated Financial Statements 28
Directors’ Declaration 58
Independent Auditor’s Report 59

c o n s o l i d a t e d s t a t e m e n t o fprofit or loss and othercomprehensive income
F O R T H E Y E A R E N D E D 3 0 J U N E 2 0 1 4
24
Consolidated Group
2014 2013Note $ $
Revenue 4(a) 524,036 598,085
Gain on reclassification of non-current asset 4(c) - 1,017,291
Other income 4(b) 197,304 738
Impairment of exploration and evaluation assets 4(d) (1,906,511) (1,440,018)
Impairment of available-for-sale investments 4(d) (722,097) (2,104,643)
Employee benefits expense 4(e) (316,962) (607,912)
Depreciation expense 4(d) (184,356) (194,968)
Finance costs 4(d) (8,494) (10,609)
Other expenses 4(f) (1,397,209) (1,181,715)
Loss before income tax expense (3,814,289) (3,923,751)
Income tax benefit 5 1,147,478 796,076
Loss for the year (2,666,811) (3,127,675)
Other comprehensive income
Items that may be reclassified to profit or loss
Exchange differences arising on translation of foreign operations 19(b) 917 6,773
Fair value gains on available-for-sale assets, net of tax 19(c) 60,000 (60,000)
Total comprehensive income for the year (2,605,894) (3,180,902)
Loss for the year is attributable to:
Members of the parent entity 20 (2,596,370) (3,113,702)
Non-controlling interest 21 ( 70,441) (13,973)
(2,666,811) (3,127,675)
Total comprehensive income for the year is attributable to:
Members of the parent entity (2,535,453) (3,166,929)
Non-controlling interest (70,441) (13,973)
(2,605,894) (3,180,902)
Earnings per share
Basic earnings per share (cents) (1.94) (3.02)
Diluted earnings per share (cents) (1.94) (3.02)
The above statement should be read in conjunction with the accompanying notes.

c o n s o l i d a t e d s t a t e m e n t o f
FINANCIAL POSITIONA S A T 3 0 J U N E 2 0 1 4
25
Consolidated Group
2014 2013Note $ $
CURRENT ASSETS
Cash and cash equivalents 7 4,794,173 9,269,636
Trade and other receivables 8 44,499 52,528
Other current assets 9 102,304 145,793
TOTAL CURRENT ASSETS 4,940,976 9,467,957
NON-CURRENT ASSETS
Available-for-sale investments 10 1,127,693 1,853,158
Property, plant and equipment 12 1,243,968 1,425,801
Exploration and evaluation assets 13 19,243,007 12,176,647
TOTAL NON-CURRENT ASSETS 21,614,668 15,455,606
TOTAL ASSETS 26,555,644 24,923,563
CURRENT LIABILITIES
Trade and other payables 15 677,897 2,114,355
Borrowings 16 114,386 35,098
Short-term provisions 17 455,340 429,220
TOTAL CURRENT LIABILITIES 1,247,623 2,578,673
NON-CURRENT LIABILITIES
Borrowings 16 392,000 114,386
Long-term provisions 17 32,459 43,159
TOTAL NON-CURRENT LIABILITIES 424,459 157,545
TOTAL LIABILITIES 1,672,082 2,736,218
NET ASSETS 24,883,562 22,187,345
EQUITY
Issued capital 18 36,874,859 31,572,748
Reserves 19 798,959 826,628
Accumulated losses 20 (13,018,255) (10,510,471)
PARENT INTEREST 24,655,563 21,888,905
Non-controlling interest 21 227,999 298,440
TOTAL EQUITY 24,883,562 22,187,345
The above statement should be read in conjunction with the accompanying notes.

c o n s o l i d a t e d s t a t e m e n t o f
CHANGES IN EQUIT YF O R T H E Y E A R E N D E D 3 0 J U N E 2 0 1 4
26
Consolidated Group
Other Issued Share Components Non-
Capital Option of Equity Retained ControllingOrdinary Reserve (Note 19) Earnings Interest Total Equity
Note $ $ $ $ $ $
Balance at 1 July 2013 31,572,748 1,013,175 (186,547) (10,510,471) 298,440 22,187,345
Comprehensive income
Total loss for the year - - - (2,596,370) (70,441) (2,666,811)
Other comprehensive income for the year - - 60,917 - - 60,917
Total comprehensive incomefor the year - - 60,917 (2,596,370) (70,441) (2,605,894)
Transactions with owners, in their capacity as owners, and other transfers
Fair value of shares issued for services 18 100,155 - - - - 100,155
Issue of shares for acquisitionof Breakaway 25 5,218,211 - - - - 5,218,211
Transaction costs (net of tax) (16,255) - - - - (16,255)
Transfer from share option reserve upon lapse of options 19 - (88,586) - 88,586 - -
5,302,111 (88,586) - 88,586 - 5,302,111
Balance at 30 June 2014 36,874,859 924,589 (125,630) (13,018,255) 227,999 24,883,562
Balance at 1 July 2012 30,816,748 981,763 (133,320) (7,591,627) - 24,073,564
Comprehensive income
Total loss for the year - - - (3,113,702) (13,973) (3,127,675)
Other comprehensive income for the year - - (53,227) - - (53,227)
Total comprehensive incomefor the year - - (53,227) (3,113,702) (13,973) (3,180,902)
Transactions with owners, in their capacity as owners, and other transfers
Issue of shares by way ofprivate placement 18 756,000 - - - 312,413 1,068,413
Share based payment 19 - 226,270 - - - 226,270
Transfer from share option reserve upon lapse of options 19 - (194,858) - 194,858 - -
756,000 31,412 - 194,858 312,413 1,857,770
Balance at 30 June 2013 31,572,748 1,013,175 (186,547) (10,510,471) 298,440 22,187,345
The above statement should be read in conjunction with the accompanying notes.

c o n s o l i d a t e d s t a t e m e n t o f
C A S H F L O W SF O R T H E Y E A R E N D E D 3 0 J U N E 2 0 1 4
27
Consolidated Group
2014 2013Note $ $
CASH FLOWS FROM OPERATING ACTIVITIES
Receipts from customers 265,608 120,489
Payments to suppliers and employees (2,582,070) (2,007,173)
Interest received 310,265 389,530
Finance costs (8,494) (10,609)
R&D tax concession received 1,147,478 796,076
NET CASH USED IN OPERATING ACTIVITIES 7 (867,213) (711,687)
CASH FLOWS FROM INVESTING ACTIVITIES
Cash acquired through acquisition of Breakaway 490,259 -
Payments for property, plant and equipment (505,372) (649,362)
Purchase of available-for-sale investments (85,000) (251,532)
Proceeds from sale of available-for-sale investments 364,463 112,617
Purchase of exploration and evaluation assets (600,000) -
Government exploration related grants - 51,557
GST on sale of Roxby Downs tenements - (950,000)
Joint venture receipts 2,659,824 2,339,132
Payment for exploration activities (6,273,988) (5,782,582)
NET CASH USED IN INVESTING ACTIVITIES (3,949,814) (5,130,170)
CASH FLOWS FROM FINANCING ACTIVITIES
Proceeds from issue of shares through private placement - 756,000
Proceeds from issue of shares to non-controlling interest - 312,413
Payment of transaction costs for issue of shares (16,255) -
Proceeds from borrowings 392,000 -
Repayment of borrowings (35,098) (32,983)
NET CASH PROVIDED BY FINANCING ACTIVITIES 340,647 1,035,430
NET DECREASE IN CASH AND CASH EQUIVALENTS (4,476,380) (4,806,427)
Net foreign exchange differences 917 6,772
Cash at the beginning of the year 9,269,636 14,069,291
CASH AT THE END OF THE YEAR 7 4,794,173 9,269,636
The above statement should be read in conjunction with the accompanying notes.

N O T E S T O T H E C O N S O L I D A T E D
FINANCIAL STATEMENTSF O R T H E Y E A R E N D E D 3 0 J U N E 2 0 1 4
28
These consolidated financial statements and notes represent
those of Minotaur Exploration Ltd and Controlled Entities (the
”consolidated Group” or “Group”).
The separate financial statements of the parent entity, Minotaur
Exploration Ltd, have not been presented within this financial
report as permitted by the Corporations Act 2001.
1 SUMMARY OF SIGNIFICANT ACCOUNTING POLICIES
Basis of Preparation
The consolidated financial statements are general purpose
financial statements that have been prepared in accordance
with Australian Accounting Standards, Australian Accounting
Interpretations, other authoritative pronouncements of the
Australian Accounting Standards Board and the Corporations
Act 2001. The Group is a for-profit entity for financial reporting
purposes under Australian Accounting Standards.
Minotaur Exploration Limited is the Group’s Ultimate Parent
Company. Minotaur Exploration Limited is a Public Company
incorporated and domiciled in Australia. The address of its
registered office is C/- HLB Mann Judd (SA) Pty Ltd,
169 Fullarton Road, Dulwich SA 5065 and its principal place of
business is Level 1, 8 Beulah Road, Norwood SA 5067.
Australian Accounting Standards set out accounting policies
that the Australian Accounting Standards Board has concluded
would result in financial statements containing relevant and
reliable information about transactions, events and conditions.
Compliance with Australian Accounting Standards ensures
that the financial statements and notes also comply with
International Financial Reporting Standards as issued by the
International Accounting Standards Board (IASB). Material
accounting policies adopted in the preparation of these financial
statements are presented below and have been consistently
applied unless stated otherwise.
Except for cash flow information, the financial statements have
been prepared on an accruals basis and are based on historical
costs, modified, where applicable, by the measurement at
fair value of selected non-current assets, financial assets and
financial liabilities.
The consolidated financial statements for the year ended
30 June 2014 were approved and authorised for issue by the
Board of Directors on 19 August 2014.
a) Principle of Consolidation
The consolidated financial statements incorporate the
assets, liabilities and results of entities controlled by
Minotaur Exploration Ltd at the end of the reporting period.
The parent entity controls a subsidiary if it is exposed, or
has rights, to variable returns from its involvement with
the subsidiary and has the ability to affect those returns
through its power over the subsidiary.
Where controlled entities have entered or left the Group
during the year, the financial performance of those entities
is included only for the period of the year that they were
controlled. A list of controlled entities is contained in
Note 24 to the financial statements.
In preparing the consolidated financial statements, all
inter-group balances and transactions between entities
in the consolidated group have been eliminated in full
on consolidation.
Non-controlling interests, being the equity in a subsidiary
not attributable, directly or indirectly, to a parent, are
reported separately within the equity section of the
consolidated statement of financial position and statement
of profit or loss and other comprehensive income.
The non-controlling interests in the net assets comprise their
interests at the date of the original business combination
and their share of changes in equity since that date.
Non-controlling interests
Non-controlling interests (i.e. equity in a subsidiary not
attributable directly or indirectly to a parent) are present
in the consolidated statement of financial position
within equity separately from the equity of the owners of
the parent.
b) Income Tax
The income tax expense (revenue) for the year comprises
current income tax expense (income) and deferred tax
expense (income).
Current income tax expense charged to profit or loss is the
tax payable on taxable income. Current tax liabilities
(assets) are measured at the amounts expected to be paid
to (recovered from) the relevant taxation authority.
Deferred income tax expense reflects movements in
deferred tax asset and deferred tax liability balances during
the year as well unused tax losses.
Current and deferred income tax expense (income)
is charged or credited outside profit or loss when the tax
relates to items that are recognised outside profit or loss.
Except for business combinations, no deferred income tax
is recognised from the initial recognition of an asset or
liability, where there is no effect on accounting or taxable
profit or loss.
Deferred tax assets and liabilities are calculated at the
tax rates that are expected to apply to the period
when the asset is realised or the liability is settled and
their measurement also reflects themanner in which
management expects to recover or settle the carrying
amount of the related asset or liability.

M I N O T A U R E X P L O R A T I O N F I N A N C I A L R E P O R T 2 0 1 4
29
Deferred tax assets relating to temporary differences and
unused tax losses are recognised only to the extent that it is
probable that future taxable profit will be available against
which the benefits of the deferred tax asset can be utilised.
Where temporary differences exist in relation to investments
in subsidiaries, branches, associates, and joint ventures,
deferred tax assets and liabilities are not recognised where
the timing of the reversal of the temporary difference can
be controlled and it is not probable that the reversal will
occur in the foreseeable future.
Current tax assets and liabilities are offset where a legally
enforceable right of set-off exists and it is intended that
net settlement or simultaneous realisation and settlement
of the respective asset and liability will occur. Deferred tax
assets and liabilities are offset where:
a) a legally enforceable right of set-off exists; and
b) the deferred tax assets and liabilities relate to income
taxes levied by the same taxation authority on either the
same taxable entity or different taxable entities where
it is intended that net settlement or simultaneous
realisation and settlement of the respective asset and
liability will occur in future periods in which significant
amounts of deferred tax assets or liabilities are expected
to be recovered or settled.
Tax consolidation
The parent entity and its Australian wholly-owned entities
are part of a tax-consolidated Group under Australian
taxation law. The head entity within the tax consolidation
group for the purposes of the tax consolidation system is
Minotaur Exploration Ltd.
Minotaur Exploration Ltd and each of its own wholly-owned
subsidiaries recognise the current and deferred tax assets
and deferred tax liabilities applicable to the transactions
undertaken by it, after elimination of intra-group
transactions. Minotaur Exploration Ltd recognises the entire
tax-consolidated Group’s retained tax losses.
c) Property, Plant and Equipment
Each class of property, plant and equipment is carried at
cost as indicated less, where applicable, any accumulated
depreciation and impairment losses.
Land and buildings
Buildings are measured on the cost basis and therefore
carried at cost less accumulated depreciation for buildings
and any accumulated impairment. In the event the
carrying amount of buildings is greater than the estimated
recoverable amount, the carrying amount is written down
immediately to the estimated recoverable amount and
impairment losses are recognised either in profit or loss
or as a revaluation decrease if the impairment losses relate
to a revalued asset. A formal assessment of recoverable
amount is made when impairment indicators are present.
Plant and equipment
Plant and equipment are measured on the cost basis and
therefore carried at cost less accumulated depreciation
and any accumulated impairment. In the event the
carrying amount of plant and equipment is greater than
the estimated recoverable amount, the carrying amount is
written down immediately to the estimated recoverable
amount and impairment losses are recognised either in
profit or loss or as a revaluation decrease if the impairment
losses relate to a revalued asset. A formal assessment of
recoverable amount is made when impairment indicators
are present.
The carrying amount of property, plant and equipment is
reviewed annually by directors to ensure it is not in excess of
the recoverable amount from these assets. The recoverable
amount is assessed on the basis of the expected net cash
flows that will be received from the asset’s employment
and subsequent disposal. The expected net cash flows have
been discounted to their present values in determining
recoverable amounts.
The cost of fixed assets constructed within the consolidated
group includes the cost of materials, direct labour,
borrowing costs and an appropriate proportion of fixed and
variable overheads. Subsequent costs are included in the
asset’s carrying amount or recognised as a separate asset, as
appropriate, only when it is probable that future economic
benefits associated with the item will flow to the Group
and the cost of the item can be measured reliably. All other
repairs and maintenance are charged to the statement of
profit or loss and other comprehensive income during the
financial period in which they are incurred.
Depreciation
The depreciable amount of all fixed assets including
buildings and capitalised lease assets, but excluding
freehold land, is depreciated on a straight-line and
diminishing value basis over the asset’s useful life to the
consolidated group commencing from the time the asset is
held ready for use. Leasehold improvements are depreciated
over the shorter of either the unexpired period of the lease
or the estimated useful lives of the improvements.
The useful life for each class of depreciable assets are:
Class of Fixed Asset Useful life
Leasehold improvements 3 – 7 years
Plant and equipment 2 - 20 years
Motor Vehicles 6 - 10 years

N O T E S T O T H E C O N S O L I D A T E D
FINANCIAL STATEMENTSF O R T H E Y E A R E N D E D 3 0 J U N E 2 0 1 4
30
1 SUMMARY OF SIGNIFICANT ACCOUNTING POLICIESc) Property, Plant and Equipment
Depreciation
The assets’ residual values and useful lives are reviewed, and
adjusted if appropriate, at the end of each reporting period.
An asset’s carrying amount is written down immediately
to its recoverable amount if the asset’s carrying amount is
greater than its estimated recoverable amount.
Gains and losses on disposals are determined by comparing
proceeds with the carrying amount. These gains and
losses are included in the statement of profit or loss and
other comprehensive income. When revalued assets are
sold, amounts included in the revaluation surplus relating
to that asset are transferred to retained earnings.
d) Exploration and Development Expenditure
Exploration, evaluation and development expenditures
incurred are capitalised in respect of each identifiable area
of interest. These costs are only capitalised to the extent that
they are expected to be recovered through the successful
development of the area or where activities in the area have
not yet reached a stage that permits reasonable assessment
of the existence of economically recoverable reserves.
Accumulated costs in relation to an abandoned area are
written off in full against profit in the year in which the
decision to abandon the area is made.
When production commences, the accumulated costs for the
relevant area of interest are amortised over the life of the
area according to the rate of depletion of the economically
recoverable reserves.
A regular review is undertaken of each area of interest to
determine the appropriateness of continuing to capitalise
costs in relation to that area of interest.
Costs of site restoration are provided over the life of the
project from when exploration commences and are included
in the costs of that stage. Site restoration costs include the
dismantling and removal of mining plant, equipment and
building structures, waste removal, and rehabilitation of
the site in accordance with local laws and regulations and
clauses of the permits. Such costs have been determined
using estimates of future costs, current legal requirements
and technology on an undiscounted basis.
Any changes in the estimates for the costs are accounted
on a prospective basis. In determining the costs of site
restoration, there is uncertainty regarding the nature and
extent of the restoration due to community expectations
and future legislation. Accordingly the costs have
been determined on the basis that the restoration will be
completed within one year of abandoning the site.
e) Leases
Leases of fixed assets where substantially all the risks
and benefits incidental to the ownership of the asset, but
not the legal ownership that is transferred to entities in
the consolidated group, are classified as finance leases.
Finance leases are capitalised by recognising an asset and a
liability at the lower of the amounts equal to the fair value
of the leased property or the present value of the minimum
lease payments, including any guaranteed residual values.
Lease payments are allocated between the reduction of the
lease liability and the lease interest expense for the period.
Leased assets are depreciated on a diminishing value
basis over the shorter of their estimated useful lives or
the lease term.
Lease payments for operating leases, where substantially all
the risks and benefits remain with the lessor, are recognised
as expenses in the periods in which they are incurred.
Lease incentives under operating leases are recognised
as a liability and amortised on a straight line basis over the
lease term.
f) Financial Instruments
Recognition and initial measurement
Financial assets and financial liabilities are recognised when
the entity becomes a party to the contractual provisions to
the instrument. For financial assets, this is equivalent to the
date that the company commits itself to either the purchase
or sale of the asset (i.e. trade date accounting is adopted).
Financial instruments are initially measured at fair value
plus transaction costs, except where the instrument is
classified "at fair value through profit or loss", in which case
transaction costs are expensed to profit or loss immediately.
Classification and subsequent measurement
Finance instruments are subsequently measured at fair
value, amortised cost using the effective interest rate
method, or cost.
Amortised cost is the amount at which the financial asset
or financial liability is measured at initial recognition less
principal repayments and any reduction for impairment, and
adjusted for any cumulative amortisation of the difference
between that initial amount and the maturity amount
calculated using the effective interest method.
Fair value is determined based on current bid prices for all
quoted investments. Valuation techniques are applied to
determine the fair value for all unlisted securities, including
recent arm’s length transactions, reference to similar
instruments and option pricing models.
M I N O T A U R E X P L O R A T I O N F I N A N C I A L R E P O R T 2 0 1 4
31
The effective interest method is used to allocate interest
income or interest expense over the relevant period and is
equivalent to the rate that discounts estimated future cash
payments or receipts (including fees, transaction costs and
other premiums or discounts) through the expected life
(or when this cannot be reliably predicted, the contractual
term) of the financial instrument to the net carrying
amount of the financial asset or financial liability. Revisions
to expected future net cash flows will necessitate an
adjustment to the carrying value with a consequential
recognition of an income or expense item in profit or loss.
The Group does not designate any interests in subsidiaries,
associates or joint venture entities as being subject to
the requirements of Accounting Standards specifically
applicable to financial instruments.
i) Loans and receivables
Loans and receivables are non-derivative financial
assets with fixed or determinable payments that are
not quoted in an active market and are subsequently
measured at amortised cost. Gains or losses are
recognised in profit or loss through the amortisation
process and when the financial asset is derecognised.
Loans and receivables are included in current assets,
where they are expected to mature within 12 months
after the end of the reporting period.
ii) Available-for-sale investments
Available-for-sale investments are non-derivative
financial assets that are either not capable of being
classified into other categories of financial assets
due to their nature or they are designated as such by
management. They comprise investments in the
equity of other entities where there is neither a fixed
maturity nor fixed or determinable payments.
They are subsequently measured at fair value with any
remeasurements other than impairment losses and
foreign exchange gains and losses recognised in other
comprehensive income. When the financial asset is
derecognised, the cumulative gain or loss pertaining
to that asset previously recognised in other
comprehensive income is reclassified into profit or loss.
Available-for-sale financial assets are classified as
non-current assets when they are expected to be sold
after 12 months from the end of the reporting period.
All other available-for-sale financial assets are classified
as current assets.
iii) Financial Liabilities
Non-derivative financial liabilities other than financial
guarantees are subsequently measured at amortised
cost. Gains or losses are recognised in profit or loss
through the amortisation process and when the
financial liability is derecognised.
g) Investments in Associates and Joint Ventures
Associates are those entities over which the Group is able
to exert significant influence but which are not subsidiaries.
A joint venture is an arrangement that the Group controls
jointly with one or more other investors, and over which the
Group has rights to a share of the arrangement’s net assets
rather than direct rights to underlying assets and obligations
for underlying liabilities. A joint arrangement in which the
Group has direct rights to underlying assets and obligations
for underlying liabilities is classified as a joint operation.
Investments in associates and joint ventures are accounted
for using the equity method. Interests in joint operations are
accounted for by recognising the Group’s assets (including
its share of any assets held jointly), its liabilities (including
its share of any liabilities incurred jointly), its revenue from
the sale of its share of the output arising from the joint
operation, its share of the revenue from the sale of the
output by the joint operation and its expenses (including
its share of any expenses incurred jointly). Any goodwill or
fair value adjustment attributable to the Group’s share in
the associate or joint venture is not recognised separately
and is included in the amount recognised as investment.
The carrying amount of the investment in associates and
joint ventures is increased or decreased to recognise the
Group’s share of the profit or loss and other comprehensive
income of the associate and joint venture, adjusted where
necessary to ensure consistency with the accounting
policies of the Group.
Unrealised gains and losses on transactions between the
Group and its associates and joint ventures are eliminated
to the extent of the Group’s interest in those entities.
Where unrealised losses are eliminated, the underlying
asset is also tested for impairment.
h) Business Combinations
The Group applies the acquisition method in accounting for
business combinations. The consideration transferred by the
Group to obtain control of a subsidiary is calculated as the
sum of the acquisition-date fair values of assets transferred,
liabilities incurred and the equity interests issued by the
Group, which includes the fair value of any asset or liability
arising from a contingent consideration arrangement.
Acquisition costs are expensed as incurred.
The Group recognises identifiable assets acquired and
liabilities assumed in a business combination regardless
of whether they have been previously recognised in
the acquiree’s financial statements prior to the acquisition.
Assets acquired and liabilities assumed are generally
measured at their acquisition-date fair values.

N O T E S T O T H E C O N S O L I D A T E D
FINANCIAL STATEMENTSF O R T H E Y E A R E N D E D 3 0 J U N E 2 0 1 4
32
1 SUMMARY OF SIGNIFICANT ACCOUNTING POLICIESh) Business Combinations
Goodwill is stated after separate recognition of identifiable
intangible assets. It is calculated as the excess of the sum of
(a) fair value of consideration transferred, (b) the recognised
amount of any non-controlling interest in the acquire, and
(c) acquisition-date fair value of any existing equity interest
in the acquiree, over the acquisition-date fair values of
identifiable net assets.
i) Foreign Currency Transactions and Balances
Functional and presentation currency
The functional currency of each of the Group’s entities
is measured using the currency of the primary
economic environment in which that entity operates.
The consolidated financial statements are presented in
Australian dollars which is the parent entity’s functional
and presentation currency.
Transactions and balances
Foreign currency transactions are translated into functional
currency using the exchange rates prevailing at the date
of the transaction. Foreign currency monetary items are
translated at the year end exchange rate. Non-monetary
items measured at historical cost continue to be carried
at the exchange rate at the date of the transaction.
Non-monetary items measured at fair value are reported
at the exchange rate at the date when fair values were
determined.
Exchange differences arising on the translation of monetary
items are recognised in profit or loss, except where deferred
in equity as a qualifying cash flow or net investment hedge.
Exchange differences arising on the translation of
non-monetary items are recognised directly in other
comprehensive income to the extent that the underlying
gain or loss is recognised in other comprehensive
income; otherwise the exchange difference is recognised
in profit or loss.
Group companies
The financial results and position of foreign operations,
whose functional currency is different from the Group’s
presentation currency, are translated as follows:
• assets and liabilities are translated at exchange rates
prevailing at the end of the reporting period;
• income and expenses are translated at average
exchange rates for the period; and
• retained earnings are translated at the exchange rates
prevailing at the date of the transaction.
Exchange differences arising on translation of foreign
operations with functional currencies other than Australian
dollars are recognised in other comprehensive income
and included in the foreign currency translation reserve in
the statement of financial position. These differences
are recognised in profit or loss in the period in which the
operation is disposed.
j) Employee Benefits
Short-term employee benefits are current liabilities included
in employee benefits, measured at the undiscounted
amount that the Group expects to pay as a result of the
unused entitlement. Annual leave is included in ‘other
long-term benefit’ and discounted when calculating the
leave liability as the Group does not expect all annual leave
for all employees to be used wholly within 12 months
of the end of reporting period. Annual leave liability is still
presented as current liability for presentation purposes
under AASB 101 Presentation of Financial Statements.
Equity-settled compensation
The Group operates an employee share option plan.
Share-based payments to employees are measured at the
fair value of the instruments issued and amortised over the
vesting periods. Share-based payments to non-employees
are measured at the fair value of goods or services received
or the fair value of the equity instruments issued, if it is
determined the fair value of the goods or services cannot
be reliably measured, and are recorded at the date the
goods or services are received. The corresponding amount
is recorded to the option reserve. The fair value of options
is determined using the Black-Scholes pricing model.
The number of options expected to vest is reviewed and
adjusted at the end of each reporting period such that the
amount recognised for services received as consideration
for the equity instruments granted is based on the number
of equity instruments that eventually vest.
k) Provisions
Provisions are recognised when the Group has a legal or
constructive obligation, as a result of past events, for
which it is probable that an outflow of economic benefits
will result and that outflow can be reliably measured.
Provisions are measured using the best estimate of the
amounts required to settle the obligation at the end of
the reporting period.
l) Cash and Cash Equivalents
Cash and cash equivalents include cash on hand, deposits
available on demand with banks, other short-term highly
liquid investments with original maturities of 6 months or
less, and bank overdrafts.
Bank overdrafts are reported within short-term borrowings
in current liabilities in the statement of financial position.

M I N O T A U R E X P L O R A T I O N F I N A N C I A L R E P O R T 2 0 1 4
33
m) Revenue and Other Income
Revenue is measured at the fair value of the consideration
received or receivable after taking into account any trade
discounts and volume rebates allowed. When the inflow of
consideration is deferred, it is treated as the provision
of financing and is discounted at a rate of interest that is
generally accepted in the market for similar arrangements.
The difference between the amount initially recognised and
the amount ultimately received is interest revenue.
Revenue from the sale of goods is recognised at the point of
delivery as this corresponds to the transfer of significant risks
and rewards of ownership of the goods and the cessation
of all involvement in those goods.
Interest revenue is recognised using the effective interest
rate method.
Revenue recognition relating to the provision of services
is determined with reference to the stage of completion of
the transaction at the end of the reporting period, where
outcome of the contract can be estimated reliably. Stage
of completion is determined with reference to the services
performed to date as a percentage of total anticipated
services to be performed. Where the outcome cannot be
estimated reliably, revenue is recognised only to the extent
that related expenditure is recoverable.
All revenue is stated net of the amount of goods and
services tax (GST).
n) Trade and Other Payables
Trade and other payables represent the liabilities for goods
and services received by the entity that remain unpaid at
the end of the reporting period. The balance is recognised
as a current liability with the amounts normally paid within
30-90 days of recognition of the liability.
o) Borrowing Costs
Borrowing costs directly attributable to the acquisition,
construction or production of assets that necessarily take a
substantial period of time to prepare for their intended use
or sale are added to the cost of those assets, until such time
as the assets are substantially ready for their intended use
or sale.
All other borrowing costs are recognised in profit or loss in
the period in which they are incurred.
p) Goods and Services Tax (GST)
Revenues, expenses and assets are recognised net of the
amount of GST, except where the amount of GST incurred is
not recoverable from the Australian Taxation Office (ATO).
Receivables and payables are stated inclusive of the
amount of GST receivable or payable. The net amount of
GST recoverable from, or payable to, the ATO is included
with other receivables or payables in the statement of
financial position.
Cash flows are presented on a gross basis. The GST
components of cash flows arising from investing or financing
activities which are recoverable from, or payable to, the ATO
are presented as operating cash flows included in receipts
from customers or payments to suppliers.
q) Government Grants
Government grants are recognised at fair value where there
is reasonable assurance that the grant will be received and
all grant conditions will be met. Grants relating to expense
items are recognised as income over the periods necessary
to match the grant to the costs they are compensating.
Grants relating to assets are credited to deferred income
at fair value and are credited to income over the expected
useful life of the asset on a straight-line basis.
r) Comparative Figures
When required by Accounting Standards, comparative
figures have been adjusted to conform to changes in
presentation for the current financial year.
s) Critical Accounting Estimates and Judgments
The directors evaluate estimates and judgments incorpo-
rated into the financial statements based on historical
knowledge and best available current information.
Estimates assume a reasonable expectation of future events
and are based on current trends and economic data,
obtained both externally and within the Group.
Key estimates
i) Impairment
The Group assesses impairment at the end of each
reporting period by evaluating conditions and
events specific to the Group that may be indicative of
impairment triggers. Recoverable amounts of relevant
assets are reassessed using value-in-use calculations
which incorporate various key assumptions.
ii) Exploration and evaluation expenditure
The Group capitalises expenditure relating to
exploration and evaluation where it is considered likely
to be recoverable or where the activities have not
reached a stage that permits a reasonable assessment
of the existence of reserves. While there are certain
areas of interest from which no reserves have been
extracted, the directors are of the continued belief that
such expenditure should not be written off since
feasibility studies in such areas have not yet concluded.
Such capitalised expenditure is carried at the end of
the year at $19,243,007 (2013: $12,176,647).

N O T E S T O T H E C O N S O L I D A T E D
FINANCIAL STATEMENTSF O R T H E Y E A R E N D E D 3 0 J U N E 2 0 1 4
34
1 SUMMARY OF SIGNIFICANT ACCOUNTING POLICIES
t) Changes in accounting policies
New and amended standards adopted by the Group
A number of new and revised standards are effective for
annual periods beginning on or after 1 January 2014.
Information on these new standards is presented below.
AASB 10 Consolidated Financial Statements
AASB 10 supersedes AASB 127 Consolidated and Separate
Financial Statements (AASB 127) and AASB Interpretation
112 Consolidation - Special Purpose Entities. AASB 10
revises the definition of control and provides extensive new
guidance on its application. These new requirements have
the potential to affect which of the Group’s investees are
considered to be subsidiaries and therefore to change the
scope of consolidation. The requirements on consolidation
procedures, accounting for changes in non-controlling
interests and accounting for loss of control of a subsidiary
are unchanged.
Management has reviewed its control assessments in
accordance with AASB 10 and has concluded that there is
no effect on the classification (as subsidiaries or otherwise)
of any of the Group’s investees held during the period or
comparative periods covered by these financial statements.
AASB 11 Joint Arrangements
AASB 11 supersedes AASB 131 Interests in Joint Ventures
(AAS 131) and AASB Interpretation 113 Jointly Controlled
Entities- Non-Monetary-Contributions by Venturers.
AASB 11 revises the categories of joint arrangement, and
the criteria for classification into the categories, with the
objective of more closely aligning the accounting with the
investor’s rights and obligations relating to the arrangement.
In addition, AASB 131’s option of using proportionate
consolidation for arrangements classified as jointly
controlled entities under that Standard has been eliminated.
AASB 11 now requires the use of the equity method for
arrangements classified as joint ventures (as for investments
in associates).
The Group has a number of joint arrangements in place as at
30 June 2014. Management has reviewed the classification
of its joint arrangements in accordance with AASB 11 as has
concluded that they are joint operations.
The changes made to the standards outlined above have
not significantly impacted the Group’s financial statements.
AASB 12 Disclosure of interests in Other Entities
AASB 12 integrates and makes consistent the disclosure
requirements for various types of investments, including
unconsolidated structured entities. It introduces new
disclosure requirements about the risks to which an entity
is exposed from its involvement with structured entities.
This did not impact on the Group as they do not have
interests in other entities.
AASB 13 Fair Value Measurement
AASB 13 clarifies the definition of fair value and provides
related guidance and enhanced disclosures about fair value
measurements. It does not affect which items are required
to be fair-valued.
The scope of AASB 13 is broad and it applies for both
financial and non-financial items for which other
Australian Accounting Standards require or permit fair
value measurements or disclosures about fair value
measurements, except in certain circumstances.
The Group has applied AASB 13 for the first time in the
current year, see Notes 27 and 29.
Amendments to AASB 119 Employee Benefits
Under the amendments, employee benefits ‘expected to
be settled wholly’ (as opposed to ‘due to be settled’ under
the superseded version of AASB 119) within 12 months
after the end of the reporting period are short-term
benefits, and are therefore not discounted when calculating
leave liabilities. As the Group does not expect all annual
leave for all employees to be used wholly within 12 months
of the end of reporting period, annual leave is included in
‘other long-term benefit’ and discounted when calculating
the leave liability.
This change has had no impact on the presentation
of annual leave as a current liability in accordance with
AASB 101 Presentation of Financial Statements.
u) Standards, amendments and interpretations to existing
standards that are not yet effective and have not been
adopted early by the Group
The AASB has issued a number of new and amended
Accounting Standards and Interpretations that have
mandatory application dates for future reporting periods,
some of which are relevant to the Group. The Group has
decided not to early adopt any of the new and amended
pronouncements. The Group’s assessment of the new and
amended pronouncements that are relevant to the Group
but applicable in future reporting periods is set out below:
AASB 9 Financial Instruments (December 2010)
AASB 9 introduces new requirements for the classification
and measurement of financial assets and liabilities.
These requirements improve and simplify the approach
for classification and measurement of financial assets
compared with the requirements of AASB 139.
M I N O T A U R E X P L O R A T I O N F I N A N C I A L R E P O R T 2 0 1 4
35
The main changes are:
a) Financial assets that are debt instruments will be
classified based on (1) the objective of the entity’s business
model for managing the financial assets; and (2) the
characteristics of the contractual cash flows.
b) Allows an irrevocable election on initial recognition
to present gains and losses on investments in equity
instruments that are not held for trading in other compre-
hensive income (instead of in profit or loss). Dividends in
respect of these investments that are a return on investment
can be recognised in profit or loss and there is no
impairment or recycling on disposal of the instrument.
c) Financial assets can be designated and measured at fair
value through profit or loss at initial recognition if doing so
eliminates or significantly reduces a measurement or
recognition inconsistency that would arise from measuring
assets or liabilities, or recognising the gains and losses on
them, on different bases.
d) Where the fair value option is used for financial
liabilities the change in fair value is to be accounted for
as follows:
• The change attributable to changes in credit risk are
presented in other comprehensive income (OCI); and
• The remaining change is presented in profit or loss.
If this approach creates or enlarges an accounting mismatch
in the profit or loss, the effect of the changes in credit risk
are also presented in profit or loss.
Otherwise, the following requirements have generally been
carried forward unchanged from AASB 139 into AASB 9:
• Classification and measurement of financial
liabilities; and
• Derecognition requirements for financial assets
and liabilities.
AASB 9 requirements regarding hedge accounting represent
a substantial overhaul of hedge accounting that will enable
entities to better reflect their risk management activities in
the financial statements.
The Group has not yet assessed the full impact of
AASB 9 as this standard does not apply mandatorily before
1 January 2018.
AASB 2012-3 Amendments to Australian Accounting Standards – Offsetting Financial Assets and Financial Liabilities
AASB 2012-3 adds application guidance to AASB 132 to
address inconsistencies identified in applying some of the
offsetting criteria of AASB 132, including clarifying the
meaning of “currently has a legally enforceable right of
set-off” and that some gross settlement systems may be
considered equivalent to net settlement.
When AASB 2012-3 is first adopted for the year ending
30 June 2015, there will be no impact on the Group as this
standard merely clarifies existing requirements in AASB 132.
AASB 2013-3 Recoverable Amount Disclosures for Non-Financial Assets
These narrow-scope amendments address disclosure of
information about the recoverable amount of impaired
assets if that amount is based on fair value less costs of
disposal.
When developing IFRS 13 Fair Value Measurement, the IASB
decided to amend IAS 36 Impairment of Assets to require
disclosures about the recoverable amount of impaired
assets. The IASB noticed however that some of the
amendments made in introducing those requirements
resulted in the requirement being more broadly applicable
than the IASB had intended.
These amendments to IAS 36 therefore clarify the IASB’s
original intention that the scope of those disclosures is
limited to the recoverable amount of impaired assets that
is based on fair value less costs of disposal.
AASB 2013-3 makes the equivalent amendments to AASB
136 Impairment of Assets.
When these amendments are first adopted for the year
ending 30 June 2015, they are unlikely to have any
significant impact on the entity given that they are largely
of the nature of clarification of existing requirements.
AASB 2013-9 Amendments to Australian Accounting Standards – Conceptual Framework, Materiality and Financial Instruments (Part C: Financial Instruments)
• add a new chapter on hedge accounting to AASB 9
Financial Instruments, substantially overhauling
previous accounting requirements in this area;
• allow the changes to address the so-called ‘own credit’
issue that were already included in AASB 9 to be
applied in isolation without the need to change any
other accounting for financial instruments; and
• defer the mandatory effective date of AASB 9 from
‘1 January 2015’ to ‘1 January 2017’.
Note that, subsequent to issuing these amendments, the
AASB has issued AASB 2014-1 which defers the effective
date of AASB 9 to ‘1 January 2018’.
The entity has not yet assessed the full impact of these
amendments.

N O T E S T O T H E C O N S O L I D A T E D
FINANCIAL STATEMENTSF O R T H E Y E A R E N D E D 3 0 J U N E 2 0 1 4
36
1 SUMMARY OF SIGNIFICANT ACCOUNTING POLICIESu) Standards, amendments and interpretations to existing
standards that are not yet effective and have not been
adopted early by the Group
Accounting for Acquisitions of Interests in Joint Operations(Amendments to IFRS 11)
The amendments to IFRS 11 state that an acquirer of an
interest in a joint operation in which the activity of
the joint operation constitutes a ‘business’, as defined in
IFRS 3 Business Combinations, should:
• apply all of the principles on business combinations
accounting in IFRS 3 and other IFRSs except
principles that conflict with the guidance of IFRS 11.
This requirement also applies to the acquisition of
additional interests in an existing joint operation that
results in the acquirer retaining joint control of the
joint operation (note that this requirement applies to
the additional interest only, i.e. the existing interest is
not remeasured) and to the formation of a joint
operation when an existing business is contributed to
the joint operation by one of the parties that participate
in the joint operation; and
• provide disclosures for business combinations as
required by IFRS 3 and other IFRSs.
The Australian Accounting Standards Board (AASB) is
expected to issue the equivalent Australian amendment
shortly.
When these amendments are first adopted for the year
ending 30 June 2017, there will be no material impact on
the transactions and balances recognised in the financial
statements.
2014 2013$ $
2 PARENT INFORMATION
Assets
Current assets 4,355,400 8,586,234
Non-current assets 21,704,736 15,673,509
26,060,136 24,259,743
Liabilities
Current liabilities 752,115 1,914,853
Non-current liabilities 424,459 157,545
1,176,574 2,072,398
Equity
Issued capital 36,874,859 31,572,748
Reserves – Share option 924,588 1,013,175
Retained earnings (12,915,885) (10,398,578)
24,883,562 22,187,345
Financial performance
Loss for the year (2,517,307) (2,673,631)
Other comprehensive income - -
(2,517,307) (2,673,631)
Guarantees
Minotaur Exploration Ltd has not entered into any guarantees, in the current or previous financial year,
in relation to the debts of its subsidiaries.
Contingent Liabilities
Contingent liabilities of the parent entity have been incorporated into the Group information in Note 23.
The contingent liabilities of the parent are consistent with that of the Group.
Contractual Commitments
Contractual Commitments of the parent entity have been incorporated into the Group information in
Note 22. The contractual commitments of the parent are consistent with that of the Group.

M I N O T A U R E X P L O R A T I O N F I N A N C I A L R E P O R T 2 0 1 4
37
3 OPERATING SEGMENTS
Information reported to the chief operating decision maker (identified as the board) for the purposes of resource allocation and
assessment of segment performance focuses on types of business segments encountered by the Group. The Group’s reportable
segments under AASB 8 are therefore as follows:
• Exploration activities conducted in Australia; and
• Exploration activities conducted in Canada.
The following is an analysis of the Group’s revenue and results from continuing operation by reportable segment.
The revenue reported below represents revenue generated from financial institutions and joint venture partners. There were no
intersegment sales during the period.
Segment profit/(loss) represents the profit earned by each segment without allocation of central administration costs, finance costs,
depreciation and income tax(expense)/benefit. This is the measure reported to the chief operating decision maker for the purposes
of resources allocation and assessment of segment performance.
Segment Revenue Segment Results
Year ended Year ended30 June 30 June 30 June 30 June
2014 2013 2014 2013$ $ $ $
Mineral exploration – Australia 264,382 120,489 (1,642,128) (1,175,180)
Mineral exploration – Canada - - - (144,349)
264,382 120,489 (1,642,128) (1,319,529)
Finance costs - - (8,494) (10,609)
Administration/Corporate 456,958 1,495,625 (1,979,311) (2,398,645)
Depreciation - - (184,356) (194,968)
Consolidated revenue 721,340 1,616,114
Loss before income tax (3,814,289) (3,923,751)
Income tax benefit/(expense) 1,147,478 796,076
Loss for year (2,666,811) (3,127,675)
Segment assets
Where an asset is used across multiple segments, the asset is allocated to the segment that receives the majority of economic value
from the asset. In the majority of instances, segment assets are clearly identifiable on the basis of their nature and physical location.

N O T E S T O T H E C O N S O L I D A T E D
FINANCIAL STATEMENTSF O R T H E Y E A R E N D E D 3 0 J U N E 2 0 1 4
38
3 OPERATING SEGMENTS
The following is an analysis of the Group’s assets and liabilities by reportable operating segment:
Opening Capital ClosingBalance Expenditure/ Impairment/ Balance
1 July 2013 Investment Share of loss 30 June 2014$ $ $ $
Segment assets
Mineral exploration – Australia 12,176,647 8,972,871 (1,906,511) 19,243,007
Total segment assets 12,176,647 8,972,871 (1,906,511) 19,243,007
Administration/Corporate 12,746,916 7,312,637
24,923,563 26,555,644
Segment liabilities
Mineral exploration – Australia 600,000 -
Administration/Corporate 2,136,218 1,672,082
2,736,218 1,672,082
Opening Capital ClosingBalance Expenditure/ Impairment/ Balance
1 July 2012 Investment Share of loss 30 June 2013$ $ $ $
Segment assets
Mineral exploration – Australia 8,658,717 4,813,599 (1,295,669) 12,176,647
Mineral exploration – Canada 7,987 136,362 (144,349) -
Total segment assets 8,666,704 4,949,961 (1,440,018) 12,176,647
Administration/Corporate 18,087,941 12,746,916
26,754,645 24,923,563
Segment liabilities
Mineral exploration – Australia - 600,000
Administration/Corporate 2,681,081 2,136,218
2,681,081 2,736,218

M I N O T A U R E X P L O R A T I O N F I N A N C I A L R E P O R T 2 0 1 4
39
Consolidated Group
2014 2013$ $
4 REVENUE AND EXPENSES
a) Revenue
Administration fees 264,382 120,489
Rent received 57,110 -
Bank interest received or receivable 202,544 477,596
524,036 598,085
b) Other income
From continuing operations
Net loss on disposal of tenements (489) -
Net gains on disposal of available-for-sale investments 194,533 738
Other income 3,260 -
197,304 738
c) Gain on reclassification of non-current asset
Gain on reclassification of investment in Petratherm Ltd – refer Note 10 and 11 - 1,017,291
- 1,017,291
d) Expenses
Impairment of non-current assets
Capitalised exploration costs written-off 1,906,511 1,440,018
Impairment of available-for-sale financial assets 722,097 2,104,643
Total impairment of non-current assets 2,628,608 3,544,661
Depreciation of non-current assets
Leasehold improvements 93,635 57,103
Plant and equipment 59,245 88,767
Motor vehicles 31,476 49,098
Total depreciation 184,356 194,968
Finance expenses
Finance costs 180 180
Interest applicable to hire-purchase contracts 8,314 10,429
Total finance expenses 8,494 10,609

N O T E S T O T H E C O N S O L I D A T E D
FINANCIAL STATEMENTSF O R T H E Y E A R E N D E D 3 0 J U N E 2 0 1 4
40
Consolidated Group
2014 2013$ $
e) Employee benefits expense
Wages, salaries, directors fees and other remuneration expenses 2,742,140 3,007,404
Superannuation expense 187,826 213,202
Transfer to/(from) annual leave provision (13,919) (18,206)
Transfer to/(from) long service leave provision 29,339 35,477
Share-based payments expense - 226,270
Transfer to exploration assets (2,628,424) (2,856,235)
316,962 607,912
f) Other expenses
Secretarial, professional and consultancy 651,488 455,256
Employee taxes and levies 116,666 143,554
Occupancy costs 261,748 274,165
Insurance costs 63,861 62,170
ASX/ASIC costs 37,492 32,954
Share register maintenance 57,713 34,277
Communication costs 27,040 31,107
Promotion and seminars 43,304 30,525
Audit fees 37,826 31,500
Other expenses 100,071 86,207
1,397,209 1,181,715
5 INCOME TAX EXPENSE
The major components of income tax expense are:
Statement of comprehensive income
Current income tax
Current income tax charge - -
Research and development tax concession (1,147,478) (796,076)
Income tax (benefit)/expense reported in the income statement (1,147,478) (796,076)
A reconciliation between tax expense and the product of accounting profit before
income tax multiplied by the Group’s applicable income tax rate is as follows:
Accounting (loss)/profit before income tax (3,814,289) (3,923,751)
At the Group’s statutory income tax rate of 30% (2013: 30%) (1,144,287) (1,177,125)
Immediate write-off of exploration expenditure (1,122,056) (1,289,783)
Expenditure not allowable for income tax purposes 816,690 1,129,329
Non-assessable income (2,166) (305,409)
Tax losses not recognised due to not meeting recognition criteria 1,451,819 1,642,988
- -
4 REVENUE AND EXPENSES

M I N O T A U R E X P L O R A T I O N F I N A N C I A L R E P O R T 2 0 1 4
41
The Group has tax losses arising in Australia of $83,960,470 (2013: $3,168,789) that
are available indefinitely for offset against future taxable profits of the companies in
which the losses arose. In addition, the Group has $2,532,821 (2013: $102,276)
capital losses available. The large increase in these losses pertains to the acquisition
of Breakaway Resources Ltd’s income tax consolidated group from 5 December 2013.
The utilisation of these losses acquired will be restricted to the available fraction
rules, which the Company will undertake to review upon lodgement of its 2014
income tax return.
Tax consolidation
Minotaur Exploration Ltd and its 100% owned Australian resident subsidiaries
have formed a tax consolidated group with effect from 5 February 2005. Minotaur
Exploration Ltd is the head entity of the tax consolidated Group.
6 EARNINGS PER SHARE
Basic earnings per share amounts are calculated by dividing net profit for the year
attributable to ordinary equity holders of the parent by the weighted average
number of ordinary shares outstanding during the year.
Diluted earnings per share amounts are calculated by dividing the net profit
attributable to ordinary equity holders of the parent by the weighted average
number of ordinary shares outstanding during the year plus the weighted
average number of ordinary shares that would be issued on the conversion
of all the dilutive potential ordinary shares into ordinary shares.
The following reflects the income and share data used in the basic and diluted
earnings per share computations:
Net profit/(loss) attributable to ordinary equity holders of the parent ($2,666,811) ($3,127,675)
Weighted average number of ordinary shares for basic earnings per share 137,614,845 103,712,284
Effect of dilution
Share options - -
Weighted average number of ordinary shares adjusted for the effect of dilution 137,614,845 103,712,284
In accordance with AASB 133 ‘Earnings per Share’, as potential ordinary shares may
only result in a situation where their conversion results in an increase in loss per share
or decrease in profit per share from continuing operations, no dilutive effect has been
taken into account for 2014.
There have been no other transactions involving ordinary shares or potential
ordinary shares between the reporting date and the date of completion of these
financial statements.
5 INCOME TAX EXPENSE

N O T E S T O T H E C O N S O L I D A T E D
FINANCIAL STATEMENTSF O R T H E Y E A R E N D E D 3 0 J U N E 2 0 1 4
42
Consolidated Group
2014 2013$ $
7 CASH AND CASH EQUIVALENTS
Cash and cash equivalents
Cash at bank and on hand 242,175 2,248,636
Short-term deposits 4,551,998 7,021,000
4,794,173 9,269,636
Cash at bank earns interest at floating rates based on daily bank deposit rates.
Short-term deposits are made for varying periods between one day and six
months, depending on the immediate cash requirements of the Group, and
earn interest at the respective short-term deposit rate.
Reconciliation to Statement of Cash Flows
For the purposes of the Statement of Cash Flows, cash and cash equivalents
comprise the following at 30 June:
Cash at banks and on hand 242,175 2,248,636
Short-term deposits 4,551,998 7,021,000
4,794,173 9,269,636
Reconciliation of net loss after tax to net cash flows from operations
Net loss (2,666,811) (3,127,675)
Adjustments for non-cash items:
Depreciation 184,356 194,968
Impairment of non-current assets 2,628,608 3,544,661
Gain on reclassification of non-current asset - 1,017,291
Net (gain)/loss on disposal of property plant and equipment, available-for-sale financial instruments and tenements (194,533) (738)
Share options expensed - 226,270
Shares issued for services – refer to Note 18 100,155 -
Changes in assets and liabilities:
(Increase)/decrease in trade and other receivables 114,955 (88,065)
(Increase)/decrease in prepayments (18,418) 22,721
(Decrease)/increase in trade and other payables (1,004,292) (483,809)
(Decrease)/increase in employee provisions (11,233) 17,271
Net cash used in operating activities (867,213) (711,687)

M I N O T A U R E X P L O R A T I O N F I N A N C I A L R E P O R T 2 0 1 4
43
Consolidated Group
2014 2013$ $
8 TRADE AND OTHER RECEIVABLES
Trade receivables (i) 44,499 52,528
44,499 52,528
Information regarding the credit risk of current receivables is set out in Note 28.
i) Trade receivables are non-interest bearing and are generally on 30-90 day terms. An allowance for doubtful debts is made when there is objective evidence that a trade receivable is impaired. No impairment was recognised in 2013 and 2014 and no receivables are past due at balance date.
9 OTHER CURRENT ASSETS
Prepayments 73,905 55,487
Accrued income 11,299 86,006
Other 17,100 4,300
102,304 145,793
10 AVAILABLE-FOR-SALE INVESTMENTS
At fair value – Shares, listed:
Opening balance 1,853,158 2,859,067
Revaluations 60,000 (60,000)
Disposals (169,930) (96,441)
Acquisitions 85,000 251,532
Additions through acquisition of Breakaway (a) 21,562 -
Impairments (722,097) (2,118,291)
Gain on reclassification of non-current assets (b) - 1,017,291
1,127,693 1,853,158
a) Relates to shares held by Breakaway in Barra Resources Ltd and Iron Road Limited.
b) During the 2013 financial year, the Company changed the classification of its
investment in Petratherm Ltd from investments in associates using the equity
method to available-for-sale investments due to dilution of Minotaur’s interest
following a share placement.
In accordance with Accounting Standards the Company’s investment was
revalued to the market value on the date of the change in classification with a
gain of $1,017,291 recognised in the Statement of profit or loss and other
comprehensive income.

N O T E S T O T H E C O N S O L I D A T E D
FINANCIAL STATEMENTSF O R T H E Y E A R E N D E D 3 0 J U N E 2 0 1 4
Consolidated Group
2014 2013$ $
11 INVESTMENT ACCOUNTED FOR USING THE EQUITY METHOD
Investments in associates - -
As at 30 June 2013, the Company had no investments accounted for using the equity
method. During the financial year, the Board changed the method of accounting
for Petratherm Ltd and was reclassified as an available-for-sale investment. Refer to
Note 10 for more details.
12 PROPERTY, PLANT AND EQUIPMENT
Land and buildings
Cost
Opening balance 508,723 -
Additions - 508,723
Disposals - -
508,723 508,723
Accumulated depreciation
Opening balance - -
Depreciation for the year - -
Disposals - -
- -
Net book value of land and buildings 508,723 508,723
Property is measured at historical cost less accumulated depreciation.
Land and buildings with a net book value of $508,723 (2013: $508,723) is
offered as security against a mortgage of $392,000.
Leasehold improvements
Cost
Opening balance 611,218 -
Additions - 611,218
Disposals - -
611,218 611,218
Accumulated depreciation
Opening balance 57,103 -
Depreciation for the year 93,635 57,103
Disposals - -
150,738 57,103
Net book value of leasehold improvements 460,480 554,115
44

M I N O T A U R E X P L O R A T I O N F I N A N C I A L R E P O R T 2 0 1 4
45
Consolidated Group
2014 2013$ $
Plant and equipment
Cost
Opening balance 405,725 774,379
Additions 13,224 31,568
Additions through acquisition of Breakaway 36,587 -
Disposals - (400,222)
455,536 405,725
Accumulated depreciation
Opening balance 281,935 583,390
Depreciation for the year 59,495 88,767
Disposals - (390,222)
341,430 281,935
Net book value of plant and equipment 114,106 123,790
Kaolin pilot plant
Cost
Opening balance 283,765 293,765
Additions - -
Disposals - (10,000)
283,765 283,765
Accumulated depreciation
Opening balance 170,794 99,538
Depreciation for the year 47,288 81,256
Disposals - (10,000)
218,082 170,794
Net book value of Kaolin pilot plant 65,683 112,971
Motor vehicles
Cost
Opening balance 202,232 226,707
Additions - -
Disposals - (24,475)
202,232 202,232
Accumulated depreciation
Opening balance 76,030 51,407
Depreciation for the year 31,226 49,098
Disposals - (24,475)
107,256 76,030
Net book value of motor vehicles 94,976 126,202
Total net book value of property, plant and equipment 1,243,968 1,425,801
Motor vehicles with a net book value of $94,976 (2013: $126,202) is
offered as security against hire purchase contracts of $114,386.
12 PROPERTY, PLANT AND EQUIPMENT
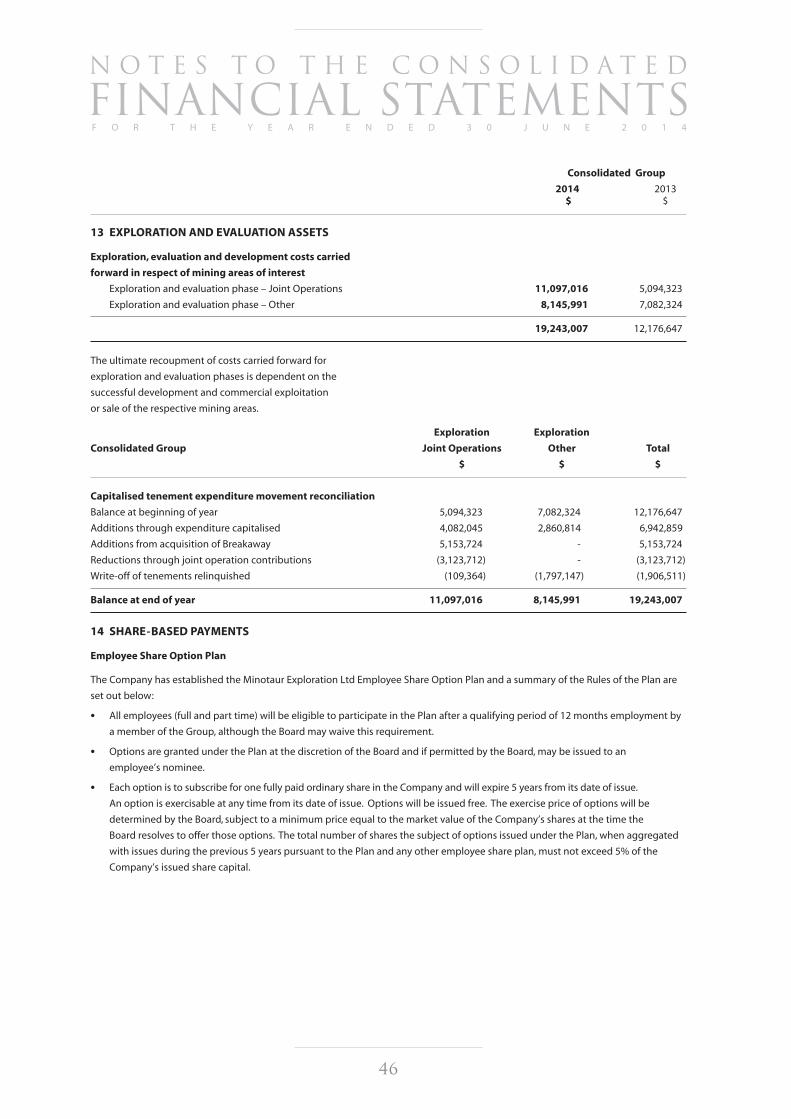
N O T E S T O T H E C O N S O L I D A T E D
FINANCIAL STATEMENTSF O R T H E Y E A R E N D E D 3 0 J U N E 2 0 1 4
46
Consolidated Group
2014 2013$ $
13 EXPLORATION AND EVALUATION ASSETS
Exploration, evaluation and development costs carried
forward in respect of mining areas of interest
Exploration and evaluation phase – Joint Operations 11,097,016 5,094,323
Exploration and evaluation phase – Other 8,145,991 7,082,324
19,243,007 12,176,647
The ultimate recoupment of costs carried forward for
exploration and evaluation phases is dependent on the
successful development and commercial exploitation
or sale of the respective mining areas.
Exploration Exploration
Consolidated Group Joint Operations Other Total
$ $ $
Capitalised tenement expenditure movement reconciliation
Balance at beginning of year 5,094,323 7,082,324 12,176,647
Additions through expenditure capitalised 4,082,045 2,860,814 6,942,859
Additions from acquisition of Breakaway 5,153,724 - 5,153,724
Reductions through joint operation contributions (3,123,712) - (3,123,712)
Write-off of tenements relinquished (109,364) (1,797,147) (1,906,511)
Balance at end of year 11,097,016 8,145,991 19,243,007
14 SHARE-BASED PAYMENTS
Employee Share Option Plan
The Company has established the Minotaur Exploration Ltd Employee Share Option Plan and a summary of the Rules of the Plan are
set out below:
• All employees (full and part time) will be eligible to participate in the Plan after a qualifying period of 12 months employment by
a member of the Group, although the Board may waive this requirement.
• Options are granted under the Plan at the discretion of the Board and if permitted by the Board, may be issued to an
employee’s nominee.
• Each option is to subscribe for one fully paid ordinary share in the Company and will expire 5 years from its date of issue.
An option is exercisable at any time from its date of issue. Options will be issued free. The exercise price of options will be
determined by the Board, subject to a minimum price equal to the market value of the Company’s shares at the time the
Board resolves to offer those options. The total number of shares the subject of options issued under the Plan, when aggregated
with issues during the previous 5 years pursuant to the Plan and any other employee share plan, must not exceed 5% of the
Company’s issued share capital.

M I N O T A U R E X P L O R A T I O N F I N A N C I A L R E P O R T 2 0 1 4
47
14 SHARE-BASED PAYMENTS
Employee Share Option Plan
• If, prior to the expiry date of options, a person ceases to be an employee of a Group company for any reason other than retirement
at age 60 or more (or such earlier age as the board permits), permanent disability, redundancy or death, the options held by
that person (or that person’s nominee) automatically lapse on the first to occur of a) the expiry of the period of 6 months from
the date of such occurrence, and b) the expiry date. If a person dies, the options held by that person will be exercisable by that
person’s legal personal representative.
• Options cannot be transferred other than to the legal personal representative of a deceased option holder.
• The Company will not apply for official quotation of any options. Shares issued as a result of the exercise of options will rank
equally with the Company’s previously issued shares.
• Option holders may only participate in new issues of securities by first exercising their options.
The Board may amend the Plan Rules subject to the requirements of the Listing Rules. The expense recognised in the Statement of
profit or loss and other comprehensive income in relation to share-based payments is disclosed in Note 4 (e).
The following table illustrates the number and weighted average exercise prices (WAEP) and movements in share options under
the Company’s Employee Share Option Plan issued during the year:
2014 2014 2013 2013
Number WAEP Number WAEP
Outstanding at the beginning of the year 4,570,000 0.23 2,270,000 0.24
Granted during the year - - 2,420,000 0.25
Forfeited during the year (500,000) 0.22 - -
Expired or lapsed during the year (410,000) 0.25 (120,000) 0.55
Outstanding at the end of the year 3,660,000 0.23 4,570,000 0.23
Exercisable at the end of the year 3,660,000 0.23 4,570,000 0.23
The outstanding balance as at 30 June 2013 is represented by:
• A total of 1,565,000 options exercisable at any time until 29 September 2016 with an exercise price of $0.21.
• A total of 2,095,000 options exercisable at any time until 3 July 2017 with an exercise price of $0.25.
The weighted average remaining contractual life for the share options outstanding as at 30 June 2014 is 2.69 years (2013: 3.40 years).
The range of exercise prices for options outstanding at the end of the year was $0.21–$0.25 (2013: $0.21–$0.25).
The weighted average fair value of options granted during the year was $nil (2013: $0.0935).
The fair value of the equity-settled share options granted under the option plan is estimated as at the date of grant using
a Black-Scholes model taking into account the terms and conditions upon which the options were granted.
Shares issued for services
On 29 October 2013, 894,240 ordinary fully paid shares were issued at $0.112 per share for corporate advisory services received by
the Group in relation to the takeover of Breakaway Resources completed on 5 December 2013.
Shares issued for the takeover of Breakaway Resources
The following table is an analysis of shares issued by the company as consideration for all the shares in Breakaway Resources:
Date Issued Number Issued
25 October 2013 39,601,137
5 December 2013 3,883,956
43,485,093
Further information regarding the takeover of Breakaway Resources is set out in Note 25.
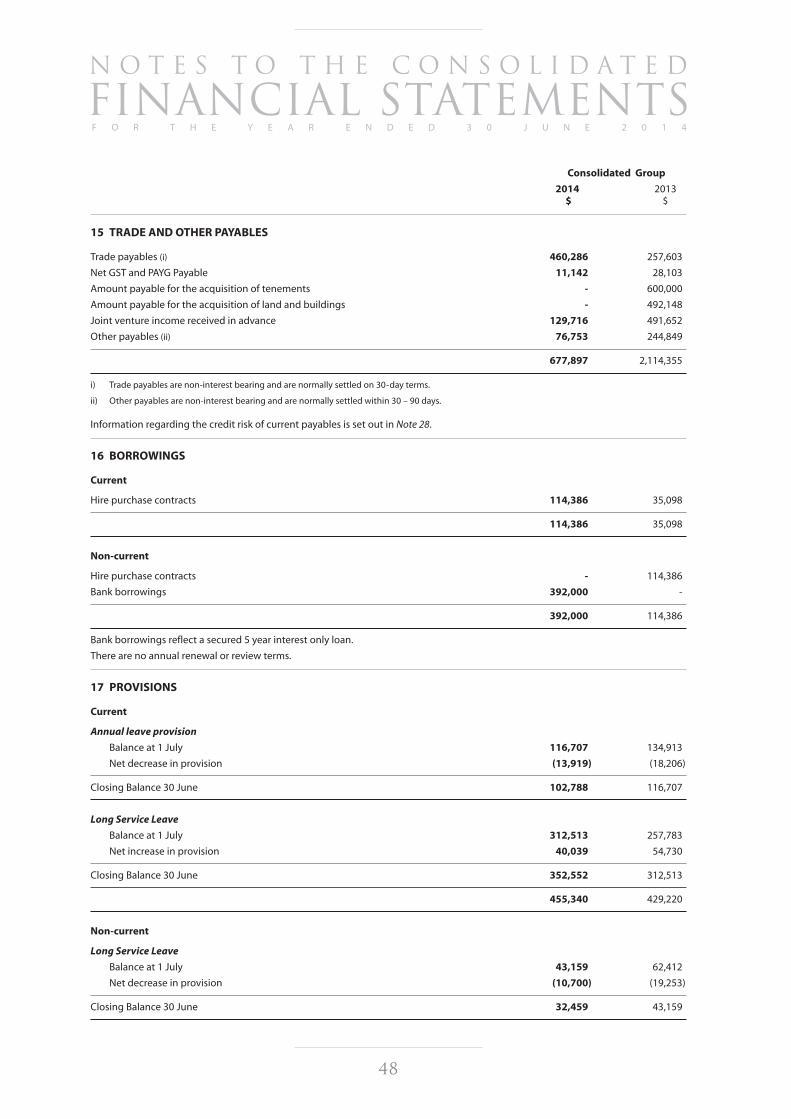
N O T E S T O T H E C O N S O L I D A T E D
FINANCIAL STATEMENTSF O R T H E Y E A R E N D E D 3 0 J U N E 2 0 1 4
48
Consolidated Group
2014 2013$ $
15 TRADE AND OTHER PAYABLES
Trade payables (i) 460,286 257,603
Net GST and PAYG Payable 11,142 28,103
Amount payable for the acquisition of tenements - 600,000
Amount payable for the acquisition of land and buildings - 492,148
Joint venture income received in advance 129,716 491,652
Other payables (ii) 76,753 244,849
677,897 2,114,355
i) Trade payables are non-interest bearing and are normally settled on 30-day terms.
ii) Other payables are non-interest bearing and are normally settled within 30 – 90 days.
Information regarding the credit risk of current payables is set out in Note 28.
16 BORROWINGS
Current
Hire purchase contracts 114,386 35,098
114,386 35,098
Non-current
Hire purchase contracts - 114,386
Bank borrowings 392,000 -
392,000 114,386
Bank borrowings reflect a secured 5 year interest only loan.
There are no annual renewal or review terms.
17 PROVISIONS
Current
Annual leave provision
Balance at 1 July 116,707 134,913
Net decrease in provision (13,919) (18,206)
Closing Balance 30 June 102,788 116,707
Long Service Leave
Balance at 1 July 312,513 257,783
Net increase in provision 40,039 54,730
Closing Balance 30 June 352,552 312,513
455,340 429,220
Non-current
Long Service Leave
Balance at 1 July 43,159 62,412
Net decrease in provision (10,700) (19,253)
Closing Balance 30 June 32,459 43,159

M I N O T A U R E X P L O R A T I O N F I N A N C I A L R E P O R T 2 0 1 4
49
Consolidated Group
2014 2013$ $
18 ISSUED CAPITAL
152,165,042 fully paid ordinary shares (2013: 107,785,709) 36,874,859 31,572,748
2014 2013Number $ Number $
Balance at beginning of financial year 107,785,709 31,572,748 103,585,709 30,816,748
Shares issued by way of private placement - - 4,200,000 756,000
Shares issued for services 894,240 100,155 - -
Shares issued for Breakaway takeover 43,485,093 5,218,211 - -
Transaction costs on shares issued - (16,255) - -
Balance at end of financial year 152,165,042 36,874,859 107,785,709 31,572,748
Effective 1 July 1998, the Corporations legislation in place abolished the concepts of authorised capital and par value shares.
Accordingly, the Parent does not have authorised capital nor par value in respect of its issued shares.
Fully paid ordinary shares carry one vote per share and carry the right to dividends (in the event such a dividend was declared).
Consolidated Group
2014 2013$ $
19 RESERVES
Share option reserve (a) 924,589 1,013,175
Foreign currency translation reserve (b) (125,630) (126,547)
Available-for-sale revaluation reserve (c) - (60,000)
798,959 826,628
a) Share option reserve
Balance at beginning of financial year 1,013,175 981,763
Issue of options to employees and officers under Employee Share Option Plan - 226,270
Transfer to retained earnings upon lapse of options (88,586) (194,858)
Balance at end of financial year 924,589 1,013,175
The share option reserve comprises the fair value of options issued to employees
under the Company’s Employee Share Option Plan and to directors of the Company.
b) Foreign currency translation reserve
Balance at beginning of financial year (126,547) (133,320)
Translation of foreign subsidiary 917 6,773
Balance at end of financial year (125,630) (126,547)
The foreign currency translation reserve comprises all foreign currency differences
arising from the translation of the financial statements of Minotaur Atlantic
Exploration Ltd, the group’s foreign operations in Canada.

N O T E S T O T H E C O N S O L I D A T E D
FINANCIAL STATEMENTSF O R T H E Y E A R E N D E D 3 0 J U N E 2 0 1 4
50
Consolidated Group
2014 2013$ $
c) Available-for-sale revaluation reserve
Balance at beginning of financial year (60,000) -
Revaluation increment/(decrement) 60,000 (60,000)
Balance at end of financial year - (60,000)
The available-for-sale revaluation reserve comprises the cumulative net change in the fair
value of available-for-sale financial assets until the investments are derecognised or impaired.
20 RETAINED EARNINGS
Balance at beginning of financial year (10,510,471) (7,591,627)
Net loss attributable to members of the parent entity (2,596,370) (3,113,702)
Transfer from share option reserve – lapsed options 88,586 194,858
Balance at end of financial year (13,018,255) (10,510,471)
21 NON-CONTROLLING INTEREST
Balance at beginning of financial year 298,440 -
Issue of shares in Minotaur Gold Solutions Ltd to private investor - 312,413
Net loss attributable to non-controlling interest (70,441) (13,973)
227,999 298,440
22 COMMITMENTS FOR EXPENDITURE
Operating leases
Not longer than 1 year 352,587 219,125
Longer than 1 year and not longer than 5 years 1,252,238 6,003
1,604,825 225,128
Hire purchase commitments
Not longer than 1 year 118,041 43,412
Longer than 1 year and not longer than 5 years - 118,041
118,041 161,453
Less: future finance charges (3,655) (11,969)
114,386 149,484
Terms of lease arrangements
The Group extended its operating lease on 13 June 2014 for its principal place of business. The lease expires on 9 July 2019 and
includes an escalation clause linked to CPI. As a result of the acquisition of Breakaway, the Group has an operating lease in place
relating to an office space previously occupied by Breakaway. The lease term expires on 14 September 2014 and it is anticipated
that the lease will not be renewed. Future minimum lease payments under hire purchase contracts together with the present
value of the net minimum lease payments are listed in the above table.
Exploration leases
In order to maintain current rights of tenure to exploration tenements the Group will be required to outlay in the year ending 30 June
2015 amounts of approximately $7.5 million in respect of tenement lease rentals and to meet minimum expenditure requirements.
Pursuant to various Joint Venture agreements, it is expected that of this minimum expenditure requirement, $2.6 million will be
funded by Minotaur’s Joint Venture partners. The net obligation to the Minotaur Exploration Group is expected to be fulfilled in the
normal course of operations.
19 RESERVES

M I N O T A U R E X P L O R A T I O N F I N A N C I A L R E P O R T 2 0 1 4
51
23 CONTINGENT LIABILITIES AND CONTINGENT ASSETS
At the date of signing this report, the Group is not aware of any Contingent Asset or Liability that should be disclosed in accordance
with AASB 137. It is however noted that the Company has established various bank guarantees in place with a number of State
Governments in Australia, totalling $322,200 at 30 June 2014 (2013: $271,000). These guarantees are designed to act as collateral
over the tenements which Minotaur explores on and can be used by the relevant Government authorities in the event that Minotaur
does not sufficiently rehabilitate the land it explores on. It is noted that the bank guarantees have, as at the date of signing this
report, never been utilised by any State Government.
Ownership interest
Country of 2014 2013incorporation % %
24 CONTROLLED ENTITIES
Parent entity
Minotaur Exploration Limited (i) Australia
Subsidiaries
Minotaur Operations Pty Ltd (ii) Australia 100 100
Minotaur Resources Investments Pty Ltd (ii) Australia 100 100
Minotaur Industrial Minerals Pty Ltd (ii) Australia 100 100
Great Southern Kaolin Pty Ltd (ii) Australia 100 100
Breakaway Resources Pty Ltd (iii) (iv) Australia 100 -
Scotia Nickel Pty Ltd (iii) Australia 100 -
Altia Resources Pty Ltd (iii) Australia 100 -
Levuka Resources Pty Ltd (iii) Australia 100 -
BMV Properties Pty Ltd (iii) Australia 100 -
Minotaur Gold Solutions Limited (v) Australia 50 50
Minotaur Atlantic Exploration Limited Canada 100 100
i) Minotaur Exploration Limited is the head entity within the tax-consolidated Group.
ii) These companies are members of the tax-consolidated Group.
iii) On 5 December 2013, Minotaur Exploration completed its 100% acquisition of Breakaway Resources Ltd and its subsidiaries; Scotia Nickel Pty Ltd, Altia Resources Pty Ltd, Levuka Resources Pty Ltd and BMV Properties Pty Ltd. Upon acquiring 100% of Breakaway, the Group moved to add Breakaway and its subsidiaries to its tax consolidated Group.
iv) On 20 June 2014, Breakaway Resources Ltd converted to a proprietary company and is now called Breakaway Resources Pty Ltd.
v) Although the Group does not hold more than half of the voting rights of Minotaur Gold Solutions Ltd, it is able to control the company as it has the power of the operating decisions of the entity and is exposed to the variable returns from its investment. The assessment of control is a significant judgement as Minotaur holds 50% of the voting equity.

N O T E S T O T H E C O N S O L I D A T E D
FINANCIAL STATEMENTSF O R T H E Y E A R E N D E D 3 0 J U N E 2 0 1 4
52
25 BUSINESS COMBINATIONS
On 5 December 2013, the Group completed its 100% acquisition of the issued share
capital and voting rights of Breakaway Resources Limited (Breakaway), a company
based in Australia that operates within the mineral exploration segment. The objective
of the acquisition was to further increase the Group’s tenements holdings over highly
prospective ground, in particular in Western Australia and Queensland.
Details of the business combination are as follows:$
Fair value of consideration transferred
Issue of shares for acquisition of Breakaway 5,218,211
5,218,211
Recognised amounts of identifiable net assets
Cash and cash equivalents 490,259
Trade and other receivables 53,043
Total current assets 543,302
Property, plant and equipment 36,587
Available-for-sale investments 21,562
Total non-current assets 58,149
Trade and other payables 460,311
Provisions 26,653
Total current liabilities 486,964
Trade creditors 50,000
Total non-current liabilities 50,000
Identifiable net assets 64,487
Exploration and evaluation assets recognised on acquisition 5,153,724
Cash and cash equivalents acquired 490,259
Net cash inflow on acquisition 490,259
Acquisition costs charged to expenses 518,147
Net cash paid relating to the acquisition (27,888)
Consideration transferred
Acquisition-related costs amounting to $518,147 are not included as part of consideration transferred and have been recognised as
an expense in the consolidated statement of profit or loss and other comprehensive income, as part of other expenses.
Exploration and evaluation assets
The exploration and evaluation asset that arose on the combination can be attributed to tenement holdings over highly prospective
geological areas and has been recognised as an exploration and evaluation asset. The exploration and evaluation asset that has been
recognised is attributable to the mineral exploration segment.
Breakaway’s contribution to the Group’s results
Breakaway contributed $7,339 and $268,316 to the Group’s revenues and losses respectively from the date of acquisition to 30 June
2014. Had the acquisition occurred on 1 July 2013, the Group’s revenue for the period to 30 June 2014 would have been ($7,899)
and the Group’s loss for the period would have been $3,513,220.

M I N O T A U R E X P L O R A T I O N F I N A N C I A L R E P O R T 2 0 1 4
53
Consolidated Group
2014 2013$ $
26 AUDITOR’S REMUNERATION
Audit or review of the financial report 37,826 31,500
Taxation compliance 1,000 -
Total auditor’s remuneration 38,826 31,500
27 FINANCIAL ASSETS AND LIABILITIES
Note 1(f ) provides a description of each category of
financial assets and financial liabilities and the related
accounting policies. The carrying amounts of financial
assets and financial liabilities in each category are
as follows:Loans and
AFS Cash Receivables TotalNote $ $ $ $
(Carried at fair value) (Carried at amortised cost)
30 June 2014
Financial assets
Cash and cash equivalents 7 - 4,794,173 - 4,794,173
Trade and other receivables 8 - - 44,499 44,499
Available-for-sale assets 27(a) 1,127,693 - - 1,127,693
1,127,693 4,794,173 44,499 5,966,365
Payables Borrowings TotalNote $ $ $
(Carried at amortised cost)
Financial liabilities
Trade and other payables 15 677,897 - 677,897
Current borrowings 27(b) - 114,386 114,386
Non-current borrowings 27(b) - 392,000 392,000
677,897 506,386 1,184,283
Loans andAFS Cash Receivables Total
Note $ $ $ $
(Carried at fair value) (Carried at amortised cost)
30 June 2013
Financial assets
Cash and cash equivalents 7 - 9,269,636 - 9,269,636
Trade and other receivables 8 - - 52,528 52,528
Available-for-sale assets 27(a) 1,853,158 - - 1,853,158
1,853,158 9,269,636 52,528 11,175,322

N O T E S T O T H E C O N S O L I D A T E D
FINANCIAL STATEMENTSF O R T H E Y E A R E N D E D 3 0 J U N E 2 0 1 4
54
Payables Borrowings TotalNote $ $ $
(Carried at amortised cost)
Financial liabilities
Trade and other payables 15 2,114,355 - 2,114,355
Current borrowings 27(b) - 35,098 35,098
Non-current borrowings 27(b) - 114,386 114,386
2,114,355 149,484 2,263,839
A description of the Group’s financial instrument risks, including risk management objectives and policies is given in Note 28.
The methods used to measure financial assets and liabilities reported at fair value are described in Note 29.
Consolidated Group
2014 2013$ $
27(a) AFS financial assets
The details and carrying amounts of AFS financial assets are as follows:
Listed securities 1,127,693 1,853,158
1,127,693 1,853,158
The listed securities are denominated in AUD and are publically traded in Australia.
27(b) Borrowings
Borrowings include the financial liabilities:Current Non-Current
2014 2013 2014 2013$ $ $ $
Financial liabilities
Fair value
Finance lease liabilities 114,386 35,098 - 114,386
Bank borrowings - - 392,000 -
114,386 35,098 392,000 114,386
All borrowings are denominated in AUD.
Borrowings at amortised cost
Bank borrowings are secured by land and buildings owned by the Group (see Note 12). Current interest rates are variable
and average 5.03% (2013: $nil). The carrying amount of bank borrowings is considered to be a reasonable approximation
of the fair value.
Other financial instruments
The carrying amount of the following financial assets and liabilities is considered to be a reasonable approximation of the fair value:
• Trade and other receivables;
• Cash and cash equivalents; and
• Trade and other payables
27 FINANCIAL ASSETS AND LIABILITIES

M I N O T A U R E X P L O R A T I O N F I N A N C I A L R E P O R T 2 0 1 4
55
28 FINANCIAL RISK MANAGEMENT
Credit risk management
The Group manages its capital to ensure that entities in the Group will be able to continue as a going concern while maximising
the return to stakeholders. The capital structure of the Group consists of cash and cash equivalents and equity attributable to
equity holders of the parent, comprising issued capital, reserves and accumulated losses as disclosed in Notes 18, 19, 20 respectively.
Proceeds from share issues are used to maintain and expand the Groups exploration activities and fund operating costs.
Consolidated Group
2014 2013$ $
Financial assets
Cash and cash equivalents 4,794,173 9,269,636
Trade receivables 44,499 52,528
Available-for-sale assets 1,127,693 1,883,158
Financial liabilities
Payables 677,897 2,114,355
Borrowings 510,041 161,453
Credit risk
Credit risk management Credit risk refers to the risk that a counterparty will default on its contractual obligations resulting in
financial loss to the Group. The Group has adopted a policy of only dealing with creditworthy counterparties as a means of
mitigating the risk of financial loss from activities.
The Group does not have any significant credit risk exposure to any single counterparty or any Group of counterparties having
similar characteristics. The credit risk on liquid funds is limited because the counterparties are banks with high credit-ratings
assigned by international credit-rating agencies.
The carrying amount of financial assets recorded in the financial statements, net of any allowances for losses, represents the Group’s
maximum exposure to credit risk.
Interest rate risk
The tables listed below detail the Group’s interest bearing assets, consisting solely of cash on hand and on short term deposit (with
all maturities less than one year in duration).
Weighted average Less than effective interest rate 1 year
% $
Consolidated
2014
Variable interest rate 3.44 4,794,173
2013
Variable interest rate 4.46 9,269,636
At reporting date, if interest rates had been 50 basis points higher or lower and all other variables were held constant, the Group’s:
• net loss would increase or decrease by $35,160 which is mainly attributable to the Group’s exposure to interest rates on its
variable bank deposits.
Liquidity risk management
Ultimate responsibility for liquidity risk management rests with the Board, which has built an appropriate liquidity risk management
framework for the management of the Group’s short, medium and long-term funding and liquidity management requirements.
The Group manages liquidity risk by maintaining adequate reserves.

N O T E S T O T H E C O N S O L I D A T E D
FINANCIAL STATEMENTSF O R T H E Y E A R E N D E D 3 0 J U N E 2 0 1 4
56
Liquidity and interest risk tables
The following table details the Company’s and the Group’s remaining contractual maturity for its non-derivative financial liabilities.
The table has been drawn up based on the undiscounted cash flows of financial liabilities based on the earliest date on which the
Group can be required to pay. The table includes both interest and principal cash flows.
Longer than 1 yearWeighted average Less than and not longer
effective interest rate 1 year than 5 years
% $ $
Consolidated
2014
Interest bearing 5.33 114,386 392,000
Non-interest bearing - 677,897 -
2013
Interest bearing 6.22 32,983 114,386
Non-interest bearing - 2,114,355 -
Available-for-sale financial instrument risk management
Ultimate responsibility for the Group’s investments in available for sale financial instruments rests with the Board. The Board actively
manages its investments by reviewing the market value of the Group’s portfolio at each board meeting and making appropriate
investment decisions.
29 FAIR VALUE MEASUREMENT
Financial assets and financial liabilities measured at fair value in the statement of financial position are grouped into three Levels of
a fair value hierarchy. The three Levels are defined based on the observability of significant inputs to the measurement, as follows:
• level 1: quoted prices (unadjusted) in active markets for identical assets or liabilities
• level 2: inputs other than quoted prices included within Level 1 that are observable for the asset or liability, either directly or indirectly
• level 3: unobservable inputs for the asset or liability
The following table shows the Levels within the hierarchy of financial assets and liabilities measured at fair value on a recurring basis
at 30 June 2014 and 30 June 2013:
Level 1 Level 2 Level 3 Total$ $ $ $
30 June 2014
Financial assets at fair value
Available-for-sale investments
Listed securities 1,127,693 - - 1,127,693
1,127,693 - - 1,127,693
30 June 2013
Financial assets at fair value
Available-for-sale investments
Listed securities 1,853,158 - - 1,853,158
1,853,158 - - 1,853,158
There were no transfers between Level 1 and Level 2 in 2014 or 2013.
Included within Level 1 of the hierarchy are listed investments. The fair values of these financial assets have been based on the
closing quoted bid prices at the end of the reporting period, excluding transaction costs.
28 FINANCIAL RISK MANAGEMENT

M I N O T A U R E X P L O R A T I O N F I N A N C I A L R E P O R T 2 0 1 4
57
30 RELATED PARTY DISCLOSURE AND KEY MANAGEMENT PERSONNEL REMUNERATION
Transactions with key management personnel
The following individuals are classified as key management personnel in accordance with AASB 124 ’Related Party Disclosures’:
Mr Derek Carter, Chairman
Mr Andrew Woskett, Managing Director
Dr Antonio Belperio, Executive Director
Mr Richard Bonython, Non-Executive Director
Mr John Atkins, Non-Executive Director (Appointed 20 November 2013)
Mr Donald Stephens, Company Secretary
Mr Varis Lidums, Commercial Manager
Mr Ian Garsed, General Manager of Exploration
Key management personnel remuneration includes the following expenses:
2014 2013$ $
Salaries including bonuses 1,196,118 1,236,496
Total short term employee benefits 1,196,118 1,236,496
Superannuation 73,992 73,586
Total post-employment benefits 73,992 73,586
Share based payments - 46,750
Total remuneration 1,270,110 1,356,832
Transactions with associates
Throughout the year no transactions took place between Minotaur Exploration Limited and any associates (2013: $nil).
In addition, no amounts were owed by any associates at the end of the year (2013: $nil).
Director related entities
Throughout the year no transactions took place between Minotaur Exploration Limited and any Director related entities (2013: $643).
Wholly owned group transactions
The entities comprising the wholly owned Group and ownership interests in these controlled entities are set out in Note 24.
Transactions between Minotaur Exploration Limited and other entities in the wholly owned Group during the year consisted of loans
advanced by Minotaur Exploration Limited to fund exploration activities.
31 POST-REPORTING DATE EVENTS
No matter or circumstance has arisen since 30 June 2014 that has significantly affected the Group’s operations, results or state of
affairs, or may do so in the future.

58
DIRECTORS’declaration
F O R T H E Y E A R E N D E D 3 0 J U N E 2 0 1 4
The Directors of the Company declare that:
1 the financial statements and notes, as set out on pages 24 to 57, are in accordance with the Corporations Act 2001 and:
a) comply with Accounting Standards, which, as stated in accounting policy Note 1 to the financial statements, constitutes explicit and unreserved compliance with International Financial Reporting Standards (IFRS); and
b) give a true and fair view of the financial position as at 30 June 2014 and of the performance for the year ended on that date of the Company and consolidated Group;
2 the Managing Director and Company Secretary have each declared that:
a) the financial records of the Company for the financial year have been properly maintained in accordance with section 286 of the Corporations Act 2001;
b) the financial statements and notes for the financial year comply with Accounting Standards; and
c) the financial statements and notes for the financial year give a true and fair view; and
3 in the Directors’ opinion there are reasonable grounds to believe that the Company will be able to pay its debts as and when they become due and payable.
This declaration is made in accordance with a resolution of the Board of Directors.
Derek CarterChairman
Dated this 19th day of August 2014

59
independenTauditor’sREPORT
T O T H E M E M B E R S O F M I N O T A U R E X P L O R A T I O N L I M I T E D
INDEPENDENT AUDITOR’S REPORT TO THE MEMBERS OF MINOTAUR EXPLORATION LIMITED
Report on the financial report
We have audited the accompanying financial report of Minotaur Exploration Limited (the “Company”), which comprises the consolidated statement of financial position as at 30 June 2014, the consolidated statement of profit or loss and other comprehensive income, consolidated statement of changes in equity and consolidated statement of cash flows for the year then ended, notes comprising a summary of significant accounting policies and other explanatory information and the directors’ declaration of the consolidated entity comprising the Company and the entities it controlled at the year’s end or from time to time during the financial year.
Directors’ responsibility for the financial report
The Directors of the Company are responsible for the preparation of the financial report that gives a true and fair view in accordance with Australian Accounting Standards and the Corporations Act 2001. The Directors’ responsibility also includes such internal control as the Directors determine is necessary to enable the preparation of the financial reportthat gives a true and fair view and is free from material misstatement, whether due to fraud or error. The Directors alsostate, in the notes to the financial report, in accordance with Accounting Standard AASB 101 Presentation of FinancialStatements, the financial statements comply with International Financial Reporting Standards.
Auditor’s responsibility
Our responsibility is to express an opinion on the financial report based on our audit. We conducted our audit in accordance with Australian Auditing Standards. Those standards require us to comply with relevant ethical requirements relating to audit engagements and plan and perform the audit to obtain reasonable assurance whether the financial report is free from material misstatement.
An audit involves performing procedures to obtain audit evidence about the amounts and disclosures in the financial report. The procedures selected depend on the auditor’s judgement, including the assessment of the risks of materialmisstatement of the financial report, whether due to fraud or error.
Level 1,67 Greenhill RdWayville SA 5034
Correspondence to:GPO Box 1270Adelaide SA 5001
T 61 8 8372 6666F 61 8 8372 6677E [email protected] www.grantthornton.com.au

independenTauditor’sREPORTAuditor’s responsibility
In making those risk assessments, the auditor considers internal control relevant to the Company’s preparation of the financial report that gives a true and fair view in order to design audit procedures that are appropriate in the circumstances, but not for the purpose of expressing an opinion on the effectiveness of the Company’s internal control. An audit also includes evaluating the appropriateness of accounting policies used and the reasonableness of accounting estimates made by the Directors, as well as evaluating the overall presentation of the financial report.
We believe that the audit evidence we have obtained is sufficient and appropriate to provide a basis for our audit opinion.
Independence
In conducting our audit, we have complied with the independence requirements of the Corporations Act 2001.
Auditor’s opinion
In our opinion:
a the financial report of Minotaur Exploration Limited is in accordance with the Corporations Act 2001, including:
i) giving a true and fair view of the consolidated entity’s financial position as at 30 June 2014 and of its performance for the year ended on that date; and
ii) complying with Australian Accounting Standards and the Corporations Regulations 2001; and
b the financial report also complies with International Financial Reporting Standards as disclosed in the notes to the financial statements.
Report on the remuneration report
We have audited the remuneration report included in the directors’ report for the year ended 30 June 2014. The Directors of the Company are responsible for the preparation and presentation of the remuneration report in accordance with section 300A of the Corporations Act 2001. Our responsibility is to express an opinion on the remuneration report, based on our audit conducted in accordance with Australian Auditing Standards.
Auditor’s opinion on the remuneration report
In our opinion, the remuneration report of Minotaur Exploration Limited for the year ended 30 June 2014, complies with section 300A of the Corporations Act 2001.
GRANT THORNTON AUDIT PTY LTDChartered Accountants
J L HumphreyPartner – Audit & Assurance
Adelaide, 19 August 2014
Grant Thornton Audit Pty Ltd ACN 130 913 594a subsidiary or related entity of Grant Thornton Australia Ltd ABN 41 127 556 389
‘Grant Thornton’ refers to the brand under which the Grant Thornton member firms provide assurance, tax and advisory services to their clients and/or refers to one or more member firms, as thecontext requires. Grant Thornton Australia Ltd is a member firm of Grant Thornton International Ltd (GTIL). GTIL and the member firms are not a worldwide partnership. GTIL and each member firmis a separate legal entity. Services are delivered by the member firms. GTIL does not provide services to clients. GTIL and its member firms are not agents of, and do not obligate one another andare not liable for one another’s acts or omissions. In the Australian context only, the use of the term ‘Grant Thornton’ may refer to Grant Thornton Australia Limited ABN 41 127 556 389 and itsAustralian subsidiaries and related entities. GTIL is not an Australian related entity to Grant Thornton Australia Limited.
Liability limited by a scheme approved under Professional Standards Legislation. Liability is limited in those States where a current scheme applies.
60

61
ASX Additionalinformation
Minotaur Equity orLease ID Lease Name State Holding Company Equity Earned % JV Partner
Border Joint Venture
EL4352 Collins Tank SA Minotaur Operations 43.5 Sumitomo Metal Mining Oceania 56.5%EL4844 Mingary SA Minotaur Operations 43.5 Sumitomo Metal Mining Oceania 56.5%EL5079 Mutooroo SA Minotaur Operations 43.5 Sumitomo Metal Mining Oceania 56.5%EL5437 Woodville Dam SA Minotaur Industrial Minerals 43.5 Sumitomo Metal Mining Oceania 56.5%
Cloncurry Joint Venture (JOGMEC)
EPM8608 Bendigo Park QLD Minotaur Operations 48 JOGMEC 52%, BHPBilliton NSREPM16975 Cattle Creek QLD Minotaur Operations 48 JOGMEC 52%EPM19530 Corella QLD Minotaur Operations 48 JOGMEC 52%EPM18861 Donaldson Well QLD Minotaur Operations 48 JOGMEC 52%EPM18802 East Racecourse QLD Minotaur Operations 48 JOGMEC 52%EPM18068 Gidyea Bore QLD Minotaur Operations 48 JOGMEC 52%EPM17286 Jackys Creek QLD Minotaur Operations 48 JOGMEC 52%EPM19412 Middle Creek QLD Minotaur Operations* 48 JOGMEC 52%
Ernest Project
EPM19205 Ernest Henry West QLD Minotaur Operations 100EPM19775 Mount Margaret QLD Minotaur Operations 100EPM18289 Mt Marathon QLD Falcon Minerals 0 Falcon Minerals 100%
Elrose Project
EPM19500 Eloise North QLD Minotaur Operations 100EPMA25389 Fullarton QLD Minotaur Operations 0EPM25237 Levuka QLD Minotaur Operations 100EPM18313 Mt Agate QLD Falcon Minerals 0 Falcon Minerals 100%EPM18624 Oorindi Park QLD Minotaur Operations 100EPM25238 Saxby QLD Minotaur Operations 100EPM19096 Strathfield QLD Minotaur Operations 100EPM19505 Yaningerry QLD Minotaur Operations 100
Eloise Copper Joint Venture
EPM17838 Levuka QLD Levuka Resources 86 GFR 14%EPM18442 Eloise Northwest QLD Levuka Resources 86 GFR 14%MDL431 Eloise QLD Levuka Resources 86 GFR 14%MDL432 Eloise QLD Levuka Resources 86 GFR 14%
Osborne Project
EPM18575 Carbo Creek QLD Minotaur Operations 100EPM18720 Cuckadoo QLD Minotaur Operations 100EPM19050 Datchet QLD Minotaur Operations 100EPM18573 Gum Creek QLD Minotaur Operations 100EPMA25197 Hamilton QLD Minotaur Operations 0EPM19066 Lucia QLD Minotaur Operations 100EPM18574 Momedah Creek QLD Minotaur Operations 100EPM18572 North Osborne QLD Minotaur Operations 100EPM18576 Pathungra QLD Minotaur Operations 100

62
ASX AdditionalinformationI N T E R E S T S I N M I N I N G
T E N E M E N T S A S A T
3 0 S E P T E M B E R 2 0 1 4
Minotaur Equity orLease ID Lease Name State Holding Company Equity Earned % JV Partner
Osborne Project
EPM18571 Sandy Creek QLD Minotaur Operations 100EPMA25699 Warburton Creek QLD Minotaur Operations 0EPM19061 Windsor QLD Minotaur Operations 100
Arthurville Project
EL7588 Arthurville NSW Minotaur Operations 100
Victoria Copper Project
EL5402 Chatsworth VIC Minotaur Operations 100EL5475 Dimboola East VIC Minotaur Operations 100EL5403 Lexington VIC Minotaur Operations 100EL5450 Roxborough VIC Minotaur Operations 100
Industrial Minerals Project
EL5095 Camel Lake SA Minotaur Operations 100ELA5502 Casterton South VIC Minotaur Industrial Minerals 0EL5395 Kyancutta SA Minotaur Operations 100EL5308 Mount Hall SA Minotaur Operations 100EL5398 Sceales SA Minotaur Operations 100EL4575 Tootla SA Great Southern Kaolin 100EL5016 Whichelby SA Minotaur Operations 100EL4697 Yanerbie SA Minotaur Operations 100EL5365 Yaninee SA Minotaur Operations 100
Gawler Ranges Project
EL5097 Diesel Dam SA Minotaur Operations 100EL5232 Peltabinna SA Minotaur Operations 100EL5096 Yandoolka Well SA Minotaur Operations 100
Gawler Craton Project
EL4745 Bonython Hill SA Minotaur Operations 100EL4776 Mt Double SA Minotaur Operations 100
Scotia Project
E 29/00661§ Goongarrie 3 WA Minotaur Gold Solutions 50E 29/00719§ Goongarrie 4 WA Minotaur Gold Solutions 50E 29/00886 Comet Vale WA Minotaur Gold Solutions 50M 24/00279§ Goongarrie 5 WA Minotaur Gold Solutions 50M 24/00336§ Goongarrie 6 WA Minotaur Gold Solutions 50M 29/00245§ Goongarrie 13 WA Minotaur Gold Solutions 50M 29/00246§ Goongarrie 14 WA Minotaur Gold Solutions 50P 29/02105§ Goongarrie 7 WA Minotaur Gold Solutions 50P 29/02117§ Goongarrie 8 WA Minotaur Gold Solutions 50P 29/02118§ Goongarrie 9 WA Minotaur Gold Solutions 50P 29/02119§ Goongarrie 10 WA Minotaur Gold Solutions 50P 29/02120§ Goongarrie 11 WA Minotaur Gold Solutions 50P 29/02121§ Goongarrie 12 WA Minotaur Gold Solutions 50
Leinster Project
E 36/235 Leinster 9 WA Altia Resources 85 GFR 15%E 37/909 Leinster 2 WA Scotia Nickel 85 GFR 15%M 36/475 Leinster 10 WA Altia Resources 85 GFR 15%M 36/502 Leinster 11 WA Altia Resources 85 GFR 15%M 36/511 Leinster 18 WA Altia Resources 85 GFR 15%M 36/524 Leinster 12 WA Altia Resources 85 GFR 15%M 36/526 Leinster 14 WA Altia Resources 85 GFR 15%M 36/548 Leinster 15 WA Altia Resources 85 GFR 15%
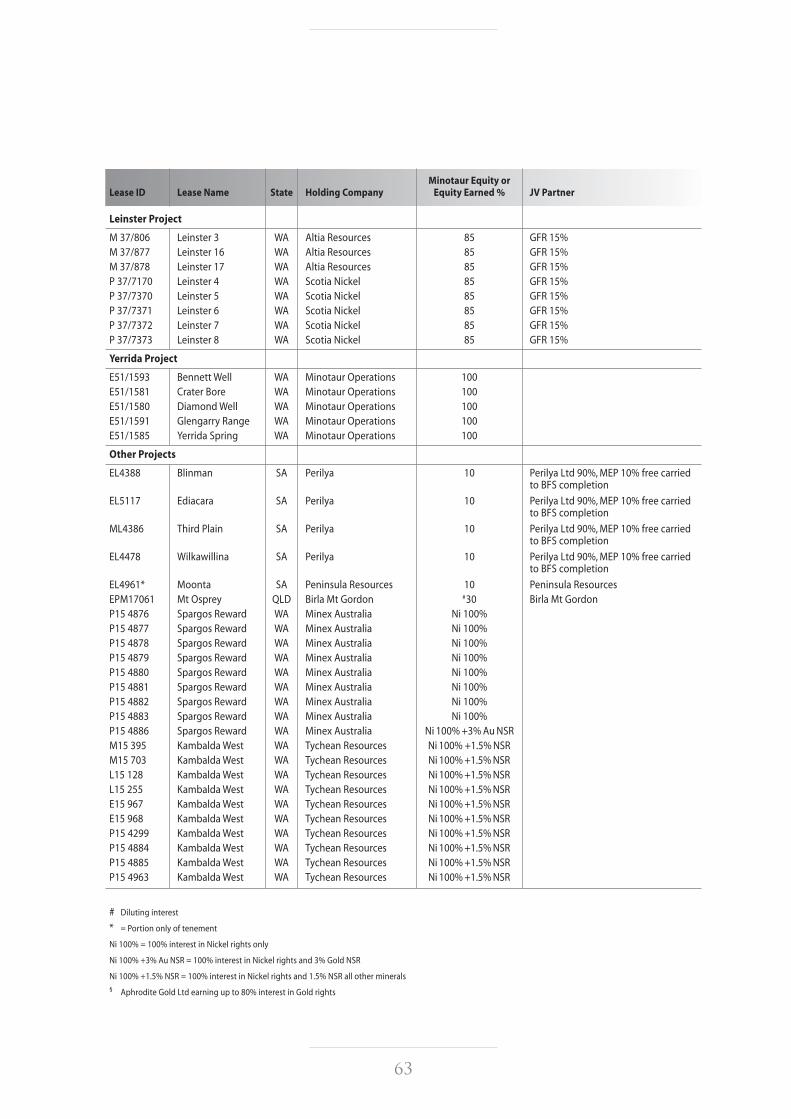
63
Minotaur Equity orLease ID Lease Name State Holding Company Equity Earned % JV Partner
Leinster Project
M 37/806 Leinster 3 WA Altia Resources 85 GFR 15%M 37/877 Leinster 16 WA Altia Resources 85 GFR 15%M 37/878 Leinster 17 WA Altia Resources 85 GFR 15%P 37/7170 Leinster 4 WA Scotia Nickel 85 GFR 15%P 37/7370 Leinster 5 WA Scotia Nickel 85 GFR 15%P 37/7371 Leinster 6 WA Scotia Nickel 85 GFR 15%P 37/7372 Leinster 7 WA Scotia Nickel 85 GFR 15%P 37/7373 Leinster 8 WA Scotia Nickel 85 GFR 15%
Yerrida Project
E51/1593 Bennett Well WA Minotaur Operations 100E51/1581 Crater Bore WA Minotaur Operations 100E51/1580 Diamond Well WA Minotaur Operations 100E51/1591 Glengarry Range WA Minotaur Operations 100E51/1585 Yerrida Spring WA Minotaur Operations 100
Other Projects
EL4388 Blinman SA Perilya 10 Perilya Ltd 90%, MEP 10% free carried to BFS completion
EL5117 Ediacara SA Perilya 10 Perilya Ltd 90%, MEP 10% free carried to BFS completion
ML4386 Third Plain SA Perilya 10 Perilya Ltd 90%, MEP 10% free carried to BFS completion
EL4478 Wilkawillina SA Perilya 10 Perilya Ltd 90%, MEP 10% free carried to BFS completion
EL4961* Moonta SA Peninsula Resources 10 Peninsula ResourcesEPM17061 Mt Osprey QLD Birla Mt Gordon #30 Birla Mt GordonP15 4876 Spargos Reward WA Minex Australia Ni 100%P15 4877 Spargos Reward WA Minex Australia Ni 100%P15 4878 Spargos Reward WA Minex Australia Ni 100%P15 4879 Spargos Reward WA Minex Australia Ni 100%P15 4880 Spargos Reward WA Minex Australia Ni 100%P15 4881 Spargos Reward WA Minex Australia Ni 100%P15 4882 Spargos Reward WA Minex Australia Ni 100%P15 4883 Spargos Reward WA Minex Australia Ni 100%P15 4886 Spargos Reward WA Minex Australia Ni 100% +3% Au NSRM15 395 Kambalda West WA Tychean Resources Ni 100% +1.5% NSRM15 703 Kambalda West WA Tychean Resources Ni 100% +1.5% NSRL15 128 Kambalda West WA Tychean Resources Ni 100% +1.5% NSRL15 255 Kambalda West WA Tychean Resources Ni 100% +1.5% NSRE15 967 Kambalda West WA Tychean Resources Ni 100% +1.5% NSRE15 968 Kambalda West WA Tychean Resources Ni 100% +1.5% NSRP15 4299 Kambalda West WA Tychean Resources Ni 100% +1.5% NSRP15 4884 Kambalda West WA Tychean Resources Ni 100% +1.5% NSRP15 4885 Kambalda West WA Tychean Resources Ni 100% +1.5% NSRP15 4963 Kambalda West WA Tychean Resources Ni 100% +1.5% NSR
# Diluting interest
* = Portion only of tenement
Ni 100% = 100% interest in Nickel rights only
Ni 100% +3% Au NSR = 100% interest in Nickel rights and 3% Gold NSR
Ni 100% +1.5% NSR = 100% interest in Nickel rights and 1.5% NSR all other minerals§ Aphrodite Gold Ltd earning up to 80% interest in Gold rights

64
ASX Additionalinformation
Additional information required by the Australian Securities Exchange Ltd and not shown elsewhere in this report is asfollows. The information is current as at 30 September 2014.
Distribution of equity securities
Ordinary share capital
152,165,042 fully paid ordinary shares are held by 3,486 individual shareholders.
All issued ordinary shares carry one (1) vote per share and carry the rights to dividend.
Options
11,543,333 unlisted options are held by 32 option holders.
The number of shareholders, by size of holding, in each class are:Fully paid ordinary shares Unlisted Options
1 – 1,000 467 -1,001 – 5,000 978 -5,001 – 10,000 594 -10,001 – 100,000 1,227 12100,001 and over 220 20
3,486 32
Holding less than a marketable parcel 914 -
Substantial shareholdersFully paid
Ordinary shareholders Number Percentage
Norilsk Nickel Australia Pty Ltd 10,777,919 7.08%OZ Minerals Limited 8,041,670 5.28%
Fully Paid Ordinary SharesTWENTY LARGEST HOLDERS OF QUOTED EQUITY SECURITIES Number Percentage
Norilsk Nickel Australia Pty Ltd 10,777,919 7.08%OZ Minerals Limited 8,041,670 5.28%Newmont Capital Pty Ltd 5,320,000 3.50%Golden Fields Resources Pty Ltd 4,200,000 2.76%Yarraandoo Pty Ltd <Yarraandoo Super Fund A/C> 3,662,129 2.41%FMR Investments Pty Limited 2,872,303 1.89%Sandfire Resources NL 2,608,695 1.71%Mr Yi Weng + Ms Ning Li Yi Weng & Ning Li S/F A/C 2,230,000 1.47%Locantro Speculative Investments Limited 2,000,000 1.31%JP Morgan Nominees Australia Limited 1,795,659 1.18%Mr Peter Francis Hasenkam 1,650,000 1.08%Mr Nicholas James Carter + Mrs Susan Mary Carter <Carter Family Super A/C> 1,583,500 1.04%Dorica Nominees Pty Ltd 1,502,000 0.99%Breakaway Resources Limited 1,128,658 0.74%Mr Nicholas Carter 1,115,164 0.73%Mr Robert Gemelli 1,110,572 0.73%Kimbriki Nominees Pty Ltd <Kimbriki Hamilton SF A/C> 1,000,000 0.66%National Nominees Limited 995,967 0.65%Miningnut Pty Ltd 975,000 0.64%Mr Derek Northleigh Carter 900,000 0.59%
55,469,236 36.45%

MINOTAUREXPLORATION

w w w . m i n o t a u r e x p l o r a t i o n . c o m . a u