annual report - usaa report usaa nasdaq-100 index fund fund shares r6 shares december 31, 2017
TRANSCRIPT

ANNUAL REPORTUSAA NASDAQ-100 INDEX FUNDFUND SHARES ■ R6 SHARES
DECEMBER 31, 2017

February 2018
The reporting period ended December 31, 2017, was remarkable, as stockprices went up and bonds did well. From the results, you’d never know howmany worries investors had to overcome during the reporting period. Amonggeopolitical disruptions, natural disasters, political gridlock over U.S. fiscalpolicy, and the speed and scope of the Federal Reserve (Fed) interest rateincreases—there was plenty to be concerned about, but investors generallymaintained composure and with it, their appetite for risk.In 2017, stocks experienced one of their best years in recent memory,strengthened by synchronized global economic growth and supportiveinflation. Emerging markets stocks were the standout performers, followedby developed markets stocks and U.S. stocks—all of which generateddouble-digit gains. Better-than-expected corporate earnings also supportedthe rally in global stocks. Looking ahead, we believe stock prices couldcontinue to rise, though 2018’s returns may not be as stellar as those in 2017.In the United States, the new federal tax law, which became effective inJanuary 2018, lowers the corporate tax rate from 35% to 21% and couldincrease companies’ cash flows as well as their bottom lines. That said, someof the potential appreciation may already have occurred during December 2017.Meanwhile, emerging markets and developed markets stocks are generallyinexpensive when compared to U.S. stocks, and therefore may offer anappealing long-term investment opportunity.As for the bond markets, they were dominated during the reporting periodby investor expectations about the Fed’s monetary policy. In 2017, Fedpolicymakers followed through on their plan to increase short-term interestrates three times, raising the federal funds target rate in March, June, andDecember of 2017 to a range of between 1.25% and 1.50% by the end of theyear. The Fed also said three interest rate increases are anticipated for 2018,as long as the U.S. economy continued to perform as it expected. In thisgradually rising interest rate environment, we believe short-term bonds may
PRESIDENT’S MESSAGE“One way to ensure that you are doing themost with what you have is to invest a setamount each month, a tactic known asdollar-cost averaging.”

be attractive, as they offer an opportunity to earn incremental income withless exposure to declining bond prices. (Bond prices and interest rates movein opposite directions.) Long-term interest rates fell during the reportingperiod as strong investor demand pushed up stock prices; remember, themarket, not the Fed, sets long-term interest rates. As a result, the 30-yearU.S. Treasury was one of the best-performing fixed income assets of 2017.At the same time, credit spreads narrowed. Credit spreads are the difference inyields between corporate bonds and U.S. Treasury securities of similarmaturity. With global interest rates near historic lows, investors were willingto take on more risk for the incrementally larger yields available in thecorporate bond market. At USAA Investments, we think ongoing economicgrowth and solid corporate earnings could continue supporting investment-grade and high-yield corporate bonds during 2018.No one can predict the movements of the financial markets. Investors wereable to shrug off their worries during 2017, but many of the same concernsremain in 2018. At the December 2017 policy meeting, Fed officials discussedwhether tax cuts might require them to raise short-term interest rates fasterthan anticipated, raising the concern of an “interest-rate shock.” An interest-rate shock occurs when interest rates suddenly change. Should the Fed be tooaggressive with interest-rate policy, it might dampen U.S. economic growth.Due to an unknown future, we believe it is important for investors to maintaindiversified portfolios that are based on their individual goals, time horizon,and risk tolerance. The first months of a new year can be an appropriate timeto look at your overall financial situation. One way to ensure that you aredoing the most with what you have is to invest a set amount each month, atactic known as dollar-cost averaging. At USAA Investments, we arecommitted to helping you meet your financial objectives.From all of us here, thank you for the opportunity to help you with yourinvestment needs.Sincerely,
Brooks EnglehardtPresidentUSAA Investments
Investments provided by USAA Investment Management Company and USAA Financial Advisors, Inc.,both registered broker-dealers, and affiliates. Financial planning services and financial advice provided byUSAA Financial Planning Services Insurance Agency, Inc. (known as USAA Financial Insurance Agencyin California, License # 0E36312), a registered investment adviser and insurance agency and its whollyowned subsidiary, USAA Financial Advisors, Inc., a registered broker dealer.

Fund Objective 1
Manager’s Commentary on the Fund 2
Investment Overview 4
Financial Information
Distributions to Shareholders 9
Report of Independent RegisteredPublic Accounting Firm 10
Portfolio of Investments 11
Notes to Portfolio of Investments 18
Financial Statements 19
Notes to Financial Statements 23
Expense Example 40
Trustees’ and Officers’ Information 42
TABLE OF CONTENTS
This report is for the information of the shareholders and others who have received a copy of thecurrently effective prospectus of the Fund, managed by USAA Asset Management Company. It maybe used as sales literature only when preceded or accompanied by a current prospectus, whichprovides further details about the Fund.
©2018, USAA. All rights reserved.

Fund Objective | 1
FUND OBJECTIVE
The USAA Nasdaq-100 Index Fund (the Fund) seeks to match,before fees and expenses, the performance of the stocks composingthe Nasdaq-100 Index. The Nasdaq-100 Index represents 100 of thelargest nonfinancial stocks traded on The Nasdaq Stock Market®.
Types of InvestmentsThe Fund’s principal investment strategy is, under normal market conditions,to invest at least 80% of the Fund’s assets in the common stocks of companiescomposing the Nasdaq-100 Index. This strategy may be changed upon 60 days’written notice to shareholders.In seeking to track the performance of the Nasdaq-100 Index, the Fund’ssubadviser, Northern Trust Investments, Inc. (NTI), will normally invest in allthe common stocks of companies in the Nasdaq-100 Index in roughly the sameproportions as their weightings in the index. While NTI attempts to replicate theindex, there may be times when the Fund and the index do not match exactly. Attimes, NTI may purchase a stock not included in the Nasdaq-100 Index when itbelieves doing so would be a cost-efficient way of approximating the index’sperformance, for example, in anticipation of a stock being added to the index.To the extent that the Nasdaq-100 Index concentrates in the securities of aparticular industry or group of industries, the Fund may similarly concentrateits investments.
IRA DISTRIBUTION WITHHOLDING DISCLOSUREWe generally must withhold federal income tax at a rate of 10% of the taxable portion ofyour distribution and, if you live in a state that requires state income tax withholding, atyour state’s tax rate. However, you may elect not to have withholding apply or to haveincome tax withheld at a higher rate. Any withholding election that you make will applyto any subsequent distribution unless and until you change or revoke the election. If youwish to make a withholding election or change or revoke a prior withholding election,call (800) 531-USAA (8722) or (210) 531-8722.If you do not have a withholding election in place by the date of a distribution, federalincome tax will be withheld from the taxable portion of your distribution at a rateof 10%. If you must pay estimated taxes, you may be subject to estimated tax penaltiesif your estimated tax payments are not sufficient and sufficient tax is not withheldfrom your distribution.For more specific information, please consult your tax adviser.

MANAGER’S COMMENTARYON THE FUND
Brent ReederNorthern Trust Investments, Inc.
2 | USAA Nasdaq-100 Index Fund
■ What were the market conditions during the reporting period?
Following an unexpected win by the U.S. Republican Presidentialcandidate, the equity markets began to rally late in 2016. Much of thatmomentum continued into the beginning of 2017. The reporting periodended December 31, 2017, started off strong and never looked back.
The early momentum of the equity markets carried through the spring andinto the summer of 2017. The equity markets took in stride the FederalReserve’s (the Fed) two interest rate increases, the first in March and thesecond in June 2017. The Fed finished off the reporting period with a thirdinterest rate increase in December 2017, which again the equity marketsseemed to view more optimistically. The Federal Open Market Committeeprojections imply three additional interest rate increases in 2018.
U.S. equities finished the year strong, posting positive performance ineach of the twelve calendar months for 2017. This consistent positiveperformance pushed equity markets to multiple all-time highs, whilesuppressing volatility to new all-time lows. The fourth quarter 2017 sawtwo unprecedented events: the beginning stages of the Fed’s plan toshrink its balance sheet, and a major federal tax plan overhaul. Thesetwo events seemed to fuel equity markets, with the latter acting as a year-end catalyst into the usually quiet holidays.
The yield curve flattened throughout 2017 as the short end steadilyincreased, and the long end remained relatively unchanged for most of2017, ending just over 2.4%. Inflation continued to remain low throughout2017, but there is anticipation of potential higher growth and inflation in2018. Oil saw steady gains throughout 2017, almost reaching $60 a barrel

by year-end. This price point had not been seen since 2014. The mostsurprising activity was likely the prolonged weakening of the U.S. dollarthroughout 2017, despite the Fed increasing rates, which created favorableconditions for international and emerging markets.
■ How did the USAA Nasdaq-100 Index Fund (the Fund) performduring the reporting period?
The Fund has two share classes: Fund Shares and R6 Shares. The Fundclosely tracked its benchmark, the broad-based Nasdaq-100 Index (theIndex), during the reporting period ended December 31, 2017. The FundShares posted a return of 32.29% versus the Index, which returned 32.99%.The R6 Shares commenced operations on March 1, 2017, and from thattime through December 31, 2017, had a total return of 19.27%. The Indexrepresents 100 of the largest nonfinancial companies listed on The NasdaqStock Market® and is not available for direct investment.
■ Please describe sector performance during the reporting period.
In 2017, the Index returned 32.99%. U.S. large-cap equitiesoutperformed mid-cap equities, represented by the S&P 400 Index,which returned 16.24% in 2017.
The top performing sectors over the reporting period were InformationTechnology and Consumer Discretionary, returning 41.63% and 30.91%respectively. Consumer Staples and Real Estate were the worst performingsectors for 2017, with returns of 1.93% and 12.00% respectively.
Thank you for the opportunity to help you with your investment needs.
Manager’s Commentary on the Fund | 3
Past performance is no guarantee of future results. • Investing in securities products involves risk,including possible loss of principal. • The Fund may be subject to stock market risk and is non-diversified, which means that it may invest a greater percentage of its assets in a single issuer.Individual stocks will fluctuate in response to the activities of individual companies, generalmarket, and economic conditions domestically and abroad. When redeemed or sold, may be worthmore or less than the original cost.
Refer to page 5 for the benchmark definition.

4 | USAA Nasdaq-100 Index Fund
INVESTMENT OVERVIEW
USAA NASDAQ-100 INDEX FUND (FUND SHARES)(Ticker Symbol: USNQX)
12/31/17 12/31/16
Net Assets $1.6 Billion $1.1 BillionNet Asset Value Per Share $17.89 $13.79
AVERAGE ANNUAL TOTAL RETURNS AS OF 12/31/17
1 Year 5 Years 10 Years 32.29% 19.97% 12.28%
EXPENSE RATIO AS OF 12/31/16*
0.54%
(includes acquired fund fees and expenses of 0.01%)
High double-digit returns are attributable, in part, to unusually favorable marketconditions and may not be repeated or consistently achieved in the future.
The performance data quoted represents past performance and is no guarantee offuture results. Current performance may be higher or lower than the performancedata quoted. The return and principal value of an investment will fluctuate, so thatan investor’s shares, when redeemed, may be worth more or less than their originalcost. For performance data current to the most recent month-end, visit usaa.com.* The expense ratio represents the total annual operating expenses, before reductions of any expenses paidindirectly and including any acquired fund fees and expenses, as reported in the Fund’s prospectus datedMay 1, 2017, and is calculated as a percentage of average net assets. This expense ratio may differ from theexpense ratio disclosed in the Financial Highlights, which excludes acquired fund fees and expenses.
Total return measures the price change in a share assuming the reinvestment of all net investment incomeand realized capital gain distributions, if any. The total returns quoted do not reflect adjustments madeto the enclosed financial statements in accordance with U.S. generally accepted accounting principles orthe deduction of taxes that a shareholder would pay on net investment income and realized capital gaindistributions, including reinvested distributions, or redemptions of shares.

Investment Overview | 5
■ CUMULATIVE PERFORMANCE COMPARISON ■
Nasdaq-100 Index $34,083
12/07 12/08 12/09 12/10 12/11 12/12 12/13 12/14 12/15 12/16 12/17
USAA Nasdaq-100 Index Fund $31,862
$31,862
$34,083$35,000
$5,000
$10,000
$15,000
$20,000
$25,000
$30,000
Data from 12/31/07 to 12/31/17.
The graph illustrates how a $10,000 hypothetical investment in the USAANasdaq-100 Index Fund closely tracks the Nasdaq-100 Index, an unmanagedmodified capitalization-weighted index composed of 100 of the largestnonfinancial domestic and international companies listed on The NasdaqStock Market® based on market capitalization.
“Nasdaq-100®,” “Nasdaq-100 Index®,” and “Nasdaq®” are trademarks or service marks of The NasdaqStock Market, Inc. (which with its affiliates are the “Corporations”) and have been licensed for our use.THE CORPORATIONS MAKE NO WARRANTIES AND BEAR NO LIABILITY WITH RESPECT TOTHE USAA NASDAQ-100 INDEX FUND. The Fund is not sponsored, sold, or promoted by The NasdaqStock Market, Inc., and The Nasdaq Stock Market, Inc. makes no representation regarding theadvisability of investing in the Fund. Index products incur f ees and expenses and may not always beinvested in all securities of the index the Fund attempts to mirror. Indexes are unmanaged and you cannotinvest directly in an index. The return information for the indexes does not reflect the deduction of any fees,expenses, or taxes.
Past performance is no guarantee of future results, and the cumulative performance quoted does notreflect the deduction of taxes that a shareholder would pay on distributions or the redemption of shares.

6 | USAA Nasdaq-100 Index Fund
USAA NASDAQ-100 INDEX FUND R6 SHARES* (R6 SHARES) (Ticker Symbol: URNQX)
12/31/17
Net Assets $5.9 MillionNet Asset Value Per Share $17.89
AVERAGE ANNUAL TOTAL RETURN AS OF 12/31/17
Since Inception 3/1/17** 19.27%
EXPENSE RATIOS***
Before Reimbursement 0.43% After Reimbursement 0.40%
High double-digit returns are attributable, in part, to unusually favorable marketconditions and may not be repeated or consistently achieved in the future.
The performance data quoted represents past performance and is no guarantee offuture results. Current performance may be higher or lower than the performancedata quoted. The return and principal value of an investment will fluctuate, so thatan investor’s shares, when redeemed, may be worth more or less than their originalcost. For performance data current to the most recent month-end, visit usaa.com.* The R6 Shares commenced operations on March 1, 2017.
** Total returns for periods of less than one year are not annualized. This return is cumulative.
***The expense ratios are reported in the Fund’s prospectus dated May 1, 2017, and are based onestimated expenses for the current fiscal year. USAA Asset Management Company (the Manager) hasagreed, through April 30, 2018, to make payments or waive management, administration, and other feesso that the total annual operating expenses of the R6 Shares (exclusive of commission recapture, expenseoffset arrangements, acquired fund fees and expenses, and extraordinary expenses) do not exceed anannual rate of 0.40% of the R6 Shares’ average net assets. This reimbursement arrangement may not bechanged or terminated during this time period without approval of the Fund’s Board of Trustees and maybe changed or terminated by the Manager at any time after April 30, 2018. If the total annual operatingexpense ratio of the R6 Shares is lower than 0.40%, the R6 Shares will operate at the lower expense ratio.These expense ratios may differ from the expense ratios disclosed in the Financial Highlights, whichexcludes acquired fund fees and expenses.
Total return measures the price change in a share assuming the reinvestment of all net investment incomeand realized capital gain distributions, if any. The total returns quoted do not reflect adjustments made tothe enclosed financial statements in accordance with U.S. generally accepted accounting principles or thededuction of taxes that a shareholder would pay on net investment income and realized capital gaindistributions, including reinvested distributions, or redemptions of shares.

Investment Overview | 7
■ CUMULATIVE PERFORMANCE COMPARISON ■
The graph illustrates how a $10,000 hypothetical investment in the USAANasdaq-100 Index Fund closely tracks the Nasdaq-100 Index, anunmanaged modified capitalization-weighted index composed of 100 of thelargest nonfinancial domestic and international companies listed on TheNasdaq Stock Market® based on market capitalization.*The performance of the Nasdaq-100 Index is calculated from the end of the month, February 28, 2017,while the inception date of the R6 Shares is March 1, 2017. There may be a slight variation ofperformance numbers because of this difference.“Nasdaq-100®,” “Nasdaq-100 Index®,” and “Nasdaq®” are trademarks or service marks of The NasdaqStock Market, Inc. (which with its affiliates are the “Corporations”) and have been licensed for our use. THECORPORATIONS MAKE NO WARRANTIES AND BEAR NO LIABILITY WITH RESPECT TO THEUSAA NASDAQ-100 INDEX FUND. The Fund is not sponsored, sold, or promoted by The Nasdaq StockMarket, Inc., and The Nasdaq Stock Market, Inc. makes no representation regarding the advisability ofinvesting in the Fund. Index products incur fees and expenses and may not always be invested in all securitiesof the index the Fund attempts to mirror. Indexes are unmanaged and you cannot invest directly in an index.The return information for the indexes does not reflect the deduction of any fees, expenses, or taxes.Past performance is no guarantee of future results, and the cumulative performance quoted does notreflect the deduction of taxes that a shareholder would pay on distributions or the redemption of shares.
Data from 02/28/17 to 12/31/17*.
Nasdaq-100 Index $12,107
2/17 3/17 4/17 5/17 6/17 7/17 8/17 9/17 10/17 11/17 12/17
USAA Nasdaq-100 Index Fund $11,927
$11,927$12,107
$13,000
$10,000
$11,000
$12,000

8 | USAA Nasdaq-100 Index Fund
You will find a complete list of securities that the Fund owns on pages 11-17.
■ TOP 10 EQUITY SECURITIES – 12/31/17 ■(% of Net Assets)
Apple, Inc. - - - - - - - - - - - - - - - - - - - - - - - - - - - - - - - - - - - - - - - - - - - - - - - - - - - - - - - - - - - - - - - - - - - - - - - - - - - - - - - - - - -
11.7%Microsoft Corp.
- - - - - - - - - - - - - - - - - - - - - - - - - - - - - - - - - - - - - - - - - - - - - - - - - - - - - - - - - - - - - - - - - - - - - - - - 8.9%
Amazon.com, Inc. - - - - - - - - - - - - - - - - - - - - - - - - - - - - - - - - - - - - - - - - - - - - - - - - - - - - - - - - - - - - - - - - - - -
7.6%Facebook, Inc. “A”
- - - - - - - - - - - - - - - - - - - - - - - - - - - - - - - - - - - - - - - - - - - - - - - - - - - - - - - - - - - - - - - - - - 5.6%
Alphabet, Inc. “C” - - - - - - - - - - - - - - - - - - - - - - - - - - - - - - - - - - - - - - - - - - - - - - - - - - - - - - - - - - - - - - - - - -
4.9%Alphabet, Inc. “A”
- - - - - - - - - - - - - - - - - - - - - - - - - - - - - - - - - - - - - - - - - - - - - - - - - - - - - - - - - - - - - - - - - - - 4.2%
Intel Corp. - - - - - - - - - - - - - - - - - - - - - - - - - - - - - - - - - - - - - - - - - - - - - - - - - - - - - - - - - - - - - - - - - - - - - - - - - - - - - - - - - - -
2.9%Cisco Systems, Inc.
- - - - - - - - - - - - - - - - - - - - - - - - - - - - - - - - - - - - - - - - - - - - - - - - - - - - - - - - - - - - - - - - - 2.5%
Comcast Corp. “A” - - - - - - - - - - - - - - - - - - - - - - - - - - - - - - - - - - - - - - - - - - - - - - - - - - - - - - - - - - - - - - - - -
2.5%Amgen, Inc.
- - - - - - - - - - - - - - - - - - - - - - - - - - - - - - - - - - - - - - - - - - - - - - - - - - - - - - - - - - - - - - - - - - - - - - - - - - - - - - - - 1.7%
■ SECTOR ALLOCATION* – 12/31/17 ■(% of Net Assets)
InformationTechnology
60.0% Health Care
10.1%
ConsumerDiscretionary
20.4%
Consumer Staples
4.7%
Industrials
2.1%
TelecommunicationServices
0.9%
*Does not include Money Market Instruments, short-term investments purchased with cash collateral fromsecurities loaned and Futures.
Percentages are of net assets of the Fund and may not equal 100%.

DISTRIBUTIONS TO SHAREHOLDERS
Distributions to Shareholders | 9
The following federal tax information related to the Fund’s fiscal year endedDecember 31, 2017, is provided for information purposes only and shouldnot be used for reporting to federal or state revenue agencies. Federal taxinformation for the calendar year will be reported to you on Form 1099-DIVin January 2018.
With respect to distributions paid, the Fund designates the followingamounts (or, if subsequently determined to be different, the maximumamount allowable) for the fiscal year ended December 31, 2017:
Dividend Received Qualified Dividend Long-Term Qualified Deduction (corporate Income (non-corporate Capital Gain Interest
shareholders)(1) shareholders)(1) Distributions(2) Income100% 100% $22,330,000 $189,000
(1) Presented as a percentage of net investment income and short-term capital gain distributions paid, if any.
(2) Pursuant to Section 852 of the Internal Revenue Code.

REPORT OF INDEPENDENT REGISTEREDPUBLIC ACCOUNTING FIRM
10 | USAA Nasdaq-100 Index Fund
To the Shareholders and Board of Trustees of USAA NASDAQ-100 Index Fund:Opinion on the Financial StatementsWe have audited the accompanying statement of assets and liabilities of USAA NASDAQ-100 Index Fund(the “Fund”) (one of the portfolios constituting the USAA Mutual Funds Trust (the “Trust”)), includingthe portfolio of investments, as of December 31, 2017, and the related statement of operations for theyear then ended, the statements of changes in net assets for each of the two years in the period then ended,and the financial highlights for each of the five years in the period then ended and the related notes(collectively referred to as the “financial statements”). In our opinion, the financial statements presentfairly, in all material respects, the financial position of USAA NASDAQ-100 Index Fund (one of theportfolios constituting the USAA Mutual Funds Trust) at December 31, 2017, the results of itsoperations for the year then ended, the changes in its net assets for each of the two years in the periodthen ended, and its financial highlights for each of the five years in the period then ended, in conformitywith U.S. generally accepted accounting principles.
Basis for OpinionThese financial statements are the responsibility of the Trust’s management. Our responsibility is toexpress an opinion on the Fund’s financial statements based on our audits. We are a public accounting firmregistered with the Public Company Accounting Oversight Board (United States) (“PCAOB”) and arerequired to be independent with respect to the Trust in accordance with the U.S. f ederal securities lawsand the applicable rules and regulations of the Securities and Exchange Commission and the PCAOB.We conducted our audits in accordance with the standards of the PCAOB. Those standards require thatwe plan and perform the audit to obtain reasonable assurance about whether the financial statements arefree of material misstatement, whether due to error or fraud. The Trust is not required to have, nor werewe engaged to perform, an audit of the Trust’s internal control over financial reporting. As part of ouraudits, we are required to obtain an understanding of internal control over financial reporting, but notfor the purpose of expressing an opinion on the effectiveness of the Trust’s internal control over financialreporting. Accordingly, we express no such opinion.Our audits included performing procedures to assess the risks of material misstatement of the financialstatements, whether due to error or fraud, and performing procedures that respond to those risks. Suchprocedures included examining, on a test basis, evidence regarding the amounts and disclosures in thefinancial statements. Our procedures included confirmation of securities owned as of December 31, 2017,by correspondence with the custodian. Our audits also included evaluating the accounting principles usedand significant estimates made by management, as well as evaluating the overall presentation of thefinancial statements. We believe that our audits provide a reasonable basis for our opinion.
We have served as the auditor of one or more USAA investment companies since 2002.San Antonio, TexasFebruary 22, 2018

Portfolio of Investments | 11
PORTFOLIO OF INVESTMENTSDecember 31, 2017
MarketNumber Valueof Shares Security (000)
EQUITY SECURITIES (98.2%) COMMON STOCKS (98.2%)Consumer Discretionary (20.4%)Apparel Retail (0.4%)
84,291 Ross Stores, Inc. $ 6,764
Automobile Manufacturers (0.7%) 36,740 Tesla, Inc.*(a) 11,439
Automotive Retail (0.3%) 18,587 O’Reilly Automotive, Inc.* 4,471
Cable & Satellite (4.5%) 54,347 Charter Communications, Inc. “A”* 18,258 1,019,634 Comcast Corp. “A” 40,836 49,819 DISH Network Corp. “A”* 2,379 48,327 Liberty Global plc “A”* 1,732 128,603 Liberty Global plc “C”* 4,352 1,004,621 Sirius XM Holdings, Inc.(a) 5,385 72,942
Casinos & Gaming (0.2%) 22,468 Wynn Resorts Ltd. 3,788
General Merchandise Stores (0.3%) 51,830 Dollar Tree, Inc.* 5,562
Hotels, Resorts & Cruise Lines (0.7%) 79,698 Marriott International, Inc. “A” 10,817
Internet & Direct Marketing Retail (11.0%) 105,339 Amazon.com, Inc.*(b) 123,191 100,143 Ctrip.com International Ltd. ADR* 4,416 30,536 Expedia, Inc. 3,657 201,544 JD.com, Inc. ADR* 8,348 87,676 Liberty Interactive Corp. “A”* 2,141 17,805 Liberty Ventures* 966 94,596 Netflix, Inc.* 18,159 10,661 Priceline Group, Inc.* 18,526 179,404

Leisure Products (0.1%) 27,227 Hasbro, Inc. $ 2,475
Movies & Entertainment (0.9%) 230,406 Twenty-First Century Fox, Inc. “A” 7,956 174,614 Twenty-First Century Fox, Inc. “B” 5,958 13,914
Restaurants (1.1%) 311,028 Starbucks Corp. 17,862
Specialty Stores (0.2%) 13,333 Ulta Beauty, Inc.* 2,982 Total Consumer Discretionary 332,420
Consumer Staples (4.7%)Drug Retail (1.0%)
216,495 Walgreens Boots Alliance, Inc. 15,722
Hypermarkets & Super Centers (1.1%) 95,528 Costco Wholesale Corp. 17,779
Packaged Foods & Meat (2.1%) 266,347 Kraft Heinz Co. 20,711 326,681 Mondelez International, Inc. “A” 13,982 34,693
Soft Drinks (0.5%) 123,285 Monster Beverage Corp.* 7,803 Total Consumer Staples 75,997
Health Care (10.1%)Biotechnology (7.0%)
48,839 Alexion Pharmaceuticals, Inc.* 5,841 158,685 Amgen, Inc. 27,595 46,225 Biogen, Inc.* 14,726 38,390 BioMarin Pharmaceutical, Inc.* 3,423 172,110 Celgene Corp.* 17,961 285,579 Gilead Sciences, Inc. 20,459 46,133 Incyte Corp.* 4,369 23,069 Regeneron Pharmaceuticals, Inc.* 8,673 16,198 Shire plc ADR 2,513 55,285 Vertex Pharmaceuticals, Inc.* 8,285 113,845
Health Care Distributors (0.2%) 34,309 Henry Schein, Inc.* 2,397
MarketNumber Valueof Shares Security (000)
12 | USAA Nasdaq-100 Index Fund

Portfolio of Investments | 13
Health Care Equipment (0.9%) 60,256 Hologic, Inc.* $ 2,576 19,079 IDEXX Laboratories, Inc.* 2,984 24,492 Intuitive Surgical, Inc.* 8,938 14,498
Health Care Services (0.6%) 123,808 Express Scripts Holding Co.* 9,241
Health Care Supplies (0.4%) 17,524 Align Technology, Inc.* 3,893 50,246 Dentsply Sirona, Inc. 3,308 7,201
Health Care Technology (0.3%) 72,664 Cerner Corp.* 4,897
Life Sciences Tools & Services (0.4%) 31,918 Illumina, Inc.* 6,974
Pharmaceuticals (0.3%) 117,248 Mylan N.V.* 4,961 Total Health Care 164,014
Industrials (2.1%)Airlines (0.3%)
104,600 American Airlines Group, Inc. 5,442
Construction Machinery & Heavy Trucks (0.3%) 76,896 PACCAR, Inc. 5,466
Diversified Support Services (0.2%) 23,237 Cintas Corp. 3,621
Railroads (0.7%) 195,370 CSX Corp. 10,747
Research & Consulting Services (0.2%) 36,011 Verisk Analytics, Inc.* 3,457
Trading Companies & Distributors (0.2%) 62,772 Fastenal Co. 3,433
Trucking (0.2%) 23,992 JB Hunt Transport Services, Inc. 2,759 Total Industrials 34,925
Information Technology (60.0%)Application Software (2.7%)
107,759 Adobe Systems, Inc.* 18,884 47,922 Autodesk, Inc.* 5,024
MarketNumber Valueof Shares Security (000)

61,721 Cadence Design Systems, Inc.* $ 2,581 32,937 Citrix Systems, Inc.* 2,898 55,885 Intuit, Inc. 8,818 32,842 Synopsys, Inc.* 2,799 29,948 Workday, Inc. “A”* 3,047 44,051
Communications Equipment (2.5%) 1,080,688 Cisco Systems, Inc. 41,390
Data Processing & Outsourced Services (2.6%) 96,948 Automatic Data Processing, Inc. 11,361 45,554 Fiserv, Inc.* 5,973 78,475 Paychex, Inc. 5,343 262,741 PayPal Holdings, Inc.* 19,343 42,020
Home Entertainment Software (1.3%) 165,285 Activision Blizzard, Inc. 10,466 67,313 Electronic Arts, Inc.* 7,072 24,932 Take-Two Interactive Software, Inc.* 2,737 20,275
Internet Software & Services (16.7%) 65,205 Alphabet, Inc. “A”*(b) 68,687 76,397 Alphabet, Inc. “C”* 79,942 61,370 Baidu, Inc. ADR* 14,373 228,342 eBay, Inc.* 8,618 521,324 Facebook, Inc. “A”* 91,993 9,653 MercadoLibre, Inc. 3,037 16,585 NetEase, Inc. ADR 5,723 272,373
IT Consulting & Other Services (0.6%) 128,897 Cognizant Technology Solutions Corp. “A” 9,154
Semiconductor Equipment (1.5%) 233,156 Applied Materials, Inc. 11,919 15,715 ASML Holdings N.V. 2,732 34,253 KLA-Tencor Corp. 3,599 35,402 Lam Research Corp. 6,516 24,766
Semiconductors (10.5%) 80,584 Analog Devices, Inc. 7,174 89,186 Broadcom Ltd. 22,912 1,023,063 Intel Corp. 47,225 61,531 Maxim Integrated Products, Inc. 3,217
MarketNumber Valueof Shares Security (000)
14 | USAA Nasdaq-100 Index Fund

Portfolio of Investments | 15
51,132 Microchip Technology, Inc. $ 4,493 252,106 Micron Technology, Inc.* 10,367 132,474 NVIDIA Corp. 25,634 322,257 QUALCOMM, Inc.(b) 20,631 40,046 Skyworks Solutions, Inc. 3,802 215,446 Texas Instruments, Inc. 22,501 54,858 Xilinx, Inc. 3,699 171,655
Systems Software (9.5%) 91,488 CA, Inc. 3,045 35,735 Check Point Software Technologies Ltd.* 3,703 1,686,433 Microsoft Corp.(b) 144,257 135,527 Symantec Corp. 3,803 154,808
Technology Hardware, Storage, & Peripherals (12.1%) 1,122,378 Apple, Inc.(b) 189,940 63,244 Seagate Technology plc(a) 2,646 64,659 Western Digital Corp. 5,143 197,729 Total Information Technology 978,221
Telecommunication Services (0.9%)Wireless Telecommunication Services (0.9%)
181,860 T-Mobile US, Inc.* 11,550 101,742 Vodafone Group plc ADR 3,246 14,796 Total Telecommunication Services 14,796 Total Common Stocks (cost: $871,841) 1,600,373 Total Equity Securities (cost: $871,841) 1,600,373
MONEY MARKET INSTRUMENTS (1.7%)GOVERNMENT & U.S. TREASURY MONEY MARKET FUNDS (1.5%)
24,795,379 State Street Institutional Treasury Money Market Fund Premier Class, 1.15%(c) 24,795
MarketNumber Valueof Shares Security (000)
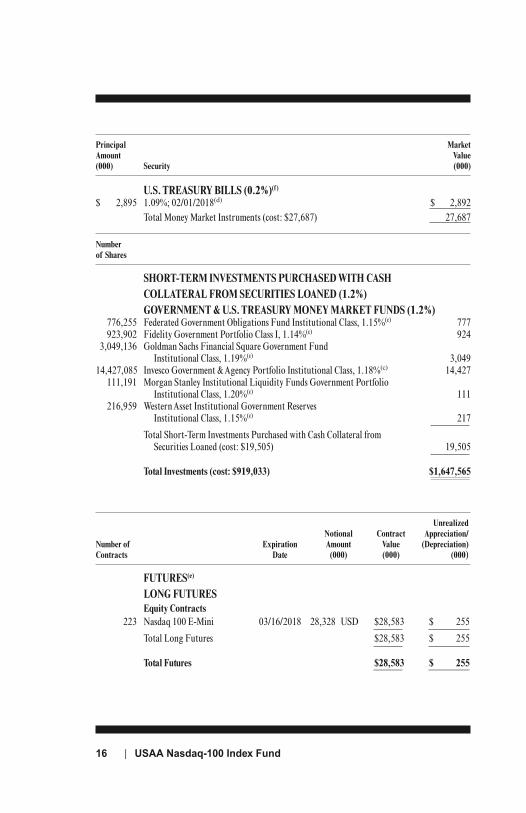
U.S. TREASURY BILLS (0.2%)(f)
$ 2,895 1.09%; 02/01/2018(d) $ 2,892 Total Money Market Instruments (cost: $27,687) 27,687
Number of Shares
SHORT-TERM INVESTMENTS PURCHASED WITH CASH COLLATERAL FROM SECURITIES LOANED (1.2%)GOVERNMENT & U.S. TREASURY MONEY MARKET FUNDS (1.2%)
776,255 Federated Government Obligations Fund Institutional Class, 1.15%(c) 777 923,902 Fidelity Government Portfolio Class I, 1.14%(c) 924 3,049,136 Goldman Sachs Financial Square Government Fund Institutional Class, 1.19%(c) 3,04914,427,085 Invesco Government & Agency Portfolio Institutional Class, 1.18%(c) 14,427 111,191 Morgan Stanley Institutional Liquidity Funds Government Portfolio Institutional Class, 1.20%(c) 111 216,959 Western Asset Institutional Government Reserves Institutional Class, 1.15%(c) 217 Total Short-Term Investments Purchased with Cash Collateral from Securities Loaned (cost: $19,505) 19,505
Total Investments (cost: $919,033) $1,647,565
Unrealized Notional Contract Appreciation/Number of Expiration Amount Value (Depreciation)Contracts Date (000) (000) (000)
FUTURES(e)
LONG FUTURESEquity Contracts
223 Nasdaq 100 E-Mini 03/16/2018 28,328 USD $28,583 $ 255 Total Long Futures $28,583 $ 255
Total Futures $28,583 $ 255
Principal MarketAmount Value(000) Security (000)
16 | USAA Nasdaq-100 Index Fund

Portfolio of Investments | 17
($ in 000s) VALUATION HIERARCHY
Assets LEVEL 1 LEVEL 2 LEVEL 3 Total
Equity Securities: Common Stocks $1,600,373 $ – $– $1,600,373
Money Market Instruments: Government & U.S. Treasury Money Market Funds 24,795 – – 24,795 U.S. Treasury Bills – 2,892 – 2,892
Short-Term Investments Purchased with Cash Collateral from Securities Loaned:
Government & U.S. Treasury Money Market Funds 19,505 – – 19,505
Futures(1) 255 – – 255
Total $1,644,928 $2,892 $– $1,647,820
(1) Futures are valued at the unrealized appreciation/(depreciation) on the investment.
For the period of January 1, 2017, through December 31, 2017, there were no transfers of securitiesbetween levels. The Fund’s policy is to recognize any transfers in and transfers out as of the beginning ofthe reporting period in which the event or circumstance that caused the transfer occurred.

18 | USAA Nasdaq-100 Index Fund
NOTES TO PORTFOLIOOF INVESTMENTSDecember 31, 2017
■ GENERAL NOTES
Market values of securities are determined by procedures and practicesdiscussed in Note 1A to the financial statements.
The Portfolio of Investments category percentages shown represent thepercentages of the investments to net assets, and, in total, may not equal100%. A category percentage of 0.0% represents less than 0.1% of netassets.
■ PORTFOLIO ABBREVIATIONS AND DESCRIPTIONS
ADR American depositary receipts are receipts issued by a U.S. bankevidencing ownership of foreign shares. Dividends are paid in U.S.dollars.
■ SPECIFIC NOTES(a) The security, or a portion thereof, was out on loan as of
December 31, 2017.(b) The security, or a portion thereof, is segregated to cover the value of
open futures contracts at December 31, 2017.(c) Rate represents the money market fund annualized seven-day yield at
December 31, 2017.(d) Securities with a value of $2,892,000 are segregated as collateral for
initial margin requirements on open futures contracts.(e) The contract value of futures purchased and/or sold as a percentage
of net assets is 1.8%.(f) Rate represents an annualized yield at time of purchase, not coupon
rate.
* Non-income-producing security.See accompanying notes to financial statements.

STATEMENT OF ASSETS AND LIABILITIES(IN THOUSANDS)
December 31, 2017
Financial Statements | 19
ASSETSInvestments in securities, at market value (including
securities on loan of $18,916) (cost of $919,033) $1,647,565Receivables: Capital shares sold 2,012 USAA Asset Management Company (Note 7D) 9 Dividends and interest 419 Securities sold 738 Other 9
Total assets 1,650,752
LIABILITIESPayables: Upon return of securities loaned 19,505 Capital shares redeemed 1,103 Bank overdraft 33Variation margin on futures contracts 162Accrued management fees 275Accrued transfer agent’s f ees 72Other accrued expenses and payables 163
Total liabilities 21,313
Net assets applicable to capital shares outstanding $1,629,439
NET ASSETS CONSIST OF: Paid-in capital $ 902,772Accumulated undistributed net investment income 7,629Accumulated net realized loss on investments and futures transactions (9,749)
Net unrealized appreciation of investments and futures contracts 728,787
Net assets applicable to capital shares outstanding $1,629,439Net asset value, redemption price, and offering price per share:
Fund Shares (net assets of $1,623,579/90,743 capital shares outstanding, no par value) $ 17.89
R6 Shares (net assets of $5,860/328 capital shares outstanding, no par value) $ 17.89
See accompanying notes to financial statements.

STATEMENT OF OPERATIONS(IN THOUSANDS)
Year ended December 31, 2017
20 | USAA Nasdaq-100 Index Fund
INVESTMENT INCOMEDividends $14,915Interest 345Securities lending (net) 111
Total income 15,371
EXPENSESManagement fees 2,765Administration and servicing fees: Fund Shares 2,067 R6 Shares* 2Transfer agent’s f ees: Fund Shares 1,410Custody and accounting fees: Fund Shares 159 R6 Shares* 1Postage: Fund Shares 114Shareholder reporting fees: Fund Shares 36Trustees’ fees 34Registration fees: Fund Shares 87 R6 Shares* 32Professional f ees 131Other 226
Total expenses 7,064Expenses reimbursed: R6 Shares* (28)
Net expenses 7,036
NET INVESTMENT INCOME 8,335

NET REALIZED AND UNREALIZED GAIN ON INVESTMENTSAND FUTURES CONTRACTS
Net realized gain on: Investments $ 12,333 Futures transactions 9,379Change in net unrealized appreciation/(depreciation) of: Investments 339,109 Futures contracts 334
Net realized and unrealized gain 361,155
Increase in net assets resulting from operations $369,490
*R6 Shares commenced operations on March 1, 2017.
See accompanying notes to financial statements.
Financial Statements | 21

22 | USAA Nasdaq-100 Index Fund
STATEMENTS OF CHANGES IN NET ASSETS(IN THOUSANDS)
Years ended December 31,
2017 2016
FROM OPERATIONSNet investment income $ 8,335 $ 7,497Net realized gain (loss) on investments 12,333 (41)Net realized gain on futures transactions 9,379 2,045Change in net unrealized appreciation/(depreciation) of: Investments 339,109 58,262 Futures contracts 334 137 Increase in net assets resulting from operations 369,490 67,900
DISTRIBUTIONS TO SHAREHOLDERS FROM:Net investment income: Fund Shares (7,464) (5,335) R6 Shares* (33) – Total distributions of net investment income (7,497) (5,335)Net realized gains: Fund Shares (23,897) – R6 Shares* (88) – Total distributions of net realized gains (23,985) –Distributions to shareholders (31,482) (5,335)
NET INCREASE IN NET ASSETS FROM CAPITALSHARE TRANSACTIONS (NOTE 6)
Fund Shares 208,096 80,749R6 Shares* 5,016 – Total net increase in net assets from capital share transactions 213,112 80,749Capital contribution from USAA Transfer Agency Company: Fund Shares – 1Net increase in net assets 551,120 143,315
NET ASSETSBeginning of year 1,078,319 935,004End of year $1,629,439 $1,078,319
Accumulated undistributed net investment income:End of year $ 7,629 $ 7,497
*R6 Shares commenced operations on March 1, 2017.See accompanying notes to financial statements.

Notes to Financial Statements | 23
NOTES TO FINANCIAL STATEMENTSDecember 31, 2017
(1) SUMMARY OF SIGNIFICANT ACCOUNTING POLICIESUSAA MUTUAL FUNDS TRUST (the Trust), registered under theInvestment Company Act of 1940, as amended (the 1940 Act), is an open-endmanagement investment company organized as a Delaware statutory trustconsisting of 51 separate funds. The USAA Nasdaq-100 Index Fund (theFund) qualifies as a registered investment company under AccountingStandards Codification Topic 946. The information presented in this annualreport pertains only to the Fund, which is classified as nondiversified underthe 1940 Act. The Fund seeks to match, before fees and expenses, theperformance of the stocks composing the Nasdaq-100 Index. TheNasdaq-100 Index represents 100 of the largest nonfinancial stocks traded onThe Nasdaq Stock Market. USAA Asset Management Company (theManager), an affiliate of the Fund, has retained Northern Trust Investments,Inc. (NTI) to serve as subadviser for the Fund. NTI is responsible forinvesting the Fund’s assets. Under normal market conditions, NTI attempts toachieve the Fund’s objective by investing at least 80% of the Fund’s assets inthe common stocks of companies composing the Nasdaq-100 Index.
As a nondiversified fund, the Fund may invest a greater percentage of itsassets in a single issuer. Because a relatively high percentage of the Fund’stotal assets may be invested in the securities of a single issuer or a limitednumber of issuers, the securities of the Fund may be more sensitive tochanges in the market value of a single issuer, a limited number of issuers, orlarge companies generally. Such a focused investment strategy may increasethe volatility of the Fund’s investment results because this Fund may bemore susceptible to risk associated with a single economic, political, orregulatory event than a diversified fund.

The Fund consists of two classes of shares: Nasdaq-100 Index Fund Shares(Fund Shares) and effective March 1, 2017, Nasdaq-100 Index R6 Shares(R6 Shares). Each class of shares has equal rights to assets and earnings,except that each class bears certain class-related expenses specific to theparticular class. These expenses include administration and servicing fees,transfer agent fees, postage, shareholder reporting fees, and certainregistration and custodian fees. Expenses not attributable to a specific class,income, and realized gains or losses on investments are allocated to each classof shares based on each class’ relative net assets. Each class has exclusivevoting rights on matters related solely to that class and separate voting rightson matters that relate to both classes. The R6 Shares are available forinvestment by participants in employer-sponsored retirement plans where afinancial intermediary provides retirement recordkeeping services to planparticipants and to endowment funds and foundations.
A. Security valuation – The Trust’s Board of Trustees (the Board) hasestablished the Valuation Committee (the Committee), and subject toBoard oversight, the Committee administers and oversees the Fund’svaluation policies and procedures, which are approved by the Board.Among other things, these policies and procedures allow the Fund toutilize independent pricing services, quotations from securities dealers,and a wide variety of sources and information to establish and adjust thefair value of securities as events occur and circumstances warrant.
The Committee reports to the Board on a quarterly basis and makesrecommendations to the Board as to pricing methodologies and servicesused by the Fund and presents additional information to the Boardregarding application of the pricing and fair valuation policies andprocedures during the preceding quarter.
The Committee meets as often as necessary to make pricing and fairvalue determinations. In addition, the Committee holds regular monthlymeetings to review prior actions taken by the Committee and theManager, an affiliate of the Fund. Among other things, these monthlymeetings include a review and analysis of backtesting reports, pricingservice quotation comparisons, illiquid securities and fair valuedeterminations, pricing movements, and daily stale price monitoring.
24 | USAA Nasdaq-100 Index Fund

The value of each security is determined (as of the close of trading onthe New York Stock Exchange (NYSE) on each business day the NYSEis open) as set forth below:
1. Equity securities, including exchange-traded funds (ETFs), except asotherwise noted, traded primarily on a domestic securities exchangeor the over-the-counter markets, are valued at the last sales price orofficial closing price on the exchange or primary market on whichthey trade. Securities traded primarily on foreign securitiesexchanges or markets are valued at the last quoted sale price, or themost recently determined official closing price calculated accordingto local market convention, available at the time the Fund is valued.If no last sale or official closing price is reported or available, theaverage of the bid and ask prices generally is used. Actively tradedequity securities listed on a domestic exchange generally arecategorized in Level 1 of the fair value hierarchy. Certain preferredand equity securities traded in inactive markets generally arecategorized in Level 2 of the fair value hierarchy.
2. Short-term debt securities with original or remaining maturities of60 days or less may be valued at amortized cost, provided thatamortized cost represents the fair value of such securities.
3. Debt securities with maturities greater than 60 days are valued eachbusiness day by a pricing service (the Service) approved by theBoard. The Service uses an evaluated mean between quoted bid andask prices or the last sales price to value a security when, in theService’s judgment, these prices are readily available and arerepresentative of the security’s market value. For many securities,such prices are not readily available. The Service generally pricesthose securities based on methods which include consideration ofyields or prices of securities of comparable quality, coupon,maturity, and type; indications as to values from dealers in securities;and general market conditions. Generally, debt securities arecategorized in Level 2 of the fair value hierarchy; however, to theextent the valuations include significant unobservable inputs, thesecurities would be categorized in Level 3.
Notes to Financial Statements | 25

4. Investments in open-end investment companies, commingled, orother funds, other than ETFs, are valued at their net asset value(NAV) at the end of each business day and are categorized in Level 1of the fair value hierarchy.
5. Repurchase agreements are valued at cost.
6. Futures are valued at the settlement price at the close of market onthe principal exchange on which they are traded or, in the absence ofany transactions that day, the settlement price on the prior tradingdate if it is within the spread between the closing bid and ask priceclosest to the last reported sale price.
7. In the event that price quotations or valuations are not readilyavailable, are not reflective of market value, or a significant event hasbeen recognized in relation to a security or class of securities, thesecurities are valued in good faith by the Committee in accordancewith valuation procedures approved by the Board. The effect of fairvalue pricing is that securities may not be priced on the basis ofquotations from the primary market in which they are traded andthe actual price realized from the sale of a security may differmaterially from the fair value price. Valuing these securities at fairvalue is intended to cause the Fund’s NAV to be more reliable than itotherwise would be.
Fair value methods used by the Manager include, but are not limitedto, obtaining market quotations from secondary pricing services,broker-dealers, other pricing services, or widely used quotationsystems. General factors considered in determining the fair value ofsecurities include fundamental analytical data, the nature andduration of any restrictions on disposition of the securities,evaluation of credit quality, and an evaluation of the forces thatinfluenced the market in which the securities are purchased and sold.
B. Fair value measurements – Fair value is defined as the price that wouldbe received to sell an asset or paid to transfer a liability in an orderlytransaction between market participants at the measurement date. Thethree-level valuation hierarchy disclosed in the Portfolio of Investments
26 | USAA Nasdaq-100 Index Fund
is based upon the transparency of inputs to the valuation of an asset orliability as of the measurement date. The three levels are defined as follows:
Level 1 – inputs to the valuation methodology are quoted prices(unadjusted) in active markets for identical securities.
Level 2 – inputs to the valuation methodology are other significantobservable inputs, including quoted prices for similar securities, inputsthat are observable for the securities, either directly or indirectly, andmarket-corroborated inputs such as market indexes.
Level 3 – inputs to the valuation methodology are unobservable andsignificant to the fair value measurement, including the Manager’s ownassumptions in determining the fair value.
The inputs or methodologies used for valuing securities are not necessarilyan indication of the risks associated with investing in those securities.
C. Derivative instruments and hedging activities – The Fund may buy, sell,and enter into certain types of derivatives, including, but not limited to,futures contracts, options, and options on futures contracts, undercircumstances in which such instruments are expected by the portfoliomanager to aid in achieving the Fund’s investment objective. The Fundalso may use derivatives in circumstances where the portfolio managerbelieves they offer an economical means of gaining exposure to aparticular asset class or securities market or to keep cash on hand tomeet shareholder redemptions or other needs while maintainingexposure to the market. With exchange-listed futures contracts andoptions, counterparty credit risk to the Fund is limited to the exchange’sclearinghouse which, as counterparty to all exchange-traded futurescontracts and options, guarantees the transactions against default fromthe actual counterparty to the transaction. The Fund’s derivativeagreements held at December 31, 2017, did not include master nettingprovisions.
Futures contracts – The Fund is subject to cash flow and tracking errorrisk in the normal course of pursuing its investment objectives. TheFund may use stock index futures contracts in an attempt to reduce anyperformance discrepancies between the Fund and the Nasdaq-100 Index.
Notes to Financial Statements | 27

A futures contract represents a commitment for the future purchase orsale of an asset at a specified price on a specified date. Upon enteringinto such contracts, the Fund is required to deposit with the broker ineither cash or securities an initial margin in an amount equal to a certainpercentage of the contract amount. Subsequent payments (variationmargin) are made or received by the Fund each day, depending on thedaily fluctuations in the value of the contract, and are recorded forfinancial statement purposes as unrealized gains or losses. When thecontract is closed, the Fund records a realized gain or loss equal to thedifference between the value of the contract at the time it was openedand the value at the time it was closed. Upon entering into suchcontracts, the Fund bears the risk of interest or exchange rates orsecurities prices moving unexpectedly in an unfavorable direction, inwhich case, the Fund may not achieve the anticipated benefits of thefutures contracts.
Fair Values of Derivative Instruments as of December 31, 2017*(in thousands) Asset Derivatives Liability Derivatives
Derivatives not Statement of Statement ofaccounted for as Assets and Assets andhedging Liabilities Liabilitiesinstruments Location Fair Value Location Fair ValueEquity contracts Net unrealized $255** $– appreciation of investments and futures contracts
* For open derivative instruments as of December 31, 2017, see the Portfolio of Investments.
** Includes cumulative appreciation/(depreciation) of futures as reported on the Portfolio ofInvestments. Only the variation margin from the last business day of the reporting period isreported within the Statement of Assets and Liabilities.
28 | USAA Nasdaq-100 Index Fund

The Effect of Derivative Instruments on the Statement of Operationsfor the year ended December 31, 2017 (in thousands) Change inDeriva tives not unrealizedaccounted for as Statement of Realized appreciation/hedging Operations gain (loss) on (depreciation) instruments Location derivatives on derivativesEquity contracts Net realized gain on $9,379 $334 Futures transactions / Change in net unrealized appreciation/(depreciation) of Futures contracts
D. Federal taxes – The Fund’s policy is to comply with the requirements ofthe Internal Revenue Code of 1986, as amended, applicable to regulatedinvestment companies and to distribute substantially all of its taxableincome and net capital gains, if any, to its shareholders. Therefore, nofederal income tax provision is required.
For the year ended December 31, 2017, the Fund did not incur anyincome tax, interest, or penalties, and has recorded no liability for netunrecognized tax benefits relating to uncertain income tax positions. Onan ongoing basis, the Manager will monitor the Fund’s tax basis todetermine if adjustments to this conclusion are necessary. The statute oflimitations on the Fund’s tax return filings generally remain open for thethree preceding fiscal reporting year ends and remain subject toexamination by the Internal Revenue Service and state taxing authorities.
E. Investments in securities – Securities transactions are accounted for onthe date the securities are purchased or sold (trade date). Gains or lossesfrom sales of investment securities are computed on the identified costbasis. Dividend income, less foreign taxes, if any, is recorded on the ex-dividend date. If the ex-dividend date has passed, certain dividendsfrom foreign securities are recorded upon notification. Interest income isrecorded daily on the accrual basis. Premiums and discounts on short-term securities are amortized on a straight-line basis over the life of therespective securities.
F. Expenses paid indirectly – Through arrangements with the Fund’scustodian and other banks utilized by the Fund for cash managementpurposes, realized credits, if any, generated from cash balances in the
Notes to Financial Statements | 29

Fund’s bank accounts may be used to directly reduce the Fund’sexpenses. For the year ended December 31, 2017, there were nocustodian and other bank credits.
G. Indemnifications – Under the Trust’s organizational documents, itsofficers and trustees are indemnified against certain liabilities arising outof the performance of their duties to the Trust. In addition, in thenormal course of business, the Trust enters into contracts that contain avariety of representations and warranties that provide generalindemnifications. The Trust’s maximum exposure under thesearrangements is unknown, as this would involve future claims that maybe made against the Trust that have not yet occurred. However, the Trustexpects the risk of loss to be remote.
H. Use of estimates – The preparation of financial statements in conformitywith U.S. generally accepted accounting principles requires managementto make estimates and assumptions that may affect the reported amountsin the financial statements.
(2) LINE OF CREDITThe Fund participates, along with other funds of the Trust and USAA ETFTrust (together, the Trusts), in a joint, short-term, revolving, committed loanagreement of $500 million with USAA Capital Corporation (CAPCO), anaffiliate of the Manager. The purpose of the agreement is to providetemporary or emergency cash needs, including redemption requests thatmight otherwise require the untimely disposition of securities. Subject toavailability (including usage of the facility by other funds of the Trusts), theFund may borrow from CAPCO an amount up to 5% of the Fund’s totalassets at an interest rate based on the London Interbank Offered Rate(LIBOR), plus 100.0 basis points.
The Trusts are also assessed facility fees by CAPCO in the amount of 13.0basis points of the amount of the committed loan agreement. Prior toSeptember 30, 2017, the maximum annual facility fee was 12.0 basis pointsof the amount of the committed loan agreement. The facility fees areallocated among the funds of the Trusts based on their respective average netassets for the period.
30 | USAA Nasdaq-100 Index Fund

The Trusts may request an optional increase of the committed loanagreement from $500 million up to $750 million. If the Trusts increase thecommitted loan agreement, the assessed facility fee on the amount of theadditional commitment will be 14.0 basis points.
For the year ended December 31, 2017, the Fund paid CAPCO facility feesof $11,000, which represents 1.8% of the total fees paid to CAPCO by thefunds of the Trusts. The Fund had no borrowings under this agreementduring the year ended December 31, 2017.
(3) DISTRIBUTIONSThe character of any distributions made during the year from net investmentincome or net realized gains is determined in accordance with federal taxregulations and may differ from those determined in accordance with U.S.generally accepted accounting principles. Also, due to the timing ofdistributions, the fiscal year in which amounts are distributed may differfrom the year that the income or realized gains were recorded by the Fund.
During the current fiscal year, permanent differences between book-basisand tax-basis accounting for non-REIT return of capital dividend, theutilization of earnings and distributions adjustments resulted inreclassifications to the Statement of Assets and Liabilities to decreaseaccumulated undistributed net investment income by $706,000, increaseaccumulated net realized loss on investments by $1,711,000, and increase inpaid in capital by $2,417,000. These reclassifications had no effect on netassets.
The tax character of distributions paid during the years ended December 31,2017, and 2016, was as follows:
2017 2016
Ordinary income* $11,570,000 $5,335,000Long-term realized capital gain 19,912,000 –
Total distributions paid $31,482,000 $5,335,000
Notes to Financial Statements | 31

As of December 31, 2017, the components of net assets representingdistributable earnings on a tax basis were as follows:
Undistributed ordinary income* $ 7,628,000Accumulated capital and other losses (2,430,000)Unrealized appreciation of investments 721,468,000
* Includes short-term realized capital gains, if any, which are taxable as ordinary income.
The difference between book-basis and tax-basis unrealized appreciation ofinvestments is attributable to the tax deferral of losses on wash sales andnon-REIT return of capital dividend adjustments.
Distributions of net investment income and realized gains from securitytransactions not offset by capital losses are made annually in the succeedingfiscal year or as otherwise required to avoid the payment of federal taxes.
At December 31, 2017, the Fund had no capital loss carryforwards, forfederal income tax purposes. Net capital losses incurred after October 31,and within the taxable year are deemed to arise on the first business day ofthe Fund’s next taxable year. For the year ended December 31, 2017, theFund deferred to January 1, 2018, post October capital losses of $2,430,000.
Tax Basis of Investments – The aggregate cost of investments for federalincome tax purposes at December 31, 2017 was substantially the same forbook purposes. The net unrealized appreciation/(depreciation) on investments,which consists of gross unrealized appreciation and depreciation, is disclosedbelow:
Gross Gross Net UnrealizedUnrealized Unrealized Appreciation/
Tax Cost Appreciation Depreciation (Depreciation)
$926,097,000 $730,818,000 $(9,350,000) $721,468,000
(4) INVESTMENT TRANSACTIONSCost of purchases and proceeds from sales/maturities of securities, excludingshort-term securities, for the year ended December 31, 2017, were$253,231,000 and $64,955,000, respectively.
32 | USAA Nasdaq-100 Index Fund

(5) SECURITIES LENDINGThe Fund, through its securities lending agreement with Citibank, N.A.(Citibank), may lend its securities to qualified financial institutions, such ascertain broker-dealers, to earn additional income. The borrowers are requiredto secure their loans continuously with collateral in an amount at least equalto 102% of the fair value of domestic securities and foreign governmentsecurities loaned and 105% of the fair value of foreign securities and allother securities loaned. Collateral may be cash, U.S. government securities,or other securities as permitted by SEC guidelines. Cash collateral may beinvested in high-quality short-term investments. Collateral requirements aredetermined daily based on the value of the Fund’s securities on loan as ofthe end of the prior business day. Risks relating to securities-lendingtransactions include that the borrower may not provide additional collateralwhen required or return the securities when due, and that the value of theshort-term investments will be less than the amount of cash collateralrequired to be returned to the borrower. The Fund’s agreement withCitibank does not include master netting provisions. Non-cash collateralreceived by the Fund may not be sold or re-pledged except to satisfyborrower default. Cash collateral is listed in the Fund’s Portfolio of Investmentsand Financial Statements while non-cash collateral is not included.
At December 31, 2017, the Fund’s value of outstanding securities on loanand the value of collateral are as follows:
Value of Securities on Loan Non-Cash Collateral Cash Collateral
$18,916,000 $– $19,505,000
(6) CAPITAL SHARE TRANSACTIONSAt December 31, 2017, there were an unlimited number of shares of capitalstock at no par value authorized for the Fund.
Notes to Financial Statements | 33

Capital share transactions for all classes were as follows, in thousands:
Year Ended Year Ended December 31, 2017 December 31, 2016
Shares Amount Shares Amount
Fund Shares:Shares sold 30,389 $ 492,063 23,911 $ 308,078Shares issued from reinvested dividends 1,726 31,023 377 5,261Shares redeemed (19,557) (314,990) (18,088) (232,590)Net increase from capital
share transactions 12,558 $ 208,096 6,200 $ 80,749R6 Shares (commenced
operations on March 1, 2017):Shares sold 328 $ 5,017 – $ –Shares issued from reinvested dividends –* –* – –Shares redeemed –* (1) – –Net increase from capital
share transactions 328 $ 5,016 – $ –
*Represents less than 500 shares or $500.
(7) TRANSACTIONS WITH MANAGER
A. Management fees – The Manager provides investment management servicesto the Fund pursuant to an Advisory Agreement. Under this agreement,the Manager is responsible for managing the business and affairs of theFund. The Manager also is authorized to select (with approval of the Boardand without shareholder approval) one or more subadvisers to manage theday-to-day investment of all or a portion of the Fund’s assets.
The Manager monitors each subadviser’s performance throughquantitative and qualitative analysis and periodically reports to theBoard as to whether each subadviser’s agreement should be renewed,terminated, or modified. The Manager is also responsible fordetermining the asset allocation for the subadviser(s). The allocation foreach subadviser could range from 0% to 100% of the Fund’s assets, andthe Manager could change the allocations without shareholder approval.
34 | USAA Nasdaq-100 Index Fund

The Fund’s management fees are accrued daily and paid monthly at anannualized rate of 0.20% of the Fund’s average net assets. For the yearended December 31, 2017, the Fund incurred management fees, paid orpayable to the Manager, of $2,765,000.
B. Subadvisory arrangement(s) – The Manager entered into an InvestmentSubadvisory Agreement with NTI under which NTI directs theinvestment and reinvestment of the Fund’s assets (as allocated from timeto time by the Manager).
The Manager (not the Fund) pays NTI a subadvisory fee equal to thegreater of a minimum annual fee of $50,000 or a fee at an annual rate equalto 0.06% of the Fund’s average net assets on amounts up to $100 million;0.04% of net assets for amounts over $100 million and up to $250 million;and 0.03% of the Fund’s net assets for amounts over $250 million. Forthe year ended December 31, 2017, the Manager incurred subadvisoryfees with respect to the Fund, paid or payable to NTI, of $460,000.
C. Administration and servicing fees – The Manager provides certainadministration and servicing functions for the Fund. For such services,the Manager receives a fee accrued daily and paid monthly at anannualized rate of 0.15% of average net assets of the Fund Shares and0.05% of average net assets of the R6 Shares. For the year endedDecember 31, 2017 (and for the period from March 1, 2017, toDecember 31, 2017, for the R6 Shares), the Fund Shares and R6 Sharesincurred administration and servicing fees, paid or payable to theManager, of $2,067,000 and $2,000.
In addition to the services provided under its Administration and ServicingAgreement with the Fund, the Manager also provides certain complianceand legal services for the benefit of the Fund. The Board has approved thereimbursement of a portion of these expenses incurred by the Manager.For the year ended December 31, 2017, the Fund reimbursed the Manager$21,000 for these compliance and legal services. These expenses areincluded in the professional fees on the Fund’s Statement of Operations.
D. Expense limitation – The Manager agreed, through April 30, 2018, tolimit the total annual operating expenses of the R6 Shares to 0.40% of its
Notes to Financial Statements | 35

average annual net assets, excluding extraordinary expenses and beforereductions of any expenses paid indirectly, and would reimburse theFund for all expenses in excess of that amount. This expense limitationarrangement may not be changed or terminated through April 30, 2018,without approval of the Board, and may be changed or terminated bythe Manager at any time after that date. For the period March 1, 2017 toDecember 31, 2017, the Fund incurred reimbursable expenses from theManager for the R6 Shares of $28,000, of which $9,000 was receivablefrom the Manager.
E. Transfer agent’s fees – USAA Transfer Agency Company, d/b/a USAAShareholder Account Services (SAS), an affiliate of the Manager, providestransfer agent services to the Fund Shares based on an annual charge of$23 per shareholder account plus out of pocket expenses. SAS pays aportion of these fees to certain intermediaries for the administration andservicing of accounts that are held with such intermediaries. Transferagent’s fees for R6 Shares are paid monthly based on a fee accrued daily atan annualized rate of 0.01% of the R6 Shares’ average net assets, plus out-of-pocket expenses. For the year ended December 31, 2017 (and for theperiod from March 1, 2017, to December 31, 2017, for the R6 Shares), theFund Shares and R6 Shares incurred transfer agent’s fees, paid or payableto SAS, of $1,410,000 and less than $500, respectively.
F. Underwriting services – USAA Investment Management Companyprovides exclusive underwriting and distribution of the Fund’s shares ona continuing best-efforts basis and receives no fee or other compensationfor these services.
(8) TRANSACTIONS WITH AFFILIATESThe Manager is indirectly wholly owned by United Services AutomobileAssociation (USAA), a large, diversified financial services institution. AtDecember 31, 2017, USAA and its affiliates owned 327,000 R6 Shares, whichrepresents 99.7% of the R6 Shares outstanding and 0.3% of the Fund’s totaloutstanding shares.
36 | USAA Nasdaq-100 Index Fund

Certain trustees and officers of the Fund are also directors, officers, and/oremployees of the Manager. None of the affiliated trustees or Fund officersreceived any compensation from the Fund.
(9) UPCOMING REGULATORY MATTERSIn October 2016, the U.S. Securities and Exchange Commission (SEC) issuedFinal Rule Release No. 33-10231, Investment Company ReportingModernization. In part, the rules require the filing of new forms N-PORTand N-CEN, and amend Regulation S-X to require standardized, enhanceddisclosure about derivatives in investment company financial statements, aswell as other amendments.
In October 2016, the SEC issued Final Rule Release No. 33-10233,Investment Company Liquidity Risk Management Programs. This rulerequires funds to establish a liquidity risk management program andenhances disclosures regarding funds’ liquidity.
In October 2016, the SEC issued Final Rule Release No. 33-10234,Investment Company Swing Pricing. This rule permits certain funds to useswing pricing during periods of heavy redemptions and requires certaindisclosures regarding the use of swing pricing in forms filed with the SEC.
The Manager continues to evaluate the impact these rules and amendmentswill have on the financial statements and other disclosures. The compliancedate for new forms N-PORT and N-CEN is June 1, 2018 (with filing ofForm N-PORT beginning April 30, 2019), with other staggered compliancedates extending through April 30, 2019. The Fund is expected to complywith the June 1, 2018 compliance date for new forms N-PORT and N-CEN.
Notes to Financial Statements | 37

38 | USAA Nasdaq-100 Index Fund
(10) FINANCIAL HIGHLIGHTS – FUND SHARESPer share operating performance for a share outstanding throughout eachperiod is as follows: Year Ended December 31, 2017 2016 2015 2014 2013Net asset value at
beginning of period $ 13.79 $ 12.99 $ 12.23 $ 10.32 $ 7.61 Income from
investment operations: Net investment income .07 .09 .08(a) .09 .06 Net realized and
unrealized gain 4.38 .78 1.04(a) 1.85 2.68 Total from investment
operations 4.45 .87 1.12(a) 1.94 2.74 Less distributions from: Net investment income (.08) (.07) (.08) (.03) (.03) Realized capital gains (.27) – (.28) – – Total distributions (.35) (.07) (.36) (.03) (.03) Net asset value at
end of period $ 17.89 $ 13.79 $ 12.99 $ 12.23 $ 10.32 Total return (%)* 32.29 6.68 9.09 18.75 36.00Net assets at
end of period (000) $1,623,579 $1,078,319 $935,004 $706,604 $460,689Ratios to average
net assets:** Expenses (%)(b) .51 .53 .57 .59 .64(c)
Expenses, excluding reimbursements (%)(b) .51 .53 .57 .59 .64
Net investment income (%) .60 .77 .62 1.04 .77Portfolio turnover (%) 5 4 10 6 11
* Assumes reinvestment of all net investment income and realized capital gain distributions, if any,during the period. Includes adjustments in accordance with U.S. generally accepted accountingprinciples and could differ from the Lipper reported return. Total returns for periods of less than oneyear are not annualized.
** For the year ended December 31, 2017, average net assets were $1,380,122,000.(a) Calculated using average shares.(b) Reflects total annual operating expenses of the Fund before reductions of any expenses paid
indirectly. The Fund’s expenses paid indirectly decreased the expense ratios as follows: – – – – (.00%)†
† Represents less than 0.01% of average net assets.(c) Prior to May 1, 2013, the Manager had voluntarily agreed to limit the annual expenses of the Fund
Shares to 0.78% of the Fund Shares’ average net assets.

Notes to Financial Statements | 39
(10) FINANCIAL HIGHLIGHTS (continued) – R6 SHARESPer share operating performance for a share outstanding throughout theperiod is as follows: Period Ended December 31, 2017***
Net asset value at beginning of period $15.31 Income from investment operations:
Net investment income .08Net realized and unrealized gain 2.87
Total from investment operations 2.95 Less distributions from:
Net investment income (.10)Realized capital gains (.27)
Total distributions (.37) Net asset value at end of period $17.89 Total return (%)* 19.27
Net assets at end of period (000) $5,860
Ratios to average net assets:**Expenses (%)(a) .40Expenses, excluding reimbursements (%)(a) 1.01Net investment income (%)(a) .66
Portfolio turnover (%) 5
* Assumes reinvestment of all net investment income and realized capital gain distributions, if any,during the period. Includes adjustments in accordance with U.S. generally accepted accountingprinciples and could differ from the Lipper reported return. Total returns for periods of less than oneyear are not annualized.
** For the period ended December 31, 2017, average net assets were $5,465,000.*** R6 Shares commenced operations on March 1, 2017.(a) Annualized. The ratio is not necessarily indicative of 12 months of operations.

40 | USAA Nasdaq-100 Index Fund
EXPENSE EXAMPLEDecember 31, 2017 (unaudited)
EXAMPLEAs a shareholder of the Fund, you incur two types of costs: direct costs, suchas wire fees, redemption fees, and low balance fees; and indirect costs,including management fees, transfer agency fees, and other Fund operatingexpenses. This example is intended to help you understand your indirectcosts, also referred to as “ongoing costs” (in dollars), of investing in theFund and to compare these costs with the ongoing costs of investing in othermutual funds.
The example is based on an investment of $1,000 invested at the beginningof the period and held for the entire six-month period of July 1, 2017,through December 31, 2017.
ACTUAL EXPENSESThe line labeled “actual” under each share class in the table providesinformation about actual account values and actual expenses. You may usethe information in this line, together with the amount you invested at thebeginning of the period, to estimate the expenses that you paid over theperiod. Simply divide your account value by $1,000 (for example, an $8,600account value divided by $1,000 = 8.6), then multiply the result by thenumber in the “actual” line under the heading “Expenses Paid DuringPeriod” to estimate the expenses you paid on your account during thisperiod.
HYPOTHETICAL EXAMPLE FOR COMPARISON PURPOSESThe line labeled “hypothetical” under each share class in the table providesinformation about hypothetical account values and hypothetical expensesbased on the Fund’s actual expense ratios for each class and an assumed rateof return of 5% per year before expenses, which is not the Fund’s actual

Expense Example | 41
return. The hypothetical account values and expenses may not be used toestimate the actual ending account balance or expenses you paid for theperiod. You may use this information to compare the ongoing costs ofinvesting in the Fund and other funds. To do so, compare this 5%hypothetical example with the 5% hypothetical examples that appear in theshareholder reports of other funds.
Please note that the expenses shown in the table are meant to highlight yourongoing costs only and do not reflect any direct costs, such as wire fees,redemption fees, or low balance fees. Therefore, the line labeled “hypothetical”is useful in comparing ongoing costs only, and will not help you determinethe relative total costs of owning different funds. In addition, if these directcosts were included, your costs would have been higher.
Expenses Paid Beginning Ending During Period* Account Value Account Value July 1, 2017 – July 1, 2017 December 31, 2017 December 31, 2017
Fund SharesActual $1,000.00 $1,135.90 $2.69
Hypothetical (5% return before expenses) 1,000.00 1,022.68 2.55
R6 Shares Actual 1,000.00 1,136.30 2.15
Hypothetical (5% return before expenses) 1,000.00 1,023.19 2.04
*Expenses are equal to the annualized expense ratio of 0.50% for Fund Shares and 0.40% for R6 Shares,which are net of any reimbursements and expenses paid indirectly, multiplied by the average account valueover the period, multiplied by 365 days/365 days (to reflect the one-half-year period) or 305 days/365 daysfor the R6 Shares (to reflect the current period beginning with the R6 Shares’ inception date). The Fund’sactual ending account values are based on its actual total returns of 13.59% for Fund Shares and 13.63%for R6 Shares for the six-month period of July 1, 2017, through December 31, 2017.

42 | USAA Nasdaq-100 Index Fund
TRUSTEES’ AND OFFICERS’INFORMATION
TRUSTEES AND OFFICERS OF THE TRUST
The Board of Trustees (the Board) of the Trust consists of eight Trustees.These Trustees and the Trust’s Officers supervise the business affairs of theUSAA family of funds. The Board is responsible for the general oversight ofthe funds’ business and for assuring that the funds are managed in the bestinterests of each fund’s respective shareholders. The Board periodically reviewsthe funds’ investment performance as well as the quality of other servicesprovided to the funds and their shareholders by each of the fund’s serviceproviders, including USAA Asset Management Company (AMCO) and itsaffiliates. Pursuant to a policy adopted by the Board, the term of office foreach Trustee shall be 20 years or until the Independent Trustee reaches age 72or an Interested Trustee reaches age 65. The Board may change or grantexceptions from this policy at any time without shareholder approval. ATrustee may resign or be removed by a vote of the other Trustees or theholders of a majority of the outstanding shares of the Trust at any time.Vacancies on the Board can be filled by the action of a majority of theTrustees, provided that after filling such vacancy at least two-thirds of theTrustees have been elected by the shareholders.
Set forth below are the Trustees and Officers of the Trust, their respectiveoffices and principal occupations during the last five years, length of timeserved, and information relating to any other directorships held. Eachserves on the Boards of the USAA family of funds consisting of two registeredinvestment companies which, together, offer 57 individual funds. Unlessotherwise indicated, the business address for each is P.O. Box 659430, SanAntonio, TX 78265-9430.

Trustees’ and Officers’ Information | 43
If you would like more information about the funds’ Trustees, you maycall (800) 531-USAA (8722) or (210) 531-8722 to request a free copy of thefunds’ Statement of Additional Information (SAI).
INTERESTED TRUSTEE1
Daniel S. McNamara2, 4, 6
Trustee, President and Vice Chair of the Board of TrusteesBorn: June 1966Year of Election or Appointment: 2012
President of Financial Advice & Solutions Group (FASG), USAA(02/13–present); Director of USAA Asset Management Company (AMCO),(08/11–present); Director of USAA Investment Management Company(IMCO) (09/09–present); President, IMCO (09/09–04/14); President, AMCO(08/11–04/13); President and Director of USAA Shareholder AccountServices (SAS) (10/09–present); Senior Vice President of USAA FinancialPlanning Services Insurance Agency, Inc. (FPS) (04/11–present); Directorof FPS (12/13–present); President and Director of USAA InvestmentCorporation (ICORP) (03/10–present); Director of USAA FinancialAdvisors, Inc. (FAI) (12/13–present). Mr. McNamara brings to the Boardextensive experience in the financial services industry, including experience asan officer of the Trust.

44 | USAA Nasdaq-100 Index Fund
NON-INTERESTED (INDEPENDENT) TRUSTEES
Robert L. Mason, Ph.D.2, 3, 4, 5, 6, 7
Trustee and Chair of the Board of TrusteesBorn: July 1946Year of Election or Appointment: 1997†
Institute Analyst, Southwest Research Institute (03/02–01/16), which focuses inthe fields of technological research. He was employed at Southwest ResearchInstitute for 40 years. Dr. Mason brings to the Board particular experiencewith information technology matters, statistical analysis, and humanresources as well as over 20 years’ experience as a Board member of theUSAA family of funds. Dr. Mason holds no other directorships of anypublicly held corporations or other investment companies outside the USAAfamily of funds.
Jefferson C. Boyce3, 4, 5, 6, 7
TrusteeBorn: September 1957Year of Election or Appointment: 2013
Senior Managing Director, New York Life Investments, LLC (1992–2012), aninvestment manager. Mr. Boyce brings to the Board experience in financialinvestment management, and, in particular, institutional and retail mutualfunds, variable annuity products, broker dealers, and retirement programs,including experience in organizational development, marketing, productdevelopment, and money management as well as four years’ experience as aBoard member of the USAA family of funds. Mr. Boyce is a board memberof Westhab, Inc.

Trustees’ and Officers’ Information | 45
Dawn M. Hawley3, 4, 5, 6, 7, 9
TrusteeBorn: February 1954Year of Election or Appointment: 2014
Manager of Finance, Menil Foundation, Inc. (05/07–06/11), which is a privatefoundation that oversees the assemblage of sculptures, prints, drawings,photographs, and rare books. Director of Financial Planning and Analysisand Chief Financial Officer, AIM Management Group, Inc. (10/87–01/06).Ms. Hawley brings to the Board experience in financial investment managementand, in particular, institutional and retail mutual funds, variable annuityproducts, broker dealers, and retirement programs, including experience infinancial planning, budgeting, accounting practices, and asset/liabilitymanagement functions including major acquisitions and mergers, as well asover three years’ experience as a Board member of the USAA family offunds. Ms. Hawley holds no other directorships of any publicly heldcorporations or other investment companies outside the USAA family offunds.
Paul L. McNamara3, 4, 5, 6, 7
TrusteeBorn: July 1948Year of Election or Appointment: 2012
Director, Cantor Opportunistic Alternatives Fund, LLC (03/10–02/14),which is a closed-end fund of funds by Cantor Fitzgerald InvestmentAdvisors, LLC. Mr. McNamara retired from Lord Abbett & Co. LLC, anindependent U.S. investment management firm, as an Executive Member on09/30/09, a position he held since 10/02. He had been employed at Lord Abbettsince 1996. Mr. McNamara brings to the Board extensive experience with thefinancial services industry and, in particular, institutional and retail mutualfund markets, including experience with mutual fund marketing, distribution,and risk management, as well as overall experience with compliance andcorporate governance issues. Mr. McNamara also has experience serving as afund director as well as five years’ experience as a Board member of the USAAfamily of funds. Paul L. McNamara is of no relation to Daniel S. McNamara.Mr. McNamara holds no other directorships of any publicly held corporationsor other investment companies outside the USAA family of funds.

46 | USAA Nasdaq-100 Index Fund
Richard Y. Newton III3,4,5,6,7
TrusteeBorn: January 1956Year of Election or Appointment: 2017
Managing Partner, Pioneer Partnership Development Group (12/15–present);Executive Director, The Union League Club of New York (06/14–11/15);Executive Vice President, Air Force Association (08/12–05/14); LieutenantGeneral, United States Air Force (01/08–06/12). Lieutenant GeneralNewton (Ret.) served 34 years of active duty in the United States Air Force.Lt. Gen. Newton retired as the Assistant Vice Chief of Staff and Directorof Air Staff at the Headquarters of the U.S. Air Force where he wasresponsible for overseeing the administration and organization of the AirStaff, which develops policies, plans and programs, establishes requirements,and provides resources to support the Air Force’s mission. Lt. Gen. Newtonbrings to the Board extensive management and military experience. Lt. Gen. Newton is a graduate of the United States Air Force Academy,Webster University, and The National War College. Lt. Gen. Newton holdsno other directorships of any publicly held corporations or other investmentcompanies outside the USAA family of funds.
Barbara B. Ostdiek, Ph.D.3, 4, 5, 6, 7, 8
TrusteeBorn: March 1964Year of Election or Appointment: 2008
Senior Associate Dean of Degree programs at Jesse H. Jones GraduateSchool of Business at Rice University (07/13–present); Associate Professorof Finance at Jesse H. Jones Graduate School of Business at Rice University(07/01–present); Academic Director, El Paso Corporation Finance Center atJesse H. Jones Graduate School of Business at Rice University (07/02–06/12).Dr. Ostdiek brings to the Board particular experience with financialinvestment management, education, and research as well as over nine years’experience as a Board member of the USAA family of funds. Dr. Ostdiekholds no other directorships of any publicly held corporations or otherinvestment companies outside the USAA family of funds.

Trustees’ and Officers’ Information | 47
Michael F. Reimherr3, 4, 5, 6, 7
TrusteeBorn: August 1945Year of Election or Appointment: 2000
President of Reimherr Business Consulting (05/95–present), which performsbusiness valuations of large companies to include the development of annualbusiness plans, budgets, and internal financial reporting. Mr. Reimherrbrings to the Board particular experience with organizational development,budgeting, finance, and capital markets as well as over 17 years’ experienceas a Board member of the USAA family of funds. Mr. Reimherr holds noother directorships of any publicly held corporations or other investmentcompanies outside the USAA family of funds.
1 Indicates the Trustee is an employee of AMCO or affiliated companies and isconsidered an “interested person” under the Investment Company Act of 1940.
2 Member of Executive Committee.3 Member of Audit and Compliance Committee.4 Member of Product Management and Distribution Committee.5 Member of Corporate Governance Committee.6 Member of Investments Committee.7 The address for all non-interested trustees is that of the USAA Funds,
P.O. Box 659430, San Antonio, TX 78265-9430.8 Dr. Ostdiek has been designated as an Audit and Compliance Committee
Financial Expert by the Funds’ Board. 9 Ms. Hawley has been designated as an Audit and Compliance Committee
Financial Expert by the Funds’ Board.† Dr. Mason was elected as Chair of the Board in January 2012.

48 | USAA Nasdaq-100 Index Fund
INTERESTED OFFICERS1
John C. SpearVice PresidentBorn: May 1964Year of Appointment: 2016
Senior Vice President and Chief Investment Officer, USAA Investments, (03/17–present); Vice President and Chief Investment Officer, USAAInvestments, (11/16–03/17); Vice President, Long Term Fixed Income,(05/12–11/16).
John P. TooheyVice PresidentBorn: March 1968Year of Appointment: 2009
Head of Equities, Equity Investments, AMCO (01/12–present).
Jon K. HadfieldSecretaryBorn: September 1974Year of Appointment: 2017
Executive Director/Attorney, FASG General Counsel, USAA (2013–present);Associate, Allen & Overy (2012–2013); Associate, Sutherland Asbill &Brennan LLP (2005–2012). Mr. Hadfield also serves as Secretary of IMCO,AMCO, ICORP, SAS, FAI, and FPS.
Trustees’ and Officers’ Information | 49
Kristen MillanAssistant SecretaryBorn: April 1983Year of Appointment: 2017
Senior Attorney, FASG General Counsel, USAA (9/17–present); Attorney,FASG General Counsel, USAA (6/13–9/17); Associate, Dechert LLP(10/10–05/13). Ms. Millan also serves as Assistant Secretary of AMCO,ICORP, and SAS.
Roberto Galindo, Jr.TreasurerBorn: November 1960Year of Appointment: 2008
Assistant Vice President, Portfolio Accounting/Financial Administration,USAA (12/02–present). Mr. Galindo also serves as the Funds’ PrincipalFinancial Officer.
James K. De VriesAssistant TreasurerBorn: April 1969Year of Appointment: 2013
Executive Director, Investment and Financial Administration, USAA(04/12–present).

50 | USAA Nasdaq-100 Index Fund
Stephanie A. HigbyChief Compliance OfficerBorn: July 1974Year of Appointment: 2013
Assistant Vice President, Compliance Mutual Funds, USAA (12/16–present);Executive Director, Institutional Asset Management Compliance, USAA(04/13–12/16); Director of Compliance, Institutional Asset ManagementCompliance, USAA (03/12–04/13). Ms. Higby also serves as the Funds’anti-money laundering compliance officer and as the Chief ComplianceOfficer for AMCO, IMCO, and FPS.
1 Indicates those Officers who are employees of AMCO or affiliated companiesand are considered “interested persons” under the Investment Company Actof 1940.

Trustees Daniel S. McNamaraRobert L. Mason, Ph.D.Jefferson C. BoyceDawn M. HawleyPaul L. McNamaraRichard Y. Newton IIIBarbara B. Ostdiek, Ph.D. Michael F. Reimherr
Administrator and USAA Asset Management CompanyInvestment Adviser P.O. Box 659453
San Antonio, Texas 78265-9825
Underwriter and USAA Investment Management CompanyDistributor P.O. Box 659453
San Antonio, Texas 78265-9825
Transfer Agent USAA Shareholder Account Services9800 Fredericksburg RoadSan Antonio, Texas 78288
Custodian and State Street Bank and Trust CompanyAccounting Agent P.O. Box 1713
Boston, Massachusetts 02105
Independent Ernst & Young LLPRegistered Public 100 West Houston St., Suite 1700Accounting Firm San Antonio, Texas 78205
Mutual Fund Under “My Accounts” onSelf-Service 24/7 usaa.com select your mutual fundat usaa.com account and either click the link orOr call select ‘I want to...’ and select(800) 531-USAA (8722) the desired action.(210) 531-8722
Copies of the Manager’s proxy voting policies and procedures, approved by the Trust’s Board ofTrustees for use in voting proxies on behalf of the Fund, are available without charge (i) by calling(800) 531-USAA (8722) or (210) 531-8722; (ii) at usaa.com; and (iii) in summary within theStatement of Additional Information on the SEC’s website at http://www.sec.gov. Informationregarding how the Fund voted proxies relating to portfolio securities during the most recent 12-monthperiod ended June 30 is available without charge (i) at usaa.com; and (ii) on the SEC’s website athttp://www.sec.gov.
The Fund files its complete schedule of portfolio holdings with the SEC for the first and thirdquarters of each fiscal year on Form N-Q. These Forms N-Q are available at no charge (i) by calling(800) 531-USAA (8722) or (210) 531-8722; (ii) at usaa.com; and (iii) on the SEC’s website athttp://www.sec.gov. These Forms N-Q also may be reviewed and copied at the SEC’s PublicRef erence Room in Washington, D.C. Information on the operation of the Public Ref erence Roommay be obtained by calling (800) 732-0330.
37732-0218 ©2018, USAA. All rights reserved.