annual report smes 2014 en
DESCRIPTION
Annual Report Smes 2014 EnTRANSCRIPT

Enterprise and Industry

Annual Report on European SMEs 2013/2014 – A Partial and Fragile Recovery Final Report -July 2014 SME Performance Review 2013/2014 Contract No. 345/PP/ENT/CIP/13/F/N02C031 Directorate-General for Enterprise and Industry, Directorate D: SMEs and Entrepreneurship, Unit D4: SME Policy Development and Small Business Act Authors: Patrice Muller, Dimitri Gagliardi, Cecilia Caliandro, Nuray Unlu Bohn, Demetrius Klitou Editors: Hesham Zakai, David Vidal, Laurent Probst, Alexander Schiersch, Anselm Mattes Client: European Commission July 2014
DISCLAIMER
European Commission, Directorate-General for Enterprise and Industry The information and views set out in this publication are those of the author(s) and do not necessarily reflect the official opinion of the Commission. The Commission does not guarantee the accuracy of the data included in this study. Neither the Commission nor any person acting on the Commission’s behalf may be held responsible for the use that may be made of the information contained therein. © 2014 – European Union. All rights reserved.

3 ANNUAL REPORT ON EUROPEAN SMES 2013/2014: A PARTIAL AND FRAGILE RECOVERY
PROJECT CONSORTIUM MEMBERS
The project consortium is composed of the following companies:
PricewaterhouseCoopers Société coopérative – is the largest professional services firm in Luxembourg with over 2100 people employed from 57 different countries. It provides audit, tax and advisory services including management consulting, transaction, financing and regulatory advice to a wide variety of clients from local and middle market entrepreneurs to large multinational companies.
CARSA – is a leading Spanish research, innovation and technology consultancy, with 25 years of experience in managing projects, carrying out studies for public authorities, evaluating research funding programmes, and performing other research and innovation activities, with a focus on SMEs.
The University of Manchester, Manchester Institute of Innovation Research – is a research centre in the Manchester Business School at the University of Manchester. Research and lecturing staff in the Institute focus on technology, innovation management, science, technology and innovation policy, technology foresight, and the evaluation of research and related topics.
INNOVA SpA – is a research, innovation and technology consultancy with a presence in 8 countries, including the United States, that is a European major player in management & innovation consulting and technology transfer and valorisation, seed capital support and applied research lab facilities.
London Economics – is a leading UK consultancy, specialising in economics and policy analysis, with expertise in analysis of applied economics in all areas where it can provide a powerful set of tools for decision-makers.
DIW Berlin (German Institute for Economic Research) – is the leading German think tank for applied economic research and policy advice. Headquartered in Berlin since its founding in 1925, DIW Berlin currently employs about 100 scientific staff.
DIW econ – is the economic consulting company of DIW Berlin, with a clear focus on the business needs of clients, whose work is based on the combination of sound economic theory with advanced economic tools and real data.

4 ANNUAL REPORT ON EUROPEAN SMES 2013/2014: A PARTIAL AND FRAGILE RECOVERY
Table of Contents TABLE OF CONTENTS ..................................................................................................................... 4
EXECUTIVE SUMMARY .................................................................................................................... 6
1 INTRODUCTION ................................................................................................................... 10
1.1 SME PERFORMANCE REVIEW ............................................................................................................................... 10
1.2 SCOPE AND OBJECTIVES OF THE REPORT ................................................................................................................... 11
2 THE RECENT PERFORMANCE OF SMES AND THE OUTLOOK FOR 2014 AND 2015 ............................ 13
2.1 RECENT PERFORMANCE OF SMES IN THE EU ............................................................................................................ 14
2.1.1 SMEs in the EU28 in 2013 .............................................................................................................................. 14
2.1.2 Performance in 2013 of SMEs in the EU28 non-financial business sector ..................................................... 16
2.1.3 To what extent have the SMEs recovered from the economic crisis? ............................................................ 20
2.1.4 How did the relative performance of the various SMEs’ segments contribute to the overall performance
of SMEs in the EU28 from 2008 to 2013? ............................................................................................................... 24
2.2 THE BUSINESS ENVIRONMENT FOR SMES IN EUROPE .................................................................................................. 26
2.2.1 Issues faced by SMEs ..................................................................................................................................... 26
2.2.2 Key findings from the 2014 review of the SBA implementation .................................................................... 30
2.3 SME PERFORMANCE FORECAST FOR 2014 AND 2015 ............................................................................................... 35
2.3.1 EU28 outlook ................................................................................................................................................. 35
2.3.2 The outlook for different SME size classes at the EU28 level ......................................................................... 37
2.3.3 The outlook for SMEs in different sectors at the EU28 level .......................................................................... 38
2.3.4 The outlook for SMEs in different Member States ......................................................................................... 40
2.4 COMPARISON OF SME PERFORMANCE IN THE EU28 AND OTHER SELECTED COUNTRIES ...................................................... 42
2.4.1 Comparative analysis of SME performance in the EU28, USA and Japan ...................................................... 42
3 DRIVERS OF SME ECONOMIC PERFORMANCE IN RECENT YEARS AND INTO THE FUTURE ............... 55
3.1 MACRO-ECONOMIC DRIVERS OF DEMAND FOR GOODS AND SERVICES PRODUCED BY SMES ................................................. 56
3.1.1 Main clients of SMEs in key economic sectors in the EU28 ........................................................................... 56
3.1.2 Impact of macroeconomic performance on SME performance ..................................................................... 57
3.2 INTERNATIONALISATION OF SMES ......................................................................................................................... 60
3.2.1 General discussion of the internationalisation of SMEs ................................................................................ 60
3.2.2 European SMEs’ overall propensity to export ................................................................................................ 63
3.2.3 Key facts about the involvement of SMEs in export-oriented industries ....................................................... 65
3.2.4 Impact of increase in foreign demand on economic sectors of key importance for SMEs ............................. 68
3.2.5 Implications of analysis of internationalisation of SMEs ............................................................................... 69
3.3 HIGH TECH MANUFACTURING AND KNOWLEDGE INTENSIVE SERVICE SMES: DRIVERS OF INNOVATION AND GROWTH? ................ 70
3.3.1 SMEs in high tech manufacturing and knowledge intensive services in 2013 in EU28 .................................. 70
3.3.2 Performance of EU28 SMEs high tech manufacturing and knowledge intensive services from 2009 to
2012 ....................................................................................................................................................................... 73
3.3.3 Statistical analysis ......................................................................................................................................... 74
3.3.4 Implications of statistical findings ................................................................................................................. 76
4 CONCLUSIONS ..................................................................................................................... 77
4.1 KEY FINDINGS ................................................................................................................................................... 77
4.2 CONCLUSIONS AND POLICY RECOMMENDATIONS ....................................................................................................... 78
ANNEXES .................................................................................................................................. 80
I. DISTRIBUTION AND IMPORTANCE OF SMES ACROSS EU28 MEMBER STATES AND SECTORS IN 2013 81
II. DISTRIBUTION AND PERFORMANCE OF SMES BY SIZE CLASS, 2008-2013 .................................... 86
5 ANNUAL REPORT ON EUROPEAN SMES 2013/2014: A PARTIAL AND FRAGILE RECOVERY
III. PERFORMANCE OF SMES IN 2012-2013 IN EU28 MEMBER STATES ............................................. 87
IV. DEGREE OF RECOVERY OF THE SMES IN DIFFERENT MEMBER STATES, 2008-2013 IN EU28 MEMBER
STATES ...................................................................................................................................... 89
V. CONTRIBUTIONS TO EU28 PERFORMANCE, 2008-2013 ............................................................ 91
VI. DISTRIBUTION OF SMES ACROSS SIZE CLASSES IN FIVE KEY SECTORS, 2013 EU28 ...................... 93
VII. GROWTH FORECASTS OF SMES IN EU28 MEMBER STATES ........................................................ 94
VIII. DEGREE OF RECOVERY OF SMES BY SECTOR IN EU28 MEMBER STATES, 2008-2013 .................. 99
IX. PERFORMANCE OF SMES IN FIVE KEY SECTORS IN EU28 MEMBER STATES ................................. 101
X. PERFORMANCE BY SIZE CLASS IN FIVE KEY SECTORS IN EU28 .................................................. 107
XI. INTERNATIONALISATION OF SMES – SECTOR EXPORT INTENSITY LEVELS .................................. 108
XII. INDEX OF FIGURES ............................................................................................................. 115
XIII. INDEX OF TABLES ............................................................................................................. 118
ENDNOTES ................................................................................................................................. 120

6 ANNUAL REPORT ON EUROPEAN SMES 2013/2014: A PARTIAL AND FRAGILE RECOVERY
EXECUTIVE SUMMARY
Background There can be no doubt that Small and Medium-sized Enterprises (SMEs) have had to navigate a difficult economic terrain in recent years. This Annual Report on the economic performance of European SMEs, now in its fifth year, is a testament to those challenges – but also a window to the progress achieved by businesses across the EU28 in spite of these challenging economic conditions. It is also a reflection of the structural support channelled to SMEs by the European Commission and National Governments under the guise of the Small Business Act (SBA). Adopted in 2008, the SBA reflects the importance and centrality of SMEs to the European economy. It could have not come at a more critical time. SMEs were in some ways a bulwark against the devastating effects of the global financial crisis. They weathered the 2009 economic downturn more resiliently than their large enterprise counterparts and mitigated the economy-wide decline in employment. Yet once the darkest days of the economic crisis were overcome, it was the large businesses that since 2010 to lead the recovery, fuelled mainly by strong growth in gross value added. The recovery of SMEs was much slower and its pace has slowed in the last three years, mirroring to a large extent the pace of the recovery of large enterprises during that period. Now, after promising signs last year, SMES are at a critical juncture. While there are some reasons for cautious optimism, the inescapable conclusion is that conditions remain extremely tough for SMEs and further support is needed to yield sustainable SME growth.
A closer look at 2013 Across the EU28 last year, some 21.6 million SMEs in the non-financial business sector employed 88.8 million people and generated €3,666 trillion in value added. Expressed another way, 99 out of every 100 businesses are SMEs, as are 2 in every 3 employees and 58 cents in every euro of value added. This illustrates how critical SMEs are and reflects the value of the present report. The level of value added generated by these SMEs increased
overall by 1.1% in 2013. However this positive trajectory is tempered by two ancillary points: firstly, a slowdown in this increase from the two previous years, when it was 1.5% (2012) and 4.2% (2011); and secondly a decline in 2013 in both the total number of SMEs (-0.9%) and the number of people employed by SMEs (-0.5%).
7 ANNUAL REPORT ON EUROPEAN SMES 2013/2014: A PARTIAL AND FRAGILE RECOVERY
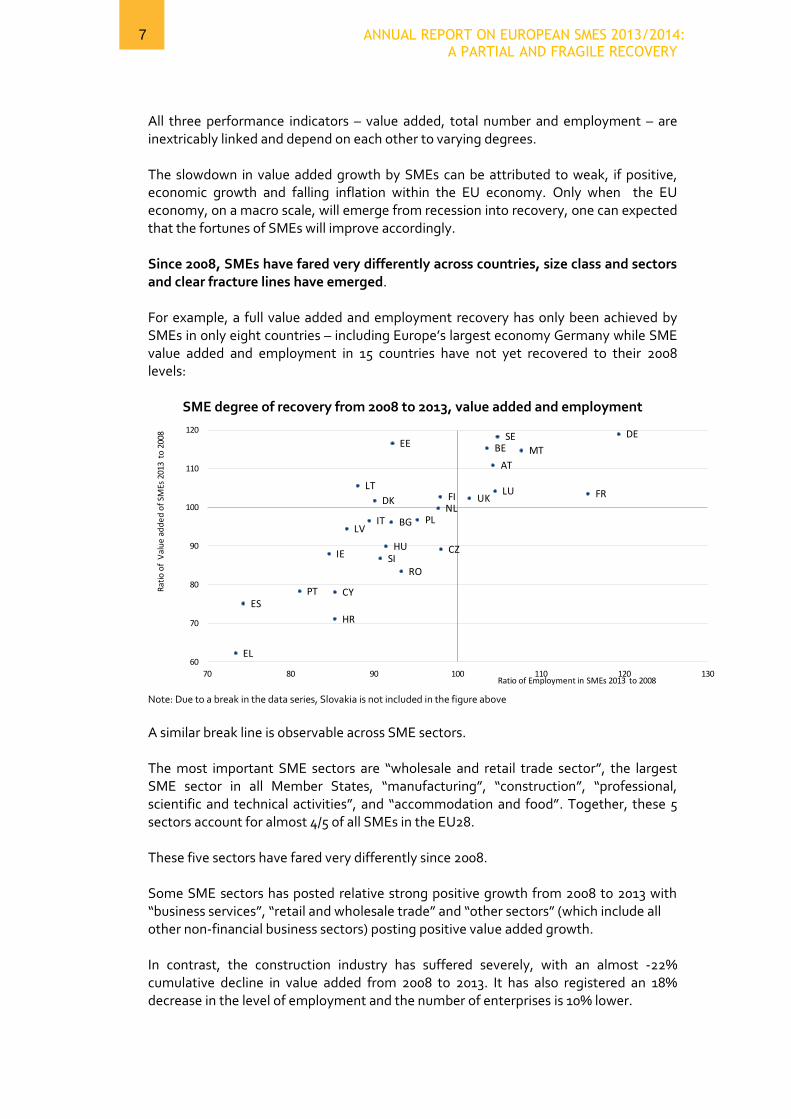
All three performance indicators – value added, total number and employment – are inextricably linked and depend on each other to varying degrees. The slowdown in value added growth by SMEs can be attributed to weak, if positive, economic growth and falling inflation within the EU economy. Only when the EU economy, on a macro scale, will emerge from recession into recovery, one can expected that the fortunes of SMEs will improve accordingly. Since 2008, SMEs have fared very differently across countries, size class and sectors and clear fracture lines have emerged. For example, a full value added and employment recovery has only been achieved by SMEs in only eight countries – including Europe’s largest economy Germany while SME value added and employment in 15 countries have not yet recovered to their 2008 levels:
SME degree of recovery from 2008 to 2013, value added and employment
Note: Due to a break in the data series, Slovakia is not included in the figure above
A similar break line is observable across SME sectors. The most important SME sectors are “wholesale and retail trade sector”, the largest SME sector in all Member States, “manufacturing”, “construction”, “professional, scientific and technical activities”, and “accommodation and food”. Together, these 5 sectors account for almost 4/5 of all SMEs in the EU28. These five sectors have fared very differently since 2008. Some SME sectors has posted relative strong positive growth from 2008 to 2013 with “business services”, “retail and wholesale trade” and “other sectors” (which include all other non-financial business sectors) posting positive value added growth. In contrast, the construction industry has suffered severely, with an almost -22% cumulative decline in value added from 2008 to 2013. It has also registered an 18% decrease in the level of employment and the number of enterprises is 10% lower.
AT
BE
BG
CY
CZ
DE
DK
EE
EL
ES
FI FR
HR
HUIE
IT
LT LU
LV
MT
NLPL
PT
RO
SE
SI
UK
60
70
80
90
100
110
120
70 80 90 100 110 120 130
Rat
io o
f V
alu
e a
dd
ed
of
SMEs
201
3 to
200
8
Ratio of Employment in SMEs 2013 to 2008

8 ANNUAL REPORT ON EUROPEAN SMES 2013/2014: A PARTIAL AND FRAGILE RECOVERY
The manufacturing sector also continued to operate in 2013 well below 2008 levels, with employment in 2013 still 10% below its 2008 level.
Change (in %) in three SME indicators from 2008 to 2013 in the EU28– key SME sectors
The level of recovery is also quite varied SMEs of different size: while there are more micro firms than there were in 2008 (+0.3%), small and medium firms are respectively 1.6% and 2.5% less numerous than they were before the crisis. The recovery in value added is for the most part driven by medium enterprises (+2.7%) and micro firms (+0.5%), while small firms are still lagging behind with value added in 2013 just below its 2008 levels. In terms of employment, all groups of SME firms are in 2013 still well below 2008, with micro firms employing 4.2% fewer people.
Internationalisation of SMEs It is important to note that while the prospects for SME success are tied with macro-economic developments, they by no means identically mirror all of them. As the majority of SMEs operate in sectors that serve domestic demand, for example, they did not share in the benefits of increased foreign demand, which was the key macro-economic driver of growth from 2008 to 2013. Many SMEs are not in export-oriented sectors, particularly the micro and small enterprises. Thus, programmes supporting SME exports benefit directly only a sub-set of SMEs. However, indirectly, all SMEs benefit to some extent from growth in exports as higher exports raises a) overall income levels, and hence the demand for goods and services sold by domestic demand facing SMEs, and b) the demand for goods and services originating from exporting-oriented enterprises.
-5.3
-10.1
-1.8
1.2
10.2
4.9
-2.9
-21.7
3.1
10.4
7.0
10.3
-9.9
-18.0
-0.2
6.0 5.4 5.6
Man
ufa
ctu
rin
g
Co
nst
ruct
ion
Trad
e
Acc
om
mo
dat
ion
/fo
od
Bu
sin
ess
S.
Oth
ers
Man
ufa
ctu
rin
g
Co
nst
ruct
ion
Trad
e
Acc
om
mo
dat
ion
/fo
od
Bu
sin
ess
S.
Oth
ers
Man
ufa
ctu
rin
g
Co
nst
ruct
ion
Trad
e
Acc
om
mo
dat
ion
/fo
od
Bu
sin
ess
S.
Oth
ers
Number of enterprises Value Added Employment
9 ANNUAL REPORT ON EUROPEAN SMES 2013/2014: A PARTIAL AND FRAGILE RECOVERY
Yet in an increasingly internationalised world, there are competitive advantages for those businesses that begin with a global strategy and can move quickly to take advantage of cross-border activities. Providing further, tailored support for this growing asset class would form a key step in allowing SMEs to leverage the benefits of increased foreign demand for goods and services.
The road ahead Looking ahead, there is a positive outlook and the promise of a strengthening of the recovery on the horizon. Total value added generated by SMEs has already surpassed its pre-crisis level and is now expected to rise by 2.8% in 2014 and 3.4% in 2015. Employment is also expected to rise, with another 740,000 jobs in SMEs, as is the total number of SMEs (+0.38%), by 2015. Improvements in EU SME´s performance depend critically on the further evolution of the macro-economic recovery. However, specific measures for improving the SMEs business environment play an important enabling role to ensure that SMEs are able to reap the full benefits of a return to solid and sustainable macroeconomic growth. At the centre of this is the continued work on the Small Business Act´s (SBA) five foundations: responsive administration, access to finance, access to markets/internationalisation, entrepreneurship, and skills & innovation. Policy implications here would range from reducing administrative costs and elevating SMEs’ status as a political priority through national SBA strategies, to supporting the establishment of an SME stock market exchange, assisting with the digitisation of SME practices such as e-payments, and advocating the mandatory inclusion of entrepreneurship education in national school curricula and public universities.

10 ANNUAL REPORT ON EUROPEAN SMES 2013/2014: A PARTIAL AND FRAGILE RECOVERY
1 INTRODUCTION Small and Medium-sized Enterprises (SMEs) form the backbone of a country’s economy. Across the EU28, there were 21.2 million SMEs in the non-financial business sector1 in 2013. SMEs account for 99.8% of all enterprises in this particular sector, 66.8% of total employment and 57.9% of total value added generated by the non-financial
business sector. SMEs are defined as businesses which employ less than 250 staff and have an annual turnover of less than €50 million and / or their balance sheet total is less than €43 million.2 They comprise three categories – micro, small and medium – which are defined as follows.
Table 1: Definition of SMEs
Company category
Employees Turnover or Balance sheet total
Micro <10 < € 2 million < €2 million
Small <50 < €10 million < € 10 million
Medium <250 < €50 million < €43million Note: The size-class definition adopted throughout the report is based on the definitions used in the Structural Business Statistics (SBS) database maintained by Eurostat. It relates to the number of persons employed.
The present report on the state of European SMEs published by EC DG Enterprise and Industry is an integral part of the annual SME Performance Review.
1.1 SME Performance Review The SME Performance Review, conducted on an annual basis, is one of the main tools the European Commission uses to monitor and assess countries' progress in implementing the Small Business Act (SBA). The SBA strives to foster SME development and remove obstacles to SME growth. It does not constitute a legal requirement, but a series of guidance measures that can be

11 ANNUAL REPORT ON EUROPEAN SMES 2013/2014: A PARTIAL AND FRAGILE RECOVERY
idiosyncratically adapted to suit each country’s specific needs while simultaneously achieving a degree of harmonisation across the EU. The ten principles are:
1. Entrepreneurship: Creating an environment in which entrepreneurs and family businesses can thrive and entrepreneurship is rewarded.
2. Second Chance: Ensuring that honest entrepreneurs who have experienced bankruptcy are promptly given a second opportunity to succeed.
3. Think Small First: Designing rules modelled on the “Think Small First” principle.3
4. Responsive Administration: Making public administrations responsive to the needs of SMEs.
5. State Aid and Public Procurement: Adapting public policy tools to suit SME needs - facilitating SMEs’ participation in public procurement and ensuring better access to State Aid for SMEs.
6. Access to Finance: Facilitating SMEs’ access to finance and developing a legal and business environment conducive to the specific requirements of SMEs, including timely payments in commercial transactions.
7. Single Market: Helping SMEs to benefit more from the opportunities offered by the Single Market.
8. Skills and Innovation: Promoting the enhancement of skills in the SME workforce and all forms of innovation.
9. Environment: Enabling SMEs to transform environmental challenges into economic opportunities while acting sustainably.
10. Internationalisation: Encouraging SMEs to benefit from the growth of global markets and supporting them in this pursuit.
The SME Performance Review brings together comprehensive information on the policy activity to implement the SBA and the economic performance of SMEs in EU28 Member States, as well as 9 other partner countries.4 The main outputs of the review process are the present Annual Report on European SMEs, the Summary Paper on the SBA implementation, the SME policy database and the SBA country fact sheets.
1.2 Scope and objectives of the report The report consists of four chapters that aim to collectively illustrate the SME landscape, highlight the factors behind SME performance, consider the increasing globalisation of SMEs, and set out recommendations for further improvements in the sector. Chapter 1 begins by introducing the report and contextualising the Performance Review. Chapter 2 considers the state of the SME sector in 2013; the performance of SMEs in 2013 and over the period 2008 to 2013; the business environment that SMEs are currently facing in the EU, and the outlook for SMEs in 2014 and 2015. Chapter 3 analyses a number of factors explaining differences in SME performance across Member States and economic sectors. The chapter focuses in particular on the macro-economic environment, the internationalisation of SMEs and the development of the SME sector in high-tech manufacturing and knowledge intensive services.

12 ANNUAL REPORT ON EUROPEAN SMES 2013/2014: A PARTIAL AND FRAGILE RECOVERY
Finally, chapter 4 highlights a few key conclusions and puts forward a list of recommendations. These are designed to improve structural support for SMEs and enhance their prospects for success.

13 ANNUAL REPORT ON EUROPEAN SMES 2013/2014: A PARTIAL AND FRAGILE RECOVERY
2 THE RECENT PERFORMANCE OF SMEs AND THE OUTLOOK FOR 2014 AND 2015
Three key performance indicators are used in the report: the number of SMEs, the value added (in current prices5) generated by SMEs and the number of persons employed by the SMEs. Some of the main factors explaining differences in the performance of the SME sector across the EU28 are discussed in chapter 3.
The first section presents a broad snapshot of SMEs in the non-financial business sector in the EU28 in 2013, and reviews post-2008 trends. The second section highlights some aspects of the business environment in which the SMEs operate in the EU28, while the third section describes the outlook for SMEs in 2014 and 2015. Finally, the fourth section reviews recent SME trends in the candidate countries, the USA, Japan and the BRICS.

14 ANNUAL REPORT ON EUROPEAN SMES 2013/2014: A PARTIAL AND FRAGILE RECOVERY
2.1 Recent performance of SMEs in the EU
2.1.1 SMEs in the EU28 in 2013 21.6 million SMEs employed 88.8 million people6 and generated €3,666 trillion in value added7 in the non-financial business sector in 2013 in the EU28. This is equivalent to 28% of EU28 GDP.
Overall, SMEs accounted for 99.8% of all enterprises active in the EU28 non-financial business sector, 66.8% of total employment and 58.1% of the value added (Table 2). Micro-enterprises accounted for 92.4% of all enterprises in the EU28 non-financial business sector. However, the distribution of employment and value added across the three groups of SMEs was more equal, with micro, small and medium enterprises accounting for 43%, 31% and 26% of EU28 SME
employment, respectively, and 37%, 31% and 32% of value added generated by SMEs in the EU28 non-financial business sector.
KEY FINDINGS
SMEs are integral to job growth, employing 88.8 million people in 2013 in the EU28
€3,666 trillion in valued added generated by SMEs in 2013 in the EU28 (28% of EU28 GDP)
Non-financial business sector dominated by SMEs in terms of number of enterprises
Difficult economic conditions for SMEs overall:
o SME value added in 2013 was just 1% above 2008 levels in the EU28 o Employment in 2013 still 2.6% below levels registered in 2008 in the
EU28
The performance of SMEs varies considerably among size classes, sectors
and Member States
o Micro SMEs suffered biggest decline in total number and number of employees between 2008 and 2013 in the EU28
o Construction and manufacturing value added in 2013 still below 2008 levels (-21.7%, -2.9%) in the EU28
o SMEs sectors in only a limited number of Member States have exceeded in 2013 their 2008 pre-crisis performance
/api/stylesheets/30?nofonts=1
88.8 millionNumber of peopleemployedbySMEs
Createinfographics
/api/stylesheets/30?nofonts=1
€3,666 trillionAmount of valueaddedgeneratedbySMEs(equivalent to28%of EUGDP)
Createinfographics

15 ANNUAL REPORT ON EUROPEAN SMES 2013/2014: A PARTIAL AND FRAGILE RECOVERY
Table 2: SMEs and large enterprises: number of enterprises, value added and employment in the EU28 in 2013
Micro Small Medium SMEs Large Total Number of enterprises
Number 19,969,338 1,378,374 223,648 21,571,360 43,517 21,614,908
% 92.4% 6.4% 1.0% 99.8% 0.2% 100%
Employment
Number 38,629,012 27,353,660 22,860,792 88,843,464 44,053,576 132,897,040
% 29.1% 20.6% 17.2% 66.9% 33.1% 100%
Value added at factor costs
Million Euros 1,362,336 1,147,885 1,156,558 3,666,779 2,643,795 6,310,557
% 21.6% 18.2% 18.3% 58.1% 41.9% 100% Source: Eurostat, National Statistical Offices and DIW Econ
In the non-financial business sector in the EU28, the six largest Member States (France, Germany, Italy, Poland, Spain and United Kingdom) account for almost:
66% of all SMEs (Figure 55, Annex I);
74% of value added generated by SMEs (Figure 56, Annex I);
69% of total SME employment (Figure 57, Annex I).
The share of the micro SMEs in the total number of SME enterprises ranges from 82% in Germany to 96% in the Czech Republic, Greece, and Slovakia (see annex III of the statistical background document for detailed information). Five key economic sectors account for approximately 78% of all SMEs in the EU28: “manufacturing”, “construction”, “professional, scientific and technical activities”, “accommodation and food” and “wholesale and retail trade, repair of motor vehicles and motorcycles”8 (Figure 1). The same five sectors also account for roughly 71% of the value added created by SMEs in the EU28 and for 79% of total EU28 SME employment (Figure 1).

16 ANNUAL REPORT ON EUROPEAN SMES 2013/2014: A PARTIAL AND FRAGILE RECOVERY
Figure 1: Importance of the five key sectors in the SME sector in Member States –2013
Note: Share of SME enterprises in total SME population, share of valued added generated by SME population and share of total employment by SME population. Five key sectors include manufacturing”, “construction”, “accommodation and food services”,“professional, scientific and technical activities”, and “wholesale and retail trade, repair of motor vehicles and motorcycles”. Source: Eurostat, National Statistical Offices and DIW Econ
Among the five key sectors, the retail/wholesale sector is the largest in almost all EU Member States (Figure 58,
Annex I).
2.1.2 Performance in 2013 of SMEs in the EU28 non-financial business sector
Broad macroeconomic conditions in 2013
Even though overall economic conditions improved marginally in 2013, the overall macro-economic environment continues to be very challenging for SMEs (Figure 2).
Figure 2: Evolution of EU28 GDP and EU28 value added of non-financial business sector (annual percentage change)
Note: Slovakia is not included in the value added aggregate due to a break in the series.
Source: Eurostat, National Statistical Offices, DIW Econ
DKLV
EEFI
UK
SE
PT
HU
LU
DE
IE
MT
ATEU28
FRPLSI
ES
NL
BE
RO
BG
LT
HR
CZ
IT
ELCY
SK
Number of enterprises Value added
Employment
-10.0
-8.0
-6.0
-4.0
-2.0
0.0
2.0
4.0
6.0
8.0
2009 2010 2011 2012 2013
Annu
al pe
rcen
tage
chan
ge
GDP, current prices GDP, constant prices Non-financial business sector value added, current prices

17 ANNUAL REPORT ON EUROPEAN SMES 2013/2014: A PARTIAL AND FRAGILE RECOVERY
Of particular importance for SMEs is the fact that economy-wide growth in 2013 was very subdued (Figure 3).
Figure 3: Change (in %) in EU28 GDP and EU28 value added of non-financial business sector from 2012 to 2013
Note: Slovakia is not included in the EU value added aggregate due to a break in the series. GDP at constant prices is in
chain-linked volumes
Source: Eurostat, National Statistical Offices, DIW econ
Performance of the EU28 SME sector in 2013
The rate of expansion of the value added generated by SMEs in the
EU28 non-financial business sector slowed again in 2013, falling to
1.1% in 2013 from 1.5% in 2012 and 4.2% in 2011 (Figure 4 and
Table 12, Annex II).
This slowdown in growth reflects a combination of positive but weak economic growth and falling inflation in the EU economy more generally. In contrast, both the number of SME enterprises and SME employment in the non-financial business sector fell respectively by 0.9% and 0.5% in 2013 after having already recorded a decline in 2012.
Figure 4: Number of SMEs in the non-financial business sector, value added generated by these SMEs and number of persons employed by these SMEs -
EU28, 2008 to 2013 (2008=100)
Note: Slovakia is not included in this EU aggregate due to a break in the series. Source: Eurostat, National Statistical Offices, DIW Econ
0.8%
0.1%
0.6%
GDP, current prices GDP, constant prices Non-financial business sector value added, current prices
85
90
95
100
105
2008 2009 2010 2011 2012 2013
Enterprises (2008=100) Gross Value Added of SMEs (2008=100)
Employment in SMEs (2008=100)
/api/stylesheets/30?nofonts=1
+ 1.1%Valueadded
- 0.9%Number of enterprises
- 0.5%Employment
Createinfographics

18 ANNUAL REPORT ON EUROPEAN SMES 2013/2014: A PARTIAL AND FRAGILE RECOVERY
Performance of SMEs in 2013 by size class At the level of the EU28, micro SMEs posted an increase in value added that was almost twice as large as small and medium-sized SMEs in 2013 (1.5% for micro SMEs versus 0.7% and 0.9% for small and medium sized SMEs) (Figure 5). However, micro SMEs fared somewhat less well than small and medium-sized SMEs in terms of number and jobs:
The number of micro SMEs fell by 0.9% in 2013 while that of small and medium-sized SMEs declined only very marginally (-0.4% and -0.4% respectively);
Mirroring the drop in the number of micro SMEs, EU28 employment by micro SME dropped by 1% while employment at small and medium-sized SMEs remained practically unchanged.
Figure 5: Annual growth (in %) in different performance indicators by SME size - EU28
Number of Enterprises
Value Added
Employment
Note: Slovakia is not included in this EU aggregate due to a break in the series. Source: National Statistical Offices, Eurostat, DIW econ
-3%
-2%
-1%
0%
1%
2%
3%
2008-2009 2009-2010 2010-2011 2011-2012 2012-2013
Micro Small Medium
-12%
-10%
-8%
-6%
-4%
-2%
0%
2%
4%
6%
2008-2009 2009-2010 2010-2011 2011-2012 2012-2013
Micro Small Medium
-3%
-2%
-2%
-1%
-1%
0%
1%
1%
2008-2009 2009-2010 2010-2011 2011-2012 2012-2013
Micro Small Medium
19 ANNUAL REPORT ON EUROPEAN SMES 2013/2014: A PARTIAL AND FRAGILE RECOVERY
However, even if the performance of micro SMEs and other SMEs differed somewhat in 2013, the composition by class size of the SME in the EU28 non-financial business sector has barely changed overall from 2008 to 2013 (Table 13, Annex II). Performance of SMEs in 2013 by Member State Between 2012 and 2013, only a limited number of Member States registered positive trends in two or three performance indicators (Table 14, Annex III):
SMEs in the non-financial business sector in Lithuania, Latvia, Malta, and Romania, posted a positive and strong performance in terms of number of firms, employment and value added, with gains higher than 3%;
SMEs in Germany, Estonia, Denmark, Austria, Luxembourg and Sweden also shared this positive trend but with smaller growth rates (between 0.5% and 3%);
In a group of four other countries (the United Kingdom, Ireland, Hungary and the Czech Republic), growth of value added generated by SMEs in the non-financial business sector was sluggish (or stable, ranging between -0.05% and 0.05%) and employment and number of enterprises grew;
SMEs in the Netherlands, Finland, Greece, and Cyprus posted a negative performance in all three indicators under scrutiny, with growth rates between -0.05% and -3% in the former two countries, and below -3% for the latter. Croatia also falls in this group in terms of employment and value added growth but not in terms of number of enterprises;
Finally, SMEs in the non-financial business sector in Belgium, Italy, Poland, Slovakia, France, Spain and Slovenia posted moderate growth in value added (below 3%) and recorded declines in terms of number of SMEs or persons employed ranging between -0.05% and -3%.
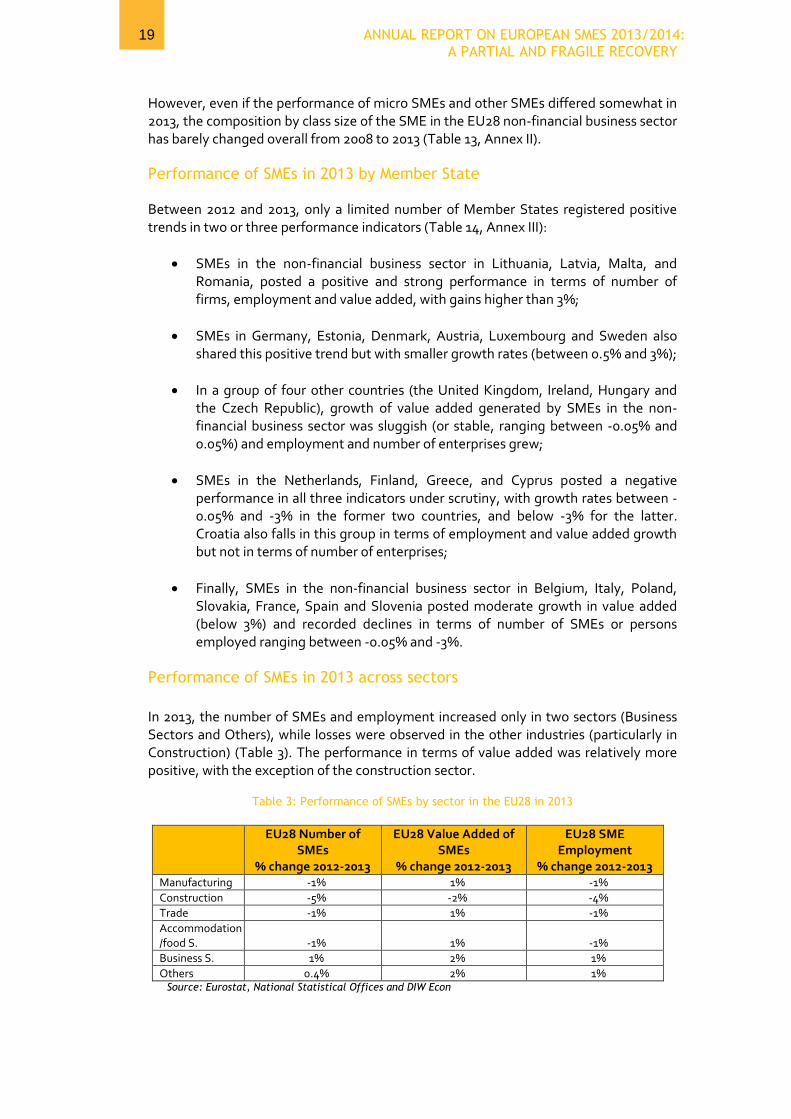
Performance of SMEs in 2013 across sectors
In 2013, the number of SMEs and employment increased only in two sectors (Business Sectors and Others), while losses were observed in the other industries (particularly in Construction) (Table 3). The performance in terms of value added was relatively more positive, with the exception of the construction sector.
Table 3: Performance of SMEs by sector in the EU28 in 2013
EU28 Number of SMEs
% change 2012-2013
EU28 Value Added of SMEs
% change 2012-2013
EU28 SME Employment
% change 2012-2013 Manufacturing -1% 1% -1%
Construction -5% -2% -4%
Trade -1% 1% -1%
Accommodation/food S. -1% 1% -1%
Business S. 1% 2% 1%
Others 0.4% 2% 1% Source: Eurostat, National Statistical Offices and DIW Econ
20 ANNUAL REPORT ON EUROPEAN SMES 2013/2014: A PARTIAL AND FRAGILE RECOVERY
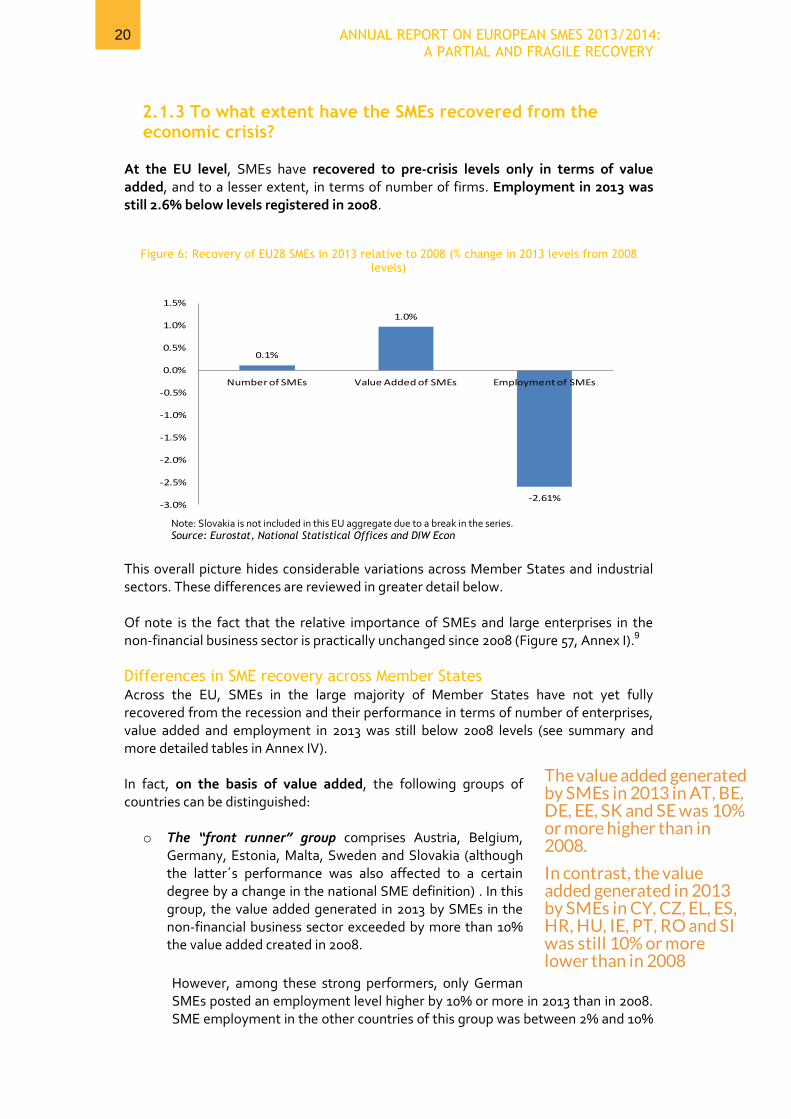
2.1.3 To what extent have the SMEs recovered from the economic crisis?
At the EU level, SMEs have recovered to pre-crisis levels only in terms of value added, and to a lesser extent, in terms of number of firms. Employment in 2013 was still 2.6% below levels registered in 2008.
Figure 6: Recovery of EU28 SMEs in 2013 relative to 2008 (% change in 2013 levels from 2008 levels)
Note: Slovakia is not included in this EU aggregate due to a break in the series. Source: Eurostat, National Statistical Offices and DIW Econ
This overall picture hides considerable variations across Member States and industrial sectors. These differences are reviewed in greater detail below. Of note is the fact that the relative importance of SMEs and large enterprises in the non-financial business sector is practically unchanged since 2008 (Figure 57, Annex I).9
Differences in SME recovery across Member States Across the EU, SMEs in the large majority of Member States have not yet fully recovered from the recession and their performance in terms of number of enterprises, value added and employment in 2013 was still below 2008 levels (see summary and more detailed tables in Annex IV). In fact, on the basis of value added, the following groups of countries can be distinguished:
o The “front runner” group comprises Austria, Belgium, Germany, Estonia, Malta, Sweden and Slovakia (although the latter´s performance was also affected to a certain degree by a change in the national SME definition) . In this group, the value added generated in 2013 by SMEs in the non-financial business sector exceeded by more than 10% the value added created in 2008.
However, among these strong performers, only German SMEs posted an employment level higher by 10% or more in 2013 than in 2008. SME employment in the other countries of this group was between 2% and 10%
0.1%
1.0%
-2.61%-3.0%
-2.5%
-2.0%
-1.5%
-1.0%
-0.5%
0.0%
0.5%
1.0%
1.5%
Number of SMEs Value Added of SMEs Employment of SMEs

21 ANNUAL REPORT ON EUROPEAN SMES 2013/2014: A PARTIAL AND FRAGILE RECOVERY
higher with the exception of Estonia where SME employment was 8% lower in 2013 than in 2008;
o The solid performer group comprises Finland, France, Lithuania, Luxembourg
and UK. In these countries, the level of value added generated by SMEs in the non-financial business sector was between 2% and 10% higher in 2013 than in 2008.
In contrast to the employment performance of the strong performer group, the employment performance of the solid performer group is much more mixed;
o In France, SME employment was 16% higher in 2013 than in 2008 reflecting
strong growth in solo entrepreneurs over this period;
o In Luxembourg and the United Kingdom, SME employment in 2013 was 4% higher than in 2008;
o In Finland, the level of SME employment in 2013 was 3% lower than in 2008 and in Lithuania SME employment was down by 12% in 2013 relative to 2008.
The no change group includes only the Netherlands. It is the only country in which aggregate SME performance in 2013 was very close to that of 2008. The level of SME value added in 2013 was 1% lower than in 2008 and employment was down by 2%.
The group of weak performers includes Bulgaria, Denmark, Italy, Latvia and Poland. The level of value added generated by SMEs in the non-financial business sector in this group of countries was between 2% and 10% lower in 2013 than in 2008.
SME employment in the weak performers mirrored the decline in value added. SMEs in Bulgaria and Poland posted employment levels that are respectively 8% and 5% lower in 2013 than in 2008 while in Denmark, Italy and Latvia 2013 SME employment levels are down by 10%, 11% and 13%. o Finally, the group of very weak performers includes 10 countries: Croatia, Cyprus, Czech Republic, Hungary, Greece, Ireland, Portugal, Romania, Slovenia and Spain.
o In this group of countries the level of value added generated in 2013 by SMEs in the non-financial business sector was 10% (or more) lower than in 2008. The largest declines in SME value are observed in Romania (-17%), Greece (-38%) and Cyprus (-22%).
o In all these countries, except the Czech Republic, Romania and Slovenia, SME employment in 2013 was 10% (or more) lower than in 2008. In Romania and Slovenia employment was respectively down by 7% and 9% in 2013 relative to 2008 while in the Czech Republic employment was down by only 2%.
On average there is a relatively strong relationship between changes in the value added produced by SMEs and SME employment (Figure 7).The correlation between the percentage change from 2008 to 2013 in value added (at current prices) and employment over the same period is 0.79. Adjusting value added for inflation has practically no impact on the estimated correlation, as the value of the correlation coefficient is 0.74.

22 ANNUAL REPORT ON EUROPEAN SMES 2013/2014: A PARTIAL AND FRAGILE RECOVERY
Figure 7: Relationship between changes (in %) from 2008 to 2013 in EU28 SME value added (at current and constant prices) and EU28 SME employment
Source: Eurostat, National Statistical Offices, Eurostat, DIW Econ
Differences in SME recovery across sectors
The EU28 construction SME sector, which accounts for 11% of SME value added and 12% of SME jobs, suffered a severe cumulative decline from 2008 to 2013 with the level of value added in 2013 being 21.7% lower than in 2008, the level of employment 18% lower and the number of enterprises 10.1% lower (Figure 8). The EU28 manufacturing SME sector is also still operating at well below 2008 levels with value added down by 2.9% in 2013 relative to 2008, the level of employment down by 9.9% and the number of enterprises down by 5.3%. Today, this sector employs more than 17 million individuals and generates 21% of SME value added in Europe. The value added of the EU28 retail and wholesale SME sector increased by 3.1% while employment and the number of enterprises is broadly flat over the 2008 to 2013 period; this industry alone employs 26% of the SME labour force and accounts for 22% of value added produced by EU SMEs. In contrast, the EU28 SME business services sector (and the “other” EU28 SME sector) expanded substantially between 2008 and 2013 with the level of value added up 7% in 2008 relative to 2013, the level of employment up by 5.4% and the number of enterprises up by 10.2%. Today, business services produce roughly 13% of SME value added and employ about 9 Million people (11%), while the other industries offer more than 18 million SME jobs and account for 29% of SME value added.
AT BE
BG
CY
CZ
DE
DKEE
EL ES
FI
FR
HR
HU
IE
IT LT
LU
LV
MT
NL
PL
PT
RO
SE
SI
-40%
-30%
-20%
-10%
0%
10%
20%
-50% -40% -30% -20% -10% 0% 10% 20% 30%
Chan
ge in
SM
E em
ploy
men
t,
2008
-201
3
Change in real SME value added, 2008-2013
AT BE
BG
CY
CZ
DE
DKEE
EL ES
FI
FR
HR
HU
IE
IT LT
LU
LV
MT
NL
PL
PT
RO
SE
SI
-40%
-30%
-20%
-10%
0%
10%
20%
-50% -40% -30% -20% -10% 0% 10% 20% 30%
Chan
ge in
SM
E em
ploy
men
t (2
008-
2013
)
Change in nominal SME value added, 2008-2013

23 ANNUAL REPORT ON EUROPEAN SMES 2013/2014: A PARTIAL AND FRAGILE RECOVERY
Finally, the accommodation/food EU28 SME sector shows the strongest growth (10.4% in value added and 6.0% in employment) among the five specific sectors highlighted in the present analysis.
Figure 8: The performance of EU28 SMEs in various economic sectors, percentage change from 2008 to 2013
Note: Slovakia is not included in this EU aggregate due to a break in the series. The name “Business S.” is used as abbreviation of the NACE category M “Professional/scientific/technical activities”, and “Trade” refers to G “Wholesale/retail trade/repair of motor vehicles/motorcycles”. Categories in “Others” refer to sections of NACE Rev.2 classifications: B, D, E, H, J, L, and N. Source: Eurostat, National Statistical Offices and DIW Econ
In terms of the evolution of EU28 SME value added and employment in the various sub-sectors of the non-financial business sector, it is interesting to note that the performance of medium-sized SMEs differs somewhat from that of micro and small SMEs.
In the EU28 construction sector, medium-sized SMEs show larger losses in value added and employment between 2008 and 2013 than micro and small SMEs;
In the EU28 manufacturing sector, value added generated by medium-sized SMEs was unchanged between 2008 and 2013 while it dropped by 5% and 6% respectively in the case of micro and small SMEs;
Medium SMEs benefited more than micro and small SMEs from the upswing in the EU28 in the demand for trade (retail and wholesale) services, business services and goods and services produced by the “other” sector.
This was mirrored by a somewhat larger increase in employment in the EU28 by medium-sized SMEs than by micro and small SMEs over the period 2008 to 2013 than in the case of trade (retail and wholesale) services and business services.
-5.3
-10.1
-1.8
1.2
10.2
4.9
-2.9
-21.7
3.1
10.4
7.0
10.3
-9.9
-18.0
-0.2
6.0 5.4 5.6
Man
ufac
turi
ng
Cons
truc
tion
Trad
e
Acc
omm
odat
ion/
food
Busi
ness
S.
Oth
ers
Man
ufac
turi
ng
Cons
truc
tion
Trad
e
Acc
omm
odat
ion/
food
Busi
ness
S.
Oth
ers
Man
ufac
turi
ng
Cons
truc
tion
Trad
e
Acc
omm
odat
ion/
food
Busi
ness
S.
Oth
ers
Number of enterprises Value Added Employment

24 ANNUAL REPORT ON EUROPEAN SMES 2013/2014: A PARTIAL AND FRAGILE RECOVERY
2.1.4 How did the relative performance of the various SMEs’ segments contribute to the overall performance of SMEs in the EU28 from 2008 to 2013?
As a result of the performance trends described above, in the EU28 in 2013 there were 354,308 more SMEs than there were in 2008, value added posted a small net increase of 44,313.75 million Euros, and SMEs have lost 1,962,808 jobs. This section examines in gretare details how SMEs of different sizes, sectors and Member States contributed to the overall performance of the SME sector from 2008 to 2013. Analysis by class size The net increase in the overall number of SMEs in the EU28 from 2008 to 2013 is explained by the growth in the number of micro firms (Table 16,Annex V). Micro firms constitute the largest share of the SME population, and their importance since 2008 is virtually unchanged (Table 13, Annex II). Small and medium-sized SMES, on the other hand, dragged down the performance of the SME sector in terms of the number of SMEs. In contrast, medium-sized SMEs account for almost 2/3 of the total increase from 2008 to 2013 in the value added generated by SMEs in the EU28 while small SMEs did not contribute at all to the growth in SME value added, and micro SMEs account for 1/3 of the growth in valued added. The overall SME employment losses from 2008 to 2013 in the EU28 are accounted for mainly by by micro firms (by 65%) (where 43% of SME jobs are located) and to a lesser extent by medium-size firms (by 27%), while employment levels at small firms fell only slightly (Table 16, Annex V).
Analysis by sector Two sectors (Business services, such as legal, accounting or adversting services, and Others, including real estate activities and information and communication services) posted a sharp increase in the number of SMEs in the recent years (Table 17, Annex V) and account for the bulk of the overall increase in the number of SMEs in the EU28 from 2008 to 2013. These two industries, together with trade and accomodation/food contributed significantly to the small overall increase in EU28-wide value added generated by SMEs , while manufacturing and, especially, construction pulled down growth in SME value added from 2008 to 2013. A similar pattern is observed in terms of employment. Of note is the fact that the construction value added between 2008 and 20013 declined by up to 70% across SMEs in the EU28, and grew in only a handful of countries. The losses in manufacturing value added were relatively less stark (Figure 9).

25 ANNUAL REPORT ON EUROPEAN SMES 2013/2014: A PARTIAL AND FRAGILE RECOVERY
Figure 9: % change in value added of SMEs in the construction and manufacturing sector in the EU28 2008-2013
Source: Eurostat, National Statistical Offices, DIWecon
Analysis by country In terms of the relative contribution of individual Member States to the EU-wide performance of SMEs, the increase in the EU28 number of SMEs was driven for the most part by Germany, France, the Netherlands, Slovakia10, and to a lesser extent, Belgium, Czech Republic, Sweden and United Kingdom (Table 18,Annex V). The same countries (with the exception of the Czech Republic) also explain the small positive trend in EU28 SME value added while the depressed level of SME activity in Spain, Romania, Italy, Greece,Ireland, Croatia, Hungary dragged down growth in EU-wide SME value added. The decrease in the overall number of SME jobs in the EU28 is was driven by SME employment losses in Spain, Italy, Portugal,Poland, and Romania.
-70%
-50%
-30%
-10%
10%
30%Construction
-60%
-50%
-40%
-30%
-20%
-10%
0%
10%
20% Manufacturing

26 ANNUAL REPORT ON EUROPEAN SMES 2013/2014: A PARTIAL AND FRAGILE RECOVERY
2.2 The business environment for SMEs in
Europe
2.2.1 Issues faced by SMEs
This section focuses on the business environment in which EU SMEs operate. The discussion draws on a number of sources, among which reports by the Survey on Access to Finance of SMEs in the Euro Area (SAFE) survey data, and the 2014 Innobarometer.
The SAFE survey
Key issues and challenges currently faced by SMEs have been very insightfully detailed by the 2013 survey of access to finance of SMEs in the EU (SAFE)11, run jointly for the European Commission and the European Central Bank. The survey asks participants to rank and assess the seriousness of six potential problems:
Access to finance
Availability of skilled staff or experienced managers
Competition
Cost of production
Finding customers
Regulation
Existing reports12 on the survey focus mainly in the issue of access to finance. In contrast, the present section considers all the issues identified by SMEs and the link between these issues and actual SME performance. More detailed country-specific information is provided in Annex IX of the statistical background document.
Finding customers is the single most pressing problem facing SMEs across the EU28 in 2013, as reported by SMEs of all class sizes. This implies that demand is the most important factor in explaining the performance of SMEs in the past years. As will be shown in section 3.1, this is particularly true for the construction and manufacturing sector, as investment in capital goods and consumer spending are key demand factors for these industries.
All other issues rank broadly the same for SMEs as a whole. But, in some cases, clear differences emerge among SMEs according to class sizes (Figure 10):
Access to finance is a relatively more important issue for micro SMEs than for small and medium-size SMEs;
KEY FINDINGS
Marked variation in perceived business environment across countries
Gaining customers biggest concern for SMEs in current environment
Micro SMEs struggling most with accessing finance
Strong correlation between perception of problems and performance
27 ANNUAL REPORT ON EUROPEAN SMES 2013/2014: A PARTIAL AND FRAGILE RECOVERY
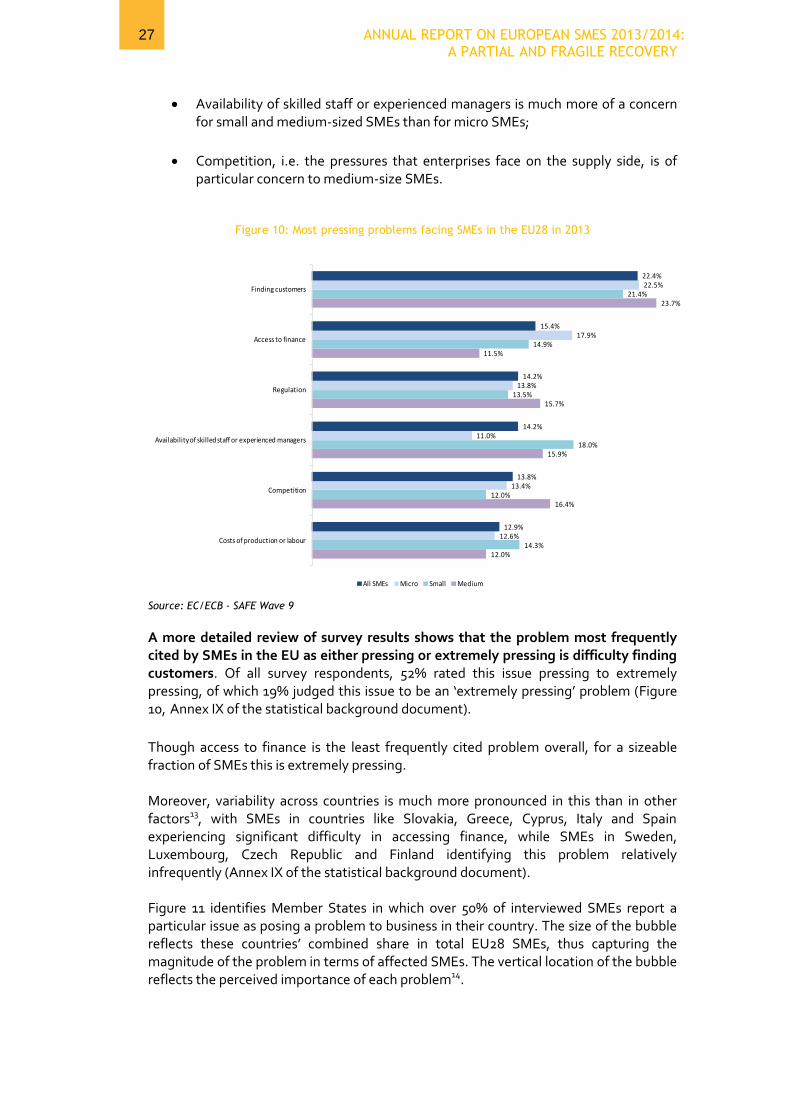
Availability of skilled staff or experienced managers is much more of a concern for small and medium-sized SMEs than for micro SMEs;
Competition, i.e. the pressures that enterprises face on the supply side, is of particular concern to medium-size SMEs.
Figure 10: Most pressing problems facing SMEs in the EU28 in 2013
Source: EC/ECB - SAFE Wave 9
A more detailed review of survey results shows that the problem most frequently cited by SMEs in the EU as either pressing or extremely pressing is difficulty finding customers. Of all survey respondents, 52% rated this issue pressing to extremely pressing, of which 19% judged this issue to be an ‘extremely pressing’ problem (Figure 10, Annex IX of the statistical background document).
Though access to finance is the least frequently cited problem overall, for a sizeable fraction of SMEs this is extremely pressing. Moreover, variability across countries is much more pronounced in this than in other factors13, with SMEs in countries like Slovakia, Greece, Cyprus, Italy and Spain experiencing significant difficulty in accessing finance, while SMEs in Sweden, Luxembourg, Czech Republic and Finland identifying this problem relatively infrequently (Annex IX of the statistical background document). Figure 11 identifies Member States in which over 50% of interviewed SMEs report a particular issue as posing a problem to business in their country. The size of the bubble reflects these countries’ combined share in total EU28 SMEs, thus capturing the magnitude of the problem in terms of affected SMEs. The vertical location of the bubble reflects the perceived importance of each problem14.
12.0%
16.4%
15.9%
15.7%
11.5%
23.7%
14.3%
12.0%
18.0%
13.5%
14.9%
21.4%
12.6%
13.4%
11.0%
13.8%
17.9%
22.5%
12.9%
13.8%
14.2%
14.2%
15.4%
22.4%
Costs of production or labour
Competition
Availability of skilled staff or experienced managers
Regulation
Access to finance
Finding customers
All SMEs Micro Small Medium

28 ANNUAL REPORT ON EUROPEAN SMES 2013/2014: A PARTIAL AND FRAGILE RECOVERY
Figure 11: Importance of problems facing SMEs within Member States, weighted by the proportion of EU SMEs per Member State
Note: The height of the bubble is constructed as the percentage of SMEs that cite each factor as a problem across the displayed Member States, weighted by the proportion of EU SMEs per Member State. This conveys the strength of the preception of a problem across the EU. The size of the bubble is the overall share of EU SMEs that declare the issue to be a pressing problem Source: EC/ECB - SAFE Wave 9
For example:
Finding customers is cited as a problem by over 50% of SMEs in 15 countries that account for 71% of all EU28 SMEs;
Access to finance, considered a pressing issue by a very large proportion of SMEs in Slovakia (70%), Greece (61%), Cyprus (62%), Italy (50%), and Spain (50%), concerns a relatively low share of SMEs at the EU28-level (32%);
Similarly, availability of skilled workers is a concern for over half of the respondents from seven countries that account for a relatively low share of EU SMEs (24%).
Once the size of the Member States’ economies is taken into account, the ranking of the issues changes, although finding customers remains by far the most important issue. This is followed by costs of production or labour, competition and regulation. Annex IX of the statistical background document provides the results of a statistical analysis examining the relationship between SME performance and the extent to which SMEs are concerned about structural factors (competition, access to finance, costs of production, availability of skilled workforce) and regulatory barriers, or cyclical factors i.e. weak demand (finding customers) and their economic situation in 2013 relative to 2008, before the recession of 2009. Key findings are summarised below. For most of the factors considered, higher SME concern is associated with worse SME performance in the period 2008-2013. This negative relationship is particularly marked in relation to access to finance and regulation.
Finding customers71%
Competition46%
Access to finance32%
Costs of production or labour
55%
Availability of skilled staff or experienced
managers24%
Regulation41%
0%
5%
10%
15%
20%
25%
30%
35%
40%
45%
50%
AT, CY, FR, DE, EL, IE, IT, LV, LT,
MT, NL, PL, PT, SK, ES
AT, CY, EL, HU, IE, IT, LV,
LT, MT, PL, RO, SK, ES
CY, EL, IT, SK,
ES
AT, BE, FR, EL, IT, MT,
PL, SK, ES
FR, IT, LV, PL,
SK, RO
AT, BE, DE, MT,
PL, SK,
29 ANNUAL REPORT ON EUROPEAN SMES 2013/2014: A PARTIAL AND FRAGILE RECOVERY
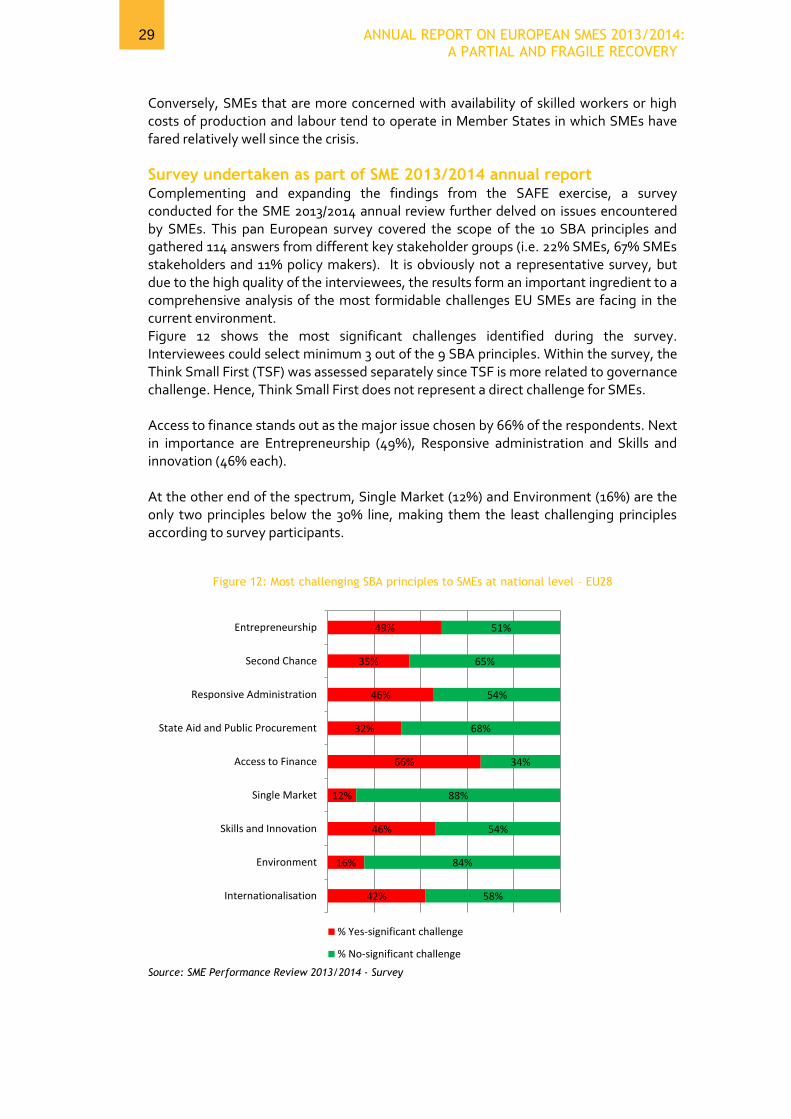
Conversely, SMEs that are more concerned with availability of skilled workers or high costs of production and labour tend to operate in Member States in which SMEs have fared relatively well since the crisis. Survey undertaken as part of SME 2013/2014 annual report Complementing and expanding the findings from the SAFE exercise, a survey conducted for the SME 2013/2014 annual review further delved on issues encountered by SMEs. This pan European survey covered the scope of the 10 SBA principles and gathered 114 answers from different key stakeholder groups (i.e. 22% SMEs, 67% SMEs stakeholders and 11% policy makers). It is obviously not a representative survey, but due to the high quality of the interviewees, the results form an important ingredient to a comprehensive analysis of the most formidable challenges EU SMEs are facing in the current environment. Figure 12 shows the most significant challenges identified during the survey. Interviewees could select minimum 3 out of the 9 SBA principles. Within the survey, the Think Small First (TSF) was assessed separately since TSF is more related to governance challenge. Hence, Think Small First does not represent a direct challenge for SMEs. Access to finance stands out as the major issue chosen by 66% of the respondents. Next in importance are Entrepreneurship (49%), Responsive administration and Skills and innovation (46% each). At the other end of the spectrum, Single Market (12%) and Environment (16%) are the only two principles below the 30% line, making them the least challenging principles according to survey participants.
Figure 12: Most challenging SBA principles to SMEs at national level – EU28
Source: SME Performance Review 2013/2014 - Survey
49%
35%
46%
32%
66%
12%
46%
16%
42%
51%
65%
54%
68%
34%
88%
54%
84%
58%
Entrepreneurship
Second Chance
Responsive Administration
State Aid and Public Procurement
Access to Finance
Single Market
Skills and Innovation
Environment
Internationalisation
% Yes-significant challenge
% No-significant challenge

30 ANNUAL REPORT ON EUROPEAN SMES 2013/2014: A PARTIAL AND FRAGILE RECOVERY
For each chosen principle, the interviewees were also asked to precise the particular challenges they found most significant, as detailed in Annex IX of the statistical background document.
Under Access to finance, the difficulty in accessing to bank credits or loans and the excessive bureaucratic procedures to access EU funds were identified as the main barriers.
Concerning Entrepreneurship, the lack of financial support measures was the main underlying barrier which also correlates to the access to finance.
For the Responsive administration, the administrative burden was pointed out, and more specifically the difficulty in managing all of the administrative requirements and requests from various authorities.
Finally, issues related to the Skills and innovation principle focused on the lack of strategic support in converting an innovative idea into a commercial product/process/service.
2014 Innobarometer Additional conclusions with regards to how these issues affecting SME performance can be drawn from the 2014 Innobarometer survey, which is devoted to the commercialisation of innovation. In particular, the survey results show that access to funding for R&D appears to be the main obstacle to the commercialisation of innovative products or services. When asked how important was public financial support in developing innovations, companies with turnover of 2 million euro or less (micro) are more likely to say that the assistance was important compared to companies with a higher turnover (51%-52% vs. 36%-44%). In contrast with this finding, medium SMEs (50-249 employees) are the least likely to say public financial assistance was important for developing their innovations (39% vs.46%-53%). Retail trade companies are the most likely to report that the assistance was important (55%), followed by those in services (50%), manufacturing (47%) and industry (36%).
2.2.2 Key findings from the 2014 review of the SBA implementation
Key findings and conclusions of the results of the SBA policy implementation assessment conducted across the EU28 Member States for each SBA principle over the reference term of 2013/14 in comparison to the last 2 reference periods (i.e. 2011/12 and 2012/13) are presented below. The assessment is based on the assessment of policy progress judged by national SME experts; and the performance and progress based on SBA indicators extracted from SBA Country Fact Sheets. It is obvious that the simple counting of measures implemented policy measures is –by and in itself – not a sufficient indicator of policy progress. However, combined with the other information it helps to obtain a more comprehensive picture of the changing SME policy environment in a given country.

31 ANNUAL REPORT ON EUROPEAN SMES 2013/2014: A PARTIAL AND FRAGILE RECOVERY
Main focus of SBA policy measures implemented Overall, the number of SBA related policy measures adopted/implemented during 2013/2014 in EU28 was slightly higher than the previous reference period (422 measures), yet still less than the 2011/2012 reference period, during which 735 measures were adopted/implemented. As illustrated in Figure 13, Access to finance is the SBA principle which saw the highest policy progress (116) during this reference period followed by Entrepreneurship (83) and Skills & Innovation (57), while Single market and Second chance were the two lagging principles, with only 8 and 15 measures, respectively. When the total number of measures adopted/implemented per principle was adjusted for each SBA principle by dividing with the number of existing sub-measures, the Access to finance (13) still remained on the top followed by Internationalisation (10), Entrepreneurship (8.3), Skills and Innovation (8), and Responsive Administration (6).
Figure 13: Number of policy measures adopted/implemented in EU28 per SBA principle - 2013/2014
Source: SME Performance Review 2013/2014 - Policy database
Figure 14 shows the percent distribution of policy measures being adopted/implemented amongst 10 SBA principles during this reference period. Access to finance and Entrepreneurship together amount for nearly half of the measures implemented (45%), while Single market and Second chance barely reach to 5% together.
Figure 14: Percent distribution of policy measures per SBA principle in EU28 - 2013/2014
Source: SME Performance Review 2013/2014 - Policy database
0
20
40
60
80
100
1201. Entrepreneurship
2. Second Chance
3. Think Small First
4. Responsive admin.
5. State aid & Public proc.
6. Access to finance
7. Single market
8. Skills & innovation
9. Environment
10. Internationalisation
Number of policy measures adopted/implemented in EU28 per SBA principle - 2013/2014

32 ANNUAL REPORT ON EUROPEAN SMES 2013/2014: A PARTIAL AND FRAGILE RECOVERY
When the policy progress achieved during this reference period of 2013/14 is compared to the ones in 2011/12 and 2012/13, the following overall conclusions can be drawn (Figure 15):
In general, the policy implementation rate achieved during 2011/12 was higher than the subsequent two reference periods;
Entrepreneurship had the highest implementation rate in cumulative terms, but decreased since 2011;
Access to finance was given the greatest attention over this reference period of 2013/14 among the SBA principles;
The number of policy measures under Access to finance, Internationalisation and State aid &Public procurement over this reference period increased significantly compared to the last reference period, while for other principles it decreased or stayed more or less the same.
Overall, Access to Finance, Entrepreneurship, Skills & Innovation, Responsive Administration, and Internationalisation had the highest implementation rate both during 2013/14 and during the 2 preceding reference periods, with the only exception of Internationalisation replacing Think Small First on this reference period of 2013/14
Figure 15: Number of policy measures adopted/implemented in EU28 per SBA principle – 2011/2014
Source: SME Performance Review 2013/2014 – Policy database
The main policy focus during 2013/14 was directed primarily towards improving the Access to Finance for SMEs, which represents more than a quarter (26%) of the new policy measures implemented in 2013/2014. This was followed by Entrepreneurship, Skills & Innovation, Responsive Administration and Internationalisation. At the

33 ANNUAL REPORT ON EUROPEAN SMES 2013/2014: A PARTIAL AND FRAGILE RECOVERY
same time, these 5 SBA principles were also ranked by the SME stakeholders as the most challenging ones for the SMEs (Figure 12). Potential impacts of the SBA Implementation on Economic Performance and Competitiveness Economic performance and growth (2.1.2) of the EU 28 Member States have been compared with their SBA implementation status to see whether any potential relationship exist in between. Estonia, Germany, Lithuania and Sweden support the assumption that a high economic performance and growth is accompanied by a high SBA implementation status. In general, those countries with high SBA implementation status also demonstrated strong economic performance with moderate to strong growth, with some exceptions such as Denmark, Netherlands, Ireland and Hungary. These differences might be attributed to the varying impact of each of the 5 SBA principles investigated on economic performance together with whole socio-economic profile and business ecosystems in those particular countries. Regarding the economic performance and growth of the countries with low SBA implementation status, such as Bulgaria, Greece, Croatia, Poland, Slovenia, and those countries had mainly weak economic performance coupled with declines in all or most of the indicators measured. Thus, it can be suggested that, with some exceptions that need further investigation, the SBA implementation status at national level may have a potential impact on a country’s economic performance and growth. The potential impact of SBA implementation on the competitiveness status of the Member States has also been investigated by looking at the Global Competitiveness Index (GCI)15 and the Europe 2020 Competitiveness Index16 published by the World Economic Forum. Among the 8 Member States (i.e. Denmark, Estonia, Germany, Hungary, Ireland, Lithuania, the Netherlands and Sweden) identified as high performing countries in terms of SBA implementation (i.e. high performing at least in 2 out of 5 key SBA principles explained above), 5 are found to be listed under the stage 3 of development (innovation driven), whilst Estonia, Hungary and Lithuania fell under the transition from stage 2 (efficiency driven) to stage 3, according to the GCI classification. For stage 3 countries, innovation and business sophistication are the key pillars, while for stage 2 countries: education and training; goods and labour market efficiency; financial market development; technological readiness; and market size are the key pillars of the competitiveness. Some of the main drivers for a high competitiveness score can be linked to the presence of strong skills and innovation capacity and capability, entrepreneurship and easy access to finance that are captured in the EU2020 Competitiveness Index under the Smart sub-dimension. Sweden, Netherlands, Denmark, Estonia, Ireland and Germany are all high scorers in the Smart dimension. This is strongly reflected in the assessment of the SBA implementation status of those countries where: DK, DE and NL are all high performers on the Skills & Innovation principle; DK, DE and SE on Access to finance; and EE and IE high performers both in Skills & Innovation and Entrepreneurship principles, which strengthens their competitiveness scores.

34 ANNUAL REPORT ON EUROPEAN SMES 2013/2014: A PARTIAL AND FRAGILE RECOVERY
In general, it should be noted that the role of the SBA in influencing the performance of SMEs in a given country is rather indirect. Implementation of the SBA helps to create an enabling environment in which they may be able to expand their businesses subject to a other stimuli such as robust macro-economic growth of the economy.
35 ANNUAL REPORT ON EUROPEAN SMES 2013/2014: A PARTIAL AND FRAGILE RECOVERY
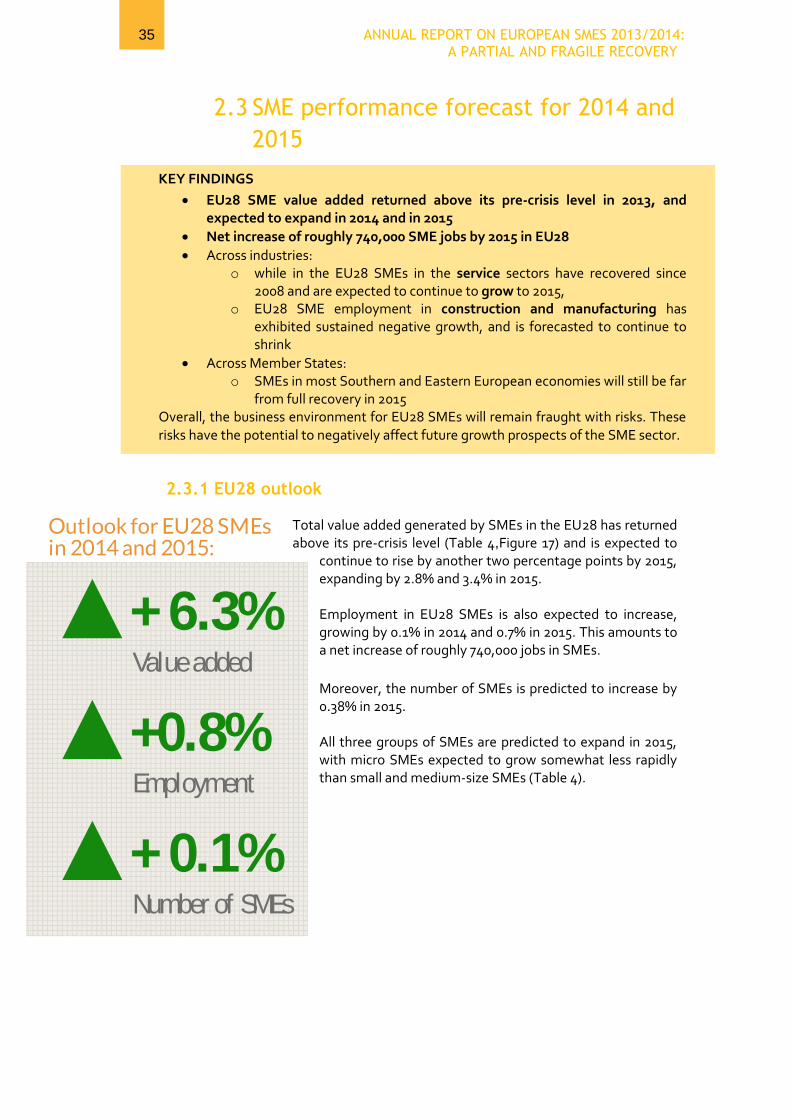
2.3 SME performance forecast for 2014 and
2015
2.3.1 EU28 outlook Total value added generated by SMEs in the EU28 has returned above its pre-crisis level (Table 4,Figure 17) and is expected to
continue to rise by another two percentage points by 2015, expanding by 2.8% and 3.4% in 2015. Employment in EU28 SMEs is also expected to increase, growing by 0.1% in 2014 and 0.7% in 2015. This amounts to a net increase of roughly 740,000 jobs in SMEs.
Moreover, the number of SMEs is predicted to increase by 0.38% in 2015. All three groups of SMEs are predicted to expand in 2015, with micro SMEs expected to grow somewhat less rapidly than small and medium-size SMEs (Table 4).
/api/stylesheets/30?nofonts=1
+ 6.3%Valueadded
+0.8%Employment
+ 0.1%Number of SMEs
Createinfographics
KEY FINDINGS
EU28 SME value added returned above its pre-crisis level in 2013, and expected to expand in 2014 and in 2015
Net increase of roughly 740,000 SME jobs by 2015 in EU28
Across industries: o while in the EU28 SMEs in the service sectors have recovered since
2008 and are expected to continue to grow to 2015, o EU28 SME employment in construction and manufacturing has
exhibited sustained negative growth, and is forecasted to continue to shrink
Across Member States: o SMEs in most Southern and Eastern European economies will still be far
from full recovery in 2015 Overall, the business environment for EU28 SMEs will remain fraught with risks. These risks have the potential to negatively affect future growth prospects of the SME sector.

36 ANNUAL REPORT ON EUROPEAN SMES 2013/2014: A PARTIAL AND FRAGILE RECOVERY
Table 4: 2014 and 2015 Forecasts of annual growth in SME performance indicators – EU28
Size class Indicator % change 2012-2013
% change 2013-2014
% change 2014-2015
Micro
Enterprises -0.93% -0.28% 0.33%
Value Added 1.57% 2.46% 2.96%
Employment -0.98% -0.25% 0.21%
Small
Enterprises -0.42% 0.33% 1.00%
Value Added 0.99% 2.87% 3.49%
Employment -0.21% 0.34% 0.86%
Medium
Enterprises -0.50% 0.45% 1.27%
Value Added 0.72% 3.14% 3.97%
Employment -0.07% 0.62% 1.24%
Large
Enterprises -0.40% -0.49% 0.25%
Value Added -0.03% 2.39% 2.90%
Employment 0.05% -0.08% 0.47%
SMEs
Enterprises -0.90% -0.23% 0.38%
Value Added 1.12% 2.80% 3.44%
Employment -0.51% 0.16% 0.68%
Total
Enterprises -0.90% -0.23% 0.38%
Value Added 0.63% 2.63% 3.22%
Employment -0.33% 0.08% 0.61%
Source: Eurostat, National Statistical Offices and DIW Econ
The estimate and forecast in the present report of annual growth in SME value added in 2013 and 2014 are little changed from the forecasts shown in the 2013 report (Figure 16). However, SME employment is projected to be significantly weaker in both 2013 and 2014. This reflects the fact that firms, large and small, focus much more than previously expected on improving their productivity.
Figure 16: 2013 estimates and 2014 forecasts of performance of SME sector in EU28
Source: 2013: Eurostat, National Statistical Offices, London Economics. 2014: Eurostat, National Statistical Offices, DIW econ
1.00%
3.10%
0.30%
1.80%
1.10%
2.80%
-0.50%-0.20%
2013 2014 2013 2014
Value added Employment
2013 Report 2014 Report
37 ANNUAL REPORT ON EUROPEAN SMES 2013/2014: A PARTIAL AND FRAGILE RECOVERY
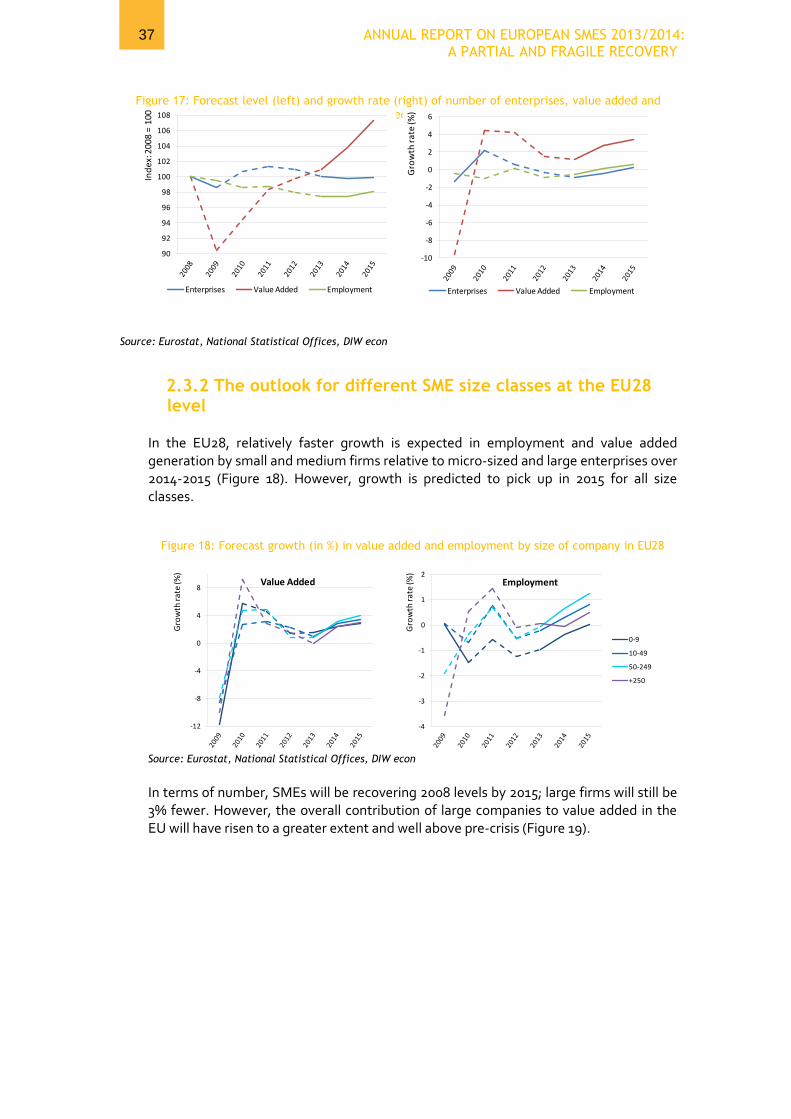
Figure 17: Forecast level (left) and growth rate (right) of number of enterprises, value added and employment accounted for by SMEs in EU28
Source: Eurostat, National Statistical Offices, DIW econ
2.3.2 The outlook for different SME size classes at the EU28 level
In the EU28, relatively faster growth is expected in employment and value added generation by small and medium firms relative to micro-sized and large enterprises over 2014-2015 (Figure 18). However, growth is predicted to pick up in 2015 for all size classes.
Figure 18: Forecast growth (in %) in value added and employment by size of company in EU28
Source: Eurostat, National Statistical Offices, DIW econ
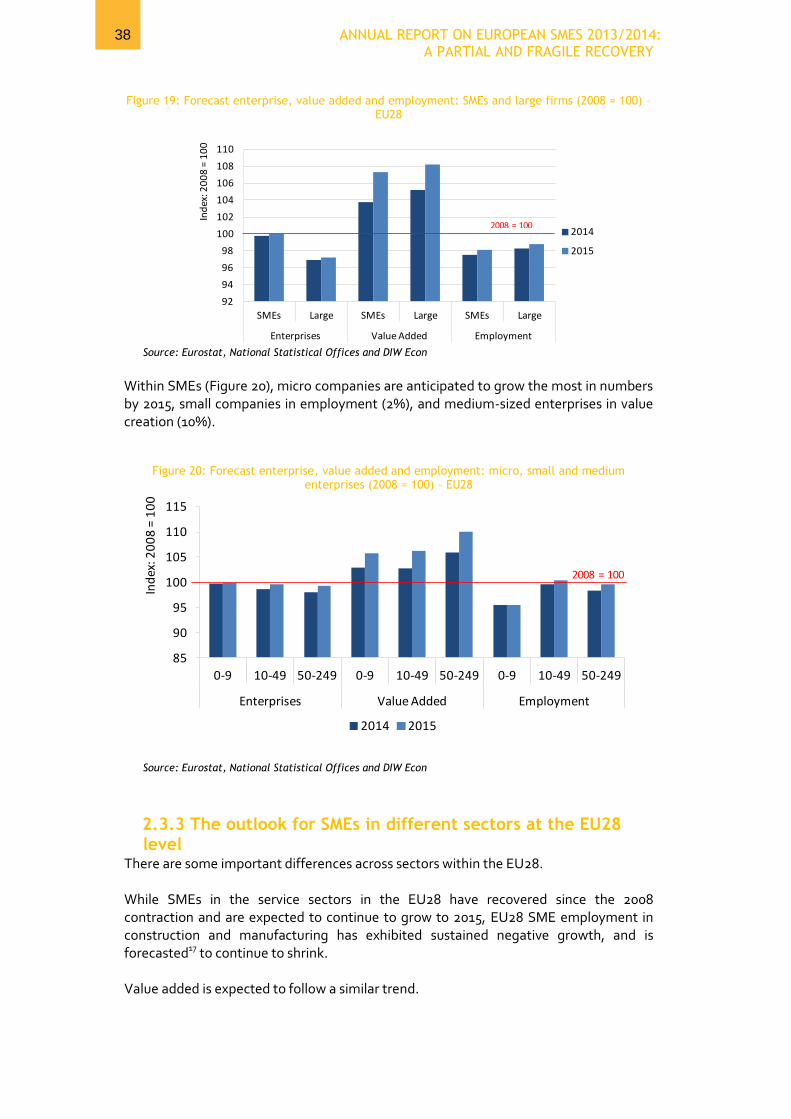
In terms of number, SMEs will be recovering 2008 levels by 2015; large firms will still be 3% fewer. However, the overall contribution of large companies to value added in the EU will have risen to a greater extent and well above pre-crisis (Figure 19).
-10
-8
-6
-4
-2
0
2
4
6
Gro
wth
ra
te (%
)
Enterprises Value Added Employment
90
92
94
96
98
100
102
104
106
108
Ind
ex:
20
08
= 1
00
Enterprises Value Added Employment
-12
-8
-4
0
4
8
Gro
wth
rate
(%)
Value Added
-4
-3
-2
-1
0
1
2
Gro
wth
rate
(%)
Employment
0-9
10-49
50-249
+250
38 ANNUAL REPORT ON EUROPEAN SMES 2013/2014: A PARTIAL AND FRAGILE RECOVERY
Figure 19: Forecast enterprise, value added and employment: SMEs and large firms (2008 = 100) – EU28
Source: Eurostat, National Statistical Offices and DIW Econ
Within SMEs (Figure 20), micro companies are anticipated to grow the most in numbers by 2015, small companies in employment (2%), and medium-sized enterprises in value creation (10%).
Figure 20: Forecast enterprise, value added and employment: micro, small and medium enterprises (2008 = 100) – EU28
Source: Eurostat, National Statistical Offices and DIW Econ
2.3.3 The outlook for SMEs in different sectors at the EU28 level
There are some important differences across sectors within the EU28. While SMEs in the service sectors in the EU28 have recovered since the 2008 contraction and are expected to continue to grow to 2015, EU28 SME employment in construction and manufacturing has exhibited sustained negative growth, and is forecasted17 to continue to shrink. Value added is expected to follow a similar trend.
92
94
96
98
100
102
104
106
108
110
SMEs Large SMEs Large SMEs Large
Enterprises Value Added Employment
Ind
ex: 2
00
8 =
10
0
2014
2015
2008 = 100
85
90
95
100
105
110
115
0-9 10-49 50-249 0-9 10-49 50-249 0-9 10-49 50-249
Enterprises Value Added Employment
Ind
ex: 2
00
8 =
10
0
2014 2015
2008 = 100

39 ANNUAL REPORT ON EUROPEAN SMES 2013/2014: A PARTIAL AND FRAGILE RECOVERY
Figure 21: Forecast growth (in %) in value added by sector -EU28
Source: Eurostat, National Statistical Offices, DIW econ
Figure 22: Forecast growth (in %) in employment by sector – EU28
Source: Eurostat, National Statistical Offices, DIW econ
In 2015, the level of employment generated by the construction sector in the EU28 will have dropped by 16% and value added by up to 25% (Figure 23). On a slightly smaller scale, value added from manufacturing will have contracted by 2% and employment by up to 12%. Professional services and other (service) sectors will instead have grown since pre-crisis years in the order of 10%.
-20
-15
-10
-5
0
5
10
Gro
wth
rate
(%)
C - Manufacturing
F - Construction
G - Wholesale & retail trade
I- Accommodation/food
M - Professional, scientific &
technical activities
Other sectors
-8
-6
-4
-2
0
2
4
6
Gro
wth
rate
(%)
C - Manufacturing
F - Construction
G - Wholesale & retail trade
I- Accommodation/food
M - Professional, scientific &
technical activities
Other sectors

40 ANNUAL REPORT ON EUROPEAN SMES 2013/2014: A PARTIAL AND FRAGILE RECOVERY
Figure 23: Forecast enterprises, value added and employment by sector (2008 = 100) – EU28
Source: Eurostat, National Statistical Offices, DIW econ
2.3.4 The outlook for SMEs in different Member States
Achieving a full recovery and resuming on a path of positive growth in jobs and value added remains an on-going challenge for many European SMEs. In terms of value added creation, three groups of countries can be identified (Figure 62,
Annex VII):
Those countries where SMEs have achieved a full recovery of pre-crisis levels by 2013, and are forecast to grow even more (at least by 4%) in the period 2013-2015 (top right quadrant)
Those countries where SMEs have not yet recovered, but are forecast to perform positively in the next years (top left quadrant)
Those countries that have not yet recovered and are not expected to improve performance in the coming years (bottom left quadrant)
There is a small, positive correlation (R-squared of 0.28) between past and forecast growth rates, implying that, on average, the countries having achieved a recovery are predicted to keep on growing, while countries lagging behind are not expected “converge” by growing at a faster pace. This may point to other macroeconomic or structural factors as drivers of (or obstacles to) SME growth, such as a depressed domestic demand, or a decrease in gross fixed capital formation.
Interestingly, in the case of employment the relationship is somewhat less clear, as the variation between countries increases (Figure 63, Annex VII):
For some countries, recovery has been achieved and employment is bound to increase even further, albeit mildly (top right)
For others, employment levels are still not comparable to pre-crisis, despite good prospects for the coming years (top left)
0
20
40
60
80
100
120
C -
Man
ufa
ctu
rin
g
F -C
on
stru
ctio
n
G -
Wh
ole
sale
& r
etai
l …
I-A
cco
mm
od
atio
n/f
oo
d
M -
Pro
fess
ion
al, …
Oth
er s
ecto
rs
C -
Man
ufa
ctu
rin
g
F -C
on
stru
ctio
n
G -
Wh
ole
sale
& r
etai
l …
I-A
cco
mm
od
atio
n/f
oo
d
M -
Pro
fess
ion
al, …
Oth
er s
ecto
rs
C -
Man
ufa
ctu
rin
g
F -C
on
stru
ctio
n
G -
Wh
ole
sale
& r
etai
l …
I-A
cco
mm
od
atio
n/f
oo
d
M -
Pro
fess
ion
al, …
Oth
er s
ecto
rs
Enterprises Value Added Employment
Ind
ex: 2
00
8 =
10
02008 = 100

41 ANNUAL REPORT ON EUROPEAN SMES 2013/2014: A PARTIAL AND FRAGILE RECOVERY
There are still many countries where SMEs have not recovered the jobs lost during the crisis and are not forecast to expand their labour force in the near future (bottom left quadrant)
Where will SMEs stand in 2015 relative to 2008?
Significant differences across Member States in SME performance are expected to prevail in 2015 relative to 2008. Figure 24 displays SME employment and value added relative to the base year (2008), as well as each Member State’s share in total value added generated by SMEs in the EU. While SMEs in selected Western European countries18 will have exceeded 2008 levels of value added and employment by 2015, SMEs in many Southern and Eastern European countries19 will according to the forecast still be far from full recovery.
In other countries, such as Denmark, Estonia and Lithuania, value added generated by SMEs is expected to be well above pre-crisis years, but employment will remain relatively low. The opposite is true for Romania, where value added generated by SMEs will still be almost half as high as it was in 2008, while employment will have just recovered.
Countries in which SMEs account for greatest shares in economic activity in the EU (Germany, France, and United Kingdom) are for the most part expected to have recovered or even grown by 2015. Important exceptions include Spain, Italy, and to a much lesser degree the Netherlands.
Figure 24: Forecast value added and employment in 2015, by Member State (2008 = 100)
Note: The size of bubbles reflects Member State’s share in total value added generated by SMEs in the EU in 2013. Slovakia is omitted because of a structural break in the data. Source: Eurostat, National Statistical Offices, DIW econ
A detailed analysis of cross country variation by sector is developed in Annex VII.
AT
BE
BG
CY
CZ
DE
DK EE
ELES
FI
FR
HRHU
IEIT
LT
LU
LV
MT
NL
PL
PT
RO
SE
SI
UK
60
70
80
90
100
110
120
130
140
50 60 70 80 90 100 110 120 130 140
Emp
loym
en
t in
20
15
/ E
mp
loym
en
t 2
00
8
Value Added in 2015/ Value Added in 2008
Share in total value added generated by EU SMEs (2013)
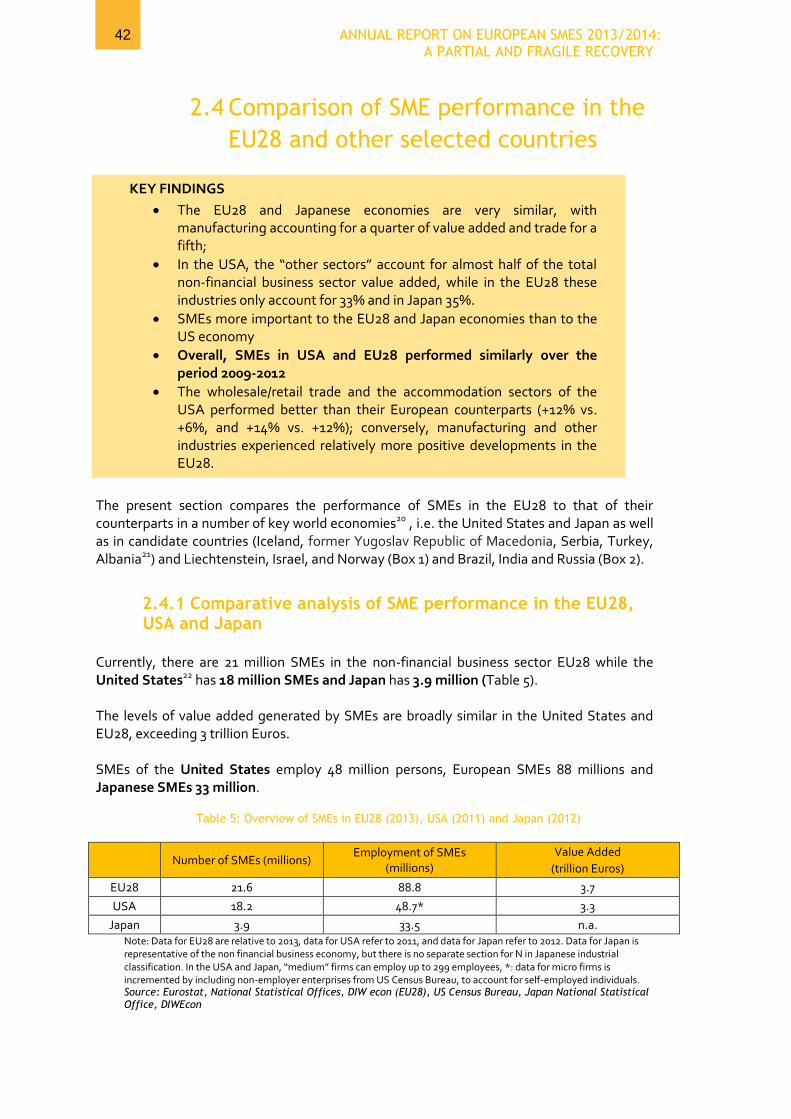
42 ANNUAL REPORT ON EUROPEAN SMES 2013/2014: A PARTIAL AND FRAGILE RECOVERY
2.4 Comparison of SME performance in the
EU28 and other selected countries
The present section compares the performance of SMEs in the EU28 to that of their counterparts in a number of key world economies20 , i.e. the United States and Japan as well as in candidate countries (Iceland, former Yugoslav Republic of Macedonia, Serbia, Turkey, Albania21) and Liechtenstein, Israel, and Norway (Box 1) and Brazil, India and Russia (Box 2).
2.4.1 Comparative analysis of SME performance in the EU28, USA and Japan
Currently, there are 21 million SMEs in the non-financial business sector EU28 while the United States22 has 18 million SMEs and Japan has 3.9 million (Table 5). The levels of value added generated by SMEs are broadly similar in the United States and EU28, exceeding 3 trillion Euros. SMEs of the United States employ 48 million persons, European SMEs 88 millions and Japanese SMEs 33 million.
Table 5: Overview of SMEs in EU28 (2013), USA (2011) and Japan (2012)
Number of SMEs (millions)
Employment of SMEs (millions)
Value Added
(trillion Euros)
EU28 21.6 88.8 3.7
USA 18.2 48.7* 3.3
Japan 3.9 33.5 n.a. Note: Data for EU28 are relative to 2013, data for USA refer to 2011, and data for Japan refer to 2012. Data for Japan is representative of the non financial business economy, but there is no separate section for N in Japanese industrial classification. In the USA and Japan, “medium” firms can employ up to 299 employees, *: data for micro firms is incremented by including non-employer enterprises from US Census Bureau, to account for self-employed individuals. Source: Eurostat, National Statistical Offices, DIW econ (EU28), US Census Bureau, Japan National Statistical Office, DIWEcon
KEY FINDINGS
The EU28 and Japanese economies are very similar, with manufacturing accounting for a quarter of value added and trade for a fifth;
In the USA, the “other sectors” account for almost half of the total non-financial business sector value added, while in the EU28 these industries only account for 33% and in Japan 35%.
SMEs more important to the EU28 and Japan economies than to the US economy
Overall, SMEs in USA and EU28 performed similarly over the period 2009-2012
The wholesale/retail trade and the accommodation sectors of the USA performed better than their European counterparts (+12% vs. +6%, and +14% vs. +12%); conversely, manufacturing and other industries experienced relatively more positive developments in the EU28.

43 ANNUAL REPORT ON EUROPEAN SMES 2013/2014: A PARTIAL AND FRAGILE RECOVERY
The figures above do not take into account differences in the size of the respective economies and therefore do not provide a good picture of the relative importance of the SME sector in each of the three economies. A very different picture emerges once the SME indicators are adjusted (Figure 25):
The number of SMEs in the EU28 is very similar to the United States (1.65 and 1.63 SME enterprises per million of GDP);
In Japan, there are many fewer SMEs compared to the size of the economy (less than 1 enterprise per million of GDP);
In contrast, the SMEs of Japan employ relatively more individuals than in Europe or the USA.
Figure 25: Number of enterprises and employment in EU28 (2013), USA (2011) and Japan (2012)as ratios over GDP
Note: Data for EU28 are relative to 2013, data for USA refer to 2011, and data for Japan refer to 2012.
Source: GDP data: Eurostat. SME data for EU28: Eurostat, National Statistical Offices, DIW Econ; SME data for USA: US Census Bureau, DIW Econ; SME data for Japan: Japan National Statistical Office, DIW Econ
Overall:
In all three economies, SMEs account for the vast majority of enterprises (over 99%);
EU28 and USA have a similar size class distribution of SMEs, with micro enterprises being the most common; in contrast, Japan tends to have relatively more small firms;
In all three economies, SMEs employ more than half of the persons employed in the non-financial business sector, but there is significant variation: in the USA they account for 52% of total employment in that sector, in the EU for 66%, and in Japan for 86%;
In the USA, large firms account for more than half of the value added generated by the non-financial business sector whereas in the EU, SMEs account for the majority (55%).
More detailed data can be found under section XI of the statistical background document.
1.65 1.63
0.85
6.80
4.36
7.24
0
1
2
3
4
5
6
7
8
EU28 United States Japan EU28 United States Japan
Number of SMEs per million GDP Employment in SMEs per million GDP

44 ANNUAL REPORT ON EUROPEAN SMES 2013/2014: A PARTIAL AND FRAGILE RECOVERY
Within the SME sector:
micro firms account for the vast majority of businesses (95% and 92.5% respectively) In the USA and the EU28, (Figure 26);
A markedly different picture is found in Japan, where 79% of SMEs are micro and 18% are small firms. The medium sized enterprises represent 2.5% of the SME population.
Figure 26: Enterprise distribution by size class, EU28 (2013), USA (2011) and Japan (2012)
Note: Data for EU28 are relative to 2013, data for USA refer to 2011, and data for Japan refer to 2012. Data for
Japan is representative of the non financial business economy, but there is no separate section for N in
Japanese industrial classification. In the USA and Japan, “medium” firms can employ up to 299 employees. For
the USA, micro firms include self-employed.
Source: Eurostat and National Statistical Offices (EU28), US Census Bureau, Japan National Statistical Office, DIW Econ
Although there is no exact correspondence between the EU28, the USA and Japan due to differences in size classification, a broad comparison between the employment distributions shows that (Annex XI of the statistical background document):
In the USA fewer people work in SMEs in the non-financial business sector than in Europe (52% as opposed to 66%);
In Japan more than 86% of individuals working in the business economy are employed in an SME.
A more granular analysis of the data by size class shows that (Figure 27):
While in the EU and the USA micro firms account for the largest shares of total SME employment (with the USA micro firms taking up more than 46% of persons employed), in Japan micro firms employ a third of the population, and small firms, instead, account for more than 40%.
92.6%
95.4%
79.2%
6.4%
3.8%
18.3%
1%
0.8%
2.5%
EU28
USA
Japan
Micro Small Medium
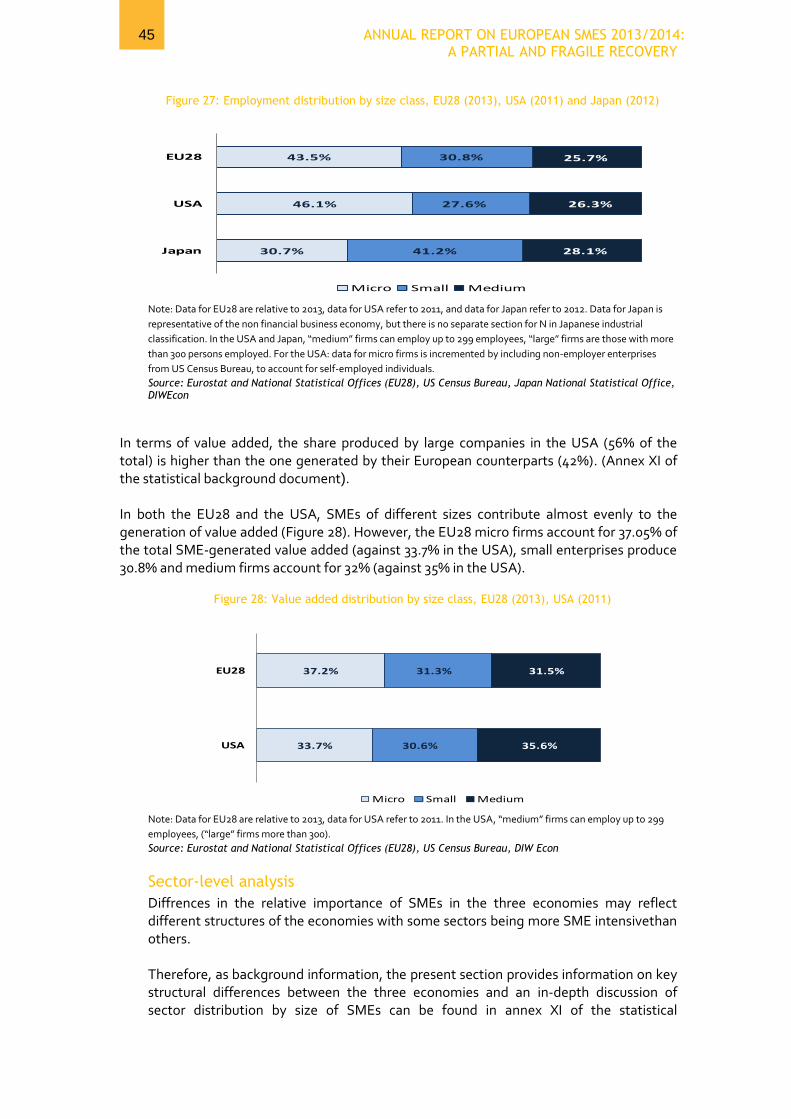
45 ANNUAL REPORT ON EUROPEAN SMES 2013/2014: A PARTIAL AND FRAGILE RECOVERY
Figure 27: Employment distribution by size class, EU28 (2013), USA (2011) and Japan (2012)
Note: Data for EU28 are relative to 2013, data for USA refer to 2011, and data for Japan refer to 2012. Data for Japan is
representative of the non financial business economy, but there is no separate section for N in Japanese industrial
classification. In the USA and Japan, “medium” firms can employ up to 299 employees, “large” firms are those with more
than 300 persons employed. For the USA: data for micro firms is incremented by including non-employer enterprises
from US Census Bureau, to account for self-employed individuals.
Source: Eurostat and National Statistical Offices (EU28), US Census Bureau, Japan National Statistical Office, DIWEcon
In terms of value added, the share produced by large companies in the USA (56% of the total) is higher than the one generated by their European counterparts (42%). (Annex XI of the statistical background document). In both the EU28 and the USA, SMEs of different sizes contribute almost evenly to the generation of value added (Figure 28). However, the EU28 micro firms account for 37.05% of the total SME-generated value added (against 33.7% in the USA), small enterprises produce 30.8% and medium firms account for 32% (against 35% in the USA).
Figure 28: Value added distribution by size class, EU28 (2013), USA (2011)
Note: Data for EU28 are relative to 2013, data for USA refer to 2011. In the USA, “medium” firms can employ up to 299
employees, (“large” firms more than 300).
Source: Eurostat and National Statistical Offices (EU28), US Census Bureau, DIW Econ
Sector-level analysis
Diffrences in the relative importance of SMEs in the three economies may reflect different structures of the economies with some sectors being more SME intensivethan others. Therefore, as background information, the present section provides information on key structural differences between the three economies and an in-depth discussion of sector distribution by size of SMEs can be found in annex XI of the statistical
43.5%
46.1%
30.7%
30.8%
27.6%
41.2%
25.7%
26.3%
28.1%
EU28
USA
Japan
Micro Small Medium
37.2%
33.7%
31.3%
30.6%
31.5%
35.6%
EU28
USA
Micro Small Medium

46 ANNUAL REPORT ON EUROPEAN SMES 2013/2014: A PARTIAL AND FRAGILE RECOVERY
background document, together with more information on the distribution of enterprises and employment. Key facts to note regarding the distribution of value added across sectors (Figure 29) are the following:
the economies of EU28 and Japan are very similar, with manufacturing accounting for a quarter of value added and trade for a fifth;
in the USA, the “other sectors” account for almost half of the total value added, while in the EU28 these industries only account for 33% and in Japan 35%. Of note is the fact that, in the USA, the industries which drive the differences relative to the EU28 and Japan are “Real estate” (17.6%) and “Information and communication” (9.1%)23.
Figure 29: Total value added by sector, EU28 (2013), USA (2011) and Japan (2012)
EU28 USA JAPAN
Note: Data for EU28 are relative to 2013, data for USA refer to 2011, and data for Japan refer to 2012. The name “Business S.” is used as abbreviation of the NACE service category M “Professional/scientific/technical activities”, and “Trade” refers to G “Wholesale/retail trade/repair of motor vehicles/motorcycles”. Categories in “Others” refer to sections of NACE Rev.2 classifications: B, D, E, H,J, L, and N. Data for Japan is produced using GDP by sector for year 2012, however, no data was available for “Accommodation/food S.”. Source: Eurostat and National Statistical Offices (EU28), US Census Bureau, Japan National Statistical Office, DIW Econ
Macroeconomic environment
Differences in SME performance among the three economies may also be due to differences in macroeconomic developments. In particular, the post 2008 period is characterised by a decrease from 2008 to 2012 in domestic demand in the EU28 (-4%) while domestic demand increased, albeit a subdued rate, in the USA and Japan. Investments in capital goods dropped in all three economies, although in the USA and Japan there were signs of an inversion in this trend in 2013. The EU28 and the USA experienced an increase in exports from 2008 to 2013, while in Japan such an increase occurred only recently in 2013.
26.1%
7.8%19.2%9.9%
3.4%
33.6%
Manufacturing
Construction
Trade
Business S
Accommodation/food S.
Others
18.5%
5.3%17.4
%11.1%
4.0%
43.8%
ManufacturingConstructionTradeBusiness SAccommodation/food S.Others
26.1%
8.1%20.7%
10.0%
35.1%
ManufacturingConstructionTradeBusiness SAccommodation/food S.Others

47 ANNUAL REPORT ON EUROPEAN SMES 2013/2014: A PARTIAL AND FRAGILE RECOVERY
Figure 30 : Developments (jn %) in key macroeconomic factors at constant prices, 2008-2013
Note: no data for 2013 was available for USA and Japan domestic demand at the time of drafting Source: Eurostat National Accounts (base year 2005, chain-linked series)
Recent performance trends
The differences in the sectoral make-up of the three economies and in macroeconomic developments noted above explain to some extent the different trends24 in SME performance described below. In terms of number of firms (Figure 31), the EU 28 and the USA followed a path of mild increase between 2010 and 2011; the latest EU data show however an inversion in this trend to levels barely above pre-crisis. Japan followed a different trajectory, with a steady decrease in the number of SMEs.
Figure 31: Number of SMEs in EU28, USA and Japan, 2009=100
Note: * Data for EU28 exclude Slovakia due to a break in series; Data for Japan is representative of the non financial
business economy, but there is no separate section for N in Japanese industrial classification. In the USA and Japan,
“medium” firms can employ up to 299 employees. Data indexed to 2009 due to a structural break in data for Japan
registered in 2008.
Source: Eurostat and National Statistical Offices (EU28), US Census Bureau, DIWEcon
A closer look at these dynamics on a sectoral level from 2009 to 2012, reveals that while for the EU28 and the USA some sectors (such as services) showed signs of positive growth, in Japan there was a widespread reduction in the SME population.
-15%
-10%
-5%
0%
5%
10%
15%
EU28 USA Japan EU28 USA Japan EU28 USA Japan
Domestic demand Exports Gross fixed capital formation
% change 2008-2012 % change 2012-2013
90
95
100
105
110
2008 2009 2010 2011 2012 2013
EU28
USA
Japan

48 ANNUAL REPORT ON EUROPEAN SMES 2013/2014: A PARTIAL AND FRAGILE RECOVERY
Figure 32: % change in number of SMEs by sector in EU28, USA and Japan, 2009 - 2012
Note: * Data for EU28 exclude Slovakia due to a break in series; data for Japan is representative of the non financial
business economy, but there is no separate section for N in Japanese industrial classification. In the USA and Japan,
“medium” firms can employ up to 299 employees. Data shown starting in 2009 due to a structural break in data for Japan
registered in 2008. The percentage change for the USA is calculated for 2009-2011, due to lack of data for 2012.
All three geographies show SME employment losses. However, they are much more severe in in the USA and Japan (Figure 33).
Figure 33: Employment in SMEs in EU28, USA and Japan, 2009=100
Note: * Data for EU28 exclude Slovakia due to a break in series; Data for Japan is representative of the non financial
business economy, but there is no separate section for N in Japanese industrial classification. In the USA and Japan,
“medium” firms can employ up to 299 employees. Data indexed to 2009 due to a structural break in data for Japan
registered in 2008.
Source: Eurostat and National Statistical Offices (EU28), US Census Bureau, DIWEcon
Similarly to the evolution of enterprises, in the case of employment the services sectors were those where (mild) growth occurred after 2009 in both the EU28 and the USA. In Japan, on the other hand, SME employment decreased in all sectors of the economy. The sharp declines in SME construction employment are very similar in all three economies.
-10%
-8%
-6%
-4%
-2%
0%
2%
4%
6%
8%
10%
C: Manufacturing F: Construction G: Wholesale and retail trade
I: Accommodation/ food services
M: Professional, scientific and technical activities
Others
EU28 USA Japan
90
95
100
105
110
2008 2009 2010 2011 2012 2013
EU28
USA
Japan
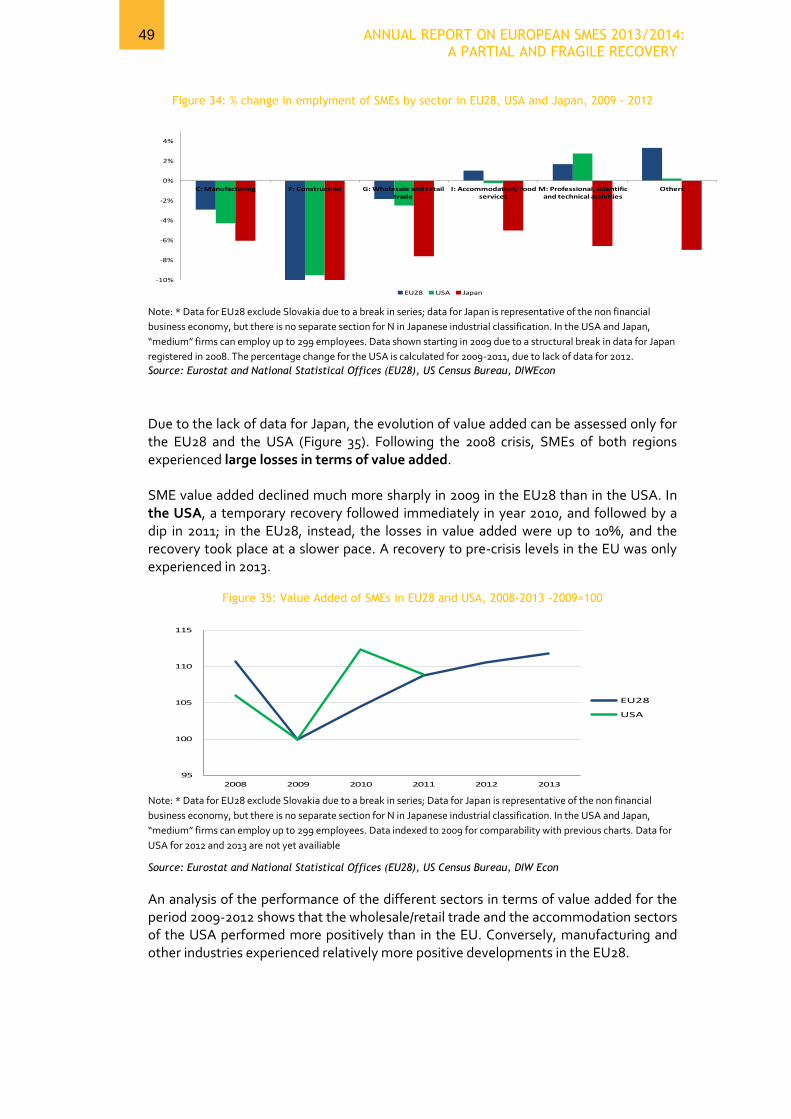
49 ANNUAL REPORT ON EUROPEAN SMES 2013/2014: A PARTIAL AND FRAGILE RECOVERY
Figure 34: % change in emplyment of SMEs by sector in EU28, USA and Japan, 2009 - 2012
Note: * Data for EU28 exclude Slovakia due to a break in series; data for Japan is representative of the non financial
business economy, but there is no separate section for N in Japanese industrial classification. In the USA and Japan,
“medium” firms can employ up to 299 employees. Data shown starting in 2009 due to a structural break in data for Japan
registered in 2008. The percentage change for the USA is calculated for 2009-2011, due to lack of data for 2012.
Source: Eurostat and National Statistical Offices (EU28), US Census Bureau, DIWEcon
Due to the lack of data for Japan, the evolution of value added can be assessed only for the EU28 and the USA (Figure 35). Following the 2008 crisis, SMEs of both regions experienced large losses in terms of value added. SME value added declined much more sharply in 2009 in the EU28 than in the USA. In the USA, a temporary recovery followed immediately in year 2010, and followed by a dip in 2011; in the EU28, instead, the losses in value added were up to 10%, and the recovery took place at a slower pace. A recovery to pre-crisis levels in the EU was only experienced in 2013.
Figure 35: Value Added of SMEs in EU28 and USA, 2008-2013 -2009=100
Note: * Data for EU28 exclude Slovakia due to a break in series; Data for Japan is representative of the non financial
business economy, but there is no separate section for N in Japanese industrial classification. In the USA and Japan,
“medium” firms can employ up to 299 employees. Data indexed to 2009 for comparability with previous charts. Data for
USA for 2012 and 2013 are not yet availiable
Source: Eurostat and National Statistical Offices (EU28), US Census Bureau, DIW Econ
An analysis of the performance of the different sectors in terms of value added for the period 2009-2012 shows that the wholesale/retail trade and the accommodation sectors of the USA performed more positively than in the EU. Conversely, manufacturing and other industries experienced relatively more positive developments in the EU28.
-10%
-8%
-6%
-4%
-2%
0%
2%
4%
C: Manufacturing F: Construction G: Wholesale and retail trade
I: Accommodation/ food services
M: Professional, scientific and technical activities
Others
EU28 USA Japan
95
100
105
110
115
2008 2009 2010 2011 2012 2013
EU28
USA

50 ANNUAL REPORT ON EUROPEAN SMES 2013/2014: A PARTIAL AND FRAGILE RECOVERY
Figure 36: % change in value added of SMEs by sector in EU28 and USA - 2009-2012
Note: * Data for EU28 exclude Slovakia due to a break in series; data for Japan is representative of the non financial
business economy, but there is no separate section for N in Japanese industrial classification. In the USA and Japan,
“medium” firms can employ up to 299 employees. Data shown starting in 2009 due to a structural break in data for Japan
registered in 2008. The percentage change for the USA is calculated for 2009-2011, due to lack of data for 2012.
Source: Eurostat and National Statistical Offices (EU28), US Census Bureau, DIWEcon
-5%
0%
5%
10%
15%
20%
C: Manufacturing F: Construction G: Wholesale and retail trade
I: Accommodation/ food services
M: Professional, scientific and technical
activities
Others
EU28 USA
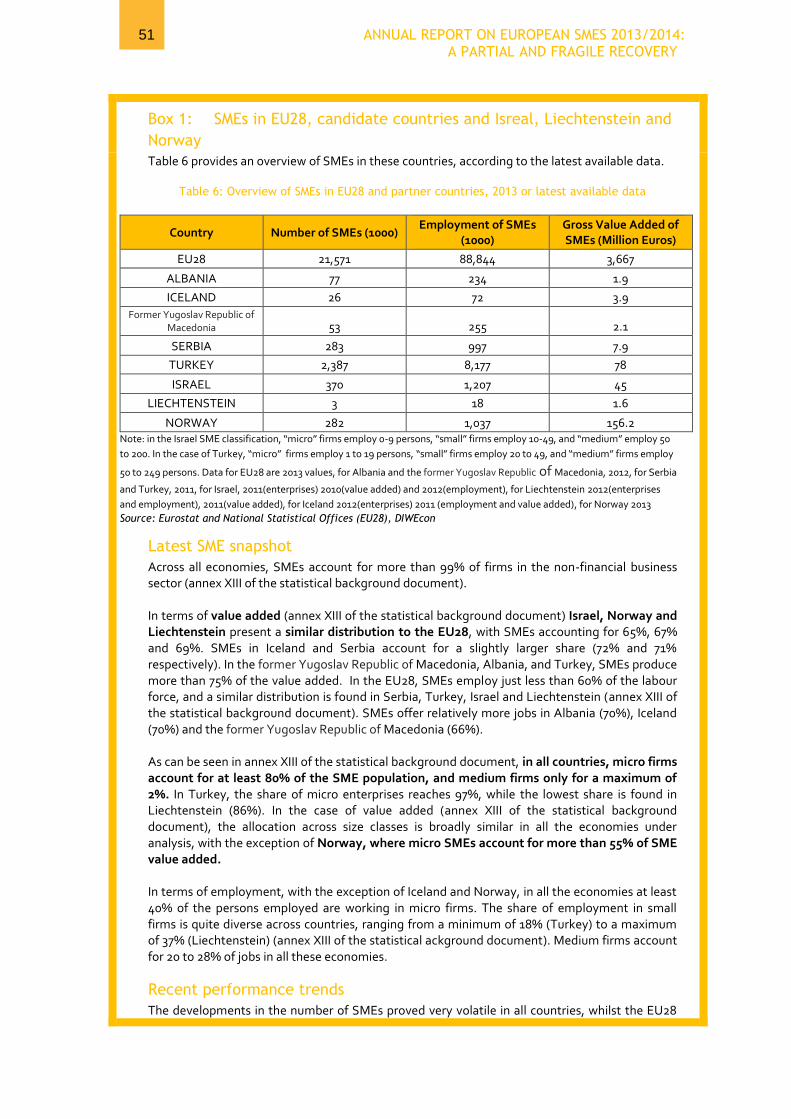
51 ANNUAL REPORT ON EUROPEAN SMES 2013/2014: A PARTIAL AND FRAGILE RECOVERY
Box 1: SMEs in EU28, candidate countries and Isreal, Liechtenstein and
Norway
Table 6 provides an overview of SMEs in these countries, according to the latest available data.
Table 6: Overview of SMEs in EU28 and partner countries, 2013 or latest available data
Country Number of SMEs (1000) Employment of SMEs
(1000) Gross Value Added of SMEs (Million Euros)
EU28 21,571 88,844 3,667
ALBANIA 77 234 1.9
ICELAND 26 72 3.9
Former Yugoslav Republic of Macedonia 53 255 2.1
SERBIA 283 997 7.9
TURKEY 2,387 8,177 78
ISRAEL 370 1,207 45
LIECHTENSTEIN 3 18 1.6
NORWAY 282 1,037 156.2 Note: in the Israel SME classification, “micro” firms employ 0-9 persons, “small” firms employ 10-49, and “medium” employ 50
to 200. In the case of Turkey, “micro” firms employ 1 to 19 persons, “small” firms employ 20 to 49, and “medium” firms employ
50 to 249 persons. Data for EU28 are 2013 values, for Albania and the former Yugoslav Republic of Macedonia, 2012, for Serbia
and Turkey, 2011, for Israel, 2011(enterprises) 2010(value added) and 2012(employment), for Liechtenstein 2012(enterprises
and employment), 2011(value added), for Iceland 2012(enterprises) 2011 (employment and value added), for Norway 2013
Source: Eurostat and National Statistical Offices (EU28), DIWEcon
Latest SME snapshot
Across all economies, SMEs account for more than 99% of firms in the non-financial business sector (annex XIII of the statistical background document). In terms of value added (annex XIII of the statistical background document) Israel, Norway and Liechtenstein present a similar distribution to the EU28, with SMEs accounting for 65%, 67% and 69%. SMEs in Iceland and Serbia account for a slightly larger share (72% and 71% respectively). In the former Yugoslav Republic of Macedonia, Albania, and Turkey, SMEs produce more than 75% of the value added. In the EU28, SMEs employ just less than 60% of the labour force, and a similar distribution is found in Serbia, Turkey, Israel and Liechtenstein (annex XIII of the statistical background document). SMEs offer relatively more jobs in Albania (70%), Iceland (70%) and the former Yugoslav Republic of Macedonia (66%). As can be seen in annex XIII of the statistical background document, in all countries, micro firms account for at least 80% of the SME population, and medium firms only for a maximum of 2%. In Turkey, the share of micro enterprises reaches 97%, while the lowest share is found in Liechtenstein (86%). In the case of value added (annex XIII of the statistical background document), the allocation across size classes is broadly similar in all the economies under analysis, with the exception of Norway, where micro SMEs account for more than 55% of SME value added. In terms of employment, with the exception of Iceland and Norway, in all the economies at least 40% of the persons employed are working in micro firms. The share of employment in small firms is quite diverse across countries, ranging from a minimum of 18% (Turkey) to a maximum of 37% (Liechtenstein) (annex XIII of the statistical ackground document). Medium firms account for 20 to 28% of jobs in all these economies.
Recent performance trends
The developments in the number of SMEs proved very volatile in all countries, whilst the EU28

52 ANNUAL REPORT ON EUROPEAN SMES 2013/2014: A PARTIAL AND FRAGILE RECOVERY
registered a more stable path during the years of the crisis (Figure 37). Albania, Israel and Liechtenstein experienced years of sustained growth; in the former Yugoslav Republic of Macedonia and Turkey, SME growth had at least one negative period (2011 and 2010 respectively). Iceland registered a negative trend from 2008 to 2011, but is now set on a positive trajectory. In all countries but Iceland, there are currently more SMEs than there were in 2008.
Figure 37: Number of SMEs, EU28 and partner countries, 2009=100
Note: in the Israel SME classification, “micro” firms employ 0-9 persons, “small” firms employ 10-49, and “medium”
employ 50 to 200. In the case of Turkey, “micro” firms employ 1 to 19 persons, “small” firms employ 20 to 49, and
“medium” firms employ 50 to 249 persons. Data for the EU28 exclude Slovakia due to a break in the series.
Source: Eurostat and National Statistical Offices (EU28), DIW Econ
The performance of SMEs in terms of value added is also quite different between the EU28 and the candidate countries, as shown in Figure 38. The EU suffered an immediate setback in 2009, with a loss of almost 10%, and Iceland, Norway, Israel and Serbia performed similarly. In the following years, these economies posted substantially different trends. While the EU resumed a mild recovery, Serbia experienced a second year of negative growth and Israel exhibited a strikingly positive performance. Albania and the former Yugoslav Republic of Macedonia only registered negative rates starting 2011 (-1.4% and -6.2%), and while Albania recovered swiftly, the former Yugoslav Republic of Macedonia lost an additional 6.8% of value added in 2012. Turkey and Liechtenstein, in contrast, did not experience losses during the crisis.
Figure 38: Value added of SMEs, EU28 and partner countries 2009=100
Note: in the Israel SME classification, “micro” firms employ 0-9 persons, “small” firms employ 10-49, and “medium”
employ 50 to 200. In the case of Turkey, “micro” firms employ 1 to 19 persons, “small” firms employ 20 to 49, and
86
88
90
92
94
96
98
100
102
104
106
108
2008 2009 2010 2011 2012 2013
EU28 Albania Iceland
FYR Macedonia Serbia Turkey
Israel Liechtenstein Norway
90
100
110
120
130
140
2008 2009 2010 2011 2012 2013
EU28 Albania Iceland
FYR Macedonia Serbia Turkey
Israel Liechtenstein Norway
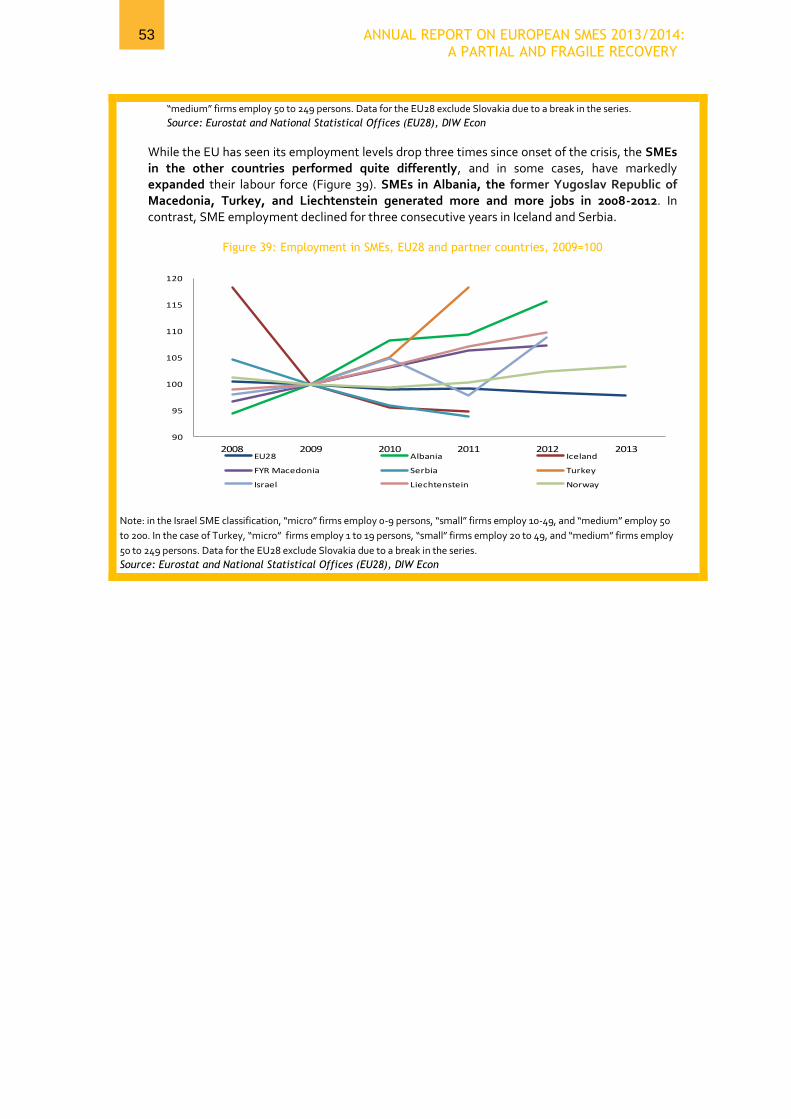
53 ANNUAL REPORT ON EUROPEAN SMES 2013/2014: A PARTIAL AND FRAGILE RECOVERY
“medium” firms employ 50 to 249 persons. Data for the EU28 exclude Slovakia due to a break in the series.
Source: Eurostat and National Statistical Offices (EU28), DIW Econ
While the EU has seen its employment levels drop three times since onset of the crisis, the SMEs in the other countries performed quite differently, and in some cases, have markedly expanded their labour force (Figure 39). SMEs in Albania, the former Yugoslav Republic of Macedonia, Turkey, and Liechtenstein generated more and more jobs in 2008-2012. In contrast, SME employment declined for three consecutive years in Iceland and Serbia.
Figure 39: Employment in SMEs, EU28 and partner countries, 2009=100
Note: in the Israel SME classification, “micro” firms employ 0-9 persons, “small” firms employ 10-49, and “medium” employ 50
to 200. In the case of Turkey, “micro” firms employ 1 to 19 persons, “small” firms employ 20 to 49, and “medium” firms employ
50 to 249 persons. Data for the EU28 exclude Slovakia due to a break in the series.
Source: Eurostat and National Statistical Offices (EU28), DIW Econ
90
95
100
105
110
115
120
2008 2009 2010 2011 2012 2013EU28 Albania Iceland
FYR Macedonia Serbia Turkey
Israel Liechtenstein Norway

54 ANNUAL REPORT ON EUROPEAN SMES 2013/2014: A PARTIAL AND FRAGILE RECOVERY
Box 2: SMEs in EU28, Brazil, India and Russia
Brazilian SMEs number 4.2 millions and employ to 23 million individuals; their Indian counterparts number 24.5 million and employment reaches 73 millions.
25 Lastly, in Russia there
are 1.7 million SMEs, generating 11.4 million jobs (Table 7).More information on the distribution and role of SMEs in these countries is available in annex XII of the statistical background
document.
Table 7: Overview of SMEs in EU28 (2013), Brazil, India and Russia (2011)
Number of SMEs (millions)
Employment of SMEs (millions)
Value Added
(trillion Euros)
EU28 21.6 88.8 3.7
Brazil 4.2 23.3 0.6
India 24.5 73.0 n.a.
Russia 1.7 11.4 0.7* Note: Data for EU28 are relative to 2013, while for Brazil, India and Russia are relative to 2011;*turnover data; SME size class definitions for Russia: Micro (0-15), Small (16-100), Medium (101-250). Source: Eurostat and National Statistical Offices (EU28), DIWEcon
Recent performance trends
In contrast with the EU trends, in Brazil, India and Russia SMEs grew in number by respectively 10%, 6% and 35% from 2008 to 2011. (annex XII of the statistical background document).
Similarly, employment in both Brazil and India experienced high growth rates in the period 2008-2011: Brazil gained 4 million SME employees (+18%) and India almost 6 million (+9%) in these 4 years. In Russia, conversely, employment followed a trend of gradual decrease, with negative growth rates in the period 2008-2011 (annex XII of the statistical background document).
In terms of value added, Brazilian SMEs experienced a sluggish growth in the period 2008-2009, but soon recouped with two consecutive years of high growth, with a cumulative growth of 56% from 2008 to 2011. In Russia, similarly to EU28, there were large losses in value added from year 2008 to 2009, but strong growth rates characterised the subsequent years (annex XII of the statistical background document).

55 ANNUAL REPORT ON EUROPEAN SMES 2013/2014: A PARTIAL AND FRAGILE RECOVERY
3 DRIVERS OF SME ECONOMIC PERFORMANCE IN RECENT YEARS AND INTO THE FUTURE
While the previous chapter presented a number of key facts on the recent performance of SMEs in the EU28 and a selection of other countries, the present chapter focuses on a number of factors which can explain the observed differences in SME performance in the EU28. The chapter first focuses on macro-economic developments as drivers of the demand for goods and services produced by EU28 SMEs (section 3.1). Next, in light of the importance of exports of goods and services and innovation to the economic recovery in Europe, the chapter discusses the issue of the internationalisation of SMEs (section 3.2). Finally, the chpater examines the performance of SMEs in high tech manufacturing and knowledge intense service SMEs, two economic segments which are expected to be key growth engines in the future (section 3.3)..

56 ANNUAL REPORT ON EUROPEAN SMES 2013/2014: A PARTIAL AND FRAGILE RECOVERY
3.1 Macro-economic drivers of demand for
goods and services produced by SMEs
3.1.1 Main clients of SMEs in key economic sectors in the EU28
Section 2.2.1 highlighted that for the vast majority of SMEs, finding customers was the most pressing problem experienced in the recent years. The present section sheds light on the importance of macroeconomic factors, and in particular demand, in explaining the large differences identified in SME performance across countries, size classes, and sectors. Unfortunately, information on the various types of clients served by SMEs does not exist at the EU28-wide level. However, the input-output tables produced by Eurostat, which show the distribution of sales to other industries and end-users such as consumers, government and foreign buyers for a large range of industries, and provide useful insights on the likely customers of SMEs. For example, the summary input-output table below (Table 8) shows that, in the EU27:
Households buy 46% of output generated by the retail and wholesale sector;
The spending on capital goods (including housing) by households and government accounts for 60% of the sales of the construction sector;
KEY FINDINGS
Macroeconomic trends
Sharp decline in gross capital formation (housing, structures,
plant and equipment) in a large number of Member States;
Very limited increase or declines in consumer spending and
government spending in many Member States;
Much stronger growth in exports of goods and services than in
final domestic demand in most Member States.
Impact of macroeconomic trends on SME performance:
Household demand has a significant impact on the performance
of SMEs in the accommodation and “other” sectors;
On the other hand, construction value added is mainly affected
by gross fixed capital formation;
In all sectors, intermediate demand is positively affecting SME
growth of value added;
For accommodation and trade firms, the factors that affect
employment growth are household expenditure and intermediate
demand by other sectors;
Gross fixed capital formation significantly affects employment in
both construction and business services

57 ANNUAL REPORT ON EUROPEAN SMES 2013/2014: A PARTIAL AND FRAGILE RECOVERY
In contrast, the various industries are together the largest customer of the manufacturing sector, accounting for 54% of all sales;
Public administrations and the business sector are other important clients of the retail and wholesale sector;
Sales of the "other sector” are broadly distributed across the group of the group of ”other” industries, households and government.
Table 8: Key demand drivers of sectors of key importance to SMEs - EU27, 2009
Intermediate demand (industries) Final demand
Ma
nu
fact
uri
ng
Co
nst
ruct
ion
Tra
de
Bu
sin
ess
se
rvic
es
Acc
om
mo
da
tio
n/f
oo
d
serv
ice
s
Oth
ers
Fin
al c
on
sum
pti
on
ex
pe
nd
itu
re b
y
ho
use
ho
lds
Fin
al c
on
sum
pti
on
ex
pe
nd
itu
re b
y
go
vern
me
nt
Gro
ss f
ixe
d c
ap
ita
l
form
ati
on
Ex
po
rts
Manufacturing 31% 6% 3% 1% 2% 11% 22% 1% 9% 16%
Construction 2% 19% 1% 1% 0.4% 13% 3% 0.2% 60% 0.3%
Trade 17% 4% 5% 1% 2% 11% 46% 2% 5% 7%
Business S. 20% 4% 10% 16% 1% 30% 2% 3% 7% 7%
Accommodation/ food S. 2% 1% 2% 1% 1% 9% 82% 0.4% 0% 2%
Others 9% 2% 5% 3% 1% 24% 27% 23% 2% 3% Note: The name “Business S.” is used as abbreviation of the NACE category M “Professional/scientific/technical activities”, and
“Trade” refers to G “Wholesale/retail trade/repair of motor vehicles/motorcycles”. Categories in “Others” refer to sections of
NACE Rev.2 classifications: B, D, E, H, J, L, and N. The percentages show how each industry in the rows allocates output across
the users in the columns, which are intermediate users (i.e. other firms) and final demand (i.e. households, governments, etc) .
2009 is the last year for which data are currently available
Source: Eurostat Input Output tables (Domestic use, EU27)
3.1.2 Impact of macroeconomic performance on SME performance
The brief overview of the main features of the EU27 input-output table highlighted the fact
that the key macro-economic drivers of demand for SME goods and services will be
different for different industries. This is particularly important in understanding why certain
sectors have suffered serious setbacks since 2008 (such as construction) and what channels
could be stimulated in order to improve the economic performance of SMEs, thus helping
them reach full recovery.
The key noteworthy macroeconomic developments since 2008 are:
a sharp decline in gross capital formation (housing, structures, plant and equipment) in a large number of Member States;
a very small increase or declines in consumer spending and government spending in many Member States;
a much stronger growth in exports of goods and services than in final domestic demand in most Member States.

58 ANNUAL REPORT ON EUROPEAN SMES 2013/2014: A PARTIAL AND FRAGILE RECOVERY
Domestic and foreign demand developments contrast sharply in many EU Member States. Domestic demand (adjusted for inflation) is higher in 2013 than in 2008 in only a handful of countries (Germany, Luxembourg, Sweden, Poland, and to a lesser extent, France, Belgium and Austria) (Figure 40). In contrast, exports of goods and services (adjusted for inflation) are higher in 2013 than in 2008 in all but 6 Member States.
Figure 40: Domestic demand and exports by Member State, % change 2008-2013 (constant prices)
Source: Eurostat – national accounts data
The importance of developments in various components of total aggregate demand for SMEs is assessed statistically using annual data from 2009 to 2012.26 The key findings of such statistical analysis are provided below.27 Key macroeconomic determinants of growth of SME value added:
Household demand has a significant impact on the performance of SMEs in the accommodation and “other” sectors;
On the other hand, construction is mainly affected by gross fixed capital formation;
In all sectors, intermediate demand is positively affecting SME growth of value added;
Government spending has a significant (positive) impact on performance of accommodation and business services.
-35%
-30%
-25%
-20%
-15%
-10%
-5%
0%
5%
10%
EL CY SI IE HR LV LT ES PT
BG
HU IT
RO SK CZ
NL
DK EE
EU2
8 FI UK
MT
FR BE
AT
DE
LU SE PL
Domestic demand at constant prices
-20%
-10%
0%
10%
20%
30%
40%
EL FI HR CY
LU IT DK SE SI AT
FR UK
BE
EU2
8 IE NL
DE
MT
PT ES HU CZ
LV PL
BG SK EE RO LT
Exports at constant prices

59 ANNUAL REPORT ON EUROPEAN SMES 2013/2014: A PARTIAL AND FRAGILE RECOVERY
Key macroeconomic determinants of growth of SME employment:
For accommodation and trade firms, the factors that affect employment growth are household expenditure and intermediate demand by other sectors;
Gross fixed capital formation by households and governments significantly affects both construction and business services; The growth of value added in the total economy (the proxy for intermediate demand)
has a significant effect on the employment growth of all sectors.

60 ANNUAL REPORT ON EUROPEAN SMES 2013/2014: A PARTIAL AND FRAGILE RECOVERY
3.2 Internationalisation of SMEs
The previous section highlighted the fact that the impact of developments in the various aggregate demand components varies markedly across the economic sectors in which SMEs are particularly active and the first section of this chapter has brought to the fore the importance of the growth in exports of goods and services to the overall economic recovery and the . Therefore, the present section looks at the impact of foreign demand from a different angle by focusing on the export performance of SMEs and assessing the involvement of SMEs in export-oriented industries. The analysis below focuses on the following questions:
What is the relevance of internationalisation for SMEs?
To what extent do European SMEs export?
Are European SMEs located in export-inclined industries?
What are the indirect benefits of exports for the (domestic) value chain?
3.2.1 General discussion of the internationalisation of SMEs
Internationalisation has become increasingly important to the competitiveness of enterprises of all sizes. In today’s environment, SMEs that start with a global strategy can move quickly to take advantage of cross-border activities, which provide opportunities not only for revenue growth but also for the exchange of knowledge and the enhancement of capabilities, thereby strengthening the long-term competitiveness of the firm. Despite the common understanding of the importance of internationalisation, there are still many internal and external barriers that impede the internationalisation of SMEs. Moreover there is a lack of data on the actual export performance of SMEs and the challenges and issues they face.
A few key facts on the internalisation of the EU-28 SMEs A 2009 study by the Commission analysed all activities that put SMEs into a meaningful business relationship with a foreign partner: exports, imports, foreign direct investment, international subcontracting and international technical co-operation.28
KEY FINDINGS
After 2008, exports were the key growth driver in many EU Member
States
Involvement of SMEs in export activities still limited in EU28: o Share of exporting SMEs below 30% (for trade in goods) o Propensity to export grows with size of the firm o SMEs (particularly micro) are mostly located in sectors with
low export intensity
But exports have a ripple effect on the whole value chain: o For example, an increase of 10% in EU exports increases value
added of the manufacturing sector by 2.7% and of the construction sector by 0.2%.

61 ANNUAL REPORT ON EUROPEAN SMES 2013/2014: A PARTIAL AND FRAGILE RECOVERY
The most relevant finding was that 25% of EU27 SMEs export or have exported at some point during the last 3 years. However, international activities are mostly geared towards other countries inside the internal market and only about 13% of EU SMEs are active in markets outside the EU. The results showed that export-oriented SMEs show higher growth of turnover and employment than SMEs catering for the domestic market. In addition, export oriented SMEs are also more innovative. Hence, the study concluded that it is in the public interest to support SMEs to internationalise. The study also presented evidence of the need to support greater internationalisation:
International SMEs create more jobs: internationally active SMEs report an employment growth of 7% versus only 1% for SMEs without any international activities;
International SMEs are more innovative: 26% of internationally active SMEs introduced products or services that were new for their sector in their country; for other SMEs this is only 8%;
Public support goes largely un-noticed: only 16% of SMEs are aware of public support programmes for internationalisation and only a small number of SMEs use public support;
European SMEs are more internationally active than US and Japanese SMEs. Overall, European firms are more active than their counterparts in Japan or the US. Even if only extra EU exports are considered they still perform better;
Most often SMEs start international activities by importing. SMEs that both import and export started with import twice as often (39%) than with exports (18%). A subsequent study, which was focused on opportunities for the internationalisation of SMEs in 12 external markets, reviewed ways of better connecting European SMEs to international markets, and specific measures to facilitate the access of European SMEs to these markets. According to the study’s results, internationalised European SMEs derive only a small share of their turnover from business activities from third markets (as shown in Figure 41).

62 ANNUAL REPORT ON EUROPEAN SMES 2013/2014: A PARTIAL AND FRAGILE RECOVERY
Figure 41: Distribution of total turnover among three market areas, average percentage turnover of internationalised SMEs
Other key findings include the following:
42% of EU SMEs are engaged in some form of internationalisation;
25% of EU SMEs are exporting;
13% of EU SMEs are exporting to third countries;
Importing is often the first stage in the internationalisation process for SMEs;
Only 10% of the turnover of the (42%) internationalised SMEs is from clients in third countries.
Figure 42: For various modes of internationalisation, the percentage of SMEs in EU27 involved in international business activities, having concrete plans to start or none at all

63 ANNUAL REPORT ON EUROPEAN SMES 2013/2014: A PARTIAL AND FRAGILE RECOVERY
Despite all the existing support mechanisms in place both at national and EU levels aiming to help SMEs in their internationalisation, many barriers still exist - both internal to the firm and external. External factors impeding the internationalisation of SMEs include national and international administrative rules as well as formal and informal trade barriers. Internal barriers for SMEs trying to internationalise can include cultural differences, lack of information or skills, insufficient networks, language barriers and lack of access to necessary finance.
The Commission study on internationalisation opportunities for SMEs in 2011 also found that SMEs face particular obstacles to tapping the global market, not least when it comes to access to
market information, locating possible customers and finding the right partners, even though international markets offer substantial opportunities for European companies. They face more complex issues such as compliance with foreign laws, for example mandatory rules of contract law, customs rules, technical regulations and standards, managing technology transfer and protecting intellectual or industrial property rights. In dealing with such challenges SMEs are usually less well equipped than larger enterprises with in-house expertise and financial or human resources. Considering firms of all sizes, the meta-analysis of the academic literature shows a generally positive relationship between internationalisation and performance. However, for small-scale companies, investigation of impact of internationalisation on performance delivers more ambiguous results. When considering firms of all sizes, size of the firm is expected to be inversely related to the degree of internationalisation: to simplify, the larger the firm the higher its involvement in international activities (trade, investment). However, academic literature shows an absence of correlation for SMEs between size of the firms and export intensity - as measured by the ratio of exports to sales. This means that the smallest firms are not necessarily those exporting the least, among the SMEs. This is likely to be due to the existence of a niche strategy for some small and micro-enterprises that subsequently exhibit very high export levels. Moreover, recent studies29 have shown that internationalising sales improves survival probabilities and is correlated with innovation levels. In terms of SME export orientation:
A 2012 Department for Business, Innovation and Skills Small Business Survey noted the number of UK “SMEs whose export is falling, with 19% of small businesses categorised as exporters, down from 24% before the financial crisis. This is below the EU average of 25%”. 30
3.2.2 European SMEs’ overall propensity to export
While internationalisation can take many forms (exports, imports, foreign direct investment, international subcontracting), export and import activities are the most common among EU SMEs, and exports will be the main focus of this section.

64 ANNUAL REPORT ON EUROPEAN SMES 2013/2014: A PARTIAL AND FRAGILE RECOVERY
Export performance of goods-producing SMEs In 2011, in the majority of the EU27, the share of SMEs exporting goods in the total number of SMEs in the goods=producing industry sector was well below 30%. It is worth noting that the size of the country may explain to some extent higher tendency of SMEs to engage in international exports of goods as the countries with the highest shares of such SMEs are Luxembourg, Estonia, Ireland (for extra-EU flows), Denmark, Austria, and Belgium (Figure 43). 31
Figure 43: Share of exporting SMEs in the EU27, industry sectors
Note: “industry” refers to NACE sections B, C, D, E. Source: Eurostat- COMEXT statistics on international trade in goods
Additional evidence on exporting SMEs In a set of 5 countries, which together account for almost 60% of EU SMEs, the number of exporting SME firms in recent years32 does not reach 12% (Table 9). The overall percentages are very low and range from a low of 4% in Italy and Spain to 11% in Germany and the United Kingdom. As will be seen in the next section, this low export propensity is mainly due to the fact that in all EU economies, micro firms account for the majority of enterprises and generally show a very low propensity to export. The tendency to export grows progressively with size, and large enterprises are those showing the highest export propensity in all five countries.
Table 9: Exporting SMEs in 5 largest EU28 countries by number of SMEs (absolute levels and in 5 of total)
Italy
(2011)
France (2013)
Spain
(2010)
Germany
(2010)
United Kingdom
(2011)
Number of exporting firms by size class
0-9 122,851 90,811
(0-20 p)
26,519 255,500 153,300
10-49 55,118 64,239 66,200 34,400
50-249 10,739 25,421
(20 to 250 p) 14,267 23,500 10,600
Large 1,936 3,403 2,702 8,400 2,900
Total 190,851 119,635 107,728 353,600 201,200
Percentage of exporting firms over total number of firms by size class
0%
10%
20%
30%
40%
50%
FR CY MT SK CZ EL IE PL FI ES EU27 RO BG SE PT IT HU DE LT UK SI DK AT LV BE EE LU
Intra EU27 exports Extra-EU27 exports

65 ANNUAL REPORT ON EUROPEAN SMES 2013/2014: A PARTIAL AND FRAGILE RECOVERY
0-9 3% 4%
(0 to 250 p)
1% 9% 9%
10-49 29% 48% 47% 20%
50-249 49% 85% 68% 34%
Large 54% 70% 93% 80% 41%
Total 4% 5% 4% 11% 11% Source: Italy: elaboration of SME database and “Commercio Estero e attivita’ internazionali delle imprese 2013”; France: elaboration of SME database and “Le chiffre du commerce exterieur- a2012”; Spain:elaboration of SME database and “Informe Sobre la Pyme 2012, Dirección General de Industria y de la Pequeña y Mediana Empresa”; Germany: elaboration of SME database and ”Außenwirtschaftsaktivitäten von kleinen und mittleren Unternehmen im Lichte der amtlichen Statistik”; United Kingdom: Annual Business Survey
3.2.3 Key facts about the involvement of SMEs in export-oriented industries
In order to gain a deeper understanding of the involvement of SMEs in exports of goods and services and overcome the problem of a lack of comprehensive data on export participation by SMEs, the analysis below focuses on the export intensity of the various economic sectors in which SMEs are active. To that end, the SME data assembled for the purpose of the 2014 SME Review 33 is combined with information from Eurostat’s Input Output tables.34 The latter provide detailed information on a sector’s export sales.35. The present analysis focuses on the EU27 as the input-output data from Eurostat do not yet cover Croatia. The export intensity indicator of a particular industry is defined as the ratio of exports over total sales for each industry. Export intensity is defined as ranging from “very low” (the share of exports over total sales of an industry is less than 5%) to “low” (5% to less than 10%), “medium” (10% to less than 20%), “high” (20% to less than 40%) and “very high” (more than 40%). Each industry is then allocated to one of these export classes and, for each enterprise class (micro, small, medium, large), the share of a particular export class in the total value added and employment of the enterprise class is computed. The figure below clearly shows that export-participation (in terms of number of enterprises) in export-oriented industries increases with the enterprise size. The vertical axis on the figure below (Figure 44) measures export intensity while the horizontal axis measures the share of each enterprise size class in the total enterprise population.36

66 ANNUAL REPORT ON EUROPEAN SMES 2013/2014: A PARTIAL AND FRAGILE RECOVERY
Overall, 70% of micro SMEs and 60% of small SMEs are active in industries with very low or low export intensity and only 15% of micro SMEs and 24% of small SMEs are active in industries characterised by high or very high export intensity. In contrast, 35% of medium SMEs and 39% of large enterprises are active in industries with high or very high export intensity and only 47% of medium SMEs and 43.5% of large enterprises are active in industries with very low or low export intensity.
Figure 44: Distribution of the population of SMEs and large enterprises across different export-intensity classes – EU27, 2009
Source: Elaboration of SME database and Eurostat – Input Output tables EU27
A similar picture emerges from an analysis of the distribution by value added and export intensity size class. The value added generated by micro and small SMEs is concentrated in industries with a very low export focus. Their share in very low and low export-oriented industries accounts for 70% and 55% of their respective total value added. In contrast, 40% and 41% respectively of the total value added of medium and large firms is generated in high and very high export intensive sectors.
Figure 45: Distribution of the value added generated by SMEs and large enterprises across different export-intensity classes –EU27, 2009
Source: Elaboration of SME database and Eurostat – Input Output tables EU27
The analysis clearly shows that, while exports are important for a group of SMEs, the vast majority of SMEs, especially micro and small SMEs, operate in industries with very
micro enterprises small enterprises
me
diu
m e
nte
rpri
ses
larg
e e
nte
rpri
ses
0%
20%
40%
60%
80%
100%
0% 10% 20% 30% 40% 50% 60% 70% 80% 90% 100%
Shar
es
of e
nte
rpri
ses
by
sect
or
exp
ort
inte
sity
Share over total number of enterprises by size
very low export intensity low medium high very high export intensity
micro enterprises small enterprises medium enterprises large enterprises
0%
20%
40%
60%
80%
100%
0% 10% 20% 30% 40% 50% 60% 70% 80% 90% 100%
Shar
es
of v
alu
e a
dd
ed
by
exp
ort
in
tesi
ty
Share over total economy value added by size
very low export intensity low medium high very high export intensity
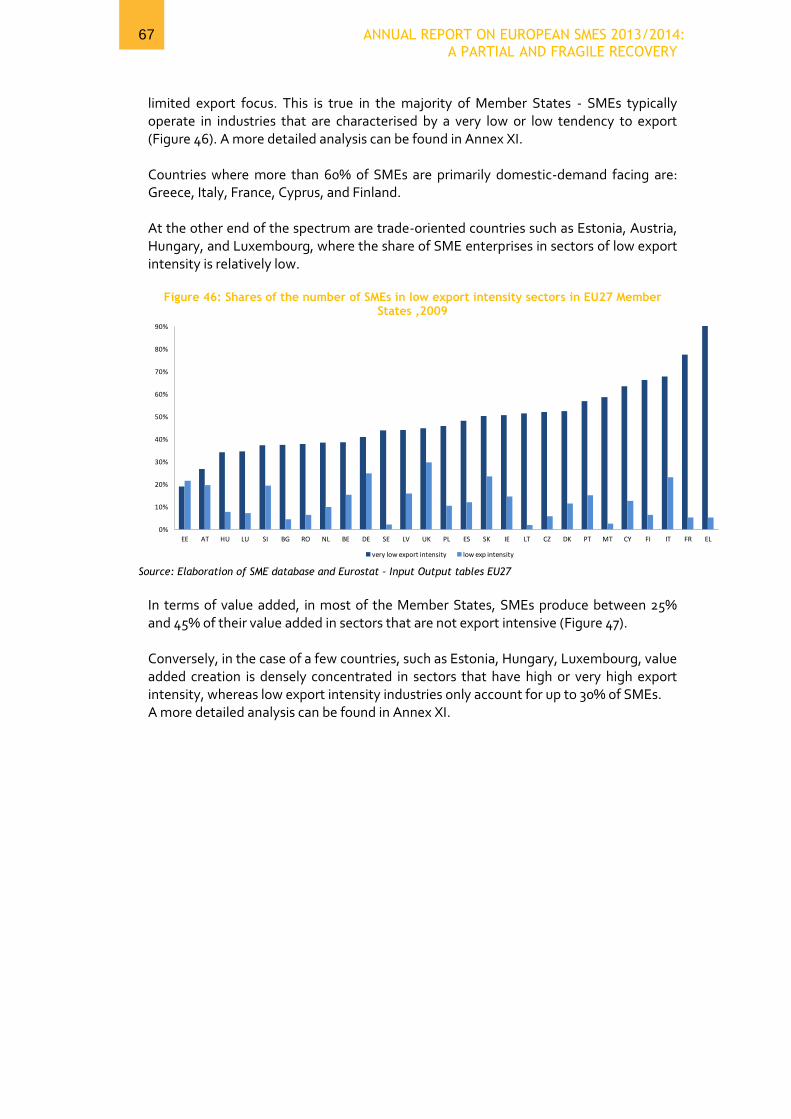
67 ANNUAL REPORT ON EUROPEAN SMES 2013/2014: A PARTIAL AND FRAGILE RECOVERY
limited export focus. This is true in the majority of Member States - SMEs typically operate in industries that are characterised by a very low or low tendency to export (Figure 46). A more detailed analysis can be found in Annex XI.
Countries where more than 60% of SMEs are primarily domestic-demand facing are: Greece, Italy, France, Cyprus, and Finland. At the other end of the spectrum are trade-oriented countries such as Estonia, Austria, Hungary, and Luxembourg, where the share of SME enterprises in sectors of low export intensity is relatively low.
Figure 46: Shares of the number of SMEs in low export intensity sectors in EU27 Member States ,2009
Source: Elaboration of SME database and Eurostat – Input Output tables EU27
In terms of value added, in most of the Member States, SMEs produce between 25% and 45% of their value added in sectors that are not export intensive (Figure 47). Conversely, in the case of a few countries, such as Estonia, Hungary, Luxembourg, value added creation is densely concentrated in sectors that have high or very high export intensity, whereas low export intensity industries only account for up to 30% of SMEs. A more detailed analysis can be found in Annex XI.
0%
10%
20%
30%
40%
50%
60%
70%
80%
90%
EE AT HU LU SI BG RO NL BE DE SE LV UK PL ES SK IE LT CZ DK PT MT CY FI IT FR EL
very low export intensity low exp intensity

68 ANNUAL REPORT ON EUROPEAN SMES 2013/2014: A PARTIAL AND FRAGILE RECOVERY
Figure 47: Shares of the value added generated by SMEs in low export intensity sectors in EU27 Member States, 2009
Source: Elaboration of SME database and Eurostat – Input Output tables EU27
3.2.4 Impact of increase in foreign demand on economic sectors of key importance for SMEs
The analysis above shows that the vast majority of SMEs are not operating in industries with a strong export focus. However, this does not mean that such SMEs would not benefit from a boost in exports, as any increase in foreign demand will create a ripple effect in the domestic economy. This ripple effect arises when industries benefiting from an increase in foreign demand increase their employment and purchases of goods and services from suppliers to meet the additional foreign demand, and in turn this increase in employment and production at suppliers will further boost employment and production in other industries. The multiplier37 measures the overall impact on all industries of an increase in demand which in the first instance is directed towards a particular industry. The table below shows the impact on the key SME sectors of an increase of 10% in exports of all industries in the economy. The first column in the Table 10 shows the share of exports in a particular economic sector. For example, manufacturing exports 16.4% of its value added while construction exports only 0.3% of its value added. The second column in the table shows, for each economic sector, the increase in value added (in percentage terms) that results directly and indirectly from an increase of 10% in all the exports of the EU economy, and the third and fourth columns show the direct and indirect effect separately. . For example, an increase of 10% in EU exports directly increases value added of the manufacturing sector by 1.6% and indirectly by 1.1%.
0%
10%
20%
30%
40%
50%
60%
70%
80%
EE HU LU BE SI AT NL IE BG DE LT LV DK PT CZ MT ES UK PL SK RO SE IT FI CY FR EL
very low export intensity low exp intensity
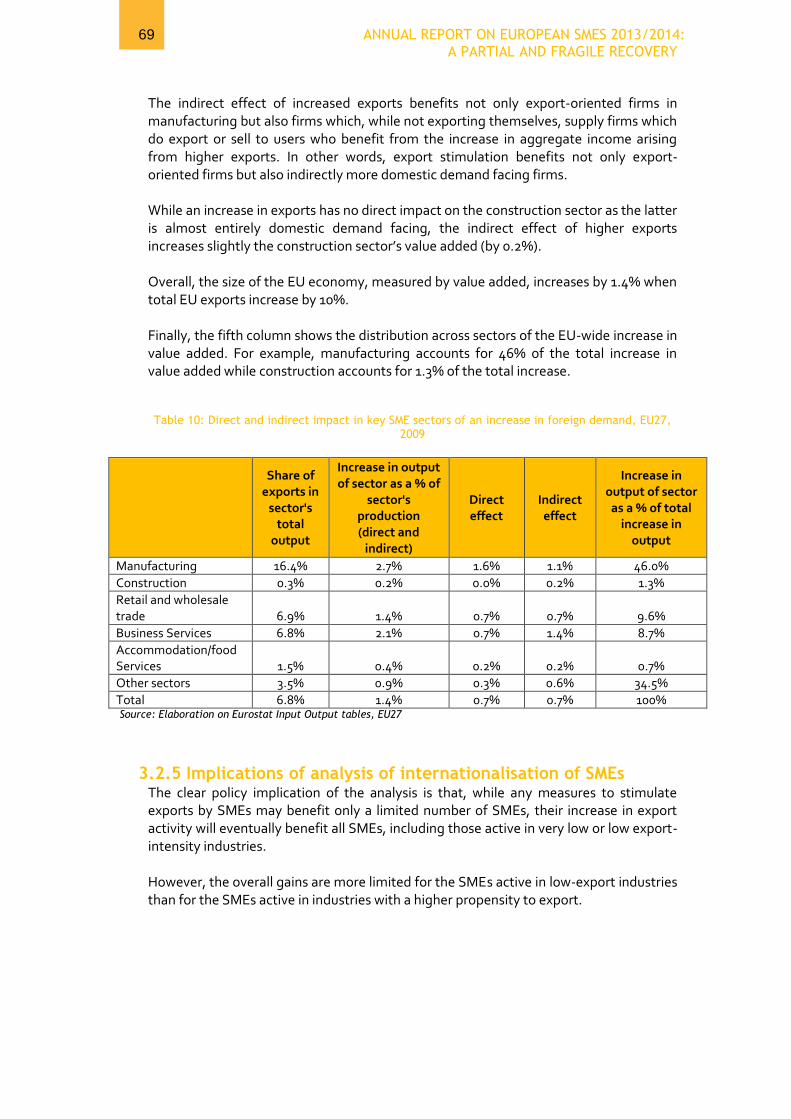
69 ANNUAL REPORT ON EUROPEAN SMES 2013/2014: A PARTIAL AND FRAGILE RECOVERY
The indirect effect of increased exports benefits not only export-oriented firms in manufacturing but also firms which, while not exporting themselves, supply firms which do export or sell to users who benefit from the increase in aggregate income arising from higher exports. In other words, export stimulation benefits not only export-oriented firms but also indirectly more domestic demand facing firms. While an increase in exports has no direct impact on the construction sector as the latter is almost entirely domestic demand facing, the indirect effect of higher exports increases slightly the construction sector’s value added (by 0.2%). Overall, the size of the EU economy, measured by value added, increases by 1.4% when total EU exports increase by 10%. Finally, the fifth column shows the distribution across sectors of the EU-wide increase in value added. For example, manufacturing accounts for 46% of the total increase in value added while construction accounts for 1.3% of the total increase.
Table 10: Direct and indirect impact in key SME sectors of an increase in foreign demand, EU27, 2009
Share of exports in
sector's total
output
Increase in output of sector as a % of
sector's production (direct and
indirect)
Direct effect
Indirect effect
Increase in output of sector
as a % of total increase in
output
Manufacturing 16.4% 2.7% 1.6% 1.1% 46.0%
Construction 0.3% 0.2% 0.0% 0.2% 1.3%
Retail and wholesale trade 6.9% 1.4% 0.7% 0.7% 9.6%
Business Services 6.8% 2.1% 0.7% 1.4% 8.7%
Accommodation/food Services 1.5% 0.4% 0.2% 0.2% 0.7%
Other sectors 3.5% 0.9% 0.3% 0.6% 34.5%
Total 6.8% 1.4% 0.7% 0.7% 100% Source: Elaboration on Eurostat Input Output tables, EU27
3.2.5 Implications of analysis of internationalisation of SMEs The clear policy implication of the analysis is that, while any measures to stimulate exports by SMEs may benefit only a limited number of SMEs, their increase in export activity will eventually benefit all SMEs, including those active in very low or low export-intensity industries.
However, the overall gains are more limited for the SMEs active in low-export industries than for the SMEs active in industries with a higher propensity to export.

70 ANNUAL REPORT ON EUROPEAN SMES 2013/2014: A PARTIAL AND FRAGILE RECOVERY
3.3 High tech manufacturing and
knowledge intensive service SMEs:
drivers of innovation and growth?
3.3.1 SMEs in high tech manufacturing and knowledge intensive services in 2013 in EU28
High tech and knowledge intensive SMEs are important contributors to a country’s innovation capabilities and its future growth potential. Overall, the high tech intensity of the EU28 manufacturing industry is relatively low, and this is true for both SMEs and large firms:
In the EU28, in 2013, only 2% of manufacturing SMEs were involved in high-tech industries, and, in the case, of large firms the equivalent figure is 7%;
However, the contribution of high-tech enterprises to value added generation is about twice as important. High tech SMEs generate roughly 6% of manufacturing value added while large high tech firms account for 13% of manufacturing value added;
SMEs in high tech manufacturing sectors account for 4% of SME manufacturing employment.
KEY FINDINGS
High tech and knowledge intensive SMEs are important contributors to a
country’s innovation capabilities and its future growth potential
In the EU, only 2% of manufacturing SMEs are involved in high-tech
About 30% of SMEs in the services industry are operating in knowledge
intensive activities, and they generate more than a ⅓ of total value added
produced by SMEs in services sectors
Key factors for the development of High Tech manufacturing and
Knowledge Intensive services:
o investment in the renewal of operating capital, in particular: gross
fixed capital formation and investment in technology intensive capital
(information and communication technologies),
o appropriate labour market policies
o public investments in education and training

71 ANNUAL REPORT ON EUROPEAN SMES 2013/2014: A PARTIAL AND FRAGILE RECOVERY
Figure 48: Share (%) of high-tech on total manufacturing, SMEs and large enterprises, EU28, 2013
Source : Eurostat, National Statistical Offices and DIW Econ
In most EU28 Member States, high-tech manufacturing SMEs account for between less than 1% and 10% of manufacturing value added (annex XVI of the statistical background document). However, in countries like Ireland and Malta, high tech SMEs play a particularly important role:
in Ireland more than 30% of manufacturing value added is generated by high tech manufacturing SMEs; and,
in Malta the comparable figure is 18%.
Figure 49: Share (%) of high tech manufacturing over total manufacturing, EU 28 SMEs, 2013
Source : Eurostat, National Statistical Offices and DIW Econ
About 30% of SMEs in the services industry are operating in knowledge intensive activities, and they generate more than a ⅓ of total value added produced by SMEs in services sectors.
0%
20%
40%
60%
80%
100%
Enterprises Value AddedEmployment Enterprises Value AddedEmployment
SMEs Large
High Tech Medium and Low Tech
0%
5%
10%
CYLU
SK
PT
PL
SI
EE
ES
HR
CZ
RO
LTBE
ATBGIT
FR
SE
LV
NL
HU
DK
DE
FI
UK
MTIE
Enterprises Value Added Employment
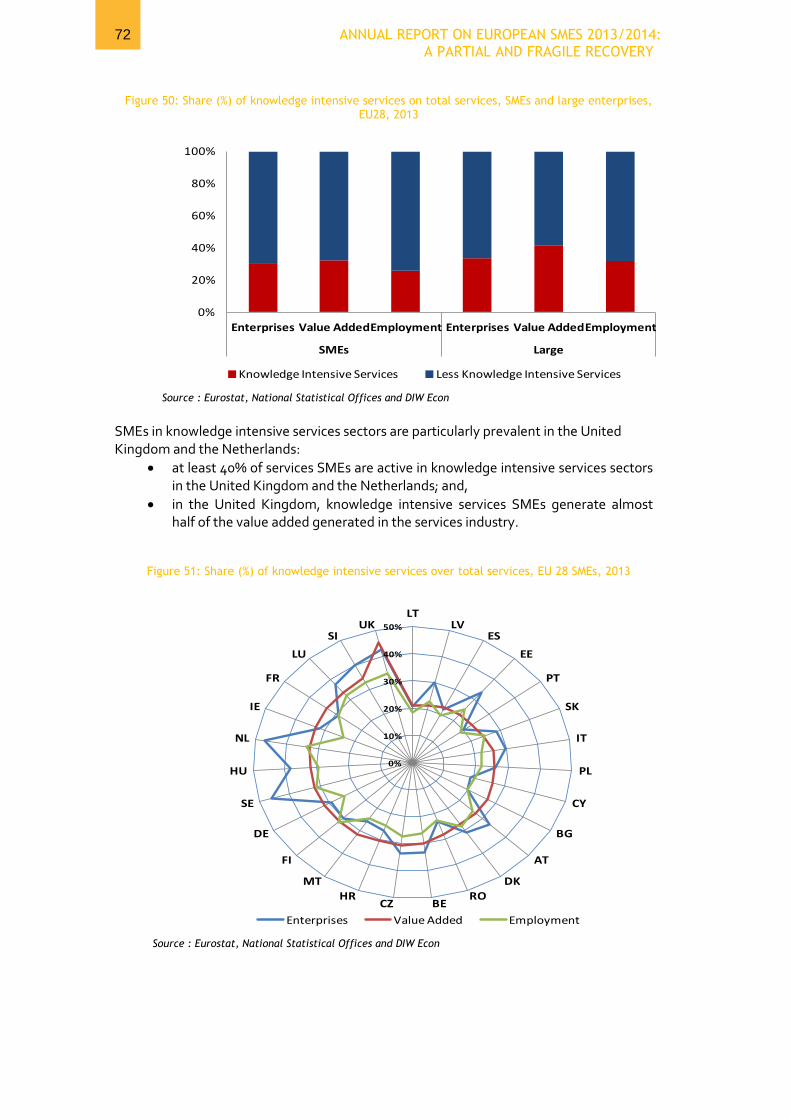
72 ANNUAL REPORT ON EUROPEAN SMES 2013/2014: A PARTIAL AND FRAGILE RECOVERY
Figure 50: Share (%) of knowledge intensive services on total services, SMEs and large enterprises, EU28, 2013
Source : Eurostat, National Statistical Offices and DIW Econ
SMEs in knowledge intensive services sectors are particularly prevalent in the United Kingdom and the Netherlands:
at least 40% of services SMEs are active in knowledge intensive services sectors in the United Kingdom and the Netherlands; and,
in the United Kingdom, knowledge intensive services SMEs generate almost half of the value added generated in the services industry.
Figure 51: Share (%) of knowledge intensive services over total services, EU 28 SMEs, 2013
Source : Eurostat, National Statistical Offices and DIW Econ
0%
20%
40%
60%
80%
100%
Enterprises Value AddedEmployment Enterprises Value AddedEmployment
SMEs Large
Knowledge Intensive Services Less Knowledge Intensive Services
0%
10%
20%
30%
40%
50%
LTLV
ES
EE
PT
SK
IT
PL
CY
BG
AT
DK
ROBECZ
HR
MT
FI
DE
SE
HU
NL
IE
FR
LU
SIUK
Enterprises Value Added Employment

73 ANNUAL REPORT ON EUROPEAN SMES 2013/2014: A PARTIAL AND FRAGILE RECOVERY
3.3.2 Performance of EU28 SMEs high tech manufacturing and knowledge intensive services from 2009 to 2012
Overall, over the period 2009-201238, the knowledge intensive SMEs are not performing any better than the non-knowledge intensive SMEs in the non-financial business sector in terms of real value added growth even if the degree of variation (indicated by the standard deviation statistics) is particularly higher in the case of knowledge intensive services SMEs. On the other hand, high tech manufacturing SMEs have recorded an increase in real value added of 12% between 2009 and 2012 which contrasts with 7.8% increase in value added by the private, non-financial, business sectors and the 2% increase in real value added of the knowledge intensive service SMEs. In terms of employment, the high-tech manufacturing SMEs performed rather poorly, with an overall decline of 6% whilst employment in the private, non-financial business sectors decline only by less than 1%. Noteworthy is the trend of employment in the knowledge intensive service SMEs, which, between 2009 and 2012 grew by over 7%.
Table 11: Descriptive statistics on EU28 high tech and knowledge intensive industries
EU28 cumulative growth rate (2009-2012)
Mean cumulative growth rate of EU28 Member States (2009-2012)
Standard deviation of cumulative growth rate across EU28 Member States
Minimum cumulative growth rate shown by Member States
Maximum cumulative growth rate shown by Member States
SMEs in non-financial business sector
Value added (*) 7.78% 5.13% 0.0265 -33.23% 31.70%
Employment- (*) -0.75% -1.46% 0.0129 -17.60% 9.05%
(Greece) (Germany)
High teach manufacturing SMEs
Value Added (*) 12.04% 5.25% 0.1984 -37.97% 42.10%
(Croatia) (Latvia)
Employment (*) -6.04% -3.07% 0.1363 -22.49% 26.95%
(Greece) (Denmark)
Knowledge intensive services SMEs
Value Added (*;**) 2.03% 0.80% 0.1814 -45.07% 42.90%
(Luxembourg) (UK)
Employment (*) 7.17% 5.24% 0.1815 -27.30% 67.70%
(Greece) (Estonia) Note: Value added is adjusted for inflation by deflating by the GDP deflator (base year 2009)* Values for Slovakia in 2009 are not included** Cyprus not included in the analysis Source : elaboration on Eurostat, National Statistical Offices and DIW Econ
In 2009 and 2010, in terms of value added (at constant prices), the high-tech sector outperformed the private, non-financial business sectors until 2011, and larger
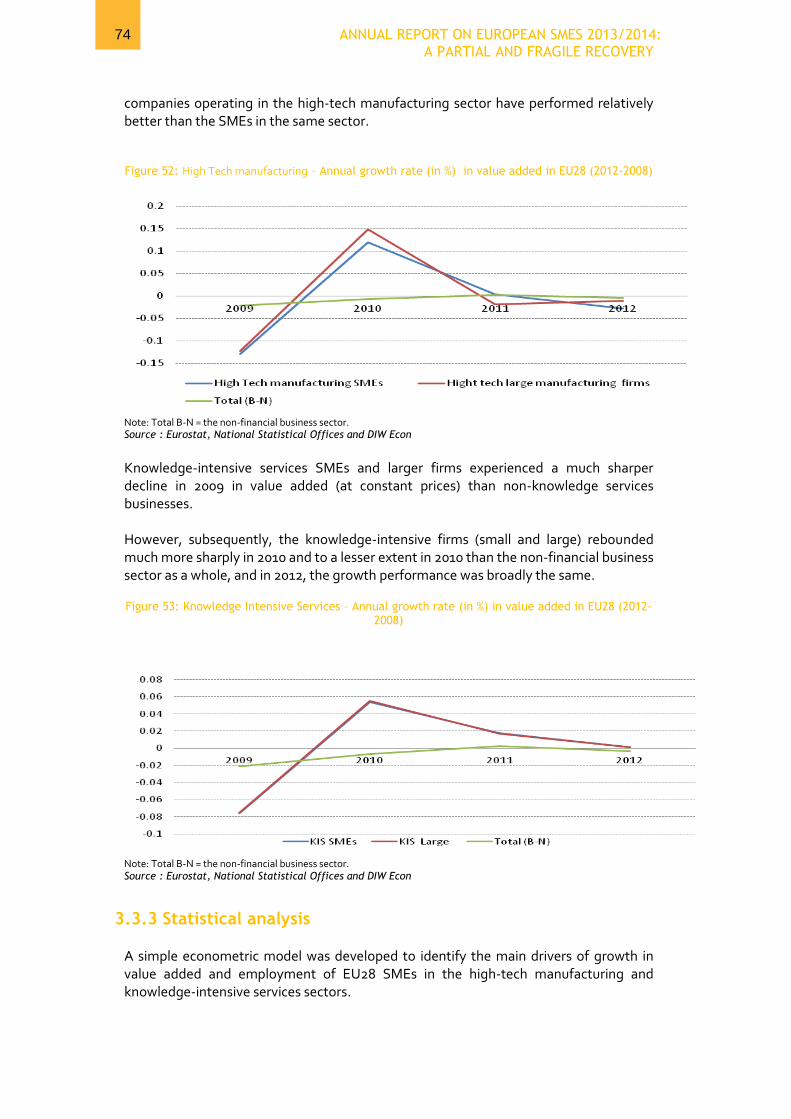
74 ANNUAL REPORT ON EUROPEAN SMES 2013/2014: A PARTIAL AND FRAGILE RECOVERY
companies operating in the high-tech manufacturing sector have performed relatively better than the SMEs in the same sector.
Figure 52: High Tech manufacturing – Annual growth rate (in %) in value added in EU28 (2012-2008)
Note: Total B-N = the non-financial business sector. Source : Eurostat, National Statistical Offices and DIW Econ
Knowledge-intensive services SMEs and larger firms experienced a much sharper decline in 2009 in value added (at constant prices) than non-knowledge services businesses. However, subsequently, the knowledge-intensive firms (small and large) rebounded much more sharply in 2010 and to a lesser extent in 2010 than the non-financial business sector as a whole, and in 2012, the growth performance was broadly the same.
Figure 53: Knowledge Intensive Services – Annual growth rate (in %) in value added in EU28 (2012-2008)
Note: Total B-N = the non-financial business sector. Source : Eurostat, National Statistical Offices and DIW Econ
3.3.3 Statistical analysis A simple econometric model was developed to identify the main drivers of growth in value added and employment of EU28 SMEs in the high-tech manufacturing and knowledge-intensive services sectors.

75 ANNUAL REPORT ON EUROPEAN SMES 2013/2014: A PARTIAL AND FRAGILE RECOVERY
The variables to be explained by the econometric analysis are the cumulative growth from 2009 to 2011 in EU28 SME value added and employment in the in the high-tech manufacturing and knowledge-intensive services sectors. Key findings of the statistical analysis are reported below and the detailed empirical results are presented in the standalone working paper “High tech manufacturing and knowledge intensive service SMEs in Europe: Drivers of innovation and growth? -Working paper for the Annual Report of European SMEs 2013/2014”. High tech manufacturing The main factors which are found to explain the cross- country variation in the cumulative growth in value added generated over the period 2009-2012 by SMEs in the high tech manufacturing sector in the EU28 are:
the cost of continual vocational training courses as a percentage of total labour cost in 2010;
the share of high tech manufacturing SME value added over total manufacturing value added;
business expenditures in R&D across all sectors of the economy;
the share of research and development personnel in the business sector as a percentage of the labour force.39
Over the period of interest, growth in EU28 high tech manufacturing SME value added is linked to economies of scale in the high tech manufacturing sector. The growth of the relative weight of EU28 high tech manufacturing SME value added over the total manufacturing is positively associated with the growth of High Tech manufacturing SMEs value added and statistically significant. This indicates that the sector is subject to economies of agglomeration. Further evidence is provided by a review of the evolution of the number of high-tech manufacturing in relation to the number of other manufacturing enterprises in the economy. These data show that numbers of high tech manufacturing firms tended to grow even though the number of other manufacturing firms is decreasing in those countries where the ratio high tech manufacturing/total manufacturing is relatively higher. Science and Technology factors such as increase in investments in business R&D and R&D personnel are also positively linked to increase in value added generated by high tech manufacturing SMEs. Both variables are statistically significant.
Knowledge-intensive services
Over the period 2009-2011, the statistical analysis reported in the Working Paper shows that the drivers of the growth in the value added of the knowledge-intensive industries in the EU28 are
the growth of gross fixed capital formation;
the value added of medium-high tech firms as a share of total manufacturing value added;
labour market policies as represented by an overall index;
total annual expenditure on public and private educational institutions per pupil in primary, secondary and tertiary education; and
76 ANNUAL REPORT ON EUROPEAN SMES 2013/2014: A PARTIAL AND FRAGILE RECOVERY
share of human resources in Science & Technology as percentage of the active population.
Investments in human resources and physical investments stimulate value added performance of SMEs in knowledge-intensive services. Both variables are statistically significant. Labour market policies (including public expenditure on labour policies such as training, labour market services and subsidies) have also a beneficial effect on value added generated by SMEs in knowledge intensive services. Moreover, public expenditure on education is also positively associated with growth of value added by SMEs in knowledge intensive services.
3.3.4 Implications of statistical findings The performance of SMEs in EU28 high-tech manufacturing SMEs depends on a multiplicity of factors, all substantially related to the economy’s effort in Science, Technology and Innovation. In particular, real value added growth by SMEs in EU28 high tech manufacturing is linked to growth in R&D investments, both nationwide ad sector specific, the growing availability of R&D personnel and the increase of technological investments especially in information and communication technologies. Moreover, the increased attractiveness of the sector to young and skilled workers is a further element of superior performance. The key conclusions emerging from the study of EU28 knowledge intensive services SMEs differs from that of the high-tech manufacturing SMEs in many aspects. Factors such as high educational attainments by the workforce are essential for a thriving SME sector in the knowledge intensive services. Overall, the policy implications which emerge from the literature review and the statistical analysis pointing towards three main (complementary) directions:
Investment in the renewal of operating capital, in particular: gross fixed capital formation and investment in technology intensive capital (information and communication technologies).
Labour market policies
Public investments in education and training

77 ANNUAL REPORT ON EUROPEAN SMES 2013/2014: A PARTIAL AND FRAGILE RECOVERY
4 CONCLUSIONS
4.1 Key Findings
After promising signs last year, there are some reasons for cautious optimism - but the inescapable conclusion is that conditions remain extremely tough for SMEs and further support is needed to yield sustainable SME growth. While exports provide a much needed stimulus to many EU economies, most SMEs do not benefit in any major way directly from the growth in foreign demand for goods and services as they are active in industries which are mainly catering to the needs of domestic demand. Across the EU28 last year, some 21.6 million SMEs in the non-financial business sector employed 88.8 million people and generated €3,666 trillion in value added. Expressed another way, 99 out of every 100 businesses in this sector are SMEs, as are 2 in every 3 employees and 58 cents in every euro of value added. This illustrates how critical SMEs are. The financial crisis and the economic recession have hit SMEs hard in the EU28 and the economic conditions remain difficult. Overall, in the EU28 in 2013 the value added generated by SMEs was just 1% above 2008 levels and employment was still 2.6% below levels registered in 2008. This overall situation masks a great deal of heterogeneity as the performance of SMEs varies considerably among size classes, sectors and Member States:
Micro SMEs suffered the biggest decline in total number and number of employees between 2008 and 2013 in the EU28
In the construction and manufacturing sectors value added in 2013 is still below 2008 levels, while in the other key SME sectors (i.e. “professional, scientific and technical activities", "accommodation and food" and "wholesale and retail trade, repair of motor vehicles and motorcycles") EU28 value added is now above its 2008 level
In 2013, the SMEs have exceeded their 2008 (pre-crisis) performance only in a limited number of Member States .
The triple divide of the SME performance among SME size class, sectors of activity and Member States suggests that a multi-pronged policy approach is required to support SMEs throughout Europe and support a sustainable recovery of the SME sector in the year ahead. Depressed demand for the goods and services SME produce is the key factor explaining why SME performance has not yet recovered to pre-recession levels in a number of Member States. SMEs depend critically on improvements in overall macroeconomic conditions in these countries. Other key challenges influencing the performance of SMEs are found to be the difficulties in accessing to finance, finding customers, doing business, high costs of production and labour as well as the lack of skilled staff. Looking ahead, the outlook is moderately positive with the promise of some strengthening of the recovery on the horizon. Total value added isexpected to rise by 2.8% in 2014 and 3.4% in 2015. This would galvanise a virtuous cycle, with employment levels and the number of SMEs also returning to positive growth.

78 ANNUAL REPORT ON EUROPEAN SMES 2013/2014: A PARTIAL AND FRAGILE RECOVERY
4.2 Conclusions and Policy recommendations
The results of this report clearly highlight the need for SME size-classes and sectoral differentiation in the design and implementation of new policies and regulations. Also, micro-SMEs and solo entrepreneurs should be treated differently. In the Member States where the SME sector has already surpassed its pre-recession levels, additional micro SME targeted policies (e.g. fiscal exemptions, less regulatory requirements, etc.) could potentially contribute significantly to ensuring the sustainability of the sector’s partial, yet fragile recovery. In addition, it is important to take into account when developing SME policies that the majority of SMEs operate in sectors characterised by low export intensity and only a relatively small proportion of SMEs operate in high-tech manufacturing or knowledge-intensive services.
In order to ensure sustainable SME growth and performance, the main challenges facing SMEs should be addressed effectively through the development and implementation of new and innovative policy solutions. For instance, even though a great deal of policy focus has been dedicated to improving access to finance for SMEs over the last couple of years, the SBA implementation assessment has shown that it is still a
main barrier for SMEs. Thus, it is necessary to launch new solutions, such as the implementation of a "Secondary Stock Exchange Market for the SMEs", in addition to improving the efficiency of the existing financing schemes. This includes efforts to increase the market uptake of EU-based funding schemes via the EIB Group at the national level. This could be achieved through the increase in the number of financial intermediaries at the national level, the reduction of the administrative burden and the increase in the awareness of all existing support schemes among SMEs and financial intermediaries. In addition, SMEs should be guided and supported through the entire process of accessing finance via dedicated one-stop-shops where appropriate solutions according to their size, sector and purpose (e.g. for R&D, innovation, expansion, modernisation of manufacturing, implementation of energy efficiency solutions, internationalisation, digitisation, etc) are readily available and provided. With regards to the other main challenges facing SMEs, such as the difficulty in finding customers, doing business, and the high costs of production and labour, this can not only be solved with SBA policies, but through the combination of horizontal and vertical policy formulations. For instance, the impact of technological advancements (e.g. ICT tools, digitalisation, cloud computing, smart software, Key Enabling Technologies - nanotechnology, micro- and nanoelectronics, biotechnology, photonics, advanced materials and manufacturing technologies) on the innovativeness, productivity, and profitability of SMEs cannot be neglected when designing new policies - esepcially at a time when we are going through a "Third Industrial Revolution" at a global scale. Particularly, ICT and digitalisation have a catalytic impact on the productivity and innovation of SMEs and offer many advantages to SMEs, as well as to public authorities for increasing the quality of the services that they offer to businesses and citizens. The main application areas for governments include e-Government, e-procurement, e-payments, e-signatures, e-commerce, e-Infrastructure for RD&I collaboration and learning, and e-business support services, which corresponds resepectively to the SBA

79 ANNUAL REPORT ON EUROPEAN SMES 2013/2014: A PARTIAL AND FRAGILE RECOVERY
principles of Responsive administration, Public Procurement, Entrepreneurship, Skills and Innovation, Internationalisation, and Single Market. With regards to e-Government, as indicated by the SBA implementation assessment, there is a need for increasing the interaction and sharing between different ministries and public authorities, in order to increase the efficiency of e-services provided and to further reduce administrative burden, particularly through the strict implementation of the “submit-once” principle. In order to further boost the innovation capacity and capability of SMEs, which influences their export potential and competitiveness, user-centric open innovation as well service innovation in combination with technological innovation concepts should be supported by an appropriate policy and regulatory framework. This includes the consideration of the major role played by clusters, living labs, design centres and innovation clinics. As additional support to innovation, Innovative Public Procurement solutions should also be supported and implemented at all levels. This requires the training of public procurers on the new procurement tools for effective implementation. By this way, the involvement of SMEs in public procurement can also be increased, while innovation, including eco-innovation, can be further supported, and market absorption of newly innovated goods and services can be accelerated via pre-commercial public procurement. For combating the skills gap within SMEs, provision mechanisms should be put in place by national governments, where labour market needs should constantly be assessed and then reflected in the education and training systems. In addition, raising awareness among researchers on exploiting their RD&I results should be a priority from the onset of the RTD project. During the R&D and Innovation stages, strategic support should be provided for project risk analysis, exploitation strategy seminars, IP support, business plan development support and the organisation of brokerage events for SMEs to meet with investors and other potential collaborators for fund-raising and commercialisation of RD&I output. While policies to support the internationalisation of SMEs and their growth in high-tech manufacturing or knowledge-intensive services are essential for the future economic well-being of Europe, the many SMEs operating outside these sectors should not be forgotten. There is a need for the establishment of a dedicated umbrella organisation to support SMEs on all aspects (e.g. financial and strategic support) of internationalisation, in order to increase efficiency by preventing the current overlaps and confusions between different organisations offering support. Finally, the voice of SMEs should be taken into greater consideration through regular and effective consultations with SMEs and SME representatives. Moreover, SME tests and regulatory impact assessments should also be applied not on ad hoc basis but rather systematically as an integral part of policy making, which is currently still not the case in most of Member States.

80 ANNUAL REPORT ON EUROPEAN SMES 2013/2014: A PARTIAL AND FRAGILE RECOVERY
ANNEXES
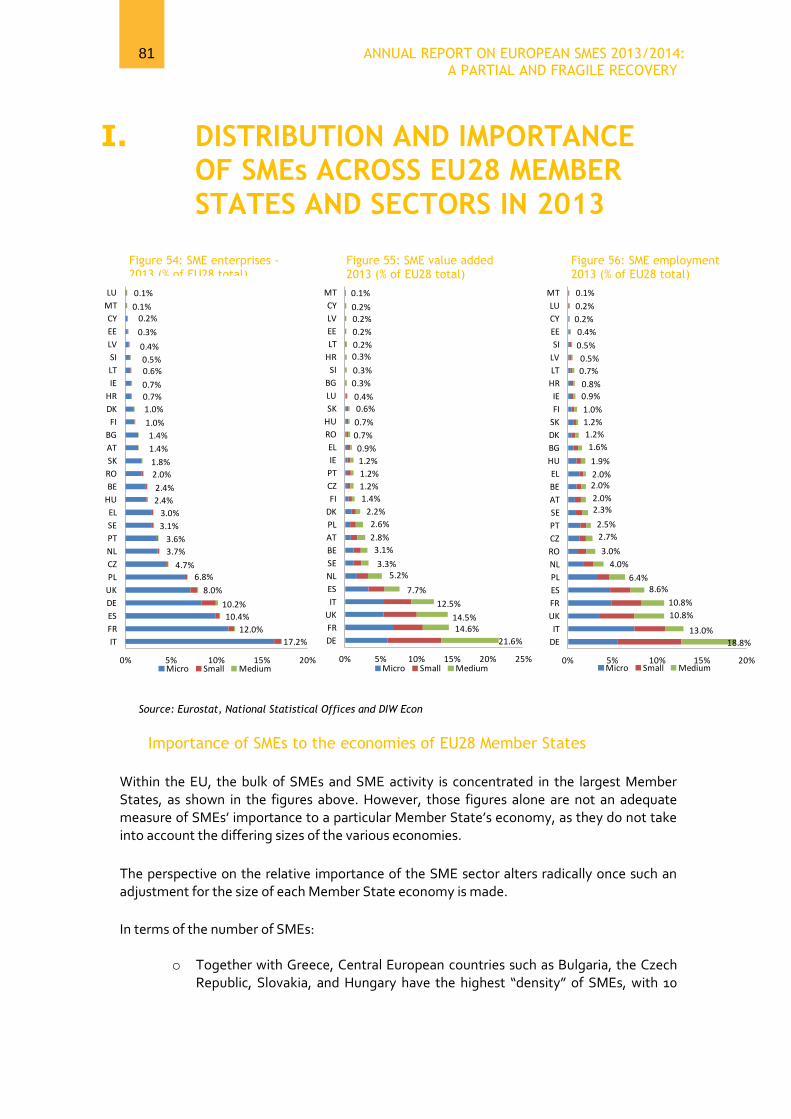
81 ANNUAL REPORT ON EUROPEAN SMES 2013/2014: A PARTIAL AND FRAGILE RECOVERY
I. DISTRIBUTION AND IMPORTANCE OF SMEs ACROSS EU28 MEMBER STATES AND SECTORS IN 2013
Source: Eurostat, National Statistical Offices and DIW Econ
Importance of SMEs to the economies of EU28 Member States
Within the EU, the bulk of SMEs and SME activity is concentrated in the largest Member States, as shown in the figures above. However, those figures alone are not an adequate measure of SMEs’ importance to a particular Member State’s economy, as they do not take into account the differing sizes of the various economies.
The perspective on the relative importance of the SME sector alters radically once such an adjustment for the size of each Member State economy is made.
In terms of the number of SMEs:
o Together with Greece, Central European countries such as Bulgaria, the Czech Republic, Slovakia, and Hungary have the highest “density” of SMEs, with 10
17.2%
12.0%
10.4%
10.2%
8.0%
6.8%
4.7%
3.7%
3.6%
3.1%
3.0%
2.4%
2.4%
2.0%
1.8%
1.4%
1.4%
1.0%
1.0%
0.7%
0.7%
0.6%0.5%
0.4%
0.3%
0.2%0.1%
0.1%
0% 5% 10% 15% 20%
IT
FR
ES
DE
UK
PL
CZ
NL
PT
SE
EL
HU
BE
RO
SK
AT
BG
FI
DK
HR
IE
LT
SI
LV
EE
CY
MT
LU
Micro Small Medium
21.6%
14.6%14.5%
12.5%
7.7%
5.2%3.3%
3.1%
2.8%
2.6%
2.2%
1.4%
1.2%
1.2%
1.2%
0.9%
0.7%
0.7%
0.6%
0.4%
0.3%
0.3%
0.3%0.2%
0.2%
0.2%
0.2%
0.1%
0% 5% 10% 15% 20% 25%
DE
FR
UK
IT
ES
NL
SE
BE
AT
PL
DK
FI
CZ
PT
IE
EL
RO
HU
SK
LU
BG
SI
HR
LT
EE
LV
CY
MT
Micro Small Medium
18.8%
13.0%
10.8%
10.8%
8.6%6.4%
4.0%
3.0%
2.7%
2.5%
2.3%2.0%
2.0%2.0%
1.9%
1.6%
1.2%
1.2%
1.0%
0.9%
0.8%
0.7%
0.5%
0.5%
0.4%
0.2%
0.2%
0.1%
0% 5% 10% 15% 20%
DE
IT
UK
FR
ES
PL
NL
RO
CZ
PT
SE
AT
BE
EL
HU
BG
DK
SK
FI
IE
HR
LT
LV
SI
EE
CY
LU
MT
Micro Small Medium
Figure 54: SME enterprises -2013 (% of EU28 total)
Figure 55: SME value added 2013 (% of EU28 total)
Figure 56: SME employment 2013 (% of EU28 total)

82 ANNUAL REPORT ON EUROPEAN SMES 2013/2014: A PARTIAL AND FRAGILE RECOVERY
SMEs or more per million of value added generated in the non-financial business sector (refer to section IV of the statistical background document).
o Conversely, Germany, Luxembourg, Ireland and the United Kingdom have less
than 5 SMEs per Million of Value Added produced in their respective business economies
In terms of the value generated by SMEs:
o In countries such as Ireland, Romania, and Poland, SMEs generate less than 50%
of total value added of the non-financial business sector (refer to statistical background document).
o By contrast, in Cyprus, Estonia and Malta, the SMEs generate more than 70% of the total value added of the non-financial business sector.
In terms of employment by SMEs:
o Bulgaria, Romania, Lithuania and Latvia have the highest number of persons employed by SMEs per million of value added generated in the non-financial business sector (refer to statistical background document)
SMEs and large enterprises in the EU28 non-financial business sector At the EU level, the relative importance of SMEs and large enterprises in the non-financial business sector is practically unchanged since 2008 (Figure 57).40 Over the period 2008 - 2013: The share of the number of SMEs in the total number of enterprises in the non-financial business sector has fluctuated between 99.79% and 99.8%; The share of value added in the non-financial business sector generated by SMEs has fluctuated between 58.4% and 58.1%; The SME employment share in total employment in the non-financial business sector ranged from 66.9% to 66.7%.
Figure 57: Number of enterprises, value added and employment in non-financial business sector – share of SMEs from 2008 to 2013 in EU28
Note: Slovakia is not included in this EU aggregate due to a break in the series.
50%
60%
70%
80%
90%
100%
2008
2009
2010
2011
2012
2013
Number of enterprises Value added Employment

83 ANNUAL REPORT ON EUROPEAN SMES 2013/2014: A PARTIAL AND FRAGILE RECOVERY
Source: Eurostat, National Statistical Offices, DIW Econ
In contrast with the picture observed at the EU28 level, an analysis of the evolution of the shares in total SME value added, employment and number of enterprises of the different SME size classes shows much less stability (Annex II of the statistical background document).
In particular, micro SMEs in Belgium, Bulgaria, Czech Republic, Estonia, Spain, Ireland, Lithuania, and Latvia, gained larger shares of the number of enterprises, value added produced and total employment of SMEs.
o In the case of Belgium, Estonia, Lithuania and Latvia, the increase in the share of micro SMEs was mirrored by a decrease in the share of both small and medium firms.
o In the case of Bulgaria, the increase in share of micro SMEs was
accompanied by a decrease in the share of the number of small SMEs and a decrease in the value added and employment shares of the medium-sized SMEs.
o In the Czech Republic, Ireland and Spain, the share gains of micro SMEs
were accompanied by a fall in the share in the number, value added and employment of small SMEs and the employment share of medium-sized SMEs.
Conversely, in Germany, Greece, Poland and Romania, the shares of small SMEs in total SME value added, employment and number of enterprises increased while generally the share of micro SMEs fell;
Only in a limited number of cases (Austria, Croatia, Italy, for value added, and Cyprus, and the United Kingdom, for value added and employment) did the medium-sized SMEs increase their share;
In all other countries, the shares of the different SME size classes remained broadly stable.
Additional information on the distribution of SMEs across sectors
In only two Member States (United Kingdom and Denmark) do the SMEs in the five key sectors account for the less than 75% but more than 60% of the SME population, value added and employment (Figure 1). In these countries, the administrative and support activities, real estate (specifically for Denmark), and information and communication services (particularly for the United Kingdom) account for the majority of the remaining shares.
Across Member States, the five key sectors above account for more than 65% of all SME enterprises, value added generated and SME employment in all Member States.41 Moreover, in six Member States – Italy, Czech Republic, Poland, Slovakia, Slovenia and Romania – that figure increases to 70% (Figure 1). However, in sharp contrast to the distribution of the number of SMEs across the three SME class sizes, the relative contribution of each size class to the generation of value added in the five economic

84 ANNUAL REPORT ON EUROPEAN SMES 2013/2014: A PARTIAL AND FRAGILE RECOVERY
sectors is broadly identical across the three size classes (Figure 60, Annex V). But, the distribution of employment across the three SME size classes differs markedly from that of value added. The share of micro SME employment is about 7 percentage points higher than the share of micro SME value added while the opposite holds for medium-sized SMEs (Figure 61, Annex V). The vast majority of firms (92.4%) in each of these five economic sectors are micro SMEs (Figure 59, Annex V ). The only exceptions are:
Share of SME enterprise – the Netherlands, where business services have a slightly higher share;
Share of SME value added – the Czech Republic, Italy and Slovenia, where the manufacturing SMEs produce a somewhat higher share of value added generated by SMEs in the non-financial business sector;
Share of SME employment – the Czech Republic, Estonia and Slovenia, where the manufacturing SMEs’ employment share of total SME employment is slightly higher.
Figure 58: Share of SME enterprises, value added and employment in non-financial business sector in Member States in EU28 Member States in 2013
Number of SME enterprises
Value added
27% 27% 29% 29% 30% 31% 32% 32% 33% 33% 34% 34% 34% 35% 35% 35% 35% 37% 41% 41% 41% 43% 44% 44% 44% 49% 50% 54%
27% 36% 30% 22% 21% 34% 26% 24% 24% 20% 18% 26% 30% 24% 33% 24% 16%23%
19% 19% 27%19% 20% 18% 14%
16% 16%
16%19%
19%21%
28%20%
20%
13%23% 24%
24%
16%
20% 15% 24%
15%
15%25%
17% 14% 16%
13%
11%16% 19%
15%
17%13%
8%
18%
11%10% 14%
21%
8%
10%
11% 9%10%
17%
14%13% 4% 3%
12%
19% 13%12% 9%
14%
12%
11%15%
13%
13%15%
12%
9% 6%10% 7% 7% 7%
19%10% 11% 12% 15%
5% 8%14% 14% 14%
5%10%
14% 15%
5%14%
9%4%
14%
4% 7% 10%
0%
10%
20%
30%
40%
50%
60%
70%
80%
90%
100%
SI SE UK FI CZ NL AT DK BE FR HR EE HU IE LU DE SK IT PT ES LV EL MT PL CY LT RO BG
Wholesale/retail trade Business S. Construction Manufacturing Accommodation/Food S.

85 ANNUAL REPORT ON EUROPEAN SMES 2013/2014: A PARTIAL AND FRAGILE RECOVERY
Employment
Note: Five key sectors include manufacturing”, “construction”, “accommodation and food services”,“professional, scientific and technical activities”, and “wholesale and retail trade, repair of motor vehicles and motorcycles”. Data are ordered by the relative shares of number of enterprises in the wholesale and retail trade industry. Source: Eurostat, National Statistical Offices and DIW Econ
28% 32% 24% 29% 29% 39% 30% 36% 37% 30% 33% 31% 33% 34% 43% 33% 45% 28% 35% 33% 40% 43% 36% 36% 36% 44% 34% 38%
15%
20%28%
16% 15%
20%
16%
16% 18%
20% 16%11%
17% 15%
21%
18%
13%
13%
13% 15%
11%11%
20%13%
18%11%
13%12%
14%
18% 19%
21%13%
13%
17%
15%17%
18%13%
17%
12%10%
21%
13%
10%
14%11% 15%
17% 9%13%
15%11% 12%
17% 12%
38%
24% 23%30%
39%
24%
28%
28%24%
24%29% 36% 34%
32%
9%
32%28%
38% 33% 27%
28%
26%19%
33%
17%
30%33% 32%
5% 6% 6% 5% 4% 5%9%
5% 5% 8% 9%4% 4%
8% 6% 5% 3% 6% 8% 10%3%
11% 12%
2%
17%
3% 3% 5%
0%
10%
20%
30%
40%
50%
60%
70%
80%
90%
100%
SI SE UK FI CZ NL AT DK BE FR HR EE HU IE LU DE SK IT PT ES LV EL MT PL CY LT RO BG
Wholesale/retail trade Business S. Construction Manufacturing Accommodation/Food S.
25% 32% 29% 28% 28% 38% 29% 37% 34% 32% 30% 29% 33% 40% 31% 34% 35% 31% 34% 37% 36% 47% 39% 38% 36% 39% 35% 39%
15%
16% 20%14% 12%
19%
14%
13% 15%14%
11% 12%
16%
14%
17% 13% 11%12%
11%13% 11%
12%
13% 10% 13% 10%8%
8%
17%
19%15%
22%
17%
14%
16%
18% 19%20%
15% 17%
14%9%
28%
13% 17%15%
15%14% 18%
9%
11% 16% 14% 17%
15%11%
34%22%
21%28%
35%18%
22%
25% 21%23%
29%34%
28%
15%
11%
26%
31%
31% 27% 20%
28%16%
20%
31%
16%
28%35%
31%
8% 10%16%
8% 8%12%
18%
7% 10% 11% 14%8% 9%
22%
12% 14%6%
12% 13% 17%7%
15% 17%
4%
20%
6% 6%11%
0%
10%
20%
30%
40%
50%
60%
70%
80%
90%
100%
SI SE UK FI CZ NL AT DK BE FR HR EE HU IE LU DE SK IT PT ES LV EL MT PL CY LT RO BG
Wholesale/retail trade Business S. Construction Manufacturing Accommodation/Food S.

86 ANNUAL REPORT ON EUROPEAN SMES 2013/2014: A PARTIAL AND FRAGILE RECOVERY
II. DISTRIBUTION AND PERFORMANCE OF SMEs BY SIZE CLASS, 2008-2013
The table below presents the detailed annual growth rate pattern of the following three performance indicators (number of enterprises, value added and employment) for SMEs and large enterprises in the EU28 non-financial business sector. The data clearly show that, while the patterns of growth of SMEs and large enterprises may diverge slightly at times, the evolutions since 2008 of the two groups of enterprises show no systematic differences.
Table 12: Annual growth rate (in %) of number of enterprises, value added and employment by SMEs and large enterprises in the EU28 non-financial business sector – 2009 to 2013
2009 2010 2011 2012 2013
Number of enterprises
SMEs -1.35% 2.11% 0.64% -0.35% -0.89%
Large -3.46% -1.00% 2.38% -0.17% -0.34%
Total -1.36% 2.11% 0.64% -0.35% -0.89%
Value added
SMEs -9.62% 4.44% 4.20% 1.52% 1.11%
Large -10.12% 9.32% 2.89% 1.62% -0.03%
Total -9.83% 6.46% 3.64% 1.56% 0.63%
Employment
SMEs -0.46% -0.96% 0.16% -0.85% -0.51%
Large -3.57% 0.51% 1.45% -0.08% 0.08%
Total -1.49% -0.48% 0.58% -0.60% -0.32% Note: EU aggregate excludes Slovakia because of break in data series Source: Eurostat, national statistical office and DIW Econ
Table 13: Distribution of SMEs by size class in the EU28 non-financial business sector – 2008 and 2013
Indicator Share of each SME class in
SME total 2008 2013
Change (2013-2008)
Enterprises
% Micro 92.37% 92.51% 0.14%
% Small 6.56% 6.44% -0.11%
% Medium 1.07% 1.05% -0.03%
Value Added
% Micro 37.28% 37.10% -0.18%
% Small 31.66% 31.32% -0.34%
% Medium 31.06% 31.59% 0.53%
Employment
% Micro 44.08% 43.38% -0.71%
% Small 30.25% 30.85% 0.60%
% Medium 25.67% 25.77% 0.10% Note: Slovakia is not included in this EU aggregate due to a break in the series. Figures may not add up due to rounding.
Source: National Statistical Offices, Eurostat, DIW econ

87 ANNUAL REPORT ON EUROPEAN SMES 2013/2014: A PARTIAL AND FRAGILE RECOVERY
III. PERFORMANCE OF SMEs IN 2012-2013 IN EU28 MEMBER STATES
Table 14: Changes (in percentage) in the number of SME enterprises, the value added generated by SMEs
and SME employment in the non-financial business sector of EU Member States - 2013
Country Enterprises (SMEs), % change 2012-2013
Value Added of SMEs, % change
2012-2013
Employment in SMEs, % change
2012-2013
AT
BE
BG
CY
CZ
DE
DK
EE
EL
ES
FI
FR
HR
HU
IE
IT
LT
LU
LV
MT
NL
PL
PT

88 ANNUAL REPORT ON EUROPEAN SMES 2013/2014: A PARTIAL AND FRAGILE RECOVERY
RO
SE
SI
SK
UK
Notes: Growth rate higher than 0.05% and below 3% Growth rate above 3% Growth rate lower
than -0.05% and above -3% Growth below -3% Growth rate between 0.05% and -0.05% Source: Eurostat, National Statistical Offices, Eurostat, DIW econ
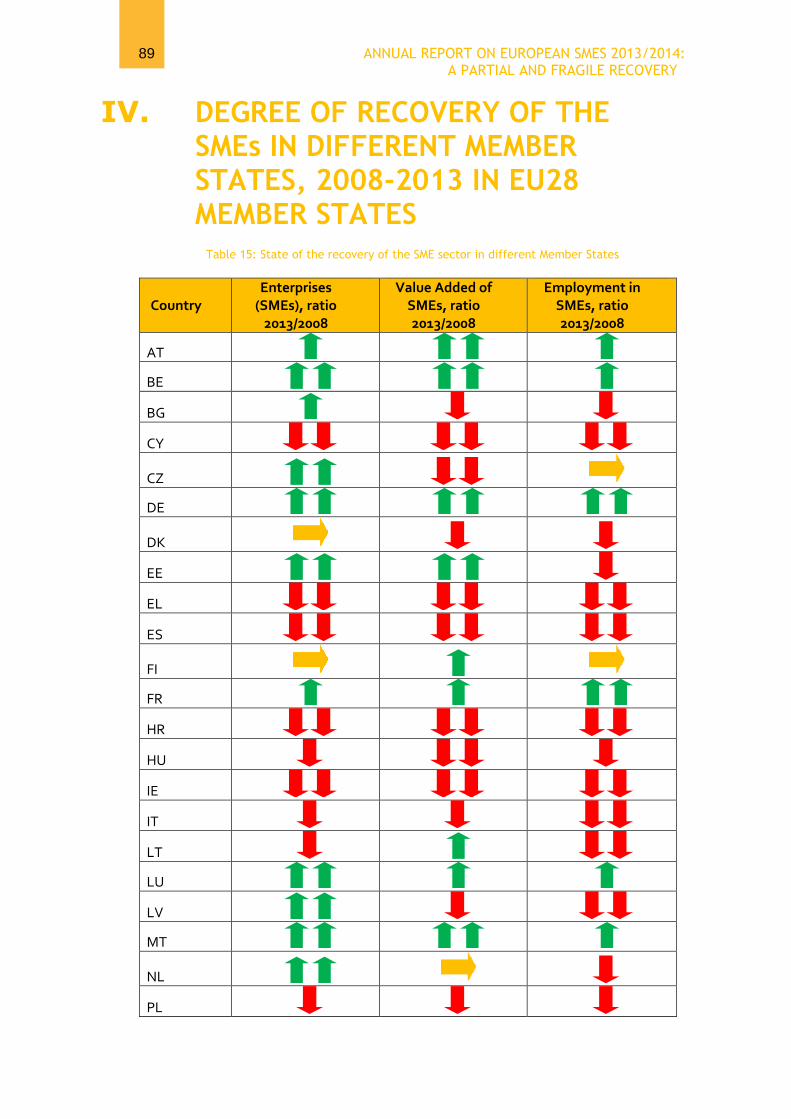
89 ANNUAL REPORT ON EUROPEAN SMES 2013/2014: A PARTIAL AND FRAGILE RECOVERY
IV. DEGREE OF RECOVERY OF THE SMEs IN DIFFERENT MEMBER STATES, 2008-2013 IN EU28 MEMBER STATES
Table 15: State of the recovery of the SME sector in different Member States
Country Enterprises
(SMEs), ratio 2013/2008
Value Added of SMEs, ratio 2013/2008
Employment in SMEs, ratio 2013/2008
AT
BE
BG
CY
CZ
DE
DK
EE
EL
ES
FI
FR
HR
HU
IE
IT
LT
LU
LV
MT
NL
PL

90 ANNUAL REPORT ON EUROPEAN SMES 2013/2014: A PARTIAL AND FRAGILE RECOVERY
PT
RO
SE
SI
SK
UK
Notes: Solid performer (between 2% and less than 10% higher in 2013 than in 2008) Strong performer (10% or more higher in 2013 than in 2008) Weak performer (between 2% and less than 10% lower in 2013 than in 2008) Very weak performer (10% or more lower in 2013 than in 2008) Unchanged (level in 2013 between 98% and 102% of 2008 level). In the case of Slovakia, the ratios are calculated using level in 2010 over level in 2013. Source: Eurostat, National Statistical Offices, Eurostat, DIW econ

91 ANNUAL REPORT ON EUROPEAN SMES 2013/2014: A PARTIAL AND FRAGILE RECOVERY
V. CONTRIBUTIONS TO EU28 PERFORMANCE, 2008-2013
Table 16: Size class contributions to EU28 SME performance (change 2008 to 2013)
Number of SMEs, Millions
Value added of SMEs, Trillion Euros
Employment of SMEs, Millions
Size 2008 2013 contribution 2008 2013 contribution 2008 2013 contribution
Micro 19.59 19.97 108% 1.35 1.36 32% 39.90 38.63 65%
Small 1.40 1.38 -7% 1.15 1.15 0% 27.52 27.35 9%
Medium 0.23 0.22 -2% 1.13 1.16 68% 23.38 22.86 27%
All SMEs 21.22 21.57 100% 3.62 3.67 100% 90.81 88.84 100%
Note: when the overall change in a variable is negative, contribution percentages should be considered with an opposite sign. Source: Eurostat, National Statistical Offices, DIW Econ
Table 17: Sector contributions to EU28 SME performance (change 2008 to 2013)
Number of SMEs, Millions
Value added of SMEs, Trillion Euros
Employment of SMEs, Millions
Sector 2008 2013 contribution 2008 2013 contribution 2008 2013 contribution
Manufacturing 2.14 2.08 -15% 0.78 0.75 -47% 19.75 17.87 96%
Construction 3.34 3.08 -73% 0.51 0.40 -248% 12.90 10.66 114%
Trade 6.17 6.15 -4% 0.79 0.82 63% 23.30 23.38 -4%
Accommodation
/food S. 1.75 1.79 10% 0.15 0.17 36% 7.99 8.49 -26%
Business S. 3.45 3.84 111% 0.45 0.48 73% 8.92 9.45 -27%
Others 4.37 4.62 71% 0.95 1.05 224% 17.95 18.99 -53%
Total 21.22 21.57 100% 3.62 3.67 100% 90.81 88.84 100%
Note: when the overall change in a variable is negative, contribution percentages should be considered with an opposite sign. Source: Eurostat, National Statistical Offices, DIWecon
Table 18: Country contributions to EU28 SME performance (change 2008 to 2013)
Number of SMEs, Millions
Value added of SMEs, Trillion Euros
Employment of SMEs, Millions
Country 2008 2013 contribution 2008 2013 contribution 2008 2013 contribution
AT 0.29 0.31 5% 0.09 0.10 23% 1.73 1.81 -4%
BE 0.45 0.52 21% 0.10 0.11 35% 1.71 1.77 -3%
BG 0.27 0.30 8% 0.01 0.01 -1% 1.53 1.41 6%
CY 0.05 0.04 -2% 0.01 0.01 -4% 0.20 0.17 2%
CZ 0.90 1.01 31% 0.05 0.04 -12% 2.47 2.42 3%
DE 1.87 2.20 94% 0.67 0.79 286% 14.01 16.72 -138%
DK 0.21 0.21 0% 0.08 0.08 3% 1.16 1.05 6%
EE 0.05 0.06 3% 0.01 0.01 2% 0.34 0.32 1%
EL 0.86 0.65 -58% 0.05 0.03 -47% 2.40 1.76 33%
ES 2.63 2.25 -106% 0.37 0.28 -210% 10.28 7.63 135%
FI 0.22 0.22 0% 0.05 0.05 3% 0.91 0.89 1%
FR 2.33 2.60 76% 0.52 0.53 42% 8.29 9.59 -66%

92 ANNUAL REPORT ON EUROPEAN SMES 2013/2014: A PARTIAL AND FRAGILE RECOVERY
HR 0.16 0.15 -5% 0.01 0.01 -9% 0.79 0.68 6%
HU 0.57 0.53 -11% 0.03 0.02 -6% 1.88 1.72 8%
IE 0.17 0.14 -6% 0.05 0.04 -13% 0.90 0.76 7%
IT 3.91 3.72 -55% 0.48 0.46 -36% 12.88 11.52 70%
LT 0.14 0.13 -1% 0.01 0.01 1% 0.74 0.65 5%
LU 0.03 0.03 1% 0.01 0.01 1% 0.16 0.16 0%
LV 0.08 0.09 3% 0.01 0.01 -1% 0.53 0.46 4%
MT 0.03 0.03 1% 0.00 0.00 1% 0.09 0.10 0%
NL 0.58 0.80 64% 0.19 0.19 -1% 3.65 3.56 4%
PL 1.53 1.47 -16% 0.10 0.09 -7% 5.97 5.68 15%
PT 0.94 0.77 -46% 0.06 0.04 -27% 2.79 2.26 27%
RO 0.50 0.43 -22% 0.03 0.03 -12% 2.90 2.71 10%
SE 0.58 0.67 24% 0.10 0.12 43% 1.92 2.02 -5%
SI 0.11 0.12 2% 0.01 0.01 -4% 0.45 0.41 2%
SK 0.06 0.39 93% 0.01 0.02 21% 0.64 1.03 -20%
UK 1.72 1.72 2% 0.52 0.53 28% 9.46 9.60 -7%
EU28 21.22 21.57 100% 3.62 3.67 100% 90.81 88.84 100% Note: when the overall change in a variable is negative, contribution percentages should be interpreted with an opposite sign. Source: Eurostat, National Statistical Offices, DIW econ

93 ANNUAL REPORT ON EUROPEAN SMES 2013/2014: A PARTIAL AND FRAGILE RECOVERY
VI. DISTRIBUTION OF SMEs ACROSS SIZE CLASSES IN FIVE KEY SECTORS, 2013 EU28
Figure 59: Shares of micro, small and medium-size SMEs in five key sectors in EU28- 2013
Figure 60: Shares of value added generated by micro, small and medium-size SMEs in EU28 in five key sectors
Figure 61: Shares of employment by micro, small and medium-size SMEs in EU28 in five key sectors
Note: Five key sectors include manufacturing”, “construction”, “professional, scientific and technical activities”, “Accommodation and food services” and “wholesale and retail trade, repair of motor vehicles and motorcycles”. Source: Eurostat, National Statistical Offices and DIW Econ
92.4%
6.6% 1.0%
Micro
Small
Medium
35.9%
33.0%
31.1%
Micro
Small
Medium
44.9%
31.3%
23.8%
Micro
Small
Medium

94 ANNUAL REPORT ON EUROPEAN SMES 2013/2014: A PARTIAL AND FRAGILE RECOVERY
VII. GROWTH FORECASTS OF SMEs IN EU28 MEMBER STATES
Figure 62: Value added recovery and growth forecast (in %), EU28 SMEs, 2008-2015
Source: Eurostat, National Statistical Offices, DIW econ
Figure 63: Employment recovery and forecast growth (in %), EU28 SMEs, 2008-2015
Source: Eurostat, National Statistical Offices, DIW econ
AT
BE
BG
CY
CZ
DE
DK
EE
EL
ES
FIFRHR
HU
IE
IT
LT
LU
LV
MT
NL
PL
PT
RO
SE
SI
SK
UKR² = 0.2839
-10%
-5%
0%
5%
10%
15%
20%
-40% -30% -20% -10% 0% 10% 20% 30%
Cu
mu
lati
ve g
row
th r
ate
20
13
-201
5
Recovery level (% 2013 level above/below 2008)
AT
BE
BG
CY
CZ
DE
DK
EE
EL
ES FIFR
HR
HU
IE
IT
LT
LU
LV
MT
NL
PL
PT
ROSE
SI
SK
UK
R² = 0.133
-10%
-5%
0%
5%
10%
15%
-30% -20% -10% 0% 10% 20%
Cu
mu
lati
ve g
row
th r
ate
20
13
-201
5
Recovery level (% 2013 level above/below 2008)

95 ANNUAL REPORT ON EUROPEAN SMES 2013/2014: A PARTIAL AND FRAGILE RECOVERY
Sector level analysis In manufacturing and construction ( Figure 64, Figure 65) for only a handful of countries there was growth in both employment and value added relative to 2008. However, France and the UK are no longer amongst these countries: SME manufacturing activity in France is expected to shrink by almost 15% while construction in the UK is anticipated to experience a similar decline among in terms of employment.
A strikingly large decline in activity of SMEs is expected in the construction sector in Greece (approximately 85% both for employment and value added). However, SMEs in construction in many larger economies are also expected to suffer (e.g. Spain, Portugal, Ireland, and Italy).
SMEs in wholesale and retail trade ( Figure 66) are expected to grow significantly more in most countries, at least in terms of value added. For the other service sectors the picture is even more positive, across the board: value added generated by SMEs in professional, scientific and technical activity is expected to be higher than 2008 levels in all countries except Portugal, Italy and Croatia. For other services, employment will have recovered in all but four countries (Romania, Croatia, Ireland and Hungary).
Figure 64: Forecast SME value added and employment by Member State in 2015 (2008 = 100): Manufacturing
Note: The size of bubbles reflects Member State’s share in total value added generated by SMEs in the EU in 2013. Slovakia is omitted because of a structural break in the data. The location of the label is not related to the position of the country in the chart, which is represented by the center of the bubble. Source: Eurostat, DIW Econ
AT
BE
BG
CY
CZ
DE
DK
EE
ELES
FI
FR
HRHU IE
IT
LT
LU
LV
MT
NLPL
PT
RO
SESI
UK
60
70
80
90
100
110
120
30 40 50 60 70 80 90 100 110 120 130 140 150
Emp
loym
en
t in
20
15
/ E
mp
loym
en
t 2
00
8
Value Added in 2015/ Value Added in 2008
C - Manufacturing
Share in total value added generated by EU SMEs (2013)

96 ANNUAL REPORT ON EUROPEAN SMES 2013/2014: A PARTIAL AND FRAGILE RECOVERY
Figure 65: Forecast SME value added and employment by Member State in 2015 (2008 = 100): Construction
Note: The size of bubbles reflects Member State’s share in total value added generated by SMEs in the EU in 2013. Slovakia is omitted because of a structural break in the data.The location of the label is not related to the position of the country in the chart, which is represented by the center of the bubble. Source: Eurostat, DIW Econ
Figure 66: Forecast SME value added and employment by Member State in 2015 (2008 = 100): Wholesale and retail trade
Note: The size of bubbles reflects Member State’s share in total value added generated by SMEs in the EU in 2013. Slovakia is omitted because of a structural break in the data.The location of the label is not related to the position of the country in the chart, which is represented by the center of the bubble. Source: Eurostat, DIW Econ
AT
BE
BG
CY
CZ
DE
DKEE
EL
ES
FI
FR
HRHU
IE IT
LT
LU
LV
MT
NL
PL
PT
RO
SE
SI
UK
0
20
40
60
80
100
120
140
160
10 20 30 40 50 60 70 80 90 100 110 120 130 140 150
Emp
loym
en
t in
20
15
/ E
mp
loym
en
t in
2
00
8
Value Added in 2015/ Value Added in 2008
F - Construction
Share in total value added generated by EU SMEs (2013)
AT
BE
BG
CY
CZ
DE
DK
EEEL
ESFI
FR
HR
HU
IEIT LT
LU
LV
MTNL
PLPT
RO
SE
SI
UK
60
80
100
120
140
160
50 60 70 80 90 100 110 120 130 140 150 160 170 180 190Em
plo
ym
en
t in
20
15
/ E
mp
loy
me
nt
in 2
00
8
Value Added in 2015/ Value Added in 2008
G - Wholesale & retail trade
Share in total value added generated by EU SMEs (2013)

97 ANNUAL REPORT ON EUROPEAN SMES 2013/2014: A PARTIAL AND FRAGILE RECOVERY
Figure 67: Forecast SME value added and employment by Member State in 2015 (2008 = 100): Accommodation and food services
Note: The size of bubbles reflects Member State’s share in total value added generated by SMEs in the EU in 2013. Slovakia is omitted because of a structural break in the data.The location of the label is not related to the position of the country in the chart, which is represented by the center of the bubble. Source: Eurostat, DIW Econ
Figure 68: Forecast SME value added and employment by Member State in 2015 (2008 = 100): Professional, scientific and technical activities
Note: The size of bubbles reflects Member State’s share in total value added generated by SMEs in the EU in 2013. Slovakia is omitted because of a structural break in the data. The location of the label is not related to the position of the country in the chart, which is represented by the center of the bubble. Source: Eurostat, DIW Econ
AT
BE
BG
CY
CZ
DE
DK
EE
EL
ES
FI
FR
HRHU
IE
IT
LT
LU
LV
MT
NL
PL
PT
RO SE
SIUK
40
60
80
100
120
140
160
180
70 80 90 100 110 120 130 140 150 160
Emp
loym
ent i
n 2
015
/ Em
plo
ymen
t in
200
8
Value Added in 2015/ Value Added in 2008
I - Accomodation/food S.
Share in total value added generated by EU SMEs (2013)
AT
BE
BG
CY
CZ
DE
DKEE
ES
FI
FR
HR
HUIE
IT
LTLU LV
MT
NL
PL
PT
RO
SE
SI
UK
60
70
80
90
100
110
120
130
140
150
160
90 100 110 120 130 140 150 160
Emp
loym
ent i
n 2
015
/ Em
plo
ymen
t in
200
8
Value Added in 2015/ Value Added in 2008
M- Professional, scientific & technical activities
Share in total value added generated by EU SMEs (2013)

98 ANNUAL REPORT ON EUROPEAN SMES 2013/2014: A PARTIAL AND FRAGILE RECOVERY
Figure 69: Forecast SME value added and employment by Member State in 2015 (2008 = 100): Other sectors
Note: The size of bubbles reflects Member State’s share in total value added generated by SMEs in the EU in 2013. Slovakia is omitted because of a structural break in the data. The location of the label is not related to the position of the country in the chart, which is represented by the center of the bubble. Source: Eurostat, DIW Econ
AT
BEBG
CY
CZ
DE
DK
EE
ES
FI
FR
HR
HU
IE
IT
LT
LU
LV
NL
PL
PT
RO
SE
SI
UK
80
90
100
110
120
130
140
70 80 90 100 110 120 130 140 150
Emp
loym
en
t in
20
15
/ E
mp
loym
en
t in
2
00
8
Value Added in 2015/ Value Added in 2008
Other sectors
Share in total value added generated by EU SMEs …

99 ANNUAL REPORT ON EUROPEAN SMES 2013/2014: A PARTIAL AND FRAGILE RECOVERY
VIII. DEGREE OF RECOVERY OF SMEs BY SECTOR IN EU28 MEMBER STATES, 2008-2013
Table 19: Value added and employment performance of SMEs from 2008 to 2013 in key economic sectors in
EU28 Member States
Manufacturing Employment outcomes (ratios of 2013 to 2008)
Value added outcomes (ratios of 2013 to 2008)
DE AT EE, LT
NL LV
RO DK,FR BG, SE,IE
MT BE,PL, UK HU,IT,SI
CZ, SK CY,EL,ES, FI,HR,LU,PT
Trade Employment outcomes (ratios of 2013 to 2008)
Value added outcomes (ratios of 2013 to 2008)
DE SE,
LU
AT BE LT
FR MT NL IT EE
CZ,UK DK,FI CY,PL
SK BG SI EL,ES, HR, HU,IE,LV,PT,RO
Business Services Employment outcomes (ratios of 2013 to 2008)
Value added outcomes (ratios of 2013 to 2008)
AT,BE,CY,
DE,FR,PL, SE
FI,MT,UK DK
EE
BG,LU HU
LT IT NL
SI CZ,LV RO, SK HR,PT EL, ES,IE
Construction Employment outcomes (ratios of 2013 to 2008)
Value added outcomes (ratios of 2013 to 2008)
DE,SE, SK MT,BE
AT FI,LU
FR EE
CZ, PL,UK BG,CY,DK,EL,ES,HR,HU,IE,IT,LT,LV,NL,PT,RO,SI
Accommodation/food S. Employment outcomes (ratios of 2013 to 2008)
Value added outcomes (ratios of 2013 to 2008)
DE,FR,LU,SE, MT,FI NL EE
BG AT IT BE,UK LT,PL,DK
HR CY
CZ ES
RO SK HU,PT,SI EL,IE,LV

100 ANNUAL REPORT ON EUROPEAN SMES 2013/2014: A PARTIAL AND FRAGILE RECOVERY
Others Employment outcomes (ratios of 2013 to 2008)
Value added outcomes (ratios of 2013 to 2008)
BE,DE,MT,UK AT,BG,
EE,FI,PL,
SE
IT,LT
FR,PT SI,LU,NL LV,DK CY ES,IE
CZ HU DK
RO
SK HR
Notes: Solid performer (between 2% and less than 10% higher in 2013 than in 2008) Strong performer
(10% or more higher in 2013 than in 2008) Weak performer (between 2% and less than 10% lower in 2013 than in
2008) Very weak performer (10% or more lower in 2013 than in 2008) Unchanged (level in 2013 between 98% and 102% of 2008 level) .In the case of Slovakia, the ratios are calculated using level in 2010 over level in 2013. Source: Eurostat, National Statistical Offices, Eurostat, DIW Econ
Figure 70: The performance of EU28 SMEs in various economic sectors, percentage change from 2008 to
2012 and 2012 to 2013
Source: Eurostat, National Statistical Offices, Eurostat, DIW Econ
-4% -5%
0%
3%
8%5%
-4%
-20%
3%
7%
0%
4%
-8%
-11%
1%
6.64%
3%5%
-1%
-5%
-1% -1%
1% 0%1%
-2%
1% 1%2% 2%
-1%
-4%
-1% -1%
1% 1%
Man
ufa
ctu
rin
g
Co
nst
ruct
ion
Trad
e
Acc
om
mo
dat
ion
/fo
od
Bu
sin
ess
S.
Oth
ers
Man
ufa
ctu
rin
g
Co
nst
ruct
ion
Trad
e
Acc
om
mo
dat
ion
/fo
od
Bu
sin
ess
S.
Oth
ers
Man
ufa
ctu
rin
g
Co
nst
ruct
ion
Trad
e
Acc
om
mo
dat
ion
/fo
od
Bu
sin
ess
S.
Oth
ers
% change 2008-2012 % change 2012-2013

101 ANNUAL REPORT ON EUROPEAN SMES 2013/2014: A PARTIAL AND FRAGILE RECOVERY
IX. PERFORMANCE OF SMEs IN FIVE KEY SECTORS IN EU28 MEMBER STATES
Table 20: Performance of SMEs in manufacturing in Member States from 2008 to 2013
MANUFACTURING
Country Enterprises (SMEs),
ratio 2013/2008
Value Added of SMEs, ratio 2013/2008
Employment in SMEs, ratio 2013/2008
AT BE
BG CY
CZ
DE DK
EE EL ES FI
FR HR
HU
IE IT
LT
LU LV MT NL PL PT
RO
SE SI
SK
UK Notes: Solid performer (between 2% and less than 10% higher in 2013 than in 2008) Strong performer
(10% or more higher in 2013 than in 2008) Weak performer (between 2% and less than 10% lower in 2013 than in
2008) Very weak performer (10% or more lower in 2013 than in 2008) Unchanged (level in 2013 between 98% and 102% of 2008 level). For Slovakia, ratios are computed from 2010 over 2013 Source: Eurostat, National Statistical Offices, Eurostat, DIW Econ
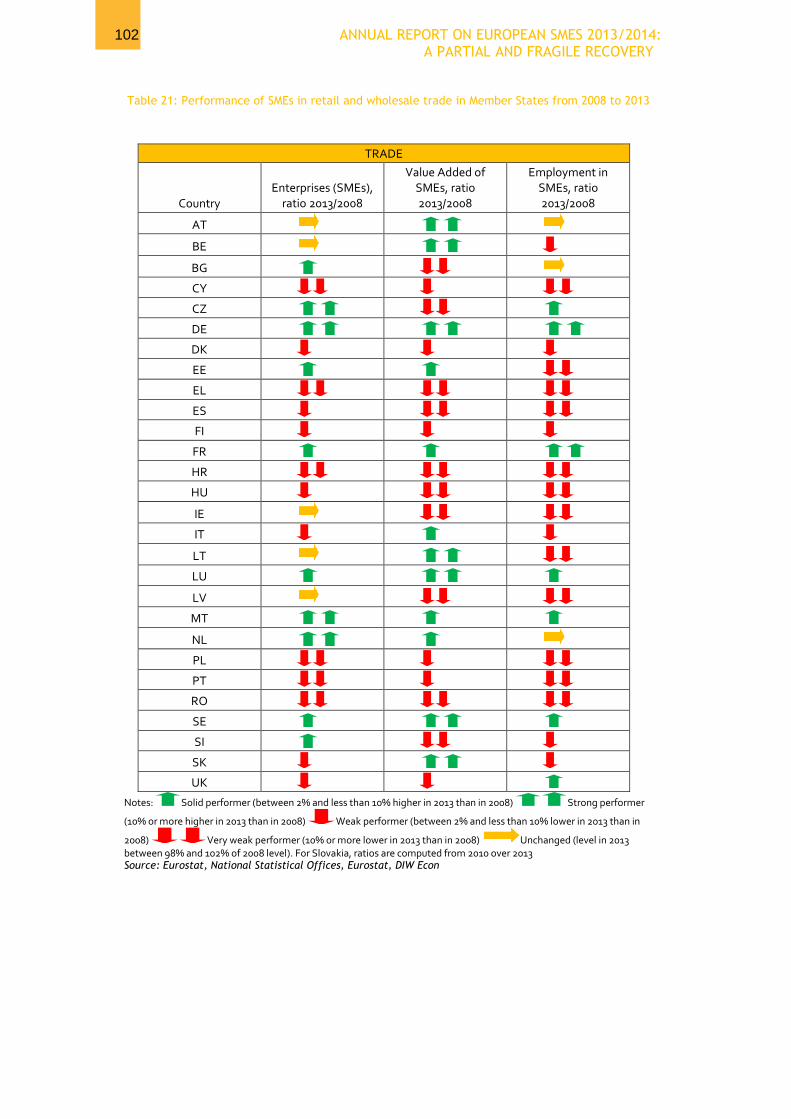
102 ANNUAL REPORT ON EUROPEAN SMES 2013/2014: A PARTIAL AND FRAGILE RECOVERY
Table 21: Performance of SMEs in retail and wholesale trade in Member States from 2008 to 2013
TRADE
Country Enterprises (SMEs),
ratio 2013/2008
Value Added of SMEs, ratio 2013/2008
Employment in SMEs, ratio 2013/2008
AT
BE
BG CY CZ DE DK EE EL ES FI FR
HR HU
IE IT
LT LU
LV MT
NL
PL PT RO SE
SI
SK
UK Notes: Solid performer (between 2% and less than 10% higher in 2013 than in 2008) Strong performer
(10% or more higher in 2013 than in 2008) Weak performer (between 2% and less than 10% lower in 2013 than in
2008) Very weak performer (10% or more lower in 2013 than in 2008) Unchanged (level in 2013 between 98% and 102% of 2008 level). For Slovakia, ratios are computed from 2010 over 2013 Source: Eurostat, National Statistical Offices, Eurostat, DIW Econ

103 ANNUAL REPORT ON EUROPEAN SMES 2013/2014: A PARTIAL AND FRAGILE RECOVERY
Table 22: Performance of SMEs in business services in Member States from 2008 to 2013
BUSINESS SERVICES
Country Enterprises (SMEs),
ratio 2013/2008
Value Added of SMEs, ratio 2013/2008
Employment in SMEs, ratio 2013/2008
AT
BE
BG CY CZ DE
DK EE EL ES FI
FR
HR
HU IE
IT LT
LU
LV
MT NL
PL
PT
RO SE
SI
SK
UK Notes: Solid performer (between 2% and less than 10% higher in 2013 than in 2008) Strong
performer (10% or more higher in 2013 than in 2008) Weak performer (between 2% and less than 10% lower in
2013 than in 2008) Very weak performer (10% or more lower in 2013 than in 2008) Unchanged (level in 2013 between 98% and 102% of 2008 level). Source: Eurostat, National Statistical Offices, Eurostat, DIW Econ

104 ANNUAL REPORT ON EUROPEAN SMES 2013/2014: A PARTIAL AND FRAGILE RECOVERY
Table 23: Performance of SMEs in construction in Member States from 2008 to 2013
CONSTRUCTION
Country Enterprises (SMEs),
ratio 2013/2008
Value Added of SMEs, ratio 2013/2008
Employment in SMEs, ratio 2013/2008
AT
BE
BG CY CZ DE DK
EE EL ES
FI FR
HR HU
IE IT
LT
LU
LV
MT NL
PL
PT RO SE SI
SK UK
Notes: Solid performer (between 2% and less than 10% higher in 2013 than in 2008) Strong
performer (10% or more higher in 2013 than in 2008) Weak performer (between 2% and less than 10% lower in
2013 than in 2008) Very weak performer (10% or more lower in 2013 than in 2008) Unchanged (level in 2013 between 98% and 102% of 2008 level). For Slovakia, ratios are computed from 2010 over 2013 Source: Eurostat, National Statistical Offices, Eurostat, DIW Econ

105 ANNUAL REPORT ON EUROPEAN SMES 2013/2014: A PARTIAL AND FRAGILE RECOVERY
Table 24: Performance of SMEs in accommodation/food services in Member States from 2008 to 2013
ACCOMMODATION
Country Enterprises (SMEs),
ratio 2013/2008
Value Added of SMEs, ratio 2013/2008
Employment in SMEs, ratio 2013/2008
AT BE BG
CY
CZ DE DK EE
EL ES FI
FR
HR HU
IE
IT
LT LU
LV MT
NL PL PT
RO
SE
SI
SK UK
Notes: Solid performer (between 2% and less than 10% higher in 2013 than in 2008) Strong
performer (10% or more higher in 2013 than in 2008) Weak performer (between 2% and less than 10% lower in
2013 than in 2008) Very weak performer (10% or more lower in 2013 than in 2008) Unchanged (level in 2013 between 98% and 102% of 2008 level); For Slovakia, ratios are computed from 2010 over 2013 Source: Eurostat, National Statistical Offices, Eurostat, DIW Econ

106 ANNUAL REPORT ON EUROPEAN SMES 2013/2014: A PARTIAL AND FRAGILE RECOVERY
Table 25: Performance of SMEs in other industries in Member States from 2008 to 2013
OTHER INDUSTRIES
Country Enterprises (SMEs),
ratio 2013/2008
Value Added of SMEs, ratio 2013/2008
Employment in SMEs, ratio 2013/2008
AT
BE BG CY
CZ DE
DK EE EL ES FI
FR
HR
HU
IE
IT LT
LU
LV
MT NL PL
PT RO SE
SI
SK
UK Notes: Solid performer (between 2% and less than 10% higher in 2013 than in 2008) Strong
performer (10% or more higher in 2013 than in 2008) Weak performer (between 2% and less than 10% lower in
2013 than in 2008) Very weak performer (10% or more lower in 2013 than in 2008) Unchanged (level in 2013 between 98% and 102% of 2008 level);For Slovakia, ratios are computed from 2010 over 2013 Source: Eurostat, National Statistical Offices, Eurostat, DIW Econ

107 ANNUAL REPORT ON EUROPEAN SMES 2013/2014: A PARTIAL AND FRAGILE RECOVERY
X. PERFORMANCE BY SIZE CLASS IN FIVE KEY SECTORS IN EU28
Table 26: Growth rates of Enterprises, Value Added and Employment by sector and size, 2008 to 2012 and 2012 to 2013 - EU28
Number of enterprises Gross Value Added Employment
Sector Size class
% 2008-2012
% 2012-2013
2013/2008
% 2008-2012
% 2012-2013
2013/2008
% 2008-2012
% 2012-2013
2013/2008
Manufacturing
Micro 1% -1% 100% -7% 3% 95% -6% 0% 94%
Small -10% -2% 89% -8% 2% 94% -10% -1% 89%
Medium -10% -2% 88% 0% 1% 100% -10% -1% 90%
SMEs -1% -1% 97% -4% 1% 97% -9% 0% 90%
Large -10% -1% 89% 0% 0% 99% -10% 0% 90%
Total -1% -1% 97% -2% 0% 98% -9% 0% 90%
Construction
Micro -3% -5% 93% -18% -3% 80% -12% -5% 84%
Small -11% -2% 87% -19% -1% 81% -13% -2% 86%
Medium -22% -4% 75% -25% -3% 72% -24% -4% 73%
SMEs -3% -5% 92% -20% -2% 78% -14% -4% 83%
Large -16% -4% 81% -7% -2% 91% -16% -3% 82%
Total -3% -5% 92% -18% -2% 80% -14% -4% 83%
Trade
Micro 0% -1% 100% 1% 2% 103% -3% -1% 96%
Small 2% 0% 102% 3% 1% 104% 5% 0% 104%
Medium 9% 0% 109% 3% 1% 105% 7% 0% 107%
SMEs 1% -1% 100% 2% 1% 103% 1% -1% 100%
Large 2% 0% 102% 7% 1% 108% 2% 0% 102%
Total 1% -1% 100% 4% 1% 105% 1% 0% 101%
Accommodation/ food S.
Micro 2% -1% 101% 4% 1% 106% 1% -1% 100%
Small 16% 0% 116% 15% 1% 116% 14% 0% 114%
Medium 14% 0% 114% 12% 1% 113% 11% 0% 111%
SMEs 3% -1% 102% 9% 1% 110% 7% -1% 106%
Large 16% 0% 116% 12% 1% 113% 4% 0% 104%
Total 3% -1% 102% 10% 1% 111% 6% 0% 106%
Business S.
Micro 11% 1% 112% 4% 2% 107% 6% 1% 106%
Small 2% 1% 104% 5% 2% 108% 4% 1% 105%
Medium 5% 2% 107% 6% 3% 108% 5% 2% 107%
SMEs 11% 1% 111% 5% 2% 107% 5% 1% 106%
Large 10% 1% 111% 9% 3% 112% 5% 1% 106%
Total 11% 1% 111% 6% 2% 108% 5% 1% 106%
Others
Micro 6% 0% 106% 7% 3% 111% 3% 0% 103%
Small 2% 1% 103% 7% 1% 108% 6% 1% 107%
Medium 5% 1% 106% 11% 1% 112% 7% 1% 108%
SMEs 5% 0% 106% 8% 2% 110% 5% 1% 106%
Large 4% 1% 104% 4% 0% 104% 2% 1% 103%
Total 5% 0% 106% 6% 1% 107% 4% 1% 104% Note: The name “Business S.” is used as abbreviation of the NACE category M “Professional/scientific/technical activities”, and “Trade” refers to G “Wholesale/ retail trade /repair of motor vehicles/motorcycles”. Categories in “Others” refer to sections of NACE Rev.2 classifications: B, D, E, H, J, L, and N. Source: National Statistical Offices, Eurostat, DIW Econ

108 ANNUAL REPORT ON EUROPEAN SMES 2013/2014: A PARTIAL AND FRAGILE RECOVERY
XI. INTERNATIONALISATION OF SMEs – SECTOR EXPORT INTENSITY LEVELS
Table 27: Classification of levels of export intensity – EU27
Export intensity Classification
1 Very low (exports over total sales between 0 and 5%)
2 Low (exports over total sales between 5 and 10%)
3 Medium (exports over total sales between 10 and 20%)
4 High (exports over total sales between 20 and 40%)
5 Very high (exports over total sales above 40%)
- Export not applicable/ no data available Source: London Economics analysis of Eurostat EU27 input-output table
Table 28: Sector labels
NACE abbreviation
sector NACE abbreviation
sector
B Mining and quarrying G45 Wholesale and retail trade and repair services of motor vehicles and motorcycles
C10_C12 Food products, beverages and tobacco products
G46 Wholesale trade services, except of motor vehicles and motorcycles
C13_C15 Textiles, wearing apparel and leather products
G47 Retail trade services, except of motor vehicles and motorcycles
C16 Wood and of products of wood and cork, except furniture; articles of straw and plaiting materials
H49 Land transport services and transport services via pipelines
C17 Paper and paper products H50 Water transport services
C18 Printing and recording services
H51 Air transport services
C19 Coke and refined petroleum products
H52 Warehousing and support services for transportation
C20 Chemicals and chemical products
H53 Postal and courier services
C21 Basic pharmaceutical products and pharmaceutical preparations
I Accommodation and food services
C22 Rubber and plastics products J58 Publishing services
C23 Other non-metallic mineral products
J59_J60 Motion picture, video and television programme production services, sound recording and music publishing; programming and broadcasting services
C24 Basic metals J61 Telecommunications services
C25 Fabricated metal products, except machinery and equipment
J62_J63 Computer programming, consultancy and related services; information services
C26 Computer, electronic and optical products
L68 Real estate services (exluding imputed rent)
C27 Electrical equipment M69_M70 Legal and accounting services; services of head offices; management consulting services

109 ANNUAL REPORT ON EUROPEAN SMES 2013/2014: A PARTIAL AND FRAGILE RECOVERY
C28 Machinery and equipment n.e.c.
M71 Architectural and engineering services; technical testing and analysis services
C29 Motor vehicles, trailers and semi-trailers
M72 Scientific research and development services
C30 Other transport equipment M73 Advertising and market research services
C31_C32 Furniture; other manufactured goods
M74_M75 Other professional, scientific and technical services; veterinary services
C33 Repair and installation services of machinery and equipment
N77 Rental and leasing services
D35 Electricity, gas, steam and air-conditioning
N78 Employment services
E36 Natural water; water treatment and supply services
N79 Travel agency, tour operator and other reservation services and related services
E37_E39 Sewerage; waste collection, treatment and disposal activities; materials recovery; remediation activities and other waste management services
N80_N82 Security and investigation services; services to buildings and landscape; office administrative, office support and other business support services
F Constructions and construction works
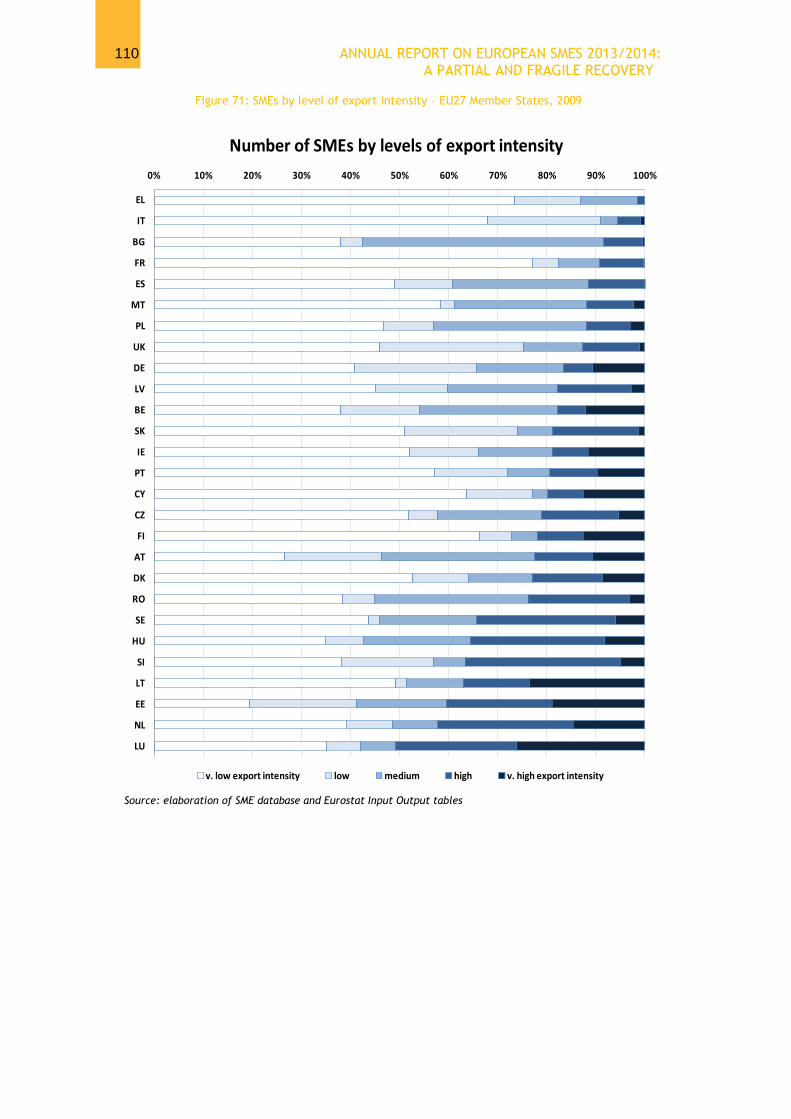
110 ANNUAL REPORT ON EUROPEAN SMES 2013/2014: A PARTIAL AND FRAGILE RECOVERY
Figure 71: SMEs by level of export intensity – EU27 Member States, 2009
Source: elaboration of SME database and Eurostat Input Output tables
0% 10% 20% 30% 40% 50% 60% 70% 80% 90% 100%
EL
IT
BG
FR
ES
MT
PL
UK
DE
LV
BE
SK
IE
PT
CY
CZ
FI
AT
DK
RO
SE
HU
SI
LT
EE
NL
LU
Number of SMEs by levels of export intensity
v. low export intensity low medium high v. high export intensity

111 ANNUAL REPORT ON EUROPEAN SMES 2013/2014: A PARTIAL AND FRAGILE RECOVERY
Figure 72: SME value added by export intensity, 2009
Source: elaboration of SME database and Eurostat Input Output tables
0% 10% 20% 30% 40% 50% 60% 70% 80% 90% 100%
EL
BG
IT
UK
FR
ES
SK
PL
MT
RO
LV
CY
CZ
FI
PT
SE
DE
AT
DK
BE
IE
SI
HU
LT
NL
EE
LU
SME value added by levels of export intensity
v. low export intensity
low
medium
high
v. high export intensity

112 ANNUAL REPORT ON EUROPEAN SMES 2013/2014: A PARTIAL AND FRAGILE RECOVERY
Table 29: Country-level classification of sectors by level of export intensity – sectors B to F, 2009
country B C10_C12 C13_C15 C16 C17 C18 C19 C20 C21 C22 C23 C24 C25 C26 C27 C28 C29 C30 C31_C32 C33 D35 E36 E37_E39 F
AT 3 3 4 4 5 4 3 4 5 4 4 5 4 4 5 5 5 5 4 3 2 1 3 1
BE 4 4 4 4 4 3 4 5 5 5 4 5 4 4 4 5 5 5 5 2 4 1 2 1
BG 1 3 4 4 3 1 4 4 4 3 3 5 3 4 4 3 3 4 4 2 3 1 5 1
CY 2 2 1 1 1 1 3 2 5 1 1 2 1 3 1 2 1 4 3 1 1 1 4 1
CZ 2 3 4 4 4 1 2 4 4 4 4 4 4 4 5 5 5 5 5 1 2 1 4 1
DE 1 3 4 3 4 2 3 5 5 4 4 4 4 5 5 5 5 5 4 2 4 1 3 1
DK 4 4 4 3 4 1 3 4 5 4 4 4 4 4 4 5 3 4 4 1 2 1 3 1
EE 3 3 4 5 5 4 3 4 3 4 4 4 4 5 5 5 5 5 5 4 3 1 5 2
EL 1 2 3 1 2 1 3 3 3 3 2 4 1 1 4 3 1 3 1 1 1 1 2 1
ES 1 3 3 2 3 1 3 4 4 4 3 4 3 3 4 4 4 4 2 1 1 1 1 1
FI 1 2 2 4 5 3 4 4 4 4 3 5 3 5 5 5 4 5 3 1 1 1 2 1
FR 1 3 4 3 3 1 3 4 4 4 3 4 3 4 4 4 4 5 3 1 1 1 3 1
HU 1 3 4 4 4 1 3 4 5 4 4 4 4 5 5 4 5 5 4 3 2 1 3 1
IE 1 5 2 4 3 4 4 5 5 4 2 4 3 5 4 4 2 2 n.a. 1 1 1 1 1
IT 1 2 4 2 3 1 3 4 4 4 3 4 3 3 4 5 4 4 4 1 1 1 2 1
LT 1 4 4 5 4 1 n.a. 5 4 4 3 4 4 4 5 5 5 5 5 1 1 1 5 1
LU 1 3 4 5 5 3 4 4 3 5 4 5 4 4 4 5 4 4 3 n.a. 2 1 5 1
LV 3 n.a. n.a. 5 3 1 n.a. n.a. n.a. 4 3 5 4 4 4 4 5 4 n.a. n.a. 1 1 4 1
MT 4 2 4 1 1 5 4 3 5 4 1 1 3 5 5 4 3 4 4 4 1 1 3 1
NL 4 4 4 3 4 1 5 5 5 5 3 5 4 5 5 5 4 5 4 3 1 1 4 1
PL 1 3 4 4 4 1 2 4 3 4 3 4 4 4 4 4 5 5 5 2 1 1 3 1
PT 2 3 4 4 4 1 3 3 2 4 4 4 4 4 4 4 4 3 3 3 1 1 3 1
RO 1 1 5 4 2 1 3 4 2 4 1 4 3 4 5 4 4 5 4 1 1 1 1 1
SE 3 3 3 4 5 1 4 5 n.a. 4 3 5 4 5 5 5 5 4 4 1 1 1 3 1
SI 1 3 4 5 5 1 3 4 5 4 4 4 4 4 5 5 5 5 5 2 3 1 4 1
SK 1 3 4 4 5 1 4 4 3 4 4 5 4 5 5 5 5 5 4 1 1 1 4 1
UK 4 2 3 1 2 1 4 4 5 3 3 4 3 4 4 5 4 5 3 1 1 1 3 1 Source: elaboration of Eurostat Input Output tables

113 ANNUAL REPORT ON EUROPEAN SMES 2013/2014: A PARTIAL AND FRAGILE RECOVERY
Table 30: Country-level classification of sectors by level of export intensity – sectors G to N, 2009
country G45 G46 G47 H49 H50 H51 H52 H53 I J58 J59_J60 J61 J62_J63 L68 M69_M70 M71 M72 M73 M74_M75 N77 N78 N79 N80_N82
AT 1 5 n.a. 4 4 4 4 3 2 3 2 2 3 1 3 3 5 3 3 2 1 1 1
BE 1 5 n.a. 3 5 4 4 3 2 3 2 3 3 1 3 3 5 3 2 2 1 1 1
BG 1 n.a. n.a. 3 1 2 3 2 3 1 2 2 3 1 3 3 1 2 1 1 1 4 1
CY 1 n.a. n.a. 2 5 5 5 1 1 3 1 3 5 2 5 4 5 4 1 4 2 5 1
CZ 1 n.a. 1 4 3 5 2 1 1 5 3 2 3 1 3 2 3 3 3 2 1 1 3
DE 1 5 n.a. 1 5 4 2 1 2 3 2 1 3 1 2 3 4 3 3 1 2 1 1
DK 4 5 1 3 5 5 2 2 1 2 1 2 3 1 2 3 3 2 1 1 1 4 4
EE 1 5 n.a. 4 5 4 4 3 1 2 2 3 4 1 3 3 3 4 3 4 5 1 2
EL 1 1 1 1 5 3 2 1 1 1 1 1 3 1 1 1 3 1 2 1 1 1 1
ES 1 4 n.a. 3 5 4 3 1 1 2 1 1 3 1 2 3 2 3 1 2 1 1 3
FI 1 5 n.a. 1 5 4 1 2 1 1 1 1 5 1 4 2 5 1 1 4 3 1 1
FR 1 4 n.a. 1 5 4 2 1 1 2 1 1 1 1 1 2 2 1 1 3 1 1 1
HU 1 5 n.a. 4 4 5 4 2 1 3 4 2 4 1 3 3 4 4 4 4 1 1 2
IE 1 5 1 2 5 5 1 4 3 n.a. 5 2 5 1 2 3 3 1 4 4 1 1 1
IT 1 2 n.a. 1 5 3 2 1 1 2 1 2 1 1 1 1 3 2 2 2 2 2 1
LT 1 5 n.a. 5 5 4 4 3 3 3 2 2 2 1 1 1 3 3 4 3 1 1 1
LU 4 5 n.a. 5 5 5 5 4 1 4 4 5 5 1 4 3 5 4 2 5 3 4 2
LV 1 3 n.a. 4 n.a. n.a. 3 n.a. 1 2 1 2 4 1 2 2 4 4 3 3 4 3 1
MT 1 n.a. 1 1 5 5 5 3 3 4 3 2 3 1 3 3 4 2 1 4 1 4 3
NL 1 5 n.a. 4 5 5 5 4 1 3 3 2 3 1 4 4 3 2 2 5 1 2 1
PL 1 n.a. n.a. 3 n.a. n.a. n.a. n.a. 1 3 2 1 3 1 3 2 3 2 3 1 1 1 1
PT 1 5 n.a. 4 5 5 3 1 1 1 2 2 2 1 2 3 2 2 2 2 1 1 1
RO 1 n.a. n.a. 4 5 5 3 3 3 1 1 2 4 1 3 2 3 3 3 3 3 1 3
SE 5 n.a. n.a. 1 5 4 3 n.a. 1 3 2 2 4 1 4 3 n.a. 3 3 4 1 4 1
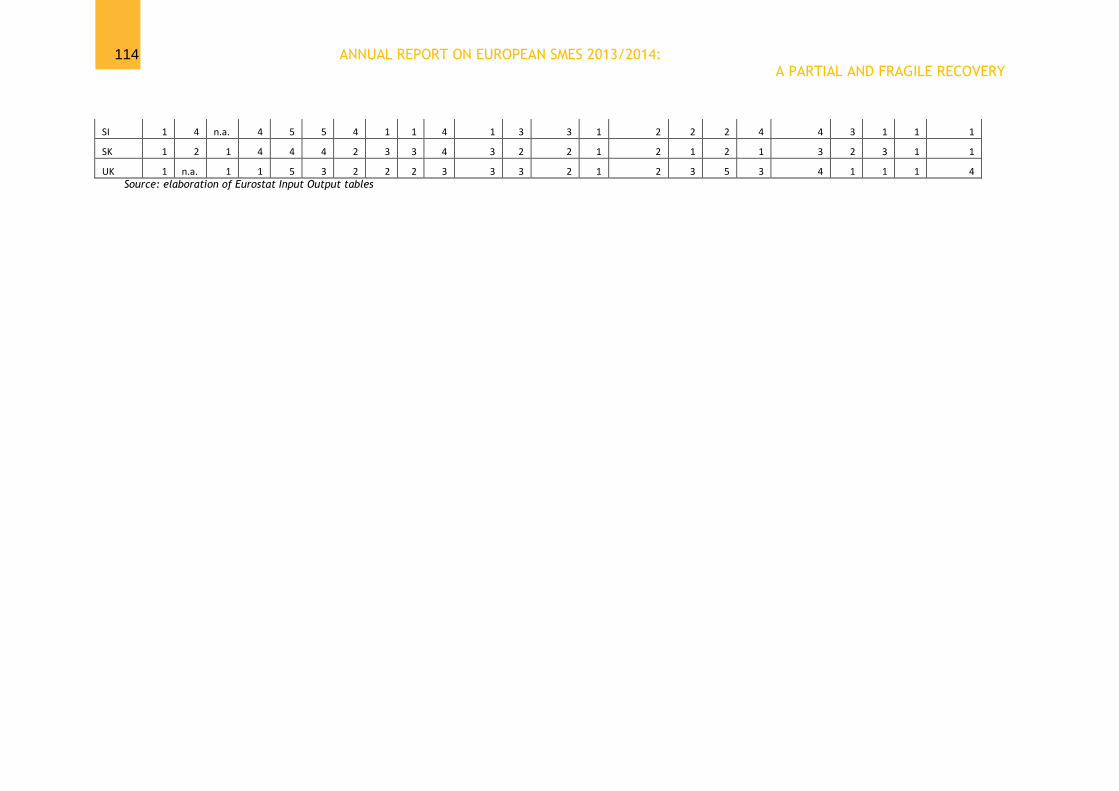
114 ANNUAL REPORT ON EUROPEAN SMES 2013/2014: A PARTIAL AND FRAGILE RECOVERY
SI 1 4 n.a. 4 5 5 4 1 1 4 1 3 3 1 2 2 2 4 4 3 1 1 1
SK 1 2 1 4 4 4 2 3 3 4 3 2 2 1 2 1 2 1 3 2 3 1 1
UK 1 n.a. 1 1 5 3 2 2 2 3 3 3 2 1 2 3 5 3 4 1 1 1 4 Source: elaboration of Eurostat Input Output tables

115 ANNUAL REPORT ON EUROPEAN SMES 2013/2014: A PARTIAL AND FRAGILE RECOVERY
XII. INDEX OF FIGURES
Figure 1: Importance of the five key sectors in the SME sector in Member States –2013 ........... 16
Figure 2: Evolution of EU28 GDP and EU28 value added of non-financial business sector
(annual percentage change) ..................................................................................................... 16
Figure 3: Change (in %) in EU28 GDP and EU28 value added of non-financial business sector
from 2012 to 2013 ...................................................................................................................... 17
Figure 4: Number of SMEs in the non-financial business sector, value added generated by
these SMEs and number of persons employed by these SMEs - EU28, 2008 to 2013
(2008=100) ................................................................................................................................. 17
Figure 5: Annual growth (in %) in different performance indicators by SME size - EU28 ........... 18
Figure 6: Recovery of EU28 SMEs in 2013 relative to 2008 (% change in 2013 levels from 2008
levels) ....................................................................................................................................... 20
Figure 7: Relationship between changes (in %) from 2008 to 2013 in EU28 SME value added
(at current and constant prices) and EU28 SME employment ................................................... 22
Figure 8: The performance of EU28 SMEs in various economic sectors, percentage change
from 2008 to 2013 ..................................................................................................................... 23
Figure 9: % change in value added of SMEs in the construction and manufacturing sector in
the EU28 2008-2013 ................................................................................................................. 25
Figure 11: Most pressing problems facing SMEs in the EU28 in 2013 ......................................... 27
Figure 12: Importance of problems facing SMEs within Member States, weighted by the
proportion of EU SMEs per Member State ................................................................................ 28
Figure 13: Most challenging SBA principles to SMEs at national level – EU28 ........................... 29
Figure 14: Number of policy measures adopted/implemented in EU28 per SBA principle -
2013/2014 .................................................................................................................................. 31
Figure 15: Percent distribution of policy measures per SBA principle in EU28 - 2013/2014 ......... 31
Figure 16: Number of policy measures adopted/implemented in EU28 per SBA principle –
2011/2014 ................................................................................................................................. 32
Figure 17: 2013 estimates and 2014 forecasts of performance of SME sector in EU28 ............... 36
Figure 18: Forecast level (left) and growth rate (right) of number of enterprises, value added
and employment accounted for by SMEs in EU28 ..................................................................... 37
Figure 19: Forecast growth (in %) in value added and employment by size of company in
EU28 .......................................................................................................................................... 37
Figure 20: Forecast enterprise, value added and employment: SMEs and large firms (2008 =
100) – EU28............................................................................................................................... 38
Figure 21: Forecast enterprise, value added and employment: micro, small and medium
enterprises (2008 = 100) – EU28 ................................................................................................ 38
Figure 22: Forecast growth (in %) in value added by sector -EU28 ............................................ 39
Figure 23: Forecast growth (in %) in employment by sector – EU28 .......................................... 39
Figure 24: Forecast enterprises, value added and employment by sector (2008 = 100) – EU28 . 40
Figure 25: Forecast value added and employment in 2015, by Member State (2008 = 100) ....... 41
Figure 26: Number of enterprises and employment in EU28 (2013), USA (2011) and Japan
(2012)as ratios over GDP .......................................................................................................... 43
Figure 27: Enterprise distribution by size class, EU28 (2013), USA (2011) and Japan (2012) ....... 44

116 ANNUAL REPORT ON EUROPEAN SMES 2013/2014: A PARTIAL AND FRAGILE RECOVERY
Figure 28: Employment distribution by size class, EU28 (2013), USA (2011) and Japan (2012)... 45
Figure 29: Value added distribution by size class, EU28 (2013), USA (2011) ............................... 45
Figure 30: Total value added by sector, EU28 (2013), USA (2011) and Japan (2012) ................... 46
Figure 31 : Developments (jn %) in key macroeconomic factors at constant prices, 2008-2013 . 47
Figure 32: Number of SMEs in EU28, USA and Japan, 2009=100 ............................................... 47
Figure 33: % change in number of SMEs by sector in EU28, USA and Japan, 2009 - 2012 .......... 48
Figure 34: Employment in SMEs in EU28, USA and Japan, 2009=100 ........................................ 48
Figure 35: % change in emplyment of SMEs by sector in EU28, USA and Japan, 2009 - 2012 .... 49
Figure 36: Value Added of SMEs in EU28 and USA, 2008-2013 -2009=100 ................................ 49
Figure 37: % change in value added of SMEs by sector in EU28 and USA - 2009-2012 ............... 50
Figure 38: Number of SMEs, EU28 and partner countries, 2009=100 ........................................ 52
Figure 39: Value added of SMEs, EU28 and partner countries 2009=100 ................................... 52
Figure 40: Employment in SMEs, EU28 and partner countries, 2009=100 ................................. 53
Figure 41: Domestic demand and exports by Member State, % change 2008-2013 (constant
prices) ....................................................................................................................................... 58
Figure 42: Distribution of total turnover among three market areas, average percentage
turnover of internationalised SMEs ........................................................................................... 62
Figure 43: For various modes of internationalisation, the percentage of SMEs in EU27
involved in international business activities, having concrete plans to start or none at all ......... 62
Figure 44: Share of exporting SMEs in the EU27, industry sectors ............................................. 64
Figure 45: Distribution of the population of SMEs and large enterprises across different
export-intensity classes – EU27, 2009 ....................................................................................... 66
Figure 46: Distribution of the value added generated by SMEs and large enterprises across
different export-intensity classes –EU27, 2009 ......................................................................... 66
Figure 47: Shares of the number of SMEs in low export intensity sectors in EU27 Member
States ,2009 ............................................................................................................................. 67
Figure 48: Shares of the value added generated by SMEs in low export intensity sectors in
EU27 Member States, 2009 ....................................................................................................... 68
Figure 49: Share (%) of high-tech on total manufacturing, SMEs and large enterprises, EU28,
2013 .......................................................................................................................................... 71
Figure 50: Share (%) of high tech manufacturing over total manufacturing, EU 28 SMEs, 2013 71
Figure 51: Share (%) of knowledge intensive services on total services, SMEs and large
enterprises, EU28, 2013 ............................................................................................................ 72
Figure 52: Share (%) of knowledge intensive services over total services, EU 28 SMEs, 2013 .... 72
Figure 53: High Tech manufacturing – Annual growth rate (in %) in value added in EU28
(2012-2008) ............................................................................................................................... 74
Figure 54: Knowledge Intensive Services – Annual growth rate (in %) in value added in EU28
(2012-2008) ............................................................................................................................... 74
Figure 55: SME enterprises -2013 (% of EU28 total)................................................................... 81
Figure 56: SME value added 2013 (% of EU28 total) .................................................................. 81
Figure 57: SME employment 2013 (% of EU28 total) ................................................................. 81
Figure 58: Number of enterprises, value added and employment in non-financial business
sector – share of SMEs from 2008 to 2013 in EU28 .................................................................... 82
Figure 59: Share of SME enterprises, value added and employment in non-financial business
sector in Member States in EU28 Member States in 2013 ......................................................... 84

117 ANNUAL REPORT ON EUROPEAN SMES 2013/2014: A PARTIAL AND FRAGILE RECOVERY
Figure 60: Shares of micro, small and medium-size SMEs in five key sectors in EU28- 2013 ..... 93
Figure 61: Shares of value added generated by micro, small and medium-size SMEs in EU28
in five key sectors ..................................................................................................................... 93
Figure 62: Shares of employment by micro, small and medium-size SMEs in EU28 in five key
sectors ...................................................................................................................................... 93
Figure 63: Value added recovery and growth forecast (in %), EU28 SMEs, 2008-2015 .............. 94
Figure 64: Employment recovery and forecast growth (in %), EU28 SMEs, 2008-2015 ............. 94
Figure 65: Forecast SME value added and employment by Member State in 2015 (2008 =
100): Manufacturing ................................................................................................................. 95
Figure 66: Forecast SME value added and employment by Member State in 2015 (2008 =
100): Construction .................................................................................................................... 96
Figure 67: Forecast SME value added and employment by Member State in 2015 (2008 =
100): Wholesale and retail trade ............................................................................................... 96
Figure 68: Forecast SME value added and employment by Member State in 2015 (2008 =
100): Accommodation and food services .................................................................................. 97
Figure 69: Forecast SME value added and employment by Member State in 2015 (2008 =
100): Professional, scientific and technical activities ................................................................. 97
Figure 70: Forecast SME value added and employment by Member State in 2015 (2008 =
100): Other sectors ................................................................................................................... 98
Figure 71: The performance of EU28 SMEs in various economic sectors, percentage change
from 2008 to 2012 and 2012 to 2013 ....................................................................................... 100
Figure 72: SMEs by level of export intensity – EU27 Member States, 2009 ............................... 110
Figure 73: SME value added by export intensity, 2009 ............................................................. 111

118 ANNUAL REPORT ON EUROPEAN SMES 2013/2014: A PARTIAL AND FRAGILE RECOVERY
XIII. INDEX OF TABLES
Table 1: Definition of SMEs ....................................................................................................... 10
Table 2: SMEs and large enterprises: number of enterprises, value added and employment in
the EU28 in 2013 ....................................................................................................................... 15
Table 3: Performance of SMEs by sector in the EU28 in 2013 .................................................... 19
Table 4: 2014 and 2015 Forecasts of annual growth in SME performance indicators – EU28 ..... 36
Table 5: Overview of SMEs in EU28 (2013), USA (2011) and Japan (2012) .................................. 42
Table 6: Overview of SMEs in EU28 and partner countries, 2013 or latest available data .......... 51
Table 7: Overview of SMEs in EU28 (2013), Brazil, India and Russia (2011) ................................ 54
Table 8: Key demand drivers of sectors of key importance to SMEs - EU27, 2009 ..................... 57
Table 9: Exporting SMEs in 5 largest EU28 countries by number of SMEs (absolute levels and
in 5 of total) ............................................................................................................................... 64
Table 10: Direct and indirect impact in key SME sectors of an increase in foreign demand,
EU27, 2009 ................................................................................................................................ 69
Table 11: Descriptive statistics on EU28 high tech and knowledge intensive industries ............. 73
Table 12: Annual growth rate (in %) of number of enterprises, value added and employment
by SMEs and large enterprises in the EU28 non-financial business sector – 2009 to 2013 ......... 86
Table 13: Distribution of SMEs by size class in the EU28 non-financial business sector – 2008
and 2013 ................................................................................................................................... 86
Table 14: Changes (in percentage) in the number of SME enterprises, the value added
generated by SMEs and SME employment in the non-financial business sector of EU
Member States - 2013 ............................................................................................................... 87
Table 15: State of the recovery of the SME sector in different Member States .......................... 89
Table 16: Size class contributions to EU28 SME performance (change 2008 to 2013) ................ 91
Table 17: Sector contributions to EU28 SME performance (change 2008 to 2013)..................... 91
Table 18: Country contributions to EU28 SME performance (change 2008 to 2013) .................. 91
Table 19: Value added and employment performance of SMEs from 2008 to 2013 in key
economic sectors in EU28 Member States ................................................................................ 99
Table 20: Performance of SMEs in manufacturing in Member States from 2008 to 2013 ........ 101
Table 21: Performance of SMEs in retail and wholesale trade in Member States from 2008 to
2013 ........................................................................................................................................ 102
Table 22: Performance of SMEs in business services in Member States from 2008 to 2013 ..... 103
Table 23: Performance of SMEs in construction in Member States from 2008 to 2013 ............ 104
Table 24: Performance of SMEs in accommodation/food services in Member States from
2008 to 2013 ........................................................................................................................... 105
Table 25: Performance of SMEs in other industries in Member States from 2008 to 2013 ....... 106
Table 26: Growth rates of Enterprises, Value Added and Employment by sector and size,
2008 to 2012 and 2012 to 2013 - EU28......................................................................................107
Table 27: Classification of levels of export intensity – EU27 ..................................................... 108
Table 28: sector labels ............................................................................................................. 108
Table 29: Country-level classification of sectors by level of export intensity – sectors B to F,
2009 ........................................................................................................................................ 112

119 ANNUAL REPORT ON EUROPEAN SMES 2013/2014: A PARTIAL AND FRAGILE RECOVERY
Table 30: Country-level classification of sectors by level of export intensity – sectors G to N,
2009 ........................................................................................................................................ 113

120 ANNUAL REPORT ON EUROPEAN SMES 2013/2014: A PARTIAL AND FRAGILE RECOVERY
ENDNOTES
1 The non-financial business sector includes the following industrial sectors: “mining and quarrying”, “manufacturing”, “electricity, gas, steam and air condition supply”, “water supply, sewerage, waste management and remediation activities”, “construction”, “wholesale and retail trade, repair of motor vehicles and motorcycles”, “transportation and storage”, “accommodation and food services”, “information and communication”, “real estate activities”, “professional, scientific and technical activities” and “administrative and support services”. The industries not covered by the analysis include the following: “agriculture, forestry and fishing”, “public administration and defence; compulsory social security”, “education”, “human health and social work activities”, “arts, entertainment and recreation”, “other service activities”, “activities of households as employers; undifferentiated goods- and services-producing activities of households for own use” and “activities of extraterritorial organisations and bodies” 2 Commission Recommendation of 6 May 2003 concerning the definition of micro, small and medium-sized enterprises, Official Journal of the European Union L124/36, 20 May 2003. 3 The Think Small First principle requires that legislation takes SMEs' interests into
account at the very early stages of policy making in order to make legislation more SME friendly. A range of tools is available to ensure the effective implementation of the principle. These include the application of an SME test to forthcoming legislative proposals, the use of specific SME provisions in legislation in order to avoid disproportionate burden on SMEs, the consultation of the SME stakeholders, the work of the SME Envoy, the use of Common Commencement dates for legislation relevant for business etc. 4 Albania, Former Yugoslav Republic Of Macedonia, Iceland, Israel, Liechtenstein,
Norway, Montenegro, Serbia and Turkey
5 Ideally, one would want to use value added at constant prices as a performance indicator. However, as Eurostat produces estimates of value added at constant prices only at the level of a whole industry and not for different enterprise size classes in an industry, the analysis focuses on value added at current prices. For information, section IV of the statistical background document provides information on the evolution of industry-wide value at current and constant prices. 6 See section V of the statistical background document for more detailed information on the share of the total economy and total employment accounted for by the non-financial business sector in the Member States. 7 Gross value added is the difference between output and intermediate consumption. As an aggregate measure of production, gross domestic product (GDP) is equal to the sum of the gross value added of all resident institutional units (i.e. economic sectors) engaged in production, plus any taxes and minus any subsidies, on products not included in the value of their outputs, 8 For convenience, we will also refer to the latter two sectors as “Trade” and “Business services” 9 See Section I of the statistical background information document for a year-by-year
comparison of the growth rates of the number of enterprises, value added and employment of SMEs and large enterprises over the period 2008-2013.

121 ANNUAL REPORT ON EUROPEAN SMES 2013/2014: A PARTIAL AND FRAGILE RECOVERY
10 As noted earlier in this report, this is mostly due to a break in the series in Slovakia statistics. Starting 2010, sole traders were included in the “micro” category. 11 http://ec.europa.eu/enterprise/policies/finance/data/index_en.htm 12 In particular, the “2013 SMEs’ Access to Finance survey Analytical Report” 13 See statistical background document 14 The height of the bubble is constructed as the average percentage of SMEs that cite each factor as a problem, across the displayed Member States, weighted by the proportion of EU SMEs per Member State 15
World Economic Forum, The Global Competitiveness Report 2013-2014 16
World Economic Forum, The Europe 2020 Competitiveness Report : Building a More Competitive Europe, 2012 Edition 17
This project was delivered by a consortium composed of CARSA, PWC Luxembourg, Innova, London Economics, DIW, DIW Econ, and the University of Manchester. The present report was produced by London Economics, while the database (including now-casts for 2012-2013, and forecasts for 2014 and 2015) was generated by DIW Econ. 18 Germany, Belgium, Sweden, Malta, Luxembourg Austria, France, United Kingdom. 19 Greece, Spain, Ireland, Croatia, Italy, Slovenia, Hungary, Cyprus Portugal, Poland. 20 Due to scarcity of data, no detailed comparison can be presented with other trading partners such as China, as no data is available on SMEs for the three core indicators under scrutiny. For Russia, Brazil and India, there is scope for aggregate level analysis: for Russia, data is not available for sectors J, L, M, N and no statistics on large firms are observed. For Brazil, value added data lacks observation for sectors E, I, M, N. For India, only data for “All SMEs” size class is available, but only for enterprises and employment. Data for these countries will be however analysed in subsequent sections of this chapter. 21 Considered a “potential” candidate. 22 Of note is the fact that in both the USA and Japan, the SME classification differs from the standard adopted in the EU: medium firms can employ up to 299 employees, and thus large firms are those with more than 300. This impedes a one-to-one comparison of the enterprise demographics but the analysis is nonetheless relevant in the context of this report. 23 See statistical background document for detailed data. 24
Due to a structural break in 2009 in data for Japan, the analysis of time trends in the section will be carried out by indexing at 2009 rather than 2008. 25 Data on Indian SMEs is not provided by size class, and there is no data on large firms and on value added. Data on Russian SMEs is based on a different size classification, and also lacks data on large firms and on value added. Size class definitions for Russia: Micro (0-15), Small (16-100), Medium (101-250), Large (250+). 26 The analysis does not cover the year 2013 as yearly national accounts data for 2013 are not yet available. 27 First, the correlations between the different macro-economic indicators and the annual growth rate in the three SME performance indicators (number of enterprises, value added and employment) were estimated. The results of this analysis are presented in annex XV of the statistical background document. Next, the contribution of developments in each intermediate and final demand component to the performance of SMEs were further assessed through econometric analysis, and the results are displayed in annex XV of the statistical background document. The model estimates a panel regression to explain the variation in growth of value added and employment of SMEs by sector, in the EU28. The regressors are the

122 ANNUAL REPORT ON EUROPEAN SMES 2013/2014: A PARTIAL AND FRAGILE RECOVERY
components of demand (final consumption of households, final consumption of government, gross fixed capital formation, exports), all expressed in year-on-year growth rates from 2008 to 2013. An additional variable, the growth of value added in the total economy (all sectors and all size classes) is also included, as a proxy for the intermediate demand taking place along the value chain. The significant coefficients and R-squared for each regression are displayed in annex XV of the statistical background document. 28 The study’s analysis and conclusions are based on a 2009 survey of 9,480 SMEs in 33 European countries. 29 Among recent publications, see for example: Lee H., Kelley D., Lee J., Lee S.(2012) “SME survival: The impact of internationalization, technology resources, and alliances”, where internationalisation is shown to improve survival probability; Higon D.A., and Driffield N. (2011) show that exporting firms are also characterized by high levels of innovation activities, and that product innovation efforts significantly impact the probability of exporting. 30 BIS Economics Paper 13, p. 32. However, the percentage figure is similar to that for larger countries such as Germany and France. See House of Lords Select Committee on Small and Medium Sized Enterprises (2013). “Roads to Success: SME Exports”. House of Lords Paper 131, p. 20, para. 2.7. 31 The cross- country analysis of SME export propensity in the case of goods exports can be performed combining COMEXT statistics on international trade (encompassing both intra- and extra- EU flows) and Structural Business Statistics. The statistics refer to the number of enterprises and include NACE sections B, C, D, E – Industry. 32 Data are from national statistical offices. 33 The database is a combination of National Statistical Offices data, Eurostat, and econometric estimates. 34 Input output tables for EU27 and a set of candidate countries are available at: http://epp.eurostat.ec.europa.eu/portal/page/portal/esa95_supply_use_input_tables/data/workbooks 35 Sectors are classified according to NACE Rev 2. Some industries/products are merged (e.g., there is no detailed 2-digit breakdown for sectors belonging to B, “Mining and quarrying”). 36 See annex XI for a detailed breakdown of each sector by intensity level within a country. 37
In this case, the multiplier is the output multiplier of Type I. This is obtained by deriving the Leontief inverse matrix from the Input Output table, and taking the column sums of the resulting matrix. This multiplier accounts for the direct and indirect effect of an increase in final demand on output. The direct impact is the one that producers immediately face, by expanding their production to meet the additional demand. This direct effect in turn determines an increase of the producers’ demand on their suppliers, which is the indirect effect. 38 Due to a lack of data for some of the potential drivers, the analysis is limited to the perdio 2009-2012. 39 This is the case of a variable on continued vocational training, which is available only for year 2010. See standalone working paper for more detailed information. 40 See Annex I of the statistical background document for a year-by-year comparison of
the growth rates of the number of enterprises, value added and employment of SMEs
and large enterprises over the period 2008-2013.

123 ANNUAL REPORT ON EUROPEAN SMES 2013/2014: A PARTIAL AND FRAGILE RECOVERY
41 The statistical background document provides detailed information for all Member States on the distribution of the SME population, vale added and employment across various sectors.
NB-04-14-987-EN
-C
ISBN: 978-92-79-43758-8doi:10.2769/51819