annual report - shokubai · the sales volume of superabsorbent polymers. operating income decreased...
TRANSCRIPT

ANNUAL REPORT“Making human life and society richer, more comfortable through technological innovations”

NIPPON SHOKUBAI CO., LTD. has been undertaking numerous
efforts to build a more solid business structure and gain a sharper
competitive edge to keep pace with rapid changes in the world, under its
corporate philosophy of ÒTechnoAmenityÓ, which means providing
affluence and comfort to society through technology, and the following
slogans:
1. Respect for humanity
2. Coexisting with society, and working in harmony
with the environment
3. Pursuing futuristic technology
4. Acting from an international perspective
Profile
Basic Corporate Vision
Since the establishment in 1941, we have carried out original research
and development in four major fields such as polymer synthesis,
environment preservation systems, organic synthesis, and catalyst
technologies.
Our major products are 1) Basic Chemicals, such as acrylic acid,
acrylic ester, ethylene oxide, ethanol amine, and higher alcohol
surfactants, etc., 2) Functional Chemicals, such as superabsorbent
polymers, polymers for concrete admixture, resins for paints/adhesives
and electronic and information materials, etc., and 3) Environment and
Catalysts, such as catalysts for cleaning automobile exhaust gases,
process catalysts, De-NOx catalysts and dioxins decomposition /
elimination equipments, etc.
In addition, our technologies for manufacturing chemical products are
appreciated in foreign countries as well as our diversified line of
products. We have licensed our technologies worldwide for
manufacturing various chemicals such as acrylic acids and esters.
Created through our original technologies and know-how, our products
above have made various contributions to our society and daily life.
Business Fields
Financial Highlights
To Our Shareholders
Review of Operations
Medium- and Long-term
Business Plans
Corporate Governance
Corporate Behavior Charter
Topics
Responsible Care
Management Indices
Financial Section
Report of Independent Auditors
Consolidated Balance Sheets
Consolidated Statements of
Income
Consolidated Statements of
Changes in Net Assets
Consolidated Statements of
Cash Flows
Notes to Consolidated
Financial Statements
Corporate Data
Contents
. . . . . . . . . . . . . . .1�
. . . . . . . . . . . . . . .2
. . . . . . . . . . . . . .4
�
. . . . . . . . . . . . . . . . .6�
. . . . . . . . . . . . .8�
. . . . . .10�
. . . . . . . . . . . . . . . . . . . . . . . . . . . . . .11�
. . . . . . . . . . . . . . . . .12
. . . . . . . . . . . . .14
. . .17
. . .18
�
.. . . . . . . . . . . . . . . . . . . . . . . .20
�
. . . . . . . .21�
�
.. . . . . . . . . . . . . . . . . . .24�
�
.. . . . . . . .26
. . . . . . . . . . . . . . . . . . . .38

Financial Highlights
For the YearNet sales
Operating Income
Ordinary Income
Net Income
´ 232,441
23,228
26,148
16,257
14.7%(16.4)(13.0)(14.0)
$ 2,257,628164,582192,749118,492
´ 291,564
168,704
11.06.3
$ 2,741,8471,519,424
´ 85.89
16.00
(12.8)–
$ 0.630.14
. . . . . . . . . . . . . . . . . .
. . . . . . . . . . .
. . . . . . . . . . . .
. . . . . . . . . . . . . . . .
. . . . . . . . . . . . . . . .
. . . . . . . . . . . .
. . . . . . . . . . . . . . . .
. . . . . . . . . . . . .
At Year EndTotal Assets
Total Net Assets
Per Share AmountsNet Income
Cash Dividends
Foreign Exchange Rate: US$ 1.00 = ´118.05
Notes: Sections under "Total Net Assets" are newly provided to conform Japanese accounting regulations.
The fiscal 2006 figures have also been restated to reflect this change.
See Note 2 of the Management Indices (Page 14-15) for details.
300�
250�
200�
150�
100�
50�
0
Millions of Yen Change%
2005
´ 266,513
19,429
22,754
13,988
´ 323,675
179,368
´ 74.92
16.00
2006 2007/2006 2007
Thousands ofU.S. dollars
Yen U.S. dollars
20�
16�
12�
8�
4�
0
Net Sales(Billions of yen)
Net Income(Billions of yen)
Ordinary Income (Billions of yen)ROA (%)
164 170
232
197
'06'05'04'03 '07
267
30�
25�
20�
15�
10�
5�
0
12�
10�
8�
6�
4�
2�
0
'06'03 '04 '05 '07'06'05'04'03 '07
4.9
7.9
9.710.1
7.4
10.9
17.2
26.123.7
22.8
Nippon Shokubai Co., Ltd. and Consolidated Subsidiaries Years ended March 31
16.3
5.5
8.8
15.7
14
Ordinary Income
ROA
1

To Our Shareholders
It gives me great pleasure to report on the
performance of NIPPON SHOKUBAI GROUP
(the ÒCompanyÓ) for the fiscal year ended March
31, 2007 (Fiscal 2006).
During the fiscal year ended March 31, 2007,
the Japanese economy expanded at a moderate
pace backed by growth in corporate earnings and
increased capital spending, although crude
oil price movements and currency market
fluctuations remained a source of instability.
The chemical industry outlook, meanwhile,
was clouded by soaring raw material prices and
international market trends.
Against this backdrop, consolidated net sales
of the Company increased by ´34,072 million
(14.7%), to ´266,513 million, compared with the
previous year. This was mainly due to an increase
in sales volume of Functional Chemicals in
particular, and revised selling prices reflecting a
sharp rise in raw material prices.
Operating income decreased by ´3,799 million
(16.4%) year on year, to ´19,429 million, due to
the weakened market conditions for some of basic
chemicals, and an increase in fixed costs
including higher depreciation expenses resulting
from expansion of facilities, though exhaustive
efforts were made to expand sales volumes and
revise selling prices in the face of a steep rise in
raw material prices.
Overview
2

Fiscal Year
266,513
19,429
22,754
13,988
´74.92
7.4%
8.2%
$=´117.00
EUR=´150.08
´50,000/kl
232,441
23,228
26,148
16,257
´85.89
9.7%
10.0%
$=´113.35
EUR=´137.85
´42,400/kl
34,072
(3,799)
(3,393)
(2,269)
(´10.97)
Ð
Ð
14.7%
(16.4%)
(13.0%)
(14.0%)
(12.8%)
(2.3points)
(2.3points)
´ 3.65
´12.23
´7,600/kl
Net sales
Operating income
Ordinary income
Net income
Net income per share
ROA
ROE
Exchange rate
Naphtha price
Performance Highlights
2006 2005 Amount %
Change
Tadao Kondo, President
Ordinary income decreased by ´3,393 million
(13.0%), to ´22,754 million, due to a significant
decline in operating income, although non-
operating income/loss was improved by ´406
million from a year earlier because the combined
impact of an increase in investment profit based
on the equity method, and a decrease in costs of
disposal and removal of fixed assets outweighed
the negative impact of a deterioration in the
financial balance. Net income also declined by
´2,269 million (14.0%) year on year, to ´13,988
million.
Net income per share was ´74.92, while ROA
(ordinary income to total assets) and ROE (net
income to shareholdersÕ equity) declined by 2.3
percentage points to 7.4% and to 8.2% respectively,
from a year earlier.
On a non-consolidated basis, net sales were
´192,177 million, operating income, ´16,008
million, ordinary income, ´20,378 million, and
net income, 12,378.
Taking into consideration the business
environment and our performance, we decided to
hold the year end dividend per share on ´8.0.
Together with the interim dividend, the annual
dividend per share for the fiscal 2006 amounts
´16.
We would like to express our sincere
appreciation and ask all of our shareholders for
their continued support and guidance as we move
forward.
June 2007
(million yen)
3

Acrylic acid and acrylic ester sales went up
thanks to higher sales volumes, even though the
market showed signs of weakness.
Sales of ethylene oxide, ethanolamine, and
higher alcohol products (trade name:
SOFTANOLE¨) grew, supported by brisk demand
and progress made in revising selling prices.
Ethylene glycol sales declined due to a lower
sales volume with a tight inventory, though the
market remained strong.
As a result, the Basic Chemical Business
posted net sales of ´97,665 million, up 3.8% over
the previous year.
Operating income decreased by 51.6% year on
year, to ´5,399 million, reflecting the weak
market conditions for some products, significantly
affected by an increase in fixed costs such as
higher depreciation expenses associated with
facility expansion, despite efforts to increase sales
volumes and revise selling prices to properly
reflect soaring raw material prices.
97,665
5,399
141,321
10,838
27,526
2,982
Performance by Business Groups and Regions
Fiscal Year 2006
BasicChemicals
94,095
11,158
116,300
9,262
22,046
3,123
3,751
(5,759)
25,022
1,576
5,480
(141)
FunctionalChemicals
Environment& Catalysts
BasicChemicals
FunctionalChemicals
Environment& Catalysts
BasicChemicals
FunctionalChemicals
Environment& Catalysts
Fiscal Year 2005 Change
Polyester fiber (Ethylene glycol)
Disposable Diapers
(Superabsorbent Polymers)
LCD (organic and inorganic fine
sphere particles)
Basic ChemicalsSuperabsorbent polymer sales rose thanks to a
constantly increasing volume of sales due to
growing world demand, and the successful
outcome of revisions to selling prices.
Sales of maleic anhydride, resins for
adhesives/paints, processed adhesive products,
and resin modifiers increased due to brisk
domestic demand.
Sales of special esters, and polymers for
concrete admixtures grew supported by strong
demand at home and abroad.
Sales of raw materials for detergents increased
due to steady overseas demand.
Sales of electronic and information materials
grew due to an increase in sales volume including
new product launches.
Sales of iodine compounds, intermediates for
pharmaceuticals, and unsaturated polyester resins
remained on a par with the previous yearÕs level.
As a result, the Functional Chemicals Business
posted net sales of ´141,321 million, up 21.5%
over the previous year.
Operating income increased by 17.0% year on
year, to ´10,838 million, owing to higher sales
volumes and revisions to the selling prices of
some products, despite the negative impact of
soaring raw material prices and higher fixed costs,
including depreciation expenses, associated with
facility expansion.
Functional Chemicals
Performance by Business Segment
Review of Operations
(unit : million of yen)
Sales
Operating income
Business Group
4
186,288
17,301
32,521
70
30,194
864
17,510
(285)
Japan Europe AsiaOther
Regions
168,773
20,350
23,953
207
27,405
3,663
12,329
(1,318)
Japan Europe AsiaOther
Regions
17,515
(3,050)
8,586
(137)
2,790
(2,800)
5,181
1,033
Japan Europe AsiaOther
Regions
(unit : million of yen)
Fiscal Year 2006
Region
Sales
Operating income
Fiscal Year 2005 Change
Environment & Catalysts
Net sales increased by 10.4% from a year earlier,
to ´186,288 million, due to higher sales volumes of
Functional Chemicals such as superabsorbent
polymers and polymers for concrete admixtures,
acrylic acids, and acrylic esters.
Operating income decreased by 15.0% year-on-
year, to ´17,301 million, affected by surging raw
material prices and higher fixed costs, including
depreciation expenses, associated with facility
expansion, even though sales actually grew.
JapanAcrylic acid and acrylic ester sales increased in
volume but slightly decreased in value reflecting the
weak market conditions. Net sales in this region,
however, increased by 10.2% over the previous year,
to ´30,194 million, due to a significant increase in
the sales volume of superabsorbent polymers.
Operating income decreased by 76.4% year on
year, to ´864 million, affected by the weak market
conditions for acrylic acids and acrylic esters against
a backdrop of a steep rise in raw material prices,
although sales of superabsorbent grew.
Asia
Net sales increased by 42.0% year on year, to
´17,510 million due to higher sales volumes of
Functional Chemicals such as superabsorbent
polymers and raw materials for detergents.
Operating loss stood at ´285 million, though this
result showed a substantial improvement over that
for the previous year, thanks to boosted sales and
revisions to selling prices amid escalating raw
material prices.
Other RegionsNet sales increased by 35.9% year on year, to
´32,521 million thanks to brisk sales of
superabsorbent polymers.
Operating income decreased by 66.3% from the
period a year earlier, to ´70 million, because the
impact of escalating raw material prices and higher
fixed costs, including depreciation expenses,
associated with facility expansion, was more than
offset by the effects of higher sales and selling price
revisions.
Europe
Performance by Regions
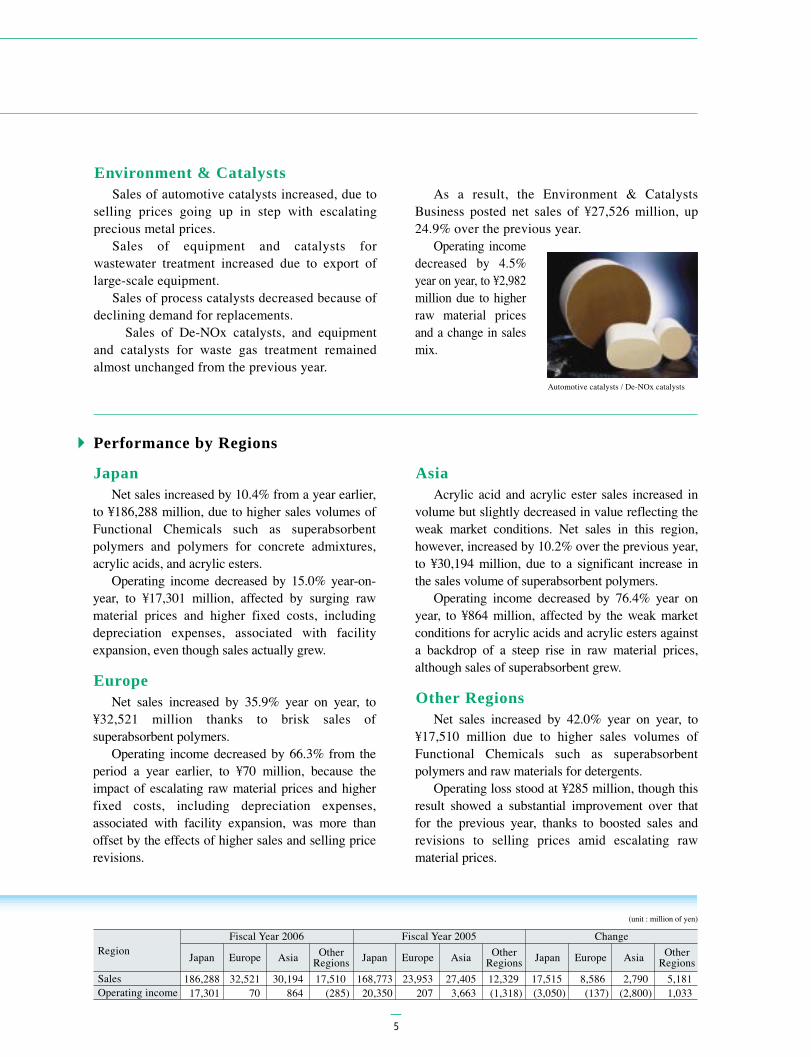
Sales of automotive catalysts increased, due to
selling prices going up in step with escalating
precious metal prices.
Sales of equipment and catalysts for
wastewater treatment increased due to export of
large-scale equipment.
Sales of process catalysts decreased because of
declining demand for replacements.
Sales of De-NOx catalysts, and equipment
and catalysts for waste gas treatment remained
almost unchanged from the previous year.
As a result, the Environment & Catalysts
Business posted net sales of ´27,526 million, up
24.9% over the previous year.
Operating income
decreased by 4.5%
year on year, to ´2,982
million due to higher
raw material prices
and a change in sales
mix.
Automotive catalysts / De-NOx catalysts
5

Medium- and Long-term Business Plans
The Company seeks further growth under the
long-term business plan ÒTechnoAmenity V3Ó (for
fiscal 2006 to 2010), which sets out a long-term
management vision, coupled with the Medium-
term Business Plan (for fiscal 2006 to 2008),
which provides a concrete action plan to realize
the long-term business plan.
The Company drew up a long-term business plan, ÒTechnoAmenity V3,Ó which sets out the
management vision for the five years since fiscal 2006 to fiscal 2010, together with a medium-
term business plan as its action program, in a bid to deliver further growth.
Challenges and Medium- and Long-term Management Strategies
1) Outline of the Long-term Business Plan “TechnoAmenity V3”
1. Vision for the future: ÒA global company creating new values through unique technologiesÓ
2. Slogan: ÒPursuitÓ to our strength such as key technologies and key materials
ÒInnovationÓ of way of marketing and research
ÒAscentÓ to be realized through Ò PursuitÓ and ÒInnovationÓ
3. Target for FY 2010: Net Sales: ´350 billions
Ordinary Income: ´35 billions
ROA: above 7.5%
FY2010
New
Business
Field
Existing
Business
Field
Themes of
Whole
Company
A
Global Company
Creating
New Values
Through
Unique
Technologies
TechnoAmenity V3(FY2006–2010)
- Pursuit, Innovation and Ascent -
Net sales: ¥350 billionsOrdinary income: ¥35 billionsROA: above 7.5%
concentration on electronic & information materials business
further selection and concentration in priority areas
selective advance into growth areas
continuous improvement of production technologies
enhancement of division's roles and responsibilities
creating business synergy with domestic subsidiariesand developing divisional responsible system
for foreign subsidiaries
FY2006
6

Progress on the Medium-term Business Plan
The Company seeks to enter into growth areas
(fields; overseas) outside the domain of its existing
business, and at the same time, continue to pursue
innovative production technologies in order to
enhance its cost competitiveness. As for new lines of
business, the Company will concentrate its
management resources on the electronic and
information materials business as the top priority for
the ÒTechnoAmenity V3Ó plan, while searching for
more sharply focused next-generation business
themes.
Through the execution of these measures, the
Company aims to attain the fiscal 2008 target for net
sales of ´300 billions (including ´40 billions of new
products), ordinary income of ´30 billions, and ROA
of 7.5% or higher.
2) Outline of the Medium-term Business Plan
The construction of superabsorbent polymer
manufacturing plants was completed at Nippon
Shokubai Europe N.V. (Belgium) and the Himeji
Plant, adding 30,000 tons to annual capacity at both
sites, with commercial operations starting in spring
2006. A manufacturing plant with an annual capacity
of 60,000 tons is also scheduled to be completed at
the Himeji Plant, and go into commercial operation
in summer 2007. With the completion of these
plants, the annual production capacity of
superabsorbent polymers will expand to 410,000
tons, allowing the Company to maintain its
leadership position in the global market.
For the acrylic acid business, a manufacturing
plant with an annual production capacity of 160,000
tons completed at the Himeji Plant has been
operating since December 2006, enabling the
Company to achieve an annual production capacity
of 620,000 tons for acrylic acids.
For the ethylene oxide business, the Company
seeks to establish a solid business foundation less
susceptible to market fluctuations, by boosting sales
of ethylene oxide and its derivative products up to
the target ratio of 80% or higher for non-EG
(ethylene glycol) products.
The Company also acquired a new site with the
intention of consolidating the manufacture of
ethylene oxide and its derivative products into the
Kawasaki area.
For other businesses, the Company seeks to
further expand global operations for its
internationally competitive functional chemicals. To
this end, a new manufacturing plant with an annual
capacity of 10,000 tons for polymers for concrete
admixtures is under construction at NISSHOKU
CHEMICAL INDUSTRY (ZHANGJIAGANG)
CO., LTD., and is due for completion in autumn
2007.
(1) Existing business
For the electronic and information materials
business, the Company newly formed the E&I
Materials Business Division in April 2006, and has
been making steady progress toward the
development and commercialization of new
products. Among other things, the production
facilities for acrylic resins for optical materials,
which were constructed at the Himeji Plant and went
into commercial operation at the end of 2006, are
scheduled for further expansion with the aim of
achieving an annual production capacity of 6,000
tons by the autumn 2007. Business development for
fine spherical particles and functional pigments has
also made solid progress. The Company, meanwhile,
opened a new office in South Korea, a promising
overseas market, pursuing further growth in the
electronic and information materials business.
Meanwhile, the Company remains committed to
development and commercialization initiatives in
fields considered to be the next growth areas, health
& medical care, and new energy, with a view to
commercialization around 2010.
(2) New Business
7

Board of Directors, comprised of 16 directors
as of March 31, 2007, deliberates and resolves the
matters relating to the execution of business
operations, and supervises each directorÕs
execution of operation. In principle, the Board of
Directors convenes once a month, chaired by the
president, at which four corporate auditors,
including two from outside, are in attendance. The
corporate auditors present statements when
deemed necessary.
Corporate Management Committee, as an
advisory organ to the president, deliberates basic
management policies, the matters related to the
policies, and the execution of important business
operations by individual divisions. Agenda items
that come up to this Committee and are regarded
as important will be forwarded to the Board of
Directors for deliberation.
The member of the Corporate Management
Committee are the president, senior managing
directors managing directors and directors
nominated by the president.
Corporate Governance
We have strived toward reinforcing our staying
power and competitive edge so that we can cope
flexibly with any fluctuation of the world, and
regard corporate governance as key for achieving
the goal. We are taking steps to revitalize the
board of directors, strengthen the audit system,
increase the efficiency and effectiveness of
operation, and ensure tighter compliance.
The diagram below shows the frame of our
corporate governance system.
audit
audit
Corporate Governance System
General Meeting of Shareholders
Board of Corporate Auditors
Accounting Auditor
report
communicate
support
cooperate
Auditor's Office
Board of Directors
President
Corporate Management
Committee
Risk Management
Committee
CSR Management Committee
Compliance CommitteeInternal Control Committee
Responsible Care Promoting Committee
Legal Advisors
InternalAudit Office internal
audit
AdministrationFinance & Accounting
Responsible Care Office
Corporate Planning
Office
Informational Technology
Management Office
SalesResearch & Development Production
8

Board of Corporate Auditors is comprised of
four corporate auditors, including two from
outside. In principle, the Board convenes once a
month to report, discuss and resolve important
matters. In addition to attending the Board of
Directors, the corporate auditors attend the
Corporate Management Committee and other
important meetings to monitor the decision-
making process, and grasp the execution of
directorsÕ operation, receive reports from the
accounting auditors, directors and others, and put
forward an audit opinion following due
consultation.
The two current Corporate Auditors from
outside have no personal or any other relationship
through investments that could create a conflict of
interest in the performance of their duties.
Risk Management Committee, chaired by the
president, explores and analyzes the risks
surrounding the Company. On the basis of the
analysis, the Committee discusses the preventive
measures or countermeasures for the risks.
CSR (Corporate Social Responsibility)
Management Committee, chaired by the
president, discusses and decides the CSR policy
and activities that would make all the stakeholders
beneficial, in cooperation with the other
committees such as Risk Management Committee
or the Compliance Committee.
Responsible Care Promoting Committee,
chaired by the president, discusses and decides the
policy and plans of activities for ÒResponsible
Care (RC)Ó placing a special emphasis on
environmental preservation, safety and quality
throughout the entire life cycle of our products
from the development to disposal. In March 2006,
the Committee established the Ò5th Medium-term
RC promotion Basic PlanÓ to reinforce our RC
more active.
Compliance Committee, chaired by the
president, discusses and decides measures to
enhance our company-wide compliance
management.
The Internal Control Committee concerning
financial reporting, chaired by the president,
discusses and prepares for the highly efficient
Internal Control System enforced by Financial
Instruments and Exchange Law as of April 1st
2008, not only aim to ensure the riability of the
companyÕs financial reporting, but also to ensure
the effectiveness and efficiency of the companyÕs
business activities.
Legal Advisers provide their opinions for us
when solicited. None of the Legal Advisors is
involved in the management of the Company.
Accounting Auditors perform their services
under the Commercial Code and Securities and
Exchange Law of Japan, and provide their
opinions when we call for it to make decisions on
accounting issues. None of the Accounting
Auditors is involved in the management of the
Company.
Internal Audit Office carries out internal
audits (verify the adequacy and effectiveness of
the business process in each division and report
the results to the directors) in cooperation with the
Board of Corporate Auditors.
Responsible Care Office carries out internal
audits on responsible care activities in each
division.
9

Nippon Shokubai Corporate Behavior Charter
In the belief that it is our social responsibility
to conduct business based upon the principles of
compliance and self-responsibility for the sake of
proper social development, we have set forth the
following basic corporate behavior guidelines in
the ÒNippon Shokubai Corporate Behavior
Charter.Ó
To ensure and realize the principles of the
Charter above, the Compliance Committee issued
ÒThe Nippon Shokubai Compliance GuidebookÓ
for ongoing compliance training for all the
managers and the employees.
1.
2.
3.
4.
5.
6.
7.
8.
9.
10.
Guided by our Corporate Philosophy of ÒTechnoAmenity,Ó we will conduct all of our
actions as a good corporate citizen.
We will comply with relevant laws both inside and outside of Japan, and act in
accordance with in-house regulations.
We will create and nurture a sound, vibrant workplace, where each individual can hone
their professional competence and find fulfillment in their career.
We will develop and market products and services that are both safe and useful, based
upon an accurate understanding of social demands.
We will commit ourselves to eliminating labor hazards and accidents, and constantly
strive to protect the global environment.
We will conduct business based on fair and open competition.
We will take a firm stance when dealing with unlawful or antisocial groups.
We will ensure frequent communications with our shareholders and members of society
in general, and guarantee the appropriate disclosure of corporate information.
With respect for the culture and customs of every nation/region we serve, we will
contribute to their development and wellbeing through community-based business
undertakings.
We will ensure the solid and sustainable development of the company through business
undertakings based soundly upon the above action guidelines.
10

Topics
The construction of a new superabsorbent
polymer (SAP) manufacturing plant with an
annual capacity of 60,000 tons, which started last
year with the aim of reinforcing the SAP business
as the CompanyÕs core operation, and responding
to growing SAP demand, has been completed.
The facilities are designed to cut costs
including reducing construction costs per unit
capacity by scaling up annual capacity from the
current 30,000 tons to 60,000 tons.
With the new facilities coming into operation,
the Company has now a total annual SAP
production capacity of 410,000 tons at four sites
around the world.
The Company will strive to maintain its
leadership position in the global market, and seek
to make further advances, capitalizing on its
strength as an integrated manufacturer of acrylic-
based products.
Himeji Plant: Completion of Superabsorbent Polymer Plant
ÒDevelopment of New Production Process for
N-vinyl-2-pyrrolidoneÓ was awarded The CSJ(*)
Award for Technical Development (2006).
( * The Chemical Society of Japan )
ÒDevelopment of Environmental Friendly
Acrylic Emulsion for PaintsÓ was awarded The
Kinka Chemical Society Award for Environmental
Technology.
Awards
11

1. Our Fundamental Policy on Environment, Safety and Quality
The Company has set the corporate philosophy
as “TechnoAmenity: providing affluence and comfort to society through technology”. Adhering to the
philosophy, the Company has defined the four
priorities regarding Environment, Safety and
Quality, which will bring our business activities into
harmony with global environmental preservation
and conservation:
1. Acknowledging environmental preservationthroughout the entire life cycle of a product, fromdevelopment to disposal
2. Aiming for zero accidents and disasters andkeeping society, including our employees, safe
3. Confirming the safety of chemical materials,intermediates and products, and considering thehealth of respective people such as ourcustomers, employees of logistics, and ouremployees, etc.
4. Stably supplying products and associated servicesthat meet customer satisfaction and inspire theirtrust
(2) RC Management System
ISO 14001(EMS)
Registration of all operations completed in July
2001. Up grading to improved 2004 standards
completed in 2005.
ISO 9001(QMS)
Registration of all operations completed. Up
grading to improved 2000 standards completed in
2003.
2. RC Promotion Organization
3. The 5th Medium-Term RC Promotion Basic Plan(FY2006-FY2008)
(1) RC Promotion Organization
Environment and Safety
Committee
Chemical Total Management
CommitteeProduct Safety Review
Sub-committee
Quality Committee.Attainment of common targets to all NIPPON SHOKUBAI GROUP
<Group common targets>
1)Environmental preservation.Promotion of energy saving activities.Reduction of emission of PRTR chemical substances.Reduction of amount of waste generated
2)Process Safety and Disaster Prevention.Zero disasters .Zero accidents
3)Occupational Safety and Health.50% reduction of industrial injuries with lost workdays
(vs.FY2004 - FY2005)
4)Chemical Safety.Zero problems on chemical safety(legal or social)
5)Quality.Zero serious claims
6)Communication with Society.Promotion of dialogue to stakeholders and adequate disclosure
of the information
7)Management System.Introduction of ISO14001 and risk assessment of OHSAS18001.
President Director responsible for RC RC Division
Responsible Care
Promotion Committee
Chairman:President
Goals(1) Voluntarily pursuing goals in each of the related areas within the company
Environmental Preservation.6% reduction of energy per unit of production on FY2008 (vs.FY2005)
(3% reduction of CO2 emission per unit of production on
FY2008 (vs.FY2005)).Accession to zero emission* and its maintenance.40% reduction of emission of PRTR* chemical substances (vs.FY2005).Establishment of eco-friendly product design system
*Zero emission is defined as less quantity of final off-site
landfill than 0.1% of total amount of waste generated.
Process Safety and Disaster Prevention.Zero disasters .Zero accidents
Occupational Safety and Health.Zero industrial injuries with lost workdays (including contractors).Zero industrial injuries without lost workdays (including contractors)
Chemical Safety.Zero problem on chemical safety (legal or social)
Quality.Zero serious claims
Communication with Society.Promotion of dialogue with stake holders and adequate
disclosure of the information regarding RC
(2) Group RC activities in domestic and overseas
SocietyCommunications
Chairman: Senior Managing Director
Chairman: Senior Managing Director
Chairman: Senior Managing Director
EnvironmentalPrevention
Quality
ProcessSafety &DisasterPrevention Occupational
Safety &Health
ChemicalSafety
Environment &Safety Dept.
Quality AssuranceDept.
Responsible Care
12

PRTR:Pollutant Release and Transfer RegisterA regulatory system which requires reporting of emission volumes of
wastes. Data compiled to the government bodies are disclosed to the
public.
HAZOP:Hazard and Operability StudiesAn execution to estimate the safety of plants.
Management of Changes:Program to ensure that proposed changes to plant operations are
evaluated changes are prevented so as to public, and the environmental,
etc.
Yellow Card:A card staring the producers to be taken and contact information for
transporters, fire squads, and police in the event of an accident during the
road transport of chemicals.
REACH:Registration, Evaluation, and Authorization of ChemicalsA new EU regulatory framework for the Registration, Evaluation and
Authorization of Chemicals aiming to improve the protection of human
health and the environment through the better and earlier identification
of the properties of chemical substances.
GHS:Globally Harmonized System of Classification and Labeling of Chemicals
A system for classification and labeling of chemicals hazard according
to the globally harmonized rule.
4. RC Performance in FY 2006
ÒNoji-GikuÓ and Himeji Plant Potato digging (Himeji Plant)
RC meeting (Himeji Plant)
(1) Environmental Preservation
① Implementation of safety assessment by
HAZOP*
②Reduction of change risk through Management
of Changes*
③Training for emergency
④Logistic safety using Yellow Card* system and
training for transportation emergency
(2) Process Safety and Disaster Prevention
Regional activities such as conserving local
chrysanthemum ÒNoji-GikuÓ in danger of extinction,
and inviting children to potato digging in Himeji
Plant.
(6) Communication with Society
■Reduction of environmental emission, labor
accident, equipment trouble and quality claim
& nonconformity■Information sharing for RC activity
①Affiliated companies in Japan:■RC audit and case study workshop about
quality carried out by the Group companies■ISO 9001 certification (Tokyo Fine Chemical
Co., Ltd.)
②Overseas affiliated companies:■ISO 14001 certification (NA Industries, Inc.)■RC meeting in Himeji Plant
(7) RC activities of the Company in Japan & overseas
① Safety assessment of new products through
Stage Gate System
②Global Product Stewardship for REACH* and
GHS*
(4) Chemical Safety
① Prevention of quality complaint by improving
Quality Management System
②Disclosing information concerning green
procurement to the customers
(5) Quality
①Energy saving
②Reduction of emission of PRTR* chemical
substances
③Reduction of industrial wastes
(3) Occupational Safety and Health
①Reduction of risk in workspace through
Occupational Safety and Health Management
System
②Prevention of injuries caused by unsafe action
13

(1) Consolidated Management Indices
Year ended March 31(Fiscal Year)
2003(2002)
2004(2003)
2005(2004)
2006(2005)
Net Sales
Ordinary Income
Net Income
Total Assets
Total Shareholders' Equity
Total Net Assets
163,514�
10,971�
5,516�
216,756
121,297�
-
169,733�
17,212�
8,822�
220,185�
131,685�
-
197,222�
23,709�
15,705�
249,349�
144,660�
-
232,441�
26,148�
16,257
291,564�
164,631�
168,704
631.12�
27.97�
-
�
56.0�
4.6�
20.4
685.20�
45.37�
-
�
59.8�
7.0�
18.0
757.72�
81.37�
-
�
58.0�
11.4�
11.9
875.00�
85.89�
-
�
56.5�
10.5�
16.3
23,117 �
(8,751)
(15,956)
21,217
16,399 �
(9,161)
(9,506)
18,654
22,161 �
(16,934)
(861)
24,160
17,468 �
(20,663)
(2,562)
19,856
2,967 2,658 2,721 2,806
Net Assets per Share
Net Income per Share
Fully Diluted Net Income per Share
Capital Ratio(%)
Return on Equity(%)
Price Earning Ratio(times)
Cash Flow from Operating Activities
Cash Flow from Investing Activities
Cash Flow from Financing Activities
Cash and Cash Equivalents at Year-end
Number of Employees
Note 1: Net Sales do not include consumption taxes.
Note 2: Effective the year ended March 31, 2007, the Company has adopted a new accounting standard for the presentation of net assets in
the balance sheet and the related implementation guidance. In addition, effective the year ended March 31, 2007, the Company is
required to prepare consolidated statements of changes in net assets instead of consolidated statements of shareholders' equity. In this
connection, the previously reported consolidated balance sheet as of March 31, 2006 and consolidated statement of shareholders'
equity for the year then ended have been restated to conform to the presentation and disclosure of the consolidated financial
statements for the year ended March 31, 2007.
Note 3: Fully diluted Net Income per Share is not recorded because no dilutive shares exist.
(Millions of Yen)
(Yen)
(Millions of Yen)
2007(2006)
266,513�
22,754�
13,988�
323,675�
-�
179,368
948.34�
74.92�
-�
�
54.1�
8.2�
17.0
16,087 �
(23,109)
4,037
16,991
2,841
Management Indices
14

(2) Non-consolidated Management Indices
Year ended March 31(Fiscal Year)
2003(2002)
2004(2003)
2005(2004)
2006(2005)
Net Sales
Ordinary Income
Net Income
Capital
Issued and Outstanding Shares
(Thousands shares)
126,612�
10,879�
3,094�
16,529�
�
194,881
132,622�
14,228�
5,966�
16,529�
�
194,881
146,789�
17,795�
11,063�
16,529�
�
194,881
170,510�
23,008�
14,502�
16,529�
�
194,881
176,155�
115,593�
-
182,806�
124,417�
-
207,303�
133,100�
-
237,571�
148,283�
148,283
601.48 �
7.00 �
(3.50)�
15.55 �
-
�
65.6 �
2.7 �
36.7 �
45.0
647.41 �
9.00 �
(4.00)�
30.56 �
-
�
68.1 �
5.0 �
26.7 �
29.5
697.19 �
13.00 �
(5.00)�
57.20 �
-
�
64.2 �
8.6 �
17.0 �
22.7
788.11 �
16.00 �
(7.50)�
76.61 �
-
�
62.4 �
10.3 �
18.3 �
20.9
1,881 1,774 1,731 1,730
2007(2006)
192,177�
20,378�
12,378�
16,529�
�
194,881
262,059�
-�
151,266�
819.47 �
16.00 �
(8.00)�
66.30 �
-
�
57.7 �
8.3 �
19.2 �
24.1
1,742
Net Assets per Share
Dividend per Share
(Interim Dividend per Share)
Net Income per Share
Fully Diluted Net Income per Share
Capital Ratio(%)
Return on Equity(%)
Price Earning Ratio(times)
Dividend Payout Ratio(%)
Number of Employees
Note 1: Net Sales do not include consumption taxes.
Note 2: Effective the year ended March 31, 2007, the Company has adopted a new accounting standard for the presentation of net assets in
the balance sheet and the related implementation guidance. In addition, effective the year ended March 31, 2007, the Company is
required to prepare consolidated statements of changes in net assets instead of consolidated statements of shareholders' equity. In this
connection, the previously reported consolidated balance sheet as of March 31, 2006 and consolidated statement of shareholders'
equity for the year then ended have been restated to conform to the presentation and disclosure of the consolidated financial
statements for the year ended March 31, 2007.
Note 3: The dividend per share for the fiscal year ended March 31,2005(fiscal 2004) include a ´2 memorial dividend our 65th anniversary of
the company's foundation.
Note 4: Fully diluted Net Income per Share is not recorded because no dilutive shares exist.
(Millions of Yen)
(Millions of Yen)
(Yen)
Total Assets
Total Shareholders' Equity
Total Net Assets
15

Nippon Shokubai Co., Ltd.Consolidated Financial Statements
Years ended March 31, 2007 and 2006
Report of Independent Auditors
Consolidated Balance Sheets
Consolidated Statements of Income
Consolidated Statements of Changes in Net Assets
Consolidated Statements of Cash Flows
Notes to Consolidated Financial Statements
...................................17
......................................18
..............................20
..........21
........................24
...................26
Consolidated Financial Statements
Contents
16

Report of Independent Auditors
17

Consolidated Balance SheetsNippon Shokubai Co., Ltd. and Consolidated Subsidiaries
Total assets
AssetsCurrent assets:
Cash and cash equivalents
Time deposits (Note 7)
Notes and accounts receivable (Note 4):
Unconsolidated subsidiaries and affiliates
Trade
Allowance for doubtful receivables
Inventories (Note 6)
Deferred income taxes (Note 9)
Other current assets
Property, plant and equipment (Note 7):
Land
Buildings and structures
Machinery and equipment
Construction in progress
Accumulated depreciation
´ 19,856
223
7,091
50,353
(94)
38,705
3,368
6,412
$ 143,931
1,398
94,424
507,033
(4,812)
389,166
26,870
74,053
.....................................
.........................................
................
...........................................................
........................
............................................
..............................
............................................
...............................................
¥ 16,991
165
11,147
59,855
(568)
45,941
3,172
8,742
125,914 1,232,063145,445
(Millions of yen)
2007
March 31,
2006 2007
(Thousands of U.S. dollars)
(Note 2)
25,636
63,972
227,941
16,958
(229,418)
233,875
579,272
2,165,117
57,416
(2,039,094)
..............................................................
.......................................
.....................................
.......................................
.....................................
.............................
27,609
68,383
255,592
6,778
(240,715)
105,089 996,586117,647
35,610
11,138
925
2,730
10,158
266,463
139,831
7,632
25,388
73,884
...................
................
..............................
...........................................
......................................................
..............................
31,456
16,507
901
2,997
8,722
60,561 513,19860,583
......................................................... ´ 291,564 $2,741,847¥ 323,675
Total current assets
Property, plant and equipment, net
Total investments and other assets
Investments and other assets:
Investments in securities (Notes 5 and 7)
Investments in and advances to
unconsolidated subsidiaries and affiliates
Deferred income taxes (Note 9)
Prepaid pension cost
Other assets
18

(Millions of yen)
2007
March 31,
2006 2007
(Thousands of U.S. dollars)
(Note 2)
Contingent liabilities (Note 14)
Total net assets
Total liabilities and net assets
See accompanying notes to consolidated financial statements.
Liabilities and Net Assets
´ 11,538
5,317
6,207
33,936
262
2,151
139
2,667
5,657
12,833
80,707
$ 153,977
49,869
62,707
398,615
152
17,459
1,101
23,228
34,036
104,134
845,278
...............................
.................
................
...........................................................
...................................................
...............................
.....
...................................
...............................
........................................
.......................................
......
..............................
.................................................
........
................................................
............................................
.................................
................
.....................................
................
...............................................
....................................................
...................................
¥ 18,177
5,887
7,403
47,056
18
2,061
130
2,742
4,018
12,293
99,785
28,363
6,754
5,429
1,607
42,153
285,201
57,526
22,423
11,995
377,145
33,668
6,791
2,647
1,416
44,522
16,529
13,565
125,684
(5,345)
150,433
140,017
114,926
1,188,903
(85,379)
1,358,467
16,529
13,567
140,350
(10,079)
160,367.....................................
90,521
33,884
124,405
36,552
12,259
1,939
14,198
4,073
10,686
4,000
14,686
4,315
Current liabilities:
Short-term bank loans (Note 7)
Current portion of long-term debt (Note 7)
Notes and accounts payable (Note 4):
Unconsolidated subsidiaries and affiliates
Trade
Construction
Accrued bonuses to employees
Accrued bonuses to directors and corporate auditors
Reserve for periodic repairs
Accrued income taxes (Note 9)
Other current liabilities�
Total current liabilities
Long-term liabilities:
Long-term debt (Note 7)
Accrued retirement benefits for employees (Note 8)
Deferred income taxes (Note 9)
Other (Note 10)
Total long-term liabilities ........................................
Net assets (Note 11):
ShareholdersÕ equity:
Common stock:
Authorized Ð 424,000,000 shares
Issued Ð 194,881,287 shares in 2007 and 2006
Capital surplus
Retained earnings
Less treasury stock, at cost
Total shareholdersÕ equity
Valuation and translation adjustments:
Net unrealized holding gain on securities
Translation adjustments
Total valuation and translation adjustments
Minority interests
...........................................
168,704
´ 291,564
1,519,424
$2,741,847
179,368
¥ 323,675
19

Consolidated Statements of IncomeNippon Shokubai Co., Ltd. and Consolidated Subsidiaries
Net sales (Note 17)
Cost of sales (Note 12)
Gross profit
Selling, general and administrative expenses (Note 12)
Operating income (Note 17)
Other income (expenses):
Interest and dividend income
Interest expense
Royalty income
Equity in earnings of unconsolidated
subsidiaries and affiliates
Loss on liquidation of an affiliate
Other, net
Income before income taxes and minority interests
Income taxes (Note 9):
Current
Deferred
Income before minority interests
Minority interests in earnings of consolidated subsidiaries
Net income (Note 15)
See accompanying notes to consolidated financial statements.
´ 232,441
176,253
56,188
32,960
23,228
1,458
(733)
1,022
961
Ð
212
26,148
10,331
(594)
9,737
16,411
(154)
´ 16,257
¥ 266,513
212,468
54,045
34,616
19,429
1,021
(1,014)
916
1,358
(452)
1,044
22,302
6,857
1,279
8,136
14,166
(178)
¥ 13,988
$2,257,628
1,799,814
457,814
293,232
164,582
8,649
(8,590)
7,759
11,504
(3,829)
8,845
188,920
58,086
10,834
68,920
120,000
(1,508)
$ 118,492
(Millions of yen)
2007
Year ended March 31,
2006 2007
(Thousands of U.S. dollars)
(Note 2)
...............................................
...........................................
..................................................
.....
...............................
.................................
.................................................
.................................................
...................................
............................
.........................................................
...
...........................................................
.........................................................
.........................
...
......................................
20

Consolidated Statements of Changes in Net AssetsNippon Shokubai Co., Ltd. and Consolidated Subsidiaries
¥ 16,529
–
–
–
–
–
–
–
¥ 16,529
¥ 13,565
–
–
–
2
–
–
2
¥ 13,567
¥ 125,684
(3,092)
13,988
–
–
3,770
–
14,666
¥ 140,350
¥ (5,345)
–
–
(4,737)
3
–
–
(4,734)
¥ (10,079)
¥ 150,433
(3,092)
13,988
(4,737)
5
3,770
–
9,934
¥ 160,367
ShareholdersÕ equity
(Millions of yen)
Balance at March 31, 2006
Movements during the year:
Cash dividends
Net income
Purchases of treasury stock
Disposition of treasury stock
Adjustments due to increase in affiliates
accounted for by the equity method
Net changes in items other than
shareholdersÕ equity
Total movements during the year
Balance at March 31, 2007
...........................
.......................................
...........................................
........................
......................
............
...............................
....................
...........................
Commonstock
Capitalsurplus
Retainedearnings
Lesstreasury
stock, at cost
Totalshareholders’
equity
¥ 12,259
–
–
–
–
–
(1,573)
(1,573)
¥ 10,686
¥ 1,939
–
–
–
–
–
2,061
2,061
¥ 4,000
¥ 14,198
–
–
–
–
–
488
488
¥ 14,686
¥ 4,073
–
–
–
–
–
242
242
¥ 4,315
¥ 168,704
(3,092)
13,988
(4,737)
5
3,770
730
10,664
¥ 179,368
Valuation and translation adjustments
(Millions of yen)
Balance at March 31, 2006
Movements during the year:
Cash dividends
Net income
Purchases of treasury stock
Disposition of treasury stock
Adjustments due to increase in affiliates
accounted for by the equity method
Net changes in items other than
shareholdersÕ equity
Total movements during the year
Balance at March 31, 2007
...........................
.......................................
...........................................
........................
......................
............
...............................
....................
...........................
Netunrealized
holdinggain on
securitiesTranslationadjustments
Totalvaluation
andtranslationadjustments
Minorityinterests
Total netassets
21

¥ 16,529
–
–
–
–
–
–
–
¥ 16,529
¥ 13,565
–
–
–
–
0
–
0
¥ 13,565
¥ 112,496
(2,945)
(124)
16,257
–
–
–
13,188
¥ 125,684
¥ (2,505)
–
–
–
(2,844)
4
–
(2,840)
¥ (5,345)
¥ 140,085
(2,945)
(124)
16,257
(2,844)
4
–
10,348
¥ 150,433
ShareholdersÕ equity
(Millions of yen)
Balance at March 31, 2005
Movements during the year:
Cash dividends
Bonuses to directors and corporate auditors
Net income
Purchases of treasury stock
Disposition of treasury stock
Net changes in items other than
shareholdersÕ equity
Total movements during the year
Balance at March 31, 2006
...........................
.......................................
.....
...........................................
........................
......................
...............................
....................
...........................
Commonstock
Capitalsurplus
Retainedearnings
Lesstreasury
stock, at cost
Totalshareholders’
equity
¥ 5,632
–
–
–
–
–
6,627
6,627
¥ 12,259
¥ (1,057)
–
–
–
–
–
2,996
2,996
¥ 1,939
¥ 4,575
–
–
–
–
–
9,623
9,623
¥ 14,198
¥ 3,494
–
–
–
–
–
579
579
¥ 4,073
¥ 148,154
(2,945)
(124)
16,257
(2,844)
4
10,202
20,550
¥ 168,704
Valuation and translation adjustments
(Millions of yen)
Balance at March 31, 2005
Movements during the year:
Cash dividends
Bonuses to directors and corporate auditors
Net income
Purchases of treasury stock
Disposition of treasury stock
Net changes in items other than
shareholdersÕ equity
Total movements during the year
Balance at March 31, 2006
...........................
.......................................
.....
...........................................
........................
......................
...............................
....................
...........................
Netunrealized
holdinggain on
securitiesTranslationadjustments
Totalvaluation
andtranslationadjustments
Minorityinterests
Total netassets
Consolidated Statements of Changes in Net Assets (continued)
22

$ 140,017
–
–
–
–
–
–
–
$ 140,017
$ 114,909
–
–
–
17
–
–
17
$ 114,926
$1,064,668
(26,192)
118,492
–
–
31,935
–
124,235
$1,188,903
$ (45,277)
–
–
(40,127)
25
–
–
(40,102)
$ (85,379)
$1,274,317
(26,192)
118,492
(40,127)
42
31,935
–
84,150
$1,358,467
ShareholdersÕ equity
(Thousands of U.S. dollars)
Balance at March 31, 2006
Movements during the year:
Cash dividends
Net income
Purchases of treasury stock
Disposition of treasury stock
Adjustments due to increase in affiliates
accounted for by the equity method
Net changes in items other than
shareholdersÕ equity
Total movements during the year
Balance at March 31, 2007
...........................
.......................................
...........................................
........................
......................
............
...............................
....................
...........................
Commonstock
Capitalsurplus
Retainedearnings
Lesstreasury
stock, at cost
Totalshareholders’
equity
$ 103,846
–
–
–
–
–
(13,325)
(13,325)
$ 90,521
$ 16,425
–
–
–
–
–
17,459
17,459
$ 33,884
$ 120,271
–
–
–
–
–
4,134
4,134
$ 124,405
$ 34,502
–
–
–
–
–
2,050
2,050
$ 36,552
$1,429,090
(26,192)
118,492
(40,127)
42
31,935
6,184
90,334
$1,519,424
Valuation and translation adjustments
(Thousands of U.S. dollars)
Balance at March 31, 2006
Movements during the year:
Cash dividends
Net income
Purchases of treasury stock
Disposition of treasury stock
Adjustments due to increase in affiliates
accounted for by the equity method
Net changes in items other than
shareholdersÕ equity
Total movements during the year
Balance at March 31, 2007
...........................
.......................................
............................................
........................
......................
............
...............................
....................�
...........................
Netunrealized
holdinggain on
securitiesTranslationadjustments
Totalvaluation
andtranslationadjustments
Minorityinterests
Total netassets
23

Consolidated Statements of Cash FlowsNippon Shokubai Co., Ltd. and Consolidated Subsidiaries
Operating activities:
Income before income taxes and minority interests
Adjustments to reconcile income before income taxes and
minority interests to net cash provided by operating activities:
Depreciation and amortization
Loss on liquidation of an affiliate
Increase (decrease) in accrued retirement benefits
Interest and dividend income
Interest expense
Equity in earnings of unconsolidated subsidiaries
and affiliates
Loss on disposal of property, plant and equipment
Other, net
Changes in operating assets and liabilities:
Notes and accounts receivable
Inventories
Notes and accounts payable
Other current liabilities
Subtotal
Interest and dividends received
Interest paid
Income taxes paid
Net cash provided by operating activities
Investing activities:
Purchases of property, plant and equipment
Proceeds from sales of property, plant and equipment
Purchases of marketable securities and
investments in securities
Proceeds from sales of short-term investments and
investments in securities
Increase in loans receivable
Collection of loans receivable
Other, net
Net cash used in investing activities
´ 26,148
9,349
Ð
(89)
(1,458)
733
(961)
315
1,133
(3,646)
(8,012)
2,719
(28)
26,203
1,571
(709)
(9,597)
17,468
¥ 22,302
12,951
452
37
(1,021)
1,014
(1,358)
317
(4,887)
(13,146)
(6,666)
13,492
(14)
23,473
1,959
(949)
(8,396)
16,087
(22,527)
4
(1,850)
455
(110)
1,191
(272)
(23,109)
(22,105)
11
(1,017)
176
(215)
1,375
1,112
(20,663)
(190,826)
34
(15,672)
3,854
(932)
10,089
(2,303)
(195,756)
$ 188,920
109,708
3,829
313
(8,649)
8,590
(11,504)
2,685
(41,397)
(111,360)
(56,468)
114,291
(119)
198,839
16,595
(8,039)
(71,122)
136,273
(Millions of yen)
2007
Year ended March 31,
2006 2007
(Thousands of U.S. dollars)
(Note 2)
.........
...............................
...........................
........
................................
................................................
...................................................
.......
........................................................
............................
...................................................
...............................
....................................
.................................................
.................................
........................................................
.................................................
.....................
..................
......
.......................................
.......................................
.....................................
..................................
..........................................................
...........................
24

(Millions of yen)
2007
Year ended March 31,
2006 2007
(Thousands of U.S. dollars)
(Note 2)
Financing activities:
Increase in short-term bank loans, net
Proceeds from long-term debt
Repayment of long-term debt
Cash dividends paid
Purchases of treasury stock
Other, net
Net cash provided by (used in) financing activities
Effect of exchange rate changes on cash and
cash equivalents
Decrease in cash and cash equivalents
Cash and cash equivalents at beginning of year
Increase in cash and cash equivalents resulting
from inclusion of subsidiaries in consolidation
Cash and cash equivalents at end of year
See accompanying notes to consolidated financial statements.
4,448
7,609
(8,815)
(2,945)
(2,844)
(15)
(2,562)
866
(4,891)
24,160
587
´ 19,856
55,451
90,640
(45,489)
(26,192)
(40,127)
(86)
34,197
1,017
(24,269)
168,200
–
$ 143,931
.........................
..................................
...................................
..............................................
......................................
..........................................................
..........
................................................
........................
..............
............
.....................
6,546
10,700
(5,370)
(3,092)
(4,737)
(10)
4,037
120
(2,865)
19,856
–
¥ 16,991
25

Notes to Consolidated Financial StatementsNippon Shokubai Co., Ltd. and Consolidated Subsidiaries March 31, 2007
1. Summary of Significant Accounting Policies(a) Basis of presentationNippon Shokubai Co., Ltd. (the ÒCompanyÓ) and its domestic
consolidated subsidiaries maintain their accounts and records in
accordance with accounting principles generally accepted in Japan.
Its overseas subsidiaries maintain their accounts in conformity with
the requirements of their respective countries of domicile.
The accompanying consolidated financial statements of the
Company and consolidated subsidiaries are prepared on the basis of
accounting principles generally accepted in Japan, which are
different in certain respects as to the application and disclosure
requirements of International Financial Reporting Standards, and are
compiled from the consolidated financial statements prepared by the
Company as required by the Securities and Exchange Law of Japan.
In preparing the accompanying consolidated financial statements,
certain reclassifications and rearrangements have been made to the
consolidated financial statements issued domestically in order to
present them in a format which is more familiar to readers outside
Japan.
Effective the year ended March 31, 2007, the Company has adopted
a new accounting standard for the presentation of net assets in the
balance sheet and the related implementation guidance. In addition,
effective the year ended March 31, 2007, the Company is required to
prepare consolidated statements of changes in net assets instead of
consolidated statements of shareholdersÕ equity. In this connection,
the previously reported consolidated balance sheet as of March 31,
2006 and consolidated statement of shareholdersÕ equity for the year
then ended have been restated to conform to the presentation and
disclosure of the consolidated financial statements for the year ended
March 31, 2007.
Certain reclassifications of previously reported amounts have been
made to conform the consolidated financial statements for the year
ended March 31, 2006 to the 2007 presentation. Such
reclassifications had no effect on consolidated net income or net
assets.
(b) Basis of consolidationThe accompanying consolidated financial statements include the
accounts of the Company and its significant subsidiaries. All
significant intercompany items have been eliminated in
consolidation.
The overseas consolidated subsidiaries are consolidated on the basis
of fiscal periods ending December 31, which differs from the
balance sheet date of the Company. As a result, adjustments have
been made for any significant intercompany transactions which took
place during the period between the year ends of these overseas
consolidated subsidiaries and the year end of the Company.
Investments in significant affiliates are accounted for by the equity
method.
Investments in an unconsolidated subsidiary and an affiliate not
accounted for by the equity method are carried at cost.
Goodwill and negative goodwill arising from the difference of cost
and underlying net assets at the date of acquisition are amortized
over a period of five years on a straight-line basis, except that
immaterial amounts are charged to income as incurred.
(c) Foreign currency translationThe financial statements of the overseas consolidated subsidiaries
are translated into yen at the rates of exchange in effect at the
balance sheet date except that the components of net assets
excluding minority interests (shareholdersÕ equity 2006) which are
translated at their historical exchange rates. Differences resulting
from translating the financial statements of the overseas consolidated
subsidiaries are not included in the determination of net income but
are reported as translation adjustments and minority interests in
separate components of net assets in the consolidated balance sheets
at March 31, 2007 and 2006.
Revenue and expense items arising from transactions denominated in
foreign currencies are generally translated into yen at the rates in
effect at the respective transaction dates.
All monetary assets and liabilities denominated in foreign currencies
are translated into yen at the rates of exchange in effect at the
balance sheet date and the gain or loss on each translation is credited
or charged to income.
(d) Cash and cash equivalentsCash and cash equivalents include cash on hand and in banks and
other highly liquid investments with maturities of three months or
less when purchased.
(e) InventoriesInventories of the Company and its consolidated subsidiaries are
stated principally at the lower of cost or market, cost being
determined by the moving average method.
(f) Property, plant and equipmentProperty, plant and equipment are stated on the basis of cost.
Depreciation is computed principally by the declining-balance
method over the estimated useful lives of the respective assets,
except that the overseas consolidated subsidiaries compute
depreciation by the straight-line method over the estimated useful
lives of the respective assets.
(g) LeasesNon-cancelable leases of the Company and its domestic consolidated
subsidiaries are accounted for as operating leases (whether such
leases are classified as operating or finance leases), except that leases
which stipulate the transfer of ownership of the leased assets to the
lessee are accounted for as finance leases. However, leases of the
overseas consolidated subsidiaries are generally classified and
accounted for as either finance or operating leases.
26

(h) Investments in securitiesSecurities are classified into three categories: trading securities, held-
to-maturity debt securities and other securities. Trading securities,
consisting of debt and marketable equity securities, are carried at fair
value. Gain and loss, both realized and unrealized, are charged to
income. Held-to-maturity debt securities are carried at amortized
cost. Marketable securities classified as other securities are carried
at fair value, with any changes in unrealized holding gain or loss, net
of the applicable income taxes, reported as a separate component of
net assets. Non-marketable securities classified as other securities
are carried at cost. Cost of securities sold is determined by the
moving average method.
(i) Research and development costs and computer softwareResearch and development costs are charged to income when
incurred.
Expenditures relating to the development of computer software
intended for internal use are charged to income as incurred, except if
these are deemed to contribute to the generation of future income or
cost savings. Such expenditures are capitalized as assets and
amortized by the straight-line method over their respective useful
lives, generally a period of 5 years.
(j) Income taxesIncome taxes are calculated based on taxable income and charged to
income on an accrual basis. Deferred income tax assets and
liabilities are computed based on the temporary differences between
financial reporting and the tax bases of the assets and liabilities
which will result in taxable or deductible amounts in the future. The
calculation of deferred income tax assets and liabilities is based on
the enacted tax laws.
(k) Accrued bonuses to employeesAccrued bonuses to employees are provided based on estimated
bonuses to be paid to employees which are charged to income in the
current year.
(l) Accrued bonuses to directors and corporate auditorsAccrued bonuses to directors and corporate auditors are provided at
an estimate of the amount to be paid in the following year which has
been allocated to the current fiscal year.
(m) Reserve for periodic repairsThe Company provides a reserve for the costs of periodic repairs of
production facilities at plants.
(n) Retirement benefitsThe CompanyÕs employees are covered by an employeesÕ retirement
benefit plan and an employeesÕ pension plan. The employeesÕ
retirement benefit plan provides for lump-sum payments determined
by reference to their basic salary, years of service and certain other
factors. The domestic consolidated subsidiaries have either
unfunded employeesÕ retirement benefit plans and/or pension plans
which are noncontributory and funded and which cover substantially
all their employees. These plans provide for lump-sum payments
and/or annuity payments payable upon termination of employment.
Accrued retirement benefits for employees have been provided, in
general, based on the retirement benefit obligation and the fair value
of the pension plan assets as adjusted for unrecognized actuarial gain
or loss and unrecognized prior service cost.
Prior service cost is amortized principally by the straight-line method
over 5 years, which is within the estimated average remaining years
of service of the eligible employees.
Actuarial gain or loss is amortized in the year following the year in
which the gain or loss is recognized principally by the straight-line
method over 10 years, which is within the estimated average
remaining years of service of the eligible employees.
(o) Appropriation of retained earningsUnder the new Corporation Law of Japan, the appropriation of
retained earnings with respect to a given financial period is made by
resolution of the shareholders at a general meeting held subsequent
to the close of the financial period. The accounts for that period do
not, therefore, reflect such appropriations (see Note 19).
2. U.S. Dollar AmountsThe translation of yen amounts into U.S. dollar amounts is included
solely for convenience, as a matter of arithmetic computation only, at
´118.05 = U.S.$1.00, the approximate rate of exchange in effect on
March 31, 2007. This translation should not be construed as a
representation that yen have been, could have been, or could in the
future be, converted into U.S. dollars at the above or any other rate.
3. Accounting ChangeEffective the year ended March 31, 2007, the Company and its
domestic consolidated subsidiaries have adopted ÒAccounting
Standard for Presentation of Net Assets in the Balance SheetÓ
(Accounting Standards Board of Japan (ASBJ) Statement No. 5
issued on December 9, 2005) and ÒGuidance on Accounting
Standard for Presentation of Net Assets in the Balance SheetÓ (ASBJ
Guidance No. 8 issued on December 9, 2005).
4. Notes Receivable and Notes PayableThe balance sheet date of the year ended March 31, 2007 fell on a
bank holiday. Consequently notes receivable, trade of ´570 million
($4,828 thousand) and notes payable, trade of ´372 million ($3,151
thousand) with a maturity date of March 31, 2007 were included in
the respective balances and were settled on the next business day.
27

Cost
Book value (Fair market
value)Unrealized gain (loss) Cost
Book value (Fair market
value)Unrealized gain (loss)
Securities whose fair market value
exceeds their cost:
Equity securities
Subtotal
Securities whose cost exceeds
their fair market value:
Equity securities
Subtotal
Total
...............
................................
...............
................................
....................................
¥ 14,15814,158
693693
¥ 14,851
¥ 29,42229,422
588588
¥ 30,010
¥ 15,26415,264
(105)(105)
¥ 15,159
$119,932119,932
5,8705,870
$125,802
$ 249,233249,233
4,9814,981
$ 254,214
$129,301129,301
(889)(889)
$128,412
(Millions of yen)
2007
(Thousands of U.S. dollars)
5. Investments in SecuritiesMarketable securities classified as other securities at March 31, 2007 and 2006 are summarized as follows:
The proceeds and gross realized gain and loss on sales of securities classified as other securities for the years
ended March 31, 2007 and 2006 were as follows:
Cost
Book value(Fair market
value)Unrealized gain (loss)
Securities whose fair market value
exceeds their cost:
Equity securities
Subtotal
Securities whose cost exceeds
their fair market value:
Equity securities
Subtotal
Total
...............
................................
...............
................................
....................................
´ 13,164
13,164
593
593
´ 13,757
´ 33,882
33,882
585
585
´ 34,467
´ 20,718
20,718
(8)
(8)
´ 20,710
(Millions of yen)
2006
Proceeds
Gross realized
gain
Gross realized
loss Proceeds
Gross realized
gain
Gross realized
loss
¥ 121 ¥ 83 ¥ – ´ 176 ´ 56 ´ Ð $ 1,025 $ 703 $ –
(Millions of yen)
20072007 2006
(Thousands of U.S. dollars)
Proceeds
Gross realized
gain
Gross realized
loss
Notes to Consolidated Financial Statements (continued)
28

¥ 2001,246
´ Ð
1,143
$ 1,69410,555
Held-to-maturity �
bonds
Other securities
.................
........
A breakdown of other securities whose market
value was not determinable at March 31, 2007 and
2006 were as follows:
6. InventoriesInventories at March 31, 2007 and 2006 were as
follows:
(Thousands of U.S. dollars)(Millions of yen)
2007 20072006
¥ 22,15211,9598,6493,181
¥ 45,941
´ 19,505
9,255
7,657
2,288
´ 38,705
$ 187,649101,30573,26626,946
$ 389,166
Merchandise and �
finished goods
Raw materials
Work in process
Supplies
.......
..........
........
.................
(Thousands of U.S. dollars)(Millions of yen)
2007 20072006
7. Short-Term Bank Loans and Long-Term DebtShort-term bank loans consisted mainly of
unsecured loans. The average interest rates on
short-term bank loans outstanding at March 31,
2007 and 2006 were 1.95% and 2.65%, respectively.
Long-term debt at March 31, 2007 and 2006
consisted of the following:
0.81% unsecured bonds
due October 2009
Unsecured loans from
banks and insurance
companies, payable in
yen, at rates from 0.49%
to 5.60%, due through
2013
Unsecured loans from
banks, payable in U.S.
dollars, at rates from
1.03% to 5.83%, due
through 2011
Unsecured loans from
banks, payable in Euro,
at rates from 2.55% to
3.17%, due through
2009
Secured loans from banks
and insurance
companies, payable in
yen, at rates from 1.14%
to 4.84%, due through
2010
Subtotal
Less current portion
Total
¥ 5,000
24,930
4,455
4,225
94539,555(5,887)
¥ 33,668
´ 5,000
17,459
5,663
3,775
1,783
33,680
(5,317)
´ 28,363
$ 42,355
211,182
37,738
35,790
8,005335,070(49,869)
$285,021
......
....................
...........
....................
................................
..........................
.....................
.....................
.....................
.........................
(Thousands of U.S. dollars)(Millions of yen)
2007 20072006
The aggregate annual maturities of long-term debt
subsequent to March 31, 2007 are summarized below:
2008
2009
2010
2011
2012 and thereafter
¥ 5,8876,370
16,7181,9198,661
¥ 39,555
$ 49,86953,960
141,61816,25673,367
$ 335,070
(Thousands of U.S. dollars)(Millions of yen)Year ending March 31,
29

8. Retirement BenefitsThe following table sets forth the funded and
accrued status of the pension plans and the amounts
recognized in the consolidated balance sheets at
March 31, 2007 and 2006 for the CompanyÕs and the
consolidated subsidiariesÕ defined benefit plans:
9. Income Taxes Income taxes applicable to the Company and its
domestic consolidated subsidiaries consist of
corporation, inhabitantsÕ and enterprise taxes. The
statutory tax rate in Japan for the years ended March
31, 2007 and 2006 was, in the aggregate,
approximately 40.6%. The effective tax rates
reflected in the consolidated statements of income
for the years ended March 31, 2007 and 2006
differed from the above statutory tax rate for the
following reasons:
The components of retirement benefit expenses for the
years ended March 31, 2007 and 2006 are outlined as follows:
..............................
..
..
..
..
............
..........
..............
.....................
..................
Assets pledged as collateral for short-term bank
loans, long-term debt, including the current portion
thereof, and notes and accounts payable at March
31, 2007 and 2006 were as follows:
The assumptions used in accounting for the
defined benefit plans for the years ended March 31,
2007 and 2006 were as follows:
Time deposits
Land
Buildings and structures
Machinery and equipment
Investments in securities
¥ 8293183345
6¥ 835
´ 8
293
197
250
1,179
´ 1,927
$ 682,4821,5502,922
51 $ 7,073
(Thousands ofU.S. dollars)(Millions of yen)
2007 20072006
..................
.............
..............
................................................
.................
Statutory tax rate
Effect of:
Valuation allowance
Tax credit for research and�
development costs
Equity in earnings of an
unconsolidated subsidiary
and affiliates
Other, net
Effective tax rates
40.6 %
3.9
(3.9)
(2.5)(1.6)
36.5 %
2007
..........
.........
Discount rate
Expected rate of return
on plan assets
Principally 1.9%
Principally 3.0%
Principally 1.9%
�
Principally 3.0%
2007 2006
Retirement benefit
obligation at end of year
Fair value of plan assets
at end of year
Unfunded retirement
benefit obligation
Unrecognized actuarial loss
Unrecognized past
service cost
Net retirement benefit
obligation
Prepaid pension cost
Accrued retirement
benefits
¥ (30,108)
26,159
(3,949)726
(571)
(3,794)2,997
¥ (6,791)
�
´ (29,937)
25,406
(4,531)
1,269
(762)
(4,024)
2,730
�
´ (6,754)
$ (255,044)
221,592
(33,452)6,150
(4,837)
(32,139)25,387
$ (57,526)
(Thousands ofU.S. dollars)(Millions of yen) 40.6 %
4.0
�
(3.9)
�
(1.5)
(2.0)
37.2 %
20062007 20072006
..............
................�
.......�..........�
..
Service cost
Interest cost
Expected return on plan assets
Amortization:
Past service cost
Actuarial loss
Retirement benefit expenses
¥ 1,080539
(560)
(180)487
¥ 1,366
´ 1,007
537
(458)
(322)
936
´ 1,700
$ 9,1494,566
(4,744)
(1,525)4,125
$ 11,571
(Thousands ofU.S. dollars)(Millions of yen)
2007 20072006
Notes to Consolidated Financial Statements (continued)
30

10. Negative goodwillNegative goodwill included in long-term
liabilities-other, at March 31, 2007 was computed as
follows:
Deferred income taxes reflect the net tax effect
of the temporary differences between the carrying
amounts of the assets and liabilities calculated for
financial reporting purposes and the corresponding
tax bases reported for income tax purposes. The
significant components of the deferred tax assets and
liabilities of the Company and its consolidated
subsidiaries at March 31, 2007 and 2006 are
summarized as follows: .............................................
..................................
Goodwill
Negative goodwill
Total
¥ 540(549)
¥ (9)
$ 4,574(4,651)
$ (77)
(Thousands ofU.S. dollars)
(Millionsof yen)
Deferred tax assets:
Accrued retirement benefits
Intercompany profit on
inventories and property,
plant and equipment
Tax loss carryforwards
Reserve for repairs
Depreciation and
amortization
Impairment loss on
fixed assets
Accrued employeesÕ bonuses
Impairment of
investments in
securities and other
Accrued enterprise tax
Other
Gross deferred tax assets
Less: Valuation allowance
Total deferred tax assets
Deferred tax liabilities:
Equity in earnings of
an overseasÕ affiliate
Net unrealized holding
gain on securities
Depreciation and
amortization
Deferred capital gain
on property
Reserve for depreciation
for tax purposes
Other
Total deferred tax
liabilities
Net deferred tax assets
(liabilities)
¥ 1,641
1,1661,5121,104
816
1,461769
1,870351
1,06711,757(3,025)8,732
1,297
4,426
848
393
165177
7,306
¥ 1,426
´ 1,989
1,215
1,152
1,081
693
1,507
819
1,866
481
1,477
12,280
(2,211)
10,069
1,152
8,407
852
340
293
161
11,205
´(1,136)
$ 13,901
9,87712,8089,352
6,912
12,3766,514
15,8412,9739,039
99,593(25,624)73,969
10,987
37,493
7,183
3,329
1,3981,500
61,890
$ 12,079
(Thousands ofU.S. dollars)(Millions of yen)
2007 20072006
2007
..
........
.....
............
...............
�.....
...........................
..
.......�
............�
.............
...............................
�................
�..............
11. Shareholders’ EquityThe new Corporation Law of Japan (the ÒLawÓ),
which superseded most of the provisions of the
Commercial Code of Japan (the ÒCodeÓ), went into
effect on May 1, 2006. The Law provides that an
amount equal to 10% of the amount to be disbursed
as distributions of capital surplus (other than the
capital reserve) and retained earnings (other than the
legal reserve) be transferred to the capital reserve
and the legal reserve, respectively, until the sum of
the capital reserve and the legal reserve equals 25%
of the capital stock account. Such distributions can
be made at any time by resolution of the
shareholders, or by the Board of Directors if certain
conditions are met.
Retained earnings include the legal reserve
provided in accordance with the provisions of the
Law. The legal reserve of the Company included in
retained earnings amounted to ´3,920 million
($33,206 thousand) at March 31, 2007 and 2006.
Common stock and treasury stockMovements in issued common stock and treasury
stock during the year ended March 31, 2007 are
summarized as follows:
(Thousands)
March31, 2006 Increase Decrease March
31, 2007
Common �
stock
Treasury �
stock
.....
.....
194,811
6,732
–
3,563
–
4
194,881
10,291
Number of shares
31

12. Research and Development CostsResearch and development costs included in cost of sales
and selling, general and administrative expenses for the years
ended March 31, 2007 and 2006 totaled ´11,123 million
($94,223 thousand) and ´10,120 million, respectively.
14. Contingent LiabilitiesAt March 31, 2007, the Company and one
consolidated subsidiary were contingently liable as
guarantors of indebtedness of affiliates in the
aggregate amount of ´2,673 million ($22,643
thousand).
In addition, at March 31, 2007, two consolidated
subsidiaries had contingent liabilities arising from
notes discounted with banks and notes endorsed in
the aggregate amount of ´933 million ($7,903
thousand).
13. LeasesThe following pro forma amounts represent the acquisition
costs (including the interest portion), accumulated
depreciation/amortization and net book value of the leased assets
at March 31, 2007 and 2006, which would have been reflected in
the balance sheets if finance lease accounting had been applied to
the finance leases currently accounted for as operating leases:
Lease payments relating to finance leases accounted
for as operating leases amounted to ´77 million ($652
thousand) and ´110 million for the years ended March 31,
2007 and 2006, respectively. Depreciation/amortization
of the leased assets calculated by the straight-line method
over the respective lease terms amounted to ´77 million
($652 thousand) and ´110 million for the years ended
March 31, 2007 and 2006, respectively.
Future minimum lease payments (including the
interest portion thereon) subsequent to March 31, 2007
for finance leases accounted for as operating leases are
summarized as follows:
¥ 357
(238)¥ 119
´ 536
(388)
´ 148
$ 3,024
(2,016) $ 1,008
Machinery and equipment and software:
Acquisition costs
Accumulated �
depreciation/amortization
Net book value
.....�
..........
................................................
(Thousands of U.S. dollars)
(Millions of yen)
2007 20072006
¥ 4871
¥ 119
$ 407601
$1,008
2008
2009 and thereafter
Year ending March 31,(Thousands of
U.S. dollars)(Millions
of yen)
Notes to Consolidated Financial Statements (continued)
32

15. Amounts per Share 16. DerivativesDerivative financial instruments are utilized by
the Company and its consolidated subsidiaries
principally to reduce the risk arising from fluctuation
in interest rates and foreign exchange rates. The
Company has established a control environment
which includes policies and procedures for risk
assessment and for the approval, reporting and
monitoring of transactions involving derivatives.
The Company and its consolidated subsidiaries do
not hold or issue derivatives for speculative trading
purposes.
The Company and its consolidated subsidiaries
are exposed to certain market risk arising from
forward foreign exchange contracts and interest-rate
swaps. The Company and its consolidated
subsidiaries are also exposed to the risk of credit loss
in the event of nonperformance by the counterparties
to these forward foreign exchange contracts and
interest-rate swap contracts; however, the Company
and its consolidated subsidiaries do not anticipate
nonperformance by any of the counterparties, all of
whom are financial institutions with high credit
ratings.
Net income per share has been computed based
on the net income available to shareholders of
common stock and the weighted-average number of
shares of common stock outstanding during the year.
Diluted net income per share has not been presented
for the years ended March 31, 2007 and 2006 since
neither the Company nor any of the consolidated
subsidiaries had any potentially dilutive shares at
March 31, 2007 and 2006.
The amounts per share of net assets have been
computed based on the net assets available for
distribution to shareholders of common stock and
the number of shares of common stock outstanding
at the year end.
Cash dividends per share represent the cash
dividends declared as applicable to the respective
years together with the interim cash dividends paid.
The financial data used in the computation of net
income per share for the years ended March 31,
2007 and 2006 is summarized as follows:
¥ 74.9216.00
948.34
´ 85.89
16.00
875.00
$0.630.148.03
Net income
Cash dividends
Net assets
......................
...............
(U.S. dollars)(Yen)
2007 20072006
¥ 13,988
–
¥ 13,988
186,703
´ 16,257
Ð
´ 16,257
189,287
$118,492
–
$118,492
186,703
Net income
Deductions from �
net income
Adjusted net income �
available to shareholders �
of common stock�
Weighted-average number �
of shares of common �
stock outstanding during �
the year�
(Thousands of shares)
.............
...........
........
�..
(Thousands of U.S. dollars)
(Millions of yen)
2007 20072006
33

(Millions of yen)
Basicchemicals
Functionalchemicals
Environmentand
catalysts Total
Year ended March 31, 2006
Elimina-tions or
corporateConsoli-
dated
I. Sales and operating incomeSales to third parties
Intergroup sales and transfers
Total sales
Operating expenses
Operating income
II. Total assets, depreciation and amortization, and capital expenditures
Total assets
Depreciation and amortization
Capital expenditures
..............
....
..........................
................
..................
.........................
..
..............
´ 94,095
17,063
111,158
100,000
´ 11,158
�
´ 94,753
3,448
11,923
´ 116,300
460
116,760
107,498
´ 9,262
´ 133,032
6,693
13,617
´ 22,046
1,302
23,348
20,226
´ 3,122
´ 23,309
504
394
´ 232,441
18,825
251,266
227,724
´ 23,542
´ 251,094
10,645
25,934
´ Ð
(18,825)
(18,825)
(18,511)
´ (314)
´ 40,470
Ð
Ð
´ 232,441
Ð
232,441
209,213
´ 23,228
´ 291,564
10,645
25,934
(Thousands of U.S. dollars)
Basicchemicals
Functionalchemicals
Environmentand
catalysts Total
Year ended March 31, 2007
Elimina-tions or
corporateConsoli-
dated
I. Sales and operating incomeSales to third parties
Intergroup sales and transfers
Total sales
Operating expenses
Operating income
II. Total assets, depreciation and amortization, and capital expenditures
Total assets
Depreciation and amortization
Capital expenditures
..............
....
...........................
................
..................
.........................
..
..............
$ 827,319183,583
1,010,902965,167
$ 45,735
$ 883,202
44,93078,856
$1,197,1287,235
1,204,3631,112,554
$ 91,809
$1,326,768
69,149128,064
$ 233,18115,247
248,428223,168
$ 25,260
$ 238,543
3,5663,144
$2,257,628206,065
2,463,6932,300,889
$ 162,804
$2,448,513117,645210,064
$ –(206,065)(206,065)(207,843)
$ 1,778
$ 293,334
––
$2,257,628–
2,257,6282,093,046
$ 164,582
$2,741,847
117,645210,064
Notes to Consolidated Financial Statements (continued)
17. Segment InformationThe Company and its consolidated subsidiaries are primarily engaged in the manufacture and sale of products
in Japan and overseas.
Business SegmentsThe business segment information of the Company and its consolidated subsidiaries for the years ended
March 31, 2007 and 2006 is outlined as follows:
(Millions of yen)
Basicchemicals
Functionalchemicals
Environmentand
catalysts Total
Elimina-tions or
corporateConsoli-
dated
I. Sales and operating incomeSales to third parties
Intergroup sales and transfers
Total sales
Operating expenses
Operating income
II. Total assets, depreciation and amortization, and capital expenditures
Total assets
Depreciation and amortization
Capital expenditures
..............
...
..........................
...............
.................
.........................
..
..............
¥ 97,66521,672
119,337113,938
¥ 5,399
¥ 104,2625,3049,309
¥ 141,321854
142,175131,337
¥ 10,838
¥ 156,6258,163
15,118
¥ 27,5271,800
29,32726,345
¥ 2,982
¥ 28,160421371
¥ 266,51324,326
290,839271,620
¥ 19,219
¥ 289,04713,88824,798
¥ –(24,326)(24,326)(24,536)
¥ 210
¥ 34,628––
¥ 266,513–
266,513247,084
¥ 19,429
¥ 323,67513,88824,798
Year ended March 31, 2007
34

Geographical SegmentsThe geographical segment information of the Company and its consolidated subsidiaries for the years ended
March 31, 2007 and 2006 is outlined as follows:
(Millions of yen)
EuropeJapan Asia Other Total
Elimina-tions or
corporateConsoli-
dated
I. Sales and operating incomeSales to third parties
Intergroup sales and �
transfers
Total sales
Operating expenses
Operating income �
(loss)
II. Total assets
..
...............
..............
...
�
...................
...........
¥ 32,521
7132,59232,522
¥ 70¥ 20,547
¥ 186,288
21,979208,267190,966
¥ 17,301¥ 222,114
¥ 30,194
1,21931,41330,549
¥ 864 ¥ 38,112
¥ 17,510
49218,00218,288
¥ (286) ¥ 13,760
¥ 266,513
23,761290,274272,325
¥ 17,949¥ 294,533
¥ –
(23,761)(23,761)(25,241)
¥ 1,480¥ 29,142
¥ 266,513
–266,513247,084
¥ 19,429¥ 323,675
Year ended March 31, 2007
(Millions of yen)
EuropeJapan Asia Other Total
Year ended March 31, 2006
Elimina-tions or
corporateConsoli-
dated
I. Sales and operating incomeSales to third parties
Intergroup sales and �
transfers
Total sales
Operating expenses
Operating income �
(loss)
II. Total assets
..
...............
..............
...
�
...................
...........
´ 23,935
61
23,996
23,789
´ 207
´ 18,995
´ 168,773
19,061
187,834
167,484
´ 20,350
´ 192,113
´ 27,405
934
28,339
24,676
´ 3,663
´ 31,818
´ 12,328
81
12,409
13,727
´ (1,318)
´ 14,919
´ 232,441
20,137
252,578
229,676
´ 22,902
´ 257,845
´ Ð
(20,137)
(20,137)
(20,463)
´ 326
´ 33,719
´ 232,441
Ð
232,441
209,213
´ 23,228
´ 291,564
(Thousands of U.S.dollars)
EuropeJapan Asia Other Total
Elimina-tions or
corporateConsoli-
dated
I. Sales and operating incomeSales to third parties
Intergroup sales and �
transfers
Total sales
Operating expenses
Operating income �
(loss)
II. Total assets
..
...............
..............
...
�
...................
...........
$ 275,485
601276,086275,493
$ 593 $ 174,053
$ 1,578,043
186,1841,764,2271,617,670
$ 146,557 $ 1,881,525
$ 255,773
10,326266,099258,780
$ 7,319 $ 322,846
$ 148,327
4,168152,495154,918
$ (2,423)
$ 116,561
$ –
(201,279)(201,279)(213,815)
$ 12,536 $ 246,862
$ 2,257,628
201,2792,458,9072,306,861
$ 152,046 $ 2,494,985
$ 2,257,628
–2,257,6282,093,046
$ 164,582 $ 2,741,847
Year ended March 31, 2007
35

Overseas SalesOverseas sales, which include export sales of the Company and its domestic consolidated subsidiaries and
sales (other than exports to Japan) of the overseas consolidated subsidiaries, for the years ended March 31, 2007
and 2006 are summarized as follows:
(Millions of yen)
Asia Europe America Other Total
Overseas sales
Overseas sales as a percentage of �
consolidated net sales
............................................
................................
¥ 51,847
19.5%
¥ 41,654
15.6%
¥ 23,184
8.7%
¥ 9,628
3.6%
¥ 126,313
47.4%
Year ended March 31, 2007
(Millions of yen)
Asia Europe America Other Total
Overseas sales
Overseas sales as a percentage of �
consolidated net sales
...........................................
................................
´ 48,385
20.8%
´ 32,788
14.1%
´ 18,623
8.0%
´ 6,958
3.0%
´ 106,754
45.9%
Year ended March 31, 2006
(Thousands of U.S. dollars)
Asia Europe America Other Total
Overseas sales ........................................... $ 439,195 $ 352,850 $ 196,391 $ 81,560 $1,069,996
Year ended March 31, 2007
Notes to Consolidated Financial Statements (continued)
36

18. Related Party TransactionsPrincipal transactions between the Company and its related companies for the years ended March 31, 2007
and 2006 are summarized as follows:
The balances due from and due to its related companies at March 31, 2007 and 2006 were as follows:
The transaction price was determined based of fair market value.
19. Subsequent EventThe following appropriation of retained earnings of the Company, which has not been reflected in the
accompanying consolidated financial statements for the year ended March 31, 2007, was approved at a
shareholdersÕ meeting held on June 20, 2007:
Cash dividends (´8.00 = $0.07 per share) ......................................................... ¥ 1,477 $ 12,512
(Millions of yen)
(Thousands of U.S. dollars)
(Millions of yen)
2007 2006 2007
(Thousands of U.S. dollars)
´ 13
Ð
12,753
11,018
$ 152
618
159,365
157,230
.................................
�
.....................
....................
...................................
¥ 18
73
18,813
18,561
Yatagai Real Estate Co., Ltd.:
Rental expense of buildings
Nippon Petrochemicals Co., Ltd.:
Rental expense of land and equipment
ICT Co., Ltd.:
Sales of the CompanyÕs finished goods
Purchases of raw materials
(Millions of yen)
2007 2006 2007
(Thousands of U.S. dollars)
´ 4,884
´ 2,825
Ð
$ 72,681
$ 44,854
229
...................................................
�
...................................................
...........................
¥ 8,580
¥ 5,295
27
Due from
ICT Co., Ltd.
Due to
ICT Co., Ltd.
Nippon Petrochemicals Co., Ltd.
37

NIPPON SHOKUBAI CO., LTD.
Incorporated
Common Stock
Capital
Number of Employees
Stock Listings
Transfer Agent
Mitsubishi UFJ Trust & Banking Corporation
4-5, Marunouchi, 1-chome, Chiyoda-ku
Tokyo , 100-8212, Japan
August 21, 1941
Authorized: 424,000,000
Issued: 194,881,287
´16,529,413,238
Consolidated: 2,841
Non-consolitated: 1,742
First Section, Tokyo Stock Exchange
First Section, Osaka Stock Exchange
Osaka Office
Himeji Plant
Chugoku Kako Co., Ltd.
Ehime Plant
Nippon Polyester Co., Ltd.
Korea Office
Shanghai Office
Nippon Shokubai Europe N.V.
NA Industries, Inc.
Nisshoku Butsuryu Co., Ltd.
Suita Plant
Advanced Materials Research Center
Strategic Technology Research Center
E&I Materials Research Center
Performance Chemicals Research Center
NISSHOKU CHEMICAL INDUSTRY(ZHANGJIAGANG) CO., LTD.
PT. NIPPON SHOKUBAI INDONESIA
NIPPON SHOKUBAI (ASIA) PTE LTD
Singapore Acrylic Pte Ltd.
Singapore Glacial Acrylic Pte Ltd.
Strategic Technology Research Center
E&I Materials Research Center
Tokyo Office
Nihon Jyoryu Kogyo Co., Ltd.
Kawasaki Plant
Nippoh Chemicals Co., Ltd.
Tokyo Fine Chemical Co., Ltd.
Shinritsu Co., Ltd.Superabsorbents Research Center
Catalysts Research Center
Process Technology Research Center
Corporate Data (as of March 31, 2007)
38

Board of Directors
Division / DepartmentOrganization
Internal Audit Office
Corporate Planning
Informational Technology Management Office
Administration
Finance &Accounting
Responsible Care
Production
Research & Development
Ethylene Oxide Business
Acrylic Business
Fine & Specialty Chemicals Business
Performance Chemicals Business
Environment & Catalysts Business
Shanghai Office
Kawasaki Plant
Himeji Plant
Suita Plant
Board of Corporate Auditors
Corporate Auditors
AuditorsÕ Office
President
Corporate Management
Committee
E&I Materials Business *
* E&I : Electronic & Information
39

Chugoku Kako Co., Ltd. *
Nihon Jyoryu Kogyo Co., Ltd. *
Shinritsu Co., Ltd. *
Nippon Polyester Co., Ltd. *
Nihon Polymer Industries Co., Ltd.
Japan Composite Co., Ltd.
LGMMA Corp.
* Included in consolidation ** American Acryl NA LLC and American Acryl L.P. are consolidated into NA industries, Inc. by the equity method. (as of June 30 2007)
International Catalyst Technology, Inc.
ICT Co., Ltd.
NA Industries, Inc. **
Nisshoku Butsuryu Co., Ltd. *
Nippon Shokubai Europe N.V. *
NISSHOKU CHEMICAL INDUSTRY (ZHANGJIAGANG) CO., LTD. *
PT. NIPPON SHOKUBAI INDONESIA *
NIPPON SHOKUBAI (ASIA) PTE LTD *
Singapore Acrylic Pte Ltd. *
Singapore Glacial Acrylic Pte Ltd. *
Nippoh Chemicals Co., Ltd. *
Name Principle Business President
Tokyo Fine Chemical Co., Ltd. *
Tadashi Kawai
Yoshinori Yokoyama
Masayoshi Sugimoto
Hidetaka Yatagai
Tamotsu Okamura
William Staron
Han-seob KIM
Tetsuyuki Matsubara
Shigehiro Nishimura
Kenjiro Komoda
Masao Kitano
Yoshinao Hirano
Yojiro Takahashi
Kenji Ozeki
Kenji Ozeki
Keishi Tsuboi
Taizo Maruo
Shinichi NagaseManufacture and sale of iodine, natural gas, �intermediates for API and agro-chemicals and �photo/electro chemicals
Manufacture and sale of synthetic resins and �related additives
Manufacture and sale of stabilizer of vinyl chloride �resin and anti-freeze
Manufacture and sale of authraquinone, carbozole, �and their derivatives
Manufacture and sale of superabsorbent polymers, �polymers for concrete admixture, water soluble polymers, �Technical Liaison and business development
Logistics
Manufacture and sale of adhesive tape and �fine sphere particle
Sale of chemical products
Sale of chemical products
Manufacture and sale of superabsorbent polymers
Manufacture and sale of crude acrylic acid
Manufacture and sale of glacial acrylic acid
Manufacture and sale of superabsorbent polymers
Sale of automobile exhaust catalyst
Manufacture and sale of acrylic emulsions
Manufacture and sale of automobile exhaust catalyst
Manufacture and sale of MMA and PMMA
Manufacture and sale of unsaturated polyeters resin �and plastic molded materials
Manufacture and sale of acrylic acid and �acrylic esters
Tadayoshi Honda
Consolidated Subsidiaries and Affiliates
Corporate Data
40

HEAD OFFICES
Osaka OfficeKogin Bldg.
4-1-1 Koraibashi, Chuo-ku, Osaka
541-0043, Japan
Telephone: 81-6-6223-9111
Facsimile : 81-6-6201-3716
Tokyo OfficeHibiya Dai Bldg.
1-2-2 Uchisaiwai-cho, Chiyoda-ku,
Tokyo 100-0011, Japan
Telephone: 81-3-3506-7475
Facsimile : 81-3-3506-7598
LABORATORIES
Advanced Materials Research Center5-8, Nishi Otabi-cho, Suita, Osaka
564-8512, Japan
Strategic Technology Research Center5-8, Nishi Otabi-cho, Suita, Osaka
564-8512, Japan
E & I Materials Research Center5-8, Nishi Otabi-cho, Suita, Osaka
564-8512, Japan
Superabsorbents Research Center992-1 Aza-Nishioki Okihama,
Aboshi-ku, Himeji, Hyogo
671-1292, Japan
Performance Chemicals Research Center5-8, Nishi Otabi-cho, Suita, Osaka
564-8512, Japan
Catalysts Research Center992-1 Aza-Nishioki Okihama,
Aboshi-ku, Himeji, Hyogo
671-1292, Japan
OVERSEAS COMPANIES
NA Industries, Inc.2651 Riverport Road Chattanooga,
Tennessee 37406,
U.S.A. (P.O. Box 5407)
Telephone: 1-423-624-6496
Facsimile : 1-423-629-0531
PT. NIPPON SHOKUBAI INDONESIA Kawasan Industri Panca Puri
Jl.Raya Anyer Km.122,
Ciwandan Cilegon 42447
Banten, Indonesia
Telephone: 62-254-600-660
Facsimile : 62-254-600-657
NIPPON SHOKUBAI (ASIA) PTE LTD80 Robinson Road #18-02
Singapore 068898
Telephone: 65-6532-0078
Facsimile : 65-6532-0079
Singapore Acrylic Pte Ltd.17 Sakra Road #01-01 Singapore
627886
Singapore Glacial Acrylic Pte Ltd.17 Sakra Road #01-01 Singapore
627886
Nippon Shokubai Europe N.V.Haven 1053, Nieuwe Weg 1, B-2070
Zwijndrecht, Belgium
Telephone: 32-3-250-3705
Facsimile : 32-3-250-3712
NISSHOKU CHEMICAL INDUSTRY(ZHANGJIAGANG) CO., LTD.No.19 Changjiagang Road(E),
Yangtze River International Chemical
Industrial Park, Zhangjiagang, Jiangsu,
China, 215635
Telephone: 86-512-5893-7910
Facsimile : 86-512-5893-7912
PLANTS
Kawasaki Chidori Plant14-1 Chidori-cho, Kawasaki-ku
Kawasaki, Kanagawa
210-0865, Japan
Kawasaki Ukishima Plant10-12 Ukishima-cho, Kawasaki-ku
Kawasaki, Kanagawa
210-0862, Japan
Himeji Plant992-1 Aza-Nishioki Okihama,
Aboshi-ku, Himeji, Hyogo
671-1282, Japan
Ehime Plant5-1 Soubiraki-cho, Niihama, Ehime
792-8521, Japan
Suita Plant5-8 Nishi Otabi-cho, Suita, Osaka
564-0034, Japan
OVERSEAS OFFICE
Shanghai OfficeR/No.3604, The Center, 989 Changle Road
Shanghai, China, 200031
Telephone: 86-21-5407-5959
Facsimile : 86-21-5407-5673
Korea Office4F Turbotek Building, 16-6 Sunae-Dong,
Bungdang-Gu, Sungnam-Si, Gyeonggi-Do,
Korea 463-825
Telephone: 82-31-718-9111
Facsimile : 82-31-718-9693
Directory
41

NIPPON SHOKUBAI CO.,LTD.
Osaka OfficeKogin Bldg.4-1-1 Koraibashi, Chuo-ku,Osaka 541-0043,JapanTelephone:+81-6-6223-9111Facsimile: +81-6-6201-3716
Tokyo OfficeHibiya Dai Bldg.1-2-2 Uchisaiwai-cho, Chiyoda-ku,Tokyo 100-0011,JapanTelephone:+81-3-3506-7475Facsimile: +81-3-3506-7598
URL:http://www.shokubai.co.jp