annual report - s3.amazonaws.com · industrial enterprises and the promotion of small and medium...
TRANSCRIPT

Annual Report

3
CONTENT05 Message from the Chairman07 Vision, mission and values08 Economic Overview10 Investments15 Social Charter19 Risk Management20 Governance and Disclosure26 Financial Results / Statements36 Contact information00 Appendix

5
After the structural and procedural progress made in 2013, which earned the Fundo Soberano de Angola (hereafter referred to as FSDEA or Fundo) national and international recognition as a financial investment vehicle of the Angolan State, 2014 is characterized as the year of implementation of investment strategy decreed by the Angolan government. We are pleased to end the year with operations in key markets and a successful debut for the establishment of a diversified portfolio for the Fund. We also appointed the FSDEA Supervisory Board and established an internal team for economic research.
2014 was a year of important milestones. During this period, the Fund established an investment subfund aimed to support infrastructure projects with an initial capital of USD 1.1 billion. This fund aims to invest in the energy, transport and industrial sectors in the domestic market and throughout Sub-Saharan Africa. Its purpose is to provide income in the long-term for Angola and promote the sustained development of capital goods at a national and Pan-African level.
As previously disclosed, one of the primary objectives of FSDEA in 2014 was to make investments in the fields of commercial infrastructure, fast-growing industry and the hospitality industry. The hospitality sector attracts significant foreign direct investment and also has strong potential to generate employment in the short and long-term. Therefore, the establishement of a USD 500 million Hotel Fund to boost the hospitality sector in the continent was critical to support domestic and regional investment activities carried out by the Fund.
At the same time, the Fund also made investments in its Social Charter Initiatives, including the construction of the Academia de Gestão Hoteleira Angolana (Angola Hotel Management Academy)and the scholarship program “Future Leaders of Angola”, which allowed 46 young graduates in various fields to take part in a unique financial asset management programme provided by the University of Applied Sciences in Zurich.
Other social programs include the Bungo Initiative, which aims to enhance and formalize family farming and agribusiness in the city of Bungo through the promotion of civil registration, the introduction of diversified farming practices, the financial formation of micro-entrepreneurs, and the provision of support in accessing and managing micro-credit. This type of programme is a source of pride for the Fund because it provides new opportunities in rural communities and helps to drive the proliferation of small businesses, as well as boosting economic growth in areas marked by poverty and a lack of professional career opportunities.
In August 2014, the Fund was accredited as a full member of the International Forum of Sovereign Wealth Funds. This important milestone highlights the determination and performance of the entire FSDEA team in the pursuit of the highest standards of transparency and governance to the Angolan State.
MESSAGE FROM THE CHAIRMAN
4

7
VISION
MISSION
VALUESPromote the social and economic development of Angola by generating income for the State, which will benefit the Angolan citizens.
The investment focus is to generate sustainable financial returns that benefit Angola’s people, economy and industries. We manage a diverse portfolio of investments and are an active partner in these ventures.
FSDEA is guided by the following values in the development of its business and its strategic objectives:
TRANSPARENCYThe Fund is committed to the highest level of transparency across all areas of our business. The Board of Directors will continue to be dedicated to transparent and responsible management, in accordance with the best practices of the industry, as well as the Santiago Principles. In the future the Fund will endeavour to continue receiving a high rating by theLinaburg-Maduell Transparency Index, an internationally renowned third party index established to rate sovereign wealth funds and their commitment to transparency.
ACCOUNTABILITY The Fund is fully accountable for all of its actions and always acts in the best interest of the people of Angola and all other stakeholders. The Fund will endeavor to follow the Generally Accepted Principles and Practices (GAPP) as stated in the Santiago Principles in all its undertakings.
COMMITMENT The Fund is a responsible state entity and is committed to making an impact on all stakeholders, especially the Angolan people and their communities.
INTEGRITYThe Fund’s actions are founded on integrity and always respect the laws and regulations of Angola and the countries where it invests and operates.
6

8 9
1 ECONOMIC OVERVIEWANGOLA
AFRICAANGOLA
In 2014, the Angolan economy witnessed slower growth compared to the previous year, caused by a decline in the oil sector.
The earlier projections from the Government indicated a GDP growth rate of 4.7% in 2014, resulting from non-oil growth of approximately 8.2% and oil growth of 2.6%.
During the years preceding the fall in oil prices, the Angolan government invested in the infrastructure sector to support commercial activity that permeated the country during difficult periods and allowed for continuous attraction of foreign direct investment. The Angolan government has also initiated a reform of its financing model, granting part of the development of public infrastructure to the private sector through public-private partnerships (PPP).
Angola continues to offer major investment opportunities in infrastructure development that are critical for continued economic growth. For this reason, the Angolan government is embarking on its first major public-private venture with the company Port of Caio. This project, which is financed by FSDEA and is under construction in the province of Cabinda, is the first deep water port in the Sub-Saharan region and includes 775 meters of embankment for anchorage and 31 hectares for support services such as maintenance, container storage, industrial storage, logistics and various offices.
It was widely reported at the end of 2014 that the Angolan State would issue bonds in early 2015 with the issuance to the equivalent of USD 2 billion of
Treasury securities. With this credit, the national debt reached USD 47.4 billion, equivalent to 35.5% of GDP, which is considered a sustainable level of public debt according to international standards.
This type of measure encourages confidence in the markets and amongst global investors, which benefits the long-term investment in the national economy. A volume of sustainable public debt, together with strategic partnerships with the private sector, reflects the balanced approach of the Angolan government in job and wealth creation. These elements, embedded in an increasingly diversified economy, reflect Angola’s ability to achieve continuous growth during 2015 and subsequent years. Public expenditure has been adjusted to reflect oil price levels, providing a realistic picture of the country’s medium-term spending capabilities and the government’s commitment to maintaining a stable medium and long-term economic position.
At the end of 2014, the inflation rate reached 7.48%, despite the reduction in the fuel subsidy. However, the Kwanza depreciated 5.37% against the US dollar. This trend has continued in 2015 and is part of the new monetary policy from the National Bank of Angola.
In general the outlook for Africa remains positive, although various important issues have persisted during 2015. Certain nations face security risks that, despite having residual effects on individual economies, currently consume the attention of the markets and investors from abroad.
Several countries have benefited from capital flows from China over the past few years. However, there are currently signs of uncertainty about the sustainability of industrial production and GDP growth in China. For this reason, certain investment activities benefiting from high levels of Chinese investment in Africa may slow down, creating difficulties for the overall development of the continent. The next 12 months will be crucial for China’s domestic economy, whose performance is, to some extent, linked to that of Africa.
The drop in oil prices has hit the main producing nations of Africa, which have responded by adjusting their budgets and planning for a period of lower
revenue in the near future. Whilst the recent trend of crude oil prices has contributed to a reduction in the pace of economic activity for some of the main producers on the continent, nations with strong infrastructure and robust public finances are likely to continue to attract foreign direct investment.
Due to the economic crisis in the Eurozone, which creates uncertainty for investors, Africa remains an attractive investment destination as a result of the continent’s higher GDP growth and major investment opportunities. Countries such as Kenya and Angola have been successful in establishing stable economic bases, namely: stable inflation rates and interest rates and rising GDPs. Together with rising regional consumption levels, a growing middle class and rising levels of disposable income, the continent is in a strong position to continue to grow over the next period.
GLOBAL OVERVIEW
The international economic outlook remains uncertain. The continued difficulties within the Eurozone and the decline in industrial production in China generates uncertainties regarding future prospects in global markets. Nevertheless, reactions from investors and from the global equity markets remained stable during 2014 and thereafter. On a positive note, some of the world’s largest economies resumed growth in 2014. Employment rates
in the UK returned to levels prior to the recession and the United States has benefited from steady growth in job creation and GDP. Even within the European Union and the Eurozone, most nations have returned to modest growth and the outlook is positive overall, with the obvious exception of Greece.

10 11
2 INVESTMENTSPRINCÍPIOS E ABORDAGEM DE INVESTIMENTO
YEAR IN REVIEW
“... Oil resources should be allocated to the constitution of financial reserves of the State that can be used equally and equitably in the sustainable and harmonious development of the country, according to the public interest and for the benefit of present and future generations.” - Presidential Decree 48/11
(Presidential Decree)
In 2014, FSDEA focused on the priorities of its investment policy to diversify the portfolio of traditional assets regulated by international financial markets, investing in regional branches with enough capital needs, including infrastructure and real estate. Both hold potential to generate economic and social gains, domestically and across borders, because of their ability to support the development of industrial enterprises and the promotion of small and medium enterprises. These are essential for job creation and the diversification of public and private sector revenues.
As of 31 December 2014, the fixed income assets amounted to 56% of the investment portfolio, as shown on the following graphic illustration:
The investment strategy of FSDEA is based on the investment policy approved by the Presidential Decree No. 107/13. Thus, all FSDEA activities in 2014 were aimed at preserving State capital and income generation.
The investment strategy is based on investing the surplus revenue generated by the sale of Angola’s petrochemical resources in order to ensure the creation of more sustainable financial income in the long term. This, together with the development of human capital, will support the nation’s socio-economic progress.
FSDEA manages a portfolio that is diversified and adjusted to expected risks, so that the invested capital income rises significantly over time. As prescribed by its Investment Policy, FSDEA started by assigning half of its portfolio
Cash availability
Fixed Income
Equity
Private Equity
Global Funds Investments
to alternative investments, particularly in the fields of agriculture, mining, infrastructure and real estate in Angola and other African markets to foster domestic and regional sustainable growth. Whereas the remaining capital of the portfolio will be invested in traditional fixed income assets issued by states, supranational institutions and large companies.This portfolio segment is also applied to shares issued in global markets and other smaller scale alternative investment in emerging markets worldwide.
A total of USD 1.6 billion was allocated to investment funds in infrastructure and in the hotel industry, with capacity to integrate more co-investors and other projects within Angola and across the sub-Saharan region.
Investment in the infrastructure sector is a crucial part of FSDEA’s strategy, which combines economic and social development. The need for funding in this sector across the continent is crucial for regional socio-economic progress and is well-documented in studies by various specialized institutions.
Hotel infrastructure built to international standards on the continent is key to attracting inward investment and in enabling existing businesses to flourish. Its establishment also drives demand for additional goods and services, as well as creating new jobs. The hospitality industry is therefore an important part of FSDEA’s investment strategy.
Regarding the geographic location of the investments, we found higher prevalence in developed economies, with low levels of volatility. About 18% of FSDEA assets were based in North America, 37% in Europe and 34% in sub-Saharan Africa.
The investment Hotel subfund for Africa has an initial capital of USD 500 million from FSDEA, which will contribute significantly to fulfilling the demands of the sector in the continent. In addition, the creation of a new hospitality academy in Angola, called AGHA or Academia de Gestão da Hotelaria Angolana (Angola Hotel Management Academy), is an important step in FSDEA’s approach of combining social and economic development.
North America
Europe
Australia
New Zealand
Middle East
Asia
Multiple Countries
sub-Saharan Africa

12 13
As part of its strategy of realization of alternative investments, FSDEA proceeded to the Constitution in the Republic of Mauritius of seven (7) investment vehicles, due to the fact that it is a neighbouring jurisdiction that has a Financial Services Commission and an international securities market, supported by an efficient tax framework.
The seven (7) investment vehicles will engage the following sectors: Infrastructure, real estate, health, agriculture, mining, forestry andstructured capital.
As illustrated in the previous diagram, on the specialized investmentvehicle in the infrastructure sector, the FSDEA participates as a limited partner in the corporate structure by FSDEA Africa Investment (LP) Ltd,a wholly self-owned company. Infrastructure Africa (GP) Ltd participates as general partner and QG Investments Africa Management Ltd plays the role of Manager, by allocating the license that allows it to operate in accordance with the laws of the Republic of Mauritius, in particular by the “Mauritius
The corporate model adopted for the seven (7) investment vehicles is of limited partnership. As a limited partner, the FSDEA has limited responsibility for the obligations of corporate society, responding only to the payment of quota limits subscribed in the limited partnership. The chosen structure provides for the entry of more limited partners, with the approval of the general partner.
Limited Partnership Act 2011, the UK “Company Act 2011” and other relevant laws to their activities.
Half of the initial capital will be allocated to important branches for economic development, allowing the State to generate income over the long-term, and hence benefiting national citizens. These include:
FSDEA AfricaInvestment (LP) LTDA
(Maurícia)
"FSDEA Limited Partner"
100%
100%
Infrastructure Africa (GP) LTDA (Maurícia)
"Limited Partner"
QG Africa Investment Management LTDA
"Manager" Consulting Agreement
Quantum GlobalAlternative investments
AG (Zug)
"Investment Consulting"
QGInfrastructure
1LP Investment Committee
(InfrastructureSpecialists)
SPV 2 SPV 3SPV 1
HOSPITALITY INDUSTRY
INFRASTRUCTURE
USD 500 million was allocated to the investment fund for real estate, which is dedicated exclusively to business hotels. The purpose of this allocation is to meet the significant demand for international standard hotel facilities for investors, entrepreneurs and institutional delegations in sub-Saharan Africa.
Hotel facilities are a low-risk investment compared to other real estate assets due to the dynamics of supply and demand for their services, and the pressing capital investment needs of our continent. In addition to generating financial
returns, the hotel sector creates immediate employment opportunities in construction and maintenance and hotel management, which contributes to the development of the domestic supply chain and drives demand for new goods and services.
The development of infrastructure has been a priority for the Angolan government since the achievement of peace. Meanwhile, infrastructure projects hold potential for the involvement of the private sector as well as for attracting foreign direct investment, particularly in the development and management of power networks, railways, airports and large industrial plants and industrial facilities.
Infrastructure demand across the continent remains underfunded, however the inclusion of commercial involvement unlocks the economic potential of several African countries. Since infrastructure is a supportive tool for the development of financial assets in the continent, they constitute a priority of
the Fund’s investment policy, whose domestic and regional focus will tend to increase in the following months.
In this context, the FSDEA capitalized on a collective investment undertaking for the infrastructure sector with USD 1,1 billion. Its focus is on infrastructure commercial projects in the energy, transport and medium and large-scale industry branches, nationally and in the sub-Saharan region. This sub-fund for the infrastructure sector also targets investments along the value chain of the agriculture sector and the amount of mining activity, which are essential for stimulating the private sector in any economy.
INVESTMENT APPROACH IN SPECIFIC INDUSTRIES / ALTERNATIVE ASSETS

14
INVESTMENT VEHICLES AND TARGET SECTORS
INFRASTRUCTURE FUNDOne of the investment subfunds established by FSDEA was announced in December 2014, with an initial share capital of USD 1.1 billion. This fund is dedicated to commercial infrastructure projects in medium and large scale industries. Over the next few years, its capital will be allocated to the energy, transport and industry branches, as well as the development of value chains for agriculture and mining. Its geographic focus is domestic and regional, including the whole of sub-Saharan Africa. It is aimed that these investments produce sustainable and high financial returns in the long term.
AGRICULTURE INVESTMENT FUNDSub-Saharan Africa has about 60% of the fertile areas of the world, which are available for the production of agricultural goods and the expansion of upstream agribusiness. The increasing shortage of capacity for the expansion of agricultural areas in the more developed and emerging nations has increased the prices of agricultural goods and transformed sub-Saharan Africa into a strong producer and natural future exporter within this economic sector. FSDEA aims to create a fund with an initial capital of USD 250 million, focused on the development, expansion and management of agricultural, livestock and medium and large scale agribusiness projects at the domestic and Pan-African level. High sustainable financial returns are targeted over time.
TIMBER INVESTMENT FUNDThe growing international demand for wood products currently exceeds the additional supply from new timber plantations in previously unexplored areas. Unlike more developed regions that hold potential for forestry in sub-Saharan Africa, the establishment and expansion of timber plantations does not compete with other land uses such as agriculture, industry and urbanization. FSDEA aims to create a fund focused on timber, with an initial capital of USD 250 million. Over the next five years, this fund will invest in the acquisition and management of forest concessions in sub-Saharan Africa, in order to obtain high sustainable financial returns over time.
MEZZANINE INVESTMENT FUND Poor access to traditional credit prevails in sub-Saharan Africa because the banking system’s capacity is limited and inaccessible to the region’s entrepreneurs. The available solutions do not provide the capital that small and medium-sized enterprises need for their growth. This gap must be filled by risk-assessed transactions developed on a case-by-case basis; with an emphasis on aspects such as the type of financial instrument, maturity period, the applicable fees, the ranking in the capital structure, the employable guarantees, participation in the capital, the possibility to transfer rights, special arrangements, and redemptions and protection calls. FSDEA aims to create a fund, with an initial capital of USD 250 million for investment in the formation of structured capital opportunities. High sustainable financial returns are targeted over time.
HOTEL FUND FOR AFRICAA significant investment in real estate was also made in 2014, by allocating 500 million dollars of the initial capital to the hotel industry subfund by FSDEA. This company is dedicated to the development and acquisition of business hotels in sub-Saharan region and the introduction of international standards of management. The hotel business is an essential part of the critical infrastructure to stimulate foreign investment in the continent, which holds a significant portion of world resources, including 60% of uncultivated arable land, 10% of world oil reserves, 40% of gold, 80% of chromium and platinum group of minerals, as well as substantial sources of renewable energy generation. These are targeted as high long-term financial returns to the investment subfund for the hotel industry capitalized by FSDEA.
MINING INVESTMENT FUNDThe vast mineral deposits of the continent provide great potential for commercial mining activity. FSDEA aims to create a fund focused on mining companies and projects with an initial capital of USD 250 million. Over the next five years, this fund will consider investment opportunities in the various phases of mining, from exploration to the modernization and expansion of the industry in sub-Saharan Africa. Angola, in particular, holds one of the richest subsoils of the region. High sustainable financial returns are targeted over time.
HEALTHCARE INVESTMENT FUNDThe World Health Organization estimates that billing in the health sector in sub-Saharan Africa is about USD 85 billion per year, of which only 50% are supplied by the government’s public expenditure. With 13% of the world population and only 1.6% of global GDP, there is a significant gap between its total expenditure in health and that of the western world. This gap has gradually decreased, by an increase in disposable income of the growing middle class and public expenditure in the healthcare sector. There are elevated potential sustainable financial returns in the long-term for private investors in this sector in the sub-Saharan region. However, except for South Africa, there are few service providers with substantial scale and most establishments need experts, technology and efficient operating models. Therefore, FSDEA aims to create a fund with an initial capital of USD 400 million, focused on training, hospital management, research and pharmaceutical production, as well as distribution, logistics and hospital equipment supply and medical devices.
15

17
3SOCIAL CHARTER
OVERVIEWThe Social Charter supports projects that aid social development, as is outlined in FSDEA’s investment policy. Up to 7.5 percent of the Fund’s assets may be allocated to social initiatives, regardless of their ability to generate financial returns. Currently, this commitment to issues that transcend the financial nature of investment is expected of all responsible and mature sovereign wealth funds.
The initiatives supported by the FSDEA Social Charter in 2014 include nine of the eighteen provinces in Angola. Every activity is based on the social impact that the invested capital can achieve and is limited to projects that complement the government’s activity in the social sphere, that diversify the trade sectors in the country, that apply modern management practices and that excel in the use of national labour. The targeted areas are professional training, education, entrepreneurship and providing off-the-grid access to water and healthcare. The target audience comprises young people, women and veterans.
16

18
INITIATIVES IMPLEMENTED UNDER THE SOCIAL CHARTER
ANGOLA SOCIAL IMAPCT PROGRAMThe priority of this program is to provide social support in the areas of water supply, energy, health services, training and entrepreneurship. The initiatives of this program are targeted at youth, women and war veterans. This activity complies with principles of local capitation, social impact, diversification of income sources and sustainability, complementary to the actions of the government. Currently, there are 10 ongoing projects that cover nine provinces.
BUNGO INITIATIVEUnder the Social Impact Program in Angola in 2014, FSDEA started a pilot program of social inclusion in the Bungo municipality, in Uige, in partnership with the AIF and JMJ NGOs. This initiative aims to empower small farmers in Bungo, by fostering activities that enable sustainable income generation and facilitate access to public education, to formal vegetable markets and official micro-credit programmes.
The program also encourages the process of civil identification in Bungo to provide the population with access to previously referred public services in their municipality. As a result, it is anticipated that 5,000 Bungo natives will have access to birth certificates, identity cards and other means of identification, which will allow them to avail education, health and banking services, as well as other social and economic benefits available nationally.
FUTURE LEADERS OF ANGOLAOne of the most important tasks for socio-economic progress in Angola is the engagement of young people that have the potential to become high profile professionals for national economic development. In the first quarter of 2014, FSDEA selected 46 young graduates in various fields of academic higher education to participate in its first scholarship program called “Future Leaders of Angola”. The initial program aimed to establish professional skills in the field of asset management. The selected students benefited from a six-month scholarship at the University of Applied Sciences in Zurich (ZHAW).
The graduates returned to the country equipped with academic and professional knowledge. This has allowed them to not only contribute to various aspects of strengthening the national economy, but also improve their individual professional development.
HOSPITALITY ACADEMYThe creation of the Academia de Gestão Hoteleira Angolana (Angola Hotel Management Academy) is an important aspect of FSDEA’s social commitment. It provides Angolans with professional training through the establishment of a dedicated training centre. The academy will provide practical and academic training courses for hospitality professionals, which are based on a curriculum developed by the Ecole Hôtelière de Lausanne (EHL), one of the industry’s most renowned institutions worldwide. AGHA will assign certificates and diplomas in areas such as management, food and beverage and culinary operations. The first intake of students is planned for the first quarter of 2016.
RESEARCH UNITTo support economic and social policies of the State, which are complemented by FSDEA’s domestic investment, a research unit has been established. The facility aims to support the development of a robust econometric model that can analyse the dynamics of the national economy with an African perspective. By studying the real foundations of the economy, FSDEA wants to generate reliable data that can serve as a basis for the guidance of State programs and policy decisions about investments in the country. This model is being developed under the supervision of the Ministry of Planning and has the commitment of the National Bank of Angola, both members of the Advisory Council of FSDEA.
19

4 RISK MANAGEMENTThe protection of assets and maximization of returns from FSDEA requires an intelligent management of the risks involved in the investment activity. To this end, FSDEA applies a risk management policy that defines the strategy, principles, methodologies, as well as the organization and supervision procedures of risk aspects. 2014 has enabled the training of personnel working in the risk management department on the use of computer applications designed to support risk management activities.
2120

22
5 GOVERNANCE AND DISCLOSURE
REGULATORY REPORTS FOR THE GOVERNMENTAs provided in the regulations governing its operations, the Fund submits quarterly performance reports to the government, providing detailed information on the implementation of its investment policy, internal activities and financial data.
REGULATORY INDEPENDENT AUDIT OF THE FINANCIAL STATEMENTSIn 2013, the government appointed a reputable, external audit firm that annually reviews the financial statements of the Fund. This periodical audit allows independent analysis on the compliance of the information provided by the Fund to the State. This also allows the inclusion of FSDEA accounts in the General State Accounts, subject to audit by the Audit Board and yearly review from the National Assembly.
FSDEA SUPERVISORY BOARD The Ministry of Finance appointed the Supervisory Board of FSDEA, whose three members are primarily responsible to ensure compliance with regulations and laws in the country. This governing body adds another level of supervision of the Fund’s internal activities by the government. The three members of the Supervisory Board are civil servants, with roles in the Ministry of Finance, who perform periodic validation of the reports and financial statements of FSDEA to the State.
FSDEA CLASSIFICATION OF ASSETS IN THE GENERAL STATE ACCOUNTSAs provided in Articles 5, 19 and 26 of the Presidential Decree 48/11 of 9 March, FSDEA is under the direct supervision of the Chief Executive. This aspect comes from Law No. 02/13 (7 March), which approves the General State Account for 2013 and assigns the management of the Strategic Financial Oil Reserve to the President. The government submits the General State Accounts for review by the Audit Board and the Parliament every year. The annual balance of FSDEA’s assets is integrated into the GeneralState Accounts.
INTERNATIONAL CERTIFICATIONSIn 2014, FSDEA received a score above the international average level of the Linaburg-Maduell Transparency Index, a method of evaluation of similar institutions’ activities, which is administered by the Sovereign Wealth Fund Institute (SWFI). The SWFI leads the study and analysis of sovereign wealth funds internationally. The 8/10 rating attributed to FSDEA reflects the commitment of the Angolan government towards rigorous reporting and the delivery of long term value to the public.
23

24 25
6 FINANCIAL INDICATORS
FUNDS SOURCE
FUNDS SOURCE
KEY EVENTSDURING THE YEAR
FUNDS SOURCE (IN THOUSANDS USD)
COMPOSITION OF THE CONSOLIDATED ASSETS (AMOUNT IN THOUSANDS USD)
Equity Total Liability
37.715
4.844.745
Cash and cash equivalents
Liquidity investment Bonds and securities Other amounts Assets
483.585
1.358.412
3.000.116
24.949 15.394
6.000.000
5.000.000
3.000.000
2.000.000
1.000.000
The year was characterized by the reinforcement of the implementation of FSDEA’s investment policy and its role as the State’s agent for commercial investments. The initial endowment of USD 5 billion allowed FSDEA to undertake long term investments at both a national and Pan-African level.
In pursuing its main objective to secure income in the long term for Angola, FSDEA placed more emphasis on its investments in an alternative portfolio, decreased the weight of fixed income assets and increased its investments in social projects.
FINANCIAL FIXED ASSETS (ALTERNATIVE PORTFOLIO) • Straightening of the investment: • Payment of the share capital of FSDEA Africa Investment (LP) (name legally registered for the Infrastructure Fund) and FSDEA Hotel Investment (LP), amounting 1.1 billion dollars (500 million and 600 million respectively). • During this year, five new limited partnerships were established to invest on health, forestry, agriculture, mining and structured capital. • Also during 2014 the Fund acquired all the share capital of Kijinga
S.A., for the amount of USD 1, aiming to establish micro-entrepreneurs in the informal sector on the outskirts of Luanda. Its dual location both on the outskirts and in the city centre allows it to be an accelerator of sustained entrepreneurship.
SOCIAL PROJECTSUSD 22 million were allocated to the social segment of FSDEA’s investment policy, which consists of initiatives that contribute to the promotion or environmental protection, which are intended to serve local communities or provide social benefits to society in general. These projects were developed by two methods, namely: the Social Impact Program, which consists of 10 projects and covers nine provinces, and education projects developed by NGOs and commercial companies, which include the Kamba Dyami programs (One Laptop Per Child), Future Leaders in Angola, Hotel Management Academy of Angola and Kijinga (Social Venture Capital).

26 27
1. Third Party Supplies and Services, in particular with Audits costs, Consulting and Other Specialized Technical Services, which reflects the the large investment in training and development, in adopting the best international practices in terms of processes and systems, and other highly specialized services such as impact and viability studies.
2. Other Costs and Income, in particular the amounts spent on social projects, reflecting the Fund’s commitment to the economic and social
development of Angola in partnership with specialized local institutions to implement social impact programmes.
These two rubrics have the vast majority of the displayed value in net income. It is also to be noticed the positive result of the financial intermediation is derived from fixed-income investments.
FINANCIAL MARGIN
Expenses with Staff
Income from Bonds and Securities
Taxes and Fees not Incidents on the result
Costs with other funding
Other Costs and Income
Results of Foreign Exchange
OPERATING RESULT
FINANCIAL INTERMEDIATION RESULT
NET INCOME BEFORE TAXES AND OTHER EXPENSES
Income from Short-Term Investments
Third Party Supplies and Services
Costs with Liquidity Funding
Depreciations and Amortizations
Trading results and Adjustments to Fair Value
Provisions for other securities and probable liabilities
Financial Services Rendered costs
NON-OPERATING RESULT
Administrative and Trading costs
NET RESULTS FOR THE FINANCIAL YEAR
AMOUNTS IN mUSD
(1.206)
97
2013201442.166
359
(165.783) (24.328)
(31.446) -
(5.326) (4.657)
41.813 -
(3.783) (2.550)
(244) (93)
(23.418) -
(987) (415)
(1) (1.303)
(133.224) (17.076)
(757) (334)
(137) -
(157.188) (26.376)
(5) -
(32) (45)
9.719 (1.633)
(156.201) (25.961)
(157.188) (26.376)
RESULTS
CONSOLIDATED BALANCE SHEET
CONSOLIDATED BALANCE SHEET
ACTIVITY
Liquidity investments
Results of negotiations and Adjustments to Fair Value
Other amounts
Financial Services Rendered Costs
OWN FUNDS
Provisions for potential liabilities
Number of employees
Accrued results
Net Income
Fixed Assets / Equity
Cash and cash equivalents
Financial margin
Bonds and securities
Results of Foreign Exchange
Assets
Administrative Costs (Structure Costs)
Allocations
Non-operating result
RATIOS
Total Liability
FUNCTIONING
Equity Ratio (Equity/Assets)
AMOUNTS IN MILLION USD
2.657.157
2.942.965
201320144.882.460
483.585
37.715 5.224
15.394 13.955
-244 -93
1358.412 300.016
4.884.745 3.651.933
-757 -334
-987 -415
3.000.116 400.000
42.166 -1.206
5.045.789 3.695.798
-165.783 -24.327
-157.188
0,32%
-26.375
0,38%
24.949 221
-31.446 0
-201.053 -43.865
-137
36
0
17
99,23% 99,86%
ANALYSIS OF FINANCIAL INDICATORS
Despite the adverse effects of the decline in commodity prices and weak recovery of the developed economies, the Fund maintains the implementation of its short-term investment policy due to the opportunityto access new industries and assets from which the current context provides.
Following this investment policy, and in order to take advantage of the potential domestic and Pan-African growth in a sustainable way, the Fund will allocate half of its assets in alternative investments. The remainder will be allocated predominantly in global and emerging equity, while a less substantial investment will be made in fixed income assets, currencies and hedging strategies.
OUTLOOK FOR 2015
In this context, the capitalization of five limited partnerships in the health, timber, agriculture, mining and structured capital sectors is planned to take place. The focus on domestic investment will be more visible and impactful. However, the parallel increase in the securities risk profile in the portfolio, derived from the poor returns of low risk bonds, introduce greater complexity in the risk management of FSDEA’s investment portfolio. This will require higher management costs and investment coverage.

28 29
Cash and cash equivalents
Short-Term Investments
Bonds and Securities
Other Amounts
ASSESTS
Financial assets
Tangible assets
Intangible assets
TOTAL ASSETS
TOTAL ASSETS
Advances to suppliers
mUSD mUSD
4 1.358.412 300.016140.010.166 29.287.259
5 3.000.116 400.000309.218.956 39.047.590
3 483.585 2.942.96549.842.622 228.717.868
6 24.949 2212.571.549 21.612
7 5.000 -515.345 205.781
7
7
2.494 2.108257.054 1156.492
7.900 11.847814.245 59.933.673
15.394
4.882.460
4
13.955
3.657.157
1.586.644
503.230.269
332
1.362.273
357.008.002
tAOA (Note 2) mAOA (Note 2)ASSET NOTES
2014 2013 PRO-FORMA
TOTAL LIABILITIES
Initial allocation of the Fund
Initial capital allocated unrealized
Reserves and Funds
Retained earnings
Net results for the financial year
TOTAL EQUITY
Provisions for potential liabilities
Other Liabilities
TOTAL LIABILITY AND EQUITY
tUSD tUSD
9 137 -14.120 -
37.501 52243.887.246 509.954
8 37.587 5.2243.873.126 509.954
10 5.000.000 5.000.000515.345.000 488.095.000
10 - (1350.000)- (131.785.650)
10 45.798 45.7984.720.354 4.470.755
10 (43.865) (17.490)(4.521.122) (1.707.356)
(157.188) (26.375)(16.201.209) (2.574.701)
4.844.745 3.651.933499.343.023 356.498.048
4.882.460 3.657.157503.230.269 357.008.002
tAOA (Note 2) mAOA (Note 2)LIABILITIES AND EQUITY NOTES
2014 2013 PRO-FORMA
7 FINANCIAL STATEMENTSThe preparation and dissemination of FSDEA’s financial statements is the responsibility of the Board of Directors. This information is embodied in the Balance Sheet, the Income Statement, the Statement of Changes in Equity and Cash Flow Statement.
BALANCE SHEET (AS OF 31 DECEMBER 2014 AND 2013)

30 31
CONSOLIDATED BALANCE SHEET(AS OF 31 DECEMBER 2014 AND 2013)
Income from Short-Term Investments
Income from Bonds and Securities
Income from Financial Instruments
Third Party Supplies
Costs with Liquidity Funding
Taxes and Fees not incurring on results
Costs with other funding
Income from Financial Instruments
Depreciations and amortizations
Other Costs and Income
ADMINISTRATIVE ANDTRADING COSTS
Trading results and adjustments to fair value
Provisions for other securitiesand liabilities
Results of Foreign Exchange
OPERATING RESULT
NET INCOME BEFORE TAXES ANDOTHER EXPENSES
Financial Services Rendered costs
FINANCIAL MARGIN
Staff
FINANCIAL INTERMEDIATIONRESULT
Non-operating result
NET RESULTS FOR THE FINANCIAL YEAR/PERIOD
tUSD tUSD
12 41.813 -
17
4.309.624 -
42.172 974.346.626 9.469
12 359 9737.002 9.469
12 (1) (1.303)(103) (127.198)
12
12
12
12
(5) -(515) -
(6) (1.303)(618) (127.198)
42.166 (1.206)
(93)
(334)
4.346.008 (117.729)
(9.079)
(32.605)
(40.511)
(2.574.701)
(31.446)
(244)
(757)
-(3.241.108)
(25.149)
(78.023)
-
13
14
(3.782) (2.550)(389.807) (248.928)
(133.224) (17.076)(13.731.264) (1.666.942)
9.719 (1.633)1.001.728 (159.413)
(32) (46)(3.298) (4.490)
7 (5.325) (4.654)(548.842) (454.319)
15 (23.420) (1)(2.413.876) (98)
(165.783) (24.327)(17.087.087) (2.374.777)
(137) (14.120)
(156.201)
(987)
(157.188)
(415)
(26.375)
(16.099.479)
(101.730)
(16.201.209)
(157.188) (26.375)
(25.960)
(16.201.209) (2.574.701)
(2.534.190)
tAOA (Note 2) tAOA (Note 2)NOTESASSET
2014 2013 PRO-FORMA
STATEMENT OF CHANGES IN EQUITY (AS OF DECEMBER 31, 2014 AND 2013)
Amounts expressed in thousands of US Dollars - tUSD)
Initial capital allocation
Initial capital allocation unrealized
Notes Reserves and Funds
Results for the financial year TotalRetained
earningsRetained earnings
Retained earning from 2012
Net results for the financial year 2013
Initial allocation of the Fund
Straightening/Expansion of the funds forconstitution and installation
Balance as of 31 December, 2013
Net results for the financial year 2014
Balance as of 31 December, 2014
Balance as of 31 December, 2012
Initial allocation of the Fund
Retained earning from 2013
- - 36.350 - (17.490) 18.860
9 - - - (26.375) 26.375 -
9 - -
-
-
- (17.490) 17.490 -
9 - (1.350.000) - - - 1.350.000
9 - -
-
9.448 - - 9.448
9 - - - - (157.188) (157.188)
5.000.000 - - 45.798 (43.865) (157.188) 4.844.745
9 - - - - - (26.375) (26.375)
9 5.000.000 - (1.350.000) - - - 3.650.000
5.000.000 - (1.350.000) 45.798 (17.490) (26.375) 3.651.933

32 33
ASSETS
Income from Bonds and Securities
CASH FLOW FROM FINANCINGACTIVITIES
Income from Short-Term Investments
Cash flow from investment in bonds and securities assets
Income from financial asset instruments
Cash flow from investments in fixed assets
Costs with Liquidity Funding
CASH FLOW FROM FIXED ASSETS
Costs with other funding
CASH FLOW FROM INVESTMENTS
Costs with financial liabilities instruments
Income from the allocation for incorporation and establishment
CASH FLOW FROM FINANCIAL MARGIN
Income from initial allocation of the Fund
Cash flow from the results of foreign exchange transactions
CASH FLOW FROM EQUITYFINANCING
Cash flow from the results of financial services rendered
FLUXO DE CAIXA DOS FINANCIAMENTOS
CASH FLOW FROM FINANCIAL INTERMEDIATION
CHANGES IN CASH AND CASH EQUIVALENTS
Costs with administrative and trading costs
CASH AND DEPOSITS AS OF THE BEGINNING OF THE FINANCIAL YEAR
Cash flow from other securities and other liabilities
CASH AND DEPOSITS AS OF THE END OF THEFINANCIAL YEAR
INCOME AND PAYMENTS FROM OTHERCOSTS AND OPERATING INCOME
CASH FLOW FROM OPERATIONS
Cash flow from short-term investments
Cash flow from other costs and operating income
2014 2013 PRO-FORMA
tUSD tAOA (Note 2) tAOA (Note 2)tUSD
375 38.651 97 9.469
28.382 2.925.304 (1.565)
(17.806)
(152.806)
(1) (103) (1303) (127.198)
- -
(17.775)
23.526
28.574 2.945.094 (1206) (117.729)
(127.362) (13.127.075)
(299.016)
(1.887.984)
26.205 2.907.061 - -
(148.990) (15.356.251)
(210)
(1.738.204)
(5) (515) - -
(155.744) (16.052.379)
(19.340)
(1.735.178)
(154) (15.873) (28) (2.765)
(1.058.412) (109.089.466)
(400.000)
(29.189.642)
28.580 2.945.712 97 9.469
(6.754) (696.128)
241
(20.500)
(6) (618) (1303) (127.198)
(38) (3.917) (331) (32.312)
(2.615.950) (269.623.351)
(699.016)
(39.047.600)
(3.674.362) (378.712.817)
(13.562)
(68.237.242)
(7.656) (789.096)
(13.562)
(1.323.909)
(7.656) (789.096)
(712.578)
(1.323.909)
(3.682.018) (379.501.913)
9.448
(69.561.151)
- -
3.650.000
922.304
1.350.000 139.143.150
3.659.448
356.309.350
1.350.000 139.143.150
3.659.448
357.231.654
1.350.000 139.143.150
2.927.530
357.231.654
(2.459.380) (253.485.838)
15.435
285.782.519
2.942.965 303.328.460
2.942.965
1.506.749
483.585 49.842.622 287.289.268
STATEMENT OF CASH FLOWS (AS OF DECEMBER 31, 2014 AND 2013)

34 35
1. INTRODUCTORY NOTE
The Sovereign Wealth Fund of Angola (also hereinafter referred to as “Fund” or “FSDEA”), whose current name was set out by Presidential Decree No. 89/13, of 19 June, was established by Presidential Decree No. 48/11 of March 9, then under the name Petroleum Fund. The Board of Directors of the Fund has been appointed on March 16, 2012. In May 2012, the Board of Directors submitted for approval the establishment of the Fund budget, which was approved in June 2012.
On July 16, 2012, the Fund was established, having received the first instalment of the allocation of incorporation and establishment of the Fund, which amounted to a total of tUSD 36,350.
On 17 October 2012, the Republic of Angola officially launched the Fundo Soberano de Angola, with an initial budget of five billion US dollars capital, which was subscribed in full by the Republic of Angola, as indicated in Note 10.
The Fund aims to promote, encourage and support, in Angola and abroad, investment in development projects in strategic sectors. The Fund will allocate about half of its initial endowment of capital to alternative investments, particularly in agriculture, mining, timber, health, infrastructure and real estate sectors (and with regard to the latter, with particular emphasis in the hotel industry) in Angola and in other African markets. The remainder of the portfolio of the Fund’s investments will be allocated to fixed income securities and treasury operations, issued by states and supranational institutions, global equity and emerging as well as other alternative investments in emerging markets worldwide.
The Fund has already proceeded with the creation of regional investment funds for the health, hospitality, mining, timber, agriculture and infrastructure sectors in sub-Saharan Africa, through which will contribute to the development and growth of the regional economy.
The Fund will devote a minimum of 7.5% of its assets to social development projects and social responsibility investments in education, generation of own income, health and access to energy and drinking water off the national grid.
In order to comply with the accounts reporting requirements established by law, the Fund prepared its consolidated financial statements as of 31 December, 2014 and 2013.
NOTES ATTACHEDTO THE FINANCIAL STATEMENTS
The consolidated financial statements of the Fund include, as of 31 December, 2014, the Sovereign Wealth Fund of Angola, the FSDEA Africa Investment (LP) Ltd., the FSDEA Hotel Investment (LP) Ltd.,the FSDEA Africa Agriculture (LP) Ltd., the FSDEA Africa Mezzanine (LP) Ltd., the FSDEA Africa Timber (LP) Ltd., the FSDEA Africa Healthcare (LP) Ltd., the FSDEA Africa Mining (LP) Ltd. and Kijinga, SA.
The entities included for the purposes of preparation of the consolidated financial statements of the Fund, as well as the nature of its activities, are described in more detail in Note 2.2 a) - “Consolidation principles”.
As of 31 December, 2014, the Fund prepared its first consolidated financial statements, given that as of 31 December, 2013 the process of creating the Fund’s first subsidiary was not yet completed. Therefore, the consolidated financial statements for the financial year 2013 are presented only for comparative purposes and publication of accounts. Considering that comparing with the financial year as of 31 December, 2013 the Fund only prepared financial statements due to the reason mentioned above, the consolidated financial statements for the year 2013 now presented assume the nature of “pro forma” financial information.
2. PRESENTATION BASIS AND SUMMARY OF SIGNIFICANTACCOUNTING POLICIES
2.1. Presentation BasisThe Fund’s consolidated financial statements have been prepared on the basis of an operations continuity, based on the books and accounting records kept in accordance with the accounting principles of the Chart of Accounts for Financial Institutions (CONTIF), according to Instruction No. 9/2007, of September 19, issued by the National Bank of Angola. CONTIF aims at standardizing the accounting records and financial disclosures in approach to international practices, through the convergence of accounting principles to International Financial Reporting Standards (IFRS - International Financial Reporting Standards).
The financial statements of the Fund as of 31 December, 2014 and 2013 are expressed in US Dollars, having the assets and liabilities denominated in other currencies been converted using the average exchange rate published
1 AOA =
1 EUR =
0,009702
2014
0,010244
2013
1,2154 1,3766
by the Angola National Bank on those dates. As of 31 December, 2014 and 2013, the US dollar exchange rates (USD) over the Kwanza (AOA) and Euro (EUR) were as follows:
In the Board’s opinion, the US dollar is the currency that best reflects the economic effects of transactions, events and conditions underlying the financial statements of the Fund, being the currency of denomination of the initial allocation of capital and endowment of incorporation and establishment of the Fund, being the preferred currency for the Fund’s investments and, consequently, the achievement of almost all of their income, as well as costs incurred. In Note 11 of the Annex the balance sheet by currency is presented, which highlights the importance of US Dollars for financial statements of the Fund.
The financial information relating to 2014 and 2013 expressed in Kwanza is presented solely as reading convenience, having its conversion been carried out based on the average exchange rate published by the Angola National Bank as of 31 December, 2014 and 2013. This conversion should not be construed as a representation that the amounts in US dollars have been, could have been or could be converted to Kwanza to these or anyexchange rates.
2.2. ACCOUNTING POLICIES
a) Consolidation principlesThe Fund’s consolidated financial statements include the Sovereign Wealth Fund of Angola accounts and those of the entities it controls directly or indirectly. These companies over which the Fund has control are classified as “subsidiaries”. Control is presumed to exist when the Fund has the power to exercise the majority or full voting rights. Control may also take place when the Fund has the power, directly or indirectly, to govern the financial and operating policies of an entity so as to obtain benefits from its activities, even though the percentage of equity held is equal or inferior to 50%. The subsidiaries are fully consolidated, having eliminated the transactions and significant balances between the entities that are subject to consolidation. Additionally, where applicable, consolidation adjustments were made to ensure consistency in the application of the Fund’s accounting principles. Consolidated net income is the aggregate of the net income of the Fund and of its subsidiaries, in proportion to their effective participation, after consolidation adjustments, where applicable, and the elimination of income and expenses resulting from transactions between the entities included in the scope of consolidation. As of 31 December, 2014, the main financial indicators of subsidiary entities by the Fund are as follows (amounts expressed in thousands of the respective currency):

36 37
The Fund began the process of the establishment of FSDEA Africa Investment (LP) Limited in 2013, with an advance of tUSD 600 to its constitution. During the financial year 2014, the Fund completed the process of constitution of FSDEA Africa Investment (LP) Limited, additionally performing a capital increase in this entity amounting tUSD 500, raising the total investment up to tUSD 1.1. Also during the year 2014, the Fund established six additional entities in the Republic of Mauritius, which involved a total investment of tUSD 544,250. It will be through these entities and FSDEA Africa Investment (LP) Limited that the Fund will hold, indirectly, investments in development projects in strategic sectors, based on their investment policy. As previously mentioned, FSDEA Africa Investment (LP) Ltd. and FSDEA Hotel Investment (LP) Ltd act in the role of “Limited Partners” of QG African Infrastructure 1 L.P. and QG Africa Hotel L.P., respectively. In turn, QG African Infrastructure 1 LP and QG Africa Hotel LP take the form of closed-end investment funds established in the Republic of Mauritius, being regulated in that jurisdiction by the Financial Services Commission. Through those entities, the Fund will invest in the infrastructure and hotel sectors, respectively. During the financial year 2014, the Fund acquired all the share capital of Kijinga, SA, at a cost of USD 1. Under the entered equities promissory purchase and sale agreement, the Fund bound to settle the liabilities of Kijinga, SA and of its subsidiary Ulussu, SA, amounting to tAOA 9,948,750 (corresponding to an equivalent of tUSD 96,525, based on the average exchange rate published by the National Bank of Angola as of 31 December, 2014). Of that amount, a value of tAOA 1,260,000 (corresponding to an equivalent of tUSD 12,225, based on the average exchange rate published by the National Bank of Angola as of 31 December, 2014) concerns a service agreement concluded by Kijinga SA and Kwanza Enterprise Promotion, SA. The remaining value, which amounts to tAOA 8,688,750 (corresponding to an equivalent of tUSD 84,300, based on the average exchange rate published by the National Bank of Angola as of 31 December, 2014) concerns a promissory purchase and sale agreement of a portion of a building locatedin Luanda signed between Ulussu, SA and Afrique IMO Corporation, SA.
In order to allow the settlement of these obligations, the Fund subscribed to a capital increase of Kijinga, SA for an amount equivalent to the obligations assumed by Kijinga, SA and its Ulussu subsidiary, SA, which was paid-in in January 2015.
b) AccrualIncome and expenses are recognized based on the duration of operations in accordance with the principle of accrual, being recorded as they are generated, irrespective of when paid or received.
c) Foreign currency transactionsOperations in a different currency than the presentation currency are recorded in accordance with the principles of the “multi-currency” system, with each operation being registered in accordance with its respective denomination currencies. Assets and liabilities denominated in a currency other than the presentation currency are converted into US dollars using the average exchange rates published by the National Bank of Angola as of balance sheet date. Costs and income from to exchange rate differences, realised or potential, are recorded in the income statement for the year they are incurred under “Results of foreign exchange operations” (Note 12).
d) Intangible and tangible assetsThe Intangible assets correspond to constitution costs, software and improvements in third party properties.
These expenses are recorded by their acquisition cost, including the necessary costs for their commissioning, and amortized linearly over a period of three years, with the exception of improvements in third party properties, which are amortized according to its estimated lifetime or the term of the signed lease.
Tangible fixed assets are recorded at acquisition cost, including the necessary costs for their commissioning, and depreciated by straight-line basis according to the estimated lifetimes of the respective assets, which
correspond in turn to depreciation rates similar to those that are set out in Presidential Decree No. 177/10 of 13 August. The estimated lifetimes of the most significant tangible assets of the Fund are between 4 and 8 years.
e) Financial fixed assetsCompanies not included in the consolidation are recognized by the equity method in the following situations:
i) When the equity holdings are consolidated; or
ii) When equity holdings are relevant and the Fund has influence in its administration, or when the percentage of participation, directly or indirectly, represents 20% or more of the voting capital of the subsidiary.
Under the equity method, investments are initially valued at acquisition cost, which is then adjusted based on the actual percentage of the Fund on changes in equity (including results) of the corresponding subsidiaries.As of 31 December 2014, the only subsidiary directly or indirectly by the Fund not included in its consolidation perimeter is as follows:
f) Securities portfolioGiven the characteristics of securities and the intention at the time of acquisition, these are classified into the following categories: held to maturity, held for trading and available for sale.
SECURITIES HELD TO MATURITYThis classification includes securities for which the Fund has the intention and financial capacity for its maintenance until their due date. Securities classified under this heading include non derivative financial assets with fixed or determinable payments and fixed maturity date.
Securities classified under this heading are valued at cost of acquisition, plus income earned by the fluency of their terms (including accrual of interest and premium / discount in the income statement). The Fund recognizes potential profit or loss determined on maturity date by the difference between the amount received on that date and their book values.As of 31 December, 2013 the entire portfolio of held-to-maturity of the Fund comprised US Treasury notes.
SECURITIES HELD FOR TRADINGSecurities acquired in order to be active and frequently traded are considered held for trading securities. Securities held for trading are initially recognized at acquisition cost, including costs directly attributable to the acquisition ofthe asset.
Entity
Capoinvest Limited, BVI
% Shareholding Valuation method
10% Equity method
They are subsequently measured at fair value and its related valuation gain or loss is recognized in the income statement (Note 12).
The fair value calculation methodology (market value) is established based on consistent and verifiable criteria, according to the following hierarchy:
I. Price and / or average closing price observed in the market on the day of clearance;
II. Probable realizable net value obtained by adopting technical or pricing model.
As of 31 December, 2014 the Fund’s entire securities portfolio is classified in the category of securities held for trading. As of 31 December, 2014 the entire portfolio of trading securities of the Fund consisted of an application in a real estate open liquidity fund.
SECURITIES AVAILABLE FOR SALESecurities available for sale are considered securities that can be negotiated and eventually that do not fit the other categories. They are initially recorded at cost, and subsequently valued at fair value. Changes in fair value are recognized against equity, under “Potential results - Adjustments to Fair Value Financial Assets Available for Sale”. Gains and losses are recognized in the income statement in the subsequent asset sale.
g) Provisions for potential liabilitiesA provision is made when there is a present obligation (legal or constructive) resulting from past events for which the future expenditure of resources is probable and it can be reliably determined. The provision amount corresponds to the best estimate of the amount to be paid to settle the liability at the balance sheet date. If a future expenditure of resources is not probable, it is a contingent liability. These contingent liabilities are only disclosed, unless the possibility of their payment is remote.
The provision for potential liabilities recorded by the Fund corresponds to compensation for retirement, defined in accordance with Law No 2/2000 and in Articles 218 and 262 of the General Labour Law (Note 9).
Compensation for reform payable by the Fund in the event of termination of the employment contract for the employee’s retirement is determined by multiplying 25% of the monthly base salary paid on the date the worker reaches the legal retirement age by the number of years of seniority on the same date.
h) Income taxThe Angola Sovereign Wealth Fund benefits under Presidential Decree No. 48/11, of 9 March, of tax exemptions, fees and contributions, whatever their title or nature, ordinary or extraordinary, national, regional, municipal or local, present or future, provided by law and applicable to the State and its services, agencies and institutes. It is also particularly applicable tax exemptions of any taxes on income, wealth taxes and stamp duty.
Entity Currency% shareholding
Reference date Equity
FSDEA Hotel Investment (LP) Ltd.
FSDEA Africa Timber (LP) Ltd.
Kijinga.S.A.
FSDEA Africa Agriculture (LP) Ltd.
FSDEA Africa Healthcare (LP) Ltd.
FSDEA Africa Investment (LP) Ltd.
FSDEA Africa Mezzanine (LP) Ltd.
FSDEA Africa Mining (LP) Ltd.
100% USD31-12-2014 1.081.854
100% USD31-12-2014 489.621
100% USD31-12-2014 224.993
100% USD31-12-2014 199.993
100% USD31-12-2014 224.993
100% USD31-12-2014 249.993
100% USD31-12-2014 249.993
100% AOA31-12-2014 9.948.750
Headquarters
Port Louis
Port Louis
Port Louis
Port Louis
Luanda
Port Louis
Port Louis
Port Louis
NetAssets
1.081.854
489.645
225.002
200.002
225.002
250.002
250.002
18.639.458
Netresults
(18.172)
(10.379)
(7)
(7)
(7)
(7)
(7)
(42)

38 39
The deposits at financial institutions maintained by the Fund are not paid and are mostly denominated in US dollars.
NOTE 3 - CASH AND CASH EQUIVALENTS
THIS ITEM IS STRUCTURED AS FOLLOWS:
CASH
Banknotes and coins in Kwanza
Banknotes and coins in functional/presentation currency
Standard Bank (Mauritius) Limited
Banknotes and coins in foreign currency
AfriAsia Bank Limited
Total cash
Total deposits in functional currencies
DEPOSITS ATCREDIT INSTITUTIONS
In Euro
Savings and Credit Bank
In functional/presentation currency
Total Cash and cash equivalents
Euroclear Bank SA/NV
Northen Trust Corporation
In Kwanza
Total Deposits at credit institutions
Total(tUSD)
Total(tAOA)
12
8
3360 360
8
208.150
825
21.453.732
44.250 44.250
8
4.560.803
8
483.172
179.791
483.180
50.087
894
208.150
894
483.172
-
-
11
483.172
360
-
1.193
49.799.976- -- -
402
483.574483.585
50.087
894
41.453
41.45341.813
41.453
49.841.42949.842.622
5.162.417
92.144
179.791-
-
-
18.530.880
Kwanza(in thousands)
Functional/Presentation
Currency(in thousands)
Other foreigncurrencies
(thousands)
2014
CASH
Banknotes and coins in Kwanza
Banknotes and coins in functional/presentation currency
Standard Bank (Mauritius) Limited
Banknotes and coins in foreign currency
AfriAsia Bank Limited
Total cash
Total deposits in functional currencies
DEPOSITS ATCREDIT INSTITUTIONS
Savings and Credit Bank
In functional/presentation currency
Total Cash and cash equivalents
Euroclear Bank SA/NV
Northen Trust Corporation
In Kwanza
Total Deposits at credit institutions
Total(tUSD)
4
8831 831
4
600.000
374
58.571.400
- -
8
-
8
2.941.098
2.248
2.941.102
1.638.845
700.005
600.000
2.941.098
-
-
12
2.941.098
831
-
1.213
287.107.03318 (24)- (2.370)
1.879
2.942.9532.942.965
1.638.845
700.005
187.392
187.392188.223
183.392
287.288.055287.289.268
159.982.425
68.333.800
2.248-
-
-
219.408
Kwanza(in thousands)
Functional/Presentation
Currency(in thousands)
Other foreigncurrencies
(in thousands)
2013 PRÓ-FORMA
NOTE 4 - SHORT-TERM INVESTMENTS
THIS ITEM IS STRUCTURED AS FOLLOWS:
Investments in foreign credit institutions
In USD
Term deposit
Receivables
Total Investments
1.358.412 140.010.166 300.000 29.285.700
1.358.412 140.010.166 300.000 29.285.700
1.358.412 140.010.166 300.016 29.287.259
- - 16 1.559
2014
tUSD tUSDtAOA tAOA
2013 Pro-forma
Income earned abroad is subject to tax according to the tax law in the jurisdictions in which income is obtained, including tax withholding title at source on interest and / or dividends received.
i) Income taxThe Fund is subject to indirect taxation in particular customs duties and consumption tax.
Total(tAOA)

40 41
As of 31 December 2014, the balance of this item referred to term deposits with 14 days maturities and remunerative rates of 0.1% kept by QG African Infrastructure 1 LP and QG Africa Hotel LP in the amounts of tUSD 1,016,013 and tUSD 342,399, respectively, with Standard Bank (Mauritius) Limited. These term deposits had their maturity in financial year 2015.
On 29 November, 2013 the Fund entered an investment management agreement with the Northern Trust Corporation, subject to the limits defined in the investment policy of the Fund, and in accordance with the Presidential Decree No. 107/13, of 28 June.
On 29 November, 2013 the Fund entered into an agreement with Quantum Global Investment Management AG, by which thîs entity will act as an investment manager in relation to money and property that may be assigned from time to time by the Fund. As of 31 December, 2014 this item is mainly comprised of fixed income financial instruments, which bore interest at a weighted annual interest average rate of 2.06%.From the total amount of tUSD 2,713,622 debt instruments held by the Fund on 31 December, 2014, about tUSD 2.405 related to bonds with BBB or higher credit rating, as shown below:
As of 31 December, 2014 the securities with no credit risk rating referred essentially to debt instruments issued by corporate entities domiciled in the United States and the European Union.
From the amount of tUSD 303,675 of securities without credit rating held by the Fund as of 31 December, 2014, about tUSD 220,000 respected debt instruments with residual maturity up to one year.
As of 31 December, 2014 and 2013, the balance of this item included the amounts of tUSD 33.585 and tUSD 300,000, respectively, relating to investments in mutual funds open liquidity managed by Northern Trust
The changes in value of trading securities and the capital gains realized by the Fund resulting from transactions of these securities are recorded under the income statement “Results of negotiations and adjustments to fair value” (Note 12).
Annex I shows the breakdown of “Securities” on December 31, 2014 per share.
As of 31 December, 2013 the balance of this item included 3 term deposits of USD 100,000,000 each, with maturities of 14, 21 and 42 days and annual remuneration rate of 0.20%, 0.20% and 0.25 %, respectively.
These term deposits, constituted under the management agreement entered with the Northern Trust Corporation, were contracted with the Mizuho Bank Ltd (two term deposits, corresponding to a total value of USD 200,000,000) and Société Générale SA (one term deposit of USD 100,000,000) and were due in the financial year 2014.
NOTE 5 - BONDS AND SECURITIES
THIS ITEM IS STRUCTURED AS FOLLOWS:
Securities held for trading:
In USD
Debt instruments:
Corporate bonds in USD
Europe
Asia
Bonds/ Treasury bills in USD
Equity instruments:
Exchange Traded Funds
North America
In USD
Securities held to maturity:
In CHF
Debt instruments:
Treasury bills
Receivables
In USD
In USD
Others
Liquidity investments
1.165.858 120.163.818 - -
- -
- -
-
-
-
-
-
-
-
-
218.794 22.550.879
978.595 100.862.808
18.503 1.907.086
321.588 33.145.754
237.297 24.457.965
33.585 3.461.572 300.000 29.285.700
100.000 9.761.890
100.000 9.761.890
100.000 9.761.890
- -
- -
- -
15.612 -1.609.113 -
2.984.504 307.609.843 300.000 29.285.700
3.000.116 400.000309.218.956 39.047.590
116.290 11.985.894
131.291 13.532.032
2.597.332 267.704.412
2.713.622 279.690.306
2014
tUSD tUSDtAOA Credit risk rating:
AAA
AA- a AA+
A- a A+
BBB- a BBB+
Without credit risk rating
Inferior a BBB-
641.818
630.241 64.958.310
66.151.539
5.270
335.480 34.577.588
543.174
303.675
797.138 82.160.217
31.299.478
802.408 82.703.391
2014
tUSD tAOAtAOA
2013 Pro-forma
Global Investments Limited, having these been settled in the course of 2015 and 2014 financial years, respectively.
Additionally, as of 31 December, 2013, this item registered a total of tUSD 100,000 concerning the US Treasury notes, with residual maturity of 20 days and annual remuneration of 0.004%.
As of 31 December, 2014, the “Bonds and Securities” item, excluding accrued income, had the following structure, according to residual maturity:
Up to 1 year
More than5 years
Between1 to 3 years
Between3 to 5 years Undetermined Total
(mUSD)Total
(mAOA)
Corporate bonds
Equity instruments:
Liquidity investments
Bonds/ Treasury bills
Exchange Traded Funds
Debt instruments:
Total
("Exchange Traded Funds") - - - -
1.772.207 -121.649 - 2.597.332 267.704.412
58.060 5.27034.259 - 116.290 11.985.894
1.830.267
1.830.267
5.270
5.270
155.908
155.908
-
270.882
2.713.622
2.984.504
279.690.306
307.609.843
237.297 237.297 24.457.965
33.585 33.585 3.461.572- - - -
703.476
18.701
722.177
722.177

42 43
NOTE 6 - OTHER SECURITIES
THIS ITEM IS STRUCTURED AS FOLLOWS:
NOTE 7 - FIXED ASSETS
Advances
Benguela Development, S.A.
QG Investments Ltd.
Others
Receivables
Total
7.272
16.809
749.518
1.732.487
-
-
-
-
24.081 2.482.005 - -
24.949 2.571.549 221 21.612
868 89.544 221 21.612
2014
tUSD tUSDtAOA tAOA
2013 Pró-forma
As of 31 December, 2014, the amount of the advance to Benguela Development, SA corresponds to the first provision of the agreement between the Fund and this entity on 17 December, 2014, which aims to implement and build the Angola Hotel Management Academy (“Academy”) as well as the management of its operations in the period between October 2015 and January 2019. The Academy will be located in the province of Benguela and its main purpose will be to provide education in the hotel industry.
The agreement between the Fund and the Benguela Development, SA foresees a total investment of tAOA 4,950,000 (corresponding to an equivalent of tUSD 48,026, based on the average exchange rate published by the National Bank of Angola for 31 December, 2014) which will be fully supported by the Fund and will be paid in three instalments. The first instalment amounted to tAOA 1,732,500 (corresponding to an equivalent of tUSD 16,809, based on the average exchange rate published by the National Bank of Angola for 31 December , 2014), which was settled in January 2015 (Note 8).
The global investment associated with this agreement will be recognized in costs by the Fund over the term of the agreement. At the end of the agreement, the Fund shall be entitled to acquire all the shares representing the share capital of the entity that will own the Academy, for a total of tAOA 3,990,000 (corresponding to an equivalent of tUSD 38,712 based on exchange indicative average published by the National Bank of Angola for 31 December, 2014).
As of 31 December , 2014, the value of the advance to QG Investments Ltd corresponds to the first two instalments of the contract between the Fund and such entity on 30 May, 2014, which aims to develop an econometric model for simulating aspects of the national economy to effectively enable the Fund’s experts economists to understand the fundamental processes that affect the national economy. The contract between the Fund and QG Investments Ltd provides a global investment of 11,635 tUSD and has a duration of 36 months. Since as of 31 December, 2014, the conditions for the registration of expenses already incurred under the agreement on the item “Intangible assets” were not gathered, the Fund recorded the amounts in question under “Other values”.
During the financial year 2014, the FSDEA Africa Investment (LP) Ltd., through QG African Infrastructure 1 LP, made an initial payment of tUSD 5,000 to acquire a 10% stake in the share capital of Capoinvest Limited, BVI, through which it will develop the project for the construction of a deep water port in the Cabinda province.
As of 31 December, 2014 and 2013, the net balance of intangible assets referred mainly to expenses incurred during the start-up and constitution of the Fund, such as payment of expenses for consulting projects, and improvements in third parties properties.
These items present the following movements during the financial years2014 and 2013:
FINANCIAL FIXEDASSETS
TANGIBLE AND INTANGIBLEASSETS
Tangible assets
Tangible assets
Furniture, utensils, facilities and equipment
Furniture, utensils, facilities and equipment
Intangible assets
Intangible assets
Automatic software data processing systems
Automatic software data processing systems
Improvements in third party properties
Improvements in third party properties
Constitution costs
Constitution costs
Total
Total
Increases
Increases
2.108
1.958
827
484
(438)
(322)
(3)
(12)
2.494
2.108
2.108
1.958
827
484
(438)
(322)
(3)
(12)
2.494
2.108
2.126
795
211
1.758
(593)
(427)
-
-
1.744
2.126
3.054
2.544
11.847
13.339
729
1.082
(960)
(572)
-
-
2.823
3.054
6.667
10.000
13.955
15.297
-
-
(3.334)
(3.333)
-
-
3.333
6.667
940
2.840
(4.887)
(4.332)
-
-
7.900
11.847
1.767
3.324
(5.325)
(4.654)
(3)
(12)
10.394
13.955
Write-offs, disposals and others
Write-offs, disposals and others
Yearamortizations
Yearamortizations
2014
2013 Pro-forma
Net assets
Net assets
Balance as of 01/01/2014Net assets
Balance as of 01/01/2013Net assets

44 45
NOTE 8 - OTHER LIABILITIES
THIS ITEM IS STRUCTURED AS FOLLOWS:
NOTE 10 - EQUITYFiscal liabilities
Initial allocation of the Fund
Payable tax liabilities - withheld from third party
Initial capital allocated unrealized
QG Investments Ltd.
Civil liabilities
Reserves and Funds
Creditors from the acquisition of goods and rights
Vacation and vacation bonus
Administrative and commercialliabilities
Other creditors
Retained earnings
Net results for the financial year
Social security contributions
Creditors from the acquisition of services
Funds for constitution and installationPersonnel - salaries and other remunerations
TotalTotal
2.165
5.000.000
2.165
-
5.000.000
223.144
515.345.000
238
3.650.000
23.163
356.309.350
223.144
-
515.345.000
238
(1.350.000)
5.000.000
23.163
(131.785.650)
488.095.000
719
45.798
1.285
45.798
34.253
(43.865)
3.339
(17.490)
74.107
4.720.354
145.696
4.470.755
3.530.422
(4.521.122)
306.926
(1.707.356)241
37.578 3.873.126 5.224 509.954
24.839 155 15.141
200
45.798
4.844.745 499.343.023 3.651.933 356.498.048
207
45.798
35.172
(157.188)
4.831
(26.375)
224 23.087 155 15.141
17 1.752 - -
20.614
4.720.354
19.028
4.470.755
3.625.143
(16.201.209)
471.650
(2.574.701)
2014
2014
tUSD
tUSD
tUSD
tUSD
tAOA
tAOA
tAOA
tAOA
2013 Pro-forma
2013 Pró-forma
As of 31 December, 2014, under “Other creditors” the amount of tUSD 15,927 concerning the first instalment of the agreement between the Fund and Benguela Development, SA was recorded.
(Note 6), net of withholding tax on the implementation of Law No. 7/97 of 10 October.
As of 31 December, 2014, was also recorded under this item the amount of tUSD 4,747 concerning the investment management fee applicable to the fourth quarter of 2014 under the agreement entered by the Fund and
As of 31 December, 2013, an amount of tUSD 1,350,000 of the initial allocation of the Fund’s capital was to realise, which on 31 December, 2013 was registered in the accounts in the form of a deduction from the total of the Fund’s equity under the heading ‘Unrealized Initial Capital”.
The amount of the initial allocation of capital that was unrealized as of 31 December, 2013 was carried out in three instalments.
The funding for constitution and installation of the Fund took place in two instalments. The first of these instalments was held on 16 July, 2012 (date of the Fund’s installation), for an amount of tUSD 36,350, while the second instalment was held on 7 August, 2013, for an amount of tUSD 9,448.
Quantum Global Investment Management AG on 29 November, 2013. As of 31 December, 2014, “Other creditors” balance also includes the amount of tUSD 12,333 (Note 15) relating to donations made by the Fund to the African Innovation Foundation to fund social projects, under the donation agreements entered between the Fund and that entity.
As of 31 December, 2013, was recorded under “Other creditors” the amount of tUSD 2,106 corresponding to pending payment consultancy projects expenses, whose services were provided by Quantum Global Capital Advisors AG and Stampa QG.
The first instalment, amounting to tUSD 500,000, was held on 19 May, 2014. The second instalment, also in the amount of tUSD 500,000, was held on 20 June, 2014, and the third instalment, amounting to tUSD 350,000, was held on 27 June, 2014.
The net profit for the financial year 2013, which amounted to tUSD 26,375, was transferred to the item “Retained earnings”.
As of 31 December, 2014, the balance of this item includes the amount of tUSD 103, to cover the Fund’s responsibility for “compensation for retirement”, following the provisions of Article No. 262 of the General Labour Law. Under the legislation that was in force as of 31 December,
PROVISIONS FOR POTENTIALLIABILITIES
According to the Presidential Decree No. 107/13, of 28 June, the Sovereign Wealth Fund of Angola is held solely by the Angolan Government, with a total initial capital allocation amount of tUSD 5,000,000.
As of 31 December, 2014 and 2013, this item is structured as follows:
2014, the responsibilities for “compensation for retirement” are determined by multiplying 25% of the basic monthly salary paid on the date the worker reaches the legal age of retirement by the number of years of service on the same date.
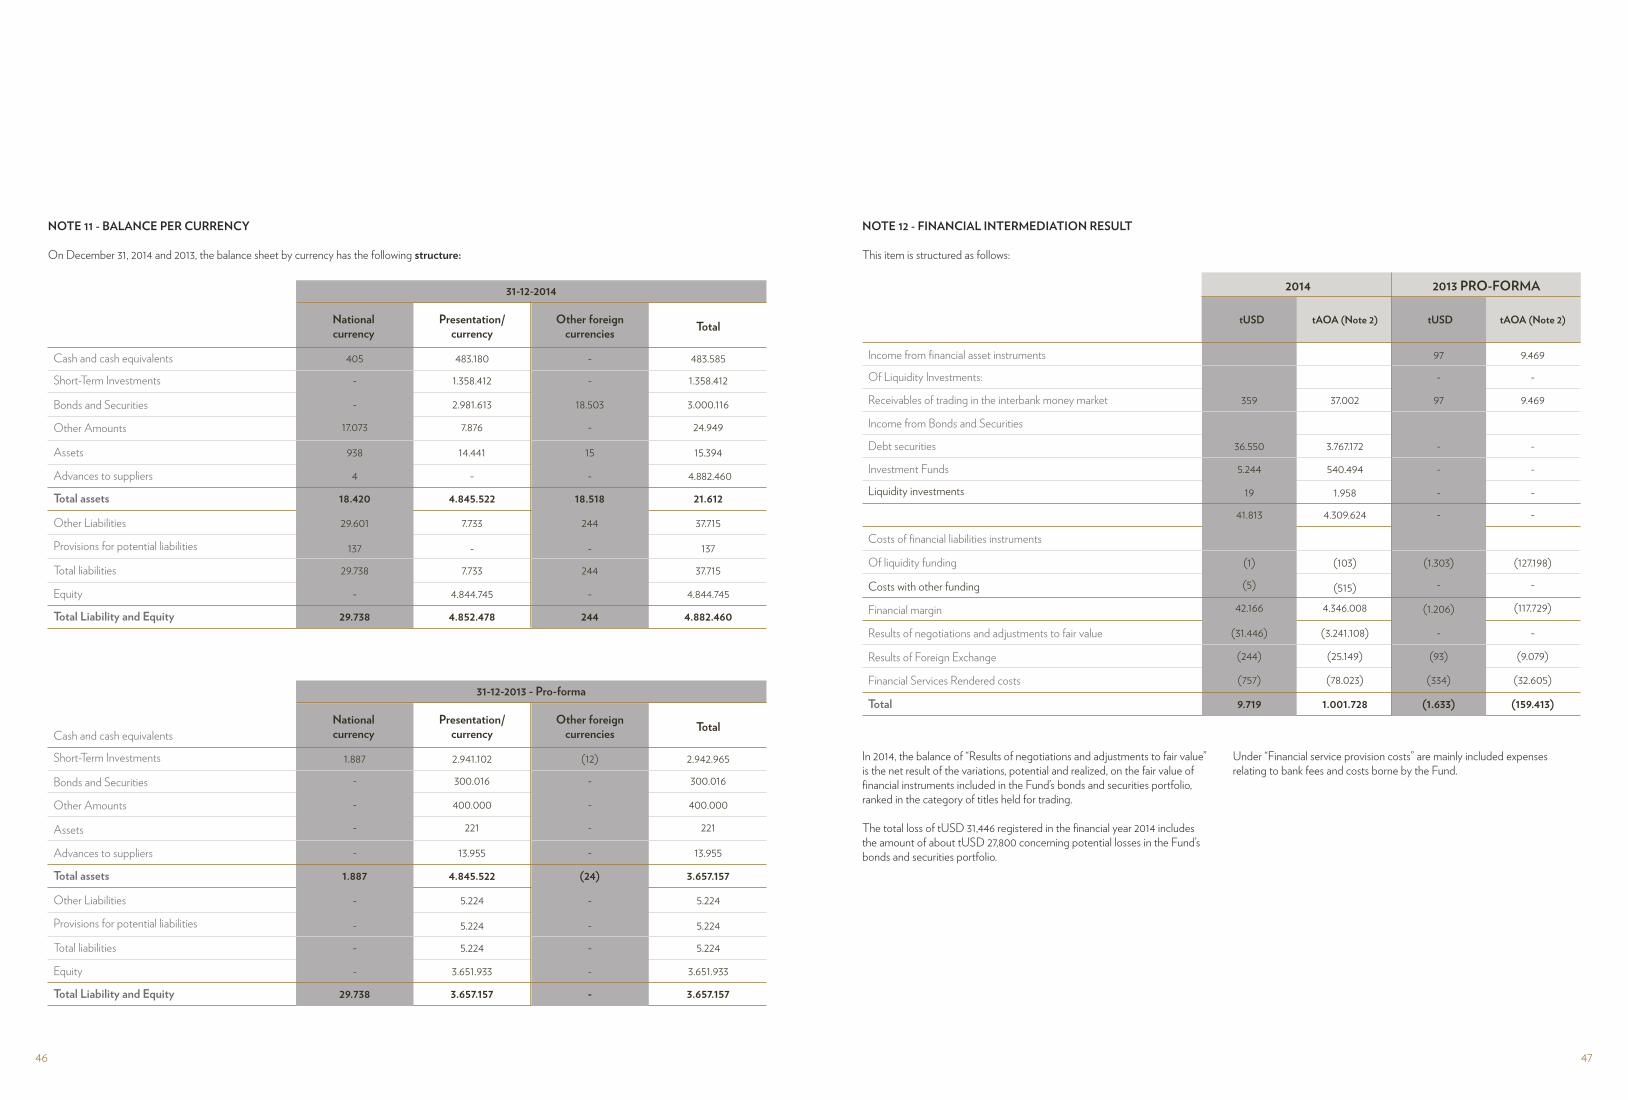
46 47
NOTE 11 - BALANCE PER CURRENCY
On December 31, 2014 and 2013, the balance sheet by currency has the following structure:
NOTE 12 - FINANCIAL INTERMEDIATION RESULT
This item is structured as follows:
Cash and cash equivalents
Cash and cash equivalents
Short-Term Investments
Short-Term Investments
Bonds and Securities
Bonds and Securities
Other Liabilities
Other Liabilities
Other Amounts
Other Amounts
Provisions for potential liabilities
Provisions for potential liabilities
Advances to suppliers
Advances to suppliers
Equity
Equity
Assets
Assets
Total liabilities
Total liabilities
Total assets
Total assets
Total Liability and Equity
Total Liability and Equity
-
-
-
-
405
1.887
2.981.613
400.000
1.358.412
300.016
483.180
2.941.102
18.503
-
15
-
-
-
-
(12)
3.000.116
400.000
1.358.412
300.016
483.585
2.942.965
17.073
-
29.601
-
7.733
5.224
244
-
37.715
5.224
938
-
137
-
-
5.224
-
-
137
5.224
29.738
-
7.733
5.224
244
-
37.715
5.224
-
-
4.844.745
3.651.933
-
-
4.844.745
3.651.933
29.738
29.738
4.852.478
3.657.157
244
-
4.882.460
3.657.157
7.876
221
14.441
13.955
-
-
24.949
221
15.394
13.955
18.420
1.887
4.845.522
4.845.522
18.518
(24)
21.612
3.657.157
4 - - 4.882.460
31-12-2014
31-12-2013 - Pro-forma
Nationalcurrency
Nationalcurrency
Other foreigncurrencies
Other foreigncurrencies
Presentation/currency
Presentation/currency
Total
Total
Of Liquidity Investments:
Income from financial asset instruments
Receivables of trading in the interbank money market
Income from Bonds and Securities
Debt securities
Investment Funds
Liquidity investments
Costs of financial liabilities instruments
Of liquidity funding
Costs with other funding
Financial margin
Results of Foreign Exchange
Total
Results of negotiations and adjustments to fair value
Financial Services Rendered costs
2014 2013 PRO-FORMA
tUSD tAOA (Note 2) tAOA (Note 2)tUSD
97 9.469
(1)
(515)
(1.303)
-
(127.198)
19 1.958 - -
- -
(5)
(1.206)
-
36.550 3.767.172 - -
41.813 4.309.624 - -
359 37.002 97 9.469
42.166 4.346.008
(31.446) (3.241.108) - -
(244) (25.149) (93) (9.079)
(757) (78.023) (334) (32.605)
9.719 1.001.728 (1.633) (159.413)
(117.729)
5.244 540.494 - -
(103)
In 2014, the balance of “Results of negotiations and adjustments to fair value” is the net result of the variations, potential and realized, on the fair value of financial instruments included in the Fund’s bonds and securities portfolio, ranked in the category of titles held for trading.
The total loss of tUSD 31,446 registered in the financial year 2014 includes the amount of about tUSD 27,800 concerning potential losses in the Fund’s bonds and securities portfolio.
Under “Financial service provision costs” are mainly included expenses relating to bank fees and costs borne by the Fund.

48 49
NOTE 13 - PERSONNEL COSTS
This item is structured as follows:
NOTE 14 - THIRD PARTY SUPPLIES
This item is structured as follows:
Salary
Consulting
Members of management body
Auditing, consulting and other specialized technical services
Training
Auditing
Mandatory social costs and others
Other specialized technical services
Members of supervisory body
Transport, logistics and accommodation
Salary
Rentals
Communications
Employees
Sundry materials
Salary
Insurance
Training
Security, Maintenance and Repair
Mandatory social costs and others
Publications. Advertising and PropagandaOther third party supplies
Total
Total
2014
2014
2013 PRO-FORMA
2013 PRO-FORMA
tUSD
tUSD
tAOA (Note 2)
tAOA (Note 2)
tAOA (Note 2)
tAOA (Note 2)
tUSD
tUSD
1.286
126
194
20.820
9.688
902
104
96
-
98
88.052
10.152
9.371
681
748
1.450
70.190
77.096
149.450
38
150
372
3.710
14.643
36.314
1.395
14.783
127
1.117
136.178
1.443.102
12.398
109.040
202
94
88
84
-
9.567
1.525
130.189
157.180
13.418.450
1.522
16.000
148.576
1.561.904
681
205
70.190
21.129
38
71
3.710
6.931
65
256
99
8.565
1.361
121.368
140.277
12.509.278
6.699
26.386
10.204
882.786
-
100
-
9.762
88
9
9.070
928
1.576
209
162.437
21.541
990
101
96.642
9.860
3.782
133.224
389.807
13.731.264
2.550
17.076
248.928
1.666.942
8.590
8.200
132.547
12.987
19.995
As provided for in Article 21 of Presidential Decree No. 48/11, of 9 March, the remuneration of the Board of Directors and the Supervisory Board of the Fund shall be fixed by executive decree of the Minister of Finance.
The balance of “Consulting” consists mostly of the costs of professional services rendered by third parties, among which stand out the realization of economic and financial feasibility studies on potential investment opportunities in sectors considered strategic by the Fund, but that were not considered to have fulfilled the conditions to be recorded under “intangible
assets”, the development and implementation of computer systems, the commissions associated with the management of the investment portfolio and the commissions associated with management agreements entered into by subsidiaries of the Fund.
Consulting:
QG Investments Africa Management Ltd.
QG Investments Ltd.
Tomé International AG
Quantum Global Investment Management AG
Uniqua Consulting GmbH
Total
Stampa QG
Others
19.419
28.750 2.963.233
2.001.497
17.000
26.385 2.719.476
1.752.173
5.812
4.083
19.919 2.053.031
599.037
420.831
121.368 12.509.278
2014
tUSD tAOA

50 51
The fees associated with the management agreements entered into by the Fund subsidiaries derive from services provided by QG Africa Investments Management Ltd. to QG African Infrastructure 1 LP and QG Africa Hotel LP. For services to QG African Infrastructure 1 LP, QG Investments Africa Management Ltd. is remunerated with an annual management fee equal to 2,0% of the total subscribed capital of QG African Infrastructure 1 LP. For services to QG Africa Hotel L.P., QG Investments Africa Management Ltd. is remunerated with an annual management fee equal to 2,5% of the total subscribed capital of QG Africa Hotel L.P.
NOTE 15 - OTHER COSTSAs of 31 December, 2014, the item “Other costs” mainly relates to donations made by the Fund to African Innovation Foundation, in a total of tUSD23,294, in order to finance social projects under the grant agreements between the Fund and that entity. Of that amount, as of 31 December, 2014 was still to be paid to the African Innovation Foundation the amount of tUSD 12,333 (Note 8). The grant agreements concluded between the parties anticipate conducting a total of 10 projects under the Social Impact Program for Angola, which will be coordinated by the African Innovation Foundation. Under the grant agreements between the parties, the African Innovation Foundation will provide the Fund semi-annual and annual progress reports on each of the projects to be developed.
NOTE 16 - NON-OPERATING INCOMEAs of 31 December, 2014, the balance of “Non-operating income” relates primarily to the settlement of customs duty for goods imported by the Fund in 2012 and in 2013 (tUSD 874).
NOTA 17 - RISK MANAGEMENTAccording to Article 10 of Presidential Decree No. 107/13, of 28 June, the Fund aims to hold a diversified portfolio of investments, and yet at an early stage, all the Fund investments should be made in assets with very low levels of risk, in a cash / liquidity management portfolio, not being allowed the use of financial leverage.
Over time, and in accordance with the desired asset allocation guidelines, the Fund may invest up to 55% of its investment portfolio into asset classes with higher expected returns and time horizon longer investment, being also allowed the use of financial leverage up to three times the amount of the Fund’s own capital. Also according to Article 10 of Presidential Decree No. 107/13, of 28 June, the assets of the Fund’s portfolio are subject in particular to the following risks:
Market RiskThe value of assets held by the Fund may vary due to numerous external factors. Such factors include, amongst others, changes in interest rates, the financial performance of specific companies in which the Fund holds
securities and an economic environment where deflation occurs. To manage market risk, the Fund uses the Value at Risk indicator ratio (Value at Risk - “VaR”) to estimate the maximum potential loss on the basis of a given time horizon and a given confidence interval. Since the measurement of value at risk applies only under normal market conditions, stress tests are performed which allow the assessment of the portfolios under extreme market conditions such as breakage and economic shocks, using retrospective and prospective scenarios.
In the case of equity investments, monitoring of market risk is done through the Value-of-Risk Program (B Va / R), which measures the risk generated by the difference between the composition of the theoretical portfolio and the portfolio composition the entity at a given date.
Credit riskThis is the risk that the issuers of the securities / bonds which may form part of the Fund’s portfolio do not meet their capital and interests payment obligations to their liabilities to the Fund. Any acquisition of private debt securities is subject to the rules defined and regulated, based on a single policy for the management of credit risk established or approved by the Board of Directors, taking into account the analysis of their own internal analysts, ratings issued by credit rating agencies or recommended by external investment managers.
Risk managementThis risk is based on the possibility that external appointed investment managers may not exceed or achieve the objectives that are assigned to them by the Board of Directors of the Fund. Continuous monitoring of the composition of the portfolios of external appointed investment managers must prevent unintended distortions that deviate from the desired investment strategy.
Interest Rate RiskChanges and economic policies may affect interest rates, which can cause large variations in asset prices of the Fund’s portfolio, with significant impact on their profitability.
Liquidity RiskThis is the risk that the Fund even in market stability situations, may not, if necessary, exercise the rescue of a large volume of units invested in a particular fund. In economic pressure times, this lack of liquidity may persist indefinitely. To reduce liquidity risk, substantial positions are held in fixed income securities issued by G3 members.
Legal risks and TaxesInvestments are dependent on contractual agreements and subject to different national regulations that can result on the one hand, on unexpected taxation of the Fund’s investments and, on the other hand, temporary
unavailability or loss of invested funds, because of the dispute, liquidation or unexpected foreign investment restrictions or prohibitions applicable to the activity of the Fund.
The appropriate structure of the Fund’s investments should strive to get the benefit of sovereign immunity for tax purposes in the jurisdiction where you invest and safeguard the rights and prerogatives of state entities.
Operational RiskOperational risk is the risk of loss resulting from inadequate or failed internal organization, processes, people and systems, including services from third party or entrusted to external service providers. Operational risk can be managed by the proper segregation of activities (amid investment activities, recording, settlement and communication), by the existence of internal regulations and processes to ensure flawless execution and by the preparation of accurate reports of the Fund’s activities. Operational risk can also be managed through the monitoring of investments, of risks and employees by an adequate system of decisions, opinions and controls, including the continuation of effective business plan.
Non Uniform Investment PerformanceThe risk of non uniform performance of investments has higher expression in the context of broader markets, including, for example, situations of return differences by activity sector, geographic region or type of securities.
Return UncertaintiesReturn uncertainties are associated with investments in real estate, private markets and opportunities in impaired assets.
Risk of using derivativesAlthough the use of derivatives market is limited to transactions which have as their sole purpose the coverage of the taken positions, the Fund is not completely free of the risks inherent in this market, as the prices of derivative contracts are not influenced only by prices in sight, but also by future expectations, which are beyond the manager’s control. Therefore, derivative transactions may cause losses to the Fund. Systemic RiskSystemic risk originates in changes in the economic environment and general policy, and these may affect all investments. By its nature, this risk can not be reduced by diversifying the investment policy of the Fund.
NOTE 18 - SUBSEQUENT EVENTSBetween 31 December 2014 and the date of approval of the financial statements, the Fund proceeded to the realization of capital subscribed in several of its subsidiaries for a total amount of tUSD 389,561. In this context, the following realizations of capital by the Fund were made (amounts expressed in thousands of the respective currency):
FSDEA Africa Investment (LP) Ltd.
FSDEA Hotel Investment (LP) Ltd.
FSDEA Africa Agriculture (LP) Ltd.
FSDEA Africa Mezzanine (LP) Ltd.
FSDEA Africa Healthcare (LP) Ltd.
Kijinga, S.A.
FSDEA Africa Mining (LP) Ltd.
USD 60 February 2015
Between February and March 2015
USD 60 January 2015
Between January and March 2015
Between January and March 2015
March 2015
January 2015
USD 50.500
USD 128.300
USD 85.900
USD 29.000
AOA 9.948.750
tUSDEntity tUSDtAOA

52 53

54
FUNDO SOBERANO DE ANGOLA Metrópolis, Ground Floor-Mezzanine217-221 Kwamne N’Krumah RoadCaixa Postal 6869 – LuandaRepublic of Angola
[email protected] Twitter: @FSDEAngolawww.fundosoberano.ao