annual report restored -...
TRANSCRIPT


AboutBook
this
This annual report presents research fi ndings and recommendations extracted from the 79 technical research reports published for TxDOT’s research program from September 1, 2009 through August 31, 2010. For any specifi c project, other reports may still be pending completion, or may have been published in a previous fi scal year.
Hard Copy – See the Table of Contents for a list of the reports published for each Research Management Committee (RMC). See page 6 for the focus areas under each RMC.
You may also scan the key words featured on each page to help locate reports of interest to you. A URL is included under the title of each report to help you locate a full text version on-line.
PDF – This version is fully searchable, and interactive. Clicking on an entry in the Table of Contents will take you to the summary of that report. Clicking on the URL on each summary page will take you to a full text version of the report on-line.
For related reports published in previous fi scal years, search the on-line catalog for TxDOT’s research library at: http://library.ctr.utexas.edu/dbtw-wpd/textbase/websearchcat.htm. TxDOT’s research library is operated by the Center for Transportation Research at The University of Texas at Austin.
How to use this book...
Where to fi nd additional reports...
1

TableContents
of
RMC Focus Areas ..................................................................................................................................6
RMC 1 Construction and Maintenance..........................................................................................7
0-1753-1 Performance of Continuously Reinforced Concrete Pavement Containing Recycled Concrete Aggregate.......................................................................................................8
0-1777-3 Tests of HMA Overlays Using Geosynthetics to Reduce Refl ection Cracking ............................9
0-4822-3 The Texas Perpetual Pavements: Experience Overview and the Way Forward............................10
0-5106-3 Laboratory and Field Evaluation of Concrete Paving Curing Effectiveness ................................11
0-5123-3 Mechanistic-Empirical Asphalt Overlay Thickness Design and Analysis System.......................12
0-5270-1 Seal Coat Damage Evaluation Due to Superheavy Load Moves Based on a Mechanistic-Empirical Approach..................................................................................................13
0-5445-3 Evaluation of MEPDG with TxDOT Rigid Pavement Database ..................................................14
0-5513-2 Development of the Texas Flexible Pavements Database.............................................................15
0-5549-2 Horizontal Cracking Mechanism in CRCP...................................................................................16
0-5569-1 Accelerated Stabilization Design of Subgrade Soils.....................................................................17
0-5597-2 Field and Laboratory Investigation of Warm Mix Asphalt in Texas .............................................18
0-5627-1 Predicting Asphalt Mixture Skid Resistance Based on Aggregate Characteristics.......................19
0-5635-1 Effective Prime Coats for Compacted Pavement Bases................................................................20
0-5798-2 Development, Calibration, and Validation of Performance Prediction Models for The Texas M-E Flexible Pavement Design System ......................................................................21
0-5836-1 Synthesis of Current Research on Permeable Friction Courses: Performance, Design, Construction, and Maintenance.................................................................22
0-6085-1 Considerations for Rigid Vs. Flexible Pavement Designs When Allowed as Alternate Bids: Technical Report ..................................................................................................23
0-6092-1 RAP Stockpile Management and Processing in Texas: State of the Practice and Proposed Guidelines...............................................................................................................24
0-6132-1 New Generation Mix-Designs: Laboratory Testing and Construction of the APT Test Sections .........................................................................................................................25
0-6388-1 Synthesis of Innovative Contracting Strategies for Routine and Preventive Maintenance Contracts..................................................................................................................26
2
RMC 2 Planning and Environment ................................................................................................27
0-5286-2 The Role of Preferential Treatment for Carpools in Managed Lanes ...........................................28
0-5335-1 Research Report: Guidance On Mitigating Impacts of Large Distribution Centers on Texas Highways ..........................................................................................................29
0-5517-1 Mechanical Properties of Tire Bales for Highway Applications...................................................30
0-5531-2 An Assessment of a Traffi c Monitoring System for a Major Traffi c Generator to Improve Regional Planning: Technical Report .........................................................................31
0-5534-2 Development of Decision-Making Support Tools for Early Right-of-Way Acquisitions .............32
0-5652-1 Transportation, Social and Economic Impacts of Light and Commuter Rail ...............................33
0-5711-1 Improving Accuracy In Household and External Travel Surveys ...............................................34
0-5748-1 Water Retention Techniques for Vegetation Establishment in TxDOT West Texas Districts ......................................................................................................................35
0-5881-1 Quantifying the Effects of Network Improvement Actions on the Value of New and Existing Toll Road Projects ...........................................................................................36
0-5930-1 Potential Development of an Intercity Passenger Transit System in Texas – Report on Tasks 1-5.......................................................................................................................37
0-5930-2 Potential Development of an Intercity Passenger Transit System in Texas – Final Report...................................................................................................................................38
0-5948-1 Roadside Sediment Control Device Evaluation Program: Technical Report................................39
0-5949-2 Bioretention for Stormwater Quality Improvement in Texas: Pilot Experiments.........................40
0-5955-2 Characterization of In-Use Emissions from TxDOT’s Non-Road Equipment Fleet - Final Report...................................................................................................................................41
0-5973-2 Emerging Trade Corridors and Texas Transportation Planning ....................................................42
0-5974-1 Estimating Texas Motor Vehicle Operating Costs ........................................................................43
0-5985-1 An Evaluation of Mexican Transportation Planning, Finance, Implementation, and Construction Processes...........................................................................................................44
0-6044-1 Actual Vs. Forecasted Toll Usage: A Case Study Review ............................................................45
0-6065-1 Integration of Utility and Environmental Activities in the Project Development Process ...........46
0-6095-1 Potential Use of Longer Combination Vehicles in Texas: First Year Report ................................47
0-6194-1 Quantifying the Purchasing Power of Public Transportation in Texas: Technical Report ............48
0-6208-1 Preserving the Functionality/Asset Value of the State Highway System: Technical Report ...........................................................................................................................49
0-6210-1 Tour-Based Model Development for TxDOT: Implementation Steps for the Tour-Based Model Design Option and the Data Needs ................................................................50
0-6210-2 Tour-Based Model Development for TxDOT: Evaluation and Transition Steps ..........................51
0-6225-1 Analysis and Recommendations on Protecting Waterways from Encroachment .........................52
0-6608-2 Integrating the Transportation System With a University Campus Transportation Master Plan: A Case Study....................................................................................53
0-6608-3 Integrating the Transportation System with a University Transportation Master Plan: Best Practices and Lessons Learned ....................................................................................54
3

RMC 4 Safety and Operations ..........................................................................................................55
0-4703-7 Development of Safety Performance Monitoring Procedures ......................................................56
0-5210-5 Crash Testing and Evaluation of TxDOT Burn Ban Signs ...........................................................57
0-5210-7 NCHRP Report 350 Crash Testing and Evaluation of the S-Square® Mailbox System ..............58
0-5446-3 Driver Comprehension of Managed Lane Signing .......................................................................59
0-5485-1 Evaluating and Improving Incident Management Using Historical Incident Data: Case Studies at Texas Transportation Management Centers ...............................................60
0-5578-1 Assessment and Validations of Managed Lanes Weaving and Access Guidelines .......................61
0-5609-1 Performance Evaluation of Cable Median Barrier Systems in Texas ...........................................62
0-5619-1 Capacity and Road User Cost Analysis of Selected Freeway Work Zones in Texas ....................63
0-5860-1 Guidelines for Spacing Between Freeway Ramps ........................................................................64
0-5862-1 Evaluation of Potential Benefi ts of Wider and Brighter Edge Line Pavement Markings.............65
0-5865-1 Arterial Intelligent Transportation Systems—Infrastructure Elements and Traveler Information Requirements ..............................................................................................66
0-5890-1 Guidelines for the Use of Pavement Marking Symbols at Freeway Interchanges: Final Report ............................................................................................................67
0-5911-1 Driver Workload at Higher Speeds ...............................................................................................68
0-5913-1 Speed Harmonization and Peak-period Shoulder Use to Manage Urban Freeway Congestion...........................................................................................................69
0-5942-1 Development of a Video Over IP Guidebook ...............................................................................70
0-6029-1 Improved Intersection Operations During Detector Failures........................................................71
0-6071-1 Analysis of Roadside Safety Devices for use on Very High-Speed Roadways ............................72
0-6071-2 Evaluation of Barriers for Very High-Speed Roadways ...............................................................73
0-6176-1 Guidelines for Signal Operations at Intersections With Wide Medians........................................74
RMC 5 Structures and Hydraulics..................................................................................................75
0-2116-4A Effects of Wet Mat Curing Time and Earlier Loading on Long-Term Durability of Bridge Decks: Compressive Strength, Maturity and Strength Durability Index (SDI) ............76
0-2116-4B Effects of Wet Mat Curing Time and Earlier Loading on Long-Term Durability of Bridge Decks: Fracture, Flexural Strength and Shrinkage .......................................................77
0-4586-3 Full-Scale Controlled Tests of Wind Loads on Traffi c Signal Structures .....................................78
0-4588-1 Effect of Voids in Grouted, Post-Tensioned Concrete Bridge Construction: Volume 1 – Electrochemical Testing and Reliability Assessment ................................................79
0-4588-1 Effect of Voids in Grouted, Post-Tensioned Concrete Bridge Construction: Volume 2 – Inspection, Repair, Materials, and Risks....................................................................80
0-4588-2 Effect of Voids in Grouted Post-Tensioned Concrete Bridge Construction: Inspection and Repair Manual for External Tendons in Segmental, Post-Tensioned Bridges .......................81
0-4825-1 Corrosion Performance Tests for Reinforcing Steel in Concrete: Technical Report ....................82
0-5197-01-1 Aggregate Distribution Investigation in Box Beams Fabricated with Self Consolidating Concrete.................................................................................................................83
4

0-5505-1 Simplifi ed Method for Estimating Scour at Bridges .....................................................................84
0-5706-1 Impact of Overhang Construction on Girder Design ....................................................................85
0-5834-1 Study of Elastomeric Bearings for Superelevated U-Beam Bridges ............................................86
0-6063-1 Site Specifi c Wave Parameters for Texas Coastal Bridges: Final Report .....................................87
0-6069-1 Long-Term Performance of GFRP Reinforcement: Technical Report..........................................88
9-4973-1 Analysis of Large Truck Collisions With Bridge Piers: Phase 1. Report of Guidelines for Designing Bridge Piers and Abutments for Vehicle Collisions...............................................89
5

RMC 1 - Construction and Maintenance• Construction Materials • Construction Operations • Construction Contracting • Maintenance Materials • Maintenance Operations • Maintenance Contracting • Pavement Design • Pavement Management • Vegetation Management
RMC 2 - Planning and Environment• Aviation System Planning • Environmental Affairs Management • Hazardous Materials • Multi-modal & Inter-modal Freight
Planning • Ports & Waterways Planning • Public Transportation • Railway Planning • Right of Way Planning, Acquisition &
Management • Roadway Planning • Statewide, Regional & Local
Transportation System Planning • Traffi c Data Collection
RMC 4 - Safety and Operations• Geometric Design• Illumination • Pavement Marking • Railroad Crossing Safety • Roadside Safety • Roadway Signing & Delineation • Traffi c Control Devices
• Work Zone SafetyRMC 5 - Structures and Hydraulics• Bridge Rails & Transitions • Geotechnical Issues • High Mast Illumination Poles • Hydraulics & Hydrology • Overhead Sign Bridges • Structures Construction &
Maintenance • Structures Design & Analysis • Structures Management • Structures Materials
Research Management Committee Focus Areas
6

Construction and Maintenance
RMC 1results
RMC 1 - Construction and MaintenanceFocus Areas• Construction Materials • Construction Operations • Construction Contracting • Maintenance Materials • Maintenance Operations • Maintenance Contracting • Pavement Design • Pavement Management • Vegetation Management
7

Recycled concrete aggregate properties Recycled coarse aggregates (RCA) have lower specifi c gravity, higher water absorption, Los Angeles (LA) abrasion loss, thermal coeffi cient, and sulfate soundness loss compared with those of virgin aggregates.
Recycled fi ne aggregates have lower specifi c gravity and higher water absorption than virgin siliceous sand.
The amount of old mortar attached to virgin aggregate is about 30 % by volume of total recycled coarse aggregate.
Freeze-thaw of RCA is comparable to that of lightweight aggregates.
Alkali-silica reaction (ASR) potential of this specifi c coarse recycled aggregate as evaluated by ASTM C1260 is less than the limit (0.1 %).
Recycled fi ne aggregates are more angular than virgin siliceous river sand as evaluated by the National Aggregate Association method.
In-situ properties of concrete containing 100 % recycled coarse and fi ne aggregatesCompressive and indirect tensile strengths are lower than that of concrete with virgin aggregates.
Modulus of elasticity is much lower than that of concrete with virgin aggregates.
Coeffi cient of thermal expansion is comparable to that of concrete with virgin aggregates.
Chloride content is higher than that in the concrete with virgin aggregates.
Sulfate content is comparable to that in concrete with virgin aggregates.
Density is lower and water absorption is higher than those of concrete with virgin aggregates.
Permeability is classifi ed as “very low” according to ASTM C 1202.
Ettringite deposits were found in the air voids in the old mortar of recycled coarse aggregates; however, these ettringite deposits do not seem to cause any damage to the surrounding concrete.
Concrete mixing and paving operations Moisture control of recycled aggregate, especially fi ne aggregate, is critical in producing consistent and workable concrete mixes.
No signifi cant adjustment is necessary in paving operations due to the use of 100 % recycled coarse and fi ne aggregate in concrete.
Performance of CRCP with 100 % recycled aggregatesThe pavement has performed well. No distresses, including spalling, wide cracks, and punchouts have taken place.
The transverse crack spacing distributions are comparable to those in concrete with virgin limestone.
Low modulus of concrete and good bond between recycled coarse aggregate and new mortar appear to be the key ingredient of good pavement performance.
The large amount of old mortar in recycled coarse aggregate does not appear to have an adverse effect on CRCP performance.
0-1753-1Performance of Continuously Reinforced Concrete Pavement Containing Recycled Concrete Aggregatehttp://library.ctr.utexas.edu/pdf02/1753-1.pdf
Key Words:Recycled concrete aggregate (RCA), CRCP, pavement performance, spalling
8

0-1777-3Tests of HMA Overlays Using Geosynthetics to Reduce Refl ection Crackinghttp://tti.tamu.edu/documents/0-1777-3.pdf
Key Words:Refl ective Cracking, Geosynthetic, Geotextile, Fabric, Grid, Composite, Asphalt Overlay, FPS-19
The fi ndings of this project and the literature review of other recent fi eld evaluations of geosynthetic products show that their effectiveness in reducing the number of refl ective cracks is marginal. The literature review indicated that certain geosynthetic products can, however, reduce the severity of refl ective cracks that appear.
Specimens of two sizes containing geosynthetics were tested using the small overlay tester. Both specimen sizes always exhibited failure due to separation at the geosynthetic interlayer. Occasionally, specimens tested using the large overlay tester exhibited a similar failure mechanism. This failure mechanism negated the utility of those data in analyses of refl ection cracking in pavements and in calibration or validation of the FPS-19 Design Check.
The Design Check for FPS-19 was developed based on the development of mediumseverity refl ection cracks. Since hardly any medium-severity cracks developed in any of the test pavements, the resulting data were unsuitable for calibration or validation of the Design Check for FPS-19.
Using fi eld performance data, researchers computed the relative life ratio for various products used on test sections in Amarillo, Waco, and Pharr. On average, when a geosynthetic product was used, these calculated values showed signifi cant reduction in refl ection cracking in Waco on concrete pavement and marginal improvement in Amarillo on the pavement. These computations involved extrapolations and should, therefore, be viewed with caution. Since very little cracking occurred on the Pharr test pavements, the data could not be used to determine relative life ratio.
The small overlay tester appears inappropriate for evaluating specimens containing a geosynthetic interlayer.
Based on this project and several previous projects, the large overlay tester provides a valuable tool for evaluating the cracking potential of composite beam specimens. However, one should expect specimens to occasionally separate at the interlayer when testing certain geosynthetic products.
Usually, for the fi rst couple of years, geosynthetic products perform somewhat better than the control section; but as the overlay gets older, the difference diminishes.
The test pavements in the Amarillo and Waco Districts are, potentially, very valuable resources for TxDOT. Their performance should be monitored for a few more years (or throughout the life cycle of the overlay) to determine the relative value of the products installed to reduce refl ective cracking. This will be a relatively inexpensive exercise that could provide very valuable information.
The Design Check Refl ection Cracking Program in the FS-19W Program predicts the time when the medium level of severity of refl ection cracking appears at the surface of the pavement. It is recommended that the extrapolated values for relative life ratio should not be used as a basis for calibrating computer programs for the design of overlays to resist refl ection cracking.
Further research should be conducted including a set of new test sections with known and clear refl ective cracking history. The proposed test sections should be constructed using more popular and relatively good performing geosynthetic products. This study should be performed for a more in-depth analysis of these materials and to verify their usefulness and cost effectiveness. This type of study requires monitoring for a signifi cantly longer period.
9

0-4822-3The Texas Perpetual Pavements: Experience Overview and The Way Forwardhttp://tti.tamu.edu/documents/0-4822-3.pdf
Key Words:Perpetual Pavement, Stone-Filled HMA, Hamburg, Rutting, Permanent Deformation, Overlay, Cracking, Modulus, Infra-Red, X-ray CT, IRI, GPR, FWD, WIM, MDD, FPS, PerRoad, VESYS, MEPDG
Field performance of all the Texas Perpetual Pavement (PP) sections was satisfactory with no structural defects. However, the majority of these PP sections have been in service less than 5 years. Therefore long-term performance monitoring is strongly recommended to verify the fi ndings. Monitoring at 2-3 year intervals is recommended (rut, ride, defl ection, ground penetrating radar (GPR), visual).
Numerous construction problems (such as density variations, localized voiding, vertical segregation, and permeability issues) were associated with the existing PP structures, primarily due to the poor workability and compactability characteristics of the coarsegraded stone-fi lled HMA (SFHMA) mixes. These problems highlighted the need for improved construction methods and adoption of increased frequency/tightening of the QC/QA test protocols. Recommendations such as improving the compaction rolling patterns, increased frequency/enforcement of joint compaction specs and joint staggering provisions, eliminating trench construction (where possible), and optimizing the compaction lift-thickness were made in the report.
Laboratory testing and material property characterization, together with the back-calculated falling weight defl ectometer (FWD) moduli values, indicated that the PP structures were substantially stiffer (with high modulus values) and fairly non-temperature susceptible as compared to thinner HMA structures. Both the base and the subgrade were also found to have suffi cient strength and have not shown moisture susceptibility. Furthermore, the results showed that the use of lower moduli values in the initial designs is what contributed to the conservative nature of the currently existing PP structures. Use of more optimal moduli values in future Texas PP designs is recommened.
Weigh-in-motion (WIM) traffi c measurements on two selected PP sections indicated that the initial traffi c loading projections were fairly consistent with projections based on actual traffi c loading on the highways. Therefore, it was concluded that the initial traffi c design estimates were valid and did not contribute signifi cantly to the conservatism in the current PP designs. Use of lower moduli values in the initial designs was the primary contributor.
The Flexible Pavement System (FPS) and Mechanistic Empirical Design Guide (MEPDG) are the suitable software for modeling Texas PP structures. Use of these softwares in future Texas PP structural designs for layer thickness determination, M-E strain analyses, and performance predictions is recommended.
Both fi eld multi-depth defl ectometer (MDD) measurements and computational strain analyses have indicated that the current Texas PP design concept is conservatively valid, with potential for further optimization. Further computational analyses indicated the possible transitioning to an optimal PP structure in the range of 12 to 14 inches total HMA thickness which allows for at least 6-inch HMA cost-savings compared to the current design concept. This possible transitioning was successfully validated with the PP section at the National Center for Asphalt Technology (NCAT) (Alabama) that had 14 inches total HMA and exhibited satisfactory fi eld performance with no structural distresses after 10 million equivalent single access loads (ESALs) of accelerated pavement testing (APT) traffi cking.
Three structural design proposals based on three levels of traffi c categorization were proposed and analytically validated using the FPS and MEPDG software. These analyses resulted in a PP structure with a minimum thickness of 12 inches total HMA and a 6-inch base. In addition, a switch to mixtures with more dense-graded characteristics as opposed to the coarse-graded stone-fi lled HMA mixes was recommended for the main structural load bearing layers. This recommendation was necessitated by the need to circumvent the constructability problems associated with the stone-fi lled HMA mixes.
IR thermal imaging and GPR measurements (supplemented with coring) were successfully utilized for HMA mat temperature measurements, layer thickness and compaction density measurements, and detection of subsurface anomalies such as density variations, localized voiding, vertical segregation, debonding, and moisture presence.
Visual defects such as open joints (longitudinal and transverse) and longitudinal cracking were observed on some projects.
It is strongly recommended, as a minimum, that performance monitoring with GPR measurements be conducted yearly to ensure that the surface HMA layers remain impermeable so as to minimize moisture ingress into the subsurface layers.
10

0-5106-3Laboratory and Field Evaluation of Concrete Paving Curing Effectivenesshttp://tti.tamu.edu/documents/0-5106-3.pdf
Key Words:Curing Evaluation Method, Portland Cement Concrete Pavement, Moisture, Physical Properties
Obtaining uniformity of the application of the curing membrane. This is best achieved using the automatic spraying equipment that follows behind the paving train. Manual spraying can also achieve similar if not better uniformity; however the spray equipment needs to be suffi ciently pressurized to vaporize the curing compound to form a fi nely divided mist ensuring even distribution of the compound.
Use of multiple, delayed applications of curing compound. Although the fi ndings from the fi eld testing were inclusive (perhaps because of the method of placement), the application of at least one delayed or additional coat of curing compound anywhere from a half to a full day after placement of the concrete appears to improve the quality of curing. Future implementation efforts should further validate this aspect of curing with consideration to application rates and type of curing compound.
Selecting the rate of application as a function of the prevailing potential evaporation (PE) conditions. There is no compelling justifi cation to assume the ASTM C156 application rate should yield adequate curing under fi eld conditions. PE will vary from day to day as well as from morning to afternoon but adjustment of the rate of application should be a practical matter for the paving contractor to address based on expected weather conditions. Again, the details and the management of such adjustments should be the focus of future implementation efforts.
Use of higher quality curing compounds with an evaluation index (EI) of 0.3 or greater. Higher quality curing compounds are more diffi cult to place due to their greater viscosity but their use would involve fewer or lower rates of application at the same quality of curing. The use of such compounds could be predicated upon threshold seasonal increases in PE during the construction period or by not using compound EIs less than 0.3 for PEs greater than 0.4 lb/ft2/hr.
Sample Cured with High Wind Speed
Sample Cured with No Wind
Sealed Specimen
Sample Cured withMedium Wind Speed
11

For simplicity and practical routine applications, the well-known Paris’ law-based fracture mechanics model is still a rational choice to model refl ective cracking induced by both traffi c loading (bending and shearing) and thermal effects. This was the basis of the M-E models proposed in this study for modelling refl ective crackingin HMA overlays.
Based on extensive stress intensity factor (SIF) computations and statistical analysis, a total of 32 SIF regression equations were developed for asphalt overlays over existing fl exible pavements and asphalt overlays over existing PCC pavements with three levels of load transfers effi ciencies (10, 50, and 90 percent) at joints/cracks. These developed equations make it possible and practical to directly analyze the refl ective crack propagation caused by equivalent single access loads (ESALs) or variable traffi c load spectrum. It was also found that the MET approach is valid for multi-layered asphalt overlays and bases (and/or subbases).
For the thermal refl ective cracking, a “hybrid” approach, similar to the SHRP low temperature cracking model, was proposed. Regression equations were accordingly developed for asphalt overlays over existing fl exible pavements and asphalt overlays over existing PCC pavements.
The HMA fracture properties (A and n), which are some of the fundamental input parameters required in the proposed M-E refl ective cracking model, can be easily and directly determined in the laboratory using the simple and rapid OT test.
The proposed refl ective cracking model was preliminarily calibrated using three HMA overlay fi eld case studies, and the calibrated model has been verifi ed using the refl ective cracking data of six asphalt overlay sections collected from California’s Heavy Vehicle Simulator (HVS) test site. Thus far, satisfactory results have been obtained.
After reviewing existing rutting models in the literature, it was found that the wellknown VESYS layer rutting model is still a rational choice to model HMA overlay rutting development.
The proposed HMA overlay rutting model was preliminarily calibrated using 11 test sections of the NCAT Test Track 2006, and the calibrated model was further verifi ed using the rutting data of 3 test sections of the NCAT Test Track 2000. Thus far, satisfactory results have been obtained.
Both calibrated refl ective cracking and rutting models have been integrated into an asphalt overlay thickness design and analysis system and associated software.
The sensitivity analysis conducted on the asphalt overlay thickness design and analysis software indicated that not all of the input parameters have signifi cant infl uence on the asphalt overlay performance in terms of the refl ective cracking and rutting.
Overall, the M-E refl ective cracking and rutting models developed in this study offer great promise for rationally modelling and accurately predicting the refl ective cracking and rutting of asphalt overlays. The asphalt overlay thickness design and analysis program is user-friendly and available to TxDOT pavement engineers, and its prediction is rational and reasonable. Therefore, researchers recommend the use of this program to design asphalt overlays for state-wide pilot implementation, follow ups on the performance of these overlays, and fi nally further calibration/refi nement of the refl ective cracking and rutting models used in the program.
0-5123-3Mechanistic-Empirical Asphalt Overlay Thickness Design and Analysis Systemhttp://tti.tamu.edu/documents/0-5123-3.pdf
Key Words:Refl ective Cracking, Rutting, Stress Intensity Factor, Overlay Test, Repeated Load Test, Asphalt Overlay Design
12
0-5270-1Seal Coat Damage Evaluation Due to Superheavy Load Moves Based on a Mechanistic-Empirical Approachhttp://tti.tamu.edu/documents/0-5270-1.pdf
Key Words:Superheavy Load, Seal Coat, Tensile Strength, Surface Energy, Pavement Surface Temperature, Slope, Curing Period, Wheel Force
The Texas Department of Transportation (TxDOT) has become increasingly aware of the fresh seal coat peel-off damage caused from super-heavy load (SHL) moves. The fi eld monitoring conducted by department personnel over recent periods has led to a tentative recommendation that fresh seal coats less than 5 weeks old should be avoided for super-heavy load routing. However, case studies revealed that the seal coat damage is also associated with temperature, slope, materials, and wheel loads. The main goals of this research project were to:propose a mechanistic approach to assess seal coat damage potential taking into account the factors aboveprepare a guideline for use of this approach to regulate SHL moves on seal coated routes.
The research team proposed a mechanistic approach to evaluate seal coat damage accounting for pavement surface temperature, curing period, pavement slope, seal coat material properties, and wheel load. Laboratory tests characterized seal coat binders and aggregates in terms of surface energy, temperature-viscosity relationship, gradation, and volumetric properties. The tests provided inputs for estimating tensile strength of seal coat mixtures. Laboratory tests successfully characterized typical seal coat binders and aggregates that are used in Texas in order to compute tensile strength of various mixture combinations.
The research team conducted fi eld tests to validate the proposed mechanistic model on roadways in the Bryan and San Antonio districts. This fi eld testing was accomplished by using test trucks equipped with wheel force transducer systems and operating those trucks on roadways at various temperatures, curing periods, slopes, and material types. A sand patch test was used to examine the relationship between surface texture condition and seal coat damage extent.
The mechanistic approach conceptualized interaction between wheel loads and seal coats. It requires two main force terms. One term is the “fracture pressure” that acts as an applied force; the other term is “tensile strength” within the seal coat that is regarded as a resistance force. When the fracture pressure exceeds tensile strength, seal coat damage tends to occur.
Recognizing the diffi culty in conducting tests to obtain the tensile strength of seal coat mixtures, the research team instead employed a formula based on fracture mechanics capable of estimating tensile strength in terms of surface energy and relaxation modulus properties. In addition, a global aging model that was incorporated into the mechanistic approach was used to simulate variation of tensile strength with respect to time and temperature changes. Field tests conducted in the Bryan and San Antonio districts revealed that seal coat damage is most highly associated with pavement surface temperature. Curing period, slope, and material types also infl uenced seal coat behavior in response to test truck loading. The sand patch testing results indicated that lower texture depth appears to result in improved performance.
Field tests provided an opportunity to calibrate the mechanistic approach. The calibrated mechanistic approach was used to analyze several case studies conducted by TxDOT, and the model captured seal coat failure damage potential reasonably well. The research team developed a database integrating routing inspection sheets that have been collected by TxDOT in the past 5 years for pavement evaluation in routing SHLs. Statistical analyses on the database indicated that establishing a logical guideline for SHL on seal coats should be encouraged, since the portion of routes including seal coat and travel distances less than 50 miles were close to half of the considered routes.
13
0-5445-3Evaluation of MEPDG with TxDOT Rigid Pavement Databasehttp://www.utexas.edu/research/ctr/pdf_reports/0_5445_3.pdf
Key Words:cracking, CRCP, punchout, MEPDG
Review of the punchout model in Mechanistic-Empirical Pavement Design Guide (MEPDG) - The punchout model in MEPDG is quite sophisticated, with a number of variables involved. It assumes that longitudinal crack is induced by top-down cracking. The model is more applicable to continuously reinforced concrete pavement (CRCP) with an asphalt shoulder. On the other hand, the model might not be appropriate for the punchout analysis of CRCP with tied-concrete shoulder. Sensitivity analyses were conducted to investigate the effects of selected input variables on punchouts. Zero-stress temperature (ZST) had quite a large effect, primarily because crack width and load transfer effi ciency (LTE) depend to a large extent on ZST.
There are three equations that can be calibrated using local information: (1) concrete fatigue, (2) damage-punchout transfer function, and (3) crack width. There are a total of six constants for these three equations. A number of CRCP sections with punchouts and accurate input values available are needed for calibration. The MEPDG equation for crack width tends to over-predict crack width. Appropriate calibration constants need to be determined.
Calibration of MEPDG Using Punchout Information - US 287 in the Wichita Falls District was selected to compare the punchouts in actual CRCP with the predictions from MEPDG. The pavement section was selected because of it’s age (built in 1970), its substantial truck traffi c and because it has an asphalt shoulder. Two punchouts were observed in a 1.6-mile section, equivalent to 1.3 punchouts per mile. Efforts were made to determine reasonable values for major input variables. To determine ZST, actual crack spacing was compared with predicted values. The construction in March 1970 provided the closest average crack spacing to the actual value.
The punchout estimate from MEPDG analysis with national calibration constants was 42.8 per mile. This value is much larger than the actual observed punchout. Efforts were made to identify the cause for this large discrepancy. Because the MEPDG over-predicts crack width, smaller values for the calibration constant for crack width were used. If the value of 0.5 or less, the number of punchouts decreases to about 5. This value is still larger than the actual value, but much closer than the value with the national calibration constant for crack width.
Punchout prediction is not quite sensitive to the national calibration constants for the damage-punchout transfer function. For the CRCP section under evaluation, 10% deviation from the national constant resulted in 2 punchouts per mile. Further efforts need to be made to collect more extensive punchout information.
CRCP Distresses in Texas - It appears that many distresses identifi ed and recorded as punchouts in Texas are not actually punchouts caused by structural defi ciency. Rather, most of them are due to imperfections in design details and/or construction/materials quality issues.
Transverse fatigue cracking that forms from the pavement edge was observed, which implies that the critical stress is in a longitudinal direction unless erosion and pumping exist. Horizontal cracking appears to be the major cause for distresses in CRCP in Texas. The interaction between longitudinal steel and concrete in response to dynamic wheel loading applications appears to be the cause of horizontal cracking.
It is recommended that efforts should be made to accurately identify punchout during fi eld evaluations. At this point, the punchout information in TxDOT’s PMIS doesn’t appear to be accurate. It is also recommended that the punchout portion of the Rater’s Manual be revised.
14

0-5513-2Development of the Texas Flexible Pavements Databasehttp://www.utexas.edu/research/ctr/pdf_reports/0_5513_2.pdf
Key Words:Pavement Management Information System, Mechanistic-Empirical Pavement Design, Long Term Pavement Performance, Pavement Design
The development of the Texas Flexible Pavements Database (TFPD) proved to be quite challenging in several aspects. The fi rst challenge was to decide on the platform that would be most suitable for this project. After interaction with TxDOT personnel, adequate review of TxDOT standards, and consideration of the volume of data to be handled, it was decided that Microsoft SQL Server 2000 would be the most suitable. In an effort to cater to TxDOT’s Microsoft-oriented business architecture, the programming platform chosen was ASP (Active Server Pages) which can be hosted on any Windows NT 4.0 and upwards server with the IIS (Internet Information Services) up and running.
This database provides dynamic information that can be used for various prediction and interpretation exercises.For example, the research team was able to derive a number of important observations while calibrating the permanent deformation performance models in the Mechanistic-Empirical Pavement Design Guide (MEPDG). One observation showed a high rate of initial rut followed by a slow rate of rut over time for every region in the Long Term Pavement Performance LTPP dataset.
The ability to tie together all relevant information needed for pavement design, at a project level, makes the TFPD unique and the fi rst of its kind. In addition, because it is available online the database is totally portable for any internet user around the world. The database provides all of the key information for each pavement section, which can be downloaded or used to run a pavement design on the newly developed MEPDG. Finally, the interim calibration factors estimated as part of this study can be safely used for Texas regions and locations instead of using national coeffi cients, thus providing a higher level of accuracy and reliability.
Based on the results obtained from this study, it is strongly recommended that TxDOT continues to monitor the sections contained in the TFPD on an annual basis for at least the next ten years. The performance monitoring should consist of collecting roughness, rutting and cracking data by means of automated systems to avoid human interpretation and subjectivity.
In addition, as new materials become popular in the state of Texas [such as warm-mix asphalt (WMA) and the increased use of recycled asphalt pavements (RAP)] the original experimental design should be periodically reviewed and new sections should be incorporated accordingly.
One of the shortcomings of the current TFPD is the lack of a representative number of sections in North Texas (Panhandle region) and in East Texas. The continuation of the database effort should look into this. As the database starts becoming more popular in the state, more extensive and intensive interaction and cooperation with the districts are expected.
As already suggested, the calibration methodologies that have been developed should be carried forward and applied to new data as they become available. This will increase confi dence in the results and produce more reliable calibration factors and, in general, more robust pavement performance models.
At the same time, a few more enhancements should also be targeted on the database side. Some of them could include site-specifi c data on traffi c and materials, an interface for users to run user-specifi ed queries, a feature that allows users to download raw data and, in general, anything else that could facilitate the implementation of mechanistic-empirical design principles in Texas.
If the use and interest in the TFPD could be seen as a measure of success of the project, the TFPD is already a success. Even before it has been offi cially completed and launched, there are more than 30 registered users. The list of users includes TxDOT personnel from the divisions and districts, researchers from The University of Texas, Texas A&M University, the University of New Mexico, and users from the private sector: Dynatest Consulting, The Transtec Group, and Pavetex Engineering and Testing.
15

0-5549-2Horizontal Cracking Mechanism in CRCPhttp://www.utexas.edu/research/ctr/pdf_reports/0_5549_2.pdf
Identifi cation of Horizontal Cracking MechanismBecause horizontal cracks result from restraining concrete volume changes near steel, concrete with a higher coeffi cient of thermal expansion (CTE) will be more likely to induce horizontal cracks in continuously reinforced concrete pavement (CRCP). A higher elastic modulus of concrete also increases the risk of horizontal cracking. Numerical analysis results imply that the bond-slip condition of steel and the depth of the transverse crack signifi cantly affect the development of concrete stress. Two-mat placement of longitudinal steel may relieve the risk of horizontal cracking in CRCP.
Longitudinal steel plays a signifi cant role in the development of horizontal cracks in CRCP. Concrete volume changes due to the variations of temperature and moisture are restrained by the steel at the transverse crack interface and this restraint results in concrete stress. Signifi cant stress of concrete develops near longitudinal steel because of steel restraint. The direction of maximum stress in concrete near steel is almost vertical. It indicates that the horizontal crack perpendicular to maximum stress can occur near the steel. The cracks initiate from the transverse crack interface and propagate along the longitudinal steel.
A horizontal cracking frame simulated the transverse and horizontal cracks in the concrete specimen with longitudinal steel. During the cooling period, longitudinal and vertical strain suddenly increased. It is considered that these sudden increases were caused by the transverse and horizontal cracks. Test results show an agreement with numerical analysis results. The risk of horizontal cracking increases as the CTE and elastic modulus of concrete become higher.
It is desirable to investigate the accuracy and correctness of the fi ndings from this study through fi eld experimentation.
Effect of Water-to-Cement Ratio and Rebar Temperature on Bond Strength of Concrete RebarRebar-concrete bond strength was signifi cantly infl uenced by the water-to-cement ratio for both corroded and as-received rebar at all temperatures. The 28-day shear strength measurements showed that a water-to-cement ratio of 0.4 resulted in the highest rebar-concrete bond strength. Data presented suggests that the presence of corrosion products adversely affects bonding strength between rebar steel and concrete. Obviously, the weakest link in CRCP pavement will be the corroded rebar-concrete interface, therefore, researchers recommend removing corrosion products from rebar surfaces before concrete placement.
Based on 10-day and 28-day data, there was a reduction in the pullout strength as the rebar temperature increased from 14°F to 252°F for both the corroded and as-received rebar experiments. A great deal of attention is directed towards concrete temperature at the concrete placement stage. No data was found on the damaging effects of high rebar temperature on bonding in the literature review. The fi ndings in this research bring this issue in focus. Results of this research highlight the importance of rebar temperature and its adverse consequences on bond strength. Researchers recommend more in-depth analysis of this issue and establishing of guidelines that set limits for rebar temperature during placement of concrete. Research on understanding the operative mechanism of the interactions of hot rebar surfaces with cold concrete is currently underway.
Based on the results obtained in this research, researchers recommend the removal of corrosion products from rebar surfaces before concrete placement. Concrete placement should ideally be done at temperatures close to ambient temperatures with a water-to-cement ratio of 0.4.
Key Words:Horizontal cracking, CRCP, concrete, longitudinal steel, bond strength, corrosion, rebar temperature, water-to-cement ratio
16

0-5569-1Accelerated Stabilization Design of Subgrade Soilshttp://ctis.utep.edu/publications/Reports/3Report%200-5569%20Final.pdf
Key Words:Chemical Stabilization, Accelerated Stabilization, Mineral Chemical Analysis
Problems encountered with subgrade failures due to the loss of stabilizer over time, or ineffectiveness or insuffi cient amount of stabilizer in some soils is well documented. If the selected concentration of additives is not adequate to ensure short- and long-term durability of a pavement layer, the stabilization will be ineffective, and pavement rehabilitations will be necessary, requiring costly repairs and road closures.
The proper type and concentration of stabilizers are typically determined considering the plasticity and the gradation of the subgrade. A number of other parameters such as the interaction between the mineralogy of the materials and additives in presence or absence of moisture, construction methods and curing processes signifi cantly impact the performance of stabilized subgrades as well.
TxDOT currently requires acceptable strength in lieu of most durability tests to select the optimal additive. Strength tests can be conducted more rapidly than durability tests (7 days vs. 1 month) and require less laboratory equipment and technician training. However, achievement of a specifi ed strength does not always ensure durability. Moreover, the current TxDOT procedures for selecting the optimum additive are time-consuming and effective protocols for determining the level of moisture conditioning are not currently available. As part of this research, new accelerated testing methods are proposed that could minimize the time required for soil specimen preparation, curing, conditioning and testing time to complete the design process. Some of the shortcomings that exist in the current protocols to establish whether the stabilizer or stabilization method is deemed to be effective in the fi eld construction projects are also addressed.
To develop new and accelerated protocols, several soils with different characteristics and different stabilizers were evaluated based on current and proposed methods of moisture conditioning under different curing and compaction methods. These soils were categorized in terms of traditional methods and their mineralogical properties. These materials were then evaluated following the current TxDOT specifi cations and compared with the proposed methods of moisture conditioning, using back-pressure, vacuum, or submergence of the specimens.
To select the desirable alternatives, simplicity and applicability of the test were considered as well as their correlation with methods covered in current specifi cations. For that matter, a protocol that could be performed on stabilized soils within one week was developed to address the effectiveness of stabilization as the main outcome of this research.
Another focus of this project was to develop several test methods to determine various chemical characteristics of the soils according to their mineralogy. Cation Exchange Capacity, Specifi c Surface Area, Total Potassium, Exchangeable Potassium and Reactive Alumina could be used for that matter to substitute more costly and time consuming methods such as X-ray Diffraction and Scanning Electron Microscope.
17

0-5597-2Field and Laboratory Investigation of Warm Mix Asphalt in Texashttp://tti.tamu.edu/documents/0-5597-2.pdf
Key Words:Asphalt, Pavements, Warm Mix Asphalt, Hot Mix Asphalt, Construction
Results of this research indicate that the compaction characteristics of an asphalt mixture are signifi cantly enhanced by warm mix asphalt (WMA) technologies. This increased compactability results in an increase in laboratory molded density, which could result in a lower optimum asphalt content when the additives are incorporated during design. This research has shown that even reducing the mixture design and compaction temperature for Texas Gyratory Compactor (TGC) designs will still produce lower optimum asphalt contents than a mix design performed without the additive. This reduction in asphalt content can improve Hamburg Wheel Tracking Test (HWTT) results and reduce the cost of the mix; however, this could have a negative impact on the durability of TxDOT dense-graded mixtures since TGC mixes already tend to be “dry” in terms of asphalt content.
The current special provision (SP 341-020) allows the option to include the additive or not during the design. It is recommended that the additive not be included during the design if doing so results in reducing the optimum asphalt content.
The most common WMA technology used within TxDOT today is foaming technology. At the present time, the laboratory technology of incorporating moisture, or foam into the mix is not readily available. As a result, the mix must be designed without foam which is incorporated during the trial batch and when establishing the job mix formula. This transition from the laboratory mix design without the foam to the trial batch production with the foam will likely result in a reduction in asphalt content due to the increased lab molded density afforded by the foam. To prevent a lower asphalt content resulting from the trial batch, one or both of the following may be employed, which are allowed in the current special provision:Increase the target density from 96 percent to 97.5 percent.Lower the laboratory mixing and compaction temperature to produce the target lab-molded density at the optimum asphalt content as designed.
Prior to TxDOT’s implementation of WMA technologies, mixtures were cured for two hours at the compaction temperature (as specifi ed for a particular PG binder grade). This research has shown that curing WMA in the laboratory for two hours at their compaction temperature, which is lower than conventional HMA, results in mixtures with low HWTT performance results. HWTT results for plant produced WMA mixtures are also sometimes below TxDOT requirements when low curing and compaction temperatures are used. However, HWTT results from fi eld cores shows a signifi cant improvement in rutting resistance produced during the fi rst year of service. To standardize the curing procedure for all types of WMA technologies and to better refl ect results from fi eld core testing, at this time, it is recommended that WMA mixtures be cured for four hours at 275ºF for performance testing. This recommendation has been implemented in current procedures as described in Appendix C.
For job control of lab-molded density, it is recommended that the WMA mixtures be cured for two hours at the compaction temperature, as determined appropriate during trial batch production, such that asphalt content for the job mix formula is as close to the design as possible, as mentioned previously. There is still much to be learned about the compactability improvements offered by different WMA technologies and what should be the appropriate compaction temperature for a given technology and mix.
18
0-5627-1
In summary, the results of the research indicated that it is possible to control and predict frictional properties of pavement by selecting the aggregate type and HMA mix type. A new laboratory testing methodology to evaluate the key parameters in frictional characteristics of a fl exible pavement was developed. These two key parameters were defi ned to be the rate of decrease in friction and terminal value for friction. These two values could be used as a basis for further comparisons between frictional performances of different aggregate types.
During this study, a complete set of experiments was performed to evaluate aggregate properties using current testing methods. The results of this research confi rmed fi ndings from previous research on the superior performance of the Brownlee aggregate. The results also showed the polishing susceptibility of Beckman and Brownwood aggregates.
The infl uence of the aggregate type on asphalt concrete skid properties was investigated through preparing and testing laboratory slabs. The results of the analysis confi rmed the strong relationship between mix frictional properties and aggregate properties. The main aggregate properties affecting mix skid resistance were recognized to be British Pendulum value, texture change before and after Micro-Deval measured by AIMS, terminal texture after Micro-Deval measured by AIMS, and coarse aggregate acid insolubility value. Based on the fi ndings, a model that is able to predict initial F60, terminal F60, and rate of polishing was developed using parameters from previous research. This model confi rmed the benefi ts of texture measurements by AIMS and will help to predict mix friction based on gradation and aggregate resistance to polishing. It will also facilitate selecting the appropriate aggregate type for the desired mixture friction and could also be used to classify aggregates based on their frictional properties.
Key Words:Skid Resistance, Asphalt Mixture Polishing, Aggregate Characteristics
Predicting Asphalt Mixture Skid Resistance Based on Aggregate Characteristicshttp://tti.tamu.edu/documents/0-5627-1.pdf
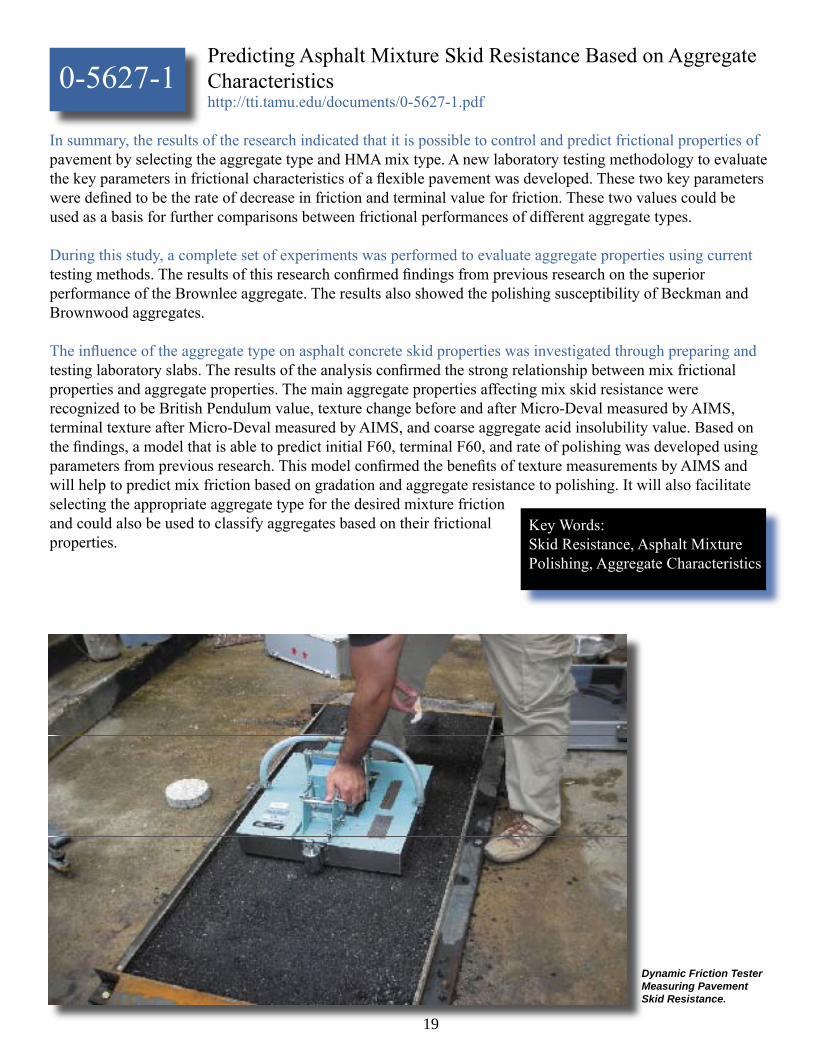
Dynamic Friction Tester Measuring Pavement Skid Resistance.
19
0-5635-1Effective Prime Coats for Compacted Pavement Baseshttp://tti.tamu.edu/documents/0-5635-1.pdf
Key Words:Prime Coat, Pavement Primer, Highway Construction, Base Construction, Hot Mix Asphalt
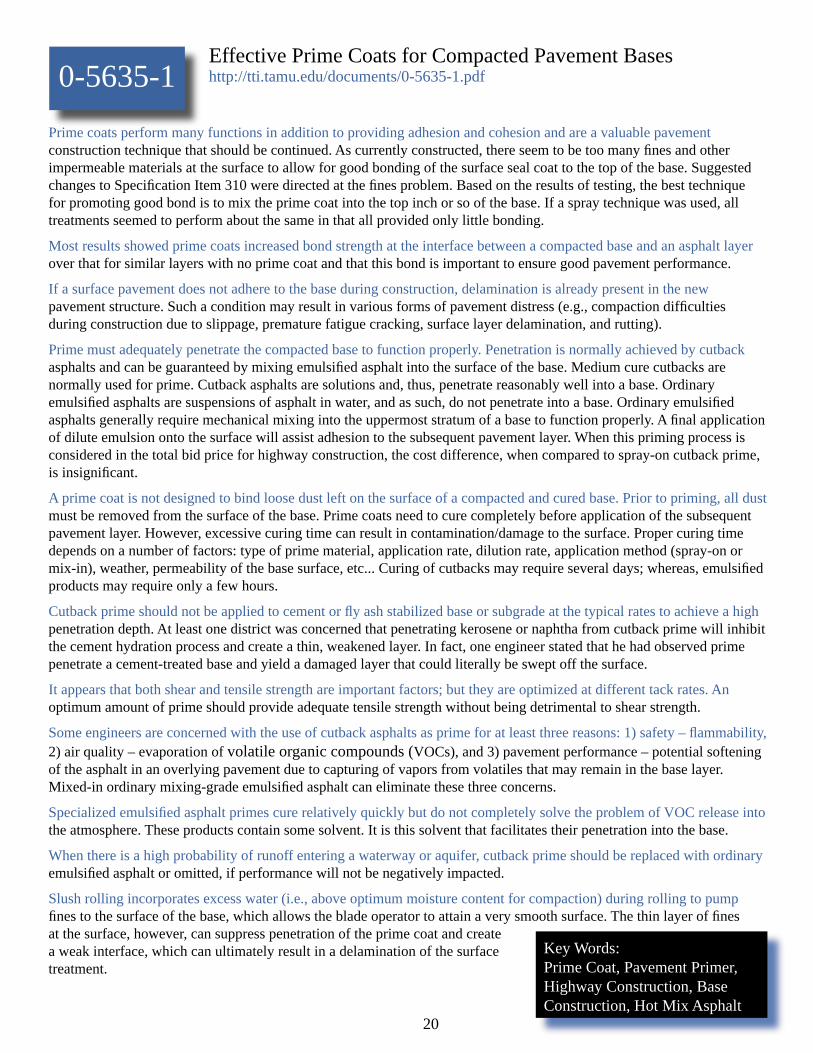
Prime coats perform many functions in addition to providing adhesion and cohesion and are a valuable pavement construction technique that should be continued. As currently constructed, there seem to be too many fi nes and other impermeable materials at the surface to allow for good bonding of the surface seal coat to the top of the base. Suggested changes to Specifi cation Item 310 were directed at the fi nes problem. Based on the results of testing, the best technique for promoting good bond is to mix the prime coat into the top inch or so of the base. If a spray technique was used, all treatments seemed to perform about the same in that all provided only little bonding.
Most results showed prime coats increased bond strength at the interface between a compacted base and an asphalt layer over that for similar layers with no prime coat and that this bond is important to ensure good pavement performance.
If a surface pavement does not adhere to the base during construction, delamination is already present in the new pavement structure. Such a condition may result in various forms of pavement distress (e.g., compaction diffi culties during construction due to slippage, premature fatigue cracking, surface layer delamination, and rutting).
Prime must adequately penetrate the compacted base to function properly. Penetration is normally achieved by cutback asphalts and can be guaranteed by mixing emulsifi ed asphalt into the surface of the base. Medium cure cutbacks are normally used for prime. Cutback asphalts are solutions and, thus, penetrate reasonably well into a base. Ordinary emulsifi ed asphalts are suspensions of asphalt in water, and as such, do not penetrate into a base. Ordinary emulsifi ed asphalts generally require mechanical mixing into the uppermost stratum of a base to function properly. A fi nal application of dilute emulsion onto the surface will assist adhesion to the subsequent pavement layer. When this priming process is considered in the total bid price for highway construction, the cost difference, when compared to spray-on cutback prime, is insignifi cant.
A prime coat is not designed to bind loose dust left on the surface of a compacted and cured base. Prior to priming, all dust must be removed from the surface of the base. Prime coats need to cure completely before application of the subsequent pavement layer. However, excessive curing time can result in contamination/damage to the surface. Proper curing time depends on a number of factors: type of prime material, application rate, dilution rate, application method (spray-on or mix-in), weather, permeability of the base surface, etc... Curing of cutbacks may require several days; whereas, emulsifi ed products may require only a few hours.
Cutback prime should not be applied to cement or fl y ash stabilized base or subgrade at the typical rates to achieve a high penetration depth. At least one district was concerned that penetrating kerosene or naphtha from cutback prime will inhibit the cement hydration process and create a thin, weakened layer. In fact, one engineer stated that he had observed prime penetrate a cement-treated base and yield a damaged layer that could literally be swept off the surface.
It appears that both shear and tensile strength are important factors; but they are optimized at different tack rates. An optimum amount of prime should provide adequate tensile strength without being detrimental to shear strength.
Some engineers are concerned with the use of cutback asphalts as prime for at least three reasons: 1) safety – fl ammability, 2) air quality – evaporation of volatile organic compounds (VOCs), and 3) pavement performance – potential softening of the asphalt in an overlying pavement due to capturing of vapors from volatiles that may remain in the base layer. Mixed-in ordinary mixing-grade emulsifi ed asphalt can eliminate these three concerns.
Specialized emulsifi ed asphalt primes cure relatively quickly but do not completely solve the problem of VOC release into the atmosphere. These products contain some solvent. It is this solvent that facilitates their penetration into the base.
When there is a high probability of runoff entering a waterway or aquifer, cutback prime should be replaced with ordinary emulsifi ed asphalt or omitted, if performance will not be negatively impacted.
Slush rolling incorporates excess water (i.e., above optimum moisture content for compaction) during rolling to pump fi nes to the surface of the base, which allows the blade operator to attain a very smooth surface. The thin layer of fi nes at the surface, however, can suppress penetration of the prime coat and create a weak interface, which can ultimately result in a delamination of the surface treatment.
20

0-5798-2Development, Calibration, and Validation of Performance Prediction Models for the Texas M-E Flexible Pavement Design Systemhttp://tti.tamu.edu/documents/0-5798-2.pdf
Key Words:Flexible Pavement Design, Overlay Test, Repeated Load Test, Rutting, Fatigue Cracking, TexME
The FPS19 design system was implemented in the mid 1990s and has served TxDOT well in providing consistent designs statewide. The existing FPS19 program presents a recommended pavement structure based on predictions of pavement roughness. This proposed structure is then checked using either a simple ME model (which uses well established fatigue cracking and subgrade rutting models) or, for thin pavement structures, the Texas Triaxial check system is run to predict whether the maximum anticipated load for the highway will cause the subgrade to fail in shear. However, the current FPS19 system has many limitations in that it does not use any results from lab testing, so it is diffi cult to quantify benefi ts from improved base materials or superior asphalt mixes. No checking of asphalt rutting is performed which has been demonstrated to be the source of most rutting found on Texas highways with 3 inches or thicker HMA layer. Furthermore the Texas Triaxial check system is well known to be too conservative for many regions, particularly those in north and west Texas.
Project 0-5798 has demonstrated that calibrated models are now available to make reasonable predictions of the most common distresses found on Texas highways. The Tex ME system described in this report is highly suited for replacing the existing simple ME check inside of FPS and the LoadGage system could replace the Texas Triaxial check. Simple performance related tests are now available to characterize soils, base, and asphalt materials in the lab, and these properties can be incorporated into a new thickness analysis and design system.
Researchers strongly recommend that TxDOT consider incorporating all of the calibrated models from this study, and those recommended herein from other national studies, into a user-friendly design software package, together with a database of default material properties. The proposed system will be used to run in parallel with the existing FPS system so that the proposed performance models can be further evaluated, validated and refi ned.
21

0-5836-1Synthesis of Current Research on Permeable Friction Courses: Performance, Design, Construction, and Maintenancehttp://tti.tamu.edu/documents/0-5836-1.pdf
Key Words:Porous Friction Courses, Open-Graded Friction Courses, Porous Asphalt, Mixture Design, Mixture Performance, Asphalt Mixture, Asphalt, Permeability, Noise Reduction, Maintenance, Construction, Durability, Safety
Permeable or porous friction courses (PFC), and new generation open-graded friction courses (OGFCs) as defi ned by the Texas Department of Transportation (TxDOT) in Item 342, have special gap-graded aggregate gradations that lead to a mixture containing a high percentage of air voids (AV) (at least 18 percent of total AV content). In fact, most international and national studies refer to this open structure mixture as porous asphalt (PA) or new generation open-graded friction courses (OGFCs).
Several researchers indicate PFC/OGFCs provide various advantages due to the high AV content and the large permeability, which improve traffi c safety, fuel consumption, and reduction of tire/pavement noise. The high AV content and the open structure enhance the effective drainage of water at the pavement surface, which can reduce hydroplaning, splash and spray, and glare under wet weather conditions as well as visibility during darkness and daylight. This property also improves wet skid resistance in comparison with dense-graded hot mix asphalt (DGHMA), since less water remains on the pavement surface. Moreover, PFC/OGFCs can reduce fuel consumption due to their smoothness and provide noise reduction in an expected range of 3 to 6 dB(A), as it is important to minimize or control pavement noise levels especially in urban areas.
PFC/OGFCs can also pose some disadvantages, such as reduced performance, high construction costs, winter maintenance problems, and limited structural contribution. Reduced performance of PFC/OGFCs is associated with reduced durability and functionality (i.e., permeability and noise reduction effectiveness), due to raveling and clogging, respectively. Furthermore, construction costs per ton of PFC/OGFCs in the United States are much higher than DGHMA, and PFC/OGFCs have pavement surface lives that are less than the standard DGHMA. Winter maintenance is also considered a serious problem with frost and ice formation common, and frequent maintenance required which leads to high maintenance costs. In addition, for pavement structure design, PFC/OGFCs materials are typically considered to have no or minimal structural contribution.
Previous research projects addressed important design, construction, and maintenance issues associated with PFC/OGFCs mixtures over the past several years. In order to complete the evaluation of this relatively new mixture type as a possible solution for improving pavement safety and reduction of pavement noise, performance must be tracked over a multiyear period to assess benefi ts, costs, and changes in benefi ts over time.This need for additional research motivated TxDOT project 0-5836 Performance of Permeable Friction Courses (PFC) Pavements over Time. The main objective of this research project was to develop a database of PFC/OGFCs performance in terms of functionality (noise reduction effectiveness and permeability), durability (resistance to raveling and possibly rutting and cracking), and safety (skid resistance and accident history), in order to produce guidelines for design, construction, and maintenance of PFC/OGFCs mixtures.
This report summarizes the results of a comprehensive and focused review of research conducted since 2004 related to the design, construction, maintenance, and performance of surface courses using PFC/OGFCs. The fi rst part of this report describes PFC/OGFCs performance including functionality (noise reduction effectiveness and drainability), durability, and safety (skid resistance and accident rate). The second part presents the mixture design methodologies, the fundamental aspects involved in the construction process, and the primary considerations for maintenance of PFC/OGFCs mixtures. The report also includes results of an ongoing online survey that was established in order to gain information from TxDOT districts on the use and experience in terms of performance and maintenance of PFC/OGFCs mixtures. Also included is a summary of information obtained from recent research regarding performance, design, construction, and maintenance of PFC/OGFCs and proposes some recommendations for future study.
22

0-6085-1Considerations for Rigid Vs. Flexible Pavement Designs When Allowed as Alternate Bids: Technical Reporthttp://tti.tamu.edu/documents/0-6085-1.pdf
Key Words:Flexible Pavement, Rigid Pavement, Life-Cycle Cost Analysis, Alternate Pavement Design Analysis Tool, APDAT, RealCost, Pavement Design, Pavement Type Selection, Alternate Bids
By using the guidelines for alternate bids, TxDOT should get the best value for a project. Alternate bids should attract more contractors, increasing competitiveness among them with the aim of resulting in lower construction costs.
The Alternate Pavement Design Analysis Tool (APDAT) will assist in determining if pavement alternates should be considered. The FHWA RealCost software can also be used for further life-cycle cost analysis when including user costs.
Researchers found that the following characteristics can make a pavement unsuitable for offering alternative pavement designs in the plans. The researchers recommend that these characteristics be incorporated into the Design Summary Report (DSR):• This is a pavement widening project.• The project does not involve new construction or reconstruction.• The pavement is less than 500 feet in length.• The pavement is less than 5 miles in length, and both connecting pavements are either rigid or fl exible pavements.• There are areas of the pavement where truck traffi c will be stationary for long periods of time.
In addition, the researchers generated two options that can be incorporated in the DSR revision. The fi rst option states that pavement alternates should not be used if the project’s oneway truck traffi c average daily traffi c (ADT) value range is below 300 or above 2,000.
The second option states that pavement alternates should not be used if the concrete pavement thickness for the project generated from the 1993 AASHTO Guide design procedure is less than 8 inches or 12 inches and greater. This is a preliminary evaluation prior to the design. If this pavement does not include any of the above characteristics, it is recommended that APDAT be used to further explore offering alternative pavement designs.
The APDAT decision analysis tool incorporates lower and upper limit equivalent single axle loads (ESALs) for each district that are based on concrete pavement thicknesses of 8 inches and 12 inches using the appropriate inputs in the 1993 AASHTO rigid pavement design procedure. If the ESALs are outside the districts’ limits, the APDAT tool indicates that pavement alternates should not be considered.
If after conducting the preliminary evaluation the pavement appears to be a candidate for alternative pavement design, then alternate designs should be generated. After developing the Flexible and Rigid Pavement Designs, a life-cycle cost analysis of both alternatives is conducted. If the life-cycle cost analysis (LCCA) difference between the alternatives is more than 20 percent, the researchers recommend that the engineer should select the alternative with the lowest life-cycle cost. If the LCCA difference between the alternatives is less than 20 percent, then alternate pavement design is recommended for the bidding process.
23

0-6092-1RAP Stockpile Management and Processing in Texas: State of the Practice and Proposed Guidelineshttp://tti.tamu.edu/documents/0-6092-1.pdf
Key Words:RAP, Stockpile Management, RAP Processing,Crushing, Fractionation
In addition to conserving energy and protecting the environment, the use of reclaimed asphalt pavement (RAP) can signifi cantly reduce the increasing cost of HMA paving. When properly designed and constructed, RAP mixes could have the same or similar performance as virgin HMA mixes. However, this does not mean that RAP mixes always perform well. One of the key problems is RAP uniformity or variability in terms of RAP aggregate gradation and asphalt content, which is the main reason why many state DOTs including TxDOT limit the use of RAP in HMA mixes.
In most circumstances, RAP variability is closely related to RAP stockpiles management and RAP processing. So this report fi rst documented the state of the practice of RAP stockpiles management and RAP processing in Texas. In general, TxDOT often separates RAP stockpiles due to no space limitation. Most contractors currently follow simple practices of managing RAP materials. Most plants combine RAP materials from different sources and sometimes waste into a single pile and then process it into a usable RAP material by crushing and/or fractionation. Researchers found that the contractors they visited are doing a good job to manage the processed RAP stockpiles. Furthermore, to quantify the RAP variability, RAP samples were collected from visited RAP stockpiles and evaluated using the ignition oven test. The results showed that both TxDOT and contractors’ RAP materials, in terms of aggregate gradation and asphalt content, are consistent and slightly better than those reported at the national level.
One concern raised during the visits was with mixing multiple-source RAP stockpiles before crushing or fractionation. RAP stockpiles are often processed or dug from a single angle or sequentially and then directly fed into a crushing or fractionating machine. If there is no further blending after crushing or fractionation, the processed RAP may still be multiple-source. So it is still very important for contractors to blend the multiple-source RAP stockpile using a front-end loader or other appropriate equipment before processing it or randomly rather than sequentially dig into the stockpile to feed into a RAP crushing or fractionating machine during RAP processing. To further address this and other issues related to stockpiles management, some guidelines are proposed and the key points are to 1) eliminate contamination of RAP stockpiles, 2) keep RAP stockpiles as separate as possible, 3) blend thoroughly before processing or fractionating the multiple-source RAP stockpiles, 4) avoid over-processing (avoid generating too much fi nes passing # 200 sieve size), 5) use good practices when storing the processed RAP (such as using the paved, sloped storage area), and 6) characterize and number the processed RAP stockpiles. To better control the RAP variability, both good stockpile management practices and RAP processing techniques described in this report should be followed.
Two Separated RAP Stockpiles.
24

0-6132-1New Generation Mix-Designs: Laboratory Testing and Construction of the APT Test Sections http://tti.tamu.edu/documents/0-6132-1.pdf
Key Words:Mix-Design, Volumetric, Balanced, Texas Gyratory Compactor, Hamburg, Rutting, Overlay, Cracking, APT, Infra-Red, Thermal Imaging, X-Ray CT, GPR, FWD, ALF, Workability, Compactability
Laboratory Mix-Design Evaluations - Two mix-design methods (the Texas gyratory and the proposed balanced mix-design) were evaluated in the laboratory. Preliminary fi ndings are that the proposed balanced mix-design method results in a higher OAC asphalt-binder content (about 1 percent) in a mix compared to the traditional Texas gyratory method, and thus, an improvement in cracking resistance performance.
While the Hamburg rutting performance were insignifi cantly different in both mix-design methods, the proposed balanced mix-design method yielded far much better laboratory crack-resistant mixes based on the Overlay test compared to the traditional Texas gyratory method. Furthermore, workability in terms of the laboratory compactive effort to achieve the desired density was better with the proposed balanced mix-design method, attributed to the increased OAC with this mix.
Air Voids (AV) and X-Ray CT Scanning Tests - Based on the two mixes (Type B and D) evaluated during this reporting period, the X-ray CT results indicated signifi cantly poor AV distribution and higher AV content (i.e., lowest density and weakest area) in the top and bottom 0.8-inch zone of the 6-inch diameter molded samples. Thus, trimming a minimum of 0.8 inches on either side of gyratory molded samples should be given consideration.
To ensure uniform AV distribution and minimize edge failures in direct-tension testing, transitioning to 4- or 5-inch high by 4-inch diameter direct-tension (DT) test specimens as opposed to the current 6-inch high may be warranted. However, caution should be exercised to meet the specimen aspect ratio and nominal maximum aggregate size (NMAS) coverage requirements.
Cracking Test Evaluations - Two mixes, Types C and D, were evaluated in the laboratory using the DT, overlay test (OT), IDT, and SCB tests. The results from all the tests indicated that the Type D mix had superior laboratory cracking resistance properties. Theoretically, it would therefore be expected to out-perform mix Type C in the fi eld if all other factors are assumed to be equal.
Based on the two mixes evaluated and the laboratory factors considered, the repeated SCB offers the most promising potential for a surrogate cracking test particularly in terms of variability and repeatability. This is seconded by the repeated IDT test with the OT being ranked third. However, the IDT test excelled in terms of simplicity and potential for practical application.
Overlay Round-Robin Tests - Considering a loading rate of 0.025-inch horizontal displacement and single crack failure mode, the average number of cycles to failure was 258 with a coeffi cient of a variation of 23 percent. The average lab range was 220 to 312 cycles. This level of variability is not unreasonable if a COV threshold of 30 percent is considered.
Overall, the results obtained from the round-robin testing indicated that there is potential that the OT variability and repeatability can be optimized to reasonably acceptable levels, with careful work (sample preparation, etc) and adherence to the test specifi cation and procedures.
Workability and Compactability Indicator Tests - Two mixes, Types B and D, were evaluated for workability and compactability assessment based on the Pine and Servopac gyratory compactors, respectively. At 92 percent target density, the Type B mix required less compaction energy compared to the Type D mix. However, during service life, the Type D mix would require less densifi cation energy compared to the Type B mix. In terms of workability and compactability, the Type D mix exhibited more sensitivity to changes in the asphalt-binder content than the Type B mix.
For the two mixes evaluated, the compaction indices have exhibited sensitivity to aggregate gradation and asphalt-binder content. However, no changes were noticed due to apparatus change, i.e., both the Pine and Servopac gyratory compactors yielded similar results.
25

0-6388-1Synthesis of Innovative Contracting Strategies for Routine and Preventive Maintenance Contractshttp://www.utexas.edu/research/ctr/pdf_reports/0_6388_1.pdf
Key Words:Maintenance outsourcing, maintenance contracting ,contracting strategy, contract type, outsourcing
Three components have been identifi ed that make up a maintenance contracting strategy: delivery method, type of contract specifi cation, and pricing strategy.
Thirteen (13) delivery methods that are used worldwide for highway maintenance contracting are identifi ed, as well as three types of contract specifi cations, and three pricing strategies.
There is no existing standard defi nition and terminology for various maintenance delivery methods because each state DOT or country tailors a delivery method to suit its needs or circumstances and names the delivery method accordingly. Hence, this research provides standard defi nitions that can be used throughout the United States.
Some delivery methods, such as Multi-Agency Contract Method or Partial Competitive Maintenance Contract Method, are seldom used by DOTs in the United States, and other methods, such as Alliance Contract Method or CREMA Contract Method, are only implemented outside the United States.
Many factors will affect a transportation agency’s ability to select an effective maintenance delivery method. A particular goal that the agency wants to achieve through outsourcing (such as a long-term commitment from contractors), or a particular circumstance (such as lack of equipment or expertise), are just two of the many factors that will impact the decision process.
A decision tree with eight (8) decision nodes (and associated decision criteria) have been identifi ed through 11 DOT interviews. A Maintenance Contracting Strategy Selection Framework was developed based on the decision nodes and criteria.
A selection algorithm has been developed to assist maintenance personnel in selecting appropriate contracting strategy that can help them achieve their particular outsourcing goals and accommodate their specifi c maintenance circumstances.
A selection guide provides guidance on the selection and implementation of innovative maintenance contracting strategies for the outsourcing of maintenance activities.
Eleven (11) case studies present fi ve (5) delivery methods that are being used within TxDOT or other state DOTs that give the reader a picture of how these delivery methods are implemented in practice.
Standard terminology and defi nitions of maintenance delivery methods should be studied and established by the Transportation Research Board.
Some delivery methods that are seldom or never used in the United States should be studied in detail and potentially pilot tested to determine whether they can be successfully implemented in U.S. DOTs.
Additional research is needed to understand how maintenance activities are bundled and how bundling affects the selection and effectiveness of delivery methods.
Additional research is needed to understand the outcomes resulting from the implementation of maintenance delivery methods, such as cost effectiveness.
A comparison study between the Signifi cantly Bundled Activities Contract Method and the Total Asset Management Contract Method might provide insights into why and how agencies outsource nearly all maintenance work.
The development of a tool to select appropriate activities to outsource, and how to bundle activities effectively, should be conducted.
26

Planning andEnvironment
RMC 2results
RMC 2 - Planning and EnvironmentFocus Areas• Aviation System Planning • Environmental Affairs Management • Hazardous Materials • Multi-modal & Inter-modal Freight
Planning • Ports & Waterways Planning • Public Transportation • Railway Planning • Right of Way Planning, Acquisition &
Management • Roadway Planning • Statewide, Regional & Local
Transportation System Planning • Traffi c Data Collection
27

0-5286-2The Role of Preferential Treatment for Carpools in Managed Laneshttp://tti.tamu.edu/documents/0-5286-2.pdf
High-occupancy vehicle (HOV) preferences are common for managed lanes in operation and under development. Most provide free access to HOV-3+ as a minimum.
There are operational, uniformity, and equity considerations on the part of agencies that infl uence decisions about HOV preference, including enforcement operations.
When considering the effectiveness of carpool incentives relative to the national decline in “acquaintance” carpools (as opposed to family carpools or “fampools”), policy makers would be well advised to consider the overall contribution of incentives to the expressed objectives of the managed lanes program.
HOV preferences in managed lanes can infl uence carpooling behavior. The most common reason for forming a carpool is to have access to the HOV lanes, particularly for work/commute trips. Other pressures that infl uence the decision to carpool—including rising gas prices and interest in sharing vehicle costs—may have become more prominent since the survey was conducted and are not addressed in this study.
Family member carpools make up the vast majority of carpools. The degree to which these carpools would remain intact without carpool preferences was not directly measured, but survey responses on why people carpool suggest that HOV preferential treatment is an important factor for these carpoolers.
There is high support for managed lanes in Texas cities that currently have toll roads and HOV lanes, and “faster travel” and “travel time reliability” were the most important reasons for support.
There may be more to gain in person-moving capacity with policies that emphasize HOV preference.
HOV policies in managed lanes have minimal impact on emissions, although there may be an infl uence associated with CO2 emissions under higher toll rates and more favorable HOV preferences.
The impacts of different HOV pricing policies on the overall mix of traffi c on an entire freeway are small. However, the small changes to the number of HOV-3+ travelers (and even HOV-2 travelers) can represent a signifi cant portion of travelers using these modes (10 percent or more).
The determination of the appropriate HOV policy in managed lanes depends upon individual project objectives and what the agencies are trying to achieve in their region and with their facility. There are a myriad of HOV policy combinations that can be chosen, but ultimately the decision depends on what is to be accomplished in terms of operation and person throughput, and what the fi nancial constraints are. The research does suggest, however, that there may be more to gain in operational effi ciency (i.e., person-moving capacity) with policies that emphasize HOV-3+, and to a lesser degree HOV-2.
Key Words:Managed Lanes, Carpools, HOV, HOT
28

0-5335-1Research Report: Guidance On Mitigating Impacts of Large Distribution Centers on Texas Highwayshttp://tti.tamu.edu/documents/0-5335-1.pdf
Key Words:Distribution Centers, Site Selection, Highways, Site Location, Impacts, Pavements, Geometric Design,
Trip Generation
Researchers recommend that TxDOT be consistent with its goal to support economic development in Texas, work with the Governor’s Offi ce of Economic Development to provide information about how TxDOT works, the process of requesting and obtaining highway improvements, and funding implications as well as providing useful information on highways and accessibility that will be useful to distribution centers’ (DC) interests (e.g., projects under construction, programmed or planned; truck-ready underutilized interchanges, congested highway segments, etc.).
Proactively develop relationships with local economic development agencies since they are often involved in both site selection and in securing improvements of various types. Educate those agencies and others about access, state highways, and the highway improvement and funding process so they can communicate them to DC interests.
Adopt a “TxDOT is here to help” posture. Assist the DC interests with benefi cial information including site selection criteria that benefi t both the DC owners and developers and TxDOT.
Provide information on funding, the process needed to get it from TxDOT, and options available to DC developers to fund projects and even to accelerate them.
Also describe the normal lead times associated with different types of improvements and how scheduling occurs.
Offer assistance to DC site selectors and to local economic development agencies to help them fi nd mutually benefi cial sites (highly accessible; minimal state highway improvements needed).
Offer to assist with developing the DC site access plan. Encourage a traffi c impact analysis to identify or confi rm the need for specifi c access improvements or to evaluate alternatives. Review site plans before design begins to identify potential for improved site access or to reduce impacts
29

0-5517-1Mechanical Properties of Tire Bales for Highway Applicationshttp://www.utexas.edu/research/ctr/pdf_reports/0_5517_1.pdf
Key Words:Scrap Tires, Tire Bales, Lightweight Fill, Drainage, Reinforcement, Tire Disposal
The unit weight of tire bale mass was redefi ned using a new method which allows for the designer to take intoaccount soil fi ll, submergence, and numerous other design considerations when determining the weight of a tire bale structure.
Large scale direct shear testing was conducted using a three bale pyramid structure. Results from a dry tire bale only interface indicated limited variability between different bales and from different setups. However, the presence of water along the interface decreased the shearing resistance of the tire bale structure.
In a series of anisotropic tire bale only interfaces, friction angle parameters for wet and dry testing were similar to those interfaces set up in a traditional orientation. However, cohesion values dropped to 0 psf.
Compression testing showed that the stiffness due to compression loading was much less with a three tire bale pyramid structure than with a single bale.
Baling wire behavior was also tested and its effects on tire bale structures if there is breakage. Results from a strain gauge test indicated that there is a redistribution of tensions within the baling wires due to breakage of surrounding wires. Rapid expansion tests indicated that there is not violent horizontal deformation of the bale after wire breakage. In fact, the bales did not exhibit any large deformation until the last two wires were cut.
An in-depth cost benefi t analysis and analytical study was presented for the use of tire bales in highway structures. The most notable cost savings associated with using bales is the reduction in cost of transporting and storing tire bales due to the instant volume reduction of the tires that can be accomplished at the site of the scrap tire dump. The cost of transporting tires in whole form is approximately $1.25, while transporting a whole tire in bale form only costs $0.42. Other cost benefi ts to using tire bales in highway structures includes the reduction in cost to make bales ($0.013) as compared to producing tire shreds ($0.64), and the ease of using tire bales in construction as compared to the methods required to place tire shreds.
The cost benefi ts of using tire bales in highway structures are illustrated using a series of case histories and construction alternatives commonly used for highway construction. In addition, each cost benefi t analysis is coupled with an analytical study of the structure to illustrate the mechanical benefi ts of using tire bales. Both a limit equilibrium analysis and fi nite element code were used in the study. In general, the use of tire bales as drainage layers and reinforcement elements increased the stability of the structure. However, the low stiffness of the bales did increase the fl exibility and deformations of the structures.
Constant fi eld monitoring of the IH 30 Phase Two slope remediation project has indicated a satisfactory performance of the tire bale reinforced and tire bale fi ll embankments during dry and wet periods. Deformations of the slope have been limited (less than 2 inches) and have occurred mainly in the compacted soil cover during wet/dry periods in the weather. Additional information has been provided by the New Mexico Department of Transportation that provides evidence of the satisfactory performance of tire bale retaining walls during dry and wet weather periods.
30

0-5531-2An Assessment of a Traffi c Monitoring System for a Major Traffi c Generator to Improve Regional Planning: Technical Reporthttp://tti.tamu.edu/documents/0-5531-2.pdf
Key Words:Traffi c Monitoring, Major Traffi c Generator, Special Traffi c Generator, Regional Planning
There is no set defi nition for a special or major traffi c generator, and both terms are often used interchangeably in literature and in practice. The vagaries of location, scale, and impact make a standard defi nition diffi cult and relative to the city and type of development. As a result, no standard is available to determine the need for pre- and post-construction traffi c monitoring of major generator sites or areas.
There is no consensus on the analysis and monitoring of special generators for planning purposes. The travel demand model can easily, according to practitioners, incorporate new traffi c sources into the model based on type of employment and number of employees. Freight analysis can incorporate a large part of expected traffi c generated, especially at industrial sites using truck transport for supply. Freight analysis is still a complex process at the Metropolitan planning organizations (MPO) level and may be diffi cult to integrate into planning. From a regional planning perspective, a new major traffi c generator is the source of economic development, regional prestige, and should be factored in planning for future land use and impacts.
If traffi c monitoring of a special generator is to be undertaken, mechanical and manual techniques are readily available. Roadside intercept surveys are a viable tool in this monitoring. For example, based on experiences at automotive manufacturing sites, future impacts near the plant are slow in developing and should be considered when developing a monitoring plan.
Collecting and warehousing the data are integral to the monitoring process. The data must get from the collection site to a centralized access point. This should be established at the beginning of the process. All agencies involved in the monitoring program should have access for analysis purposes.
Data collection sites must be installed in a timely manner. Data should be collected prior to the installation of a major traffi c generator to create a “before” and “after” comparison of traffi c surrounding the major traffi c generator. Data collection locations should be considered in light of future development plans. Also, locations should be considered in context of existing land uses.
Data collection locations must be suffi ciently comprehensive to capture the “before” and “after” traffi c movements. Suffi ciency depends on the size of the study area and resources available to purchase the necessary equipment and manpower.
Coordination between interested agencies is essential. The agencies must agree on several issues regarding the monitoring process, such as availability of funds, the locations of the collection sites, the types of data collected, the warehousing of the data, the personnel to analyze the resulting collected data, and the dissemination of the results.
Data types such as continuous volume counts, short-term volume counts, travel times, travel purposes, trip generations, incident data, aerial photographs, number of building permits, number of utility hook-ups, and economic data need to be chosen for availability and relevance. Note that some data types may not be available for all areas.
A traffi c monitoring network can capture a variety of data types depending on the needs of the agency/agencies and the available funds. When analyzing the data collected from a monitoring net, the challenge is to match the various sources and types of data in order to measure changes on the road network. Typical matching scenarios can include short-term data with continuous data, historical data with current data, and travel time data and commuter surveys with traffi c data.
Data collected for different purposes need to be aligned for analysis, such as aligning volume data with classifi cation data.
31

Key Words:Asset Management, Simulation, Optimization, Budget Decision Support, Business Science Tools, Early Right-of-Way Acquisition, Transportation Planning and Programming, Fleet Vehicle Replacement
0-5534-2Development of Decision-Making Support Tools for Early Right-of-Way Acquisitionshttp://tti.tamu.edu/documents/0-5534-2.pdf
Simulation and optimization business science methods have been found suitable for the development of decision-support tools regarding early acquisition of right-of-way parcels. Two tools were developed in this project: TAMSIM and EROW. These tools can assist decision makers at the district and state levels in the funding allocation process for early right-of-way acquisition and can support the following activities: a. Determination of the probability of signifi cant savings from early acquisition on a single project and estimating the magnitude of that savings, b. Determination of the number of parcels within a given project which should be considered for early acquisition, c. Determination of which projects within a district offer the most potential for signifi cant savings from early acquisition, and d. Determination on a statewide basis an optimal number of parcels or projects or right-of-way dollar-value to be allocated for early acquisition of right-of-way.Based on TAMSIM sensitivity testing, TAMSIM provides cost saving results in correct relative magnitude sequence. Earlier times for speculation to begin result in greater savings potential from early acquisition. The greatest cost savings occur when speculation activities begin immediately after the schematics become available.The use of asset management practices for right-of-way early acquisition can be technically justifi ed, but there may be limitations to implementation potential. Availability of funds for purchase of right-of-way is a concern in Texas. Parcels which are identifi ed as benefi cial for early acquisition may not be within TxDOT budgeting ability to purchase early.To maximize benefi ts possible through early acquisition, laws and policies will need to be modifi ed to allow early acquisition with less restriction than is currently allowable. Asset management tools used for estimating the benefi ts of right-of-way early acquisition, when applicable, will assist in improving communication with legislators if legislative changes are considered in the future.TxDOT should implement TAMSIM and EROW on a statewide basis for the initial purpose of assisting in selection of right-of-way parcels for early acquisition within the current limitations of state legislation.Initial results provided to TxDOT by TAMSIM and EROW during the implementation period should be analyzed by TxDOT right-of-way professionals to allow model adjustments as may be found desirable.A pool of representative projects should be assembled for use in estimating potential cost savings for the State of Texas should various new allowances be provided through future legislation.TxDOT personnel with experience in right of way, made the following general recommendations for applying asset management principles to right-of-way early acquisition:a. Projects should be studied case-by-case to determine if early acquisition will be benefi cial.b. Protective buying can save money if: 1) parcels are located in an area where cost can increase rapidly, 2) a signifi cant number of parcels are purchased, and 3) parcels are acquired early enough to avoid speculation and/or improvements being added to the properties.c. Buy parcels when they are vacant. It is not recommended to wait for improvements in the parcels. Any improvement will cause the cost to increase.d. Speculation, improvements to the property, and damages to the remainder of the property are considered to be the major factors causing signifi cantly increased land cost.e. Right-of-way early acquisition may foster smoother negotiations, saving time and human resources. f. Good communication with cities and counties will help to identify areas where right-of-way cost can increase signifi cantly from initial estimates. This will allow districts to take action to minimize the impact of potential cost escalation.
32

0-5652-1Transportation, Social and Economic Impacts of Light and Commuter Railhttp://tti.tamu.edu/documents/0-5652-1.pdf
Key Words:Light Rail, Commuter Rail, Intercity Rail, Economic Development
Based on the fi ndings of the case studies, the research team determined that the state DOT is usually directly involved in longer distance, intercity commuter rail projects. In large, urbanized areas where the entire or most of the proposed route is contained within a single jurisdiction (MPO or regional/local transit agency), the local agency usually takes a more important role than the DOT in development of the project. Most MPOs/transit agencies in areas of this type have experience administering Federal Transit Authority (FTA) funding for bus systems and having them take a lead role in commuter rail programs within their area helps make sure that the new rail route acts as a system with existing transit services.
While the state DOT may have a limited role in shorter distance commuter rail and urban light rail (LRT) development, we also found that there is a defi nite DOT role in interregional/intercity passenger rail where the “commuter rail” service may connect two or more urban centers—acting as a regional transportation interface. We identifi ed three broad areas in which the state DOT could play a primary role: fi nancial support, planning assistance, and operational support.
Lessons for TxDOTIn large cities where the regional transportation authority or local transportation agency has a history of purchasing existing rail lines or working directly with the railroads, it may be best for the state DOT to allow the local agency to continue in this role. The DOT can assist by administering funding programs authorized by the legislature or assisting with advance ROW acquisition. Preserving these corridors for some time period may be necessary in order to allow time for a project to advance and/or receive funding from a federal program such as the New Starts program or another funding source.
Houston METRORail, Houston, Texas.
33

0-5711-1Improving Accuracy in Household and External Travel Surveys http://tti.tamu.edu/documents/0-5711-1.pdf
Key Words:External Survey, Household Survey, Response Rates, Survey Methodology, Geocoding, Data Analysis, Vehicle Classifi cation Counts, Sample Size, Survey Design
Household surveys as practiced in Texas are comparable to those done in other parts of the nation.Vendors should be required to document how the sample of households is selected and the randomness of the procedure maintained. Specifi cally, the documentation should include how cell phones are handled in the recruitment and data retrieval phases. Vendors should be required to document the disposition of all phone calls in the recruitment and retrieval phases and provide a computation of the response rate for the household survey. Vendors should be encouraged to use mixed modes for household recruitment and data retrieval. Mixed modes that should be considered include telephone, mail, and internet. Vendors should be required to incorporate into the survey design and execution a follow-up survey directed at households that have refused to participate and households that could not be contacted by phone. The method for this survey is mail based recruitment with data retrieval subject to the method best suited to the participants. Vendors should be allowed to have proxy reporting for all minors in a household. Minors are defi ned as individuals under the age of 16. Proxy reporting for persons over the age of 15 should be limited to not exceed 20 percent of those individuals participating in the household survey. Analysis of household surveys should be expanded to include an evaluation of the trips per person for individuals being represented by proxy versus individuals responding personally. The results of that evaluation should be incorporated into the development of recommended trip production rates for use in travel demand models. Additional research is recommended to examine the feasibility of combining un-weighted household surveys from different areas and using the combined data to develop representative household trip rates for urban areas that do not have a household survey. External surveys as practiced in Texas are comparable to those executed in other parts of the nation. Vendors should be required to provide all vehicle classifi cations counts by direction in 15-minute increments using the FHWA Scheme F for classifying vehicles. All data should be submitted in Excel fi les. Vendors should be required to use tablet personal computers as the primary means for conducting roadside intercept surveys with paper surveys available as a backup. Vendors should be required to maintain a log for each external survey that documents the number of interviewers being used and the name of the on-site supervisor for each hour the survey is in progress. Vendors should be prohibited from using the project manager as a site supervisor on a full time basis. The project supervisor can be allowed to serve as site supervisor in a temporary relief capacity. Vendors should be prohibited from using interactive GIS maps for geocoding at the time of interview unless it can be shown to TxDOT‘s satisfaction that the geocoding can be achieved within the time frame of the survey and the technical capability to accomplish the geocoding is possessed by all the vendor‘s surveyors. Vendors should be required to calibrate the automatic vehicle classifi cation (AVC) counters being used at all external survey sites and provide documentation of same. Vendors should be required to video tape vehicles in both directions passing through the survey site, manually classify the vehicles by hour for the time period surveys are conducted, and provide the data including video tapes to TxDOT as part of the requirements for each external station surveyed. The minimum sample requirement for commercial vehicles at external stations should be 70 useable commercial vehicle surveys or 25 percent of the commercial vehicles traversing the survey site during the time period the surveys are conducted. This minimum should be set for usable commercial vehicle surveys.
34

0-5748-1Water Retention Techniques for Vegetation Establishment in TxDOT West Texas Districtshttp://tti.tamu.edu/documents/0-5748-1.pdf
Key Words:Water Harvesting, Water Retention, Vegetation Establishment in Arid Areas
Water harvesting offers potential benefi ts to the overall highway system in that it helps reduce the environmental impact of the system while helping to improve the roadway’s function. The challenge in the arid portions of Texas is to maximize limited periodic and seasonal rainfall by developing cost effective, site specifi c, and integrated implementation strategies. Unfortunately, there is no single solution when it comes to solving water/irrigation problems in these diffi cult locations. However, there are several ‘tried-and-true’ methods available to the designer to encourage moisture availability to vegetation.
To determine the water harvesting techniques that will be most successful on a site, several characteristics must be evaluated. For obvious reasons rainfall characteristics, such as minimum annual rainfall, average annual rainfall, and peak rainfall intensity, must be determined. Site physiographic characteristics including existing vegetation, soil slope, and type are factors in determining which techniques will be most successful on a site.
As with any cost-benefi t discussion, accurate cost analysis is made easier using regionally accurate, up-to-date records. Benefi t analysis, on the other hand, often proves to be more diffi cult due to the fact that determining benefi ts is typically more subjective. Combine this subjectivity with rainfall predictions and it is easy to see the diffi culty in applying this to water harvesting. However, there are predictors that can assist in making these decisions.
Cost will be relative to the degree and type of mechanization required and whether or not new structures are needed. In some cases multiple techniques may be used on the same site or in conjunction with each other. Considering the cost of emulsion at $11.00 per gallon [$2.90 per liter] and the TxDOT application rate the resulting cost is approximately $10,648.00/acre [$26,300 per hectare], its use would be restricted to the early spring planting to maximize soil temperatures to take advantage of the early spring rains in March and early April (25 percent of the annual rainfall occurs in March, April, and May) to increase soil temperature and to encourage early seed germination.
The least costly method of capturing and using rainfall is to use it where it falls and avoid trying to move it someplace else. Compost cost, approximately $12 to $15/ton [$10.80 to $13.50/metric ton], is directly infl uenced by the haul distance and local delivery rates. The increased soil water retention of up to 20 percent could more than offset the cost over time. One problem has been the availability of compost meeting TxDOT specifi cations within a reasonable distance of the planned project. More TxDOT-approved vendors are needed throughout the area to provide sources in close proximity to TxDOT projects. Vendor education programs could be conducted to provide potential vendors with the TxDOT specifi cations as well as providing orientation to vendors on TxDOT’s vendor approval procedures.
Using the Plan Profi le diagrams provided by TxDOT and assuming a berm height of 2 ft [0.61 m] and an area of infl uence equal to the area rise and assuming no berms in depressions, the 3.18 mile [5.18 km] project would require from 25 to 30 berm structures for each ditch and median for a total of 75 to 90 berm structures. It is diffi cult to estimate the cost of the structures. Local materials would be used in the construction of the berms with the additional cost of adding gravel or other erosion features. Considering a berm width of approximately 30 ft [9.1 m] at the top, approximately 10 ft [3.04 m] wide with 6 inches [0.15 m] of gravel material cap, less than 16 cubic yards [12.2 m3] of berm material and 5 cubic yards [3.8 m3] of erosion cap would be required. Due to the low infi ltration rates for scraped areas or recent construction areas, the dramatically improved infi ltration rates on well vegetated areas, the low rainfall in the area and TxDOT’s requirement to meet the Clean Water Act re-vegetation requirements the berms and optional features discussed above should be considered. Additional fi eld studies are needed to verify the cost effectiveness of the berms and other recommended water harvesting options.
35

Key Words:Toll Roads, Network improvements, Feeder and Competing Links and Routes, Financial Feasibility
0-5881-1Quantifying the Effects of Network Improvement Actions on the Value of New and Existing Toll Road Projectshttp://tti.tamu.edu/documents/0-5881-1.pdf
Development, delivery, and operation of public infrastructure are becoming increasingly dependent on participation of the private sector. While revenue generating projects, such as toll roads, were traditionally developed and funded from the public sources, in recent years, as the public demand for new projects have exceeded the ability of the public sector to deliver them, the private investors have started to fi ll the gap between the need and the available infrastructure.
However, the participation of the private sector in public-private partnership (PPP) agreements is constrained by the availability of funds, thus putting the fi nancial institutions in the role of lenders in these agreements. The schemes of PPP agreements and the interaction among project participants are very complex. Due to this complexity, there are numerous associated risks, but one risk can be distinguished as the core of the project’s fi nancial feasibility: the revenue risk.
This research examines the correlation of the revenue risk and the three fi nancial instruments most commonly used in PPP agreements: bank loans, bonds, and real options. A new methodology that links transportation network planning parameters with fi nancial risk measures is proposed. This network-based valuation method provides a quantitative assessment of the impact of changes in the network structure on the fi nancial feasibility of toll road projects.
The valuation method developed in this research is a valuable tool, which has the potential to add to current practices of toll road modeling due to the following:
• It creates a solid basis for the objective assessment of the impact that decisions made by the public sector, regarding network improvements, have on fi nancial instruments.
• It provides a tool for quantifi cation of the impact of changes in the network structure on the project’s fi nancial feasibility.
• It builds a common ground that ensures that project managers and decision makers interpret the decisions made by the public sector in a meaningful manner, that is, the public sector, the private sector, and fi nancial institutions.
36

0-5930-1Potential Development of an Intercity Passenger Transit System in Texas – Report on Tasks 1-5http://tti.tamu.edu/documents/0-5930-1.pdf
Key Words:Intercity Travel, Intercity Transit, Intercity Passenger Rail, Intercity Bus, Corridor Planning, Rail Planning
Initial analysis of these results indicates that an improved rail system connecting DFW with San Antonio and DFW with Houston are the priority corridors for TxDOT to consider in developing a statewide transit system. This result is consistent with previous intercity passenger rail studies within Texas, which identifi ed these as the two major growth corridors. Questions still remain: Is it best to have rail service in an “inverted V” confi guration (or the Greek letter lambda, “Λ”)—directly linking the four major urban areas of the state via two lines from DFW as I-35 and I-45 do at present—or would a “T-shaped” confi guration linking Houston to the DFW-San Antonio corridor somewhere between Austin and Waco serve an even larger constituency by bringing the Bryan/College Station urban area into the proposed alignment? Another alternative confi guration would be to build Houston to Austin or Houston to San Antonio routes as well as the “inverted V” to create a “triangle-shaped” service that more directly serves the state’s four largest urban areas. The answer to which of these is more effective would largely be a tradeoff between the higher ridership generated by improved direct service and the cost to construct the additional infrastructure mileage that such a system would require.
Differences of opinion have also been expressed as to where the connection to Houston should be along the I-35 corridor and if a T-shaped system should be selected. While many people in San Antonio and on the southern end of the corridor would like to see the connection point to Houston in a two-corridor system be no further north than the Austin area, the results of this study, thus far, indicate that a more northern connection point in Waco or Hillsboro would more fully address the two highest ranked corridor intercity demand routes and better serve the growing DFW population base. Further study is needed to determine the most effi cient connection point between the two corridors for a T-shaped system.
The addition of an improved intercity bus service from El Paso to DFW is also indicated from the research results, until ridership grows to the point that rail service along all or some of the route could be supported. For example, rail service from DFW to Abilene could be added with feeder express bus services to and from Abilene to El Paso, San Angelo, Lubbock, and Amarillo in order to serve West Texas.
Further analysis planned for Year 2, regarding project phasing and interconnections with existing and planned rail systems, will refi ne and determine which segments of this conceptual intercity system might be economically feasible to undertake fi rst. For example, the completion of the Austin-San Antonio commuter rail service planned by the Austin-San Antonio Intermunicipal Commuter Rail District might suggest building the segments north of Austin prior to implementing service on the statewide system between those two cities. Likewise, if the efforts of the East Texas Corridor Council and the North Central Texas Council of Governmentsare successful in developing an intercity rail link in East Texas, the statewide system could instead focus on connections between the major urban areas, leaving regional rail systems to connect internal destinations. Alternatively, the same East Texas corridor to Louisiana and the one from Houston to Beaumont might be determined to be more vital since they can potentially connect the statewide system to improved interstate rail corridors being planned in the southeastern United States.
37
0-5930-2Potential Development of an Intercity Passenger Transit System in Texas – Final Project Reporthttp://tti.tamu.edu/documents/0-5930-2.pdf
Key Words:Intercity Travel, Intercity Transit, Intercity Passenger Rail, Intercity Bus, Corridor Planning, Rail Planning
This report describes the fi ndings of a research study of the potential for development of an intercity rail and express bus system in the state of Texas. Rather than focus on regional commuter or light rail systems radiating from urban areas, this project examined long distance intercity and interregional corridors to determine which are most likely to need additional intercity travel capacity in the coming decades. Specifi c corridor characteristics for 18 intercity corridors were examined. Ranking of the corridors based upon these characteristics identify those that may need added intercity transit capacity in the future. The underlying analysis of corridors is based upon several factors related to:current and future population and demographic projections along 18 intercity corridors in the state;projected future demand based upon forecasts by the Texas State Demographer and other state agencies; andcurrent transportation network capacity and routes for intercity highway, bus, air, and rail travel.
A preliminary concept plan was developed during the fi rst year of the project, and the second year focusedon determination of potential costs and benefi ts of implementing the concept plan or individual systemcomponents along each corridor.
When originally conceived, one task of this project called for the research team to propose a plan for phased implementation of an intercity passenger transit system—suggesting which corridors might be initial starter segments for long-term development. Several factors have prevented that element of the proposed research from being completed. First and foremost, new state and federal rail planning legislation were passed during the course of the research project, requiring that TxDOT conduct and produce separate passenger rail plans with very specifi c requirements. Among these requirements are the more detailed investigation of engineering and environmental issues and more detailed ridership studies along with public input from open public meetings. Because this detailed planning effort is on-going at the time that this report is being published, it would not be appropriate for this report to suggest that its fi ndings should supersede those determined through this traditional and more rigorous planning process.
In the discussion of intercity corridor rankings found in this report, several of the issues regarding confi guration of a core statewide rail system and the potential for phasing certain segments of the corridors based upon development of other, new transit systems, both within the state and nationally, was addressed. For example, implementation of successful commuter rail service between Austin and San Antonio could allow an intercity system to focus on the portion of the DFW to San Antonio corridor north of Austin in its initial stages. Passage of the Federal Passenger Rail Improvement and Investment Act (PRIIA) in late 2008 could also impact phasing of any Texas intercity passenger system. An example would be that federal grant funding for a High Speed Rail (HSR) or higher speed rail (incremental) improvement in an adjacent state could drive different decisions to be made within Texas on priority corridors. However, by concentrating on its own internal intercity passenger travel needs as has been done in this research, TxDOT can more readily make decisions regarding which of those multistate projects have the potential to benefi t travel within Texas. Consideration of the multimodal, systemwide nature of such planning (i.e. impacts on airports, highways, rail, and transit systems) must also be a part of these decisions.
Clarifying the roles that various levels of government and local transit agencies could play in the development of a statewide rail and express bus systems is vital in determining how such a system might be funded and implemented.
38

0-5948-1Roadside Sediment Control Device Evaluation Program: Technical Reporthttp://tti.tamu.edu/documents/0-5948-1.pdf
Key Words:Sediment Control, Sediment Retention Device, Erosion Control, Sediment Retention Effectiveness,Sediment Retention Device Testing Program
Based on the 2008–2009 test results researchers have developed an evaluation protocol for Sediment Control Devices (SCDs). This protocol is designed to effectively, consistently, and fairly test the many various types of SCDs available to TxDOT construction and maintenance divisions.
Preparing the channelThe testing channel should be cleaned and the soil in the installation zone resurfaced to match the channel profi le.
Installing the SCD: The SCD should be installed in the installation zone according to manufacturer’s instructions. (Note: In the absence of specifi c instruction from the manufacturer, SCD installation should be carried out according to the technicians’ discretion). Installation details like number of stakes, spacing between stakes, presence/absence of apron, trenching depth, and height of SCD after installing should be recorded.
TestingInstrumentation: Turbidity probes and bubbler tubes should be connected to the appropriate locations at the inlet and outlet. Technicians should ensure that the fl ow meters and turbidity meter are recording data correctly (Note: While connecting the turbidity probes and bubbler tubes, special care should be taken to ensure that the locations are dirt free).
Sediment preparation: No sediment should be added to 1500 gal of water in the mixing during this process.
Test Flow: Water should be released into the channel at a fl ow rate of ~ 60 gpm by controlling the butterfl y valve on the mixing tank. The valve should be closed and the fl ow of water into the channel stopped when water begins to overtop the SCD. The maximum fl ow rate at the outlet should be recorded and should determine the infl ow rate to be applied during performance testing on the SCD. For example, if the maximum fl ow rate observed at the outlet in 15 gpm, then the SCD falls in the 10–20 gpm fl ow category and a maximum infl ow rate of 20 gpm will be applied during performance testing on the SCD.
Performance testing on SCD: Three repetitions of this test should be conducted on the SCD before removing it from the installation zone.
Sediment preparation: Mix 12.5 lb of SIL-CO-SIL®49 and 12.5 lb of ball in 1500 gal of water to create sediment-laden water having a suspended solids concentration (SSC) of 2000 mg/L. The sediment-laden water should be kept stirred in the mixing tank until the test has ended.
Testing Flow: Water should be released into the channel, at a fl ow rate defi ned by the SCD fl ow category, by controlling the butterfl y valve on the mixing tank. The entire 1500 gal of sediment-laden water should be emptied into the channel. The test should continue until there is no water retained behind the SCD.
Data processing: Data from the fl ow meter and turbidity meter should be downloaded to the fi eld laptop. All relevant calculations should be performed using an Excel spreadsheet.
Data RecordingThe following data should be reported to TxDOT following each product evaluation: 1)Product installation details, 2)Flow-through rate (cfs), Maximum Flow Rate (gpm), 4)Ponding Volume (gal), 5)Turbidity (NTU) at the inlet and outlet, 6) SSC (mg/L) at the inlet and outlet, 7)Mass Loading (lb), and 8)Removal Effi ciency (%).
39
0-5949-2Bioretention for Stormwater Quality Improvement in Texas: Pilot Experimentshttp://tti.tamu.edu/documents/0-5949-2.pdf
Key Words:Stormwater Best Management Practice, Highway Runoff, Texas Highway, Roadsides, Low Impact Development
From the pilot testing, researchers drew the following conclusions:
Peak fl ow rate of effl uents was signifi cantly reduced compared to that of infl uents. The control box was the most effective, while the vegetated ones were moderately effective due to plant roots that increased soil infi ltration rates.
TSS, Pb, Zn, NH3-N, and E. coli were effectively removed while Cu, NO3-N, TN, and TP were not.
Negative removal performance for N, P, and Cu can be attributed to leaching from the soil/compost media.
Weeds emerged and dominated in the vegetation community.
The lessons learned from the pilot experiments include:
An ideal bioretention design should enhance plant roots and increase detention time.
To eliminate leaching of N and P or even Cu from bioretention, the use of compost should be minimized. A saturation zone at the bottom of the bioretention (not tested in this pilot experiment but suggested by previous studies) may further remove N from soil media.
Prolonged drought is one of the factors affecting the success of bioretention. The saturation zone could mitigate drought stress.
Red imported fi re ants will continue to prevail on Texas roadsides. The saturation zone may also suppress their infestation.
After observing the weed growth on the pilot bioretention boxes and the wet/dry conditions, it is clear that vegetation planted in bioretentions must be able to tolerate droughts as well as periodic inundation. Vegetation should also sustain mowing as it is typically applied on highways.
This research is unable to discriminate the performances (including survival and water quality) between different vegetation types. More studies are needed to identify suitable species that improve the performance of bioretention.
The next stage of the project, the fi eld demonstrations, will further clarify the benefi ts and challenges of bioretention in Texas highways. The information obtained in the next stage will help develop the bioretention design guidelines for TxDOT.
40

0-5955-2Characterization of In-Use Emissions from TxDOT’s Non-Road Equipment Fleet - Final Reporthttp://tti.tamu.edu/documents/0-5955-2.pdf
Key Words:Non-road Equipment, Diesel Equipment, Grader, Rubber Tire Loader, Excavator, Exhaust Emissions, NOx, Emissions Reduction, PEMS Testing
TTI researchers performed an extensive investigation to obtain information on emission reduction technologies, non-road emission reduction case studies, and non-road emissions resources. Based on the analysis of the collected information, fuel additive (FA) and hydrogen enrichment (HE) technologies were selected for initial testing, while selective catalytic reduction (SCR) technology was proposed for further testing. Findings from seven selected studies relevant to this research are also presented in this report. The NOx emissions of TxDOT non-road diesel equipment were calculated in Task 2. Also, various practices proposed and/or implemented for non-road emissions reductions by other states as well as by Texas were investigated and presented.
In consultation with the TxDOT project monitoring committee (PMC), the research team modifi ed the test protocol developed and presented in the Phase 1 report. The changes were made as a result of preliminary fi ndings that indicated that FA and HE were not effective for NOx reductions. Additional constraints also did not allow for testing with SCR, which is to be carried out as a separate research project. Thus, emissions testing of a total of six graders were conducted and the results discussed in this research.
Baseline and degreened (treatment level) NOx, HC, CO, CO2, and particulate matter PM emissions for the selected equipment were measured using SEMTECH-DS and Axion portable emission measurement units. The research team performed a series of analyses to characterize the emissions from the tested equipment. The operation of the graders were broken down into four operational modes: 1) driving at the maximum attainable speed, 2) driving at 20 mph, 3) leveling/grading, and 4) idling.
An average modal analysis was performed to quantify the average emissions impact of each unit. The NOx emissions rates from EPA guidelines were calculated and compared to the observed modal emissions rates. The results indicate that the tested TxDOT equipment (all tiers: Tier 0, 1, and 2) emitted less NOx emissions than estimated from EPA guidelines for non-road diesel equipment. Because of the high variability of data, the average modal results were found unsuitable for comparison purposes.
A two step prediction interval analysis was applied to second-by-second fuel-based emissions data. The analysis results indicate that neither hydrogen enrichment nor the selected fuel additive had any impact on NOx and CO emissions from graders. Both options appear to provide moderate reductions of hydrocarbon and PM emissions; however, the reduction of PM emissions happened at higher engine load conditions.
The results here are presented based on a few observations under the in-use testing conditions and thus should be treated only as indicators of the direction of the changes in emissions levels. Non-road equipment operates under conditions where the engine is required to power multiple tasks. Therefore, there is a very high variability of engine operation conditions, which affects the exhaust emissions. Due to this high variability, the exact amount of reduction in each case should be determined through engine dynamometer testing.
Since NOx is the focus of TxDOT emission reduction efforts and the two tested technologies did not show signifi cant results for NOx emissions, neither of the technologies are recommended to be utilized in TxDOT’s non-road fl eet. However, the fi ndings from the SCR testing (which is to be conducted in a separate research project) may prove promising in achieving NOx emissions reductions.
The research team also developed an optimization methodology that could be used for future deployment of emission reduction technologies. This methodology is fl exible and can recommend the most benefi cial deployment of technologies (or combination of technologies) for a fi xed budget. These fi ndings have applicability at a later stage if TxDOT fi nds suitable technologies (such as SCR) for deployment in the non-road fl eet.
41

0-5973-2Emerging Trade Corridors and Texas Transportation Planninghttp://www.utexas.edu/research/ctr/pdf_reports/0_5973_2.pdf
Key Words:Texas Corridors, Rail Cost Model, Maritime vessel costs, Texas Trade, Panama Canal
Transportation corridors are rarely entirely new. Typically trade uses well defi ned paths and modes as it moves across the global transportation system. Moreover, changes—even improvements— come at a cost that must be borne by several benefi ciaries and not a single provider. Improvements to ship design, port infrastructure, landside links, rail systems, and information technology require careful analysis, planning, and funding that all take time. This favors state-level transportation planning because it provides reasonable time “windows” in which to evaluate the issues and decide whether further appropriate actions need to be taken, such as joining the debate (as a public-private-partner) or incorporating data into current state plans to address future potential impacts.
Monitoring corridors is not technically challenging but it requires a consistent commitment, ensuring that the dynamic nature of the international transportation business is captured. A multi-level information system should be followed, based on inexpensive data sources.
This report identifi ed the predominant trade corridors carrying global trade to, and through, Texas in containerized form, as specifi ed in the study objectives. In addition, there are proposals for other corridors termed “emerging” that also should be monitored. The basic monitoring technique could be rather simple. A spreadsheet for each corridor should be used to record data on trade volumes, plans, funding sources, implementation strategies for improvements, and the key strategic points that would trigger a new TxDOT planning activity. These are termed “milestones” and work in the following way.
Data and information are collected to monitor the corridor and so allow time series analyses to be undertaken, and issues identifi ed where a major change in direction is noted. As an example, proponents of an emerging corridor wish to alert TxDOT to the need for new investments in Texas needed to support the predicted trade fl ows. If the proposed corridor data and information system were in place, planners could access it to confi rm the relevance and impact of the corridor. They would note a) steamship liner frequencies to the import gateway, b) terminal capacity at port, c) volumes of Twenty-Foot Equivalent Units (TEU), d) if served by rail, frequency of double-stack service, e) the location of entry into the state (in this case, border gateway), and f) subsequent modal state routes used. Very quickly a pattern of “needs” would arise, many of them lying outside state jurisdiction and some within agency responsibility. As an example, many import gateways are limited by capacity constraints that must be addressed before impacts are felt on the corridor. Typically, terminal investment proceeds in building increments of around a third of a million TEU, which can take years from conception to operation—Bayport, for example, took around a decade. This gives time TxDOT planners time to review their options and make changes, if necessary, to their planning and programming schedules.
Texas transportation planning will greatly benefi t from multiple corridors—actual and emerging—capable of handling international trade to and from the state. First, the state will not be faced with the investment programs needed to mitigate congestion from concentrated trade fl ows on a single corridor, like IH 710 in Long Beach. In addition, the equally important social costs associated with a congested corridor like IH 710 will be reduced. Marine international trade will benefi t from accessing a wide variety of foreign port to Texas corridor options capable of alleviating future congestion on the current east-west rail corridors. And even with NAFTA, other highway corridors will complement the IH 35 corridor; some rail based, using containerized systems. Finally, providing transportation services to the predicted centers of state population growth and the likely development of one or two mega-regions in the state over the next 30 years is greatly enhanced by the variety of modal corridors available to shippers. It is essential, however, that TxDOT continually monitors activities on all corridors so that its planners are in the best position to make a timely contribution to enhance their effectiveness.
42

0-5974-1Estimating Texas Motor Vehicle Operating Costshttp://www.utexas.edu/research/ctr/pdf_reports/0_5974_1.pdf
Key Words:Vehicle operating costs, Texas, light duty vehicles, fuel experiments, fuel consumption model, rolling resistance, Texas vehicle composition
A specifi c Vcost model was developed for Texas conditions based on a sophisticated fuel model for lightduty vehicles, several excellent sources of secondary vehicle cost data, and the ability to measure heavy truck fuel consumption through both experimental and survey work. The basic model was designed to address the relatively narrow range of pavement roughness found on the Texas highway network and is free-fl ow, and does not accurately measure congestion effects. The team developed a vehicle classifi cation scheme that was suitable for TxDOT planning and revenue forecasting. These resources led to the adoption of eight categories of light-duty vehicles and two heavy truck types. The current Texas fl eet composition was determined from 2007 vehicle title and registration (VTR) data and was made a default for model use. Each cost item associated with the representative vehicle was calculated for each year of operation up to 20 years. Six main cost categories are included in the Vcost model: depreciation, fi nancing, insurance, other fi xed costs, repair and maintenance, and fuel. These costs fall into two categories: fi xed and variable costs. The Vcost model can provide operating cost estimates for each specifi c representative vehicle as well as fl eets of vehicles. The model allows the user to change key parameters so that the cost calculation is specifi c to any particular situation, and can be updated as the economic or technological landscape changes. The model was designed to provide the user with a program that looked, felt, and operated in a similar fashion to most Windows programs and would be intuitive for the typical TxDOT user.
The Vcost model should now be tested within TxDOT with a variety of staff to facilitate both fi nal testing and iterative improvements to the basic model provided as a product of this work. The dynamic nature of vehicular design and the adoption of new technologies require further work to enhance the model so that it can be used over the next decade. 1. Include at least three levels of congestion, to be determined from TxDOT staff interviews, to allow the Vcost model to predict the increases in the per mile cost for each congestion level.2. Evaluate whether a regional dimension to the basic Texas Vcost calculations can be added to the model. Tire costs are higher in some areas of the state and if other cost differentials are noted by vehicle operators, further discrimination could be built into the model.3. The heavy truck portion of the Vcost model centers on the 5-axle, 18-wheel semitrailer truck because it dominates the state’s heavy truck vehicle miles traveled (VMT). It is recommended that a 3-axle rigid truck be added. The model could potentially be used for building a “made to order” heavy truck design based on attributes. The user would select an engine and transmission, axle numbers, vehicle weight, and other basic information and the model would calculate the cost per mile. 4. In 2010, the fi nal U.S. Environmental Protection Agency (EPA) truck engine requirements of the current decade for improving exhaust emissions will come into force. Further work would capture the impacts of the EPA requirement and keep the cost estimates up to date.5. Truck manufacturers are beginning to evaluate hybrid technologies being developed by transmission companies in an effort to reduce fuel consumption and exhaust emissions. Improving the Vcost sub-models for the differential, transmission, and engine to capture these recent technological advances is highly desirable.6. Finally, the light-duty auto and pick-up class is likely to incorporate several different “hybrid” technologies that would enable the Vcost model to be used over the next decade. At the outset of this work, mention was made of the two major contributions the results could make to TxDOT operations, namely economic engineering evaluations of different types and revenue estimation from fuel consumed in the state. The basic model reported as the product of this work should be enhanced to allow its utility as vehicle, engine, and transmission designs continue to evolve in the period 2010–2020.
43
0-5985-1An Evaluation of Mexican Transportation Planning, Finance,Implementation, and Construction Processeshttp://www.utexas.edu/research/ctr/pdf_reports/0_5985_1.pdf
Key Words:Mexico transportation planning, Mexico transportation fi nance, Mexico’s transportation infrastructure, 2007-2012 National Infrastructure Plan, public private partnerships, highways, commuter rail, ports, airports, inland ports and border planning
Historically, transportation within Mexico was developed independently and attention to network interconnections, either between or within modes, was lacking. Several recent administrations sought to improve the network; yet fi nancial constraints – i.e., Mexico’s budget is fi nanced with fl uctuating oil revenues from the state run oil company PEMEX – hindered Mexico’s ability to make long-term infrastructure investments.
The implementation of constitutional and legislative changes regarding development planning and fi nancing throughout the late 1990s and early 2000s and tax and budget reforms during 2006 changed this dynamic and established the groundwork for better transportation development.
As a consequence, Mexico is shifting to a new paradigm in how it manages and develops its transportation system. Since the late 1990s Mexico began to decentralize responsibility for planning from the Secretariat of Communications and Transportation (SCT) to the states, and the responsibility for much of the fi nancing and construction of projects to the private sector and autonomous public sector entities. SCT strengthened its internal process mechanisms and analytical capability and formalized a structured planning process. The use of two new infrastructure funds FARAC and FONADIN capitalized through Concessions and Public Private Partnerships (PPP) have also provided new fi nance mechanisms.
Mexico and the U.S. are at different positions in their network life cycles. Mexico is focused on completion of its network and integrating modes, while the U.S. is focused on maintenance of an aging system. This may lead to differing objectives for any proposed projects.
Mexico and the U.S. are facing challenges in fi nancing their transportation systems. Mexico’s PEMEX-reliant budget means transportation competes with other policy objectives. While private fi nancing relieved pressure on the Mexican government, it requires a robust global fi nancial market. In the U.S. gasoline taxes have been eroded by infl ationary effects because they have not been raised in over 15 years. The U.S. has utilized PPPs but there has been a backlash against them in some states. Transportation planners in states that border Mexico should be aware of the issues surrounding the underlying fi nancing of projects initiated.
Notwithstanding decentralization moves, Mexico is still a federally centered system that revolves around the presidential election every six years. Mexico’s strict term limits for public offi cials also play a role in the continuum of planning across multiple funding years/administrations occurring. Transportation planners should be aware of these dynamics, monitoring Mexico’s political/fi scal arena and long-term transportation infrastructure plans which impact trade corridors into the U.S.
Many of the projects in this study encountered environmental challenges as they were being planned andconstructed. Projects in Mexico also faced issues surrounding the acquisition of communal ejido lands. Thetiming of the environmental review, after ROW has been acquired, may also be problematic for U.S. partiescollaborating on projects leading to unforeseen costs and change orders. Contracts should be structured toprovide mechanisms for such eventualities.
The transportation systems of both countries have a long legacy of developments that took different courses yet arrived at remarkably similar destinations. This congruity underscores that the needs of the Mexican and U.S. populations from their transportation systems are similar and interdependent. Further integration of the transportation networks beyond the border zone is a necessity for improving the performance of both systems and their ultimate value to the population. Therefore continued and better cross-border planning is recommended to ensure enhanced network connectivity between the two countries.
44

0-6044-1Actual Vs. Forecasted Toll Usage: A Case Study Reviewhttp://www.utexas.edu/research/ctr/pdf_reports/0_6044_1.pdf
Key Words:T&R forecasts, toll roads, traffi c forecast, revenue forecast
Literature Review - The variability in forecasting traffi c for facilities that will rely heavily on traffi c and revenue (T&R) to support debt payment, has led to the rating agencies and the capital markets noting that “challenges remain”. As is evident from the literature, these forecasting uncertainties have been mainly attributed to the inability to obtain good data or incorrect modeling assumptions. It has been argued that the T&R industry is constantly adapting their model and approach to address previous sources of uncertainty. However, studies have concluded that the accuracy of T&R forecasting has not changed dramatically. Therefore, these changes have not resulted in a better product for the project owners, fi nancial markets, and investors.
Traffi c and Revenue Forecasting Approach - The introduction of tolling did not only require the altering or expansion of the traditional four-step model, but it also increased the focus on the model inputs, such as demographics, time savings, land use inputs, value of time inputs, traffi c growth rates (ramp-up period), and the actual model’s performance. This leads T&R consultants to a critical review of the input values obtained from the metropolitan planning organizations (MPOs) and the collection of additional data to allow for corridor specifi c analysis. Also, T&R fi rms typically use stated-preference surveys and more detailed origin-destination matrices to model a corridor specifi c forecast.
As mentioned before, there seems to be a general consensus that traffi c and revenue forecasting uncertainty does not stem from the models and methodology used, but rather from the model inputs and assumptions employed. However, the precise approach used by each T&R consultant to forecast toll demand is considered proprietary so it is impossible to explore whether the models used or the approach adopted introduces any signifi cant uncertainty in the process.
Research Methodology and Case Studies - The research attempted to replicate and extend the work conducted previously by fi nancial analysts at S&P and J.P Morgan. However, a replication of the work done by S&P was hampered by the fact that the analysts did not describe the research method in any detail. For example, S&P noted the use of initial forecasts, but it is unclear whether the forecasts were transactions, daily traffi c, or annual traffi c. Also, it is unclear if the facility opened in segments what was regarded as the fi rst year of operation, i.e., the opening of the fi rst section or the opening of the whole road? The researchers attempted numerous times to meet with the analysts to clarify the methodology, but were unsuccessful. Furthermore, the analysis was also complicated by the lack of information and specifi city included in the T&R reports.
Traffi c Revenue and Forecasting Uncertainties - This report identifi ed a number of variables and areas that require an improved understanding to ensure more reliable T&R forecasts for toll roads. It is clear that forecasting variables, such as population growth, land use, employment, value-of-time (VOT), and infl ation are very complex and severely infl uenced by external factors and unforeseen occurrences beyond the control of the T&R consultants. Nonetheless, there is a general lack of transparency concerning the assumptions, estimated values, and modeling methods used by T&R consultants that prevent a clear understanding of the key variables impacting T&R forecasts. Better notation of the key variables infl uencing T&R forecasts, the data sources used, the implicit assumptions, and the limitations of the modeling methods used are positive steps the T&R industry could take.
45

0-6065-1Integration of Utility and Environmental Activities in the Project Development Processhttp://tti.tamu.edu/documents/0-6065-1.pdf
Key Words:Utility Relocation, Utility Adjustment, Environment Process, Project Development Process
The review of environmental and utility activities included a review of manuals and business process diagrams, as well as meetings with stakeholders. The meetings with stakeholders also enabled the researchers to gather input from stakeholders about pressing utility and environmental issues and discuss potential strategies to integrate utility and environmental processes. In addition, the literature review and interviews facilitated an analysis of the potential impact of regionalization on the optimization strategies developed during the research and/or the integrated business process diagram.
During the review of current practices and subsequent meetings with TxDOT offi cials, the researchers identifi ed a number of potential strategies to integrate the utility and environmental processes and to integrate both processes into the project development process more effectively.
Involve environmental and right-of-way staff in planning and programming.
Establish planning advisory teams and support tools.
Coordinate environmental and utility data collection.
Enhance and coordinate preparation of scopes of services.
Require utility owners to verify utility facility information.
Gather some quality level B (QLB) data during preliminary design.
Include some drainage design elements during preliminary design.
Include some design elements during preliminary design.
Address utility issues in constructability review during preliminary design.
Develop and/or update curricula for utility coordination stakeholders.
An additional strategy discussed with stakeholders dealt with the need to integrate reference manuals at TxDOT more effectively to address the issue of project development process complexity expressed during the recent sunset review process. A review of several TxDOT manuals found issues such as redundancy and inconsistency in structure, information aggregation levels, activity code designations, and supporting documentation such as fl owcharts. To address the issue of redundancy and inconsistency, the researchers developed a conceptual framework that replaces the current “silo” approach for manuals at TxDOT with another approach in which the Project Development Process Manual becomes a central “bookcase” with thematic shelves that present detailed information related to a topic only once (in its corresponding shelf and volume).
The researchers developed an integrated environmental/utility business process model based on a detailed review of current practices, potential regionalization impacts, and the optimization strategies discussed previously. The development also included a prototype web-based application called TxDOT Business Process Explorer (TxBPE) to facilitate access to project development process information graphically.
A research objective was to measure the economic impact resulting from planned and unplanned utility adjustments, as well as extract information to infer potential economic benefi ts that would result from implementing the strategies discussed above. However, the type of data needed to conduct a traditional economic analysis was not available. The process of gathering, reviewing, and analyzing available cost data did enable the researchers to develop an understanding of the type and quality of relevant utility-related cost data that TxDOT collects, which, in turn, enabled the researchers to make general observations about specifi c defi ciencies and formulate recommendations for business process changes.
46

0-6095-1Potential Use of Longer Combination Vehicles in Texas: First Year Reporthttp://www.utexas.edu/research/ctr/pdf_reports/0_6095_1.pdf
Key Words:Longer combination vehicles, LCVs, road trains
Trucking remains the only major freight mode not to benefi t from increases in size and weight regulations since 1982. The need for more productive trucks—both longer less than truckload (LTL) and heavier (TL)—is growing with economic activity, rising fuel costs and concerns over environmental impacts from emissions. This study covers the fi rstyear activities of a two-year TxDOT-sponsored study into potential long combination vehicles (LCV) use in Texas. It describes current U.S. LCV operations and regulations, operational characteristics of various LCV types, safety issues, and environmental and energy impacts, together with pavement and bridge consumption associated with LCVs.
Methods to measure both pavement and bridge impacts on a route basis are described. A survey of current U.S. LCV operators provides an insight into business characteristics, vehicles, drivers, performance, and safety. The overall study benefi ted from three sources of direction: an advisory panel from TxDOT, an industry panel comprising heavy truck and LCV operators, and fi nally an academic team from the University of Michigan Transportation Research Institute. In the second year of the study, a series of routes and LCV types will be evaluated in Texas using methods developed in the fi rst year and approved at a study workshop.
The vehicle and operational characteristics of LCVs are important as they potentially impact traffi c congestion, vehicle offtracking, and traffi c operations. For example, the stability and acceleration speed of different LCV confi gurations may impact both traffi c operations and safety, while vehicle weights, dimensions, and connection types may infl uence a vehicle’s ability to perform basic traffi c maneuvers. It is, however, important to consider all of the potential operational impacts of allowing changes in truck confi gurations, as often changes that produce improvement in one area can lead to a worsening situation in another. For example, combination trucks with short trailer wheelbases and multiple articulation points, such as Triple Trailers, offtrack less than vehicles with longer trailers and fewer articulation points, such as Turnpike Doubles, but these vehicles are considerably more likely to roll over. One important benefi t from LCVs is the ability to lower ton-mile fuel consumption andso lower operating costs in a vital area of expense.
The major benefi t of LCV operations in the U.S. is an increased payload capacity that may yield greater revenue and productivity gains and therefore improve and stimulate business. Another primary benefi t of LCV operations is overall cost effi ciency that may stem from cost savings due to fuel effi ciency, a reduction in the number of drivers and tractors, and a reduction in the number of trips undertaken as well as a general time-savings benefi t.
47

0-6194-1Quantifying the Purchasing Power of Public Transportation in Texas: Technical Reporthttp://tti.tamu.edu/documents/0-6194-1.pdf
Key Words:Public Transportation, Public Transit, Cooperative Purchasing, Economic Impact
Many different entities provide public transportation services in Texas. In 2007, a total of 213 entities received federal and/or state funds to provide public transportation. Included in that total, 77 local government agencies received funds for public transportation services in urban and rural areas in the state, and 136 human or social service agencies received funds for TxDOT-funded client-based transportation services.
According to research documented in this report, the purchasing power of the 213 public transportation providers in Texas is more than $1.8 billion annually. Transit provider expenditures include more than $1.2 billion in operating expenses (2007) and almost $0.6 billion in capital expenses (average annual 2005–2007).
The estimated impact of expenditures for public transportation on the economy of Texas is based on the multiplier concept. The multiplier concept recognizes that when an expenditure is made, the initial direct outlay of money creates additional business activity and employment and generates household income and government revenue. The multiplier measures direct or initial spending, indirect spending, and induced effects.
The economic impact of public transportation on the economy of Texas is an estimated multiplier of 2.11. The $1.8 billion in annual expenditures generates more than $3.8 billion in direct, indirect, and induced economic impact in the state on an annual basis.
There is an increasing interest in cooperative purchasing in the transit industry at the federal, state, and local levels. The Federal Transit Administration (FTA) encourages transit agencies to procure goods and services jointly with other recipients to obtain better pricing through larger purchases. Grantees must follow the requirements of FTA Circular 4220.1F and are encouraged to reference the FTA Best Practices Procurement Manual.
Texas statutes allow local governments to contract with and between each other to provide governmental functions and services and to join together in contracting with others to provide goods and services. Local governments, including transit agencies, may also participate in state purchasing contracts established by the Texas Comptroller of Public Accounts. The Texas Comptroller of Public Accounts has published the State of Texas Cooperative Purchasing Manual to provide information about the State of Texas cooperative purchasing programs.
The Texas Comptroller of Public Accounts performs a variety of purchasing operations and customer services including awards for all statewide term and open market contracts. Texas Procurement and Support Services (TPASS) is a program of the Texas Comptroller of Public Accounts’ offi ce. TPASS awards and manages hundreds of statewide contracts on behalf of more than 200 state agencies and 1,700 local government agencies. Among the programs sponsored by TPASS are the State of Texas purchase card and fuel card.
The Texas Legislature passed legislation in 1995 authorizing Texas public agencies to use purchase and fuel cards. The Texas Comptroller of Public Accounts was assigned authority to administer state purchasing programs including the purchase and fuel card programs.
HGACBuy is a government-to-government procurement service sponsored by the Houston-Galveston Area Council. As a unit of local government assisting other local governments, HGACBuy has established competitively priced contracts for goods and services, provides customer service, and is compliant with state statutes. All units of local government, including non-profi ts providing governmental services, are eligible to join HGACBuy.
As a part of the research for this project, transit providers in Texas participated in a survey to document current practices in cooperative and green purchasing. A large percent of survey respondents said they are unaware of the variety of cooperative purchasing and green purchasing opportunities available through state and regional programs. Transit providers responding to the survey were asked to indicate interest in a demonstration project or implementation project for one or more of several possible topics. Researchers used survey results to select case study research topics: purchase cards and fuel cards, green purchasing, and vehicle maintenance.
48
0-6208-1Preserving the Functionality/Asset Value of the State Highway System: Technical Reporthttp://tti.tamu.edu/documents/0-6208-1.pdf
Key Words:Highway Functionality, Planning, Land Development, Operations and Capacity, Right-of-Way, Utilities, Safety
Most of the effective practices and programs in place today that help to maintain, restore, or enhance the functionality of highways are located in Transportation Management Areas (TMAs) or communities with active planning programs. In unincorporated areas of the state, the combination of a lack of local planning and proper authority to regulate access and site development combined with a business-friendly development climate are major contributors to deterioration of functionality. While TxDOT can address functionality through access management and highway design, a system-wide approach where cities, counties, and metropolitan planning organizations (MPOs) and TxDOT coordinate and work together toward common goals on functionality is needed.
The research identifi ed many new actions, changes, or additions to current practices and policies that are needed help to protect, restore, or enhance highway functionality. In statewide and MPO planning, statewide goals, policies, and objectives to support functionality as well as a policy on adherence to functionality standards and criteria should be added to TxDOT’s Statewide Transportation Plan (STP). MPOs should establish work and project priorities or strategies in their Unifi ed Planning Work Programs (UPWPs) that enhance functionality such as access management, context sensitive design, transit-oriented development, travel demand management, corridor management planning, and others.
In TxDOT and local planning, TxDOT should continue to implement its access guidelines through coordination in local development review and provide support to rural districts in these efforts. It should initiate corridor management planning with MPOs and local partners that include non-traversable medians, adherence to proper signal spacing thresholds, and connectivity between adjacent local streets and developments. Failing to protect or preserve right of-way early could preclude or signifi cantly delay new facilities or expansions. Early cooperative planning efforts should ensure that adequate right of way is planned to accommodate ultimate needs.
In the area of facility design and enhancement, TxDOT should continue its practice of improving regional links in the highway system with divided sections and all new highway loops or bypasses around communities should be planned and designed as controlled access facilities. As a statewide policy, surface arterials having three or more dedicated through lanes or existing or projected traffi c volumes in excess of 24,000 vehicles per day should contain raised non-traversable medians. Where possible, TxDOT should use minor geometric and operational enhancements such as restriping, auxiliary lanes, ramp metering, and braided ramp confi gurations as faster, lower cost options to address bottlenecks and congestion.
The development and implementation of corridor access management plans by the Houston District and the Houston Galveston Area Council of Governments (HGAC) on an annual basis is a practice that should be expanded and followed by other districts and MPOs in the state.
49

0-6210-1Tour-Based Model Development for TxDOT: Implementation Steps for the Tour-Based Model Design Option and the Data Needshttp://www.utexas.edu/research/ctr/pdf_reports/0_6210_1.pdf
Key Words:Implementation of a tour-based model system, Data needs for tour-based modeling
The main sources of data required for the implementation of the tour-based model design are household activity and/or travel survey, land-use data, and transportation network and system performance data—the same data currently being used for the development and/or updating of the trip-based models. The land-use and the transportation network and system performance data require no/very little additional processing to be used in the development of the tour-based model. The household activity and/or travel survey data requires additional processing to form tours from trips recorded in the travel diary.
The models in the tour-based model design can be grouped into three categories: 1) Population synthesizer and the long-term choice models, 2) Activity-travel generation module, and 3) Scheduling module.
The population synthesizer generates synthetic population and households that are allocated to the traffi c analysis zones (TAZs). The long-term choice models include work location choice model and household vehicle ownership model. For each synthetic individual and household, the long-term choice models predict work location and the number of vehicles owned by a household, respectively. The outputs from the population synthesizer and the long-term choice models are used as inputs in the subsequent models.
The activity-travel generation module provides a list of all the activities, tours, and trips generated by a household in a day. The generated tours and trips are scheduled using the scheduling module. For each tour generation and scheduling module, the model development steps are provided, including analytical methods to model travel patterns, econometric framework, choice alternatives, possible explanatory variables, and calibration (and validation) criteria.
The core model system may be developed using software programs such as Visual C++, interfaced with TransCAD and the Texas Package.
50

0-6210-2Tour-Based Model Development for TxDOT: Evaluation and Transition Stepshttp://www.utexas.edu/research/ctr/pdf_reports/0_6210_2.pdf
Key Words:TxDOT travel demand modeling, Tour-based modeling
In the previous chapters of this project, the research team recommended two design options for the development of a tour-based travel demand model system: Design Option #1 and Design Option #2. Design Option #1 was chosen by the project monitoring committee (PMC) as the preferred framework for the possible implementation of a tour-based travel demand model system for TxDOT. In this report, the details of implementing Design Option #1 for Texas metropolitan planning organizations (MPOs) are provided. The main sources of data required for the implementation of the Design Option #1 are household activity and/or travel survey, land use data, and transportation network and system performance data—the same data currently being used for the development and/or updating of the trip-based models. The land use and the transportation network and system performance data require no/very little additional processing to be used in the development of the tour-based model. The household activity and/or travel survey data requires additional processing to form tours from trips recorded in the travel diary. The necessary steps for tour development are also outlined in this report.
The models in Design Option #1 can be grouped into three categories:(1) Population synthesizer and the long-term choice models(2) Activity-travel generation module(3) Scheduling module
The population synthesizer generates synthetic population and households that are allocated to the traffi c analysis zones (TAZs). The long-term choice models include the work location choice model and household vehicle ownership model. For each synthetic individual and household, the long-term choice models predict work location and the number of vehicles owned by a household, respectively. The outputs from the population synthesizer and the long-term choice models are used as inputs in the subsequent models.
The activity-travel generation module provides a list of all the activities, tours, and trips generated by a household in a day. The generated tours and trips are scheduled using the scheduling module. For each tour generation and scheduling module, the model development steps are provided, including analytical methods to model travel patterns, econometric framework, choice alternatives, possible explanatory variables, and calibration (and validation) criteria.
The core model system may be developed using software programs such as Visual C++, interfaced with TransCAD and the Texas Package.
51

0-6225-1Analysis and Recommendations on Protecting Waterways From Encroachmenthttp://tti.tamu.edu/documents/0-6225-1.pdf
Key Words:GIWW, Smart Development, Encroachment, Developer
The importance of the Gulf Intracoastal Waterway (GIWW) to trade and commerce in Texas and the United States cannot be overemphasized. It is the metric that the federal government utilizes to determine waterway maintenance funding. Therefore, it is imperative that the GIWW and other Texas commercial waterways do not get overconsumed by waterfront development. Waterfront development should be done smartly to co-exist with commercial traffi c. This study discusses the stakeholders in the waterway, the concerns they have about hazards to navigation, and the recommendations to permitters and developers on ways to improve the maintenance of this transportation corridor.
The impact of this study is to begin to develop and permit “smart” development with regard to navigation. Hopefully, there will be better cooperation between governmental agencies on permitting development and a focus on the agglomeration, clustering, and density of development along the waterways. Additionally, there should be increased cooperation between developers, governmental agencies, and the barge industry in maintaining the GIWW for its primary use of moving goods effectively and effi ciently to promote and support Texas and U.S. commerce.
This study has:Identifi ed specifi c areas of concern for navigation through the use of incident data, survey fi ndings, and physical inspection. These areas include Aransas, Calhoun, Matagorda, Galveston, and Jefferson Counties. In Galveston and Jefferson Counties, the cause of concern relates to a high volume of commercial traffi c and bridge infrastructure in the waterway. In the other counties, the main cause for concern is the shoreline development that brings structures into the waterway and creates a hazard for navigation.
Identifi ed potential future development that would negatively impact navigation in the GIWW.
Illuminated the current permitting process for shoreline structures along the water, recommending additional criteria for consideration.
Recommended better coordination of permitting among government agencies.
Recommended better disclosure to property owners of the risks to structures near and in the waters.
Suggested a better type of structure and locations to be considered by developers.
Suggested that the accumulated effects of all permits should be considered in new permit applications.
Several questions that are beyond the scope of this project surfaced and potentially need more study. They are:Should vessel operators promote educational programs for recreational boater safety?
Should a monitoring program for vessel traffi c levels and operations be employed to better understand the concerns to navigation?
Should an evaluation of the effi ciencies or capacity of the waterway (including the total miles of shoreline development and number and location of current mooring facilities) be made?
52

0-6608-2Integrating the Transportation System With a University Campus Transportation Master Plan: A Case Studyhttp://tti.tamu.edu/documents/0-6608-2.pdf
Key Words:University Campus Master Plan, Transportation System, Pedestrian Safety, Transportation System Integration, Best Practices
Case study results and conclusions were presented to TxDOT and UTEP at the conclusion of the research project. The overall fi ndings of the study involve the UTEP campus master plan as a case study on how the transportation system integrates with the surrounding system. A multiresolution simulation modeling methodology provided output of existing and future transportation system scenarios as they pertain to both the transportation system integration and interactions between modes within the university campus. The fi ndings of the simulation, along with the accident reports, surveys conducted, and site investigation throughout the campus will help both university campus planners and various stakeholders in the region in determining optimal transportation strategies for both the campus setting and the surrounding areas. In addition, the results can assist the university in allocating funding for proposed projects and provide specifi c guidance to safety concerns around campus as they pertain to all modes of transport. Recommendations were made for traffi c control, pedestrian crossings, transit routes, bike/walk paths, and infrastructure improvements.
Traffi c ControlTraffi c control strategies for various intersections were analyzed based upon the research performed. Four key intersections were analyzed for traffi c throughput, concentration of pedestrian crossings, and proposed new parking facilities for the southern portion of the campus.
Pedestrian CrossingsResearchers also recommended signalized crosswalks at three locations around campus. The research team also recommended two pedestrian bridges.
TransitThe current miner metro transit system routes do not enter the center core of the campus due to heavy pedestrian fl ow at the intersection of Hawthorne St. and W University Ave., especially during time periods between classes. In general, all vehicular traffi c stopped at this intersection is severely delayed due to pedestrian traffi c. Miner metro shuttle routes do not enter the campus core due to this impedance. The research team proposed four alternative campus shuttle routes to service various locations on campus. In addition, stop points for each route were also provided.
Walk And Bike PathsThe research team recommended enhancing UTEPs existing campus walkways. The current campus infrastructure has three on-campus outdoor walking trails where designated pathway and distance traveled are marked. However, pathway markings are not highly visible, and certain sections have inadequate sidewalk width to accommodate both pedestrians and bicyclists. The research team recommends that all designated walkway sidewalks be upgraded to accommodate both pedestrian and bicyclists. In addition, outdoor-shaded seating is recommended on Rim Rd. and W Schuster Ave. Furthermore, it is recommended that UTEP begin an outreach program to surrounding neighborhoods to utilize the pathways and provide free parking during off-peak campus hours.
Infrastructure Improvement RecommendationsThe research team proposed several roadway improvements that coincide with the university campus master plan. However, there are project specifi c improvements at various locations that came as a result of data acquisition and analysis.
Transportation Improvements Prioritized ListThe TTI researchers developed a prioritized project list based on the various recommendations given with the purpose of improving issues such as pedestrian safety and traffi c congestion within and around the campus.
53
0-6608-3Integrating the Transportation System With a University Transportation Master Plan: Best Practices and Lessons Learnedhttp://tti.tamu.edu/documents/0-6608-3.pdf
Key Words:University Campus Master Plan, Transportation System, Pedestrian Safety, Transportation System Integration, Best Practices.
In conducting the analysis of the UTEP case study, the research team was able to identify a number of interrelated issues that must be considered when analyzing and planning the integration of the regional transportation system with a university campus transportation system. These issues are primarily related to the way data collection, public surveys, multi-resolution modeling, and crash analysis are conducted. Data should be collected during regular campus sessions in order to capture the true dynamics of the various mode interactions in and around campus. Researchers should collect traffi c and pedestrian counts during the highest peak periods at all major intersections and access points that surround the campus perimeter. In addition, data should be collected on several different days of the week, as campus schedules differ between days of the week and this is refl ected in overall congestion and traffi c patterns. Researchers should perform site investigations of the overall campus infrastructure, documenting all related issues including infrastructure accessibility and condition, parking trends, vehicle-pedestrian confl ict areas, neighborhood conditions, lighting, and the overall geometric design of the system.When conducting a crash analysis, researchers should collect crash reports from both university campus and local police departments. When collecting crash data around a university campus, researchers will need to fi lter out minor “fender-bender” accidents that only require an insurance claim against more severe accidents that may or may not include injuries at different levels. This is necessary to identify localized crash hot-spots that may contribute to the frequency and severity of the accidents. In addition, when collecting crash data from several different resources, researchers must realize that crash data are documented in different ways by different agencies and different individuals. Therefore, campus and local police departments must establish uniform reporting procedures to generate consistent data that will facilitate the identifi cation of crash hotspots.When conducting any sort of survey on a university campus, researchers must anticipate the need for approval from the Institutional Review Board (IRB). This is necessary when conducting any sort of research involving human subjects (i.e., surveys) to ensure that the rights and welfare of subjects are protected and the survey is in compliance with federal, state, and university regulations. Surveys not disclosing any information that can be tied back to the respondents may be considered as “exempt” and not need to be reviewed by the entire IRB committee. However, time is still needed to review the application documentation and therefore researchers should consider and account for this in the overall project timeline.When considering modeling a university campus and the surrounding transportation system, several issues must be addressed ahead of time. Usually, a regional travel demand model can be obtained from local metropolitan planning organizations (MPOs) to determine projected future traffi c conditions. However, travel demand models are static and cannot perform a temporal analysis of traffi c at any given time slice (e.g., morning peak); therefore, a dynamic simulation model is needed. Regional travel demand models can be converted to mesoscopic Dynamic Traffi c Assignment (DTA) models where traffi c congestion can be analyzed at various time periods under different conditions. DTA models can refl ect the changes in traffi c patterns by rerouting vehicles based upon existing conditions or network changes. These types of models do not have the fi delity to perform detailed analysis of individual vehicle interactions or pedestrian-vehicle interactions and therefore micro-simulation is needed.Microscopic models can simulate multiple modes of transportation simultaneously and can be used to analyze parking lot distribution, various types of traffi c control for pedestrians, or speed reduction areas. Yet microscopic models are not large enough to capture the dynamics of traffi c rerouting based upon regional changes (e.g., tolling on freeway redistributes traffi c to and from the freeway). Researchers need to use multi-resolution modeling methods to capture both the system-wide and localized interactions in and around a university campus. However, there may be instances where the regional models do not have the inner university campus modeled, only the perimeter streets. In these types of situations, the microscopic models must be created from scratch, and origin-destination matrices should be created based upon data collection and surveys to determine campus entrance and parking.
54

Safety and Operations
RMC 4results
RMC 4 - Safety and OperationsFocus Areas• Geometric Design• Illumination • Pavement Marking • Railroad Crossing Safety • Roadside Safety • Roadway Signing & Delineation • Traffi c Control Devices • Traffi c Management & Operations • Work Zone Safety
55

0-4703-7Development of Safety Performance Monitoring Procedureshttp://tti.tamu.edu/documents/0-4703-7.pdf
Key Words:Highway Design, Highway Safety, Freeways, Urban Streets, Rural Highways, Types of Intersections, Ramps (Interchanges)
Highway safety is an ongoing concern to the Texas Department of Transportation (TxDOT). As part of its proactive commitment to improving highway safety, TxDOT is moving toward including quantitative safety analyses earlier in the project development process. The objectives of this research project are: (1) the development of safety design guidelines and evaluation tools to be used by TxDOT designers, and (2) the production of a plan for the incorporation of these guidelines and tools in the planning and design stages of the project development process.
This document summarizes the research that was conducted and the products that were developed during this six-year research project. It also describes a plan to incorporate safety design guidelines and evaluation tools into the project development process. It is intended for use by engineers responsible for the planning and design of streets and highways.
56

0-5210-5Crash Testing and Evaluation of TxDOT Burn Ban Signshttp://tti.tamu.edu/documents/0-5210-5.pdf
The slip base sign support systems with attached burn ban signs satisfi ed the impact performance evaluation criteria of NCHRP Report 350.
In the three high-speed tests performed on different burn ban sign confi gurations, secondary contact of the sign support system with the roof resulted in substantial deformation of the occupant compartment ranging in magnitude from 4.8 inches to 5.6 inches. These deformation levels are less than the 6-inch roof deformation threshold established by FHWA based on accepted testing of various breakaway sign support and luminaire poles. However, they are signifi cantly greater than roof deformations typically associated with impacts of slip base sign support systems.
After examination of the test results, the extent of roof deformation is primarily attributed to the use of a slip base with a small, 4 square foot aluminum confi rmation sign rather than the addition of the burn ban signs to these systems. It was concluded that the small size and light weight of the confi rmation sign substrate decreased the height of the center of mass and mass moment of inertia of the support system. This adversely infl uenced the trajectory of the support post and increased the severity of interaction with the vehicle by lowering the point of rotation and increasing the rotational velocity of the released support post.
Historically, and primarily due to economic considerations, slip base sign supports have only been used for larger sign panels (e.g., area greater than 10 square feet). With an increase in the size of the sign panel, there is a corresponding increase in the sign panel weight and length of the support post, both of which tend to increase the height of the center of mass and mass moment of inertia. This increases the height of the point of rotation and decreases the rate of rotation of the released support, which tends to shift the point of secondary contact further rearward on the vehicle and decrease the severity of this contact. In tests of the Texas slip base with a 16 square foot plywood sign panel mounted at a height of 7 ft from the ground to the bottom of the sign, the released sign support system rotated above the impacting vehicle without any secondary contact at all.
A recent review of district practices by the Traffi c Operations Division noted that some districts were using the Texas slip base for all small signs, even those having an area less than 10 square feet. The motivation behind this practice was to reduce inventory associated with multiple types of supports and simplify maintenance training and operations. Thus, the smallest, lightest sign panel being used with the Texas slip base support is a 24 inch 24 inch aluminum confi rmation sign. Until this project, TTI researchers were not aware of any crash testing of slip base supports with signs this small.
Although the slip base support with 24 inch 24 inch aluminum confi rmation sign was found to satisfy NCHRP Report 350 impact performance requirements, it may be appropriate to limit the minimum sign area on slip base supports to achieve a reduction in occupant compartment deformation caused by secondary contact of the released support system with the roof of the impacting vehicle. It is recommended that an expanded investigation using engineering modeling and full-scale crash testing be undertaken to more fully examine the performance limits of slip base sign supports in terms of sign panel size, mass, and mounting height. The compatibility of other vehicle types (e.g., pickup truck) with the slip base with small signs could also be evaluated.
Key Words:Sign Supports, Roadside Safety, Crash Testing
57
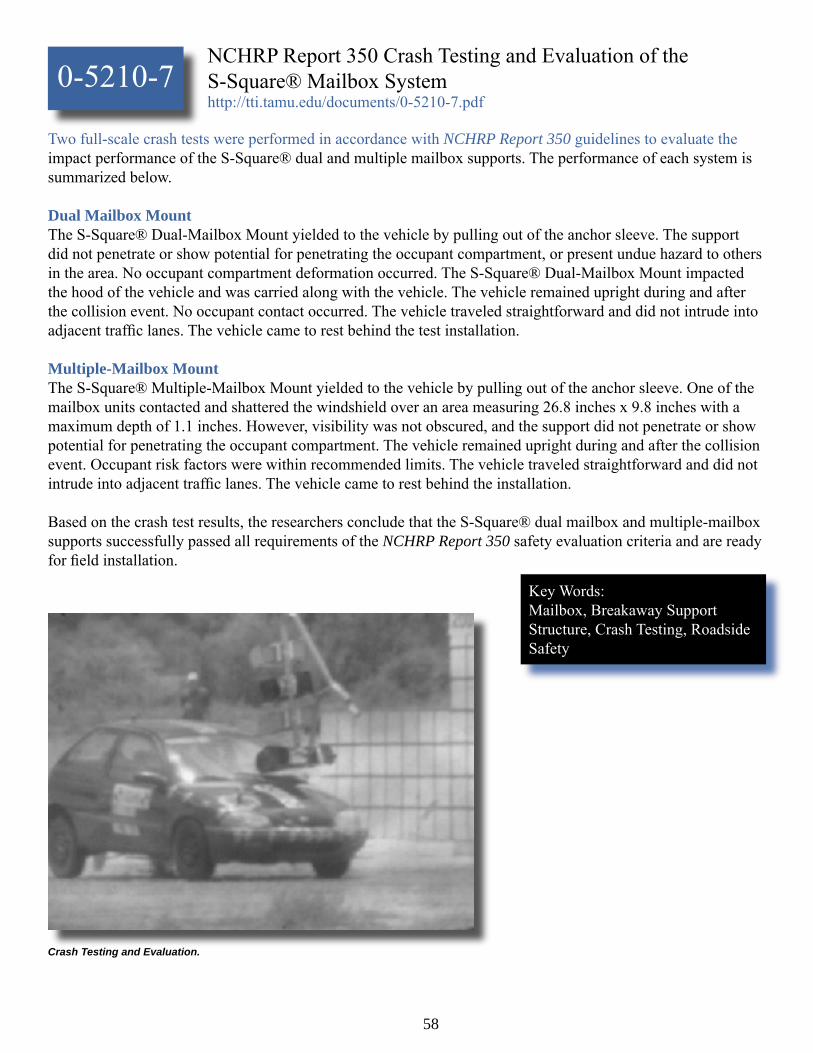
0-5210-7NCHRP Report 350 Crash Testing and Evaluation of the S-Square® Mailbox Systemhttp://tti.tamu.edu/documents/0-5210-7.pdf
Two full-scale crash tests were performed in accordance with NCHRP Report 350 guidelines to evaluate the impact performance of the S-Square® dual and multiple mailbox supports. The performance of each system is summarized below.
Dual Mailbox MountThe S-Square® Dual-Mailbox Mount yielded to the vehicle by pulling out of the anchor sleeve. The support did not penetrate or show potential for penetrating the occupant compartment, or present undue hazard to others in the area. No occupant compartment deformation occurred. The S-Square® Dual-Mailbox Mount impacted the hood of the vehicle and was carried along with the vehicle. The vehicle remained upright during and after the collision event. No occupant contact occurred. The vehicle traveled straightforward and did not intrude into adjacent traffi c lanes. The vehicle came to rest behind the test installation.
Multiple-Mailbox MountThe S-Square® Multiple-Mailbox Mount yielded to the vehicle by pulling out of the anchor sleeve. One of the mailbox units contacted and shattered the windshield over an area measuring 26.8 inches x 9.8 inches with a maximum depth of 1.1 inches. However, visibility was not obscured, and the support did not penetrate or show potential for penetrating the occupant compartment. The vehicle remained upright during and after the collision event. Occupant risk factors were within recommended limits. The vehicle traveled straightforward and did not intrude into adjacent traffi c lanes. The vehicle came to rest behind the installation.
Based on the crash test results, the researchers conclude that the S-Square® dual mailbox and multiple-mailbox supports successfully passed all requirements of the NCHRP Report 350 safety evaluation criteria and are ready for fi eld installation.
Key Words:Mailbox, Breakaway Support Structure, Crash Testing, Roadside Safety
Crash Testing and Evaluation.
58

0-5446-3Driver Comprehension of Managed Lane Signinghttp://tti.tamu.edu/documents/0-5446-3.pdf
The survey revealed several important aspects of drivers’ comprehension of signs for toll and managed lanes facilities.
Advanced destination signing is an important determinant of whether drivers will use a managed lane or not. Distance – Destination signs and Interchange Sequence Signs should be provided in advance of all access points to and from managed lanes.
Interchange sequence signs for managed lane exits may need to be made more distinct to avoid confusion with signing for the general purpose lanes.
The HOV Diamond Symbol in the corner of signs is still misunderstood by 15-25 percent of drivers to mean “Offi cial Vehicles Only.”
The text HOV was well understood by over 90 percent of participants.
The survey method used here was slightly different than TTI has used in past studies. The use of computer animation holds promise to simulate the time pressure of actual driving. The researchers did learn from this survey, however, that adjustments in the size of signs and the animation speed may need to be made to provide adequate reading time of signs. Large overhead guide signs can be read up to 1000 feet away in daylight conditions. At freeway speeds this provides roughly 10 seconds of visibility time within the range of legibility. On actual roads, drivers make a series of short fi xations on signs interspersed with glances to the roadway. So, the total amount of time a driver fi xates on a sign summed across these multiple glances may be 5 seconds or less.
The signs used in the computer animations in the current study were legible for approximately 5 seconds. The size of the signs was to roadway scale, and the animation speed was equivalent to 60 mph. Despite this, many participants reported that the signs were too small or went by too quickly to be read and comprehended, particularly for the trials early in the experimental session. Future computer animations may overcome this by slowing down the speed to allow more time with the signs in view, or by re-scaling the signs so that they can be viewed at a greater virtual distance. Providing a practice animation containing non-test signs also would allow participants to become acquainted with the scenes and animation speed prior to actual testing.
Another methodological consideration is in the wording and administration of the instructions. Prior to each video clip, text appeared on the screen providing instructions to the participants and describing the driving scenario to keep in mind while viewing the video. It was clear from the results that some participants did not read this description carefully. Although the text told them they had a passenger in the car, some respondents indicated that they did not meet high occupancy vehicle (HOV) requirements. Future studies should have the experimenter provide critical scenario information verbally to ensure that all participants understand the instructions.
Key Words:Managed Lanes, High Occupancy Toll (HOT) Lanes, Toll Roads, Traffi c Sign Comprehension,Computer-based Survey
59

0-5485-1Evaluating and Improving Incident Management Using Historical Incident Data: Case Studies at Texas Transportation Management Centers http://tti.tamu.edu/documents/0-5485-1.pdf
Applying the Evaluation/Planning Analysis Modules of the Guidebook Developed from this StudySeveral incident data attributes are useful for incident characteristics reporting. Major considerations are the type of data, time scale used in the analysis, data validity, reporting objectives, and reporting frequency.The appropriate hot spot analysis method should be based on data availability and the objectives of the analysis. Consider the frequency-based method if the agency’s priority is to reduce the frequency of incident occurrences. Consider the attribute-based method if the agency’s priority is to evaluate and improve the incident management performance of relevant entities based on the attributes of interest (e.g., reducing the incident duration, improving the incident response time, etc.).An agency can use combined incident and traffi c data to evaluate incident impacts from both system and travelers’ perspectives. From a system perspective, an agency can estimate the amount of traffi c delay caused by an incident or the time it takes for the traffi c fl ow to resume normal conditions. From travelers’ perspectives, an agency can account for travelers’ anticipation with the concept of background travel time.Delay index is defi ned as a ratio of incident delay to expected incident-free travel time. The delay index profi le can account for the impact of incidents over time with respect to travelers’ anticipation. An agency should consider multiple metrics for describing the performance of the facilities and operations of the transportation management centers (TMCs). Potential uses of these metrics include traveler information provision, operations evaluation, resource evaluation, safety evaluation, monitoring, planning, and customer satisfaction measurement.An agency can predict the incident duration with reasonable degree of accuracy if the detailed incident characteristics are available.Several incident characteristics were very useful for predicting incident duration, but incident type and lane blockage characteristics were major determinants for selecting appropriate models.The incident prediction models must refl ect the standard operating procedure that TMC operators use in logging incident data.
Applying the Predictive Analysis Modules of the GuidebookAn agency can predict incident-induced congestion clearance time using the combined historical and real-time traffi c data and the characteristics of an ongoing incident.Researchers’ analysis indicated that the method for predicting incident-induced congestion clearance time is most sensitive to the estimated incident duration and the incident-induced traffi c diversion rate.
Enhancing the Utility of the Incident Database for Incident Management and Performance Monitoring EffortsRecord the number of lanes blocked along the total number of lanes available at the incident location.Develop consistent defi nitions of all incident data attributes and standardized data entry procedures for Texas TMCs.Traffi c and weather data are generally available in real time but from different data sources. Consider integrating these two data sources directly into the incident data archive.
Key Words:Transportation Management Center, Incident Data, Performance Measures, Freeway Operations, Incident Management, Incident Impact
60

0-5578-1Assessment and Validation of Managed Lanes Weaving and Access Guidelineshttp://www.uta.edu/ce/faculty/williams/report0-5578-1.pdf
Key Words:Managed Lane Access, Freeway Weaving, Microscopic Simulation, Weaving Capacity
Throughout the simulations, researchers found that the ramp to managed lane fl ow (vrm) (or the managed lane to ramp fl ow (vmr), in the case of exit ramps) is the key factor to consider when establishing the proper value for the distance between the right-side ramp and the access point for the managed lane.
The ramp fl ow itself (vr), which includes the traffi c weaving over to the managed lane, has a signifi cant impact on the capacity of the ramp junction (i.e., in the immediate vicinity of the ramp), which, in turn, can impact the weaving distance for the managed lane, especially at high ramp fl ows.
In conditions with no intermediate ramps between the entrance ramp and the access to the managed lane (or between the access point and the exit ramp), maximum capacity was guaranteed for distances of 4000 feet. (In many cases, maximum capacity was found for shorter distances.)
The fl ow from the general purpose lanes to the managed lane (vfm, or vmf in the case of exit ramps) was found to have little impact in this work. However, if the access point to the managed lane is modelled as a Type A weaving area instead of an exit or entrance ramp, a more signifi cant impact may be found. This should not have a large impact on the required distance between a right-hand entrance ramp and the access point (or between the access point and a right-hand exit ramp) because the capacity problem will be the ability of the vehicles to weave into the managed lane.
Researchers also found that the impact of trucks in the traffi c stream appears to be larger than what is predicted by the Highway Capacity Manual for level terrain.
The presence of intermediate ramps tend to decrease the capacity, with a greater effect found when the intermediate ramp is close to the entrance ramp or close to the exit ramp. This is likely due to the concentration of fl ows in the right lanes of the general purpose lanes in the vicinity of the ramps. The impact is more pronounced at higher ramp fl ows, as well.
Video image of weaving area.
61

0-5609-1Performance Evaluation of Cable Median Barrier Systems in Texashttp://tti.tamu.edu/documents/0-5609-1.pdf
From a capital cost and life-cycle cost perspective, cable barrier is an attractive option compared to concrete median barrier.
There has been a lack of coordination between TxDOT and emergency responders during the project planning and maintenance phases of cable barrier system projects.
Maintenance costs and personnel requirements for cable barrier systems can be substantial and constrained maintenance budgets and personnel availability for frequent repair needs are issues.
Cable barriers are performing extremely well and have had very few cases of penetration unless there were nonstandard impact conditions. Researchers believe that the cable barriers are functioning according to their intended design and are restraining vehicles that impact them in fashions similar to NCHRP 350 crash-testing guidelines.
The installation of cable barriers has produced signifi cant benefi ts with a reduction of 18 fatalities and 26 incapacitating injuries in the fi rst full year. This reduction equates to an almost $46 million economic benefi t based on current crash cost values used in evaluation of projects for safety funding.
Due to problems experienced in Texas and other states, soil conditions should be considered as part of the project development process for cable barrier system installations.
Key Words:Cable Barrier, Wire Rope, Median Barrier, In-Service Performance Evaluation, and Safety.
Simple Repair of Impact on IH 10 in Boerne.
62

0-5619-1Capacity and Road User Cost Analysis of Selected Freeway Work Zones in Texashttp://tti.tamu.edu/documents/0-5619-1.pdf
Key Words:Work Zone, Capacity, Road User Cost, Freeway
For Roadway Capacities in Work Zones Roadway capacity is reduced by about 20 percent within a work zone.
The confi guration of the work zone (i.e., number of lanes open versus lanes closed) does not have a signifi cant impact on the per lane capacity in the work zone.
As the level of work activity increases, the capacity within work zones can decrease.
For work zone planning purposes, the per lane capacity values should be used as guidance in determining impacts of lane closures in work zone traffi c.
For Software to Model Lane Closure While the QUEWZ-92 model tended to underestimate the work zone capacity, its performance was not much worse than the other models reviewed for “linear” modeling. However, should TxDOT decide to use it on a statewide basis, it should be updated to a Windows environment operating system.
In cases of a more complex “linear” work zone requiring more robust analysis, Kim’s model should be used. Although it is a series of equations, these could be combined into a more user friendly spreadsheet product for implementation.
For projects in which the analysis of adjacent detour routes is necessary, it is recommended that QuickZone be used for a comprehensive network impact analysis.
When planning and designing long-term pavement rehabilitation projects, TxDOT should consider using the CA4PRS product as a decision-support tool to reduce highway construction time and the resulting traffi c impact.
For Road User Cost Estimations As the QUEWZ-92 program does not accurately predict road user costs, Jiang’s model should be used for delay cost estimation within the work zone. However, a set of spreadsheet applications need to be developed for ease of use.
If TxDOT pursues upgrading the QUEWZ-92 software to the Windows operating system, that effort should include a refi nement of the user cost estimation process.
For network wide user cost impacts, the outputs of QuickZone and CA4PRS are suffi cient.
For Emission Measures Emissions analysis is likely required for a limited number of projects.
Only the VISSIM model can provide particulate emission measures.
For Implementation TxDOT has not provided statewide training in completion of road user costs studies for construction projects since 1999.
Because of the federal mandate to reduce work zone delays, TxDOT should consider developing an updated training program for disseminating this information as well as hands-on use of the recommended work zone road user cost estimation packages to assure statewide consistency.
63

0-5860-1Guidelines for Spacing Between Freeway Rampshttp://tti.tamu.edu/documents/0-5860-1.pdf
Key Words:Freeway, Ramp Spacing, Weaving
Existing geometric design guidance related to interchange ramp spacing in the Texas Roadway Design Manual and the AASHTO’s A Policy on Geometric Design of Highways and Streets (Green Book) is not speed-dependent even though intuition indicates spacing and speed are related.
Understanding the relationship between interchange ramp spacing, speed, and freeway operations is important, especially in developing potential design values for higher speeds (e.g., 85 to 100 mph). The objectives of this project were to: (a) investigate relationships between weaving length, speed, and overall vehicle operations on Texas freeways and (b) propose updates to current Texas Department of Transportation guidance on recommended distances between ramps.
Within the research tasks several methods were utilized to assist in developing guidance on ramp spacing lengths. The methods or resources used to generate potential lengths included: guidance provided in Design Manual for Roads and Bridges published by the Highways Agency in England, minimum deceleration and acceleration length for freeway conditions, decision sight distance, sign spacing needs, NCHRP project 3-75 fi ndings, fi ndings from fi eld studies at seven study sites, fi ndings from simulation conducted as part of this research, and safety relationships identifi ed in the literature.
Suggested ramp spacings were developed for the entrance ramp to exit ramp and exit ramp to exit ramp conditions.
View of SH 288 SB between Reed Road and Airport Boulevard (Viewed from Camera 810 at Reed Road).
64
0-5862-1Evaluation of Potential Benefi ts of Wider and Brighter Edge Line Pavement Markingshttp://tti.tamu.edu/documents/0-5862-1.pdf
Key Words:Wider Edge Line Pavement Marking, Human Factors, Safety, Lateral Placement, Encroachment, Eye-Tracking, Speed, Tangent, Horizontal Curve
This report documents a study conducted by the Texas Transportation Institute for the Texas Department of Transportation to investigate potential benefi ts of wider and/or brighter edge line markings. TTI was already conducting fi eld study research with respect to crashes and macroscopic traffi c analyses in horizontal curves of wider edge line markings, and so it was decided that a complimentary human factors analysis would better enable the research team to assess other potential benefi ts of wider edge line pavement markings. Since a human factors study generally allows for greater controls during the data collection, the researchers also included an assessment of pavement marking brightness. In this report, the researchers documented the following:
At the completion of this study, the majority of states were installing wider pavement markings either on a regular or experimental basis to investigate the potential benefi t of wider pavement markings.
The crash data analysis supports the use of wider edge line pavement markings to improve safety along rural roadways.
Study participants encroached less along the edge line in the inside lane of horizontal curves as marking width increased.
Study participants shifted away from the edge lines in the outside lane of horizontal curves as marking brightness increased.
Study participants shifted away from edge lines as edge line marking width increased along tangents with small shifts in alignment.
Researchers recommend that TxDOT consider the use of wider edge line pavement markings for two-lane highways. The latest safety analyses support their positive effect on safety. In addition, the surrogate operational studies showed that the traditional surrogate measure of safety such as lateral placement and edge line encroachments support the positive safety fi ndings in that drivers tend to position themselves slightly closer to the centerline and experience fewer edge line encroachments. The eye tracking data also support the recommendation in that drivers appear to have more opportunity to focus on critical driving tasks when wider edge lines are used.
Although the researchers studied different levels of pavement marking retrorefl ectivity, there were no signifi cant discoveries and therefore this report does not include pavement marking minimum retrorefl ectivity recommendations.
65

0-5865-1Arterial Intelligent Transportation Systems—Infrastructure Elements and Traveler Information Requirementshttp://www.utexas.edu/research/ctr/pdf_reports/0_5865_1.pdf
Key Words:Intelligent Transportation Systems, ITS, Arterial systems, Arterial performance measures, Traveler information dissemination, Simulation.
Detection technologies are a key component to successful deployment of any arterial Intelligent Transportation Systems (ITS) technology system. No negative traffi c impacts result from deployment of detection systems. So it is recommend that various means of data collection technologies such as detectors, video detection, GPS detection, cell phone detection, toll tag detection, and so on be used to improve arterial data collection.
Coordinated signal control plays an important role in responding to recurrent or nonrecurrent congestion. Signal optimization is the most effective way to improve arterial traffi c operations. The software and hardware are already mature and widely available. Therefore, it is recommended that TxDOT should consider coordinated signal control implementation to enhance arterial system performance as the fi rst priority.
Information dissemination technologies are essential for arterial management enhancement. Desirable characteristics of arterial traveler information systems include (a) Providing route and decision guidance (b) Being timely, accurate, available, and cost effective, and (c) Being easy to access and safe to use. It is recommended that TxDOT staff should fully consider these characteristics to maximize the benefi ts when implementing information dissemination technologies.
Comprehensive websites offering a variety of content on traffi c fl ow, incidents, construction, and weather that can be personalized to localized information for a specifi c user are most useful. Websites must be easy to navigate and provide information in understandable text and graphic formats. Integration of the information into a graphical display might provide some users, especially infrequent pass-through users, with a better understanding of existing traffi c conditions. These fi ndings are recommended for TxDOT future use.
The ideal message design should reduce a driver’s uncertainty regarding traffi c conditions instead of overwhelming him or her with unneeded data. An auditory method is adequate and effective when drivers are familiar with the network. If dynamic message signs (DMS) systems are going to be deployed on the arterial network, particularly during peak hours, they should be located in areas where realistic alternate routes exist. Specifi cally, the DMS should be located so that traffi c can be easily redirected to an alternate route that under normal operating conditions has the capacity to accommodate additional traffi c volumes. These fi ndings should be carefully considered for future information dissemination applications.
Arterial management can be integrated with TxDOT’s traffi c management plan so that freeway traffi c operations can be enhanced through improving interactions between arterial and freeways. Therefore, it is recommended that TxDOT should actively integrate arterial and freeway operations systematically.
The technologies for vehicle registration/identifi cation, toll collection, and ATIS are similar, and it is recommended that the possibilities for integration should be pursued. This integration would benefi t arterial data collection as well.
66

0-5890-1Guidelines for the use of Pavement Marking Symbols at Freeway Interchanges: Final Reporthttp://tti.tamu.edu/documents/0-5890-1.pdf
Key Words:Pavement Markings, Horizontal Signing
Based on the information gained through both the human factors laboratory studies and the fi eld studies, researchers have developed basic recommendations for what information should be placed as in-lane pavement markings near an interchange. Basic recommendations are:
Shields should be used as opposed to text for highway identifi cation.
Arrow and shield markings should be used in combination.
Simple single lane exits (particularly traditional right exits) only need pavement marking symbols to be placed in the exit lane.
If in-lane pavement markings are used at complex interchanges (e.g., optional lanes, multi-lane exits, etc.), they should be applied to all lanes.
Optional lane symbol pavement markings should provide the same basic information as other lanes at that interchange (i.e., show both highway shields and an option arrow).
Order of information in the optional lane should be: a) primary (through traffi c) highway shield fi rst and exiting route shield second and b) arrows preceding the highway route shields.
Do not stagger lane markings. Install same symbols in a single line.
The use of cardinal directions should be limited.
The size of pavement marking symbols recommended for standard freeway interchanges are: a) shields 15-ft long and b) arrows 12-ft long.
Contrast borders on pavement marking symbols are not required.
Markings should be placed after a motorist has passed at least one overhead guide sign for the interchange. Thereby this is a reinforcement of the information from the sign and not the primary information source.
The in-lane pavement marking symbols should be placed far enough upstream of the decision point that it allows a motorist to safely change lanes based on the information provided.
Guidelines for the application of in-lane pavement markings symbols are important for many reasons. First, the standardization of information to be placed helps a driver with regard to expectations while driving. Additionally, creating a set of guidelines for what information should be used at an interchange ensures that drivers are receiving the best possible benefi t from this information. Lastly, this information can help engineers in decision making when faced with installation of these types of markings at a new interchange. All of these points led researchers to create guidelines aimed at answering the following questions.
Should in-lane pavement markings be installed at this interchange?
What information should the in-lane pavement markings provide?
In what sequence should this information appear?
Where should the in-lane pavement markings be placed in the interchange area?
67

0-5911-1Driver Workload at Higher Speedshttp://tti.tamu.edu/documents/0-5911-1.pdf
Key Words:Freeway, Driver Workload, High Speed, Passing Gap, Following Distance, Reaction Time
Previous research as part of the NCHRP stopping sight distance study and fi ndings from the simulator pilot study found that drivers will steer away from an obstacle in their lane rather than engage in a panic stop situation. When responding to a vehicle slowing in their lane, the reaction time of drivers in the Simulator Phase II Study driving 85-mph was statistically longer than those driving 60-mph. This 0.21-sec difference was statistically signifi cant, and the research team also considered it to be a practical difference.
In the simulator and test track studies where researchers directly measured driver performance, evidence was present that performance declines when a driver is multitasking at higher speeds. For tasks such as mental arithmetic in the simulator and detecting a peripheral light while changing a CD on the test track, reaction time to lead vehicle deceleration was longer at higher speeds. Researchers interpreted this to mean that driving at higher speeds was more challenging. The simulator study, in particular, showed that driving 85 mph required more mental effort than driving 60 mph, leaving less mental capacity free to do the arithmetic problems. These laboratory and controlled test track tasks are likely relatively easy compared to the type of multitasking drivers may do on actual roads. For safety reasons researchers were not able to overload drivers on the open road and test track by giving them tasks such as cell phone conversations, navigation system interactions, etc. For this reason, the results of these driver performance studies should be taken to be at the low end of a scale of driver distraction. Driving performance may decline even further in situations where drivers are engaging in other physically or mentally distracting tasks.
The passing gap data showed that passing drivers initiated their lane change typically between 240 and 290 ft behind the lead vehicle. The predicted average gap distance for the 80-mph sections was similar to the 70-mph sections, so the posted speed limit of the facility did not infl uence the passing decision of the driver. The operating speed of the passing vehicle, however, did infl uence the passing gap. Faster drivers used larger gapdistances as compared to slower drivers. The passing gap increased by 10 ft for each mile-per-hour increase in the speed difference between the lead vehicle and the following vehicle. While drivers used similar passing gap distances for the 70- and 80-mph sections, they used larger following distances at 80 mph as compared to the 70- and 60-mph sections.
68

0-5913-1Speed Harmonization and Peak-Period Shoulder use to Manage Urban Freeway Congestionhttp://www.utexas.edu/research/ctr/pdf_reports/0_5913_1.pdf
Key Words:Speed harmonization, variable speed limit, peak-period shoulder use, Intelligent Transportation System
Variable speed limits (VSL) and shoulder use did not have a signifi cant impact on throughput of the freeway.
However, these strategies homogenized traffi c stream and resulted in smoother fl ow of traffi c by reducing the total number of stops per vehicle, stopped delay, and number of lane changing maneuvers.
In general, traffi c stream was further homogenized due to reduction in traffi c density and speed variability within and across lanes. This also indicated that potential safety benefi ts can be obtained by the use of these strategies on freeways.
If VSL and shoulder strategies are implemented early on and before the onset of full congestion, they will result in greater benefi ts.
Shoulder use contributed signifi cantly to the traffi c homogenization process in the middle of the shoulder-use section. However a sudden drop of shoulder use at the end of the section reduced the capacity of the downstream section by one lane leading to bottleneck creation and signifi cant speed reduction.
VSL and shoulder use implementation reduced the average speed of traffi c in the implementation section, and therefore contributed to a small increase in travel time.
In conclusion, VSL and shoulder use homogenized traffi c and reduced stop-and-go traffi c conditions by moving the traffi c more steadily. Smoother fl ow of traffi c results in less emission, less fuel consumption, less wear and tear on vehicles, and safer driving conditions.
Speed Harmonization in the Netherlands.
69

0-5942-1Development of a Video Over IP Guidebookhttp://tti.tamu.edu/documents/0-5942-1.pdf
Key Words:Video, Systems Engineering, Communicatins
Researchers found that the systems engineering process (SEP) serves the purpose of developing video deployment along a well-known course of action that will meet the needs of the various stakeholders. It accounts for integration into the regional architecture, establishes a concept of operations, and leads todetailed functional requirements—which in turn lead to detailed testing procedures. The consistent and structured approach for video solutions developed in this project was documented in a guidebook.
Overall, the guidebook was organized into sections such as:A Brief Introduction to Systems EngineeringEarly Phases of the Systems Engineering ProcessThe Functional Requirements PhaseThe System Design PhaseThe Testing and System Acceptance PhaseThe Concluding Phases of the Systems Engineering ProcessProcurement to Support Systems Engineering
Throughout the development of the guidebook, several topics were encountered that lent themselves more to a visual explanation than to written text. A typical example is frame rate. While descriptive text was written to convey what a video frame is and what frame rate is, for most people a more intuitive understanding comes from looking at characteristics. For this reason, a supplemental CD-ROM was developed to convey this type of information. With a simple menu interface constructed in standard HyperText Markup Language (HTML), the supplemental CD is a stand-alone component that requires no installation, supporting software, or particular technical expertise to operate.
Engineers with TxDOT who have some level of overview or responsibility for the design and deployment of video solutions now have a consistent and systematic standards-based process for developing and assessing digital video solutions and deployments.
70

0-6029-1Improved Intersection Operations During Detector Failureshttp://tti.tamu.edu/documents/0-6029-1.pdf
Key Words:Variable Initial, Detector Failure, Intersection Effi ciency, Detector Delay, D-CS
TTI researchers developed and evaluated the adaptive variable initial module (Module 1) and the detector failure module (Module 2) in this project. Researchers compared Module 1 performance with actual queue clearance times and found good correlation between the predicted initial green and the queue clearance times after considering the minimum green factor. The performance was accurate for both of the approach phases as well as weekdays and weekends. Module 1 can be used at intersections where stop-bar detectors are not installed to improve the intersection operations. It can also be used at intersections that have both stop-bar and upstream detectors if the stop-bar detectors malfunction.
The detector failure module (Module 2) predicted the phase duration at the onset of the phase using two methodologies. One was a rolling average of the phase utilization from a database of four weeks of data. The second was a model that used variances in phase utilization both within the historical database as well as from the current day. These two models predicted the phase utilizations for detector failures ranging from 10 percent to 100 percent. The rolling average model was implemented in the fi eld. TTI researchers then compared these two predictions with the actual phase duration for each phase. This project discovered that the rolling average model was very accurate for predicting the phase duration. These predictions were more accurate during time periods having consistent activity on the phases (peak periods). During the extremely low volume periods, the predictions were not very accurate due to the randomness of vehicle arrival patterns. The advance module predicted the phase duration as accurately as the rolling average module in the Waco and Conroe sites. However, the advance module was more accurate than the rolling average in Bryan. The sites in Waco and Conroe had very low volumes on the cross streets for most of the day. Random arrival patterns on the minor streets during low volume periods impacted the accuracy of the major movements by both the prediction models. However, the Bryan site experienced equally high volumes on the minor streets as compared to the major movements. These volume patterns caused the advance phase prediction model to be more accurate than the rolling average model. Data requirements for the two models are easily available within the traffi c signal controller.
Installation of Adaptive Detection-Control System (D-CS) in the Houston District Near Conroe.
71

0-6071-1Analysis of Roadside Safety Devices for use on Very High-Speed Roadwayshttp://tti.tamu.edu/documents/0-6071-1.pdf
Key Words:High-Speed Roadway, Bridge Rail, Guardrail, Sign Support, Finite Element Analysis, Simulation, Modeling, Roadside Safety, Crash Testing
Guardrail - Two guardrail systems considered to have potential for accommodating high-speed passenger vehicle impacts were evaluated. These are the modifi ed thrie-beam and weak-post box beam systems.
Modifi ed Thrie-Beam Guardrail - Researchers observed in the high-speed simulations that the steel blockouts deformed and collapsed as the vehicle progressed through the system. This collapse reduced the offset distance between the rail and posts and led to signifi cant interaction between the front wheel assembly and the guardrail support posts. The front wheel assembly was observed to ride over the twisted and bent steel posts, which in turn imparted a vertical acceleration to the vehicle that helped it climb over the rail. Thus, although the rail was found to have suffi cient structural capacity to accommodate the increased impact severity, the rail failed to contain the design pickup truck.
Box Beam Guardrail - In the high-speed impact simulation, the pickup truck was redirected. However, the large lateral defl ection of the system led to a long length of unsupported rail. The lack of vertical support allowed the tubular rail to drop in height when the lateral impact force diminished during the vehicle’s attempt to exit the system. This behavior indicates a signifi cant probability that the vehicle will override the system.
Bridge Rail - The concrete bridge rail selected for evaluation for high-speed applications was the single-slope barrier. The single-slope barrier has one constant sloping traffi c face that is 10.8 degrees from vertical. Previous testing has shown it to provide a reasonable compromise between vehicle stability concerns associated with safety-shaped profi les and occupant risk concerns associated with vertical concrete parapets.
The results of the high-speed impact simulations into the single-slope barrier indicate marginal to unacceptable performance. While it is predicted that the single slope barrier will contain and redirect the design pickup truck in a stable manner, the occupant risk numbers and occupant compartment deformation are expected to be close to the allowable limits of the Manual for Assessing Safety Hardware (MASH) criteria. Although stable redirection of the design passenger car is also predicted, the lateral occupant impact velocity (OIV) is expected to be at or above the maximum acceptable recommended in MASH.
In a separate analysis, simulation results confi rmed that a high-speed impact into the New Jersey safety shape barrier is likely to result in high vehicle climb and roll, with a high probability of vehicle rollover when impacted by a small passenger car.
Sign Supports - The performance of the slip-base sign support systems selected for this evaluation was found to be satisfactory for passenger car impacts at very high-speeds. The increased rotational velocity imparted to the support was offset by the greater speed of the vehicle. The vehicle passed beneath the sign support system without secondary contact with the roof or windshield.
However, the test matrix for breakaway supports under MASH has been revised to include a high-speed test with a pickup truck in addition to a small car. In an 85 mph head-on impact simulation with a pickup truck, the sign panel is predicted to impact the roof of the pickup with signifi cant force. The severity of this secondary contact is expected to result in unacceptable occupant compartment deformation (i.e., > 4 inches of roof crush), leading to the conclusion that the standard 7-ft mounting height of the sign panel is not suffi cient to accommodate the taller pickup truck at very high impact speeds.
72

0-6071-2Evaluation of Barriers for Very High-Speed Roadwayshttp://tti.tamu.edu/documents/0-6071-2.pdf
Key Words:High-Speed Roadways, Bridge Rail, Longitudinal Barriers, Crash Testing, Roadside Safety
As TxDOT plans for future expansion of the state’s highway network, interest in higher design speeds has been expressed as a means of promoting faster and more effi cient travel and movement of goods within the state. TxDOT funded project 0-6071 as part of a proactive consideration of safety on these high-speed facilities. This project began the process of developing roadside safety hardware suitable for use on high-speed highways. The impact conditions selected for the design, testing, and evaluation of this high-speed hardware include a speed of 85 mi/h and an angle of 25 degrees for barrier impacts. The design vehicles are those specifi ed by the pending AASHTO Manual for Assessing Safety Hardware (MASH) and include a 5000-lb, ½-ton, 4-door pickup truck and a 2425-lb passenger car.
After evaluation of several barrier systems using fi nite element simulation, two designs were selected for further evaluation through full-scale crash testing. These included an energy absorbing bridge rail concept and a modifi ed wood post thrie beam guardrail.
The 85 mi/h impact simulations of the energy absorbing bridge rail predicted marginal performance for both the small car and pickup truck. The results showed a high vehicle roll angle during redirection, which indicated the possibility of vehicle instability and rollover. The simulated small passenger car impact indicated an occupant impact velocity near the maximum acceptable value of 12 m/s and signifi cant occupant compartment deformation. However, considering the challenge of accommodating these severe impact conditions and in absence of any obvious failure for either vehicle, TxDOT elected to approve some full-scale crash tests.
The energy-absorbing bridge rail contained and redirected the small car. The car remained upright during and after the collision event. Maximum roll angle was 13 degrees at 1.7 s, and maximum pitch angle was 10 degrees at 2.00 s. Maximum occupant compartment deformation was 9.0 inches in the right side fl oor pan/toe pan area, which is the allowable limit for this area recommended in MASH. Longitudinal occupant impact velocity was 24.6 ft/s, and lateral occupant impact velocity was 40.7 ft/s. The maximum limit according to MASH is 40 ft/s, which was slightly exceeded in the lateral direction. It is noted that under NCHRP Report 350, a value of 41 ft/s (12.49 m/s) was considered acceptable by FHWA. Longitudinal and lateral ridedown accelerations were -16.3 G and -10.0 G, respectively, both of which are below the recommended threshold of 20 G. The performance of the energy absorbing bridge rail was considered marginal.
In a subsequent test, the energy-absorbing bridge rail contained and redirected the pickup truck. However, upon exiting the bridge rail, the vehicle rolled over. This outcome is unacceptable. It is of interest to note that the occupant compartment deformation and occupant risk indices were within the limits specifi ed in MASH.
In regards to the performance assessment of the modifi ed wood post thrie beam guardrail, the pickup truck was not successfully contained and redirected. Failure of the upstream anchorage permitted the vehicle to penetrate behind the guardrail. Although the outcome of the test was unacceptable, it is not necessarily an indictment of the modifi ed wood post thrie beam guardrail system.
73

0-6176-1Guidelines for Signal Operations at Intersections With Wide Medianshttp://tti.tamu.edu/documents/0-6176-1.pdf
Key Words:Intersection Operations, Signal Operations, Wide Medians, Trailing Overlap, Diamond Phasing
This project specifi cally examined signal timing strategies for intersections with wide medians. The one-year time frame allowed us to focus more on signal timing issues and less on signal design issues. The scope of this project emphasized signal operational guidance rather than signal design guidance, which becomes complicated for intersections with medians of 30 to 100 ft. However, operational guidance for intersections with less than 100 ft of median width would be the same as those recommended for 100 ft. Future research should focus on design guidance for such intersections including the applicability of additional mast arms in medians and the use of internal clearances or all-red intervals. Other issues to consider include: a) the limitations of using four-phase operations for intersections with such medians widths (30 ft to 100 ft), b) confusion caused to motorists turning from a major-street when the mast arm is located in the median, and c) warrants for using protected or protected/permissive operations for minor streets. Given the resources available for this one-year project, researchers focused on developing guidance on signal timings for this type of intersection. Nevertheless, engineers must also consider signal design issues and exercise their judgment when designing such intersections.
Trailing overlaps tend to increase overall delay Trailing overlap is a very common feature used at intersections with wide medians. This feature ensures that no vehicles are stored in the interior. However in lower volume conditions, this can be ineffi cient. The trailing overlap feature was found to be more effi cient than other strategies only for intersections with small medians (100-ft wide), for extremely high volumes (1250 vph), and high turning/cross street traffi c (30 percent). Thus trailing overlap should be used sparingly.
Two-phase and four-phase operations for low and high volumes A two-phase operation is recommended for most low volume scenarios. Researchers believe the need for a two-phase operation appears to increase as the median width increases. For example while a two-phase operation is recommended for most cases where median width is 300 ft, it is only recommended for about half of the cases where median width is 100 ft. Within a certain median width, a two-phase operation is not recommended for higher volumes. Thus it can be stated that under high volume and small median spacing, a two-phase operation is not recommended.
For cases of narrow medians and high turning percentages, use of either a major-street left-turn phase or four-phase operation is recommended. In some cases right-of-way may not be available to have a left-turn lane. In these cases a four-phase operation is recommended. However, when there is only a single lane in the interior, a four-phase operation is not possible. For this situation there is a four-phase type operation without fi xed intervals that researchers recommended.
Phasing sequence using a major-street left-turn phase Due to geometric limitations, lead-lag phasing is recommended for intersection with wide medians having exclusive major-street left-turn phases. This will avoid confl ict between these two movements. However, simulation studies have found that the heavier left-turn movement should lag the lighter left-turn movement.
74

Structures andHydraulics
RMC 5results
RMC 5 - Structures and HydraulicsFocus Areas• Bridge Rails & Transitions • Geotechnical Issues • High Mast Illumination Poles • Hydraulics & Hydrology • Overhead Sign Bridges • Structures Construction &
Maintenance • Structures Design & Analysis • Structures Management • Structures Materials
75

0-2116-4A
Effects of Wet Mat Curing Time and Earlier Loading on Long-Term Durability of Bridge Decks: Compressive Strength, Maturity and Strength Durability Index (SDI)http://www.depts.ttu.edu/techmrtweb/Reports/Complete%20Reports/0-2116-4A.pdf
Key Words:concrete, bridge, deck, durability, curing, wet mat, vehicle loading, early loading
The fi ndings from this research confi rm what was previously known about the maturity method. The maturity method can be successfully implemented to determine in-situ strength of concrete. Though, these results match better than might be expected, the prediction could be further improved if moisture levels were also considered. Although, some discrepancies did exist during the analysis of the data, most of these are explained by differences in testing procedures and construction practices, including at times, a lack of quality control. These issues are discussed in this report. The following is a quick list of what was found:
Maturity method is successful in assessing in-situ strength provided strict quality control is in place.
Maturity equivalent age calculation can be misleading at times due to the lack of moisture or humidity variable in the Arrhenius and Nurse-Saul functions.
Conventional cylinders are satisfactory when assessing in-situ strength in this manner, but involve much guesswork to determine when desired strengths have been achieved.
Quality Control at fi eld sites do not seem to be strongly enforced (i.e., addition of excessive water to concrete, thus altering fi nal strength gain of concrete).
Sampling Laboratory Bridge Deck Slabs with Portable Coring Machine.
76

0-2116-4B
Effects of Wet Mat Curing Time and Earlier Loading on Long-Term Durability of Bridge Decks: Fracture, Flexural Strength and Shrinkagehttp://www.depts.ttu.edu/techmrtweb/Reports/Complete%20Reports/2116-R4B_fi nal.pdf
Key Words:concrete, bridge, deck, durability, curing, wet mat, vehicle loading, early loading
Fracture: Field-Cast Notched Cylinders - From the data obtained by testing fi eld-cast notched cylinders, it is apparent that concrete gets more brittle with increased duration of curing, at least at the test age of 28 days. The gain in strength with increased curing is not signifi cant beyond 4 days of curing for this size of specimen, and the trends are much sharper than those obtained in the fi eld-cast fl exural beam tests. Furthermore, it would be erroneous to conclude from the data obtained that concrete, in general, is getting stronger in fracture with increased duration of curing, as tests on cylinders of larger diameter may have resulted in entirely different trends.
Size-Effect Tests at 16-Day Age and 7-Day Age - Size-effect testing at 16-day age and 7-day age shows that concretes with relatively large amounts of slag, or possibly, fl y ash, take a long duration to cure, and have smaller fracture strengths than other types of concretes. Concretes made from Type I cement that do not contain any fl y ash are more brittle than concretes containing Type I/II cement and fl y ash. Since strengths of mix designs are heavily infl uenced by the compatibilities of the ingredients, statements about the effects of class of fl y ash, or the relative amounts of fl y ash within the ranges examined, are not made.
Fatigue Testing - It was found that there is a distinct upward trend in the number of cycles to failure of cylinders as duration of curing is increased for data generated at the testing age of 28 days. A less marked increase in the number of cycles to failure with increased duration of curing was observed at 10-day age. It should be pointed out that for many concretes, the cylinders tested under static loading at 7-day age showed decreased failure loads with increased duration of curing, while the trend was reversed at 16-day age. The test data generated at the age of 10 days refl ect the static loads to failure of the cylinders at this age, because there is a strong correlation between static failure loads and fatigue strength.
Absorption-Desorption Tests - Concretes containing Type I cement and no fl y ash show smaller increases in hydration levels from curing beyond 8 days, while concretes containing Type I/II cement and fl y ash show small improvements in hydration levels from curing beyond 8 days. Testing on larger specimens delivered absorption-desorption data that was less sensitive to curing duration than data generated from smaller specimens, and it seems logical to conclude that bridge decks are less sensitive to curing durations as far as hydration levels are concerned, because of their relatively large size when compared to specimens.
Tests to Determine Effects of Varying Thickness of Size-Effect Specimens - The differences in hydration levels of specimens of different lengths can lead to differences in fracture strengths for certain combinations of concretes, curing durations, and testing ages. The logical conclusion would be that it is desirable to change lengths of cylinders in such a manner that differential curing and drying is minimized. The current philosophy of curing test specimens for long duration until the time of tests leads test specimens to be non-representative of structures, especially ones with large surface areas like bridge decks. Curing should be curtailed at a point in time to ensure that hydration levels of the specimens and the structure the concrete is being tested for are similar at the age the testing is carried out.
Shrinkage - A 4-day cure from the shrinkage perspective, is suffi cient for bridge decks with mixes using Type I or III cements without fl y ash, as these bridge decks are currently being cured for 8 days in Texas. However, conducting restrained tests would be benefi cial before the change in curing duration is implemented. It can also be concluded that from the shrinkage perspective a 4-day cure can also be used for bridge deck mixes with Type II or I/II cements or for bridge deck mixes with fl y ash as cement type or fl y ash content is not expected to have any signifi cant effect on shrinkage of concrete. However, additional parametric study on cement types and fl y ash contents from shrinkage perspective would be benefi cial before the change in curing duration is implemented for these mixes.
77

0-4586-3Full-Scale Controlled Tests of Wind Loads on Traffi c Signal Structureshttp://www.depts.ttu.edu/techmrtweb/Reports/Complete%20Reports/0-4586-3_fi nal.pdf
Key Words:Cantilever, mast arm, galloping, fatigue failure, vortex shedding, backplates
It has been observed throughout this experiment that large amplitude vertical vibrations of mast arms with signals with backplates occur for the most part at low wind speed ranges, and as the wind speed increases the amplitude of the vertical vibrations decreases. Having large vibrations at a certain wind speed range refl ects the typical behavior of vibrations induced by vortex shedding. This contradicts the theory that vortex shedding does not cause large-enough vibrations of mast/arms that could lead to fatigue failure. Large vibrations are generally attributed to galloping where vibration amplitude increases with wind speed. Such galloping was not observed in this study.
It seems that the higher amplitude vertical oscillations have a higher probability of occurring when the wind speed is steady (i.e. has low turbulence) between 5 to 10 mph. It also appears that oscillations are more likely to occur when the wind approaches the mast arm from the back of the signal.
Very few cases of large vibrations were observed under Mode 1100, possibly because wind conditions were less than ideal. This is a typical diffi culty of conducting full-scale experiments. It could be advantageous to include wind tunnel experiments, where the wind conditions are more easily controlled.
Two Cantilever Traffi c Signal Structures Tested at Reese Technology Center.
78

0-4588-1Effect of Voids in Grouted, Post-Tensioned Concrete Bridge Construction: Volume 1 – Electrochemical Testing and Reliability Assessmenthttp://tti.tamu.edu/documents/0-4588-1-Vol1.pdf
Key Words:Post-tensioned Bridge; Corrosion; Electrochemistry, Strand, Reliability; Voids; Grout; Durability; Strength Reliability; Service Reliability; Deterioration
The research did perform extensive studies on the corrosion of strands in various environments. Results indicate that signifi cant decreases in strand capacity occur when the stands are exposed directly to moisture and moisture containing chlorides. The research indicated that high humidity levels do not result in the same deterioration as the water and chloride exposure conditions; however, condensation can lead to higher corrosion rates. The results also indicated that oxygen and carbon dioxide levels have limited infl uence on the reduction of strand capacities. Using this information, the researchers developed a strand capacity model for the different environmental exposure conditions. Using a general cross section of a post-tensioned (PT) bridge, the researchers performed reliability analyses. These analyses indicated that a PT bridge could fail as soon as 21 years after construction if the strands are subjected to high chloride containing solutions. If the tendons are protected from these aggressive environments, the service life of these structures, based on corrosion of the strands, could exceed 100 years. The research fi ndings show the importance of protecting the strands from water and chlorides.
To this end, the researchers evaluated different inspection and repair techniques for tendons on PT bridges. The researchers also assessed the applicability of the current TxDOT specifi cation for repair grouts. The research found that the pressure-vacuum repair procedure results in the best fi llability of the voids. This method was also identifi ed as being the fastest and most economical. The research also proposed a new method for assessing repair grouts. These repair methods and materials can be used if it is determined that galvanic cells do not formbetween the existing and repair grouts.
The researchers recommend that every effort is made to keep water and chlorides from the inside of PT girders. This should include the repair of drainage pipes, damaged ducts, or leaking anchorage plates, or correcting any other issues that result in water penetrating the tendon and girder. Preventing the infi ltration of water and chlorides into the tendons by performing these relatively simple tasks will likely extend the service life of PT bridges in Texas. The researchers also recommend that a study be performed on the infl uence of different grout.
Severely Corroded Strands at Anchorage Zones.
79

0-4588-1Effect of Voids in Grouted, Post-Tensioned Concrete Bridge Construction: Volume 2 – Inspection, Repair, Materials, and Riskshttp://tti.tamu.edu/documents/0-4588-1-Vol2.pdf
Key Words:Inspection, Repair, Post-Tensioned Bridge; Corrosion, Tendon; Voids; Grout; Durability; Strength Reliability; Service Reliability; Deterioration
Repair Grout Materials - The current TxDOT specifi cations for grouts provide test methods and threshold values for cement grouts. These standards fail to provide specifi cations to test pre-packaged proprietary cementitious-based grouts for the ability of a particular grout to fi ll voids. Also, some TxDOT recommendations (desirable limits of effl ux time) may not be appropriate.
The three prepackaged Class C grouts evaluated in this research conformed to the current TxDOT grout specifi cations. These grout exhibited zero bleed, limited shrinkage, and good fl uidity. However, grout C-3 exhibited poor fi llability.
The Class C grouts exhibited a slow increase in the viscosity over time. This is due to the hydration of these grouts. Characterization of pre-packaged grouts is very important as it provides ample time for material engineers to assess applicability of these pre-packaged grouts.
The newly developed fi llability test procedure was found to be a useful procedure in differentiating the pre-packaged PT grouts in terms of their void fi lling ability. The fi llability test results indicate that Class C-1 and C-2 grouts performed well in terms of their void fi lling ability with a fi llability index less than 5.5. The Class C-3 grout resulted in a higher fi llability index (>5.5) indicating that it will not fi ll smaller voids effi ciently. The fi llability test procedure can assist constructors and engineers in determining a suitable pre-packaged PT grout for use in PT tendons, either for new or repair scenarios.
Inspection and Mitigation Assessment - In this research, tests on an external PT tendon system were conducted to assess methods for fi lling voids in ducts. Based on these tests, the proposed repair grouting methods, pressure grouting (PG), pressure-vacuum grouting (PVG), and vacuum grouting (VG) were evaluated with respect to their fi lling capabilities, fi lling performance, and economic feasibility.
Although the different grouting repair methods did not show signifi cant differences in their fi lling capability at a 95 percent confi dence limit, the PG method seems to have a lower fi lling capability than the VG and PVG methods. The analysis contained in this report concludes that the VG method requires more sealing time than the PG and PVG method. Thus, the PG and PVG methods are more economical methods for repairing voids than the VG method. Because the PG method exhibited lower fi lling capability and the VG method requires extensive preparation time, the PVG method is recommended for fi lling voids in the fi eld. Note that this method should only be used if it is determined that galvanic cells do not form at existing-new grout interfaces.
Although the voids identifi ed with the sounding inspection were not identical to the voids found with a visual inspection, statistical analysis shows that both inspections are highly correlated. The analysis results show that the sounding inspection underestimates the size of the voids; however, the inspected locations have a close correlation with actual voids in ducts. Thus, the sounding inspection can be applied as an effective inspection tool in the fi eld to assess void volume.
Economic Risk Modeling - A review of the literature shows that it is important to develop a proper approach for optimization of the maintenance policy of PT bridges in the State of Texas. Uncertainties always exist in design, analysis, construction of structures, associated expenditures, and environmental conditions. Thus, it is important to have sound robust models to predict the behavior of both structural components and structural systems from which the reliability of the entire structural system in a network can be reasonably predicted. This system should be based on collected inspection data and developed models for structural deterioration.
80

0-4588-2Effect of Voids in Grouted Post-Tensioned Concrete Bridge Construction: Inspection and Repair Manual for External Tendons in Segmental, Post-Tensioned Bridgeshttp://tti.tamu.edu/documents/0-4588-2.pdf
Key Words:Inspection, Repair, Post-Tensioned Bridge; Corrosion, Tendon; Voids; Grout; Durability; Strength Reliability; Service Reliability; Deterioration
Post-tensioned (PT) bridges have the advantages of spanning longer distances, reducing the bridge’s self-weight, and having shorter construction periods. Many PT bridges have been constructed over the last several decades. However, recent investigations of these bridges have identifi ed voids in the ducts, and the exposed strands at these void locations can undergo corrosion. The rate of corrosion is very high when high humidity, water and/or chlorides are present inside the tendons. The corrosion of strands can lead to the failure of tendons.
It is critical to be proactive in protecting tendons from corrosion because a tendon failure will adversely affect the bridge’s performance, will be costly to replace, and will increase the probability of bridge failure. Therefore, an inspection program for the condition assessment of PT tendons should be developed to ensure public safety and extend the service life of PT bridges.
The critical factors that should be identifi ed in an inspection program include the identifi cation of voids, moisture, and/or chlorides that have been or are present in the tendons at the time of inspection. This manual presents procedures for the inspection and minor repair of external tendon systems.
Tendon Corrosion at Anchorage.
Leak Detection and Void Measuring Equipment
81
0-4825-1Corrosion Performance Tests for Reinforcing Steel in Concrete: Technical Reporthttp://tti.tamu.edu/documents/0-4825-1.pdf
Key Words:Corrosion, Test, Accelerated Corrosion Test, Polarization Resistance, Half-Cell Potential,Corrosion Rate, Critical Chloride Threshold
Five different corrosion test methods were evaluated in this report to evaluate their effectiveness in assessing corrosion performance. In addition, comparisons between the results were made with the standard conventional test method, ASTM G 109. Results indicated that State Highway Authorities (SHAs) can save considerable time and money by using one of the rapid methods instead of the standard ASTM G 109 method. Although no methods can assess all variables that infl uence corrosion, the research indicates that information can be gleaned from the rapid tests. Although all tests have benefi ts and could be considered for evaluating the different variables, the expertise and time available must be considered before performing the tests. Based on the testing performed in this research, the MM test was identifi ed as providing the most reasonable assessment of different variables for assessing corrosion performance. In addition, this test is relatively economical and can be completed in a relatively short time frame.
Although the researchers believe that the task of testing and evaluating new materials and methods should be contracted to experienced independent research agencies and laboratories, the decision on which method to use and what kind of experimental program to use should still be made by the SHA. Results of this study showed that different test methods may be more sensitive to different variables, and different test methods may be more appropriate to test different materials.
It is recommended that the MM test be specifi ed to evaluate the corrosion performance instead of the standard ASTM G 109 test. The ASTM G 109 samples take excessive time to activate. Evaluation of results obtained from the MM test were compared with the ASTM G 109 results and were found to be similar for regular steel samples embedded in concrete mixtures with a water-cement ratio of 0.55. Both methods showed that the corrosion exhibited by stainless steel was negligible. For conventional steel samples, the MM method was sensitive to different water-cement ratios and corrosion inhibitor levels. An additional advantage of the MM test is its fi xed duration that would allow the SHAs to know exactly how long it will take to complete the corrosion testing.
Although the MM test is a faster and more feasible alternative to the ASTM G 109 method, results indicate that it cannot be used to test dielectric (epoxy) coated samples. No accelerated test method was identifi ed to quickly evaluate dielectrically coated reinforcement. As such, it is recommended that the MG 109 test be used. However, additional research should be performed to identify alternative reliable and accelerated tests.
If the objective of the SHA is to evaluate the critical chloride threshold of the system being examined, the MM test cannot produce these data. In this case, it is recommended that the chloride ion threshold test method (CCIA) test or accelerated chloride threshold (ACT) test be used. The CCIA test can provide the SHAs with instantaneous corrosion rates as well as total corrosion loss and critical chloride threshold data. Results obtained from the CCIA test were similar to the results of ASTM G 109 testing at a water-cement ratio of 0.55 for conventional steel samples. However, it should be noted that the CCIA method was not found to be an appropriate test to test epoxy coated, galvanized, and stainless steel samples. The ACT test was found to be able to evaluate corrosion resistant reinforcement in earlier studies.
As with any testing, the corrosion test plan will have to determine the number of samples to be tested. Because of the large scatter common with corrosion testing, it is recommended that a minimum of 15 samples of the accelerated test be evaluated by the independent testing agency. Additional samples may be needed. It is also recommended that at least three samples be tested by TxDOT or its representative. Control samples must also be fabricated and tested to compare the performance of the proposed system. It is recommended that 15 control samples be tested by the independent testing agency and 3 control samples be tested by TxDOT or its representative.
82

0-5197-01-1Aggregate Distribution Investigation in Box Beams Fabricated with Self Consolidating Concretehttp://www.utexas.edu/research/ctr/pdf_reports/0_5197_01_1.pdf
Key Words:Box Beams, Self Consolidating Concrete, Allowable Release Stress
After a meticulous examination of 25 cross sections exposed by cutting 4 specimens, it was found that the 21 cross sections of beams fabricated with self consolidating concrete exhibited normal aggregate distribution with no noticeable segregation problems. Furthermore, the vertical distribution of coarse aggregate in the aforementioned self consolidating concrete (SCC) specimens was found to be comparable to that seen in the four cross sections of beams fabricated with conventional concrete.
Two differences were noticeable between the specimens made with different types of concrete. First, a lighter overall color was observed in specimens made with conventional concrete. This difference was solely because of the different aggregate type. The conventional concrete beams studied in this investigation were fabricated using limestone as coarse aggregate, whereas the beams fabricated with self consolidating concrete studied herein used round river gravel. The second difference was the paste fraction. The examination of the cuts indicated that beams fabricated with SCC had a higher paste fraction. This was expected since the concrete mixture design for SCC requires the use of higher paste fraction and smaller coarse aggregate.
In addition, it was observed that the Styrofoam void placement was reasonably accurate within a 1/4” tolerance.
The present investigation allowed the authors to conclude that the poor performance of the beams fabricated with SCC cannot be attributed to improper concrete consolidation or aggregate segregation.
Visual evidence suggests that the quality of the self consolidating concrete used in fabricating box beams for TxDOT project 0-5197 has minimum room for improvement, if any. Hence, the performance of beams fabricated with SCC is expected to be worse than those beams fabricated with conventional concrete.
The advantages of using SCC in beam fabrication and the inferior overall performance observed in TxDOT project 0-5197 box beams must be carefully weighed prior to the statewide implementation of SCC in bridge applications.
Cross Section of River Rock Beam.
83

0-5505-1Simplifi ed Method for Estimating Scour at Bridgeshttp://tti.tamu.edu/documents/0-5505-1.pdf
This research proposes a new method to assess a bridge for scour. It is made up of three levels of assessments. The fi rst level is termed Bridge Scour Assessment 1 (BSA 1). The second and third levels are termed BSA 2 and BSA 3, respectively.
BSA 1 overcomes the qualitative nature of current initial evaluation procedures by extrapolating present scour measurements to obtain the scour depth corresponding to a specifi ed future fl ood event. It utilizes computergenerated extrapolation charts based on a large combination of hypothetical bridges, which relate the future scour depth/maximum observed scour depth ratio to the future fl ood velocity/maximum observed fl ood velocity ratio.
BSA 2 has to be carried out if BSA 1 does not conclude with a specifi c plan of action for the bridge. BSA 2 determines the maximum scour depth. Though conservative, BSA 2 was introduced due to its simplicity. BSA 3 has to be carried out if BSA 2 does not conclude with a specifi c plan of action.
BSA 3 involves the calculation of time-dependent scour depth rather than simply using the maximum scour depth. BSA 3 is valuable in the case of highly erosion-resistant materials that do not achieve the maximum scour depth within the lifetime of a bridge. Both BSA 2 and BSA 3 utilize erosion classifi cation charts that replace site-specifi c erosion testing for preliminary evaluations.
Scour vulnerability depends on the comparison of the predicted scour depth and the allowable scour depth of the foundation. Hydrologic and hydraulic computer programs were developed to obtain the fl ow parameters. These programs generate maps of the maximum previous fl ood recurrence interval experienced by a specifi ed bridge in Texas and converts fl ow into fl ow velocities.
Eleven case histories used as validation showed good agreement between predicted and measured values. BSA 1 was then applied to 16 bridges. In this process, 6 out of 10 scour-critical bridges were found to be stable in terms of scour. The proposed bridge scour assessment procedure allows for the economical and relatively simple evaluation of scour-critical bridges. It also overcomes the over-conservatism in current methods. Key Words:
Scour, Bridges, Bridge Scour Assessment, Erodibility, Scour-Critical Bridges, Flood, Recurrence Interval
As a supplement to the 11 case histories used in this study, the Schoharie Creek Bridge failure in 1987 was investigated.
The failure of this bridge caused the deaths of 10 people. The cause of the failure was attributed to scour. This photo is of pier 2 taken in 1987 after the failure.
84

0-5706-1Impact of Overhang Construction on Girder Designhttp://www.utexas.edu/research/ctr/pdf_reports/0_5706_1.pdf
Key Words:I-girder, Curved Bridge, Lifting, Erection, Construction
Prestressed Concrete Girder Systems - The connection types for top bracing bars include two types of connections referred to as the fl exible connection and the stiff connection. The fl exible connection is representative of the actual connection confi guration typically used in practice for the top bracing bar while the stiff connection is the connection confi guration specifi ed by TxDOT standard drawings. The fl exible connection is used because widespread use of precast concrete panels makes it diffi cult to implement the stiff connection. Both connection types are recommended to be used as bracing for concrete girder systems through an adequate amount of bracing determined by the proposed overhang design equation. The stiff connection can generally be used at the end regions of beams where the thickened end may be used without deck panels.
Two top bracing distributions were considered: bracing distributed along the length of the bridge and end bracing. In the case of the distributed bracing, the top bracing bars were uniformly distributed along the girder length, while for the end bracing, the top bracing bars were concentrated at each end of a girder. The method of end bracing can provide an alternative to distributed bracing that is currently required by TxDOT standard drawings. The end bracing method is recommended especially when concrete deck panels are not used at the thickened ends and the stiff connection is to be implemented.
Horizontal timber blocking in combination with top bracing bars is much more effective at restraining rotation of a girder than diagonal timber blocking. Horizontal timber blocking combined with top bracing provides restoring moment to the fascia girder. Therefore, horizontal timber blocking is recommended to be used for bracing of girder systems at the locations of top bracing bars.
The rigid-body model is recommended to be used for evaluating the safety of concrete girder systems subjected to overhang construction loads. Key values of bearing stiffness, stiffness of the timber blocking, and R-bar/bracing bar stiffness are included in this report.
System Buckling of Steel Girder Systems - Steel girder systems with a relatively large length to width ratio combined with unbalanced load from overhangs are susceptible to system buckling which is critical during construction of bridge decks. Therefore, unbalanced ovehang load should be taken into consideration when designing systems for bridge widening applications or other cases where unbalanced loading on girder systems may occur.
For system buckling, proportioning the interior and exterior overhang widths to produce zero net torque on the girder system is suggested to minimize effects of the eccentric overhang loads.
Effects of Overhang Brackets on Local Deformations in Web Plates - For a given overhang width, an overhang bracket that reacts close to the top fl ange can produce substantial lateral reaction force on the web. Therefore, the use of a large ratio of overhang bracket vertical dimension to overhang width, which often results in overhang brackets reacting close to the bottom fl ange, is recommended to minimize bracket reaction force.
Overhang width, overhang bracket reaction height, web slenderness, and stiffener spacing were the dominating factors for the lateral deformation in the web in a girder that is subjected to overhang load. Although these dominating factors intensifi ed web lateral deformation, the range of lateral deformations in the web for the cross sections studied was below the fabrication imperfection limit of D/150 specifi ed in the Bridge Welding Code from the American Welding Society (2008). In fi nished bridges, a web with an imperfection in the same direction as the lateral deformation imposed by the overhang bracket is likely to have web deformations larger than the D/150 limit, although the effects are most likely relatively minor.
85

0-5834-1Study of Elastomeric Bearings for Superelevated U-Beam Bridgeshttp://www.depts.ttu.edu/techmrtweb/Reports/Complete%20Reports/0-5834-1_fi nal.pdf
Key Words:superelevation, transverse, transverse slope, u-beam, elastomeric bearing
The primary objective of this research was to determine the best way to consider the effects of transverse superelevation on uniform-height steel-reinforced elastomeric bearing pads for U-Beam bridges. Existing TxDOT design provisions did not specifi cally account for the effects of the transverse superelevation.
A nationwide survey of Departments of Transportation (DOTs) revealed that the country was nearly evenly split on whether or not superstructure elements such as U-Beams should be placed on a transverse superelevation. Specifi c modifi cations to the AASHTO Method “A” design of elastomeric bearing equations were developed to account for the transverse superelevation. The proposed modifi cations were evaluated over typical U-Beam span/spacing combinations for both the U-40 and U-54 sections. The ability of the proposed modifi cations to predict actual behavior was evaluated by inspecting existing bridges and performing full-scale laboratory testing.
Both the fi eld inspections and the laboratory testing validated the need for the proposed revisions. These proposed revisions have been submitted as suggested revisions to the TxDOT LRFD Bridge Design Manual. The feasibility of electronic monitoring in-situ bearings that have experienced signifi cant transverse defl ections was investigated. The bulging on the sides of the bearings made monitoring unreliable. Instead, a method to manually record pertinent information during the routine bridge inspection is recommended.
Elevation View of Testing Frame: The test frame was composed of three separate smaller frames, allowing for the bearing to be loaded in three directions simultaneously.
86
0-6063-1Site Specifi c Wave Parameters for Texas Coastal Bridges: Final Reporthttp://tti.tamu.edu/documents/0-6063-1.pdf
Key Words:Wave Forces, Wave Action, Storm Surge, Coastal Bridges, Hurricane, Wave Parameters
Site specifi c wave parameters (wave height and wave period) have been developed for four bridges along the Texas coast. These parameters were developed using results of numerical simulations of wave and storm surge performed at combinations of different hurricane wind and storm surge levels. We observed that extreme wave heights at these four bridges generally increase with hurricane wind speed and storm surge level. At Rollover Pass Bridge, the wave heights were less sensitive to wind speed.
Hurricane Ike provided us an opportunity to validate the capability of the numerical models we used for wave and storm surge simulations. Comparisons between model results and measured wave height and high water mark data indicated that the wave model SWAN and storm surge model ADCIRC are capable of reproducing the extreme wave conditions during Hurricane Ike with high accuracy.
Flood levels derived by hurricane meteorology were estimated near the locations of 20 vulnerable bridges widely spread throughout the Texas coast. To incorporate the wide range of study area with minimum computational workload, the surge response function (SRF) method was optimized for accurate surge predictions. Based on the numerical storm surge simulations of more than 105 storms traveling over 15 parallel tracks, 20 SRFs were developed to characterize storm surge behavior at each target bridge location along the Texas coast. The SRFs performed surge prediction was within 30 cm root-mean-square (RMS) error range in comparison to the numerically simulated surge levels. Considering that the model computation accuracy was in the order of 20 to 30 cm, it was concluded that the obtained SRFs are capable of providing accurate surge prediction in the region of interest.
The capability of SRF in capturing the spatial trends of storm surge for a given hurricane condition was proved through comparison to historical storm surge records (Carla in 1961 and Ike in 2008). In addition, the application of SRF for the extreme-value analysis of storm surge was demonstrated. The peak surge levels expected at the bridge locations were estimated accordingly to various hurricane conditions based on the hurricane meteorology typically observed in the Gulf of Mexico. From this analysis, it was shown that the SRF can be used to predict the relative distance between a hurricane’s landfall and the location of the maximum fl ooding expected on the given hurricane meteorology. In addition, it can also predict peak surge levels.
Study was undertaken to optimize the use of SRF to produce peak surge predictions over a wide range of hurricane meteorological conditions along the Texas coast. The effects of shoreline orientation, storm forward speed, and interaction with complex geographical features inside a bay were considered as insignifi cant on storm surge response. Such simplifi cations were justifi ed by partitioning off the entire study area into three regions, within which the assumption of the slowly varying geographical feature was applicable. However, in order to make wide use of SRF methodology and improve the credibility in the predictions from SRF, research to account for the listed variability in the hurricane meteorology and the regional geography remains to be conducted. Moreover, the prediction made by SRF does not include certain forcing factors, such as wave radiation and astronomical tide. For engineering applications, hurricane impact should be evaluated after coupling with the excluded forcing factors by utilizing the SRF surge prediction as an initial estimation. Finally, in order to apply the SRF method for storm surge hazard analysis, further incorporation with the statistical application has to be made.
In 2008, AASHTO published Guide Specifi cations for Bridges Vulnerable to Coastal Storms, which provided equations for computation of wave forces on coastal bridges. The results obtained in this project will enable TxDOT to quickly implement the equations in AASHTO guidelines to determine wave forces on the four bridges studied in this project.
87

0-6069-1Long-Term Performance of GFRP Reinforcement: Technical Reporthttp://tti.tamu.edu/documents/0-6069-1.pdf
Key Words:Glass, Fiber-Reinforcement, Glass Fiber-Reinforced Polymer, Polymer, Durability, Deterioration, Service Life, Concrete Reinforcement
Glass fi ber reinforced polymer (GFRP) reinforcing bars can provide many advantages to the owners and constructors of infrastructure systems. These advantages have been widely reported. Although the advantages are many, the acceptance of using GFRP bars has been hampered by longer-term data on residual strengths when embedded in concrete. This research evaluated the residual capacity and modulus of elasticity of GFRP embedded in concrete for 7 years. The authors found no information in the literature that provides results from GFRP-reinforced beams beyond 3 years. These data can provide valuable information to the GFRP engineering community.
A state-of-the-art model to predict the actual performance of GFRP bars embedded in concrete was developed. The data from the experimental program of this project and the additional data available from the literature were used to construct the probabilistic model capturing the dependency of the tensile strength on time and the initial bar size. The developed probabilistic model is unbiased and properly accounts for the relevant sources of uncertainties, including the statistical uncertainty in the estimation of the unknown model parameters and the model error associated to the inexact model form. The developed time-variant model can provide required information to assess the safety and performance of GFRP reinforcing bars embedded in decks, pavements, and other infrastructure elements over time.
The model indicates that the decay of the mean stress capacity is rapid over the fi rst few years and gradually slows as time increases. Furthermore, the decay is more pronounced for smaller bars than for larger bars. The developed probabilistic model was also used to assess the probability that the actual stress capacity of GFRP bars does not meet the ACI 440 minimum capacity requirement over time. The model predicted that for a specifi ed bar size, the probability of not meeting the ACI 440 requirement increases with time. Conversely, at the same time, the probability decreases as the bar size increases. In particular, in 100 years #3 bars reach a 0.44 probability of not meeting the ACI 440 requirement, #5 bars reach a 0.25 probability, and #6 bars reach a 0.2 probability.
While the developed model provides valuable information on the long-term performance of GFRP bars embedded in concrete, additional research is needed to assess the time-variant structural reliability of whole structures. A reliability analysis would answer the fundamental question on the actual safety of structures with GFRP bars. The developed probabilistic model should be used in assessing the structural capacity over time needed for a time-variant structural reliability analysis. It should also be noted that the GFRP reinforcing bars assessed in this research were embedded in concrete that was not subjected to loads other than the self-weight of the beam. The literature indicates that the residual capacity of GFRP subjected to load is less than GFRP bars subjected to no load.
88

9-4973-1Analysis of Large Truck Collisions With Bridge Piers: Phase 1. Report of Guidelines for Designing Bridge Piers and Abutments for Vehicle Collisionshttp://tti.tamu.edu/documents/9-4973-1.pdf
Key Words:Bridge Piers, Abutments, Vehicle Collisions, Load Resistance Factor Design, LRFD, Heavy Trucks,Single-Unit Trucks, Bridge Design
The current AASHTO LRFD Bridge Design Specifi cations require that “abutments and piers located within a distance of 30.0 ft of the edge of the roadway, or within a distance of 50.0 ft to the centerline of a railway track, shall be designed for an equivalent static force of 400 kip . . .” Further guidance is not given to the designer. Also, detailed warrants for application of this requirement are not stated.
The objective of this effort is to address warrants for application of this requirement and the validity of magnitude of the design force. Work performed in this portion of the project included an investigation of collisions of trucks with bridge piers that occurred on the highway, fi nite element analyses of truck collisions with bridge piers, and a formulation of a methodology for estimating the risk of a truck colliding with a bridge pier.
Nineteen accidents involving trucks colliding with bridge piers were investigated and are reported. Several accidents resulted in partial or complete structural failure of the pier. Failure mechanisms consisted of two shear failure planes – one extending upward from the applied load at approximately 45 degrees and the other extending downward at approximately 45 degrees.
Finite element analyses of trucks colliding with bridge piers were performed using the LS-DYNA computer program. Parameters investigated included type of truck (65,000-lb SUT and 80,000-lb tractor-trailer), type of cargo (deformable and rigid), impact speed (40, 50, and 60 mph), and diameter of pier (24, 36, and 48 inches). The analyses indicate that, within the range of parameters studied, forces imposed on a pier can be much higher than 400 kips and that the magnitude of force is highly dependent on the cargo type (deformable or rigid). As expected, higher impact speeds generate higher forces. The effect of pier diameter on magnitude of force was not strong.
Results of research reported herein and other research reviewed indicate that collision forces generated on an assumed rigid bridge pier during a collision by a truck traveling at usual highway speeds is strongly dependent on the structure of the vehicle and the properties of the payload being carried. For typical trucks with soft, deformable payloads, forces generated are expected to be less than 1000 kips. For more rigid payloads, short duration dynamic forces can be as high as 2500 to 3000 kips.
A methodology for estimating the risk for a heavy vehicle to leave the traveled-way and hit a bridge pier is presented. The methodology is divided into two components: crash risk analysis and regression models. Crash and highway network data for the States of Texas and Minnesota were used for developing the methodology. The data collected in this project included average annual daily traffi c, estimated truck average annual daily traffi c, segment length, lane width, shoulder width, median width, and the number of curves, among others. The fi rst component of the methodology is very similar to the risk analysis tools proposed by AASHTO for bridge piers located on waterways. The crash probability analysis using the Texas data showed that undivided segments have higher risk for a truck to run-off-the-road than for divided segments. Also, tangent sections experienced less run-off-the-road crashes than horizontal curves for undivided highway segments. The second component focused on developing the regression models for heavy vehicle running-off-the-road and hit bridge pier crashes. Separate models were developed for undivided and divided roads, as well as for the straight tangent sections and horizontal curves. Initially, models were developed with truck fl ow as the only variable. Subsequently, additional models were developed with different variables that are known to infl uence running-off-the road and hit bridge pier crashes. Finally, two examples are provided to describe how the methodology can be used for individual sites and corridor studies.
The researchers developed and recommended four concepts for a test pier that were reviewed by the project panel. A load measuring test pier recommended by the researchers was selected by the panel for use in full-scale truck crash tests in Phase 2 of this study.
89


Texas Department of TransportationResearch and Technology Implementation OfficeP.O. Box 5080Austin, Texas 78763-5080
Telephone: 512-416-4730Fax: 512-416-4734