annual report on port state control in the asia-pacific region 2010 · memorandum of understanding...
TRANSCRIPT

ANNUAL REPORT
ON PORT STATE CONTROL
IN THE ASIA-PACIFIC REGION
2010

This work is copyright. It may be reproduced in whole or part subject to the inclusion of an acknowledgement of the source but not for commercial use or sale. Further information may be obtained from: The Tokyo MOU Secretariat Ascend Shimbashi 8F 6-19-19 Shimbashi Minato-ku, Tokyo Japan 105-0004 Tel: +81-3-3433-0621 Fax: +81-3-3433-0624
This Report is also available at Tokyo MOU web-site (http://www.tokyo-mou.org) on the Internet.

MEMORANDUM OF UNDERSTANDING ON PORT STATE CONTROL IN THE ASIA-PACIFIC REGION
FOREWORD
We are pleased to present the Annual Report on Port State Control in the Asia-Pacific Region 2010. With the dedicated efforts and contributions by the eighteen member Authorities, the Tokyo MOU enjoys continued success and achievements. The total number of PSC inspections by the Tokyo MOU exceeded 25,000 in 2010 for the first time. For long term development and achievement, Tokyo MOU adopted a strategic plan, which describes the clear vision and mission to be achieved as the ultimate goal, reiterates the commitments to PSC to be accomplished for the coming years and addresses the internal and external challenges to be taken on the way ahead. This annual report provides an overview of the port State control developments and activities of the Tokyo MOU in 2010. Furthermore, the report also provides port State control statistics and analysis which summarizes the results of inspections carried out by member Authorities during the year. Though the detention rate has declined during the past two years, the number of detentions is still high. Some ships are repeatedly detained but have made little or no effort for improvement. For this reason, Tokyo MOU started to publish a list of “under-performing ships”, to warn flag States and companies, that their ships will be inspected by port States at each and every port call within the region. The Tokyo MOU will continue to devise further actions and measures which can be applied to eliminate substandard ships from the region so as to promote the maritime safety, security, protection of the marine environment and to ensure living and working condition onboard.
Hua Siong Ong Mitsutoyo Okada Chairman Secretary Port State Control Committee Tokyo MOU Secretariat

MEMORANDUM OF UNDERSTANDING ON PORT STATE CONTROL IN THE ASIA-PACIFIC REGION
CONTENTS page
OVERVIEW
General introduction ............................................................................…….. 1
Review of year 2010 .............................................................................…….. 2
The Port State Control Committee ......................................................…….. 3
Technical Working Group (TWG) ……………………………………………… 5
The Asia-Pacific Computerized Information System (APCIS) ...........……. 5
Training and seminars for port State control officers .......................…….. 6
Co-operation with other regional port State control agreements ………... 9
PORT STATE CONTROL UNDER THE TOKYO MOU, 2010
Inspections ...........................................................................................……... 11
Detentions ............................................................................................……... 11
Deficiencies ..........................................................................................……... 12
Overview of port State control results 2000-2010 …………………………... 13
ANNEX 1 -- STATUS OF THE RELEVANT INSTRUMENTS .......................….. 20
ANNEX 2 -- PORT STATE INSPECTION STATISTICS ..............................…….. 22
Statistics for 2010 .....................................................................……… 22
Summary of port State inspection data 2008-2010 .......................… 31
ANNEX 3 -- ORGANIZATION STRUCTURE OF THE TOKYO MOU .............. 49
Explanatory Note on the Black-Grey-White Lists ……………………………… 50

MEMORANDUM OF UNDERSTANDING ON PORT STATE CONTROL IN THE ASIA-PACIFIC REGION
LIST OF FIGURES AND TABLES pageFigure 1 Inspection percentage ………………………………………………….. 14Figure 2 Port State inspections - contribution by Authorities ……………… 14Figure 3 Type of ship inspected ………………………………………………….. 15Figure 4 Detentions per flag ……………………………………………………… 15Figure 5 Detention per ship type ………………………………………………… 16Figure 6 Deficiencies by main categories ……………………………………… 16Figure 7 Most frequent detainable deficiencies ………………………………. 17Figure 8 No. of inspections ……………………………………………………….. 18Figure 9 Inspection percentage ………………………………………………….. 18Figure 10 No. of inspections with deficiencies …………………………………. 18Figure 11 No. of deficiencies ………………………………………………………. 19Figure 12 No. of detentions …………………………………….…………………... 19Figure 13 Detention percentage ……………………………….…………………... 19Figure 14 Comparison of inspections per ship type …………………………... 37Figure 15 Comparison of detentions per ship type ………………………….… 37Figure 16 Comparison of inspections with deficiencies per ship type …….. 39Figure 17 Comparison of number of deficiencies by main categories …….. 45Figure 18 Comparison of most frequent detainable deficiencies …………… 47 Table 1 Status of the relevant instruments …………………………………… 20Table 1a Status of MARPOL 73/78 ……………………………………………….. 21Table 2 Port State inspections carried out by Authorities …………………. 22Table 2a Port State inspections on maritime security ……………………….. 23Table 3 Port State inspections per flag ……………………………………….. 24Table 4 Port State inspections per ship type …………………………………. 27Table 5 Port State inspections per recognized organization …….……….. 28Table 6 Deficiencies by categories …………………………………………….. 30Table 7 Black – Grey – White Lists ……………………………………………... 31Table 8 Inspections and detentions per flag …………………………………. 33Table 9 Inspections and detentions per ship type ………………………….. 38Table 10 Inspections with deficiencies per ship type ……………………….. 40Table 11 Inspections and detentions per recognized organization ……….. 41Table 12 Performance of recognized organization …………………………… 43Table 13 Comparison of deficiencies by categories ………………………….. 46Table 14 Comparison of most frequent detainable deficiencies …………… 48

MEMORANDUM OF UNDERSTANDING ON PORT STATE CONTROL IN THE ASIA-PACIFIC REGION
1
O V E R V I E W
GENERAL INTRODUCTION
The Annual Report on Port State Control in the Asia-Pacific Region is published under the auspices of the Port State Control Committee of the Memorandum of Understanding on Port State Control in the Asia-Pacific Region (Tokyo MOU). This annual report is the sixteenth issue and covers port State control activities and developments in the year 2010. The Memorandum was concluded in Tokyo on 1 December 1993. The following maritime Authorities in the Asia-Pacific region are the signatories to the Memorandum: Australia, Canada, Chile, China, Fiji, Hong Kong (China), Indonesia, Japan, Republic of Korea, Malaysia, New Zealand, Papua New Guinea, the Philippines, the Russian Federation, Singapore, Solomon Islands, Thailand, Vanuatu and Vietnam. The Memorandum came into effect on 1 April 1994. In accordance with the provisions of the Memorandum, the Authorities which have signed and formally accepted the Memorandum or which have been accepted with unanimous consent of the Port State Control Committee would become full members. Currently, the Memorandum has 18 full members, namely: Australia, Canada, Chile, China, Fiji, Hong Kong (China), Indonesia, Japan, Republic of Korea, Malaysia, New Zealand, Papua New Guinea, the Philippines, the Russian Federation,
Singapore, Thailand, Vanuatu and Vietnam. A maritime Authority which declared the clear intention to fully adhere to the Memorandum within a three-year period would be accepted as a co-operating member with unanimous consent of the Port State Control Committee. The Republic of the Marshall Islands is the only co-operating member Authority at the moment. The main objective of the Memorandum is to establish an effective port State control regime in the Asia-Pacific region through co-operation of its members and harmonization of their activities, to eliminate substandard shipping so as to promote maritime safety, to protect the marine environment and to safeguard working and living conditions on board ships. The Port State Control Committee established under the Memorandum monitors and controls the implementation and on-going operation of the Memorandum. The Committee consists of representatives of the member Authorities, co-operating member Authorities and observers. The observer status has been granted the following maritime Authorities and the inter-governmental organizations by the Committee: Democratic People’s Republic of Korea, Macao (China), Solomon Islands, United States Coast Guard, the International Maritime Organization (IMO), the International Labour Organization (ILO), the Paris MOU, the Viña del Mar Agreement, the Indian Ocean MOU and the Black Sea MOU. The
MEMORANDUM OF UNDERSTANDING ON PORT STATE CONTROL IN THE ASIA-PACIFIC REGION
2
Secretariat of the Memorandum is located in Tokyo, Japan. For the purpose of the Memorandum, the following instruments are the basis for port State control activities in the region:
− the International Convention on Load Lines, 1966;
− the Protocol of 1988 relating to the International Convention on Load Lines, 1966, as amended;
− the International Convention for the
Safety of Life at Sea, 1974, as amended;
− the Protocol of 1978 relating to the International Convention for the Safety of Life at Sea, 1974;
− the Protocol of 1988 relating to the International Convention for the Safety of Life at Sea, 1974;
− the International Convention for the
Prevention of Pollution from Ships 1973, as modified by the Protocol of 1978 relating thereto, as amended;
− the International Convention on Standards for Training, Certification and Watchkeeping for Seafarers, 1978, as amended;
− the Convention on the International Regulations for Preventing Collisions at Sea, 1972;
− the International Convention on Tonnage Measurement of Ships, 1969;
− the Merchant Shipping (Minimum
Standards) Convention, 1976 (ILO Convention No. 147); and
− the International Convention on the
Control of Harmful Anti-fouling Systems on Ships, 2001.
REVIEW OF YEAR 2010
After two years preparation and consideration, the Tokyo MOU adopted a strategic plan and the related strategic directions, and plan of actions. The development of the strategic plan will enable the Tokyo MOU to have a clearer view of middle and long term future and to react effectively to the internal and external challenges. As a message to the industry and the public, the key elements of the strategic plan are made available on the Tokyo MOU web-site. The concentrated inspection campaign (CIC) on Harmful Substances (Marine Pollutants) Carried in Packaged Form in accordance with MARPOL Annex III, SOLAS Chapter VII and the IMDG Code was conducted from 1 September to 30 November 2010. The campaign was intended to check whether the ship had an appropriate document of compliance (DOC) which covered the harmful substances (Marine Pollutants) being carried; whether the ship was provided with relevant documents and information corresponding to the harmful substances (marine pollutants) carried onboard; whether emergency procedures to be employed in the event of an incident involving harmful substances (marine pollutants) were in place and the crew were aware of them and, whether harmful substances (marine pollutants) carried were marked, stowed and secured appropriately.

MEMORANDUM OF UNDERSTANDING ON PORT STATE CONTROL IN THE ASIA-PACIFIC REGION
3
During the campaign period, a total of 4,079 CIC inspections were carried out, of which 589 (14.4%) are ships either carrying or loading marine pollutants and of which 542 are container ships. There were a total of 305 instances of non-compliance observed, of which areas related to documentation were 178 (58.4%) and areas related to cargo marking, stowing and securing were 127 (41.6%). Of the ships carrying or loading Marine Pollutants, 10 detentions were recorded. The detention rate is 1.7% of ships that were carrying or loading marine pollutants. It has been a concern for some years that a number of vessels which have been detained repeatedly are still operating in the region. For increasing pressure on these vessels, the Tokyo MOU decided to implement a package of actions against such ships on a trial basis, which include publication of a monthly list of under-performing ships (i.e. ships were detained three or more times during previous twelve months), inspection of
“under-performing ships” at each and every port call within the region and sending warning letters to flag States and companies of the listed ships.
THE PORT STATE CONTROL COMMITTEE
The Port State Control Committee met in Hanoi, Viet Nam, from 14 to 17 June 2010 for its twentieth meeting. The meeting was hosted by the Viet Nam Maritime Administration. The meeting was chaired by Dr. Vitaly Klyuev, Deputy Director of the Department of State Policy for Maritime and River Transport, Ministry of Transport of the Russian Federation. The twentieth Committee meeting was attended by representatives of the member Authorities of Australia, Canada, Chile, China, Hong Kong (China), Indonesia, Japan, Republic of Korea, Malaysia, New Zealand, Papua New Guinea, the Philippines, the Russian Federation, Singapore, Thailand and Viet Nam, and observers from DPR Korea,
The twentieth Committee meeting, Hanoi, June 2010.
MEMORANDUM OF UNDERSTANDING ON PORT STATE CONTROL IN THE ASIA-PACIFIC REGION
4
Macao (China), the United States Coast Guard, the Black Sea MOU, the Indian Ocean MOU, the Paris MOU and the Viña del Mar Agreement. The Committee considered the application for Co-operating Member status by the Marshall Islands and an evaluation report thereon by a monitoring team. The Committee unanimously agreed to accept the Marshall Islands as the first Co-operating Member of the Tokyo MOU in accordance with the relevant provisions of the Memorandum. The Committee also approved a number of recommendations made to the Marshall Islands for facilitating its establishment of effective national PSC system and improvement of its PSC activities. The Committee received a completed draft strategic directions and plan of actions prepared by the inter-sessional group on strategy and finalized by an ad hoc group meeting. The Committee approved the strategic directions and plan of actions. Furthermore, the Committee formally adopted the strategic plan that had been agreed in principle at the last meeting. The Committee decided to publish the key elements of the strategic plan on the MOU web-site. The Committee agreed to keep the strategy issue as a standing agenda to be reviewed at each meeting. The Committee considered a provisional analysis report of the CIC on lifeboat launching arrangements conducted in 2009. The Committee approved the arrangements for the CIC on Harmful Substances (Marine Pollutants) Carried in Packaged Form (MARPOL Annex III, SOLAS VII and the IMDG Code) scheduled for the period from 1 September to 30 November 2010. For the purpose of giving highlight on closer
co-operation and promoting further joint CICs with the Paris MOU, the Committee agreed to adjust the original plan for future CICs. In this regard, the Committee decided to deal with the same subject – structural safety and Load Lines as the Paris MOU for the CIC in 2011. The Committee decided to conduct a joint CIC on Fire Safety System (FSS) with the Paris MOU in 2012. Moreover, the Committee agreed to adopt the general principles for CIC harmonized with the Paris MOU. The Committee approved a revised guidance for PSC on checking for compliance with long range identification and tracking (LRIT). The Committee considered and approved the integrated strategic plan for technical co-operation programmes from 2011 to 2015. The Committee authorized the Secretariat to develop and implement the technical co-operation projects in accordance with the approved plan. During the meeting, the Committee also gave consideration and made decisions on the following: • review of list of follow-up actions
emanating from the second Joint Ministerial Conference;
• analysis of data on ship targeting factor
usage; • adoption of measures on under-performing
ships;
• consideration of elements of Paris MOU new inspection regime (NIR);
• draft agreement for data exchange with
GISIS; and

MEMORANDUM OF UNDERSTANDING ON PORT STATE CONTROL IN THE ASIA-PACIFIC REGION
5
• awarding the winner of the best deficiency photo of the year.
As term of office of both the Chairman, Dr. Vitaly Klyuev of the Russian Federation, and the Vice-Chairman, Mr. Ong Hua Siong of Singapore, expired at the end of the meeting, the Committee unanimously elected Mr. Ong Hua Siong, Assistant Director (Ship Regulation and Development/Port State Control), Shipping Division, Maritime and Port Authority of Singapore, as the Chairman and Mr. Abdul Samad Bin Shaik Osman, Principal Assistant Director, Maritime Industry Control Division, Marine Department Peninsular Malaysia, as the Vice-Chairman for the next three meetings of the Committee. The Committee expressed its deep appreciation to Dr. Vitaly Klyuev for his able chairmanship performed during the meetings. The twenty-first meeting of the Port State Control Committee will be held in Republic of Korea in 2011.
TECHICAL WORKING GROUP (TWG) The third meeting of the Technical Working Group (TWG) was held in Hanoi, Viet Nam, from 11 to 12 June 2010, in conjunction with the twentieth meeting of the Committee. The TWG03 meeting was chaired by Mr. Christopher Lindesay, Principal System Officer, Australian Maritime Safety Authority. The TWG meeting discussed and made recommendations to the Committee on matters relating to: • cases considered by the detention review
panel; • periodical revision of the PSC Manual;
• development and review of PSC
guidelines;
• preparation and arrangements for on-going and upcoming CICs;
• reports of intersessional groups: advisory
group on information exchange (AG-IE), intersessional group on batch protocol (IG-BP) and intersessional group on statistics (IG-Statistics);
• activities and operation of the APCIS
system; • amendments to the codes; • analysis and statistics on PSC; • information exchange with other regional
PSC databases; and
• reports and evaluations of technical co-operation activities.
Mr. Christopher Lindesay of Australia and Mr. Ning Bo of China were unanimously re-elected as the Chairman and the Vice-Chairman of TWG respectively for the next three meetings.
ASIA-PACIFIC COMPUTERIZED INFORMATION SYSTEM (APCIS)
For reporting and storing of port State inspection results and facilitating exchange of information in the region, a computerized database system, the Asia-Pacific Computerized Information System (APCIS), was established. The central site of the APCIS is located in Moscow, under the auspices of
MEMORANDUM OF UNDERSTANDING ON PORT STATE CONTROL IN THE ASIA-PACIFIC REGION
6
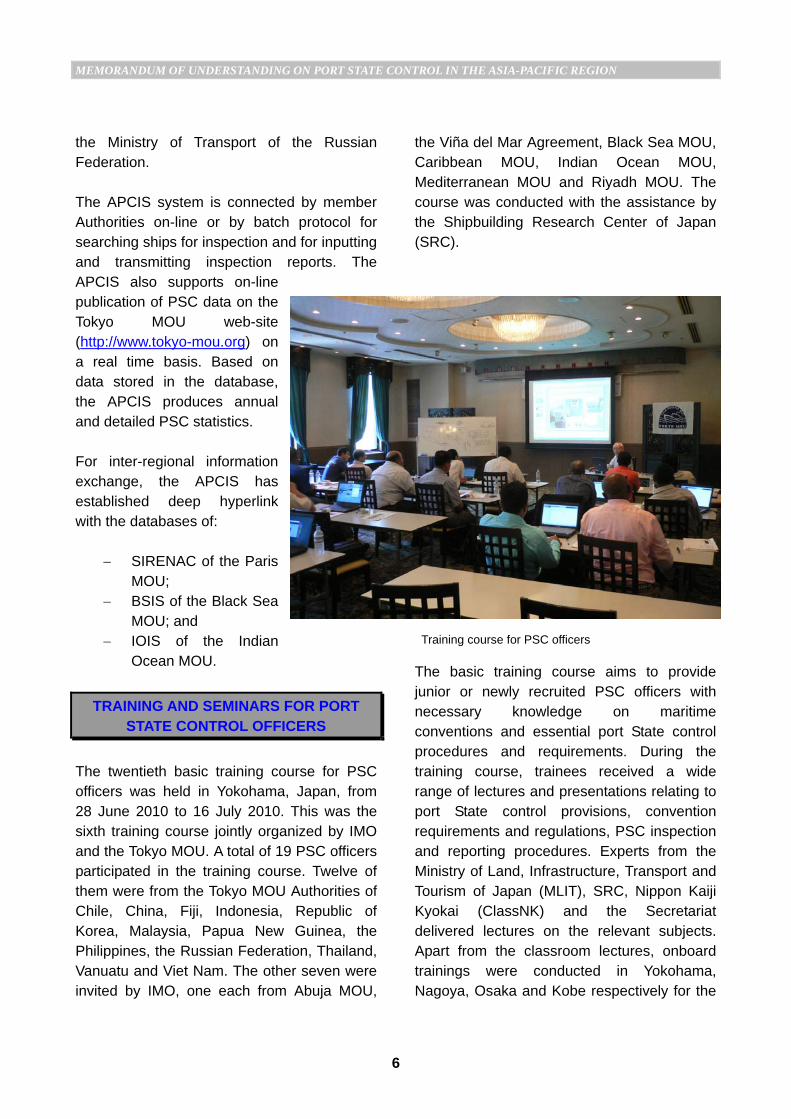
Training course for PSC officers
the Ministry of Transport of the Russian Federation. The APCIS system is connected by member Authorities on-line or by batch protocol for searching ships for inspection and for inputting and transmitting inspection reports. The APCIS also supports on-line publication of PSC data on the Tokyo MOU web-site (http://www.tokyo-mou.org) on a real time basis. Based on data stored in the database, the APCIS produces annual and detailed PSC statistics. For inter-regional information exchange, the APCIS has established deep hyperlink with the databases of:
− SIRENAC of the Paris MOU;
− BSIS of the Black Sea MOU; and
− IOIS of the Indian Ocean MOU.
TRAINING AND SEMINARS FOR PORT STATE CONTROL OFFICERS
The twentieth basic training course for PSC officers was held in Yokohama, Japan, from 28 June 2010 to 16 July 2010. This was the sixth training course jointly organized by IMO and the Tokyo MOU. A total of 19 PSC officers participated in the training course. Twelve of them were from the Tokyo MOU Authorities of Chile, China, Fiji, Indonesia, Republic of Korea, Malaysia, Papua New Guinea, the Philippines, the Russian Federation, Thailand, Vanuatu and Viet Nam. The other seven were invited by IMO, one each from Abuja MOU,
the Viña del Mar Agreement, Black Sea MOU, Caribbean MOU, Indian Ocean MOU, Mediterranean MOU and Riyadh MOU. The course was conducted with the assistance by the Shipbuilding Research Center of Japan (SRC).
The basic training course aims to provide junior or newly recruited PSC officers with necessary knowledge on maritime conventions and essential port State control procedures and requirements. During the training course, trainees received a wide range of lectures and presentations relating to port State control provisions, convention requirements and regulations, PSC inspection and reporting procedures. Experts from the Ministry of Land, Infrastructure, Transport and Tourism of Japan (MLIT), SRC, Nippon Kaiji Kyokai (ClassNK) and the Secretariat delivered lectures on the relevant subjects. Apart from the classroom lectures, onboard trainings were conducted in Yokohama, Nagoya, Osaka and Kobe respectively for the

MEMORANDUM OF UNDERSTANDING ON PORT STATE CONTROL IN THE ASIA-PACIFIC REGION
7
On-the-job training
On-the-job training
trainees to gain practical experience on PSC inspections. Moreover, a technical visit to a liferaft manufacturer was also arranged. The eighteenth seminar for PSC officers was held in Shenzhen, China, from 26 to 29 July 2010. The seminar was hosted by the China Maritime Safety Administration (MSA). Participants from Authorities of Australia, Canada, Chile, China, Fiji, Hong Kong (China), Indonesia, Japan, Democratic People’s Republic of Korea, Republic of Korea, Macao (China), Malaysia, Papua New Guinea, the Philippines, the Russian Federation, Singapore, Thailand and Viet Nam attended the seminar. At the seminar, an expert from MLIT of Japan made a comprehensive presentation about the revised MARPOL
Annex VI and the related PSC guidelines. An expert from the Australian Maritime Safety Authority (AMSA) provided a detailed introduction and explanations on the CIC on Harmful Substances (Marine Pollutants) Carried in Packaged Form (MARPOL Annex III, SOLAS VII and the IMDG Code). Another expert from China MSA delivered an informative presentation on PSC on LRIT. Participants were also informed of the recent development and activities of the Tokyo MOU, the results of the CIC on
lifeboat launching arrangements in 2009 and PSC activities in China. There were two case study sessions conducted during the seminar as well as discussion of the actual cases provided by Authorities or reviewed by the detention review panel.

MEMORANDUM OF UNDERSTANDING ON PORT STATE CONTROL IN THE ASIA-PACIFIC REGION
8
The eighteenth seminar for PSC officers
Fellowship training for PSC officers
Four fellowship trainings were conducted in China, Japan, Republic of Korea and the Russian Federation. Two PSC officers, one from Indonesia and the other from Viet Nam, attended the fellowship training in Pusan, Republic of Korea, from 25 May to 4 June 2010. Three PSC officers participated in the fellowship training in China: two officers, one each from the Philippines and Thailand were trained in Dalian from 3 to 13 August 2010 and one officer from Malaysia was trained in Shanghai from 14 to 24 September 2010. The Russian Federation received one PSC officer from China for the fellowship training in Vladivostok from 21 September to 1 October 2010. From 22 October to 4 November 2010, 10 PSC officers
from the Authorities of Chile, China, Indonesia, Republic of Korea, Malaysia, Papua New Guinea, the Philippines, the Russian Federation, Thailand and Viet Nam participated in the fellowship training in Japan. Participants, being divided into five groups,
took part in onboard training separately in Yokohama, Nagoya, Osaka, Kobe and Hiroshima. One expert mission was organized in Cebu, the Philippines, from 6 to 17 September 2010. Experts from Japan conducted onboard training for this mission. Two experts from AMSA were dispatched to Suva, Fiji, for training from 18 to 29 October 2010. Malaysia received one expert mission training in Kuching, conducted by two experts from Japan, during the period from 22 November to 3

MEMORANDUM OF UNDERSTANDING ON PORT STATE CONTROL IN THE ASIA-PACIFIC REGION
9
December 2010. In 2010, six PSC officer exchanges were completed, namely one PSC officer from Singapore to Japan, one from Hong Kong (China) to Australia, one from Republic of Korea to Canada, one from New Zealand to Singapore, one from Canada to Hong Kong (China) and one from Singapore to Republic of Korea. Currently, the PSC officers exchange programme is implemented among the Authorities of Australia, Canada, China, Hong Kong (China), Japan, Republic of Korea, New Zealand and Singapore. The technical co-operation programmes are implemented successfully with full support and active participation by all Authorities. The Nippon Foundation kindly provides the continuous financial assistance to the Tokyo MOU technical co-operation activities. In accordance with the integrated strategic plan for technical co-operation programmes from 2011 to 2015 approved by the Port State Control Committee in 2010, some changes and improvements will be made to the technical co-operation activities. The new elements in the technical co-operation programmes include the creation of general training course (GTC) for PSC based on the existing basic training and fellowship training courses and the introduction of specialized training course (STC). The expert mission, PSCO Exchange Programme and PSC Seminar will remain.
CO-OPERATION WITH OTHER REGIONAL PORT STATE CONTROL AGREEMENTS
Establishment and effective operation of regional co-operation regimes on port State control has formed a worldwide network for
elimination of substandard shipping. Currently, there are a total of nine regional port State control agreements (MOUs) covering the major part of the world, namely:
− Paris MOU − Viña del Mar Agreement − Tokyo MOU − Caribbean MOU − Mediterranean MOU − Indian Ocean MOU − Abuja MOU − Black Sea MOU − Riyadh MOU
As one of the inter-governmental organizations (IGO) associated with IMO, the Tokyo MOU has attended the meetings of the Flag State Implementation (FSI) Sub-Committee since 2006. The Tokyo MOU Secretariat presented at the eighteenth session of FSI in July 2010. In support of inter-regional collaboration on port State control, the Tokyo MOU holds an observer status of the Paris MOU, the Caribbean MOU and the Indian Ocean MOU. In a similar manner, the Tokyo MOU has granted an observer status to the Paris MOU, the Indian Ocean MOU, the Viña del Mar Agreement and the Black Sea MOU. The Tokyo MOU has established and maintained effective and close co-operation with the Paris MOU both at administrative and the technical levels. Representatives of the two Secretariats attend the Port State Control Committee meetings of each MOU on a regular basis. During the period of 2010, continuous efforts and further co-ordinated actions by the two Memoranda were made on the following:

MEMORANDUM OF UNDERSTANDING ON PORT STATE CONTROL IN THE ASIA-PACIFIC REGION
10
− plan for a joint CIC on FSS in 2012 and development of general principles for CICs;
− continuous submissions to IMO on
annual list of flags targeted by the Paris MOU, Tokyo MOU and the United States Coast Guard and the updated list of follow-up actions emanating from the 2nd Ministerial Declaration;
− review of PSC guidance on LRIT in a
harmonized manner;
− consideration of assessment of performance of companies and correlation between flag and RO; and
− joint arrangements for implementation
and maintenance of the coding system.
With the co-operation and support by the Indian Ocean MOU Secretariat and the relevant Authorities, a second advanced course for PSC was organized in 2010 in the Indian Ocean MOU region under the project of technical co-operation with other regions. The course was carried out in Kochi, India, from 4 to 15 October 2010. Experts from the Tokyo MOU Authorities of Australia, Chile and Japan and an officer from the Tokyo MOU Secretariat were dispatched for conducting the training. The project for technical co-operation with other regions is implemented with the financial support by the Nippon Foundation.
PSC training course for Indian Ocean MOU
MEMORANDUM OF UNDERSTANDING ON PORT STATE CONTROL IN THE ASIA-PACIFIC REGION
11
PORT STATE CONTROL UNDER THE TOKYO MOU, 2010
INSPECTIONS
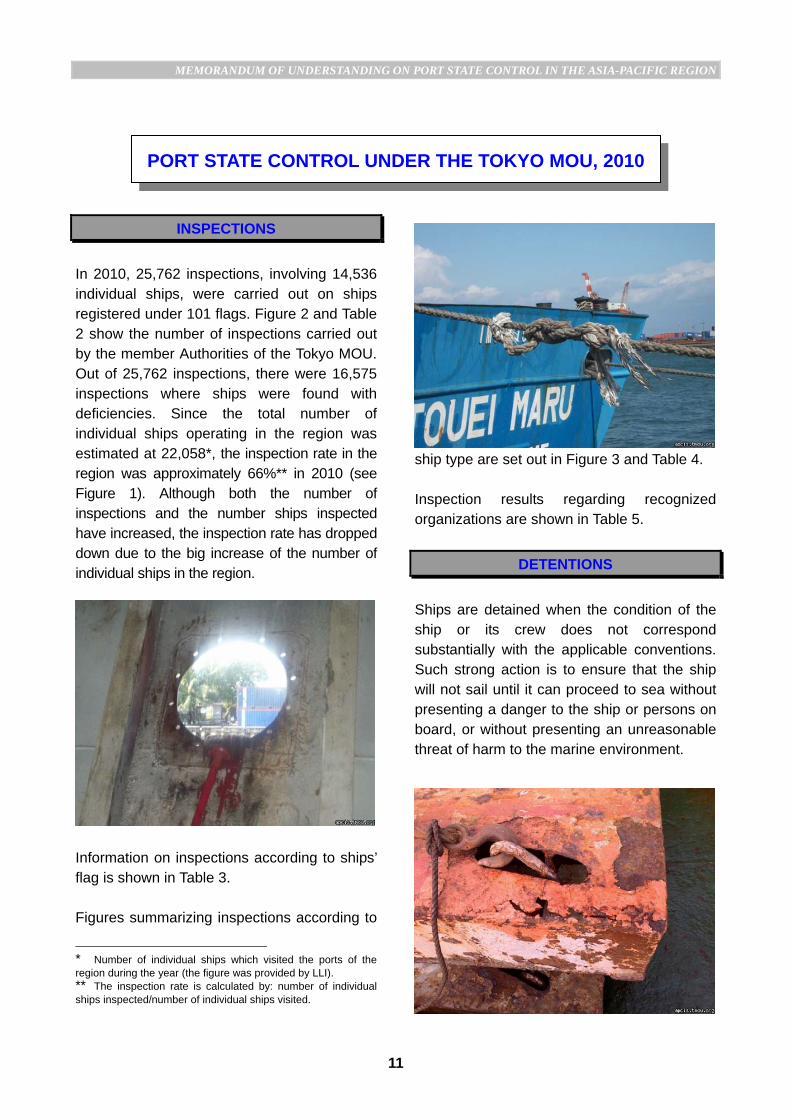
In 2010, 25,762 inspections, involving 14,536 individual ships, were carried out on ships registered under 101 flags. Figure 2 and Table 2 show the number of inspections carried out by the member Authorities of the Tokyo MOU. Out of 25,762 inspections, there were 16,575 inspections where ships were found with deficiencies. Since the total number of individual ships operating in the region was estimated at 22,058*, the inspection rate in the region was approximately 66%** in 2010 (see Figure 1). Although both the number of inspections and the number ships inspected have increased, the inspection rate has dropped down due to the big increase of the number of individual ships in the region.
Information on inspections according to ships’ flag is shown in Table 3. Figures summarizing inspections according to
* Number of individual ships which visited the ports of the region during the year (the figure was provided by LLI). ** The inspection rate is calculated by: number of individual ships inspected/number of individual ships visited.
ship type are set out in Figure 3 and Table 4. Inspection results regarding recognized organizations are shown in Table 5.
DETENTIONS
Ships are detained when the condition of the ship or its crew does not correspond substantially with the applicable conventions. Such strong action is to ensure that the ship will not sail until it can proceed to sea without presenting a danger to the ship or persons on board, or without presenting an unreasonable threat of harm to the marine environment.
MEMORANDUM OF UNDERSTANDING ON PORT STATE CONTROL IN THE ASIA-PACIFIC REGION
12
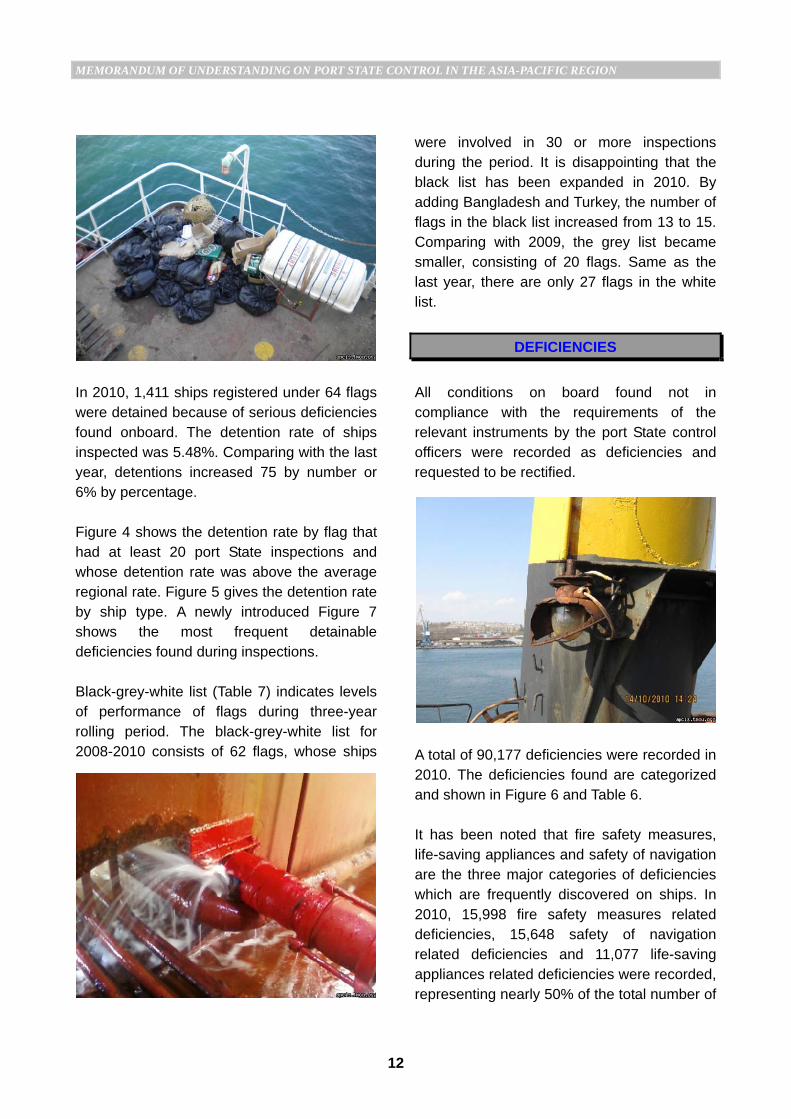
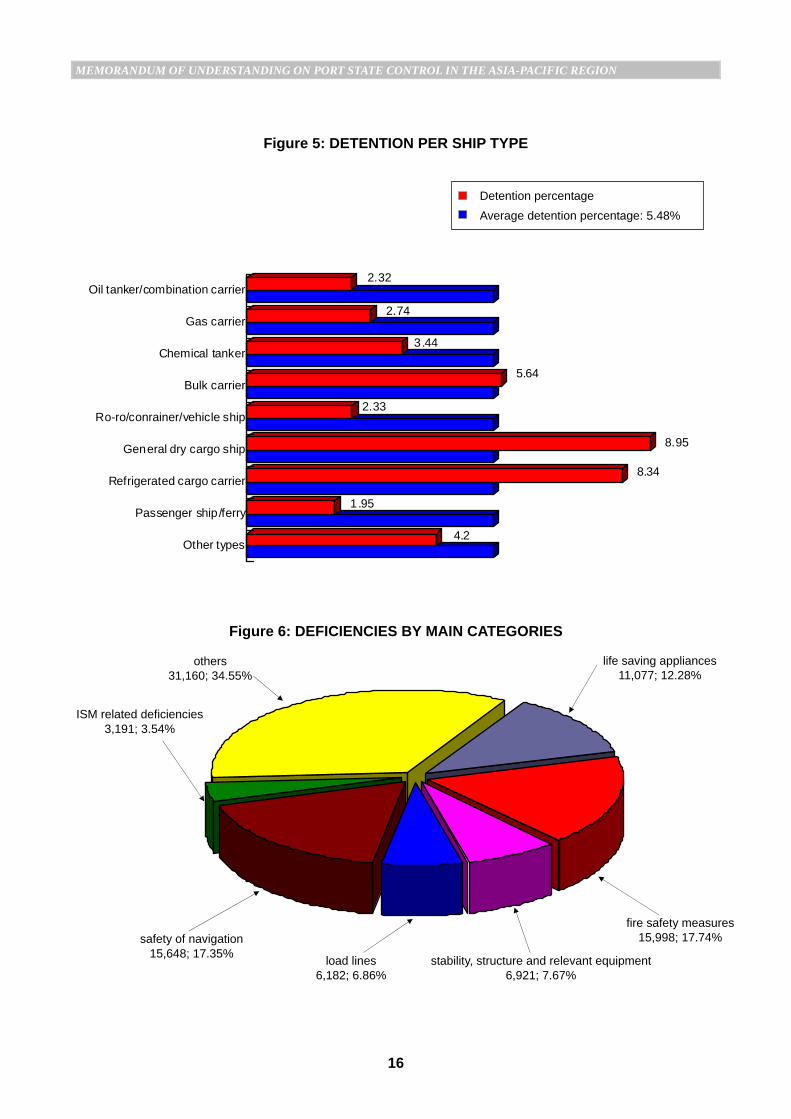
In 2010, 1,411 ships registered under 64 flags were detained because of serious deficiencies found onboard. The detention rate of ships inspected was 5.48%. Comparing with the last year, detentions increased 75 by number or 6% by percentage. Figure 4 shows the detention rate by flag that had at least 20 port State inspections and whose detention rate was above the average regional rate. Figure 5 gives the detention rate by ship type. A newly introduced Figure 7 shows the most frequent detainable deficiencies found during inspections. Black-grey-white list (Table 7) indicates levels of performance of flags during three-year rolling period. The black-grey-white list for 2008-2010 consists of 62 flags, whose ships
were involved in 30 or more inspections during the period. It is disappointing that the black list has been expanded in 2010. By adding Bangladesh and Turkey, the number of flags in the black list increased from 13 to 15. Comparing with 2009, the grey list became smaller, consisting of 20 flags. Same as the last year, there are only 27 flags in the white list.
DEFICIENCIES
All conditions on board found not in compliance with the requirements of the relevant instruments by the port State control officers were recorded as deficiencies and requested to be rectified.
A total of 90,177 deficiencies were recorded in 2010. The deficiencies found are categorized and shown in Figure 6 and Table 6. It has been noted that fire safety measures, life-saving appliances and safety of navigation are the three major categories of deficiencies which are frequently discovered on ships. In 2010, 15,998 fire safety measures related deficiencies, 15,648 safety of navigation related deficiencies and 11,077 life-saving appliances related deficiencies were recorded, representing nearly 50% of the total number of

MEMORANDUM OF UNDERSTANDING ON PORT STATE CONTROL IN THE ASIA-PACIFIC REGION
13
deficiencies. It is notable that the number of deficiencies on fire safety measures and safety of navigation have been increased nearly 10% in 2010 but the number of deficiencies on lifesaving appliances reduced about 9%. Furthermore, it can be seen as the results of the CIC of the year that the number of deficiencies relating to carriage of cargo and dangerous goods increased around 20%.
OVERVIEW OF PORT STATE CONTROL RESULTS 2000 – 2010
Figures 8-13 show the comparison of port State inspection results for 2000 - 2010. These figures indicate the trends in port State activities and ship performance over the past eleven years.

MEMORANDUM OF UNDERSTANDING ON PORT STATE CONTROL IN THE ASIA-PACIFIC REGION
14
Figure 1: INSPECTION PERCENTAGE
Figure 2: PORT STATE INSPECTIONS - CONTRIBUTION BY AUTHORITIES
Total ships inspected: 14,536Percentage: 66%
Total individual ship visited: 22,058
Australia 3,127; 12.14%
Canada 447; 1.74%
China 5,186; 20.13%
Hong Kong, China 734; 2.85%Indonesia 1,406; 5.46%
Japan 5,308; 20.60%
Republic of Korea 2,290; 8.89%
Malaysia 660; 2.56% New Zealand 565; 2.19%
Papua New Guinea 178; 0.69% Russian Federation 1,068; 4.75%
Singapore 792; 3.07%
Thailand 368; 1.43%
Total inspections: 25,762
Viet Nam 1,028; 3.99%
Chile 764; 2.97%
Philippines 1,785; 6.93%
Fiji 56; 0.22%

MEMORANDUM OF UNDERSTANDING ON PORT STATE CONTROL IN THE ASIA-PACIFIC REGION
15
Figure 3: TYPE OF SHIP INSPECTED
Figure 4: DETENTIONS PER FLAG
Flags: 1. Sierra Leone 2. Georgia 3. Mongolia 4. Barbados 5. St. Kitts & Nevis 6. Cambodia 7. Dominica 8. Kiribati 9. Indonesia 10. Korea, Dem. People’s Rep. 11. Thailand 12. Turkey 13. Belize 14. Tuvalu 15. Belgium 16. Viet Nam 17. Gibraltar (UK) 18. Netherlands Note: Flags listed above are those flags the ships of which were involved in at least 20 port State inspections and detention percentage of which are above the regional average detention percentage. The complete information on detentions by flag is given in Table 3.
Perc
enta
ge
oil tanker/combination carrier: 2,027; 7.87%
chemical tanker: 1,483; 5.76%
gas carrier: 620; 2.41%
bulk carrier: 7,142; 27.72%
ro-ro/container/vehicle ship: 4,942; 19.18%
general dry cargo ship: 7,355; 28.55%
refrigerated cargo carrier: 839; 3.26%
passenger ship/ferry: 307; 1.19%
other types: 1,047; 4.06%
0
10
20
1 2 3 4 5 6 7 8 9 10 11 12 13 14 15 16 17 18
Detention percentage
Regional average: 5.48%
Detention: 35 Percentage: 20.96%
14 20.90%
28 18.67%
266 16.13%
28 14.51%
14 8.75%
3 15.00%
5 8.20%
Flags
4 17.39%
11 17.19%
35 10.03% 2
8.70%
25 12.20%
6 10.00
34 9.50%
55 8.59%
15 10.71%
8 5.67%
MEMORANDUM OF UNDERSTANDING ON PORT STATE CONTROL IN THE ASIA-PACIFIC REGION
16
Figure 5: DETENTION PER SHIP TYPE
Figure 6: DEFICIENCIES BY MAIN CATEGORIES
4.2
1.95
8.34
8.95
2.33
5.64
3.44
2.74
2.32Oil tanker/combination carrier
Gas carrier
Chemical tanker
Bulk carrier
Ro-ro/conrainer/vehicle ship
General dry cargo ship
Refrigerated cargo carrier
Passenger ship /ferry
Other types
Detention percentage Average detention percentage: 5.48%
life saving appliances11,077; 12.28%
fire safety measures 15,998; 17.74%
stability, structure and relevant equipment 6,921; 7.67%
load lines 6,182; 6.86%
safety of navigation15,648; 17.35%
others 31,160; 34.55%
ISM related deficiencies 3,191; 3.54%

MEMORANDUM OF UNDERSTANDING ON PORT STATE CONTROL IN THE ASIA-PACIFIC REGION
17
Figure 7: MOST FREQUENT DETAINABLE DEFICIENCIES
198
163
133
101
91
80
78
72
173
128
Li feboats (Lifesaving appliances)
Oil fi ltering equipment (MARPOL-Annex I)
Emergency Fire Pump (Fire safety measures)
Maintenance of the ship and equipment (ISM relateddeficiencies)
Fire-dampers (Fire safety measures)
Ventila tors, air pipes, casings (Load lines)
Means of control (Fire safety measures)
Fire prevention (Fire safety measures)
Ventilation (Fire safety measures)
Jacketed piping system for high pressure fuel lines (Firesafety measures)

MEMORANDUM OF UNDERSTANDING ON PORT STATE CONTROL IN THE ASIA-PACIFIC REGION
18
OVERVIEW OF PORT STATE CONTROL RESULTS 2000 - 2010
Figure 8: NO. OF INSPECTIONS
Figure 9: INSPECTION PERCENTAGE
Figure 10: NO. OF INSPECTIONS WITH DEFICIENCIES
16,034 17,37919,588 20,124
21,400 21,058 21,686 22,039 22,15223,116
25,762
0
5,000
10,000
15,000
20,000
25,000
2000 2001 2002 2003 2004 2005 2006 2007 2008 2009 2010
10,62812,049
13,76014,816 14,396 14,421 14,916 14,864 15,298 15,422 16,575
0
5,000
10,000
15,000
2000 2001 2002 2003 2004 2005 2006 2007 2008 2009 2010
65%71%
78% 77%69% 70% 69% 66%
63% 61%66%
0%
20%
40%
60%
80%
2000 2001 2002 2003 2004 2005 2006 2007 2008 2009 2010

MEMORANDUM OF UNDERSTANDING ON PORT STATE CONTROL IN THE ASIA-PACIFIC REGION
19
Figure 11: NO. OF DEFICIENCIES
Figure 12: NO. OF DETENTIONS
Figure 13: DETENTION PERCENTAGE
58,435
69,57875,210
84,119
73,16374,668 80,556
83,950 89,478 86,820 90,177
0
20,000
40,000
60,000
80,000
2000 2001 2002 2003 2004 2005 2006 2007 2008 2009 2010
1,101
1,349 1,307
1,709
1,393
1,097 1,1711,238
1,528
1,3361,411
0
500
1,000
1,500
2,000
2000 2001 2002 2003 2004 2005 2006 2007 2008 2009 2010
6.87%
7.76%
6.67%
8.49%
6.51%
5.21% 5.40% 5.62%
6.90%
5.78% 5.48%
0.00%
2.00%
4.00%
6.00%
8.00%
2000 2001 2002 2003 2004 2005 2006 2007 2008 2009 2010

MEMORANDUM OF UNDERSTANDING ON PORT STATE CONTROL IN THE ASIA-PACIFIC REGION
20
ILO
147
**
- 25
/05/
93
- - - 28
/11/
80
- 31
/05/
83
- - - - - 07
/05/
91
- - - - - - - -
28/1
1/81
CO
LREG
72
29/0
2/80
07
/03/
75
02/0
8/77
07
/01/
80
04/0
3/83
15
/07/
77
13/1
1/79
21
/06/
77
29/0
7/77
23
/12/
80
26/1
1/76
18
/05/
76
- 09
/11/
73
29/0
4/77
06
/08/
79
28/0
7/82
18
/12/
90
26
/04/
88
01
/05/
85
20/1
2/99
12
/03/
82
15/0
7/77
AFS
20
01
09/0
1/07
08
/04/
10
- - - - - 08
/07/
03
24/0
7/08
27
/09/
10
- - - - 31
/12/
09
- 20
/08/
08
- 09
/05/
08
- - -
17/0
9/08
STC
W
78
07/1
1/83
06
/11/
87
09/0
6/87
08
/06/
81
27/0
3/91
03
/11/
84
27/0
1/87
27
/05/
82
04/0
4/85
31
/01/
92
30/0
7/86
28
/10/
91
22/0
2/84
09
/10/
79
01/0
5/88
19
/06/
97
22/0
4/91
18
/12/
90
25
/04/
89
01
/05/
85
18/0
7/05
01
/06/
94
28/0
4/84
MA
RPO
L 73
/78
14/1
0/87
16
/11/
92
10/1
0/94
01
/07/
83
- 11
/04/
85
21/1
0/86
09
/06/
83
23/0
7/84
31
/01/
97
25/0
9/98
25
/10/
93
15/0
6/01
03
/11/
83
01/1
1/90
02
/11/
07
13/0
4/89
29
/05/
91
26
/04/
88
01
/05/
85
20/1
2/99
30
/06/
04
02/1
0/83
SOLA
S PR
OT
88
07
/02/
97
08/0
4/10
29
/09/
95
03/0
2/95
28
/07/
04
23/1
0/02
-
24/0
6/97
14
/11/
94
- 03
/06/
01
- - 18
/08/
00
10/0
8/99
-
14/0
9/92
27
/05/
02
16
/10/
95
08
/08/
01
24/0
6/05
-
03/0
2/00
SOLA
S PR
OT
78
17
/08/
83
- 15
/07/
92
17/1
2/82
28
/07/
04
14/1
1/81
23
/08/
88
15/0
5/80
02
/12/
82
19/1
0/83
23
/02/
90
- - 12
/05/
81
01/0
6/84
-
28/0
7/82
12
/10/
92
26
/04/
88
01
/05/
85
20/1
2/99
-
01/0
5/81
SOLA
S 74
17/0
8/83
08
/05/
78
28/0
3/80
07
/01/
80
04/0
3/83
25
/05/
80
17/0
2/81
15
/05/
80
31/1
2/80
19
/10/
83
23/0
2/90
12
/11/
80
15/1
2/81
09
/01/
80
16/0
3/81
18
/12/
84
28/0
7/82
18
/12/
90
26
/04/
88
01
/05/
85
20/1
2/99
30
/06/
04
25/0
5/80
LOA
D L
INE
PRO
T
88
07/0
2/97
08
/04/
10
03/0
3/95
03
/02/
95
28/0
7/04
23
/10/
02
- 24
/06/
97
14/1
1/94
-
03/0
6/01
- -
18/0
8/00
18
/08/
99
- 26
/11/
90
27/0
5/02
29/1
1/94
08/0
8/01
- -
03/0
2/00
LOA
D L
INE
66
29/0
7/68
14
/01/
70
10/0
3/75
05
/10/
73
29/1
1/72
16
/08/
72
17/0
1/77
15
/05/
68
10/0
7/69
12
/01/
71
05/0
2/70
18
/05/
76
04/0
3/69
04
/07/
66
21/0
9/71
30
/12/
92
28/0
7/82
18
/12/
90
26
/04/
88
18
/10/
89
18/0
7/05
30
/06/
04
21/0
7/68
TON
NA
GE
69
21/0
5/82
18
/07/
94
22/1
1/82
08
/04/
80
29/1
1/72
18
/07/
82
14/0
3/89
17
/07/
80
18/0
1/80
24
/04/
84
06/0
1/78
25
/10/
93
06/0
9/78
20
/11/
69
06/0
6/85
11
/06/
96
13/0
1/89
18
/12/
90
25
/04/
89
18
/10/
89
18/0
7/05
30
/06/
04
18/0
7/82
Aut
horit
y
Aus
tralia
C
anad
a C
hile
C
hina
Fi
ji H
ong
Kon
g, C
hina
* In
done
sia
Japa
n R
epub
lic o
f Kor
ea
Mal
aysi
a N
ew Z
eala
nd
Papu
a N
ew G
uine
a Ph
ilipp
ines
R
ussi
an F
eder
atio
n Si
ngap
ore
Thai
land
Va
nuat
u Vi
et N
am
Mar
shal
l Isl
ands
D
PR
Kor
ea
Mac
ao, C
hina
S
olom
on Is
land
s
Ent
ry in
to fo
rce
date
AN
NEX
1
STAT
US
OF
THE
REL
EVA
NT
INST
RU
MEN
TS
Tabl
e 1:
STA
TUS
OF
THE
REL
EVA
NT
INST
RU
MEN
TS
(Dat
e of
dep
osit
of in
stru
men
ts)
(A
s at
31
Dec
embe
r 201
0)
* E
ffect
ive
date
of e
xten
sion
of i
nstru
men
ts.
**
Alth
ough
som
e A
utho
ritie
s ha
ve n
ot ra
tifie
d th
e IL
O C
onve
ntio
n N
o.14
7, p
arts
of t
he IL
O c
onve
ntio
ns re
ferre
d to
ther
ein
are
impl
emen
ted
unde
r the
ir na
tiona
l leg
isla
tion
and
port
Stat
e co
ntro
l is
carri
ed o
ut o
n m
atte
rs c
over
ed b
y th
e na
tiona
l reg
ulat
ions
.

MEMORANDUM OF UNDERSTANDING ON PORT STATE CONTROL IN THE ASIA-PACIFIC REGION
21
Table 1a: STATUS OF MARPOL 73/78 (Date of deposit of instruments)
(As at 31 December 2010)
Authority Annexes I & II Annex III Annex IV Annex V Annex VI
Australia 14/10/87 10/10/94 27/02/04 14/08/90 07/08/07
Canada 16/11/92 08/08/02 26/03/10 26/03/10 26/03/10
Chile 10/10/94 10/10/94 10/10/94 15/08/08 16/10/06
China 01/07/83 13/09/94 02/11/06 21/11/88 23/05/06
Fiji - - - - -
Hong Kong, China* 11/04/85 07/03/95 02/11/06 27/03/96 20/03/08
Indonesia 21/10/86 - - - -
Japan 09/06/83 09/06/83 09/06/83 09/06/83 15/02/05
Republic of Korea 23/07/84 28/02/96 28/11/03 28/02/96 20/04/06
Malaysia 31/01/97 - - 31/01/97 -
New Zealand 25/09/98 25/09/98 - 25/09/98 -
Papua New Guinea 25/10/93 25/10/93 25/10/93 25/10/93 -
Philippines 15/06/01 15/06/01 15/06/01 15/06/01 -
Russian Federation 03/11/83 14/08/87 14/08/87 14/08/87 -
Singapore 01/11/90 02/03/94 01/05/05 27/05/99 10/08/00
Thailand 02/11/07 - - - -
Vanuatu 13/04/89 22/04/91 15/03/04 22/04/91 15/03/04
Viet Nam 29/05/91 - - - -
Marshall Islands 26/04/88 26/04/88 26/04/88 26/04/88 07/03/02
DPR Korea 01/05/01 01/05/01 01/05/01 01/05/01 -
Macao, China 20/12/99 20/12/99 02/11/06 20/12/99 23/05/06
Solomon Islands 30/06/04 30/06/04 30/06/04 30/06/04 -
Entry into force date 02/10/1983 01/07/1992 27/09/2003 31/12/1988 19/05/2005
* Effective date of extension of instruments.

MEMORANDUM OF UNDERSTANDING ON PORT STATE CONTROL IN THE ASIA-PACIFIC REGION
22
ANNEX 2
PORT STATE INSPECTION STATISTICS
STATISTICS FOR 2010
Table 2: PORT STATE INSPECTIONS CARRIED OUT BY AUTHORITIES
Aut
horit
y
No.
of i
ndiv
idua
l sh
ips
insp
ecte
d (a
)
No.
of i
nitia
l and
fo
llow
-up
insp
ectio
ns
(b+c
)
No.
of i
nitia
l in
spec
tions
(b
)
No.
of f
ollo
w-u
p in
spec
tions
(c
)
No.
of i
nspe
ctio
ns
with
def
icie
ncie
s (d
)
No.
of d
efic
ienc
ies
1)
(e)
No.
of d
eten
tions
1)
(f)
No.
of i
ndiv
idua
l sh
ips
visi
ted
2)
(g)
Insp
ectio
n ra
te
(a/g
%)
Det
entio
n pe
rcen
tage
(f/
b%)
Australia3) 2,735 4,288 3,127 1,161 1,604 7,482 222 4,455 61.39 7.10
Canada4) 436 447 447 0 235 780 5 1,584 27.53 1.12
Chile 696 1,036 764 273 388 1,182 14 1,779 39.12 1.83
China 4,098 6,525 5,186 1,340 4,469 33,537 532 12,420 33.00 10.26
Fiji 48 70 56 14 0 0 0 156 30.77 0
Hong Kong, China 731 745 734 11 481 1,641 21 4,803 15.22 2.86
Indonesia 1,293 1,593 1,406 187 299 1,731 38 5,683 22.75 2.70
Japan 3,721 6,390 5,308 1,082 3,578 16,890 239 7,504 49.59 4.50
Republic of Korea 1,832 3,062 2,290 772 1,838 10,045 205 8,858 20.68 8.95
Malaysia 611 794 660 134 353 1,471 12 5,296 11.54 1.82
New Zealand 490 794 565 229 289 946 13 756 64.81 2.30
Papua New Guinea 163 244 178 66 80 578 3 336 48.51 1.69
Philippines 1,451 2,142 1,785 357 597 2,559 4 1,679 86.42 0.22
Russian Federation4) 766 1,994 1,068 926 809 4,779 30 1,151 66.55 2.81
Singapore 608 1,268 792 476 635 2,518 19 11,791 5.16 2.40
Thailand 316 410 368 42 186 353 2 2,763 11.44 0.54
Vanuatu 0 0 0 0 0 0 0 23 0 0
Viet Nam 818 1,410 1,028 382 734 3,685 52 1,852 44.17 5.06
Total 14,536 33,212 25,762 7,452 16,575 90,177 1,411 Regional 22,058
Regional66%
Regional5.48%
1) Numbers of deficiencies and detentions do not include those related to security. 2) LLI data for 2010. 3) Data for Australia is also provided to Indian Ocean MOU. 4) Data are only for the Pacific ports.
MEMORANDUM OF UNDERSTANDING ON PORT STATE CONTROL IN THE ASIA-PACIFIC REGION
23
Table 2a: PORT STATE INSPECTIONS ON MARITME SECURITY
Aut
horit
y
No.
of
insp
ectio
ns
No.
of
insp
ectio
ns
with
sec
urity
re
late
d de
ficie
ncie
s
No.
of s
ecui
rty
rela
ted
defic
ienc
ies
No.
of s
ecur
ity
rela
ted
dete
ntio
ns
Det
entio
n pe
rcen
tage
(%
)
Australia 3,127 6 6 0 0 Canada 447 3 3 0 0 Chile 764 12 13 0 0 China 5,186 854 1,171 22 0.42 Fiji 56 0 0 0 0 Hong Kong, China 734 21 22 2 0.27 Indonesia 1,406 31 34 1 0.07 Japan 5,308 341 412 3 0.06 Republic of Korea 2,290 391 506 11 0.48 Malaysia 660 62 78 0 0 New Zealand 565 8 9 0 0 Papua New Guinea 178 5 5 0 0 Philippines 1,785 22 22 0 0 Russian Federation 1,068 77 87 0 0 Singapore 792 301 314 0 0 Thailand 368 6 6 0 0 Vanuatu 0 0 0 0 0 Vietnam 1,028 56 62 2 0.19
Total 25,762 2,196 2,750 41 Regional 0.16%
Note: Security related data showing in the above table and the tables of deficiency by category are
excluded from all other statistical tables and figures in this report.

MEMORANDUM OF UNDERSTANDING ON PORT STATE CONTROL IN THE ASIA-PACIFIC REGION
24
Table 3: PORT STATE INSPECTIONS PER FLAG
Flag
No. of inspections
No. of inspections
with deficiencies
No. of deficiencies
No. of detentions
Detention percentage
%
Algeria 5 3 51 0 0 Antigua and Barbuda 541 329 1,375 24 4.44 Argentina 6 6 18 0 0 Australia 9 3 6 0 0 Bahamas 610 305 1,227 15 2.46 Bahrain 2 2 10 0 0 Bangladesh 14 11 89 4 28.57 Barbados 23 16 104 4 17.39 Belgium 23 11 62 2 8.70 Belize 358 320 1,968 34 9.50 Bermuda (UK) 68 27 75 0 0 Bolivia 3 2 52 1 33.33 Brazil 4 4 36 1 25.00 Brunei Darussalam 7 5 8 0 0 Bulgaria 4 4 37 1 25.00 Cambodia 1,649 1,598 12,426 266 16.13 Cayman Islands (UK) 84 27 68 2 2.38 China 676 417 1,946 8 1.18 Comoros 9 9 94 3 33.33 Cook Islands 12 5 23 0 0 Croatia 31 15 62 1 3.23 Curacao 15 7 36 1 6.67 Cyprus 500 281 1,307 27 5.40 Denmark 132 61 228 1 0.76 Dominica 20 17 103 3 15.00 Ecuador 2 1 5 0 0 Egypt 11 8 56 1 9.09 Ethiopia 6 6 38 0 0 France 54 23 68 1 1.85 Georgia 67 67 621 14 20.90 Germany 279 150 648 5 1.79 Gibraltar (UK) 61 30 106 5 8.20 Greece 291 141 569 10 3.44 Honduras 1 1 2 0 0 Hong Kong, China 1,765 939 4,241 29 1.64 India 101 44 219 2 1.98 Indonesia 205 188 1,285 25 12.20 Iran 5 4 16 0 0 Isle of Man (UK) 107 41 143 2 1.87

MEMORANDUM OF UNDERSTANDING ON PORT STATE CONTROL IN THE ASIA-PACIFIC REGION
25
Flag
No. of inspections
No. of inspections
with deficiencies
No. of deficiencies
No. of detentions
Detention percentage
%
Israel 5 5 39 0 0 Italy 137 69 301 7 5.11 Jamaica 2 2 15 1 50.00 Japan 107 60 241 2 1.87 Jordan 1 1 4 0 0 Kiribati 193 156 1,235 28 14.51 Korea, Democratic People's Republic
140 136 1,126 15 10.71
Korea, Republic of 1,179 874 4,373 23 1.95 Kuwait 11 6 18 0 0 Latvia 1 0 0 0 0 Liberia 1,758 930 3,937 66 3.75 Libyan Arab Jamahiriya 7 4 9 0 0 Lithuania 5 3 19 1 20.00 Luxemburg 9 4 17 1 11.11 Malaysia 239 147 819 9 3.77 Maldives 10 8 64 0 0 Malta 554 322 1,489 29 5.23 Marshall Islands 923 467 2,060 32 3.47 Moldova 2 2 9 0 0 Mongolia 150 141 1,151 28 18.67 Myanmar 19 19 140 1 5.26 Netherlands 141 84 321 8 5.67 New Zealand 2 2 14 0 0 Nigeria 1 0 0 0 0 Norway 228 123 494 5 2.19 Pakistan 6 5 30 0 0 Panama 7,952 5,077 27,318 418 5.26 Papua New Guinea 12 12 109 4 33.33 Peru 1 1 4 0 0 Philippines 213 145 646 8 3.76 Poland 1 1 11 0 0 Portugal 7 4 22 1 14.29 Qatar 10 5 13 0 0 Russian Federation 320 291 1,395 12 3.75 Saint Vincent and the Grenadines
265 241 1,413 11 4.15
Samoa 7 5 41 0 0 Saudi Arabia 12 9 33 1 8.33 Seychelles 2 2 7 0 0 Sierra Leone 167 165 1,404 35 20.96 Singapore 1,380 621 2,714 38 2.75
MEMORANDUM OF UNDERSTANDING ON PORT STATE CONTROL IN THE ASIA-PACIFIC REGION
26
Flag
No. of inspections
No. of inspections
with deficiencies
No. of deficiencies
No. of detentions
Detention percentage
%
Slovakia 3 3 28 1 33.33 Solomon Islands 3 2 17 0 0 Spain 1 0 0 0 0 Sri Lanka 7 4 30 0 0 St. Kitts & Nevis 64 61 464 11 17.19 Sweden 30 13 38 0 0 Switzerland 22 12 35 0 0 Syrian Arab Republic 1 0 0 0 0 Taiwan, China 68 36 181 2 2.94 Tanzania 3 3 18 2 66.67 Thailand 349 261 1,672 35 10.03 Togo 8 8 44 0 0 Tonga 14 9 53 1 7.14 Tunisia 2 0 0 0 0 Turkey 60 38 234 6 10.00 Tuvalu 160 138 791 14 8.75 Ukraine 1 0 0 0 0 United Arab Emirates (UAE) 6 3 12 0 0 United Kingdom (UK) 236 109 353 4 1.69 United States of America 38 29 108 0 0 Vanuatu 104 64 305 3 2.88 Viet Nam 640 503 3,296 55 8.59 Ship's registration withdrawn 3 2 15 1 33.33
Total 25,762 16,575 90,177 1,411 Regional 5.48

MEMORANDUM OF UNDERSTANDING ON PORT STATE CONTROL IN THE ASIA-PACIFIC REGION
27
Table 4: PORT STATE INSPECTIONS PER SHIP TYPE
Type of ship
No. of inspections
No. of inspections
with deficiencies
No. of deficiencies
No. of detentions
Detention percentage
%
NLS tanker 85 39 147 0 0 Combination carrier 107 44 319 5 4.67 Oil tanker 1,835 769 3,510 42 2.29 Gas carrier 620 271 1,136 17 2.74 Chemical tanker 1,483 796 3,642 51 3.44 Bulk carrier 7,142 4,326 23,089 403 5.64 Vehicle carrier 746 322 1,008 16 2.14 Container ship 3,963 2,211 8,852 92 2.32 Ro-Ro cargo ship 233 155 728 7 3.00 General cargo/multi-purpose ship 7,355 6,071 39,316 658 8.95 Refrigerated cargo carrier 839 678 3,820 70 8.34 Woodchip carrier 220 113 412 7 3.18 Livestock carrier 53 35 188 2 3.77 Ro-Ro passenger ship 83 75 625 4 4.82 Passenger ship 224 150 508 2 0.89 Factory ship 1 1 4 0 0.00 Heavy load carrier 61 41 205 3 4.92 Offshore service vessel 149 95 577 9 6.04 MODU & FPSO 11 7 72 0 0 High speed passenger craft 57 54 173 0 0 Special purpose ship 40 20 86 0 0 Tugboat 212 131 744 12 5.66 Others 243 171 1,016 11 4.53 Total 25,762 16,575 90,177 1,411 5.48

MEMORANDUM OF UNDERSTANDING ON PORT STATE CONTROL IN THE ASIA-PACIFIC REGION
28
Table 5: PORT STATE INSPECTIONS PER RECOGNIZED ORGANIZATION
Recognized organization (RO)
No.
of o
vera
ll in
spec
tions
No.
of o
vera
ll de
tent
ions
No.
of R
O
resp
onsi
ble
dete
ntio
ns
Det
entio
n pe
rcen
tage
%
RO
resp
onsi
ble
dete
ntio
n pe
rcen
tage
%
Perc
enta
ge o
f R
O re
spon
sibl
e de
tent
ions
%
Alfa Register of Shipping 13 0 0 0 0 0 American Bureau of Shipping 2,315 71 5 3.07 0.22 7.04 Belize Maritime Bureau Inc. 5 0 0 0 0 0 Belize Register Corporation 1 0 0 0 0 0 Biro Klasifikasi Indonesia 98 15 1 15.31 1.02 6.67 Bulgarski Koraben Registar 2 0 0 0 0 0 Bureau Securitas 6 0 0 0 0 0 Bureau Veritas 2,479 124 9 5.00 0.36 7.26 China Classification Society 2,150 25 2 1.16 0.09 8.00 China Corporation Register of Shipping 315 32 0 10.16 0 0 Cosmos Marine Bureau 25 2 0 8.00 0 0 Croatian Register of Shipping 43 2 1 4.65 2.33 50.00 Cyprus Bureau of Shipping 4 0 0 0 0 0 Det Norske Veritas 2,769 84 2 3.07 0.07 2.38 Fidenavis SA 6 0 0 0 0 0 Germanischer Lloyd 2,678 110 6 4.11 0.22 5.45 Global Marine Bureau 446 55 6 12.33 1.35 10.91 Hellenic Register of Shipping 9 3 0 33.33 0 0 Honduras Bureau of Shipping 1 0 0 0 0 0 Honduras International Surveying and Inspection Bureau
1 0 0 0 0 0
INCLAMAR (Inspection y Classification Maritime, S. de. R.L.)
134 17 1 12.69 0.75 5.88
Indian Register of Shipping 103 1 0 0.97 0 0 Intermaritime Certification Services, S.A.
350 34 3 9.71 0.86 8.82
International Naval Surveys Bureau 54 3 0 5.56 0 0 International Register of Shipping 447 66 6 14.77 1.34 9.09 International Ship Classification 370 49 7 13.24 1.89 14.29 Isthmus Bureau of Shipping 473 58 7 12.26 1.48 12.07 Korea Classification Society (former Joson Classification Society)
138 14 0 10.14 0 0
Korea Ship Safety Technology Authority 50 1 0 2.00 0 0 Korean Register of Shipping 2,226 57 2 2.56 0.09 3.51 Lloyd's Register 3,056 100 7 3.27 0.23 7.00 Marconi International Marine Company Ltd.
2 0 0 0 0 0
Maritime Technical Systems and Services
66 7 1 10.61 1.52 14.29
MEMORANDUM OF UNDERSTANDING ON PORT STATE CONTROL IN THE ASIA-PACIFIC REGION
29
Recognized organization (RO)
No.
of o
vera
ll in
spec
tions
No.
of o
vera
ll de
tent
ions
No.
of R
O
resp
onsi
ble
dete
ntio
ns
Det
entio
n pe
rcen
tage
%
RO
resp
onsi
ble
dete
ntio
n pe
rcen
tage
%
Perc
enta
ge o
f R
O re
spon
sibl
e de
tent
ions
%
National Cargo Bureau Inc. 3 0 0 0 0 0 National Shipping Adjusters Inc 26 3 0 11.54 0 0 Nippon Kaiji Kyokai 7,739 290 21 3.75 0.27 7.24 NV Unitas 1 0 0 0 0 0 Overseas Marine Certification Services 262 44 4 16.79 1.53 9.09 Panama Bureau of Shipping 57 2 0 3.51 0 0 Panama Maritime Documentation Services
268 37 3 13.81 1.12 8.11
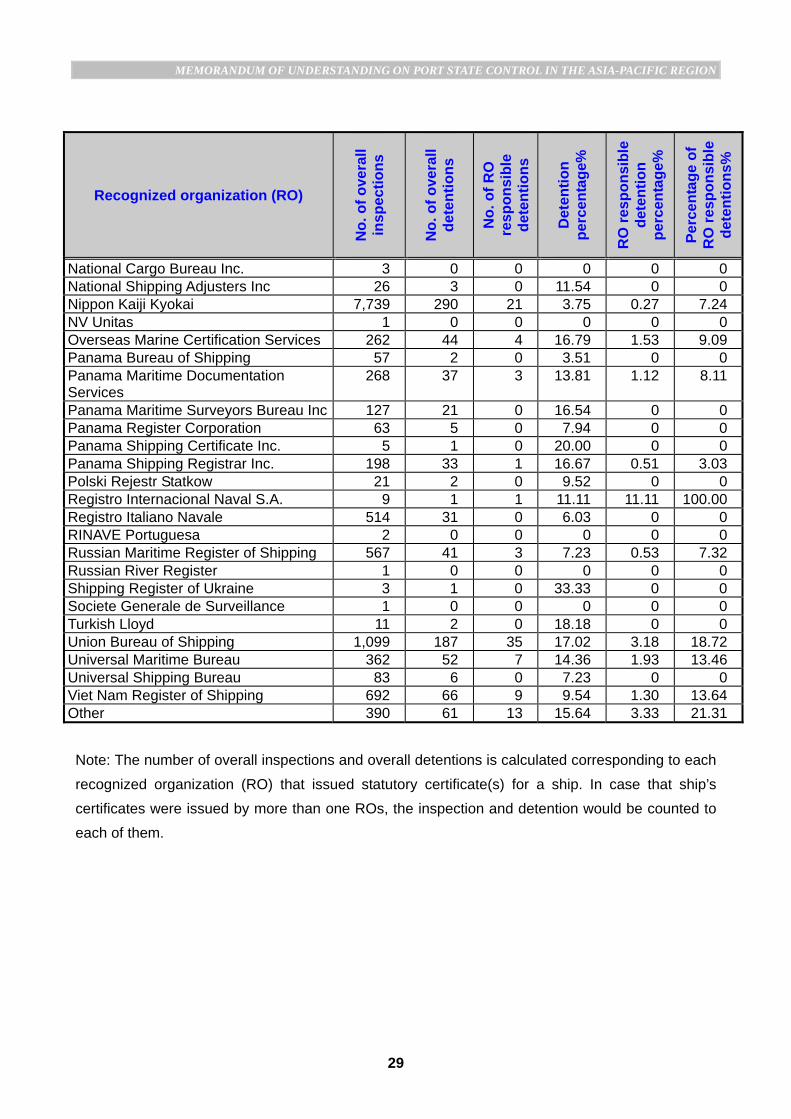
Panama Maritime Surveyors Bureau Inc 127 21 0 16.54 0 0 Panama Register Corporation 63 5 0 7.94 0 0 Panama Shipping Certificate Inc. 5 1 0 20.00 0 0 Panama Shipping Registrar Inc. 198 33 1 16.67 0.51 3.03 Polski Rejestr Statkow 21 2 0 9.52 0 0 Registro Internacional Naval S.A. 9 1 1 11.11 11.11 100.00 Registro Italiano Navale 514 31 0 6.03 0 0 RINAVE Portuguesa 2 0 0 0 0 0 Russian Maritime Register of Shipping 567 41 3 7.23 0.53 7.32 Russian River Register 1 0 0 0 0 0 Shipping Register of Ukraine 3 1 0 33.33 0 0 Societe Generale de Surveillance 1 0 0 0 0 0 Turkish Lloyd 11 2 0 18.18 0 0 Union Bureau of Shipping 1,099 187 35 17.02 3.18 18.72 Universal Maritime Bureau 362 52 7 14.36 1.93 13.46 Universal Shipping Bureau 83 6 0 7.23 0 0 Viet Nam Register of Shipping 692 66 9 9.54 1.30 13.64 Other 390 61 13 15.64 3.33 21.31 Note: The number of overall inspections and overall detentions is calculated corresponding to each
recognized organization (RO) that issued statutory certificate(s) for a ship. In case that ship’s certificates were issued by more than one ROs, the inspection and detention would be counted to each of them.

MEMORANDUM OF UNDERSTANDING ON PORT STATE CONTROL IN THE ASIA-PACIFIC REGION
30
Table 6: DEFICIENCIES BY CATEGORIES
Nature of deficiencies
No. of deficiencies
Ship's certificates and documents 2,479 Stability, structure and related equipment 6,921 Propulsion and auxiliary machinery 6,238 Alarm signals 664 Fire safety measures 15,998 Oil, chemical tankers and gas carriers 236 Lifesaving appliances 11,077 Radiocommunications 3,015 Safety of navigation 15,648 Carriage of cargo and dangerous goods 589 ISM related deficiencies 3,191 SOLAS related operational deficiencies 4,073 Additional measures to enhance maritime safety 888 Bulk carriers-additional safety measures 486 Load lines 6,182 MARPOL-Annex I 4,403 MARPOL-Annex II 47 MARPOL-Annex III 92 MARPOL-Annex IV 879 MARPOL-Annex V 1,336 MARPOL-Annex VI 508 MARPOL related operational deficiencies 477 AFS Convention 12 Certification and watchkeeping for seafarers 1,595 Crew and accommodation (ILO 147) 326 Food and catering (ILO 147) 172 Working spaces (ILO 147) 899 Accident prevention (ILO 147) 800 Mooring arrangements (ILO 147) 793 Other deficiencies 153 Total 90,177 Maritime security related deficiencies 2,750 Grand total 92,927

MEMORANDUM OF UNDERSTANDING ON PORT STATE CONTROL IN THE ASIA-PACIFIC REGION
31
SUMMARY OF PORT STATE INSPECTION DATA 2008 – 2010
Table 7: BLACK – GREY – WHITE LISTS *
Flag Inspections 2008-2010
Detentions 2008-2010
Black to Grey Limit
Grey to White Limit
Excess Factor
BLACK LIST
Sierra Leone 355 84 33 5.34 Georgia 274 66 27 5.31 Cambodia 5,109 877 388 4.10 Papua New Guinea 45 11 6 3.56 St. Kitts & Nevis 181 34 19 3.41 Korea, Democratic People's Republic 343 59 32 3.33 Mongolia 520 84 46 3.20 Indonesia 592 86 52 2.74 Kiribati 474 67 43 2.54 Bangladesh 32 6 5 1.64 Tuvalu 526 58 47 1.63 Thailand 959 97 81 1.53 Belize 1,154 111 96 1.42 Viet Nam 1,610 150 130 1.39 Turkey 156 18 17 1.24
GREY LIST
Maldives 47 6 7 0 0.90 Curacao 63 7 8 1 0.84 India 270 21 26 12 0.64 Barbados 57 5 8 0 0.64 Saint Vincent and the Grenadines 830 60 71 46 0.58 Tonga 43 3 6 0 0.50 Dominica 89 6 11 2 0.47 Saudi Arabia 32 2 5 0 0.46 Iran 52 3 7 0 0.41 Malta 1,495 99 121 88 0.33 Gibraltar (UK) 128 7 14 4 0.31 Belgium 66 3 9 1 0.29 Cook Islands 32 1 5 0 0.28 Taiwan, China 214 12 22 8 0.28 Egypt 33 1 5 0 0.27 Croatia 74 3 9 1 0.23 Myanmar 51 1 7 0 0.13 Malaysia 638 36 56 34 0.11 Switzerland 61 1 8 0 0.07 Italy 337 16 32 15 0.04

MEMORANDUM OF UNDERSTANDING ON PORT STATE CONTROL IN THE ASIA-PACIFIC REGION
32
Flag Inspections 2008-2010
Detentions 2008-2010
Black to Grey Limit
Grey to White Limit
Excess Factor
WHITE LIST
Kuwait 36 0 0 0 Cyprus 1,411 72 83 -0.27 Isle of Man (UK) 315 12 14 -0.27 Panama 22,441 1,261 1,507 -0.37 Antigua and Barbuda 1,287 58 75 -0.47 Russian Federation 946 39 53 -0.54 Netherlands 381 12 18 -0.63 Marshall Islands 2,201 94 134 -0.65 Philippines 622 21 33 -0.71 United States of America 108 1 3 -0.76 Sweden 76 0 1 -0.81 Vanuatu 278 6 12 -0.89 Liberia 4,276 159 271 -0.92 Greece 753 22 41 -0.94 France 123 1 3 -0.94 Norway 625 17 33 -0.97 Cayman Islands (UK) 242 4 10 -1.03 Bahamas 1,731 53 103 -1.05 Bermuda (UK) 183 2 7 -1.14 Japan 341 6 16 -1.16 Denmark 351 6 16 -1.20 Singapore 3,618 101 228 -1.24 United Kingdom (UK) 555 10 28 -1.32 Germany 663 10 35 -1.49 Korea, Republic of 3,428 60 215 -1.62 Hong Kong, China 4,602 80 293 -1.64 China 2,064 26 125 -1.76 Note: 1) Flags listed above are those of ships which were involved in 30 or more port State
inspections over the 3-year period. 2) According to the decision by the Port State Control Committee, flags involving 30-49
port State inspections with nil detentions are listed on top of the White List. * See explanatory note on page 50. p=7% z95%=1.645 q=3%

MEMORANDUM OF UNDERSTANDING ON PORT STATE CONTROL IN THE ASIA-PACIFIC REGION
33
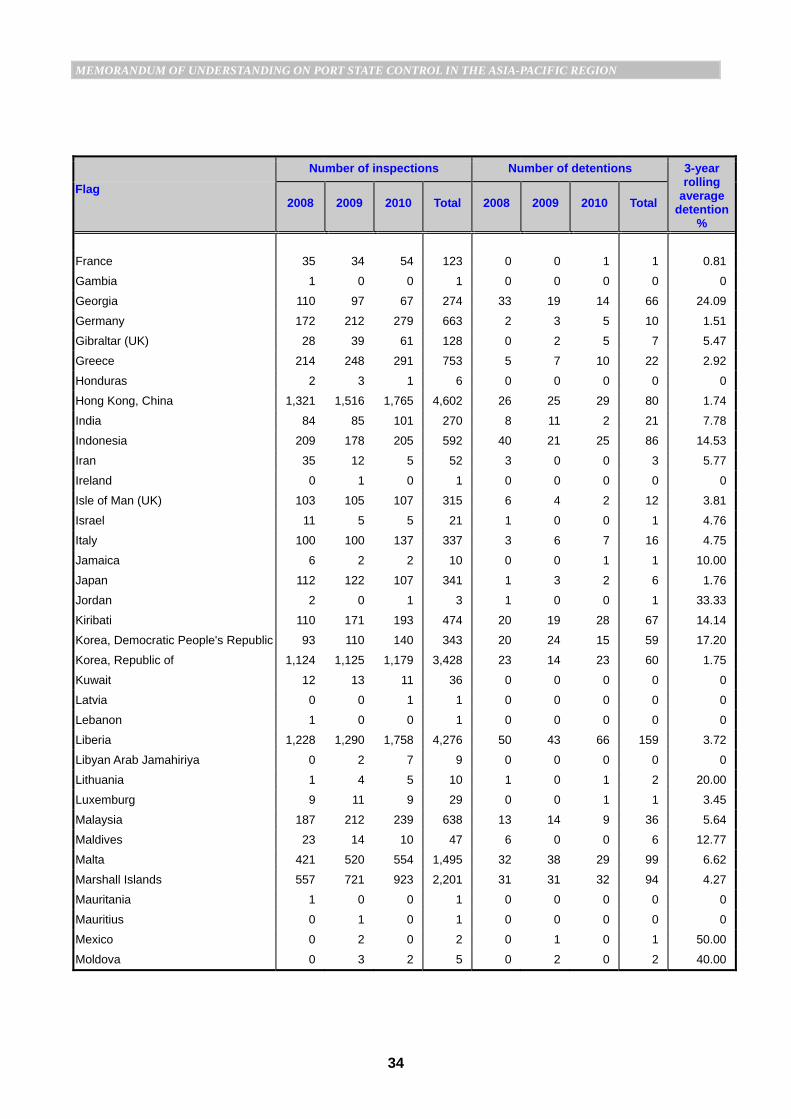
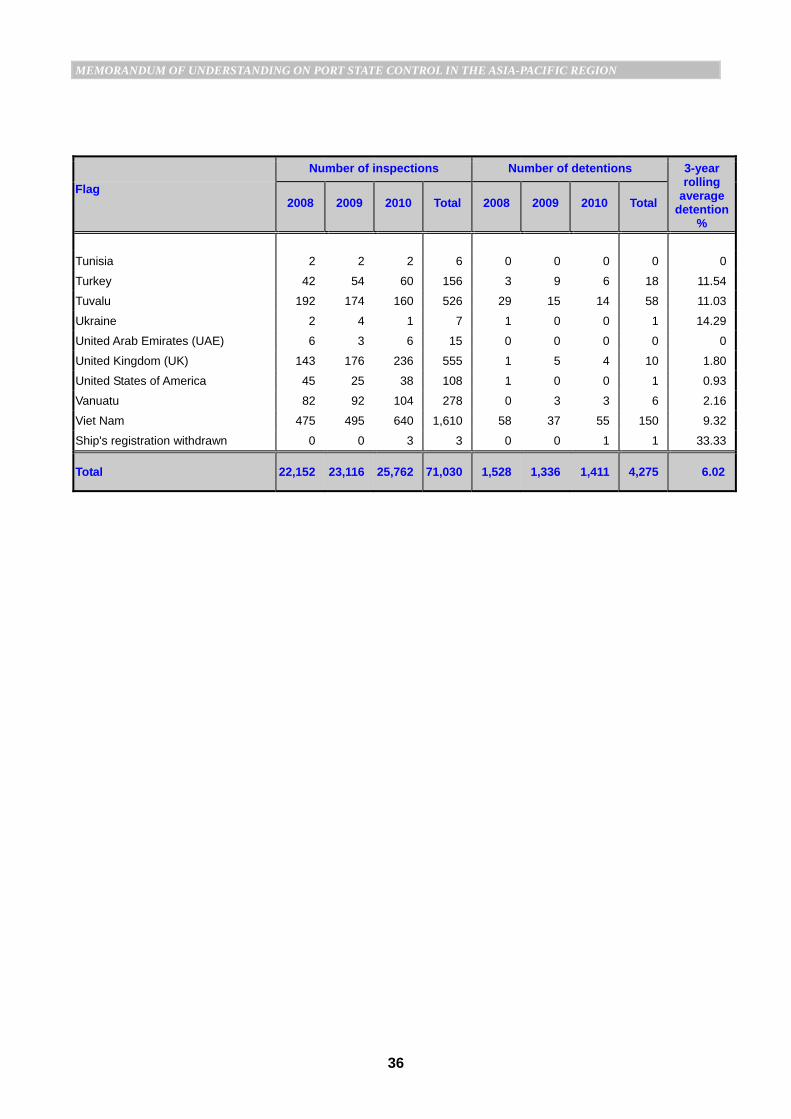
Table 8: INSPECTIONS AND DETENTIONS PER FLAG
Number of inspections Number of detentions 3-year rolling
average detention
%
Flag 2008 2009 2010 Total 2008 2009
2010
Total
Afghanistan 1 0 0 1 0 0 0 0 0
Algeria 2 3 5 10 0 1 0 1 10.00
Antigua and Barbuda 367 379 541 1,287 23 11 24 58 4.51
Argentina 3 6 6 15 2 0 0 2 13.33
Australia 4 12 9 25 0 0 0 0 0
Bahamas 533 588 610 1,731 16 22 15 53 3.06
Bahrain 2 4 2 8 0 0 0 0 0
Bangladesh 8 10 14 32 1 1 4 6 18.75
Barbados 15 19 23 57 1 0 4 5 8.77
Belgium 22 21 23 66 1 0 2 3 4.55
Belize 448 348 358 1,154 49 28 34 111 9.62
Bermuda (UK) 47 68 68 183 0 2 0 2 1.09
Bolivia 3 2 3 8 1 0 1 2 25.00
Brazil 2 1 4 7 1 1 1 3 42.86
Brunei Darussalam 3 3 7 13 0 0 0 0 0.00
Bulgaria 2 5 4 11 0 0 1 1 9.09
Cambodia 1,755 1,705 1,649 5,109 324 287 266 877 17.17
Canada 2 2 0 4 1 0 0 1 25.00
Cayman Islands (UK) 81 77 84 242 0 2 2 4 1.65
Chile 1 2 0 3 0 0 0 0 0
China 695 693 676 2,064 10 8 8 26 1.26
Colombia 0 1 0 1 0 0 0 0 0
Comoros 6 5 9 20 1 0 3 4 20.00
Cook Islands 8 12 12 32 1 0 0 1 3.13
Croatia 18 25 31 74 1 1 1 3 4.05
Curacao 23 25 15 63 2 4 1 7 11.11
Cyprus 437 474 500 1,411 18 27 27 72 5.10
Denmark 108 111 132 351 2 3 1 6 1.71
Dominica 39 30 20 89 1 2 3 6 6.74
Ecuador 5 1 2 8 0 0 0 0 0
Egypt 9 13 11 33 0 0 1 1 3.03
Equatorial Guinea 1 0 0 1 1 0 0 1 100.00
Ethiopia 4 5 6 15 1 1 0 2 13.33
Falkland Islands (UK) 0 1 0 1 0 0 0 0 0
Fiji 1 0 0 1 0 0 0 0 0
MEMORANDUM OF UNDERSTANDING ON PORT STATE CONTROL IN THE ASIA-PACIFIC REGION
34
Number of inspections Number of detentions 3-year
rolling average
detention%
Flag 2008 2009 2010 Total 2008 2009
2010
Total
France 35 34 54 123 0 0 1 1 0.81
Gambia 1 0 0 1 0 0 0 0 0
Georgia 110 97 67 274 33 19 14 66 24.09
Germany 172 212 279 663 2 3 5 10 1.51
Gibraltar (UK) 28 39 61 128 0 2 5 7 5.47
Greece 214 248 291 753 5 7 10 22 2.92
Honduras 2 3 1 6 0 0 0 0 0
Hong Kong, China 1,321 1,516 1,765 4,602 26 25 29 80 1.74
India 84 85 101 270 8 11 2 21 7.78
Indonesia 209 178 205 592 40 21 25 86 14.53
Iran 35 12 5 52 3 0 0 3 5.77
Ireland 0 1 0 1 0 0 0 0 0
Isle of Man (UK) 103 105 107 315 6 4 2 12 3.81
Israel 11 5 5 21 1 0 0 1 4.76
Italy 100 100 137 337 3 6 7 16 4.75
Jamaica 6 2 2 10 0 0 1 1 10.00
Japan 112 122 107 341 1 3 2 6 1.76
Jordan 2 0 1 3 1 0 0 1 33.33
Kiribati 110 171 193 474 20 19 28 67 14.14
Korea, Democratic People's Republic 93 110 140 343 20 24 15 59 17.20
Korea, Republic of 1,124 1,125 1,179 3,428 23 14 23 60 1.75
Kuwait 12 13 11 36 0 0 0 0 0
Latvia 0 0 1 1 0 0 0 0 0
Lebanon 1 0 0 1 0 0 0 0 0
Liberia 1,228 1,290 1,758 4,276 50 43 66 159 3.72
Libyan Arab Jamahiriya 0 2 7 9 0 0 0 0 0
Lithuania 1 4 5 10 1 0 1 2 20.00
Luxemburg 9 11 9 29 0 0 1 1 3.45
Malaysia 187 212 239 638 13 14 9 36 5.64
Maldives 23 14 10 47 6 0 0 6 12.77
Malta 421 520 554 1,495 32 38 29 99 6.62
Marshall Islands 557 721 923 2,201 31 31 32 94 4.27
Mauritania 1 0 0 1 0 0 0 0 0
Mauritius 0 1 0 1 0 0 0 0 0
Mexico 0 2 0 2 0 1 0 1 50.00
Moldova 0 3 2 5 0 2 0 2 40.00

MEMORANDUM OF UNDERSTANDING ON PORT STATE CONTROL IN THE ASIA-PACIFIC REGION
35
Number of inspections Number of detentions 3-year
rolling average
detention%
Flag 2008 2009 2010 Total 2008 2009
2010
Total
Mongolia 210 160 150 520 30 26 28 84 16.15
Myanmar 24 8 19 51 0 0 1 1 1.96
Netherlands 129 111 141 381 3 1 8 12 3.15
New Zealand 2 2 2 6 1 0 0 1 16.67
Nigeria 0 0 1 1 0 0 0 0 0
Norway 212 185 228 625 6 6 5 17 2.72
Pakistan 12 7 6 25 1 1 0 2 8.00
Palau 0 1 0 1 0 0 0 0 0
Panama 7,156 7,333 7,952 22,441 458 385 418 1,261 5.62
Papua New Guinea 16 17 12 45 2 5 4 11 24.44
Peru 0 0 1 1 0 0 0 0 0
Philippines 197 212 213 622 5 8 8 21 3.38
Poland 1 0 1 2 0 0 0 0 0
Portugal 2 3 7 12 1 0 1 2 16.67
Qatar 4 6 10 20 0 0 0 0 0
Russian Federation 335 291 320 946 11 16 12 39 4.12
Saint Vincent and the Grenadines 288 277 265 830 31 18 11 60 7.23
Samoa 2 1 7 10 0 0 0 0 0
Saudi Arabia 8 12 12 32 1 0 1 2 6.25
Seychelles 4 1 2 7 0 0 0 0 0
Sierra Leone 83 105 167 355 25 24 35 84 23.66
Singapore 1,038 1,200 1,380 3,618 28 35 38 101 2.79
Slovakia 3 8 3 14 1 2 1 4 28.57
Solomon Islands 2 0 3 5 1 0 0 1 20.00
South Africa 2 0 0 2 0 0 0 0 0
Spain 3 1 1 5 0 0 0 0 0
Sri Lanka 3 3 7 13 0 0 0 0 0
St. Kitts & Nevis 53 64 64 181 13 10 11 34 18.78
Sweden 25 21 30 76 0 0 0 0 0
Switzerland 11 28 22 61 0 1 0 1 1.64
Syrian Arab Republic 1 0 1 2 0 0 0 0 0
Taiwan, China 78 68 68 214 7 3 2 12 5.61
Tanzania 2 1 3 6 0 0 2 2 33.33
Thailand 275 335 349 959 26 36 35 97 10.11
Togo 1 6 8 15 0 1 0 1 6.67
Tonga 14 15 14 43 1 1 1 3 6.98
MEMORANDUM OF UNDERSTANDING ON PORT STATE CONTROL IN THE ASIA-PACIFIC REGION
36
Number of inspections Number of detentions 3-year
rolling average
detention%
Flag 2008 2009 2010 Total 2008 2009
2010
Total
Tunisia 2 2 2 6 0 0 0 0 0
Turkey 42 54 60 156 3 9 6 18 11.54
Tuvalu 192 174 160 526 29 15 14 58 11.03
Ukraine 2 4 1 7 1 0 0 1 14.29
United Arab Emirates (UAE) 6 3 6 15 0 0 0 0 0
United Kingdom (UK) 143 176 236 555 1 5 4 10 1.80
United States of America 45 25 38 108 1 0 0 1 0.93
Vanuatu 82 92 104 278 0 3 3 6 2.16
Viet Nam 475 495 640 1,610 58 37 55 150 9.32
Ship's registration withdrawn 0 0 3 3 0 0 1 1 33.33
Total 22,152 23,116 25,762 71,030 1,528 1,336 1,411 4,275 6.02

MEMORANDUM OF UNDERSTANDING ON PORT STATE CONTROL IN THE ASIA-PACIFIC REGION
37
Figure 14: COMPARISON OF INSPECTIONS PER SHIP TYPE
Figure 15: COMPARISON OF DETENTIONS PER SHIP TYPE
1,0471,0321,059
307308345
839805
7267,355
6,8327,048
4,9423,955 4,256
7,1426,458
5,5661,483
1,4821,296
620539
4822,027
1,7051,374
Oil tanker/combination carrier
Gas carrier
Chemical tanker
Bulk carrier
Ro-ro/container/vehicle ship
General dry cargo ship
Refrigerated cargo carrier
Passenger ship
Other types
2008 2009 2010
4.22
2.70
2.32 2.
966.
022.
904.
082.
74 3.23
6.02
3.70 3.
583.
44 3.57
6.02
6.09
5.65
5.64
5.78
6.02
2.96 2.
232.
33 2.50
6.02
11.2
19.
05 8.95
9.73
6.02
10.0
69.
818.
34
9.37
6.02
2.90
3.90
1.95
2.92
6.02 6.
615.
144.
205.
32 6.02
0.00
2.00
4.00
6.00
8.00
10.00
12.00
2008200920103-year averageAverage detention percentage
Oil tanker/ combination
carrier
Gas carrier Chemical tanker
Bulk carrier Ro-ro/ container/
vehicle ship
General dry cargo ship
Refrigerated cargo carrier
Passenger ship/ferry
Other types

MEMORANDUM OF UNDERSTANDING ON PORT STATE CONTROL IN THE ASIA-PACIFIC REGION
38
Table 9: INSPECTIONS AND DETENTIONS PER SHIP TYPE
Number of inspections Number of detentions Average detention
percentage %
Type of ship 2008
2009 2010 Total 2008 2009
2010
Total
NLS tanker 54 73 85 212 4 4 0 8 3.77 Combination carrier 63 74 107 244 1 2 5 8 3.28 Oil tanker 1,257 1,558 1,835 4,650 53 40 42 135 2.90 Gas carrier 482 539 620 1,641 14 22 17 53 3.23 Chemical tanker 1,296 1,482 1,483 4,261 48 53 51 152 3.57 Bulk carrier 5,566 6,458 7,142 19,166 339 365 403 1,107 5.78 Vehicle carrier 752 587 746 2,085 20 16 16 52 2.49 Container ship 3,246 3,174 3,963 10,383 90 67 92 249 2.40 Ro-Ro cargo ship 258 194 233 685 16 5 7 28 4.09 General cargo/multi-purpose ship 7,048 6,832 7,355 21,235 790 618 658 2,066 9.73 Refrigerated cargo carrier 726 805 839 2,370 73 79 70 222 9.37 Woodchip carrier 230 212 220 662 4 5 7 16 2.42 Livestock carrier 43 55 53 151 2 1 2 5 3.31 Ro-Ro Passenger ship 96 77 83 256 7 4 4 15 5.86 Passenger ship 249 231 224 704 3 8 2 13 1.85 Factory ship 1 1 1 3 0 0 0 0 0 Heavy load carrier 48 67 61 176 2 2 3 7 3.98 Offshore service vessel 129 126 149 404 7 2 9 18 4.46 MODU & FPSO 6 5 11 22 0 0 0 0 0 High speed passenger craft 52 58 57 167 0 0 0 0 0 Special purpose ship 59 47 40 146 1 0 0 1 0.68 High speed cargo craft 1 1 0 2 0 0 0 0 0 Tugboat 239 217 212 668 35 25 12 72 10.78 Others 251 243 243 737 19 18 11 48 6.51
Total 22,152 23,116 25,762 71,030 1,528 1,336 1,411 4,275 6.02

MEMORANDUM OF UNDERSTANDING ON PORT STATE CONTROL IN THE ASIA-PACIFIC REGION
39
Figure 16: COMPARISON OF INSPECTIONS WITH DEFICIENCIES PER SHIP TYPE
Passenger ship/ferry
Passenger ship/ferry
General dry cargo ship
Passenger ship/ferry
General dry cargo ship
Other types
Passenger ship/ferry
General dry cargo ship
General dry cargo ship
(a) Year 2008
Oil tanker/combination carrierGas carrier
Bulk carrierChemical tanker
Ro-ro/container/vehicle ship
Refrigerated cargo carrier
Oil tanker/combination carrier Gas carrier
Bulk carrierChemical tanker
Ro-ro/container/vehicle ship
Refrigerated cargo carrier
Other types
(b) Year 2009
Oil tanker/combination carrierGas carrier
Bulk carrierChemical tanker
Ro-ro/container/vehicle ship
Refrigerated cargo carrier
Other types
(c) Year 2010
Oil tanker/combination carrierGas carrier
Bulk carrierChemical tanker
Ro-ro/container/vehicle ship
Refrigerated cargo carrier
Other types
(d) 3-year summary
* % over [+] or under [-] average
-0.411.67
6.8415.18
-10.65
-10.42-19.68
-4.65
Average
-13.02
-20 -15 -10 -5 0 5 10 15 20
0.05-5.35
13.1616.69
-11.42
-9.90-18.29
-2.59
Average
-21.44
-25 -20 -15 -10 -5 0 5 10 15 20 25
-0.548.95
16.4718.20
-9.95
-10.67-20.63
-22.31
Average
-3.77
-25 -20 -15 -10 -5 0 5 10 15 20 25
-0.171.96
12.4116.80
-10.62
-10.30-19.66
-19.69
Average
-3.70
-20 -15 -10 -5 0 5 10 15 20
MEMORANDUM OF UNDERSTANDING ON PORT STATE CONTROL IN THE ASIA-PACIFIC REGION
40
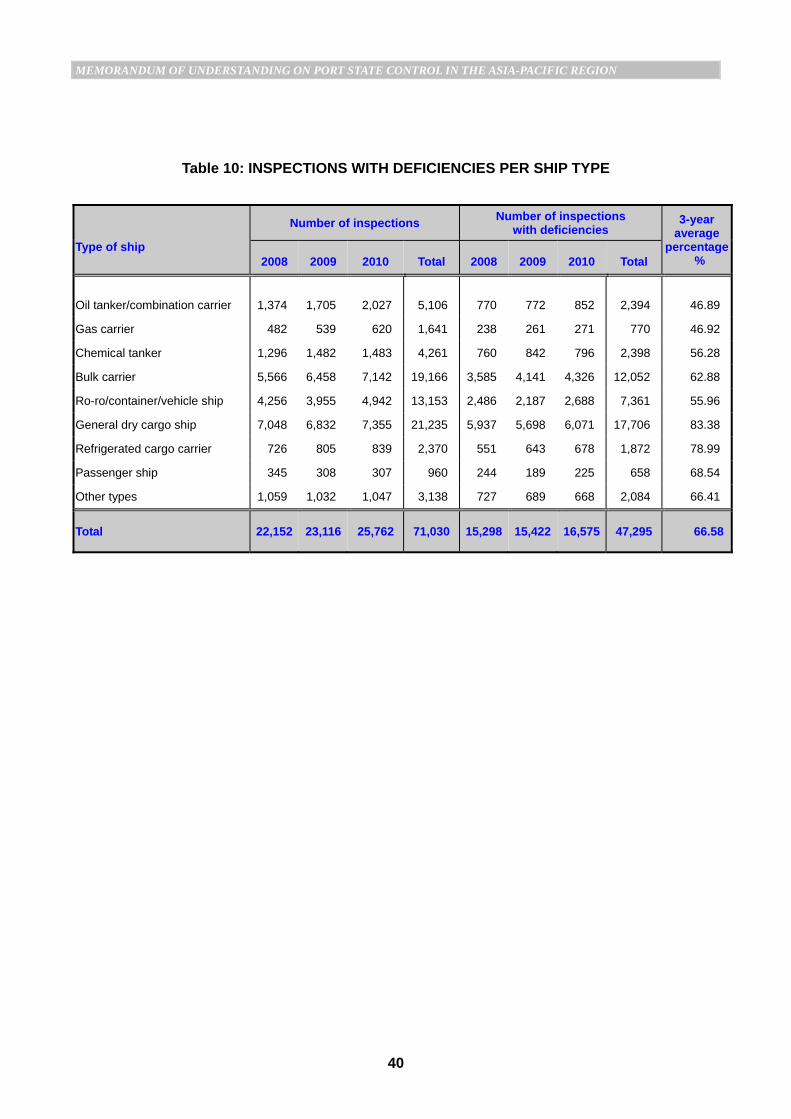
Table 10: INSPECTIONS WITH DEFICIENCIES PER SHIP TYPE
Type of ship
Number of inspections Number of inspections with deficiencies
3-year average
percentage %
2008
2009 2010 Total 2008 2009
2010
Total
Oil tanker/combination carrier 1,374 1,705 2,027 5,106 770 772 852 2,394 46.89
Gas carrier 482 539 620 1,641 238 261 271 770 46.92
Chemical tanker 1,296 1,482 1,483 4,261 760 842 796 2,398 56.28
Bulk carrier 5,566 6,458 7,142 19,166 3,585 4,141 4,326 12,052 62.88
Ro-ro/container/vehicle ship 4,256 3,955 4,942 13,153 2,486 2,187 2,688 7,361 55.96
General dry cargo ship 7,048 6,832 7,355 21,235 5,937 5,698 6,071 17,706 83.38
Refrigerated cargo carrier 726 805 839 2,370 551 643 678 1,872 78.99
Passenger ship 345 308 307 960 244 189 225 658 68.54
Other types 1,059 1,032 1,047 3,138 727 689 668 2,084 66.41
Total 22,152 23,116 25,762 71,030 15,298 15,422 16,575 47,295 66.58

MEMORANDUM OF UNDERSTANDING ON PORT STATE CONTROL IN THE ASIA-PACIFIC REGION
41
Table 11: INSPECTIONS AND DETENTIONS PER RECOGNIZED ORGANIZATION
Recognized organization (RO)
No.
of o
vera
ll in
spec
tions
20
08-2
010
No.
of o
vera
ll de
tent
ions
20
08-2
010
No.
of R
O
resp
onsi
ble
dete
ntio
ns
2008
-201
0
3-ye
ar a
verg
ae
dete
ntio
n pe
rcen
tage
%
3-ye
ar a
vera
ge
RO
resp
onsi
ble
dete
ntio
n pe
rcen
tage
%
3-ye
ar a
vera
ge
perc
enta
ge o
f R
O re
spon
sibl
e de
tent
ions
%
Alfa Register of Shipping 25 0 0 0 0 0 American Bureau of Shipping 6,058 202 16 3.33 0.26 7.92 Belize Maritime Bureau Inc. 211 16 0 7.58 0 0 Belize Register Corporation 3 0 0 0 0 0 Biro Klasifikasi Indonesia 267 55 9 20.60 3.37 16.36 Bulgarski Koraben Registar 4 1 0 25.00 0 0 Bureau Securitas 13 0 0 0 0 0 Bureau Veritas 6,221 351 20 5.64 0.32 5.70 Ceskoslovensky Lodin Register 6 2 0 33.33 0 0 China Classification Society 6,246 99 7 1.59 0.11 7.07 China Corporation Register of Shipping 1,025 97 10 9.46 0.98 10.31 Compania Nacional de Registro e Inspeccion de Naves
1 0 0 0 0 0
Cosmos Marine Bureau 25 2 0 8.00 0 0 Croatian Register of Shipping 95 7 2 7.37 2.11 28.57 Cyprus Bureau of Shipping 7 0 0 0 0 0 Det Norske Veritas 7,574 262 21 3.46 0.28 8.02 Fidenavis SA 59 2 0 3.39 0 0 Germanischer Lloyd 6,613 245 10 3.70 0.15 4.08 Global Marine Bureau 2,365 384 60 16.24 2.54 15.63 Hellenic Register of Shipping 66 13 1 19.70 1.52 7.69 Honduras Bureau of Shipping 4 0 0 0 0 0 Honduras International Surveying and Inspection Bureau
4 0 0 0 0 0
INCLAMAR (Inspection y Classification Maritime, S. de. R.L.)
594 86 15 14.48 2.53 17.44
Indian Register of Shipping 282 19 1 6.74 0.35 5.26 Intermaritime Certification Services, S.A. 758 92 10 12.14 1.32 10.87 International Merchant Marine Registry of Belize 14 4 0 28.57 0 0 International Naval Surveys Bureau 151 12 1 7.95 0.66 8.33 International Register of Shipping 1,198 208 35 17.36 2.92 16.83 International Ship Classification 1,187 158 30 13.31 2.53 18.99 Isthmus Bureau of Shipping 1,509 191 28 12.66 1.86 14.66 Korea Classification Society (former Joson Classification Society)
341 57 16 16.72 4.69 28.07
Korea Ship Safety Technology Authority 142 4 0 2.82 0 0 Korean Register of Shipping 6,237 202 6 3.24 0.10 2.97 Lloyd's Register 8,359 342 25 4.09 0.30 7.31 Marconi International Marine Company Ltd. 4 0 0 0 0 0 Maritime Technical Systems and Services 193 29 6 15.03 3.11 20.69 Mongolia Ship Registry 14 2 0 14.29 0 0 National Cargo Bureau Inc. 5 0 0 0 0 0 National Shipping Adjusters Inc 38 5 1 13.16 2.63 20.00 Nippon Kaiji Kyokai 21,983 853 73 3.88 0.33 8.56 NV Unitas 5 1 0 20.00 0 0 Overseas Marine Certification Services 514 100 11 19.46 2.14 11.00 Panama Bureau of Shipping 179 9 2 5.03 1.12 22.22

MEMORANDUM OF UNDERSTANDING ON PORT STATE CONTROL IN THE ASIA-PACIFIC REGION
42
Recognized organization (RO)
No.
of o
vera
ll in
spec
tions
20
08-2
010
No.
of o
vera
ll de
tent
ions
20
08-2
010
No.
of R
O
resp
onsi
ble
dete
ntio
ns
2008
-201
0
3-ye
ar a
verg
ae
dete
ntio
n pe
rcen
tage
%
3-ye
ar a
vera
ge
RO
resp
onsi
ble
dete
ntio
n pe
rcen
tage
%
3-ye
ar a
vera
ge
perc
enta
ge o
f R
O re
spon
sibl
e de
tent
ions
%
Panama Maritime Documentation Services 559 74 7 13.24 1.25 9.46 Panama Maritime Surveyors Bureau Inc 503 86 4 17.10 0.80 4.65 Panama Register Corporation 221 25 2 11.31 0.90 8.00 Panama Shipping Certificate Inc. 10 1 0 10.00 0 0 Panama Shipping Registrar Inc. 532 87 8 16.35 1.50 9.20 Polski Rejestr Statkow 95 8 1 8.42 1.05 12.50 Register of Shipping (Albania) 1 0 0 0 0 0 Registro Cubano de Buques 1 0 0 0 0 0 Registro Internacional Naval S.A. 26 3 1 11.54 3.85 33.33 Registro Italiano Navale 1,181 86 0 7.28 0 0 RINAVE Portuguesa 11 1 0 9.09 0 0 Russian Maritime Register of Shipping 1,710 129 6 7.54 0.35 4.65 Russian River Register 5 0 0 0 0 0 Shipping Register of Ukraine 5 2 0 40.00 0 0 Sociedad Classificadora de Colombia 1 0 0 0 0 0 Societe Generale de Surveillance 2 0 0 0 0 0 Turkish Lloyd 32 8 0 25.00 0 0 Union Bureau of Shipping 2,743 512 110 18.67 4.01 21.48 Universal Maritime Bureau 956 142 24 14.85 2.51 16.90 Universal Shipping Bureau 272 29 0 10.66 0 0 Viet Nam Register of Shipping 1,761 184 23 10.45 1.31 12.50 Other 1,159 190 33 16.39 2.85 17.37
See also the note in page 29.
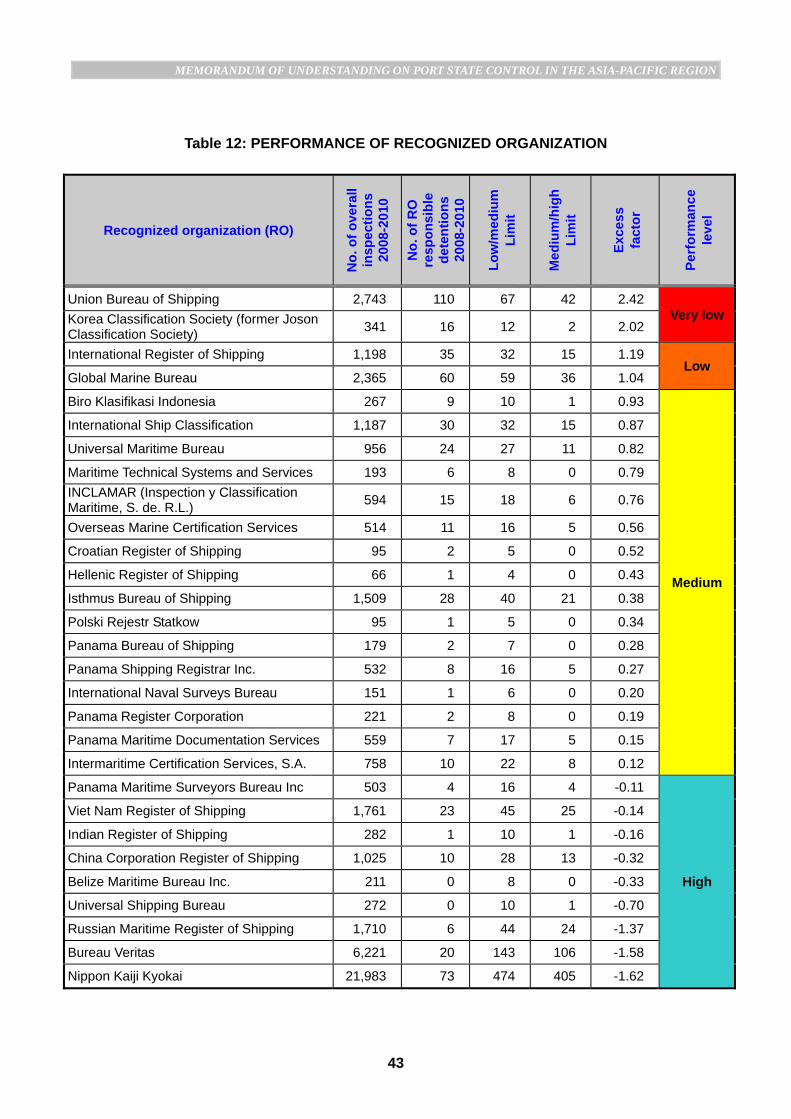
MEMORANDUM OF UNDERSTANDING ON PORT STATE CONTROL IN THE ASIA-PACIFIC REGION
43
Table 12: PERFORMANCE OF RECOGNIZED ORGANIZATION
Recognized organization (RO)
No.
of o
vera
ll in
spec
tions
20
08-2
010
No.
of R
O
resp
onsi
ble
dete
ntio
ns
2008
-201
0
Low
/med
ium
Li
mit
Med
ium
/hig
h Li
mit
Exce
ss
fact
or
Perf
orm
ance
le
vel
Union Bureau of Shipping 2,743 110 67 42 2.42 Very low Korea Classification Society (former Joson
Classification Society) 341 16 12 2 2.02
International Register of Shipping 1,198 35 32 15 1.19 Low
Global Marine Bureau 2,365 60 59 36 1.04
Biro Klasifikasi Indonesia 267 9 10 1 0.93
Medium
International Ship Classification 1,187 30 32 15 0.87
Universal Maritime Bureau 956 24 27 11 0.82
Maritime Technical Systems and Services 193 6 8 0 0.79 INCLAMAR (Inspection y Classification Maritime, S. de. R.L.) 594 15 18 6 0.76
Overseas Marine Certification Services 514 11 16 5 0.56
Croatian Register of Shipping 95 2 5 0 0.52
Hellenic Register of Shipping 66 1 4 0 0.43
Isthmus Bureau of Shipping 1,509 28 40 21 0.38
Polski Rejestr Statkow 95 1 5 0 0.34
Panama Bureau of Shipping 179 2 7 0 0.28
Panama Shipping Registrar Inc. 532 8 16 5 0.27
International Naval Surveys Bureau 151 1 6 0 0.20
Panama Register Corporation 221 2 8 0 0.19
Panama Maritime Documentation Services 559 7 17 5 0.15
Intermaritime Certification Services, S.A. 758 10 22 8 0.12
Panama Maritime Surveyors Bureau Inc 503 4 16 4 -0.11
High
Viet Nam Register of Shipping 1,761 23 45 25 -0.14
Indian Register of Shipping 282 1 10 1 -0.16
China Corporation Register of Shipping 1,025 10 28 13 -0.32
Belize Maritime Bureau Inc. 211 0 8 0 -0.33
Universal Shipping Bureau 272 0 10 1 -0.70
Russian Maritime Register of Shipping 1,710 6 44 24 -1.37
Bureau Veritas 6,221 20 143 106 -1.58
Nippon Kaiji Kyokai 21,983 73 474 405 -1.62

MEMORANDUM OF UNDERSTANDING ON PORT STATE CONTROL IN THE ASIA-PACIFIC REGION
44
Recognized organization (RO)
No.
of o
vera
ll in
spec
tions
20
08-2
010
No.
of R
O
resp
onsi
ble
dete
ntio
ns
2008
-201
0
Low
/med
ium
Li
mit
Med
ium
/hig
h Li
mit
Exce
ss
fact
or
Perf
orm
ance
le
vel
Lloyd's Register 8,359 25 189 146 -1.63
Det Norske Veritas 7,574 21 172 131 -1.65
American Bureau of Shipping 6,058 16 140 103 -1.66
Germanischer Lloyd 6,613 10 151 113 -1.80
China Classification Society 6,246 7 144 106 -1.85
Korean Register of Shipping 6,237 6 143 106 -1.87
Registro Italiano Navale 1,181 0 32 15 -1.92
Note: 1) In this table, only recognized organizations (RO) that had more than 60 inspections
are taken into account. The formula used is identical to the one used for the Black-Grey-White List. However, the values for P and Q are adjusted to P=2% and Q=1%.
2) ROs involving 60-179 inspections with zero detention are not included in this table.

MEMORANDUM OF UNDERSTANDING ON PORT STATE CONTROL IN THE ASIA-PACIFIC REGION
45
Figure 17: COMPARISON OF NUMBER OF DEFICIENCIES BY MAIN CATEGORIES
31,160
29,96731,031
3,1913,386
3,57615,648
14,20715,438
6,1826,0486,8776,921
6,4626,269
15,99814,61914,796
11,07712,131
11,491Li fesaving appliances
Fire safety measures
Stabil ity, structure andrelated equipment
Load lines
Safety o f navigation
ISM related deficiencies
Others
2008 2009 2010

MEMORANDUM OF UNDERSTANDING ON PORT STATE CONTROL IN THE ASIA-PACIFIC REGION
46
Table 13: COMPARISON OF DEFICIENCIES BY CATEGORIES
Nature of deficiency
Number of deficiencies
2008 2009 2010 Ship's certificates and documents 2,611 2,399 2,479 Stability, structure and related equipment 6,269 6,462 6,921 Propulsion and auxiliary machinery 5,185 5,723 6,238 Alarm signals 490 533 664 Fire safety measures 14,796 14,619 15,998 Oil, chemical tankers and gas carriers 213 258 236 Lifesaving appliances 11,491 12,131 11,077 Radiocommunications 3,527 3,354 3,015 Safety of navigation 15,438 14,207 15,648 Carriage of cargo and dangerous goods 537 496 589 ISM related deficiencies 3,576 3,386 3,191 SOLAS related operational deficiencies 4,076 4,132 4,073 Additional measures to enhance maritime safety 874 822 888 Bulk carriers-additional safety measures 310 379 486 Load lines 6,877 6,048 6,182 MARPOL-Annex I 5,505 4,452 4,403 MARPOL-Annex II 77 64 47 MARPOL-Annex III 26 12 92 MARPOL-Annex IV 340 727 879 MARPOL-Annex V 1,687 1,341 1,336 MARPOL-Annex VI 358 312 508 MARPOL related operational deficiencies 440 440 477 AFS Convention 31 21 12 Certification and watchkeeping for seafarers 1,817 1,398 1,595 Crew and accommodation (ILO 147) 414 305 326 Food and catering (ILO 147) 167 151 172 Working spaces (ILO 147) 756 866 899 Accident prevention (ILO 147) 746 712 800 Mooring arrangements (ILO 147) 747 863 793 Other deficiencies 97 207 153 Total 89,478 86,820 90,177 Maritime security related deficiencies 2,318 2,011 2,750Grand total 91,796 88,831 92,927

MEMORANDUM OF UNDERSTANDING ON PORT STATE CONTROL IN THE ASIA-PACIFIC REGION
47
Figure 18: COMPARISON OF MOST FREQUENT DETAINABLE DEFICIENCIES
198
173
163
133
128
101
91
80
78
72
174
117
130
143
139
89
61
90
99
69
184
176
203
108
113
200
94
75
108
88
Lifeboats (Lifesaving appliances)
Oil filtering equipment (MARPOL-Annex I)
Emergency Fire Pump (Fire safety measures)
Maintenance of the ship and equipment (ISMrelated deficiencies)
Fire-dampers (Fire safety measures)
Ventilators, air pipes, casings (Load lines)
Means of control (Fire safety measures)
Fire prevention (Fire safety measures)
Ventilation (Fire safety measures)
Jacketed piping system for high pressure fuel lines(Fire safety measures)
201020092008

MEMORANDUM OF UNDERSTANDING ON PORT STATE CONTROL IN THE ASIA-PACIFIC REGION
48
Table 14: COMPARISON OF MOST FREQUENT DETAINABLE DEFICIENCIES
No. Most frequent deficiencies Year
2008 2009 2010
1 Lifeboats (Lifesaving appliances) 184 174 198
2 Oil filtering equipment (MARPOL-Annex I) 176 117 173
3 Emergency Fire Pump (Fire safety measures) 203 130 163
4 Maintenance of the ship and equipment (ISM related deficiencies) 108 143 133
5 Fire-dampers (Fire safety measures) 113 139 128
6 Ventilators, air pipes, casings (Load lines) 200 89 101
7 Means of control (Fire safety measures) 94 61 91
8 Fire prevention (Fire safety measures) 75 90 80
9 Ventilation (Fire safety measures) 108 99 78
10 Jacketed piping system for high pressure fuel lines (Fire safety measures) 88 69 72
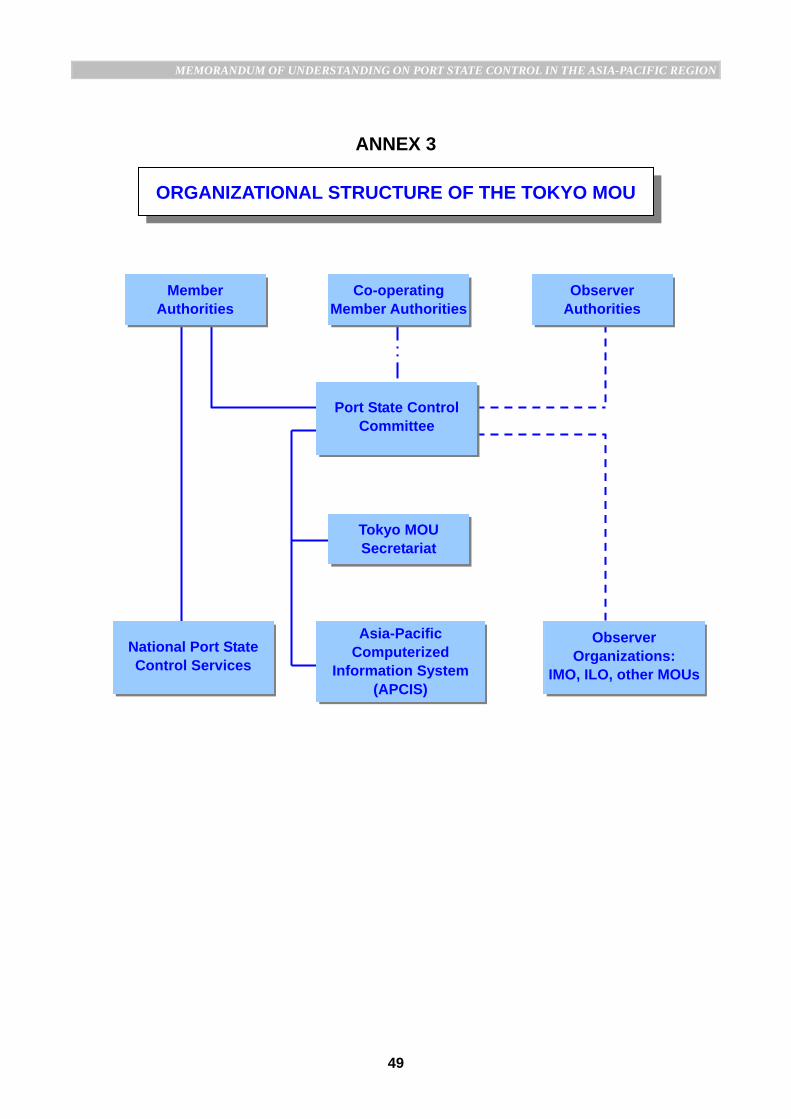
MEMORANDUM OF UNDERSTANDING ON PORT STATE CONTROL IN THE ASIA-PACIFIC REGION
49
ANNEX 3
ORGANIZATIONAL STRUCTURE OF THE TOKYO MOU
Observer Organizations:
IMO, ILO, other MOUs
National Port State Control Services
Co-operating Member Authorities
Observer Authorities
Tokyo MOU Secretariat
Asia-Pacific Computerized
Information System (APCIS)
Member Authorities
Port State Control Committee

MEMORANDUM OF UNDERSTANDING ON PORT STATE CONTROL IN THE ASIA-PACIFIC REGION
50
EXPLANATORY NOTE ON THE BLACK – GREY – WHITE LISTS The Port State Control Committee adopted the same method as used by the Paris MOU for assessment of performance of flags. Compared to the calculation method of previous year, this system has the advantage of providing an excess percentage that is significant and also reviewing the number of inspections and detentions over a 3-year period at the same time, based on binomial calculus. The performance of each flag State is calculated using a standard formula for statistical calculations in which certain values have been fixed in accordance with the agreement of the Port State Control Committee. Two limits have been included in the new system, the ‘black to grey’ and the ‘grey to white’ limit, each with its own specific formula:
)1(5.0 ppNzpNu greytoblack −⋅⋅⋅++⋅=−−
)1(5.0 ppNzpNu greytowhite −⋅⋅⋅−−⋅=−− In the formula "N" is the number of inspections, "p" is the allowable detention limit (yardstick), set to 7% by the Tokyo MOU Port State Control Committee, and "z" is the significance requested (z=1.645 for a statistically acceptable certainty level of 95%). The result "u" is the allowed number of detentions for either the black or white list. The "u" results can be found in the table as the ‘black to grey’ or the ‘grey to white’ limit. A number of detentions above this ‘black to grey’ limit means significantly worse than average, where a number of detentions below the
‘grey to white’ limit means significantly better than average. When the amount of detentions for a particular flag State is positioned between the two, the flag State will find itself on the grey list. The formula is applicable for sample sizes of 30 or more inspections over a 3-year period. To sort results on the black or white list, simply alter the target and repeat the calculation. Flags which are still significantly above this second target are worse than the flags which are not. This process can be repeated, to create as many refinements as desired. (Of course the maximum detention rate remains 100%!) To make the flags’ performance comparable, the excess factor (EF) is introduced. Each incremental or decremental step corresponds with one whole EF-point of difference. Thus the excess factor EF is an indication for the number of times the yardstick has to be altered and recalculated. Once the excess factor is determined for all flags, the flags can be ordered by EF. The excess factor can be found in the last column the black, grey or white list. The target (yardstick) has been set on 7% and the size of the increment and decrement on 3%. The Black – Grey – White lists have been calculated in accordance with the above principles. The graphical representation of the system, below, is showing the direct relations between the number of inspected ships and the number of detentions. Both axis have a logarithmic character.
Number of inspections
Num
ber o
f det
entio
ns
0
10
100
1000
30 50 100 250 500 1000 2000
EF=4 EF=3 EF=2 EF=1 Black EF=0 White EF=-1 EF=-2

MEMORANDUM OF UNDERSTANDING ON PORT STATE CONTROL IN THE ASIA-PACIFIC REGION
51
Example flag on Black list: Ships of St. Kitts & Nevis were subject to 181 inspections of which 34 resulted in a detention. The "black to grey limit" is 19 detentions. The excess factor is 3.41. N = total inspections P = 7% Q= 3% Z = 1.645 How to determine the black to grey limit:
)1(5.0 ppNzpNu greytoblack −⋅⋅⋅++⋅=−−
93.007.0181645.15.007.0181 ⋅⋅⋅++⋅=−− greytoblacku u = 19 The excess factor is 3.41. This means that ‘p’ has to be adjusted in the formula. The black to grey limit has an excess factor of 1, so to determine the new value for ‘p’, ‘q’ has to be multiplied with 2.41, and the outcome has to be added to the normal value for ‘p’: p + 2.41q = 0.07 + (2.41 ⋅ 0.03) = 0.1423
8577.01423.0181645.15.01423.0181 ⋅⋅⋅++⋅=orexcessfactu uexcessfactor = 34 Example flag on Grey list: Ships of India were subject to 270 inspections, of which 21 resulted in a detention. The "black to grey limit" is 26 and the "grey to white limit" is 12. The excess factor is 0.64. How to determine the black to grey limit:
93.007.0270645.15.007.0270 ⋅⋅⋅++⋅=−− greytoblacku ublack-to-grey = 26 How to determine the grey to white limit:
)1(5.0 ppNzpNu greytowhite −⋅⋅⋅−−⋅=−−
93.007.0270645.15.007.0270 ⋅⋅⋅−−⋅=−− greytowhiteu uwhite-to-grey = 12

MEMORANDUM OF UNDERSTANDING ON PORT STATE CONTROL IN THE ASIA-PACIFIC REGION
52
To determine the excess factor the following formula is used: ef = (Detentions – white to grey limit)/(grey to black limit – white to grey limit) ef = (21-11.50)/(26.30-11.50) ef = 0.64 Example flag on White list: Ships of the United Kingdom were subject to 555 inspections of which 10 resulted in detention. The "grey to white limit" is 28 detentions. The excess factor is -1.32. How to determine the grey to white limit:
)1(5.0 ppNzpNu greytowhite −⋅⋅⋅−−⋅=−−
93.007.0555645.15.007.0555 ⋅⋅⋅−−⋅=−− greytowhiteu uwhite-to-grey = 28 The excess factor is -1.32. This means that ‘p’ has to be adjusted in the formula. The grey to white limit has an excess factor of 0, so to determine the new value for ’p’, ‘q’ has to be multiplied with -1.32, and the outcome has to be added to the normal value for ‘p’: p + (-1.32q) = 0.07 + (-1.32 ⋅ 0.03) = 0.0304
9696.00304.0555645.15.00304.0555 ⋅⋅⋅−−⋅=orexcessfactu uexcessfactor = 10 According to the decision by the Port State Control Committee, flags involving 30-49 port State inspections with nil detentions are listed on top of the White List.

MEMORANDUM OF UNDERSTANDING ON PORT STATE CONTROL IN THE ASIA-PACIFIC REGION
53
TOKYO MOU SECRETARIAT
The Secretariat (Tokyo MOU Secretariat) of the Memorandum of Understanding on Port State Control in the Asia-Pacific Region is located in Tokyo, Japan. The Secretariat may be approached for further information or inquiries on the
operation of the Memorandum.
ADDRESS OF THE SECRETARIAT
The address of the Tokyo MOU Secretariat reads:
Tokyo MOU Secretariat Ascend Shimbashi 8F 6-19-19 Shimbashi Minato-ku, Tokyo Japan 105-0004 Tel: +81-3-3433-0621 Fax: +81-3-3433-0624 E-mail: [email protected]
STAFF OF THE SECRETARIAT
The staff of the Secretariat consist of:
Mitsutoyo Okada Secretary
Ikuo Nakazaki Deputy Secretary Ning Zheng Technical Officer
Fumiko Akimoto Projects Officer