annual report on living kidney transplantation · annual report on living kidney transplantation...
TRANSCRIPT

ANNUAL REPORT ON LIVING KIDNEY TRANSPLANTATION
REPORT FOR 2015/2016 (1 APRIL 2001 – 31 MARCH 2016)
PUBLISHED AUGUST 2016

Contents

1 Executive Summary ....................................................................................................... 1
2 Introduction .................................................................................................................... 3
ADULT ................................................................................................................................. 5
PAEDIATRIC ....................................................................................................................... 8
3 Demographic Characteristics ...................................................................................... 11
ADULT ............................................................................................................................... 12
PAEDIATRIC ..................................................................................................................... 15
4 Living Donor Follow-Up ............................................................................................... 18
4.1 Prescription of Antihypertensive drugs, 1 April 2001 – 31 March 2015 ............... 21
4.2 Serum creatinine, 1 April 2001 – 31 March 2015 ................................................ 24
4.3 Return to normal activity, 1 April 2001 – 31 March 2015..................................... 27
5 UK Living Kidney Sharing Schemes ............................................................................ 28
5.1 Paired Donation Scheme ............................................................................................. 29
5.1.1 Registrations: Matching Runs, 1 April 2010 – 31 March 2016 ............................ 29
5.1.2 Outcomes: Matching Runs, 1 April 2012 – 31 March 2016 ................................. 32
5.2 Non-directed Altruistic Donation .................................................................................. 36
5.2.1 Transplants, 1 April 2007 – 31 March 2016 ........................................................ 36
5.2.2 Donation Preference, 1 April 2012 – 31 March 2016 .......................................... 38
5.2.3 Time to donation, 1 April 2012 – 31 March 2016 ................................................ 39
6 Antibody Incompatible Transplants ............................................................................. 41
ADULT ............................................................................................................................... 44
PAEDIATRIC ..................................................................................................................... 47
7 Recipient Graft and Patient Survival ............................................................................ 48
ADULT ............................................................................................................................... 49
PAEDIATRIC ..................................................................................................................... 57
Appendix ............................................................................................................................ 58
A1 Glossary of terms ................................................................................................ 59
A2 Statistical methodology for survival rate estimation ............................................ 63

- 1 -
1 Executive Summary
Executive Summary

- 2 -
This report presents key figures about living kidney transplantation in the UK. The period reported covers 15 years of transplant data, from 1 April 2001. The report presents information on the number of transplants, follow-up data and survival analysis on a national and centre-specific basis. Key findings
There were 944 adult living kidney transplants performed in the UK in 2015/16 an increase of 1 transplant compared to 2014/15. Of these, 447 were related, 220 were unrelated, 26 were HLAi, 52 were ABOi, 118 were paired/pooled and 81 were altruistic donor transplants. The equivalent number of paediatric transplants was 78 a 14% decrease from the previous year.
The proportion of living donors across the UK being prescribed anti-hypertensive drugs is 5% at one year, 8% at five years and 13% at ten years post donation.
Serum creatinine for living donors in the UK is 103 (IQ-range 90-121) at one year, 97 (84-110) at five years and 93 (81-107) at ten years post donation.
The national rate of graft survival five years after adult living donor kidney transplant by type is; unrelated 94%, related 91%, HLAi 80%, ABOi 91%, Paired exchange 93% and Altruistic 91%
Use of the contents of this report should be acknowledged as follows: Annual Report on Living Kidney Transplantation 2015/16. NHS Blood and Transplant

- 3 -
2 Introduction
Introduction
- 4 -
This report presents information on transplant activity between 1 April 2001 and 31 March 2016, for all 24 centres performing living kidney transplantation in the UK. Data were obtained from the UK Transplant Registry, at NHS Blood & Transplant, that holds information relating to donors, recipients and outcomes for all kidney transplants performed in the UK. Graft and patient survival estimates are reported at one-year post transplant for the period 1 April 2011 to 31 March 2015 and five-year post-transplant for the period 1 April 2007 to 31 March 2011. Results are described separately according to the type of donor. Throughout this report West London Renal and Transplant Centre is labeled as WLRTC and Great Ormond Street Hospital is labeled as GOSH.

- 5 -
ADULT Figure 2.1 shows the number of adult living donor kidney transplants performed in the UK between 1 April 2001 and 31 March 2016. The number of transplants increased from 331 in 2001/02 to 944 in 2015/16. Figure 2.2 and Table 2.1 show the number of adult living donor kidney transplants performed in 2015/16 in each transplant centre. Manchester performed the most living kidney transplants last year with 86 patients receiving a transplant.
- 6 -
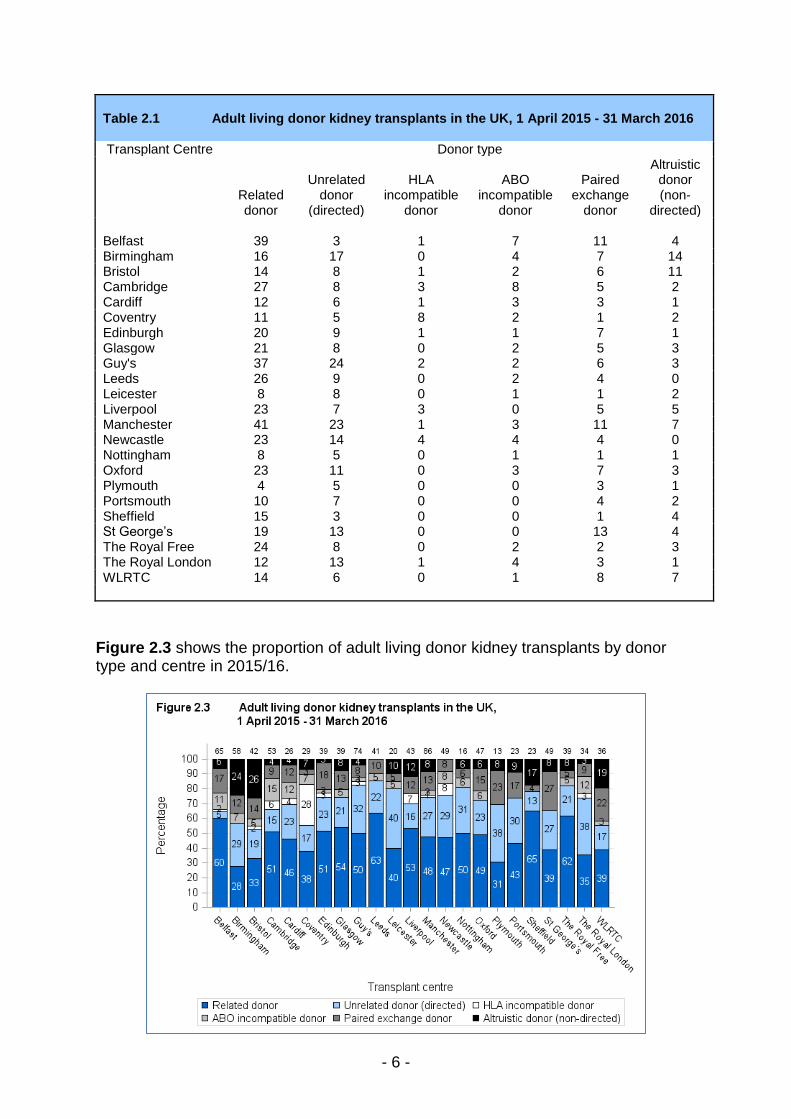
Table 2.1 Adult living donor kidney transplants in the UK, 1 April 2015 - 31 March 2016 Transplant Centre Donor type
Related donor
Unrelated donor
(directed)
HLA incompatible
donor
ABO incompatible
donor
Paired exchange
donor
Altruistic donor (non-
directed)
Belfast 39 3 1 7 11 4 Birmingham 16 17 0 4 7 14 Bristol 14 8 1 2 6 11 Cambridge 27 8 3 8 5 2 Cardiff 12 6 1 3 3 1 Coventry 11 5 8 2 1 2 Edinburgh 20 9 1 1 7 1 Glasgow 21 8 0 2 5 3 Guy's 37 24 2 2 6 3 Leeds 26 9 0 2 4 0 Leicester 8 8 0 1 1 2 Liverpool 23 7 3 0 5 5 Manchester 41 23 1 3 11 7 Newcastle 23 14 4 4 4 0 Nottingham 8 5 0 1 1 1 Oxford 23 11 0 3 7 3 Plymouth 4 5 0 0 3 1 Portsmouth 10 7 0 0 4 2 Sheffield 15 3 0 0 1 4 St George’s 19 13 0 0 13 4 The Royal Free 24 8 0 2 2 3 The Royal London 12 13 1 4 3 1 WLRTC 14 6 0 1 8 7
Figure 2.3 shows the proportion of adult living donor kidney transplants by donor type and centre in 2015/16.

- 7 -
Figure 2.4 shows the number of adult living donor kidney transplants by donor type and centre between 1 April 2001 and 31 March 2016.

- 8 -
PAEDIATRIC Figure 2.5 shows the number of paediatric living donor kidney transplants performed in the UK between 1 April 2001 and 31 March 2016. The number of transplants increased from 37 in 2001/02 to 78 in 2015/16. Figure 2.6 and Table 2.2 show the number of paediatric living donor kidney transplants performed in 2015/16 in each transplant centre. Guy’s transplant team performed the most living kidney transplants last year with 34 patients receiving a transplant (19 at GOSH and 15 at Guy’s).

- 9 -
Table 2.2 Paediatric living donor kidney transplants in the UK, 1 April 2015 - 31 March 2016 Transplant Centre Donor type
Related donor
Unrelated donor
(directed)
HLA incompatible
donor
ABO incompatible
donor
Paired exchange
donor
Altruistic donor (non-
directed)
Birmingham 5 0 0 0 0 1 Bristol 3 0 0 0 0 0 GOSH* 14 2 1 0 2 0 Glasgow 2 0 0 0 0 0 Guy's 15 0 0 0 0 0 Leeds 3 0 0 1 1 0 Manchester 16 0 0 2 0 1 Newcastle 1 1 0 0 0 0 Nottingham 2 0 0 1 0 0 Adult centre's 3 1 0 0 0 0 *Guy’s transplant team routinely carry out transplants at GOSH
Figure 2.7 shows the proportion of paediatric living donor kidney transplants by donor type and centre in 2015/16.

- 10 -
Figure 2.8 shows the number of paediatric living donor kidney transplants by donor type and centre between 1 April 2001 and 31 March 2016.
- 11 -
3 Demographic Characteristics
Demographic Characteristics
- 12 -
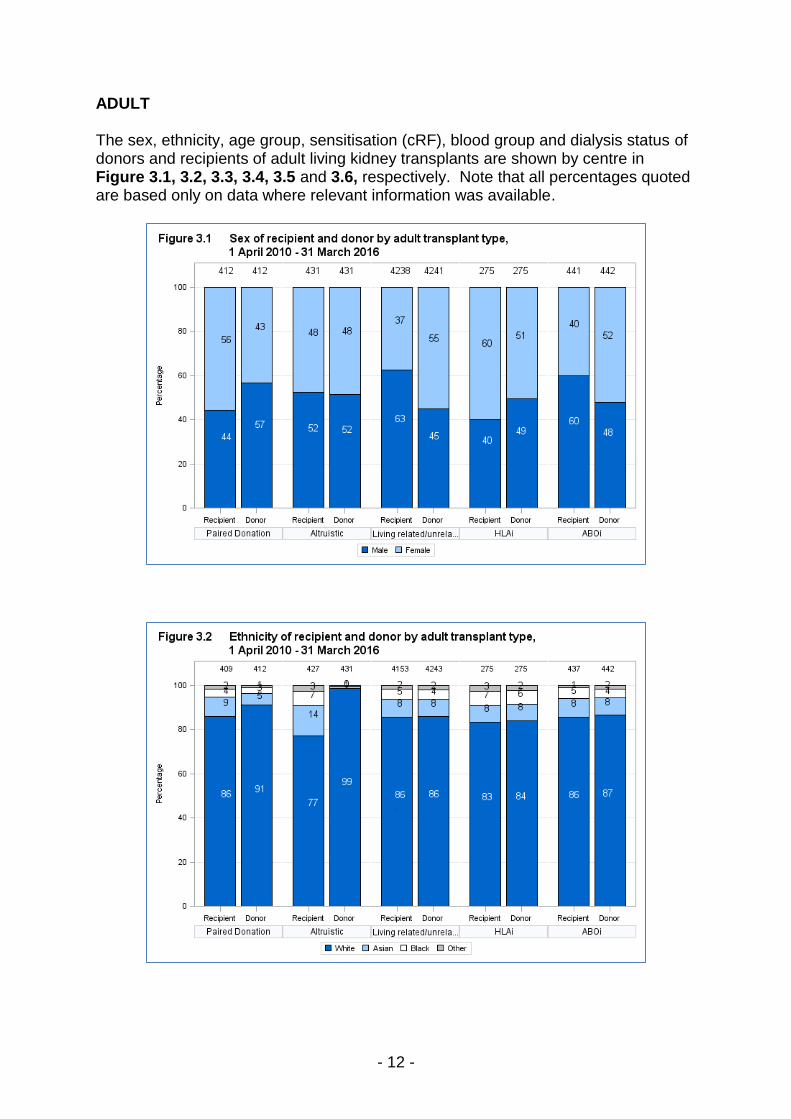
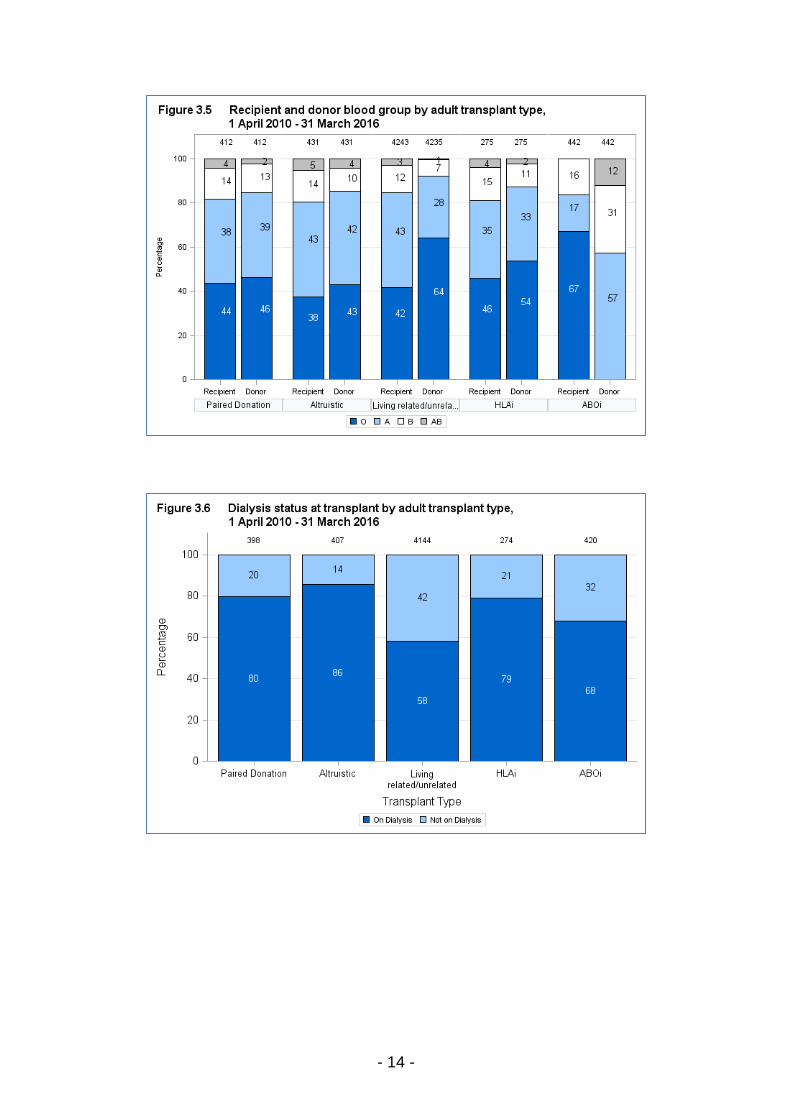
ADULT The sex, ethnicity, age group, sensitisation (cRF), blood group and dialysis status of donors and recipients of adult living kidney transplants are shown by centre in Figure 3.1, 3.2, 3.3, 3.4, 3.5 and 3.6, respectively. Note that all percentages quoted are based only on data where relevant information was available.

- 13 -
- 14 -

- 15 -
PAEDIATRIC The sex, ethnicity, age group, sensitisation (cRF), blood group and dialysis status of donors and recipients of paediatric living kidney transplants are shown by centre in Figure 3.7, 3.8, 3.9, 3.10, 3.11 and 3.12, respectively. Note that all percentages quoted are based only on data where relevant information was available.

- 16 -

- 17 -

- 18 -
4 Living Donor Follow-Up
Living Donor Follow-Up
- 19 -
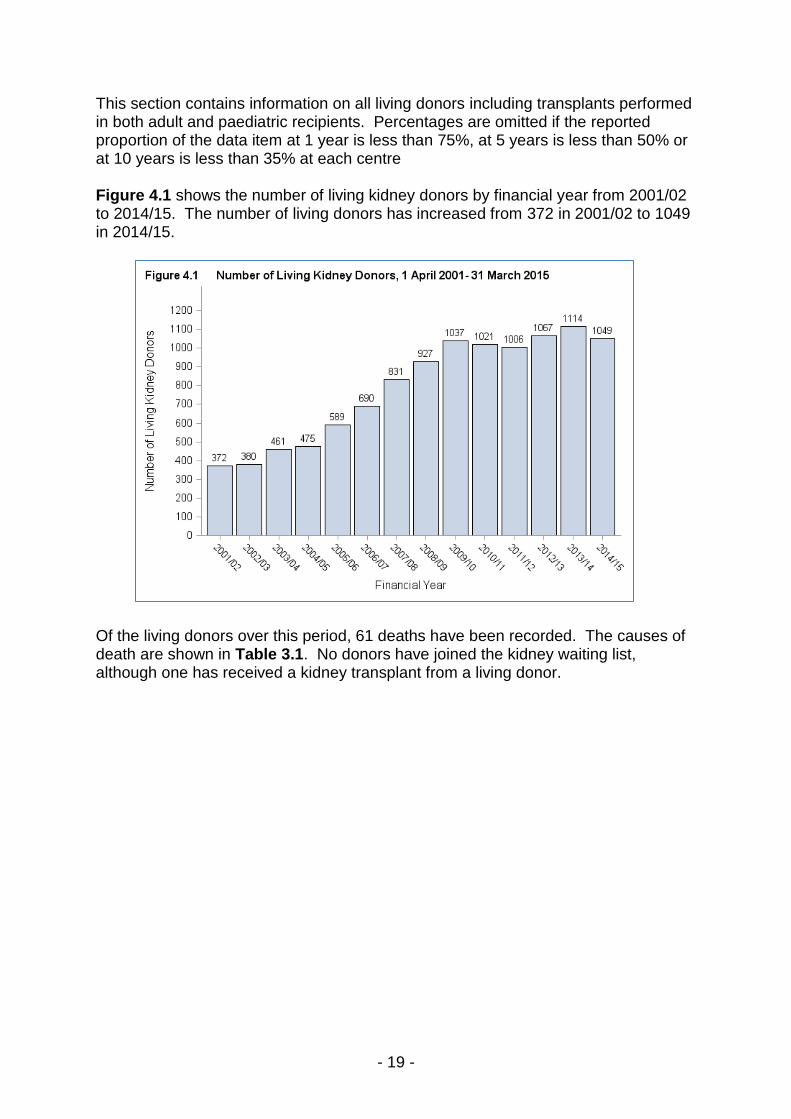
This section contains information on all living donors including transplants performed in both adult and paediatric recipients. Percentages are omitted if the reported proportion of the data item at 1 year is less than 75%, at 5 years is less than 50% or at 10 years is less than 35% at each centre Figure 4.1 shows the number of living kidney donors by financial year from 2001/02 to 2014/15. The number of living donors has increased from 372 in 2001/02 to 1049 in 2014/15. Of the living donors over this period, 61 deaths have been recorded. The causes of death are shown in Table 3.1. No donors have joined the kidney waiting list, although one has received a kidney transplant from a living donor.

- 20 -
Table 3.1 Cause of death for living donors 1 April 2001 – 31 March 2015 Cause of Death N % Cancer 26 43
Bowel 2 3 Breast 1 2 Colonic 1 2 Gastric 1 2 Liver 1 2 Lung 3 5 Oesophagus 3 5 Pancreatic 3 5 Stomach 1 2 Throat 2 3 Uterus 1 2 Other 7 11 Brain Tumor 5 8 Intracranial hemorrhage 3 5 Ischaemic heart disease 1 2 Motor neuron disease 1 2 Myelodysplasia 1 2 Myocardial infarction 1 2 Parkinson’s disease 1 2 Pulmonary embolism 1 2 bronchopneumonia 2 3 Other 7 11 Unknown 12 20
TOTAL 61 100

- 21 -
4.1 Prescription of Antihypertensive drugs, 1 April 2001 – 31 March 2015 Figure 4.2, 4.3 and 4.4 show the proportion of living kidney donors where the donor has been prescribed antihypertensive drugs at 1, 5 and 10 year follow-up by centre, respectively. The same information is summarised in Table 4.2.

- 22 -

- 23 -
Table 4.2 Percentage of Donors Prescribed Antihypertensive Drugs by Centre, Donations April 2001 - March 2015 Donor centre 1 Year 5 Year 10 Year
N %1 %
2 N %
1 %
2 N %
1 %
2
Belfast 223 94 2 88 53 6 33 48 - Birmingham 244 70 - 312 49 - 145 30 - Bristol 166 77 5 203 55 14 140 47 21 Cambridge 173 87 6 180 70 13 76 64 22 Cardiff 151 96 6 161 86 16 78 74 19 Coventry 117 76 9 163 56 12 87 39 9 Edinburgh 132 83 6 117 62 3 71 59 7 Glasgow 161 81 3 137 17 - 104 14 - Guy's 473 86 6 540 54 8 285 32 - Leeds 190 76 6 203 67 7 129 48 8 Leicester 142 17 - 214 16 - 132 9 - Liverpool 135 76 2 124 43 - 87 23 - Manchester 382 86 5 293 55 8 122 42 18 Newcastle 229 55 - 203 35 - 95 35 12 Nottingham 61 85 0 96 64 2 77 48 16 Oxford 210 82 4 195 44 - 82 28 - Plymouth 91 75 7 89 61 11 22 45 - Portsmouth 115 89 14 98 76 11 55 44 8 Sheffield 82 88 3 93 70 3 43 65 21 St George’s 162 81 4 238 45 - 105 27 - The Royal Free 139 68 - 153 48 - 69 19 - The Royal London 175 67 - 169 44 - 64 58 22 WLRTC 246 65 - 415 52 5 156 50 9 UK 4199 77 5 4484 52 8 2257 39 13 1% of donors with follow-up reported
2% of donors that have been prescribed antihypertensive drugs (where follow-up returned)
- Percentages are omitted where less than 75%, 50% or 35% of data reported at 1yr, 5yrs or 10yrs
- 24 -
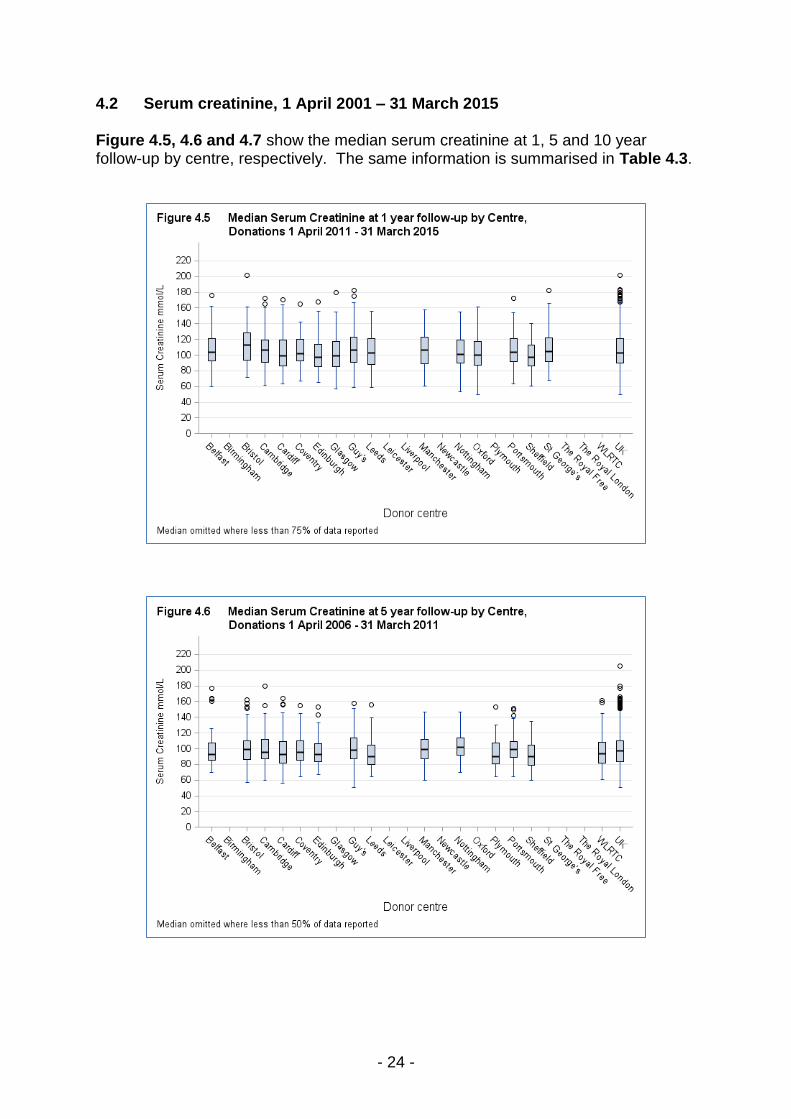
4.2 Serum creatinine, 1 April 2001 – 31 March 2015 Figure 4.5, 4.6 and 4.7 show the median serum creatinine at 1, 5 and 10 year follow-up by centre, respectively. The same information is summarised in Table 4.3.

- 25 -

- 26 -
Table 4.3 Median Serum Creatinine at 1 Year follow up by Centre, Donations 1 April 2011 – 31 March 2015 Centre 1 Year 5 Year 10 Year
N %1
Median (IQ range) N
%
1
Median (IQ range) N %
1
Median (IQ range)
Belfast 223 94 104 (93-121) 88 53 93 (85-107) 33 48 104 (93-113) Birmingham 244 69 (-) 312 49 (-) 145 29 (-) Bristol 166 76 113 (94-128) 203 55 99 (86-110) 140 46 91 (81-105) Cambridge 173 87 106 (91-119) 180 69 95 (87-112) 76 63 93 (79-105) Cardiff 151 95 99 (86-119) 161 86 93 (82-109) 78 74 97 (81-108) Coventry 117 75 102 (93-120) 163 56 95 (85-110) 87 39 87 (79-98) Edinburgh 132 83 97 (85-114) 117 62 93 (84-107) 71 59 91 (75-111) Glasgow 161 81 99 (85-117) 137 17 (-) 104 14 (-) Guy's 473 86 106 (91-123) 540 54 98 (87-114) 285 32 (-) Leeds 190 76 103 (89-121) 203 66 90 (80-105) 129 48 95 (82-107) Leicester 142 15 (-) 214 15 (-) 132 9 (-) Liverpool 135 67 (-) 124 40 (-) 87 23 (-) Manchester 382 86 106 (89-123) 293 54 99 (87-112) 122 41 93 (85-112) Newcastle 229 54 (-) 203 35 (-) 95 35 91 (82-106) Nottingham 61 87 101 (90-119) 96 64 102 (92-114) 77 48 95 (81-110) Oxford 210 81 100 (87-117) 195 44 (-) 82 28 (-) Plymouth 91 75 104 (95-117) 89 61 90 (81-107) 22 45 105 (79-129) Portsmouth 115 89 104 (92-121) 98 74 99 (89-109) 55 44 87 (80-102) Sheffield 82 88 97 (86-113) 93 70 90 (79-105) 43 65 89 (77-99) St George’s 162 78 105 (92-122) 238 45 (-) 105 27 (-) The Royal Free 139 68 (-) 153 48 (-) 69 19 (-) The Royal London 175 66 (-) 169 44 (-) 64 58 94 (78-106) WLRTC 246 65 (-) 415 52 94 (82-108) 156 50 91 (79-107) UK 4199 76 103 (90-121) 4486 51 97 (84-110) 2258 38 93 (81-107)
1% of donors with follow-up reported
- Medians are omitted where less than 75%, 50% or 35% of data reported at 1yr, 5yrs or 10yrs
- 27 -
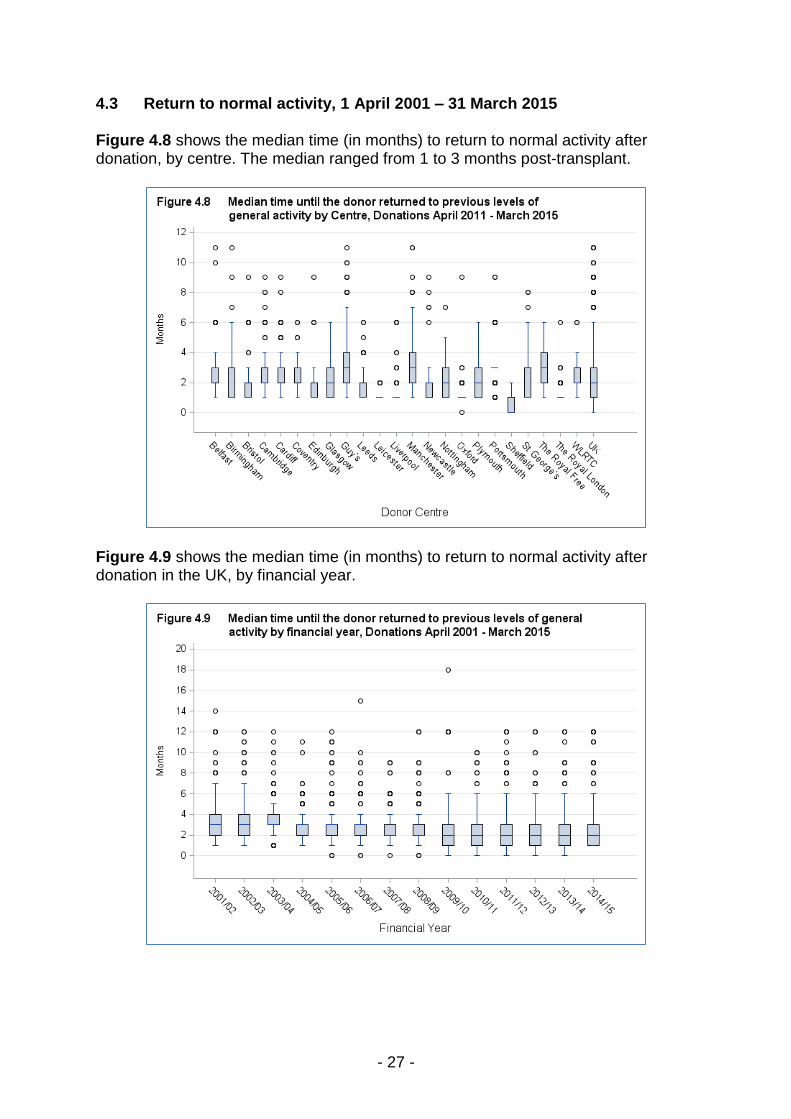
4.3 Return to normal activity, 1 April 2001 – 31 March 2015 Figure 4.8 shows the median time (in months) to return to normal activity after donation, by centre. The median ranged from 1 to 3 months post-transplant.
Figure 4.9 shows the median time (in months) to return to normal activity after donation in the UK, by financial year.

- 28 -
5 UK Living Kidney Sharing Schemes
UK Living Kidney Sharing Schemes
- 29 -
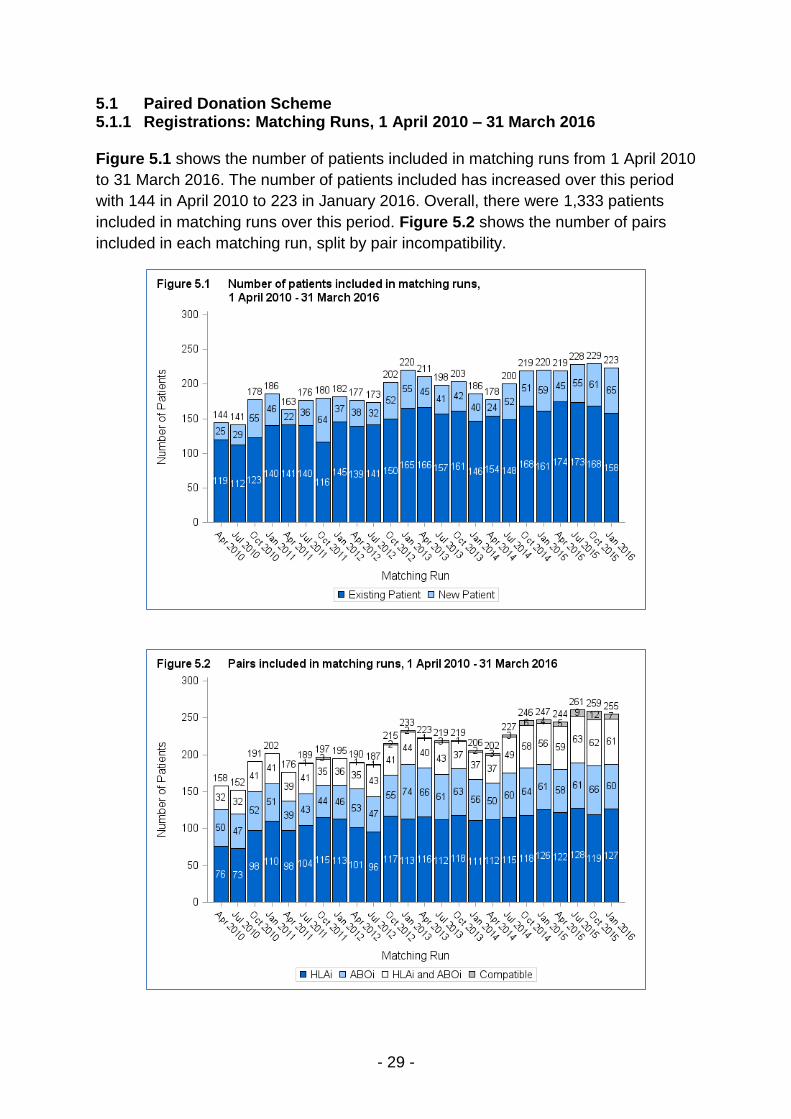
5.1 Paired Donation Scheme 5.1.1 Registrations: Matching Runs, 1 April 2010 – 31 March 2016 Figure 5.1 shows the number of patients included in matching runs from 1 April 2010
to 31 March 2016. The number of patients included has increased over this period
with 144 in April 2010 to 223 in January 2016. Overall, there were 1,333 patients
included in matching runs over this period. Figure 5.2 shows the number of pairs
included in each matching run, split by pair incompatibility.

- 30 -
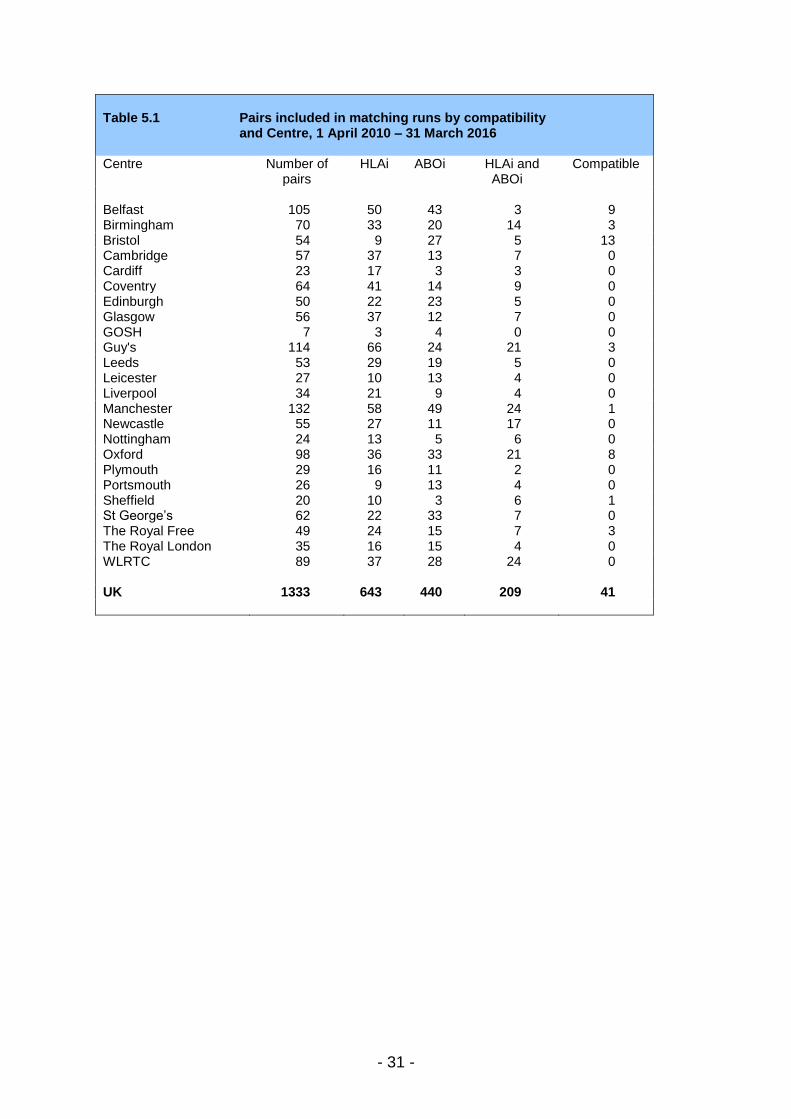
Figure 5.3 shows the number of patients included in matching runs from 1 April 2010 to 31 March 2016 by centre. This is broken down further by the nature of the incompatibility between the pair. It can be seen that Manchester has had the highest number of patients registered over this time period. Most pairs registered over this period were HLA incompatible (49%).This information is also shown in Table 5.1.
- 31 -
Table 5.1 Pairs included in matching runs by compatibility and Centre, 1 April 2010 – 31 March 2016 Centre Number of
pairs HLAi ABOi HLAi and
ABOi Compatible
Belfast 105 50 43 3 9 Birmingham 70 33 20 14 3 Bristol 54 9 27 5 13 Cambridge 57 37 13 7 0 Cardiff 23 17 3 3 0 Coventry 64 41 14 9 0 Edinburgh 50 22 23 5 0 Glasgow 56 37 12 7 0 GOSH 7 3 4 0 0 Guy's 114 66 24 21 3 Leeds 53 29 19 5 0 Leicester 27 10 13 4 0 Liverpool 34 21 9 4 0 Manchester 132 58 49 24 1 Newcastle 55 27 11 17 0 Nottingham 24 13 5 6 0 Oxford 98 36 33 21 8 Plymouth 29 16 11 2 0 Portsmouth 26 9 13 4 0 Sheffield 20 10 3 6 1 St George’s 62 22 33 7 0 The Royal Free 49 24 15 7 3 The Royal London 35 16 15 4 0 WLRTC 89 37 28 24 0 UK 1333 643 440 209 41
- 32 -
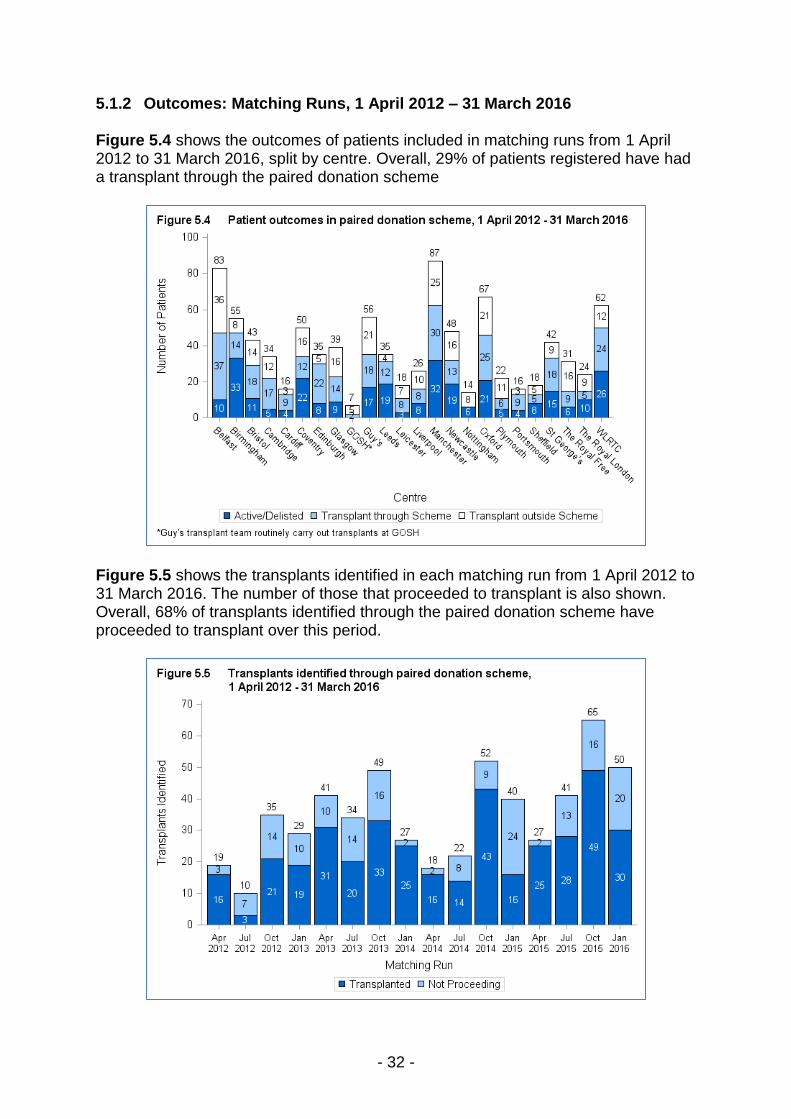
5.1.2 Outcomes: Matching Runs, 1 April 2012 – 31 March 2016 Figure 5.4 shows the outcomes of patients included in matching runs from 1 April 2012 to 31 March 2016, split by centre. Overall, 29% of patients registered have had a transplant through the paired donation scheme
Figure 5.5 shows the transplants identified in each matching run from 1 April 2012 to 31 March 2016. The number of those that proceeded to transplant is also shown. Overall, 68% of transplants identified through the paired donation scheme have proceeded to transplant over this period.

- 33 -
Tables 5.2 and 5.3 show the number of transplants split by patient calculated reaction frequency and patient and donor blood group respectively. Table 5.2 Transplants as a proportion of registered patients by calculated reaction frequency, 1 April 2012 – 31 March 2016 Calculated Reaction Frequency Patients Registered Patients Transplanted N (%) 0-9% 276 122 (44) 10-84% 214 116 (54) 85-94% 94 42 (45) 95-99% 204 48 (24) 100% 140 5 (4)
Table 5.3 Transplants as a proportion of registered pairs by blood group, 1 April 2012 – 31 March 2016 Donor Blood Group
Patient Blood Group (Patients Transplanted/Pairs Registered (%))
O A B AB
O 69/ 221 (31%) 58/ 95 (61%) 12/ 26 (46%) 3/ 9 (33%) A 75/ 313 (24%) 38/ 131 (29%) 21/ 41 (51%) 2/ 9 (22%) B 19/ 77 (25%) 18/ 31 (58%) 8/ 31 (26%) 1/ 5 (20%) AB 2/ 12 (17%) 5/ 8 (63%) 2/ 11 (18%) 0/ 3 (0%)
Figure 5.6 shows the number of patients transplanted from matching runs between 1 April 2012 and 31 March 2016. This is split by centre and exchange type.

- 34 -
Figure 5.7 shows the patients transplanted from matching runs between 1 April 2012 and 31 March 2016. This is split by centre and the incompatibility of the patient with their registered donor. Table 5.4 shows the percentage of pairs transplanted through paired donation given that they have been included in 1 or more, 2 or more or 5 or more matching runs. Table 5.5 shows the average waiting time for transplant in the paired donation scheme. Data is censored if the patient received a transplant outside the scheme.

- 35 -
Table 5.4 Transplants by group type and Centre, 1 April 2012 – 31 March 2016 Centre Number of Transplants 2-way 3-way Short Chain Belfast 36 7 24 1 Birmingham 29 4 7 3 Bristol 22 2 9 3 Cambridge 19 5 8 2 Cardiff 11 3 5 0 Coventry 12 3 7 0 Edinburgh 23 8 10 1 Glasgow 17 3 7 2 GOSH* 3 0 1 1 Guy's 25 8 3 3 Leeds 15 5 7 0 Leicester 11 2 1 0 Liverpool 10 1 6 0 Manchester 34 9 14 4 Newcastle 15 4 4 1 Nottingham 3 0 1 0 Oxford 27 5 10 3 Plymouth 8 3 3 1 Portsmouth 10 3 2 2 Sheffield 6 3 0 0 St George’s 24 3 11 6 The Royal Free 11 2 3 1 The Royal London 13 2 2 1 WLRTC 28 7 8 4 UK 412 92 153 39
Table 5.5 Median waiting time to paired donation kidney transplant in the UK, for patients registered 1 April 2006 - 31 March 2012 Pair Incompatibility Number of patients Waiting time (days)
registered Median 95% Confidence interval
HLAi 314 1147 686 - 1608 ABOi 247 771 616 - 926 All Pairs 665 1135 815 - 1455
- 36 -
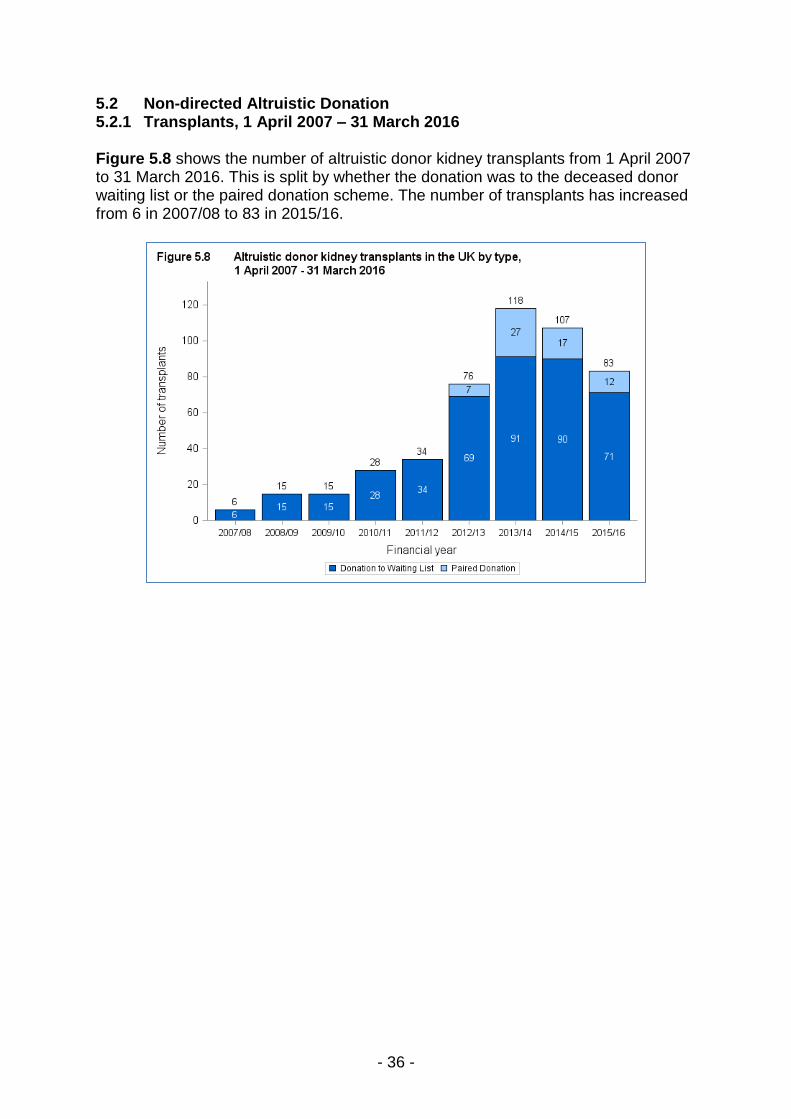
5.2 Non-directed Altruistic Donation 5.2.1 Transplants, 1 April 2007 – 31 March 2016 Figure 5.8 shows the number of altruistic donor kidney transplants from 1 April 2007 to 31 March 2016. This is split by whether the donation was to the deceased donor waiting list or the paired donation scheme. The number of transplants has increased from 6 in 2007/08 to 83 in 2015/16.

- 37 -
Figure 5.9 shows the number of altruistic donor kidney transplants from 1 April 2012 to 31 March 2016 by donor centre. Manchester had the highest number of altruistic donors. Figure 5.10 shows the number of altruistic donor kidney transplant from 1 April 2012 to 31 March 2016 by recipient centre. Birmingham had the highest number of recipients of altruistic donors.

- 38 -
5.2.2 Donation Preference, 1 April 2012 – 31 March 2016 Figure 5.11 shows the original donation preference for altruistic donors from 1 April 2012 to 31 March 2016, by centre. The proportion indicating a preference for donating to the paired donation scheme varies from 0% in Leicester to 80% in Sheffield.

- 39 -
5.2.3 Time to donation, 1 April 2012 – 31 March 2016 Figure 5.12 shows the median time in months from notification to donation from 1 April 2012 to 31 March 2016, by centre. This ranged from 1 to 4 months. This data is shown further in Table 5.6.

- 40 -
Table 5.6 Median time between notification and donation by Centre, Donations April 2012 - March 2016 Centre Number of donors Median Interquartile range Belfast 24 2 2 - 4 Birmingham 14 1 1 - 3 Bristol 11 1 1 - 3 Cambridge 15 2 1 - 3 Cardiff 9 2 1 - 3 Coventry 7 2 0 - 3 Edinburgh 29 2 1 - 3 Glasgow 9 1 1 - 2 Guy's 28 2 1 - 2 Leeds 18 2 1 - 4 Leicester 3 1 0 - 4 Liverpool 13 2 1 - 3 Manchester 38 1 1 - 2 Newcastle 14 2 1 - 3 Nottingham 9 2 1 - 2 Oxford 33 2 1 - 3 Plymouth 32 2 1 - 3 Portsmouth 37 2 1 - 2 Sheffield 5 2 2 - 2 St George’s 9 1 1 - 2 The Royal Free 10 1 1 - 1 The Royal London 4 3 2 - 3 WLRTC 5 1 1 - 2 - UK 376 2 1 - 3 -

- 41 -
6 Antibody Incompatible Transplants
Antibody Incompatible Transplants
- 42 -
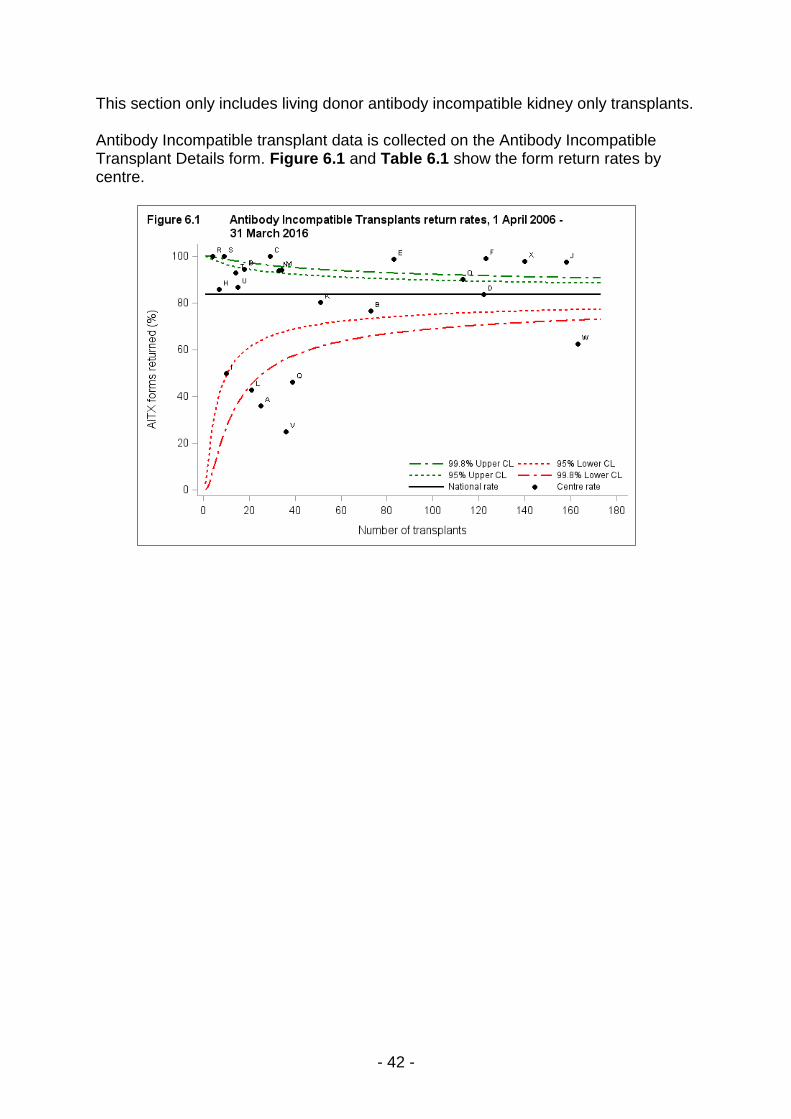
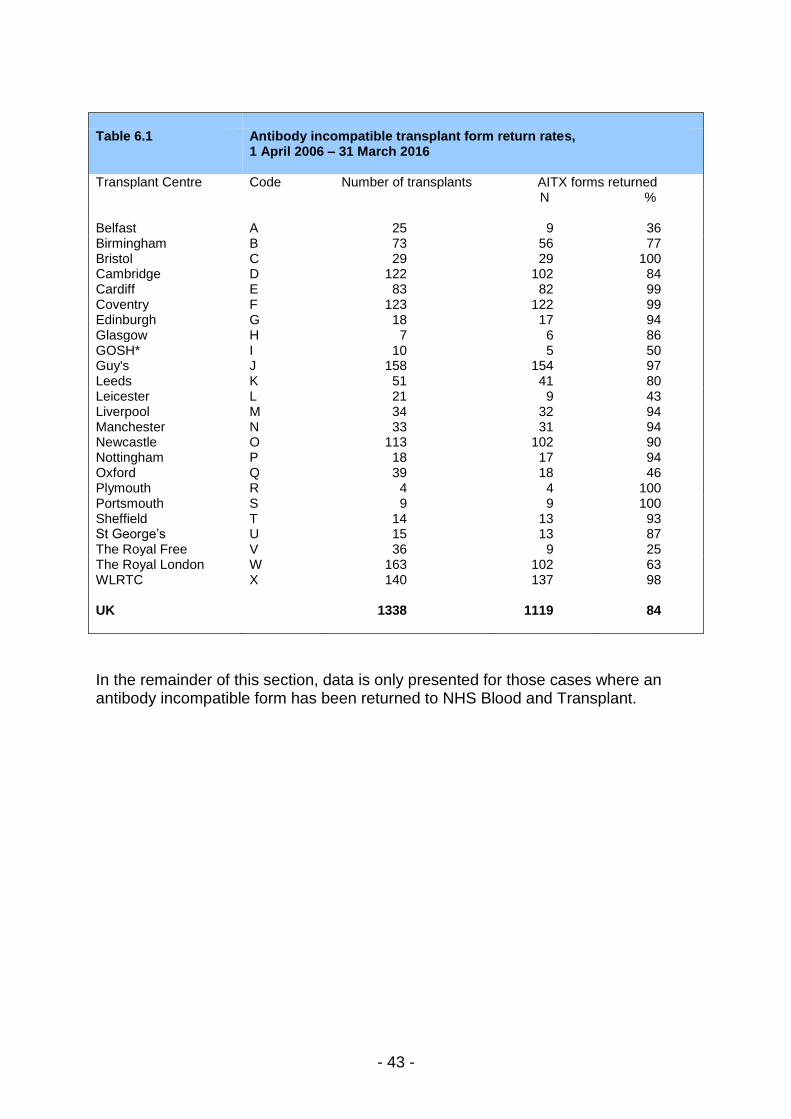
This section only includes living donor antibody incompatible kidney only transplants. Antibody Incompatible transplant data is collected on the Antibody Incompatible Transplant Details form. Figure 6.1 and Table 6.1 show the form return rates by centre.
- 43 -
Table 6.1 Antibody incompatible transplant form return rates,
1 April 2006 – 31 March 2016 Transplant Centre Code Number of transplants AITX forms returned N % Belfast A 25 9 36 Birmingham B 73 56 77 Bristol C 29 29 100 Cambridge D 122 102 84 Cardiff E 83 82 99 Coventry F 123 122 99 Edinburgh G 18 17 94 Glasgow H 7 6 86 GOSH* I 10 5 50 Guy's J 158 154 97 Leeds K 51 41 80 Leicester L 21 9 43 Liverpool M 34 32 94 Manchester N 33 31 94 Newcastle O 113 102 90 Nottingham P 18 17 94 Oxford Q 39 18 46 Plymouth R 4 4 100 Portsmouth S 9 9 100 Sheffield T 14 13 93 St George’s U 15 13 87 The Royal Free V 36 9 25 The Royal London W 163 102 63 WLRTC X 140 137 98 UK 1338 1119 84
In the remainder of this section, data is only presented for those cases where an antibody incompatible form has been returned to NHS Blood and Transplant.

- 44 -
ADULT Figures 6.2 and 6.3 show the number of living donor antibody incompatible kidney transplants by financial year and centre respectively.
- 45 -
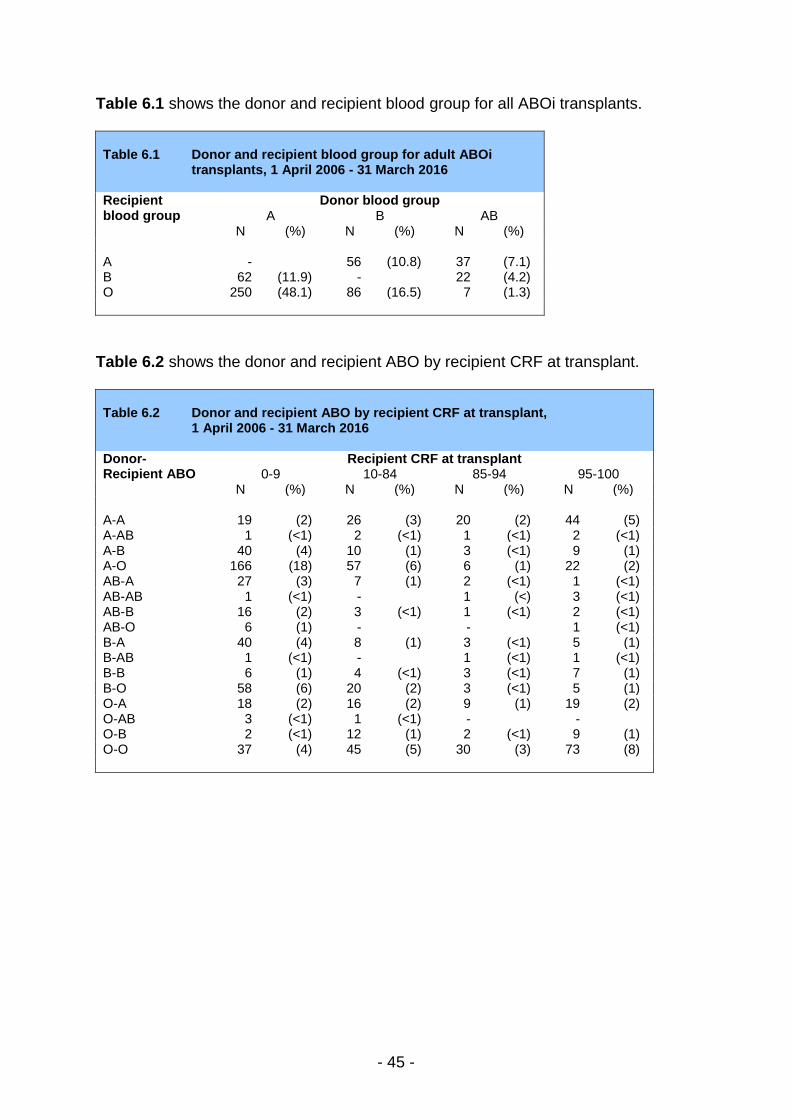
Table 6.1 shows the donor and recipient blood group for all ABOi transplants. Table 6.1 Donor and recipient blood group for adult ABOi transplants, 1 April 2006 - 31 March 2016 Recipient Donor blood group blood group A B AB
N (%) N (%) N (%)
A - 56 (10.8) 37 (7.1) B 62 (11.9) - 22 (4.2) O 250 (48.1) 86 (16.5) 7 (1.3)
Table 6.2 shows the donor and recipient ABO by recipient CRF at transplant. Table 6.2 Donor and recipient ABO by recipient CRF at transplant, 1 April 2006 - 31 March 2016 Donor- Recipient CRF at transplant Recipient ABO 0-9 10-84 85-94 95-100
N (%) N (%) N (%) N (%)
A-A 19 (2) 26 (3) 20 (2) 44 (5) A-AB 1 (<1) 2 (<1) 1 (<1) 2 (<1) A-B 40 (4) 10 (1) 3 (<1) 9 (1) A-O 166 (18) 57 (6) 6 (1) 22 (2) AB-A 27 (3) 7 (1) 2 (<1) 1 (<1) AB-AB 1 (<1) - 1 (<) 3 (<1) AB-B 16 (2) 3 (<1) 1 (<1) 2 (<1) AB-O 6 (1) - - 1 (<1) B-A 40 (4) 8 (1) 3 (<1) 5 (1) B-AB 1 (<1) - 1 (<1) 1 (<1) B-B 6 (1) 4 (<1) 3 (<1) 7 (1) B-O 58 (6) 20 (2) 3 (<1) 5 (1) O-A 18 (2) 16 (2) 9 (1) 19 (2) O-AB 3 (<1) 1 (<1) - - O-B 2 (<1) 12 (1) 2 (<1) 9 (1) O-O 37 (4) 45 (5) 30 (3) 73 (8)

- 46 -
Table 6.3 shows the pre and at transplant level group for all HLAi transplants. Table 6.4 shows the calculated reaction frequency by incompatibility type.
Table 6.3 Pre and at transplant antibody level group for all adult HLAi transplants, 1 April 2006 - 31 March 2016
At Transplant antibody level group
Pre treatment antibody level group
CDC pos, Flow pos,
DSA SPA pos
CDC neg, Flow pos,
DSA SPA pos
CDC neg, Flow neg,
DSA SPA pos
CDC neg, Flow neg, DSA SPA
neg
CDC NT, Flow pos,
DSA SPA pos Unknown N (%) N (%) N (%) N (%) N (%) N (%)
CDC NT, Flow pos, DSA SPA pos
- 1 (<1) 22 (5) 2 (<1) 13 (3) 1 (<1)
CDC neg, Flow neg, DSA SPA pos
- 1 (<1) 118 (24) 27 (6) - 1 (<1)
CDC neg, Flow pos, DSA SPA pos
- 101 (21) 54 (11) 47 (10) - 18 (4)
CDC pos, Flow pos, DSA SPA pos
15 (3) 27 (6) 14 (3) 7 (1) 1 (<1) 3 (1)
Unknown - 1 (<1) - 2 (<1) - 9 (2)
Table 6.4 At transplant calculated reaction frequency by incompatibility type, 1 April 2006 - 31 March 2016 Calculated Reaction ABOi HLAi HLAi and ABOi Frequency N % N % N %
0-9 12 (19) 342 (75) 88 (21) 10-84 16 (25) 89 (20) 106 (25) 85-94 7 (11) 11 (2) 67 (16) 95-100 30 (46) 14 (3) 159 (38)
- 47 -
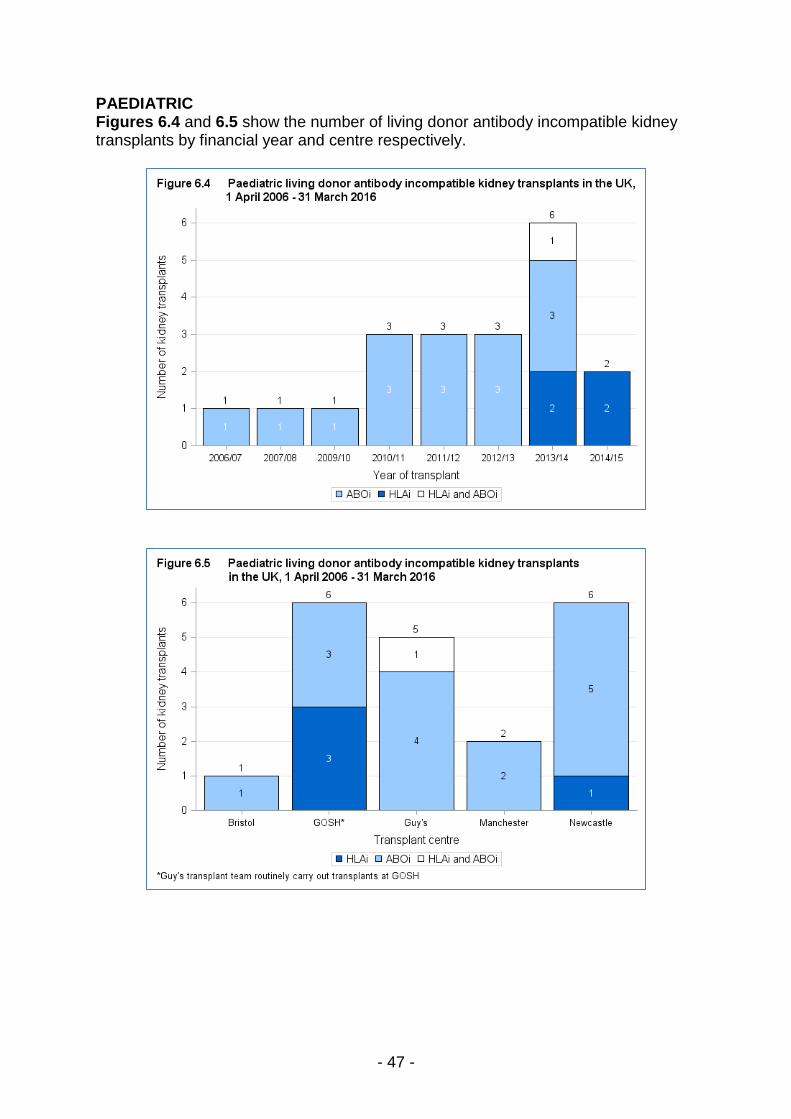
PAEDIATRIC Figures 6.4 and 6.5 show the number of living donor antibody incompatible kidney transplants by financial year and centre respectively.

- 48 -
7 Recipient Graft and Patient Survival
Recipient Graft and Patient survival

- 49 -
ADULT One and five year graft and patient survival are shown in Figures 7.1-7.4 following adult living donor kidney transplants by donor type. Tables 7.1-7.4 show the survival rates and 95% confidence limits.
Table 7.1 1 year graft survival following adult living kidney transplant between 1 April 2011 and 31 March 2015 (p<0.0001)
Living Donors No. at risk on
day 0 % Graft survival (95% confidence interval)
Related donor 1822 98.2 (97-99) Unrelated donor (directed) 997 98.1 (97-99) Altruistic donor (non-directed) 325 95.9 (93-98) Paired exchange donor 249 95.4 (92-97) ABO incompatible donor 311 93.5 (90-96) HLA incompatible donor 194 92.2 (87-95)
Figure 7.1 1 year graft survival following adult living kidney
transplant between 1 April 2011 and 31 March 2015

- 50 -
Table 7.2 5 year graft survival following adult living kidney transplant between 1 April 2007 and 31 March 2011 (p<0.0001)
Living Donors No. at risk on
day 0 % Patient survival (95% confidence interval)
Unrelated donor (directed) 1002 94.1 (92-95) Paired exchange donor 91 93.4 (86-97) Altruistic donor (non-directed) 61 91.3 (80-96) ABO incompatible donor 220 91.1 (86-94) Related donor 1958 90.7 (89-92) HLA incompatible donor 215 80.0 (74-85)
Figure 7.2 5 year graft survival following adult living kidney
transplant between 1 April 2007 and 31 March 2011
- 51 -
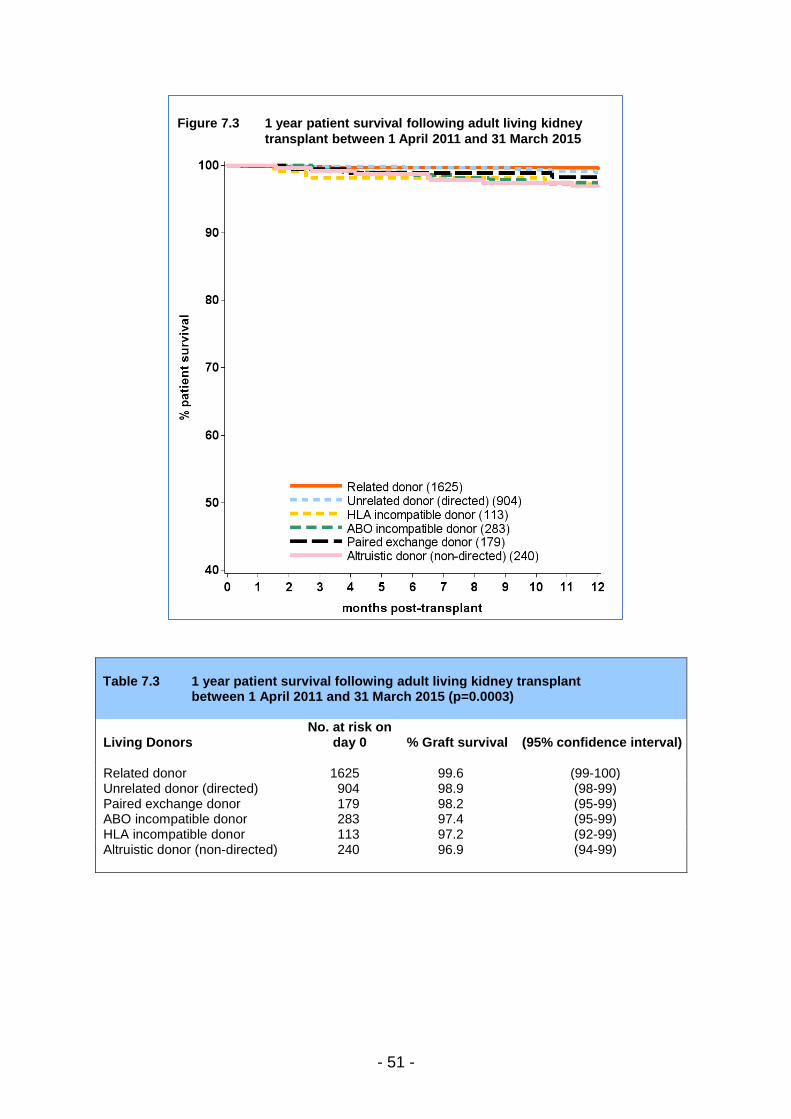
Table 7.3 1 year patient survival following adult living kidney transplant between 1 April 2011 and 31 March 2015 (p=0.0003)
Living Donors No. at risk on
day 0 % Graft survival (95% confidence interval)
Related donor 1625 99.6 (99-100) Unrelated donor (directed) 904 98.9 (98-99) Paired exchange donor 179 98.2 (95-99) ABO incompatible donor 283 97.4 (95-99) HLA incompatible donor 113 97.2 (92-99) Altruistic donor (non-directed) 240 96.9 (94-99)
Figure 7.3 1 year patient survival following adult living kidney
transplant between 1 April 2011 and 31 March 2015
- 52 -
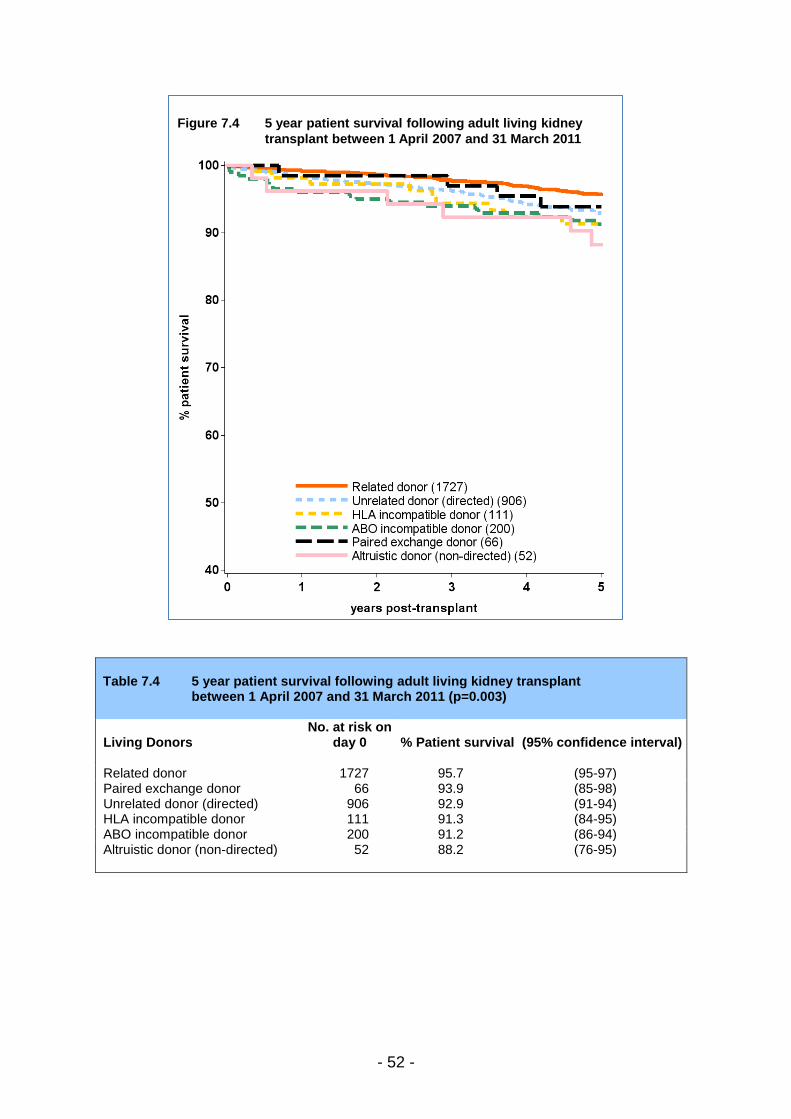
Table 7.4 5 year patient survival following adult living kidney transplant between 1 April 2007 and 31 March 2011 (p=0.003)
Living Donors No. at risk on
day 0 % Patient survival (95% confidence interval)
Related donor 1727 95.7 (95-97) Paired exchange donor 66 93.9 (85-98) Unrelated donor (directed) 906 92.9 (91-94) HLA incompatible donor 111 91.3 (84-95) ABO incompatible donor 200 91.2 (86-94) Altruistic donor (non-directed) 52 88.2 (76-95)
Figure 7.4 5 year patient survival following adult living kidney
transplant between 1 April 2007 and 31 March 2011

- 53 -
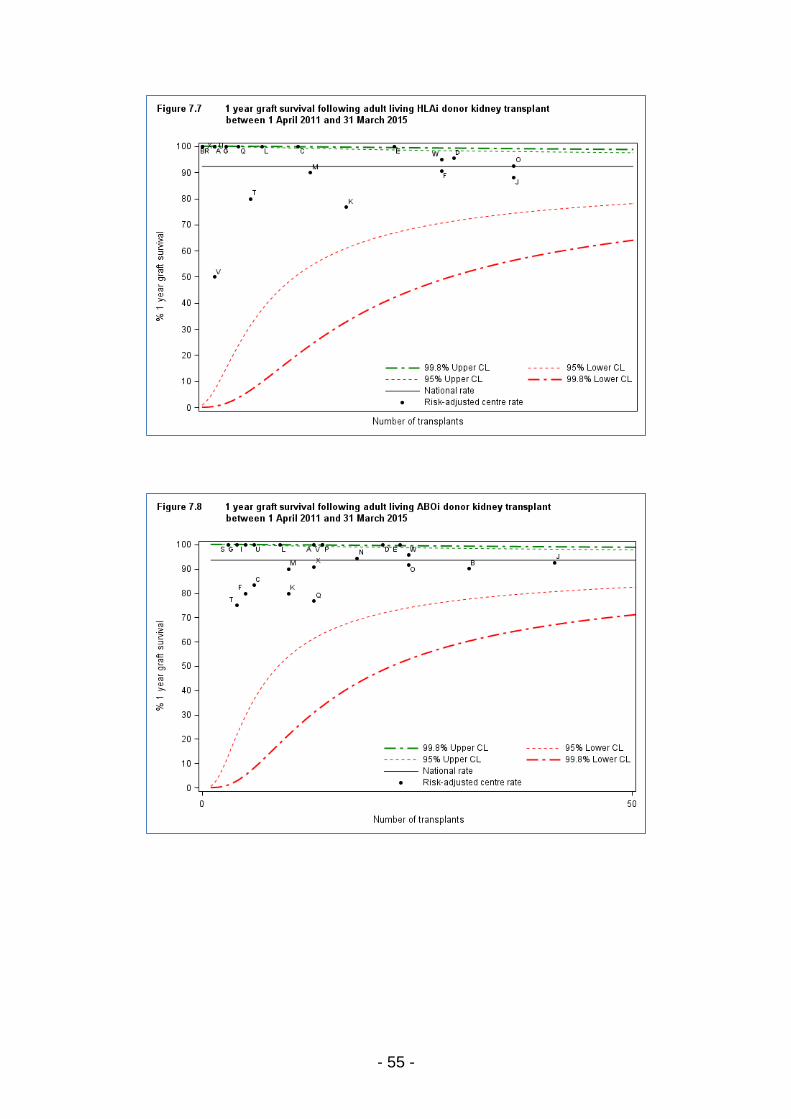
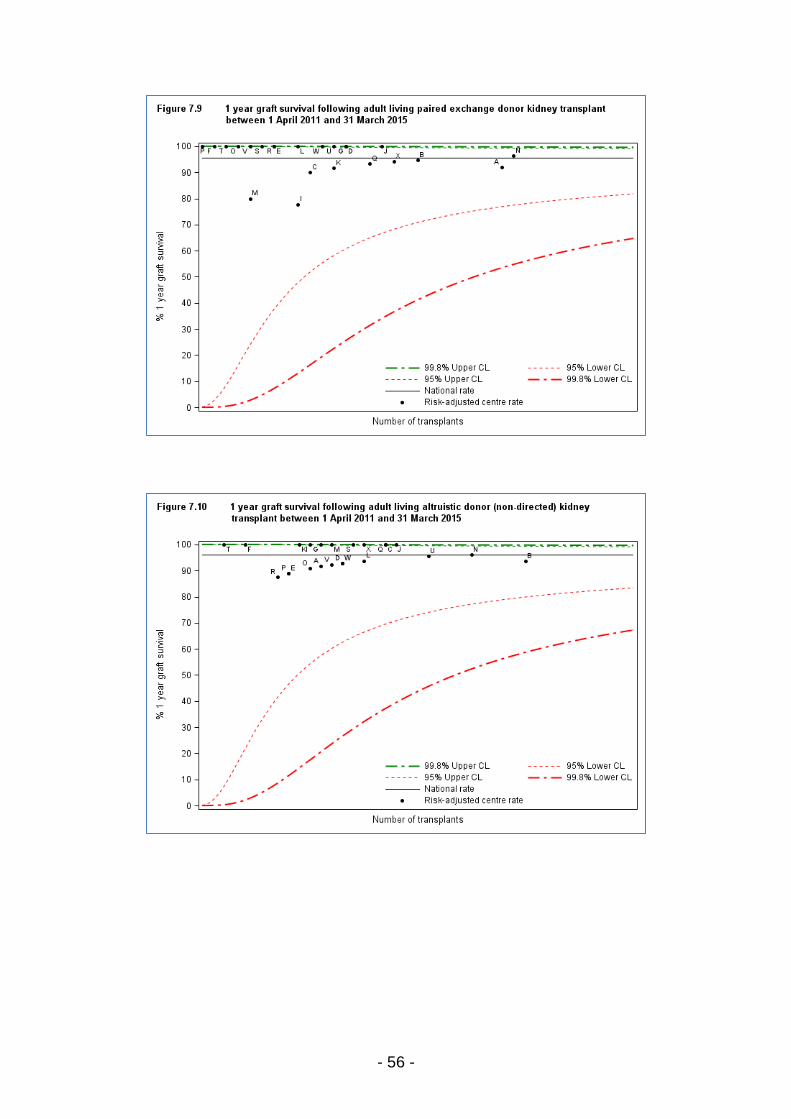
We present a visual comparison of survival rates among centres that is based on a graphical display known as a funnel plot (1, 2). This display is used to show how consistent the rates of the different transplant units are with the national rate. Funnel plots show the survival rate plotted against the number of transplants for each centre, with the overall national survival rate (solid line), and its 95% (thin dotted lines) and 99.8% (thick dotted lines) confidence limits superimposed. Each dot in the plot represents one of the centres. Note that many patients return to local renal units for follow-up care after their transplant and although we report survival according to transplant unit, patients may in fact be followed up quite distantly from their transplant centre. Interpreting the funnel plots If a centre lies within all the limits, then that centre has a survival rate that is statistically consistent with the national rate. If a centre lies outside the 95% confidence limits, this serves as an alert that the centre may have a rate that is significantly different from the national rate. If a centre lies outside the 99.8% limits, then further investigations may be carried out to determine the reasons for the possible difference. When a centre lies above the upper limits, this indicates a survival rate that is higher than the national rate, while a centre that lies below the lower limits has a survival rate that is lower than the national rate. It is important to note that adjusting for patient mix through the use of risk-adjustment models may not account for all possible causes of centre differences. There may be other factors that are not taken into account in the risk-adjustment process that may affect the survival rate of a particular centre. References 1. Tekkis PP, McCulloch P, Steger AC, Benjamin IS, Poloniecki JD. Mortality
control charts for comparing performance of surgical units: validation study using hospital mortality data. British Medical Journal 2003; 326: 786 – 788.
2. Stark J, Gallivan S, Lovegrove J, Hamilton JRL, Monro JL, Pollock JCS,
Watterson KG. Mortality rates after surgery for congenital heart defects in children and surgeons’ performance. Lancet 2000; 355: 1004 – 1007.

- 54 -
Figures 7.5 to 7.10 shows one year risk adjusted survival rates following adult living donor kidney transplants by centre for each donor type. Table 7.5 shows the survival rates by centre and donor type.
- 55 -
- 56 -

- 57 -
Table 7.5
1 year graft survival following adult living donor kidney transplant between 1 April 2011 and 31 March 2015, by donor type and centre
Related Unrelated HLAi ABOi Paired Altruistic Centre Code N %
1 N %
1 N %
1 N %
1 N %
1 N %
1
Belfast A 118 99 32 100 2 100 13 100 26 92 12 92 Birmingham B 102 98 65 97 1 100 31 90 19 95 31 94 Bristol C 57 98 49 95 9 100 6 83 10 90 18 100 Cambridge D 65 98 37 100 22 95 21 100 13 100 14 93 Cardiff E 63 98 33 94 17 100 23 100 7 100 9 89 Coventry F 49 100 24 95 21 90 5 80 2 100 5 100 Edinburgh G 64 98 21 100 3 100 4 100 13 100 12 100 Glasgow I 80 99 39 97 0 5 100 9 78 11 100 Guy's J 151 99 90 98 27 88 41 93 16 100 19 100 Leeds K 87 96 42 100 13 77 10 80 12 92 10 100 Leicester L 74 97 40 97 6 100 9 100 9 100 16 94 Liverpool M 73 99 28 96 10 90 10 90 5 80 13 100 Manchester N 168 98 87 99 0 18 94 27 96 26 96 Newcastle O 86 100 57 100 27 93 24 92 4 100 11 91 Nottingham P 19 100 13 100 0 14 100 1 100 9 89 Oxford Q 96 95 49 98 4 100 13 77 15 93 18 100 Plymouth R 35 100 20 100 1 100 0 7 100 8 88 Portsmouth S 35 100 34 100 0 3 100 6 100 15 100 Sheffield T 40 100 27 96 5 80 4 75 3 100 3 100 St George’s U 75 97 55 100 2 100 6 100 12 100 22 95 The Royal Free V 77 100 26 100 2 50 14 100 5 100 13 92 The Royal London W 88 97 37 97 21 95 24 96 11 100 14 93 WLRTC X 116 97 92 97 1 100 13 91 17 94 16 100 UK 1818 98 997 98 194 92 311 93 249 95 325 96 1 % 1 year graft survival
PAEDIATRIC Numbers are too small to present paediatric graft and patient survival broken down by living donor transplant type. Overall living donor survival is presented in the Annual report on kidney transplantation.
- 58 -
Appendix
Appendix

- 59 -
A1 Glossary of terms ABO The most important human blood group system for transplantation is the ABO system. Every human being is of blood group O, A, B or AB, or of one of the minor variants of these four groups. ABO blood groups are present on other tissues and, unless special precautions are taken, a group A kidney transplanted to a group O patient will be rapidly rejected. Active transplant list When a patient is registered for a transplant, they are registered on what is called the ‘active’ transplant list. This means that when a donor kidney becomes available, the patient is included among those who are matched against the donor to determine whether or not the kidney is suitable for them. It may sometimes be necessary to take a patient off the transplant list, either temporarily or permanently. This may be done, for example, if someone becomes too ill to receive a transplant. The patient is told about the decision to suspend them from the list and is informed whether the suspension is temporary or permanent. If a patient is suspended from the list, they are not included in the matching of any donor kidneys that become available. Case mix The types of patients treated at a unit for a common condition. This can vary across units depending on the facilities available at the unit as well as the types of people in the catchment area of the unit. The definition of what type of patient a person is depends on the patient characteristics that influence the outcome of the treatment. For example the case mix for patients registered for a kidney transplant is defined in terms of various factors such as the blood group, tissue type and age of the patient. These factors have an influence on the chance of a patient receiving a transplant. Confidence interval (CI) When an estimate of a quantity such as a survival rate is obtained from data, the value of the estimate depends on the set of patients whose data were used. If, by chance, data from a different set of patients had been used, the value of the estimate may have been different. There is therefore some uncertainty linked with any estimate. A confidence interval is a range of values whose width gives an indication of the uncertainty or precision of an estimate. The number of transplants or patients analysed influences the width of a confidence interval. Smaller data sets tend to lead to wider confidence intervals compared to larger data sets. Estimates from larger data sets are therefore more precise than those from smaller data sets. Confidence intervals are calculated with a stated probability, usually 95%. We then say that there is a 95% chance that the confidence interval includes the true value of the quantity we wish to estimate. Confidence limit The upper and lower bounds of a confidence interval. Cox Proportional Hazards model A statistical model that relates the instantaneous risk (hazard) of an event occurring at a given time point to the risk factors that influence the length of time it takes for the

- 60 -
event to occur. This model can be used to compare the hazard of an event of interest, such as graft failure or patient death, across different groups of patients. Cross-match A cross-match is a test for patient antibodies against donor antigens. A positive cross-match shows that the donor and patient are incompatible. A negative cross-match means there is no reaction between donor and patient and that the transplant may proceed. Donor after brain death (DBD) A donor whose heart is still beating when their entire brain has stopped working so that they cannot survive without the use of a ventilator. Organs for transplant are removed from the donor while their heart is still beating, but only after extensive tests determine that the brain cannot recover and they have been certified dead. Donor after circulatory death (DCD) A donor whose heart stops beating before their brain stops working and who is then certified dead. The organs are then removed. Funnel plot A graphical method that shows how consistent the survival rates of the different transplant units are compared to the national rate. The graph shows for each unit, a survival rate plotted against the number of transplants undertaken, with the national rate and confidence limits around this national rate superimposed. In this report, 95% and 99.8% confidence limits were used. Units that lie within the confidence limits have survival rates that are statistically consistent with the national rate. When a unit is close to or outside the limits, this is an indication that the centre may have a rate that is considerably different from the national rate. Graft survival rate The percentage of patients whose grafts are still functioning. This is usually specified for a given time period after transplant. For example, a five-year transplant survival rate is the percentage of transplants still functioning five years after transplant. HLA mismatch Human Leucocyte Antigen (HLA) antigens are carried on many cells in the body and the immune system can distinguish between those that can be recognised as ‘self’ (belonging to you or identical to your own) and those that can be recognised as ‘nonself’. The normal response of the immune system is to attack foreign/non-self material by producing antibodies against the foreign material. This is one of the mechanisms that provide protection against infection. This is unfortunate from the point of view of transplantation as the immune system will see the graft as just another ‘infection’ to be destroyed, produce antibodies against the graft and rejection of the grafted organ will take place. To help overcome this response, it is recognised that ‘matching’ the recipient and donor on the basis of HLA (and blood group) reduces the chances of acute rejection and, with the added use of immunosuppressive drugs, very much improves the chances of graft survival. ‘Matching’ refers to the similarity of the recipient HLA type and donor HLA type. HLA mismatch refers to the number of mismatches between the donor and the recipient at the A, B and DR (HLA) loci. There can only be a total of two mismatches at each

- 61 -
locus. For example, an HLA mismatch value of 000, means that the donor and recipient are identical at all three loci, while an HLA mismatch value of 210 means that the donor and recipient differ completely at the A locus, are partly the same at the B locus and are identical at the DR locus. Inter-quartile range The values between which the middle 50% of the data fall. The lower boundary is the lower quartile, the upper boundary the upper quartile. Kaplan-Meier method A method that allows patients with incomplete follow-up information to be included in estimating survival rates. For example, in a cohort for estimating one year patient survival rates, a patient was followed up for only nine months before they relocated. If we calculated a crude survival estimate using the number of patients who survived for at least a year, this patient would have to be excluded as it is not known whether or not the patient was still alive at one year after transplant. The Kaplan-Meier method allows information about such patients to be used for the length of time that they are followed-up, when this information would otherwise be discarded. Such instances of incomplete follow-up are not uncommon and the Kaplan-Meier method allows the computation of estimates that are more meaningful in these cases. Live donor A donor who is a living person and who is usually, but not always, a relative of the transplant patient. For example, a parent may donate one of their kidneys to their child. Median The midpoint in a series of numbers, so that half the data values are larger than the median, and half are smaller. Multi-organ transplant A transplant in which the patient receives more than one organ. For example, a patient may undergo a transplant of a kidney and liver. National Kidney Allocation Scheme A nationally agreed set of rules for sharing and allocating kidneys for transplant between transplant centres in the UK. The scheme is administered by NHS Blood and Transplant. Patient survival rate The percentage of patients who are still alive (whether the graft is still functioning or not). This is usually specified for a given time period after transplant. For example, a five-year patient survival rate is the percentage of patients who are still alive five years after their first transplant.
- 62 -
p value In the context of comparing survival rates across centres, the p value is the probability that the differences observed in the rates across centres occurred by chance. As this is a probability, it takes values between 0 and 1. If the p value is small, say less than 0.05, this implies that the differences are unlikely to be due to chance and there may be some identifiable cause for these differences. If the p value is large, say greater than 0.1, then it is quite likely that any differences seen are due to chance. Pre-emptive Patients that are placed on the kidney transplant list or receive a transplant prior to the need for dialysis are termed as pre-emptive. Patients listed pre-emptively will usually require dialysis within six months of being placed on the transplant list. Risk-adjusted survival rate Some transplants have a higher chance than others of failing at any given time. The differences in expected survival times arise due to differences in certain factors, the risk factors, among patients. A risk-adjusted survival rate for a centre is the expected survival rate for that centre given the case mix of their patients. Adjusting for case mix in estimating centre-specific survival rates allows valid comparison of these rates across centres and to the national rate. Risk factors These are the characteristics of a patient, transplant or donor that influence the length of time that a graft is likely to function or a patient is likely to survive following a transplant. For example, when all else is equal, a transplant from a younger donor is expected to survive longer than that from an older donor and so donor age is a risk factor. Unadjusted survival rate Unadjusted survival rates do not take account of risk factors and are based only on the number of transplants at a given centre and the number and timing of those that fail within the post-transplant period of interest. In this case, unlike for risk-adjusted rates, all transplants are assumed to be equally likely to fail at any given time. However, some centres may have lower unadjusted survival rates than others simply because they tend to undertake transplants that have increased risks of failure. Comparison of unadjusted survival rates across centres and to the national rate is therefore inappropriate.

- 63 -
A2 Statistical methodology for survival rate estimation Unadjusted estimates of patient and graft survival are given for each centre. Unadjusted rates give an estimate of what the survival rate at a centre is, assuming that all patients at the centre have the same chance of surviving a given length of time after transplant. Computing unadjusted survival rates Unadjusted survival rates were calculated using the Kaplan-Meier method, which allows patients with incomplete follow-up information to be included in the computation. For example, in a cohort for estimating one-year patient survival rates, a patient was followed up for only nine months before they relocated. If we calculated a crude survival estimate using the number of patients who survived for at least a year, this patient would have to be excluded, as it is not known whether or not the patient was still alive one year after transplant. The Kaplan-Meier method allows information about such patients to be used for the length of time that they are followed-up, when this information would otherwise be discarded. Such instances of incomplete follow-up are not uncommon in the analysis of survival data and the Kaplan-Meier method therefore allows the computation of survival estimates that are more meaningful.
- 64 -
Prepared by: Statistics and Clinical Studies, NHS Blood and Transplant Miss Laura Pankhurst Mr Mathew Robb Mrs Lisa Bradbury Miss Chloe Brown