annual report of the michigan state treasurer tax year ... · attached for your review is the...
TRANSCRIPT

o f t h e M i c h i g a n S t a t e T r e a s u r e rAnnuAl RepoRt
2015-2016
Rick Snyder, Governor | Nick A. Khouri, Treasurer

Table of ContentsState Treasurer’s Letter of Transmittal ........................................................................................................1
Cash and Investments
Schedule 1 State Treasurer’s Common Cash - Assets and Equities ................................................ 2 Schedule2 InvestmentPortfoliosofSpecificFunds ........................................................................3 Schedule 3 Investment Revenues .....................................................................................................4
NotestoFinancialSchedules .................................................................................................................6
Cash and Investments ............................................................................................................................8
Table1 InvestmentRevenuesforFiscalYears ...........................................................................8 Table 2 Available Month-End Common Cash ............................................................................9 Table 3 Common Cash History ...................................................................................................9 Table4 StateTreasurer’sCommonCashFund,CashBalances,and TransactionsbyFund ..................................................................................................10 Table5 DemandDepositoriesasofSeptember30,2016 .........................................................13
Bonds, Notes, and Taxes
BondsandNotes ..................................................................................................................................14
Table6 GeneralObligationDebt,Bond,andNotePayments ..................................................15 Table7 SpecialAuthorityRevenueBondDebt ........................................................................16 Table8 GeneralObligationBondPaymentSchedule ..............................................................17 Table9 BondsandNotesPayablebyFiscalYear .....................................................................17 Table10 SpecialRevenueDebt,Bond,andNotePayments ......................................................18
State Tax Collections ..................................................................................................19
Table11 TreasuryAdministeredTaxesandFeesCollectedonaCashBasis .............................19 Table 12 Michigan State Taxes ...................................................................................................20
Local Property Taxes ...................................................................................................21
Table13 LocalPropertyTaxValuation,Levies,andAverageRates ..........................................21 Table 14 Distribution of Local Property Taxes ...........................................................................21
Note: Dollar figures in financial tables represent thousands of dollars unless indicated otherwise. Figures may not add to totals because of rounding.

1
State of Michigan
DePARTMeNT OF TReASuRYRICK SNYDeR NICK A. KHOuRIgovernor LanSing state treasurer
The Honorable Rick SnyderMembers of the Michigan LegislaturePeople of the State of Michigan
Attached for your review is the Annual Report of the Michigan State Treasurer for Fiscal Year (FY) 2015-2016. This report contains financial information regarding the State Treasurer’s Common Cash Fund; Investment Portfolios and Revenues; Michigan’s General Obligation Debt, Bond, and Note Payments; as well as State Administered Tax Revenues collected during FY 2016.
Sincerely,
N.A. Khouri State Treasurer
RICHARD H. AuSTIN BuILDING PO B Ox 30716 L ANSING, MICHIGAN 48909 www.michigan.gov/treasury 517-373-3223

Schedule 1State Treasurer’s Common Cash - Assets and Equities (In Thousands of Dollars)
Fiscal Year ended September 30 2016 2015 Assets Demand Deposits $ 1,384,012 $ 1,310,652 Prime Commercial Paper - At Cost 3,942,681 3,541,989 emergency Municipal Loans 293,431 139,846 Total $ 5,620,124 $ 4,992,487
equities Available equity of Other Funds $ 5,488,675 $ 4,915,314 Outstanding Warrants 131,449 77,173 Total $ 5,620,124 $ 4,992,487
2
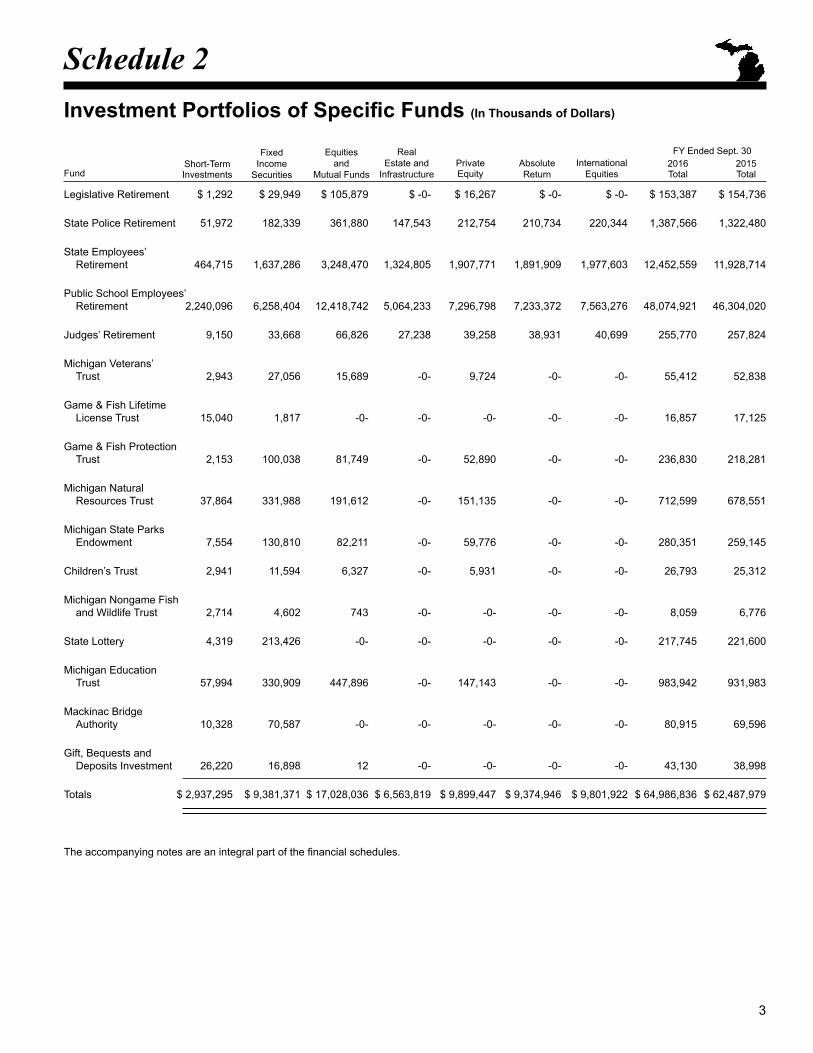
Schedule 2Investment Portfolios of Specific Funds (In Thousands of Dollars)
Fixed equities Real FY ended Sept. 30Short-Term Income and estate and Private Absolute International 2016 2015
Fund Investments Securities Mutual Funds Infrastructure equity Return equities Total Total
Legislative Retirement $ 1,292 $ 29,949 $ 105,879 $ -0- $ 16,267 $ -0- $ -0- $ 153,387 $ 154,736
State Police Retirement 51,972 182,339 361,880 147,543 212,754 210,734 220,344 1,387,566 1,322,480
State employees’ Retirement 464,715 1,637,286 3,248,470 1,324,805 1,907,771 1,891,909 1,977,603 12,452,559 11,928,714
Public School employees’ Retirement 2,240,096 6,258,404 12,418,742 5,064,233 7,296,798 7,233,372 7,563,276 48,074,921 46,304,020
Judges’ Retirement 9,150 33,668 66,826 27,238 39,258 38,931 40,699 255,770 257,824
Michigan Veterans’ Trust 2,943 27,056 15,689 -0- 9,724 -0- -0- 55,412 52,838
Game & Fish Lifetime License Trust 15,040 1,817 -0- -0- -0- -0- -0- 16,857 17,125
Game & Fish Protection Trust 2,153 100,038 81,749 -0- 52,890 -0- -0- 236,830 218,281
Michigan Natural Resources Trust 37,864 331,988 191,612 -0- 151,135 -0- -0- 712,599 678,551
Michigan State Parks endowment 7,554 130,810 82,211 -0- 59,776 -0- -0- 280,351 259,145
Children’s Trust 2,941 11,594 6,327 -0- 5,931 -0- -0- 26,793 25,312
Michigan Nongame Fish and Wildlife Trust 2,714 4,602 743 -0- -0- -0- -0- 8,059 6,776
State Lottery 4,319 213,426 -0- -0- -0- -0- -0- 217,745 221,600
Michigan education Trust 57,994 330,909 447,896 -0- 147,143 -0- -0- 983,942 931,983
Mackinac Bridge Authority 10,328 70,587 -0- -0- -0- -0- -0- 80,915 69,596
Gift, Bequests and Deposits Investment 26,220 16,898 12 -0- -0- -0- -0- 43,130 38,998
Totals $ 2,937,295 $ 9,381,371 $ 17,028,036 $ 6,563,819 $ 9,899,447 $ 9,374,946 $ 9,801,922 $ 64,986,836 $ 62,487,979
The accompanying notes are an integral part of the financial schedules.
3

Schedule 3Investment Revenues (In Thousands of Dollars)
Total Revenues
Fiscal Year ended Common Specific September 30Fund Cash Funds 2016 2015
General $ 1,124 $ -0- $ 1,124 $ 620Game and Fish Lifetime License Trust 22 104 126 45State Aeronautics 7 -0- 7 7Michigan Veterans’ Benefit Trust 6 4,332 4,338 1,403State Trunkline 2,259 -0- 2,259 647 Michigan State Waterways 81 -0- 81 22 Blue Water Bridge 208 -0- 208 71 Michigan Transportation 467 -0- 467 143 Comprehensive Transportation 169 -0- 169 54 School Aid 618 -0- 618 478 Game and Fish Protection Trust 23 20,365 20,388 3,937 State Park Improvement 93 -0- 93 21 Forest Development 80 -0- 80 18 Michigan Natural Resources Trust 147 56,587 56,734 13,805 Michigan State Parks endowment 76 21,998 22,074 4,285 Safety education and Training 10 -0- 10 4 Bottle Deposits 126 -0- 126 42 State Construction Code 17 -0- 17 2 Children’s Trust 4 2,016 2,020 614 Homeowner Construction Lien Recovery 1 -0- 1 -0- Michigan Nongame Fish and Wildlife 7 378 385 94 21st Century Jobs Trust 1,117 -0- 1,117 366 Michigan Merit Award Trust 181 -0- 181 102 State Trunkline Bond Proceeds 110 -0- 110 57 Comprehensive Transportation Bond Proceeds 28 -0- 28 11 Outdoor Recreation Legacy 6 -0- 6 1 Off-Road Vehicle 31 -0- 31 8 Snowmobile 32 -0- 32 9 Michigan Settlement Administration Auth -0- -0- -0- 66 unemployment Obligation Trust 60 -0- 60 17 Liquor Purchasing Revolving 402 -0- 402 110 State Lottery 283 13,518 13,801 13,009
4

Schedule 3Continued. . . (In Thousands of Dollars)
Total Revenues
Fiscal Year ended Common Specific September 30Fund Cash Funds 2016 2015
Michigan Strategic $ 214 $ -0- $ 214 $ 91 Michigan State Housing Development 14 -0- 14 11 Land Bank Fast Track 31 -0- 31 4 Jobs For Michigan Investment 414 -0- 414 120 State Sponsored Group Insurance 990 -0- 990 283 State Water Pollution Control Loan 7 -0- 7 1 School Loan Revolving 3,299 -0- 3,299 349 Combined State Trunkline Bond and Interest Redemption 13 -0- 13 1 Combined Comprehensive Transportation Bond and Interest Redemption (1) -0- (1) -0- Recreation & environmental Protection Bond 3 -0- 3 1 Legislative Retirement 6 13,673 13,679 (6,943)State Police Retirement 5 102,764 102,769 31,483 State employees’ Retirement -0- 924,720 924,720 286,039 Public School employees’ Retirement 214 3,541,405 3,541,618 1,127,098 Judges’ Retirement 3 19,339 19,342 6,641 Military Retirement Pension Fund 11 -0- 11 -0- Michigan employment Security Act Contingent 452 -0- 452 91 Military Family Relief 8 -0- 8 3 Intrastate Switched Toll Restruct. 3 -0- 3 1 Gifts, Bequests, and Deposits Investment 124 781 906 846 Silicosis, Dust Disease, and Logging Industry Compensation 4 -0- 4 1 Second Injury 32 -0- 32 10 Self-Insurers’ Security 106 -0- 106 33 State employees’ Deferred Compensation I (457) -0- -0- -0- -0- State employees’ Deferred Compensation II (401 (k)) 1 -0- 1 -0- State of Michigan MPSeRS DC 457 10 -0- 10 4 environmental Quality Deposits 9 -0- 9 4 utility Consumer Representation 5 -0- 5 2 Transportation Related Trust (40) -0- (40) (8)MPSeRS DC 401K 2 -0- 2 -0- Mackinac Bridge Authority -0- 2,282 2,282 2,454 Michigan education Trust -0- 88,630 88,630 2,577 TOTALS $ 13,734 $4,812,894 $4,826,628 $1,491,263
The accompanying notes are an integral part of the financial schedules.
5

Notes to Financial SchedulesNOTE 1: SIGNIFICANT ACCOUNTING POLICIESa. Report Presentation The accompanying financial schedules report the assets and equities of the State Treasurer’s common cash
(Schedule 1), investment portfolios of specific funds (Schedule 2), and investment revenues of the common cash and specific funds (Schedule 3).
The State Treasurer’s common cash and specific funds are accounted for in various funds of the State of Michigan and reported in the State of Michigan Comprehensive Annual Financial Report.
The State of Michigan Comprehensive Annual Financial Report provides more extensive general disclosures regarding the State Treasurer’s common cash and deposits and investments. These disclosures provide information regarding market values and risk levels of the deposits and investments.
Common Cash Pool. The State Treasurer, under the authority provided by State statute, manages the State’s common cash pool. The pooling of cash allows the State Treasurer to invest money not needed to pay immediate obligations so that investment earnings on available cash are maximized. Pool investments are not segregated by fund; rather, each contributing fund’s balance is treated as equity in the common cash pool.
Investments. The State Treasurer, under authority provided by State statutes, manages most investments for the State of Michigan.
Short-Term Investments: This category includes each of the listed fund’s individually held short-term investments by classification, the fund’s equity in the State Treasurer’s common cash pool, and receivables and payables pertaining to security trades not yet settled at fiscal year-end.
Alternative Investments: These investments consist of limited partnerships.
Derivatives: Derivatives are financial instruments whose value is derived from, or based on, an underlying security, asset, reference rate, or index. The State Treasurer only uses derivatives securities or related contractual agreements to hedge assets held or to replicate asset returns. Derivatives are not used for speculation or to leverage the investment portfolios.
The State Treasurer invests in derivatives as detailed below:
• Fixed Income Investments (Derivatives - Future Contracts): u.S.Treasury Bond Future Contracts are investments to manage duration and yield curve exposure. On September 30, 2016 and 2015, future contracts represent less than 0.1 percent of the fixed income investment category and less than 0.1 percent of the total pension trust funds.
• Domestic Equity Investments (Derivatives - Option Contracts): Option Contracts are investments on single securities to provide downside protection and enhance current income. On September 30, 2016 and 2015, option contracts represent less than 0.1 percent of the domestic equity investment category of the pension trust funds.
• International Equity Investments (Derivatives - Swaps): International equity investments swap agreements are investments tied to stock market indices in approximately 42 foreign countries and are the core of the international equity market investment strategy. On September 30, 2016 and 2015, the swap agreements represented 11.5 percent and 13.5 percent of the international equity investment category, respectively.
• Domestic Equity Investments (Derivatives - Swaps): Domestic equity swap agreements are investments tied to u.S. Stock indices. On September 30, 2016 and 2015, these swap agreements represent 0.03 percent and 0.2 percent of the domestic equity investment category, respectively.
The swap contractual agreements are made with large global banks and brokerage firms. On September 30, 2016 and 2015, they represent 1.8 percent and 1.8 percent of the total pension trust funds, respectively.Separately issued financial reports including financial statements and required supplementary information are issued for the pension trust funds. These provide more extensive disclosure for derivatives.
6

b. Basis of Accounting Schedule 1, State Treasurer’s Common Cash - Assets and Equities, is presented on the cash basis of accounting.
(The State of Michigan Comprehensive Annual Financial Report’s disclosure regarding the State Treasurer’s common cash includes $2.0 million in interest receivable, because it is presented on the modified accrual basis of accounting.) Schedule 2, Investment Portfolios of Specific Funds, and Schedule 3, Investment Revenues, are reported on the accrual basis of accounting.
These financial schedules are not intended to constitute a complete financial presentation of either the Department of Treasury or the State’s General Fund in accordance with accounting principles generally accepted in the united States of America.
c. Valuations of Investments Schedule 1. All investments are reported at cost. Demand deposits represent the account balance reported on bank statements and include deposits which are in
the process of being collected through the banking system. The market value of prime commercial paper and time deposits - regular at September 30, 2016 and 2015, was
$3,943.8 and $3,542.3 million, respectively. Schedule 2. Methods used to value investments. All investments are reported at fair value. Securities traded on a national exchange are valued at last reported
sales price. Investments that do not have an established market are reported at estimated fair value.d. Securities Lending Transactions under the authority of Act No. 314 of the Public Acts of 1965, the State lends securities to broker-dealers and other
entities for collateral that will be returned for the same securities in the future. The State’s third-party agent, Credit Suisse, manages the securities lending program and receives cash collateral. The agent is not liable for any losses on the management of the cash collateral portfolio unless there is negligence or willful misconduct on its part. The collateral cash cannot be pledged or sold by the State and the State receives cash collateral in the amount of at least 100 percent of the market value of the securities lent. The types of securities lent are government securities, corporate bonds, and equities. There is no restriction on the amount of securities lent. Because the loans were terminable at will, their duration did not generally match the duration of the investments made with cash collateral. At September 30, 2016 and 2015, the State had no outstanding credit risk on the securities lent. The market value of the securities lent at September 30, 2016 and 2015, was $4,248.4 and $3,468.2 million, respectively. The amortized cost of the securities lending cash collateral pool at September 30, 2016 and 2015, was $4,319.2 and $3,526.2 million respectively. The market value of securities lending cash collateral pool at September 30, 2016 and 2015, was $4,325.1 and $3,526.7 million respectively.
NOTE 2: CHANGE IN REPORTING OF FUNDS Effective for FY ended September 30, 2016:
Funds added to Schedule 3: Homeowner Construction Lien Recovery; Military Retirement; and MPSeRS DC 401K.
Effective for FY ended September 30, 2015:No funds were added or removed.
7

Cash and InvestmentsThe State Treasurer manages the State’s cash so funds Manageable common cash includes the following funds:not needed to pay immediate obligations are invested to earn income. Investments include time certificates • General • Special Revenue and enterpriseof deposit and prime commercial paper as detailed in • School Aid • Internal ServiceSchedule 1, State Treasurer’s Common Cash - Assets • Budget Stabilization • Trust and Agencyand Equities.
The State Treasurer is authorized to transfer cash on Statutes also allow the State Treasurer to loan funds hand and on deposit among the various funds in the State from the common cash pool to financially troubled Treasury, except funds established to pay debts service on municipalities in Michigan. notes and bonds, in such a manner as to best manage the The common cash fund pools the cash balances of available cash, maximize short-term investment earnings, certain State funds until paid as provided by law. and ensure State obligations are paid when due.
Table 1Investment Revenues for Fiscal Years (In Thousands of Dollars)
General Fund PublicCommon Cash School State State Other
earnings employees’ employees’ Police Judges’ Investment (expenses)(a) Retirement Retirement Retirement Retirement Funds Totals
2016 $ 1,124 $ 3,541,618 $ 924,720 $ 102,769 $ 19,342 $ 237,055 $ 4,826,6282015 620 1,127,098 286,039 31,483 6,641 39,382 1,491,263 2014 530 6,682,047 1,679,814 186,612 38,064 206,705 8,793,7722013 239 5,159,840 1,265,073 142,161 31,685 147,249 6,746,2452012 (1,297) 5,735,829 1,379,714 155,136 35,594 281,462 7,586,4382011 (722) 1,594,584 404,603 45,826 10,786 64,950 2,120,0272010 (3,758) 3,846,693 927,685 104,319 22,723 176,040 5,073,7022009 (3,076) (2,591,269) (652,076) (74,793) (20,709) 129,566 (3,212,357)2008 (17,012) (7,360,810) (1,819,798) (200,062) (47,948) 9,025 (9,436,605)2007 (25,140) 7,293,036 1,819,563 203,509 50,121 249,852 9,590,941
(a) See the table below for the annual total of earnings and distributions resulting in General Fund Common Cash earnings (expenses).
Distribution of earnings to Retirement General Fund Fiscal Year Total State Treasurer’s and Other Funds Common Cash ending Common Cash Fund earnings Reported in Their earnings earnings (expenses)
2016 $13,734 $12,610 $1,124 2015 4,142 3,522 6202014 3,119 2,589 5302013 3,660 3,421 2392012 2,246 3,543 (1,297)2011 3,663 4,385 (722)2010 2,901 6,659 (3,758)2009 22,189 25,265 (3,076)2008 68,893 85,905 (17,012)2007 80,107 105,247 (25,140)
8

Table 2Available Month-End Common Cash (In Millions of Dollars)
Combined General Fund Manageable Total & School Other Common Retirement Bond CommonMonth Aid Fund (a) Funds Cash (b) Funds Funds (c)(d) Cash October 2015 1,863.6 3,306.0 5,169.7 118.8 196.8 5,485.3 November 1,511.3 3,328.6 4,840.0 187.4 185.6 5,213.0 December 1,266.0 3,244.0 4,510.0 208.2 57.6 4,775.8 January 2016 1,670.8 3,405.1 5,075.8 345.6 57.7 5,479.1 February 868.4 3,425.7 4,294.1 153.2 57.8 4,505.1 March 444.4 3,628.6 4,073.0 151.0 39.6 4,263.7 April 262.6 3,992.8 4,255.4 160.6 82.7 4,498.7 May (7.5) 3,781.2 3,773.7 169.1 46.8 3,989.6 June (309.9) 3,815.9 3,506.0 233.0 39.2 3,778.2 July (83.4) 3,986.7 3,903.3 362.6 39.4 4,305.3 August (300.1) 3,910.9 3,610.8 168.6 39.6 3,819.0September 1,304.5 3,883.9 5,180.6 246.5 53.7 5,488.7
(a) In accordance with Governmental Accounting Standards Board (GASB) Statement No. 54 Fund Balance Reporting and Governmental Fund Type Definition the Budget Stabilization Fund is a committed subfund of the General Fund.
(b) Manageable Common Cash Includes the General, School Aid, Budget Stabilization, Special Revenue, enterprise, Internal Service, Trust, and Agency Funds.
(c) Includes Debt Service and Bond Funds. (d) In accordance with Governmental Accounting Standards Board (GASB) Statement No. 54 Fund Balance Reporting and Governmental
Fund Type Definition the School Bond Loan Fund, Environmental Protection Bond Fund, and the Clean Michigan Initiative Bond Fund – environmental Projects and the Great Lakes Water Quality Bond Fund are restricted subfunds of the General Fund.
Table 3Common Cash History (In Millions of Dollars)
Combined General Fund Budget Manageable Total and School Stabilization Other Common Retirement Bond CommonFiscal Year ended Aid Fund Fund (a) Funds Cash (b) Funds Funds (c) Cash
September 2007 (1,004.4) 2.1 2,396.9 1,394.6 133.7 423.4 1,951.7September 2008 (616.6) 2.2 2,088.7 1,474.3 822.0 154.6 2,450.9September 2009 (762.3) 2.2 1,843.8 1,083.7 138.7 317.4 1,539.8September 2010 (373.7) 2.2 1,742.1 1,370.6 85.5 151.4 1,607.5September 2011 1,025.1 2.2 2,109.5 3,136.8 244.5 109.9 (d) 3,491.2September 2012 1,274.6 365.1 2,470.2 4,109.9 262.7 135.5 (d) 4,508.1September 2013 1,586.5 505.6 2,727.2 4,819.3 521.2 82.3 (d) 5,422.8September 2014 978.4 386.2 3,036.2 4,400.9 400.9 41.3 (d) 4,843.1September 2015 818.8 498.1 3,395.3 4,712.3 177.7 32.5 (d) 4,922.4September 2016 692.1 612.4 3,883.9 5,180.6 246.5 53.7 (d) 5,488.7
(a) The State implemented Governmental Accounting Standards Board (GASB) Statement No. 54 Fund Balance Reporting and Governmental Fund Type Definition during fiscal year 2011. As a result, the Budget Stabilization Fund was reclassified as a subfund of the General Fund.
(b) Manageable Common Cash Includes the General, School Aid, Budget Stabilization, Special Revenue, enterprise, Internal Service, Trust, and Agency Funds.
(c) Includes Debt Service and Bond Funds.
(d) During fiscal year 2011, the State implemented Governmental Accounting Standards Board (GASB) Statement No. 54 Fund Balance Reporting and Governmental Fund Type Definition. As a result, the School Bond Loan Fund, Environmental Protection Bond Fund, the Clean Michigan Initiative Bond Fund – Environmental Projects and the Great Lakes Water Quality Bond Fund were reclassified and are accounted for as restricted subfunds of the General Fund.
9
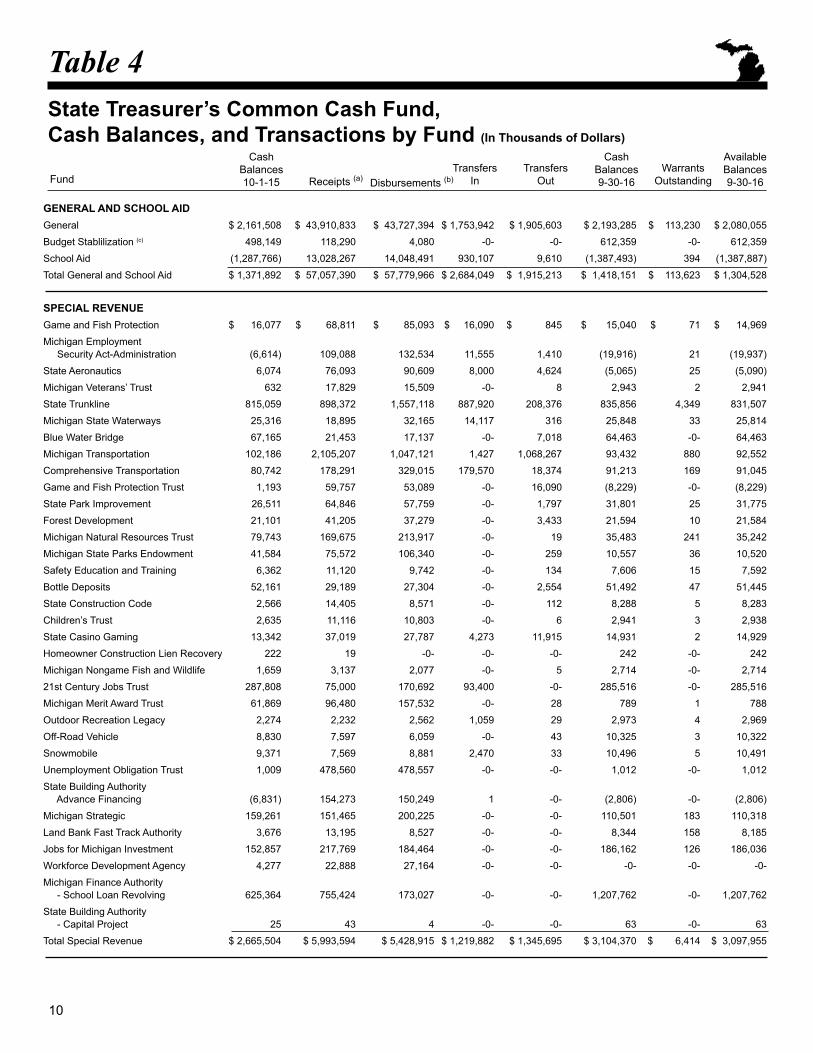
Table 4State Treasurer’s Common Cash Fund,Cash Balances, and Transactions by Fund (In Thousands of Dollars)
Cash Cash AvailableBalances Transfers Transfers Balances Warrants Balances
Fund 10-1-15 Receipts (a) Disbursements (b) In Out 9-30-16 Outstanding 9-30-16
GENERAL AND SCHOOL AID
General $ 2,161,508 $ 43,910,833 $ 43,727,394 $ 1,753,942 $ 1,905,603 $ 2,193,285 $ 113,230 $ 2,080,055
Budget Stablilization (c) 498,149 118,290 4,080 -0- -0- 612,359 -0- 612,359
School Aid (1,287,766) 13,028,267 14,048,491 930,107 9,610 (1,387,493) 394 (1,387,887)
Total General and School Aid $ 1,371,892 $ 57,057,390 $ 57,779,966 $ 2,684,049 $ 1,915,213 $ 1,418,151 $ 113,623 $ 1,304,528
SPECIAL REVENUE
Game and Fish Protection $ 16,077 $ 68,811 $ 85,093 $ 16,090 $ 845 $ 15,040 $ 71 $ 14,969
Michigan employment Security Act-Administration (6,614) 109,088 132,534 11,555 1,410 (19,916) 21 (19,937)
State Aeronautics 6,074 76,093 90,609 8,000 4,624 (5,065) 25 (5,090)
Michigan Veterans’ Trust 632 17,829 15,509 -0- 8 2,943 2 2,941
State Trunkline 815,059 898,372 1,557,118 887,920 208,376 835,856 4,349 831,507
Michigan State Waterways 25,316 18,895 32,165 14,117 316 25,848 33 25,814
Blue Water Bridge 67,165 21,453 17,137 -0- 7,018 64,463 -0- 64,463
Michigan Transportation 102,186 2,105,207 1,047,121 1,427 1,068,267 93,432 880 92,552
Comprehensive Transportation 80,742 178,291 329,015 179,570 18,374 91,213 169 91,045
Game and Fish Protection Trust 1,193 59,757 53,089 -0- 16,090 (8,229) -0- (8,229)
State Park Improvement 26,511 64,846 57,759 -0- 1,797 31,801 25 31,775
Forest Development 21,101 41,205 37,279 -0- 3,433 21,594 10 21,584
Michigan Natural Resources Trust 79,743 169,675 213,917 -0- 19 35,483 241 35,242
Michigan State Parks endowment 41,584 75,572 106,340 -0- 259 10,557 36 10,520
Safety education and Training 6,362 11,120 9,742 -0- 134 7,606 15 7,592
Bottle Deposits 52,161 29,189 27,304 -0- 2,554 51,492 47 51,445
State Construction Code 2,566 14,405 8,571 -0- 112 8,288 5 8,283
Children’s Trust 2,635 11,116 10,803 -0- 6 2,941 3 2,938
State Casino Gaming 13,342 37,019 27,787 4,273 11,915 14,931 2 14,929
Homeowner Construction Lien Recovery 222 19 -0- -0- -0- 242 -0- 242
Michigan Nongame Fish and Wildlife 1,659 3,137 2,077 -0- 5 2,714 -0- 2,714
21st Century Jobs Trust 287,808 75,000 170,692 93,400 -0- 285,516 -0- 285,516
Michigan Merit Award Trust 61,869 96,480 157,532 -0- 28 789 1 788
Outdoor Recreation Legacy 2,274 2,232 2,562 1,059 29 2,973 4 2,969
Off-Road Vehicle 8,830 7,597 6,059 -0- 43 10,325 3 10,322
Snowmobile 9,371 7,569 8,881 2,470 33 10,496 5 10,491
unemployment Obligation Trust 1,009 478,560 478,557 -0- -0- 1,012 -0- 1,012
State Building Authority Advance Financing (6,831) 154,273 150,249 1 -0- (2,806) -0- (2,806)
Michigan Strategic 159,261 151,465 200,225 -0- -0- 110,501 183 110,318
Land Bank Fast Track Authority 3,676 13,195 8,527 -0- -0- 8,344 158 8,185
Jobs for Michigan Investment 152,857 217,769 184,464 -0- -0- 186,162 126 186,036
Workforce Development Agency 4,277 22,888 27,164 -0- -0- -0- -0- -0-
Michigan Finance Authority - School Loan Revolving 625,364 755,424 173,027 -0- -0- 1,207,762 -0- 1,207,762
State Building Authority - Capital Project 25 43 4 -0- -0- 63 -0- 63
Total Special Revenue $ 2,665,504 $ 5,993,594 $ 5,428,915 $ 1,219,882 $ 1,345,695 $ 3,104,370 $ 6,414 $ 3,097,955
10

Table 4Continued... (In Thousands of Dollars)
Cash Cash AvailableBalances Transfers Transfers Balances Warrants Balances
Fund 10-1-15 Receipts (a) Disbursements (b) In Out 9-30-16 Outstanding 9-30-16
BOND AND DEBT SERVICE
Clean Michigan Initiative Bond - Local Projects $ 82 $ -0- $ 55 $ -0- $ -0- $ 28 $ -0- $ 28
1994 State Trunkline Bond Proceeds (1) 1 -0- -0- -0- 0 -0- 0
State Trunkline Bond Proceeds 20,390 65,778 7,477 2 34,852 43,841 -0- 43,841
Build Michigan II - GARVee Note Proceeds -0- -0- -0- -0- -0- -0- -0- -0-
Comprehensive Transportation Bond Proceeds 9,994 44 2,128 -0- -0- 7,911 -0- 7,911
Combined State Trunkline Bond and Interest Redemption -0- 67,093 271,659 204,571 -0- 5 2 3
Combined Comprehensive Transportation Bond and Interest Redemption 25 -0- 22,579 22,716 -0- 162 -0- 162
Recreation and environmental Protection Bond Redemption 2,019 692 150,598 149,630 -0- 1,743 -0- 1,743
School Loan Bond Redemption -0- 264 126,356 126,105 -0- 14 -0- 14
State Building Authority - Debt Service -0- -0- -0- -0- -0- -0- -0- -0-
Total Bond and Debt Service $ 32,510 $ 133,872 $ 580,851 $ 503,025 $ 34,852 $ 53,703 $ 2 $ 53,701
ENTERPRISE
Liquor Purchasing Revolving $ 77,362 $ 1,077,902 $ 865,029 $ -0- $ 209,756 $ 80,479 $ 1,168 $ 79,311
State Lottery 4,545 1,605,922 724,148 -0- 882,000 4,319 660 3,659
Michigan State Housing Development Authority -0- 63,778 62,199 -0- -0- 1,578 2 1,577
Michigan Finance Authority - State Water Revolving 45 172,982 172,961 -0- -0- 66 -0- 66
Total enterprise $ 81,953 $ 2,920,584 $ 1,824,338 $ -0- $ 1,091,756 $ 86,443 $ 1,830 $ 84,613
INTERNAL SERVICE
Correctional Industries Revolving (4,102) 17,178 15,022 -0- 119 (2,065) 6 (2,071)
Motor Transport 9,237 66,700 66,524 -0- 68 9,345 2 9,343
Office Services Revolving 9,895 160,597 155,061 -0- 204 15,227 4 15,223
Information Technology 14,407 827,652 834,659 -0- 7,179 222 572 (350)
Risk Management 13,349 27,071 27,418 -0- 31 12,971 -0- 12,971
State Sponsored Group Insurance 300,118 715,032 693,880 -0- -0- 321,270 7 321,263
Total Internal Service 342,904 1,814,231 1,792,564 -0- 7,600 356,971 591 356,380
11

Table 4Concluded... (In Thousands of Dollars)
Cash Cash AvailableBalances Transfers Transfers Balances Warrants Balances
Fund 10-1-15 Receipts (a) Disbursements (b) In Out 9-30-16 Outstanding 9-30-16
RETIREMENT
Legislative $ 1,185 $ 54,883 $ 54,865 $ -0- $ -0- $ 1,202 $ 3 $ 1,200
State Police 4,666 563,741 557,580 -0- 2 10,824 309 10,515
State employees’ 5,396 5,855,963 5,787,484 -0- 34 73,842 53 73,788
Public School employees’ 163,640 19,404,263 19,412,059 -0- 194 155,650 373 155,278
Judges’ 3,471 98,928 100,365 -0- -0- 2,034 -0- 2,034
Military -0- 6,847 3,129 -0- -0- 3,718 -0- 3,718
Total Retirement $ 178,357 $ 25,984,625 $ 25,915,481 $ -0- $ 230 $ 247,271 $ 738 $ 246,532
TRUST AND AGENCY
Michigan employment Security Act Contingent $ 110,508 $ 60,976 $ 11 $ -0- $ 11,555 $ 159,917 $ -0- $ 159,917
Military Family Relief 2,461 77 193 -0- -0- 2,345 3 2,342
IntraState Switched Toll Restructuring (142) 18,187 15,029 -0- 8 3,007 219 2,788
Children’s Institute Trust 103 -0- -0- -0- -0- 103 -0- 103
Abandoned and unclaimed Property (escheats) 132,447 164,697 183,431 -0- -0- 113,713 6,030 107,683
Gifts, Bequests and Deposits Investment 19,113 103,384 96,276 -0- -0- 26,220 277 25,944
Silicosis, Dust Disease, and Logging Industry Compensation 1,803 1,100 1,622 -0- 5 1,277 30 1,247
Second Injury 13,563 8,315 10,752 -0- 22 11,105 180 10,925
Hospital Patients 118 645 636 -0- -0- 128 8 119
Self-Insurers’ Security 32,171 9,744 8,513 -0- 13 33,389 391 32,998
State employees’ Deferred Comp. I (457) 388 42,397 42,765 -0- -0- 19 -0- 19
State employees’ Deferred Comp. II (401K) 425 47,351 47,484 -0- -0- 292 -0- 292
State of Michigan MPSeRS DC 457 4,801 92,381 94,755 -0- -0- 2,427 -0- 2,427
State Employees’ Defined Contribution Plan 201 284,672 284,616 -0- -0- 257 -0- 257
Special Assessment Deferment 2,495 176 4 -0- -0- 2,667 -0- 2,667
environmental Quality Deposits 2,737 18 67 -0- -0- 2,689 -0- 2,689
Insurance Carrier Deposits 395 50,556 47,756 -0- -0- 3,194 -0- 3,194
utility Consumer Representation 1,498 1,666 1,290 -0- 5 1,869 -0- 1,869
Transportation Related (8,714) 311,042 328,112 -0- -0- (25,784) 73 (25,857)
State of Michigan MPSeRS DC 401K 1,362 676 343 -0- -0- 1,695 -0- 1,695
State of Michigan Personal Health Care 140 4,085 4,211 -0- -0- 15 -0- 15
City Income Tax -0- 8,790 -0- -0- -0- 8,790 985 7,805
Social Welfare 1,482 13,554 11,156 -0- -0- 3,880 54 3,826
Total Trust and Agency $ 319,355 $ 1,224,489 $ 1,179,020 $ -0- $ 11,609 $ 353,215 $ 8,250 $ 344,965
GRAND TOTALS $ 4,992,474 $ 95,128,784 $ 94,501,135 $ 4,406,955 $ 4,406,955 $ 5,620,123 $ 131,449 $ 5,488,675
(a) Receipts include $16,904.3 million of securities sold and matured.
(b) Disbursements include $18,446.8 million of securities purchased.
(c) In accordance with Governmental Accounting Standards Board (GASB) Statement No. 54 Fund Balance Reporting and Governmental Fund Type Definition, the Budget Stabilization Fund is a committed subfund of the General Fund.
12

Table 5Demand Depositories as of September 30, 2016 (In Thousands of Dollars)
City Depository Bank Deposits (a) City Depository Bank Deposits (a)
Adrian First Federal Bank $ 161 Iron Mountain First National Bank of Iron Mountain 59
Lansing Bank of America-Credit Card 0 Baldwin Lake Osceola State Bank 8 Bank of America-Main Account 4,462
Cheboygan Citizens National Bank 82Lapeer Lapeer County Bank and Trust 100
Chelsea Chelsea State Bank 98Manistique mBank 568
Coldwater Century Bank and Trust 138 Southern Michigan National Bank 134
Marquette Wells Fargo Bank, Michigan 18,631 Croswell eastern Michigan Bank 187
Mason Mason State Bank 5,108 Crystal Falls First National Bank 32
Midland Chemical Bank and Trust 3,536 Detroit JPMorgan Chase-Income Tax 0
Monroe Monroe Bank and Trust 1,001 JPMorgan Chase-Main Acct. 1,323,378 Comerica Bank - Detroit 7,023 Munising Peoples State Bank of Munising 51 Comerica Bank - ACH Service 0
Newberry Tahquamenon Area Credit union 15 east Tawas Huron Community Bank 52 Norway First National Bank 5 escanaba upper Peninsula State Bank 59Ontonagon Citizens State Bank 29
ewen State Bank of ewen 22 Port Austin Port Austin State Bank 4
Flint FirstMerit Bank 12,381 St. Charles Community State Bank 49
Gladstone First Bank upper Michigan 19 St. Ignace First National Bank 32 Grand Rapids Fifth Third Bank 3,973
Sault Ste. Marie Central Savings Bank 37 Hancock Superior National Bank and Trust 88 Soo Co-Op Credit union 2
Hillsdale Hillsdale County National Bank 47 Shelby Shelby State Bank 138
Honor The Honor State Bank 31 Stockbridge SSBBank 3
Ionia Independent Bank 208 Wakefield First National Bank 101 First Bank, West Michigan 101
Zeeland Huntington National Bank 1,861
Total $ 1,384,014
(a) Deposits represent the account balance reported on bank statements and include deposits which are in the process of being collected through the banking system. Deposits are rounded to the nearest thousand and are secured by $2,185,439,000 of collateral.
13

Bonds and NotesThe Michigan Constitution limits State general obligation debt to (1) short-term debt for State operating purposes, (2) short- and long-term debt for the purpose of making loans to school districts, and (3) long-term debt for voter-approved purposes.
Short-term debt for operating purposes is limited to an amount not in excess of 15 percent of undedicated revenues received during the preceding fiscal year (FY). Under the Michigan Constitution, as implemented by statutory provisions, such debt must be authorized by the State Administrative Board and issued only to meet obligations incurred pursuant to appropriation and must be repaid during the FY in which it was incurred. Such debt does not require voter approval.
The amount of debt incurred by the State for the purpose of making loans to school districts is recommended by the State Treasurer, who certifies the amounts necessary for loans to school districts semiannually. The bonds may be issued in whatever amount is required without voter approval. All other general obligation bonds issued by the State must be approved as to amount, purpose, and method of payment by a two-thirds vote of each house of the Legislature and by a majority vote of the public at a general election.
There is no limitation as to number or size of such general obligation issues.
General Obligation DebtAll current general obligation bond and note issues are presented in Table 6, General Obligation Debt, Bond, and Note Payments. During FY 2016, the State issued $82.2 million in debt to fund the Great Lakes Water Quality program. The State also issued $189 million to refund existing debt.
Special Authority Revenue Bond DebtCertain governmental authorities issue revenue bonds for construction projects and to acquire or build facilities for the State or its institutions of higher learning. These bonds, as shown in Table 7, Special Authority Revenue Bond Debt, are obligations of the individual authorities and are not a general obligation of the State.
Special Revenue DebtThe State periodically issues long-term bonds for specific purposes, as presented in Table 10, Special Revenue Debt, Bond, and Note Payments. These issues are not supported by the State’s general credit, and their financing comes strictly from the designated revenue sources.
14

Table 6General Obligation Debt, Bond, and Note Payments (In Thousands of Dollars)
OutstandingIssue Maturity New Refunded Principal Interest Principal as of
Item Date Dates Issues Principal Payments Payments 9-30-16School Bond Loan(a) Series 2001 (Refunding) 2001 2002-2016 $ -0- $ -0- $ 14,130 $ 389 $ -0- Series 2002 (Refunding) 2002 2003-2015 -0- -0- 7,525 207 -0- Series 2008A (Refunding) 2008 2012-2023 -0- 116,035 -0- 5,904 -0- * Series 2009A 2009 2015-2020 -0- -0- 6,895 6,637 96,830 Series 2009A (Refunding) 2009 2015-2020 -0- -0- 6,670 6,421 93,685 Series 2009B (Refunding) 2009 2010-2030 -0- -0- 4,877 2,473 20,902 Series 2010B (Refunding) 2010 2016-2020 -0- -0- -0- 1,623 43,460 Series 2010B 2010 2016-2020 -0- -0- -0- 1,507 40,365 Series 2011A 2011 2014-2023 -0- -0- 24,600 4,812 95,200 Series 2011B 2011 2022 -0- -0- -0- 1,114 30,110 Series 2012A (Refunding) 2012 2013-2026 -0- -0- 5,072 1,332 41,760 Series 2012A 2012 2013-2026 -0- -0- 13,663 3,587 112,485 Series 2013A 2013 2024-2033 -0- -0- -0- 6,668 200,000 Series 2016A (Refunding) 2016 2017-2023 129,085 -0- -0- -0- 129,085 environmental Protection(b) Series 2001 (Refunding) 2001 2002-2016 -0- -0- 13,450 370 -0- Series 2002 (Refunding) 2002 2004-2015 -0- -0- 7,475 206 -0- Series 2005B (Refunding) 2005 2013-2016 -0- -0- 24,600 615 -0- Series 2006A 2006 2014-2026 -0- -0- 1,570 79 -0- * Series 2008A (Refunding) 2008 2011-2019 -0- -0- 4,712 3,037 38,617 Series 2010A (Refunding) 2010 2012-2020 -0- -0- 823 295 5,900 Series 2010B (Refunding) 2010 2013-2015 -0- -0- 14,279 215 -0- Series 2012 (Refunding) 2012 2016-2020 -0- -0- -0- 1,227 27,359 Series 2015A (Refunding) 2015 2017-2026 -0- -0- -0- 883 26,063 Recreation(c) Series 2010B (Refunding) 2010 2013-2015 -0- -0- 1,190 5 -0- Clean Michigan Initiative(d) Series 2002 (Refunding) 2002 2004-2016 -0- -0- 12,000 1,403 19,500 Series 2006A 2006 2014-2026 -0- -0- 5,030 252 -0- * Series 2008A 2008 2011-2019 -0- -0- 1,735 374 5,745 Series 2008A (Refunding) 2008 2011-2019 -0- -0- 9,568 3,494 78,403 Series 2008B 2008 2011-2019 -0- -0- 863 184 2,843 Series 2009A 2009 2022-2026 -0- 46,355 -0- 2,620 -0- * Series 2010A (Refunding) 2010 2012-2020 -0- -0- 3,507 1,259 25,151 Series 2010B (Refunding) 2010 2013-2015 -0- -0- 8,825 95 -0- Series 2010B 2010 2013-2015 -0- -0- 3,623 46 -0- Series 2011A 2011 2021-2025 -0- -0- -0- 369 9,617 Series 2011B 2011 2013-2020 -0- -0- -0- 167 5,509 Series 2011B (Refunding) 2011 2013-2020 -0- -0- -0- 110 3,613 Series 2012 (Refunding) 2012 2016-2020 -0- -0- -0- 2,913 64,946 Series 2015A (Refunding) 2015 2017-2026 -0- -0- -0- 2,649 78,002 Series 2016B (Refunding) 2016 2022-2026 43,164 -0- -0- -0- 43,164 Great Lakes Water Quality SWQIF 2003 2003 2053 -0- -0- -0- -0- 6,000 Bonds(e) (f) Series 2008B (SWQIF) 2008 2011-2019 -0- -0- 288 61 948 Series 2009A (Refunding) 2009 2022-2026 -0- 17,780 -0- 1,005 -0- * Series 2010B (Refunding) 2010 2013-2015 -0- -0- 496 1 -0- Series 2010B 2010 2013-2015 -0- -0- 3,623 46 -0- Series 2011A 2011 2021-2025 -0- -0- -0- 925 24,123 Series 2011A (Refunding) 2011 2021-2025 -0- -0- -0- 395 10,295 Series 2011B (Refunding) 2011 2013-2020 -0- -0- -0- 618 20,394 Series 2014A 2014 2024-2029 -0- -0- -0- 3,257 65,140 Series 2014B 2014 2027 -0- -0- -0- 724 20,155 Series 2015A (Refunding) 2015 2027-2029 -0- -0- -0- 891 25,050 Series 2016A 2016 82,240 -0- -0- -0- 82,240 Series 2016B (Refunding) 2016 16,786 -0- -0- -0- 16,786
Total General Obligation Debt 271,275 180,170 201,089 73,463 1,609,443
(a) P.A. 112 of 1961 as amended, provides that the State may borrow from time to time such amounts as shall be required for the purpose of making loans to school districts. Requirements are determined semiannually and general obligation debt is issued as needed.
(b) P.A. 328 of 1988, provided for the issuance of $660 million General Obligation Bonds, of which $8.5 million remains.(c) P.A. 329 of 1988, provided for the issuance of $140 million General Obligation bonds, all of which have been issued.(d) P.A. 284 of 1998 and P.A. 451 of 1994 as amended, provided for the issuance of $675 million General Obligation bonds, of which $80.4 million remains.(e) P.A. 396 of 2002 provided for the issuance of $1.0 billion General Obligation Bonds, of which $586.9 million remains.(f) On December 18, 2003, the State issued $100 million in general obligation Great Lakes W ater Quality Bonds pursuant to voter authorization which were placed with a State Authority.
To date, the State has recognized $10.0 million of this as a liability on the State of Michigan Comprehensive Annual Financial Report of which $6.0 million remains outstanding.
* All or part of the principal amount not presented and not represented in the totals due to the advanced refunding of all or part of this obigation. The table below summarizes the advanced refunding activity by type of bond.
Advanced Refunded Amount FY 16 Paid From escrow FY 16 escrowSeries From Series Refunded Principal Interest BalanceGeneral Obligation Debt: environmental Protection 2012, 2015 $ 36,588 $ 36,588 $ 915 $ 0 Clean Michigan Initiative 2012, 2015, 2016 221,672 175,317 6,184 54,214 Great Lakes Water Quality 2015, 2016 47,780 30,000 60 20,794 School Bond Loan 2016 116,035 0 0 130,796 $ 422,075 $ 241,905 $ 7,159 $ 205,804
15

Table 7
Special Authority Revenue Bond Debt (a) (In Thousands of Dollars)
OutstandingPrincipal
New Principal Interest as ofItem Issues Payments Payments 9-30-16
Mackinac Island State Park Commission $ -0- $ 55 $ 75 $ 1,630 Michigan State Housing Development Authority(b) 401,830 132,360 73,418 2,362,250Michigan Finance Authority(c) 4,346,702 4,023,365 628,192 18,852,904 *Michigan State Building Authority(d) 665,150 108,778 117,282 3,031,728 *
Total Special Authority Debt $ 5,413,682 $ 4,264,558 $ 818,967 $ 24,248,512
* All or part of the principal amount not presented, and not represented in the totals due to the advance refunding of all or part of this obligation.
(a) Information in the table is provided by each Authority.(b) The new issues include $401.8 million of new bond issues for the year. Amounts are as of September 30, 2016.(c) Balance does not include obligations that have been advanced refunded. The escrow principal liability as of September 30, 2016, was
$2,133 million. Executive Order 2010-2 consolidated 10 public finance authorities under the Michigan Finance Authority.(d) Balance does not include obligations that have been advanced refunded. The escrow principal liability as of September 30, 2016, was
$1,069 million. Also outstanding principal does not include commercial paper notes issued by the Authority. As of September 30, 2016, $71.2 million of commercial paper notes was outstanding. Balance does include capital appreciation bonds reported with a ultimate maturity value of $6.4 million with a final maturity on October 15, 2016.
Outstanding Principal New Principal Interest as of Michigan Finance Authority Debt by Program Issues Payments Payments 9-30-16
Health $ 2,017,110 $ 1,214,155 $ 149,849 $ 7,138,136Higher education 115,930 141,941 12,738 497,099Municipal 1,892,222 1,837,220 285,700 7,316,878Public School Academies 39,440 44,955 15,701 274,595Tobacco -0- 5,665 57,937 1,129,016Private K-12 -0- N/A N/A 84,226Student Loan 282,000 390,389 13,646 755,537unemployment -0- 389,040 92,621 1,657,417
Total Michigan Finance Authority Debt $ 4,346,702 $ 4,023,365 $ 628,192 $ 18,852,904
16
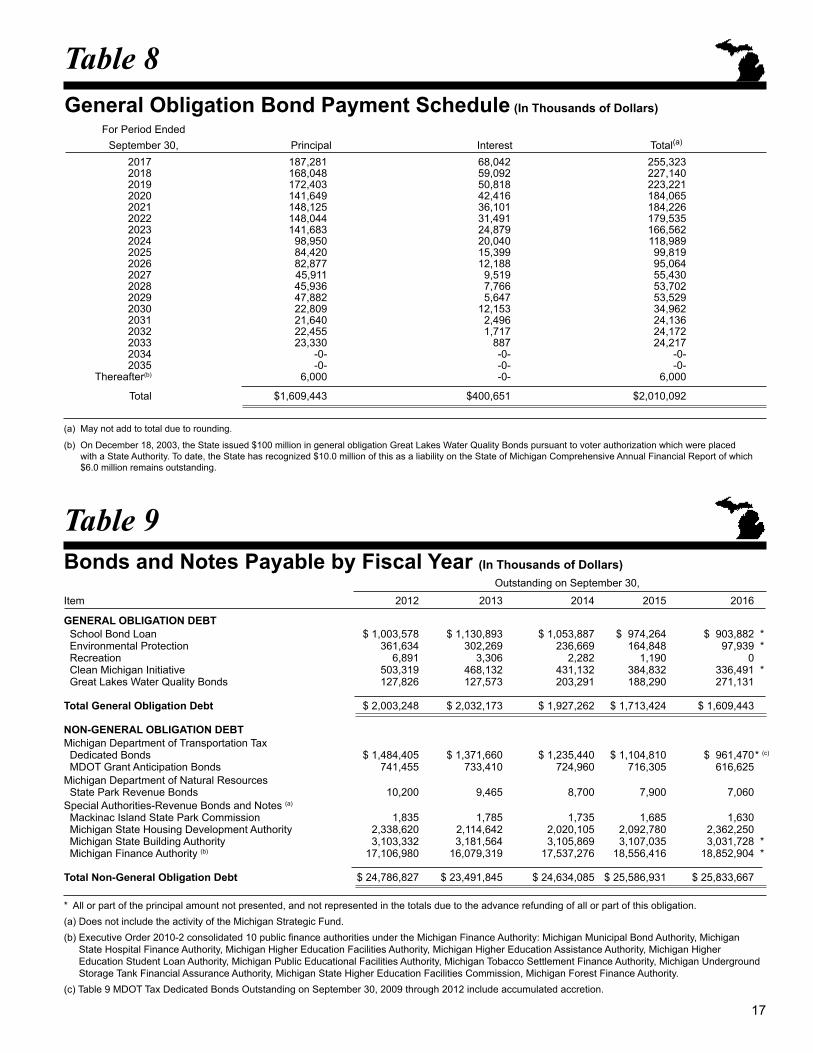
Table 8General Obligation Bond Payment Schedule (In Thousands of Dollars)
For Period ended September 30, Principal Interest Total(a)
2017 187,281 68,042 255,323 2018 168,048 59,092 227,140 2019 172,403 50,818 223,221 2020 141,649 42,416 184,065 2021 148,125 36,101 184,226 2022 148,044 31,491 179,535 2023 141,683 24,879 166,562 2024 98,950 20,040 118,989 2025 84,420 15,399 99,819 2026 82,877 12,188 95,064 2027 45,911 9,519 55,430 2028 45,936 7,766 53,702 2029 47,882 5,647 53,529 2030 22,809 12,153 34,962 2031 21,640 2,496 24,136 2032 22,455 1,717 24,172 2033 23,330 887 24,217 2034 -0- -0- -0- 2035 -0- -0- -0- Thereafter(b) 6,000 -0- 6,000
Total $1,609,443 $400,651 $2,010,092
(a) May not add to total due to rounding.
(b) On December 18, 2003, the State issued $100 million in general obligation Great Lakes Water Quality Bonds pursuant to voter authorization which were placed with a State Authority. To date, the State has recognized $10.0 million of this as a liability on the State of Michigan Comprehensive Annual Financial Report of which $6.0 million remains outstanding.
Table 9Bonds and Notes Payable by Fiscal Year (In Thousands of Dollars)
Outstanding on September 30,
Item 2012 2013 2014 2015 2016
GENERAL OBLIGATION DEBT School Bond Loan $ 1,003,578 $ 1,130,893 $ 1,053,887 $ 974,264 $ 903,882 * environmental Protection 361,634 302,269 236,669 164,848 97,939 * Recreation 6,891 3,306 2,282 1,190 0 Clean Michigan Initiative 503,319 468,132 431,132 384,832 336,491 * Great Lakes Water Quality Bonds 127,826 127,573 203,291 188,290 271,131
Total General Obligation Debt $ 2,003,248 $ 2,032,173 $ 1,927,262 $ 1,713,424 $ 1,609,443 NON-GENERAL OBLIGATION DEBT Michigan Department of Transportation Tax Dedicated Bonds $ 1,484,405 $ 1,371,660 $ 1,235,440 $ 1,104,810 $ 961,470 * (c)
MDOT Grant Anticipation Bonds 741,455 733,410 724,960 716,305 616,625 Michigan Department of Natural Resources State Park Revenue Bonds 10,200 9,465 8,700 7,900 7,060 Special Authorities-Revenue Bonds and Notes (a) Mackinac Island State Park Commission 1,835 1,785 1,735 1,685 1,630 Michigan State Housing Development Authority 2,338,620 2,114,642 2,020,105 2,092,780 2,362,250 Michigan State Building Authority 3,103,332 3,181,564 3,105,869 3,107,035 3,031,728 * Michigan Finance Authority (b) 17,106,980 16,079,319 17,537,276 18,556,416 18,852,904 *
Total Non-General Obligation Debt $ 24,786,827 $ 23,491,845 $ 24,634,085 $ 25,586,931 $ 25,833,667 * All or part of the principal amount not presented, and not represented in the totals due to the advance refunding of all or part of this obligation.(a) Does not include the activity of the Michigan Strategic Fund. (b) Executive Order 2010-2 consolidated 10 public finance authorities under the Michigan Finance Authority: Michigan Municipal Bond Authority, Michigan
State Hospital Finance Authority, Michigan Higher education Facilities Authority, Michigan Higher education Assistance Authority, Michigan Higher education Student Loan Authority, Michigan Public educational Facilities Authority, Michigan Tobacco Settlement Finance Authority, Michigan underground Storage Tank Financial Assurance Authority, Michigan State Higher education Facilities Commission, Michigan Forest Finance Authority.
(c) Table 9 MDOT Tax Dedicated Bonds Outstanding on September 30, 2009 through 2012 include accumulated accretion.
17
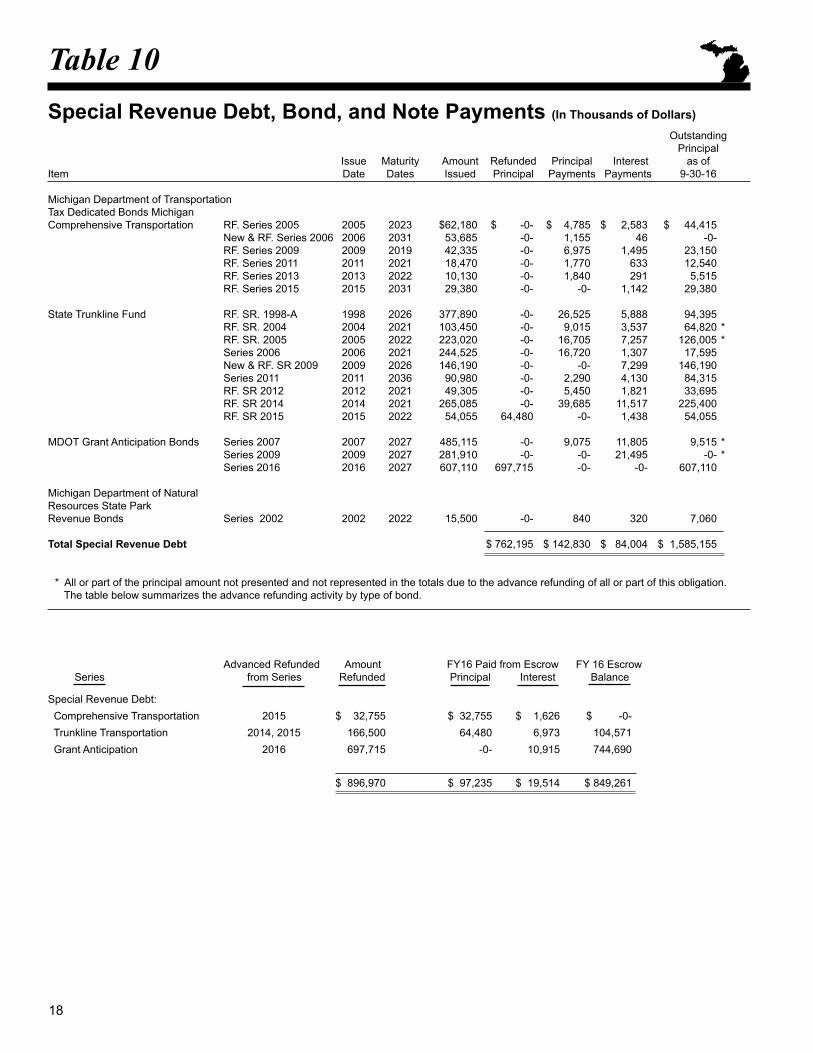
Table 10Special Revenue Debt, Bond, and Note Payments (In Thousands of Dollars) Outstanding Principal Issue Maturity Amount Refunded Principal Interest as of Item Date Dates Issued Principal Payments Payments 9-30-16
Michigan Department of TransportationTax Dedicated Bonds MichiganComprehensive Transportation RF. Series 2005 2005 2023 $62,180 $ -0- $ 4,785 $ 2,583 $ 44,415 New & RF. Series 2006 2006 2031 53,685 -0- 1,155 46 -0- RF. Series 2009 2009 2019 42,335 -0- 6,975 1,495 23,150 RF. Series 2011 2011 2021 18,470 -0- 1,770 633 12,540 RF. Series 2013 2013 2022 10,130 -0- 1,840 291 5,515 RF. Series 2015 2015 2031 29,380 -0- -0- 1,142 29,380
State Trunkline Fund RF. SR. 1998-A 1998 2026 377,890 -0- 26,525 5,888 94,395 RF. SR. 2004 2004 2021 103,450 -0- 9,015 3,537 64,820 * RF. SR. 2005 2005 2022 223,020 -0- 16,705 7,257 126,005 * Series 2006 2006 2021 244,525 -0- 16,720 1,307 17,595 New & RF. SR 2009 2009 2026 146,190 -0- -0- 7,299 146,190 Series 2011 2011 2036 90,980 -0- 2,290 4,130 84,315 RF. SR 2012 2012 2021 49,305 -0- 5,450 1,821 33,695 RF. SR 2014 2014 2021 265,085 -0- 39,685 11,517 225,400 RF. SR 2015 2015 2022 54,055 64,480 -0- 1,438 54,055
MDOT Grant Anticipation Bonds Series 2007 2007 2027 485,115 -0- 9,075 11,805 9,515 * Series 2009 2009 2027 281,910 -0- -0- 21,495 -0- * Series 2016 2016 2027 607,110 697,715 -0- -0- 607,110 Michigan Department of NaturalResources State Park Revenue Bonds Series 2002 2002 2022 15,500 -0- 840 320 7,060
Total Special Revenue Debt $ 762,195 $ 142,830 $ 84,004 $ 1,585,155
* All or part of the principal amount not presented and not represented in the totals due to the advance refunding of all or part of this obligation. The table below summarizes the advance refunding activity by type of bond.
Advanced Refunded Amount FY16 Paid from escrow FY 16 escrow Series from Series Refunded Principal Interest Balance
Special Revenue Debt: Comprehensive Transportation 2015 $ 32,755 $ 32,755 $ 1,626 $ -0- Trunkline Transportation 2014, 2015 166,500 64,480 6,973 104,571 Grant Anticipation 2016 697,715 -0- 10,915 744,690 $ 896,970 $ 97,235 $ 19,514 $ 849,261
18
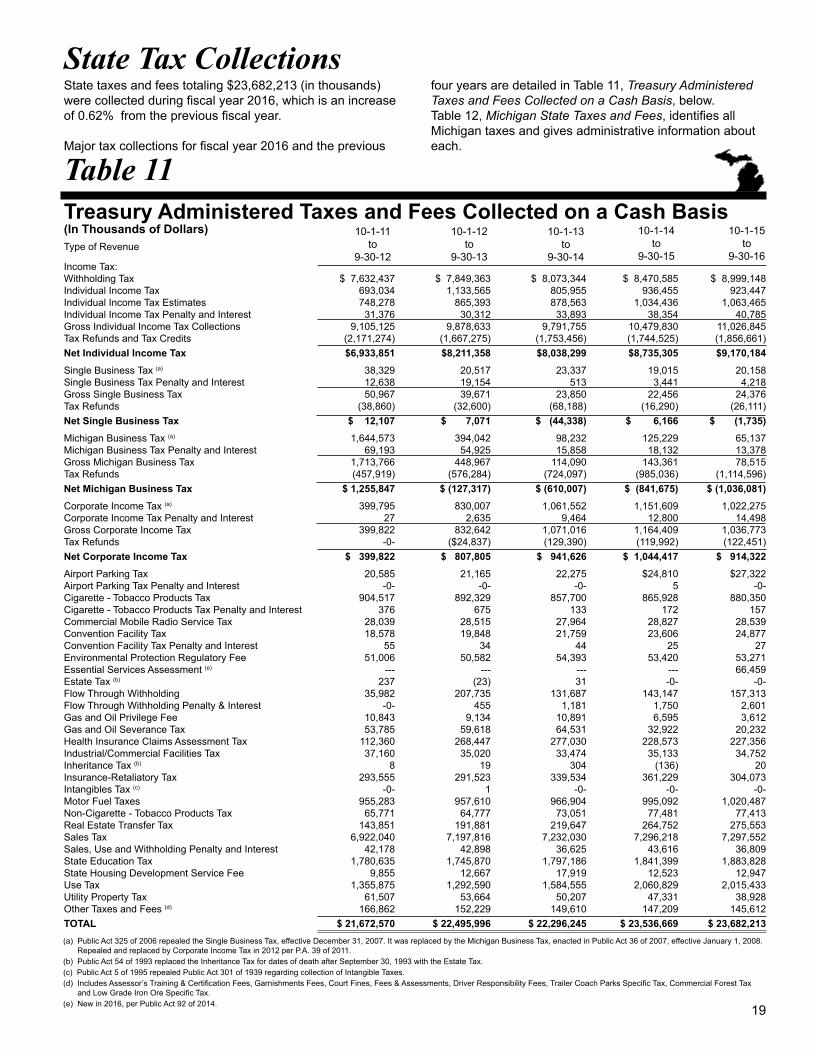
State Tax CollectionsState taxes and fees totaling $23,682,213 (in thousands) four years are detailed in Table 11, Treasury Administered were collected during fiscal year 2016, which is an increase Taxes and Fees Collected on a Cash Basis, below. of 0.62% from the previous fiscal year. Table 12, Michigan State Taxes and Fees, identifies all
Michigan taxes and gives administrative information about
TMajor tax collections for fiscal year 2016 and the previous
able 11each.
Treasury Administered Taxes and Fees Collected on a Cash Basis (In Thousands of Dollars) 10-1-11 10-1-12 10-1-13 10-1-14 10-1-15Type of Revenue to to to to to
9-30-12 9-30-13 9-30-14 9-30-15 9-30-16Income Tax: Withholding Tax $ 7,632,437 $ 7,849,363 $ 8,073,344 $ 8,470,585 $ 8,999,148 Individual Income Tax 693,034 1,133,565 805,955 936,455 923,447 Individual Income Tax estimates 748,278 865,393 878,563 1,034,436 1,063,465 Individual Income Tax Penalty and Interest 31,376 30,312 33,893 38,354 40,785 Gross Individual Income Tax Collections 9,105,125 9,878,633 9,791,755 10,479,830 11,026,845 Tax Refunds and Tax Credits (2,171,274) (1,667,275) (1,753,456) (1,744,525) (1,856,661)Net Individual Income Tax $6,933,851 $8,211,358 $8,038,299 $8,735,305 $9,170,184
Single Business Tax (a) 38,329 20,517 23,337 19,015 20,158 Single Business Tax Penalty and Interest 12,638 19,154 513 3,441 4,218 Gross Single Business Tax 50,967 39,671 23,850 22,456 24,376 Tax Refunds (38,860) (32,600) (68,188) (16,290) (26,111)Net Single Business Tax $ 12,107 $ 7,071 $ (44,338) $ 6,166 $ (1,735)
Michigan Business Tax (a) 1,644,573 394,042 98,232 125,229 65,137 Michigan Business Tax Penalty and Interest 69,193 54,925 15,858 18,132 13,378 Gross Michigan Business Tax 1,713,766 448,967 114,090 143,361 78,515 Tax Refunds (457,919) (576,284) (724,097) (985,036) (1,114,596)Net Michigan Business Tax $ 1,255,847 $ (127,317) $ (610,007) $ (841,675) $ (1,036,081)
Corporate Income Tax (a) 399,795 830,007 1,061,552 1,151,609 1,022,275 Corporate Income Tax Penalty and Interest 27 2,635 9,464 12,800 14,498 Gross Corporate Income Tax 399,822 832,642 1,071,016 1,164,409 1,036,773 Tax Refunds -0- ($24,837) (129,390) (119,992) (122,451)Net Corporate Income Tax $ 399,822 $ 807,805 $ 941,626 $ 1,044,417 $ 914,322
Airport Parking Tax 20,585 21,165 22,275 $24,810 $27,322 Airport Parking Tax Penalty and Interest -0- -0- -0- 5 -0- Cigarette - Tobacco Products Tax 904,517 892,329 857,700 865,928 880,350 Cigarette - Tobacco Products Tax Penalty and Interest 376 675 133 172 157 Commercial Mobile Radio Service Tax 28,039 28,515 27,964 28,827 28,539 Convention Facility Tax 18,578 19,848 21,759 23,606 24,877 Convention Facility Tax Penalty and Interest 55 34 44 25 27 environmental Protection Regulatory Fee 51,006 50,582 54,393 53,420 53,271 essential Services Assessment (e) --- --- --- --- 66,459estate Tax (b) 237 (23) 31 -0- -0- Flow Through Withholding 35,982 207,735 131,687 143,147 157,313 Flow Through Withholding Penalty & Interest -0- 455 1,181 1,750 2,601 Gas and Oil Privilege Fee 10,843 9,134 10,891 6,595 3,612 Gas and Oil Severance Tax 53,785 59,618 64,531 32,922 20,232 Health Insurance Claims Assessment Tax 112,360 268,447 277,030 228,573 227,356 Industrial/Commercial Facilities Tax 37,160 35,020 33,474 35,133 34,752 Inheritance Tax (b) 8 19 304 (136) 20 Insurance-Retaliatory Tax 293,555 291,523 339,534 361,229 304,073 Intangibles Tax (c) -0- 1 -0- -0- -0- Motor Fuel Taxes 955,283 957,610 966,904 995,092 1,020,487 Non-Cigarette - Tobacco Products Tax 65,771 64,777 73,051 77,481 77,413 Real estate Transfer Tax 143,851 191,881 219,647 264,752 275,553 Sales Tax 6,922,040 7,197,816 7,232,030 7,296,218 7,297,552 Sales, use and Withholding Penalty and Interest 42,178 42,898 36,625 43,616 36,809 State education Tax 1,780,635 1,745,870 1,797,186 1,841,399 1,883,828 State Housing Development Service Fee 9,855 12,667 17,919 12,523 12,947 use Tax 1,355,875 1,292,590 1,584,555 2,060,829 2,015,433 utility Property Tax 61,507 53,664 50,207 47,331 38,928 Other Taxes and Fees (d) 166,862 152,229 149,610 147,209 145,612 TOTAL $ 21,672,570 $ 22,495,996 $ 22,296,245 $ 23,536,669 $ 23,682,213(a) Public Act 325 of 2006 repealed the Single Business Tax, effective December 31, 2007. It was replaced by the Michigan Business Tax, enacted in Public Act 36 of 2007, effective January 1, 2008.
Repealed and replaced by Corporate Income Tax in 2012 per P.A. 39 of 2011.(b) Public Act 54 of 1993 replaced the Inheritance Tax for dates of death after September 30, 1993 with the estate Tax.(c) Public Act 5 of 1995 repealed Public Act 301 of 1939 regarding collection of Intangible Taxes.(d) Includes Assessor’s Training & Certification Fees, Garnishments Fees, Court Fines, Fees & Assessments, Driver Responsibility Fees, Trailer Coach Parks Specific Tax, Commercial Forest Tax
and Low Grade Iron Ore Specific Tax.(e) New in 2016, per Public Act 92 of 2014. 19
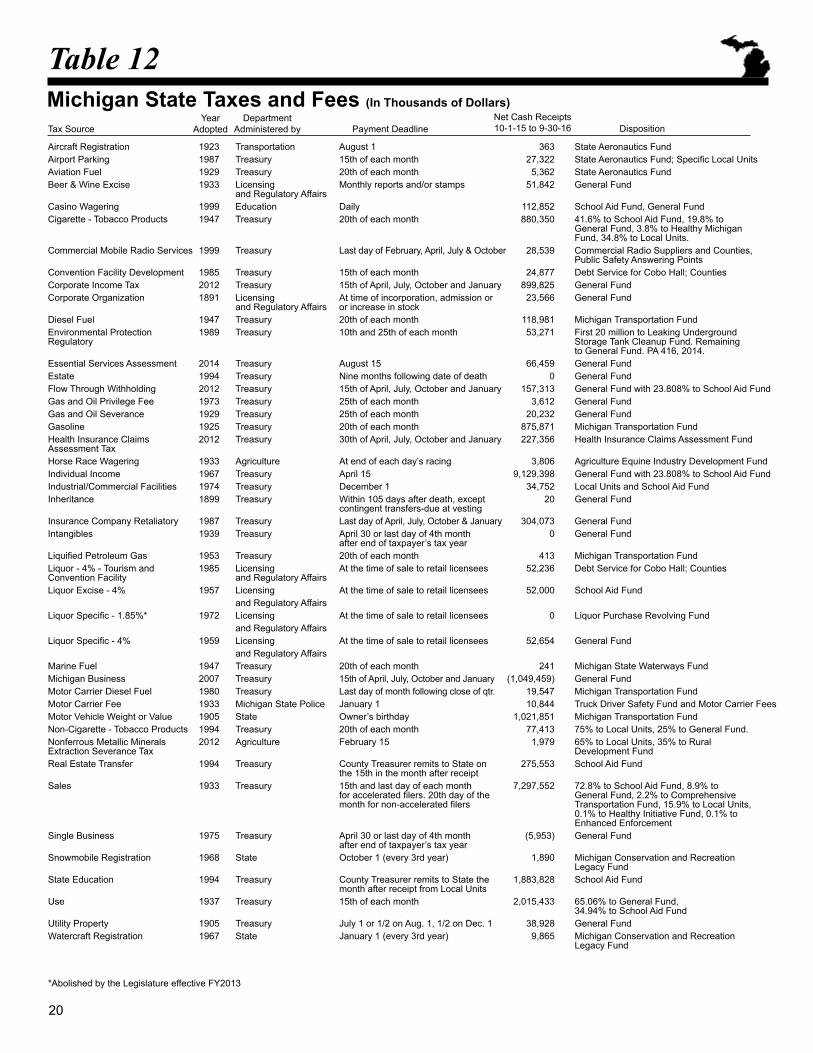
Table 12Michigan State Taxes and Fees (In Thousands of Dollars)
Year Department Net Cash ReceiptsTax Source Adopted Administered by Payment Deadline 10-1-15 to 9-30-16 Disposition
Aircraft Registration 1923 Transportation August 1 363 State Aeronautics FundAirport Parking 1987 Treasury 15th of each month 27,322 State Aeronautics Fund; Specific Local UnitsAviation Fuel 1929 Treasury 20th of each month 5,362 State Aeronautics FundBeer & Wine excise 1933 Licensing Monthly reports and/or stamps 51,842 General Fund and Regulatory AffairsCasino Wagering 1999 education Daily 112,852 School Aid Fund, General FundCigarette - Tobacco Products 1947 Treasury 20th of each month 880,350 41.6% to School Aid Fund, 19.8% to General Fund, 3.8% to Healthy Michigan Fund, 34.8% to Local units.Commercial Mobile Radio Services 1999 Treasury Last day of February, April, July & October 28,539 Commercial Radio Suppliers and Counties, Public Safety Answering PointsConvention Facility Development 1985 Treasury 15th of each month 24,877 Debt Service for Cobo Hall; CountiesCorporate Income Tax 2012 Treasury 15th of April, July, October and January 899,825 General FundCorporate Organization 1891 Licensing At time of incorporation, admission or 23,566 General Fund and Regulatory Affairs or increase in stockDiesel Fuel 1947 Treasury 20th of each month 118,981 Michigan Transportation Fundenvironmental Protection 1989 Treasury 10th and 25th of each month 53,271 First 20 million to Leaking underground Regulatory Storage Tank Cleanup Fund. Remaining to General Fund. PA 416, 2014.essential Services Assessment 2014 Treasury August 15 66,459 General Fundestate 1994 Treasury Nine months following date of death 0 General FundFlow Through Withholding 2012 Treasury 15th of April, July, October and January 157,313 General Fund with 23.808% to School Aid FundGas and Oil Privilege Fee 1973 Treasury 25th of each month 3,612 General FundGas and Oil Severance 1929 Treasury 25th of each month 20,232 General FundGasoline 1925 Treasury 20th of each month 875,871 Michigan Transportation FundHealth Insurance Claims 2012 Treasury 30th of April, July, October and January 227,356 Health Insurance Claims Assessment Fund Assessment TaxHorse Race Wagering 1933 Agriculture At end of each day’s racing 3,806 Agriculture equine Industry Development FundIndividual Income 1967 Treasury April 15 9,129,398 General Fund with 23.808% to School Aid FundIndustrial/Commercial Facilities 1974 Treasury December 1 34,752 Local units and School Aid FundInheritance 1899 Treasury Within 105 days after death, except 20 General Fund contingent transfers-due at vestingInsurance Company Retaliatory 1987 Treasury Last day of April, July, October & January 304,073 General FundIntangibles 1939 Treasury April 30 or last day of 4th month 0 General Fund after end of taxpayer’s tax yearLiquified Petroleum Gas 1953 Treasury 20th of each month 413 Michigan Transportation FundLiquor - 4% - Tourism and 1985 Licensing At the time of sale to retail licensees 52,236 Debt Service for Cobo Hall; Counties Convention Facility and Regulatory AffairsLiquor excise - 4% 1957 Licensing At the time of sale to retail licensees 52,000 School Aid Fund and Regulatory AffairsLiquor Specific - 1.85%* 1972 Licensing At the time of sale to retail licensees 0 Liquor Purchase Revolving Fund and Regulatory AffairsLiquor Specific - 4% 1959 Licensing At the time of sale to retail licensees 52,654 General Fund and Regulatory AffairsMarine Fuel 1947 Treasury 20th of each month 241 Michigan State Waterways FundMichigan Business 2007 Treasury 15th of April, July, October and January (1,049,459) General FundMotor Carrier Diesel Fuel 1980 Treasury Last day of month following close of qtr. 19,547 Michigan Transportation FundMotor Carrier Fee 1933 Michigan State Police January 1 10,844 Truck Driver Safety Fund and Motor Carrier FeesMotor Vehicle Weight or Value 1905 State Owner’s birthday 1,021,851 Michigan Transportation FundNon-Cigarette - Tobacco Products 1994 Treasury 20th of each month 77,413 75% to Local units, 25% to General Fund.Nonferrous Metallic Minerals 2012 Agriculture February 15 1,979 65% to Local units, 35% to Rural extraction Severance Tax Development FundReal estate Transfer 1994 Treasury County Treasurer remits to State on 275,553 School Aid Fund the 15th in the month after receiptSales 1933 Treasury 15th and last day of each month 7,297,552 72.8% to School Aid Fund, 8.9% to for accelerated filers. 20th day of the General Fund, 2.2% to Comprehensive month for non-accelerated filers Transportation Fund, 15.9% to Local Units, 0.1% to Healthy Initiative Fund, 0.1% to enhanced enforcementSingle Business 1975 Treasury April 30 or last day of 4th month (5,953) General Fund after end of taxpayer’s tax yearSnowmobile Registration 1968 State October 1 (every 3rd year) 1,890 Michigan Conservation and Recreation Legacy FundState education 1994 Treasury County Treasurer remits to State the 1,883,828 School Aid Fund month after receipt from Local unitsuse 1937 Treasury 15th of each month 2,015,433 65.06% to General Fund, 34.94% to School Aid Fundutility Property 1905 Treasury July 1 or 1/2 on Aug. 1, 1/2 on Dec. 1 38,928 General FundWatercraft Registration 1967 State January 1 (every 3rd year) 9,865 Michigan Conservation and Recreation Legacy Fund *Abolished by the Legislature effective FY2013
20

Local Property Taxeseach of Michigan’s 83 counties “equalizes” the local property Table 13 shows state, county and local equalized valuations assessments. equalization ensures that similar properties for calendar year 2015 and the prior decade. This table also in different areas are assessed equitably. Following county lists the total Taxable Valuation and the average tax rate equalization, the State Tax Commission equalizes among (millage) for each year. Table 14 shows how property tax counties. dollars are apportioned among the various taxing units.Local property taxes in Michigan are levied on taxable values Michigan taxpayers’ local property tax burden is lessened (resulting from State equalization) by local units of government: substantially by an income tax credit for property taxes paid.school districts, cities, counties, townships and villages.
Table 13Local Property Tax Valuation, Levies, and Average Rates (In Millions of Dollars)
Local County State Total Average Homestead Non-Homesteadequalized equalized Taxable T Rate AverageCalendar Assessed axes Average
Year Valuation Valuation Valuation Valuation Levied (Mills) Rate (a) Rate
2015 382,421 382,415 382,415 327,674 13,475 41.12 34.21 52.332014 360,594 360,593 360,593 319,540 13,034 40.79 33.92 51.772013 350,023 350,025 350,025 316,726 12,818 40.47 33.53 51.472012 349,320 349,306 349,306 315,772 12,757 40.40 33.47 51.242011 362,765 362,775 362,775 323,616 12,946 40.00 33.68 50.972010 385,115 385,050 385,050 336,845 13,374 39.70 33.13 50.402009 423,892 423,901 423,901 360,567 14,110 39.13 32.86 51.092008 448,112 448,140 448,140 363,225 14,144 38.94 33.14 50.942007 453,058 453,109 453,109 357,298 14,254 39.89 32.72 51.492006 436,294 436,422 436,421 340,334 13,598 39.96 32.66 51.382005 415,776 415,796 415,796 321,653 12,827 39.88 32.60 51.38 (a) Homesteads include properties which received exemption from school operating millage. Property exemptions included: principal residence,
qualified agricultural, qualified forest, supportive housing, property occupied by a public school academy, DNR, and industrial personal property.
Table 14Distribution of Local Property Taxes (In Thousands of Dollars)
Taxing Taxes Levied Percent of unit 2014 2015 IncreaseCity $ 2,286,675 $ 2,380,166 4.09%County 2,182,713 2,278,524 4.39%Township 917,044 972,587 6.06%Village 89,058 86,451 -2.93%School 5,724,104 5,875,671 2.65%State education Tax 1,833,970 1,882,000 2.62%
Totals $13,033,564 (a) $13,475,399 (b) (a) $557.9 million of the total property taxes levied in 2014 was refunded to taxpayers through the “circuit breaker” system of property tax credits
against State income tax due or as a reimbursement if they exceed the income tax.(b) $557.2 million of the total property taxes levied in 2015 was refunded to taxpayers through the “circuit breaker” system of property tax credits
against State income tax due or as a reimbursement if they exceed the income tax.
21

Published by the:
Michigan Department of Treasury430 W. Allegan Street
Lansing, MI 48922
This report is available at www.michigan.gov/treasury.
Issued under the authority of P.A. 122 of 1941.