annual report of tata sip fund (scheme i and ii) for the
TRANSCRIPT
annual report2008 - 2009
l Tata SIP Fund (Scheme I & II)

tata SIp Fund Scheme 1 tata SIp Fund Scheme II
Annual Report 2008-2009 2
Statutory DetailS:SPoNSorS tata Sons limited Bombay House, 24, Homi Modi Street, Mumbai - 400 001.
tata investment Corporation limited Ewart House, 22, Homi Modi Street, Mumbai - 400 001.
truStee tata trustee Company Private limited Fort House, 221, D. N. Road, Fort, Mumbai – 400 001.
aMC tata asset Management ltd. Fort House, 221, D. N. Road, Fort, Mumbai – 400 001.
reGiStrar Computer age Management Services (Pvt.) limited Ground Floor, 178/10 Kodambakkam High Road, Opp. Hotel Palmgrove, Nungambakkam, Chennai - 600 034.
iNDex1. Report of the Trustees to Unitholders of Tata Mutual Fund ................................ 3
2. Brief Background of Sponsors, Trust, Trustee Co. and Asset Management Company (AMC). ................................................................ 5
3. Investment Objectives of the Schemes ............................................................... 5
4. SignificantAccountingPolicies: .......................................................................... 5
5. Unclaimed Dividend & Redemptions ................................................................... 5
6. Statutory Information ........................................................................................... 5
7. Auditors’ Report ................................................................................................... 6
8. Balance Sheet as at 31st March 2009 ................................................................. 8
9. Revenue Account for the year/Period ended 31st March 2009 ........................... 9
11. Note to Accounts .................................................................................................. 12
12. Key Statistics ....................................................................................................... 32
tata SIp Fund Scheme 1 tata SIp Fund Scheme II
Annual Report 2008-2009 �
rePort oF tHe truStee to tHe uNitHolDerS For tHe year eNDeD 31St MarCH, 2009
Dear Unitholder,Itgivesusgreatpleasuretoencloseschemewiseauditedfinancialsason31st March, 2009. This Report is in continuation of the ‘Performance and Portfolio of the Schemes’ Report as on 31st March, 2009 published by us earlier.1. Scheme Performance, Future outlook and operations of the Schemes tata SiP Fund Scheme i: The fund has been systematically investing in equities as per themandate and has out performed theBSESENSEX in a difficult
environment. Performance at a glance (% as on 31st March, 2009)
last 1 year last 3 years last 5 years Since inceptionTata SIP Fund Scheme I -27.57 NA NA -13.06 (05/03/07)BSE SENSEX -37.94 NA NA -11.18
Past performance may or may not be sustained in future. Return for period upto 1 year is absolute and for more than one year is compounded annualised. Returns are for growth option. tata SiP Fund Scheme ii: The fund has been systematically investing in equities as per themandate and has out performed theBSESENSEX in a difficult
environment. Performance at a glance (% as on 31st March, 2009)
last 1 year last 3 years last 5 years Since inceptionTata SIP Fund Scheme II -28.57 NA NA -17.63 (01/07/07)BSE SENSEX -37.94 NA NA -20.95
Past performance may or may not be sustained in future. Return for period upto 1 year is absolute and for more than one year is compounded annualised. Returns are for growth option. the year that was: equity: In the Financial Year 2008-09, equity markets witnessed a sharp correction with the Nifty and the Sensex each down by 38% and 36%
respectively. It was a very volatile (with a downward bias) ride for markets as well for economic indicators. Global markets performance wasworsewithMSCIEmergingMarketIndexfalling46%andtheMSCIWorldIndexfalling44%YearonYear,reflectingthefactthattheIndian markets were led down, more by global concerns rather than domestic events. On the macro environment, however, the Indian marketsendedthefiscalwithsomepositiveswithacollapseincommodityprices(beinganetcommodityconsumer),fallininterestratesandinflationfromhighs,andgovernmentfiscalandmonetarypushforgrowth.
Other than in April’08 and March ’09, FIIs were net sellers throughout the year. Global markets were reeling under the impact of the creditcrisisleadingtosignificantriskaversionandliquiditycontraction.Also,thestrongbullmarketoverthelastfewyearsandtheIndianmarketoutperformancecouldhaveresultedinsomeprofitbookingfromthismarket.Forthefiscal,FIIswerenetsellersincashequitiesto the extent of USD 10.3 billion compared to being net buyers of USD 13.2 billion in the previous year. Slow but sure emergence of Equity as an asset class for Indians could be seen from DII purchases -Domestic Mutual funds were net buyers to the extent of USD 1.6 billioncomparedtobeingnetbuyersofUSD4billioninthepreviousyear.Duringthefiscal,largecap(-38%)stockscontinuedtoperformbetter than mid cap (-54%) and small(-58%) stocks. Barring a lone month of August when there was some improvement in mid caps, the marketreflectedextremeriskaversionthroughouttheyearandlargecapstocksdidbetter.IntermsofsectoralperformanceAuto(-32%),FMCG(-11%), Health Care(-27%), IT (-36%) ,Oil & Gas (-30%) and PSU(30%), indices outperformed the Sensex, while Banking(-42%), Consumer Durables(-58%), Capital Goods(-54%), Metals(-59 %), Power(-42%) and Realty(-79 %) lagged the Sensex.
The beginning of FY 08-09 was characterized by the onset of a credit crisis originating in heavily debt laden developed markets like US, UK etc. Tough credit conditions were brought on by Bear Sterns bankruptcy in March 08 which then was exacerbated by oil touching USD 149 per Barrel on 3rd July 08, followed by Lehman Brothers bankruptcy on 15th September 08. In the past year most investable assetclasseslikecrudeoil,stocks,realestate,agriculturecommodities,metalsetcsawextremevolatility.TheyearstartedwithinflationshootingupandtheRBIraisingkeyrateslikeCRRandReporateuptoJuly.FoodandFuelwerethemainculpritsofhigherinflation.InfluencedbyglobaltrendsandtheslowdowninIIPgrowth,thecentralbankthenstartedarateloweringcyclefromOctoberonwards.RupeereflectedincreasedriskaversionandthesellingpressurefromtheFIIsbyendingatRs.50.5againstthedollar-28%depreciationfrom Rs.40.10 a year earlier.
In terms of corporate performance the year saw further consolidation with growth slowing down. The initial signs of slow down came intheMarch’08quarterlynumberswithslightmoderationintoplineaswellasbottomlineasrisinginputcostsateintomargins.ProfitgrowthfurtherweakenedintheSeptemberquarteronthebackofhighrawmaterialcostsandinterestrates.Thefirsthalfoftheyearsawgrowth slowing down but the second half pulled down the overall growth. The December quarter saw corporate earnings moving into de-growth following the volatility in input prices and tightness in credit markets. There were several aberrations in the quarter in currency movements, commodity price trends etc which impacted corporate performance adversely.
Theseverefallintheequitymarketssawvaluationsgoingdownsignificantlytosub10levelsfortheIndianmarketwhichwasatthelowerend of the P/E band that the market historically enjoyed. Though valuations were in an attractive zone, uncertainty about the future and the sheer impact of the rapid deterioration would have numbed the best of investors. Since bottoming out in September ’08, the markets
tata SIp Fund Scheme 1 tata SIp Fund Scheme II
Annual Report 2008-2009 �
were range bound for some time and beginning March 09 markets have been rallying with the basic theme that incremental data is less bad than earlier. There was improvement in risk appetite with money moving out of the US Dollar assets to commodities, emerging markets etc. Along with risk appetite which improved due to the signals from various governments that they would infuse liquidity and protect large institutions from a collapse, there also emerged some ‘Green Shoots’ globally be it in the US, China or in India in terms of economic performance indicators. In May 09 India had more to celebrate, with a game changing electoral verdict, which gave the ruling coalition a stronger mandate to pursue reforms. The new government is expected to facilitate infrastructural development while pushing the inclusive growth agenda further.
Debt: Inthefirsthalfof2008-09,financialmarketssufferedthefullmightofthesubprime-crisisthatfirstbroke-outinAugust2007.Worldcredit
marketsfroze,majorbankssufferedhugelossesandneededre-capitalizationandfinancialmarketswentforatail-spin.Globalmarketswitnessed huge volatility until the world governments and central banks came together to stabilize the markets with injection of huge liquidity and aggressive rate cuts, pumping fresh capital in troubled banks and buying out their bad assets. Global economic momentum sufferedmassiveset-backwithmajoreconomiesgettingintorecessionandtheemergingcountrieswitnessingsignificantslowdowningrowth rates. A blessing in disguise was sharp correction in commodity and oil prices. In second-half of 2008-09, following the easing of policyratesbymajorcentralbanksandcorrectionincommodityprices,inflationacrosstheglobeeaseddramaticallyandinterestratesdeclined, setting the ground for a massive rally in bond prices. With credit markets also opening back again, corporate spreads also contacted sharply from the multi-decade high that it hit earlier at the peak of the crisis. However, by Q4, the massive government stimulus forbanksandeconomyresulted inhigherfiscaldeficitand largergovernmentborrowingsstarted toputpressureon long termbondyields.
Future outlooK: eQuity Inthelastfourmonthssincemidmarch,themarketsgloballyhaverecoveredsignificantly.BetweenMarchandMay,theIndianmarket
underperformed many of the other emerging markets. However, post the election results, the Indian market out performed most other markets and this strong move has taken India to among the best performing markets globally in this year. Money waiting on the side lines prior to the elections suddenly rushed in which also helped in pushing the market to a higher range very sharply. In terms of valuations the Indian market as mentioned above has done a mean reversion to the long term average which is a P/E around 16x on one year forward earnings. The current valuation is factoring in expectation of higher growth probably in FY’11 as FY’10 may continue with the same trend and is likely to show subdued growth. In predicting a recovery it is possible for the markets to get ahead of reality, as they had in the sell off earlier in FY09.
Inthecurrentyearthemarketsarelikelytobeinfluencedbyglobalevents,dataflowandanyimprovementincorporateperformanceinthe next few quarters especially in the second half of the year which could lead to an upgrade of the earnings growth estimates by the street. Reforms & new initiatives from the government may impact the economy only from the next year onwards. While a recovery or a bounce in equity markets globally and in India was expected, the speed of the rally has taken everyone by surprise. This also probably means that many investors have not participated in this rally and therefore more money could be waiting to get invested including domestic retail money. However, for the market to continue with the same momentum it would need a lot of follow through positive factors from the global and domestic economy. Also since this re-rating of the Indian markets came on the back of a stable government in power, the out performance over other markets going forward would depend on the delivery of reforms and the execution by the government
Wefeelthatoverthenextfewmonthstherecouldbenegativenewsflowfromtheglobaleconomyandfromdomesticcorporateswhichcould give opportunities to invest. A delayed monsoon would be a worry, but a pick up in latter months should ensure minimal damage to the rural growth story. There are also a lot of expectations from the yet to be presented Finance Budget. However what is most important is that there is a change in the outlook from the last year which was fraught with uncertainty to a more positive future. Given a stable government in India and a recovery, albeit slow, in the global economy over this year and next, declines could now be looked at as buying opportunities with valuations in mind.
DeBt outlooK Un-precedent measures, in recent quarters, by way of fiscal stimulus, re-capitalization, liquidity injection and rate -cuts by world
governmentsandcentralbanks,followingthemeltdowninfinancialmarketspostthesub-primecrisisandamidstasharpslowdownineconomic momentum, have begun to bear results. As the economists have been saying, the green shoots are visible all over. Economic datahasshownsteadyimprovementandthefinancialmarketshavealsostabilized.Equityandcommoditymarketshaveseenasharprally in the past few months demonstrating the optimism that has now replaced the extreme pessimism earlier.
However,onecollateraldamageofthemassivefiscalstimulushasbeenthesharpspikeinfiscaldeficit.InIndia,FiscaldeficitforFY2008-09ispeggedat6.2%ofGDPagainstinitialbudgetestimateof2.5%.SimilarlyFiscaldeficitfor2009-10isprojectedat5.5%ofGDP.Inevitably, resultant larger government borrowing will put upward pressure on bond yields. Benchmark 10 year GOI yield, after hitting a multi year low below 5% in early Jan’09s has since hardened to hover in 6.75-7% range, a massive correction of 200bps + in a short time. Situation is similar across global market. For example, inspite of lowering the Fed rate to 0-0.25% band and buy-back of treasury securities by Fed, US 10 year treasury yields are currently around 3.75% rebounding from a low of 2.05% in Dec 08.
InIndia,likeelsewhere,thisisinspiteofasignificanteasingofinflation(0.48%asofMay23’2009),multipleratecutsandmassiveopenmarket operations by RBI and with oil prices remaining low in recent months.
RBI’s monetary policy stance remains explicitly accommodative. Liquidity in the system remains high. RBI has successfully blunted theupwardpressureoninterestratesthroughlargeopenmarketoperations.Tilloverseascapitalflowsresumeagain,continuedRBIinterventionandsupportiveunderlyingeconomicandinflationaryenvironmentshouldkeepinterestratesrangeboundalthoughmarketscould be volatile. In the medium to long term, interest rates are likely to be stable with downward bias.

tata SIp Fund Scheme 1 tata SIp Fund Scheme II
Annual Report 2008-2009 �
FuNDS uNDer MaNaGeMeNt - oPeratioNS TataMutualFundtodaymanagesthirty-eightopenendedschemesofwhichfifteenareequityschemes,twoarebalancedschemes,
twenty are debt schemes, one is Equity Linked Saving Scheme (ELSS) and thirteen are close ended schemes of which two are equity scheme,fourarebalancedschemes,fivearedebtschemes,andtwoareEquityLinkedSavingScheme(ELSS).TheAMCcontinuesitsfocus on fund performance and marketing / sales efforts to serve our investors better.
2. Brief Background of Sponsors, trust, trustee Co. and asset Management Company (aMC). a) tata Mutual Fund Tata Mutual Fund (TMF) was set up as a Trust by the Sponsors and the Settlers, Tata Sons Limited (TSL) and Tata Investment
Corporation Limited (TICL) on 9th May, 1995 with Tata Trustee Company Private Limited as a Trustee in accordance with the provisions of the Indian Trust Act, 1882 and is duly registered under the Indian Registration Act, 1908. The Trustee has entered into an Investment Management Agreement dated 9th May, 1995 with Tata Asset Management Limited to function as the Investment Manager for all the Schemes of Tata Mutual Fund (TMF). TMF was registered with SEBI on 30th June, 1995.
b) tata trustee Company Private limited TheTrusteeistheexclusiveowneroftheTrustFundandholdsthesameintrustforthebenefitoftheunitholders.TheTrusteehas
been discharging its duties and carrying out the responsibilities as provided in the Regulations and the Trust Deed. The Trustee seekstoensurethattheFundandtheSchemesfloatedthereunderaremanagedbytheAMCinaccordancewiththeTrustDeed,the Regulations, directions and guidelines issued by the SEBI, the Stock Exchanges, the Association of Mutual Funds in India and other regulatory agencies.
c) asset Management Company Tata Asset Management Limited (TAML) is a company incorporated under the Companies Act, 1956 on 15th March, 1994, having its
RegisteredOfficeatFortHouse,221Dr.D.N.Road,Fort,Mumbai400001.TAMLhasbeenappointedastheAssetManagementCompany for Tata Mutual Fund by the Trustee vide Investment Management Agreement (IMA) dated 9th May, 1995, and executed between TTCPL and TAML.
The Trustee Company has appointed TAML as the Asset Management Company for TMF. The shareholders of TAML are TSL and TICL. TAML has entered into an Investment Management Agreement dated 9th May, 1995 with TTCPL, pursuant to which TAML will runtheoperationsofTMFandmanagetheassetsofTMF’sSchemes.TAML,havingitsregisteredofficeat,FortHouse,221Dr.D. N. Road, Mumbai 400 001 is a Company incorporated under the Companies Act, 1956 on 15th March 1994 and was approved to act as an Asset Management Company for TMF by SEBI on 30th June, 1995. The networth of TAML as on May 31, 2009 is approximately about Rs. 100.04 crores. TAML is currently managing thirty-eight open-ended schemes and thirteen close ended schemes.
3. investment objectives of the Schemes tSiPF1 / tSiPF2: A 36 months close ended hybrid scheme. The primary Investment Objective of the scheme is to achieve a long term
growth. The scheme seeks to achieve it’s investment objective by investing systematically in the Equity / Equity related instruments. However there can be no assurance that the investment objective of the scheme will be realized, as actual market movements may be at variance with anticipated trends.
4. SignificantAccountingPolicies: Accounting policies are in accordance with Securities Exchange Board of India (Mutual Fund) Regulations 1996.5. unclaimed Dividend & redemptions: Nil6. Statutory information: a. The Sponsors are not responsible or liable for any loss resulting from the operation of the Schemes of the Fund beyond their initial
contribution (to the extent contributed) of Rs. 1 lakh for setting up the Fund, and such other accretions / additions to the same.
b. Thepriceandredemptionvalueoftheunits,andincomefromthem,cangoupaswellasdownwithfluctuationsinthemarketvalueof its underlying investments.
c. Full Annual Report shall be disclosed on the website (www.tatamutualfund.com) and shall be available for inspection at the Head Officeofthemutualfund.Presentandprospectiveunitholdercanobtaincopyofthetrustdeed,thefullAnnualReportoftheFund/AMCatachargefromAMC’sheadoffice.
For Tata Trustee Company Private Limited,
S. M. Datta Chairman
Place:Mumbai Date :July10,2009
Encl. Schemewise Audited Accounts and Auditor’s Report
abbreviations of the Scheme Name:tSiPF1 - Tata SIP Fund Scheme I and tSiPF2 - Tata SIP Fund Scheme II these schemes have two options namely Dividend Option and Growth Option. Dividend option is denoted by D, Div and Growth Option is denoted by G, GR.

tata SIp Fund Scheme 1 tata SIp Fund Scheme II
Annual Report 2008-2009 �
auDitorS’ rePortto tHe BoarD oF DireCtorS oF tata truStee CoMPaNy PriVate liMiteD
We have audited the attached Balance Sheet of tata Mutual FuND – tata SiP FuND SCHeMe-1 (“the Fund”) as at 31st March, 2009 andtheRevenueAccountoftheFundfortheyearendedonthatdate,annexedthereto,andreportthereonasfollows:
a) The Balance Sheet and the Revenue Account dealt with by this report have been prepared in accordance with the accounting policies andstandardsspecifiedintheNinthScheduleoftheSecuritiesandExchangeBoardofIndia(MutualFunds)Regulations,1996.ThesefinancialstatementsaretheresponsibilityoftheManagementsoftheTrusteeandtheAssetManagementcompanies.
b Our audit was conducted in accordance with the generally accepted auditing standards in India. These Standards require that we plan andperformtheaudit toobtainreasonableassuranceaboutwhetherthefinancialstatementsarefreeofmaterialmisstatements.Anauditincludesexamining,onatestbasis,evidencesupportingtheamountsandthedisclosuresinthefinancialstatements.AnauditalsoincludesassessingtheaccountingprinciplesusedandthesignificantestimatesmadebytheManagement,aswellasevaluatingtheoverallfinancialstatementpresentation.Webelievethatourauditprovidesareasonablebasisforouropinion.
c) We have obtained all the information and explanations which to the best of our knowledge and belief were necessary for the purposes of our audit.
d) The Balance Sheet and the Revenue Account dealt with by this report are in agreement with the books of account of the Fund.
e) Non-tradedsecuritieshavebeenvaluedinaccordancewiththeguidelinesnotifiedbytheSecuritiesandExchangeBoardofIndia.Inouropinion, these valuations are fair and reasonable.
f) Without qualifying our opinion, we draw attention to Note No. 14 of Schedule VIII Part B wherein the Management of the Tata Asset Management Limited has explained its rationale regarding certain Accounting Standards issued by the Institute of Chartered Accountants of India as not being applicable to mutual funds.
g) In our opinion and to the best of our information and according to the explanations given to us, the said accounts give the information required by the Securities and Exchange Board of India (Mutual Funds) Regulations, 1996 and give a true and fair view in conformity with theaccountingprinciplesgenerallyacceptedinIndia:
(i) in the case of the Balance Sheet, of the state of affairs of the Fund as at 31st March, 2009 and
(ii) in the case of the Revenue Account, ofthedeficitoftheFundfortheyearendedonthatdate.
For Deloitte HaSKiNS & SellS Chartered Accountants
Z.F. Billimoria Partner
(Membership No. 42791)
MUMBAI, 10th July, 2009

tata SIp Fund Scheme 1 tata SIp Fund Scheme II
Annual Report 2008-2009 �
auDitorS’ rePortto tHe BoarD oF DireCtorS oF tata truStee CoMPaNy PriVate liMiteD
We have audited the attached Balance Sheet of tata Mutual FuND – tata SiP FuND 2 (“the Fund”) as at 31st March, 2009 and the RevenueAccountoftheFundfortheyearendedonthatdate,annexedthereto,andreportthereonasfollows:
a) The Balance Sheet and the Revenue Account dealt with by this report have been prepared in accordance with the accounting policies andstandardsspecifiedintheNinthScheduleoftheSecuritiesandExchangeBoardofIndia(MutualFunds)Regulations,1996.ThesefinancialstatementsaretheresponsibilityoftheManagementsoftheTrusteeandtheAssetManagementcompanies.
b) Our audit was conducted in accordance with the generally accepted auditing standards in India. These Standards require that we plan andperformtheaudit toobtainreasonableassuranceaboutwhetherthefinancialstatementsarefreeofmaterialmisstatements.Anauditincludesexamining,onatestbasis,evidencesupportingtheamountsandthedisclosuresinthefinancialstatements.AnauditalsoincludesassessingtheaccountingprinciplesusedandthesignificantestimatesmadebytheManagement,aswellasevaluatingtheoverallfinancialstatementpresentation.Webelievethatourauditprovidesareasonablebasisforouropinion.
c) We have obtained all the information and explanations which to the best of our knowledge and belief were necessary for the purposes of our audit.
d) The Balance Sheet and the Revenue Account dealt with by this report are in agreement with the books of account of the Fund.
e) Non-tradedsecuritieshavebeenvaluedinaccordancewiththeguidelinesnotifiedbytheSecuritiesandExchangeBoardofIndia.Inouropinion, these valuations are fair and reasonable.
f) Without qualifying our opinion, we draw attention to Note No.14 of Schedule VIII Part B wherein the Management of the Tata Asset Management Limited has explained its rationale regarding certain Accounting Standards issued by the Institute of Chartered Accountants of India as not being applicable to mutual funds.
g) In our opinion and to the best of our information and according to the explanations given to us, the said accounts give the information required by the Securities and Exchange Board of India (Mutual Funds) Regulations, 1996 and give a true and fair view in conformity with theaccountingprinciplesgenerallyacceptedinIndia:
(i) in the case of the Balance Sheet, of the state of affairs of the Fund as at 31st March, 2009 and,
(ii) inthecaseoftheRevenueAccount,ofthedeficitoftheFundfortheyearendedonthatdate.
For Deloitte HaSKiNS & SellS Chartered Accountants
Z.F. Billimoria Partner
(Membership No. 42791)
MUMBAI, 10th July, 2009

tata SIp Fund Scheme 1 tata SIp Fund Scheme II
Annual Report 2008-2009 8
Balance Sheet of Tata SIP Fund Scheme-1 as at 31st March, 2009
Schedule As At As At31-Mar-09 31-Mar-08(Rupees) (Rupees)
LIABILITIES
Unit Capital I 2,412,048,469 2,667,830,607 Reserves & Surplus II (607,528,421) 87,711,824 Current Liabilities & Provisions III 8,974,432 11,892,528
TOTAL 1,813,494,480 2,767,434,959
ASSETS
Investments IV 1,760,275,229 2,621,583,935 Other Current Assets V 9,516,284 44,166,844 Deferred Revenue Expenditure VI 43,702,967 101,684,180
TOTAL 1,813,494,480 2,767,434,959
Significant Accounting Policies and Notes to the Accounts VIII
tata SIp Fund Scheme 1 tata SIp Fund Scheme II
Annual Report 2008-2009 9
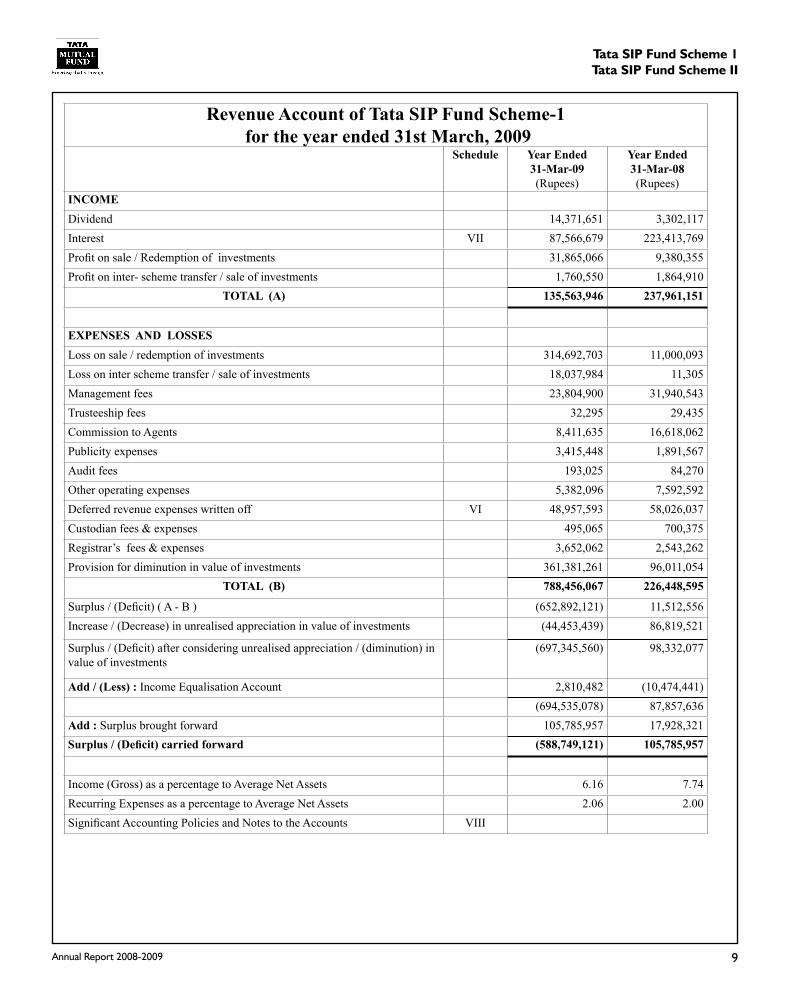
Revenue Account of Tata SIP Fund Scheme-1 for the year ended 31st March, 2009
Schedule Year Ended31-Mar-09(Rupees)
Year Ended31-Mar-08(Rupees)
INCOMEDividend 14,371,651 3,302,117 Interest VII 87,566,679 223,413,769 Profit on sale / Redemption of investments 31,865,066 9,380,355 Profit on inter- scheme transfer / sale of investments 1,760,550 1,864,910
TOTAL (A) 135,563,946 237,961,151
EXPENSES AND LOSSESLoss on sale / redemption of investments 314,692,703 11,000,093 Loss on inter scheme transfer / sale of investments 18,037,984 11,305 Management fees 23,804,900 31,940,543 Trusteeship fees 32,295 29,435 Commission to Agents 8,411,635 16,618,062 Publicity expenses 3,415,448 1,891,567 Audit fees 193,025 84,270 Other operating expenses 5,382,096 7,592,592 Deferred revenue expenses written off VI 48,957,593 58,026,037 Custodian fees & expenses 495,065 700,375 Registrar’s fees & expenses 3,652,062 2,543,262 Provision for diminution in value of investments 361,381,261 96,011,054
TOTAL (B) 788,456,067 226,448,595
Surplus / (Deficit) ( A - B ) (652,892,121) 11,512,556 Increase / (Decrease) in unrealised appreciation in value of investments (44,453,439) 86,819,521
Surplus / (Deficit) after considering unrealised appreciation / (diminution) in value of investments
(697,345,560) 98,332,077
Add / (Less) : Income Equalisation Account 2,810,482 (10,474,441) (694,535,078) 87,857,636
Add : Surplus brought forward 105,785,957 17,928,321 Surplus / (Deficit) carried forward (588,749,121) 105,785,957
Income (Gross) as a percentage to Average Net Assets 6.16 7.74 Recurring Expenses as a percentage to Average Net Assets 2.06 2.00 Significant Accounting Policies and Notes to the Accounts VIII

tata SIp Fund Scheme 1 tata SIp Fund Scheme II
Annual Report 2008-2009 10
As At31-Mar-09(Rupees)
As At31-Mar-08(Rupees)
Schedule I - Unit Capital
Initial Capital
( 300,825,727.000 Units of the face value of Rs. 10/- each) 3,008,257,270 3,008,257,270
Unit Capital
Opening Balance
(266,783,060.738 units (previous year 300,810,369.171 Units) of the face value of Rs. 10/- each)
2,667,830,607 3,008,103,692
Add : Units reissued during the year
(Nil units (Previous year 15,360.820 units) of the face value of Rs.10/- each) - 153,608 2,667,830,607 3,008,257,300
Less : Units repurchased during the year
(25,578,213.868 units (previous year 34,042,669.253 units ) of the face value of Rs.10/- each)
255,782,138 340,426,693
Units Closing Balance
(241,204,846.870 units (previous year 266,783,060.738 Units) of the face value of Rs. 10/- each)
2,412,048,469 2,667,830,607
Schedule II - Reserves & Surplus
Unit Premium ReserveOpening Balance (18,074,133) - Less : Deduction during the year (705,167) (18,074,133)Closing Balance (18,779,300) (18,074,133)
Revenue Account (588,749,121) 105,785,957
(607,528,421) 87,711,824
Schedule III - Current Liabilities & ProvisionsCurrent LiabilitiesManagement Fees Payable 853,974 1,254,225 Trusteeship Fees Payable 29,760 26,282 Selling Commission / Brokerage 1,575,941 903,401 Advertisement & Publicity 563,902 1,936,805 Audit Fees 193,025 84,270 Custodian Fees & Expenses 36,573 56,033 Registrar’s Fees & Expenses 579,466 491,158 Other Expenses 5,141,791 7,140,354
8,974,432 11,892,528
tata SIp Fund Scheme 1 tata SIp Fund Scheme II
Annual Report 2008-2009 11
As At31-Mar-09(Rupees)
As At31-Mar-08(Rupees)
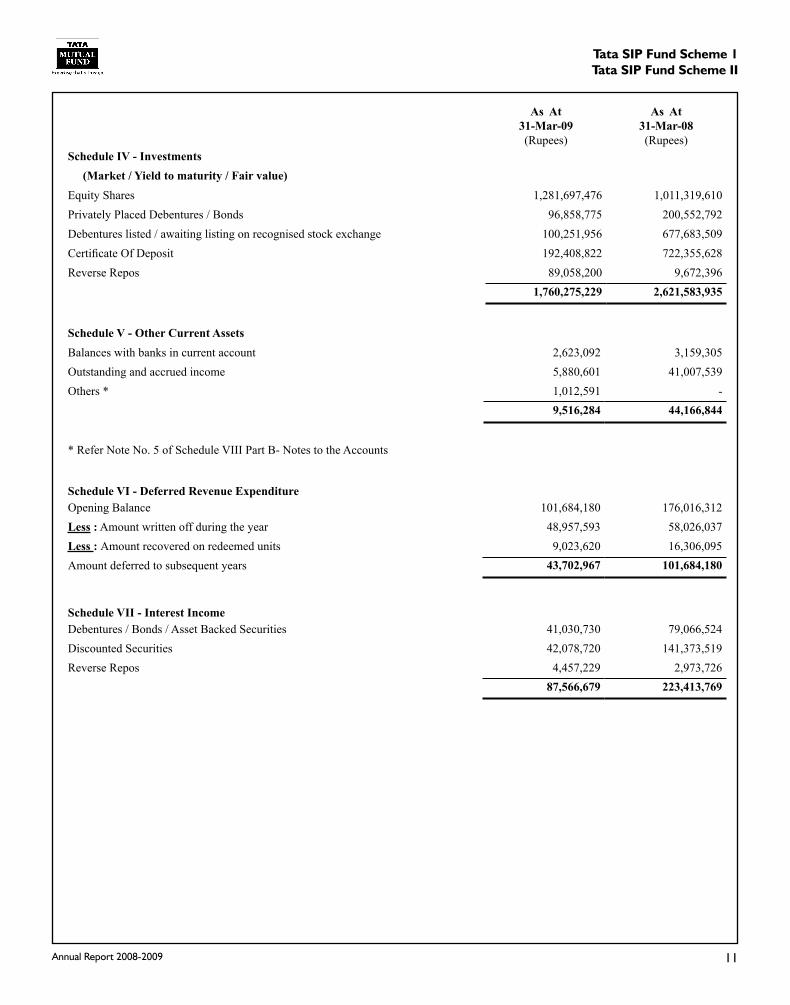
Schedule IV - Investments (Market / Yield to maturity / Fair value)Equity Shares 1,281,697,476 1,011,319,610 Privately Placed Debentures / Bonds 96,858,775 200,552,792 Debentures listed / awaiting listing on recognised stock exchange 100,251,956 677,683,509 Certificate Of Deposit 192,408,822 722,355,628 Reverse Repos 89,058,200 9,672,396
1,760,275,229 2,621,583,935
Schedule V - Other Current AssetsBalances with banks in current account 2,623,092 3,159,305 Outstanding and accrued income 5,880,601 41,007,539 Others * 1,012,591 -
9,516,284 44,166,844
* Refer Note No. 5 of Schedule VIII Part B- Notes to the Accounts
Schedule VI - Deferred Revenue ExpenditureOpening Balance 101,684,180 176,016,312 Less : Amount written off during the year 48,957,593 58,026,037 Less : Amount recovered on redeemed units 9,023,620 16,306,095 Amount deferred to subsequent years 43,702,967 101,684,180
Schedule VII - Interest IncomeDebentures / Bonds / Asset Backed Securities 41,030,730 79,066,524 Discounted Securities 42,078,720 141,373,519 Reverse Repos 4,457,229 2,973,726
87,566,679 223,413,769

tata SIp Fund Scheme 1 tata SIp Fund Scheme II
Annual Report 2008-2009 12
Schedule VIII - Statement of significant accounting policies of Tata SIP Fund Scheme - 1 (TSIPF1) and Notes forming part of the Accounts for the year ended 31st March, 2009.
A. SIGNIFICANT ACCOUNTING POLICIES
1. INCOME RECOGNITION:
a) Dividend income is accounted on ex-dividend dates.
b) Profit or loss on sale of investments is recognised on trade dates. The cost of investments sold is determined on “weighted average cost basis”.
c) Interest on investments is accounted on an accrual basis. Interest on an investment that is past due for three months is accrued and a full provision is made against all outstanding interest on that investment.
d) Discounts / premiums to redemption value on fixed income securities are amortised on a straight-line basis over the period upto redemption.
e) Other income of a miscellaneous nature is accounted when it is received on grounds of prudence.
2. EXPENSES:
a) All expenses are accounted on an accrual basis.
b) Expenses not identifiable with any particular scheme are generally allocated to the schemes in proportion to their net assets. With effect from 1st October, 2008 Registrar’s fees and expenses have been allocated to the schemes in proportion to the number of live folios in the schemes.
3. DEFERRED REVENUE EXPENDITURE:
This being a close ended hybrid scheme the initial issue expenses are written of equally over the close ended period viz. 3 years. The unamortised portion of the initial issue expenses Rs. 43,702,967/- (previous year Rs.101,684,180/-) is included in the NAV.
4. INVESTMENTS:
a) Purchase and sale of investments are recorded on the date of the transaction, at cost and sale price respectively, after considering brokerage, commission, stamp charges and any charge customarily included in the broker note.
b) Rights entitlement pending formal allotment is accounted as investments at issue price plus acquisition cost, if any.
c) Bonus entitlement is recognised on ex-bonus dates.
5. PORTFOLIO VALUATION FOR NAV CALCULATION
i. Traded Securities (Other than Floating Rate Debt Securities):
Traded Securities are valued at year-end closing market rates on the principal stock exchange on which the security is traded (excluding accrued interest, if any, which is accounted separately).
In the absence of a quoted price on the valuation date for equity instruments, the last available quoted price within a period of Fifteen days prior to the valuation date is used for valuation purposes.
ii. Thinly Traded Securities (Other than Floating Rate Debt Securities):
Thinly traded equity / equity related securities are those securities whose trade in a month, are both less than Rs.5 lacs and the total volume is less than 50,000 shares. These have been valued on the basis of valuation principles laid down by The Securities and Exchange Board of India (SEBI) for the same.
iii. Non-Traded Securities :
a. Non-Traded/Thinly Traded Debt Securities/Asset Backed Securities (other than Floating Rate Debt Securities) of over 182 days to maturity are valued in good faith on a yield to maturity basis by Tata Asset Management Limited (TAML).
The non – traded debt securities have been classified by TAML as “investment grade” and “below investment grade” as at 31st March, 2009. The values applied by TAML for “investment grade” debt securities are on the basis of valuation yields determined by Credit Rating Information Services of India Limited (CRISIL). In the opinion of TAML, these yields determine fair and reasonable values and such basis of valuation is approved by the Tata Trustee Company Private Limited. These securities have been valued on the basis of valuation principles laid down by SEBI for the same.
tata SIp Fund Scheme 1 tata SIp Fund Scheme II
Annual Report 2008-2009 1�
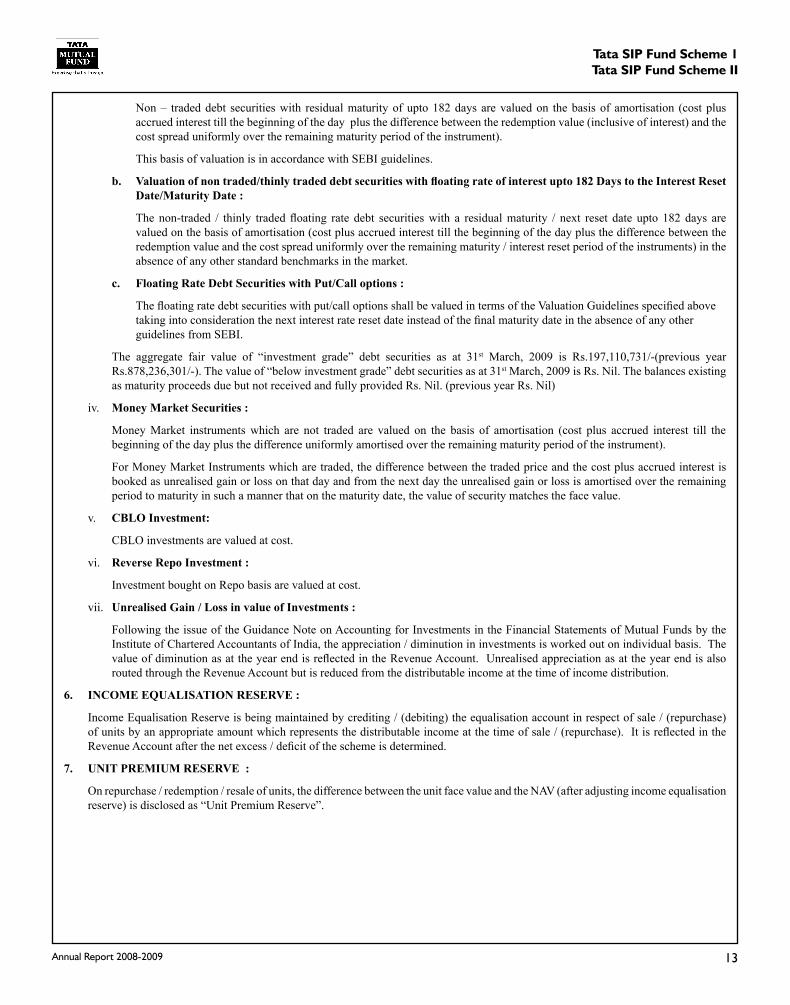
Non – traded debt securities with residual maturity of upto 182 days are valued on the basis of amortisation (cost plus accrued interest till the beginning of the day plus the difference between the redemption value (inclusive of interest) and the cost spread uniformly over the remaining maturity period of the instrument).
This basis of valuation is in accordance with SEBI guidelines.
b. Valuation of non traded/thinly traded debt securities with floating rate of interest upto 182 Days to the Interest Reset Date/Maturity Date :
The non-traded / thinly traded floating rate debt securities with a residual maturity / next reset date upto 182 days are valued on the basis of amortisation (cost plus accrued interest till the beginning of the day plus the difference between the redemption value and the cost spread uniformly over the remaining maturity / interest reset period of the instruments) in the absence of any other standard benchmarks in the market.
c. Floating Rate Debt Securities with Put/Call options :
The floating rate debt securities with put/call options shall be valued in terms of the Valuation Guidelines specified above taking into consideration the next interest rate reset date instead of the final maturity date in the absence of any other guidelines from SEBI.
The aggregate fair value of “investment grade” debt securities as at 31st March, 2009 is Rs.197,110,731/-(previous year Rs.878,236,301/-). The value of “below investment grade” debt securities as at 31st March, 2009 is Rs. Nil. The balances existing as maturity proceeds due but not received and fully provided Rs. Nil. (previous year Rs. Nil)
iv. Money Market Securities :
Money Market instruments which are not traded are valued on the basis of amortisation (cost plus accrued interest till the beginning of the day plus the difference uniformly amortised over the remaining maturity period of the instrument).
For Money Market Instruments which are traded, the difference between the traded price and the cost plus accrued interest is booked as unrealised gain or loss on that day and from the next day the unrealised gain or loss is amortised over the remaining period to maturity in such a manner that on the maturity date, the value of security matches the face value.
v. CBLO Investment:
CBLO investments are valued at cost.
vi. Reverse Repo Investment :
Investment bought on Repo basis are valued at cost.
vii. Unrealised Gain / Loss in value of Investments :
Following the issue of the Guidance Note on Accounting for Investments in the Financial Statements of Mutual Funds by the Institute of Chartered Accountants of India, the appreciation / diminution in investments is worked out on individual basis. The value of diminution as at the year end is reflected in the Revenue Account. Unrealised appreciation as at the year end is also routed through the Revenue Account but is reduced from the distributable income at the time of income distribution.
6. INCOME EQUALISATION RESERVE :
Income Equalisation Reserve is being maintained by crediting / (debiting) the equalisation account in respect of sale / (repurchase) of units by an appropriate amount which represents the distributable income at the time of sale / (repurchase). It is reflected in the Revenue Account after the net excess / deficit of the scheme is determined.
7. UNIT PREMIUM RESERVE :
On repurchase / redemption / resale of units, the difference between the unit face value and the NAV (after adjusting income equalisation reserve) is disclosed as “Unit Premium Reserve”.
tata SIp Fund Scheme 1 tata SIp Fund Scheme II
Annual Report 2008-2009 1�
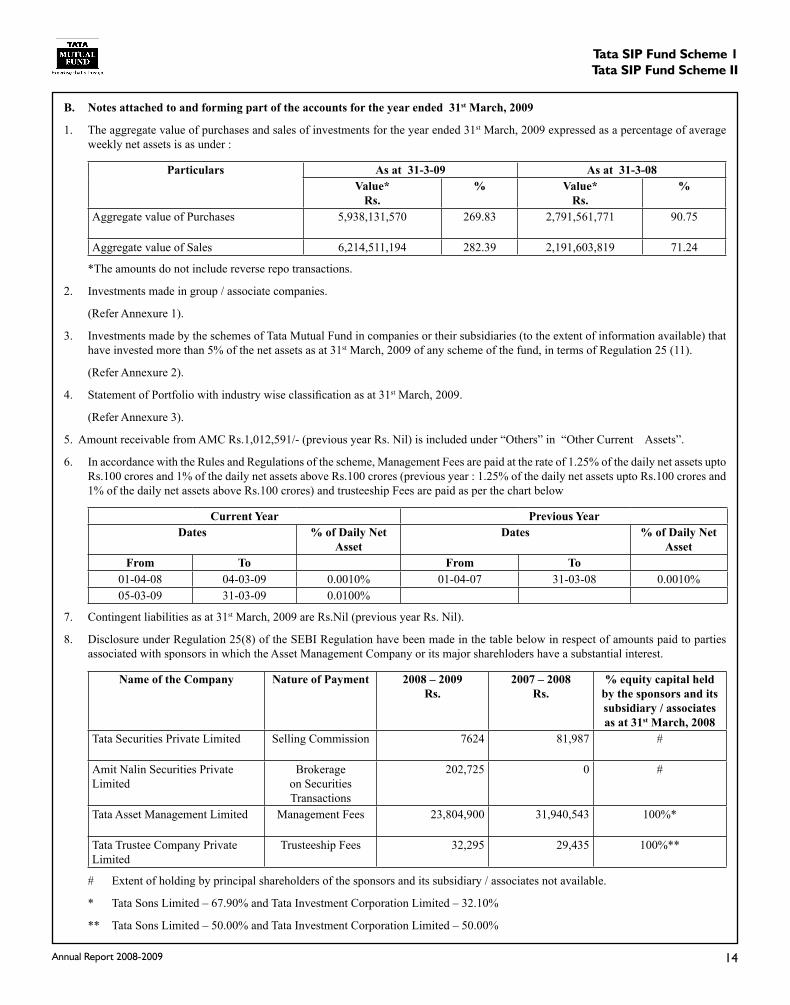
B. Notes attached to and forming part of the accounts for the year ended 31st March, 2009
1. The aggregate value of purchases and sales of investments for the year ended 31st March, 2009 expressed as a percentage of average weekly net assets is as under :
Particulars As at 31-3-09 As at 31-3-08Value*
Rs.% Value*
Rs.%
Aggregate value of Purchases 5,938,131,570 269.83 2,791,561,771 90.75
Aggregate value of Sales 6,214,511,194 282.39 2,191,603,819 71.24
*The amounts do not include reverse repo transactions.
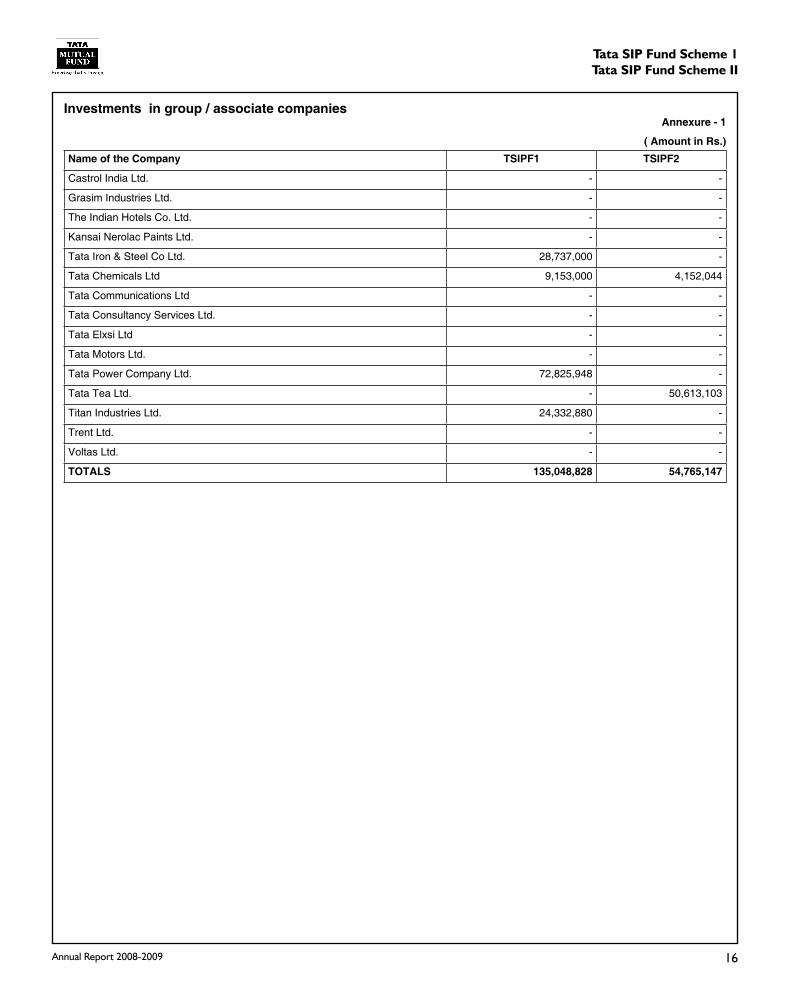
2. Investments made in group / associate companies.
(Refer Annexure 1).
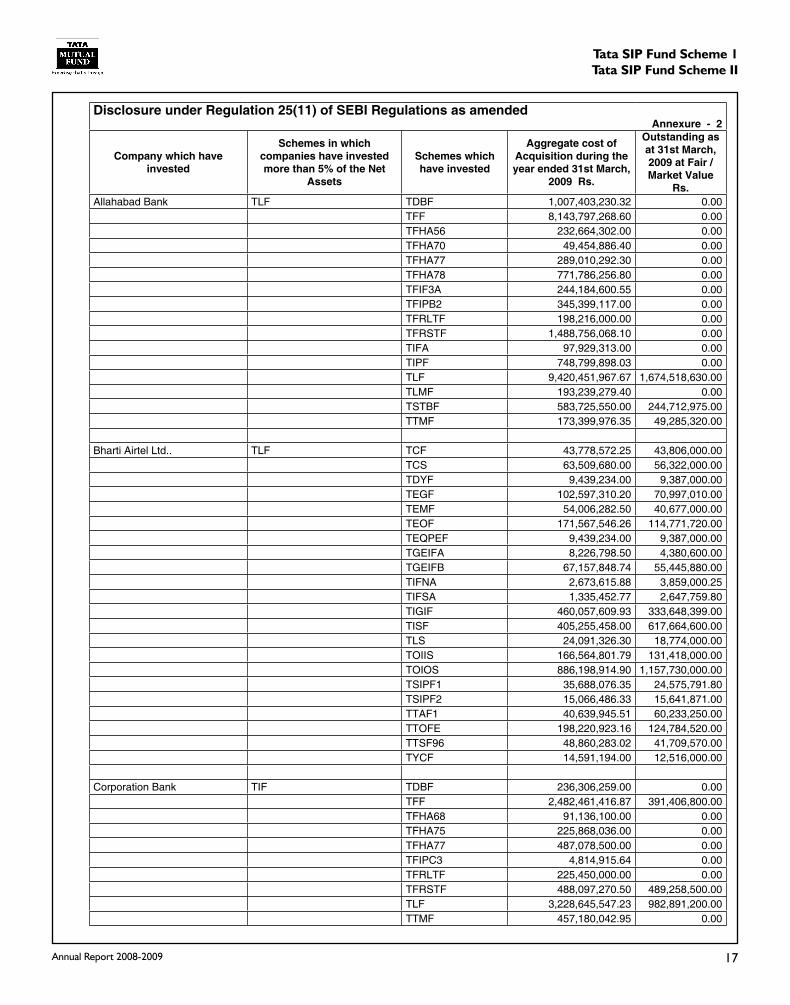
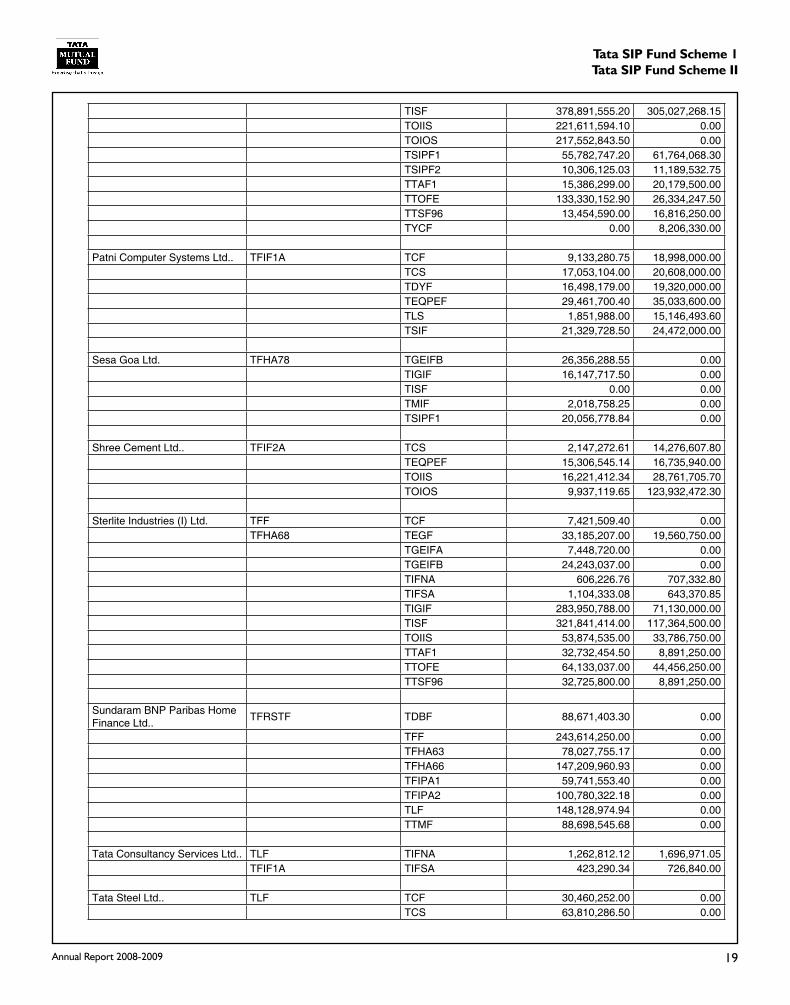
3. Investments made by the schemes of Tata Mutual Fund in companies or their subsidiaries (to the extent of information available) that have invested more than 5% of the net assets as at 31st March, 2009 of any scheme of the fund, in terms of Regulation 25 (11).
(Refer Annexure 2).
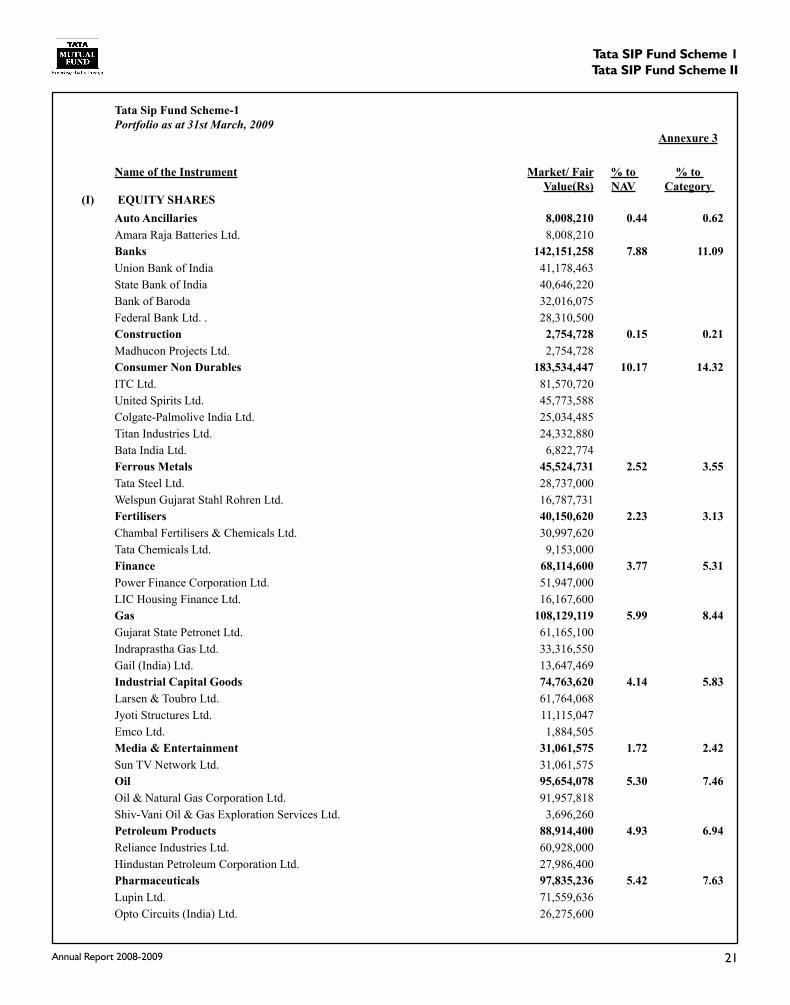
4. Statement of Portfolio with industry wise classification as at 31st March, 2009.
(Refer Annexure 3).
5. Amount receivable from AMC Rs.1,012,591/- (previous year Rs. Nil) is included under “Others” in “Other Current Assets”.
6. In accordance with the Rules and Regulations of the scheme, Management Fees are paid at the rate of 1.25% of the daily net assets upto Rs.100 crores and 1% of the daily net assets above Rs.100 crores (previous year : 1.25% of the daily net assets upto Rs.100 crores and 1% of the daily net assets above Rs.100 crores) and trusteeship Fees are paid as per the chart below
Current Year Previous YearDates % of Daily Net
AssetDates % of Daily Net
AssetFrom To From To
01-04-08 04-03-09 0.0010% 01-04-07 31-03-08 0.0010%05-03-09 31-03-09 0.0100%
7. Contingent liabilities as at 31st March, 2009 are Rs.Nil (previous year Rs. Nil).
8. Disclosure under Regulation 25(8) of the SEBI Regulation have been made in the table below in respect of amounts paid to parties associated with sponsors in which the Asset Management Company or its major sharehloders have a substantial interest.
Name of the Company Nature of Payment 2008 – 2009Rs.
2007 – 2008Rs.
% equity capital held by the sponsors and its subsidiary / associates as at 31st March, 2008
Tata Securities Private Limited Selling Commission 7624 81,987 #
Amit Nalin Securities Private Limited
Brokerage on Securities Transactions
202,725 0 #
Tata Asset Management Limited Management Fees 23,804,900 31,940,543 100%*
Tata Trustee Company Private Limited
Trusteeship Fees 32,295 29,435 100%**
# Extent of holding by principal shareholders of the sponsors and its subsidiary / associates not available.
* Tata Sons Limited – 67.90% and Tata Investment Corporation Limited – 32.10%
** Tata Sons Limited – 50.00% and Tata Investment Corporation Limited – 50.00%
tata SIp Fund Scheme 1 tata SIp Fund Scheme II
Annual Report 2008-2009 1�
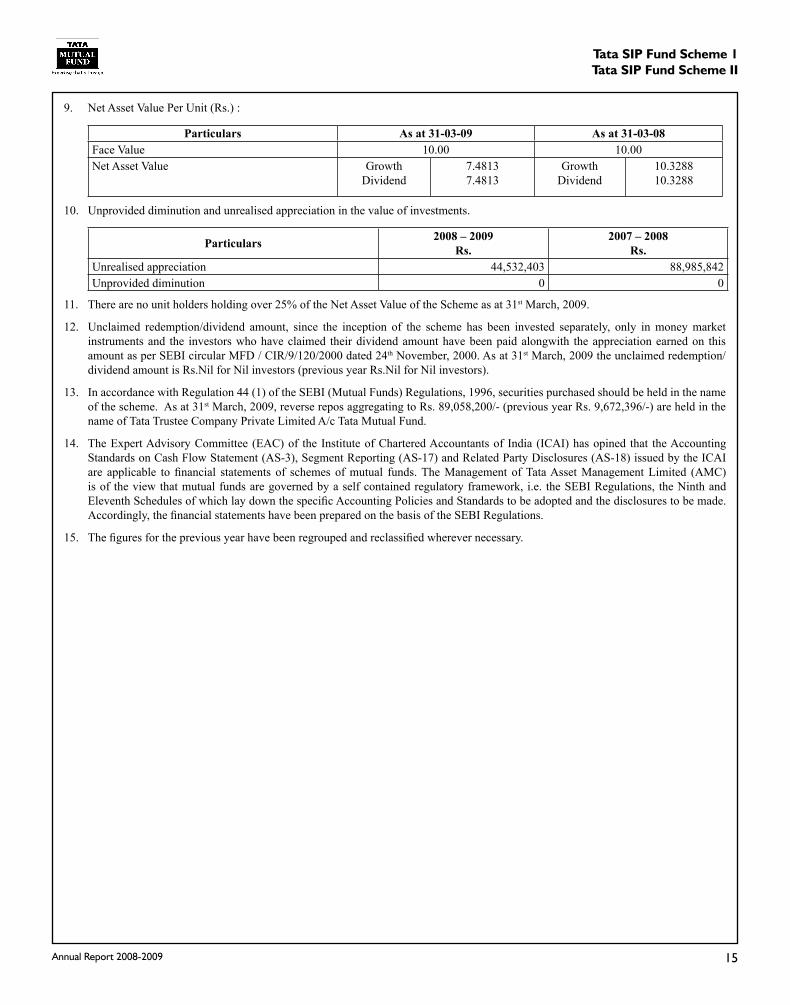
9. Net Asset Value Per Unit (Rs.) :
Particulars As at 31-03-09 As at 31-03-08Face Value 10.00 10.00Net Asset Value Growth
Dividend7.48137.4813
GrowthDividend
10.328810.3288
10. Unprovided diminution and unrealised appreciation in the value of investments.
Particulars 2008 – 2009Rs.
2007 – 2008Rs.
Unrealised appreciation 44,532,403 88,985,842Unprovided diminution 0 0
11. There are no unit holders holding over 25% of the Net Asset Value of the Scheme as at 31st March, 2009.
12. Unclaimed redemption/dividend amount, since the inception of the scheme has been invested separately, only in money market instruments and the investors who have claimed their dividend amount have been paid alongwith the appreciation earned on this amount as per SEBI circular MFD / CIR/9/120/2000 dated 24th November, 2000. As at 31st March, 2009 the unclaimed redemption/dividend amount is Rs.Nil for Nil investors (previous year Rs.Nil for Nil investors).
13. In accordance with Regulation 44 (1) of the SEBI (Mutual Funds) Regulations, 1996, securities purchased should be held in the name of the scheme. As at 31st March, 2009, reverse repos aggregating to Rs. 89,058,200/- (previous year Rs. 9,672,396/-) are held in the name of Tata Trustee Company Private Limited A/c Tata Mutual Fund.
14. The Expert Advisory Committee (EAC) of the Institute of Chartered Accountants of India (ICAI) has opined that the Accounting Standards on Cash Flow Statement (AS-3), Segment Reporting (AS-17) and Related Party Disclosures (AS-18) issued by the ICAI are applicable to financial statements of schemes of mutual funds. The Management of Tata Asset Management Limited (AMC) is of the view that mutual funds are governed by a self contained regulatory framework, i.e. the SEBI Regulations, the Ninth and Eleventh Schedules of which lay down the specific Accounting Policies and Standards to be adopted and the disclosures to be made. Accordingly, the financial statements have been prepared on the basis of the SEBI Regulations.
15. The figures for the previous year have been regrouped and reclassified wherever necessary.
tata SIp Fund Scheme 1 tata SIp Fund Scheme II
Annual Report 2008-2009 1�
investments in group / associate companiesannexure - 1
( amount in rs.)Name of the Company tSiPF1 tSiPF2
Castrol India Ltd. - -
Grasim Industries Ltd. - -
The Indian Hotels Co. Ltd. - -
Kansai Nerolac Paints Ltd. - -
Tata Iron & Steel Co Ltd. 28,737,000 -
Tata Chemicals Ltd 9,153,000 4,152,044
Tata Communications Ltd - -
Tata Consultancy Services Ltd. - -
Tata Elxsi Ltd - -
Tata Motors Ltd. - -
Tata Power Company Ltd. 72,825,948 -
Tata Tea Ltd. - 50,613,103
Titan Industries Ltd. 24,332,880 -
Trent Ltd. - -
Voltas Ltd. - -
totalS 135,048,828 54,765,147
tata SIp Fund Scheme 1 tata SIp Fund Scheme II
Annual Report 2008-2009 1�
Disclosure under regulation 25(11) of SeBi regulations as amendedannexure - 2
Company which have invested
Schemes in which companies have invested more than 5% of the Net
assets
Schemes which have invested
aggregate cost of acquisition during the year ended 31st March,
2009 rs.
outstanding as at 31st March, 2009 at Fair / Market Value
rs.Allahabad Bank TLF TDBF 1,007,403,230.32 0.00
TFF 8,143,797,268.60 0.00TFHA56 232,664,302.00 0.00TFHA70 49,454,886.40 0.00TFHA77 289,010,292.30 0.00TFHA78 771,786,256.80 0.00TFIF3A 244,184,600.55 0.00TFIPB2 345,399,117.00 0.00TFRLTF 198,216,000.00 0.00TFRSTF 1,488,756,068.10 0.00TIFA 97,929,313.00 0.00TIPF 748,799,898.03 0.00TLF 9,420,451,967.67 1,674,518,630.00TLMF 193,239,279.40 0.00TSTBF 583,725,550.00 244,712,975.00TTMF 173,399,976.35 49,285,320.00
Bharti Airtel Ltd.. TLF TCF 43,778,572.25 43,806,000.00TCS 63,509,680.00 56,322,000.00TDYF 9,439,234.00 9,387,000.00TEGF 102,597,310.20 70,997,010.00TEMF 54,006,282.50 40,677,000.00TEOF 171,567,546.26 114,771,720.00TEQPEF 9,439,234.00 9,387,000.00TGEIFA 8,226,798.50 4,380,600.00TGEIFB 67,157,848.74 55,445,880.00TIFNA 2,673,615.88 3,859,000.25TIFSA 1,335,452.77 2,647,759.80TIGIF 460,057,609.93 333,648,399.00TISF 405,255,458.00 617,664,600.00TLS 24,091,326.30 18,774,000.00TOIIS 166,564,801.79 131,418,000.00TOIOS 886,198,914.90 1,157,730,000.00TSIPF1 35,688,076.35 24,575,791.80TSIPF2 15,066,486.33 15,641,871.00TTAF1 40,639,945.51 60,233,250.00TTOFE 198,220,923.16 124,784,520.00TTSF96 48,860,283.02 41,709,570.00TYCF 14,591,194.00 12,516,000.00
Corporation Bank TIF TDBF 236,306,259.00 0.00TFF 2,482,461,416.87 391,406,800.00TFHA68 91,136,100.00 0.00TFHA75 225,868,036.00 0.00TFHA77 487,078,500.00 0.00TFIPC3 4,814,915.64 0.00TFRLTF 225,450,000.00 0.00TFRSTF 488,097,270.50 489,258,500.00TLF 3,228,645,547.23 982,891,200.00TTMF 457,180,042.95 0.00

tata SIp Fund Scheme 1 tata SIp Fund Scheme II
Annual Report 2008-2009 18
Hero Honda Motors Ltd. TFIF2A TEGF 29,687,509.00 21,403,000.00TEOF 77,057,931.40 65,901,977.30TEQPEF 27,282,832.00 0.00TIFNA 288,286.64 715,528.20TSIPF2 11,818,830.06 14,511,234.00TTAF1 22,436,267.46 29,108,080.00TTOFE 29,639,538.00 26,753,750.00TTSF96 20,776,117.26 26,860,765.00
Hindalco Industries Ltd. TFIF1A TCF 39,177,246.00 18,535,669.80TFHA68 TCS 54,491,964.00 15,570,000.00
TEQPEF 46,028,015.00 15,940,669.80TIFNA 526,976.11 295,383.75TIFSA 648,005.77 409,387.20TIGIF 279,492,188.00 0.00TISF 125,042,059.00 0.00TOIOS 1,064,567,956.00 481,187,113.20
Hindustan Zinc Ltd.. TFF TCF 19,722,393.00 13,422,000.00TFIF2A TCS 19,714,988.00 13,422,000.00TFHA78 TEGF 23,872,016.70 0.00TFHA79 TEQPEF 12,432,975.00 53,688,000.00
TGEIFA 3,992,118.00 0.00TGEIFB 23,811,663.54 0.00TISF 95,535,458.00 0.00TMCF 18,068,962.91 8,948,000.00TMPF 10,153,043.00 0.00TOIOS 198,621,787.53 402,660,000.00
ITC Ltd. TFRSTF TCF 12,365,094.50 13,860,000.00TFIF1A TDYF 26,952,147.00 0.00
TEGF 72,598,412.00 52,668,000.00TEMF 27,982,586.00 27,720,000.00TEOF 148,532,693.00 59,136,000.00TIFNA 1,236,369.39 2,227,257.65TIFSA 1,271,199.44 3,114,064.80TOIOS 56,803,650.00 0.00TSIPF1 86,816,236.67 81,570,720.00TSIPF2 8,911,690.75 10,517,892.00TTOFE 131,376,229.00 60,060,000.00TTSF96 4,282,433.50 27,720,000.00TYCF 21,711,461.00 18,480,000.00
Larsen & Toubro Ltd.. TSTBF TCBF 24,104,594.00 23,542,750.00TCS 12,100,685.00 0.00TEGF 144,498,703.00 12,768,242.30TEMF 56,263,156.00 41,637,035.00TEOF 146,809,042.50 24,842,309.80TEQPEF 24,669,421.50 0.00TGEIFA 22,629,170.68 11,939,537.50TGEIFB 104,603,272.21 45,437,507.50TIFNA 1,075,656.58 1,272,303.00TIFSA 1,360,431.32 2,254,722.80TIGIF 435,683,073.50 407,063,564.60TINR 15,137,734.00 6,053,850.00
tata SIp Fund Scheme 1 tata SIp Fund Scheme II
Annual Report 2008-2009 19
TISF 378,891,555.20 305,027,268.15TOIIS 221,611,594.10 0.00TOIOS 217,552,843.50 0.00TSIPF1 55,782,747.20 61,764,068.30TSIPF2 10,306,125.03 11,189,532.75TTAF1 15,386,299.00 20,179,500.00TTOFE 133,330,152.90 26,334,247.50TTSF96 13,454,590.00 16,816,250.00TYCF 0.00 8,206,330.00
Patni Computer Systems Ltd.. TFIF1A TCF 9,133,280.75 18,998,000.00TCS 17,053,104.00 20,608,000.00TDYF 16,498,179.00 19,320,000.00TEQPEF 29,461,700.40 35,033,600.00TLS 1,851,988.00 15,146,493.60TSIF 21,329,728.50 24,472,000.00
Sesa Goa Ltd. TFHA78 TGEIFB 26,356,288.55 0.00TIGIF 16,147,717.50 0.00TISF 0.00 0.00TMIF 2,018,758.25 0.00TSIPF1 20,056,778.84 0.00
Shree Cement Ltd.. TFIF2A TCS 2,147,272.61 14,276,607.80TEQPEF 15,306,545.14 16,735,940.00TOIIS 16,221,412.34 28,761,705.70TOIOS 9,937,119.65 123,932,472.30
Sterlite Industries (I) Ltd. TFF TCF 7,421,509.40 0.00TFHA68 TEGF 33,185,207.00 19,560,750.00
TGEIFA 7,448,720.00 0.00TGEIFB 24,243,037.00 0.00TIFNA 606,226.76 707,332.80TIFSA 1,104,333.08 643,370.85TIGIF 283,950,788.00 71,130,000.00TISF 321,841,414.00 117,364,500.00TOIIS 53,874,535.00 33,786,750.00TTAF1 32,732,454.50 8,891,250.00TTOFE 64,133,037.00 44,456,250.00TTSF96 32,725,800.00 8,891,250.00
Sundaram BNP Paribas Home Finance Ltd.. TFRSTF TDBF 88,671,403.30 0.00
TFF 243,614,250.00 0.00TFHA63 78,027,755.17 0.00TFHA66 147,209,960.93 0.00TFIPA1 59,741,553.40 0.00TFIPA2 100,780,322.18 0.00TLF 148,128,974.94 0.00TTMF 88,698,545.68 0.00
Tata Consultancy Services Ltd.. TLF TIFNA 1,262,812.12 1,696,971.05TFIF1A TIFSA 423,290.34 726,840.00
Tata Steel Ltd.. TLF TCF 30,460,252.00 0.00TCS 63,810,286.50 0.00

tata SIp Fund Scheme 1 tata SIp Fund Scheme II
Annual Report 2008-2009 20
TEGF 6,694,748.00 0.00TEOF 60,258,850.00 0.00TEQPEF 70,569,758.80 0.00TGEIFA 16,272,366.40 0.00TGEIFB 55,785,052.60 0.00TIFNA 591,840.53 519,073.90TIFSA 530,280.27 671,560.00TIGIF 64,133,207.00 0.00TINR 16,644,181.40 0.00TISF 142,245,194.00 0.00TSIPF1 42,137,655.50 28,737,000.00TTAF1 42,006,473.50 8,240,000.00TTOFE 31,713,709.00 0.00TTSF96 14,958,900.50 0.00
Kansai Nerolac Paints Ltd. TFIF1A TDYF 0.00 9,959,177.00TEQPEF 0.00 10,853,917.00
0.00 0.00ICICI Home Finance Company Ltd. TFRSTF TDBF 898,600,348.00 0.00
TFF 881,034,637.00 0.00TFHA56 50,410,760.00 0.00TFHA59 151,232,279.00 0.00TFHA61 100,821,519.00 0.00TFHA62 191,173,431.00 0.00TFHA63 89,816,626.00 0.00TFHA66 182,781,121.00 0.00TFHA70 84,344,127.00 0.00TFHA74 150,183,063.00 0.00TFHA75 753,005,096.00 765,584,587.00TFHA76 338,785,485.00 0.00TFHA78 700,722,458.00 391,272,962.00TFHA79 150,000,000.00 150,779,586.00TFIF2B 624,618,429.00 635,686,051.00TFIF4A 20,025,367.00 20,103,945.00TFIF4B 120,008,054.00 60,311,834.00TFIPA2 224,278,500.00 0.00TFRSTF 792,454,154.00 38,249,940.00TIFA 44,655,950.00 0.00TIPF 135,522,860.00 0.00TLF 2,280,926,783.00 191,427,871.00TLMF 46,659,907.00 0.00TMIF 29,878,790.00 0.00TMPF 49,797,983.00 0.00TOIIS 254,024,064.00 0.00TSTBF 89,311,900.00 0.00TTMF 183,141,336.00 0.00
tata SIp Fund Scheme 1 tata SIp Fund Scheme II
Annual Report 2008-2009 21
Tata Sip Fund Scheme-1 Portfolio as at 31st March, 2009
Annexure 3
Name of the Instrument Market/ Fair Value(Rs)
% to NAV
% to Category
(I) EQUITY SHARESAuto Ancillaries 8,008,210 0.44 0.62Amara Raja Batteries Ltd. 8,008,210Banks 142,151,258 7.88 11.09Union Bank of India 41,178,463State Bank of India 40,646,220Bank of Baroda 32,016,075Federal Bank Ltd. . 28,310,500Construction 2,754,728 0.15 0.21Madhucon Projects Ltd. 2,754,728Consumer Non Durables 183,534,447 10.17 14.32ITC Ltd. 81,570,720United Spirits Ltd. 45,773,588Colgate-Palmolive India Ltd. 25,034,485Titan Industries Ltd. 24,332,880Bata India Ltd. 6,822,774Ferrous Metals 45,524,731 2.52 3.55Tata Steel Ltd. 28,737,000Welspun Gujarat Stahl Rohren Ltd. 16,787,731Fertilisers 40,150,620 2.23 3.13Chambal Fertilisers & Chemicals Ltd. 30,997,620Tata Chemicals Ltd. 9,153,000Finance 68,114,600 3.77 5.31Power Finance Corporation Ltd. 51,947,000LIC Housing Finance Ltd. 16,167,600Gas 108,129,119 5.99 8.44Gujarat State Petronet Ltd. 61,165,100Indraprastha Gas Ltd. 33,316,550Gail (India) Ltd. 13,647,469Industrial Capital Goods 74,763,620 4.14 5.83Larsen & Toubro Ltd. 61,764,068Jyoti Structures Ltd. 11,115,047Emco Ltd. 1,884,505Media & Entertainment 31,061,575 1.72 2.42Sun TV Network Ltd. 31,061,575Oil 95,654,078 5.30 7.46Oil & Natural Gas Corporation Ltd. 91,957,818Shiv-Vani Oil & Gas Exploration Services Ltd. 3,696,260Petroleum Products 88,914,400 4.93 6.94Reliance Industries Ltd. 60,928,000Hindustan Petroleum Corporation Ltd. 27,986,400Pharmaceuticals 97,835,236 5.42 7.63Lupin Ltd. 71,559,636Opto Circuits (India) Ltd. 26,275,600
tata SIp Fund Scheme 1 tata SIp Fund Scheme II
Annual Report 2008-2009 22
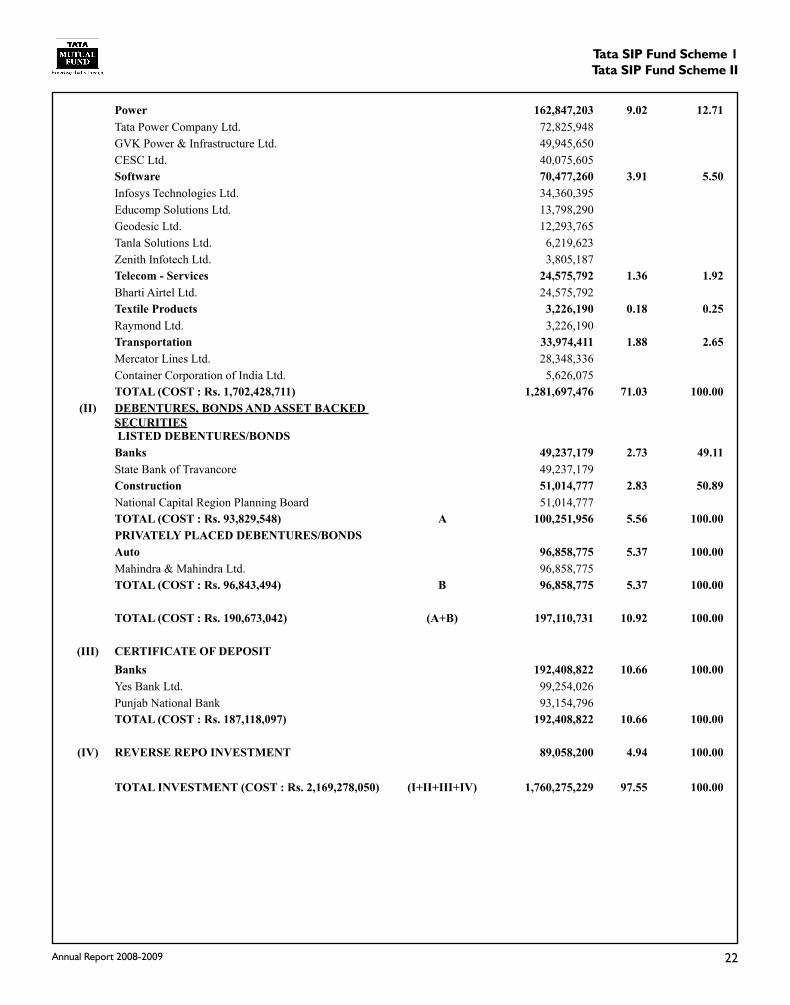
Power 162,847,203 9.02 12.71Tata Power Company Ltd. 72,825,948GVK Power & Infrastructure Ltd. 49,945,650CESC Ltd. 40,075,605Software 70,477,260 3.91 5.50Infosys Technologies Ltd. 34,360,395Educomp Solutions Ltd. 13,798,290Geodesic Ltd. 12,293,765Tanla Solutions Ltd. 6,219,623Zenith Infotech Ltd. 3,805,187Telecom - Services 24,575,792 1.36 1.92Bharti Airtel Ltd. 24,575,792Textile Products 3,226,190 0.18 0.25Raymond Ltd. 3,226,190Transportation 33,974,411 1.88 2.65Mercator Lines Ltd. 28,348,336Container Corporation of India Ltd. 5,626,075TOTAL (COST : Rs. 1,702,428,711) 1,281,697,476 71.03 100.00
(II) DEBENTURES, BONDS AND ASSET BACKED SECURITIES LISTED DEBENTURES/BONDSBanks 49,237,179 2.73 49.11State Bank of Travancore 49,237,179Construction 51,014,777 2.83 50.89National Capital Region Planning Board 51,014,777TOTAL (COST : Rs. 93,829,548) A 100,251,956 5.56 100.00PRIVATELY PLACED DEBENTURES/BONDSAuto 96,858,775 5.37 100.00Mahindra & Mahindra Ltd. 96,858,775TOTAL (COST : Rs. 96,843,494) B 96,858,775 5.37 100.00
TOTAL (COST : Rs. 190,673,042) (A+B) 197,110,731 10.92 100.00
(III) CERTIFICATE OF DEPOSITBanks 192,408,822 10.66 100.00Yes Bank Ltd. 99,254,026Punjab National Bank 93,154,796TOTAL (COST : Rs. 187,118,097) 192,408,822 10.66 100.00
(IV) REVERSE REPO INVESTMENT TSIPF1 89,058,200 4.94 100.00
TOTAL INVESTMENT (COST : Rs. 2,169,278,050) (I+II+III+IV) 1,760,275,229 97.55 100.00
tata SIp Fund Scheme 1 tata SIp Fund Scheme II
Annual Report 2008-2009 2�
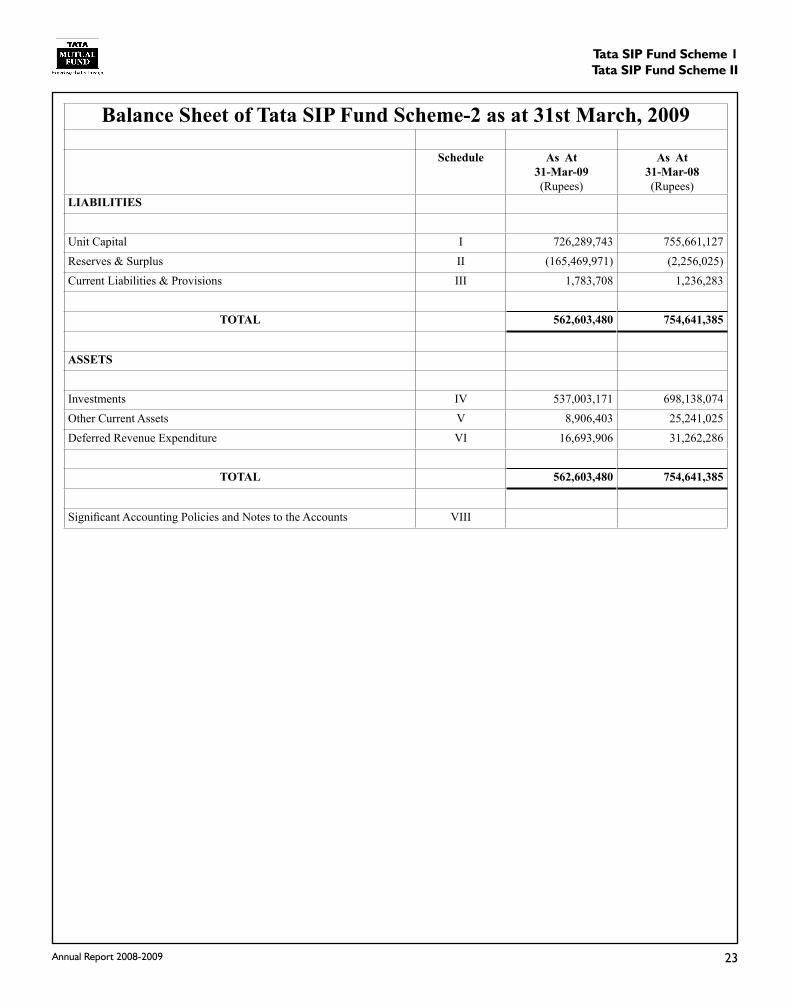
Balance Sheet of Tata SIP Fund Scheme-2 as at 31st March, 2009
Schedule As At31-Mar-09(Rupees)
As At31-Mar-08(Rupees)
LIABILITIES
Unit Capital I 726,289,743 755,661,127 Reserves & Surplus II (165,469,971) (2,256,025)Current Liabilities & Provisions III 1,783,708 1,236,283
TOTAL 562,603,480 754,641,385
ASSETS
Investments IV 537,003,171 698,138,074 Other Current Assets V 8,906,403 25,241,025 Deferred Revenue Expenditure VI 16,693,906 31,262,286
TOTAL 562,603,480 754,641,385
Significant Accounting Policies and Notes to the Accounts VIII
tata SIp Fund Scheme 1 tata SIp Fund Scheme II
Annual Report 2008-2009 2�
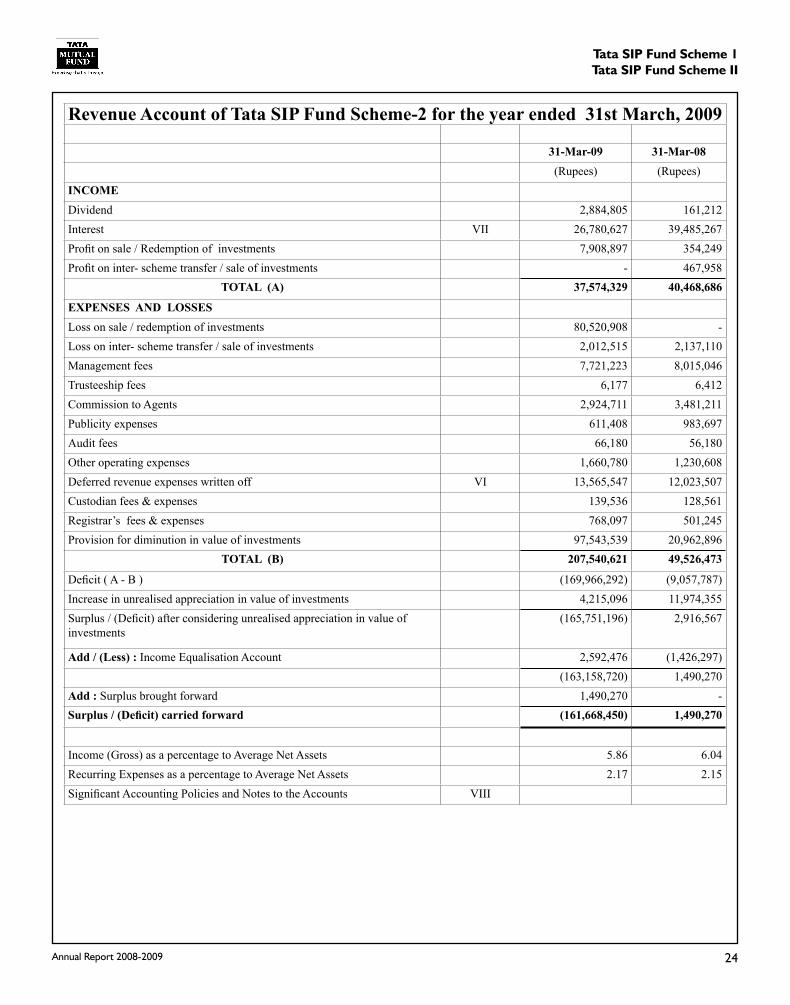
Revenue Account of Tata SIP Fund Scheme-2 for the year ended 31st March, 2009
31-Mar-09 31-Mar-08(Rupees) (Rupees)
INCOMEDividend 2,884,805 161,212 Interest VII 26,780,627 39,485,267 Profit on sale / Redemption of investments 7,908,897 354,249 Profit on inter- scheme transfer / sale of investments - 467,958
TOTAL (A) 37,574,329 40,468,686
EXPENSES AND LOSSESLoss on sale / redemption of investments 80,520,908 - Loss on inter- scheme transfer / sale of investments 2,012,515 2,137,110 Management fees 7,721,223 8,015,046 Trusteeship fees 6,177 6,412 Commission to Agents 2,924,711 3,481,211 Publicity expenses 611,408 983,697 Audit fees 66,180 56,180 Other operating expenses 1,660,780 1,230,608 Deferred revenue expenses written off VI 13,565,547 12,023,507 Custodian fees & expenses 139,536 128,561 Registrar’s fees & expenses 768,097 501,245 Provision for diminution in value of investments 97,543,539 20,962,896
TOTAL (B) 207,540,621 49,526,473
Deficit ( A - B ) (169,966,292) (9,057,787)Increase in unrealised appreciation in value of investments 4,215,096 11,974,355 Surplus / (Deficit) after considering unrealised appreciation in value of investments
(165,751,196) 2,916,567
Add / (Less) : Income Equalisation Account 2,592,476 (1,426,297) (163,158,720) 1,490,270
Add : Surplus brought forward 1,490,270 - Surplus / (Deficit) carried forward (161,668,450) 1,490,270
Income (Gross) as a percentage to Average Net Assets 5.86 6.04 Recurring Expenses as a percentage to Average Net Assets 2.17 2.15 Significant Accounting Policies and Notes to the Accounts VIII

tata SIp Fund Scheme 1 tata SIp Fund Scheme II
Annual Report 2008-2009 2�
As At31-Mar-09(Rupees)
As At31-Mar-08(Rupees)
Schedule I - Unit Capital
Initial Capital
(90,930,234.899 units of the face value of Rs. 10/- each) 909,302,349 909,302,349
Unit Capital
Opening Balance
(75,566,112.723 units (previous year 90,930,234.899 units) of the face value of Rs. 10/- each) 755,661,127 909,302,349 Less : Units repurchased during the year
(2,937,138.438 units (previous year 15,364,122.176 units ) of the face value of Rs.10/- each) 29,371,384 153,641,222 Units Closing Balance
(72,628,974.285 units (previous year 75,566,112.723 units) of the face value of Rs. 10/- each) 726,289,743 755,661,127
Schedule II - Reserves & SurplusUnit Premium ReserveOpening Balance (3,746,295) - Less : Deduction during the year (55,226) (3,746,295)Closing Balance (3,801,521) (3,746,295)Revenue Account (161,668,450) 1,490,270
(165,469,971) (2,256,025)
Schedule III - Current Liabilities & ProvisionsCurrent LiabilitiesManagement Fees Payable 291,050 391,901 Trusteeship Fees Payable 5,446 5,676 Selling Commission / Brokerage 385,519 318,796 Advertisement & Publicity 241,787 122,972 Audit Fees 66,180 56,180 Custodian Fees & Expenses 11,650 16,280 Registrar’s Fees & Expenses 106,336 106,688 Other Expenses 675,740 217,790
1,783,708 1,236,283
Schedule IV - Investments (Market / Yield to maturity / Fair value)Equity Shares 331,439,045 197,302,160Privately Placed Debentures / Bonds 18,552,149 136,541,379Debentures listed / awaiting listing on recognised stock exchange 151,282,675 346,770,732Reverse Repos 35,729,302 17,523,803
537,003,171 698,138,074
tata SIp Fund Scheme 1 tata SIp Fund Scheme II
Annual Report 2008-2009 2�
As At31-Mar-09(Rupees)
As At31-Mar-08(Rupees)
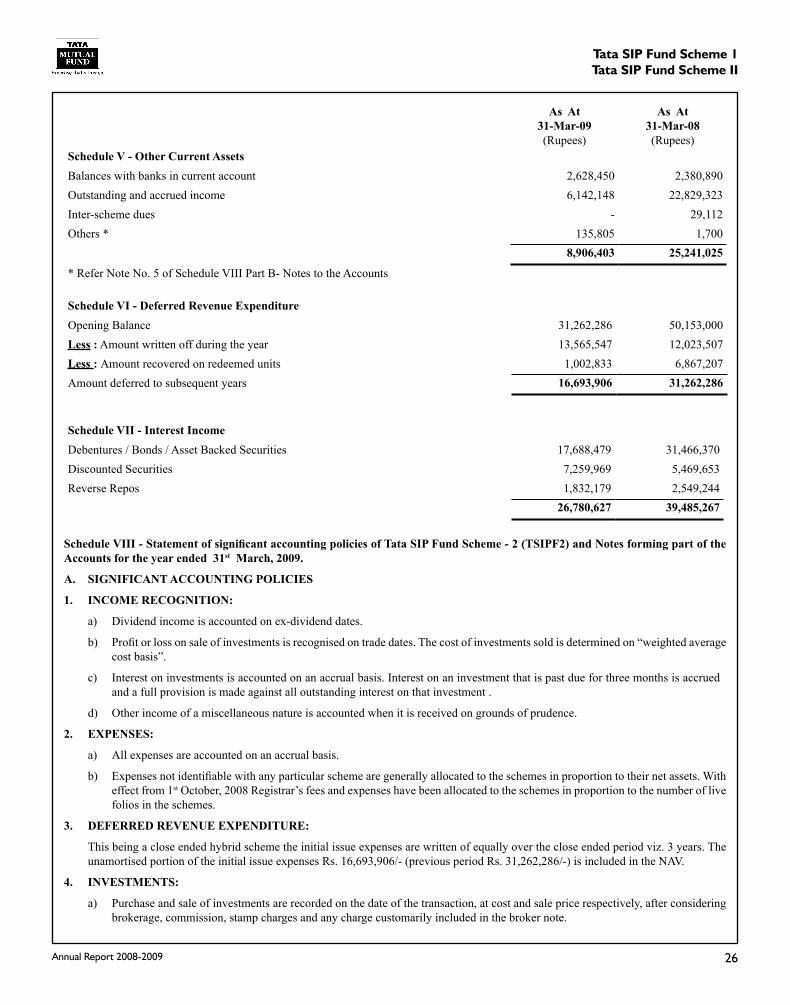
Schedule V - Other Current AssetsBalances with banks in current account 2,628,450 2,380,890 Outstanding and accrued income 6,142,148 22,829,323 Inter-scheme dues - 29,112 Others * 135,805 1,700
8,906,403 25,241,025
* Refer Note No. 5 of Schedule VIII Part B- Notes to the Accounts
Schedule VI - Deferred Revenue ExpenditureOpening Balance 31,262,286 50,153,000 Less : Amount written off during the year 13,565,547 12,023,507 Less : Amount recovered on redeemed units 1,002,833 6,867,207 Amount deferred to subsequent years 16,693,906 31,262,286
Schedule VII - Interest IncomeDebentures / Bonds / Asset Backed Securities 17,688,479 31,466,370 Discounted Securities 7,259,969 5,469,653 Reverse Repos 1,832,179 2,549,244
26,780,627 39,485,267
Schedule VIII - Statement of significant accounting policies of Tata SIP Fund Scheme - 2 (TSIPF2) and Notes forming part of the Accounts for the year ended 31st March, 2009.
A. SIGNIFICANT ACCOUNTING POLICIES
1. INCOME RECOGNITION:
a) Dividend income is accounted on ex-dividend dates.
b) Profit or loss on sale of investments is recognised on trade dates. The cost of investments sold is determined on “weighted average cost basis”.
c) Interest on investments is accounted on an accrual basis. Interest on an investment that is past due for three months is accrued and a full provision is made against all outstanding interest on that investment .
d) Other income of a miscellaneous nature is accounted when it is received on grounds of prudence.
2. EXPENSES:
a) All expenses are accounted on an accrual basis.
b) Expenses not identifiable with any particular scheme are generally allocated to the schemes in proportion to their net assets. With effect from 1st October, 2008 Registrar’s fees and expenses have been allocated to the schemes in proportion to the number of live folios in the schemes.
3. DEFERRED REVENUE EXPENDITURE:
This being a close ended hybrid scheme the initial issue expenses are written of equally over the close ended period viz. 3 years. The unamortised portion of the initial issue expenses Rs. 16,693,906/- (previous period Rs. 31,262,286/-) is included in the NAV.
4. INVESTMENTS:
a) Purchase and sale of investments are recorded on the date of the transaction, at cost and sale price respectively, after considering brokerage, commission, stamp charges and any charge customarily included in the broker note.
tata SIp Fund Scheme 1 tata SIp Fund Scheme II
Annual Report 2008-2009 2�
b) Rights entitlement pending formal allotment is accounted as investments at issue price plus acquisition cost, if any.
c) Bonus entitlement is recognised on ex-bonus dates.
5. PORTFOLIO VALUATION FOR NAV CALCULATION
i. Traded Securities (Other than Floating Rate Debt Securities):
Traded Securities are valued at year-end closing market rates on the principal stock exchange on which the security is traded (excluding accrued interest, if any, which is accounted separately).
In the absence of a quoted price on the valuation date for equity instruments, the last available quoted price within a period of Fifteen days prior to the valuation date is used for valuation purposes.
ii. Thinly Traded Securities (Other than Floating Rate Debt Securities) :
Thinly traded equity / equity related securities are those securities whose trade in a month, are both less than Rs.5 lacs and the total volume is less than 50,000 shares. These have been valued on the basis of valuation principles laid down by The Securities and Exchange Board of India (SEBI) for the same.
iii. Non-Traded Securities :
a. Non-Traded/Thinly Traded Debt Securities/Asset Backed Securities (other than Floating Rate Debt Securities) of over 182 days to maturity are valued in good faith on a yield to maturity basis by Tata Asset Management Limited (TAML).
The non – traded debt securities have been classified by TAML as “investment grade” and “below investment grade” as at 31st March, 2009. The values applied by TAML for “investment grade” debt securities are on the basis of valuation yields determined by Credit Rating Information Services of India Limited (CRISIL). In the opinion of TAML, these yields determine fair and reasonable values and such basis of valuation is approved by the Tata Trustee Company Private Limited. These securities have been valued on the basis of valuation principles laid down by SEBI for the same.
Non – traded debt securities with residual maturity of upto 182 days are valued on the basis of amortisation (cost plus accrued interest till the beginning of the day plus the difference between the redemption value (inclusive of interest) and the cost spread uniformly over the remaining maturity period of the instrument).
This basis of valuation is in accordance with SEBI guidelines.
b. Valuation of non traded/thinly traded debt securities with floating rate of interest upto 182 Days to the Interest Reset Date/Maturity Date :
The non-traded / thinly traded floating rate debt securities with a residual maturity / next reset date upto 182 days are valued on the basis of amortisation (cost plus accrued interest till the beginning of the day plus the difference between the redemption value and the cost spread uniformly over the remaining maturity / interest reset period of the instruments) in the absence of any other standard benchmarks in the market.
c. Floating Rate Debt Securities with Put/Call options :
The floating rate debt securities with put/call options shall be valued in terms of the Valuation Guidelines specified above taking into consideration the next interest rate reset date instead of the final maturity date in the absence of any other guidelines from SEBI.
The aggregate fair value of “investment grade” debt securities as at 31st March, 2009 is Rs.169,834,824/- (previous period Rs.483,312,111/-). The value of “below investment grade” debt securities as at 31st March, 2009 is Rs. Nil (previous period Rs.Nil). . The balances existing as maturity proceeds due but not received and fully provided Rs. Nil (previous period Rs.Nil).
iv. Money Market Securities :
Money Market instruments which are not traded are valued on the basis of amortisation (cost plus accrued interest till the beginning of the day plus the difference uniformly amortised over the remaining maturity period of the instrument).
For Money Market Instruments which are traded, the difference between the traded price and the cost plus accrued interest is booked as unrealised gain or loss on that day and from the next day the unrealised gain or loss is amortised over the remaining period to maturity in such a manner that on the maturity date, the value of security matches the face value.
v. Asset backed Securities :
Asset backed securities in the form of Pass-Through Certificates (non coupon bearing) are valued at discounted value of future cash inflows whereas coupon bearing Pass-Through Certificates are valued at cost.
tata SIp Fund Scheme 1 tata SIp Fund Scheme II
Annual Report 2008-2009 28
vi. CBLO Investment:
CBLO investments are valued at cost.
vii. Reverse Repo Investment :
Investment bought on Repo basis are valued at cost.
viii. Unrealised Gain / Loss in value of Investments :
Following the issue of the Guidance Note on Accounting for Investments in the Financial Statements of Mutual Funds by the Institute of Chartered Accountants of India, the appreciation / diminution in investments is worked out on individual basis. The value of diminution as at the year end is reflected in the Revenue Account. Unrealised appreciation as at the year end is also routed through the Revenue Account but is reduced from the distributable income at the time of income distribution.
6. INCOME EQUALISATION RESERVE :
Income Equalisation Reserve is being maintained by crediting / (debiting) the equalisation account in respect of sale / (repurchase) of units by an appropriate amount which represents the distributable income at the time of sale / (repurchase). It is reflected in the Revenue Account after the net excess / deficit of the scheme is determined.
7. UNIT PREMIUM RESERVE :
On repurchase / redemption / resale of units, the difference between the unit face value and the NAV (after adjusting income equalisation reserve) is disclosed as “Unit Premium Reserve”.
B. Notes attached to and forming part of the accounts for the year ended 31st March, 2009
1. The aggregate value of purchases and sales of investments for the year ended 31st March, 2009 expressed as a percentage of average weekly net assets is as under :
Particulars As at 31-3-09 As at 31-3-08Value*
Rs.% Value*
Rs.%
Aggregate value of Purchases 1,432,901,066 223.39 2,119,606,070 237.72Aggregate value of Sales 1,472,837,503 229.62 269,329,979 30.21
*The amounts do not include reverse repo transactions.
2. Investments made in group / associate companies.
(Refer Annexure 1).
3. Investments made by the schemes of Tata Mutual Fund in companies or their subsidiaries (to the extent of information available) that have invested more than 5% of the net assets as at 31st March, 2009 of any scheme of the fund, in terms of Regulation 25 (11).
(Refer Annexure 2).
4. Statement of Portfolio with industry wise classification as at 31st March, 2009.
(Refer Annexure 3).
5. Amount receivable from AMC Rs.135,805/- (previous period Rs.1,700/-) is included under “Others” in “Other Current Assets”.
6. In accordance with the Rules and Regulations of the scheme, Management Fees are paid at the rate of 1.25% of the daily net assets upto Rs.100 crores and 1.00% of the daily net assets above Rs.100 crores (previous period : 1.25% of the daily net assets upto Rs.100 crores and 1.00% of the daily net assets above Rs.100 crores ) and Trusteeship Fees are paid at the rate of 0.0010% of the daily net assets (previous period : 0.0010% of the daily net assets).
7. Contingent liabilities as at 31st March, 2009 are Rs.Nil (previous period Rs. Nil).
8. Disclosure under Regulation 25(8) of the SEBI Regulation have been made in the table below in respect of amounts paid to parties associated with sponsors in which the Asset Management Company or its major sharehloders have a substantial interest.
Name of the Company Nature of Payment 2008-09Rs.
Period from 10-05-2007 to 31-03-2008
Rs.
% equity capital held by the sponsors and its subsidiary / associates as at 31st March,
2009Tata Securities Private Limited Selling Commission 1,238 14,701 #Tata Asset Management Limited Management Fees 7,721,223 8,015,046 100%*
tata SIp Fund Scheme 1 tata SIp Fund Scheme II
Annual Report 2008-2009 29
Tata Trustee Company Private Limited
Trusteeship Fees 6,177 6,412 100%**
# Extent of holding by principal shareholders of the sponsors and its subsidiary / associates not available
* Tata Sons Limited – 67.90% and Tata Investment Corporation Limited – 32.10%
** Tata Sons Limited – 50.00% and Tata Investment Corporation Limited – 50.00%
9. Net Asset Value Per Unit (Rs.) :
Particulars As at 31-03-09 As at 31-03-08Face Value 10.00 10.00Net Asset Value Growth
Dividend7.72187.7217
GrowthDividend
9.97019.9702
10. Unprovided diminution and unrealised appreciation in the value of investments.
Particulars 2008-09Rs.
Period from 10-05-2007 to 31-03-2008
Rs.Unrealised appreciation 16,189,451 11,974,355Unprovided diminution 0 0
11. There are no unit holders holding over 25% of the Net Asset Value of the Scheme as at 31st March, 2009.
12. Unclaimed redemption/dividend amount, since the inception of the scheme has been invested separately, only in money market instruments and the investors who have claimed their dividend amount have been paid alongwith the appreciation earned on this amount as per SEBI circular MFD / CIR/9/120/2000 dated 24th November, 2000. As at 31st March, 2009 the unclaimed redemption/dividend amount is Rs.Nil (previous period Rs. Nil).
13. In accordance with Regulation 44 (1) of the SEBI (Mutual Funds) Regulations, 1996, securities purchased should be held in the name of the scheme. As at 31st March, 2009, reverse repos aggregating to Rs. 35,729,302/- (previous period Rs. 17,523,803/-) are held in the name of Tata Trustee Company Private Limited A/c Tata Mutual Fund.
14. The Expert Advisory Committee (EAC) of the Institute of Chartered Accountants of India (ICAI) has opined that the Accounting Standards on Cash Flow Statement (AS-3), Segment Reporting (AS-17) and Related Party Disclosures (AS-18) issued by the ICAI are applicable to financial statements of schemes of mutual funds. The Management of Tata Asset Management Limited (AMC) is of the view that mutual funds are governed by a self contained regulatory framework, i.e. the SEBI Regulations, the Ninth and Eleventh Schedules of which lay down the specific Accounting Policies and Standards to be adopted and the disclosures to be made. Accordingly, the financial statements have been prepared on the basis of the SEBI Regulations.
15. Prior period comprises the period beginning from 10th May, 2007 to 31st March, 2008, hence the prior period figures are strictly not comparable with current year. The figures for the previous period have been regrouped and reclassified wherever necessary.

tata SIp Fund Scheme 1 tata SIp Fund Scheme II
Annual Report 2008-2009 �0
Portfolio as at 31st March, 2009 Annexure 3
Name of the Instrument Market/ Fair Value(Rs)
% to NAV
% to Category
(I) EQUITY SHARESAuto Ancillaries 5,769,840 1.03 1.74Exide Industries Ltd. 5,769,840Auto 14,511,234 2.59 4.38Hero Honda Motors Ltd. 14,511,234Banks 49,313,362 8.79 14.88HDFC Bank Ltd. 16,346,987State Bank of India 13,242,285Bank of Baroda 10,201,752ICICI Bank Ltd. 9,522,338Cement 5,483,700 0.98 1.65Rain Commodities Ltd. 5,483,700Construction 4,976,790 0.89 1.50Punj Llyod Ltd. 4,976,790Consumer Non Durables 47,246,989 8.42 14.26Hindustan Unilever Ltd. 12,461,433United Spirits Ltd. 10,906,054ITC Ltd. 10,517,892Dabur India Ltd. 7,136,010Nestle India Ltd. 6,225,600Ferrous Metals 14,709,884 2.62 4.44Jindal Steel & Power Ltd. 9,372,090Usha Martin Ltd. 5,337,794Fertilisers 4,152,044 0.74 1.25Tata Chemicals Ltd. 4,152,044Finance 10,389,600 1.85 3.13Rural Electrification Corporation Ltd. 10,389,600Industrial Capital Goods 30,820,877 5.50 9.30Bharat Heavy Electricals Ltd. 12,726,801Larsen & Toubro Ltd. 11,189,532Voltamp Transformers Ltd. 3,767,340Crompton Greaves Ltd. 3,137,204Media & Entertainment 5,662,700 1.01 1.71Sun TV Network Ltd. 5,662,700Oil 16,919,490 3.02 5.10Oil & Natural Gas Corporation Ltd. 16,919,490Petroleum Products 28,769,743 5.13 8.68Reliance Industries Ltd. 18,893,773Hindustan Petroleum Corporation Ltd. 9,875,970Pharmaceuticals 34,660,664 6.18 10.46Divi’s Laboratories Ltd. 9,297,600Lupin Ltd. 7,532,956Sun Pharmaceuticals Ltd. 6,373,766Dishman Pharmaceuticals & Chemicals Ltd. 6,008,103Ranbaxy Laboratories Ltd. 5,448,240
tata SIp Fund Scheme 1 tata SIp Fund Scheme II
Annual Report 2008-2009 �1
Power 8,320,868 1.48 2.51National Thermal Power Corporation Ltd. 6,018,680KEC International Ltd. 2,302,189Software 34,089,389 6.08 10.29Mphasis Ltd. 13,844,400Infosys Technologies Ltd. 12,367,093Oracle Financials Services Software 5,302,083Financial Technologies India Ltd. 1,630,337Tanla Solutions Ltd. 945,475Telecom - Services 15,641,871 2.79 4.72Bharti Airtel Ltd. 15,641,871TOTAL (COST : Rs. 440,738,610) 331,439,045 59.10 100.00
(II) DEBENTURES, BONDS AND ASSET BACKED SECURITIESLISTED DEBENTURES/BONDSBanks 100,669,572 17.95 66.54Export Import Bank of India 100,669,572Consumer Non Durables 50,613,103 9.02 33.46Tata Tea Ltd. 50,613,103TOTAL (COST : Rs. 146,870,716) A 151,282,675 26.98 100.00
PRIVATELY PLACED DEBENTURES/BONDSFinance 18,552,149 3.31 100.00Housing Development Finance Corporation Ltd. 18,552,149TOTAL (COST : Rs. 15,981,528) B 18,552,149 3.31 100.00
TOTAL (COST : Rs. 162,852,244) (A+B) 169,834,824 30.28 100.00
(III) REVERSE REPO INVESTMENT TSIPF2 35,729,302 6.37 100.00
TOTAL INVESTMENT (COST : Rs. 639,320,156) (I+II+III) 537,003,171 95.75 100.00
tata SIp Fund Scheme 1 tata SIp Fund Scheme II
Annual Report 2008-2009 �2
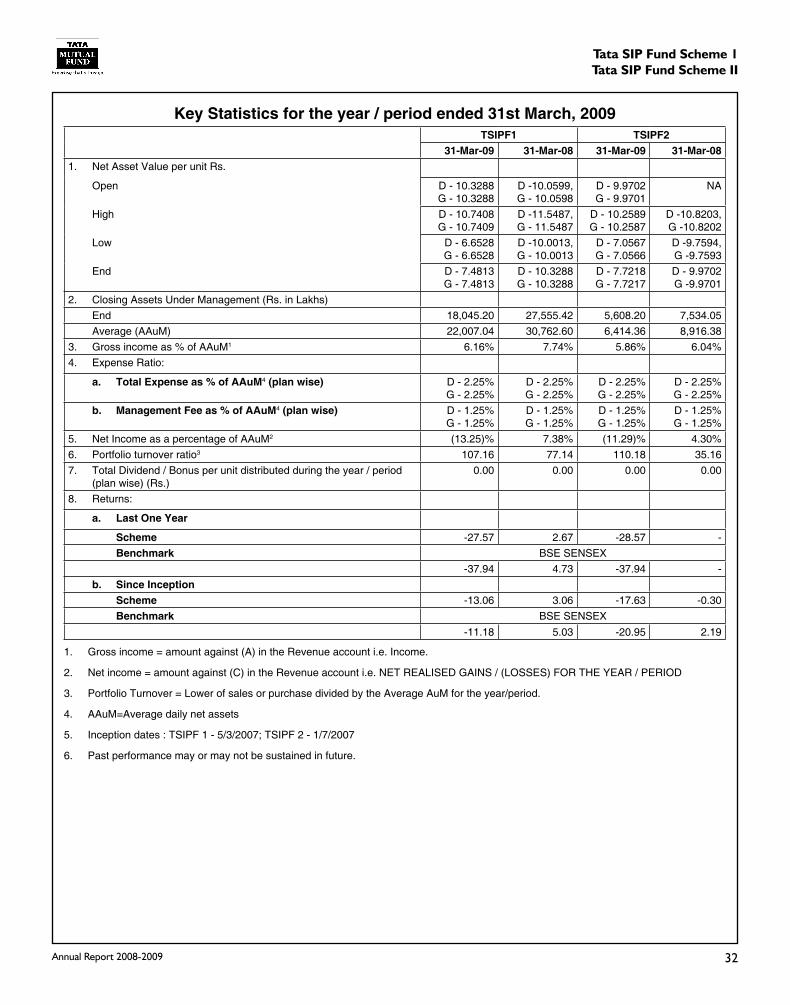
Key Statistics for the year / period ended 31st March, 2009tSiPF1 tSiPF2
31-Mar-09 31-Mar-08 31-Mar-09 31-Mar-081. Net Asset Value per unit Rs.
Open D - 10.3288 G - 10.3288
D -10.0599, G - 10.0598
D - 9.9702 G - 9.9701
NA
High D - 10.7408 G - 10.7409
D -11.5487, G - 11.5487
D - 10.2589 G - 10.2587
D -10.8203, G -10.8202
Low D - 6.6528 G - 6.6528
D -10.0013, G - 10.0013
D - 7.0567G - 7.0566
D -9.7594, G -9.7593
End D - 7.4813G - 7.4813
D - 10.3288G - 10.3288
D - 7.7218G - 7.7217
D - 9.9702G -9.9701
2. Closing Assets Under Management (Rs. in Lakhs) End 18,045.20 27,555.42 5,608.20 7,534.05 Average (AAuM) 22,007.04 30,762.60 6,414.36 8,916.38 3. Gross income as % of AAuM1 6.16% 7.74% 5.86% 6.04%4. ExpenseRatio:
a. total expense as % of aauM4 (plan wise) D - 2.25% G - 2.25%
D - 2.25% G - 2.25%
D - 2.25% G - 2.25%
D - 2.25% G - 2.25%
b. Management Fee as % of aauM4 (plan wise) D - 1.25% G - 1.25%
D - 1.25% G - 1.25%
D - 1.25% G - 1.25%
D - 1.25% G - 1.25%
5. Net Income as a percentage of AAuM2 (13.25)% 7.38% (11.29)% 4.30%6. Portfolio turnover ratio3 107.16 77.14 110.18 35.16 7. Total Dividend / Bonus per unit distributed during the year / period
(plan wise) (Rs.)0.00 0.00 0.00 0.00
8. Returns:
a. last one year
Scheme -27.57 2.67 -28.57 - Benchmark BSE SENSEX
-37.94 4.73 -37.94 - b. Since inception Scheme -13.06 3.06 -17.63 -0.30 Benchmark BSE SENSEX
-11.18 5.03 -20.95 2.19
1. Gross income = amount against (A) in the Revenue account i.e. Income.
2. Net income = amount against (C) in the Revenue account i.e. NET REALISED GAINS / (LOSSES) FOR THE YEAR / PERIOD
3. Portfolio Turnover = Lower of sales or purchase divided by the Average AuM for the year/period.
4. AAuM=Average daily net assets
5. Inceptiondates:TSIPF1-5/3/2007;TSIPF2-1/7/2007
6. Past performance may or may not be sustained in future.

tata SIp Fund Scheme 1 tata SIp Fund Scheme II
Annual Report 2008-2009 ��
tHiS PaGe iNteNtioNally KePt BlaNK
tata SIp Fund Scheme 1 tata SIp Fund Scheme II
Annual Report 2008-2009 ��
Statutory Details: Constitution : Tata Mutual Fund (TMF) has been set up as a Trust under the India Trust Act, 1882. Sponsors & Settlors: Tata Sons Limited and Tata Investment Corporation Limited. Trustee : Tata Trustee Company Pvt. Limited. Investment Manager: Tata Asset Management Limited. Risk Factors: • Mutual Fund and securities investments are subject to market risks and there can be no assurance and no guarantee that the schemes will achieve their objectives. • As with any investment in stocks, shares and securities the NAV of the unitsunder the schemes can go up or down, depending upon the factors and forces affecting the capital market. • Past performance of the previousSchemes, the Sponsors or its Group affiliates is not indicative of and does not guarantee the future performance of the Schemes. • Tata SIP Fund Scheme I and Tata SIP Fund Scheme II are only the names of the Schemes and do not in any manner indicate either the quality of theSchemes, its future prospects or the returns. • The sponsors are not responsible or liable for any loss resulting from the operations of thescheme beyond the initial contribution of Rs.1 lac made by them towards setting up the Mutual Fund. • Investment in fixed income securitiesare subject to interest rate risk, credit risk and liquidity risk. • Pursuant to allotment of bonus units the NAV of the schemes would fall inproportion to the bonus allotted and as a result the total value of units held by the investor would remain same. • Investment in floating rate debtinstrument is subject to Basis Risk and Spread Risk. • In case of downward movement of interest rates floating rate debt instruments will givea lower return than fixed rate debt instruments. • For scheme specific risk factors & other details please read the Scheme Information Document (SID), Statement of Additional Information (SAI) and Key Information Memorandum (KIM) of thescheme carefully before investing.
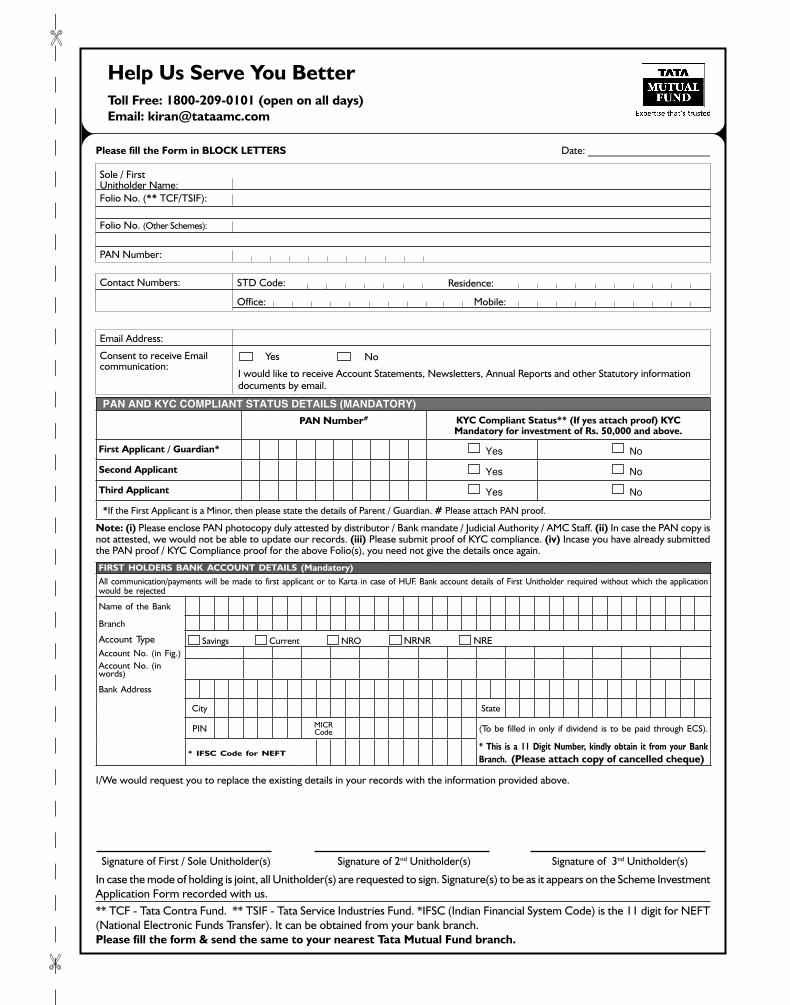
In case the mode of holding is joint, all Unitholder(s) are requested to sign. Signature(s) to be as it appears on the Scheme Investment Application Form recorded with us. ** TCF - Tata Contra Fund. ** TSIF - Tata Service Industries Fund. *IFSC (Indian Financial System Code) is the 11 digit for NEFT (National Electronic Funds Transfer). It can be obtained from your bank branch. please fill the form & send the same to your nearest tata Mutual Fund branch.
Signature of First / Sole Unitholder(s)
I/We would request you to replace the existing details in your records with the information provided above.
note: (i) Please enclose PAN photocopy duly attested by distributor / Bank mandate / Judicial Authority / AMC Staff. (ii) In case the PAN copy is not attested, we would not be able to update our records. (iii) Please submit proof of KYC compliance. (iv) Incase you have already submitted the PAN proof / KYC Compliance proof for the above Folio(s), you need not give the details once again.
PaN aND KyC CoMPliaNt StatuS DetailS (MaNDatory)pan number# KYC Compliant Status** (If yes attach proof) KYC
Mandatory for investment of rs. 50,000 and above.
First applicant / Guardian* Yes No
Second applicant Yes No
third applicant Yes No
*If the First Applicant is a Minor, then please state the details of Parent / Guardian. # Please attach PAN proof.
Help us Serve You Better
Sole / FirstUnitholder Name:
PAN Number:
Contact Numbers: Residence:
Mobile:
STD Code:
Office:
Email Address:
I would like to receive Account Statements, Newsletters, Annual Reports and other Statutory information documents by email.
Consent to receive Email communication:
Yes No
Folio No. (** TCF/TSIF):
Folio No. (Other Schemes):
Date: _______________________please fill the Form in BloCK letterS
Signature of 2nd Unitholder(s) Signature of �nd Unitholder(s)
toll Free: 1800-209-0101 (open on all days)email: [email protected]
FIrSt HolderS BanK aCCount detaIlS (Mandatory)All communication/payments will be made to first applicant or to Karta in case of HUF. Bank account details of First Unitholder required without which the application would be rejected
Name of the Bank
Branch
Account Type Savings Current NRO NRNR NRE Account No. (in Fig.)Account No. (in words)
Bank Address
City State
PIN MICR Code (To be filled in only if dividend is to be paid through ECS).
* IFSC Code for neFt* this is a 11 digit number, kindly obtain it from your Bank Branch. (please attach copy of cancelled cheque)

InveStor ServICe CentreS - aMC oFFICeS Call Free : 1800 – 209 – 0101
BOOK-POST
If undelivered please return to:tata asset Management ltd.Mulla House, Grnd Floor, Homi Modi Street, Mumbai – �00 001
WeSt Zone: Mumbai: Tata Asset Management Ltd., Mulla House, Ground Floor, �1, M.G. Road, Near Flora Fountain, Mumbai - �00 001. Tel.: 022-���1�191/92/9�, Fax: 022- ���1�19�. Borivali: Ground Floor, Shop No. 8, Victor Park, Behind Indryani Saree Shop, Chandarvarkar Road, Borivali (West), Mumbai - �00 092. Tel.: 022-��2�88�2. ahmedabad: �02, ‘Megha House’, Mithakhali - Law Garden Road, Netaji Marg, Ahmedabad - �80 00�. Tel.: 0�9- ���1 8989/ ���� ��99. Fax: 0�9-2��� �080. pune: Tata Asset Management Ltd., Office No. 10�, D-Gold House, Near Hotel Sheetal, Dnyaneshwar Paduka Chowk, F. C. Road, Shivajinagar, Pune - �11 00�. Tel.: 020-�0288���/��00�9�2, Telefax:- �0288���. Surat: �21, Jolly Plaza, Near Collector Office, Next to G.P. College, Athwa Gate, Surat - �9� 001. Tel.: 02�1-�����18 / 19, Fax: 02�1-2��0�2�. vadodara: 202- 20� Madhav Complex, RC Dutt Road,GEB Circle, Alkapuri, Vadodara - �90 00�. Tel.: 02��-���1888/2���11�, Fax: 02��-���1999. rajkot: Arhant Plaza, 201, 2nd Floor, Subhas Road, Near Moti Taki, Rajkot - ��0001. Tel.: 0281-��2�8�8/����9�9. Indore: G-2�, City Centre, �0� M.G. Road, Indore - ��2 001. Tel.: 0��1-�20180�, Fax 0��1-�20180�. Bhopal: Tata Asset Management Ltd., MF-12, Block-A, Mansarovar Complex, Near Habibganj Railway Station, Bhopal - ��2 01�. Tel.: 0���- �229��9 / �2��91� / 2���198. nashik: �, Samriddhi Residency, Opp Hotel City Pride, Tilakwadi, Nashik - �22 002. Tel.: 02��-��0�1�8 / 02��-��10�1�, Fax: 02��-2��9098. Goa: Tata Asset Mangement Ltd, FO-�, 1st Floor, Indraprastha, Above Dena Bank, Dr Shirgaonkar Road, Panjim. Goa-�0�001. Tel.: 08�2 - ���11��/��/2�221��, Fax: 08�2-2�221��. Jabalpur: TATA Asset Management Ltd., Office No. �, 11�8 , Napier Town, Home Sciences College Road, Jabalpur - �82 001(M.P.). Tel.: 0��1-�0��2��. nagpur: “Mile Stone”, 1st Floor, Near Lokmat Square, Wardha Road, Ramdaspeth, Nagpur - ��0 010, Tel.: 0�12-��� 02�� / ��0 288�. eaSt Zone: Bhubaneswar: Janpath Tower, Room-208, 2nd Flr, Ashok Nagar, Bhubaneswar - ��1009. Tel.: 0���-2���818. dhanbad: �th flr, Room No-�09, Shriram Plaza, Bank More, Dhanbad - 82� 001. Tel.: 92���02��8/0�2�-2�00�0�. durgapur: A 20�, 1st Flr, Kamdhenu Bengal Shristi Complex, City Centre, Durgapur - �1� 21�. Tel.: 99�22�19��. Guwahati: 109, 1st Flr, Orion Tower, Christian Basti, G S Road, Guwahati - �81 00� (Assam). Tel.: 0��1-2���08�. Kolkata: Tata Centre, 1st Floor, ��, J L Nehru Road, Kolkata - �00 0�1. Tel.: 0��-2288��1�/�, 22881���. Fax: 0��-22881���. Jamshedpur: C/o Mithila Motors Ltd, 1st Floor, Bistupur, Jamshedpur - 8�1 001. Tel.: 0���-2���021/22/2�/�0. raipur: ��1 & ��2, �rd Flr, Lalganga Shopping Mall, G E Road, Raipur - �92 001 (Chhattisgarh). Tel.: 0��1-2������. ranchi: Shop No 1�, A C Market, Grnd Flr, C F L Church Main Road, Ranchi - 8�� 001. Tel.: 0��1-2��0�0�/2��022�. patna: �0�, �th Flr, Ashiana Hariniwas, New Dak Bunglow Chowk, Patna - 800 001. Tel.: 0�12-220��9�/���0120. Bhilai: Shop No.1��, Ground Floor, Chauhan Estate, Near HDFC Bank, Bhilai - �90 001. Tel.: 0�88-229��2�. nortH Zone: agra: G-12, Block No.19/�, Vimal Tower, Sanjay Place, Agra - 282 002. Tel.:- 0��2-2�2�19�. allahabad: ��/1, S P Marg, 1st Floor, Opp. MAK Tower, Civil Lines, Allahabad (UP) - 211 001. Tel. :- 0��2-���1122. amritsar: Mezzanine floor, S.C.O – 2�, B Block, District Shopping Complex, Ranjit Avenue, Amritsar – 1�� 001. Tel.: 981�0 82808. Chandigarh: Cabin No.�-�-�, 1st Floor, Meeting Point, SCO - �8�/�88, Sector- ��C, Chandigarh - 1�0 022. Tel.: 01�2 - �08��22 /���0�22/2�0��20, Fax: 01�2 - 2�0���0. dehradun: Shop No. 19, Ground Floor, Shree Radha Palace, �8, Rajpur Road, Dehradun-2�8001, Uttarakhand. Tel.: 01��-���08��. Jaipur: 2��, 2nd Floor, Ganpati Plaza, M I Road, Jaipur - �02 001. Tel.: 01�1 - �10�1�� / �8 / 2�89�8� / ���9009, Fax: �10�1�8. Kanpur: �th floor, Office no. �12 - �1�, KAN Chambers, 1� / 11�, Civil Lines, Kanpur - 208 001. Tel.: 0�12 - 2�0�0��, Fax: 0�12 - 2�0�0��. delhi: �th Floor, No. E - H, Vandana building, 11, Tolstoy Marg, Connaught Place, New Delhi 110 001. Tel.: 011-���2�111/102/10�/10�/10�, Fax: 011-���0�202. lucknow: Office No.2, Saran Chambers-I, 1st Floor, �, Park Road, Lucknow - 22� 001. Tel.: 0�22-���2��2/�001��1, Fax: 0�22-22���8�. ludhiana: Cabin No. 201, 2nd. Floor, SCO 18, Opp Ludhiana Stock Exchange, Feroze Gandhi Market, Ludhiana - 1�1 001. Tel.: 01�1 - �089���/��0����, Fax: 01�1-2�1��98. Moradabad: Tata Asset Management Ltd., Ground floor, Near Hotel Rajmahal, Civil Lines, Moradabad – 2�� 001, Tel.: 0�91 - 2�10���, ����002. Jodhpur: Jaya Enclave, �9/�, Opp IDBI Bank, 1st A Road, Sardarpura, Jodhpur - ��2 001. Tel.: 0291-���0���/2��12��, Fax: 0291-2��12��. udaipur: Office No - �, 2nd Floor, Madhav Appartment, Opp GPO, Chetak Circle, Udaipur - �1� 001. Tel.: 029� - ���09�9/ 2�29��1, Fax: 029�-2�29��1. varanasi : D-��/12�, C-H Arihant Complex, Sigra, Varanasi - 221010 Tel .: 0��2 - �������. Jalandhar : 2nd Floor, Above ING Vyasya Bank, Namdev Chowk, Jalandhar 1�� 001 Tel.: 0181-�00102�/2�. SoutH Zone: Bangalore: �/�, Millers Road, High Grounds, Bangalore – ��0 0�2. Tel.: 080-����1�1� / �����98� / �����98�, Fax: 080-22��0�12. Calicut: C-8 & 9, Friends Commercial Complex, Near Federal Towers, Arayadathu Palam, Mavoor Road, Calicut - ���01�. Tel.: 0�9�-���0�08. Chennai: TATA Asset Management Ltd, Riaz Garden, �rd Floor, No:29, Kodambakkam High Road, Near Palmgrove Hotel, Nungambakkam, Chennai - �00 0��. Tel.: 0��-����18�8/�9/�8, ����18��/��. Fax: 0��-������1�. Cochin: 2nd Floor, Ajay Vihar, JOS Junction, M. G. Road, Cochin - �82 01�. Tel.: 0�8� - 2����80, ����10�, ����81�/1�/1�/1�. Fax: 0�8� - 2�� ��81. Coimbatore: ��1 A, 1st Floor, West Lokamaniya Street, Near CAMS, R. S. Puram, Coimbatore - ��1 002. Tel.: 0�22 - ��021��/��, �������, Fax: 2����8�. Hyderabad: �rd floor, Block B, R R Estate, G.S MALL, Somajiguda, Hyderabad-82. Tel.: 0�0-��9�12��/�8 & ����8290, Fax: 0�0-�����18�. Hubli: 1� & 1�, 2nd floor, Eureka Junction, Travellers Bangalow Road, Above ICICI Bank, Hubli - �80 029. Tel.: 08��-���0��2 Fax: �2�1�10. Kottayam: C S I Ascention Square, Collectrorate P. O., Kottayam - �8� 002. Tel.: 9�����92�0. Mangalore: Tata Asset Management Ltd., Essel Towers, 1st Floor, Bunts Hostel Circle, Above UTI Bank, Mangalore - ��� 00�. Tel.: 082�-���0�08. Madurai: A - 1st Floor, A.R. Plaza, No:1�/1�, North Veli Street, Madurai-�2�001. Tel.: 0��2-������0 Fax: 0��2-�2���1�. Mysore: 8��, 1st Floor , New Kantharaja Urs Road, Above New Krishna Sweets & Bakery, Kuvempu Nagar, Mysore - ��0 02�. Tel.: 0821-���0��0 Fax: �2�����. Salem: Raj Towers, Ground Floor, No: �, Brindavan Road, Fairlands, Salem - ��� 01�. Tel.: 0�2�-���1��� Fax: �0�2028. thiruvananthapuram: Krishna Tower, �th Floor, Sasthamangalam, Trivandrum - �9� 010 Tel.: 0��1-������1/2�191�9. trichy: No.�0/�, ‘Krishna’, 2nd Floor, Sastri Main Road,Tennur, Trichy - �20 01�. Tel.: 0��1-����0�0. thrissur: �th Floor, Pathayappura buildings, Round South, Thrissur - �80 001. Tel.: 0�8�-���128�. vijaywada: �th Floor, KONA Heights, Opp. All India Radio, M. G. Road, Vijaywada - �20 010. Tel.: 08��-���2�21. vishakapatnam: Shop No : 2, �th Floor, Door No : ��-22-��/21, Kalyan Estates, Near Hotel Dwaraka Inn, Railway Station Road, Visakhapatnam – ��001�. Tel.: 0891 – ���188� Fax: 0891-2�0�292.
WP
P -
4031
7777
ww
w.w
este
rnpr
ess.
in