annual report 2013annualreports.com/hosteddata/annualreportarchive/e/... · letter to shareholders...
TRANSCRIPT

Annual Report 2013

Letters to Shareholders . . . . . . . . . . . . . . . . . . . . . . . . . . . . . . . . . . . . . . . . . . . . . . . . . . . . . . . . 1Management’s Discussion and Analysis . . . . . . . . . . . . . . . . . . . . . . . . . . . . . . . . . . . . . . . . .6 Emera Consolidated . . . . . . . . . . . . . . . . . . . . . . . . . . . . . . . . . . . . . . . . . . . . . . . . . . . . . . . .14 NSPI . . . . . . . . . . . . . . . . . . . . . . . . . . . . . . . . . . . . . . . . . . . . . . . . . . . . . . . . . . . . . . . . . . . . . .18 Maine Utility Operations . . . . . . . . . . . . . . . . . . . . . . . . . . . . . . . . . . . . . . . . . . . . . . . . . . . 28 Caribbean Utility Operations . . . . . . . . . . . . . . . . . . . . . . . . . . . . . . . . . . . . . . . . . . . . . . . 35 Pipelines . . . . . . . . . . . . . . . . . . . . . . . . . . . . . . . . . . . . . . . . . . . . . . . . . . . . . . . . . . . . . . . . . 44 Services, Renewables and Other Investments . . . . . . . . . . . . . . . . . . . . . . . . . . . . . . . . 45 Corporate . . . . . . . . . . . . . . . . . . . . . . . . . . . . . . . . . . . . . . . . . . . . . . . . . . . . . . . . . . . . . . . . 50 Management Report . . . . . . . . . . . . . . . . . . . . . . . . . . . . . . . . . . . . . . . . . . . . . . . . . . . . . . . . . 78Independent Auditors’ Report . . . . . . . . . . . . . . . . . . . . . . . . . . . . . . . . . . . . . . . . . . . . . . . . 79Consolidated Financial Statements . . . . . . . . . . . . . . . . . . . . . . . . . . . . . . . . . . . . . . . . . . . 80Notes to the Consolidated Financial Statements . . . . . . . . . . . . . . . . . . . . . . . . . . . . . . . 88
TABLE OF CONTENTSEmera Inc . is an energy and services company with $8 .88 billion in assets and 2013 revenues of $2 .2 billion . The company invests in electricity generation, transmission and distribution, as well as gas transmission and utility energy services . Emera’s strategy is focused on the transformation of the electricity industry to cleaner generation and the delivery of that clean energy to market . Emera has investments throughout northeastern North America, and in four Caribbean countries . Approximately 90% of the company’s reported net income in 2013 came from regulated investments . Emera common and preferred shares are listed on the Toronto Stock Exchange and trade respectively under the symbol EMA, EMA .PR .A ., EMA .PR .C ., and EMA .PR .E . Additional information can be accessed at: www .emera .com or at www .sedar .com .

Letter to Shareholders
Emera Inc . — Annual Report 2013 1
This expansion of Emera’s business platform has created the capacity and expertise so that the company can initiate new opportunities well into the future .
LETTER TO SHAREHOLDERS
Dear Fellow Shareholders,Seven years ago, around the time I joined the Emera Board, Chris Huskilson and I sat on a pair of Adirondack chairs in my hometown of Mahone Bay, Nova Scotia .
We talked about Emera’s strategy… . . about how we needed to grow from being a business focused almost exclusively on thermal generation to one that is investing in renewables . We discussed how Emera needed to become a business where geographies and technologies were linked, allowing us to identify and initiate opportunities instead of waiting to become another casualty of change . In short, we needed to step off the curb and become proactive in this new world .
It is this proactive approach, embraced by management, which has transformed Emera’s strategy and helped us achieve consistent growth during these past seven years . It is this approach that will support continued growth into the future .
In 2014 I’m stepping down after five years as Chairman of the Emera Board, although I am pleased to remain as a Director . This is a very exciting time in which some major outcomes of Emera’s strategy are coming to fruition . For example, the Maritime Link is on track to become a key part of our region’s energy infrastructure, bringing with it many opportunities for our business and our communities . The project has passed the regula-tory approval process and has gained wider support . This platform will become a core part of our total infrastructure, supporting even more growth in the years ahead .
A project as ambitious as the Maritime Link would not be possible without an able and versatile team to make it happen . Under the leadership of Chris Huskilson, Emera has evolved into a multi-talented organization, continuing to address major growth opportunities in the energy landscape – for the benefit of shareholders, employees and customers . Five years ago, there were 2,350 people working for Emera companies . In 2013 there were 3,556 . Five years ago, we had total assets of $5 .2 billion . In 2013 our total assets were $8 .8 billion . This expansion of Emera’s business platform has created the capacity and expertise so that the Company can initiate new opportunities well into the future .
The Emera Board of Directors is the steward of the Company’s evolution . Each Director brings significant expertise and depth of experience to support and guide management in the execution of this evolving strategy . For all of the last five years, our Board has been in the top quartile of The Globe and Mail corporate governance rankings, placing in the top 5 per cent in 2013 . Board members give of their time, effort and hearts to ensure we continue to perform strongly . I wish to acknowledge all of my Board colleagues who serve with me for their significant commitment to the planning and decision-making process that is so critically invaluable to the management team . In particular, I recognize the committee chairs who give in excess of the already high standard of their fellow Directors so that our governance processes serve us well .
John McLennan Chairman of the Board of Directors

2 Emera Inc . — Annual Report 2013
We were fortunate to have my predecessor, Derek Oland, support the creation and launch of the Emera concept . That initiative allowed me, along with Directors and senior leaders, to move the concept forward into what it is today . And now, we are truly privileged to have Jackie Sheppard lead Emera, together with management, to the next level of growth .
Jackie will become Chair of the Emera Board of Directors in 2014 . With her wealth of experience and exemplary qualifications, Jackie will most certainly serve the Company and our stakeholders well . Jackie has been an Emera Director since 2009 and a Director of Emera Newfoundland & Labrador Holdings since 2011 . She has also served as a member of Emera’s Audit Committee, Management Resources and Compensation Committee and the Technology and Development Committee . A native of Newfoundland, Jackie has made invaluable contributions to the Board’s oversight of the Company’s strategy and business development initiatives . She has played a key role in the Company’s participation in the Muskrat Falls, Labrador-Island Link and Maritime Link projects . Jackie is a great fit for Emera’s strategic growth and I look forward to continuing to work with her .
Just as Emera’s governance bodies are in skilled hands, so too is the Emera executive leadership team under Chris Huskilson . I have greatly enjoyed working with Chris and I’m proud of what our team has achieved together . Chris is able to grasp the big picture and the fine detail, keeping Emera pointed in the right direction while ensuring that all the fine calibrations happen to keep us on track . He is a great leader for our business .
During my career I’ve been fortunate to have worked with a variety of remarkable businesses that have had the courage to embrace change for success . I am proud that Emera has not only embraced change for success, but has become a leader in this area, which will serve all stakeholders well for years to come .
John McLennan Chairman of the Board

Letter to Shareholders
Emera Inc . — Annual Report 2013 3
Christopher HuskilsonPresident and Chief Executive Officer
Dear Fellow Shareholders, I’m proud to say this year will mark the tenth annual general meeting since I was appointed President and CEO and 2013 marks a pivotal year in what has been a period of change for Emera . Our business is evolving and growing and we are delivering on our strategy as is indicated by our strong 2013 financial and strategic results .
We’re delivering on our strategy to invest in renewable energy. This year we completed construction of the Port Hawkesbury biomass plant, purchased the Brooklyn Energy biomass plant, and made significant progress on the South Canoe Wind project, the largest wind farm in Nova Scotia . We also invested in the Bull Hill wind project, and construction began for the Oakfield wind project through our investment in Northeast Wind .
We’re delivering on our strategy to invest in transmission that gets renewable energy to market. This year, with our partner Nalcor, we achieved final approval on Phase I of the Lower Churchill project and the Maritime Link project, which will transform the electricity energy system in our region .
We’re delivering on our strategy to invest in natural gas as a cleaner back-up for renewables. In 2013 we acquired three natural gas electricity plants in New England, adding 1,050 megawatts to our generation capacity and making us the fourth largest producer of natural gas-fired electricity in New England . We’re also seeking approval to supply cleaner compressed natural gas from Florida to the Bahamas .
We’re delivering on our strategy to invest in utilities. We’re making material invest-ments in our existing utilities to help them better serve their customers, and through the addition of Dominica Electricity Services Ltd ., creating more opportunities to link our Caribbean investments .
These are just some of our achievements in 2013 as our Company continues to perform well in Canada, the US Northeast and in the Caribbean . Emera companies in all regions are contributing to the Company’s robust financial outcomes .
This is an exciting time for Emera . Our business is evolving and growing . We’re delivering on our strategy as our strong 2013 financial results demonstrate .
LETTER TO SHAREHOLDERS

4 Emera Inc . — Annual Report 2013
Financial Results Earnings Per ShareWe hit our earnings per share (EPS) growth targets in 2013, achieving five-year annualized growth of 8 .1 per cent and delivering adjusted EPS of $1 .96 .
We’re on track to maintain our three- to five-year annualized average EPS growth target of four to six per cent . This range strikes an appropriate balance between driving growth and managing risk .
DividendOur Board authorized another increase this year, to $1 .45 per share . The dividend has seen a compound annual growth rate of 7% over the last five years . We remain commit-ted to increasing the dividend in line with earnings growth .
Cash FlowCash flows from operations continued to grow in 2013, increasing to $564 million .
Total Shareholder ReturnWe believe that a fundamental measure of our success will be the shareholder value we create over the long term .
In 2013, Emera delivered a five-year annualized total return to shareholders of 11 .3 per cent, ahead of the S&P TSX Capped Utilities Index, which had a five year annualized total return to shareholders of 8 .3 per cent over the same period .
Like many of our utility peers, and other defensive interest rate-sensitive stocks, Emera saw a 12 per cent decline in share price in 2013 . There remains a lot of uncertainty about US tapering, long-term interest rates and their impact on the equity markets . Our focus remains on driving strong business results, growing earnings and dividends for our investors and delivering on our strategy .
Looking to the Future The regions where we choose to do business are filled with opportunities that fit with our strategy . We continue to see alignment between the desire of customers and governments to reduce the carbon intensity of electricity, while also improving its reliability and predictability . Emera now has a track record of delivering services and projects that achieve these goals .
In 2014 and beyond we will concentrate on expanding the clean energy and transmission system in Atlantic Canada, the US Northeast and the Caribbean to achieve the goals of carbon reduction in a cost-effective and productive manner .
As well, gas in this region will continue to be volatile until an enhanced transportation system is available to move gas from where it can be sourced to where it is consumed . The electricity system and the gas system converge in many places — and that is where we will continue to expand our efforts .
We have a clear plan for the next five years of Emera’s development . As we continue to implement that plan, we will also be working to define Emera’s strategic direction in the next five to ten years . We will continue to share that vision with you .
Energy from the Muskrat Falls Hydro-electric Facility will flow through the Maritime Link to Nova Scotia. (Image: Nalcor)
Bridgeport Energy in Connecticut, one of three new generation facilities acquired by Emera in 2013.

Letter to Shareholders
Emera Inc . — Annual Report 2013 5
The letter to shareholders above contains certain forward-looking statements . By their nature, forward-looking statements require us to make assumptions and are subject to risks and uncertainties . Please refer to the caution regarding Forward-Looking Statements on page six of this MD&A for a discussion of such risks and uncertainties and the material factors and assumptions related to the statements set forth in such letter .
Our PeopleOur Board of Directors plays an important role in our operational success and strong corporate governance .
In 2014, John McLennan will step down from his role as Chair of the Board, remaining as a Director of the Company . Board member Jackie Sheppard will become Emera’s new Chair . It has been a privilege to work closely with John during his five years in this position . His experience with disruptive technologies across a range of industries has helped us see that continued reinvention is critical . John has played a big role in shaping Emera’s strategy and positioning us to take advantage of growth opportunities . Early in our relationship John encouraged management to “step off the curb” and strive for a new success . His influence has been invaluable in the success we have had and I thank him again for his continued commitment to our Company .
At the same time, I look forward to working more closely with Jackie . Jackie joined the Emera Board in 2009, bringing with her considerable knowledge and extensive experi-ence as a leader and director in the energy sector . Jackie has been an invaluable part of the Company’s growth over the last four years and I know she will make a significant contribution to Emera’s ongoing success in her new role .
This year we also say goodbye to our longest-serving Director, Robert (Bob) Briggs, who is retiring from the Board . We’ve benefitted greatly from Bob’s broad knowledge of our sector, gained during his time as the former President and CEO of Bangor Hydro . His steady hand and diligent approach to all things Emera will be sincerely missed by me and my team .
Finally, I thank the employees of Emera’s companies . Every day they work to help achieve world-class safety across our companies . Their efforts turn our strategy into action, help our business grow and create value for our customers and investors every single day .
Chris Huskilson President and CEO
Emera Maine employees, like Line Worker Mark King, continue to deliver the same high commitment to customer service.
BLPC continues to build on operational efficiency at facilities including the Spring Garden Plant.
6 Emera Inc . — Annual Report 2013
Management’s Discussion & Analysis (“MD&A”) provides a review of the results of operations of Emera Incorporated and its subsidiaries and investments (“Emera”) during the fourth quarter of 2013 relative to 2012; and the full year of 2013 relative to 2012 and 2011; and its financial position as at December 31, 2013 relative to December 31, 2012 . To enhance shareholders’ understanding, certain multi-year historical financial and statistical information is presented . Throughout this discussion, “Emera Incorporated”, “Emera” and “Company” refer to Emera Incorporated and all of its consolidated subsidiaries and investments .
This discussion and analysis should be read in conjunction with the Emera Incorporated annual audited consolidated financial statements and supporting notes as at and for the year ended December 31, 2013 . Emera follows United States Generally Accepted Accounting Principles (“USGAAP” or “GAAP”) .
The accounting policies used by Emera’s rate-regulated entities may differ from those used by Emera’s non-rate-regulated businesses with respect to the timing of recognition of certain assets, liabilities, revenue and expenses . Emera’s rate-regulated subsidiaries include:
Emera Rate-Regulated Subsidiary Accounting Policies Approved/Examined By
Nova Scotia Power Inc . (“NSPI”) Nova Scotia Utility and Review Board (“UARB”)
Bangor Hydro Electric Company (“Bangor Hydro”) Maine Public Utilities Commission (“MPUC”) and the Federal Energy Regulatory Commission (“FERC”)
Maine Public Service Company (“MPS”) MPUC and FERC
Barbados Light & Power Company Limited (“BLPC”) Fair Trading Commission, Barbados
Grand Bahama Power Company Limited (“GBPC”) The Grand Bahama Port Authority (“GBPA”)
Dominica Electricity Services Ltd . (“DOMLEC”) Independent Regulatory Commission, Dominica
Emera Brunswick Pipeline Company Limited National Energy Board (“NEB”) (“Brunswick Pipeline”)
NSP Maritime Link Inc . (“NSPML”) UARB
All amounts are in Canadian dollars (“CAD”), except for the Maine Utility Operations and the Caribbean Utility Operations sections of the MD&A, which are reported in US dollars (“USD”), unless otherwise stated .
Additional information related to Emera, including the Company’s Annual Information Form, can be found on SEDAR at www .sedar .com .
Forward-Looking Information
This MD&A contains “forward-looking information” within the meaning of applicable Canadian securities laws . The words “anticipates”, “believes”, “could”, “estimates”, “expects”, “intends”, “may”, “plans”, “projects”, “schedule”, “should”, “will”, “would” and similar expressions are often intended to identify forward-looking information, although not all forward-looking information contains these identifying words .
The forward-looking information in this MD&A includes statements which reflect the current view with respect to the Company’s objectives, plans, financial and operating performance, business prospects and opportunities . The forward-looking information reflects management’s current beliefs and is based on information currently available to Emera’s management and should not be read as guarantees of future events, performance or results, and will not necessarily be accurate indications of whether, or the times at which, such events, performance or results will be achieved .
The forward-looking information is based on reasonable assumptions and is subject to risks, uncertainties and other factors that could cause actual results to differ materially from historical results or results anticipated by the forward-looking information . Factors which could cause results or events to differ from current expectations are discussed in the Outlook section of the MD&A and may also include: regulatory risk; operating and maintenance risks; economic conditions; availability and price of energy and other commodities; capital resources and liquidity risk; weather; commodity price risk; competitive pressures; construction risk; derivative financial instruments and hedging availability and cost of financing; interest rate risk; counterparty risk; competitiveness of electricity as an energy source; commodity supply; environmental risks; foreign exchange; regulatory and government decisions, including changes to environmental, financial reporting and tax legislation; loss of service area; market energy sales prices; labour relations; and availability of labour and management resources .
MANAGEMENT’S DISCUSSION AND ANALYSIS
As at February 10, 2014

Emera Inc . — Annual Report 2013 7
Management’s Discussion and Analysis
Readers are cautioned not to place undue reliance on forward-looking information as actual results could differ materially from the plans, expectations, estimates or intentions and statements expressed in the forward-looking information . All forward-looking information in this MD&A is qualified in its entirety by the above cautionary statements and, except as required by law, Emera undertakes no obligation to revise or update any forward-looking information as a result of new information, future events or otherwise .
Structure of MD&A
This MD&A begins with an Introduction and Strategic Overview; followed by the Consolidated Financial Review and outstanding common stock data; then presents information separately on Emera’s consolidated subsidiaries and investments, specifically: • NSPI; • Maine Utility Operations includes Bangor Hydro and MPS; • Caribbean Utility Operations includes BLPC and DOMLEC and their parent company, Light & Power Holdings Ltd . (“LPH”), GBPC and
St . Lucia Electricity Services Limited (“LUCELEC”); • Pipelines includes Brunswick Pipeline and Maritimes & Northeast Pipeline (“M&NP”); • Other operations and investments are grouped and discussed under Services, Renewables and Other Investments and include:
• Emera Energy includes Emera Energy Services, Bayside Power Limited Partnership (“Bayside Power”), Bear Swamp Power Company LLC (“Bear Swamp”), Northeast Wind Partners II, LLC (“NWP”), Brooklyn Power Corporation (“Brooklyn Energy”), and Bridgeport Power, Tiverton Power and Rumford Power (“EE New England Gas Generation”),
• Emera Utility Services Inc . and Emera Utility Services (Bahamas) Limited (“Emera Utility Services”), • Emera Newfoundland & Labrador Holdings Inc . (“ENL”) and its subsidiaries NSPML and ENL Island Link Inc ., which is an investor
in the Labrador-Island Link Partnership (“LIL”), • Algonquin Power & Utilities Corp . (“APUC”), • Atlantic Hydrogen Inc . (“AHI”), • OpenHydro Group Ltd . (“OpenHydro”); and
• Corporate includes interest revenue on intercompany financings and costs associated with corporate activities not directly associated with the operations of Emera’s consolidated subsidiaries and investments noted above .
The Liquidity and Capital Resources, including Consolidated Cash Flow Highlights, Pension Funding, Off-Balance Sheet Arrangements, Outlook, Transactions with Related Parties, Dividends and Payout Ratios, Business Risks and Risk Management, including Financial Instruments, Disclosure and Internal Controls, Critical Accounting Estimates, Significant Accounting Policies, Changes in Accounting Policies and Practices and Summary of Quarterly Results sections of the MD&A are presented on a consolidated basis .
Introduction and Strategic Overview
Emera Incorporated is an energy and services company that owns and invests in electricity generation, transmission and distribution, gas transmission, utility services and provides energy marketing, trading and other energy-related management services .
Emera’s strategy is focused on driving profitable growth by investing in its existing and new businesses, improving system reliability, reducing emissions from the generation of electricity, and transmitting that cleaner energy to market . Emera continues to build its existing businesses and leverage assets and capabilities to capitalize on acquisitions and greenfield development opportunities in electric or gas utilities . Emera continues to target a three- to five-year annualized average earnings per share growth rate of 4 to 6 per cent .
Emera’s business interests are primarily in northeastern North America and the Caribbean . Approximately 90 per cent of Emera’s reported net income is earned by its rate-regulated subsidiaries, which generally contribute strong, predictable income and cash flows to fund dividends and reinvestment .
The energy industry is seasonal in nature for companies like Emera, where seasonal and unseasonal weather patterns, as well as the number and severity of storms, can affect the demand for energy and the cost of service . Similarly, mark-to-market adjustments arising from commodity purchases or trading activities that do not qualify for hedge accounting or regulatory accounting can have a material impact on financial results for a period . Therefore, results in any one quarter are not necessarily indicative of results in any other quarter, or for the year as a whole .

8 Emera Inc . — Annual Report 2013
Non-GAAP Financial Measures
Emera uses financial measures that do not have a standardized meaning under USGAAP .
ADJUSTED NET INCOME
“Adjusted net income attributable to common shareholders”, “adjusted earnings per common share — basic”, “adjusted contribution to consolidated net income” and “adjusted contribution to consolidated earnings per common share — basic” are non-GAAP financial measures used by Emera . These measures represent net income and non-diluted earnings per common share absent the income effect of mark-to-market adjustments related to Emera’s held-for-trading (“HFT”) derivative instruments, the mark-to-market adjustments included in Emera’s equity income related to the business activities of Bear Swamp and NWP and the amortization of transportation capacity recognized as a result of certain trading and marketing transactions . HFT derivatives do not qualify for hedge accounting or regulatory accounting . They are recognized on the balance sheet at fair value and all gains or losses are recognized in net income of the period .
Emera’s HFT derivatives are primarily contracts related to the expected purchase and/or supply of electricity and natural gas, which fluctuate in value due to market price volatility of the relevant commodity . Management believes excluding the effect of these mark-to-market valuations, and changes thereto, related to these contracts from income until settlement, better matches the financial effect of these contracts with the underlying cash flows and that presentation of adjusted net income attributable to common shareholders, adjusted earnings per common shareholders — basic, adjusted contribution to consolidated income and adjusted contribution to consolidated earnings per common share — basic provides useful information to investors as it allows them an additional relevant comparison of the Company’s performance across reporting periods .
The most directly comparable USGAAP measure for adjusted net income attributable to common shareholders, adjusted earnings per common share — basic, adjusted contribution to consolidated net income and adjusted contribution to consolidated earnings per common share — basic is net income attributable to common shareholders, earnings per common share — basic, contribution to consolidated net income and contribution to consolidated earnings per common share, respectively . Mark-to-market adjustments are discussed further in the Consolidated Financial Highlights section and the Services, Renewables and Other Investments — Review of 2013 section .
The following is a reconciliation of reported net income attributable to common shareholders to adjusted net income attributable to common shareholders and reported earnings per common share — basic to adjusted earnings per common share — basic .
Three months ended Year ended For the December 31 December 31
millions of Canadian dollars (except per share amounts) 2013 2012 2013 2012 2011
Net income attributable to common shareholders $ 21.0 $ 42.7 $ 217.5 $ 220.8 $ 241.1After-tax derivative mark-to-market gain (loss) $ (42.0)$ (15.9)$ (41.9)$ (9.7)$ (3.0)
Adjusted net income attributable to common shareholders $ 63.0 $ 58.6 $ 259.4 $ 230.5 $ 244.1
Earnings per common share — basic $ 0.16 $ 0.34 $ 1.64 $ 1.77 $ 1.99
Adjusted earnings per common share — basic $ 0.47 $ 0.46 $ 1.96 $ 1.85 $ 2.02
ELECTRIC MARGIN
NSPI, Caribbean Utility Operations and Services, Renewables and Other Investments“Electric margin” is a non-GAAP financial measure used to show the amounts NSPI, BLPC, GBPC and DOMLEC retain to recover their non-fuel costs, as effectively fuel costs are recovered from customers . Services, Renewables and Other have a non-regulated electric margin used to show the amount EE New England Gas Generation, Brooklyn Energy and Bayside have earned to contribute to the recovery of their non-fuel costs .
The companies’ electric margin may not be comparable to other companies’ electric margin measures . This measure is not intended to replace “Income from operations” which, as determined in accordance with GAAP, is an indicator of operating performance . Electric margin is discussed further in the NSPI — Electric Margin, the Caribbean Utility Operations — Electric Margin sections and Services, Renewables and Other Investments — Non-Regulated Electric Margin .

Management’s Discussion and Analysis
Emera Inc . — Annual Report 2013 9
Significant Items Affecting Earnings
AFTER-TAX DERIVATIVE MARK-TO-MARKET LOSSES
After-tax mark-to-market losses increased $26 .1 million to $42 .0 million in Q4 2013 compared to $15 .9 million in Q4 2012; and increased $32 .2 million to $41 .9 million for the year ended December 31, 2013 compared to $9 .7 million in 2012 . Increased mark-to-market losses largely resulted from increased volatility in the New England market, where the increased price differential between contracted markets is recognized under USGAAP but the offsetting change in value of the use of related transportation is not and increased volume of business .
AHI INVESTMENT IMPAIRMENT
In Q4 2013, the Company recorded an impairment charge of $8 .8 million ($7 .6 million after-tax or $0 .06 per common share) to write down its investment in AHI as AHI’s path to commercialization is less certain . The impairment charge included a $2 .2 million write-off of its AHI investment, a $1 .1 million write-off of a receivable that was deemed uncollectible and a write-off of $5 .5 million of convertible debentures .
APUC DISCONTINUED OPERATIONS
In Q2 2013, APUC, in which Emera has a 24 .3 per cent equity interest, recorded a loss from discontinued operations, net of tax, of $33 .9 million on its Interim Consolidated Statements of Operations .
The majority of APUC’s loss was due to a write-down of its Energy From Waste (“EFW”) facility that was no longer deemed strategic to the business . These assets were written down to APUC’s estimation of net realizable value .
Emera accounts for its equity earnings in APUC a quarter in arrears to when APUC reports such earnings, as the information is not publicly available at the time of Emera’s public release of its financial results . Therefore, in Q3 2013, Emera recognized a loss of $8 .3 million before tax (after-tax loss of $7 .0 million or $0 .05 per common share) related to APUC’s discontinued operations in “Income from equity investments” . This loss was offset by positive earnings before discontinued operations of $8 .7 million before tax (after-tax earnings of $7 .3 million) during the year .
GAINS ON EXCHANGE OF APUC SUBSCRIPTION RECEIPTS TO SHARES
The following table outlines 2012 and 2013 subscription receipts which have been converted to shares and their associated after-tax gains:
Earnings per Quarter After-tax gain on conversion of Common Transaction subscription receipts to APUC shares Share Underlying transaction Closed (millions of Canadian dollars) Impact
New Hampshire Transaction Q2 2012 $ 11 .6 $ 0 .09 Gamesa — 1/2 of first tranche Q3 2012 1 .8 0 .01 Atmos Q3 2012 0 .9 0 .01 Sale of CPUV — first tranche Q4 2012 8 .4 0 .07
Total 2012 $ 22.7 $ 0.18
Gamesa — 1/2 of first tranche Q1 2013 3 .6 0 .03 Gamesa — second tranche Q1 2013 7 .0 0 .05 Completion of California Pacific’s rate case — second tranche Q1 2013 7 .5 0 .06
Total 2013 $ 18.1 $ 0.14
NORTHEAST WIND PARTNERS SUPPLIER SETTLEMENT
Northeast Wind Partners (“NWP”), a company in which Emera has a 49 per cent equity interest, received a settlement of all of its entitlements under various guarantee, warranty and performance obligations of one of its turbine suppliers in Q1 2013 . Thus, NWP will be responsible for future repair costs related to these turbines . Emera’s share of the total after-tax net proceeds was $6 .4 million ($0 .05 per common share), which was included in “Income from equity investments” for the year ended December 31, 2013 .

10 Emera Inc . — Annual Report 2013
Consolidated Financial Review
CONSOLIDATED FINANCIAL HIGHLIGHTS
Three months ended Year ended For the December 31 December 31
millions of Canadian dollars (except per share amounts) 2013 2012 2013 2012 2011
Operating revenues $ 594.4 $ 512 .9 $2,230.2 $ 2,058 .6 $ 2,064 .4
Income from operations 69.0 44 .7 407.1 346 .5 317 .5
Net income attributable to common shareholders 21.0 42 .7 217.5 220 .8 241 .1
After-tax derivative mark-to-market gain (loss) (42.0) (15 .9) (41.9) (9 .7) (3 .0)
Adjusted net income attributable to common shareholders 63.0 58 .6 259.4 230 .5 244 .1
Earnings per common share — basic $ 0.16 $ 0 .34 $ 1.64 $ 1 .77 $ 1 .99
Earnings per common share — diluted $ 0.16 $ 0 .34 $ 1.64 $ 1 .76 $ 1 .97
Adjusted earnings per common share — basic 0.47 0 .46 1.96 1 .85 2 .02
Dividends per common share declared $ 0.3625 $ — $ 1.4125 $ 1 .3625 $ 1 .3125
Three months ended Year ended For the December 31 December 31
millions of Canadian dollars (except per share amounts) 2013 2012 2013 2012 2011
Operating Unit Contributions (after-tax)NSPI $ 29.9 $ 27 .0 $ 126.0 $ 126 .0 $ 123 .5 Maine Utility Operations 11.4 8 .6 38.4 35 .4 37 .0 Caribbean Utility Operations 9.2 6 .7 32.4 23 .2 46 .8 Pipelines 8.1 7 .0 30.3 27 .9 27 .9 Services, Renewables and Other Investments (30.5) (2 .4) 16.7 33 .7 26 .4 Corporate (7.1) (4 .2) (26.3) (25 .4) (20 .5)
Net income attributable to common shareholders $ 21.0 $ 42 .7 $ 217.5 $ 220 .8 $ 241 .1
Year ended For the December 31
millions of Canadian dollars 2013 2012 2011
Operating cash flow before changes in working capital $ 577.8 $ 411.2 $ 439.8Change in investment in working capital (13.6) (13.6) (40.3)Operating cash flow 564.2 397.6 399.5
Working capital $ 454.7 $ 358.6 $ 334.4
As at December 31
millions of Canadian dollars 2013 2012 2011
Total assets $8,876.8 $7,536.4 $6,923.6Total long-term liabilities 4,449.7 4,306.7 4,298.2

Management’s Discussion and Analysis
Emera Inc . — Annual Report 2013 11
Developments
EMERA
Maritime Link ProjectOn July 22, 2013, NSPML, a wholly owned subsidiary of ENL, received the UARB decision on the Maritime Link Project, a 500-megawatt (“MW”) high voltage direct current transmission line between Nova Scotia and Newfoundland . The UARB approved the Maritime Link Project subject to certain conditions, including an assurance that additional market-priced energy will be available to Nova Scotians . The UARB approved NSPML’s requested project cost of $1 .52 billion, as well as the requested variance amount of $60 million, for total approved project costs of $1 .58 billion, plus allowance for funds used during construction .
On October 21, 2013, NSPML filed the Maritime Link Compliance Filing with the UARB . The compliance filing sought confirmation from the UARB that NSPML has complied with each of the UARB conditions, including the condition relating to the availability of market-priced energy .
On November 29, 2013, the UARB approved the Maritime Link Compliance Filing and gave its final approval of the Maritime Link Project . Subsequent to the UARB approval, the Nova Scotia government passed legislative amendments to the Maritime Link Act, which clarified certain aspects of the regulatory framework in respect of the Maritime Link Project and provides NSPML with certain legal rights to facilitate the development and operation of the Maritime Link Project .
In addition to UARB approval of the Compliance Filing, the Maritime Link Project will require further agreements and satisfaction of other conditions precedent, as referenced in the terms of the federal loan guarantee term sheet and the Maritime Link Formal Agreements between Emera and Nalcor Energy (“Nalcor”) .
Among the conditions which have been satisfied to date for the Government of Canada’s federal loan guarantee in support of the Maritime Link are a payment obligation agreement between Emera, NSPML and the Government of Canada (the “Payment Obligation Agreement”) and a completion guarantee from Emera in favour of the Government of Canada (the “Completion Guarantee”) .
The Payment Obligation Agreement became effective on December 13, 2013; the date on which the first funding of debt guaranteed by the Government of Canada for the development of the Muskrat Falls generating station and associated transmission assets and the Labrador-Island Transmission Link occurred (the “Nalcor Funding Date”) . Under the Payment Obligation Agreement, Emera and NSPML have agreed that if (i) a special purpose funding vehicle to be formed by Emera or NSPML (“MLFV”) has not entered into a committed term sheet for a credit facility in respect of a portion of the funding of the Maritime Link (the “Project Facility”), and if NSPML and MLFV have not negotiated certain financing documentation with the Government of Canada, in each case within ninety days following the Nalcor Funding Date (the “ML Financial Close”), or (ii) at least $50 .0 million under the Project Facility has not been drawn within ninety days following the date of the ML Financial Close (which period may in certain circumstances be extended for a further ninety days), NSPML, or failing NSPML, Emera, will be obligated to pay to the Government of Canada $60 .0 million, and the Government of Canada will no longer be obligated to make available the Federal Loan Guarantee in respect of the Maritime Link . In the event the payment obligation is triggered, Nalcor has agreed to pay $30 .0 million of this obligation to Emera .
Under the Completion Guarantee, which will only become effective once the Federal Loan Guarantee has been issued in support of drawn advances under project financings, Emera will guarantee to the Government of Canada the performance of the obligations of NSPML to cause the completion of the Maritime Link Project in the circumstances and within the timelines provided for in the Completion Guarantee .
On December 13, 2013, NSPML filed its first quarterly compliance filing with the UARB, which included an updated capital cost estimate for the Maritime Link Project of $1 .577 billion . Based upon this cost estimate and the application of the terms of the agreement with Nalcor Energy, whereby NSPML will pay 20 per cent of the total cost of the LCP Phase I and Maritime Link projects, the amount of this cost estimate that will be NSPML’s responsibility will be $1 .5554 billion .
Maritime Link Project Environmental AssessmentOn June 21, 2013, NSPML received a release from the Federal Environmental Assessment process, as well as environmental approval from the provinces of Newfoundland and Labrador and Nova Scotia for the proposed Maritime Link Project .

12 Emera Inc . — Annual Report 2013
Purchase of Natural Gas Generation Facilities in New EnglandOn November 19, 2013, Emera acquired three combined-cycle gas-fired electricity generating facilities in New England . The transaction added 1,050 MW to Emera’s generation capacity in the region at a total investment of $541 million USD . The addition of gas generation in the northeastern United States has been a strategic objective of Emera and is a complement to its wind and hydro facilities in the region . The facilities: Bridgeport Energy (520 MW) in Bridgeport, Connecticut; Tiverton Power (265 MW) in Tiverton, Rhode Island; and Rumford Power (265 MW) in Rumford, Maine — are recent vintage, high-efficiency units, collectively referred to as EE New England Gas Generation . They currently sell their output into the ISO New England power pool .
The $541 million USD purchase price and a working capital adjustment of $8 .5 million USD ($575 .1 million CAD) were financed by funds received on repayment of a $150 million USD loan to NWP, a one-year $350 million USD non-revolving credit facility established by an indirect wholly owned subsidiary of Emera and available cash on hand .
Increase in Common Share DividendOn October 16, 2013, Emera’s Board of Directors approved an increase in the annual common share dividend rate from $1 .40 to $1 .45, and accordingly declared a quarterly dividend of $0 .3625 per common share .
Investment in Labrador-Island Transmission LinkOn February 11, 2013, a subsidiary of ENL invested $67 .7 million in the LIL, a $2 .6 billion electricity transmission project in Newfoundland and Labrador, which will enable the transmission of the Muskrat Falls energy between Labrador and the island of Newfoundland .
Investment in Algonquin Power & Utilities Corp.Georgia TransactionOn February 22, 2013, Emera agreed to purchase 3 .96 million common shares of APUC at an issue price of $7 .40 each, for a total purchase price of approximately $29 .3 million, in connection with APUC’s acquisition of regulated natural gas distribution utility assets located in Georgia, United States .
Emera’s purchase of these 3 .96 million common shares of APUC closed on March 26, 2013, increasing Emera’s interest in APUC to 24 .5 per cent .
California Pacific TransactionOn February 14, 2013, Emera converted 3 .4 million subscription receipts into 3 .4 million APUC common shares at an issue price of $4 .72 each, for a total purchase price of $16 .1 million, increasing its interest in APUC to 23 per cent . This resulted in an after-tax gain of $7 .5 million being recorded in Q1 2013 .
Gamesa TransactionOn February 14, 2013, Emera converted 5 .2 million subscription receipts into 5 .2 million APUC common shares at an issue price of $5 .74 each, for a total purchase price of $30 .0 million, increasing its interest in APUC to 21 .7 per cent . This resulted in an after-tax gain of $7 .0 million being recorded in Q1 2013 .
On February 7, 2013, Emera converted 2 .6 million subscription receipts into 2 .6 million APUC common shares at an issue price of $5 .74 each, for a total purchase price of $15 .0 million, increasing its interest to 19 .6 per cent . This resulted in an after-tax gain of $3 .6 million being recorded in Q1 2013 .
RECENT FINANCING ACTIVITY
Common Share FinancingOn January 7, 2014, Emera completed an offering of 8,665,000 common shares, including the exercise of the over-allotment option of 865,000 common shares, at $28 .85 per common share, for net proceeds of approximately $239 .9 million . The net proceeds of the offering were used for general corporate purposes to support the Company’s recently announced growth initiatives and to reduce indebtedness outstanding under Emera’s credit facility .
Preferred Share IssuanceOn June 10, 2013, Emera issued five million 4 .50 per cent Cumulative Redeemable First Preferred Shares, Series E at $25 .00 per share for gross proceeds of $125 .0 million and net proceeds of $122 .4 million . The net proceeds of the preferred share offering were used for general corporate purposes, including repayments of indebtedness under the Company’s credit facility .

Management’s Discussion and Analysis
Emera Inc . — Annual Report 2013 13
NSPI
Electricity Reform ActThe Electricity Reform Act was approved by the Province of Nova Scotia in December 2013 . It will eventually permit licensed generators to sell renewable electricity generated within Nova Scotia directly to retail customers in the province . The legislation requires NSPI, in consultation with stakeholders, to develop related tariffs for distribution and transmission and standards of conduct for approval by the UARB . The new tariffs, which would enable “renewable to retail” transactions, are not expected to be in place before 2015 . The Electricity Reform Act also initiates a government consultation process to help determine the Province of Nova Scotia’s long-term electricity strategy, with the resulting report required to be tabled in late 2014 or early 2015 .
Medium-Term Note IssuanceOn July 19, 2013, NSPI completed the issuance of $300 million Series Z Medium-Term Notes . The Series Z Notes bear interest at a rate of 4 .50 per cent and yield 4 .537 per cent per annum until July 20, 2043 . The proceeds of the note offering will be used for general corporate purposes, including the repayment of maturing corporate debt .
South Canoe Wind ProjectNSPI was a successful bidder, to the Renewable Energy Administrator, appointed by the Province of Nova Scotia, as a co-developer and investor in the 102 MW South Canoe Wind Project, having committed to invest up to a maximum 49 per cent interest in the project .
The Municipality of the District of Chester approved development agreements for the South Canoe Wind Project on March 14, 2013 . However, two appeals were filed with the UARB regarding the development agreement approval . The UARB’s hearing of the two appeals concluded in early June 2013, and on September 4, 2013, the UARB dismissed the appeals and upheld the decision of the Municipality .
On April 26, 2013, the UARB approved NSPI’s $93 million capital work order request related to the project . The UARB decision is being appealed to the Nova Scotia Court of Appeal . The Court of Appeal is currently dealing with procedural matters . The appeal issue is whether NSPI should receive its revenue from the project through the power purchase agreement or a rate base mechanism .
The project is under development and expected to commence commercial operation in 2015 .
APPOINTMENTS
DirectorsEmeraOn November 8, 2013, the Board of Directors of Emera announced Jacqueline Sheppard, will assume the position of Chair effective May 7, 2014, replacing John McLennan, who will continue as a Director on the Emera Board of Directors .
NSPISandra Greer, B .B .A ., joined NSPI’s Board of Directors on February 5, 2014 . Ms . Greer is the former President and CEO, and presently a Board member, of Amirix Systems Inc . in Halifax, Nova Scotia .

14 Emera Inc . — Annual Report 2013
REVIEW OF 2013
EMERA CONSOLIDATED STATEMENTS OF INCOME
Three months ended Year ended For the December 31 December 31
millions of Canadian dollars (except per share amounts) 2013 2012 2013 2012 2011
Operating revenues — regulated $ 530.5 $ 489.6 $2,040.8 $1,912.7 $1,891.0Operating revenues — non-regulated 63.9 23.3 189.4 145.9 173.4
Total operating revenues 594.4 512.9 2,230.2 2,058.6 2,064.4
Regulated fuel for generation and purchased power 223.6 210.7 868.4 810.5 866.4Regulated fuel and fixed cost adjustments 0.2 2.0 (40.8) 10.0 (8.5)Non-regulated fuel for generation and purchased power 59.0 11.1 89.8 44.5 73.9Non-regulated direct costs 13.3 14.7 52.4 56.6 60.9Operating, maintenance and general 140.4 127.9 505.8 462.9 453.3Provincial, state and municipal taxes 12.3 12.4 49.7 49.4 49.2Depreciation and amortization 76.6 89.4 297.8 278.2 251.7
Total operating expenses 525.4 468.2 1,823.1 1,712.1 1,746.9
Income from operations 69.0 44.7 407.1 346.5 317.5
Income from equity investments 10.5 (3.6) 38.1 13.2 34.3Other income (expenses), net (1.8) 19.1 25.6 40.6 43.1Interest expense, net 43.4 41.5 172.2 167.1 159.4
Income before provision for income taxes 34.3 18.7 298.6 233.2 235.5
Income tax expense (recovery) 2.8 (27.9) 43.3 (12.4) (23.9)
Net income 31.5 46.6 255.3 245.6 259.4
Non-controlling interest in subsidiaries 4.9 3.9 18.5 13.7 11.7
Net income of Emera Incorporated 26.6 42.7 236.8 231.9 247.7
Preferred stock dividends 5.6 — 19.3 11.1 6.6
Net income attributable to common shareholders 21.0 42.7 217.5 220.8 241.1
After-tax derivative mark-to-market gain (loss) (42.0) (15.9) (41.9) (9.7) (3.0)
Adjusted net income attributable to common shareholders $ 63.0 $ 58.6 $ 259.4 $ 230.5 $ 244.1
Earnings per common share — basic $ 0.16 $ 0.34 $ 1.64 $ 1.77 $ 1.99
Earnings per common share — diluted $ 0.16 $ 0.34 $ 1.64 $ 1.76 $ 1.97
Adjusted earnings per common share — basic $ 0.47 $ 0.46 $ 1.96 $ 1.85 $ 2.02
Emera Incorporated’s consolidated net income decreased $21 .7 million to $21 .0 million in Q4 2013 compared to $42 .7 million in Q4 2012 . For the year ended December 31, 2013, Emera’s consolidated net income decreased $3 .3 million to $217 .5 million compared to $220 .8 million in 2012 .

Management’s Discussion and Analysis
Emera Inc . — Annual Report 2013 15
Income from OperationsFor the year ended December 31, 2013, total operating revenues increased $171 .6 million to $2,230 .2 million in 2013 compared to $2,058 .6 million in 2012 primarily due to acquisitions providing $101 .9 million in revenues and increased electricity pricing and residential and commercial sales volumes in NSPI, largely due to weather, adding a further $93 .9 million, partially offset by increased mark-to-market losses of $32 .2 million in Emera Energy .
For the year ended December 31, 2013, total operating expenses increased $111 .0 million to $1,823 .1 million in 2013 compared to $1,712 .1 million in 2012 primarily due to acquisitions, resulting in additional expenses of $89 .2 million .
Income from Equity InvestmentsFor the year ended December 31, 2013, income from equity investments increased $24 .9 million to $38 .1 million in 2013 compared to $13 .2 million in 2012 primarily due to the investment in LIL and improved earnings in Bear Swamp, NWP and APUC .
Other Income (Expenses), NetFor the year ended December 31, 2013, other income, net decreased $15 .0 million to $25 .6 million in 2013 compared to $40 .6 million in 2012 primarily due to the timing of pre-tax gains on the conversion of APUC subscription receipts to common shares .
Income Tax Expense (Recovery)For the year ended December 31, 2013, income tax expense increased $55 .7 million to $43 .3 million in 2013 compared to a recovery of $12 .4 million in 2012 primarily due to decreased tax deductions related to pension contributions in NSPI and increased income before provision for income taxes .
16 Emera Inc . — Annual Report 2013
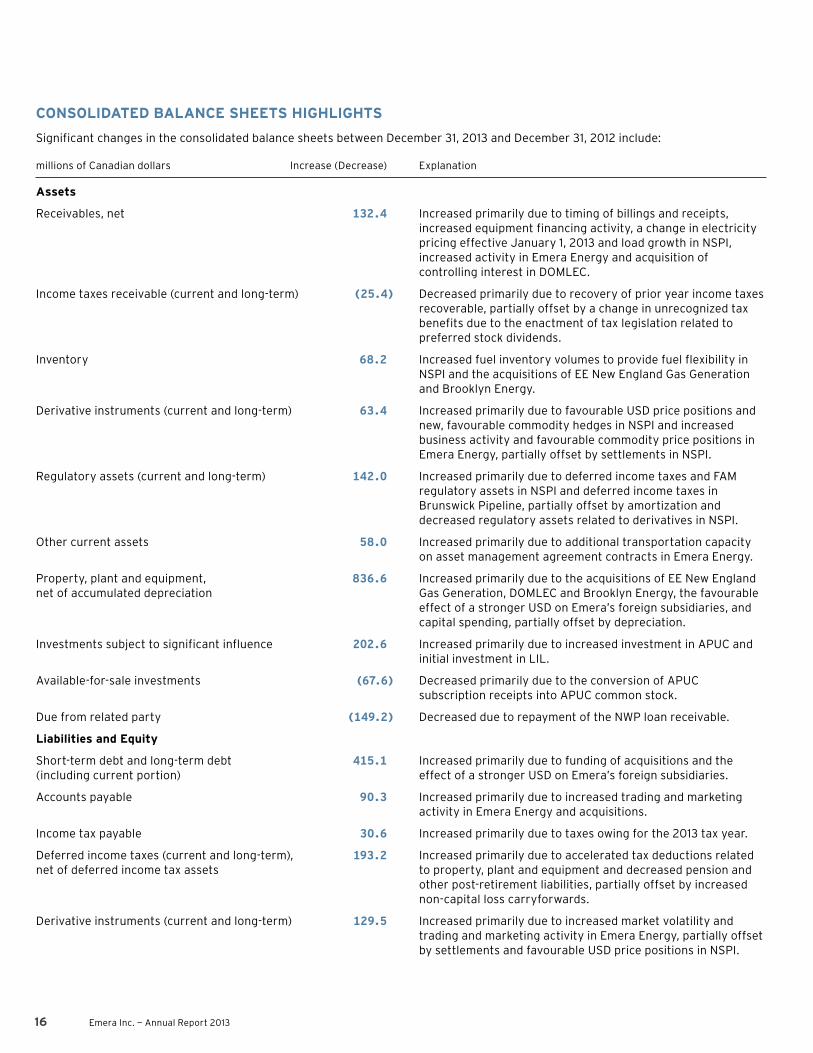
CONSOLIDATED BALANCE SHEETS HIGHLIGHTS
Significant changes in the consolidated balance sheets between December 31, 2013 and December 31, 2012 include:
millions of Canadian dollars Increase (Decrease) Explanation
Assets
Receivables, net 132.4 Increased primarily due to timing of billings and receipts, increased equipment financing activity, a change in electricity pricing effective January 1, 2013 and load growth in NSPI, increased activity in Emera Energy and acquisition of controlling interest in DOMLEC .
Income taxes receivable (current and long-term) (25.4) Decreased primarily due to recovery of prior year income taxes recoverable, partially offset by a change in unrecognized tax benefits due to the enactment of tax legislation related to preferred stock dividends .
Inventory 68.2 Increased fuel inventory volumes to provide fuel flexibility in NSPI and the acquisitions of EE New England Gas Generation and Brooklyn Energy .
Derivative instruments (current and long-term) 63.4 Increased primarily due to favourable USD price positions and new, favourable commodity hedges in NSPI and increased business activity and favourable commodity price positions in Emera Energy, partially offset by settlements in NSPI .
Regulatory assets (current and long-term) 142.0 Increased primarily due to deferred income taxes and FAM regulatory assets in NSPI and deferred income taxes in Brunswick Pipeline, partially offset by amortization and decreased regulatory assets related to derivatives in NSPI .
Other current assets 58.0 Increased primarily due to additional transportation capacity on asset management agreement contracts in Emera Energy .
Property, plant and equipment, 836.6 Increased primarily due to the acquisitions of EE New England net of accumulated depreciation Gas Generation, DOMLEC and Brooklyn Energy, the favourable
effect of a stronger USD on Emera’s foreign subsidiaries, and capital spending, partially offset by depreciation .
Investments subject to significant influence 202.6 Increased primarily due to increased investment in APUC and initial investment in LIL .
Available-for-sale investments (67.6) Decreased primarily due to the conversion of APUC subscription receipts into APUC common stock .
Due from related party (149.2) Decreased due to repayment of the NWP loan receivable .
Liabilities and Equity
Short-term debt and long-term debt 415.1 Increased primarily due to funding of acquisitions and the (including current portion) effect of a stronger USD on Emera’s foreign subsidiaries .
Accounts payable 90.3 Increased primarily due to increased trading and marketing activity in Emera Energy and acquisitions .
Income tax payable 30.6 Increased primarily due to taxes owing for the 2013 tax year .
Deferred income taxes (current and long-term), 193.2 Increased primarily due to accelerated tax deductions related net of deferred income tax assets to property, plant and equipment and decreased pension and
other post-retirement liabilities, partially offset by increased non-capital loss carryforwards .
Derivative instruments (current and long-term) 129.5 Increased primarily due to increased market volatility and trading and marketing activity in Emera Energy, partially offset by settlements and favourable USD price positions in NSPI .

Management’s Discussion and Analysis
Emera Inc . — Annual Report 2013 17
millions of Canadian dollars Increase (Decrease) Explanation
Regulatory liabilities (current and long-term) 40.5 Increased primarily related to derivatives in NSPI .
Pension and post-retirement liabilities (250.4) Decreased primarily due to increase in discount rate used in (current and long-term) determining the pension and post-retirement obligations and
investment gains during 2013 in NSPI and cash contributions exceeding the current benefit accrual in Bangor Hydro .
Common stock 59.3 Increased primarily due to the dividend reinvestment program .
Cumulative preferred stock 122.4 Increased due to the issuance of preferred shares .
Accumulated other comprehensive loss (345.7) Decreased primarily due to the favourable effect of a stronger USD on Emera’s foreign subsidiaries and an increase in discount rate and investment gains in 2013 in NSPI used to determine the pension and post-retirement obligations .
Retained earnings 29.1 Increased due to net income in excess of dividends paid .
Non-controlling interest in subsidiaries 61.6 Increased due to the issuance of preferred shares in GBPC and the acquisition of controlling interest in DOMLEC .
OUTSTANDING COMMON STOCK DATA
millions of millions of Common stock issued and outstanding: shares Canadian dollars
December 31, 2011 122.83 $1,385.0Issuance of common stock 5.91 193.2Issued for cash under Purchase Plans at market rate 1.55 52.0Discount on shares purchased under Dividend Reinvestment Plan — (2.3)Options exercised under senior management stock option plan 0.69 15.0Stock-based compensation — 0.8
December 31, 2012 130.98 $1,643.7Issued for cash under Purchase Plans at market rate 1.85 59.8Discount on shares purchased under Dividend Reinvestment Plan — (2.7)Options exercised under senior management stock option plan 0.06 1.4Stock-based compensation — 0.8
December 31, 2013 132.89 $1,703.0
As at January 27, 2014, the amount of issued and outstanding common shares was 141 .6 million .
The weighted average shares of common stock outstanding — basic for the three months ended December 31, 2013 was 133 .3 million (2012 — 126 .6 million) . The weighted average shares of common stock outstanding — basic for the year ended December 31, 2013 was 132 .6 million (2012 — 124 .9 million) .

18 Emera Inc . — Annual Report 2013
NSPI
Overview
NSPI was created in 1992 through the privatization of the Crown corporation Nova Scotia Power Corporation (“NSPC”) . NSPI is a fully integrated regulated electric utility with approximately $4 .2 billion of assets and is the primary electricity supplier in Nova Scotia, Canada . NSPI provides electricity generation, transmission and distribution services to approximately 501,000 customers . The Company owns 2,483 MW of generating capacity, of which approximately 50 .1 per cent is coal-fired; natural gas and/or oil comprise another 28 .3 per cent of capacity, hydro and wind total 19 .2 per cent ; and biomass-fuelled generation of 2 .4 per cent . In addition, NSPI has contracts to purchase renewable energy from independent power producers (“IPP”) . These IPPs own 273 MW, increasing to 373 MW in 2014 of wind and biomass-fuelled generation capacity . A further 208 MW of renewable capacity is being built directly or purchased under long-term contracts by NSPI of which 100 MW is expected to be in service by the end of 2014 and the remainder is expected to be in service by the end of 2015 . NSPI also owns approximately 5,000 kilometres of transmission facilities and 27,000 kilometres of distribution facilities . The Company has a workforce of approximately 1,735 people .
NSPI is a public utility as defined in the Public Utilities Act (Nova Scotia) (“Act”) and is subject to regulation under the Act by the UARB . The Act gives the UARB supervisory powers over NSPI’s operations and expenditures . Electricity rates for NSPI’s customers are also subject to UARB approval . The Company is not subject to a general annual rate review process, but rather participates in hearings from time to time at the Company’s or the UARB’s request .
NSPI is regulated under a cost-of-service model, with rates set to recover prudently incurred costs of providing electricity service to customers, and provide an appropriate return to investors . NSPI’s target regulated return on equity (“ROE”) range for 2013 and 2014 is 8 .75 per cent to 9 .25 per cent, based on an actual average regulated common equity component of up to 40 .0 per cent of actual average regulated capitalization .
On December 21, 2012, the UARB approved a General Rate Application (“GRA”) settlement agreement between NSPI and customer representatives, which resulted in an average net increase of 3 per cent by customer class effective January 1, 2013 and again on January 1, 2014 . As part of the settlement agreement, to achieve the net three per cent increase in rates, the UARB approved a rate stabilization plan in which a portion of non-fuel costs for 2013 and 2014 may be deferred for future recovery . Rates were approved based on a nine per cent regulated ROE, applied to a 37 .5 per cent regulated common equity component .
In Q4 2011, the UARB approved a GRA settlement agreement between NSPI and customer representatives which resulted in an average rate increase of 5 .1 per cent for all customers effective January 1, 2012 . Rates were approved based on a 9 .2 per cent regulated ROE, applied to a 37 .5 per cent regulated common equity component . As part of the settlement agreement, the UARB approved a fixed cost recovery related to two large industrial customers who experienced financial challenges and idled their mills . Where actual sales to these customers in 2012 were less than expected when rates were set, the resultant shortfall in contribution towards non-fuel costs was deferred for future recovery .
In 2009, the UARB approved a fuel adjustment mechanism (“FAM”) allowing NSPI to recover fluctuating fuel expenses from customers through annual fuel rate adjustments . Differences between prudently incurred fuel for generation and purchased power and certain fuel-related costs (“fuel costs”) and amounts recovered from customers through electricity rates in a year are deferred to a FAM regulatory asset or liability and recovered from or returned to customers in a subsequent year .
Although the market in Nova Scotia is otherwise mature, the transformation of energy supply to lower emission sources has driven organic growth within NSPI as new investments have been made in renewable generation and system reliability projects .

Management’s Discussion and Analysis
Emera Inc . — Annual Report 2013 19
Review of 2013
NSPI NET INCOME
Three months ended Year ended For the December 31 December 31
millions of Canadian dollars (except per share amounts) 2013 2012 2013 2012 2011
Operating revenues — regulated $ 350.1 $ 324.8 $1,334.9 $1,237.2 $1,233.0
Regulated fuel for generation and purchased power (1) 145.5 135.9 556.9 494.9 547.4Regulated fuel adjustment mechanism and fixed cost deferrals 0.2 2.0 (40.8) 10.0 (8.5)Operating, maintenance and general 68.0 73.1 272.3 259.8 268.6Provincial grants and taxes 9.4 9.4 37.7 37.8 38.7Depreciation and amortization 50.1 73.8 213.8 212.3 187.2
Total operating expenses 273.2 294.2 1,039.9 1,014.8 1,033.4
Income from operations 76.9 30.6 295.0 222.4 199.6
Other expenses net (2) 2.1 1.0 7.1 4.2 8.9Interest expense, net 28.8 29.1 119.6 113.3 104.2
Income before provision for income taxes 46.0 0.5 168.3 104.9 86.5Income tax expense (recovery) 14.2 (28.4) 34.4 (29.0) (44.9)
Net income of Nova Scotia Power Inc . 31.8 28.9 133.9 133.9 131.4Preferred stock dividends (3) 1.9 1.9 7.9 7.9 7.9
Contribution to consolidated net income $ 29.9 $ 27.0 $ 126.0 $ 126.0 $ 123.5
Contribution to consolidated earnings per common share $ 0.22 $ 0.21 $ 0.95 $ 1.01 $ 1.02
(1) Fuel for generation and purchased power includes affiliate transactions and proceeds from the sale of natural gas .(2) Other expenses, net is included in “Other income (expenses), net” on the Consolidated Statements of Income .(3) Preferred stock dividends are included in “Non-controlling interest in subsidiaries” on the Consolidated Statements of Income .

20 Emera Inc . — Annual Report 2013
NSPI’s contribution to consolidated net income increased $2 .9 million to $29 .9 million in Q4 2013 compared to $27 .0 million in Q4 2012 . For the year ended December 31, 2013, NSPI’s contribution to consolidated net income was consistent with 2012 . Highlights of the changes are summarized in the following table:
Three months ended Year ended For the December 31 December 31
millions of Canadian dollars
Contribution to consolidated net income — 2011 $ 123.5Increased electric margin (see Electric Margin section for explanation) 40 .3 Decreased operating, maintenance and general (“OM&G”) expenses primarily due to reversal of a receivable allowance of a large customer, decreased plant maintenance
spending and lower storm costs, partially offset by increased pension costs 8 .8 Increased depreciation and amortization primarily due to increased regulatory amortization (see Regulatory Amortization section below for explanation) and
increased depreciation resulting from increased property, plant and equipment and new depreciation rates effective January 1, 2012 (1) (26 .4)
Increased interest expense, net primarily due to higher long-term debt levels and decreased interest revenues related to the election to amend prior year
income tax returns in 2011 (1) (10 .1)Decreased income tax recovery primarily due to fewer accelerated tax deductions related to property, plant and equipment; the prior year included a deferred tax
recovery resulting from a reduction in a FAM regulatory asset; and increased income before provision for income taxes, partially offset by increased tax deductions related to pension contributions (15 .9)
Other, net (1) 5 .8
Contribution to consolidated net income — 2012 $ 27.0 $ 126.0Increased electric margin (see Electric Margin section for explanation) 17 .9 85 .1 Decreased OM&G expenses quarter-over-quarter primarily due to lower planned plant maintenance; increased OM&G expenses year-over-year primarily due to higher
pension costs, the reversal of a receivable allowance of a large customer in 2012 and operating costs associated with the new biomass generation facility, partially offset by decreased regulatory costs and organization-wide productivity improvements 5 .1 (12 .5)
Decreased depreciation and amortization quarter-over-quarter primarily due to changes in regulatory amortization (see Regulatory Amortization section below for explanation) 23 .7 (1 .5)Increased interest expense, net primarily year-over-year due to decreased allowance for funds used during construction largely due to lower capital spending and higher long-term
debt levels, partially offset by increased interest revenue on regulatory deferrals (0 .3) (6 .3)Increased income tax expense primarily due to decreased tax deductions related to pension contributions and increased income before provision for income taxes (42 .6) (63 .4)Other, net (1) (0 .9) (1 .4)Contribution to consolidated net income — 2013 $ 29.9 $ 126.0
(1) Amounts exclude variances included in the calculation of electric margin .

Management’s Discussion and Analysis
Emera Inc . — Annual Report 2013 21
OPERATING REVENUES — REGULATED
NSPI’s operating revenues — regulated include sales of electricity and other services as summarized in the following table:
Three months ended Year ended For the December 31 December 31
millions of Canadian dollars 2013 2012 2013 2012 2011
Electric revenues $ 342.0 $ 316.7 $1,304.3 $1,210.4 $1,209.7Other revenues 8.1 8.1 30.6 26.8 23.3
Operating revenues — regulated $ 350.1 $ 324.8 $1,334.9 $1,237.2 $1,233.0
Electric RevenuesElectric sales volume is primarily driven by general economic conditions, population and weather . Residential and commercial electricity sales are seasonal, with Q1 being the strongest period, reflecting colder weather and fewer daylight hours in the winter season .
NSPI’s residential load generally comprises individual homes, apartments and condominiums . Commercial customers include small retail operations, large office and commercial complexes, and the province’s universities and hospitals . Industrial customers include manufacturing facilities and other large volume operations . Other electric revenues consist primarily of sales to municipal electric utilities and revenues from street lighting .
Electric sales volumes are summarized in the following graphs by customer class:
Q4 Electric Sales VolumesGigawatt hours (GWh)
Other
Industrial
Commercial
Residential1,0981,173
12 1113
2,627 2,4922,706
1,073
657635
563
8687
83
786811
768
Annual Electric Sales VolumesGWh
Other
Industrial
Commercial
Residential4,1864,394
12 1113
9,789
11,206
10,467
4,275
2,1672,605 3,516
337
320
313
3,0993,148 3,102
Electric revenues are summarized in the following graphs by customer class:
Q4 Electric Revenuesmillions of Canadian dollars
Other
Industrial
Commercial
Residential158.1173.5
12 1113
316.7
282.9
342.0
141.0
52.8
55.4
45.2
11.7
13.0
10.9
94.1100.1
85.8
Annual Electric Revenuesmillions of Canadian dollars
Other
Industrial
Commercial
Residential606.8654.0
12 1113
1,210.4 1,209.7
1,304.3
564.9
190.6218.0
260.1
45.8
48.4
42.9
367.2383.9
341.8
22 Emera Inc . — Annual Report 2013
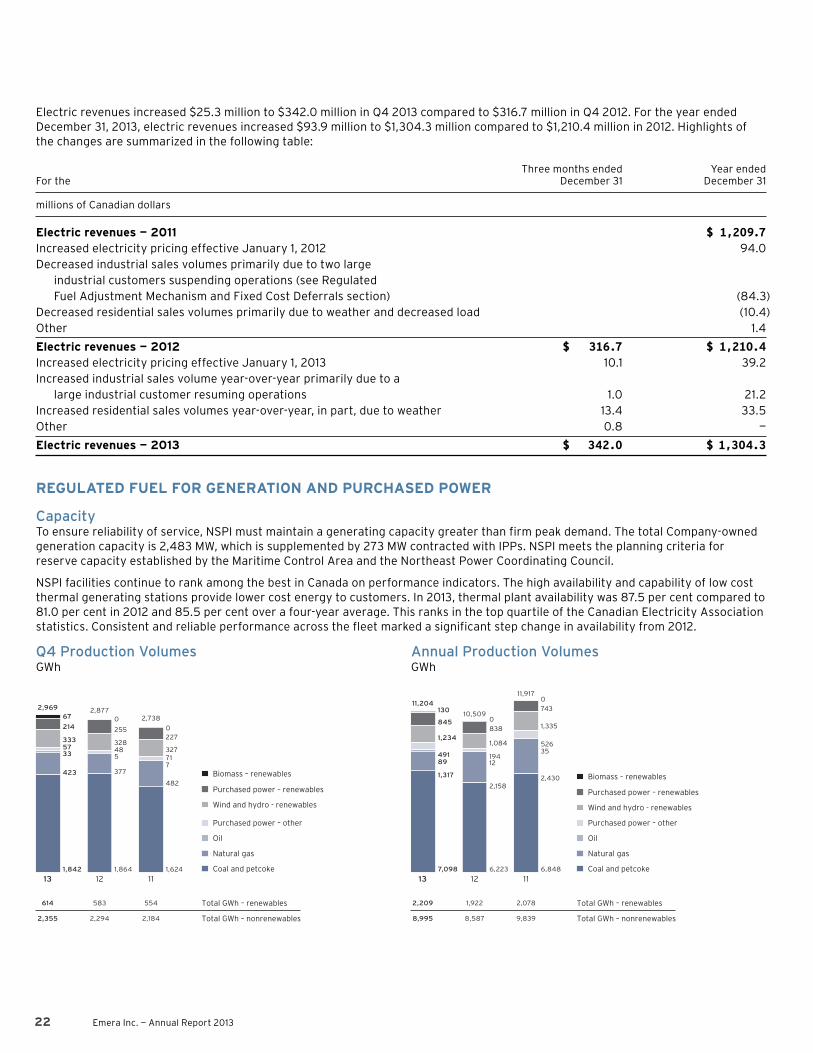
Electric revenues increased $25 .3 million to $342 .0 million in Q4 2013 compared to $316 .7 million in Q4 2012 . For the year ended December 31, 2013, electric revenues increased $93 .9 million to $1,304 .3 million compared to $1,210 .4 million in 2012 . Highlights of the changes are summarized in the following table:
Three months ended Year ended For the December 31 December 31
millions of Canadian dollars
Electric revenues — 2011 $1,209.7Increased electricity pricing effective January 1, 2012 94 .0 Decreased industrial sales volumes primarily due to two large industrial customers suspending operations (see Regulated
Fuel Adjustment Mechanism and Fixed Cost Deferrals section) (84 .3)Decreased residential sales volumes primarily due to weather and decreased load (10 .4)Other 1 .4
Electric revenues — 2012 $ 316.7 $1,210.4Increased electricity pricing effective January 1, 2013 10 .1 39 .2 Increased industrial sales volume year-over-year primarily due to a large industrial customer resuming operations 1 .0 21 .2 Increased residential sales volumes year-over-year, in part, due to weather 13 .4 33 .5 Other 0 .8 —
Electric revenues — 2013 $ 342.0 $1,304.3
REGULATED FUEL FOR GENERATION AND PURCHASED POWER
CapacityTo ensure reliability of service, NSPI must maintain a generating capacity greater than firm peak demand . The total Company-owned generation capacity is 2,483 MW, which is supplemented by 273 MW contracted with IPPs . NSPI meets the planning criteria for reserve capacity established by the Maritime Control Area and the Northeast Power Coordinating Council .
NSPI facilities continue to rank among the best in Canada on performance indicators . The high availability and capability of low cost thermal generating stations provide lower cost energy to customers . In 2013, thermal plant availability was 87 .5 per cent compared to 81 .0 per cent in 2012 and 85 .5 per cent over a four-year average . This ranks in the top quartile of the Canadian Electricity Association statistics . Consistent and reliable performance across the fleet marked a significant step change in availability from 2012 .
Q4 Production VolumesGWh
1,8641,842
12 1113
2,294 2,1842,355
583 554614
2,8772,738
2,969
1,624
067
0
377423
482
533
7
4857
71
328333
327
255214
227
Purchased power – other
Oil
Wind and hydro - renewables
Purchased power – renewables
Biomass – renewables
Natural gas
Coal and petcoke
Total GWh – renewables
Total GWh – nonrenewables
Annual Production VolumesGWh
6,2237,098
12 1113
1,922 2,0782,209
10,509
11,917
11,204
8,587 9,8398,995
6,848
2,430
838845
743
0
130
0
2,158
1,317
35
1289194491
5261,0841,234
1,335
Purchased power – other
Oil
Wind and hydro - renewables
Purchased power – renewables
Biomass – renewables
Natural gas
Coal and petcoke
Total GWh – renewables
Total GWh – nonrenewables

Management’s Discussion and Analysis
Emera Inc . — Annual Report 2013 23
Q4 Average Fuel Costs 2013 2012 2011
Dollars per megawatt hour (“MWh”) $ 49 $ 47 $ 47
Annual Average Fuel Costs 2013 2012 2011
Dollars per MWh $ 50 $ 47 $ 46
NSPI’s fuel costs are affected by generation mix which is largely dependent on the economic dispatch of the generating fleet, bringing the lowest cost options on stream first, such that the incremental cost of production increases as sales volumes increase . Generation mix may also be affected by plant outages, plant performance and environmental standards and regulations .
Historically, coal and petroleum coke (“petcoke”) has had the lowest per unit fuel cost, after hydro and NSPI-owned wind, which have no fuel cost component . Purchased power, natural gas, oil and biomass have the next lowest fuel cost, depending on the relative pricing of each . Over the last few years economic dispatch has favoured natural gas over coal . However, this trend has reversed since the latter part of 2012, due to volatility in natural gas markets in Nova Scotia as a result of supply challenges .
A large portion of NSPI’s fuel supply comes from international suppliers, and is subject to commodity price and foreign exchange risk . NSPI seeks to manage this risk through the use of financial hedging instruments and physical contracts and utilizes a portfolio strategy for fuel procurement with a combination of long-, medium- and short-term supply agreements . It also provides for supply and supplier diversification . Foreign exchange risk is managed through forward and swap contracts . Fuel contracts may also be exposed to broader global conditions which may include impacts on delivery reliability and price, despite contracted terms . The adoption and implementation of the FAM, effective January 1, 2009, has further helped NSPI manage this risk . Further details on NSPI’s risk management strategies related to regulated fuel for generation and purchased power are discussed in the Business Risks and Risk Management section .
Average unit fuel costs increased in Q4 2013 compared to Q4 2012 primarily due to increased commodity prices and increased sales volumes resulting in higher incremental fuel costs . Year-over-year, average unit fuel costs increased in 2013 compared to 2012 primarily due to increased natural gas prices experienced early in the year and increased sales volumes resulting in higher incremental fuel costs .
Regulated fuel for generation and purchased power increased $9 .6 million to $145 .5 million in Q4 2013 compared to $135 .9 million in Q4 2012 . For the year ended December 31, 2013, regulated fuel for generation and purchased power increased $62 .0 million to $556 .9 million compared to $494 .9 million in 2012 . Highlights of the changes are summarized in the following table:
Three months ended Year ended For the December 31 December 31
millions of Canadian dollars
Regulated fuel for generation and purchased power — 2011 $ 547.4Decreased sales volumes (71 .6)Increased commodity prices 6 .9 Favourable generation mix and plant performance (5 .0)Decreased renewable production due to lower hydro production 12 .2 Other 5 .0
Regulated fuel for generation and purchased power — 2012 $ 135.9 $ 494.9Increased commodity prices 6 .2 44 .8 Increased sales volumes 4 .9 38 .0 Favourable generation mix and plant performance (3 .5) (11 .7)Increased hydro and wind production (0 .3) (7 .5)Other 2 .3 (1 .6)
Regulated fuel for generation and purchased power — 2013 $ 145.5 $ 556.9

24 Emera Inc . — Annual Report 2013
REGULATED FUEL ADJUSTMENT MECHANISM AND FIXED COST DEFERRALS
Regulated Fuel Adjustment Mechanism and FAM Regulatory AssetNSPI has a Fuel Adjustment Mechanism (“FAM”) which enables NSPI to seek recovery of fuel costs through regularly scheduled rate adjustments . Differences between actual fuel costs and amounts recovered from customers through electricity rates in a year are deferred to a FAM regulatory asset or liability and recovered from or returned to customers in a subsequent year .
Pursuant to the FAM Plan of Administration, NSPI’s fuel costs are subject to independent audit . The first audit completed was for fiscal 2009, with no financial implications . The second audit completed was for fiscal 2010 and fiscal 2011 and, on December 21, 2012, the UARB disallowed $4 .5 million of fuel-related costs to be applied against the outstanding FAM balance . Including interest of $0 .7 million, this resulted in an after-tax impact to 2012 net income of $3 .6 million . The decision also disallowed $2 .0 million, which was applied in 2012 and reduced a regulatory asset owed from customers . The audit for fiscal 2012 and fiscal 2013 is currently underway .
On December 10, 2012, the UARB approved NSPI’s request for recovery of $45 .9 million of prior years’ unrecovered fuel-related costs as submitted in NSPI’s November 2012 FAM filing, subject to any changes related to the 2013 GRA Decision . On December 21, 2012, the UARB released their decision on the 2013 GRA . No changes were required as a result of this decision . The approved customer rates were set to recover $29 .2 million of prior years’ unrecovered fuel costs in 2013 which were included in the GRA filing in Q2 2013 .
As part of the 2013 GRA settlement agreement, NSPI will defer any 2013 unrecovered or over recovered fuel costs normally required to be collected from or returned to customers in 2014 . Instead, these costs will be eligible to be collected from or returned to customers beginning in 2015 .
On December 19, 2011, the UARB approved NSPI’s request associated with the recovery of prior period fuel costs . The recovery of these costs began January 1, 2012 . The approved customer rates were set to recover $69 .0 million of prior years’ unrecovered fuel costs in 2012 .
The regulated fuel adjustment included in “Regulated fuel and fixed cost adjustments” on the Consolidated Statements of Income related to the FAM includes the effect of fuel costs in both the current and preceding years, specifically: • The difference between actual fuel costs and amounts recovered from customers in the current year . This amount is deferred to a
FAM regulatory asset in “Regulatory assets” or a FAM regulatory liability in “Regulatory liabilities”; and • The recovery from (rebate to) customers of under (over) recovered fuel costs from prior years .
The FAM regulatory asset includes amounts recognized as a fuel adjustment and associated interest that is included in “Interest expense, net” on the Consolidated Statements of Income . Details of the FAM regulatory asset, classified in “Regulatory assets” on the Consolidated Balance Sheets, are summarized in the following table:
millions of Canadian dollars 2013 2012
FAM regulatory asset — Balance as at January 1 $ 43.1 $ 93.7Under (over) recovery of current year’s fuel costs 67.6 15.7Rebate to (recovery from) customers of prior years’ fuel costs (29.8) (65.9)FAM audit disallowance including interest adjustment — (5.2)Interest on FAM balance 5.5 4.8
FAM regulatory asset — Balance as at December 31 $ 86.4 $ 43.1

Management’s Discussion and Analysis
Emera Inc . — Annual Report 2013 25
Regulated Fixed Cost Deferrals and Fixed Cost Recovery Deferral Regulatory AssetsNSPI has two regulated fixed cost deferral mechanisms which include a 2013/2014 Rate Stabilization fixed cost recovery deferral (“FCR”) and a 2012 Large Industrial Customers FCR .
2013/2014 Rate Stabilization Fixed Cost Recovery DeferralOn December 21, 2012, the UARB approved a FCR for fiscal 2013 and 2014 as part of a rate stabilization plan . The UARB approved an average net three per cent increase in rates effective January 1, 2013 and again on January 1, 2014 . To achieve the net three per cent increase in rates, a portion of non-fuel costs for 2013 and 2014 may be deferred for future recovery . As part of the rate stabilization plan, any earnings in excess of NSPI’s target regulated ROE range, over the two year period, will reduce the amount deferred . The UARB has stipulated the rate stabilization regulatory asset cannot exceed $83 .3 million as at December 31, 2014 .
Recovery of the 2013/2014 rate stabilization regulatory asset will begin in 2015, when certain other regulatory assets are fully amortized .
The rate stabilization regulatory asset includes amounts recognized as a regulated fixed cost deferral and associated interest that is included in “Interest expense, net” on the Consolidated Statements of Income .
Details of the rate stabilization regulatory asset, classified in “Regulatory assets” on the Consolidated Balance Sheets, are summarized in the following table:
millions of Canadian dollars 2013
Rate stabilization regulatory asset — Balance as at January 1 $ —Under (over) recovered current year non-fuel costs 3.0Interest on rate stabilization FCR balance 0.7
Rate stabilization regulatory asset — Balance as at December 31 $ 3.7
2012 Large Industrial Customers Fixed Cost Recovery DeferralThe UARB approved a FCR for 2012 to address uncertainty associated with the operations of two large industrial customers who experienced financial challenges and idled their mills . In 2012, where actual sales to these customers were less than expected when rates were set, the resultant shortfall in contribution toward non-fuel costs was deferred as a regulatory asset for future recovery . The 2013 GRA settlement agreement, approved on December 21, 2012 by the UARB, allows recovery of this deferral from customers over a three-year period commencing January 1, 2013 .
The large industrial customers regulatory asset includes amounts recognized as a regulated fixed cost deferral in 2012, regulatory amortization included in “Depreciation and amortization” in 2013 and associated interest included in “Interest expense, net” on the Consolidated Statements of Income .
Details of the large industrial customers regulatory asset, classified in “Regulatory assets” on the Consolidated Balance Sheets are summarized in the following table:
millions of Canadian dollars 2013 2012
Large industrial customers regulatory asset — Balance as at January 1 $ 46.7 $ —Under recovery of 2012 large industrial customers non-fuel revenue — 44.7Recovery of regulatory asset recorded as regulatory amortization (16.7) —Interest on large industrial customers FCR balance 3.0 2.0
Large industrial customers regulatory asset — Balance as at December 31 $ 33.0 $ 46.7
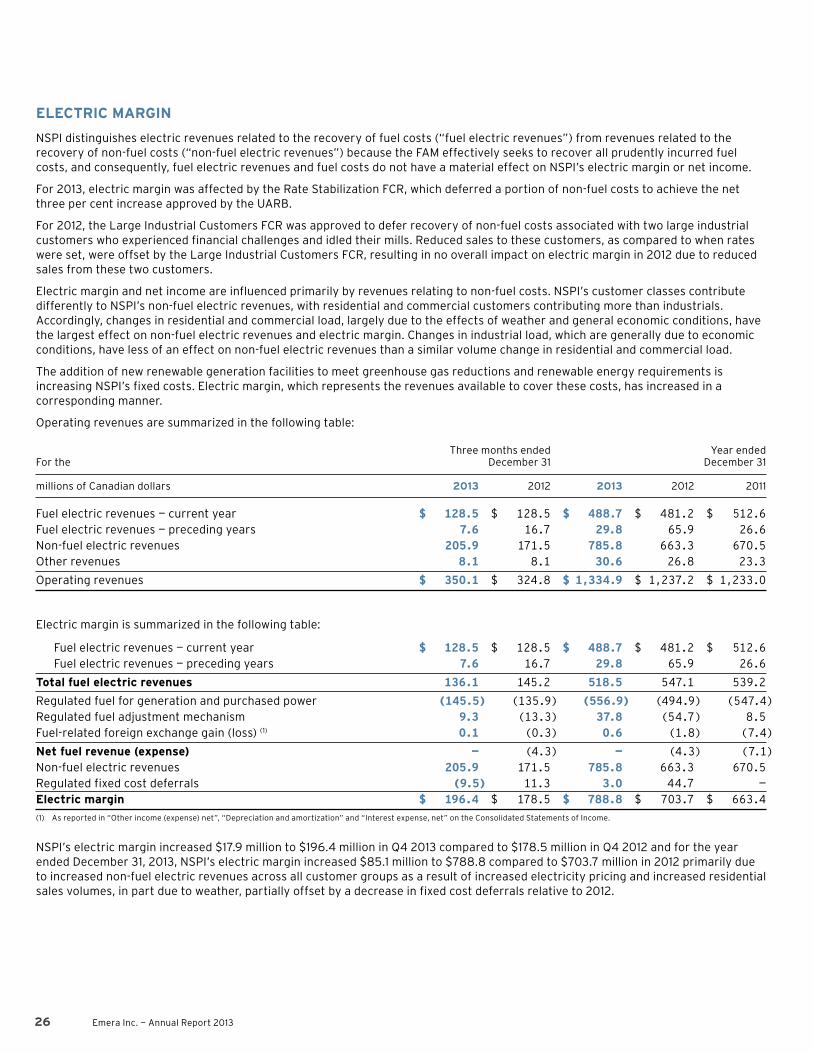
26 Emera Inc . — Annual Report 2013
ELECTRIC MARGIN
NSPI distinguishes electric revenues related to the recovery of fuel costs (“fuel electric revenues”) from revenues related to the recovery of non-fuel costs (“non-fuel electric revenues”) because the FAM effectively seeks to recover all prudently incurred fuel costs, and consequently, fuel electric revenues and fuel costs do not have a material effect on NSPI’s electric margin or net income .
For 2013, electric margin was affected by the Rate Stabilization FCR, which deferred a portion of non-fuel costs to achieve the net three per cent increase approved by the UARB .
For 2012, the Large Industrial Customers FCR was approved to defer recovery of non-fuel costs associated with two large industrial customers who experienced financial challenges and idled their mills . Reduced sales to these customers, as compared to when rates were set, were offset by the Large Industrial Customers FCR, resulting in no overall impact on electric margin in 2012 due to reduced sales from these two customers .
Electric margin and net income are influenced primarily by revenues relating to non-fuel costs . NSPI’s customer classes contribute differently to NSPI’s non-fuel electric revenues, with residential and commercial customers contributing more than industrials . Accordingly, changes in residential and commercial load, largely due to the effects of weather and general economic conditions, have the largest effect on non-fuel electric revenues and electric margin . Changes in industrial load, which are generally due to economic conditions, have less of an effect on non-fuel electric revenues than a similar volume change in residential and commercial load .
The addition of new renewable generation facilities to meet greenhouse gas reductions and renewable energy requirements is increasing NSPI’s fixed costs . Electric margin, which represents the revenues available to cover these costs, has increased in a corresponding manner .
Operating revenues are summarized in the following table:
Three months ended Year ended For the December 31 December 31
millions of Canadian dollars 2013 2012 2013 2012 2011
Fuel electric revenues — current year $ 128.5 $ 128.5 $ 488.7 $ 481.2 $ 512.6Fuel electric revenues — preceding years 7.6 16.7 29.8 65.9 26.6Non-fuel electric revenues 205.9 171.5 785.8 663.3 670.5Other revenues 8.1 8.1 30.6 26.8 23.3
Operating revenues $ 350.1 $ 324.8 $1,334.9 $1,237.2 $1,233.0
Electric margin is summarized in the following table:
Fuel electric revenues — current year $ 128.5 $ 128.5 $ 488.7 $ 481.2 $ 512.6 Fuel electric revenues — preceding years 7.6 16.7 29.8 65.9 26.6
Total fuel electric revenues 136.1 145.2 518.5 547.1 539.2
Regulated fuel for generation and purchased power (145.5) (135.9) (556.9) (494.9) (547.4)Regulated fuel adjustment mechanism 9.3 (13.3) 37.8 (54.7) 8.5Fuel-related foreign exchange gain (loss) (1) 0.1 (0.3) 0.6 (1.8) (7.4)
Net fuel revenue (expense) — (4.3) — (4.3) (7.1)Non-fuel electric revenues 205.9 171.5 785.8 663.3 670.5Regulated fixed cost deferrals (9.5) 11.3 3.0 44.7 —Electric margin $ 196.4 $ 178.5 $ 788.8 $ 703.7 $ 663.4
(1) As reported in “Other income (expense) net”, “Depreciation and amortization” and “Interest expense, net” on the Consolidated Statements of Income .
NSPI’s electric margin increased $17 .9 million to $196 .4 million in Q4 2013 compared to $178 .5 million in Q4 2012 and for the year ended December 31, 2013, NSPI’s electric margin increased $85 .1 million to $788 .8 compared to $703 .7 million in 2012 primarily due to increased non-fuel electric revenues across all customer groups as a result of increased electricity pricing and increased residential sales volumes, in part due to weather, partially offset by a decrease in fixed cost deferrals relative to 2012 .

Management’s Discussion and Analysis
Emera Inc . — Annual Report 2013 27
Q4 Average Electric Margin/MWh 2013 2012 2011
Dollars per MWh $ 73 $ 68 $ 63
Annual Average Electric Margin/MWh 2013 2012 2011
Dollars per MWh $ 75 $ 72 $ 59
The increase in average electric margin per MWh in Q4 2013 compared to Q4 2012 and the change in average electric margin per MWh for the year ended December 31, 2013 compared to 2012 is primarily due to increased electricity pricing and changes in customer mix, partially offset by the impact of fixed cost deferrals .
REGULATORY AMORTIZATION
Regulatory amortization is included in “Depreciation and amortization” on the Consolidated Statements of Income . Highlights of the changes in regulatory amortization are summarized in the following table:
Three months ended Year ended For the December 31 December 31
millions of Canadian dollars
Regulatory amortization — 2011 $ 19.1(Decreased) increased pre-2003 income tax regulatory asset amortization (1) 13.1Other regulatory amortization 1.2
Regulatory amortization — 2012 $ 28.3 $ 33.4(Decreased) increased pre-2003 income tax regulatory asset amortization (1) (27 .0) (14 .1)2012 Large Industrial Customers FCR amortization, which commenced in 2013, following the 2013 GRA settlement agreement 4 .1 16 .7 Other regulatory amortization 0 .4 1 .4
Regulatory amortization — 2013 $ 5.8 $ 37.4
(1) The UARB’s 2010 ROE decision has allowed NSPI flexibility in the recognition of additional amortization of the pre-2003 income tax regulatory asset in current periods, which accordingly reduces amortization in future periods resulting in a lower customer rate requirement .
PROVINCIAL GRANTS AND TAXES
NSPI pays annual grants to the Province of Nova Scotia in lieu of municipal taxation other than deed transfer tax .
INCOME TAXES
In 2013, NSPI was subject to corporate income tax (31 per cent) and Part VI .1 tax relating to preferred stock dividends (40 per cent) . NSPI also receives a reduction in its corporate income tax otherwise payable related to the Part VI .1 tax deduction (43 per cent of preferred stock dividends) .
In Q4 2012, NSPI contributed an additional $90 .0 million to its defined benefit pension plan resulting in tax savings of $31 .1 million .

28 Emera Inc . — Annual Report 2013
MAINE UTILITY OPERATIONS
Overview
Maine Utility Operations (‘Maine Utilities”) includes Bangor Hydro and Maine Public Service (MPS) . On January 1, 2014, Bangor Hydro and MPS merged to become Emera Maine . All amounts in the Maine Utility Operations section are reported in USD unless otherwise stated .
Bangor Hydro and MPS are both transmission and distribution (“T&D”) electric utilities . Bangor Hydro is the second largest utility in Maine . Bangor Hydro has approximately $900 million of assets and serves approximately 119,000 customers in eastern Maine, while MPS has approximately $150 million of assets and serves approximately 36,000 customers in northern Maine .
Electricity generation is deregulated in Maine, and several suppliers compete to provide customers with the energy delivered through both utilities’ T&D networks . Bangor Hydro owns and operates approximately 1,000 kilometres of transmission facilities and 11,500 kilometres of distribution facilities . Bangor Hydro‘s workforce is approximately 310 people . MPS owns and operates approximately 600 kilometres of transmission facilities, and 3,200 kilometres of distribution facilities . MPS’s workforce is approximately 100 people . Maine Utilities currently has approximately $120 million of additional transmission development in progress .
Approximately 50 per cent of Maine Utilities’ electric revenue represents distribution operations, 31 per cent is associated with local transmission operations and 19 per cent relates to stranded cost recoveries . The rates for each element are established in distinct regulatory proceedings .
DISTRIBUTION OPERATIONS
Maine Utilities’ distribution businesses operate under a traditional cost-of-service regulatory structure . Distribution rates are set by the MPUC based on an allowed ROE of 10 .2 per cent, on a common equity component of 50 per cent .
TRANSMISSION OPERATIONS
Bangor HydroBangor Hydro’s local transmission rates are set and regulated by the FERC annually on June 1, based upon a formula utilizing prior year actual transmission investments and expenses, adjusted for current year forecasted transmission investments and expenses . The allowed ROE for these local transmission investments is 11 .14 per cent . The common equity component is based upon the prior calendar year actual average balances . On June 1, 2013, Bangor Hydro’s local transmission rates decreased by approximately 5 per cent (2012 — increased 4 per cent) .
Bangor Hydro’s bulk transmission assets are managed by the ISO-New England (“ISO”) as part of a region-wide pool of assets . The ISO manages the regions’ bulk power generation and transmission systems and administers the open access transmission tariff . Currently, Bangor Hydro, along with all other participating transmission providers, recovers the full cost of service for its transmission assets from the customers of participating transmission providers in New England, based on a regional formula determined by FERC that is updated on June 1 of each year . This formula is based on prior year regionally funded transmission investments and expenses, adjusted for current year forecasted investments and expenses . Bangor Hydro’s allowed ROE for these transmission investments ranges from 11 .64 per cent to 12 .64 per cent, and the common equity component is based upon the prior calendar year average balances . The participating transmission providers are also required to contribute to the cost of service of such transmission assets on a ratable basis according to the proportion of the total New England load that their customers represent .
On June 1, 2013, Bangor Hydro’s regionally recoverable transmission investments and expenses decreased by 1 per cent (2012 — increased by 18 per cent) .
MPSMPS local transmission rates are set and regulated by the FERC annually on June 1, based upon a formula utilizing prior year actual transmission investments and expenses, adjusted for current year forecasted investments . These rates go into effect June 1 for wholesale customers and July 1 for retail customers . The current allowed ROE for transmission operations is 9 .75 per cent . The common equity component is based upon the prior calendar year actual average balances . On June 1, 2013, MPS’s transmission rates increased by 21 per cent for wholesale customers (June 1, 2012 — increased nine per cent ; July 1, 2012 decreased 17 per cent) and by 67 per cent for retail customers on July 1, 2013 (2012 — decreased five per cent) .
MPS’s electric service territory is not interconnected to the New England bulk power system, and MPS is not a member of the ISO .

Management’s Discussion and Analysis
Emera Inc . — Annual Report 2013 29
STRANDED COST RECOVERIES
Stranded cost recoveries in Maine are set by the MPUC . Electric utilities are entitled to recover all prudently incurred stranded costs resulting from the restructuring of the industry in 2000 that could not be mitigated or that arose as a result of rate and accounting orders issued by the MPUC . Unlike transmission and distribution operational assets, which are generally sustained with new investment, the net stranded cost regulatory asset pool diminishes over time as elements are amortized through charges to income and recovered through rates . Generally, regulatory rates to recover stranded costs are set every three years, determined under a traditional cost-of-service approach and are fully recoverable .
Bangor HydroBangor Hydro’s net regulatory assets primarily include the costs associated with the restructuring of an above-market power purchase contract, the unamortized portion on its loss on the sale of its investment in the Seabrook nuclear facility and deferrals associated with reconciling stranded costs . These net regulatory assets total approximately $65 .4 million as at December 31, 2013 (2012 — $63 .9 million) or 7 .2 per cent of Bangor Hydro’s net asset base (2012 — 7 .5 per cent) .
In May 2011, the MPUC approved an approximate 27 per cent increase in Bangor Hydro’s stranded cost rates for the period of June 1, 2011 to February 28, 2014 . The increased stranded cost revenues are offset, for the most part, by changes in regulatory amortizations, purchased power expense and resale of purchased power . The allowed ROE used in setting these new stranded cost rates is 7 .4 per cent, with a common equity component of 48 per cent .
While the stranded cost revenue requirements differ throughout the period due to changes in annual stranded costs, the actual annual stranded cost revenues are the same during the period . To levelize the impact of the varying revenue requirements, cost or revenue deferrals are recorded as a regulatory asset or liability, and addressed in subsequent stranded cost rate proceedings, where customer rates are adjusted accordingly .
MPSIn December 2011, the MPUC approved MPS’s stranded cost rates for the three-year period January 1, 2012 through December 31, 2014 . This revised three-year agreement, which amortizes essentially all of MPS’s remaining stranded costs, and resulted in an approximately 50 per cent rate decrease, has an ROE of 7 .2 per cent and a common equity component of 50 per cent . Any residual stranded costs remaining after December 31, 2014 will be recovered in future rate proceedings .

30 Emera Inc . — Annual Report 2013
Review of 2013
MAINE UTILITY OPERATIONS’ NET INCOME
Three months ended Year ended For the December 31 December 31
millions of US dollars (except per share amounts) 2013 2012 2013 2012 2011
Operating revenues — regulated $ 54.1 $ 52.3 $ 211.2 $ 204.5 $ 204.1Operating revenues — non-regulated — 0.1 0.5 0.5 0.5
Total operating revenues 54.1 52.4 211.7 205.0 204.6
Regulated fuel for generation and purchased power 7.7 8.8 30.8 31.7 27.9Transmission pool expense (1) 5.7 5.1 22.9 19.4 17.9Operating, maintenance and general 9.7 13.2 44.2 49.5 43.6Provincial, state and municipal taxes 2.4 3.0 10.2 10.1 9.0Depreciation and amortization 9.8 6.9 35.9 31.3 38.6
Total operating expenses 35.3 37.0 144.0 142.0 137.0
Income from operations 18.8 15.4 67.7 63.0 67.6
Other income (expenses), net 1.1 1.3 3.3 5.3 4.3Interest expense, net 2.8 3.2 12.2 13.0 11.8
Income before provision for income taxes 17.1 13.5 58.8 55.3 60.1Income tax expense (recovery) 6.2 4.8 21.6 19.9 22.7
Contribution to consolidated net income — USD $ 10.9 $ 8.7 $ 37.2 $ 35.4 $ 37.4
Contribution to consolidated net income — CAD $ 11.4 $ 8.6 $ 38.4 $ 35.4 $ 37.0
Contribution to consolidated earnings per common share — CAD $ 0.09 $ 0.07 $ 0.29 $ 0.28 $ 0.31
Net income weighted average foreign exchange rate — CAD/USD $ 1.05 $ 0.99 $ 1.03 $ 1.00 $ 0.99
(1) Transmission pool expense is included in “Regulated fuel for generation and purchased power” on the Consolidated Statements of Income .

Management’s Discussion and Analysis
Emera Inc . — Annual Report 2013 31
Maine Utilities’ USD contribution to consolidated net income increased by $2 .2 million to $10 .9 million in Q4 2013 compared to $8 .7 million in Q4 2012 . For the year ended December 31, 2013, Maine Utilities USD contribution to consolidated net income increased by $1 .8 million to $37 .2 million compared to $35 .4 million in 2012 . Highlights of the USD net income changes are summarized in the following table:
Three months ended Year ended For the December 31 December 31
millions of US dollars
Contribution to consolidated net income — 2011 $ 37.4Increased operating revenues — regulated (see Operating Revenues — Regulated Section below) 0 .4 Increased regulated fuel for generation and purchased power expense due to changes in long-term purchased power contracts (3 .8)Increased transmission pool expense due to new transmission investments in New England (1 .5)Increased OM&G expenses primarily due to decreased capitalized construction overheads and increased pension and medical expenses (5 .9)Decreased depreciation and amortization primarily due to the difference between higher purchased power costs and lower stranded cost revenues 7 .3 Decreased income tax expense primarily due to decreased income before provision for income taxes 2 .8 Other (1 .3)
Contribution to consolidated net income — 2012 $ 8.7 $ 35.4Increased operating revenues — regulated (see Operating Revenues — Regulated Section below) 1 .8 6 .7 Increased transmission pool expense primarily due to new transmission investments in New England (0 .6) (3 .5)Decreased OM&G expenses primarily due to increased capitalized construction overheads as a result of higher
capital spending in 2013 and decreased employee benefit costs 3 .5 5 .3 Increased depreciation and amortization primarily due to increased regulatory amortization and the effect of increased transmission investments (2 .9) (4 .6)Decreased other income, net, primarily due to lower allowance for equity funds used during construction as a result of a lower level of construction work in progress (0 .2) (2 .0)Decreased interest expense, net, primarily due to lower average outstanding debt 0 .4 0 .8 Increased income tax expense primarily due to increased income before provision for income taxes (1 .4) (1 .7)Other 1 .6 0 .8
Contribution to consolidated net income — 2013 $ 10.9 $ 37.2
Maine Utility Operations’ CAD contribution to consolidated net income increased by $2 .8 million to $11 .4 million in Q4 2013 from $8 .6 million in Q4 2012 . For the year ended December 31, 2013, Maine Utility Operations’ CAD contribution to consolidated net income increased by $3 .0 million to $38 .4 million from $35 .4 million in 2012 . The impact of a stronger USD, increased CAD earnings quarter-over-quarter by $0 .6 million for the three months ended December 31, 2013 and year-over-year $1 .2 million for the year ended December 31, 2013 .

32 Emera Inc . — Annual Report 2013
OPERATING REVENUES — REGULATED
Maine Utilities operating revenues — regulated include sales of electricity and other services as summarized in the following table:
Q4 Operating Revenues — Regulatedmillions of US dollars 2013 2012 2011
Electric revenues $ 39.3 $ 37.5 $ 37.1Transmission pool revenues 11.3 11.0 8.8Resale of purchased power 3.5 3.8 4.7
Operating revenues — regulated $ 54.1 $ 52.3 $ 50.6
Annual Operating Revenues — Regulatedmillions of US dollars 2013 2012 2011
Electric revenues $ 146.9 $ 143.9 $ 145.8Transmission pool revenues 50.7 46.1 40.2Resale of purchased power 13.6 14.5 18.1
Operating revenues — regulated $ 211.2 $ 204.5 $ 204.1
ELECTRIC REVENUES
Electric sales volume is primarily driven by general economic conditions, population and weather . Electric sales pricing in Maine is regulated, and therefore can change in accordance with regulatory decisions .
Electric sales volumes are summarized in the following graphs by customer class:
Q4 Electric Sales VolumesGWh
Other
Industrial
Commercial
Residential204206
12 1113
506 497511
196
10690
91
32 3
193213 207
Annual Electric Sales VolumesGWh
Other
Industrial
Commercial
Residential786801
12 1113
2,009 2,0172,038
779
425369 381
1211 11
786857 846

Management’s Discussion and Analysis
Emera Inc . — Annual Report 2013 33
Electric revenues are summarized in the following graphs by customer class:
Q4 Electric Revenuesmillions of US dollars
Other
Industrial
Commercial
Residential18.118.7
12 1113
37.5 37.1
39.3
17.2
3.62.8
2.6
2.12.8
3.0
13.715.014.3
Annual Electric Revenuesmillions of US dollars
Other
Industrial
Commercial
Residential68.471.7
12 1113
143.9 145.8146.9
68.1
13.011.4
11.2
9.26.7
10.3
53.357.1
56.2
Electric revenues increased $1 .8 million to $39 .3 million in Q4 2013 compared to $37 .5 million in Q4 2012 . For the year ended December 31, 2013, electric revenues increased $3 .0 million to $146 .9 million in 2013 compared to $143 .9 million in 2012 . Highlights of the changes are summarized in the following table:
Three months ended Year ended For the December 31 December 31
millions of US dollars
Electric revenues — 2011 $ 145.8Decreased primarily due to transmission rate changes in Bangor Hydro and stranded cost rate changes in MPS (1 .3)Decreased sales volumes primarily due to weather (0 .6)
Electric revenues — 2012 $ 37.5 $ 143.9Increased sales volumes primarily due to weather 0 .4 2 .1 Increased primarily due to Bangor Hydro stranded cost rate increase in Q3 2013 and transmission rate changes in Bangor Hydro and MPS 1 .4 3 .1 Decreased primarily due to the estimated effect of the expected FERC transmission rate review that could retroactively reduce the ROE Bangor Hydro earns on its transmission investments — (2 .2)
Electric revenues — 2013 $ 39.3 $ 146.9
Q4 Electric Revenue/MWhmillions of US dollars 2013 2012 2011
Dollars per MWh $ 77 $ 74 $ 75
Annual Average Electric Revenue/MWhmillions of US dollars 2013 2012 2011
Dollars per MWh $ 72 $ 72 $ 72

34 Emera Inc . — Annual Report 2013
TRANSMISSION POOL REVENUES AND EXPENSES
These transmission pool expenses are recorded in “Regulated fuel for generation and purchased power” in the Consolidated Statements of Income . Transmission pool revenues are recorded in “Operating revenues — regulated” in the Consolidated Statements of Income .
Transmission pool revenues and expenses are summarized in the following table:
Three months ended Year ended For the December 31 December 31
millions of US dollars 2013 2012 2013 2012 2011
Transmission pool revenues $ 11.3 $ 11.0 $ 50.7 $ 46.1 $ 40.2Transmission pool expenses 5.7 5.1 22.9 19.4 17.9
Net transmission pool revenues $ 5.6 $ 5.9 $ 27.8 $ 26.7 $ 22.3
Maine Utilities’ net transmission pool revenues decreased $0 .3 million to $5 .6 million in Q4 2013 compared to $5 .9 million in Q4 2012 primarily due to a reduction in the level of regionally funded transmission investments and expenses, and partially offset by the effects of weather in Q4 2013 . For the year ended December 31, 2013, net transmission pool revenues increased $1 .1 million to $27 .8 million compared to $26 .7 million in 2012, primarily due to a higher level of investment in regionally funded transmission assets, as well as increased loads due to weather in the New England region .
RESALE OF PURCHASED POWER AND REGULATED FUEL FOR GENERATION AND PURCHASED POWER
Bangor Hydro has several above-market power purchase contracts with generators in its service territory . The power purchased under these arrangements is resold at market rates significantly below the contract rates . The difference between the cost of the power purchased under these arrangements and the revenue collected is recovered through stranded cost rates under a full reconciliation rate mechanism .
MPS has an expired power purchase contract that is currently being recovered in stranded cost rates and the related deferred asset of $1 .7 million as at December 31, 2013 ($3 .0 million in 2012) is being amortized accordingly .
Resale of purchased power decreased $0 .3 million to $3 .5 million in Q4 2013 compared to $3 .8 million in Q4 2012 and for the year ended December 31, 2013, resale of purchased power decreased $0 .9 million to $13 .6 million in 2013 compared to $14 .5 million in 2012 primarily due to lower market rates for electricity in New England in 2013 .
INCOME TAXES
Maine Utilities’ are subject to corporate income tax at the statutory rate of 40 .8 per cent (combined US federal and state income tax rate) .

Management’s Discussion and Analysis
Emera Inc . — Annual Report 2013 35
CARIBBEAN UTILITY OPERATIONS
Overview
Caribbean Utility Operations includes Emera’s: • 80 .3 per cent investment in Light & Power Holdings Ltd . (“LPH”) and its wholly owned subsidiary Barbados Light & Power Company
Ltd . (“BLPC”), a vertically integrated utility and the provider of electricity on the island of Barbados, which serves approximately 125,000 customers and is regulated by the Fair Trading Commission, Barbados . The government of Barbados has granted BLPC a franchise to generate, transmit and distribute electricity on the island until 2028 . BLPC owns approximately 239 MW of oil-fired generation, 82 kilometres of transmission facilities and 1,659 kilometres of distribution facilities . BLPC has a workforce of approximately 460 people . BLPC is regulated under a cost-of-service model with rates set to recover prudently incurred costs of providing electricity service to customers, and provide an appropriate return to investors . BLPC’s approved regulated return on rate base for 2013 is 10 .0 per cent . A fuel pass-through mechanism ensures fuel costs are recovered . Emera acquired a controlling interest in LPH on January 25, 2011 .
• 50 .0 per cent direct and 30 .4 per cent indirect interest in Grand Bahama Power Company Ltd . (“GBPC”), a vertically integrated utility and the sole provider of electricity on Grand Bahama Island . GBPC serves approximately 19,000 customers . GBPC owns approximately 98 MW of oil-fired generation, 138 kilometres of transmission facilities and 860 kilometres of distribution facilities and has a workforce of approximately 156 people . GBPC is regulated by GBPA, which has granted it a licensed, regulated and exclusive franchise to generate, transmit and distribute electricity on the island until 2054 . Effective July 1, 2012, GBPC’s approved regulated return on rate base for 2013 is 10 .0 per cent . A fuel pass-through mechanism ensures fuel costs are recovered .
• 41 .7 per cent indirect controlling interest, through LPH, in Dominica Electricity Services Ltd . (“DOMLEC”), an integrated utility on the island of Dominica . DOMLEC serves approximately 35,000 customers and is regulated by the Independent Regulatory Commission, Dominica . DOMLEC owns approximately 20 MW of oil-fired generation, 404 kilometres of transmission facilities and 552 kilometres of distribution facilities . DOMLEC has a workforce of approximately 198 people . On October 7, 2013, the Independent Regulatory Commission, Dominica issued a Transmission, Distribution & Supply License and a Generation License, both of which will come into effect on January 1, 2014 for a period of 25 years . These new licenses will replace the existing license, which was due to expire on December 31, 2015 .
• 15 .3 per cent indirect interest, through LPH, in St . Lucia Electricity Services Limited (“LUCELEC”), a vertically integrated regulated electric utility on the Caribbean island of St . Lucia . The investment in LUCELEC is accounted for on the equity basis .

36 Emera Inc . — Annual Report 2013
Review of 2013
CARIBBEAN UTILITY OPERATIONS’ NET INCOME
Three months ended Year ended For the December 31 December 31
millions of US dollars (except per share amounts) 2013 2012 2013 2012 2011
Operating revenues — regulated $ 106.5 $ 101.3 $ 427.4 $ 421.1 $ 411.2
Regulated fuel for generation and purchased power 60.9 61.5 248.6 264.8 276.9Operating, maintenance and general 28.0 26.1 103.4 94.3 88.4Property taxes (1) 0.4 0.2 1.5 1.5 1.5Depreciation and amortization 6.7 7.3 30.9 30.2 22.8
Total operating expenses 96.0 95.1 384.4 390.8 389.6
Income from operations 10.5 6.2 43.0 30.3 21.6
Income from equity investment 0.8 0.5 1.7 1.7 2.9Other income (expenses), net 4.6 4.9 11.6 7.7 35.9Interest expense, net 3.1 2.6 11.7 9.3 8.7
Income before provision for income taxes 12.8 9.0 44.6 30.4 51.7Income tax expense (recovery) 1.4 0.3 3.2 1.5 0.7
Net income 11.4 8.7 41.4 28.9 51.0
Non-controlling interest in subsidiaries (2.6) (1.9) (8.9) (5.7) (3.8)
Preferred stock dividends (2) — — 1.2 — —
Contribution to consolidated net income — USD $ 8.8 $ 6.8 $ 31.3 $ 23.2 $ 47.2
Contribution to consolidated net income — CAD $ 9.2 $ 6.7 $ 32.4 $ 23.2 $ 46.8
Contribution to consolidated earnings per common share — CAD $ 0.07 $ 0.05 $ 0.24 $ 0.19 $ 0.39
Net income weighted average foreign exchange rate — CAD/USD $ 1.05 $ 0.99 $ 1.04 $ 1.00 $ 0.99
(1) Included in “Provincial, state and municipal taxes” on the Consolidated Statements of Income .(2) Preferred stock dividends are included in “Non-controlling interest in subsidiaries” on the Consolidated Statements of Income .

Management’s Discussion and Analysis
Emera Inc . — Annual Report 2013 37
Caribbean Utility Operations’ USD contribution to consolidated net income increased by $2 .0 million to $8 .8 million in Q4 2013 compared to $6 .8 million in Q4 2012 . For the year ended December 31, 2013, Caribbean Utility Operations’ USD contribution to consolidated net income increased by $8 .1 million to $31 .3 million compared to $23 .2 million in 2012 . Highlights of the net income changes are summarized in the following table:
Three months ended Year ended For the December 31 December 31
millions of US dollars
Contribution to consolidated net income — 2011 $ 47.2Increased electric margin primarily due to GBPC’s rate structure changes and increased investment in LPH as of January 25, 2011 15 .9 Increased OM&G expenses primarily due to business development activities and transitional costs associated with the new generation in GBPC (5 .9)Increased non-controlling interest primarily due to increased earnings in GBPC (1 .8)Decreased other income, net primarily due to a $28 .7 million gain on increased investment in LPH as of January 25, 2011 (28 .2)Other (4 .0)
Contribution to consolidated net income — 2012 $ 6.8 $ 23.2Increased electric margin quarter-over-quarter primarily due to increased sales volumes in GBPC, partially offset by decreased sales volumes in LPH; increased
year-over-year also due to GBPC’s rate structure changes effective July 1, 2012 0 .8 5 .8 OM&G expenses decreased quarter-over-quarter primarily due to reduced LPH maintenance costs; increased year-over-year also due to LPH business development activities 1 .1 (0 .5)Decreased other income (expenses), net quarter-over-quarter primarily due to recognition of a regulatory asset in GBPC in 2012, partially offset by the recognition of $4 .2 million
investment income relating to LPH’s self-insurance fund; increased year-over-year also due to recognition of a $2 .6 million regulatory asset related to the Earnings Share Mechanism in GBPC (see Other income (expenses), net below) (0 .2) 1 .2
Increased interest expense quarter-over-quarter primarily due to acquisition of a controlling interest in DOMLEC; increased year-over-year also due to financing costs associated
with issuance of GBPC’s preferred shares (0 .3) (1 .7)Increased preferred dividends due to preferred share issuance in January 2013 — (1 .2)Net earnings effect of the acquisition of a controlling interest in DOMLEC as of April 10, 2013, including $2 .2 million gain on acquisition 0 .6 3 .5 Other — 1 .0
Contribution to consolidated net income — 2013 $ 8.8 $ 31.3
Caribbean Utility Operations’ CAD contribution to consolidated net income increased by $2 .5 million to $9 .2 million in Q4 2013 compared to $6 .7 million in Q4 2012 . Year-over-year, Caribbean Utility Operations’ CAD contribution to consolidated net income increased by $9 .2 million to $32 .4 million in 2013 compared to $23 .2 million in 2012 . The impact of a stronger USD, quarter-over-quarter increased CAD earnings by $0 .5 million for the three months ended December 31, 2013 compared to 2012 . The impact of a stronger USD year-over-year increased CAD earnings by $1 .1 million in 2013 compared to 2012 .

38 Emera Inc . — Annual Report 2013
OPERATING REVENUES — REGULATED
Caribbean Utility Operations operating revenues — regulated include sales of electricity and other services as summarized in the following table:
Q4 Operating Revenues — Regulatedmillions of US dollars 2013* 2012 2011
Electric revenues — base rates $ 45.4 38.9 $ 36.8Fuel charge 60.3 61.5 68.0
Total electric revenues 105.7 100.4 104.8Other revenues 0.8 0.9 0.8
Operating revenues — regulated $ 106.5 101.3 $ 105.6
* DOMLEC contributed $9 .2 million to operating revenues — regulated .
Annual Operating Revenues — Regulatedmillions of US dollars 2013* 2012 2011
Electric revenues — base rates $ 177.0 $ 157.6 $ 148.9Fuel charge 247.0 260.6 259.3
Total electric revenues 424.0 418.2 408.2Other revenues 3.4 2.9 3.0
Operating revenues — regulated $ 427.4 $ 421.1 $ 411.2
* DOMLEC contributed $26 .5 million to operating revenues — regulated .

Management’s Discussion and Analysis
Emera Inc . — Annual Report 2013 39
ELECTRIC REVENUES
Electric sales volume is primarily driven by general economic conditions, population and weather . Residential and commercial electricity sales are seasonal, with Q3 being the strongest period, reflecting warmer weather .
Q4 Electric Sales VolumesGWh
Other
Industrial
Commercial
Residential99110
12 1113*
302 307
326
97
19
18
24
6
7
6
178191
180
* DOMLEC contributed 10 GWh to residential, 12 GWh to commercial, nil to industrial and 1 GWh to other .
Annual Electric Sales VolumesGWh
Other
Industrial
Commercial
Residential400428
12 1113*
1,2311,200
1,291
385
8793
92
2326
22
721744701
* DOMLEC contributed 29 GWh to residential, 35 GWh to commercial, nil to industrial and 2 GWh to other .
Electric revenues are summarized in the following tables by customer class:
Q4 Electric Revenuesmillions of US dollars
Other
Industrial
Commercial
Residential30.833.3
12 1113*
100.4104.8105.7
32.2
6.87.6 4.7
1.71.9
6.7
61.162.9 61.2
* DOMLEC contributed $3 .8 million to residential, $5 .1 million to commercial, nil to industrial and $0 .2 million to other .
Annual Electric Revenuesmillions of US dollars
Other
Industrial
Commercial
Residential127.3133.2
12 11
418.2 408.2424.0
124.6
31.231.531.7
10.97.8
12.1
248.8251.5 239.8
13*
* DOMLEC contributed $11 .3 million to residential, $14 .5 million to commercial, nil to industrial and $0 .5 million to other .

40 Emera Inc . — Annual Report 2013
Electric revenues increased $5 .3 million to $105 .7 million in Q4 2013 compared to $100 .4 million in Q4 2012 . For the year ended December 31, 2013, electric revenues increased $5 .8 million to $424 .0 million compared to $418 .2 million in 2012 . Highlights of the changes are summarized in the following table:
Three months ended Year ended For the December 31 December 31
millions of US dollars
Electric revenues — 2011 $ 408.2Increased year-over-year due to the increased investment in LPH as of January 25, 2011 17 .9 Increased primarily due to changes in GBPC rate structure 2 .3 Decreased fuel charge primarily due to lower temporary generation costs and improved plant performance in GBPC (9 .8)Other (0 .4)
Electric revenues — 2012 $ 100.4 $ 418.2Increased due to acquisition of a controlling interest in DOMLEC 9 .1 26 .3 Increased due to GBPC’s rate structure changes — 2 .3 Increased sales volumes in GBPC 0 .7 0 .4 Decreased fuel charge primarily due to lower fuel prices (4 .5) (23 .2)
Electric revenues — 2013 $ 105.7 $ 424.0
Q4 Electric Revenue/MWhmillions of US dollars 2013 2012 2011
Dollars per MWh $ 324 $ 332 $ 341
Annual Average Electric Revenue/MWhmillions of US dollars 2013 2012 2011
Dollars per MWh $ 328 $ 340 $ 340

Management’s Discussion and Analysis
Emera Inc . — Annual Report 2013 41
ELECTRIC MARGIN
Caribbean Utility Operations distinguishes revenues related to the recovery of fuel costs through the fuel charge from revenues related primarily to the recovery of non-fuel costs (“base rates”) . Caribbean Utility Operations’ electric margin and net income are influenced primarily by the base rates, whereas the fuel charge and fuel costs do not have a material effect on electric margin or net income . In BLPC, GBPC and DOMLEC, customer classes contribute differently to the Company’s base rate revenue, with residential and commercial customers contributing more than industrials . Residential and commercial load is primarily affected by changes in weather and economic conditions, while industrial load is primarily affected by changes in the economic conditions .
Electric margin is summarized in the following table:
Three months ended Year ended For the December 31 December 31
millions of US dollars 2013 2012 2013 2012 2011
Operating revenues — regulated $ 106.5 $ 101.3 $ 427.4 $ 421.1 $ 411.2Less: Other revenues (0.8) (0.9) (3.4) (2.9) (3.0)
Total electric revenues 105.7 100.4 424.0 418.2 408.2
Total electric revenues are broken down as follows:Electric revenues — base rate $ 45.4 $ 38.9 $ 177.0 $ 157.6 $ 148.9Fuel charge 60.3 61.5 247.0 260.6 259.3
Total electric revenues 105.7 100.4 424.0 418.2 408.2
Regulated fuel for generation and purchased power (1) 60.9 61.5 248.6 264.8 276.9Regulatory amortization (2) 0.7 0.7 2.9 1.8 (4.4)
Electric margin (3) $ 44.1 $ 38.2 $ 172.5 $ 151.6 $ 135.7
(1) Regulated fuel for generation and purchased power includes nil temporary generation costs in Q4 2013 and for the year ended December 31, 2013 (2012 — nil and $3 .7 million respectively), which ceased in Q3 2012 when the new generation plant went into service .
(2) Included in “Depreciation and amortization” on the Consolidated Statements of Income .(3) The acquisition of DOMLEC in Q2 2013 contributed $5 .1 million in Q4 2013 and $15 .1 million for the year ended December 31, 2013 to Caribbean Utility Operations’ electric margin .
Caribbean Utility Operations’ electric margin increased $5 .9 million to $44 .1 million in Q4 2013 compared to $38 .2 million in Q4 2012 and for the year ended December 31, 2013, electric margin increased $20 .9 million to $172 .5 million compared to $151 .6 million in 2012 primarily due to the inclusion of operating income and gains on the acquisition of a controlling interest in DOMLEC . For the year ended December 31, 2013 compared to 2012, the increase is also due to changes in GBPC’s rate structure .
Q4 Average Electric Margin/MWh 2013 2012 2011
Dollars per MWh $ 135 $ 126 $ 111
Annual Average Electric Margin/MWh 2013 2012 2011
Dollars per MWh $ 134 $ 123 $ 113
The increase in average electric margin per MWh for Q4 2013 compared to Q4 2012 is primarily due to the inclusion of operating income and gains on the acquisition of a controlling interest in DOMLEC in April 2013 . The increase in average electric margin for the year ended December 31, 2013 compared to 2012 is also due to GBPC’s rate structure changes effective July 2012 .

42 Emera Inc . — Annual Report 2013
REGULATED FUEL FOR GENERATION AND PURCHASED POWER
Q4 Production VolumesGWh 2013* 2012 2011
Oil 345 332 339
*DOMLEC contributed 15 GWh .
Annual Production VolumesGWh 2013* 2012 2011
Oil 1,371 1,343 1,317
*DOMLEC contributed 45 GWh .
Q4 Average Fuel CostsGWh 2013 2012 2011
Dollars per MWh $ 177 $ 185 $ 202
Annual Average Fuel Costs/MWhGWh 2013 2012 2011
Dollars per MWh $ 181 $ 194 $ 203
Regulated fuel for generation and purchased power decreased $0 .6 million to $60 .9 million in Q4 2013 compared to $61 .5 million in Q4 2012 primarily due to lower fuel prices, partially offset by the acquisition of controlling interest of DOMLEC . For the year ended December 31, 2013, regulated fuel for generation and purchased power decreased $16 .2 million to $248 .6 million compared to $264 .8 million in 2012 primarily due to lower fuel prices, lower temporary generation costs and improved plant performance in GBPC as the new generation unit went into service in Q3 2012, partially offset by the acquisition of controlling interest of DOMLEC .
FUEL RECOVERY MECHANISMS
BLPCAll BLPC fuel costs are passed to customers through the fuel clause adjustment fuel charge . Fair Trading Commission, Barbados has approved the calculation of the fuel charge, which is adjusted on a monthly basis .
GBPCUntil June 30, 2012, the base rate included $20 USD per barrel of oil consumed by GBPC for generation of electricity . The amount by which actual fuel costs exceeded $20 USD per barrel was recovered or rebated through the fuel charge, which was adjusted on a monthly basis . The methodology for calculating the amount of the fuel charge was approved by GBPA .
Effective July 1, 2012, all GBPC fuel costs are passed to customers through the fuel charge . The GBPA has approved the calculation of the fuel charge, which is adjusted on a monthly basis .

Management’s Discussion and Analysis
Emera Inc . — Annual Report 2013 43
OTHER INCOME (EXPENSES), NET
As a component of its regulatory agreement with the GBPA, GBPC has an Earnings Share Mechanism to allow for earnings above or below its approved 10 per cent return on rate base to be deferred to a regulatory asset or liability at the rate of 50 per cent of amounts below a 9 per cent return on rate base and 50 per cent of amounts above 11 per cent return on rate base respectively . GBPC will amortize this deferral into income beginning in 2016 .
Other income (expenses), net decreased $0 .3 million to $4 .6 million in Q4 2013 compared to $4 .9 million in Q4 2012 primarily due to recognition of a regulatory asset in GBPC in 2012, partially offset by the recognition of $4 .2 million in investment income relating to LPH’s self-insurance fund asset . Year-over-year, other income (expenses), net, increased $3 .9 million to $11 .6 million in 2013 compared to $7 .7 million in 2012 also due to recognition of a regulatory asset in GBPC of $2 .6 million related to the Earnings Share Mechanism for the period of July 1, 2012 to December 31, 2013 and a non-taxable gain of $2 .7 million as a result of the acquisition of a controlling interest in DOMLEC in April 2013 .
REGULATORY DEFERRALS
Effective July 1, 2012, the GBPA approved the recovery of $18 .3 million related to retired generation assets in future rates . The fair value of these assets was less than the carrying value at the time Emera acquired a controlling interest in GBPC . Therefore, $4 .6 million was recognized through income in Q4 2012 and recorded as a regulatory asset . GBPC is expected to amortize this deferral into income beginning in 2016 .
INCOME TAXES
The Caribbean Utility Operations are subject to corporate income tax at the following statutory rates: • LPH is subject to corporate income tax at the statutory rate of 25 per cent ; • BLPC is subject to corporate income tax at the statutory rate of 15 per cent ; • GBPC is not subject to corporate income tax; • DOMLEC is subject to corporate income tax at the statutory rate of 30 per cent ; and • LUCELEC is subject to corporate income tax at the statutory rate of 30 per cent .

44 Emera Inc . — Annual Report 2013
PIPELINES
Overview
Pipelines comprises Emera’s wholly owned Emera Brunswick Pipeline Company Limited (“Brunswick Pipeline”) and the Company’s 12 .9 per cent interest in the M&NP .
• Brunswick Pipeline is a pipeline delivering re-gasified natural gas from the Canaport™ Liquefied Natural Gas (“LNG”) import terminal near Saint John, New Brunswick, to markets in the northeastern United States for Repsol Energy Canada under a 25-year firm service agreement . The NEB, which regulates Brunswick Pipeline, has classified it as a Group II pipeline . Brunswick Pipeline is accounted for as a direct financing lease .
• M&NP is a 1,400-kilometre pipeline which transports natural gas from offshore Nova Scotia to markets in Maritime Canada and the northeastern United States . The investment in M&NP is accounted for on the equity basis .
Review of 2013
PIPELINES’ NET INCOME
Three months ended Year ended For the December 31 December 31
millions of Canadian dollars (except per share amounts) 2013 2012 2013 2012 2011
Operating revenues — regulated $ 12.4 $ 12.6 $ 49.9 $ 50.1 $ 49.8Operating maintenance and general — — 0.1 0.1 0.1Accretion (1) — — 0.2 0.2 0.1Income from equity investment 3.5 3.4 14.7 14.0 14.4Other income (expenses), net 0.1 — 0.1 0.2 0.2Interest expense, net 6.3 7.5 27.6 30.2 30.2
Income before provision for income taxes 9.7 8.5 36.8 33.8 34.0
Income tax expense (recovery) 1.6 1.5 6.5 5.9 6.1
Contribution to consolidated net income $ 8.1 $ 7.0 $ 30.3 $ 27.9 $ 27.9
Contribution to consolidated earnings per common share $ 0.06 $ 0.06 $ 0.23 $ 0.22 $ 0.23
(1) Accretion is included in “Depreciation and amortization” on the Consolidated Statements of Income .
Pipelines’ contribution to consolidated net income increased by $1 .1 million to $8 .1 million in Q4 2013 compared to $7 .0 million Q4 2012 and increased $2 .4 million to $30 .3 million for the year ended December 31, 2013 compared to $27 .9 million in 2012 primarily due to refinancing resulting in lower interest expense .
BRUNSWICK PIPELINE
The Company records the net investment in a lease under the direct finance method, which consists of the sum of the minimum lease payments and residual value net of estimated executory costs and unearned income . This accounting method has the effect of recognizing higher revenues in the early years of the contract than would have been recorded if the toll revenues were recorded as received .
INCOME TAXES
Brunswick Pipeline is subject to corporate income tax at the statutory rate of 26 .0 per cent (combined Canadian federal and provincial income tax rate) .

Management’s Discussion and Analysis
Emera Inc . — Annual Report 2013 45
SERVICES, RENEWABLES AND OTHER INVESTMENTS
Overview
Services, Renewables and Other Investments includes the following consolidated and non-consolidated investments:
CONSOLIDATED INVESTMENTS
• Emera Energy Services, a physical energy business that purchases and sells natural gas and electricity, and provides related energy asset management services to customers across northeastern North America .
• EE New England Gas Generation, three combined-cycle gas-fired electricity generation facilities in New England with 1,050 MW of generating capacity . The facilities are Bridgeport Energy (520 MW) in Bridgeport, Connecticut; Tiverton Power (265 MW) in Tiverton, Rhode Island; and Rumford Power (265 MW) in Rumford, Maine, held indirectly by Emera .
• Bayside Power, a 290 MW gas-fired merchant electricity generating facility in Saint John, New Brunswick, wholly owned by Emera Energy .
• Brooklyn Energy, a 30 MW biomass co-generation facility in Brooklyn, Nova Scotia, wholly owned by Emera Energy . Brooklyn Energy has a long-term power purchase agreement with NSPI .
• Emera Utility Services, providing utility construction services primarily in Atlantic Canada and The Bahamas . • ENL, a company focused on transmission investments related to a proposed 824 MW hydroelectric generating facility at Muskrat
Falls in Labrador . ENL’s subsidiary, NSPML is developing the Maritime Link Project, a $1 .56 billion transmission project, including two 170-kilometre subsea cables, between the island of Newfoundland and Nova Scotia . ENL’s subsidiary, ENL Island Link Inc ., is an investor in the LIL .
NON-CONSOLIDATED INVESTMENTS — ACCOUNTED FOR ON THE EQUITY BASIS
• Emera’s 49 .0 per cent investment in NWP, a 420 MW portfolio of wind energy projects in the northeastern United States . • Emera’s 24 .3 per cent investment in APUC, a growth oriented public corporation, traded on the Toronto Stock Exchange (“TSX”)
under the symbol “AQN”, in the independent power and rate regulated utilities business sectors . APUC has a diversified portfolio of renewable power and utility businesses primarily through two operating subsidiaries . One subsidiary owns and operates a diversified portfolio of non-regulated renewable and thermal electric generation utility assets . A second subsidiary owns and operates a diversified rate regulated portfolio of North American electric, natural gas and water distribution utility systems .
• Emera’s 50 .0 per cent joint venture ownership of Bear Swamp, a 600 MW pumped storage hydroelectric facility in northern Massachusetts .
• Emera’s 34 .9 per cent investment in LIL, held by ENL, a $2 .6 billion electricity transmission project in Newfoundland and Labrador to enable the transmission of the Muskrat Falls energy between Labrador and the island of Newfoundland .
• Emera’s 37 .4 per cent investment in Atlantic Hydrogen Inc . (“AHI”) . • Emera’s 3 .3 per cent investment in OpenHydro is accounted for on the cost basis .

46 Emera Inc . — Annual Report 2013
Review of 2013
SERVICES, RENEWABLES AND OTHER INVESTMENTS NET INCOME
Three months ended Year ended For the December 31 December 31
millions of Canadian dollars (except per share amounts) 2013 2012 2013 2012 2011
Trading and marketing margin (1) $ (42.7)$ (9.5)$ (9.6)$ 17.8 $ 22.9Electricity sales (2) 92.7 14.8 145.9 61.0 82.3Utility services 13.7 17.9 52.3 66.5 67.4
Total operating revenues — non-regulated 63.7 23.2 188.6 145.3 172.6
Non-regulated fuel for generation and purchased power (3) 59.0 11.1 89.8 44.5 73.9Non-regulated direct costs 13.3 15.7 52.4 57.6 59.9Operating, maintenance and general 24.4 9.3 52.8 32.9 31.5Depreciation and amortization 9.2 1.3 14.5 3.6 3.4
Total operating expenses 105.9 37.4 209.5 138.6 168.7
Income (loss) from operations (42.2) (14.2) (20.9) 6.7 3.9
Income from equity investments (4) 6.2 (7.6) 21.6 (2.7) 17.1Other income (expenses), net (4.4) 14.9 19.2 32.2 14.6Interest expense, net 1.2 — 2.2 0.8 0.9
Income (loss) before provision for income taxes (41.6) (6.9) 17.7 35.4 34.7Income tax expense (recovery) (11.1) (4.5) 1.0 1.7 8.3
Contribution to consolidated net income (loss) $ (30.5)$ (2.4)$ 16.7 $ 33.7 $ 26.4
After-tax derivative mark-to-market gain (loss) $ (42.0)$ (15.9)$ (41.9)$ (9.7)$ (3.0)
Adjusted contribution to consolidated net income $ 11.5 $ 13.5 $ 58.6 $ 43.4 $ 29.4
Contribution to consolidated earnings per common share — basic $ (0.23)$ (0.02)$ 0.13 $ 0.27 $ 0.22
Adjusted contribution to consolidated earnings per common share — basic $ 0.09 $ 0.11 $ 0.44 $ 0.35 $ 0.24
(1) Trading and marketing margin includes a pre-tax mark-to-market loss of $64 .7 million in Q4 2013 (2012 — $20 .0 million loss) and a loss of $69 .9 million for the year ended December 31,2013 (2012 — $9 .8 million loss) .
(2) Electricity sales include a pre-tax mark-to-market loss of $0 .3 million in Q4 2013 and the year ended December 31, 2013 (2012 — nil) .(3) Non-regulated fuel for generation and purchased power includes a pre-tax mark-to-market gain of $3 .7 million in Q4 2013 (2012 — nil) and a gain of $8 .2 million for the year ended December 31,
2013 (2012 — nil) .(4) Income from equity investments includes a pre-tax mark-to-market gain of $0 .4 million in Q4 2013 (2012 — $3 .5 million loss) and a gain of $1 .0 million for the year ended December 31,2013
(2012 — $4 .9 million loss) .
Services, Renewables and Other Investments contribution to consolidated net income decreased by $28 .1 million to net income of $(30 .5) million in Q4 2013 compared to net income of $(2 .4) million in Q4 2012 . For the year ended December 31, 2013, Services, Renewables and Other Investments contribution to consolidated net income decreased $17 .0 million to $16 .7 million compared to $33 .7 million in 2012 . Highlights of the income changes are summarized in the following table:

Management’s Discussion and Analysis
Emera Inc . — Annual Report 2013 47
Three months ended Year ended For the December 31 December 31
millions of Canadian dollars
Contribution to consolidated net income — 2011 $ 26.4Increased trading and marketing margin due to stronger energy marketing results (1) 1 .5 Decreased electricity sales primarily due to a planned maintenance outage and lower priced contracted energy sales at Bayside Power reflecting lower natural gas prices (1) (21 .3)Decreased Utility Services due to lower construction activity (0 .9)Decreased non-regulated fuel for generation and purchased power primarily due to a planned maintenance outage at Bayside Power and lower natural gas prices (1) 29 .4 Decreased non-regulated direct costs primarily due to changes in construction activity in Utility Services 2 .3 Income from equity investments — see table below for highlights (1) (16 .2)Increased other income, net, due to APUC subscription receipt gains and a gain on the sale of the CPUV investment 17 .6 Decreased income taxes primarily due to foreign exchange losses, a higher foreign tax rate on NWP losses and the deferred tax impact of dividends recorded against the investment in APUC (1) 3 .1 Increased mark-to-market losses, net of tax primarily due to refinements in the valuation methodology for certain multi-year natural gas purchase contracts (6 .7)Other (1 .5)
Contribution to consolidated net income — 2012 $ (2.4) $ 33.7Increased trading and marketing margin primarily due to strong New England market conditions (1) 11 .5 32 .7 Increased electricity sales quarter-over-quarter due to the acquisition of EE New England Gas Generation, a planned maintenance outage at Bayside Power in 2012, higher priced contracted energy sales, and improved plant performance; year-over-year these items were partially offset by 2013 maintenance outages and gas supply curtailments at Bayside Power, which reduced production (1) 78 .2 85 .2 Decreased Utility Services due to lower construction activity (4 .2) (14 .2)Increased non-regulated fuel for generation and purchased power quarter-over-quarter primarily due to acquisition of EE New England Gas Generation; year-over-year also partially offset by 2013 maintenance outages and gas supply curtailments at Bayside Power (1) (51 .6) (53 .5)Decreased non-regulated direct costs primarily due to lower construction activity in Utility Services 2 .4 5 .2 Increased OM&G primarily due to the acquisition of EE New England Gas Generation, increased activity at Emera Energy and business development activities (15 .1) (19 .9)Increased depreciation and amortization quarter-over-quarter due to the acquisition of EE New England Gas Generation and a real estate investment; increased year-over-year also due to capital investments at Bayside Power in 2012 (7 .9) (10 .9)Income from equity investments — see table below for highlights (1) 9 .9 18 .4 Decreased other income primarily due to timing of pre-tax gains on APUC subscription receipts and the 2012 gain on the sale of the CPUV investment (19 .3) (13 .0)Increased income tax expense primarily due to increased income before provision for income taxes, difference in foreign tax rates, and timing of gains on APUC subscriptions (1) (4 .7) (13 .4)Increased mark-to-market losses, net of tax primarily due to changes in Emera Energy gas and power contract positions (26 .1) (32 .2)Other (1 .2) (1 .4)
Contribution to consolidated net income — 2013 $ (30.5) $ 16.7
(1) Presented net of mark-to-market .
A portion of earnings are exposed to foreign exchange fluctuations, thereby impacting CAD contribution to net earnings .

48 Emera Inc . — Annual Report 2013
The impact of a stronger USD, quarter-over-quarter, decreased CAD earnings by $1 .1 million in Q4 2013 compared to 2012 . The impact of a stronger USD increased CAD earnings by $0 .4 million for the year ended December 31, 2013 compared to 2012 .
The impact of a stronger USD, quarter-over-quarter increased adjusted CAD earnings by $3 .1 million in Q4 2013 compared to 2012 . The impact of a stronger USD year-over-year increased adjusted CAD earnings by $2 .7 million for the year ended December 31, 2013 compared to 2012 .
Trading and Marketing MarginTrading and marketing margin is composed of Emera Energy’s corresponding purchases and sales of natural gas and electricity sales, related energy asset management services and the mark-to-market of related derivative instruments .
Trading and marketing margin on purchases and sales of natural gas and related energy asset management services was $22 .0 million in Q4 2013 (2012 — $10 .5 million) and $60 .3 million for the year ended December 31, 2013 (2012 — $27 .6 million) . The increase reflects growth in the volume of business and increased volatility in the northeast gas markets during the year, providing increased margin opportunity for Emera Energy .
Trading and marketing recorded a mark-to-market loss of $64 .7 million in Q4 2013 (2012 — $20 .0 million loss) and $69 .9 million loss for the year ended December 31, 2013 (2012 — $9 .8 million loss) . The increase in the mark-to-market loss year-over-year is primarily due to growth in the absolute volume of business and increased volatility in the northeast gas markets in Q4 2013 .
Non-Regulated Electric MarginNon-regulated electric margin shows the amount Bayside Power, EE New England Gas Generation and Brooklyn Energy have earned to contribute to the recovery of their non-fuel costs . Bayside Power is contracted under a long-term purchase power agreement to sell its entire generation during the months of November through March to a regulated power utility and operates as a merchant facility for the balance of the year . The EE New England Gas Generation facilities are also merchant facilities and sell their output in the New England power pool . Brooklyn Energy operates under a long-term power purchase agreement with NSPI .
Non-regulated electric margin is summarized in the following table:
Three months ended Year ended For the December 31 December 31
millions of Canadian dollars 2013 2012 2013 2012 2011
Electricity sales $ 92.7 $ 14.8 $ 145.9 $ 61.0 $ 82.3Non-regulated fuel for generation and purchased power (59.2) (10.0) (89.7) (37.4) (65.4)
Non-regulated electric margin $ 33.5 $ 4.8 $ 56.2 $ 23.6 $ 16.9
Non-regulated electric margin increased $28 .7 million to $33 .5 million in Q4 2013 from $4 .8 million in Q4 2012 and $32 .6 million to $56 .2 million for the year ended December 31, 2013 from $23 .6 million for the year ended December 31, 2012 primarily due to the acquisition of EE New England Gas Generation .
Mark-to-Market Gains and LossesMark-to-market gains and losses are related to Emera’s HFT derivative instruments, included in “Trading and marketing margin” and “Electricity sales” . Mark-to-market adjustments are also included in income from equity investments and non-regulated fuel for generation and purchased power related to business activities of Bear Swamp and NWP .
After-tax mark-to-market losses increased $26 .1 million to $42 .0 million in Q4 2013 compared to $15 .9 million in Q4 2012; and increased $32 .2 million to $41 .9 million for the year ended December 31, 2013 compared to $9 .7 million in 2012 . Increased mark-to-market losses largely resulted from increased volatility in the New England market, where the increased price differential between contracted markets is recognized under USGAAP but the offsetting change in value of the use of related transportation is not, and increased volume of business .
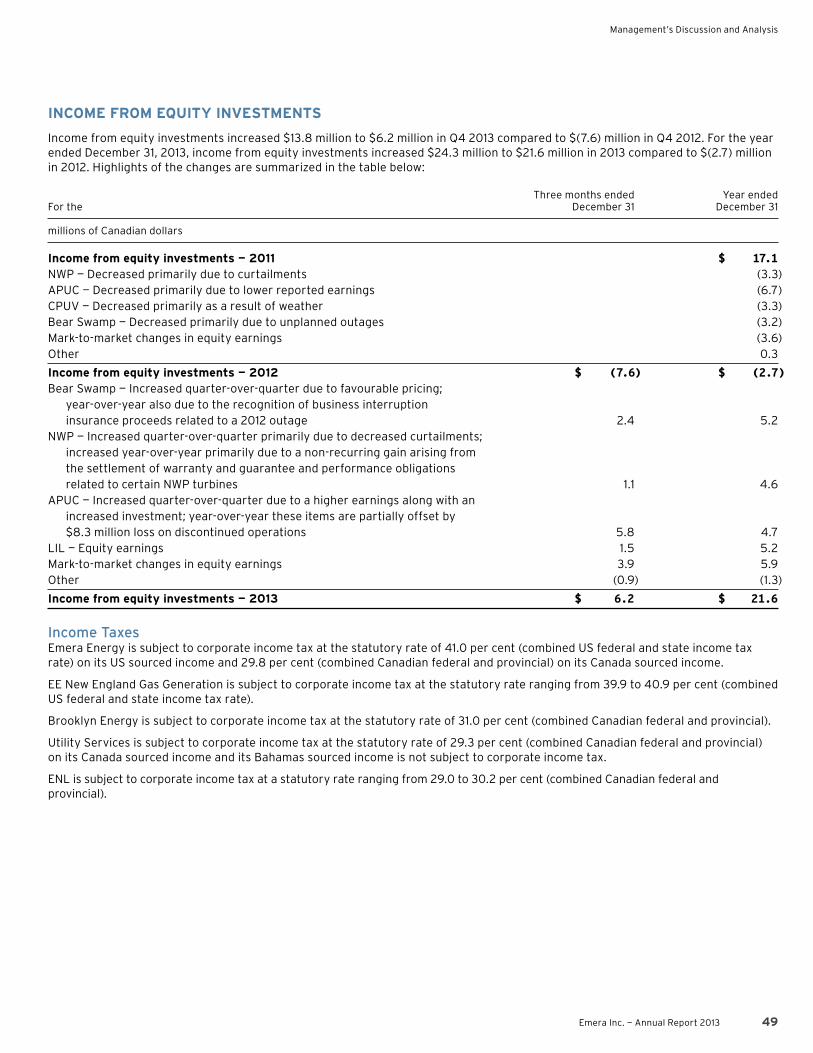
Management’s Discussion and Analysis
Emera Inc . — Annual Report 2013 49
INCOME FROM EQUITY INVESTMENTS
Income from equity investments increased $13 .8 million to $6 .2 million in Q4 2013 compared to $(7 .6) million in Q4 2012 . For the year ended December 31, 2013, income from equity investments increased $24 .3 million to $21 .6 million in 2013 compared to $(2 .7) million in 2012 . Highlights of the changes are summarized in the table below:
Three months ended Year ended For the December 31 December 31
millions of Canadian dollars
Income from equity investments — 2011 $ 17.1NWP — Decreased primarily due to curtailments (3 .3)APUC — Decreased primarily due to lower reported earnings (6 .7)CPUV — Decreased primarily as a result of weather (3 .3)Bear Swamp — Decreased primarily due to unplanned outages (3 .2)Mark-to-market changes in equity earnings (3 .6)Other 0 .3
Income from equity investments — 2012 $ (7.6) $ (2.7)Bear Swamp — Increased quarter-over-quarter due to favourable pricing; year-over-year also due to the recognition of business interruption insurance proceeds related to a 2012 outage 2 .4 5 .2 NWP — Increased quarter-over-quarter primarily due to decreased curtailments; increased year-over-year primarily due to a non-recurring gain arising from the settlement of warranty and guarantee and performance obligations related to certain NWP turbines 1 .1 4 .6 APUC — Increased quarter-over-quarter due to a higher earnings along with an increased investment; year-over-year these items are partially offset by $8 .3 million loss on discontinued operations 5 .8 4 .7 LIL — Equity earnings 1 .5 5 .2 Mark-to-market changes in equity earnings 3 .9 5 .9 Other (0 .9) (1 .3)
Income from equity investments — 2013 $ 6.2 $ 21.6
Income TaxesEmera Energy is subject to corporate income tax at the statutory rate of 41 .0 per cent (combined US federal and state income tax rate) on its US sourced income and 29 .8 per cent (combined Canadian federal and provincial) on its Canada sourced income .
EE New England Gas Generation is subject to corporate income tax at the statutory rate ranging from 39 .9 to 40 .9 per cent (combined US federal and state income tax rate) .
Brooklyn Energy is subject to corporate income tax at the statutory rate of 31 .0 per cent (combined Canadian federal and provincial) .
Utility Services is subject to corporate income tax at the statutory rate of 29 .3 per cent (combined Canadian federal and provincial) on its Canada sourced income and its Bahamas sourced income is not subject to corporate income tax .
ENL is subject to corporate income tax at a statutory rate ranging from 29 .0 to 30 .2 per cent (combined Canadian federal and provincial) .

50 Emera Inc . — Annual Report 2013
CORPORATE
Overview
Corporate includes interest revenue on intercompany financings and costs associated with corporate activities that are not directly allocated to the operations of Emera’s consolidated subsidiaries and investments . Corporate includes certain corporate-wide functions including executive management, strategic planning, treasury services, financial reporting, tax planning, corporate business development and corporate governance, internal audit, investor relations, risk management, insurance and certain human resource activities .
Review of 2013
CORPORATE
Three months ended Year ended For the December 31 December 31
millions of Canadian dollars 2013 2012 2013 2012 2011
Revenue (1) $ 8.1 $ 10.0 $ 39.3 $ 36.7 $ 30.2Corporate costs 10.3 6.5 33.1 26.1 26.7Interest expense 9.0 9.3 37.4 37.3 33.9Income tax expense (recovery) (9.7) (1.6) (24.2) (12.4) (16.5)Preferred stock dividends 5.6 — 19.3 11.1 6.6
Contribution to consolidated net income $ (7.1)$ (4.2)$ (26.3)$ (25.4)$ (20.5)
(1) Revenue consists of interest from Brunswick Pipeline, NWP and a real estate investment; and preferred dividends from Brunswick Pipeline .
CORPORATE COSTS
Corporate costs increased by $3 .8 million to $10 .3 million in Q4 2013 compared to $6 .5 million in Q4 2012 and increased $7 .0 million to $33 .1 million for year ended December 31, 2013 compared to $26 .1 million in 2012 primarily due to increased business development costs and foreign exchange losses, partially offset by deferred compensation costs .
INCOME TAX RECOVERY
Income tax recovery increased by $8 .1 million to $9 .7 million in Q4 2013 compared to $1 .6 million in Q4 2012 primarily due to changes in deferred tax as a result of the acquisition of EE New England Gas Generation and decreased income before provision for income taxes and increased $11 .8 million to $24 .2 million for the year ended December 31, 2013 compared to $12 .4 million in 2012 primarily due to changes in deferred tax as a result of the EE New England Gas Generation acquisition, a change in unrecognized tax benefits due to enactment of tax legislation related to preferred stock dividends and decreased income before provision for income taxes .
PREFERRED STOCK DIVIDENDS
Preferred stock dividends increased $5 .6 million to $5 .6 million in Q4 2013 compared to nil in Q4 2012 due to timing of declaration of dividends and increased $8 .2 million to $19 .3 million for the year ended December 31, 2013 compared to $11 .1 million in 2012 due to a preferred share issuance in June 2012 .

Management’s Discussion and Analysis
Emera Inc . — Annual Report 2013 51
LIQUIDITY AND CAPITAL RESOURCES
The Company generates cash primarily through its regulated utilities and equity investments . The utilities’ customer bases are diversified by both sales volumes and revenues among customer classes . Emera’s non-regulated businesses provide diverse revenue streams and counterparties to the business . Circumstances that could affect the Company’s ability to generate cash include general economic downturns in Emera’s markets, the loss of one or more large customers, regulatory decisions affecting customer rates and the recovery of regulatory assets and changes in environmental legislation . Emera’s subsidiaries are generally capable of paying dividends to Emera provided they do not breach their debt covenants, where applicable, after giving effect to the dividend payment .
Consolidated Cash Flow HighlightsSignificant changes in the statements of cash flows between the years ended December 31, 2013 and 2012 include:
Year ended December 31 2013 2012 $ Change
millions of Canadian dollars 2013 versus 2012
Cash and cash equivalents, beginning of period $ 86.7 $ 76.9 $ 9.8Provided by (used in):Operating cash flow before changes in working capital 577.8 411.2 166.6Change in investment in working capital (13.6) (13.6) —Operating activities 564.2 397.6 166.6Investing activities (921.6) (919.4) (2.2)Financing activities 362.1 534.2 (172.1)Effect of exchange rate changes on cash and cash equivalents 9.4 (2.6) 12.0
Cash and cash equivalents, end of period $ 100.8 $ 86.7 $ 14.1
OPERATING CASH FLOWS
Net cash provided by operating activities increased $166 .6 million to $564 .2 million for the year ended December 31, 2013 compared to $397 .6 million for the year ended December 31, 2012 . The increase was primarily due to higher cash earnings primarily from a $90 .0 million voluntary pension contribution in 2012 by NSPI and increased trading and marketing activity of $105 .4 million . Cash earnings were reduced by increased NSPI fuel costs in 2013 of $53 .9 million .
INVESTING CASH FLOWS
Net cash used in investing activities increased $2 .2 million to $921 .6 million for the year ended December 31, 2013 compared to $919 .4 million for the year ended December 31, 2012 . The increase was primarily due to an increase in acquisitions of $613 .6 million relating to EE New England Gas Generation, DOMLEC and Brooklyn Energy . The increase was offset by a provision of cash of $310 .3 million relating to the receipt of the $150 million USD NWP loan receivable, decreased additions to property, plant and equipment of $116 .4 million, lower subscription receipts purchases of $105 .0 million and reduced additions to significant influence investments of $59 .6 million .
Capital expenditures, including AFUDC, for the year ended December 31, 2013 were approximately $354 million (2012 — $491 million) and included: • $208 million in NSPI (2012 — $284 million); • $84 million in Maine Utility Operations (2012 — $68 million); • $24 million in Caribbean Utility Operations (2012 — $60 million); and • $38 million in Services, Renewables and Other Investments (2012 — $79 million) .
Acquisitions completed for the year ended December 31, 2013 were: • EE New England Gas Generation, for total consideration of $575 .1 million ($549 .5 million USD) on November 19, 2013 and a
100 per cent interest • Brooklyn Energy, for total consideration of $26 .8 million on July 22, 2013 and a 100 per cent interest • DOMLEC, for total consideration of $10 .7 million ($10 .5 million USD) on April 10, 2013 and a 41 .7 per cent indirect interest
Equity investments completed for the year ended December 31, 2013 were: • Blue Sky East, LLC (“Bull Hill”), a 34 .5 MW wind farm located south of Bangor, Maine for $14 .4 million USD, through its joint venture
with First Wind in NWP on February 11, 2013 . The project is under a 15-year long-term contract for its energy, capacity and renewable energy credits .
• Labrador-Island Link Partnership (“LIL”), a $2 .6 billion electricity transmission project in Newfoundland and Labrador, which will enable the transmission of the Muskrat Falls energy between Labrador and the island of Newfoundland, for $67 .7 million on February 11, 2013 .
• APUC additional investment of $29 .3 million upon the conversion of APUC subscription receipts into APUC common shares .

52 Emera Inc . — Annual Report 2013
FINANCING CASH FLOWS
Net cash provided by financing activities decreased $172 .1 million to $362 .1 million for the year ended December 31, 2013 compared to $534 .2 million in December 31, 2012 . The decrease was primarily due to reduced preferred share and common share issuances and higher dividend payments in 2013, partially offset by debt issuances by Emera Energy and BLPC to fund acquisitions .
Working Capital
As at December 31, 2013, Emera’s cash and cash equivalents were $100 .8 million (2012 — $86 .7 million) and Emera’s investment in non-cash working capital was $454 .7 million (2012 — $358 .6 million) . Of the $100 .8 million of cash and cash equivalents held at December 31, 2013, $94 .3 million is held by Emera’s foreign subsidiaries (2012 — $24 .2 million) . Emera is unaware of any significant restrictions on the repatriation of these funds, although a portion is considered permanently invested in these foreign subsidiaries .
Emera’s future liquidity and capital needs will be predominately for working capital requirements and capital expenditures in support of growth throughout the businesses, as well as acquisitions, dividends and debt servicing . These liquidity and capital needs will be financed through internally generated cash flows, short-term credit facilities, and ongoing access to capital markets .
Contractual Obligations
As at December 31, 2013, commitments for each of the next five years and in aggregate thereafter consisted of the following:
millions of Canadian dollars 2014 2015 2016 2017 2018 Thereafter Total
Long-term debt $ 328.4 $ 89.1 $ 15.2 $ 569.0 $ 336.4$ 2,353.3 $3,691.4Purchased power (1) 126.7 153.8 168.3 169.2 141.8 1,760.5 2,520.3Coal, biomass, oil and natural gas supply 249.6 146.3 72.2 13.6 10.2 — 491.9Pension and post-retirement obligations (2) 49.1 12.1 11.5 10.8 10.3 561.8 655.6Asset retirement obligations 1.1 1.0 3.8 2.2 1.0 335.0 344.1Interest payment obligations (3) 177.9 165.9 159.1 148.9 143.6 2,195.8 2,991.2Transportation (4) 118.4 48.2 15.6 10.5 6.0 7.8 206.5Long-term service agreements (5) 25.7 20.6 25.8 17.7 14.8 69.0 173.6Capital projects 119.9 17.5 11.2 1.6 — — 150.2Leases (6) 4.0 3.8 3.0 2.8 2.7 13.4 29.7Other 3.8 3.5 1.3 1.3 1.3 38.3 49.5
$1,204.6 $ 661.8 $ 487.0 $ 947.6 $ 668.1$ 7,334.9 $11,304.0
( 1 ) Purchased power: annual requirement to purchase 20 — 100 per cent of electricity production from independent power producers over varying contract lengths up to 25 years .(2) Pension and post-retirement obligations: Defined benefit funding contractual obligations were determined based on funding requirements and assuming pension accruals cease as at December
31, 2013 . Credited service and earnings are assumed to be crystallized as at December 31, 2013 . The Company contractual obligations for post-retirement (non-pension) benefits assumes members must be age 55 or over as at December 31, 2013 to be eligible . As the defined benefit pension plans currently undergo regular reviews to revise contribution requirements and members are still accruing service under the plans, actual future contributions to the plans will differ from the amounts shown .
(3) Interest payment obligations are calculated based on the assumption that all debt is outstanding until maturity . For debt instruments with variable rates, interest is calculated for all future periods using the rates in effect as at December 31, 2013 .
(4) Transportation: purchasing commitments for transportation of solid fuel and transportation capacity on various pipelines .(5) Long-term service agreements: outsourced management of computer and communication infrastructure, vegetation management, maintenance of certain generating equipment, and services
related to a generation facility and wind operating agreements .(6) Leases: operating lease agreements for office space, land, plant fixtures and equipment, telecommunications services, rail cars and vehicles .
Forecasted Gross Consolidated Capital Expenditures
For the year ended December 31, 2014, forecasted gross consolidated capital expenditures are as follows:
Services, Caribbean renewables Maine Utility Utility and other millions of Canadian dollars NSPI operations operations investments Corporate Total
Generation $ 144.7 $ — $ 21.7 $ 40.6$ — $ 207.0Transmission 51.8 53.7 0.3 300.0 — 405.8Distribution 59.0 17.1 17.9 — — 94.0Facilities, equipment, vehicles and other 27.5 24.8 10.0 22.5 7.7 92.5
$ 283.0 $ 95.6 $ 49.9 $ 363.1$ 7.7 $ 799.3

Management’s Discussion and Analysis
Emera Inc . — Annual Report 2013 53
Significant Individual Capital Projects
As at December 31, 2013, the individually significant forecasted spending in active capital projects are as follows:
Expected Nature of Pre-2013 2013 Post-2013 year of millions of Canadian dollars project spending forecast (1) forecast (1) completion (1)
NSPISable Wind Farm Project Generation $ 1.1 $ 11.1 $ — 2014 South Canoe Wind Farm Project Generation 6.8 73.8 12.1 2015 LED Streetlight Replacement Distribution 12.3 2.7 22.9 2018
Services, renewables and other investmentsBridgeport Energy Upgrade Generation — 32.1 — 2014 Maritime Link Transmission 59.1 300.0 1,134.0 2017
(1) The spending and timing of spending in this table are based on estimates and are subject to change .
Debt Management
In addition to funds generated from operations, Emera and its subsidiaries have, in aggregate, access to $1 .3 billion committed syndicated revolving bank lines of credit as discussed in the table below . NSPI has an active commercial paper program for up to $400 million, of which the full amount outstanding is backed by the Company’s bank line referred to below, which results in an equal amount of credit being considered drawn and unavailable .
As at December 31, 2013, the Company’s total credit facilities, outstanding borrowings and available capacity were as follows:
Revolving Undrawn credit and millions of dollars Maturity facilities Utilized available
Emera — Operating and acquisition credit facility June 2018 — Revolver $ 700 $ 339 $ 361NSPI — Operating credit facility (1) June 2017 — Revolver 500 283 217Bangor Hydro — in USD — Operating credit facility September 2014 — Revolver 80 31 49Other — in USD — Operating credit facilities 2014 31 6 25
(1) Extended to June 2018 on January 10, 2014 .
Emera and its subsidiaries have debt covenants associated with their credit facilities . Covenants are tested regularly and the Company is in compliance with covenant requirements . Emera’s significant covenants are listed below:
As at Financial covenant Requirement December 31, 2013
EmeraSyndicated credit facilities Debt to capital ratio Less than or equal to 0 .70 to 1 0.57:1NSPISyndicated credit facility Debt to capital ratio Less than or equal to 0 .65 to 1 0.61:1
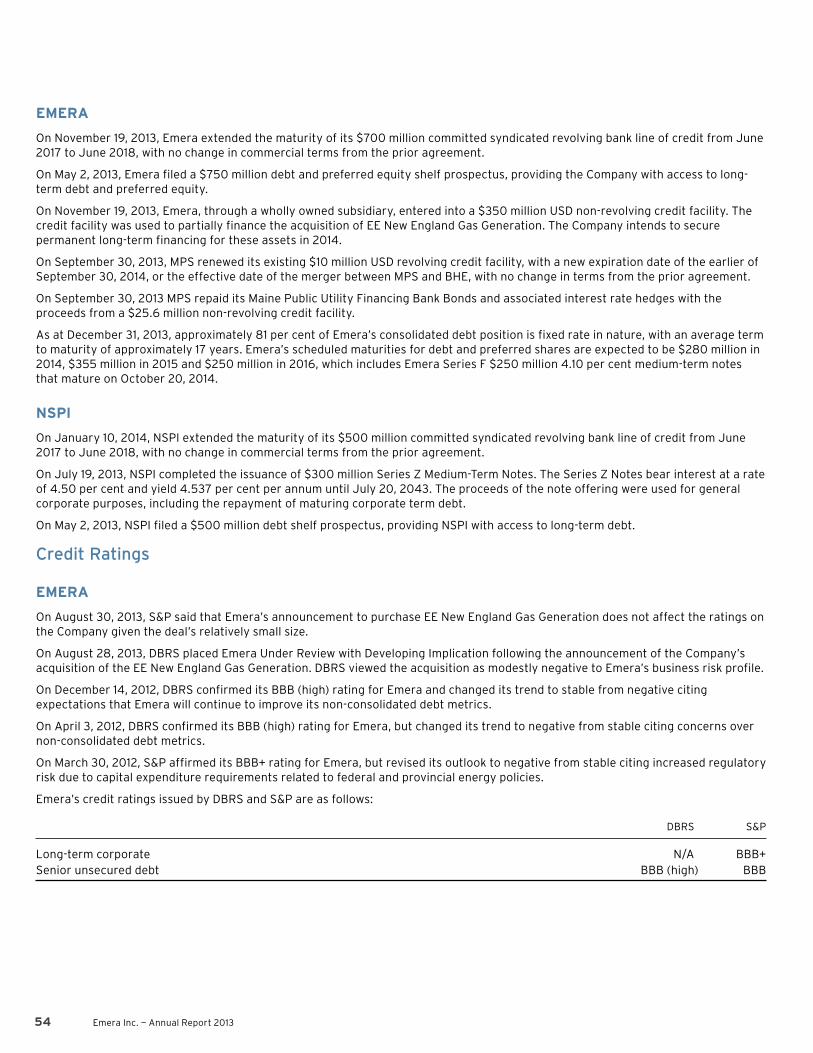
54 Emera Inc . — Annual Report 2013
EMERA
On November 19, 2013, Emera extended the maturity of its $700 million committed syndicated revolving bank line of credit from June 2017 to June 2018, with no change in commercial terms from the prior agreement .
On May 2, 2013, Emera filed a $750 million debt and preferred equity shelf prospectus, providing the Company with access to long-term debt and preferred equity .
On November 19, 2013, Emera, through a wholly owned subsidiary, entered into a $350 million USD non-revolving credit facility . The credit facility was used to partially finance the acquisition of EE New England Gas Generation . The Company intends to secure permanent long-term financing for these assets in 2014 .
On September 30, 2013, MPS renewed its existing $10 million USD revolving credit facility, with a new expiration date of the earlier of September 30, 2014, or the effective date of the merger between MPS and BHE, with no change in terms from the prior agreement .
On September 30, 2013 MPS repaid its Maine Public Utility Financing Bank Bonds and associated interest rate hedges with the proceeds from a $25 .6 million non-revolving credit facility .
As at December 31, 2013, approximately 81 per cent of Emera’s consolidated debt position is fixed rate in nature, with an average term to maturity of approximately 17 years . Emera’s scheduled maturities for debt and preferred shares are expected to be $280 million in 2014, $355 million in 2015 and $250 million in 2016, which includes Emera Series F $250 million 4 .10 per cent medium-term notes that mature on October 20, 2014 .
NSPI
On January 10, 2014, NSPI extended the maturity of its $500 million committed syndicated revolving bank line of credit from June 2017 to June 2018, with no change in commercial terms from the prior agreement .
On July 19, 2013, NSPI completed the issuance of $300 million Series Z Medium-Term Notes . The Series Z Notes bear interest at a rate of 4 .50 per cent and yield 4 .537 per cent per annum until July 20, 2043 . The proceeds of the note offering were used for general corporate purposes, including the repayment of maturing corporate term debt .
On May 2, 2013, NSPI filed a $500 million debt shelf prospectus, providing NSPI with access to long-term debt .
Credit Ratings
EMERA
On August 30, 2013, S&P said that Emera’s announcement to purchase EE New England Gas Generation does not affect the ratings on the Company given the deal’s relatively small size .
On August 28, 2013, DBRS placed Emera Under Review with Developing Implication following the announcement of the Company’s acquisition of the EE New England Gas Generation . DBRS viewed the acquisition as modestly negative to Emera’s business risk profile .
On December 14, 2012, DBRS confirmed its BBB (high) rating for Emera and changed its trend to stable from negative citing expectations that Emera will continue to improve its non-consolidated debt metrics .
On April 3, 2012, DBRS confirmed its BBB (high) rating for Emera, but changed its trend to negative from stable citing concerns over non-consolidated debt metrics .
On March 30, 2012, S&P affirmed its BBB+ rating for Emera, but revised its outlook to negative from stable citing increased regulatory risk due to capital expenditure requirements related to federal and provincial energy policies .
Emera’s credit ratings issued by DBRS and S&P are as follows:
DBRS S&P
Long-term corporate N/A BBB+Senior unsecured debt BBB (high) BBB
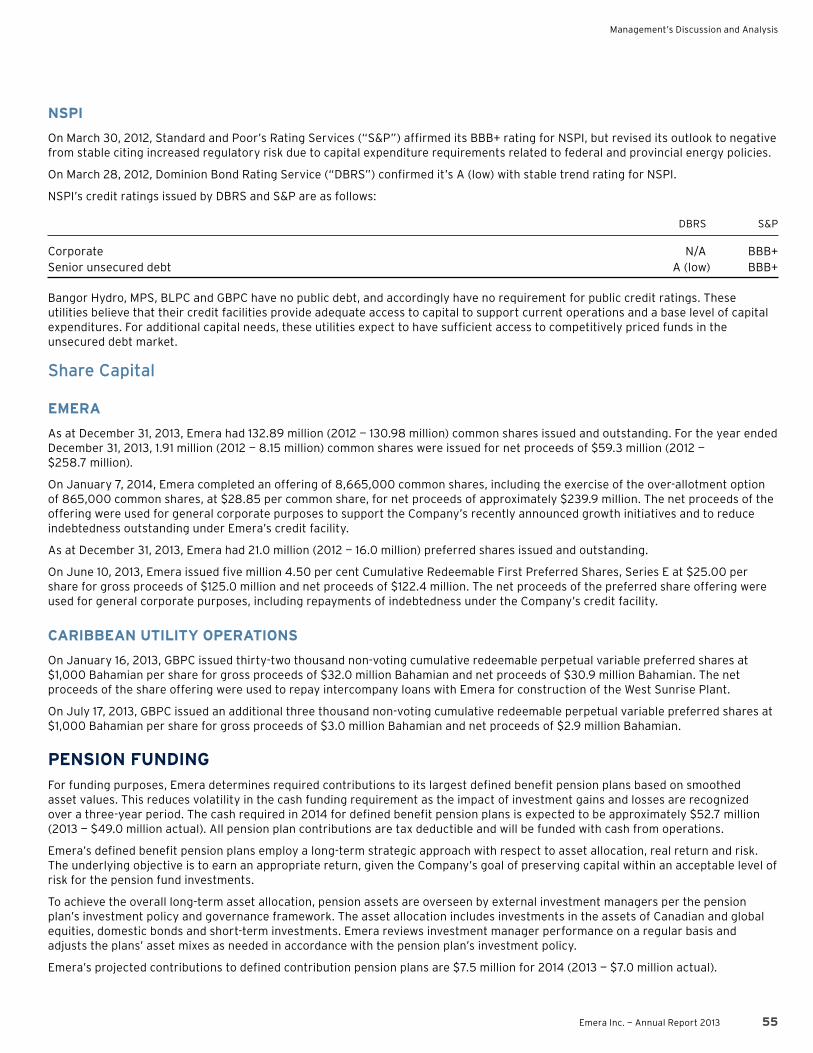
Management’s Discussion and Analysis
Emera Inc . — Annual Report 2013 55
NSPI
On March 30, 2012, Standard and Poor’s Rating Services (“S&P”) affirmed its BBB+ rating for NSPI, but revised its outlook to negative from stable citing increased regulatory risk due to capital expenditure requirements related to federal and provincial energy policies .
On March 28, 2012, Dominion Bond Rating Service (“DBRS”) confirmed it’s A (low) with stable trend rating for NSPI .
NSPI’s credit ratings issued by DBRS and S&P are as follows:
DBRS S&P
Corporate N/A BBB+Senior unsecured debt A (low) BBB+
Bangor Hydro, MPS, BLPC and GBPC have no public debt, and accordingly have no requirement for public credit ratings . These utilities believe that their credit facilities provide adequate access to capital to support current operations and a base level of capital expenditures . For additional capital needs, these utilities expect to have sufficient access to competitively priced funds in the unsecured debt market .
Share Capital
EMERA
As at December 31, 2013, Emera had 132 .89 million (2012 — 130 .98 million) common shares issued and outstanding . For the year ended December 31, 2013, 1 .91 million (2012 — 8 .15 million) common shares were issued for net proceeds of $59 .3 million (2012 — $258 .7 million) .
On January 7, 2014, Emera completed an offering of 8,665,000 common shares, including the exercise of the over-allotment option of 865,000 common shares, at $28 .85 per common share, for net proceeds of approximately $239 .9 million . The net proceeds of the offering were used for general corporate purposes to support the Company’s recently announced growth initiatives and to reduce indebtedness outstanding under Emera’s credit facility .
As at December 31, 2013, Emera had 21 .0 million (2012 — 16 .0 million) preferred shares issued and outstanding .
On June 10, 2013, Emera issued five million 4 .50 per cent Cumulative Redeemable First Preferred Shares, Series E at $25 .00 per share for gross proceeds of $125 .0 million and net proceeds of $122 .4 million . The net proceeds of the preferred share offering were used for general corporate purposes, including repayments of indebtedness under the Company’s credit facility .
CARIBBEAN UTILITY OPERATIONS
On January 16, 2013, GBPC issued thirty-two thousand non-voting cumulative redeemable perpetual variable preferred shares at $1,000 Bahamian per share for gross proceeds of $32 .0 million Bahamian and net proceeds of $30 .9 million Bahamian . The net proceeds of the share offering were used to repay intercompany loans with Emera for construction of the West Sunrise Plant .
On July 17, 2013, GBPC issued an additional three thousand non-voting cumulative redeemable perpetual variable preferred shares at $1,000 Bahamian per share for gross proceeds of $3 .0 million Bahamian and net proceeds of $2 .9 million Bahamian .
PENSION FUNDING
For funding purposes, Emera determines required contributions to its largest defined benefit pension plans based on smoothed asset values . This reduces volatility in the cash funding requirement as the impact of investment gains and losses are recognized over a three-year period . The cash required in 2014 for defined benefit pension plans is expected to be approximately $52 .7 million (2013 — $49 .0 million actual) . All pension plan contributions are tax deductible and will be funded with cash from operations .
Emera’s defined benefit pension plans employ a long-term strategic approach with respect to asset allocation, real return and risk . The underlying objective is to earn an appropriate return, given the Company’s goal of preserving capital within an acceptable level of risk for the pension fund investments .
To achieve the overall long-term asset allocation, pension assets are overseen by external investment managers per the pension plan’s investment policy and governance framework . The asset allocation includes investments in the assets of Canadian and global equities, domestic bonds and short-term investments . Emera reviews investment manager performance on a regular basis and adjusts the plans’ asset mixes as needed in accordance with the pension plan’s investment policy .
Emera’s projected contributions to defined contribution pension plans are $7 .5 million for 2014 (2013 — $7 .0 million actual) .

56 Emera Inc . — Annual Report 2013
OFF-BALANCE SHEET ARRANGEMENTS
DEFEASANCE
Upon privatization of the former provincially owned NSPC in 1992, NSPI became responsible for managing a portfolio of defeasance securities that provide principal and interest streams to match the related defeased debt, which at December 31, 2013 totalled $0 .9 billion (2012 — $0 .8 billion) . The securities are held in trust for Nova Scotia Power Finance Corporation (“NSPFC”), an affiliate of the Province of Nova Scotia . Approximately 68 per cent of the defeasance portfolio consists of investments in the related debt, eliminating all risk associated with this portion of the portfolio; the remaining defeasance portfolio has a market value higher than the related debt, reducing the future risk of this portion of the portfolio .
Under the privatization agreements, NSPI administers the defeasance cash flows and obligations pursuant to a Management and Administration Agreement . All of the NSPFC bank accounts are included in NSPI’s pool of bank accounts under a mirror netting agreement and therefore, from time to time, if any cash accumulates in the NSPFC bank account it is available as an offset until that cash is required to service the defeased NSPC debt .
GUARANTEES AND LETTERS OF CREDIT
Emera had the following guarantees and letters of credit on behalf of third parties not included within the Balance Sheets as at December 31, 2013: • NSPI has provided a limited guarantee for the indebtedness of Renewable Energy Services Ltd . (“RESL”) under a $23 .5 million loan
agreement between RESL and a third-party lender . As at December 31, 2013, RESL’s indebtedness under the loan agreement was $19 .6 million . NSPI holds a security interest in the present and future assets owned by RESL in connection with a wind energy project at Point Tupper, Nova Scotia .
• Emera has provided a guarantee to the Long Island Power Authority (“LIPA”) on behalf of Bear Swamp for Bear Swamp’s long-term energy and capacity supply agreement (“PPA”) with LIPA, which expires on April 30, 2021 . The guarantee is for 50 per cent of the relevant obligations under the PPA up to a maximum of $5 .1 million USD . As at December 31, 2013, the fair value of the PPA was positive .
• Standby letters of credit in the amount of $7 .3 million USD for the benefit of third parties that have extended credit to Emera and its subsidiaries . These letters of credit typically have a one-year term and are renewed annually as required .
• Emera has provided standby letters of credit in the amount of $2 .9 million USD for the benefit of third parties that have extended credit to subsidiaries of NWP . These letters of credit typically have a one-year term and are renewed annually as required .
• A standby letter of credit to secure obligations under an unfunded pension plan in NSPI . The letter of credit expires in June 2014 and is renewed annually . The amount committed as at December 31, 2013 was $31 .7 million .
• A standby letter of credit to secure obligations under an unfunded pension plan in Bangor Hydro . The letter of credit expires in October 2014 and is renewed annually . The amount committed as at December 31, 2013 was $2 .2 million USD .
• A standby letter of credit in connection with a precedent transmission line agreement between Bangor Hydro and two other parties . The letter of credit expires in August 2014 . The amount committed as at December 31, 2013 was $1 .8 million USD .
No liability has been recognized on the consolidated balance sheet related to any potential obligation under these guarantees and letters of credits .

Management’s Discussion and Analysis
Emera Inc . — Annual Report 2013 57
OUTLOOK
NSPI
NSPI anticipates earning within its allowed ROE range in 2014 and expects its rate base and earnings to be similar to 2013 . Over the past several years, NSPI has experienced growth in capital assets which has largely been driven by the requirement to reduce Nova Scotia’s reliance upon high carbon and greenhouse gas emitting sources of energy, and thus resulting in a significant investment in renewable energy sources . The effect of these required investments has contributed to increasing power rates for customers .
NSPI continues to focus on cost control, productivity and service improvements, and making regulated investments in renewable energy and system reliability projects .
NSPI expects to finance its capital expenditures with funds from operations and debt .
Maine Utility Operations
Maine Utilities Operations’ earnings are most directly impacted by the combined impacts of the range of rates of return on equity and equity thickness approved by its regulators, the prudent management and approved recovery of operating costs, and the timing and amount of capital expenditures .
Two complaints against New England Transmission Operators, currently before the FERC, are seeking to lower the current allowed ROE of 11 .14 per cent on base transmission investments in New England, which if successful, could negatively affect Bangor Hydro’s return on transmission investments . It is expected that any reduction in ROE would be applied to a retroactive 15-month period beginning from the date of the complaint, and thus any such decision could accordingly have a more material impact on earnings for 2013 than in the future .
On August 6, 2013, a decision was received from the administrative law judge recommending to the FERC Commissioners an ROE of 10 .6 per cent for the retroactive period and 9 .7 per cent prospectively, subject to adjustment for changes in current market conditions from the date evidence was filed in April 2013 . While not yet final, the recommended decision provided a basis on which to calculate a likely potential refund for the 15-month retroactive period . Bangor Hydro recorded a $2 .4 million USD contingent accrual, including interest for the refund period in 2013 . A final decision is not expected by the FERC until 2014 .
Bangor Hydro and MPS continue to focus on gaining efficiencies by fully integrating the operations in Maine, and officially merged on January 1, 2014, becoming Emera Maine .
On December 6, 2013, Bangor Hydro and MPS filed a joint request with the MPUC seeking an increase of 9 .43 per cent in distribution rates . The regulatory proceeding processing this case will take place during 2014, and a final decision is expected in late Q3 2014, with new rates expected to go into effect on October 1, 2014 .
In November 2013, Bangor Hydro filed with the MPUC a request for an approximate 23 per cent increase in stranded cost rates to be effective on March 1, 2014 for a three-year period . The increase is principally attributable to above-market purchased power contracts . The requested ROE is 5 .90 per cent, reflecting the diminishing life of stranded costs, and a common equity component of 48 per cent . A regulatory decision is expected in Q1 2014 .
Capital expenditures in 2014 are forecasted at approximately $95 .6 million, compared with actual capital expenditures in 2013 of $84 .2 million, including AFUDC, 2013 depreciation of $25 .8 million, excluding regulatory amortization, and an average annual capital expenditure profile of $70 .6 million from 2009—2013 .
Caribbean Utility Operations
Earnings from the Caribbean Utility Operations earnings are most directly impacted by the combined impacts of the range of rates of return on equity and equity thickness approved by their regulators, the prudent management and approved recovery of operating costs, and the timing and amount of capital expenditures . Earnings are also impacted by the investment returns of Emera’s interest in the self-insurance fund .
Capital expenditures in 2014 are forecasted at approximately $49 .9 million, compared with actual capital expenditures in 2013 of $24 .1 million, including AFUDC, 2013 depreciation of $28 .8 million, excluding regulatory amortization, and an average annual capital expenditure profile of $20 .8 million from 2009—2013 .
LPH, consistent with its growth strategy, continues to evaluate opportunities for synergistic energy investments within the Caribbean region . On April 10, 2013, LPH completed the first of these investments by acquiring a 51 .91 per cent interest in DOMLEC, an integrated utility on the island of Dominica .
BLPC continues to focus on managing operating costs and has completed and submitted an integrated resource planning process to optimize Barbados’ short- and long-term electricity requirements . The integrated resource plan evaluated various generation technologies and fuel sources to provide the most reliable and efficient solution to customers . Management continues to work with stakeholders to develop an acceptable generation plan .

58 Emera Inc . — Annual Report 2013
The Barbados government has passed legislation that may modify the electricity market as it relates to the addition of renewable generation . BLPC is working with the government and stakeholders to implement the government’s policy and to extend its franchise .
With the investment in the West Sunrise Plant, GBPC will continue its efforts to improve the efficiency of its operations and evaluate opportunities to reduce the island’s dependence on oil as its primary fuel source for generation of electricity .
Pipelines
The timing of the income from Pipelines is predominately a result of capital lease accounting treatment, which yields declining earnings over the life of the asset .
Services, Renewables and Other Investments
Income from Services, Renewables and Other Investments is dependent on energy trading margins, the timing of capital expenditures on the Maritime Link Project, the timing of equity investments into the Labrador-Island Link, project-based construction services activity by Utility Services, operating performance of its electricity generation assets and investment in new renewable and other electrical generation, transmission and distribution projects or companies and fluctuations in APUC’s earnings . Constrained and volatile gas markets drive energy trading margins .
ENL
Through its subsidiary, NSPML, ENL has invested approximately $65 .2 million, including AFUDC, in the estimated $1 .56 billion development of the Maritime Link Project . AFUDC on invested equity is being capitalized at the rate of 9 .0 per cent . ENL’s future earnings contribution from the Maritime Link Project will be impacted by the timing of capital expenditures for design and construction activities . Project expenditures of approximately $300 .0 million, before AFUDC, are anticipated to be incurred in 2014, a portion of which is expected to be financed with project debt . The Maritime Link Project is scheduled to be in service by the end of 2017 .
Receipt of the Federal Loan Guarantee for the Maritime Link Project requires satisfactory achievement of financial close, which is targeted before the end of the second quarter of 2014 .
The Labrador-Island Link Transmission Project is currently estimated at $2 .6 billion . ENL has a 34 .9 per cent equity interest in this project with Nalcor Energy and, in Q1 2013, invested $67 .7 million of ENL’s total estimated equity investment of $390 million . Equity earnings, effectively equivalent to AFUDC, are being recorded at a rate determined according to the contract with Nalcor, set by the Newfoundland and Labrador Board of Commissioners of Public Utilities for privately owned electric utilities in Newfoundland and Labrador, which is currently 8 .8 per cent . Future earnings are dependent upon the timing of the additional equity investment in the Labrador-Island Transmission Link Project . No material investment in the project is expected in 2014, as project costs are expected to be principally financed with debt during the year .
EMERA ENERGY
Emera Energy’s business comprises physical natural gas and electricity trading and marketing, ownership of 1,340 MW of gas and 30 MW of biomass electricity generation, as well as its 49 per cent equity interest in NWP’s 420 MW of wind generation and 50 per cent equity interest in Bear Swamp’s 600 MW of hydro generation, all in northeast North America .
The trading and marketing business is generally dependent on market conditions . In particular, market volatility, which can be influenced by weather, local supply constraints and other factors all can provide arbitrage opportunities . The past three years have seen favourable market conditions, and 2013 experienced unprecedented market volatility that contributed to very strong earnings from trading and marketing . If market volatility decreases in the future, trading and marketing earnings may be lower . In addition to capitalizing on near-term market opportunities, the business expects to continue to grow organically, building market share through superior customer service and expanding its geographic reach, including the Marcellus Shale region .
Earnings from Emera Energy generating assets are also largely dependent on market conditions and in particular the relevant pricing of electricity and natural gas . Efficient operations of the fleet to ensure unit availability, cost management and effective commercial performance are key success factors . Current market conditions are such that the recent addition of 1,050 MW of natural gas-fired generation to Emera Energy’s portfolio is expected to increase earnings modestly in the medium term, increasing over time as the assets are depreciated and debt is paid down .
Corporate
Corporate is comprised of intercompany financing revenues, corporate interest expense and other corporate activities, offset by corporate administration costs not allocated to operating subsidiaries . Corporate’s contribution to consolidated net income is expected to be lower in 2014 as business growth leads to increased financing, corporate administration costs and business development costs .
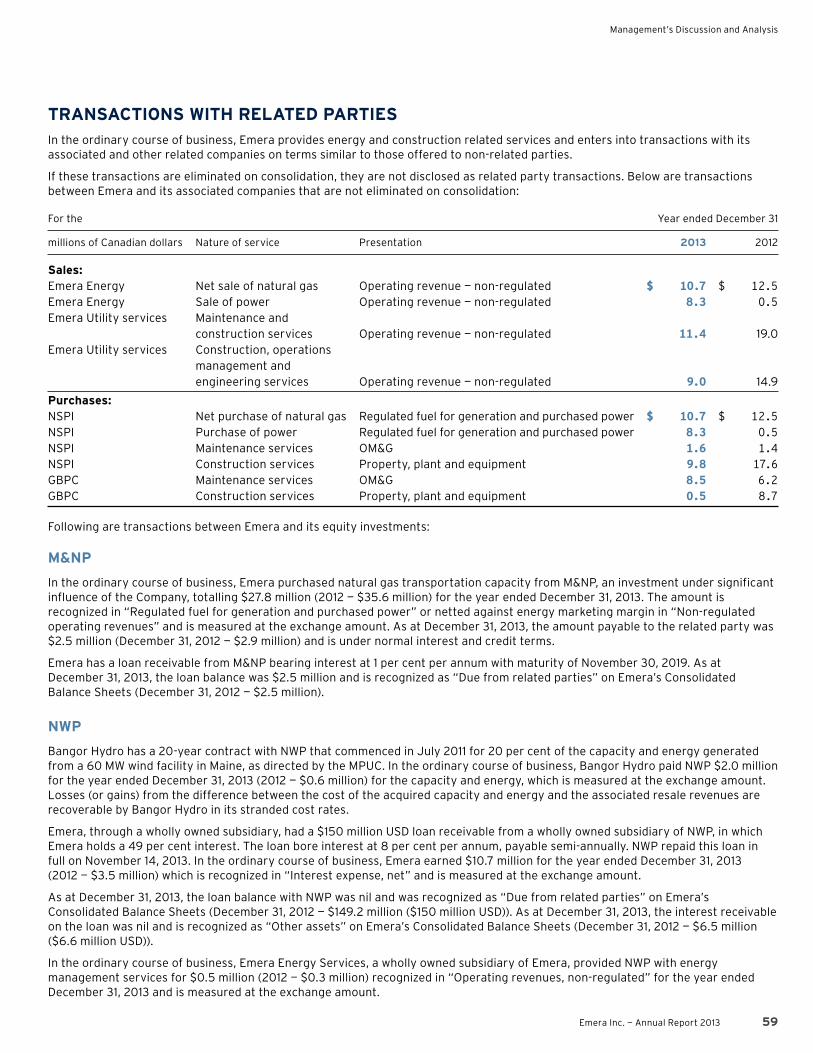
Management’s Discussion and Analysis
Emera Inc . — Annual Report 2013 59
TRANSACTIONS WITH RELATED PARTIES
In the ordinary course of business, Emera provides energy and construction related services and enters into transactions with its associated and other related companies on terms similar to those offered to non-related parties .
If these transactions are eliminated on consolidation, they are not disclosed as related party transactions . Below are transactions between Emera and its associated companies that are not eliminated on consolidation:
For the Year ended December 31
millions of Canadian dollars Nature of service Presentation 2013 2012
Sales:Emera Energy Net sale of natural gas Operating revenue — non-regulated $ 10.7 $ 12.5Emera Energy Sale of power Operating revenue — non-regulated 8.3 0.5Emera Utility services Maintenance and construction services Operating revenue — non-regulated 11.4 19 .0 Emera Utility services Construction, operations management and engineering services Operating revenue — non-regulated 9.0 14 .9
Purchases:NSPI Net purchase of natural gas Regulated fuel for generation and purchased power $ 10.7 $ 12.5NSPI Purchase of power Regulated fuel for generation and purchased power 8.3 0.5NSPI Maintenance services OM&G 1.6 1.4NSPI Construction services Property, plant and equipment 9.8 17.6GBPC Maintenance services OM&G 8.5 6.2GBPC Construction services Property, plant and equipment 0.5 8.7
Following are transactions between Emera and its equity investments:
M&NP
In the ordinary course of business, Emera purchased natural gas transportation capacity from M&NP, an investment under significant influence of the Company, totalling $27 .8 million (2012 — $35 .6 million) for the year ended December 31, 2013 . The amount is recognized in “Regulated fuel for generation and purchased power” or netted against energy marketing margin in “Non-regulated operating revenues” and is measured at the exchange amount . As at December 31, 2013, the amount payable to the related party was $2 .5 million (December 31, 2012 — $2 .9 million) and is under normal interest and credit terms .
Emera has a loan receivable from M&NP bearing interest at 1 per cent per annum with maturity of November 30, 2019 . As at December 31, 2013, the loan balance was $2 .5 million and is recognized as “Due from related parties” on Emera’s Consolidated Balance Sheets (December 31, 2012 — $2 .5 million) .
NWP
Bangor Hydro has a 20-year contract with NWP that commenced in July 2011 for 20 per cent of the capacity and energy generated from a 60 MW wind facility in Maine, as directed by the MPUC . In the ordinary course of business, Bangor Hydro paid NWP $2 .0 million for the year ended December 31, 2013 (2012 — $0 .6 million) for the capacity and energy, which is measured at the exchange amount . Losses (or gains) from the difference between the cost of the acquired capacity and energy and the associated resale revenues are recoverable by Bangor Hydro in its stranded cost rates .
Emera, through a wholly owned subsidiary, had a $150 million USD loan receivable from a wholly owned subsidiary of NWP, in which Emera holds a 49 per cent interest . The loan bore interest at 8 per cent per annum, payable semi-annually . NWP repaid this loan in full on November 14, 2013 . In the ordinary course of business, Emera earned $10 .7 million for the year ended December 31, 2013 (2012 — $3 .5 million) which is recognized in “Interest expense, net” and is measured at the exchange amount .
As at December 31, 2013, the loan balance with NWP was nil and was recognized as “Due from related parties” on Emera’s Consolidated Balance Sheets (December 31, 2012 — $149 .2 million ($150 million USD)) . As at December 31, 2013, the interest receivable on the loan was nil and is recognized as “Other assets” on Emera’s Consolidated Balance Sheets (December 31, 2012 — $6 .5 million ($6 .6 million USD)) .
In the ordinary course of business, Emera Energy Services, a wholly owned subsidiary of Emera, provided NWP with energy management services for $0 .5 million (2012 — $0 .3 million) recognized in “Operating revenues, non-regulated” for the year ended December 31, 2013 and is measured at the exchange amount .

60 Emera Inc . — Annual Report 2013
DIVIDENDS AND PAYOUT RATIOS
Emera Incorporated’s common dividend rate was $1 .41 ($0 .3500 per quarter in Q1, Q2 and Q3 and $0 .3625 in Q4) per common share for the year ended December 31, 2013 and $1 .36 ($0 .3375 per quarter in Q1, Q2 and Q3 and $0 .3500 in Q4) per common share for the year ended December 31, 2012, representing a payout ratio of approximately 85 .6 per cent in 2013 and 76 .3 per cent for the year ended December 31, 2012 .
On October 16, 2013, Emera’s Board of Directors approved an increase in the annual common dividend rate from $1 .40 to $1 .45, and accordingly declared a quarterly dividend of $0 .3625 per common share .
BUSINESS RISKS AND RISK MANAGEMENT
Emera has a business-wide risk management process, monitored by the Board of Directors, to ensure a consistent and coherent approach to risk management . Certain risk management activities for Emera are overseen by the Enterprise Risk Management Committee to ensure such risks are appropriately assessed, monitored and controlled within predetermined risk tolerances established through approved policies .
The Company’s risk management activities are focused on those areas that most significantly impact profitability, quality of income and cash flow . These risks include, but are not limited to, exposure to regulatory and political risk, changes in environmental legislation, weather, interest rate, commodity price risk, foreign exchange, commercial relationships, project development and construction risk, non-regulated plant operational risk, labour, acquisition credit, capital market and country risk .
In this section, Emera describes some of the principal risks management believes could materially affect its business, revenues, operating income, net income, net assets, or liquidity or capital resources . The nature of risk is such that no list can be comprehensive, and other risks may arise or risks not currently considered material may become material in the future .
Regulatory and Political Risk
The Company’s rate-regulated subsidiaries and certain investments subject to significant influence are subject to risk of the recovery of costs and investments in a timely manner . As cost-of-service utilities with an obligation to serve, NSPI, Bangor Hydro, MPS, BLPC, GBPC, NSPML and DOMLEC must obtain regulatory approval to change electricity rates and/or riders from their respective regulators . Costs and investments can be recovered upon the respective regulator’s approval of the recovery in adjustments to rates and/or riders, which normally requires a public hearing process or may be mandated by other governmental bodies . In addition, the commercial and regulatory frameworks under which Emera and its subsidiaries operate can be impacted by significant shifts in government policy and changes in governments . Emera’s investments in entities in which it has significant influence and which are subject to regulatory risk include: APUC, M&NP, LIL and LUCELEC .
During public hearing processes, consultants and customer representatives scrutinize the costs, actions and plans of these subsidiaries and their respective regulators determine whether to allow recovery and to adjust rates based upon the subsidiaries’ evidence and any contrary evidence from other parties . In some circumstances, other government bodies may influence the setting of rates . The subsidiaries manage this regulatory risk through transparent regulatory disclosure, ongoing stakeholder and government consultation and multi-party engagement on aspects such as utility operations, fuel-related audits, rate filings and capital plans . The subsidiaries employ a collaborative regulatory approach through technical conferences and, where appropriate, negotiated settlements .
Brunswick Pipeline entered into a 25-year firm service agreement with Repsol Energy Canada (“REC”), which was filed with the NEB . The firm service agreement provides for predetermined toll increases after the fifth and fifteenth year of the contract . As a regulated Group II pipeline, the tolls of Brunswick Pipeline are regulated by the NEB on a complaint basis . Brunswick Pipeline is required to make copies of tariffs and supporting financial information readily available to interested persons . Persons who cannot resolve traffic, toll and tariff issues with Brunswick Pipeline may file a complaint with the NEB . In the absence of a complaint, the NEB does not normally undertake a detailed examination of Brunswick Pipeline’s tolls .
Changes in Environmental Legislation
Emera is subject to regulation by federal, provincial, state, regional and local authorities with regard to environmental matters primarily related to its utility operations . Changes to climate change and air emissions standards could adversely affect utility operations .
In addition to imposing continuing compliance obligations, there are laws, regulations and permits authorizing the imposition of penalties for non-compliance, including fines, injunctive relief and other sanctions . The cost of complying with current and future environmental requirements is material to Emera . Failure to comply with environmental requirements or to recover environmental costs in a timely manner through rates could have a material adverse effect on Emera .

Management’s Discussion and Analysis
Emera Inc . — Annual Report 2013 61
NSPI
Conformance with legislative and NSPI internal requirements are verified through a comprehensive environmental audit program . There were no significant environmental or regulatory compliance issues identified during the audits completed to December 31, 2013 .
NSPI is committed to operating in a manner that is respectful and protective of the environment, and in full compliance with legal requirements and Company policy . NSPI has implemented this policy through development and application of environmental management systems .
Climate Change and Air EmissionsGreenhouse Gas EmissionsNSPI continued to reduce GHG emissions in 2013 . This has been achieved through energy efficiency and conservation programs, the addition of new renewable energy sources to the generation portfolio and decreased industrial load .
GHG emissions from NSPI facilities have been capped beginning in 2010 through to 2020 . The regulations allow for multi-year compliance periods recognizing the variability in electricity supply sources and demand . Over the decade, the caps will be achieved by a combination of additional renewable generation, import of non-emitting energy, and energy efficiency and conservation .
On September 12, 2012, Environment Canada published regulations for the national carbon dioxide framework in the Canadian electricity sector . NSPI is not expected to be subject to these federal regulations as the Nova Scotia Environment Department and Environment Canada have proposed a Greenhouse Gas Emissions Equivalency Agreement (“the Equivalency Agreement”) . In the Equivalency Agreement published in Canada Gazette I on September 14, 2012, provincial regulations would take precedence over federal regulations, provided provincial regulations achieve an equivalent emissions outcome . The Equivalency Agreement proposed by the Government of Canada and the Province of Nova Scotia would require reductions equivalent to or greater than the new federal regulations, but allow NSPI operational flexibility in the determination of the means of compliance .
Nova Scotia’s existing GHG regulations require reductions of 25 per cent in GHG emissions in the electricity sector by 2020, compared to emissions in 2010 . Based on the new federal regulations, a further reduction of 25 per cent compared to 2010 emissions would be required by 2030 . The Province of Nova Scotia issued a discussion paper outlining 2021—2030 emission targets for greenhouse gases, sulphur dioxide, nitrogen dioxide and mercury . Comments were received on the discussion paper and in 2013 the Province of Nova Scotia signed an Order in Council supporting these targets for greenhouse gases but delayed further action for air pollutants . Environment Canada and the Province of Nova Scotia are working on finalizing the Equivalency Agreement .
Federal Air Pollutant RegulationsFor the past three years the federal government has engaged in discussions with provincial governments, industry and environmental non-governmental organizations regarding the possibility of establishing Base Level Industrial Emission Regulations (“BLIERs”) . This would form part of a more comprehensive approach to air quality, including new Canadian Ambient Air Quality Standards, with a focus on air zone and air shed monitoring and modelling . In 2013, the federal government was moving ahead with BLIERs for the electricity sector . NSPI has been working closely with Environment Canada and Nova Scotia Environment . Preliminary indications are that some form of equivalency might be possible, even if BLIERs are eventually brought forward .
The Province of Nova Scotia has initiated steps to regulate new lower air pollutant caps for the 2021 —2030 period . That process has been delayed to allow for consideration of the upcoming Integrated Resource Plan and pending federal decisions .
Renewable EnergyThe Province of Nova Scotia has established targets with respect to the per cent age of renewable energy in NSPI’s generation mix . The target date for 5 per cent of electricity to be supplied from post-2001 sources of renewable energy, owned by independent power producers, was extended to 2011 from 2010 . Annual targets have been set, increasing to 40 per cent by 2020 . The target for 2013 required an additional 5 per cent of renewable energy, with the target remaining at 10 per cent for 2014 .
Mercury, Nitrogen Oxide and Sulphur Dioxide Emissions
NSPI
NSPI completed a capital program to add sorbent injection to each of the seven pulverized fuel coal units in 2010 . This was put in place to address planned reductions in mercury emissions limits, which are set out in the following table:
Year Mercury Emissions Limit (kg)
2009 1682010 1102011 — 2012 1002013 852014 — 2019 652020 35

62 Emera Inc . — Annual Report 2013
Any mercury emission above 65 kg, between 2010 and 2013, must be offset by lower emissions in the 2014 to 2020 period .
NSPI completed its capital program of retrofitting low nitrogen oxide combustion firing systems on six of its seven pulverized fuel coal units in early 2009 . NSPI now meets the nitrogen oxide emission cap of 21,365 tonnes per year established by the Nova Scotia Government effective 2010 . NSPI is committed to meeting ever-reducing sulphur dioxide emission cap requirements through the use of a blend of net lower sulphur content solid fuel . These investments, combined with the purchasing of low sulphur coal, allow NSPI to meet the provincial air quality regulations .
Services, Renewables and Other InvestmentsEmissionsEE New England Gas Generation is subject to the Acid Rain Program for sulphur dioxide emissions and the Regional Greenhouse Gas Initiative (“RGGI”) for carbon dioxide emissions . In addition, Bridgeport Power is subject to the Clean Air Interstate Rule for ozone season nitrogen dioxide emission allowances . EE New England Gas Generation emits approximately two million tons of carbon dioxide per year . The amount of sulphur dioxide or nitrogen dioxide emitted is not considered significant . Changes to these emissions programs could adversely impact financial and operational performance .
As part of its acquisition of the EE New England Gas Generation, Emera acquired six million RGGI emission allowances, with each allowance being sufficient to offset one short ton of carbon dioxide emissions . The RGGI compliance period spans three years, with the current period covering January 1, 2012 to December 31, 2014 . The RGGI allowances acquired are sufficient to cover the carbon dioxide emissions liability that was assumed on acquisition, and are expected to cover a significant portion, if not all, of the balance of the liability anticipated to December 31, 2014 .
Weather Risk
Shifts in weather patterns affect electric sales volumes and associated revenues and costs . Extreme weather events generally result in increased operating costs associated with restoring power to customers . Emera responds to significant weather event related outages according to each subsidiary’s respective emergency services restoration plan .
Interest Rate Risk
Emera utilizes a combination of fixed and floating rate debt financing for operations and capital expenditures, resulting in an exposure to interest rate risk . Emera seeks to manage interest rate risk through a portfolio approach that includes the use of fixed and floating rate debt with staggered maturities . The Company will, from time to time, issue long-term debt or enter into interest rate hedging contracts to limit its exposure to fluctuations in floating interest rate debt .
For Emera’s regulated subsidiaries, regulatory lag in a period of rising interest rates may have a negative effect on ROE rates . Rising interest rates may also negatively affect the economic viability of project development initiatives .
Commodity Price Risk
A large portion of the Company’s fuel supply comes from international suppliers and is subject to commodity price risk . Fuel contracts may be exposed to broader global conditions, which may include impacts on delivery reliability and price, despite contracted terms . The Company seeks to manage this risk through the use of financial hedging instruments and physical contracts . In addition, the adoption and implementation of FAMs in certain subsidiaries has further helped manage this risk, as the regulatory framework for the Company’s rate-regulated subsidiaries permits the recovery of prudently incurred costs .
REGULATED FUEL FOR GENERATION AND PURCHASED POWER
NSPICoal/Petroleum CokeA substantial portion of NSPI’s coal and petroleum coke (“petcoke”) supply comes from international suppliers, which was contracted at or near the market prices prevailing at the time of contract . The Company has entered into fixed-price and index price contractual arrangements for coal with several suppliers as part of the fuel procurement portfolio strategy . All index-priced contractual arrangements are matched with a corresponding financial instrument to fix the price . The approximate per cent age of coal requirements contracted as at December 31, 2013 are as follows:
2014 — 86 per cent 2015 — 43 per cent 2016 — 26 per cent

Management’s Discussion and Analysis
Emera Inc . — Annual Report 2013 63
Natural GasNSPI periodically enters into contracts based on forecasted natural gas consumption to meet load and system security requirements . Volumes exposed to market prices are managed using financial instruments where the fuel is required for NSPI’s generation; and the balance is sold against market prices when available for resale . As at December 31, 2013, amounts of natural gas volumes that have been hedged are approximately as follows:
2014 — 70 per cent 2015 — 8 per cent
Heavy Fuel OilNSPI manages exposure to changes in the market price of heavy fuel oil through the use of swaps, options and forward contracts . For 2014 and 2015, NSPI currently does not have heavy fuel oil hedging requirements due to favourable natural gas pricing .
BiomassNSPI has entered into a fixed-price contractual arrangement with a supplier as part of its biomass fuel procurement strategy . The majority of its market priced biomass fuel is being sourced from within Nova Scotia with a small per cent age outside of the province . As at December 31, 2013, approximately 15 per cent of NSPI’s biomass fuel purchases have been fixed for 2014 .
Caribbean Utility OperationsHeavy Fuel OilGBPC manages exposure to change in the market price of heavy fuel oil through the use of swaps, options, forwards and futures contracts . GBPC has entered into fixed price futures contracts to hedge approximately 75 per cent of their heavy fuel oil requirements beginning in 2014 .
BLPC does not use derivatives to manage the changes in market price of heavy fuel oil . BLPC’s fuel pricing is based on the three-day average market price .
Services, Renewables and OtherNatural GasEmera Energy’s investment in natural gas-fired plants in northeastern United States, operating as merchant facilities, are susceptible to the volatility of the New England electricity market and natural gas prices . Market electricity prices are dependent upon a number of factors, including the projected supply and demand of electricity, natural gas prices, the price of other materials used to generate electricity, the cost of complying with applicable environmental and other regulatory requirements and weather conditions . A material change in any one of these factors can materially affect the profitability of the facilities .
MARKETING AND TRADING
The majority of Emera’s portfolio of electricity and gas marketing and trading contracts, and in particular its natural gas asset management arrangements, are contracted on a back-to-back basis, avoiding any material long or short commodity positions . However, the portfolio is subject to commodity price risk, particularly with respect to basis point differentials between relevant markets, in the event of an operational issue or counterparty default, the Company’s commercial arrangements, including the combination of supply and purchase agreements, asset management agreements, pipeline transportation agreements and financial hedging instruments, as well as its credit policies, counterparty credit assessments, market and credit position reporting, and other risk management and reporting practices, are all used to manage and mitigate this risk .
Foreign Exchange Risk
The Company is also exposed to foreign currency exchange rate risks . The Company receives currencies other than the Canadian dollar and, as such, can benefit from a weaker Canadian dollar, and can be adversely affected by a stronger Canadian dollar relative to currencies worldwide . Accordingly, changes in exchange rates, and in particular a strengthening of the Canadian dollar, may adversely affect consolidated revenue and operating margins as expressed in Canadian dollars .
The Company identifies and hedges significant transactional currency risks in accordance with its policies and procedures . Emera does not currently hedge the value of its investments in foreign subsidiaries . Exchange gains and losses on net investments in foreign subsidiaries are included in accumulated other comprehensive loss (“AOCL”) .
The Company enters into foreign exchange forward and swap contracts to limit exposure on certain foreign currency transactions such as fuel purchases, revenues streams, capital expenditures and capital projects . The regulatory framework for the Company’s rate-regulated subsidiaries permits the recovery of prudently incurred costs, including foreign exchange .
NSPINSPI enters into certain foreign exchange forward and swap contracts to limit the exposure of currency rate fluctuations related to certain fuel purchases and capital projects . Currency forwards are used to fix the CAD cost to acquire USD, reducing exposure to currency rate fluctuations .

64 Emera Inc . — Annual Report 2013
The risk due to fluctuation of the CAD against the USD for fuel purchases in NSPI is measured and managed . In 2014, NSPI expects approximately 63 per cent of its anticipated net fuel costs to be denominated in USD . Forward contracts to buy $227 .0 million USD were in place as at December 31, 2013 at a weighted average rate of $1 .0087, representing 84 per cent of 2014’s anticipated USD requirements . Forward contracts to buy $466 .0 million USD in 2015 through 2017 at a weighted average rate of $1 .0088 were in place as at December 31, 2013 . These contracts cover 56 per cent of anticipated USD requirements in these years . As at December 31, 2013, there were no fuel-related foreign exchange swaps outstanding .
Bayside PowerBayside Power uses foreign exchange forward contracts to hedge the currency risk for capital projects denominated in foreign currencies . Forward contracts to buy 2 .8 million € were in place as at December 31, 2013 at a weighted average rate of $1 .3951 for capital projects in 2016 .
Brunswick PipelineBrunswick Pipeline uses forward contracts to hedge the currency risk associated with revenue streams denominated in USD . Forward contracts to sell $53 .9 million USD in 2014 were in place as at December 31, 2013 at an average rate of $1 .0363 and sell $146 million USD in 2015 through 2018 at a weighted average rate of $1 .0606 . These contracts cover 94 per cent of anticipated USD revenue inflows in 2014 and 62 per cent of anticipated USD revenue inflows in 2015 through 2018 .
Commercial Relationships Risk
Emera’s notable commercial relationships include:
NSPIFor the year ended December 31, 2013, NSPI’s five largest customers contributed approximately 9 .6 per cent (2012 — 7 .1 per cent) of electric revenues . The loss of a large customer could have a material effect on NSPI’s operating revenues . NSPI works to mitigate this risk through operational adjustments and cost management as well as the regulatory process .
Brunswick PipelineBrunswick Pipeline has a 25-year firm service agreement with Repsol Energy Canada (“REC”) . The pipeline was used solely in 2013 and 2012 to transport natural gas from the Canaport LNG terminal in Saint John, New Brunswick to the United States border for REC . The risk of non-payment is mitigated as Repsol YPF, S .A (“Repsol”), the parent company of REC, has provided Brunswick Pipeline with a guarantee for all RECs’ payment obligations under the firm service agreement . As at December 31, 2013, the net investment in direct financing lease with Repsol was $487 .2 million .
Repsol is rated investment grade BBB-/Baa3; credit ratings and other company information are monitored on an ongoing basis . There is currently no allowance for credit losses related to this agreement .
ENLIn 2012, Emera and Nalcor Energy executed agreements pertaining to the development and transmission of hydroelectric power from Muskrat Falls in Labrador to the island of Newfoundland, the Province of Nova Scotia and through to New England . In exchange for the investment in the Maritime Link Project, estimated to be approximately $1 .56 billion, 20 per cent of the output of the Muskrat Falls generating station will be received from Nalcor for a period of thirty-five years .
Bayside PowerBayside Power sells all its generation during the months of November through March to NB Power in accordance with a long-term purchase power agreement (“PPA”) . Revenue from this PPA contributed 55 .3 per cent (2012 — 55 .7 per cent) to Bayside Power’s electric revenues for the year ended December 31, 2013 . The PPA expires March 31, 2021, with an option to renew for an additional five-year term, provided both parties consent to the renewal .
Project Development and Construction Risk
ENL’s planned investment in the development of the Maritime Link Project has risks commensurate with any large construction project . Risks related to such large projects include impact on costs of schedule delays and risk of cost overruns . Emera has deployed a robust project and risk management approach to this project, led by a team with extensive experience in large projects . There are also significant contractual terms in place protecting Emera and ENL from any exposure to cost overruns to either of Nalcor’s projects and with specific provisions for Nalcor sharing in cost overruns of the Maritime Link Project .
If Emera does not meet certain conditions in 2014 relating to closing its financing, it could be subject to a $60 million penalty . In the event the payment obligation is triggered, Nalcor has agreed to pay $30 million of the obligation to Emera .

Management’s Discussion and Analysis
Emera Inc . — Annual Report 2013 65
Non-Regulated Plant Operational Risk
Emera owns three combined-cycle gas-fired electricity generating facilities in New England, collectively known as EE New England Gas Generation as well as Bayside Power and Brooklyn Energy . Fuel purchases for these plants are often variable and when facility heat rates do not meet expectations, unit profitability may be affected . In addition, power plant operations are susceptible to outages due to failure of generation equipment, transmission lines, pipelines or other equipment, which could make the impacted plant unavailable to provide service . To the extent that plant equipment requires significant capital and other operation and maintenance expenditures to maintain efficiency, requires longer than forecast down-times for maintenance and repair, experiences outages due to equipment failure or suffers disruptions of power generation for other reasons, the cost of generating electricity will increase and Emera’s revenues may also be negatively affected .
Labour Risk
Certain Emera employees are subject to collective labour agreements . Approximately 51 per cent of the full-time and term employees within the Emera labour force are represented by local unions .
Approximately 9 per cent of the labour force is covered by collective labour agreements that will expire within the next twelve months . Emera seeks to manage this risk through ongoing discussions with the local unions . The Company has contingency plans in place in the event of a labor disruption .
Acquisition Risk
The risks associated with Emera’s acquisition strategy include the availability of suitable acquisition candidates, obtaining the necessary regulatory approval for any acquisition and assimilating and integrating acquired companies into the Company . In addition, potential difficulties inherent in acquisitions may adversely affect the results of an acquisition . These include delays in implementation or unexpected costs or liabilities, as well as the risk of failing to realize operating benefits or synergies from completed transactions .
Emera mitigates these risks by following systematic procedures for integrating acquisitions, applying strict financial metrics to any potential acquisition and subjecting the process to close monitoring and review by the Board of Directors .
Credit Risk
The Company is exposed to credit risk with respect to amounts receivable from customers, energy marketing collateral deposits and derivative assets . Credit risk is the potential loss from a counterparty’s non-performance under an agreement . The Company manages credit risk with policies and procedures for counterparty analysis, exposure measurement, and exposure monitoring and mitigation . Credit assessments are conducted on all new customers and counterparties, and deposits or collateral are requested on any high risk accounts .
Capital Market Risk
Emera’s utility operations and projects in development require significant capital investments in property, plant and equipment . Consequently, Emera is an active participant in the debt and equity markets . Any disruption in capital markets could have a material impact on Emera’s ability to fund its operations . Capital markets are global in nature and are affected by numerous events throughout the world economy . Capital market disruptions could prevent Emera from issuing new securities or cause the Company to issue securities with less than ideal terms and conditions .
Country Risk
Operating revenues outside of Canada constituted 33 per cent of Emera’s total operating revenues . Emera’s investments are currently in regions where the political and economic risk levels are considered by the Company to be acceptable . Emera’s operations in some countries may be subject to the following risks: changes in the rate of economic growth, restrictions on the repatriation of income or capital exchange controls, inflation, the effect of global health, safety and environmental matters or economic conditions and market conditions, and change in financial policy and availability of credit . To mitigate this risk, Emera has a rigorous approval process for investment . In addition, a liquidity strategy is developed for all investments .

66 Emera Inc . — Annual Report 2013
RISK MANAGEMENT INCLUDING FINANCIAL INSTRUMENTS
Emera’s risk management policies and procedures provide a framework through which management monitors various risk exposures . The risk management policies and practices are overseen by the Board of Directors . The Company has established a number of processes and practices to identify, monitor, report on and mitigate material risks to the Company . This includes establishment of the Enterprise Risk Management Committee, whose responsibilities include preparing and updating a “Risk Dashboard” for the Board of Directors on a quarterly basis . Furthermore, a corporate team independent from operations is responsible for tracking and reporting on market and credit risks, such as financial and credit risks on a daily and weekly basis, as applicable .
The Company manages its exposure to normal operating and market risks relating to commodity prices, foreign exchange and interest rates through contractual protections with counterparties where practicable, as well as by using financial instruments consisting mainly of foreign exchange forwards and swaps, interest rate options and swaps, and coal, oil and gas futures, options, forwards and swaps . In addition, the Company has contracts for the physical purchase and sale of natural gas . Collectively, these contracts and financial instruments are considered “derivatives” .
The Company recognizes the fair value of all its derivatives on its balance sheet, except for non-financial derivatives that meet the normal purchases and normal sales (“NPNS”) exception . A physical contract generally qualifies for the NPNS exception if the transaction is reasonable in relation to the Company’s business needs, the counterparty owns or controls resources within the proximity to allow for physical delivery, the Company intends to receive physical delivery of the commodity, and the Company deems the counterparty creditworthy . The Company continually assesses contracts designated under the NPNS exception and will discontinue the treatment of these contracts where the criteria are no longer met .
Derivatives qualify for hedge accounting if they meet stringent documentation requirements, and can be proven to effectively hedge the identified risk both at the inception and over the term of the instrument . Specifically, for cash flow hedges, the effective portion of the change in the fair value of derivatives is deferred to Accumulated Other Comprehensive Loss (“AOCL”) and recognized in income in the same period the related hedged item is realized . Any ineffective portion of the change in the fair value of the cash flow hedges is recognized in net income in the reporting period .
Where the documentation or effectiveness requirements are not met, the derivatives are recognized at fair value, with any changes in fair value recognized in net income in the reporting period, unless deferred as a result of regulatory accounting .
Derivatives entered into by NSPI that are documented as economic hedges, and for which the NPNS exception has not been taken, are subject to regulatory accounting treatment, as approved by the UARB . These derivatives are recorded at fair value on the balance sheet as derivative assets or liabilities . The change in fair value of the derivatives is deferred to a regulatory asset or liability . The realized gain or loss is recognized when the hedged item settles in regulated fuel for generation and purchased power, inventory or property, plant and equipment, depending on the nature of the item being economically hedged . Management believes that any gains or losses resulting from settlement of these derivatives be refunded to or collected from customers in future rates through the FAM and depreciation .
Derivatives that do not meet any of the above criteria are designated as HFT and are recognized on the balance sheet at fair value . All gains or losses are recognized in net income of the period unless deferred as a result of regulatory accounting . The Company has not elected to designate any derivatives to be included in the HFT category when another accounting treatment applies .
Hedging Items Recognized on the Balance SheetsThe Company has the following categories on the balance sheet related to derivatives in valid hedging relationships:
As at December 31 December 31
millions of Canadian dollars 2013 2012
Derivative instrument assets (current and other assets) $ 15.4 $ 6.7Derivative instrument liabilities (current and long-term liabilities) (7.2) (8.3)
Net derivative instrument assets (liabilities) $ 8.2 $ (1.6)

Management’s Discussion and Analysis
Emera Inc . — Annual Report 2013 67
Hedging Impact Recognized in Net IncomeThe Company recognized gains (losses) related to the effective portion of hedging relationships under the following categories:
Year ended For the December 31
millions of Canadian dollars 2013 2012
Operating revenues — regulated $ 1.7 $ —Non-regulated fuel for generation and purchased power (1.9) (10.7)Income from equity investments (0.5) 2.1Interest expense, net (3.2) —
Effective net gains (losses) $ (3.9) $ (8.6)
The effectiveness gains (losses) reflected in the above table would be offset in net income by the hedged item realized in the period .
The Company recognized in net income the following gains (losses) related to the ineffective portion of hedging relationships under the following categories:
Year ended For the December 31
millions of Canadian dollars 2013 2012
Non-regulated fuel for generation and purchased power $ 2.1 $ —
Ineffective gains (losses) $ 2.1 $ —
Regulatory Items Recognized on the Balance SheetsThe Company has the following categories on the balance sheet related to derivatives receiving regulatory deferral:
As at December 31 December 31
millions of Canadian dollars 2013 2012
Derivative instrument assets (current and other assets) $ 51.4 $ 20.1Regulatory assets (current and other assets) 8.6 22.7Derivative instrument liabilities (current and long-term liabilities) (8.6) (22.4)Regulatory liabilities (current and long-term liabilities) (51.4) (20.1)
Net asset (liability) $ — $ 0.3
Regulatory Impact Recognized in Net IncomeThe Company recognized the following net gains (losses) related to derivatives receiving regulatory deferral as follows:
Year ended For the December 31
millions of Canadian dollars 2013 2012
Regulated fuel for generation and purchased power (1) $ (4.0) $ (39.1)
Net gains (losses) $ (4.0) $ (39.1)
(1) Realized gains (losses) on derivative instruments settled and consumed in the period, hedging relationships that have been terminated or the hedged transaction is no longer probable . Realized gains (losses) recorded in inventory will be recognized in “Regulated fuel for generation and purchased power” when the hedged item is consumed .

68 Emera Inc . — Annual Report 2013
Held-for-trading Items Recognized on the Balance SheetsThe Company has the following categories on the balance sheet related to HFT derivatives:
As at December 31 December 31
millions of Canadian dollars 2013 2012
Derivative instruments assets (current and other assets) $ 44.1 $ 20.7Derivative instruments liabilities (current and long-term liabilities) (171.2) (26.8)
Net derivative instrument assets (liabilities) $ (127.1) $ (6.1)
Held-for-trading Items Recognized in Net IncomeThe Company has recognized the following realized and unrealized gains (losses) with respect to HFT derivatives in net income:
Year ended For the December 31
millions of Canadian dollars 2013 2012
Non-regulated operating revenues $ 13.8 $ 16.1Other income (expenses), net 6.2 —
Net gains (losses) $ 20.0 $ 16.1
DISCLOSURE AND INTERNAL CONTROLS
The Company, under the supervision and participation of management, including the Chief Executive Officer and Chief Financial Officer, has designed as at December 31, 2013 disclosure controls and procedures (“DC&P”) and internal controls over financial reporting (“ICFR”) as those terms are defined in National Instrument 52-109 Certification of Disclosure in Issuers’ Annual and Interim Filings (“NI 52-109”) .
As permitted, the Company has limited the scope of its design of DC&P and ICFR by excluding the controls, policies and procedures at Bridgeport Energy, Tiverton Power and Rumford Power, collectively known as the EE New England Gas Generation, which were acquired on November 19, 2013 . Summary financial information about the acquisition is included in Note 34 of the Consolidated Financial Statements as at and for the year ended December 31, 2013 and 2012 . The relative size of the entities has not materially changed since its acquisition dates .
The Chief Executive Officer and the Chief Financial Officer have caused to be evaluated under their supervision, with the assistance of Company employees, the effectiveness of the Company’s DC&P and ICFR, and based on that evaluation, have concluded DC&P and ICFR were effective at December 31, 2013 .
There have been no changes in Emera or its consolidated subsidiaries’ ICFR during the period beginning on January 1, 2013 and ending on December 31, 2013, which have materially affected or are reasonably likely to materially affect ICFR .
CRITICAL ACCOUNTING ESTIMATES
The preparation of consolidated financial statements in accordance with generally accepted accounting principles requires management to make estimates and assumptions that affect the reported amounts of assets and liabilities at the date of the financial statements, and the reported amounts of revenues and expenses during the reporting periods . Management evaluates the Company’s estimates on an ongoing basis based upon historical experience, current conditions and assumptions believed to be reasonable at the time the assumption is made . Significant areas requiring the use of management estimates relate to rate-regulated assets and liabilities, pension and other post-retirement employee benefits, unbilled revenue, useful lives for depreciable assets, goodwill impairment assessments, income taxes, asset retirement obligations, capitalized overhead and valuation of derivative instruments . Actual results may differ significantly from these estimates .

Management’s Discussion and Analysis
Emera Inc . — Annual Report 2013 69
SIGNIFICANT ACCOUNTING POLICIES
RATE REGULATION
The rate-regulated accounting policies of NSPI, Bangor Hydro, MPS, BLPC, DOMLEC, GBPC, NSPML and Brunswick Pipeline may differ from accounting policies for non-rate-regulated companies . NSPI, Bangor Hydro, MPS, BLPC, DOMLEC, GBPC and NSPML accounting policies are subject to examination and approval by their respective regulators . These accounting policy differences occur when the regulators render their decisions on rate applications or other matters, and generally involve a difference in the timing of revenue and expense recognition . The accounting for these items is based on the expectation of the future actions of the regulators .
Emera has recorded $616 .1 million of regulatory assets and $151 .2 million of regulatory liabilities .
PENSION AND OTHER POST-RETIREMENT EMPLOYEE BENEFITS
The Company provides post-retirement benefits to employees, including defined benefit pension plans . The cost of providing these benefits is dependent upon many factors that result from actual plan experience and assumptions of future experience .
The benefit cost and accrued benefit obligation for employee future benefits included in annual compensation expenses are affected by employee demographics, including age, compensation levels, employment periods, contribution levels and earnings on plan assets .
Changes to the provision of the plan may also affect current and future pension costs . Benefit costs are also affected by changes in key actuarial assumptions, including anticipated rates of return on plan assets and discount rates used in determining the accrued benefit obligation and benefit costs .
The pension plan assets are comprised primarily of equity and fixed income investments . Fluctuations in actual equity market returns and changes in interest rates may result in increased or decreased pension costs in future periods .
Emera’s accounting policy is to amortize the net actuarial gain or loss, which exceeds 10 per cent of the greater of the projected benefit obligation/accumulated post-retirement benefit obligation (“PBO”) and the market-related value of assets, over active plan members’ average remaining service period, which is currently nine years . Emera’s use of smoothed asset values further reduces the volatility related to the amortization of actuarial investment experience . As a result, the main cause of volatility in reported pension cost is the discount rate used to determine the PBO .
The discount rate used to determine benefit costs is based on the yield of high-quality long-term corporate bonds in each operating entity’s country . The discount rate is determined with reference to bonds which have the same duration as the PBO as at January 1 of the fiscal year, rounded to the nearest 25 basis points . For benefit cost purposes, NSPI’s rate was 4 .25 per cent for 2013 (2012 — 5 .00 per cent and Bangor Hydro’s rate was 4 .00 per cent for 2013 (2012 — 4 .60 per cent) . MPS’s rate was 3 .80 for 2013 (2012 — 4 .50 per cent) and GBPC’s rate for 2013 was 5 .00 per cent (2012 — 5 .00 per cent) .
The expected return on plan assets is based on management’s best estimate of future returns, considering economic and consensus forecasts . The benefit cost calculations assumed that plan assets would earn a rate of return of 6 .50 per cent for 2013 (2012 — 6 .75 per cent) for NSPI and 7 .50 per cent for 2013 (2012 — 8 .00 per cent) for Bangor Hydro . The assumed rate of return on plan assets was 7 .50 per cent for 2013 (2012 — 8 .50 per cent) for MPS and 5 .50 per cent for both 2013 and 2012 for GBPC .
The reported benefit cost for defined benefit and defined contribution plans in 2013, based on management’s best estimate assumptions, is $76 .8 million . While there are numerous assumptions which are used to determine the benefit cost, the discount rate and asset return assumptions have an impact on the calculations .
The following shows the impact on 2013 benefit cost of a 25 basis point change (0 .25 per cent) in the discount rate and asset return assumptions:
0 .25% Increase 0 .25% Decrease
millions of Canadian dollars 2013 2012 2013 2012
Discount rate assumption $ (5.2)$ (4.1)$ 5.3 $4.2Asset return assumption $ (2.3)$ (2.1)$ 2.3 $ 2.1

70 Emera Inc . — Annual Report 2013
UNBILLED REVENUE
Electric revenues are billed on a systematic basis over a one- or two-month period for NSPI and a one-month period for Bangor Hydro, MPS, BLPC, DOMLEC and GBPC . At the end of each month, the Company must make an estimate of energy delivered to customers since the date their meter was last read and of related revenues earned but not yet billed . The unbilled revenue is estimated based on several factors, including current month’s generation, estimated customer usage by class, weather, line losses and applicable customer rates . Utility Services includes an estimate of work completed under contracts but not yet billed at the end of each month . Brunswick Pipeline also makes an estimate of toll revenues at the end of each month . Based on the extent of the estimates included in the determination of unbilled revenue, actual results may differ from the estimate . As at December 31, 2013, unbilled revenues amount to $154 .7 million (2012 — $143 .2 million) on a base of annual operating revenues of approximately $2,230 .2 million (2012 — $2,058 .6 million) .
PROPERTY, PLANT AND EQUIPMENT
Property, plant and equipment represents 60 .0 per cent of total assets recognized on the Company’s balance sheet . Included in “Property, plant and equipment” are the generation, transmission and distribution and other assets of the Company . Due to the magnitude of the Company’s property, plant and equipment, changes in estimated depreciation rates can have a material impact on depreciation expense .
Depreciation is determined by the straight-line method, based on the estimated remaining service lives of the depreciable assets in each category . The service lives of regulated assets are determined based on formal depreciation studies and require the appropriate regulatory approval . NSPI’s last depreciation study was completed in 2010 and approved by the UARB on May 11, 2011 .
Depreciation expense was $238 .9 million for the year ended December 31, 2013 (2012 — $227 .9 million) .
GOODWILL IMPAIRMENT ASSESSMENTS
Goodwill represents the excess of the acquisition purchase price for Bangor Hydro, GBPC and MPS over the fair values assigned to individual assets acquired and liabilities assumed . Emera is required to perform an impairment assessment annually, or in the interim if an event occurs that indicates the fair value of Bangor Hydro, GBPC or MAM may be below its carrying value . Emera performs its annual impairment test as at October 1 .
Goodwill arose on the acquisitions of GBPC, Bangor Hydro and MPS . At December 31, 2013, this goodwill had a total carrying amount of $206 .5 million (December 31, 2012 — $193 .5 million) .
Emera’s reporting units will first assess qualitative factors to determine whether it is more likely than not that the assets’ fair value is less than the carrying amount, in which case it is necessary to perform the quantitative goodwill impairment test . The carrying amount of the reporting unit’s goodwill is considered not recoverable if the carrying amount of the reporting unit as a whole exceeds the reporting unit’s fair value . An impairment charge is recorded for any excess of the carrying value of the goodwill over the implied fair value .
Determining the fair market value of goodwill is susceptible to changes from period to period as assumptions about future cash flows are required .
Emera reviewed the carrying amount of goodwill and no goodwill impairments existed for the year ended December 31, 2013 or 2012 .
INCOME TAXES
Income taxes are determined based on the expected tax treatment of transactions recorded in the consolidated financial statements . In determining income taxes, tax legislation is interpreted in a variety of jurisdictions, the likelihood that deferred tax assets will be recovered from future taxable income is assessed and assumptions about the expected timing of the reversal of deferred tax assets and liabilities are made . If interpretations differ from those of tax authorities or if the recovery of deferred tax assets or timing of reversals is not as anticipated, the provision for income taxes could increase or decrease in future periods . The amount of any such increase or decrease cannot be reasonably estimated .

Management’s Discussion and Analysis
Emera Inc . — Annual Report 2013 71
ASSET RETIREMENT OBLIGATIONS
An ARO is recognized if a legal obligation exists in connection with the future disposal or removal costs resulting from the permanent retirement, abandonment or sale of a long-lived asset . A legal obligation may exist under an existing or enacted law or statute, written or oral contract, or by legal construction under the doctrine of promissory estoppel .
An ARO represents the fair value of the estimated cash flows necessary to discharge the future obligation using the Company’s credit-adjusted risk free rate . The amounts are reduced by actual expenditures incurred . Estimated future cash flows are based on completed depreciation studies, remediation reports, prior experience, estimated useful lives and governmental regulatory requirements . The present value of the liability is recorded and the carrying amount of the related long-lived asset is correspondingly increased . The amount capitalized at inception is depreciated in the same manner as the related long-lived asset . Over time, the liability is accreted to its estimated future value . Accretion expense is included as part of “Depreciation and amortization” . Any accretion expense not yet approved by the regulator is deferred to a regulatory asset in “Property, plant and equipment” and included in the next depreciation study . Accordingly, changes to the ARO or cost recognition attributable to changes in the factors discussed above, should not impact the results of operations of the Company .
Some transmission and distribution assets may have conditional AROs, which are required to be estimated and recorded as a liability . A conditional ARO refers to a legal obligation to perform an asset retirement activity in which the timing and/or method of settlement are conditional on a future event that may or may not be within the control of the entity . Management monitors these obligations and a liability is recognized at fair value when an amount can be determined .
The key assumptions used to determine the ARO are as follows:
Estimated undiscounted Expected Credit-adjusted future obligation (millions settlement date Asset risk-free rate of Canadian dollars) (number of years)
2013 2012 2013 2012 2013 2012
Thermal 5.1–5.3% 5.1–5.3% $ 142.8 $ 142.8 19–30 20–31Hydro 5.1–5.3% 5.1–5.3% 127.6 127.6 18–48 19–49Wind 5.1–5.2% 5.1–5.2% 27.4 27.4 15–22 16–23Combustion turbines 5.1–5.3% 5.1–5.3% 8.3 8.4 3–32 4–33Transmission and distribution 4.3–5.8% 4.3–5.8% 15.2 16.7 1–12 1–13Pipeline 3.50% 3.50% 22.8 24.4 36 37
$ 344.1 $ 347.3
As at December 31, 2013, the AROs recorded on the balance sheet were $98 .6 million (2012 — $95 .0 million) . The Company estimates the undiscounted amount of cash flow required to settle the obligations is approximately $344 .1 million, which will be incurred between 2014 and 2062 . The majority of these costs will be incurred between 2032 and 2047 .
CAPITALIZED OVERHEAD
As required by their respective regulators, NSPI, Bangor Hydro, MPS, GBPC, BLPC and DOMLEC capitalize overhead costs that are not directly attributable to specific utility assets, but to the overall capital expenditure program . The methodology for the calculation of capitalized overhead is approved by their respective regulator . For the year ended December 31, 2013, $59 .8 million (2012 — $52 .4 million) of overhead costs were capitalized to capital assets . Any change in the methodology for the calculation and allocation of overhead costs could have a material impact on the amounts recognized as expenses versus assets .
FINANCIAL INSTRUMENTS
Emera is required to determine the fair value of all derivatives except those which qualify for the normal purchase, normal sale exception . Fair value is the price that would be received for the sale of an asset or paid to transfer a liability in an orderly arms-length transaction between market participants at the measurement date . Fair value measurements are required to reflect the assumptions that market participants would use in pricing an asset or liability based on the best available information, including the risks inherent in a particular valuation technique, such as a pricing model, and the risks inherent in the inputs to the model .

72 Emera Inc . — Annual Report 2013
LEVEL DETERMINATIONS AND CLASSIFICATIONS
Emera uses the Level 1, 2 and 3 classifications in the fair value hierarchy . The fair value measurement of a financial instrument is included in only one of the three levels and is based on the lowest level input significant to the derivation of the fair value . Fair values are determined, directly or indirectly, using inputs that are unobservable for the asset or liability . In limited circumstances, Emera may enter into commodity transactions involving non-standard features where market observable data is not available, or contracts with terms that extend beyond five years .
CHANGES IN ACCOUNTING POLICIES AND PRACTICES
In Q1 2013, Emera adopted Accounting Standards Update (“ASU”) Number (“No .”) 2013-02 . This ASU did not change the current requirements for reporting net income or other comprehensive income . The amendments require an entity to present, either parenthetically on the face of the financial statements or in the notes, significant amounts reclassified from each component of accumulated other comprehensive income and the income statement line items affected by the reclassification . An entity would not show the income statement line item affected for certain components, which are not required to be reclassified in their entirety to net income . New disclosures have been added to reflect this change in presentation; however, the amendment had no effect on the financial results of the Company .
In Q1 2013, Emera adopted ASU No . 2012-04 . This ASU amended Accounting Standard Codification (“ASC”) 820 for technical corrections and improvements and conforming amendments related to fair value measurements (ASU 820) . The amendments represented clarifications and corrections to unintended application of guidance and minor improvements to the ASCs and had no effect on the financial results of the Company .
In Q1 2013, Emera adopted ASU No . 2011-11 . This ASU amended ASC 815 Derivatives and Hedging, requiring companies to disclose gross and net information for derivative instruments . The Company is currently in compliance with this standard and therefore, the adoption of this standard did not have any impact on the financial statements .
Future Accounting Pronouncements
Income Taxes, ASU No. 2013-11In July 2013, the Financial Accounting Standards Board (“FASB”) issued an ASU amending guidance on the financial statement presentation of an unrecognized tax benefit when a net operating loss carryforward, similar tax loss, or tax credit carryforward exists . The purpose of this amendment is to reduce diversity in practice by providing guidance on the presentation of unrecognized tax benefits and to better reflect the manner in which an entity would settle at the reporting date any additional income taxes that would result from the disallowance of a tax position when net operating loss carryforwards, similar tax losses, or tax credit carryforwards exist . ASU No . 2013-11 is effective for fiscal years, and interim periods within those years, beginning on or after December 15, 2013 . The Company is currently in compliance with this standard and therefore, does not expect the adoption of this standard will have any impact on the financial statements .

Management’s Discussion and Analysis
Emera Inc . — Annual Report 2013 73
SUMMARY OF QUARTERLY RESULTS
Q4 Q3 Q2 Q1 Q4 Q3 Q2 Q1 For the quarter ended 2013 2013 2013 2013 2012 2012 2012 2012
millions of Canadian dollars (except per share amounts)
Operating revenues $ 594.4 $ 491.2 $ 506.5 $ 638.1 $ 512.9 $ 476.4$ 501.3 $ 568.0
Net income attributable to common shareholders 21.0 28.8 44.9 122.8 42.7 44.7 53.2 80.2
Earnings per common share — basic 0.16 0.22 0.34 0.93 0.34 0.36 0.43 0.65
Earnings per common share — diluted 0.16 0.22 0.34 0.92 0.34 0.36 0.43 0.64
Adjusted earnings per common share — basic 0.47 0.29 0.32 0.88 0.46 0.35 0.37 0.66
Quarterly operating revenues and net income attributable to common shareholders are affected by seasonality . The first quarter is generally the strongest because a significant portion of the Company’s operations are located in northeast North America, where winter is the peak electricity season . As the energy industry is seasonal in nature for companies like Emera, seasonal and unseasonal weather patterns, as well as the number and severity of storms, can affect the demand for energy and the cost of service . Quarterly results could be affected by items outlined in the Significant Items section and mark-to-market adjustments .

74 Emera Inc . — Annual Report 2013
OPERATING STATISTICS
Five-Year Summary
Year ended December 31 2013 2012 2011 2010 2009
Electric energy sales (GWh) Residential 5,623.6 5,372.2 5,458.9 4,738.2 4,819.2 Commercial 7,847.7 6,174.7 6,562.3 5,584.4 3,694.4 Industrial 3,067.4 2,678.7 3,988.5 4,268.2 3,985.3 Other 357.9 371.2 347.0 620.1 1,166.9
Total electric energy sales 16,896.6 14,596.8 16,356.7 15,210.9 13,665.8
Sources of energy (GWh) Thermal – coal 7,098.0 6,223.0 6,848.0 7,838.7 8,177.3 – oil 1,417.5 1,355.1 1,070.8 36.1 306.9 – natural gas 3,685.9 3,726.0 4,304.7 4,183.0 2,141.4 Biomass 167.0 — — — — Hydro 1,214.5 828.0 1,414.5 991.5 1,063.4 Wind 739.9 256.0 247.0 25.3 1.8Purchases 3,528.0 3,210.2 3,518.3 2,987.4 2,846.1
Total generation and purchases 17,850.8 15,598.3 17,403.3 16,062.0 14,536.9Losses and internal use 954.2 1,001.5 1,046.6 851.1 871.1
Total electric energy sold 16,896.6 14,596.8 16,356.7 15,210.9 13,665.8
Electric customers Residential 738,444 702,738 696,970 588,935 539,333 Commercial 83,622 79,613 79,817 61,620 51,768 Industrial 2,711 2,521 2,517 2,558 2,543 Other 10,510 20,230 10,446 9,422 9,155
Total electric customers 835,287 805,102 789,750 662,535 602,799
CapacityGenerating nameplate capacity (MW) Coal-fired 1,243.0 1,243.0 1,243.0 1,243.0 1,243.0 Dual-fired 250.0 350.0 350.0 350.0 350.0 Gas turbines 1,896.5 746.5 666.0 599.0 564.0 Biomass 90.0 — — — — Hydroelectric 1,001.6 395.0 395.0 395.0 395.0 Wind turbines 500.5 82.0 82.0 76.0 1.0 Diesel 244.6 231.5 173.0 61.0 15.0 Steam 40.0 40.0 47.0 51.0 —Independent power producers 308.0 300.0 264.0 347.0 172.0
Total capacity 5,574.2 3,388.0 3,220.0 3,122.0 2,740.0
Total number of employees 3,558 3,374 3,458 2,972 2,350
Km of transmission lines 7,224 6,803 6,800 6,700 6,300
Km of distribution lines 44,741 39,590 41,600 40,900 33,800

Management’s Discussion and Analysis
Emera Inc . — Annual Report 2013 75
Regulated Electric
Peak Energy Total Rate Allowable Allowable Employee demand sales assets base Income ROE ROE Customers count (MW) (GWh) (billions) (billions) (millions) 2013 2012
NSPI 500,718 1,735 2,033 10,467 4.2 3.7 $ 126.0 8.75-9.25%9.1-9.5%Bangor Hydro 119,072 311 276 1,535 0.9 0.5 33.2 11.2% 11.3%MPS 36,238 102 116 503 0.1 0.1 5.2 10.0% 9.9%BLPC 125,012 460 157 914 0.3 0.2 22.6 10.0% 10.0%GBPC 18,986 156 60 314 0.3 0.2 3.0 10.0% 10.0% (1)
DOMLEC 35,245 198 17 66 0.1 — 12.2 15.0% 15.0%
(1) GBPC is return on rate base .

76 Emera Inc . — Annual Report 2013
FOUR-YEAR FINANCIAL SUMMARY
For the year ended December 31 (millions of Canadian dollars) 2013 2012 2011 2010
Consolidated Statements of IncomeOperating revenues $2,230.2 $2,058.6 $2,064.4 1,606.1
Operating expenses Regulated fuel for generation and purchased power 868.4 810.5 866.4 634.6 Regulated fuel and fixed cost adjustments (40.8) 10.0 (8.5) (99.0) Non-regulated fuel for generation and purchased power 89.8 44.5 73.9 83.9 Non-regulated direct costs 52.4 56.6 60.9 62.3 Operating, maintenance and general 505.8 462.9 453.3 349.4 Provincial, state and municipal taxes 49.7 49.4 49.2 47.4 Depreciation and amortization 297.8 278.2 251.7 215.3
Income from operations 407.1 346.5 317.5 312.2
Income from equity investments and Other income (expenses), net 63.7 53.8 77.4 34.1Interest expense, net 172.2 167.1 159.4 148.8
Income before provision for income taxes 298.6 233.2 235.5 197.5Income tax expense (recovery) 43.3 (12.4) (23.9) (1.8)
Net income 255.3 245.6 259.4 199.3Non-controlling interest in subsidiaries 18.5 13.7 11.7 5.6
Net income of Emera Incorporated 236.8 231.9 247.7 193.7Preferred stock dividends 19.3 11.1 6.6 3.0
Net income attributable to common shareholders 217.5 220.8 241.1 190.7
Balance Sheets InformationCurrent assets 1,161.3 940.2 993.3 840.1Property, plant and equipment, net of accumulated depreciation 5,327.7 4,491.1 4,294.4 3,742.6Other assets Income taxes receivable 27.8 — — — Deferred income taxes 67.8 28.9 33.1 31.1 Derivative instruments 61.6 23.4 39.6 36.0 Regulatory assets 557.8 376.4 312.2 354.9 Net investment in direct financing lease 487.2 490.0 492.0 491.5 Investments subject to significant influence 739.2 536.6 219.8 243.2 Available-for-sale investments 74.2 141.8 54.6 0.8 Goodwill 206.5 193.5 197.7 167.4 Intangibles, net of accumulated amortization 118.4 114.2 100.7 98.7 Due from related party 2.5 151.7 2.8 2.8 Other 44.8 48.6 183.4 69.9
Total assets 8,876.8 7,536.4 6,923.6 6,079.0

Management’s Discussion and Analysis
Emera Inc . — Annual Report 2013 77
FOUR-YEAR FINANCIAL SUMMARY (continued)
For the year ended December 31 (millions of Canadian dollars) 2013 2012 2011 2010
Current liabilities 1,529.9 951.9 801.7 605.9Long-term liabilities Long-term debt 3,363.7 3,257.4 3,273.5 3,115.3 Deferred income taxes 547.7 312.1 228.6 168.5 Derivative instruments 27.0 22.4 38.7 28.9 Regulatory liabilities 119.5 92.5 107.1 65.2 Asset retirement obligations 98.6 95.0 99.9 141.8 Pension and post-retirement liabilities 256.4 506.4 530.8 400.0 Other long-term liabilities 36.8 20.9 19.6 22.0Equity Common stock 1,703.0 1,643.7 1,385.0 1,137.8 Cumulative preferred stock 514.0 391.6 146.7 146.7 Contributed surplus 4.1 2.8 3.3 3.2 Accumulated other comprehensive loss (430.1) (775.8) (671.7) (564.2) Retained earnings 817.2 788.1 735.9 653.5
Total Emera Incorporated equity 2,608.2 2,050.4 1,599.2 1,377.0 Non-controlling interest in subsidiaries 289.0 227.4 224.5 154.4
Total equity 2,897.2 2,277.8 1,823.7 1,531.4
Total liabilities and equity 8,876.8 7,536.4 6,923.6 6,079.0
Statements of Cash Flow Information Cash provided by operating activities 564.2 397.6 399.5 419.2 Cash used in investing activities (921.6) (919.4) (660.8) (886.0) Cash provided by financing activities 362.1 534.2 331.4 454.6Financial ratios ($ per share) Earnings per share $ 1.64 $ 1.77 $ 1.99 1.67

78 Emera Inc . — Annual Report 2013
Management’s Responsibility for Financial ReportingThe accompanying consolidated financial statements of Emera Incorporated and the information in this annual report are the responsibility of management and have been approved by the Board of Directors (“Board”) .
The consolidated financial statements have been prepared by management in accordance with United States Generally Accepted Accounting Principles . When alternative accounting methods exist, management has chosen those it deems most appropriate in the circumstances . In preparation of these consolidated financial statements, estimates are sometimes necessary when transactions affecting the current accounting period cannot be finalized with certainty until future periods . Management represents that such estimates, which have been properly reflected in the accompanying consolidated financial statements, are based on careful judgements and are within reasonable limits of materiality . Management has determined such amounts on a reasonable basis in order to ensure that the consolidated financial statements are presented fairly in all material respects . Management has prepared the financial information presented elsewhere in the annual report and has ensured that it is consistent with that in the consolidated financial statements .
Emera Incorporated maintains effective systems of internal accounting and administrative controls, consistent with reasonable cost . Such systems are designed to provide reasonable assurance that the financial information is relevant, reliable and accurate, and that Emera Incorporated’s assets are appropriately accounted for and adequately safeguarded .
The Board is responsible for ensuring that management fulfils its responsibilities for financial reporting and is ultimately responsible for reviewing and approving the consolidated financial statements . The Board carries out this responsibility principally through its Audit Committee .
The Audit Committee is appointed by the Board, and its members are directors who are not officers or employees of Emera Incorporated . The Audit Committee meets periodically with management, as well as with the internal auditors and with the external auditors, to discuss internal controls over the financial reporting process, auditing matters and financial reporting issues, to satisfy itself that each party is properly discharging its responsibilities, and to review the annual report, the consolidated financial statements and the external auditors’ report . The Audit Committee reports its findings to the Board for consideration when approving the consolidated financial statements for issuance to the shareholders . The Audit Committee also considers, for review by the Board and approval by the shareholders, the appointment of the external auditors .
The consolidated financial statements have been audited by Ernst & Young LLP, the external auditors, in accordance with Canadian Generally Accepted Auditing Standards . Ernst & Young LLP has full and free access to the Audit Committee .
February 10, 2014
Christopher Huskilson Scott BalfourPresident and Chief Executive Officer Chief Financial Officer
MANAGEMENT REPORT

Emera Inc . — Annual Report 2013 79
To the Shareholders of Emera IncorporatedWe have audited the accompanying consolidated financial statements of Emera Incorporated, which comprise the consolidated balance sheets as at December 31, 2013 and 2012, and the consolidated statements of income, comprehensive income, cash flows and changes in equity for the years then ended, and a summary of significant accounting policies and other explanatory information .
Management’s Responsibility for the Consolidated Financial StatementsManagement is responsible for the preparation and fair presentation of these consolidated financial statements in accordance with United States generally accepted accounting principles, and for such internal control as management determines is necessary to enable the preparation of consolidated financial statements that are free from material misstatement, whether due to fraud or error .
Auditors’ ResponsibilityOur responsibility is to express an opinion on these consolidated financial statements based on our audits . We conducted our audits in accordance with Canadian generally accepted auditing standards . Those standards require that we comply with ethical requirements and plan and perform the audit to obtain reasonable assurance about whether the consolidated financial statements are free from material misstatement .
An audit involves performing procedures to obtain audit evidence about the amounts and disclosures in the consolidated financial statements . The procedures selected depend on the auditors’ judgment, including the assessment of the risks of material misstatement of the consolidated financial statements, whether due to fraud or error . In making those risk assessments, the auditors consider internal control relevant to the entity’s preparation and fair presentation of the consolidated financial statements in order to design audit procedures that are appropriate in the circumstances, but not for the purpose of expressing an opinion on the effectiveness of the entity’s internal control . An audit also includes evaluating the appropriateness of accounting policies used and the reasonableness of accounting estimates made by management, as well as evaluating the overall presentation of the consolidated financial statements .
We believe that the audit evidence we have obtained in our audits is sufficient and appropriate to provide a basis for our audit opinion .
OpinionIn our opinion, the consolidated financial statements present fairly, in all material respects, the financial position of Emera Incorporated as at December 31, 2013 and 2012, and its financial performance and its cash flows for the years then ended in accordance with United States generally accepted accounting principles .
Halifax, Canada February 10, 2014
Ernst & Young LLPChartered accountants
INDEPENDENT AUDITORS’ REPORT

80 Emera Inc . — Annual Report 2013
For the Year ended December 31
millions of Canadian dollars (except per share amounts) 2013 2012
Operating revenues Regulated $2,040.8 $1,912.7 Non-regulated 189.4 145.9
Total operating revenues 2,230.2 2,058.6
Operating expenses Regulated fuel for generation and purchased power 868.4 810.5 Regulated fuel adjustment mechanism and fixed cost deferrals (note 5) (40.8) 10.0 Non-regulated fuel for generation and purchased power 89.8 44.5 Non-regulated direct costs 52.4 56.6 Operating, maintenance and general 505.8 462.9 Provincial, state, and municipal taxes 49.7 49.4 Depreciation and amortization 297.8 278.2
Total operating expenses 1,823.1 1,712.1
Income from operations 407.1 346.5Income from equity investments (note 6) 38.1 13.2Other income (expenses), net (note 7) 25.6 40.6Interest expense, net (note 8) 172.2 167.1
Income before provision for income taxes 298.6 233.2Income tax expense (recovery) (note 9) 43.3 (12.4)
Net income 255.3 245.6Non-controlling interest in subsidiaries 18.5 13.7
Net income of Emera Incorporated 236.8 231.9Preferred stock dividends 19.3 11.1
Net income attributable to common shareholders $ 217.5 $ 220.8
Weighted average shares of common stock outstanding (in millions) Basic 132.6 124.9 Diluted 132.9 125.3
Earnings per common share (note 10) Basic $ 1.64 $ 1.77 Diluted $ 1.64 $ 1.76
Dividends per common share declared $ 1.4125 $ 1.3625
The accompanying notes are an integral part of these consolidated financial statements .
CONSOLIDATED STATEMENTS OF INCOME
Emera Incorporated

Emera Inc . — Annual Report 2013 81
As at December 31
millions of Canadian dollars (except per share amounts) 2013 2012
Net income $ 255.3 $ 245.6
Other comprehensive income (loss), net of taxForeign currency translation adjustment (1) 108.7 (35.7)Cash flow hedges Net derivative gains (losses) (2) 1.8 (1.6) Less: reclassification adjustment for losses (gains) included in income (3) 1.7 4.2 Less: reclassification adjustment for losses (gains) recognized in property, plant and equipment (4) — 0.6 Net effects of cash flow hedges 3.5 3.2Unrealized gains on available-for-sale investment Unrealized gain (loss) arising during the period (5) 4.6 13.6 Less: reclassification adjustment for (gains) recognized in income (6) (13.4) — Net unrealized holding gains (losses) (8.8) 13.6Net change in unrecognized pension and post-retirement benefit obligation (7) 250.7 (86.7)Other comprehensive income (loss) (8) (note 11) 354.1 (105.6)Comprehensive income (loss) 609.4 140.0
Less: Comprehensive income (loss) attributable to non-controlling interest 26.8 12.2 Preferred stock dividends 19.3 11.1
Comprehensive income (loss) attributable to common shareholders $ 563.3 $ 116.7
The accompanying notes are an integral part of these consolidated financial statements .
(1) Net of tax expense of $1 .0 million (2012 — $0 .4 million tax recovery) for the year ended December 31, 2013 .(2) Net of tax expense of $5 .3 million (2012 — $2 .8 million tax recovery) for the year ended December 31, 2013 .(3) Net of tax expense of $2 .3 million (2012 — $4 .6 million tax expense) for the year ended December 31, 2013 .(4) Net of tax expense/recovery of nil (2012 — $0 .1 million tax expense) for the year ended December 31, 2013 .(5) Net of tax expense/recovery of nil (2012 — $2 .5 million tax expense) for the year ended December 31, 2013 .(6) Net of tax recovery of $2 .5 million (2012 — nil tax expense/recovery) for the year ended December 31, 2013 .(7) Net of tax expense of $17 .2 million (2012 — $2 .2 million tax recovery) for the year ended December 31, 2013 .(8) Net of tax expense of $23 .3 million (2012 — $1 .8 million tax expense) for the year ended December 31, 2013 .
CONSOLIDATED STATEMENTS OF COMPREHENSIVE INCOME
Emera Incorporated

82 Emera Inc . — Annual Report 2013
As at December 31
millions of Canadian dollars 2013 2012
AssetsCurrent assets Cash and cash equivalents $ 100.8 $ 86.7 Restricted cash (note 12) 21.6 17.1 Receivables, net (note 13) 581.8 449.4 Income taxes receivable 1.7 54.9 Inventory (note 14) 245.8 177.6 Deferred income taxes (note 9) 15.8 14.9 Derivative instruments (notes 15 and 16) 49.3 24.1 Regulatory assets (notes 5 and 17) 58.3 97.7 Prepaid expenses 23.7 13.3 Other current assets (note 18) 62.5 4.5
Total current assets 1,161.3 940.2
Property, plant and equipment, net of accumulated depreciation of $3,183 .1 and $2,952 .1, respectively (note 19) 5,327.7 4,491.1Other assets Income tax receivable 27.8 — Deferred income taxes (note 9) 67.8 28.9 Derivative instruments (notes 15 and 16) 61.6 23.4 Regulatory assets (notes 5 and 17) 557.8 376.4 Net investment in direct financing lease (note 20) 487.2 490.0 Investments subject to significant influence (note 6) 739.2 536.6 Available-for-sale investments (note 21) 74.2 141.8 Goodwill (note 22) 206.5 193.5 Intangibles, net of accumulated amortization of $77 .8 and $67 .2, respectively 118.4 114.2 Due from related parties (note 23) 2.5 151.7 Other 44.8 48.6
Total other assets 2,387.8 2,105.1
Total assets $8,876.8 $7,536.4
The accompanying notes are an integral part of these condensed consolidated financial statements .
CONSOLIDATED BALANCE SHEETS
Emera Incorporated

Emera Inc . — Annual Report 2013 83
As at December 31
millions of Canadian dollars 2013 2012
Liabilities and EquityCurrent liabilities Short-term debt (note 24) $ 438.0 $ 20.4 Current portion of long-term debt (note 25) 328.3 437.1 Accounts payable 385.1 294.8 Income taxes payable 32.7 2.1 Deferred income taxes (note 9) 0.9 3.5 Derivative instruments (notes 15 and 16) 160.0 35.1 Regulatory liabilities (note 17) 31.7 18.2 Pension and post-retirement liabilities (note 26) 9.4 9.8 Other current liabilities (note 27) 143.8 130.9
Total current liabilities 1,529.9 951.9
Long-term liabilities Long-term debt (note 25) 3,363.7 3,257.4 Deferred income taxes (note 9) 547.7 312.1 Derivative instruments (notes 15 and 16) 27.0 22.4 Regulatory liabilities (note 17) 119.5 92.5 Asset retirement obligations (note 28) 98.6 95.0 Pension and post-retirement liabilities (note 26) 256.4 506.4 Other long-term liabilities 36.8 20.9
Total long-term liabilities 4,449.7 4,306.7
Commitments and contingencies (note 29)Equity Common stock, no par value, unlimited shares authorized, 132 .89 million and 130 .98 million shares issued and outstanding, respectively (note 30) 1,703.0 1,643.7 Cumulative preferred stock, Series A, C and E, par value $25 per share; unlimited shares authorized, 6 million, 10 million and 5 million shares issued and outstanding, respectively (note 31) 514.0 391.6 Contributed surplus 4.1 2.8 Accumulated other comprehensive loss (note 11) (430.1) (775.8) Retained earnings 817.2 788.1
Total Emera Incorporated equity 2,608.2 2,050.4 Non-controlling interest in subsidiaries (note 32) 289.0 227.4
Total equity 2,897.2 2,277.8
Total liabilities and equity $8,876.8 $7,536.4
The accompanying notes are an integral part of these condensed consolidated financial statements .
Approved on behalf of the Board of Directors
John T. McLennan Christopher G. HuskilsonChairman President and Chief Executive Officer
CONSOLIDATED BALANCE SHEETS (continued)
Emera Incorporated

84 Emera Inc . — Annual Report 2013
For the Year ended December 31
millions of Canadian dollars 2013 2012
Operating activitiesNet income $ 255.3 $ 245.6Adjustments to reconcile net income to net cash provided by operating activities: Depreciation and amortization 313.6 294.4 Income from equity investments, net of dividends 14.0 15.2 Allowance for equity funds used during construction (10.2) (17.2) Deferred income taxes, net 9.7 13.0 Net change in pension and post-retirement obligations 10.4 (101.3) Regulated fuel adjustment mechanism and fixed cost deferrals (50.0) 3.9 Net change in fair value of derivative instruments 100.2 (5.2) Net change in regulatory assets and liabilities (2.6) (7.4) Other operating activities, net (62.6) (29.8)Changes in non-cash working capital: Receivables, net (109.3) 10.7 Income taxes receivable 26.1 (13.4) Inventory (26.9) 20.4 Prepaid expenses (6.7) 1.7 Other current assets (4.1) (2.6) Accounts payable 68.9 (35.0) Income taxes payable 29.4 0.2 Other current liabilities 9.0 4.4
Net cash provided by operating activities 564.2 397.6
Investing activities Additions to property, plant and equipment (317.2) (433.6) Acquisition, net of cash acquired (note 35) (613.6) — Decrease in restricted cash (2.9) (3.3) Net purchase of investments subject to significant influence, inclusive of acquisition costs (note 6) (113.4) (173.0) Allowance for borrowed funds used during construction (4.2) (12.5) Retirement spending, net of salvage (13.0) (10.4) Purchase of subscription receipts — (105.0) Loan to related party (note 23) 157.4 (152.9) Other investing activities (14.7) (28.7)
Net cash used in investing activities $ (921.6) $ (919.4)
CONSOLIDATED STATEMENTS OF CASH FLOWS
Emera Incorporated

Emera Inc . — Annual Report 2013 85
For the Year ended December 31
millions of Canadian dollars 2013 2012
Financing activities Change in short-term debt, net $ 415.7 $ (96.5) Retirement of long-term debt (369.3) (30.3) Proceeds from long-term debt 312.2 384.9 Net borrowings (repayments) under committed credit facilities 6.5 (15.1) Issuance of common stock, net of issuance costs (note 30) 59.3 257.6 Issuance of preferred stock, net of issuance costs (note 31) 122.4 242.7 Dividends on common stock (185.6) (168.4) Dividends on preferred stock (19.3) (11.1) Dividends paid by subsidiaries to non-controlling interest (10.9) (8.8) Other financing activities 31.1 (20.8)
Net cash provided by financing activities 362.1 534.2
Effect of exchange rate changes on cash and cash equivalents 9.4 (2.6)
Net increase in cash and cash equivalents 14.1 9.8Cash and cash equivalents, beginning of period 86.7 76.9
Cash and cash equivalents, end of period $ 100.8 $ 86.7
Cash and cash equivalents consists of:Cash $ 56.8 $ 34.6Short-term investments 44.0 52.1
Cash and cash equivalents $ 100.8 $ 86.7
Supplemental disclosure of cash paid (received):Interest $ 188.4 $ 180.6
Income and capital taxes $ (23.1) $ (11.7)
The accompanying notes are an integral part of these consolidated financial statements .
CONSOLIDATED STATEMENTS OF CASH FLOWS (continued)
Emera Incorporated

86 Emera Inc . — Annual Report 2013
Accumulated other comp- Non- Common Preferred Contributed rehensive Retained controlling Total stock stock surplus loss (“AOCL”) earnings interest equity
millions of Canadian dollars
2013 Balance, December 31, 2012 $1,643.7 $ 391.6 $ 2.8 $ (775.8)$ 788.1$ 227.4 $2,277.8Net income of Emera Incorporated — — — — 236.8 18.5 255.3Other comprehensive income (loss), net of tax — — — 345.7 — 8.3 354.0Acquisition of DOMLEC — — — — — 12.3 12.3Cash dividends declared on preferred stock ($1 .1000/share) — — — — (19.3) — (19.3)Cash dividends declared on common stock ($1 .4125/share) — — — — (186.0) — (186.0)Dividends paid by subsidiaries to non-controlling interest — — — — — (1.6) (1.6)Issuance of preferred shares, net of issuance costs — 122.4 — — — — 122.4Issuance of preferred shares of GBPC, net of issuance costs — — — — — 33.5 33.5Common stock issued under purchase plan 57.1 — — — — — 57.1Senior management stock options exercised 1.4 — (0.1) — — — 1.3Stock option expense — — 1.0 — — — 1.0Other stock-based compensation 0.8 — — — . — 0.8Preferred dividends paid by subsidiaries to non-controlling interest — — — — — (9.3) (9.3)Disposition of non-controlling interest of significant influence investment — — — — (2.2) — (2.2)Other — — 0.4 — (0.2) (0.1) 0.1
Balance, December 31, 2013 $1,703.0 $ 514.0 $ 4.1 $ (430.1)$ 817.2$ 289.0 $2,897.2
CONSOLIDATED STATEMENTS OF CHANGES IN EQUITY
Emera Incorporated

Emera Inc . — Annual Report 2013 87
CONSOLIDATED STATEMENTS OF CHANGES IN EQUITY (continued)
Emera Incorporated
Accumulated other comp- Non- Common Preferred Contributed rehensive Retained controlling Total stock stock surplus loss (“AOCL”) earnings interest equity
millions of Canadian dollars
2012 Balance, December 31, 2011 $1,385.0 $ 146.7 $ 3.3 $ (671.7)$ 735.9$ 224.5 $1,823.7Net income of Emera Incorporated — — — — 231.9 13.7 245.6Other comprehensive income (loss), net of tax — — — (104.1) — (1.5) (105.6)Issuance of common stock, net of issuance costs 193.2 — — — — — 193.2Cash dividends declared on preferred stock ($1 .1000/share) — — — — (11.1) — (11.1)Cash dividends declared on common stock ($1 .3625/share) — — — — (168.6) — (168.6)Dividends paid by subsidiaries to non-controlling interest — — — — — (1.4) (1.4)Issuance of preferred shares, net of issuance costs — 244.9 — — — — 244.9Common stock issued under purchase plan 49.7 — — — — — 49.7Senior management stock options exercised 15.0 — (1.1) — — — 13.9Stock option expense — — 0.6 — — — 0.6Other stock-based compensation 0.8 — — — — — 0.8Preferred dividends paid by subsidiaries to non-controlling interest — — — — — (8.0) (8.0)Other — — — — — 0.1 0.1
Balance, December 31, 2012 $1,643.7 $ 391.6 $ 2.8 $ (775.8)$ 788.1$ 227.4 $2,277.8
The accompanying notes are an integral part of these consolidated financial statements .

88 Emera Inc . — Annual Report 2013
1. Summary of Significant Accounting Policies
The significant accounting policies for both the regulated and non-regulated operations of Emera Incorporated are as follows:
A. NATURE OF OPERATIONS
Emera Incorporated is an energy and services company which invests in electricity generation, transmission and distribution, gas transmission and utility energy services .
Emera’s primary rate-regulated subsidiaries and investments at December 31, 2013 included the following: • Nova Scotia Power Inc . (“NSPI”), a fully integrated electric utility and the primary electricity supplier in Nova Scotia, serving
approximately 501,000 customers; • Bangor Hydro Electric Company (“Bangor Hydro”) and Maine Public Service Company (“MPS”), which together provide
transmission and distribution services to approximately 155,000 customers in Maine; • an 80 .3 per cent interest in Light & Power Holdings Ltd . (“LPH”), the parent of The Barbados Light & Power Company Limited
(“BLPC”), a vertically integrated utility and sole provider of electricity on the island of Barbados, serving approximately 125,000 customers; a 41 .7 per cent indirect interest, through LPH, in Dominica Electricity Services Ltd . (“DOMLEC”), an integrated utility on the island of Dominica, serving approximately 35,000 customers; and a 15 .3 per cent indirect interest, through LPH, in St . Lucia Electricity Services Limited (“LUCELEC”), a vertically integrated regulated electric utility in St . Lucia;
• a 50 .0 per cent direct and 30 .4 per cent indirect interest (through ICD Utilities Limited (“ICDU”)) in Grand Bahama Power Company Limited (“GBPC”), a vertically integrated utility and sole provider of electricity on Grand Bahama Island, serving approximately 19,000 customers; and
• Emera Brunswick Pipeline Company Limited (“Brunswick Pipeline”), a 145-kilometre pipeline carrying re-gasified liquefied natural gas from Saint John, New Brunswick to the United States border under a 25-year firm service agreement with Repsol Energy Canada (“REC”) .
• Emera Newfoundland & Labrador Holdings Inc . (“ENL”), focused on two transmission investments related to the proposed 824 MW hydroelectric generating facility at Muskrat Falls in Labrador, scheduled to be in service in 2017 . ENL’s two investments are: • 100 per cent interest in NSP Maritime Link Inc . (“NSPML”), which is developing the Maritime Link Project, a $1 .56 billion
transmission project, including two 170-kilometre sub-sea cables, between the island of Newfoundland and Nova Scotia; • 34 .9 per cent interest in Labrador-Island Link Limited Partnership, (“LIL”) a $2 .6 billion electricity transmission project in
Newfoundland and Labrador to enable the transmission of the Muskrat Falls energy between Labrador and the island of Newfoundland;
Emera Incorporated and its subsidiaries (“Emera” or the “Company”) also own investments in other energy-related companies, including: • Emera Energy Inc . (“Emera Energy”), includes:
• Emera Energy Services, a physical energy business that purchases and sells natural gas and electricity and provides related energy asset management services;
• Bayside Power Limited Partnership (“Bayside Power”), a 290 megawatt (“MW”) electricity generating facility in Saint John, New Brunswick;
• Brooklyn Power Corporation (“Brooklyn Energy”), a 30 MW biomass co-generation merchant electricity facility in Brooklyn, Nova Scotia . Brooklyn Energy has a long-term power purchase agreement with NSPI;
• Bridgeport Power, Tiverton Power and Rumford Power (“EE New England Gas Generation”), a three-facility, 1,050 MW combined-cycle gas-fired electricity generating investment in northeastern United States;
• Emera Utility Services Inc . and Emera Utility Services (Bahamas) Limited (“Emera Utility Services”), two utility services contractors primarily operating in Atlantic Canada and The Bahamas;
• a 49 .0 per cent interest in Northeast Wind Partners II, LLC (“NWP”), a 420 MW portfolio of wind energy projects in the northeastern United States;
• a 24 .3 per cent investment in Algonquin Power & Utilities Corp . (“APUC”), a public company traded on the Toronto Stock Exchange under the symbol “AQN”;
• a 50 .0 per cent joint venture interest in Bear Swamp Power Company LLC (“Bear Swamp”), a 600 MW pumped storage hydroelectric facility in northern Massachusetts;
• a 12 .9 per cent interest in Maritimes & Northeast Pipeline (“M&NP”), a 1,400-kilometre pipeline which transports natural gas from offshore Nova Scotia to markets in Maritime Canada and the northeastern United States;
• a 37 .4 per cent investment in Atlantic Hydrogen Inc . (“AHI”); • a 3 .3 per cent investment in OpenHydro Group Ltd . (“OpenHydro”); • and other investments .
NOTES TO THE CONSOLIDATED FINANCIAL STATEMENTS
As at December 31, 2013 and 2012

Notes to the Consolidated Financial Statements
Emera Inc . — Annual Report 2013 89
B. BASIS OF PRESENTATION
These consolidated financial statements are prepared and presented in accordance with United States Generally Accepted Accounting Principles (“USGAAP”) . In the opinion of management, these consolidated financial statements include all adjustments that are of a recurring nature and necessary to fairly state the financial position of Emera Incorporated .
All dollar amounts are presented in Canadian dollars, unless otherwise indicated .
C. PRINCIPLES OF CONSOLIDATION
The consolidated financial statements of Emera Incorporated include the accounts of Emera Incorporated, its majority-owned subsidiaries, and a variable interest entity where Emera is the primary beneficiary . All significant inter-company balances and inter-company transactions have been eliminated on consolidation except for certain transactions between non-regulated and regulated entities that have not been eliminated because management believes that the elimination of these transactions would understate property, plant and equipment, operating, maintenance and general expenses, or regulated fuel for generation and purchased power .
Where Emera does not control an investment, but has significant influence over operating and financing policies of the investee, the investment is accounted for under the equity method . The cost method of accounting is used for investments where Emera does not have significant influence over the operating and financial policies of the investee .
Emera accounts for its equity earnings in APUC a quarter in arrears to when APUC reports such earnings, as the information is not publicly available at the time of Emera’s public release of its financial results .
D. USE OF MANAGEMENT ESTIMATES
The preparation of consolidated financial statements in accordance with generally accepted accounting principles requires management to make estimates and assumptions that affect the reported amounts of assets and liabilities at the date of the financial statements, and the reported amounts of revenues and expenses during the reporting periods . Management evaluates the Company’s estimates on an ongoing basis based upon historical experience, current conditions and assumptions believed to be reasonable at the time the assumption is made, with any adjustments recognized in income in the year they arise . Significant estimates are included in unbilled revenue, allowance for doubtful accounts, inventory, valuation of derivative instruments, capitalized overhead, depreciation, amortization, regulatory assets and regulatory liabilities (including the determination of the current portion), income taxes (including deferred income taxes), pension and post-retirement benefits, asset retirement obligations (“AROs”), goodwill impairment assessments, valuation of investments and contingencies . Actual results may differ significantly from these estimates .
E. REGULATORY MATTERS
Regulatory accounting applies where rates are established by, or subject to approval by, an independent third-party regulator; are designed to recover the costs of providing the regulated products or services; and it is reasonable to assume rates are set at levels such that the costs can be charged to and collected from customers .
Regulatory assets represent incurred costs that have been deferred because it is probable that they will be recovered through future rates or tolls collected from customers . Management believes that existing regulatory assets are probable of recovery either because the Company received specific approval from the appropriate regulator, or due to regulatory precedent set for similar circumstances . If management no longer considers it probable that an asset will be recovered, the deferred costs are charged to income .
Regulatory liabilities represent obligations to make refunds to customers or to reduce future revenues for previous collections . If management no longer considers it probable that a liability will be settled, the related amount is recognized in income .
For regulatory assets and liabilities that are amortized, the amortization is as approved by the respective regulator .
F. FOREIGN CURRENCY TRANSLATION
Monetary assets and liabilities, denominated in foreign currencies, are converted to Canadian dollars at rates of exchange prevailing at the balance sheet date . The resulting differences between the translation at the original transaction date and the balance sheet date are included in income .
Assets and liabilities of self-sustaining foreign operations are translated using the exchange rates in effect at the balance sheet date and the results of operations at the average rates for the period . The resulting exchange gains and losses on the assets and liabilities are deferred on the balance sheet in AOCL .
90 Emera Inc . — Annual Report 2013
G. REVENUE RECOGNITION
Operating revenues are recognized when electricity is delivered to customers or when products are delivered and services are rendered . Revenues are recognized on an accrual basis and include billed and unbilled revenues . Revenues related to the sale of electricity are recognized at rates approved by the respective regulator and recorded based on meter readings and estimates, which occur on a systematic basis throughout a month . At the end of each month, the electricity delivered to customers, but not billed, is estimated and the corresponding unbilled revenue is recognized . The accuracy of the unbilled revenue estimate is affected by energy demand, weather, line losses and changes in the composition of customer classes .
The Company records the net investment in a lease under the direct finance method, which consists of the sum of the minimum lease payments and residual value net of estimated executory costs and unearned income . The difference between the gross investment and the cost of the leased item for a direct financing lease is recorded as unearned income at the inception of the lease . The unearned income is recognized in income over the life of the lease using a constant rate of interest equal to the internal rate of return on the lease .
Other revenues are recognized when services are performed or goods delivered .
H. RESEARCH AND DEVELOPMENT COSTS
Research and development costs are expensed as incurred .
I. STOCK-BASED COMPENSATION
The Company has several stock-based compensation plans: a common share option plan for senior management; an employee common share purchase plan; a deferred share unit (“DSU”) plan; and a performance share unit (“PSU”) plan . The Company accounts for its plans in accordance with the fair value-based method of accounting for stock-based compensation . Stock-based compensation cost is measured at the grant date, based on the calculated fair value of the award, and is recognized as an expense over the employee’s or director’s requisite service period using the graded vesting method . Stock-based compensation plans recognized as liabilities are measured at fair value and re-measured at fair value at each reporting date with the change in liability recognized as expense .
J. EMPLOYEE BENEFITS
The costs of the Company’s pension and other post-retirement benefit programs for employees are expensed over the periods during which employees render service . The Company recognizes the funded status of its defined-benefit and other post-retirement plans on the balance sheet and recognizes changes in funded status in the year the change occurs . The Company recognizes the unamortized gains and losses and past service costs in AOCL .
K. EARNINGS PER SHARE
Basic earnings per share (“EPS”) is determined by dividing net income attributable to common shareholders by the weighted average number of common shares and DSUs outstanding during the period . Diluted EPS is computed by dividing net income attributable to common shareholders by the weighted average number of common shares and DSUs outstanding during the period, adjusted for the exercise and/or conversion of all potentially dilutive securities . Such dilutive items include Company contributions to the senior management stock option plan and preferred shares of a subsidiary .
L. CASH AND CASH EQUIVALENTS
Cash equivalents consist of highly liquid short-term investments with original maturities of three months or less at acquisition . The short-term investments of $44 .0 million have an effective interest rate of 2 .0 per cent at December 31, 2013 (2012 — $52 .1 million with an effective interest rate of 2 .6 per cent) .
M. RECEIVABLES AND ALLOWANCE FOR DOUBTFUL ACCOUNTS
Customer receivables are recorded at the invoiced amount and do not bear interest . Standard payment terms for electricity sales are approximately 30 days . A late payment fee may be assessed on account balances after the due date .
The Company is exposed to credit risk with respect to amounts receivable from customers . Credit risk assessments are conducted on all new customers and deposits are requested on any high risk accounts . The Company also maintains provisions for potential credit losses, which are assessed on a regular basis .

Notes to the Consolidated Financial Statements
Emera Inc . — Annual Report 2013 91
Management estimates uncollectible accounts receivable after considering historical loss experience, current events and the characteristics of existing accounts . Provisions for losses on receivables are expensed to maintain the allowance at a level considered adequate to cover expected losses . Receivables are written off against the allowance when they are deemed uncollectible .
N. INVENTORY
Inventory, consisting of fuel and materials, is measured at the lower of cost or market . Fuel cost is determined using the weighted average method and material cost is determined using the average costing method . Fuel and materials are charged to inventory when purchased and then expensed or capitalized, as appropriate, using the weighted average cost method for fuel and average costing method for materials .
O. PROPERTY, PLANT AND EQUIPMENT
Property, plant and equipment are recorded at original cost, including allowance for funds used during construction (“AFUDC”) or capitalized interest, net of contributions received in aid of construction .
The cost of additions, including betterments and replacements of units of property, plant and equipment are included in “Property, plant and equipment” . When units of regulated property, plant and equipment are replaced, renewed or retired, their cost plus removal or disposal costs, less salvage proceeds, is charged to accumulated depreciation, with no gain or loss reflected in income . Where a disposition of non-regulated property, plant and equipment occurs, gains and losses are included in income as the dispositions occur .
Normal maintenance projects are expensed as incurred . Planned major maintenance projects that do not increase the overall life of the related assets are expensed . When a cost increases the life or value of the underlying asset, the cost is capitalized .
P. CAPITALIZATION POLICY
The cost of property, plant and equipment represents the original cost of materials, contracted services, direct labour, AFUDC for regulated property or interest for non-regulated property, AROs and overhead attributable to the capital project . Overhead includes corporate costs such as finance, information technology and executive, along with other costs related to support functions, employee benefits, insurance, inventory, and fleet operating and maintenance . Expenditures for project development are capitalized if they are expected to have future economic benefit .
Q. ALLOWANCE FOR FUNDS USED DURING CONSTRUCTION
Allowance for funds used during construction (“AFUDC”) represents the cost of financing regulated construction projects and is capitalized to the cost of property, plant and equipment until the asset is operational . As approved by their respective regulator, NSPI, Bangor Hydro, MPS, NSPML and GBPC include an equity cost component in AFUDC in addition to a charge for borrowed funds . AFUDC is a non-cash item; cash is realized under the rate-making process over the service life of the related property, plant and equipment through future revenues resulting from a higher rate base and recovery of higher depreciation expense . The component of AFUDC attributable to borrowed funds is included as a reduction to “Interest expense, net”, while the equity component is included in “Other income (expenses), net” . AFUDC is calculated using a weighted average cost of capital, as per the method of calculation approved by the respective regulator, and is compounded semi-annually . The annual AFUDC rate consisted of the following:
2013 2012
Debt Equity Debt Equity Total component component Total component component
NSPI (1) 7.70% 4.08% 3.62% 7.97% 4.15% 3.82%Bangor Hydro 8.88% 2.29% 6.59% 8.80% 2.54% 6.26%MPS 8.89% 2.40% 6.49% 8.89% 2.40% 6.49%GBPC 10.00% 4.32% 5.68% 10.00% 4.32% 5.68%ENL 9.00% — 9.00% 9.10% — 9.10%
(1) The AFUDC rate approved by the UARB, effective May 2013, is 7 .68 per cent comprised of a debt portion of 4 .08 per cent and an equity portion of 3 .60 per cent . The AFUDC rate applied for January through April 2013 was 7 .76 per cent comprised of a debt portion of 4 .09 per cent and an equity portion of 3 .67 per cent .

92 Emera Inc . — Annual Report 2013
R. DEPRECIATION
Depreciation is determined by the straight-line method, based on the estimated remaining service lives of the depreciable assets in each category . The service lives of regulated assets are determined based on formal depreciation studies and require the appropriate regulatory approval .
The estimated useful lives, in years, for each major category of property, plant and equipment consist of the following:
Generation 15 to 100Generation — hydro 63 to 131Generation — wind 25Transmission 10 to 65Distribution 11 to 80General plant 5 to 57
S. INTANGIBLE ASSETS
Intangible assets consist primarily of computer software, as well as land rights and naming rights with definite lives . Amortization is determined by the straight-line method, based on the estimated remaining service lives of the depreciable assets in each category . The service lives of regulated assets are determined based on formal depreciation studies and require the appropriate regulatory approval .
The estimated useful lives, in years, for each major category of intangibles with definite lives consist of the following:
Computer software 3 to 10Land rights 50 to 143Naming rights 1 to 24
The estimated aggregate amortization for each of the five succeeding fiscal years is as follows:
millions of Canadian dollars 2014 2015 2016 2017 2018
Computer software 6.9 6.1 6.2 5.2 4.8Land rights 1.4 1.4 1.4 1.4 1.4Naming rights 0.7 0.6 0.6 0.6 0.6Other 0.2 — — — —
9.2 8.1 8.2 7.2 6.8
T. ASSET IMPAIRMENT
Goodwill and Other IntangiblesGoodwill and other intangible assets with indefinite lives are not amortized, but are subject to an annual impairment test . Emera’s reporting units containing goodwill perform annual goodwill impairment tests during the fourth quarter of each year, and interim impairment tests are performed when impairment indicators are present . The carrying amount of the reporting unit’s goodwill is considered not recoverable if the carrying amount of the reporting unit as a whole exceeds the reporting unit’s fair value . An impairment charge is recorded for any excess of the carrying value of the goodwill over the implied fair value .
Long-Lived AssetsOther long-lived assets require an impairment review when, based on the qualitative assessment, there is more than 50 per cent likelihood that the indefinite-lived intangible asset’s fair value is less than its carry amount . Emera bases its evaluation of other long-lived assets on the presence of impairment indicators, such as the future economic benefit of the assets, any historical or future profitability measurements, and other external market conditions or factors .
Assets Held and Used: The carrying amount of assets held and used is considered not recoverable if it exceeds the undiscounted sum of cash flows expected to result from the use and eventual disposition of the asset . If the carrying value is not recoverable, the impairment loss is measured as the excess of the asset’s carrying value over its fair value .
Assets Held for Sale: The carrying value of assets held for sale is considered not recoverable if it exceeds the fair value less the cost to sell . An impairment charge is recorded for any excess of the carrying value over the fair value less estimated costs to sell .

Notes to the Consolidated Financial Statements
Emera Inc . — Annual Report 2013 93
Cost and Equity Method InvestmentsThe carrying value of investments accounted for under the cost and equity methods are assessed for impairment by comparing the fair values of these investments to their carrying values, if a fair value assessment was completed, or by reviewing for the presence of impairment indicators . If an impairment exists and it is determined to be other-than-temporary, a charge is recognized equal to the amount the carrying value exceeds the investment’s fair value .
Financial AssetsThe Company assesses at each balance sheet date whether there is objective evidence that a financial asset or a group of financial assets is impaired . In the case of equity securities classified as available-for-sale, an other than temporary decline in the fair value of the security below its cost is considered as an indicator that the securities are impaired . In the case of debt securities classified as available-for-sale, a breach of contract, such as default or delinquency in interest or principal payments, or evidence of significant financial difficulty of the issuer is considered an indicator of impairment . If any such evidence exists for available-for-sale financial assets, the cumulative loss, measured as the difference between the acquisition cost and the current fair value, less any impairment loss on that financial asset previously recognized in income, is removed from AOCL and recognized on the Consolidated Statements of Income .
In Q4 2013, the Company recorded an impairment charge of $8 .8 million ($7 .6 million after-tax or $0 .06 per common share) to write down its investment in AHI as AHI’s path to commercialization is less certain . The impairment charge included a $2 .2 million write-off of its AHI investment, a $1 .1 million write-off of a receivable that was deemed uncollectible and a write-off of $5 .5 million of convertible debentures .
U. DEBT FINANCING COSTS
The Company capitalizes the external costs of obtaining debt financing and includes them in “Other” as part of “Other assets” on the Consolidated Balance Sheets . The deferred charge is amortized over the life of the related debt on an effective interest basis and included in “Interest expense, net” on the Consolidated Statements of Income .
V. INCOME TAXES AND INVESTMENT TAX CREDITS
Emera recognizes deferred income tax assets and liabilities for the future tax consequences of events that have been included in the financial statements or income tax returns . Deferred income tax assets and liabilities are determined based on the difference between the carrying value of assets and liabilities on the balance sheet and their respective tax bases using enacted tax rates in effect for the year in which the differences are expected to reverse . Emera recognizes the effect of income tax positions only when it is more likely than not that they will be realized . If management subsequently determines that it is likely that some or all of a deferred income tax asset will not be realized, then a valuation allowance is recorded to report the balance at the amount expected to be realized .
Generally, investment tax credits are recorded as a reduction to income tax expense in the current or future periods to the extent that realization of such benefit is more likely than not . Investment tax credits earned by Bangor Hydro or MPS on regulated assets are deferred and amortized over the estimated service lives of the related properties, as required by United State tax laws and Maine regulatory practices .
Emera’s rate-regulated subsidiaries recognize regulatory assets or liabilities where the deferred income taxes are expected to be recovered from or returned to customers in future rates .
Emera classifies interest and penalties associated with unrecognized tax benefits as interest and operating expense, respectively .
W. ASSET RETIREMENT OBLIGATION
An ARO is recognized if a legal obligation exists in connection with the future disposal or removal costs resulting from the permanent retirement, abandonment or sale of a long-lived asset . A legal obligation may exist under an existing or enacted law or statute, written or oral contract, or by legal construction under the doctrine of promissory estoppel .
An ARO represents the fair value of the estimated cash flows necessary to discharge the future obligation using the Company’s credit adjusted risk-free rate . The amounts are reduced by actual expenditures incurred . Estimated future cash flows are based on completed depreciation studies, remediation reports, prior experience, estimated useful lives and governmental regulatory requirements . The present value of the liability is recorded and the carrying amount of the related long-lived asset is correspondingly increased . The amount capitalized at inception is depreciated in the same manner as the related long-lived asset . Over time, the liability is accreted to its estimated future value . Accretion expense is included as part of “Depreciation and amortization” . Any accretion expense not yet approved by the regulator is deferred to a regulatory asset in “Property, plant and equipment” and included in the next depreciation study .
Some transmission and distribution assets may have conditional AROs, which are required to be estimated and recorded as a liability . A conditional ARO refers to a legal obligation to perform an asset retirement activity in which the timing and/or method of settlement are conditional on a future event that may or may not be within the control of the entity . Management monitors these obligations and a liability is recognized at fair value when an amount can be determined .

94 Emera Inc . — Annual Report 2013
X. DERIVATIVES AND HEDGING ACTIVITIES
Emera’s risk management policies and procedures provide a framework through which management monitors various risk exposures . The risk management policies and practices are overseen by the Board of Directors . The Company has established a number of processes and practices to identify, monitor, report on and mitigate material risks to the Company . This includes establishment of the Enterprise Risk Management Committee, whose responsibilities include preparing and updating a “Risk Dashboard” for the Board of Directors on a quarterly basis . Furthermore, a corporate team independent from operations is responsible for tracking and reporting on market and credit risks, such as financial and credit risks on a daily and weekly basis, as applicable .
The Company manages its exposure to normal operating and market risks relating to commodity prices, foreign exchange and interest rates through contractual protections with counterparties where practicable, as well as by using financial instruments consisting mainly of foreign exchange forwards and swaps, interest rate options and swaps, and coal, oil and gas futures, options, forwards and swaps . In addition, the Company has contracts for the physical purchase and sale of natural gas . In addition, the Company has contracts for the physical purchase and sale of natural gas . These physical and financial contracts are classified as held-for-trading (“HFT”) . Collectively, these contracts are considered “derivatives” .
The Company recognizes the fair value of all its derivatives on its balance sheet, except for non-financial derivatives that meet the normal purchases and normal sales (“NPNS”) exception . A physical contract generally qualifies for the NPNS exception if the transaction is reasonable in relation to the Company’s business needs, the counterparty owns or controls resources within the proximity to allow for physical delivery, the Company intends to receive physical delivery of the commodity, and the Company deems the counterparty creditworthy . Emera continually assesses contracts designated under the NPNS exception and will discontinue the treatment of these contracts under this exception where the criteria are no longer met .
Derivatives qualify for hedge accounting if they meet stringent documentation requirements, and can be proven to effectively hedge the identified risk both at the inception and over the term of the instrument . Specifically, for cash flow hedges, the effective portion of the change in the fair value of derivatives is deferred to AOCL and recognized in income in the same period the related hedged item is realized . Any ineffective portion of the change in the fair value of the cash flow hedges is recognized in net income in the reporting period .
Where the documentation or effectiveness requirements are not met, the derivatives are recognized at fair value, with any changes in fair value recognized in net income in the reporting period, unless deferred as a result of regulatory accounting .
Derivatives entered into by NSPI that are documented as economic hedges, and for which the NPNS exception has not been taken, are subject to regulatory accounting treatment, as approved by the Nova Scotia Utility and Review Board (“UARB”) . These derivatives are recorded at fair value on the balance sheet as derivative assets or liabilities . The change in fair value of the derivatives is deferred to a regulatory asset or liability . The gain or loss is recognized in the hedged item when the hedged item is settled . Management believes that any gains or losses resulting from settlement of these derivatives related to fuel for generation and purchased power will be refunded to or collected from customers in future rates through the FAM .
Derivatives that do not meet any of the above criteria are designated as HFT derivatives and are recorded on the balance sheet at fair value, with changes normally recorded in net income of the period, unless deferred as a result of regulatory accounting . The Company has not elected to designate any derivatives to be included in the HFT category where another accounting treatment would apply .
Emera classifies gains and losses on derivatives as a component of fuel for generation and purchased power, other expenses, inventory and property, plant and equipment, depending on the nature of the item being economically hedged . Transportation capacity arising as a result of trading and marketing transactions is recognized as an asset in “Other current assets” and amortized over the period of the transportation contract term . Cash flows from derivative activities are presented in the same category as the item being hedged within operating or investing activities on the Consolidated Statements of Cash Flows .
Y. FAIR VALUE MEASUREMENT
The Company is required to determine the fair value of all derivatives except those which qualify for the NPNS exception (refer to notes 15 and 16), and uses a market approach to do so . Fair value is the price that would be received to sell an asset or paid to transfer a liability in an orderly arms-length transaction between market participants at the measurement date . Fair value measurements are required to reflect the assumptions that market participants would use in pricing an asset or liability based on the best available information, including the risks inherent in a particular valuation technique, such as a pricing model, and the risks inherent in the inputs to the model . The Company uses a fair value hierarchy, based on the relative objectivity of the inputs used to measure fair value, with Level 1 representing the highest .
The three levels of the fair value hierarchy are defined as follows:
Level 1 Valuations — Where possible, the Company bases the fair valuation of its financial assets and liabilities on quoted prices in active markets (“quoted prices”) for identical assets and liabilities .

Notes to the Consolidated Financial Statements
Emera Inc . — Annual Report 2013 95
Level 2 Valuations — Where quoted prices for identical assets and liabilities are not available, the valuation of certain contracts must be based on quoted prices for similar assets and liabilities with an adjustment related to location differences . Also, certain derivatives are valued using quotes from over-the-counter clearing houses .
Level 3 Valuations — Where the information required for a Level 1 or Level 2 valuation is not available, derivatives must be valued using unobservable or internally developed inputs . The primary reasons for a Level 3 classification are as follows: • While valuations were based on quoted prices, significant assumptions were necessary to reflect seasonal or monthly shaping and
locational basis differentials . • The term of certain transactions extends beyond the period when quoted prices are available, and accordingly, assumptions were
made to extrapolate prices from the last quoted period through the end of the transaction term . • The valuations of certain transactions were based on internal models, although quoted prices were utilized in the valuations .
Derivative assets and liabilities are classified in their entirety based on the lowest level of input that is significant to the fair value measurement .
Z. VARIABLE INTEREST ENTITIES
The Company performs ongoing analysis to assess whether it holds any variable interest entities (“VIEs”) . To identify potential VIEs, management reviews contracts under leases, long-term purchase power agreements, tolling contracts and jointly owned facilities .
VIEs of which the Company is deemed the primary beneficiary must be consolidated . The primary beneficiary of a VIE has both the power to direct the activities of the entity that most significantly impact its economic performance and the obligation to absorb losses or the right to receive benefits of the entity that could potentially be significant to the entity . In circumstances where Emera is not deemed the primary beneficiary, the VIE is not recorded in the Company’s consolidated financial statements .
AA. AVAILABLE-FOR-SALE INVESTMENTS
Assets designated as Available-for-sale are non-derivative financial assets (equity and debt securities) intended to be held for an indefinite period of time, and may be sold in response to needs for liquidity or changes in interest rates, exchange rates or equity prices .
Regular purchases and sales of financial assets are recognized at fair value, including transaction costs, on the trade date, the date on which the Company commits to purchase or sell the asset; and subsequently carried at fair value-based on current bid prices on the market . Unrealized gain and losses arising from changes in the fair value of available-for-sale assets are recognized in AOCL until the financial asset is sold, or otherwise disposed of, or until the financial investment is determined to be impaired, at which time the cumulative gain or loss will be included in income for the period .
Interest on available-for-sale debt securities is calculated using the effective interest method and is recognized on the Consolidated Statements of Income in “Other income (expenses), net” . Dividends on available-for-sale equity securities are recognized on the Consolidated Statements of Income in “Other income (expenses), net” .
BB. DERIVATIVE POSITIONS AND CASH COLLATERAL
Derivatives, as reflected on the Consolidated Balance Sheets, are not offset by the fair value amounts of cash collateral with the same counterparty . Rights to reclaim cash collateral are recognized in “Receivables, net” and obligations to return cash collateral are recognized in “Accounts payable” .

96 Emera Inc . — Annual Report 2013
2. Change in Accounting Policy
In Q1 2013, Emera adopted Accounting Standards Update (“ASU”) Number (“No .”) 2013-02 . This ASU did not change the current requirements for reporting net income or other comprehensive income . The amendments require an entity to present, either parenthetically on the face of the financial statements or in the notes, significant amounts reclassified from each component of accumulated other comprehensive income and the income statement line items affected by the reclassification . An entity would not show the income statement line item affected for certain components, which are not required to be reclassified in their entirety to net income . New disclosures have been added to reflect this change in presentation; however, the amendment had no effect on the financial results of the Company .
In Q1 2013, Emera adopted ASU No . 2012-04 . This ASU amended Accounting Standard Codification (“ASC”) 820 for technical corrections and improvements and conforming amendments related to fair value measurements (ASU 820) . The amendments represented clarifications and corrections to unintended application of guidance and minor improvements to the ASCs and had no effect on the financial results of the Company .
In Q1 2013, Emera adopted ASU No . 2011-11 . This ASU amended ASC 815 Derivatives and Hedging, requiring companies to disclose gross and net information for derivative instruments . The Company is currently in compliance with this standard and therefore, the adoption of this standard did not have any impact on the financial statements .
3. Future Accounting Pronouncements
Income Taxes, ASU No. 2013-11In July 2013, the Financial Accounting Standards Board (“FASB”) issued an ASU amending guidance on the financial statement presentation of an unrecognized tax benefit when a net operating loss carryforward, similar tax loss, or tax credit carryforward exists . The purpose of this amendment is to reduce diversity in practice by providing guidance on the presentation of unrecognized tax benefits and to better reflect the manner in which an entity would settle at the reporting date any additional income taxes that would result from the disallowance of a tax position when net operating loss carryforwards, similar tax losses, or tax credit carryforwards exist . ASU No . 2013-11 is effective for fiscal years, and interim periods within those years, beginning on or after December 15, 2013 . The Company is currently in compliance with this standard and therefore does not expect the adoption of this standard will have any impact on the financial statements .
4. Segment Information
Emera manages its reportable segments separately due to their different geographical, operating and regulatory environments . Segments are reported based on each subsidiary’s contribution of revenues, net income and total assets .
As at December 31, 2013, Emera has five reportable segments, specifically: • NSPI; • Maine Utility Operations (Bangor Hydro and MPS); • Caribbean Utility Operations (LPH and its subsidiaries, BLPC and DOMLEC; and GBPC); • Pipelines (Brunswick Pipeline and M&NP); and • Other (Emera Energy, Bayside Power, Brooklyn Energy, EE New England Gas Generation, Emera Utility Services, Emera
Newfoundland, Corporate, other strategic investments, holding companies, and inter-segment eliminations) .

Notes to the Consolidated Financial Statements
Emera Inc . — Annual Report 2013 97
Maine Caribbean Utility Utility Other and NSPI operations operations Pipelines eliminations Total
millions of Canadian dollars
For the year ended December 31, 2013Operating revenues from external customers (1) $1,332.5 $ 218.2 $ 440.6 $ 49.9$ 147.2 $2,188.4 Inter-segment revenues (1) 2.4 — — — 39.4 41.8
Total operating revenues 1,334.9 218.2 440.6 49.9 186.6 2,230.2
Allowance for funds used during construction — debt and equity 5.5 4.5 0.2 — 4.2 14.4Regulated fuel and fixed cost adjustments (40.8) — — — — (40.8)Depreciation and amortization 213.8 37.0 31.8 0.2 15.0 297.8Interest expense 132.8 14.7 12.2 — 40.0 199.7Interest revenue 10.3 1.0 — — 12.0 23.3Internally allocated interest (2) — — — (27.6) 27.6 —Gain on acquisition — — 2.8 — — 2.8Income from equity investments — — 1.8 14.7 21.6 38.1Income tax expense (recovery) 34.4 22.3 3.3 6.5 (23.2) 43.3Capital expenditures 207.9 84.2 24.1 — 37.5 353.7Net income attributable to common shareholders 126.0 38.4 32.4 30.3 (9.6) 217.5As at December 31, 2013Total assets 4,186.9 1,103.3 1,022.9 592.7 1,971.0 8,876.8Investments subject to significant influence — 2.5 28.1 115.1 593.5 739.2Goodwill — 121.7 81.1 — 3.7 206.5
For the year ended December 31, 2012Operating revenues from external customers (1) $1,235.3 $ 205.0 $ 420.8 $ 50.1$ 98.6 $2,009.8 Inter-segment revenues (1) 1.9 — — — 46.9 48.8
Total operating revenues 1,237.2 205.0 420.8 50.1 145.5 2,058.6
Allowance for funds used during construction — debt and equity 17.5 6.8 3.7 — 1.7 29.7Regulated fuel and fixed cost adjustments 10.0 — — — — 10.0Depreciation and amortization 212.3 31.3 30.2 0.2 4.2 278.2Interest expense 129.3 15.4 10.8 — 39.0 194.5Interest revenue 6.9 0.6 — — 7.4 14.9Internally allocated interest (2) — — — (30.2) 30.2 —Gain on acquisition — — — — — —Income from equity investments — 0.2 1.7 14.0 (2.7) 13.2Income tax expense (recovery) (29.0) 19.9 1.5 5.9 (10.7) (12.4)Capital expenditures 283.8 68.2 60.2 — 79.4 491.6Net income attributable to common shareholders 126.0 35.4 23.2 27.9 8.3 220.8As at December 31, 2012Total assets 3,954.2 986.5 882.4 600.3 1,113.0 7,536.4Investments subject to significant influence — 1.3 26.4 116.6 392.3 536.6Goodwill — 113.9 75.9 — 3.7 193.5
(1) All significant inter-company balances and inter-company transactions have been eliminated on consolidation except for certain transactions between non-regulated and regulated entities that have not been eliminated because management believes that the elimination of these transactions would understate property, plant and equipment, operating, maintenance and general expenses, or regulated fuel for generation and purchased power . Eliminated transactions are included in determining reportable segments .
(2) Segment net income is reported on a basis that included internally allocated financing costs .

98 Emera Inc . — Annual Report 2013
5. Regulated Fuel Adjustment Mechanism and Fixed Cost Deferrals
Regulated fuel adjustment mechanism and fixed cost deferrals recognized in the Consolidated Statements of Income consisted of the following:
For the Year ended December 31
millions of Canadian dollars 2013 2012
Regulated fuel adjustment mechanism $ (37.8) $ 54.7Regulated fixed cost deferral related to 2013/2014 rate stabilization (3.0) —Regulated fixed cost deferral related to 2012 large industrial customers — (44.7)
$ (40.8) $ 10.0
REGULATED FUEL ADJUSTMENT MECHANISM
The regulated fuel adjustment mechanism (“FAM”) included in the Consolidated Statements of Income for NSPI includes the effect of prudently incurred fuel for generation and purchased power and fuel-related costs (“fuel costs”) in both the current and preceding years, specifically, and as detailed in the table below: • The difference between actual fuel costs and amounts recovered from customers in the current year . This amount is deferred
to a FAM regulatory asset in “Regulatory assets” or a FAM regulatory liability in “Regulatory liabilities” on the Consolidated Balance Sheets .
• The recovery from (rebate to) customers of under (over) recovered fuel costs from prior years .
The FAM regulatory asset includes amounts recognized as a regulated fuel adjustment mechanism and associated interest that is included in “Interest expense, net” on the Consolidated Statements of Income .
The regulated fuel adjustment mechanism consisted of the following:
For the Year ended December 31
millions of Canadian dollars 2013 2012
Over (Under) recovery of current period fuel costs $ (67.6) $ (15.7)Recovery from (rebate to) customers of prior years’ fuel costs 29.8 65.9FAM audit disallowance — 4.5
Regulated fuel adjustment mechanism $ (37.8) $ 54.7
The following table shows the balance sheet classification of the various components of the regulated FAM balances:
As at December 31 December 31
millions of Canadian dollars 2013 2012
Current regulatory asset $ — $ 29.1Long-term regulatory asset 86.4 14.0
Total FAM regulatory asset $ 86.4 $ 43.1
Current deferred income tax liability $ — $ (9.0)Long-term deferred income tax liability (26.8) (4.4)
Total FAM deferred income tax liability $ (26.8) $ (13.4)
NSPI has recognized a deferred income tax expense related to the regulated fuel adjustment mechanism based on NSPI’s enacted statutory tax rate .
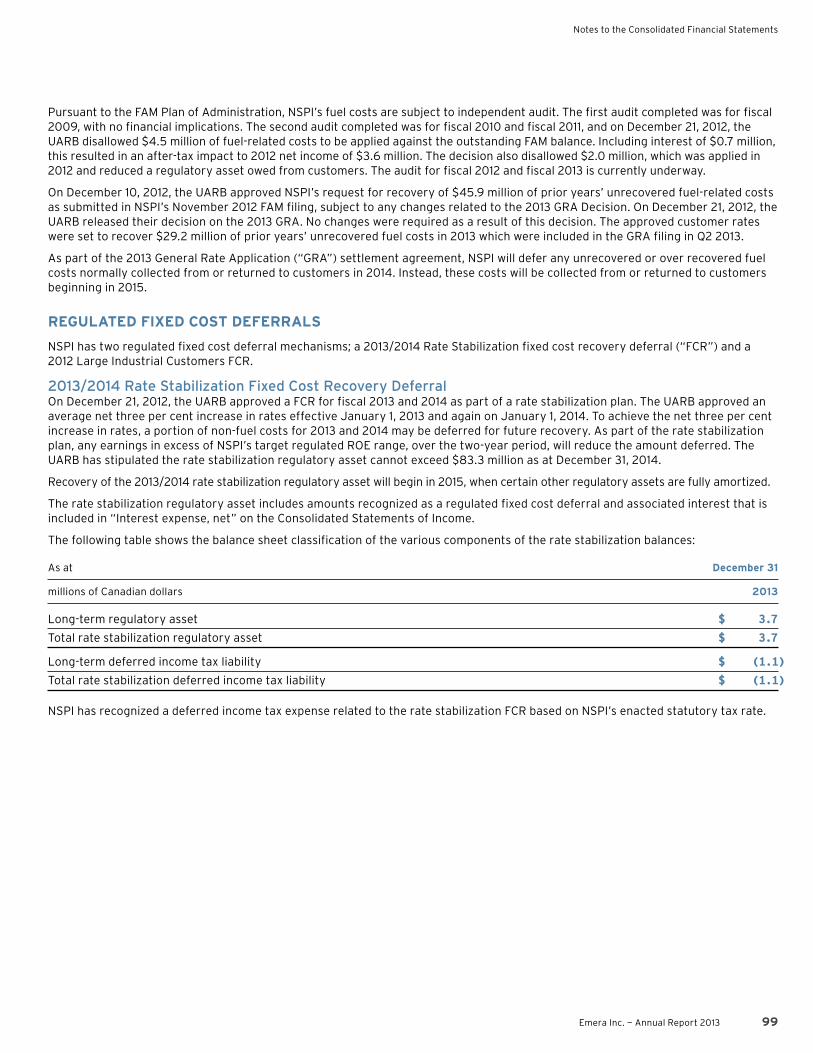
Notes to the Consolidated Financial Statements
Emera Inc . — Annual Report 2013 99
Pursuant to the FAM Plan of Administration, NSPI’s fuel costs are subject to independent audit . The first audit completed was for fiscal 2009, with no financial implications . The second audit completed was for fiscal 2010 and fiscal 2011, and on December 21, 2012, the UARB disallowed $4 .5 million of fuel-related costs to be applied against the outstanding FAM balance . Including interest of $0 .7 million, this resulted in an after-tax impact to 2012 net income of $3 .6 million . The decision also disallowed $2 .0 million, which was applied in 2012 and reduced a regulatory asset owed from customers . The audit for fiscal 2012 and fiscal 2013 is currently underway .
On December 10, 2012, the UARB approved NSPI’s request for recovery of $45 .9 million of prior years’ unrecovered fuel-related costs as submitted in NSPI’s November 2012 FAM filing, subject to any changes related to the 2013 GRA Decision . On December 21, 2012, the UARB released their decision on the 2013 GRA . No changes were required as a result of this decision . The approved customer rates were set to recover $29 .2 million of prior years’ unrecovered fuel costs in 2013 which were included in the GRA filing in Q2 2013 .
As part of the 2013 General Rate Application (“GRA”) settlement agreement, NSPI will defer any unrecovered or over recovered fuel costs normally collected from or returned to customers in 2014 . Instead, these costs will be collected from or returned to customers beginning in 2015 .
REGULATED FIXED COST DEFERRALS
NSPI has two regulated fixed cost deferral mechanisms; a 2013/2014 Rate Stabilization fixed cost recovery deferral (“FCR”) and a 2012 Large Industrial Customers FCR .
2013/2014 Rate Stabilization Fixed Cost Recovery DeferralOn December 21, 2012, the UARB approved a FCR for fiscal 2013 and 2014 as part of a rate stabilization plan . The UARB approved an average net three per cent increase in rates effective January 1, 2013 and again on January 1, 2014 . To achieve the net three per cent increase in rates, a portion of non-fuel costs for 2013 and 2014 may be deferred for future recovery . As part of the rate stabilization plan, any earnings in excess of NSPI’s target regulated ROE range, over the two-year period, will reduce the amount deferred . The UARB has stipulated the rate stabilization regulatory asset cannot exceed $83 .3 million as at December 31, 2014 .
Recovery of the 2013/2014 rate stabilization regulatory asset will begin in 2015, when certain other regulatory assets are fully amortized .
The rate stabilization regulatory asset includes amounts recognized as a regulated fixed cost deferral and associated interest that is included in “Interest expense, net” on the Consolidated Statements of Income .
The following table shows the balance sheet classification of the various components of the rate stabilization balances:
As at December 31
millions of Canadian dollars 2013
Long-term regulatory asset $ 3.7
Total rate stabilization regulatory asset $ 3.7
Long-term deferred income tax liability $ (1.1)
Total rate stabilization deferred income tax liability $ (1.1)
NSPI has recognized a deferred income tax expense related to the rate stabilization FCR based on NSPI’s enacted statutory tax rate .
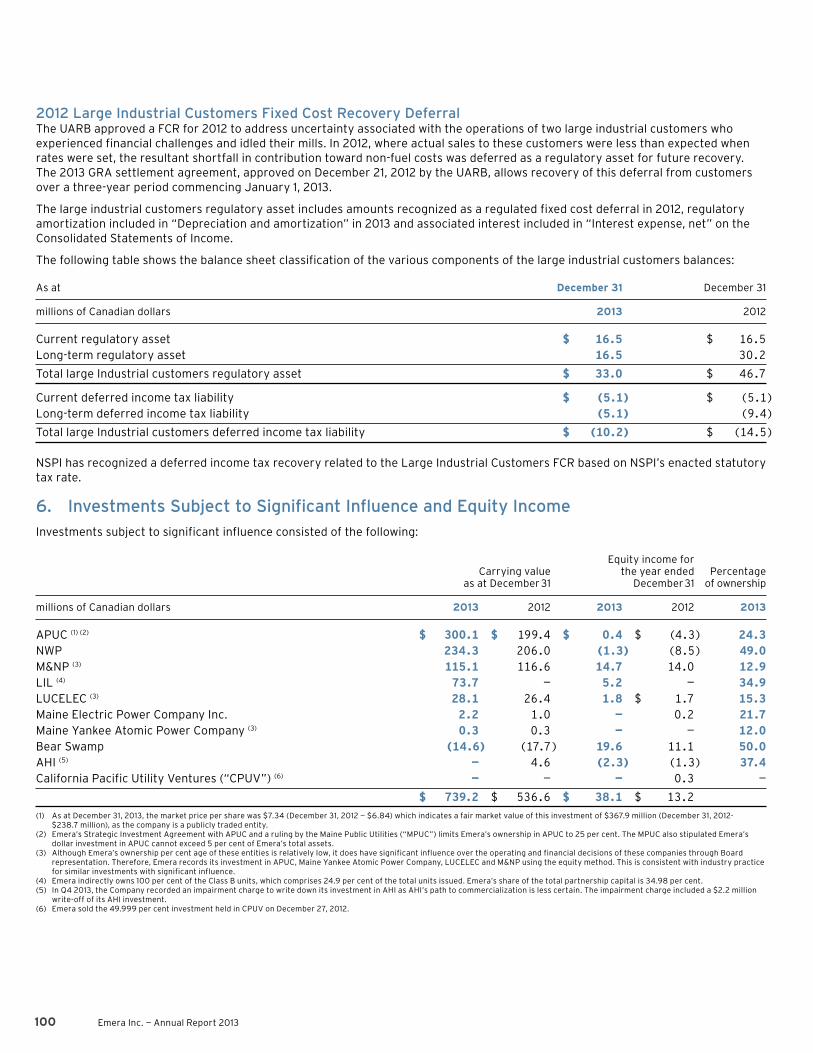
100 Emera Inc . — Annual Report 2013
2012 Large Industrial Customers Fixed Cost Recovery DeferralThe UARB approved a FCR for 2012 to address uncertainty associated with the operations of two large industrial customers who experienced financial challenges and idled their mills . In 2012, where actual sales to these customers were less than expected when rates were set, the resultant shortfall in contribution toward non-fuel costs was deferred as a regulatory asset for future recovery . The 2013 GRA settlement agreement, approved on December 21, 2012 by the UARB, allows recovery of this deferral from customers over a three-year period commencing January 1, 2013 .
The large industrial customers regulatory asset includes amounts recognized as a regulated fixed cost deferral in 2012, regulatory amortization included in “Depreciation and amortization” in 2013 and associated interest included in “Interest expense, net” on the Consolidated Statements of Income .
The following table shows the balance sheet classification of the various components of the large industrial customers balances:
As at December 31 December 31
millions of Canadian dollars 2013 2012
Current regulatory asset $ 16.5 $ 16.5Long-term regulatory asset 16.5 30.2
Total large Industrial customers regulatory asset $ 33.0 $ 46.7
Current deferred income tax liability $ (5.1) $ (5.1)Long-term deferred income tax liability (5.1) (9.4)
Total large Industrial customers deferred income tax liability $ (10.2) $ (14.5)
NSPI has recognized a deferred income tax recovery related to the Large Industrial Customers FCR based on NSPI’s enacted statutory tax rate .
6. Investments Subject to Significant Influence and Equity Income
Investments subject to significant influence consisted of the following:
Equity income for Carrying value the year ended Percentage as at December 31 December 31 of ownership
millions of Canadian dollars 2013 2012 2013 2012 2013
APUC (1) (2) $ 300.1 $ 199.4 $ 0.4 $ (4.3) 24.3NWP 234.3 206.0 (1.3) (8.5) 49.0M&NP (3) 115.1 116.6 14.7 14.0 12.9LIL (4) 73.7 — 5.2 — 34.9LUCELEC (3) 28.1 26.4 1.8 $ 1.7 15.3Maine Electric Power Company Inc . 2.2 1.0 — 0.2 21.7Maine Yankee Atomic Power Company (3) 0.3 0.3 — — 12.0Bear Swamp (14.6) (17.7) 19.6 11.1 50.0AHI (5) — 4.6 (2.3) (1.3) 37.4California Pacific Utility Ventures (“CPUV”) (6) — — — 0.3 —
$ 739.2 $ 536.6 $ 38.1 $ 13.2
(1) As at December 31, 2013, the market price per share was $7 .34 (December 31, 2012 — $6 .84) which indicates a fair market value of this investment of $367 .9 million (December 31, 2012- $238 .7 million), as the company is a publicly traded entity .
(2) Emera’s Strategic Investment Agreement with APUC and a ruling by the Maine Public Utilities (“MPUC”) limits Emera’s ownership in APUC to 25 per cent . The MPUC also stipulated Emera’s dollar investment in APUC cannot exceed 5 per cent of Emera’s total assets .
(3) Although Emera’s ownership per cent age of these entities is relatively low, it does have significant influence over the operating and financial decisions of these companies through Board representation . Therefore, Emera records its investment in APUC, Maine Yankee Atomic Power Company, LUCELEC and M&NP using the equity method . This is consistent with industry practice for similar investments with significant influence .
(4) Emera indirectly owns 100 per cent of the Class B units, which comprises 24 .9 per cent of the total units issued . Emera’s share of the total partnership capital is 34 .98 per cent .(5) In Q4 2013, the Company recorded an impairment charge to write down its investment in AHI as AHI’s path to commercialization is less certain . The impairment charge included a $2 .2 million
write-off of its AHI investment .(6) Emera sold the 49 .999 per cent investment held in CPUV on December 27, 2012 .
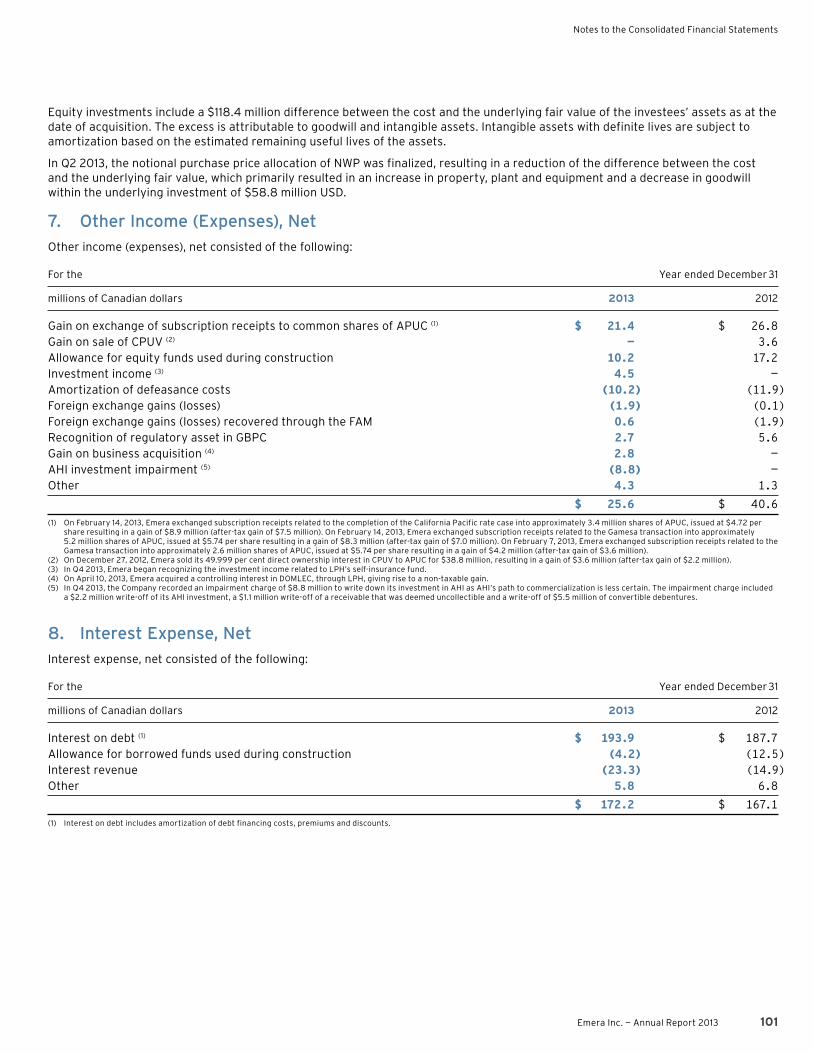
Notes to the Consolidated Financial Statements
Emera Inc . — Annual Report 2013 101
Equity investments include a $118 .4 million difference between the cost and the underlying fair value of the investees’ assets as at the date of acquisition . The excess is attributable to goodwill and intangible assets . Intangible assets with definite lives are subject to amortization based on the estimated remaining useful lives of the assets .
In Q2 2013, the notional purchase price allocation of NWP was finalized, resulting in a reduction of the difference between the cost and the underlying fair value, which primarily resulted in an increase in property, plant and equipment and a decrease in goodwill within the underlying investment of $58 .8 million USD .
7. Other Income (Expenses), Net
Other income (expenses), net consisted of the following:
For the Year ended December 31
millions of Canadian dollars 2013 2012
Gain on exchange of subscription receipts to common shares of APUC (1) $ 21.4 $ 26.8Gain on sale of CPUV (2) — 3.6Allowance for equity funds used during construction 10.2 17.2Investment income (3) 4.5 —Amortization of defeasance costs (10.2) (11.9)Foreign exchange gains (losses) (1.9) (0.1)Foreign exchange gains (losses) recovered through the FAM 0.6 (1.9)Recognition of regulatory asset in GBPC 2.7 5.6Gain on business acquisition (4) 2.8 —AHI investment impairment (5) (8.8) —Other 4.3 1.3
$ 25.6 $ 40.6
(1) On February 14, 2013, Emera exchanged subscription receipts related to the completion of the California Pacific rate case into approximately 3 .4 million shares of APUC, issued at $4 .72 per share resulting in a gain of $8 .9 million (after-tax gain of $7 .5 million) . On February 14, 2013, Emera exchanged subscription receipts related to the Gamesa transaction into approximately 5 .2 million shares of APUC, issued at $5 .74 per share resulting in a gain of $8 .3 million (after-tax gain of $7 .0 million) . On February 7, 2013, Emera exchanged subscription receipts related to the Gamesa transaction into approximately 2 .6 million shares of APUC, issued at $5 .74 per share resulting in a gain of $4 .2 million (after-tax gain of $3 .6 million) .
(2) On December 27, 2012, Emera sold its 49 .999 per cent direct ownership interest in CPUV to APUC for $38 .8 million, resulting in a gain of $3 .6 million (after-tax gain of $2 .2 million) .(3) In Q4 2013, Emera began recognizing the investment income related to LPH’s self-insurance fund .(4) On April 10, 2013, Emera acquired a controlling interest in DOMLEC, through LPH, giving rise to a non-taxable gain .(5) In Q4 2013, the Company recorded an impairment charge of $8 .8 million to write down its investment in AHI as AHI’s path to commercialization is less certain . The impairment charge included
a $2 .2 million write-off of its AHI investment, a $1 .1 million write-off of a receivable that was deemed uncollectible and a write-off of $5 .5 million of convertible debentures .
8. Interest Expense, Net
Interest expense, net consisted of the following:
For the Year ended December 31
millions of Canadian dollars 2013 2012
Interest on debt (1) $ 193.9 $ 187.7Allowance for borrowed funds used during construction (4.2) (12.5)Interest revenue (23.3) (14.9)Other 5.8 6.8
$ 172.2 $ 167.1
(1) Interest on debt includes amortization of debt financing costs, premiums and discounts .

102 Emera Inc . — Annual Report 2013
9. Income Taxes
The income tax provision, for the years ended December 31, differs from that computed using the statutory rates for the following reasons:
millions of Canadian dollars 2013 2012
Income before provision for income taxes $ 298.6 $ 233.2
Income taxes, at statutory rates 92.6 31.0% 72.3 31.0%Deferred income taxes on regulated income recorded as regulatory assets and regulatory liabilities (28.0) (9.4)% (79.8) (34.2)%Change in prior year unrecognized tax benefits (9.1) (3.0)% (1.6) (0.7)%Non-deductible regulatory amortization 5.1 1.7% 9.4 4.0%Barbados manufacturing and investment allowances (2.6) (0.9)% (3.8) (1.6)%Other (14.7) (4.9)% (8.9) (3.8)%
Income tax expense (recovery) $ 43.3 14.5%$ (12.4) (5.3)%
The 2013 statutory income tax rate of 31 .0 per cent (2012 — 31 .0 per cent) represents the combined Canadian federal and Nova Scotia provincial income tax rates, which are the relevant tax jurisdictions for Emera .
The following reflects the composition of taxes on income from continuing operations for the years ended December 31:
millions of Canadian dollars 2013 2012
Income tax expense (recovery) — current Domestic $ 27.0 $ (22.7) Foreign 6.7 (2.7)Income tax expense (recovery) — deferred Domestic 14.1 2.9 Foreign 53.2 34.0Operating loss carryforwards (57.7) (23.2)Change in the beginning of the year valuation allowance — (0.7)
Income tax expense (recovery) $ 43.3 $ (12.4)
Foreign income before taxes was $186 .4 million in 2013 and $128 .6 million in 2012 .

Notes to the Consolidated Financial Statements
Emera Inc . — Annual Report 2013 103
The deferred income tax assets and liabilities as at December 31 consisted of the following:
millions of Canadian dollars 2013 2012
Deferred income tax assets:Tax loss carryforwards $ 161.9 $ 95.0Pension and other post-retirement liabilities 114.2 222.4Asset retirement obligations 45.2 43.2Intangibles 36.8 28.7Derivative instruments 35.2 40.3Regulatory liabilities 31.5 17.8Other 51.7 34.4
Total deferred income tax assets before valuation allowance 476.5 481.8Valuation allowance (17.8) (16.0)
Total deferred income tax assets after valuation allowance $ 458.7 $ 465.8
Deferred income tax liabilities:Property, plant and equipment $ 703.6 $ 564.1Net investment in direct financing lease 74.0 58.8Derivative instruments 49.9 27.3Other 96.2 87.4
Total deferred income tax liabilities $ 923.7 $ 737.6
Consolidated Balance Sheets presentation:Current deferred income tax assets $ 15.8 $ 14.9Long-term deferred income tax assets 67.8 28.9Current deferred income tax liabilities (0.9) (3.5)Long-term deferred income tax liabilities (547.7) (312.1)
Net deferred income tax liabilities $ (465.0) $ (271.8)
For regulated entities, to the extent deferred income taxes are expected to be recovered from or returned to customers in future rates, a regulatory asset or liability is recognized . These amounts include a gross-up to reflect the income tax associated with future revenues required to fund these deferred income tax liabilities, and the income tax benefits associated with reduced revenues resulting from the realization of deferred income tax assets .
The following table summarizes as at December 31, 2013 the net operating loss (“NOL”), capital loss and tax credit carryovers and the associated carryover periods, and the valuation allowances for amounts which Emera has determined that realization is uncertain:
Deferred Valuation Net deferred Expiration millions of Canadian dollars tax asset allowance tax asset period
NOL $ 145.9 $ (2.4)$ 143.5 2014—2033Capital loss 15.6 (13.8) 1.8 IndefiniteTax credit 0.4 — 0.4 Indefinite
As at December 31, 2013, Emera had a gross NOL carryover of $767 .2 million (2012 — $277 .2 million), capital loss carryover of $73 .7 million (2012 — $66 .9 million), and a tax credit carryforward of $1 .0 million (2012 — $1 .1 million) .
Considering all evidence regarding the utilization of the Company’s deferred income tax assets, it has been determined that Emera is more likely than not to realize all recorded deferred income tax assets, except for the losses noted above and unrealized capital losses on certain investments . A valuation allowance has been recorded as at December 31, 2013 related to these losses and investments .

104 Emera Inc . — Annual Report 2013
The following table provides details of the change in unrecognized tax benefits for the years ended December 31 as follows:
millions of Canadian dollars 2013 2012
Balance, January 1 $ 14.7 $ 12.9Decreases due to tax positions related to prior year (0.2) —Increases (decreases) due to tax positions related to current year (0.2) 3.5Decreases due to expiration of statute of limitations — (1.7)Decreases due to enactment of legislation (9.1) —
Balance, December 31 $ 5.2 $ 14.7
The total amount of unrecognized tax benefits as at December 31, 2013 was $5 .2 million (2012 — $14 .7 million), which would affect the effective tax rate if recognized . The total amount of accrued interest with respect to unrecognized tax benefits was $1 .1 million (2012 — $1 .5 million) . No penalties have been accrued . In the next twelve months, Emera does not expect significant changes in the unrecognized tax benefits .
The Company intends to indefinitely reinvest earnings from certain foreign operations . Accordingly, US and non-US income and withholding taxes for which deferred taxes might otherwise be required have not been provided for on a cumulative amount of temporary differences related to investments in foreign subsidiaries of approximately $447 .4 million as at December 31, 2013 (2012 — $355 .6 million) . It is impractical to estimate the amount of income and withholding tax that might be payable if a reversal of temporary differences occurred .
Emera files a Canadian federal income tax return, which includes its Nova Scotia provincial income tax . Emera’s subsidiaries file Canadian, US, Barbados, St . Lucia and Dominica income tax returns . As at December 31, 2013, the Company’s tax years still open to examination by taxing authorities include 2004 and subsequent years . With few exceptions, the Company is no longer subject to examination for years prior to 2006 .
10. Earnings Per Share
The following table reconciles the computation of basic and diluted earnings per share:
For the Year ended December 31
millions of Canadian dollars (except per share amounts) 2013 2012
NumeratorNet income attributable to common shareholders $ 217.5 $ 220.8Diluted numerator (1) 217.5 220.8
Denominator Weighted average shares of common stock outstanding 131.9 124.3Weighted average deferred share units outstanding 0.7 0.6
Weighted average shares of common stock outstanding — basic 132.6 124.9Stock-based compensation 0.3 0.4
Weighted average shares of common stock outstanding — diluted 132.9 125.3
Earnings per common shareBasic $ 1.64 $ 1.77Diluted (1) $ 1.64 $ 1.76
(1) The calculation of diluted earnings per share for the year ended December 31, 2013 excluded the impact of $7 .7 million net of tax (2012 — $8 .6 million) in preferred stock dividends of a subsidiary (and 3 .9 million (2012 — 4 .1 million) in potential common shares) .

Notes to the Consolidated Financial Statements
Emera Inc . — Annual Report 2013 105
11. Accumulated Other Comprehensive Income (Loss)
The components of accumulated other comprehensive income are as follows:
For the Year ended December 31, 2013
Unrealized Net change (loss) gain on (Losses) gains in unrecognized Net change translation of on derivatives pension and on available- self-sustaining recognized as post-retirement for-sale foreign millions of Canadian dollars cash flow hedges benefit costs investments operations Total AOCL
Balance, January 1, 2013 $ (7.7) $ (604.1) $ 12.1 $ (176.1) $ (775.8)Other comprehensive income (loss) before reclassifications 1.8 — 4.6 108.7 115.1Amounts reclassified from accumulated other comprehensive income loss (gain) 1.7 250.7 (13.4) — 239.0Net current period other comprehensive income (loss) 3.5 250.7 (8.8) 108.7 354.1Non-controlling interest — — 0.9 7.5 8.4
Balance, December 31, 2013 $ (4.2) $ (353.4) $ 2.4 $ (74.9) $ (430.1)
The reclassifications out of accumulated other comprehensive income (loss) are as follows:
For the Year ended December 31, 2013
Affected line item Amounts reclassified in the Consolidated millions of Canadian dollars from AOCL Statements of Income
Losses (gain) on derivatives recognized as cash flow hedges Power and gas swaps $ 1.9 Non-regulated fuel for generation and purchased power Interest rate swaps 0.5 Income from equity investments Interest rate swaps 3.3 Interest expense, net Foreign exchange forwards (1.7) Operating revenue — regulatedTotal before tax 4.0
(2.3) Income tax expense (recovery)
Total net of tax $ 1.7
Net change in unrecognized pension and post-retirement benefit costs Actuarial losses (gains) $ 52.7 Operating, maintenance and general (“OM&G”) Past service costs (gains) (2.3) OM&G Amounts reclassified into obligations 217.5 Pension and post-retirement benefits
Total before tax 267.9
(17.2) Income tax expense (recovery)
Total net of tax $ 250.7
Net change in available-for-sale investments
$ (15.9) Other income (expenses), net
Total before tax (15.9)
2.5 Income tax expense (recovery)
Total net of tax $ (13.4)
Total reclassifications out of AOCL, net of tax, for the period $ 239.0

106 Emera Inc . — Annual Report 2013
12. Restricted Cash
Restricted cash consisted of the following:
As at December 31 December 31
millions of Canadian dollars 2013 2012
Restricted cash — BLPC (1) $ 20.7 $ 16.3Restricted cash — Other 0.9 0.8
$ 21.6 $ 17.1
(1) $2 .4 million of this cash is held for the self-insurance fund (“SIF”) at BLPC for the purpose of building an insurance fund to cover risk against damage and consequential loss to certain of BLPC’s generating, transmission and distribution systems . Any withdrawal of SIF Fund assets by the Company would be subject to existing regulations . $7 .6 million of this cash is held by The Bank of Nova Scotia; as per the secured credit agreement, that partially financed the purchase of a 19 .1 per cent interest in LUCELEC from a wholly owned subsidiary of Emera and $10 .7 million is held by FirstCaribbean International Bank that financed the purchase of a 51 .9 per cent interest in DOMLEC .
13. Receivables, Net
Receivables, net consisted of the following:
As at December 31 December 31
millions of Canadian dollars 2013 2012
Customer accounts receivable — billed $ 404.4 $ 284.8Customer accounts receivable — unbilled 154.7 143.2Total customer accounts receivable 559.1 428.0Allowance for doubtful accounts (11.2) (9.6)Customer accounts receivable, net 547.9 418.4Other 33.9 31.0
$ 581.8 $ 449.4
14. Inventory
Inventory consisted of the following:
As at December 31 December 31
millions of Canadian dollars 2013 2012
Fuel $ 143.3 $ 111.9Materials 83.3 65.7Emission credits (1) 19.2 —
$ 245.8 $ 177.6
(1) EE New England Gas Generation is subject to the Acid Rain Program for sulphur dioxide emissions and the Regional Greenhouse Gas Initiative (“RGGI”) for carbon dioxide emissions . In addition, Bridgeport Power is subject to the Clean Air Interstate Rule for ozone season nitrogen dioxide emission allowances . The emissions credits inventory balance represents the credits purchased to offset the liabilities associated with these programs .

Notes to the Consolidated Financial Statements
Emera Inc . — Annual Report 2013 107
15. Derivative Instruments
Derivative assets and liabilities relating to the foregoing categories consisted of the following:
Derivative assets Derivative liabilities
As at December 31 December 31
millions of Canadian dollars 2013 2012 2013 2012
CurrentCash flow hedgesPower and gas swaps $ 6.6 $ 0.8 $ 0.1 $ 0.2Foreign exchange forwards — 3.0 1.7 —
6.6 3.8 1.8 0.2
Regulatory deferralCommodity swaps and forwards Coal purchases — 1.8 4.3 1.1 Natural gas purchases and sales 6.4 1.5 0.1 9.0Foreign exchange forwards 13.3 2.6 — 8.1Physical natural gas purchases and sales 0.3 3.9 0.3 —
20.0 9.8 4.7 18.2HFT derivativesPower swaps and physical contracts 3.0 1.3 4.0 1.0Natural gas swaps, futures, forwards, physical contracts and related transportation 35.3 16.4 165.1 22.9
38.3 17.7 169.1 23.9
Total gross current derivatives 64.9 31.3 175.6 42.3
Impact of master netting agreements with intent to settle net or simultaneously (15.6) (7.2) (15.6) (7.2)
Total current derivatives 49.3 24.1 160.0 35.1
Long-termCash flow hedgesPower swaps 8.3 1.2 3.3 1.3Interest rate swaps — — — 6.5Foreign exchange forwards 0.5 1.7 2.1 0.3
8.8 2.9 5.4 8.1
Regulatory deferralCommodity swaps and forwards Coal purchases — — 3.5 0.6 Natural gas purchases and sales — 0.3 0.1 —Foreign exchange forwards 31.5 11.4 0.4 5.0
31.5 11.7 4.0 5.6
HFT derivativesPower swaps and physical contracts 0.4 — 0.7 —Natural gas swaps, futures, forwards and physical contracts 23.8 8.8 19.8 8.7
24.2 8.8 20.5 8.7
Total gross long-term derivatives 64.5 23.4 29.9 22.4
Impact of master netting agreements with intent to settle net or simultaneously (2.9) — (2.9) —
Total long-term derivatives 61.6 23.4 27.0 22.4
Total derivatives $ 110.9 $ 47.5 $ 187.0 $ 57.5
Derivative assets and liabilities are classified as current or long-term based upon the maturities of the underlying contracts .

108 Emera Inc . — Annual Report 2013
CASH FLOW HEDGES
The Company enters into various derivatives designated as cash flow hedges . Emera enters into power swaps to limit Bear Swamp’s exposure to purchased power prices . The Company also enters into foreign exchange forwards to hedge the currency risk for revenue streams denominated in foreign currency for Brunswick Pipeline .
As previously noted, the effective portion of the change in fair value of these derivatives is included in AOCL, until the hedged transactions are recognized in income . The ineffective portion is recognized in income of the period . The amounts related to cash flow hedges recorded in income and AOCL consisted of the following:
For the Year ended December 31
millions of Canadian dollars 2013 2012
Power Interest Foreign Power Interest Foreign and gas rate exchange and gas rate exchange swaps swaps forwards swaps swaps forwards
Unrealized gain (loss) in Non-regulated fuel for generation and purchased power — ineffective portion $ 2.1 $ — $ — $ —$ — $ —Realized gain (loss) in Non-regulated fuel for generation and purchased power (1.9) — — (10.7) — —Realized gain (loss) in Operating revenue — Regulated — — 1.7 — — —Realized gain (loss) in Income from equity investments — (0.5) — — (1.5) 3.6Realized gain (loss) in Interest expense, net — (3.2) — — — —
Total gains (losses) in Net income $ 0.2 $ (3.7)$ 1.7 $ (10.7)$ (1.5)$ 3.6
As at December 31 December 31
millions of Canadian dollars 2013 2012
Power Interest Foreign Power Interest Foreign and gas rate exchange and gas rate exchange swaps swaps forwards swaps swaps forwards
Total unrealized gain (loss) in AOCL — effective portion, net of tax $ 0.2 $ (1.9)$ (3.3)$ (7.9)$ (4.6)$ 4.5
The Company expects $0 .9 million of unrealized gains currently in AOCL to be reclassified into net income within the next twelve months, as the underlying hedged transactions settle .
As at December 31, 2013, the Company had the following notional volumes of outstanding derivatives designated as cash flow hedges that are expected to settle as outlined below:
millions 2014 2015 2016 2017 2018
Power swaps (megawatt hours (“MWh”)) purchases 0.4 0.3 0.3 0.3 0.3Foreign exchange forwards (EURO) purchases — 2.8 — — —Foreign exchange forwards (USD) sales $ 53.9 $ 40.5 $ 42.5 $ 42.0 $ 21.0

Notes to the Consolidated Financial Statements
Emera Inc . — Annual Report 2013 109
REGULATORY DEFERRAL
As previously noted, NSPI receives approval from the UARB for regulatory accounting treatment of gains and losses on certain derivatives documented as economic hedges, including certain physical contracts that do not qualify for the NPNS exemption .
The Company has recorded the following changes in realized and unrealized gains (losses) with respect to derivatives subject to regulatory accounting treatment:
For the Year ended December 31
millions of Canadian dollars 2013 2012
Physical Physical Commodity natural gas Foreign Commodity natural gas Foreign swaps and purchases exchange swaps and purchases exchange forwards and sales forwards forwards and sales forwards
Unrealized gain (loss) in regulatory assets $ (7.9)$ (0.3)$ 7.3 $ (16.3)$ (1.3)$ 22.8Unrealized gain (loss) in regulatory liabilities 5.8 (1.0) 35.5 (7.9) (1.2) (20.8)Realized gain (loss) in regulatory assets 0.2 — — 0.2 — —Realized gain (loss) in Inventory (1) (1.4) — 0.3 0.8 — (1.2)Realized gain (loss) in Regulated fuel for generation and purchased power (2) 6.4 (2.6) 0.2 41.7 (1.3) (1.3)Total gains (losses) on Derivative instruments $ 3.1 $ (3.9)$ 43.3 $ 18.5$ (3.8)$ (0.5)
(1) Realized gains (losses) will be recognized in fuel for generation and purchased power when the hedged item is consumed .(2) Realized gains (losses) on derivative instruments settled and consumed in the period; hedging relationships that have been terminated or the hedged transaction is no longer probable .
COMMODITY SWAPS AND FORWARDS
As at December 31, 2013, the Company had the following notional volumes of commodity swaps and forward contracts designated for regulatory deferral that are expected to settle as outlined below:
2014 2015 2016
millions Purchases Purchases Purchases
Coal (metric tonnes) 0.5 0.1 0.1Natural gas (Mmbtu) 6.4 0.5 —
FOREIGN EXCHANGE SWAPS AND FORWARDS
As at December 31, 2013, the Company had the following notional volumes of foreign exchange swaps and forward contracts designated for regulatory deferral that are expected to settle as outlined below:
2014 2015 2016 2017
Fuel purchases exposure (millions of US dollars) $ 227.0 $ 227.0 $ 160.0 $ 79.0Weighted average rate 1.0087 1.0083 1.0025 1.0228% of USD requirements 84% 77% 57% 30%

110 Emera Inc . — Annual Report 2013
HELD-FOR-TRADING DERIVATIVES
In the ordinary course of its business, Emera enters into physical contracts for the purchase and sale of natural gas, as well as power and natural gas swaps, forwards and futures to economically hedge those physical contracts . These derivatives are all considered HFT .
The Company has recognized the following realized and unrealized gains (losses) with respect to HFT derivatives:
For the Year ended December 31
millions of Canadian dollars 2013 2012
Power swaps and physical contracts in non-regulated operating revenues $ (2.6) $ 1.6Natural gas swaps, forwards, futures and physical contracts in non-regulated operating revenues 16.4 14.5Natural gas swaps, forwards, futures and physical contracts in non-regulated fuel for generation and purchased power 6.2 —
$ 20.0 $ 16.1
As at December 31, 2013, the Company had the following notional volumes of outstanding HFT derivatives that are expected to settle as outlined below:
millions 2014 2015 2016 2017 2018 2019
Natural gas purchases (Mmbtu) 222.4 54.5 57.6 48.3 47.4 47.4Natural gas sales (Mmbtu) 73.2 11.3 9.8 7.6 — —Power purchases (MWh) 0.2 — — — — —Power sales (MWh) 0.2 — — — — —
CREDIT RISK
The Company is exposed to credit risk with respect to amounts receivable from customers, energy marketing collateral deposits and derivative assets . Credit risk is the potential loss from a counterparty’s non-performance under an agreement . The Company manages credit risk with policies and procedures for counterparty analysis, exposure measurement, and exposure monitoring and mitigation . Credit assessments are conducted on all new customers and counterparties, and deposits or collateral are requested on any high risk accounts .
The Company assesses the potential for credit losses on a regular basis, and where appropriate, maintains provisions . With respect to counterparties, the Company has implemented procedures to monitor the creditworthiness and credit exposure of counterparties and to consider default probability in valuing the counterparty positions . The Company monitors counterparties’ credit standing, including those that are experiencing financial problems, have significant swings in default probability rates, have credit rating changes by external rating agencies, or have changes in ownership . Net liability positions are adjusted based on the Company’s current default probability . Net asset positions are adjusted based on the counterparty’s current default probability . The Company assesses credit risk internally for counterparties that are not rated .
As at December 31, 2013, the maximum exposure the Company has to credit risk is $630 .9 million (2012 — $443 .6 million), which includes accounts receivable net of collateral/deposits and assets related to derivatives .
It is possible that volatility in commodity prices could cause the Company to have material credit risk exposures with one or more counterparties . If such counterparties fail to perform their obligations under one or more agreements, the Company could suffer a material financial loss . The Company transacts with counterparties as part of its risk management strategy for managing commodity price, foreign exchange and interest rate risk . Counterparties that exceed established credit limits can provide a cash deposit or letter of credit to the Company for the value in excess of the credit limit where contractually required . The total cash deposits/collateral on hand as at December 31, 2013 was $61 .9 million (2012 — $53 .3 million), which mitigates the Company’s maximum credit risk exposure . The Company uses the cash as payment for the amount receivable or returns the deposit/collateral to the customer/counterparty where it is no longer required by the Company .
The Company enters into commodity master arrangements with its counterparties to manage certain risks, including credit risk to these counterparties . The Company generally enters into International Swaps and Derivatives Association agreements (“ISDA”), North American Energy Standards Board agreements (“NAESB”) and, or Edison Electric Institute agreements . The Company believes that entering into such agreements offers protection by creating contractual rights relating to creditworthiness, collateral, non-performance and default .

Notes to the Consolidated Financial Statements
Emera Inc . — Annual Report 2013 111
As at December 31, 2013, the Company had $79 .6 million (2012 — $70 .9 million) in financial assets, considered to be past due, which have been outstanding for an average of 82 days . The fair value of these financial assets is $64 .8 million (2012 — $62 .5 million), the difference of which is included in the allowance for doubtful accounts . These assets primarily relate to accounts receivable from electric revenue .
CONCENTRATION RISK
The Company’s concentrations of risk consisted of the following:
As at December 31, 2013 December 31, 2012
millions of millions of Canadian % of total Canadian % of total dollars exposure dollars exposure
Receivables, netRegulated utilitiesResidential $ 196.4 29% $ 168.7 34%Commercial 106.0 15% 91.3 18%Industrial 29.0 4% 28.2 6%Other 30.6 4% 24.5 5%
362.0 52% 312.7 63%
Trading groupCredit rating of A- or above 39.3 6% 14.2 3%Credit rating of BBB- to BBB+ 31.9 5% 23.0 5%Not rated — fully collateralized — 0% 4.5 1%Not rated 79.3 11% 41.8 8%
150.5 22% 83.5 17%
Other accounts receivable 69.3 10% 53.2 11%
581.8 84% 449.4 91%
Derivative Instruments(current and long-term)Credit rating of A- or above 71.5 10% 30.4 6%Credit rating of BBB- to BBB+ 25.3 4% 4.7 1%Not rated 14.1 2% 12.4 2%
110.9 16% 47.5 9%
$ 692.7 100% $ 496.9 100%
CASH COLLATERAL
Derivatives, as reflected on the Consolidated Balance Sheets, are not offset by the fair value amounts of cash collateral with the same counterparty . Rights to reclaim cash collateral are recognized in “Receivables, net” and obligations to return cash collateral are recognized in “Accounts payable” .
The Company’s cash collateral positions consisted of the following:
As at December 31 December 31
millions of Canadian dollars 2013 2012
Cash collateral provided to others $ 55.5 $ 31.4Cash collateral received from others 14.9 12.9
Collateral is posted in the normal course of business based on the Company’s creditworthiness, including its senior unsecured credit rating as determined by certain major credit rating agencies . Certain of the Company’s derivatives contain financial assurance provisions that require collateral to be posted if a material adverse credit-related event occurs . If a material adverse event resulted in the senior unsecured debt to fall below investment grade, the counterparties to such derivatives could request ongoing full collateralization .

112 Emera Inc . — Annual Report 2013
As at December 31, 2013, the total fair value of these derivatives, in a liability position, is $187 .0 million (December 31, 2012 — $57 .5 million) . If the credit ratings of the Company were reduced below investment grade the full value of the net liability position could be required to be posted as collateral for these derivatives .
16. Fair Value Measurements
The following tables set out the classification of the methodology used by the Company to fair value its derivatives:
As at December 31, 2013
millions of Canadian dollars Level 1 Level 2 Level 3 Total
AssetsCash flow hedgesPower and gas swaps $ 9.8 $ — $ 5.1 $ 14.9Foreign exchange forwards — 0.5 — 0.5
9.8 0.5 5.1 15.4
Regulatory deferralCommodity swaps and forwards Natural gas purchases and sales 6.3 — — 6.3Foreign exchange forwards — 44.8 — 44.8Physical natural gas purchases and sales — — 0.3 0.3
6.3 44.8 0.3 51.4
HFT derivativesPower swaps and physical contracts (0.5) — 1.3 0.8Natural gas swaps, futures, forwards, physical contracts and related transportation (0.1) 7.0 36.4 43.3
(0.6) 7.0 37.7 44.1
Total assets 15.5 52.3 43.1 110.9
LiabilitiesCash flow hedgesPower and gas swaps 0.6 — 2.8 3.4Foreign exchange forwards — 3.8 — 3.8
0.6 3.8 2.8 7.2
Regulatory deferralCommodity swaps and forwards Coal purchases — 7.8 — 7.8 Natural gas purchases and sales 0.1 — — 0.1Foreign exchange forwards — 0.4 — 0.4Physical natural gas purchases and sales — — 0.3 0.3
0.1 8.2 0.3 8.6
HFT derivativesPower swaps and physical contracts 2.5 — 1.1 3.6Natural gas swaps, futures, forwards and physical contracts (0.2) 39.4 128.4 167.6
2.3 39.4 129.5 171.2
Total liabilities 3.0 51.4 132.6 187.0
Net assets (liabilities) $ 12.5 $ 0.9 $ (89.5)$ (76.1)

Notes to the Consolidated Financial Statements
Emera Inc . — Annual Report 2013 113
As at December 31, 2012
millions of Canadian dollars Level 1 Level 2 Level 3 Total
AssetsCash flow hedgesPower and gas swaps $ 1.9 $ — $ 0.1 $ 2.0Foreign exchange forwards — 4.7 — 4.7
1.9 4.7 0.1 6.7
Regulatory deferralCommodity swaps and forwards Coal purchases — 1.8 — 1.8 Natural gas purchases and sales 0.4 — — 0.4Foreign exchange forwards — 14.0 — 14.0Physical natural gas purchases and sales — — 3.9 3.9
0.4 15.8 3.9 20.1
HFT derivativesPower swaps and physical contracts — — 0.9 0.9Natural gas swaps, futures, forwards and physical contracts 0.4 3.4 16.0 19.8
0.4 3.4 16.9 20.7
Total assets 2.7 23.9 20.9 47.5
LiabilitiesCash flow hedgesPower and gas swaps 0.5 — 1.0 1.5Foreign exchange forwards — 0.3 — 0.3Interest rate swaps — 6.5 — 6.5
0.5 6.8 1.0 8.3
Regulatory deferralCommodity swaps and forwards Coal purchases — 1.7 — 1.7 Natural gas purchases and sales 7.6 — — 7.6Foreign exchange forwards — 13.1 — 13.1
7.6 14.8 — 22.4
HFT derivativesPower swaps and physical contracts 0.1 — 0.5 0.6Natural gas swaps, futures, forwards and physical contracts 2.0 12.7 11.5 26.2
2.1 12.7 12.0 26.8
Total liabilities 10.2 34.3 13.0 57.5
Net assets (liabilities) $ (7.5)$ (10.4)$ 7.9 $ (10.0)

114 Emera Inc . — Annual Report 2013
The change in the fair value of the Level 3 financial assets for the year ended December 31, 2013 was as follows:
Cash flow hedges and Regulatory deferral HFT derivatives
Physical natural gas Natural millions of Canadian dollars purchases and sales Power gas Total
Balance, January 1, 2013 $ 3.9 $ 1.0 $ 16.0 $ 20.9 Increase (reduction) in benefit included in regulated fuel for generation and purchased power (2.6) — — (2.6)Increase (reduction) in benefit included in non-regulated fuel for generation and purchased power — 5.0 — 5.0 Unrealized gains (losses) included in regulatory assets or liabilities (1.0) — — (1.0)Total realized and unrealized gains (losses) included in non-regulated operating revenues — 0.4 20.4 20.8
Balance, December 31, 2013 $ 0.3 $ 6.4 $ 36.4 $ 43.1
The change in the fair value of the Level 3 financial liabilities for the year ended December 31, 2013 was as follows:
Cash flow hedges and Regulatory deferral HFT derivatives
Physical natural gas Natural millions of Canadian dollars purchases and sales Power gas Total
Balance, January 1, 2013 $ — $ 1.5 $ 11.5 $ 13.0 Increase (reduction) in benefit included in non-regulated fuel for generation and purchased power — 1.8 — 1.8 Unrealized gains (losses) included in regulatory assets or liabilities 0.3 — — 0.3Total realized and unrealized gains (losses) included in non-regulated operating revenues — 0.6 116.9 117.5
Balance, December 31, 2013 $ 0.3 $ 3.9 $ 128.4 $ 132.6
Emera’s Enterprise Risk Management group is responsible for valuation policies, processes and the measurement of fair value within Emera . The processes and methods of measurement for third-party pricing information and illiquid markets are developed with input and using the market knowledge of the trading operations within Emera and affiliates . The significant unobservable inputs used in the fair value measurement of Emera’s natural gas and power derivatives includes third-party-sourced pricing for instruments based on illiquid markets; internally developed correlation factors and basis differentials; own credit risk; and discount rates . Internally developed correlations and basis differentials are reviewed on a quarterly basis based on statistical analysis of the spot markets in the various illiquid term markets . Where possible, Emera will also source multiple broker prices in an effort to evaluate and substantiate these unobservable inputs . Discount rates may include a risk premium for those long-term forward contracts with illiquid future price points to incorporate the inherent uncertainty of these points . Any risk premiums for long-term contracts are evaluated by observing similar industry practices and in discussion with industry peers . Significant increases (decreases) in any of these inputs in isolation would result in a significantly lower (higher) fair value measurement .

Notes to the Consolidated Financial Statements
Emera Inc . — Annual Report 2013 115
The following table outlines quantitative information about the significant unobservable inputs used in the fair value measurements categorized within Level 3 of the fair value hierarchy:
As at December 31, 2013
Weighted millions of Canadian dollars Fair value Valuation technique Unobservable input Range average
AssetsCash flow hedges – $ 5.1 Modelled pricing Third-party pricing $29.76-$108.84 $51.96 Power and gas swaps Probability of default 0.19%-0.22% 0.21% Discount rate 5.98%-10.3% 7.70%
Regulatory deferral — Physical 0.3 Modelled pricing Third-party pricing $9.51-$22.40 $17.02natural gas purchases and sales Probability of default 0.03% 0.03%
HFT derivatives — Power swaps 1.3 Modelled pricing Third-party pricing $28.21-$149.82 $106.02 and physical contracts Correlation factor 0.96%-1.00% 0.98% Probability of default 0.12%-0.12% 0.12% Discount rate 0.00%-29.1% 2.67%
HFT derivatives — Natural gas 36.4 Modelled pricing Third-party pricing $3.91-$21.78 $7.65 swaps, futures, forwards, Probability of default 0.03%-32.1% 0.37% physical contracts Discount rate 0.00%-55.09% 6.51%
Total assets 43.1
Liabilities Cash flow hedges – $ 2.8 Modelled pricing Third-party pricing $28.21-$108.84 $54.52 Power and gas swaps Own credit risk 0.22%-0.22% 0.22% Discount rate 5.98%-10.29% 7.64%
Regulatory deferral — Physical 0.3 Modelled pricing Third-party pricing $9.51-$22.40 $18.58 natural gas purchases and sales Own credit risk 0.22% 0.22%
HFT derivatives — Power swaps 1.1 Modelled pricing Third-party pricing $29.76-$149.82 $86.83 and physical contracts Correlation factor 0.96%-1.0% 0.98% Own credit risk 0.22%-0.22% 0.22% Discount rate 0.00%-29.11% 5.15%
HFT derivatives — Natural gas 128.4 Modelled pricing Third-party pricing $3.79-$21.78 $10.99 swaps, futures, forwards and Own credit risk 0.22%-0.22% 0.22% physical contacts Discount rate 0.00%-7.41% 0.55%
Total liabilities 132.6
Net assets (liabilities) $ (89.5)

116 Emera Inc . — Annual Report 2013
As at December 31, 2012
Weighted millions of Canadian dollars Fair value Valuation technique Unobservable input Range average
AssetsCash flow hedges – $ 0.1 Modelled pricing Third-party pricing $38.85-$51.85 $42.03 Power and gas swaps Probability of default 0.13%-0.21% 0.14% Discount rate 3.73%-6.33% 4.80%
Regulatory deferral — Physical 3.9 Modelled pricing Third-party pricing $4.20-$10.32 $5.99 natural gas purchases and sales Probability of default 0.08%-1.27% 0.27%
HFT derivatives — Power swaps 0.5 Modelled pricing Third-party pricing $35.09-$72.04 $52.84 and physical contracts Probability of default 0.12%-0.13% 0.12% Discount rate 0.00%-0.26% 0.06%
0.4 Modelled pricing Third-party pricing $35.09-$59.81 $40.40 Correlation factor 1.0%-1.0% 1.00% Probability of default 0.15%-0.15% 0.15% Discount rate 0.00%-0.26% 0.08%
HFT derivatives — Natural gas 10.1 Modelled pricing Third-party pricing $3.71-$14.10 $4.76 swaps, futures, forwards and Probability of default 0.08%-1.53% 1.21% physical contracts Discount rate 0.00%-52.92% 13.30%
5.9 Modelled pricing Third-party pricing $3.038-$13.234 $5.29 Basis adjustment (0.12)%-0.47% 0.24% Probability of default 0.06%-3.02% 1.46% Discount rate 0.00%-2.64% 0.275%
Total assets 20.9
Liabilities Cash flow hedges – $ 1.0 Modelled pricing Third-party pricing $38.85-$51.85 $41.65 Power and gas swaps Probability of default 0.13%-0.13% 0.13% Discount rate 3.73%-6.33% 4.63%
HFT derivatives — Power swaps 0.5 Modelled pricing Third-party pricing $35.09-$72.04 $52.76 and physical contracts Own credit risk 0.13%-0.13% 0.13% Discount rate 0.00%-0.26% 0.06%
HFT derivatives — Natural gas 10.5 Modelled pricing Third-party pricing $3.789-$14.100 $6.86 swaps, futures, forwards and Own credit risk 0.13%-0.13% 0.13% physical contracts Discount rate 0.00%-2.02% 0.35%
1.0 Modelled pricing Third-party pricing $3.038-$14.100 $5.89 Basis adjustment (0.12)%-0.47% 0.27% Own credit risk 0.13%-0.13% 0.13% Discount rate 0.00%-3.63% 0.43%
Total liabilities 13.0
Net assets (liabilities) $ 7.9
The financial assets and liabilities included on the Consolidated Balance Sheets that are not measured at fair value consisted of the following:
As at December 31, 2013 December 31, 2012
Carrying Carrying millions of Canadian dollars amount Fair value amount Fair value
Long-term debt (including current portion) $3,692.0 $4,069.8 $3,694.5 $4,328.4
Notes to the Consolidated Financial Statements
Emera Inc . — Annual Report 2013 117
The fair values of long-term debt instruments, classified as level 3 in the fair value hierarchy, are estimated based on the quoted market price for the same or similar issues, or on the current rates offered to the Company for debt of the same remaining maturity, without considering the effect of third-party credit enhancements .
All other financial assets and liabilities, such as cash and cash equivalents, restricted cash, accounts receivable, short-term debt and accounts payable, are carried at cost . The carrying value approximates fair value due to the short-term nature of these financial instruments .
17. Regulatory Matters
NSPI
NSPI is a public utility as defined in the Public Utilities Act of Nova Scotia (the “Act”) and is subject to regulation under the Act by the UARB . The Act gives the UARB supervisory powers over NSPI’s operations and expenditures . Electricity rates for NSPI’s customers are also subject to UARB approval . NSPI is not subject to a general annual rate review process, but rather participates in hearings held from time to time at NSPI’s or the UARB’s request .
NSPI is regulated under a cost-of-service model, with rates set to recover prudently incurred costs of providing electricity service to customers, and provide an appropriate return to investors . NSPI’s target regulated return on equity (“ROE”) range for 2013 was 8 .75 per cent to 9 .25 per cent (2012 — 9 .1 per cent to 9 .5 per cent) based on an actual average regulated common equity component of up to 40 per cent of actual average regulated capitalization . NSPI has a FAM, which enables NSPI to seek recovery of fuel costs through regularly scheduled rate adjustments . Differences between actual fuel costs and amounts recovered from customers through electricity rates in a year are deferred to a FAM regulatory asset or liability and recovered from or returned to customers in a subsequent year .
On December 21, 2012, the UARB approved a GRA settlement agreement between NSPI and customer representatives which resulted in an average net rate increase of 3 per cent by customer class effective January 1, 2013 and January 1, 2014 . To achieve the net 3 per cent increase in rates, the UARB approved a rate stabilization plan in which a portion of non-fuel costs from 2013 and 2014 may be deferred for future recovery . NSPI committed to $27 .5 million in non-fuel cost savings over a two-year period beginning in fiscal 2013 . As part of the rate stabilization plan, any earnings in excess of NSPI’s target ROE range, over the two year period, will reduce the amount deferred . The UARB has stipulated the rate stabilization regulatory asset cannot exceed $83 .3 million as at December 31, 2014 . The deferral recovery was approved to begin in 2015 when certain other regulatory assets are fully amortized . The 2013 GRA settlement agreement reduced NSPI’s targeted regulated ROE range for 2013 and 2014 to 8 .75 per cent to 9 .25 per cent, down from the 2012 range of 9 .1 per cent to 9 .5 per cent, based on an actual average regulated common equity component of up to 40 per cent, which is unchanged from 2012 .
On December 21, 2012, the UARB disallowed $4 .5 million of fuel-related costs to be applied against the 2013 FAM balance . Including interest of $0 .7 million, this resulted in an after-tax impact to 2012 net income of $3 .6 million . The decision also disallowed $2 .0 million, which was applied in 2012 and reduced a regulatory asset owed from customers .
In May 2011, NSPI filed a GRA with the UARB requesting an average 7 .3 per cent rate increase across all customer classes effective January 1, 2012 . In November 2011, the UARB approved a settlement agreement between NSPI and customer representatives which resulted in an average rate increase of 5 .1 per cent for all customers, effective January 1, 2012 . Rates were approved based on a 9 .2 per cent regulated ROE, applied to a 37 .5 per cent regulated common equity component, with a target ROE range of 9 .1 per cent to 9 .5 per cent on maximum actual average regulated common equity of 40 per cent .
ENL
On May 17, 2012, the province of Nova Scotia passed the Maritime Link Act, in order to enable a project-specific review of the Maritime Link Project by the Nova Scotia UARB . Pursuant to the Maritime Link Act, the Province announced the Maritime Link Approval Process Regulations on October 2, 2012, setting out the approval process to be followed for the Maritime Link Project .
On July 22, 2013, NSPML, a wholly owned subsidiary of ENL, received the UARB decision on the Maritime Link Project . The UARB approved the Maritime Link Project subject to certain conditions, including an assurance that additional market-priced energy will be available to Nova Scotians . The UARB approved NSPML’s requested project cost of $1 .52 billion, as well as the requested variance amount of $60 million, for total approved project costs of $1 .58 billion, plus allowance for funds used during construction .
On October 21, 2013, NSPML filed the Maritime Link Compliance Filing with the UARB . The compliance filing sought confirmation from the UARB that NSPML has complied with each of the UARB conditions, including the condition relating to the availability of market-priced energy .
On November 29, 2013, the UARB approved the Maritime Link Compliance Filing and gave its final approval of the Maritime Link Project . Subsequent to the UARB approval, the Nova Scotia government passed legislative amendments to the Maritime Link Act, which clarified certain aspects of the regulatory framework in respect of the Maritime Link Project and provides NSPML with certain legal rights to facilitate the development and operation of the Maritime Link Project .

118 Emera Inc . — Annual Report 2013
On December 13, 2013, NSPML filed its first quarterly compliance filing with the UARB, which included an updated capital cost estimate for the Maritime Link Project of $1 .577 billion . Based upon this cost estimate and the application of the terms of the agreement with Nalcor Energy, whereby NSPML will pay 20 per cent of the total cost of the LCP Phase I and Maritime Link projects, the amount of this cost estimate that will be NSPML’s responsibility will be $1 .5554 billion .
MAINE UTILITIES
Both Bangor Hydro and MPS’s core businesses are the transmission and distribution of electricity, with distribution operations and stranded cost recoveries regulated by the Maine Public Utilities Commission (“MPUC”) . Each Company’s transmission operations are regulated by the Federal Energy Regulatory Commission (“FERC”) . The rates for these three elements are established in distinct regulatory proceedings .
Distribution OperationsMaine Utilities’ distribution businesses operate under a traditional cost-of-service regulatory structure . Distribution rates are set by the MPUC based on an allowed ROE of 10 .2 per cent, on a common equity component of 50 per cent .
Transmission OperationsBangor HydroBangor Hydro’s local transmission rates are set and regulated by the FERC annually on June 1, based upon a formula utilizing prior year actual transmission investments and expenses, adjusted for current year forecasted transmission investments and expenses . The allowed ROE for these local transmission investments is 11 .14 per cent . The common equity component is based upon the prior calendar year actual average balances . On June 1, 2013, Bangor Hydro’s local transmission rates decreased by approximately 5 per cent (2012 — increased 4 per cent) .
Bangor Hydro’s bulk transmission assets are managed by the ISO-New England (“ISO”) as part of a region-wide pool of assets . The ISO manages the regions’ bulk power generation and transmission systems and administers the open access transmission tariff . Currently, Bangor Hydro, along with all other participating transmission providers, recovers the full cost of service for its transmission assets from the customers of participating transmission providers in New England, based on a regional formula determined by FERC that is updated on June 1 of each year . This formula is based on prior year regionally funded transmission investments and expenses, adjusted for current year forecasted investments and expenses . Bangor Hydro’s allowed ROE for these transmission investments ranges from 11 .64 per cent to 12 .64 per cent, and the common equity component is based upon the prior calendar year average balances . The participating transmission providers are also required to contribute to the cost of service of such transmission assets on a ratable basis according to the proportion of the total New England load that their customers represent .
On June 1, 2013, Bangor Hydro’s regionally recoverable transmission investments and expenses decreased by 1 per cent (2012 — increased by 18 per cent) .
MPSMPS local transmission rates are set and regulated by the FERC annually on June 1, based upon a formula utilizing prior year actual transmission investments and expenses, adjusted for current year forecasted investments . These rates go into effect June 1 for wholesale customers and July 1 for retail customers . The current allowed ROE for transmission operations is 9 .75 per cent . The common equity component is based upon the prior calendar year actual average balances . On June 1, 2013, MPS’s transmission rates increased by 21 per cent for wholesale customers (June 1, 2012 — increased 9 per cent ; July 1, 2012 decreased 17 per cent) and by 67 per cent for retail customers on July 1, 2013 (2012 — decreased 5 per cent) .
MPS’s electric service territory is not interconnected to the New England bulk power system, and MPS is not a member of the ISO .
Stranded Cost RecoveriesStranded cost recoveries in Maine are set by the MPUC . Electric utilities are entitled to recover all prudently incurred stranded costs resulting from the restructuring of the industry in 2000 that could not be mitigated or that arose as a result of rate and accounting orders issued by the MPUC . Unlike transmission and distribution operational assets, which are generally sustained with new investment, the net stranded cost regulatory asset pool diminishes over time as elements are amortized through charges to income and recovered through rates . Generally, regulatory rates to recover stranded costs are set every three years, determined under a traditional cost-of-service approach and are fully recoverable .
Bangor HydroBangor Hydro’s net regulatory assets primarily include the costs associated with the restructuring of an above-market power purchase contract, the unamortized portion on its loss on the sale of its investment in the Seabrook nuclear facility and deferrals associated with reconciling stranded costs . These net regulatory assets total approximately $65 .4 million as at December 31, 2013 (2012 — $63 .9 million) or 7 .2 per cent of Bangor Hydro’s net asset base (2012 — 7 .5 per cent) .

Notes to the Consolidated Financial Statements
Emera Inc . — Annual Report 2013 119
In May 2011, the MPUC approved an approximate 27 per cent increase in Bangor Hydro’s stranded cost rates for the period of June 1, 2011 to February 28, 2014 . The increased stranded cost revenues are offset, for the most part, by changes in regulatory amortizations, purchased power expense and resale of purchased power . The allowed ROE used in setting these new stranded cost rates is 7 .4 per cent, with a common equity component of 48 per cent .
While the stranded cost revenue requirements differ throughout the period due to changes in annual stranded costs, the actual annual stranded cost revenues are the same during the period . To levelize the impact of the varying revenue requirements, cost or revenue deferrals are recorded as a regulatory asset or liability, and addressed in subsequent stranded cost rate proceedings, where customer rates are adjusted accordingly .
MPSIn December 2011, the MPUC approved MPS’s stranded cost rates for the three-year period January 1, 2012 through December 31, 2014 . This revised three-year agreement, which amortizes essentially all of MPS’s remaining stranded costs, and resulted in an approximately 50 per cent rate decrease, has an ROE of 7 .2 per cent and a common equity component of 50 per cent . Any residual stranded costs remaining after December 31, 2014 will be recovered in future rate proceedings .
THE BARBADOS LIGHT & POWER COMPANY LIMITED
BLPC is a vertically integrated utility and provider of electricity on the island of Barbados .
BLPC is subject to regulation under the Utilities Regulation (Procedural) Rules 2003 by Fair Trading Commission (“The Rules”), Barbados, an independent regulator . The Rules give the Fair Trading Commission, Barbados utility regulation functions which include establishing principles for arriving at rates to be charged, monitoring the rates charged to ensure compliance, and setting the maximum rates for regulated utility services . The government of Barbados has granted BLPC a franchise to produce, transmit and distribute electricity on the island until 2028 .
BLPC is regulated under a cost-of-service model, with rates set to recover prudently incurred costs of providing electricity service to customers, and providing an appropriate return to investors . BLPC’s approved regulated return on rate base for 2013 and 2012 is 10 per cent .
All BLPC fuel costs are passed to customers through the fuel clause adjustment fuel charge . Fair Trading Commission, Barbados has approved the calculation of the fuel charge, which is adjusted on a monthly basis .
DOMINICA ELECTRICITY SERVICES LIMITED
DOMLEC is an integrated utility on the island of Dominica and is regulated by the Independent Regulatory Commission, Dominica .
On October 7, 2013, the Independent Regulatory Commission, Dominica issued a Transmission, Distribution & Supply License and a Generation License, both of which will come into effect on January 1, 2014 for a period of 25 years . These new licenses will replace the existing license, which was due to expire on December 31, 2015 .
GRAND BAHAMA POWER COMPANY LIMITED
GBPC is a vertically integrated utility and sole provider of electricity on Grand Bahama Island . The Grand Bahama Port Authority (“GBPA”) regulates the utility and has granted GBPC a licensed, regulated and exclusive franchise to produce, transmit and distribute electricity on the island until 2054 . There is a fuel pass-through mechanism and flexible tariff adjustment policy to ensure that fuel costs are recovered and a reasonable return earned . Effective July 1, 2012, GBPC’s approved regulated return on rate base for 2012 is 10 per cent .
As a component of its regulatory agreement with the GBPA, GBPC has an Earnings Share Mechanism to allow for earnings above or below its approved 10 per cent return on rate base to be deferred to a regulatory asset or liability at the rate of 50 per cent of amounts below a 9 per cent return on rate base and 50 per cent of amounts above 11 per cent return on rate base respectively . GBPC recorded a regulatory asset of $2 .6 million USD related to the Earnings Share Mechanism for the period of July 1, 2012 to December 31, 2013 . GBPC will amortize this deferral into income beginning in 2016 .
Until June 30, 2012, the base rate included $20 USD per barrel of oil consumed by GBPC for generation of electricity . The amount by which actual fuel costs exceeded $20 USD dollars per barrel was recovered or rebated through the fuel charge, which was adjusted on a monthly basis . The methodology for calculating the amount of the fuel charge was approved by GBPA .
Effective July 1, 2012, all GBPC fuel costs are passed to customers through the fuel charge . The GBPA has approved the calculation of the fuel charge, which is adjusted on a monthly basis .

120 Emera Inc . — Annual Report 2013
BRUNSWICK PIPELINE
Brunswick Pipeline is a 145-kilometre pipeline delivering natural gas from the Canaport™ re-gasified Liquefied Natural Gas (“LNG”) import terminal near Saint John, New Brunswick to markets in the northeastern United States . Brunswick Pipeline entered into a 25-year firm service agreement commencing in July 2009 with Repsol Energy Canada . The pipeline is considered a Group II pipeline regulated by the National Energy Board (“NEB”) . The NEB Gas Transportation Tariff is filed by Brunswick Pipeline in compliance with the requirements of the NEB Act and sets forth the terms and conditions of the transportation rendered by Brunswick Pipeline .
REGULATORY ASSETS AND LIABILITIES
Regulatory assets represent incurred costs that have been deferred because it is probable that they will be recovered through future rates or tolls collected from customers . Management believes that existing regulatory assets are probable of recovery either because the Company received specific approval from the appropriate regulator, or due to regulatory precedent set for similar circumstances . If management no longer considers it probable that an asset will be recovered, the deferred costs are charged to income .
Regulatory liabilities represent obligations to make refunds to customers or to reduce future revenues for previous collections . If management no longer considers it probable that a liability will be settled, the related amount is recognized in income .
Regulatory assets and liabilities consisted of the following:
As at December 31 December 31
millions of Canadian dollars 2013 2012
Regulatory assetsDeferred income tax regulatory asset $ 318.3 $ 166.9Fuel adjustment mechanism 86.4 43.1Unamortized defeasance costs 60.3 70.5Large industrial customers fixed cost deferral 33.0 46.7Stranded cost recovery 22.8 21.3Stranded cost revenue and purchase power reconciliation deferrals 10.3 8.5Deferrals related to derivative instruments 9.9 22.6Smart Grid 9.6 8.3Purchase power contracts 8.3 9.5Pension and post-retirement medical plan 6.3 12.5Hydro-Quebec Obligation 5.9 5.4Seabrook nuclear project 5.2 8.2Asset impairment recovery 4.5 4.5Maine ice storm 3.8 —Rate stabilization fixed cost deferral 3.7 —Deferral of income and capital taxes not included in Q1 2005 rates 3.3 5.6Deferred leasing costs 1.7 4.9Pre-2003 income tax and related interest — 14.0Other 22.8 21.6
$ 616.1 $ 474.1
Current $ 58.3 $ 97.7Long-term 557.8 376.4
Total regulatory assets $ 616.1 $ 474.1
Regulatory liabilitiesSelf-Insurance Fund $ 66.3 $ 66.2Deferrals related to derivative instruments 51.5 20.9Deferred income tax regulatory liabilities 26.7 22.1Other 6.7 1.5
$ 151.2 $ 110.7
Current $ 31.7 $ 18.2Long-term 119.5 92.5
Total regulatory liabilities $ 151.2 $ 110.7

Notes to the Consolidated Financial Statements
Emera Inc . — Annual Report 2013 121
DEFERRED INCOME TAX REGULATORY ASSET AND LIABILITY
To the extent deferred income taxes are expected to be recovered from or returned to customers in future rates, a regulatory asset or liability is recognized .
FUEL ADJUSTMENT MECHANISM
As discussed in Note 5, the UARB approved the implementation of a FAM for NSPI effective January 1, 2009 .
millions of Canadian dollars 2013 2012
FAM regulatory asset — Balance as at January 1 $ 43.1 $ 93.7Under (over) recovery of current year’s fuel costs 67.6 15.7Rebate to (recovery from) customers of prior years’ fuel costs (29.8) (65.9)FAM audit disallowance including interest adjustment — (5.2)Interest on FAM balance 5.5 4.8
FAM regulatory asset — Balance as at December 31 $ 86.4 $ 43.1
UNAMORTIZED DEFEASANCE COSTS
Upon privatization in 1992, NSPI became responsible for managing a portfolio of defeasance securities held in trust that provide the principal and interest streams to match the related defeased debt, which as at December 31, 2013, totalled $0 .9 billion (2012 — $0 .8 billion) . The excess of the cost of defeasance investments over the face value of the related debt is deferred on the balance sheet and amortized over the life of the defeased debt as permitted by the UARB .
LARGE INDUSTRIAL CUSTOMERS FIXED COST DEFERRAL
As discussed in Note 5, the UARB approved the implementation of the 2012 Large Industrial Customers fixed cost regulatory deferral for NSPI effective January 1, 2012 with recovery commencing on January 1, 2013 .
Details of the large industrial customers regulatory asset, classified in “Regulatory assets” on the Consolidated Balance Sheets are summarized in the following table:
millions of Canadian dollars 2013 2012
Large industrial customers regulatory asset — Balance as at January 1 $ 46.7 $ —Under recovery of 2012 large industrial customers non-fuel revenue — 44.7Recovery of regulatory asset recorded as regulatory amortization (16.7) —Interest on large industrial customers FCR balance 3.0 2.0
Large industrial customers regulatory asset — Balance as at December 31 $ 33.0 $ 46.7
STRANDED COST RECOVERY
Due to the decommissioning of the steam turbine during the year, the GBPA approved the recovery of a $21 .4 million USD stranded cost through future electricity rates . These amounts are scheduled to be recovered beginning January 1, 2016 .
STRANDED COST REVENUE AND PURCHASED POWER RECONCILIATION DEFERRAL
Bangor Hydro and MPS have full recovery of stranded cost revenues and expenses, with deferral of variances between actual amounts and those used to set rates . Stranded cost rates are adjusted periodically to account for these cost deferrals .
DEFERRALS RELATED TO DERIVATIVE INSTRUMENTS
NSPI defers changes in fair value of derivatives that are documented as economic hedges or that do not qualify for normal purchase normal sale (“NPNS”) exemption, as a regulatory asset or liability as approved by the UARB . The realized gain or loss is recognized when the hedged item settles in fuel for generation and purchased power or inventory, depending on the nature of the item being economically hedged .

122 Emera Inc . — Annual Report 2013
SMART GRID
In 2010, Bangor Hydro received an Accounting Order from the MPUC which allowed for the deferral of costs associated with Bangor Hydro’s Smart Grid project for future recovery .
PURCHASE POWER CONTRACTS
Bangor Hydro has power purchase contracts, which it was required to negotiate when oil prices were high, with several independent power producers . Bangor Hydro attempted to alleviate the adverse impact of these high-cost contracts and in doing so incurred costs to restructure certain of the contracts . The MPUC has allowed Bangor Hydro to defer these costs and recover them in stranded cost rates . The contract restructuring costs are being recovered over a 20-year period ending in June 2018 . In 2011, Bangor Hydro entered into a 20-year power purchase contract with a 60 MW wind farm to purchase 20 per cent of the energy generated . Also in 2011, Bangor Hydro entered into a 20-year power purchase contract with a 1 MW biomass generator to purchase 100 per cent of the energy generated . As with the Company’s other power purchase contracts, the MPUC has allowed Bangor Hydro full cost recovery for these contracts .
PENSION AND POST-RETIREMENT MEDICAL PLAN
As a result of purchase accounting, all unrecognized actuarial gains and losses, prior service cost, and the net transition asset/liability associated with the pension and post-retirement medical benefit plans were eliminated as a result of the Bangor Hydro and MPS mergers with Emera . As a result of regulatory accounting, a regulatory asset of $30 million, equal to these unrecognized amounts, was established at the merger dates . Bangor Hydro and MPS are amortizing the regulatory asset balance over the same period at which the corresponding gains and losses were being amortized when they were a component of pension and post-retirement benefit expense .
HYDRO-QUEBEC OBLIGATION
The obligation associated with Hydro-Quebec represents the estimated present value of Bangor Hydro’s estimated future payments for net costs associated with ownership and operation of the Hydro-Quebec intertie between the New England utilities and Hydro-Quebec . The obligation has been recognized in other liabilities and the MPUC has permitted recovery of this obligation . The regulatory asset and obligation are being reduced as expenses are incurred, with the reduction of the regulatory asset amortized to purchase power expense .
SEABROOK NUCLEAR PROJECT
Bangor Hydro and MPS were participants in the Seabrook nuclear project in Seabrook, New Hampshire . In 1986 Bangor and MPS sold their respective interests with a combined cost of approximately $179 .1 million . Both companies reached separate agreements with the MPUC providing for the recovery through customer rates of, in Bangor Hydro’s case, 70 per cent of 1984 year-end investment in Seabrook Unit 1 over 30 years ending in October 2015 and, in MPS’s case, 60 per cent of costs associated with Seabrook Units 1 and 2 over 30 years ending in 2016 . In the last MPS stranded cost rate case, the Seabrook amortization period was revised so that the regulatory asset will be fully amortized at the end of 2014 .
ASSET IMPAIRMENT RECOVERY
On July 14, 2011, GBPA approved the recovery of a $4 .7 million asset impairment charge recorded in 2010 . As a result, the charge was reversed through earnings in Q3 2011, and instead recorded as a regulatory asset which will be amortized into income over a 25-year period commencing upon completion of the new 52 MW diesel generation unit, scheduled to be on line mid-2012 .
MAINE ICE STORM
In late December 2013, Bangor Hydro experienced a major ice storm in its service territory, with over one-third of the Company’s customers experiencing power outages at the peak of the storm . Due to the volume of power outages and significant damage to Bangor Hydro’s electrical system in certain areas, numerous outside resources were utilized to assist with the restoration of electrical service . The total incremental costs associated with the service restoration during the ice storm amounted to approximately $3 .8 million, and the Company has recorded this amount as a regulatory asset on its consolidated balance sheets as at December 31, 2013 . Given the significance of the storm-related costs, Bangor Hydro believes there is strong regulatory precedence for rate recovery of these costs through a regulatory filing with the MPUC, and plans to make such filing in the first quarter of 2014 . Rate recovery would likely be aligned with Bangor Hydro’s distribution rate proceeding currently in progress at the MPUC .

Notes to the Consolidated Financial Statements
Emera Inc . — Annual Report 2013 123
RATE STABILIZATION FIXED COST DEFERRAL
As discussed in Note 5, the UARB approved the implementation of the 2013/2014 rate stabilization fixed cost regulatory deferral for NSPI effective January 1, 2013 .
Details of the rate stabilization regulatory asset, classified in “Regulatory assets” on the Consolidated Balance Sheets, are summarized in the following table:
millions of Canadian dollars 2013
Rate stabilization regulatory asset — Balance as at January 1 $ —Under (over) recovered current year non-fuel costs 3.0Interest on rate stabilization FCR balance 0.7
Rate stabilization regulatory asset — Balance as at December 31 $ 3.7
DEFERRAL OF INCOME AND CAPITAL TAXES NOT INCLUDED IN Q1 2005 RATES
The UARB agreed to allow NSPI to defer taxes not reflected in rates for the period January 1, 2005 until April 1, 2005, the date when new rates became effective . As a result, NSPI deferred $16 .7 million, consisting of $4 .5 million of provincial and federal grants and $12 .2 million in income taxes . The UARB approved recovery of this regulatory asset over eight years, commencing April 1, 2007 .
DEFERRED LEASING COSTS
On April 12, 2011, GBPA approved, as part of the fuel surcharge, the recovery of the net costs of leasing the temporary generation required to meet peak demand for electricity until the commission of a new 52 MW power plant . The amount by which the actual cost of the temporary generation exceeds what has been recovered through the fuel surcharge has been recorded as a regulatory asset, which will be amortized into income .
PRE-2003 INCOME TAX AND RELATED INTEREST
NSPI has a regulatory asset related to pre-2003 income taxes that have been paid, but not yet recovered from customers as a result of capital cost allowance deductions NSPI claimed in its corporate income tax return that were disallowed in a Supreme Court decision . NSPI applied to the UARB to include recovery of these costs in customer rates . In February 2007, the UARB approved recovery of this regulatory asset over eight years, commencing April 1, 2007 .
In January 2010, NSPI reached an agreement with stakeholders on its calculation of the Company’s regulated ROE . The agreement provides NSPI with flexibility in amortizing its pre-2003 income tax regulatory asset such that NSPI has flexibility in recognizing additional amortization in current periods and reducing amortization in future periods . The approval of the 2012 and 2013 General Rate Decision provided continuation of this flexibility for 2012, 2013 and 2014 . For the year ended December 31, 2013, NSPI recorded no additional discretionary regulatory amortization expense (2012 — $9 .8 million) .
As part of the FAM audit decision, the UARB disallowed $2 .0 million, which was applied in 2012 against this deferral .
SELF-INSURANCE FUND
LPH has established a SIF primarily for the purpose of building a fund to cover risk against damage and consequential loss to certain generating, transmission and distribution systems . LPH holds a variable interest in the SIF, for which it was determined that LPH was the primary beneficiary and, accordingly, the SIF must be consolidated by LPH . In its determination that LPH controls the SIF, management considered that in substance the activities of the SIF are being conducted on behalf of LPH’s subsidiary BLPC and BLPC, alone, obtains the benefits from the SIF’s operations . Additionally, because LPH, through BLPC, has rights to all the benefits of the SIF, it is also exposed to the risks related to the activities of the SIF . Any withdrawal of SIF Fund assets by the Company would be subject to existing regulations .

124 Emera Inc . — Annual Report 2013
18. Other Current Assets
Other current assets consisted of the following:
As at December 31 December 31
millions of Canadian dollars 2013 2012
Net investment in direct financing lease $ 3.1 $ 1.8Dividend receivable 4.2 2.7Capitalized transportation capacity 55.2 —
$ 62.5 $ 4.5
19. Property, Plant and Equipment
Property, plant and equipment consisted of the following regulated and non-regulated assets:
As at December 31 December 31
millions of Canadian dollars 2013 2012
Generation $4,290.3 $3,347.0Transmission 1,215.2 1,357.6Distribution 2,085.2 1,731.9General plant and other 684.3 726.6
Total cost 8,275.0 7,163.1Less: Accumulated depreciation (3,183.1) (2,952.1)
5,091.9 4,211.0Construction work in progress 235.8 280.1
Net book value $5,327.7 $4,491.1
For the year ended December 31, 2013, AFUDC of $14 .5 million (2012 — $29 .4 million) was capitalized to “Property, plant and equipment” .
As a result of regulator-approved accounting policies and depreciation rates, NSPI, Bangor Hydro and MPS defer certain costs within “Property, plant and equipment” that would not otherwise be deferred in the absence of rate regulation . Cumulative differences between items recognized for rate regulatory purposes and applicable accounting standards including depreciation rates, AFUDC and overhead costs, cannot be separately determined . Cumulative deferred accretion expense related to AROs were $12 .7 million as at December 31, 2013 (2012 — $15 .1 million) .

Notes to the Consolidated Financial Statements
Emera Inc . — Annual Report 2013 125
20. Net Investment in Direct Financing Lease
Brunswick Pipeline commenced service on July 16, 2009, transporting re-gasified LNG for Repsol Energy Canada under a 25-year firm service agreement . The agreement meets the definition of a direct financing capital lease for accounting purposes . The net investment in direct financing lease consists of the sum of the minimum lease payments and residual value net of estimated executory costs and unearned income . The unearned income is recognized in income over the life of the lease using a constant rate of interest equal to the internal rate of return on the lease . Net investment in direct financing lease consisted of the following:
As at December 31 December 31
millions of Canadian dollars 2013 2012
Total minimum lease payments to be received $1,323.2 $1,382.0Less: amounts representing estimated executory costs (231.5) (240.8)
Minimum lease payments receivable $1,091.7 $1,141.2Estimated residual value of leased property (unguaranteed) 183.0 183.0Less: unearned finance lease income (784.4) (832.3)
Net investment in direct financing lease $ 490.3 $ 491.9
Principal due within one year (included in “Other current assets”) 3.1 1.9
Net investment in direct financing lease — long-term $ 487.2 $ 490.0
Future minimum lease payments to be received for the next five years:
For the Year ended December 31
millions of Canadian dollars 2014 2015 2016 2017 2018
Minimum lease payments to be received $ 60.0 $ 61.6 $ 61.6 $ 61.6 $ 61.6Less: amounts representing estimated executory costs (9.4) (9.6) (9.8) (9.9) (10.1)
Minimum lease payments receivable $ 50.6 $ 52.0 $ 51.8 $ 51.7 $ 51.5

126 Emera Inc . — Annual Report 2013
21. Available-For-Sale Investments
The available-for-sale investments consists primarily of investments in debt and equity investments held in trust on behalf of BLPC’s Self Insurance Fund (“SIF”) for the purpose of building an insurance fund to cover risk against damage and consequential loss to certain of BLPC’s generating, transmission and distribution systems . Any withdrawal of SIF Fund assets by the Company would be subject to existing regulations .
As at December 31, 2012, available-for-sale investments included APUC subscription receipts, which were readily convertible to common shares of APUC upon regulatory approval . Regulatory approval was received in Q1 2013, and the subscription receipts were subsequently converted to common shares .
Emera has classified these investments as available-for-sale and recorded all such investments at their fair market value as at December 31, 2013 .
Available-for-sale financial assets measured at fair value include the following:
As at December 31
millions of Canadian dollars Level 1 Level 2 Level 3 2013
Common shares $ 12.4 $ — $ — $ 12.4Mutual funds — 31.6 — 31.6Corporate bonds, debentures, short and medium term notes — 21.4 — 21.4Government bonds — 8.8 — 8.8
$ 12.4 $ 61.8 $ — $ 74.2
As at December 31
millions of Canadian dollars Level 1 Level 2 Level 3 2012
Common shares $ 12.3 $ — $ — $ 12.3Mutual funds (1) — 23.5 — 23.5Corporate bonds, debentures, short and medium term notes — 21.9 — 21.9Government bonds — 7.1 — 7.1Subscription receipts convertible to common shares — 77.0 — 77.0
$ 12.3 $ 129.5 $ — $ 141.8
(1) Balance was retroactively reclassified from Level 1 to Level 2, effective Q4 2012 .
The fair value of financial instruments traded in active markets is based on quoted market prices at the balance sheet date . The quoted market price used for financial assets is the current bid price at the balance sheet date .
The change in available-for-sale assets is as follows:
As at December 31 December 31
millions of Canadian dollars 2013 2012
Balance, beginning of the year $ 141.8 $ 54.6Additions, net of foreign exchange loss 38.7 85.0Disposals (91.9) (14.4)
$ 88.6 $ 125.2
Change in fair valueGain (loss) recognized in regulatory liability 0.2 1.7Realized (loss) gain recognized in income (23.3) —Gain (loss) recognized in other comprehensive income during the period 8.7 14.9
$ (14.4) $ 16.6
Balance, end of the period $ 74.2 $ 141.8

Notes to the Consolidated Financial Statements
Emera Inc . — Annual Report 2013 127
There were no impairment provisions for available-for-sale investments for the years ended December 31, 2013 and 2012 .
The maturity profile of debt securities included in the available-for-sale assets is as follows:
As at December 31 December 31
millions of Canadian dollars 2013 2012
Maturity within 1 year $ 5.2 $ 12.9Maturity in 1—5 years 25.0 16.1
$ 30.2 $ 29.0
The maximum exposure to credit risk at the reporting date is the carrying value of the debt securities . None of these financial instruments are either past due or impaired .
22. Goodwill
The change in goodwill for the years ended December 31 is due to the following:
millions of Canadian dollars 2013 2012
Balance, January 1 $ 193.5 $ 197.7Change in foreign exchange rate 13.0 (4.2)
Balance, December 31 $ 206.5 $ 193.5
23. Related Party Transactions
In the ordinary course of business, Emera provides energy and construction related services and enters into transactions with its associated and other related companies on terms similar to those offered to non-related parties .
If these transactions are eliminated on consolidation, they are not disclosed as related party transactions . Below are transactions between Emera and its associated companies that are not eliminated on consolidation:
For the Year ended December 31
millions of Canadian dollars Nature of service Presentation 2013 2012
Sales:Emera Energy Net sale of natural gas Operating revenue — non-regulated $ 10.7 $ 12.5Emera Energy Sale of power Operating revenue — non-regulated 8.3 0.5Emera Utility services Maintenance and construction services Operating revenue — non-regulated 11.4 19.0Emera Utility services Construction, operations management and engineering services Operating revenue — non-regulated 9.0 14.9
Purchases:NSPI Net purchase of natural gas Fuel for generation and purchased power $ 10.7 $ 12.5NSPI Purchase of power Fuel for generation and purchased power 8.3 0.5NSPI Maintenance services OM&G 1.6 1.4NSPI Construction services Property, plant and equipment 9.8 17.6GBPC Maintenance services OM&G 8.5 6.2GBPC Construction services Property, plant and equipment 0.5 8.7

128 Emera Inc . — Annual Report 2013
Following are transactions between Emera and its equity investments:
M&NP
In the ordinary course of business, Emera purchased natural gas transportation capacity from M&NP, an investment under significant influence of the Company, totalling $27 .8 million (2012 — $35 .6 million) for the year ended December 31, 2013 . The amount is recognized in “Regulated fuel for generation and purchased power” or netted against energy marketing margin in “Non-regulated operating revenues” and is measured at the exchange amount . As at December 31, 2013, the amount payable to the related party was $2 .5 million (December 31, 2012 — $2 .9 million) and is under normal interest and credit terms .
Emera has a loan receivable from M&NP bearing interest at 1 per cent per annum with maturity of November 30, 2019 . As at December 31, 2013, the loan balance was $2 .5 million and is recognized as “Due from related parties” on Emera’s Consolidated Balance Sheets (December 31, 2012 — $2 .5 million) .
NWP
Bangor Hydro has a 20-year contract with NWP that commenced in July 2011 for 20 per cent of the capacity and energy generated from a 60 MW wind facility in Maine, as directed by the MPUC . In the ordinary course of business, Bangor Hydro paid NWP $2 .0 million for the year ended December 31, 2013 (2012 — $0 .6 million) for the capacity and energy, which is measured at the exchange amount . Losses (or gains) from the difference between the cost of the acquired capacity and energy and the associated resale revenues are recoverable by Bangor Hydro in its stranded cost rates .
Emera, through a wholly owned subsidiary, had a $150 million USD loan receivable from a wholly owned subsidiary of NWP, in which Emera holds a 49 per cent interest . The loan bore interest at 8 per cent per annum, payable semi-annually . NWP repaid this loan in full on November 14, 2013 . In the ordinary course of business, Emera earned $10 .7 million for the year ended December 31, 2013 (2012 — $3 .5 million) which is recognized in “Interest expense, net” and is measured at the exchange amount .
As at December 31, 2013, the loan balance with NWP was nil and was recognized as “Due from related parties” on Emera’s Consolidated Balance Sheets (December 31, 2012 — $149 .2 million ($150 million USD)) . As at December 31, 2013, the interest receivable on the loan was nil and is recognized as “Other assets” on Emera’s Consolidated Balance Sheets (December 31, 2012 — $6 .5 million ($6 .6 million USD)) .
In the ordinary course of business, Emera Energy Services, a wholly owned subsidiary of Emera, provided NWP with energy management services for $0 .5 million (2012 — $0 .3 million) recognized in “Operating revenues, non-regulated” for the year ended December 31, 2013 and is measured at the exchange amount .

Notes to the Consolidated Financial Statements
Emera Inc . — Annual Report 2013 129
24. Short-Term Debt
Emera’s short-term borrowings consist of commercial paper issuances, advances on revolving and non-revolving credit facilities and short-term notes . Short-term debt and the related weighted-average interest rates as at December 31 consisted of the following:
Weighted- Weighted- average average millions of Canadian dollars 2013 interest rate 2012 interest rate
EmeraCurrent portion of advances on the revolving credit facilities (1) $ 7.2 3.20% $ — —
NSPIBank indebtedness (2) 6.7 3.00% 7.9 3.00%
Emera EnergyAdvances on the non-revolving credit facilities 361.7 1.50% — —
MPSAdvances on the revolving and non-revolving credit facilities 33.3 1.67% 3.3 1.96%
GBPCAdvances on the revolving credit facilities — — 9.2 5.75%
BHEAdvances on the revolving credit facilities 29.1 1.55% — —
Short-term debt $ 438.0 $ 20.4
(1) Advances on the long-term revolving credit facilities (Note 25) can be made by way of overdraft and prime rate borrowing on accounts for Emera and NSPI for up to $30 million and $50 million, respectively .
(2) Upon privatization of NSPI in 1992, NSPI became responsible for managing a portfolio of defeasance securities that provide the principal and interest streams to match the related defeased debt . Under the privatization agreements, NSPI administers the defeasance cash flows and obligations which are not recorded in NSPI’s financial statements . All of the bank accounts are included in NSPI’s pool of bank accounts under a mirror netting agreement, therefore NSPI’s bank indebtedness position is offset by cash held for defeasances and no interest charges are incurred .
The Company’s total short-term revolving and non-revolving credit facilities, outstanding borrowings and available capacity as at December 31 were as follows:
millions of Canadian dollars Maturity 2013 2012
MPS — revolving and non-revolving credit facilities 2014 $ 37.9 $ 9.9BHE — revolving credit facility 2014 85.1 —Emera Energy — non-revolving credit facility 2014 361.7 —GBPC — revolving credit facility 2014 13.8 12.9
Total 498.5 22.8
Less:Advances under revolving credit facilities 424.1 12.5Letters of credit issued inside credit facilities 4.2 —
Use of available facilities 428.3 12.5
Available capacity under existing agreements $ 70.2 $ 10.3
As at December 31, 2013, these credit facilities require commitment fees of 0 .25 per cent . The weighted average interest rate on outstanding short-term debt at December 31, 2013 was 1 .57 per cent (2012 — 4 .07 per cent) .
CREDIT FACILITIES
On November 19, 2013, Emera extended the maturity of its $700 million committed syndicated revolving bank line of credit from June 2017 to June 2018, with no change in commercial terms from the prior agreement .
On November 19, 2013, Emera, through a wholly owned subsidiary, entered in to a $350 USD million non-revolving credit facility . The credit facility was used to partially finance the acquisition of the EE New England Gas Generation .
On September 30, 2013, MPS renewed its existing $10 million USD revolving credit facility, with a new expiration date of the earlier of September 30, 2014 or the effective date of the merger between MPS and BHE, with no change in terms from the prior agreement .
On September 30, 2013, MPS repaid its Maine Utility Financing Bank Bonds and associated interest rate hedges with the proceeds from a $25 .6 million non-revolving credit facility .

130 Emera Inc . — Annual Report 2013
25. Long-Term Debt
Emera’s long-term debt includes the issuances detailed below . Medium-term notes and debentures are issued under trust indentures at fixed interest rates and are unsecured unless noted below . Also included are certain bankers’ acceptances and commercial paper where the Company has the intention and the unencumbered ability to refinance the obligations for a period greater than one year . Long-term debt as at December 31 consisted of the following:
Stated Effective interest interestmillions of Canadian dollars rate (1) rate (2) Maturity 2013 2012
EMERA 5-yearBankers acceptances, LIBOR loans (3) — 1.10% renewal $ 321.3 $ 302.5
Medium-term notes Series F 4.10% 4.19% 2014 250.0 250.0 Series G 4.83% 4.89% 2019 225.0 225.0 Series H 2.96% 3.05% 2016 250.0 250.0
725.0 725.0
Promissory note — — 2016 1.0 1.3
Capital lease obligations — — Various 0.6 1.0
$1,047.9 $1,029.8
NSPI 4-yearCommercial paper (4) — 1.15% renewal $ 282.9 $ 291.2
Medium-term notes Series F 8.85% 8.21% 2025 125.0 125.0 Series I 8.40% 8.43% 2015 70.0 70.0 Series L 8.30% 8.88% 2036 60.0 60.0 Series M (5) 8.50% 7.76% 2026 40.0 40.0 Series N 7.60% 7.57% 2097 50.0 50.0 Series P 6.28% 6.28% 2029 40.0 40.0 Series R 7.45% 7.51% 2031 75.0 75.0 Series S 6.95% 7.12% 2033 200.0 200.0 Series T 5.75% 6.09% 2013 — 300.0 Series V 5.67% 5.71% 2035 150.0 150.0 Series W 5.95% 6.01% 2039 200.0 200.0 Series X 5.61% 5.65% 2040 300.0 300.0 Series Y 4.15% 4.19% 2042 250.0 250.0 Series Z 4.50% 4.57% 2043 300.0 —
1,860.0 1,860.0
Debentures — Series 3 9.75% 9.99% 2019 95.0 95.0
Capital lease obligations — 4.30% 2016 1.0 —
$2,238.9 $2,246.2

Notes to the Consolidated Financial Statements
Emera Inc . — Annual Report 2013 131
Stated Effective interest interestmillions of Canadian dollars rate (1) rate (2) Maturity 2013 2012
Bangor Hydro (6)
LIBOR loans and demand loans (7) — 1.71% 2013 $ — $ 15.4General and refunding mortgage bonds (8)
$20 million 8.98% 8.98% 2022 21.3 19.9 $30 million 10.25% 10.25% 2020 31.9 29.8
53.2 49.7
Senior unsecured notes $50 million 2003 (9) 5.31% 5.31% 2018 24.0 27.1 $30 million 2007 5.65% 5.65% 2014 31.9 29.9 $20 million 2007 5.87% 5.87% 2017 21.3 19.9 $70 million 2012 3.61% 3.61% 2022 74.5 69.6
151.7 146.5
$ 204.9 $ 211.6
MPS (6)
Maine Public Utility Financing Bank Bonds (10) 0.46% 6.20% 2021 $ — $ 13.5Maine Public Utility Financing Bank Bonds (10) 0.46% 6.32% 2025 — 9.0
$ — $ 22.5
GBPC (6)
Unsecured notes 3.18% 3.57% 2014 77.3 82.0Bond notes 7.07% 7.07% 2020-2023 54.1 51.0
$ 131.4 $ 133.0
BLPC and LPHSenior secured notes $12 .3 million 2021 (11) 6.50% 7.00% 2021 $ 10.2 $ 10.3 $9 .9 million 2020 (11) 6.65% 6.65% 2020 10.6 9.9 $9 .9 million 2025 (11) 6.88% 6.88% 2025 10.6 9.9 $10 .0 million 2015 (12) 5.99% 5.99% 2015 2.1 3.0 $34 .0 million 2013 (13) 4.27% 4.27% 2013 — 3.9 $14 .2 million 2015 (14) 2.37% 2.37% 2015 7.6 11.6 $12 .0 million 2028 (14) 4.05% 4.05% 2028 10.6 — $16 .4 million 2021 (15) 5.75% 5.75% 2021 16.2 —Other 0.4 0.5
$ 68.3 $ 49.1
AdjustmentsUnamortized debt premium — net 0.6 2.3Amount due within one year (328.3) (437.1)
$ (327.7)$ (434.8)
Long-Term Debt $3,363.7 $3,257.4
(1) The stated interest rate is the coupon rate for any long-term debt issuance .(2) The effective interest rate is the constant rate which will fully amortize the premium/discount and issuance costs over the life of the associated debt when the rate is applied against the net
amount of debt less unamortized costs .(3) Emera’s revolving credit facility matures in June 2018, at which point the Company has the intention to renew under similar terms . The credit facility can be extended annually with the
approval of the syndicated banks .(4) NSPI’s commercial paper is backed by a revolving credit facility, which matures in 2017 .(5) Notes extendable until 2056 at the option of the holders .(6) Debt issued and payable in USD .(7) Bangor Hydro’s revolving credit facility matures in September 2014, at which point the Company has the intention to renew under similar terms .(8) Secured by property, plant and equipment of Bangor Hydro .(9) Sinking fund payments beginning in year five .(10) Maine Public Utility Financing Bank Bonds and associated interest rate hedges were repaid in September 2013 with the proceeds from a $25 .6 million non-revolving credit facility .(11) Debt issued and payable in Barbadian dollars . Borrowings are secured under a Debenture Trust Deed, which creates a first and floating charge on the Company’s property, present and future .(12) Debt issued and payable in USD . Borrowings are secured under a Debenture Trust Deed which creates a first and floating charge on the Company’s property, present and future .(13) Debt issued and payable in USD . Borrowings are guaranteed by the Government of Barbados .(14) Cash security in the form of security deposit .(15) Fixed charge over property of DOMLEC .

132 Emera Inc . — Annual Report 2013
The Company’s total long-term revolving credit facilities, outstanding borrowings and available capacity as at December 31 were as follows:
millions of Canadian dollars Maturity 2013 2012
Emera — revolving credit facility (1) June 2018 $ 700.0 $ 700.0NSPI — revolving credit facility (2) June 2017 500.0 500.0BLPC — revolving credit facility 8.5 8.0Bangor Hydro — revolving credit facility September 2014 — 79.6
Total 1,208.5 1,287.6
Less:Borrowings under credit facilities 611.4 609.0Letters of credit issued inside credit facilities 11.0 14.8
Use of available facilities 622.4 623.8
Available capacity under existing agreements $ 586.1 $ 663.8
(1) Advances on the revolving credit facility can be made by way of overdraft on accounts up to $30 million and such advances are classified as short-term debt (note 24) .(2) Advances on the revolving credit facility can be made by way of overdraft on accounts up to $50 million and such advances are classified as short-term debt (note 24) .
CREDIT FACILITIES
On November 19, 2013, Emera extended the maturity of its $700 million committed syndicated revolving bank line of credit from June 2017 to June 2018, with no change in commercial terms from the prior agreement .
NSPI has an active commercial paper program for up to $400 million, of which outstanding amounts are 100 per cent backed by NSPI’s bank line, which results in an equal amount of credit being considered drawn and unavailable .
ISSUANCES
On July 19, 2013, NSPI completed the issuance of $300 million Series Z Medium-Term Notes . The Series Z Notes bear interest at a rate of 4 .50 per cent and yield 4 .537 per cent per annum until July 20, 2043 . The proceeds of the note offering were used for general corporate purposes including the repayment of maturing corporate term debt on October 1, 2013 .
DEBT COVENANTS
Emera and its subsidiaries have debt covenants associated with their credit facilities . Covenants are tested regularly and the Company is in compliance with covenant requirements . Emera’s significant covenants are listed below:
As at Financial covenant Requirement December 31, 2013
Emera Syndicated credit facilities Debt to capital ratio Less than or equal to 0 .70 to 1 0.57:1NSPI Syndicated credit facility Debt to capital ratio Less than or equal to 0 .65 to 1 0.61:1
DEBT SHELF PROSPECTUS
EmeraOn May 2, 2013, Emera filed a $750 million debt and preferred equity shelf prospectus, providing the Company with access to long-term debt and preferred equity .
NSPIOn May 2, 2013, NSPI filed a $500 million debt shelf prospectus, providing NSPI with access to long-term debt .

Notes to the Consolidated Financial Statements
Emera Inc . — Annual Report 2013 133
LONG-TERM DEBT MATURITIES
As at December 31, long-term debt maturities, including capital lease obligations, for each of the next five years and in aggregate thereafter are as follows:
Greater than millions of Canadian dollars 2014 2015 2016 2017 2018 5 years Total
Emera $ 250.7 $ 0.6 $ 0.3 $ 250.0 $ 321.3$ 225.0 $1,047.9NSPI 0.4 70.4 0.2 282.9 — 1,885.0 2,238.9Bangor Hydro 36.7 4.8 4.8 26.1 4.8 127.7 204.9GBPC 30.9 6.0 6.0 6.0 6.0 76.5 131.4BLPC 9.7 7.3 3.9 4.0 4.3 39.1 68.3
Total $ 328.4 $ 89.1 $ 15.2 $ 569.0 $ 336.4$ 2,353.3 $3,691.4
26. Employee Benefit Plans
Emera maintains a number of contributory defined-benefit and defined-contribution pension plans, which cover substantially all of its employees; and plans providing non-pension benefits for its retirees in Nova Scotia, New Brunswick, Newfoundland and Labrador, Maine, Barbados and Grand Bahama Island .
BENEFIT OBLIGATION AND PLAN ASSETS
The changes in benefit obligation and plan assets, and the funded status for all plans were as follows:
For the Year ended December 31
millions of Canadian dollars 2013 2012
Defined Non- Defined Non- Change in Projected Benefit Obligation and benefit pension benefit pension Accumulated Post-retirement Benefit Obligation pension plans benefit plans pension plans benefit plans
Balance, January 1 $1,320.9 $ 101.3 $1,165.4 $ 99.1Service cost 21.9 3.0 18.0 2.8Plan participant contributions 7.1 0.1 6.2 0.2Interest cost 55.3 4.2 56.8 4.7Plan amendments — — (5.4) —Benefits paid (58.3) (5.8) (55.1) (6.9)Actuarial losses (104.1) (20.6) 135.0 2.1Special termination 0.7 — 1.5 0.5Foreign currency translation adjustment 9.8 3.8 (1.5) (1.2)
Balance, December 31 1,253.3 86.0 1,320.9 101.3
Change in Plan assetsBalance, January 1 902.6 3.5 722.4 3.4Employer contributions 49.0 5.6 163.2 6.7Plan participant contributions 7.1 0.1 6.2 0.2Benefits paid (58.3) (5.8) (55.1) (6.9)Actual return on assets, net of expenses 163.4 0.4 66.1 0.3Foreign currency translation adjustment 6.2 0.2 (0.2) (0.2)Balance, December 31 1,070.0 4.0 902.6 3.5
Funded Status, end of year $ (183.3)$ (82.0)$ (418.3)$ (97.8)
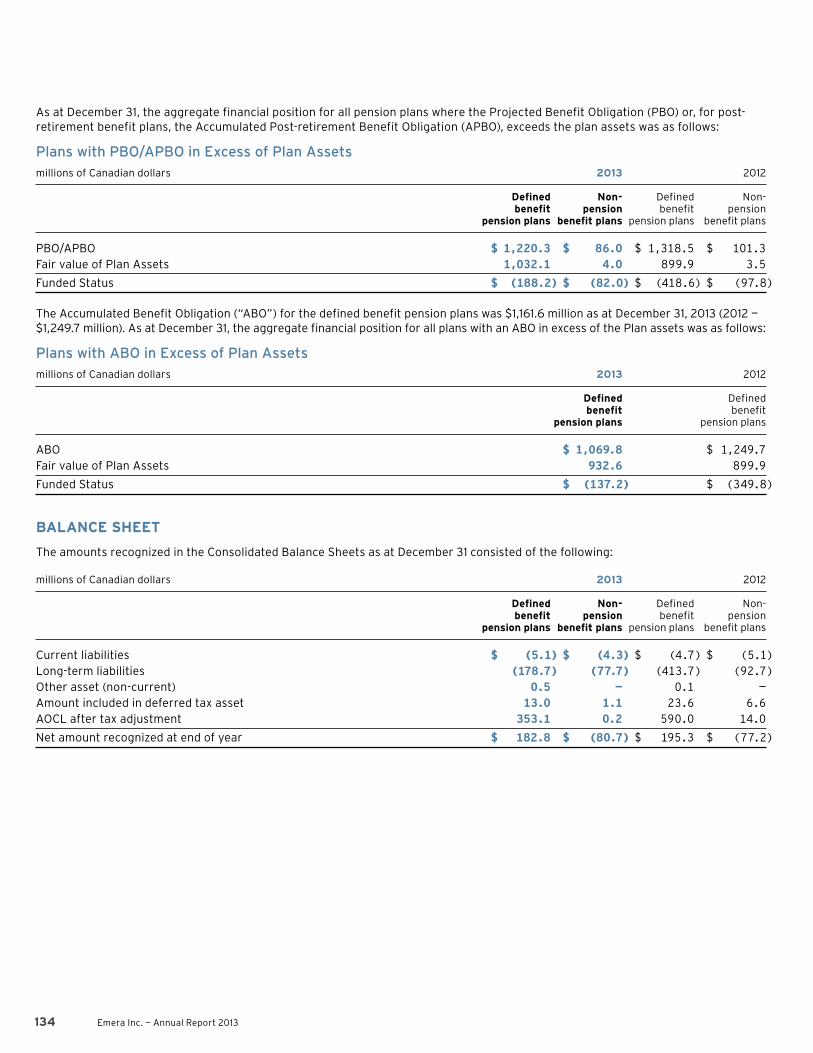
134 Emera Inc . — Annual Report 2013
As at December 31, the aggregate financial position for all pension plans where the Projected Benefit Obligation (PBO) or, for post-retirement benefit plans, the Accumulated Post-retirement Benefit Obligation (APBO), exceeds the plan assets was as follows:
Plans with PBO/APBO in Excess of Plan Assetsmillions of Canadian dollars 2013 2012
Defined Non- Defined Non- benefit pension benefit pension pension plans benefit plans pension plans benefit plans
PBO/APBO $1,220.3 $ 86.0 $1,318.5 $ 101.3Fair value of Plan Assets 1,032.1 4.0 899.9 3.5
Funded Status $ (188.2)$ (82.0)$ (418.6)$ (97.8)
The Accumulated Benefit Obligation (“ABO”) for the defined benefit pension plans was $1,161 .6 million as at December 31, 2013 (2012 — $1,249 .7 million) . As at December 31, the aggregate financial position for all plans with an ABO in excess of the Plan assets was as follows:
Plans with ABO in Excess of Plan Assetsmillions of Canadian dollars 2013 2012
Defined Defined benefit benefit pension plans pension plans
ABO $1,069.8 $1,249.7Fair value of Plan Assets 932.6 899.9
Funded Status $ (137.2) $ (349.8)
BALANCE SHEET
The amounts recognized in the Consolidated Balance Sheets as at December 31 consisted of the following:
millions of Canadian dollars 2013 2012
Defined Non- Defined Non- benefit pension benefit pension pension plans benefit plans pension plans benefit plans
Current liabilities $ (5.1)$ (4.3)$ (4.7)$ (5.1)Long-term liabilities (178.7) (77.7) (413.7) (92.7)Other asset (non-current) 0.5 — 0.1 —Amount included in deferred tax asset 13.0 1.1 23.6 6.6AOCL after tax adjustment 353.1 0.2 590.0 14.0
Net amount recognized at end of year $ 182.8 $ (80.7)$ 195.3 $ (77.2)

Notes to the Consolidated Financial Statements
Emera Inc . — Annual Report 2013 135
Unamortized gains and losses and past service costs arising on post-retirement benefits are recorded in AOCL . The following tables provide detail on the change in AOCL during fiscal 2013 relating to these items; and the composition of the year-end balance:
Actuarial losses Past service Accumulated other comprehensive loss (gains) (gains) costs
millions of Canadian dollars
Defined Benefit Pension PlansBalance, January 1 $ 619.5 $ (5.9)Amortized in current period (47.6) 0.6Current year addition to AOCL (204.1) —Transfer to other regulatory asset (1) 3.5 —Foreign currency translation adjustment 0.1 —
Balance, December 31 $ 371.4 $ (5.3)
Non-pension benefits plansBalance, January 1 $ 29.8 $ (9.2)Amortized in current period (2.2) 1.7Current year addition to AOCL (20.7) —Transfer to other regulatory asset (1) 1.4 —Foreign currency translation adjustment 0.2 0.3
Balance, December 31 $ 8.5 $ (7.2)
(1) For MPS, as a result of regulatory accounting, any gain or loss is transferred to regulatory assets and amortized over the same period as the corresponding actuarial gains or losses .
millions of Canadian dollars 2013 2012
Defined Non- Defined Non- benefit pension benefit pension Accumulated other comprehensive loss pension plans benefit plans pension plans benefit plans
Actuarial losses $ 371.4 $ 8.5 $ 619.5 $ 29.8Past service (gains) (5.3) (7.2) (5.9) (9.2)
Total AOCL on a pre-tax basis 366.1 1.3 613.6 20.6Less: Amount included in deferred tax asset (13.0) (1.1) (23.6) (6.6)
Net amount in AOCL after tax adjustment $ 353.1 $ 0.2 $ 590.0 $ 14.0
The amounts in the foregoing table were not recognized in Emera’s net periodic benefit cost as at December 31 .
millions of Canadian dollars 2013 2012
Defined Non- Defined Non- benefit pension benefit pension Benefit cost components pension plans benefit plans pension plans benefit plans
Service cost $ 21.9 $ 3.0 $ 18.0 $ 2.8Interest cost 55.3 4.2 56.8 4.7Expected return on plan assets (63.1) (0.2) (58.0) (0.2)Current year amortization of: Actuarial losses 47.6 2.2 32.8 2.2 Past service costs (gains) (0.6) (1.7) — (1.6)Special termination 0.7 — 1.5 0.5
Total $ 61.8 $ 7.5 $ 51.1 $ 8.4
The expected return on plan assets is determined based on the market-related value of plan assets of $957 .9 million as at January 1, 2013 (2012 — $835 .5 million), adjusted for interest on certain cash flows during the year . The market-related value of assets is based on a five-year smoothed asset value . Any investment gains (or losses) in excess of (or less than) the expected return on plan assets are recognized on a straight-line basis into the market-related value of assets over a five-year period .

136 Emera Inc . — Annual Report 2013
PENSION PLAN ASSET ALLOCATIONS
Emera’s investment policy includes discussion regarding the investment philosophy, the level of risk which the Company is prepared to accept with respect to the investment of the Pension Funds, and the basis for measuring the performance of the assets . Central to the policy is the target asset allocation by major asset categories . The objective of the target asset allocation is to diversify risk and to achieve asset returns that meet or exceed the plan’s actuarial assumptions . The diversification of assets reduces the inherent risk in financial markets by requiring that assets be spread out amongst various asset classes . Within each asset class, a further diversification is undertaken through the investment in a broad basket of investment-grade securities . Emera’s target asset allocation is as follows:
CANADIAN PENSION PLANS
Asset Class Target range at market
Short-term securities 0% to 5%Fixed income 30% to 45%Equities: Canadian 17% to 27% Non-Canadian (world) 36% to 50%
NON-CANADIAN PENSION PLANS
Asset Class Target range at market (weighted average)
Short-term securities 0% to 5%Fixed income 25% to 43%Equities: US 27% to 63% Non-US 15% to 25%
For Bangor Hydro and MPS, the investment of the Non-Canadian pension assets is overseen by the management team . For GBPC, the investment of Non-Canadian pension assets is overseen by GBPA .
The fair values of investments as at December 31, 2013, by asset category, are as follows:
millions of Canadian dollars Level 1 Percentage
Cash and cash equivalents $ 15.8 1.5%Equity securities: Canadian equity 180.3 16.9% US equity 267.5 25.0% Other equity 240.0 22.4%Fixed income securities: Canadian government 165.2 15.4% US government 16.2 1.5% Other government 0.7 0.1% Corporate debt 184.3 17.2% Real estate — —
Total $1,070.0 100.0%

Notes to the Consolidated Financial Statements
Emera Inc . — Annual Report 2013 137
The fair value of investments as at December 31, 2012, by asset category, are as follows:
millions of Canadian dollars Level 1 Percentage
Cash and cash equivalents $ 38.8 4.3%Equity Securities: Canadian equity 159.5 17.7% US equity 216.1 24.0% Other equity 185.2 20.5%Fixed income securities: Canadian government 150.0 16.6% US government 14.8 1.6% Other government 0.7 0.1% Corporate debt 137.0 15.2% Real estate 0.3 —
Total $ 902.4 100.0%
Refer to Note 1(Y), “Summary of Significant Accounting Policies — Fair Value Measurement”, for more information on the fair value hierarchy and inputs used to measure fair value . All investments were deemed Level 1 for the years ended December 31, 2013 and 2012 .
INVESTMENTS IN EMERA OR NSPI
As at December 31, 2013 and 2012, the pension funds do not hold any material investments in Emera Incorporated or NSPI securities . However, as a significant portion of assets for the benefit plan are held in pooled assets, there may be indirect investments in these securities .
CANADIAN POST-RETIREMENT BENEFIT PLANS
There are no assets set aside to pay for the Canadian post-retirement benefit plans . As is common in Canada, post-retirement health benefits are paid from general accounts on a pay as you go basis .
US POST-RETIREMENT BENEFIT PLANS
Emera’s US subsidiaries currently provide certain post-retirement health care and life insurance benefits for employees retiring after age 55 who meet eligibility requirements . Post-retirement benefit levels are substantially unrelated to salary . The Company reserves the right to terminate or modify plans in whole or in part at any time .
Bangor Hydro and MPS provide retiree medical benefits to certain classes of employees . The Company’s retiree medical expenses are incorporated into rate filings with its regulators and are recovered through its electric rates to customers .
The Medicare Prescription Drug, Improvement and Modernization Act of 2003 (MMA) added prescription drug coverage to Medicare, with a 28 per cent tax-free subsidy to encourage employers to retain their prescription drug programs for retirees, along with other key provisions . Emera’s current retiree medical program for those eligible for Medicare (generally over age 65) includes coverage for prescription drugs . The Company has determined that prescription drug benefits available to certain Medicare-eligible participants under its defined-dollar-benefit post-retirement health care plan are at least “actuarially equivalent” to the standard drug benefits that are offered under Medicare Part D .
The Company received subsidy payments under Part D for the 2009 and 2010 plan years . Its 2011 Part D subsidy application with the Centers for Medicare and Medicaid Services was approved in December 2010, and the Company expects to receive payment later this year .
Emera’s target asset allocation for its US Post-Retirement Benefits Plan is as follows:
Asset Class Target Range at Market (weighted average)
Short-term securities 10% to 50%Fixed income 0% to 40%Equities: US 30% to 60% Non-US 0% to 60%

138 Emera Inc . — Annual Report 2013
The fair values of investments as at December 31, 2013, by asset category, are as follows:
millions of Canadian dollars Level 1 Percentage
Cash and cash equivalents $ 1.1 27.5%
Equity securities: US equity 2.0 50.0%
Fixed income securities: US government 0.9 22.5%
Total $ 4.0 100.0%
The fair value of investments as at December 31, 2012, by asset category, are as follows:
millions of Canadian dollars Level 1 Percentage
Cash and cash equivalents $ 1.1 31.4%
Equity securities: US equity 1.6 45.7%
Fixed income securities: US government 0.8 22.9%
Total $ 3.5 100.0%
Refer to Note 1(Y), “Summary of Significant Accounting Policies — Fair Value Measurement”, for more information on the fair value hierarchy and inputs used to measure fair value . All investments were deemed Level 1 for the years ended December 31, 2013 and 2012 .
INVESTMENTS IN EMERA OR NSPI
As at December 31, 2013 and 2012, the assets related to the post-retirement benefit plans do not hold any material investments in Emera Incorporated or NSPI securities . However, as a significant portion of assets for the benefit plan are held in pooled assets, there may be indirect investments in these securities .
CASH FLOWS
The following table shows the expected cash flows for defined benefit pension and other post-retirement benefit plans:
Defined Non- benefit pension millions of Canadian dollars pension plans benefit plans
Expected employer contributions2014 $ 52.7 $ 5.9
Expected benefit payments2014 62.1 5.92015 66.2 6.32016 70.8 6.52017 75.5 6.92018 80.2 7.42019—2023 483.5 40.3
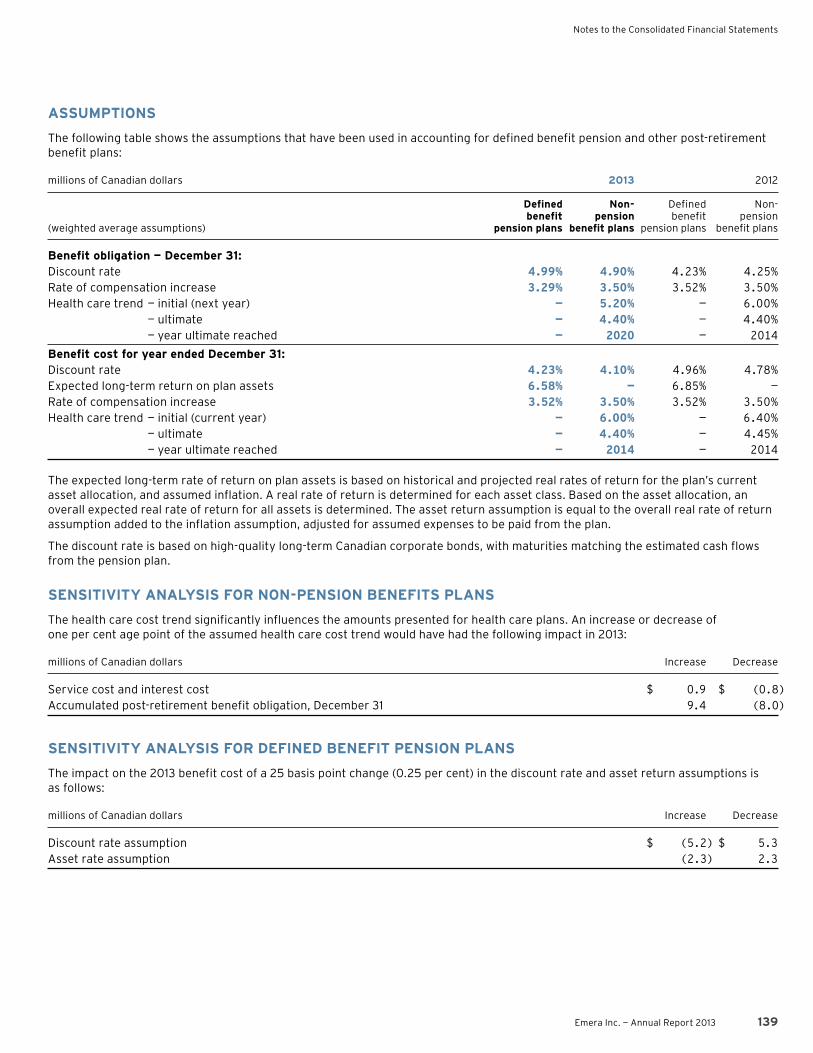
Notes to the Consolidated Financial Statements
Emera Inc . — Annual Report 2013 139
ASSUMPTIONS
The following table shows the assumptions that have been used in accounting for defined benefit pension and other post-retirement benefit plans:
millions of Canadian dollars 2013 2012
Defined Non- Defined Non- benefit pension benefit pension (weighted average assumptions) pension plans benefit plans pension plans benefit plans
Benefit obligation — December 31:Discount rate 4.99% 4.90% 4.23% 4.25%Rate of compensation increase 3.29% 3.50% 3.52% 3.50%Health care trend — initial (next year) — 5.20% — 6.00% — ultimate — 4.40% — 4.40% — year ultimate reached — 2020 — 2014
Benefit cost for year ended December 31:Discount rate 4.23% 4.10% 4.96% 4.78%Expected long-term return on plan assets 6.58% — 6.85% —Rate of compensation increase 3.52% 3.50% 3.52% 3.50%Health care trend — initial (current year) — 6.00% — 6.40% — ultimate — 4.40% — 4.45% — year ultimate reached — 2014 — 2014
The expected long-term rate of return on plan assets is based on historical and projected real rates of return for the plan’s current asset allocation, and assumed inflation . A real rate of return is determined for each asset class . Based on the asset allocation, an overall expected real rate of return for all assets is determined . The asset return assumption is equal to the overall real rate of return assumption added to the inflation assumption, adjusted for assumed expenses to be paid from the plan .
The discount rate is based on high-quality long-term Canadian corporate bonds, with maturities matching the estimated cash flows from the pension plan .
SENSITIVITY ANALYSIS FOR NON-PENSION BENEFITS PLANS
The health care cost trend significantly influences the amounts presented for health care plans . An increase or decrease of one per cent age point of the assumed health care cost trend would have had the following impact in 2013:
millions of Canadian dollars Increase Decrease
Service cost and interest cost $ 0.9 $ (0.8)Accumulated post-retirement benefit obligation, December 31 9.4 (8.0)
SENSITIVITY ANALYSIS FOR DEFINED BENEFIT PENSION PLANS
The impact on the 2013 benefit cost of a 25 basis point change (0 .25 per cent) in the discount rate and asset return assumptions is as follows:
millions of Canadian dollars Increase Decrease
Discount rate assumption $ (5.2)$ 5.3Asset rate assumption (2.3) 2.3
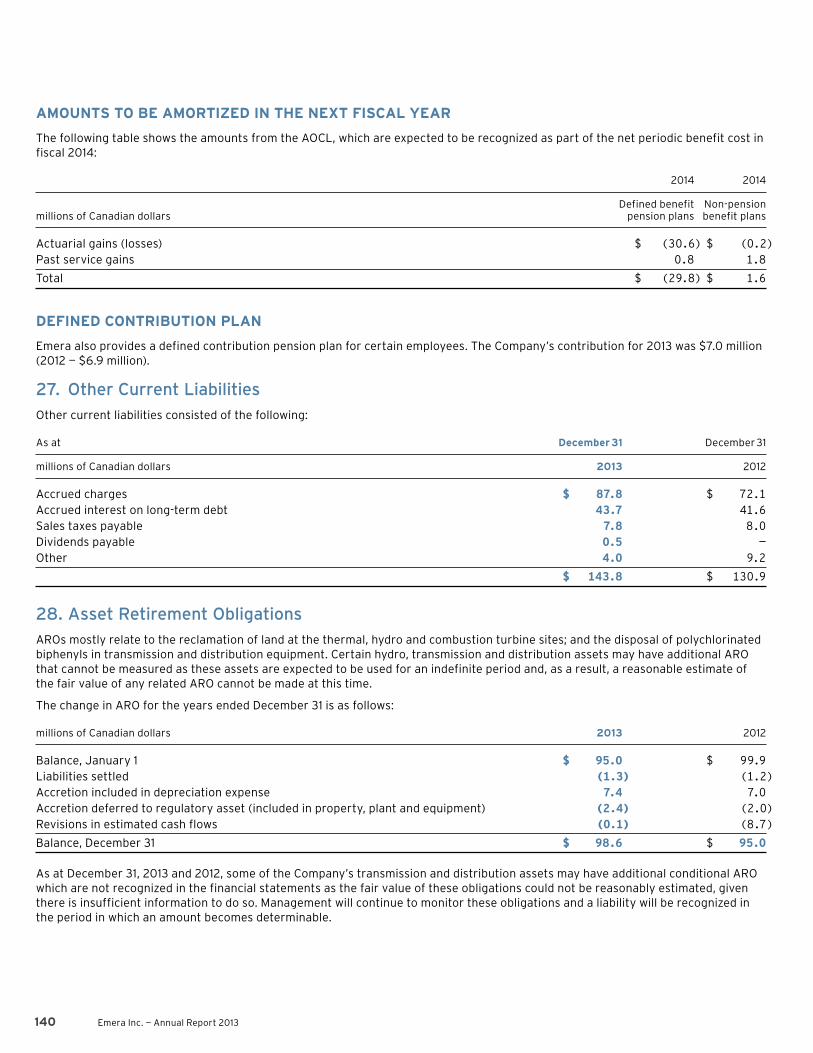
140 Emera Inc . — Annual Report 2013
AMOUNTS TO BE AMORTIZED IN THE NEXT FISCAL YEAR
The following table shows the amounts from the AOCL, which are expected to be recognized as part of the net periodic benefit cost in fiscal 2014:
2014 2014
Defined benefit Non-pension millions of Canadian dollars pension plans benefit plans
Actuarial gains (losses) $ (30.6)$ (0.2)Past service gains 0.8 1.8
Total $ (29.8)$ 1.6
DEFINED CONTRIBUTION PLAN
Emera also provides a defined contribution pension plan for certain employees . The Company’s contribution for 2013 was $7 .0 million (2012 — $6 .9 million) .
27. Other Current Liabilities
Other current liabilities consisted of the following:
As at December 31 December 31
millions of Canadian dollars 2013 2012
Accrued charges $ 87.8 $ 72.1Accrued interest on long-term debt 43.7 41.6Sales taxes payable 7.8 8.0Dividends payable 0.5 —Other 4.0 9.2
$ 143.8 $ 130.9
28. Asset Retirement Obligations
AROs mostly relate to the reclamation of land at the thermal, hydro and combustion turbine sites; and the disposal of polychlorinated biphenyls in transmission and distribution equipment . Certain hydro, transmission and distribution assets may have additional ARO that cannot be measured as these assets are expected to be used for an indefinite period and, as a result, a reasonable estimate of the fair value of any related ARO cannot be made at this time .
The change in ARO for the years ended December 31 is as follows:
millions of Canadian dollars 2013 2012
Balance, January 1 $ 95.0 $ 99.9Liabilities settled (1.3) (1.2)Accretion included in depreciation expense 7.4 7.0Accretion deferred to regulatory asset (included in property, plant and equipment) (2.4) (2.0)Revisions in estimated cash flows (0.1) (8.7)
Balance, December 31 $ 98.6 $ 95.0
As at December 31, 2013 and 2012, some of the Company’s transmission and distribution assets may have additional conditional ARO which are not recognized in the financial statements as the fair value of these obligations could not be reasonably estimated, given there is insufficient information to do so . Management will continue to monitor these obligations and a liability will be recognized in the period in which an amount becomes determinable .

Notes to the Consolidated Financial Statements
Emera Inc . — Annual Report 2013 141
29. Commitments And Contingencies
A. COMMITMENTS
As at December 31, 2013, contractual commitments (excluding pensions and other post-retirement obligations, long-term debt and AROs) for each of the next five years and in aggregate thereafter consisted of the following:
millions of Canadian dollars 2014 2015 2016 2017 2018 Thereafter Total
Purchased power (1) $ 126.7 $ 153.8 $ 168.3 $ 169.2 $ 141.8$ 1,760.5 $2,520.3Coal, biomass, oil and natural gas supply 249.6 146.3 72.2 13.6 10.2 — 491.9Transportation (2) 118.4 48.2 15.6 10.5 6.0 7.8 206.5Long-term service agreements (3) 25.7 20.6 25.8 17.7 14.8 69.0 173.6Capital projects 119.9 17.5 11.2 1.6 — — 150.2Leases (4) 4.0 3.8 3.0 2.8 2.7 13.4 29.7Other 3.8 3.5 1.3 1.3 1.3 38.3 49.5
$ 648.1 $ 393.7 $ 297.4 $ 216.7 $ 176.8$ 1,889.0 $3,621.7
(1) Purchased power: annual requirement to purchase 20—100 per cent of electricity production from independent power producers over varying contract lengths up to 25 years .(2) Transportation: purchasing commitments for transportation of solid fuel and transportation capacity on various pipelines .(3) Long-term service agreements: outsourced management of computer and communication infrastructure, vegetation management, maintenance of certain generating equipment, and services
related to a generation facility and wind operating agreements .(4) Leases: operating lease agreements for office space, land, plant fixtures and equipment, telecommunications services, rail cars and vehicles .
B. LEGAL PROCEEDINGS
A number of individuals who live in proximity to NSPI’s Trenton generating station have filed a statement of claim for an unspecified amount against NSPI in respect of emissions from the operation of the plant for the period from 2001 forward . The plaintiffs claim unspecified damages as a result of interference with enjoyment of, or damage to, their property . NSPI has filed a defence to the claim . The outcome of this litigation, and therefore an estimate of any contingent loss, is not determinable .
On September 30, 2011, a consortium of New England Commission’s Public Advocates and End Users (“Complainants”) filed a complaint with the FERC alleging that the 11 .14 per cent base ROE under the ISO-New England Open Access Transmission Tariff (“OATT”) is unjust and unreasonable . The Complainants offered evidence and testimony that the appropriate ROE should be no more than 9 .0 per cent . On October 20, 2011, the New England Transmission Owners (“NETOs”), of which the Bangor Hydro is one, answered the complaint and filed testimony alleging that the 11 .14 per cent ROE continues to be just and reasonable and within the range in evidence provided by the Complainants . On December 27, 2012, a second group of consumer advocates, including Environment Northeast, filed a complaint at the FERC on similar grounds, arguing that an ROE of 8 .7 per cent was appropriate .
On April 17, 2013, the parties filed their updated analysis to reflect market data for the six months ended March 31, 2013 . The NETO’s analysis produced an ROE range of 7 .3 per cent to 12 .2 per cent, and they contend the existing 11 .14 per cent is just and reasonable . The FERC staff’s updated analysis revised their ROE recommendation to 8 .9 per cent, based on the midpoint of a zone of reasonableness from 6 .1 per cent to 11 .7 per cent .
On August 6, 2013, a decision was received from the administrative law judge recommending to the FERC Commissioners an ROE of 10 .6 per cent for the retroactive period and 9 .7 per cent prospectively, subject to adjustment for changes in current market conditions from the date evidence was filed in April 2013 . While not yet final, the recommended decision provided a basis on which to calculate a likely potential refund for the 15-month retroactive period . Bangor Hydro recorded a $2 .4 million USD contingent accrual, including interest for the refund period, in September 2013 . A final decision is not expected by the FERC until 2014 .
In addition, Emera and its subsidiaries may, from time to time, be involved in legal proceedings, claims and litigations that arise in the ordinary course of business which the Company believes would not reasonably be expected to have a material adverse effect on the financial condition of the Company .

142 Emera Inc . — Annual Report 2013
C. ENVIRONMENT
Emera’s activities are subject to a broad range of federal, provincial, state, regional and local laws and environmental regulations, designed to protect, restore and enhance the quality of the environment including air, water and solid waste . Emera estimates its environmental capital expenditures, excluding AFUDC, based upon present environmental laws and regulations were approximately $14 .8 million during 2013 and are estimated to be $106 .1 million from 2014 through 2017 . Amounts that have been committed to are included in “Capital projects” in the commitments table in note 29A . The estimated expenditures do not include costs related to possible changes in the environmental laws or regulations and enforcement policies that may be enacted in response to issues such as climate change and other pollutant emissions .
NSPINSPI is subject to regulation by federal, provincial and municipal authorities with regard to environmental matters primarily through its utility operations . In addition to imposing continuing compliance obligations, there are laws, regulations and permits authorizing the imposition of penalties for non-compliance, including fines, injunctive relief and other sanctions . The cost of complying with current and future environmental requirements is material to NSPI . Failure to comply with environmental requirements or to recover environmental costs in a timely manner through rates could have a material adverse effect on NSPI .
Conformance with legislative and NSPI requirements is verified through a comprehensive environmental audit program . There were no significant environmental or regulatory compliance issues identified during the audits completed to December 31, 2013 .
In 2012, the federal government proposed a Greenhouse Gas Emissions Equivalency Agreement (the “Equivalency Agreement”) with the Province of Nova Scotia and began discussions on air pollutant emission targets for sulphur dioxide and nitrogen dioxide . The Province issued a discussion paper outlining 2021 —2030 emissions targets for greenhouse gases, sulphur dioxide, nitrogen dioxide and mercury . Comments were received on the discussion paper, and in 2013, the Province signed an Order in Council supporting these targets . Environment Canada and the Province of Nova Scotia are working on finalizing the Equivalency Agreement . The Province of Nova Scotia will prepare further analysis and consideration of options, before the introduction of 2021—2030 sulphur dioxide and nitrogen dioxide targets .
Emera Energy EmissionsEE New England Gas Generation is subject to the Acid Rain Program for sulphur dioxide emissions and the Regional Greenhouse Gas Initiative (“RGGI”) for carbon dioxide emissions . In addition, Bridgeport Power is subject to the Clean Air Interstate Rule for ozone season nitrogen dioxide emission allowances . EE New England Gas Generation emits approximately two million tons of carbon dioxide per year . The amount of sulphur dioxide or nitrogen dioxide emitted is not considered significant . Changes to these emissions programs could adversely impact financial and operational performance .
As part of its acquisition of the EE New England Gas Generation, Emera acquired six million RGGI emission allowances, with each allowance being sufficient to offset one short ton of carbon dioxide emissions . The RGGI compliance period spans three years, with the current period covering January 1, 2012 to December 31, 2014 . The RGGI allowances acquired are sufficient to cover the carbon dioxide emissions liability that was assumed on acquisition, and are expected to cover a significant portion, if not all, of the balance of the liability anticipated to December 31, 2014 .
Poly Chlorinated Bi-Phenol TransformersIn response to the Canadian Environmental Protection Act 1999, 2008 Poly Chlorinated Bi-Phenol (“PCB”) Regulations to phase out electrical equipment and liquids containing PCBs, NSPI has implemented a program to eliminate transformers and other oil-filled electrical equipment on its system that do not meet the 2008 PCB Regulations Standard by 2014 . The federal government published proposed amendments to the PCB Regulations extending the required deadline for the removal of some types of equipment from 2014 to 2025 . The amendments are expected to be finalized in Q1 2014 . In addition, there is a capital program to destroy all confirmed PCB contaminated pole mount transformers taken out of service through attrition . The combined total cost of these projects is estimated to be $26 .2 million and, as at December 31, 2013, approximately $12 .1 million (December 31, 2012 — $10 .2 million) has been spent to date .NSPI has recognized an ARO of $11 .1 million as at December 31, 2013 (December 31, 2012 — $11 .8 million) associated with the PCB phase-out program .
ENLOn June 21, 2013, The Maritime Link Project, a sub-sea cable transmission project between the island of Newfoundland and Nova Scotia, received a release from the Federal Environmental Assessment process, as well as environmental approval from the provinces of Newfoundland and Labrador and Nova Scotia .
Caribbean UtilitiesThe Caribbean Utilities have implemented a Health Safety Environmental and Management system to assist in safeguarding the health and safety of employees, contractors and customers while ensuring protection of the environment .

Notes to the Consolidated Financial Statements
Emera Inc . — Annual Report 2013 143
D. PRINCIPAL RISKS AND UNCERTAINTIES
In this section, Emera describes some of the principal risks management believes could materially affect Emera’s business, revenues, operating income, net income, net asset or liquidity or capital resources . The nature of risk is such that no list can be comprehensive, and other risks may arise, or risks not currently considered material may become material in the future .
Sound risk management is an essential discipline for running the business efficiently and pursuing the Company’s strategy successfully . Emera has a business-wide risk management process, monitored by the Board of Directors, to ensure a consistent and coherent approach .
Regulatory and Political RiskThe Company’s rate-regulated subsidiaries and certain investments subject to significant influence are subject to risk of the recovery of costs and investments in a timely manner . As cost-of-service utilities with an obligation to serve, NSPI, Bangor Hydro, MPS, BLPC, GBPC, NSPML and DOMLEC must obtain regulatory approval to change electricity rates and/or riders from their respective regulators . Costs and investments can be recovered upon the respective regulator’s approval of the recovery in adjustments to rates and/or riders, which normally requires a public hearing process or may be mandated by other governmental bodies . In addition, the commercial and regulatory frameworks under which Emera and its subsidiaries operate can be impacted by significant shifts in government policy and changes in governments . Emera has certain investments subject to significant influence which are subject to regulatory risk and include: APUC, M&NP, LIL and LUCELEC .
During public hearing processes, consultants and customer representatives scrutinize the costs, actions and plans of these subsidiaries and their respective regulators determine whether to allow recovery and to adjust rates based upon the subsidiaries’ evidence and any contrary evidence from other parties . In some circumstances, other government bodies may influence the setting of rates . The subsidiaries manage this regulatory risk through transparent regulatory disclosure, ongoing stakeholder and government consultation and multi-party engagement on aspects such as utility operations, fuel-related audits, rate filings and capital plans . The subsidiaries employ a collaborative regulatory approach through technical conferences and, where appropriate, negotiated settlements .
Brunswick Pipeline entered into a 25-year firm service agreement with Repsol Energy Canada (“REC”), which was filed with the National Energy Board (“NEB”) . The firm service agreement provides for predetermined toll increases after the fifth and fifteenth year of the contract . As a regulated Group II pipeline, the tolls of Brunswick Pipeline are regulated by the NEB on a complaint basis . Brunswick Pipeline is required to make copies of tariffs and supporting financial information readily available to interested persons . Persons who cannot resolve traffic, toll and tariff issues with Brunswick Pipeline may file a complaint with the NEB . In the absence of a complaint, the NEB does not normally undertake a detailed examination of Brunswick Pipeline’s tolls .
Changes in Environmental LegislationThe Company is subject to regulation by federal, provincial, state, regional and local authorities with regard to environmental matters primarily related to its utility operations . Changes to climate change and air emissions standards could adversely affect utility operations .
Emera is committed to operating in a manner that is respectful and protective of the environment, and in full compliance with legal requirements and Company policy . Emera and its wholly owned subsidiaries have implemented this policy through development and application of environmental management systems .

144 Emera Inc . — Annual Report 2013
Commercial RelationshipsNSPINSPI’s five largest customers contributed approximately 9 .6 per cent (2012 — 7 .1 per cent) for the year ended December 31, 2013 . The loss of a large customer could have a material effect on NSPI’s operating revenues . NSPI works to mitigate this risk through operational adjustments and cost management as well as the regulatory process .
Brunswick PipelineBrunswick Pipeline has a 25-year firm service agreement with REC . The pipeline was used solely to transport natural gas from the CanaportTM LNG terminal in Saint John, New Brunswick to the United States border for REC . The risk of non-payment is mitigated as Repsol YPF, S .A (“Repsol”), the parent company of REC, has provided Brunswick Pipeline with a guarantee for all REC’s payment obligations under the firm service agreement . As at December 31, 2013, the net investment in direct financing lease with Repsol was $490 .3 million (December 31, 2012 — $491 .9 million) .
Bayside PowerBayside Power sells its power during the winter months, November through March, to NB Power in accordance with a long-term purchase power agreement (“PPA”) . Revenue from this PPA contributed 55 .3 per cent (2012 — 55 .7 per cent) to Bayside Power’s electric revenues for the nine months ended December 31, 2013 . The PPA expires March 31, 2021, with an option to renew for an additional five-year term, provided both parties consent to the renewal .
ENLIn 2012, Emera and Nalcor Energy executed agreements pertaining to the development and transmission of hydroelectric power from Muskrat Falls in Labrador to the island of Newfoundland, the Province of Nova Scotia and through to New England . In exchange for the Company’s investment in the Maritime Link Project, Nalcor has agreed to provide 20 per cent of the output of the Muskrat Falls generating station, estimated to be approximately $1 .56 billion .
Labour RiskCertain Emera employees are subject to collective labour agreements . Therefore, Emera may be subject to the detrimental effects of a strike or other labour action . Approximately 51 per cent of the full-time and term employees within the Emera group of companies are represented by local unions .
Approximately 9 per cent of the labour force is covered by collective labour agreements that will expire within the next twelve months . Emera seeks to manage this risk through ongoing discussions with local unions . In the event of a labour disruption, Emera would implement its contingency plans .
Interest Rate RiskThe Company utilizes a combination of fixed and variable rate debt financing for operations and capital expenditures resulting in an exposure to interest rate risk . The Company seeks to manage interest rate risk through a portfolio approach that includes the use of fixed and floating rate debt with staggered maturities . The Company will, from time to time, issue long-term debt or enter into interest rate hedging contracts to limit its exposure to fluctuations in floating interest rate debt .
Commodity Prices and Foreign Exchange Rate FluctuationsA substantial amount of the Company’s fuel supply comes from international suppliers and is subject to commodity price risk . Fuel contracts may be exposed to broader global conditions which may include impacts on delivery reliability and price, despite contracted terms . The Company seeks to manage this risk through the use of financial hedging instruments and physical contracts . In addition, the adoption and implementation of FAMs in certain subsidiaries has further helped manage this risk . The regulatory framework for the Company’s rate-regulated subsidiaries permits the recovery of prudently incurred costs .
The Company enters into foreign exchange forward and swap contracts to limit exposure on foreign currency transactions such as fuel purchases and USD revenue streams .

Notes to the Consolidated Financial Statements
Emera Inc . — Annual Report 2013 145
E. COLLABORATIVE ARRANGEMENTS
NSPINSPI is a participant in 23 .3-megawatt (“MW”) wind energy project with Renewable Energy Services Ltd . in Point Tupper, Nova Scotia . Percentage ownership of the wind project assets is based on the relative value of each party’s project assets by the total project assets with NSPI owning less than 49 per cent . NSPI’s has a power purchase arrangement to purchase the entire net output of the project and therefore NSPI’s portion of the revenues are recorded net, within fuel for generation and purchased power . NSPI’s portion of operating expenses, are recorded in operating, maintenance and general (“OM&G”) expenses . In 2013, NSPI recognized $2 .6 million (2012 — $2 .6 million) in fuel for generation and purchase power and $0 .5 million (2012 — $0 .5 million) in OM&G .
NSPI is a participant in the development of a 102 MW wind farm in South Canoe, Nova Scotia . Percentage ownership of the wind farm will be based on the relative value of each party’s project assets by the total project assets, however NSPI will not own more than 49 per cent . The projects are planned to be in service in 2015 .
Bangor HydroThrough Bangor Hydro, the Company is a party to a collaborative arrangement with National Grid Transmission Services Corporation to develop the Northeast Energy Link (“NEL”) Project . The cost of development activities, including acquisition of land in the transmission corridor and acquisition of necessary governmental and regulatory permits and approvals, are shared equally between the Company and National Grid . Bangor Hydro has deferred $2 .9 million USD of costs associated with the NEL project as at December 31, 2013 (December 31, 2012 — $2 .8 million USD), reported in the Consolidated Balance Sheets in “Other” as part of other assets .
F. GUARANTEES AND LETTERS OF CREDIT
Emera had the following guarantees and letters of credit on behalf of third parties not included within the Balance Sheets as at December 31, 2013: • NSPI has provided a limited guarantee for the indebtedness of Renewable Energy Services Ltd . (“RESL”) under a $23 .5 million loan
agreement between RESL and a third-party lender . As at December 31, 2013, RESL’s indebtedness under the loan agreement was $19 .6 million . NSPI holds a security interest in the present and future assets owned by RESL in connection with a wind energy project at Point Tupper, Nova Scotia . For further information, see Note 34 .
• Emera has provided a guarantee to the Long Island Power Authority (“LIPA”) on behalf of Bear Swamp for Bear Swamp’s long-term energy and capacity supply agreement (“PPA”) with LIPA, which expires on April 30, 2021 . The guarantee is for 50 per cent of the relevant obligations under the PPA up to a maximum of $5 .1 million USD . As at December 31, 2013, the fair value of the PPA was positive .
• Standby letters of credit in the amount of $7 .3 million USD for the benefit of third parties that have extended credit to Emera and its subsidiaries . These letters of credit typically have a one-year term and are renewed annually as required .
• Emera has provided standby letters of credit in the amount of $2 .9 million USD for the benefit of third parties that have extended credit to subsidiaries of NWP . These letters of credit typically have a one-year term and are renewed annually as required .
• A standby letter of credit to secure obligations under an unfunded pension plan in NSPI . The letter of credit expires in June 2014 and is renewed annually . The amount committed as at December 31, 2013 was $31 .7 million .
• A standby letter of credit to secure obligations under an unfunded pension plan in Bangor Hydro . The letter of credit expires in October 2014 and is renewed annually . The amount committed as at December 31, 2013 was $2 .2 million USD .
• A standby letter of credit in connection with a precedent transmission line agreement between Bangor Hydro and two other parties . The letter of credit expires in August 2014 . The amount committed as at December 31, 2013 was $1 .8 million USD .
No liability has been recognized on the consolidated balance sheet related to any potential obligation under these guarantees and letters of credits .

146 Emera Inc . — Annual Report 2013
30. Common Stock
Authorized: Unlimited number of non-par value common shares .
2013 2012
millions of millions of millions of Canadian millions of Canadian Issued and outstanding: shares dollars shares dollars
Balance, January 1 130.98 $1,643.7 122.83 $1,385.0Issuance of common stock — — 5.91 193.2Issued for cash under Purchase Plans at market rate 1.85 59.8 1.55 52.0Discount on shares purchased under Dividend Reinvestment Plan — (2.7) — (2.3)Options exercised under senior management share option plan 0.06 1.4 0.69 15.0Stock-based compensation — 0.8 — 0.8
Balance, December 31, 2013 132.89 $1,703.0 130.98 $1,643.7
As at December 31, 2013, there were the following common shares reserved for issuance: 2 .6 million (2012 — 2 .7 million) under the senior management stock option plan, 2 .0 million (2012 — 0 .1 million) under the employee common share purchase plan and 2 .0 million (2012 — 3 .7 million) under the dividend reinvestment plan . The issuance of common shares under the current or proposed common share compensation arrangements will not exceed ten per cent of Emera’s outstanding common shares .
31. Cumulative Preferred Stock
Authorized: Unlimited number of First Preferred shares, issuable in series . Unlimited number of Second Preferred shares, issuable in series .
Preferred stock (millions of millions of Canadian Issued and outstanding: shares dollars)
Balance, December 31, 2012 16.0 $ 391.6Issuance of First Preferred Shares Series E 5.0 122.4
Balance, December 31, 2013 21.0 $ 514.0
FIRST PREFERRED SHARES, SERIES E
On June 10, 2013, Emera issued five million 4 .50 per cent Cumulative Redeemable First Preferred Shares, Series E (“First Preferred Shares, Series E”) at $25 .00 per share for gross proceeds of $125 .0 million and net proceeds of $122 .4 million . The net proceeds of the preferred share offering were used for general corporate purposes, including repayments of indebtedness under the Company’s credit facility .
As the First Preferred Shares, Series E are neither redeemable at the option of the shareholder nor have a mandatory redemption date, they are classified as equity and the associated dividends will be deducted on the consolidated statements of earnings immediately before arriving at “Net earnings attributable to common shareholders” and will be shown on the consolidated statement of equity as a deduction from retained earnings .
The First Preferred Shares, Series E are entitled to receive fixed cumulative preferred cash dividends in the amount of $1 .125 per share per annum in perpetuity, subject to the Company’s redemption rights . On or after August 15, 2018, the Company may, on not less than 30 nor more than 60 days’ notice, redeem the Series E Preferred Shares in whole or in part, at the Company’s option, by the payment in cash of $26 .00 per Series E Preferred Share if redeemed prior to August 15, 2019; at $25 .75 per Series E Preferred Share if redeemed on or after August 15, 2019 but prior to August 15, 2020; at $25 .50 per Series E Preferred Share if redeemed on or after August 15, 2010 but prior to August 15, 2021; at $25 .25 per Series E Preferred Share if redeemed on or after August 15, 2021 but prior to August 15, 2022; and at $25 .00 per Series E Preferred Share if redeemed on or after August 15, 2022, in each case together with all declared and unpaid dividends up to but excluding the date fixed for redemption .

Notes to the Consolidated Financial Statements
Emera Inc . — Annual Report 2013 147
FIRST PREFERRED SHARES, SERIES C
On June 7 2012, Emera issued ten million 4 .10 per cent Cumulative Six-Year Rate Reset First Preferred Shares, Series C (“First Preferred Shares, Series C”) . The First Preferred Shares, Series C were issued at $25 .00 per share for gross proceeds of $250 .0 million and net proceeds of $244 .9 million .
As the First Preferred Shares, Series C are neither redeemable at the option of the shareholder nor have a mandatory redemption date, they are classified as equity and the associated dividends will be deducted on the Consolidated Statements of Income immediately before arriving at “Net income attributable to common shareholders” and will be shown on the Consolidated Statement of Changes in Equity as a deduction from “Retained earnings” .
The holders of First Preferred Shares, Series C are entitled to receive fixed cumulative preferred cash dividends in the amount of $1 .025 per share per annum for each year up to but excluding August 15, 2018, as and when declared by the Board of Directors . For each five-year period after August 15, 2018, the holders of Series C Shares will be entitled to receive reset fixed cumulative preferred cash dividends . The reset annual dividends per share will be determined by multiplying the $25 .00 per share by the annual fixed dividend rate, which is the sum of the five-year Government of Canada Bond Yield on the application reset date plus 2 .65 per cent .
On August 15, 2018 and on August 15 every five years thereafter, the Company has the right to redeem all or any part of the then outstanding Frist Preferred Shares, Series C by the payment of an amount in cash of $25 per share plus all accrued and unpaid dividends up to but excluding the date fixed for redemption .
The holders of First Preferred Shares, Series C will, subject to the automatic conversion provisions and the right of the Company to redeem those shares, have the right, at their option, to convert any of all of their shares into an equal number of Cumulative Floating Rate First Preferred Shares, Series D on August 15, 2018 and on August 15 every five years thereafter .
The holders of Series D Shares will be entitled to receive floating rate cumulative preferred cash dividends, as and when declared by the Board of Directors . The First Preferred Shares, Series D have the same characteristic as Series C, with the exception of the calculation of the floating dividend rate for the Series D shares being the sum of the T-bill rate plus 2 .65 per cent .
The holders of First Preferred Shares, Series D will, subject to the automatic conversion provisions and the right of the Company to redeem those shares, have the right, at their option, to convert any or all of their Series D Shares into an equal number of Series C Shares on August 15, 2023 and on August 15 every five years thereafter .
On August 15, 2023 and on August 15 every five years thereafter, the Company has the right to redeem all or any part of the then outstanding First Preferred Shares, Series D by the payment of an amount in cash of $25 per share plus all accrued and unpaid dividends up to but excluding the date fixed for redemption or $25 .50 per share plus all accrued and unpaid dividends up to but excluding the date fixed for redemption in the case of redemptions on any other date after August 15, 2018 .
FIRST PREFERRED SHARES, SERIES A
In June 2010, Emera issued six million 4 .40 per cent Cumulative Five-Year Rate Reset First Preferred Stock, Series A (“First Preferred Stock, Series A”) . The $150 million First Preferred Stock, Series A were issued at $25 .00 per share for net proceeds of approximately $146 .7 million .
As the First Preferred Shares, Series A are neither redeemable at the option of the shareholder nor have a mandatory redemption date, they are classified as equity and the associated dividends will be deducted on the consolidated statements of earnings immediately before arriving at “Net earnings attributable to common shareholders” and will be shown on the consolidated statement of equity as a deduction from retained earnings .
The First Preferred Shares, Series A are entitled to receive fixed cumulative preferred cash dividends in the amount of $1 .10 per share per annum for each year up to and including May 15, 2015 . For each five-year period after this date, the holders of First Preferred Shares, Series A are entitled to receive reset fixed cumulative preferred cash dividends . The reset annual dividends per share will be determined by multiplying the $25 .00 per share by the annual fixed dividend rate, which is the sum of the five-year Government of Canada Bond Yield on the applicable reset date plus 1 .84 per cent .
The holders of First Preferred Shares, Series A will have the right, at their option, to convert their shares into an equal number of Cumulative Floating Rate First Preferred Shares, Series B of the Company on August 15, 2015 and every five years thereafter .
The First Preferred Shares, Series B have the same characteristics as the Series A shares, with the exception of the calculation of the floating dividend rate for the Series B shares being the sum of the T-bill rate plus 1 .84 per cent .
The holders of the First Preferred Shares, Series B will have the right, at their option, to convert their shares into an equal number of Series A shares of the Company on August 15, 2020 and every five years thereafter .
On August 15, 2015 and August 15, 2020 respectively and on August 15 every five years thereafter, the Company has the right to redeem for cash the outstanding First Preferred Shares, Series A or B in whole or in part at a price of $25 per share plus all accrued and unpaid dividends up to but excluding the date fixed for redemption .
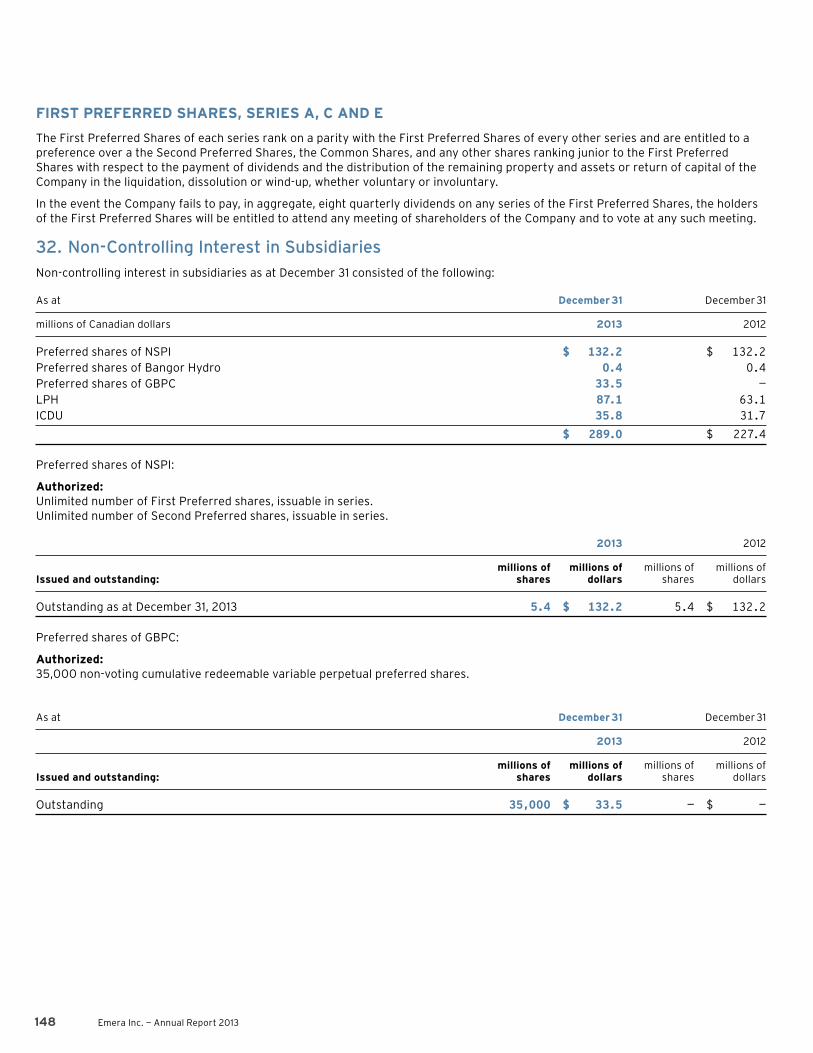
148 Emera Inc . — Annual Report 2013
FIRST PREFERRED SHARES, SERIES A, C AND E
The First Preferred Shares of each series rank on a parity with the First Preferred Shares of every other series and are entitled to a preference over a the Second Preferred Shares, the Common Shares, and any other shares ranking junior to the First Preferred Shares with respect to the payment of dividends and the distribution of the remaining property and assets or return of capital of the Company in the liquidation, dissolution or wind-up, whether voluntary or involuntary .
In the event the Company fails to pay, in aggregate, eight quarterly dividends on any series of the First Preferred Shares, the holders of the First Preferred Shares will be entitled to attend any meeting of shareholders of the Company and to vote at any such meeting .
32. Non-Controlling Interest in Subsidiaries
Non-controlling interest in subsidiaries as at December 31 consisted of the following:
As at December 31 December 31
millions of Canadian dollars 2013 2012
Preferred shares of NSPI $ 132.2 $ 132.2Preferred shares of Bangor Hydro 0.4 0.4Preferred shares of GBPC 33.5 —LPH 87.1 63.1ICDU 35.8 31.7
$ 289.0 $ 227.4
Preferred shares of NSPI:
Authorized: Unlimited number of First Preferred shares, issuable in series . Unlimited number of Second Preferred shares, issuable in series .
2013 2012
millions of millions of millions of millions of Issued and outstanding: shares dollars shares dollars
Outstanding as at December 31, 2013 5.4 $ 132.2 5.4 $ 132.2
Preferred shares of GBPC:
Authorized: 35,000 non-voting cumulative redeemable variable perpetual preferred shares .
As at December 31 December 31
2013 2012
millions of millions of millions of millions of Issued and outstanding: shares dollars shares dollars
Outstanding 35,000 $ 33.5 — $ —

Notes to the Consolidated Financial Statements
Emera Inc . — Annual Report 2013 149
NSPI SERIES D FIRST PREFERRED STOCK
On and after October 15, 2015, Series D First Preferred Stock is redeemable by NSPI, in whole at any time or in part from time to time at $25 per share plus accrued and unpaid dividends . NSPI also has the option, commencing October 15, 2015, to exchange the Series D First Preferred Stock into Emera common stock, determined by dividing $25 by the greater of $2 and the market price of the Emera common stock .
Commencing on and after January 15, 2016, with prior notice and prior to any dividend payment date, each Series D First Preferred Stock will be exchangeable at the option of the holder into fully paid and freely tradable Emera common stock, determined by dividing $25 by the greater of $2 and the market price of the Emera common stock, subject to the right of NSPI to redeem such stock for cash or to cause the holders of such stock to sell on the exchange date all or any part of such stock to substitute purchasers found by NSPI . NSPI will pay all accrued and unpaid dividends to the exchange date .
Each Series D First Preferred Stock is entitled to a $1 .475 per share per annum fixed cumulative preferential dividend, as and when declared by the Board of Directors, accruing from the date of issue and payable quarterly on the fifteenth day of January, April, July and October of each year .
The First Preferred Shares of each series rank on a parity with the First Preferred Shares of every other series issued by NSPI and are entitled to a preference over NSPI’s Second Preferred Shares, the Common Shares, and any other shares ranking junior to the First Preferred Shares with respect to the payment of dividends and the distribution of the remaining property and assets or return of capital of NSPI in the liquidation, dissolution or wind-up, whether voluntary or involuntary .
In the event NSPI fails to pay, in aggregate, eight quarterly dividends on any series of the First Preferred Shares, the holders of NSPI’s First Preferred Shares will be entitled to attend any meeting of shareholders of NSPI and to vote at any such meeting .
GBPC NON–VOTING CUMULATIVE VARIABLE PERPETUAL PREFERRED STOCK
On and after January 16, 2016, the Preferred Stock is redeemable by GBPC, in whole at any time or in part from time to time, at $1,000 Bahamian per share plus accrued and unpaid dividends .
The Preferred Stock is entitled to a 7 .25 per cent per annum fixed cumulative preferential dividend for years 2013 through 2016, 8 .50 per cent per annum fixed cumulative preferential dividend for years 2017 through 2019 and, 10 .00 per cent per annum fixed cumulative preferential dividend after 2020, as and when declared by the Board of Directors, accruing from the date of issue .
The Preferred Shares rank behind all of GBPC’s current and future secured and unsecured debt with any of GBPC’s future preferred stock and ahead of all of GBPC’s current and future common stock .

150 Emera Inc . — Annual Report 2013
33. Stock-Based Compensation
EMPLOYEE COMMON STOCK PURCHASE PLAN AND COMMON SHAREHOLDERS DIVIDEND REINVESTMENT AND SHARE PURCHASE PLAN
The Company has an Employee Common Share Purchase Plan to which employees make cash contributions for the purpose of purchasing common shares . The Company also contributes to the plan a per cent age of the employees’ contributions . The plan allows the reinvestment of dividends . The maximum aggregate number of common shares reserved for issuance under this plan is 2 .0 million common shares .
The Company uses the fair value-based method to measure the compensation expense related to its employee purchase plan . Compensation cost recognized for the year ended December 31, 2013 was $0 .8 million (2012 — $0 .8 million) and is included in “Operating, maintenance and general” on the Consolidated Statements of Income .
The Company also has a Common Shareholders Dividend Reinvestment and Share Purchase Plan (“Dividend Reinvestment Plan”), which provides an opportunity for shareholders to reinvest dividends and to make cash contributions for the purpose of purchasing common shares . Effective September 25, 2009, Emera changed its Dividend Reinvestment Plan to provide for a discount of up to 5 per cent from the average market price of Emera’s common shares for common shares purchased in connection with the reinvestment of cash dividends under the Plans .
STOCK-BASED COMPENSATION PLANS
Stock Option PlanThe Company has a stock option plan that grants options to senior management of the Company for a maximum term of ten years . The option price of the stock options is the closing market price of the stocks on the day before the option is granted . The maximum aggregate number of shares issuable under this plan is 6 .7 million shares .
All options granted to date are exercisable on a graduated basis with up to 25 per cent of options exercisable on the first anniversary date and in further 25 per cent increments on each of the second, third and fourth anniversaries of the grant . If an option is not exercised within ten years, it expires and the optionee loses all rights thereunder . The holder of the option has no rights as a shareholder until the option is exercised and shares have been issued . The total number of stocks to be optioned to any optionee shall not exceed five per cent of the issued and outstanding common stocks on the date the option is granted .
If, before the expiry of an option in accordance with its terms, the optionee ceases to be an eligible person due to retirement or termination for other than just cause, such option may, subject to the terms thereof and any other terms of the plan, be exercised at any time within the 24 months following the date the optionee retires, but in any case prior to the expiry of the option in accordance with its terms .
If, before the expiry of an option in accordance with its terms, the optionee ceases to be an eligible person due to employment termination for just cause, resignation or death, such option may, subject to the terms thereof and any other terms of the plan, be exercised at any time within the six months following the date the optionee is terminated, resigns or dies, as applicable, but in any case prior to the expiry of the option in accordance with its terms .
The Company uses the fair value-based method to measure the compensation expense related to its stock-based compensation and recognizes the expense over the vesting period on a straight-line basis . The fair value of stock option awards granted was estimated on the date of grant using a Black-Scholes valuation model . The expected term of the option awards is calculated based on historical exercise behaviour and represents the period of time that options are expected to be outstanding . The risk-free interest rate is based on the Bank of Canada seven-year government bond yields . The expected dividend yield incorporates current dividend rates as well as historical dividend increase patterns . Emera’s expected stock price volatility was estimated using its three-year historical volatility .
The following table shows the weighted-average fair values per stock option along with the assumptions incorporated into the valuation models for options granted:
2013 2012
Weighted average fair value per option $ 3.24 $ 2.51Expected term 5 years 6 .5 yearsRisk-free interest rate 1.49% 1.58%Expected dividend yield 3.98% 4.32%Expected volatility 18.21% 16.38%
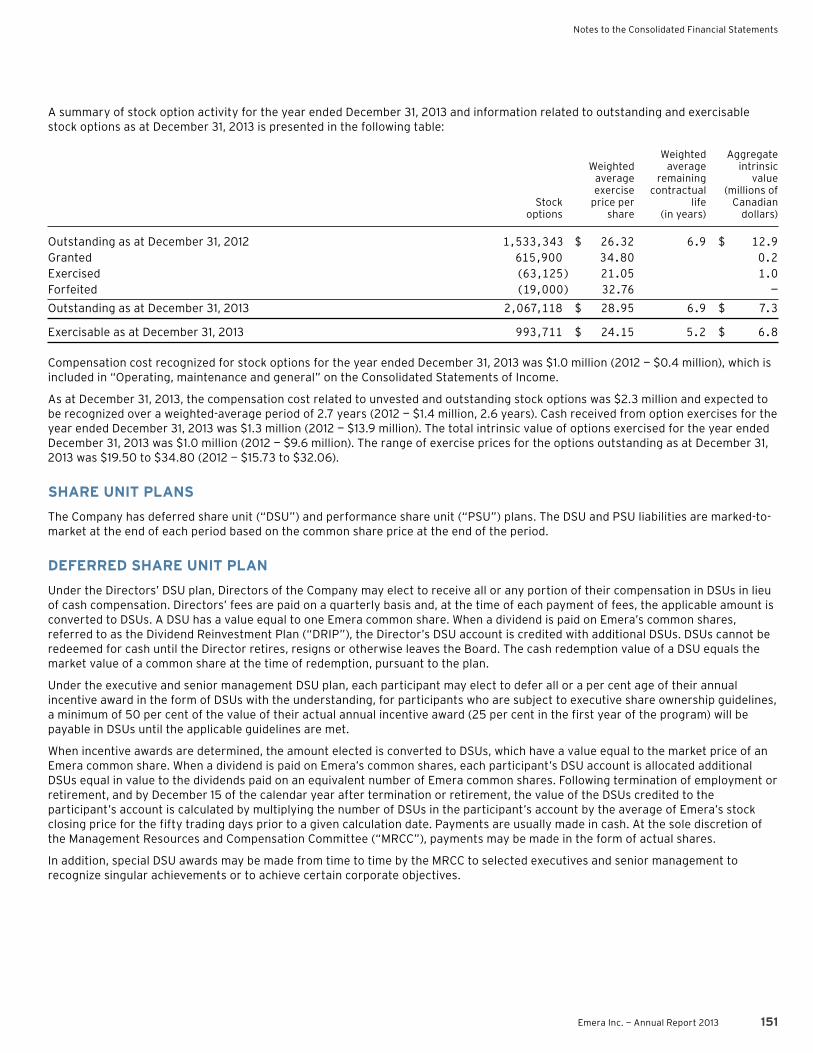
Notes to the Consolidated Financial Statements
Emera Inc . — Annual Report 2013 151
A summary of stock option activity for the year ended December 31, 2013 and information related to outstanding and exercisable stock options as at December 31, 2013 is presented in the following table:
Weighted Aggregate Weighted average intrinsic average remaining value exercise contractual (millions of Stock price per life Canadian options share (in years) dollars)
Outstanding as at December 31, 2012 1,533,343 $ 26.32 6.9 $ 12.9Granted 615,900 34.80 0.2Exercised (63,125) 21.05 1.0Forfeited (19,000) 32.76 —
Outstanding as at December 31, 2013 2,067,118 $ 28.95 6.9 $ 7.3
Exercisable as at December 31, 2013 993,711 $ 24.15 5.2 $ 6.8
Compensation cost recognized for stock options for the year ended December 31, 2013 was $1 .0 million (2012 — $0 .4 million), which is included in “Operating, maintenance and general” on the Consolidated Statements of Income .
As at December 31, 2013, the compensation cost related to unvested and outstanding stock options was $2 .3 million and expected to be recognized over a weighted-average period of 2 .7 years (2012 — $1 .4 million, 2 .6 years) . Cash received from option exercises for the year ended December 31, 2013 was $1 .3 million (2012 — $13 .9 million) . The total intrinsic value of options exercised for the year ended December 31, 2013 was $1 .0 million (2012 — $9 .6 million) . The range of exercise prices for the options outstanding as at December 31, 2013 was $19 .50 to $34 .80 (2012 — $15 .73 to $32 .06) .
SHARE UNIT PLANS
The Company has deferred share unit (“DSU”) and performance share unit (“PSU”) plans . The DSU and PSU liabilities are marked-to-market at the end of each period based on the common share price at the end of the period .
DEFERRED SHARE UNIT PLAN
Under the Directors’ DSU plan, Directors of the Company may elect to receive all or any portion of their compensation in DSUs in lieu of cash compensation . Directors’ fees are paid on a quarterly basis and, at the time of each payment of fees, the applicable amount is converted to DSUs . A DSU has a value equal to one Emera common share . When a dividend is paid on Emera’s common shares, referred to as the Dividend Reinvestment Plan (“DRIP”), the Director’s DSU account is credited with additional DSUs . DSUs cannot be redeemed for cash until the Director retires, resigns or otherwise leaves the Board . The cash redemption value of a DSU equals the market value of a common share at the time of redemption, pursuant to the plan .
Under the executive and senior management DSU plan, each participant may elect to defer all or a per cent age of their annual incentive award in the form of DSUs with the understanding, for participants who are subject to executive share ownership guidelines, a minimum of 50 per cent of the value of their actual annual incentive award (25 per cent in the first year of the program) will be payable in DSUs until the applicable guidelines are met .
When incentive awards are determined, the amount elected is converted to DSUs, which have a value equal to the market price of an Emera common share . When a dividend is paid on Emera’s common shares, each participant’s DSU account is allocated additional DSUs equal in value to the dividends paid on an equivalent number of Emera common shares . Following termination of employment or retirement, and by December 15 of the calendar year after termination or retirement, the value of the DSUs credited to the participant’s account is calculated by multiplying the number of DSUs in the participant’s account by the average of Emera’s stock closing price for the fifty trading days prior to a given calculation date . Payments are usually made in cash . At the sole discretion of the Management Resources and Compensation Committee (“MRCC”), payments may be made in the form of actual shares .
In addition, special DSU awards may be made from time to time by the MRCC to selected executives and senior management to recognize singular achievements or to achieve certain corporate objectives .

152 Emera Inc . — Annual Report 2013
A summary of the activity related to employee and director DSUs for the year ended December 31, 2013 is presented in the following table:
Weighted Weighted average average Employee grant date Director grant date DSU fair value DSU fair value
Outstanding as at December 31, 2012 390,991 $ 22.34 216,184 $ 26.16Granted including DRIP 52,540 30.48 51,019 31.23Exercised — — (23,831) 24.50
Outstanding as at December 31, 2013 443,531 $ 23.30 243,372 $ 28.43
Compensation cost recognized for employee and director DSU for the year ended December 31, 2013 was $0 .7 million (2012 — $3 .9 million) . Tax benefits related to this compensation cost for share units realized for the year ended December 31, 2013 were $0 .3 million (2012 — $1 .3 million); $0 .2 million was offset with regulatory assets and regulatory liabilities (2012 — $0 .4 million) .
PERFORMANCE SHARE UNIT PLAN
Under the PSU plan, executive and senior employees are eligible for long-term incentives payable through the PSU plan . PSUs are granted annually for three-year overlapping performance cycles . PSUs are granted based on the average of Emera’s stock closing price for the fifty trading days prior to a given calculation date . Dividend equivalents are awarded and are used to purchase additional PSUs, also referred to as DRIP . The PSU value varies according to the Emera common share market price and corporate performance .
PSUs vest at the end of the three-year cycle and will be calculated and approved by the MRCC early in the following year . The value of the payout considers actual service over the performance cycle and will be pro-rated in the case of retirement, disability or death .
A summary of the activity related to employee PSUs for the year ended December 31, 2013 is presented in the following table:
Weighted average Employee grant date PSU fair value
Outstanding as at December 31, 2012 359,161 $ 29.59Granted including DRIP 183,459 32.71Exercised (126,600) 23.71Forfeited (6,143) 32.13
Outstanding as at December 31, 2013 409,877 $ 32.77
Compensation cost recognized for the PSU plan for the year ended December 31, 2013 was $2 .0 million (2012 — $5 .1 million) . Tax benefits related to this compensation cost for share units realized for the year ended December 31, 2013 were $0 .6 million (2012 — $1 .7 million) .

Notes to the Consolidated Financial Statements
Emera Inc . — Annual Report 2013 153
NON-VESTED STOCK-BASED COMPENSATION PLANS
For the year ended December 31, 2013, a summary of activity from the different plans is presented in the following table:
Share unit plan
Stock option plan DSU plan PSU plan
Weighted Weighted Weighted average average average Number of grant date Number of grant date Number of grant date options fair value share units fair value share units fair value
Non-vested shares as at December 31, 2012 788,768 $ 30.04 31,450 $ 21.52 258,637 $ 31.88Granted 615,900 34.80 52,540 30.48 183,459 32.71Vested (312,261) 27.74 (72,224) 28.12 (155,612) 31.19Forfeited (19,000) 32.76 — — (6,143) 32.13
Non-vested shares as at December 31, 2013 1,073,407$ 33.39 11,766 $ 21.04 280,341 $ 33.50
FULLY VESTED STOCK-BASED COMPENSATION PLANS
Share unit plan
Stock option plan DSU plan PSU plan
OutstandingNumber of options/share units 2,067,118 675,136 129,536Weighted-average exercise price of options $ 28.95 — —Aggregate intrinsic value of options/ fair value of share units $7,336,860 $20,638,921 $3,959,926Weighted-average remaining contractual terms of options/share units 6 .9 years — —Currently exercisableNumber of options/share units 993,711 — —Weighted-average exercise price of options $ 24.15 — —Aggregate intrinsic value of options/ fair value of share units $6,814,163 — —Weighted-average remaining contractual terms of options/share units 5 .2 years — —
The total fair value of shares vested for all the plans was $55 .0 million for the year ended December 31, 2013 (2012 — $49 .4 million) . The weighted-average grant date fair value of shares, granted for all the plans, for the year ended December 31, 2013 was $28 .61 (2012 — $23 .74) .

154 Emera Inc . — Annual Report 2013
34. Variable Interest Entities
The Company performs ongoing analysis to assess whether it holds any VIEs . To identify potential VIEs, management reviews contracts under leases, long-term purchase power agreements, tolling contracts and jointly owned facilities .
VIEs of which the Company is deemed the primary beneficiary must be consolidated . The primary beneficiary of a VIE has both the power to direct the activities of the entity that most significantly impact its economic performance and the obligation to absorb losses of the entity that could potentially be significant to the entity . In circumstances where Emera is not deemed the primary beneficiary, the VIE is not recorded in the Company’s consolidated financial statements .
LPH has established a Self Insurance Fund (“SIF”) primarily for the purpose of building a fund to cover risk against damage and consequential loss to certain generating, transmission and distribution systems . LPH holds a variable interest in the SIF for which it was determined that LPH was the primary beneficiary and, accordingly, the SIF must be consolidated by LPH . In its determination that LPH controls the SIF, management considered that, in substance, the activities of the SIF are being conducted on behalf of LPH’s subsidiary BLPC and BLPC, alone, obtains the benefits from the SIF’s operations . Additionally, because LPH, through BLPC, has rights to all the benefits of the SIF, it is also exposed to the risks related to the activities of the SIF .
NSPI holds a variable interest in RESL, a VIE for which it was determined that NSPI was not the primary beneficiary since it does not have the controlling financial interest of RESL . NSPI has provided a guarantee with no set term for the indebtedness of RESL under a loan agreement between RESL and a third-party lender for $23 .5 million, in support of which NSPI holds a security interest in the present and future assets owned by RESL, in connection with a wind energy project at Point Tupper, Nova Scotia . The guarantee arose in conjunction with NSPI’s participating in the foregoing wind energy project, which is operated by RESL . Under a purchased power agreement, NSPI purchases, at a fixed price, 100 per cent of the power generated by the project . A default by RESL, under its loan agreement, would require NSPI to make payment under the guarantee . As at December 31, 2013, RESL’s indebtedness under the loan agreement was $19 .6 million (December 31, 2012 — $20 .8 million), and NSPI has not recorded a liability in relation to the guarantee .
Bangor Hydro holds a variable interest in Chester Static Var Compensator (“SVC”), a VIE for which it was determined that Bangor Hydro was not the primary beneficiary since it does not have the controlling financial interest of Chester SVC . A subsidiary of Bangor Hydro is a 50 per cent general partner in Chester SVC, which owns electrical equipment that supports a major transmission line . A wholly owned subsidiary of Central Maine Power Company owns the other 50 per cent interest . Chester SVC is 100 per cent debt financed and accordingly the partners have no equity interest; and the holders of the SVC notes are without recourse against the partners or their parent companies .
The Company has identified certain long-term purchase power agreements that could be defined as variable interests as the Company has to purchase all or a majority of the electricity generation at a fixed price . However, it was determined that the Company was not the primary beneficiary since it lacked the power to direct the activities of the entity, including the ability to operate the generating facilities and make management decisions .
Emera’s consolidated VIE is recorded as an “Available-for-sale investment” and “Restricted cash” . The following table provides information about Emera’s portion of consolidated and unconsolidated VIEs:
As at December 31, 2013 December 31, 2012
Maximum Maximum Total exposure Total exposure millions of Canadian dollars assets to loss assets to loss
Consolidated VIEBLPC SIF $ 75.8 $ 75.8 $ 66.2 $ 66.2Unconsolidated VIEs in which Emera has variable interestsRESL — 23.5 — 23.5Chester SVC — — — —
For the years ended, December 31 2013 and 2012, the Company has not identified any new VIEs .

Notes to the Consolidated Financial Statements
Emera Inc . — Annual Report 2013 155
35. Acquisitions
BRIDGEPORT ENERGY, TIVERTON POWER AND RUMFORD POWER
On November 19, 2013, Emera acquired all of the outstanding equity interests in three combined-cycle gas-fired electricity generating facilities in New England: Bridgeport Energy (520 MW) in Bridgeport, Connecticut; Tiverton Power (265 MW) in Tiverton, Rhode Island; and Rumford Power (265 MW) in Rumford, Maine (collectively “EE New England Gas Generation”), for total cash consideration of $575 .1 million CAD ($549 .5 million USD) . This investment was made as gas-fired generation is a natural complement to Emera’s New England wind and pumped storage position and will enable Emera to optimize its generation portfolio . To finance the transaction, Emera received repayment of its $150 million USD loan to NWP, which was facilitated by the recent refinancing of that entity’s indebtedness . These funds, together with a newly established one-year $350 million USD non-revolving credit facility and other cash resources on hand, were used to finance the closing .
The fair value valuation technique was used to measure the acquisition-date fair value of the assets and liabilities . The purchase price was negotiated between arms-length parties . The purchase price allocation has not been finalized as work is ongoing to corroborate the valuation of property, plant and equipment and asset retirement obligations . The total purchase price has been preliminarily allocated to the fair value of assets and liabilities as follows:
millions of Canadian dollars
Receivables, net $ 0.3Inventory 28.0Prepaid expenses 3.0Property, plant and equipment 573.5Accounts payable (2.5)Income taxes payable (0.5)Derivative liability — current (14.5)Other current liabilities (0.4)Other long term liabilities (11.8)
Total purchase consideration $ 575.1
The Company has included operating revenues of $68 .0 million and net income attributable to common shareholders of $6 .0 million, before acquisition costs, for EE New England Gas Generation in its consolidated net income attributable to common shareholders for fiscal 2013 related to the period subsequent to November 19, 2013, when the financial results of EE New England Gas Generation were consolidated into Emera’s financial results .
The Company also incurred $2 .2 million in acquisition-related costs for the year ended December 31, 2013 . These costs are included in “Operating, maintenance and general expense” in the Consolidated Statements of Income .
Supplemental Pro Forma DataThe pro forma statement below gives effect to the acquisition of EE New England Gas Generation as if the transaction had occurred at the beginning of 2012 . This pro forma data is presented for informational purposes only and does not purport to be indicative of the results of future operations or of the results that would have occurred had the acquisition taken place at the beginning of 2012, nor is it indicative of the results that may be expected in future periods .
For the Year ended December 31
millions of Canadian dollars (except per share amounts) 2013 2012
Operating revenues $2,465.1 $2,278.5Net income attributable to common shareholders 217.9 199.5
Pro forma basic earnings per share $ 1.64 $ 1.60Pro forma diluted earnings per share $ 1.64 $ 1.59

156 Emera Inc . — Annual Report 2013
Brooklyn Power and DOMLECThe Company closed the following acquisitions during the year ended December 31, 2013:
On July 22, 2013, Emera, through its wholly owned subsidiary, Emera Energy, purchased a 100 per cent interest in Brooklyn Power Corporation (“Brooklyn Energy”) for total consideration of $26 .8 million . Brooklyn Energy is a 30 MW biomass co-generation facility located in Brooklyn, Nova Scotia . This investment was made to increase Emera’s renewable generation portfolio .
On April 10, 2013, LPH acquired a 51 .91 per cent interest in DOMLEC, an integrated utility on the island of Dominica for $10 .7 million ($10 .5 million USD) . Through LPH’s investment, Emera acquired a 41 .7 per cent interest . DOMLEC serves approximately 35,000 customers and is regulated by the Independent Regulatory Commission, Dominica . This investment was made to increase Emera’s regulated electricity, transmission and generation portfolio .
Earnings of the acquired companies are included in the Company’s results of operations from their respective acquisition dates . The aggregate purchase price consideration of these acquisitions was $37 .5 million .
The valuation techniques used to measure the acquisition-date fair value of the assets and liabilities of Brooklyn Energy and DOMLEC was fair value . The purchase price allocations have been finalized . The combined purchase price has been allocated to the fair value of assets and liabilities as follows:
millions of Canadian dollars
Cash and cash equivalents $ 0.4Receivables, net 7.2Inventory 9.7Prepaid expenses 0.8Property, plant and equipment 61.5Deferred income tax asset 2.9Current portion of long-term debt (1.3)Accounts payable (5.3)Income tax payable (0.1)Other current liabilities (1.2)Long-term debt (15.4)Deferred income taxes (6.6)Gain on business acquisition (1) (2.8)Non-controlling interest in subsidiaries (12.3)
Total purchase consideration $ 37.5
(1) The acquisition of a controlling interest in DOMLEC resulted in a non-taxable gain of $2 .8 million, representing the difference between the purchase price and the fair value of the assets and liabilities at the acquisition date . Emera was the exclusive bidder . The gain is included in “Other income (expenses) net” in the Consolidated Statements of Income .
36. Subsequent Events
On January 7, 2014, Emera completed an offering of 8,665,000 common shares, including the exercise of the over-allotment option of 865,000 common shares, at $28 .85 per common share, for net proceeds of approximately $239 .9 million .

EMERA LEADERSHIP BOARD OF DIRECTORS
John McLennan Chairman, (outgoing), Emera Inc . Former Vice-Chair and Chief Executive Officer, Allstream Inc . Mahone Bay, Nova Scotia
Jacqueline Sheppard, Q.C.Chair (incoming), Emera Inc . Former Executive Vice-President, Corporate and Legal, Talisman Energy Inc . Calgary, Alberta
Robert Briggs (retiring from Emera’s board) Former President and Chief Executive Officer, Bangor Hydro Electric Company Carrabassett Valley, Maine
Allan Edgeworth President, ALE Energy Inc . Calgary, Alberta
Lynn Loewen, FCA Chief Operating Officer, Minogue Medical Inc . Westmount, Quebec
Andrea Rosen Former Vice-Chair, TD Bank Financial Group and President, TD Canada Trust Toronto, Ontario
Christopher Huskilson President and Chief Executive Officer, Emera Inc . Wellington, Nova Scotia
Sylvia Chrominska Former Group Head, Global Human Resources, and Communications The Bank of Nova Scotia Toronto, Ontario
James Eisenhauer, FCA President and Chief Executive Officer, ABCO Group Limited Lunenburg, Nova Scotia
Donald Pether Former Chair of the Board and Chief Executive Officer, ArcelorMittal Dofasco Inc . Dundas, Ontario
Richard Sergel Former President and Chief ExecutiveOfficer, North American ElectricReliability Corporation (NERC)Wellesley, Massachusetts
Christopher HuskilsonPresident and Chief Executive Officer, Emera Inc .
Rob BennettExecutive Vice President and Chief Operating Officer, Emera Inc .
Scott BalfourExecutive Vice President and Chief Financial Officer, Emera Inc .
Nancy TowerExecutive Vice President of Business Development, Emera Inc .Chief Executive Officer, Emera Newfoundland & Labrador
Barbara Meens ThistleChief Human Resources Officer, Emera Inc .
Bruce MarchandChief Legal Officer, Emera Inc .
Robert HanfPresident and Chief Executive Officer, Nova Scotia Power
Sarah MacDonaldPresident, Emera Caribbean President and Chief Executive Officer, Grand Bahama Power President and Chief Executive Officer, ICD Utilities
Dan MuldoonPresident and Chief Operating Officer of CNG, Emera Inc .
Claudette PorterPresident and Chief Operating Officer, Emera Utility Services
Judy SteelePresident and Chief Operating Officer,Emera Energy
Gerry ChassePresident and Chief Operating Officer,Emera Maine
Rick JanegaPresidentEmera Newfoundland & Labrador
Learn more about Emera's leadership and Board of Directors: www.emera.com/leaders

SHAREHOLDER INFORMATION
For general inquiries about our Company, please contact our corporate office:
Emera Inc.1223 Lower Water Street Halifax, Nova Scotia B3J 3S8 T: 902 .450 .0507
Information regarding Company news and initiatives, including our 2013 Annual Financial Report, is also available at our website: www.emera.com
Share ListingsToronto Stock Exchange (TSX)Common Shares: EMAPreferred Shares: EMA.PR.A, EMA.PR.C
and EMA.PR.E
Shares OutstandingCommon Shares: 132,886,124(as of December 31, 2013)
Transfer AgentComputershare Trust Company of CanadaPurdy’s Wharf Tower II1969 Upper Water Street, Suite 2008Halifax, Nova Scotia B3J 3R7T: 1 .877 .982 .8762F: 902 .420 .2764
Investor ServicesT: 902 .428 .6060 or 1 .800 .358 .1995F: 902 .428 .6181E: investors@emera .com
Financial Analysts, Portfolio Managers and Institutional InvestorsManager, Investor RelationsJill Hennigar, CAT: 902 .428 .6486F: 902 .428 .6118E: jill .hennigar@emera .com
Dividends Paid in 2013Emera Inc. paid Common Share dividends of$0.3500 per Common Share in Q1, Q2 andQ3, and $0.3625 per Common Share in Q4,for an effective annual Common Sharedividend rate of $1.4125 per Common Share.
Dividend Payments in 2014 Subject to approval by the Board of Directors, dividends for Emera Inc. are payable on or about the 15th of February, May, August and November. A first quarter Common Share dividend of $0.365 per common share and a series A First Preferred Share dividend of $0.2750 per share, Series C First Preferred Share dividend of $0.25625 per share, Series E First Preferred Share dividend of $0.28125 per share was declared and paid February 17, 2014.
Corporate SecretaryStephen AftanasT: 902 .428 .6096F: 902 .428 .6171E: stephen .aftanas@emera .com
Annual General MeetingThe Annual General Meeting is scheduled to be held May 7, 2014 at 2:00 p .m . (Atlantic Time) at Queens Place Emera Centre, 50 Queens Place Drive Liverpool, Nova Scotia .
This Annual Report contains forward-looking information. Actual future results may differ materially. Additional financial and opera-tional information is filed electronically with various securities commissions in Canada through the System for Electronic Document Analysis and Retrieval (SEDAR).
Dividend Reinvestment and Share Purchase PlanEmera’s Dividend Reinvestment and Share Purchase Plan is available to shareholders resident in Canada. The plan provides shareholders with a convenient and economical means of acquiring additional Common Shares through the reinvestment of dividends at a 5 per cent discount. Plan participants may also contribute cash payments of up to $5,000 per quarter. Participants of the plan pay no commissions, service charges or brokerage fees for shares purchased under the plan. Please contact Investor Services if you have questions or wish to receive a copy of the plan brochure and enrollment form.
Direct Deposit ServiceShareholders may have dividends deposited directly into accounts held at financial institutions that are members of the Canadian Payments Association. To arrange this service, please contact Investor Services.
Quarterly EarningsQuarterly earnings are expected to be announced May 6, August 12 and November 10, 2014. Year-end results for 2013 were released in February 2014.
Printed on Rolland Opaque, a FSC® Mix certified paper which contains 30% de-inked post-consumer fibre and is manufactured in Canada with biogas (an alternative green energy source that reduces greenhouse gas emissions that cause global warming).