annual report insights 2017 surveying ftse reporting
TRANSCRIPT
Annual report insights 2017Surveying FTSE reporting

Contents
Overview 01
Introduction 05
1. Company purpose 06
2. Report structure and preliminary announcements 08
3. Alternative performance measures 12
4. Business model 16
5. Stakeholder engagement 20
6. Risks and opportunities 24
7. Viability statements 28
8. Corporate governance 32
9. Nomination committee reporting 36
10. Audit committee reporting 40
11. Judgements and estimates, tax and pensions 46
12. Other financial statement disclosures 50
Appendix 1 – The preparation process 54
Appendix 2 – Timeline of key corporate reporting changes 56
Appendix 3 – Additional disclosure examples 58
Appendix 4 – Regulatory overview 78

Overview
Welcome to the latest edition of our Annual Report Insights. As ever, we have scoured the reports of 100 listed UK companies, of various sizes and in various industries, in order to provide you with insight into FTSE reporting practices. We look at the whole report, including the strategic report, governance content and the financial statements, with a focus on how companies are responding to new requirements and areas of regulatory focus as well as ways in which companies are innovating when reporting.
The big pictureSo what’s changed in companies’ most recent reports? You can probably guess whether reports got shorter or longer, but it is more interesting to look at the big picture and the way that corporate reporting is evolving to reflect broader economic and societal changes. Looking back 20 years, the average report was 43% narrative (and 57% was the financial statements). Now, the narrative makes up 61% of the report.
This shift reflects an increased recognition that the income statement and the balance sheet do not, in isolation, tell the whole story. It doesn’t take long to think of large corporates with hugely valuable brands, where those brands are not recognised in the accounts. Brands are an easy example here, but there are many more factors that are important to a company and which people want to know about when they pick up an annual report. Compared to 70% last year, we saw 77% of companies identifying key inputs in their business models in the form of off‑balance sheet resources and relationships such as customers, employees and intellectual property.
The IIRC’s International Integrated Reporting Framework (the <IR> Framework) can be helpful in this regard, and indeed six companies referred to it or produced a report called an “integrated report”. Linking to the above point around off‑balance sheet resources and relationships, we felt that 32 companies were clearly considering the <IR> notion of capitals in their business models.
This past year has also seen increased focus on section 172 of the Companies Act 2006 (s172), which sets out that directors must promote the longer term success of the company, but having regard to, inter alia, employees’ interests, the need to foster relationships with suppliers, customers and others and the impact on the community and environment. The purpose of the strategic report, under company law, is to inform members of the company and help them assess how the directors have performed their duty under s172. In this year’s survey we saw 17 companies referring to the requirements of s172, typically in their governance statements and, pleasingly, generally avoiding boilerplate language. 69% described, to varying extents, how they engaged with at least one stakeholder group other than shareholders and 63% discussed value creation for stakeholders other than shareholders. 12 companies also referred to the UN’s Sustainable Development Goals.
All these disclosures in today’s reports resonate with the FRC’s project on corporate culture, their proposed updates to the guidance on the strategic report and the government’s proposed governance reforms. The BEIS Select Committee’s April 2017 report on corporate governance also looked at how companies incorporate employee input into board discussions – at present, we saw only one company reporting about this.
01
Annual report insights 2017 | Surveying FTSE reporting

More encouragingly, we saw 41 companies giving a clear, prominent description of their purpose beyond just making profits for shareholders. A company’s purpose should be more than simply an explanation of what the company does, but it should also reflect consideration of how value creation is sustainable, in the longer term, for its broader stakeholders.
Although, technically, they are only required to the extent necessary for an understanding of the business, non‑financial KPIs were identified by 74% of companies, a slight increase on the 70% doing so last year. On average, those companies were identifying four such measures, often relating to customer satisfaction, employee engagement or health and safety metrics.
With an ever‑increasing use of, and market reliance, on non‑financial data and alternative performance measures, the quality of such data and the effectiveness of internal controls move into sharper focus, particularly since these are outside the scope of the traditional external audit. We saw 33% of audit committees in companies with an internal audit function failing to explain how they had assessed its effectiveness.
As companies endeavour to move away from an undue focus on short‑termism, looking at their longer term viability statements, only 22% reported on a lookout period spanning more than three years, although the FRC and Investment Association encourage a longer lookout period where that is appropriate to the business cycle. This was up from 14% last year. In our opinion, only 58% had a satisfactory explanation of their lookout period which went beyond simply referring to the medium term planning cycle.
Alternative performance measuresESMA’s recent guidelines on the use of alternative performance measures (APMs, sometimes referred to as non‑GAAP measures) applied to all the annual reports we surveyed. APMs are commonly used throughout UK annual reports, with investors often finding them useful in addition to the statutory IFRS measures. Of the 92 companies clearly identifying their key performance indicators, all included APMs. Similarly, 88 companies presented high level highlights in their reports before getting into any detail, of which approximately 80% were financial metrics and roughly half of those were APMs.
Encouragingly, 88 of the 92 companies clearly identifying their KPIs provided comparative balances for all their APMs, in line with ESMA’s guidelines and aiding an understanding of performance trends. We also saw 15 companies (up from six last year) highlighting changes to their KPIs, rather than changing them without drawing this to a reader’s attention.
However, it appeared that some companies were open to challenge on the level of prominence given to APMs, bearing in mind ESMA’s recently published Q&As on their guidelines. Albeit the question of prominence will invariably require judgement, potential sources of challenge for some included failing to provide IFRS equivalents where they existed, providing APMs in larger or bolded font (for example in headlines for chairmen’s or CEOs’ statements) and discussing APMs before GAAP measures.
02
Annual report insights 2017 | Surveying FTSE reporting

Nomination committee highlightsWith increased attention on effective long‑term governance, it was pleasing to see a substantial improvement in companies’ disclosures on succession planning. 89% of boards disclosed activity in this area, up from 69% in 2016. In addition, the quality of disclosure was significantly improved across all sizes of companies. It was especially noticeable that the smaller companies outside the FTSE 350 started to include informative disclosures on succession planning this year.
41% of companies explained the findings of their board evaluation and related action points (2016: 27%). This is a focus area for corporate governance reform, with the BEIS Select Committee report on corporate governance calling for more robust education, role description and performance evaluation for non‑executive directors.
On a related note, companies’ directors’ remuneration reports were on average 19 pages long, although no company gave ratios of CEOs’ pay to employees, as is currently being proposed by government.
Risks and BrexitThe issue of Brexit was widely discussed, with 89 companies mentioning it in their annual report and 55 of these including Brexit as a principal risk or a contributing factor to a principal risk. Eight companies indicated their business model may change as a result of Brexit, 21 made a positive statement that their business model would not be changing and two indicated that their business model had already changed in response to the referendum result.
44% disclosed board‑level attention to the topic of Brexit, where boards discussed strategy, principal risks and mitigating actions, whilst audit committees mentioned foreign exchange and treasury risk, potential impairments, principal risks and the impact on viability statements.
Interestingly, only two companies identified climate risk as a principal risk in its own right. Other environmental‑related and broader sustainability principal risks were identified by a number of other companies. The recommendations of the Financial Stability Board’s Task Force on Climate‑related Financial Disclosure are likely to be a challenge for many as they try to explain why climate risk is or is not considered a principal risk for their company. The FRC is adding further emphasis on climate risk in its proposed amendments to its strategic report guidance.
Far more common was the disclosure of cyber‑related risks. 71% of the FTSE 350 companies surveyed identified cyber attacks as a principal risk and 49% of smaller companies were similarly concerned. Unsurprisingly, many boards are taking the threat seriously – 50% disclosed board attention on cyber risk/cyber security, including board training, presentations to boards or audit committees and externally provided projects regarding cyber security.
03
Annual report insights 2017 | Surveying FTSE reporting

Final thoughtsThe ongoing shift in expectations of what an annual report needs to convey leaves preparers facing an ever more difficult task. This year, annual reports got three pages longer, now reaching an average of 155 pages. With so much content, whether your focus is on clearer communications or innovation in reporting, I believe this publication’s findings and examples offer valuable insights.
Veronica PooleGlobal IFRS Leader and UK Head of Corporate ReportingDeloitte
Accounting highlightsWith big IFRSs on revenue and financial instruments becoming effective imminently, it was disappointing that an overwhelming majority of companies (94% for IFRS 9 and 92% for IFRS 15) failed to provide any insight into the expected impact of these standards. Some stated that they either hadn’t assessed the impact, or that there might be a material impact, but without providing any further insight into potential effects and some included no disclosure at all. No company surveyed quantified the effect these Standards will have. Regulators have already called for action on these disclosures, setting out in detail their expectations for the forthcoming reporting season.
The FRC is undertaking a thematic review of companies’ disclosures on significant accounting judgements and sources of estimation uncertainty. At present, 94% of companies seemed open to challenge either because they had at least one “significant judgement” which seemed unlikely to have a significant effect, or because they had at least one “key source of estimation uncertainty” which seemed unlikely to give rise to a material adjustment in the next 12 months. Companies would be well advised to take a closer look at the disclosures they are making in this area.
The FRC is calling for disclosure of sensitivity analyses for all key areas of estimation uncertainty. Only 7% of companies provided comprehensive disclosure. Most of the time sensitivities were being provided where other Standards, such as IAS 36 and IAS 19, require specific disclosures.
04
Annual report insights 2017 | Surveying FTSE reporting

Introduction
The overriding aim of this publication is to provide insight into practices in annual reporting, focusing on areas where requirements have changed, where regulators are focusing or where innovative practices are emerging.
The publication presents the findings of a survey of 100 annual reports of UK companies with a premium listing of their equity on the London Stock Exchange. As far as possible the sample is consistent with that used in previous surveys, comprising 18 FTSE 100 companies (2016: 19), 39 FTSE 250 companies (2016: 39) and 43 companies outside the FTSE 350 (2016: 42). Investment trusts, other than real estate investment trusts, are excluded from the sample due to their specialised nature. The reports analysed are for financial years ended between 30 September 2016 and 2 April 2017.
Each section addresses a different aspect of a typical UK listed company’s annual report, generally distinguishing between:
• areas where compliance has been relatively good;
• areas where companies have struggled to comply with requirements; and
• areas where companies have gone beyond mere compliance and are innovating or voluntarily providing information.
Three topics in particular have, or will have, an impact on multiple parts of companies’ annual reports and therefore arise in different sections of our publication. To help identify these recurring topics we have used the following colour‑coding:
Integrated reporting – commentary highlighted blue
Brexit‑related issues – commentary highlighted green
Governance reform – commentary highlighted teal
Although our survey data uses only companies from our sample, when selecting examples of good practice, included at the end of each section, we have used material from the reports of companies that, in our view, best illustrate a particular requirement or innovation, regardless of whether they are in our sample.
Many more example disclosures can be found in an appendix accompanying the electronic version of this publication, available at www.deloitte.co.uk/annualreportinsights. A more detailed discussion of the regulatory requirements UK companies with a premium listing are subject to is also provided as an appendix in the electronic version.
Each section also includes a short list of items to watch out for in the reporting season ahead, again reflecting areas of changing requirements or practice and areas of regulatory focus.
05
Annual report insights 2017 | Surveying FTSE reporting

1. Company purpose
We found 41 companies in our sample included a prominent and clear description of the company’s purpose, explaining why it exists. In these cases the purpose was not just to make profit for its shareholders. Nor was it just a description of what the company does. It was about its sustainable value generation, in the long term, for its broader stakeholders including employees, customers, society, regulators, investors and the environment.
There is an increasing acknowledgement that a company needs a societal licence to operate to rebuild trust in business. 73% of companies alluded to a desire to maintain a reputation for high standards of business conduct. This came through by acknowledging their need to earn a societal licence to operate, or, as in most cases, highlighting risks that might affect their reputation such as major environmental or ethical failures, and failure to adhere to regulatory requirements.
There is also increasing recognition that commercial success is linked to a commitment to sustainable development and that they are interdependent1. This should be encapsulated in a clear, authentic purpose.
A clear company purpose sets the context for the company itself and, as a result, drives the company story told through the annual report. It underpins the business model and how the organisation creates value, drives the company’s strategy for stakeholder engagement, and reflects the underlying culture and values the company signs up to.
Taken together, a clear understanding of how these elements interact aids shareholders’ understanding
of how the directors have discharged their duty under section 1722 (see discussion in section 5).
This thinking is aligned with the IIRC’s International Integrated Reporting Framework (the <IR> Framework)
which introduces the concept of ‘integrated thinking’, in effect, living your purpose. The resulting integrated report brings together, in one place, information on strategy, governance, performance and prospects across commercial, social and environmental contexts. This year six companies referred to the <IR> Framework and/or produced a report called an integrated report. A few other companies said that they were run in, and reported in, an integrated way. We look at these various themes throughout this publication.
The length of purpose statements varied considerably. In our opinion, the most engaging were one to two sentences that gave enough space to say something of substance. Some reports, such as National Express Group PLC, clearly ‘marked’ their purpose to the reader upfront. Some organisations stated their ‘mission’ or ‘vision’. In some cases these encapsulated the purpose, but an overriding vision to ‘be the best….’ was not considered to get to the heart of a company’s purpose.
Good examples of purpose statements linked wider stakeholders back to what they do. For example Marks and Spencer Group PLC stated “We are committed to making every moment special for our customers, through our high quality, own‑brand food, clothing and home products we offer in our 1,433 stores worldwide and online.” Similarly, Kingfisher plc wrote “Our ambition is to become the leading home improvement company. We believe everyone should have a home they feel good about, so our purpose is to make home improvement accessible for everyone.” Some others were generic, including a bland statement or ‘buzz words’, indicating that they ‘create sustainable value’, ‘unlock value’ or ‘make a difference’. Unfortunately this doesn’t give the reader much insight and could be for any company.
A company’s purpose might change or evolve as the environment changes. National Grid plc explained how it had revisited its purpose, supporting vision, strategy and values in the year. Howden Joinery Group Plc did the same.
41 companies gave a clear, prominent description of their purpose beyond making profits for shareholders
06
Annual report insights 2017 | Surveying FTSE reporting

Examples of disclosureThe following statements of purpose go beyond making a profit for shareholders.
BT Group Plc
Pearson plc
National Grid plc
National Express plc
Lloyds plc
What to watch out for
Explain your company’s purpose. The importance of communicating company purpose and linking this to the strategy and business model is something that is drawn out in the FRC’s draft amendments to Guidance on the Strategic Report.3
Howden Joinery Group Plc
07
Annual report insights 2017 | Surveying FTSE reporting

2. Report structure and preliminary announcements2. Report structure and preliminary announcements
Average report length up from
152 to 155 pages
narrative financial statements39%61%
88%
Reports comprised
companies disclose a single figure for distributable profits
14 companies explicitly referred to materiality outside their financial statements
Companies produce an average of pages on directors’ remuneration
of reports were well structured
19
17
08
Annual report insights 2017 | Surveying FTSE reporting
Although there are relatively few rules in terms of how required content is structured, guidance from the FRC and the IIRC is available. We looked at how reports were structured and where companies chose to present certain information that doesn’t necessarily have an obvious “home”. We also considered the way in which companies announced their results to the market.
Length of report and materialityAnnual reports now stand at an average of
155 pages, up from 152 pages last year. After stripping out the effects of one company that managed to trim its report by more than 200 pages, the average increase is actually six pages. Unsurprisingly, the FTSE 350 reports surveyed were longer, averaging 180 pages, than smaller listed companies’ reports, which averaged 123 pages.
Overall, financial statements gained a page on average, now extending to 60 pages. However, the proportion of narrative content continues to grow, at 61% of the report (2016: 60%), emphasising the need to consider materiality in the context of narrative reporting as well as financial reporting. Although, for example, strategic reports need to be “fair, balanced and comprehensive”, the FRC’s guidance does point out that they should only contain information that is material to shareholders.
At present, few companies explicitly assert that they are considering materiality when it comes to their narrative reporting. One company explained how they had regard to materiality throughout their annual report, and a further 13 companies did so in relation to corporate responsibility information. Typical disclosure included insight into the fact that only material matters related to sustainability had been included in the strategic report, but that more could be found in separate sustainability reports available on the company’s website. In some cases, insight was provided into the determination as to whether an item was material, for example through use of a materiality matrix.
Directors’ remunerationOne area material to many is directors’
remuneration, so it should come as no surprise that the average remuneration report is 19 pages (2016: 17 pages) – over 10% of an average annual report. Given that the law only requires inclusion of the pay policy in years when the shareholders will vote to approve it – which need only be every third year – many companies chose to follow the GC100 Guidance and included a summary of the policy with a cross‑reference to the full version on their website; two companies excluded the policy completely. Despite this, the average description of policy ran to seven pages.
Although companies are legally required to disclose changes in the CEO’s pay compared to a selected population of employees, no company gave a ratio comparing it to employees’ pay, something which is being proposed by the government under their governance reforms.
09
Annual report insights 2017 | Surveying FTSE reporting

Structure and location of contentIn our opinion, 88% of the reports we surveyed
were well structured, such that there was a good “flow” when reading them. For the remaining 12% it was harder to navigate the report, for example, because of duplication or information being “forced” into locations without properly integrating it with the surrounding material. Preparers may find it helpful to consider the communication principles in the FRC’s strategic report guidance and the <IR> Framework guiding principles.
In terms of consistency, it was very pleasing to see that 99% of the reports we looked at had an analysis of their business in their strategic report that was broadly in line with their segmental analysis disclosed under IFRS 8. Such alignment reflects well on a company’s ability to tell a consistent story throughout the report.
Certain types of information appear in different parts of a report, or sometimes in
multiple parts. Brexit and the potential consequences for companies was primarily discussed in strategic reports (see later in this publication for an analysis of risk disclosures in this area). 86% did so, with 22% also discussing it in their governance reporting and 12% also doing so in their audit committee reporting. A further 3% discussed Brexit in their governance reporting but not in their strategic report.
The availability of distributable profits was also talked about in a variety of locations within companies’ reports. The FRC has previously stated that, whilst it encourages companies to pay close attention to their investors’ views and include good disclosure about distributable profits, the Companies Act 2006 does not require the separate disclosure of a figure for distributable profits or, specifically, multiple figures for distributable profits. 17 companies (2016: 14) disclosed a single figure for the level of profits available for distribution, with a further seven describing which of their reserves reflected distributable profits or reductions thereto.
10
Annual report insights 2017 | Surveying FTSE reporting

Examples of disclosureMondi Group Plc discussed materiality in the
context of their whole report on their contents page.
Mondi Group Plc
11 of the 17 companies disclosing a single figure did so in the financial statements, with the other six including it in their narrative reporting. Disclosures around dividend policy are discussed in our section on the business model.
Reporting timetable and results announcements
In an age where readers often want more information and quicker delivery, maybe surprisingly the average time taken by companies to approve their annual reports was longer this year, rising from 62 days to 64 days. Those in the FTSE 350 took longer with 59 days on average (2016: 56 days), whereas companies outside the FTSE 350 reported earlier than last year with an average of 69 days (2016: 71 days).
Looking at the results announcements companies made to the market, the average time was 63 days after the year end, similar to the above report approval timetable. Four companies made clear that their announcements were prior to completion of the external auditor’s report, two were unclear and the remaining 94 had received their audit opinions. Four companies chose to include a special‑purpose audit report in their results announcements, providing investors with more timely insight into the audit than waiting for the full annual report (in which an average of seven pages were devoted to the auditor’s report).
What to watch out for
Remember that the strategic report is only required to contain information material to shareholders.
Consider the communication principles set out in the FRC’s guidance on the strategic report and the <IR> Framework’s Guiding Principles.
Changes will be required to audit reports for periods commencing on or after 17 June 2016.4
Consider investor views on whether to disclose the level of distributable profits.
See more examples of disclosure in the electronic version of this publication.
11
Annual report insights 2017 | Surveying FTSE reporting

3. Alternative performance measures and key performance indicators3. Alternative performance measures
Adjustments on the face of the income statement
Common types of non-financial KPIs (of those with such metrics)
100% of companies identifying
KPIs included APMs
45% showed how their KPIs were used as metrics for directors’
performance‑related pay
Approximately 80% of companies’ “highlights” were financial and
roughly half of thosewere APMs
18
43
21
30
613
35
2819
210
39%
30%
53%47%
50%
23% 26% 29%
53% 56%
42%
12%
37
Sale of termination of operationsRestructuring/reorganiations
Disposal of non-current assetsIAS 36 impairmentIAS 39 impairmentOther IAS 39 items
AmortisationAquisition (IFRS 3 costs)
ProvisionsForeign exchange movements
IFRS 2 expenseOther
Customer related
Employeerelated
Health & Saftey
Environmental (excluding
GHG)
GHG/carbonfootprint -
green house gas
Other
2017 2016
12
Annual report insights 2017 | Surveying FTSE reporting

Alternative performance measures (APMs), sometimes referred to as non‑GAAP measures, are commonly used throughout UK annual reports, with investors often finding them useful in addition to the statutory IFRS measures. ESMA’s recent guidelines5 on the use of APMs applied to all the annual reports that we surveyed. Although the guidelines scope out financial statements, much of their content is equally relevant to the back of annual reports and resonates with messages from the FRC, for example on the treatment of exceptional items.
For example, 90 companies (2016: 92) presented an operating profit line on the face of their income statement – if used outside of the financial statements, ESMA’s recent Q&As6 clarify that such a metric is an APM. In addition, 68 companies (2016: 69) presented other metrics on the face of their income statement which would constitute APMs under the ESMA guidelines were it not for the fact that they scope out the financial statements.
88 companies presented high level highlights in their annual reports before getting into a more detailed discussion, such as a Chairman’s statement. Of these companies’ high level highlights, on average approximately 80% were financial metrics and approximately half of those financial metrics seemed to be APMs as defined by ESMA. 81% of companies had a Chairman’s statement containing APMs and 89% a CEO’s statement with APMs. This prevalence is not surprising and, in and of itself, is not an area of challenge. In the UK, recent concerns have tended to focus on whether APMs are being used appropriately rather than whether they should be used at all.
Compliance – positive trendsAPMs within the scope of the ESMA guidelines
commonly appear in the key performance indicators (KPIs). 92 companies (2016: 95) clearly identified their KPIs, in all cases with one or more measures that would be regarded as an APM under the ESMA guidance. Encouragingly, 88 companies provided comparatives for all their APMs, in line with the ESMA guidelines, and two provided comparatives for some of their APMs.
Under the FRC’s strategic report guidance, where changes are made to KPIs, disclosure should provided to explain those changes (resonating with an equivalent requirement in ESMA’s guidelines on APMs). It seems some progress has been made in this area, with 15 companies (2016: six) indicating such a change had been made in the current year, with varying levels of insight provided into why such a change had arisen.
Compliance – problem areasIt’s worth highlighting that ESMA’s definition
of an alternative performance measure is relatively broad and it is not always obvious whether a metric falls under it. However, it seems likely that the more obvious metrics, such as adjusted profit measures, will be where regulators will focus their greatest efforts in monitoring compliance.
Similarly, providing associated IFRS metrics and accompanying reconciliations is not necessarily straightforward either, since it may not be obvious whether an IFRS equivalent even exists. This could be the case, for example, where financial measures relate to future performance, such as order book figures, given that IFRS financial statements are historical in nature. Where companies did provide reconciliations, the focus tended to be on those instances where IFRS equivalents were fairly apparent.
Acknowledging the difficulties mentioned above, it nevertheless appeared that some companies were open to challenge on the level of prominence given to APMs, bearing in mind ESMA’s recently published Q&As on their guidelines. Albeit the question of prominence will invariably require judgement, potential sources of challenge for some, included failing to provide IFRS equivalents where they existed, providing APMs in larger or bolded font (for example in headlines for Chairmen’s or CEOs’ statements) and discussing APMs before GAAP measures.
13
Annual report insights 2017 | Surveying FTSE reporting
72 companies included APMs in their KPIs where at least one of those APMs had an IFRS equivalent. However, only one company provided all the relevant IFRS equivalents in the KPI section of their report and another six provided some of the IFRS equivalents. In those seven instances it appeared as though the IFRS measures may well have been included not so much to comply with the ESMA guidelines, but rather because they were already KPIs in their own right. While the guidelines are not intended to force companies to pick GAAP measures as KPIs, companies should nevertheless not overlook the fact that APMs selected as KPIs are within the scope of the guidelines and should make sure that, for example, suitable reconciliations are provided within their reports.
Of the seven companies presenting APMs and IFRS equivalents as KPIs, three presented their APMs first and four their IFRS metrics first. None of those companies used larger or bold font to give more prominence to the APMs.
37 companies (2016: 41) linked their KPIs back to the company’s strategy, not just through use of a cross‑reference but by meaningfully demonstrating how individual KPIs related to different elements of their strategy. Only 28 companies described in narrative form the purpose of all their KPIs, in line with the ESMA guidelines and FRC guidance on the strategic report. In those cases, the level of justification varied and did not always explicitly state why an APM was selected instead of a GAAP measure. Other companies provided more generic references that KPIs were used to assess performance against strategy.
The language that companies use to describe the items they adjust statutory measures for is important. For example, the FRC has challenged companies that describe items as “non‑recurring” or “exceptional” where constituent items appear year on year in a similar fashion. 68 companies (2016: 69) made adjustments to statutory profit (excluding an operating profit line) on the face of their income statement in order to present adjusted metrics, often through the use of an additional column. 51 of those companies used a collective term to capture multiple adjusting items, of which 20 used “exceptional”, six used “adjusting”, three used “non‑recurring” and 22 used other terms.
In 13 cases, companies used a collective term for certain adjusting items but also went on to adjust for other items, for example through the use of a column capturing “exceptional items and amortisation of intangibles”. Similar to the requirement to disclose the purposes of a company’s APMs, the FRC typically expects to see an accounting policy explaining which types of items are adjusted for and why, including why items are regarded as “exceptional”. 44 companies were seen to be presenting such a policy, although the quality of these varied. Where companies pull out specific items or “exceptional” items plus other specific items, such as amortisation, companies should make sure they include an explanation of why the non‑exceptional items have also been pulled out. This element was sometimes omitted.
Looking beyond complianceOf the 92 companies clearly identifying KPIs, an
average of 9 metrics were given, of which six (2016: six) were financial. Although companies are only required to identify non‑financial KPIs to the extent necessary for an understanding of the company’s development, performance and position, 74 companies still did so (2016: 70). On average those companies identified four (2016: four) such measures. Common non‑financial KPIs related to employee and customer satisfaction as well as health and safety type metrics. On a related note, approximately half of the companies surveyed had directors’ remuneration schemes where performance‑related pay was based, in part, on non‑financial metrics.
It will be interesting to see whether increased focus on directors’ responsibilities to stakeholders beyond just shareholders, under s172 of the Companies Act, will drive an increase in the use of non‑financial KPIs (see also our Business Model section). On a similar note, assurance over such metrics might also be expected to increase, given current practice tends to see assurance provided on financial statements and little else.
14
Annual report insights 2017 | Surveying FTSE reporting

Examples of disclosure
Tate & Lyle PLC provided a clear disclosure in tabular form of why certain metrics are selected as KPIs.
Tate & Lyle PLC
BT Group Plc provided an example of an explanation of why EBITDA was provided as an alternative performance measure.
BT Group Plc
See more examples of disclosure in the electronic version of this publication.
What to watch out for
Review the new ESMA Q&As on APMs
Avoid giving APMs more prominence than the associated IFRS GAAP measures
Use language that faithfully reflects the nature of any items that statutory measures are being adjusted for
Consider whether adequate levels of non‑financial KPIs have been identified
Where it exists, evidence linkage between KPIs and metrics for directors’ performance‑related pay
15
Annual report insights 2017 | Surveying FTSE reporting

4. Business model4. Business model
What information is provided in the business model?
Of those identifying <IR> capitals, which ones are referred to
An explanation of what the company does?
Where it sits in the value chain?
Key divisions and their contribution?
Key markets and market segments?
Its competetive advantage?
Key inputs in the form of off-balance sheet resources and relationship?
Key inputs in the form of assets and liabilities recognised on balance sheet?
67% 33%
65% 35%
13% 76%
21% 71%
52% 37%
59% 17%
53% 24%
In the business model Elsewhere in the report
Is value creation for wider stakeholders discussed? 39% 24%
69%59% 63%
94%
81%
25%
Over 60% of companies discussed value creation for stakeholders other
than shareholders in their annual report
Is there evidence of a change in business model because of Brexit?
Yes, already changed Indicated might be changingIndicated won’t be changing No
2 8
21
69
Financial Intellectual Manufactured Human NaturalSocial & relationship
16
Annual report insights 2017 | Surveying FTSE reporting

Compliance – positive trendsAlmost all companies explained their business
model, as required by law7, with 95 obviously doing so. Seven of these companies provided information resembling a business model but without labelling it as such.
Investors usually read discrete sections of the annual report, so each section needs to be able to communicate the key messages. The graph opposite identifies elements the FRC and investors participating in the FRC’s Financial Reporting Lab project8 believe support an informative and useful business model disclosure.
Where clear cross‑references were made from the business model to elsewhere in the report, this has been included in our analysis as having been located in the business model. Cross‑references are helpful, though a handful of companies were considered to have incorporated so many cross‑references that the description of the business model no longer could be useful on a standalone basis, instead acting more like a contents page.
For every element of Lab suggested disclosure, well over half of the companies were including relevant information somewhere in their report. Clearly some elements, such as an explanation of what the company does and its competitive advantage feel most at home within the business model. This is in line with the FRC Lab’s definition of the business model as “what the company does, how it does it, and how it creates economic value now”.8 Consistent with prior year, 71% of companies were telling their value creation story in their business models, not necessarily using all the attributes referred to by the FRC, but going beyond just explaining what the company does.
In contrast, details of key divisions and their contribution and market and market segments were usually presented elsewhere in the report. Presenting an overview of what each of the divisions does, together with relevant statistics to indicate size and importance to the business model, enables users to understand the organisational structure. Similarly, linking the business model to the key markets allows a more in depth assessment of current market potential and risk exposure. 78 companies gave an overview of trends in the marketplace that the company operates in, although in quite a few cases it was not clear how the company was responding to the trends in terms of mitigating risks or making the most of the opportunities.
There are differing interpretations of ‘value’, including profit generated, cash generated and broader value generation such as training hours, tax paid and so on. Financial value creation is discussed throughout annual reports and is usually in the context of shareholders. Through its Reporting Lab, the FRC has encouraged companies to respond to investors’ calls for better disclosure of dividends9. 78 companies disclosed a dividend policy, with 51% of these policies considered to meet the Lab’s definition of good disclosure. Only a handful of reports then linked the dividend policy back to the strategy or business model.
Broader value creation, either expressed in a monetary value or as a non‑financial metric, such as qualifications gained by employees, is linked in part to whether a company acknowledges and identifies other stakeholders. As part of their fiduciary duty, directors must act in a way to promote the success of the company for the benefit of its members as a whole, including the wider stakeholder groups. It is not unreasonable to conclude that directors would have regard to those other stakeholders when determining the company’s business model.
The majority of companies acknowledged stakeholders other than shareholders. 42% of these companies discussed value creation for those other stakeholders, with a further 26% going further by quantifying the value created, at least in part. Three companies presented a pie chart or table showing how revenues earned in the year were distributed between different stakeholder groups, for example payments to employees, suppliers, governments, bank lenders and communities. Others, quantified both the financial and non‑financial value created for other stakeholder groups, presenting this either in the business model itself such as BT Group Plc, or in the corporate social responsibility section, such as Howden Joinery Group Plc. Understanding how value creation for other stakeholders also generates economic value is important to investors, as it helps them assess the sustainability of the business model.
In addition to providing a long‑term viability statement, we found a third of companies provided an explicit statement or discussion of how their business model is sustainable in the long term which tended to look further than the typical 3‑5 years of the viability statement.
17
Annual report insights 2017 | Surveying FTSE reporting
Looking beyond complianceLinkage and flow within the annual report is an
important element required to tell a holistic story. The business model, which describes what the company does and how, would seem an obvious place to provide links to the strategy, risks and viability, KPIs and remuneration and dividend policy. Marks and Spencer Group PLC presented a useful chart entitled “Connected Value” immediately after the business model which demonstrates the link between core objectives, business model, risks, accountability and KPIs.
Nine companies discussed or disclosed in their narrative reporting a proposed future allocation of capital aside from paying out profits to shareholders. This included, for example, allocation of funds for the future year to training, R&D or specific capital investment projects.
The Lab project suggested a number of other elements that could be included within the business model, such as a company’s market share, its societal purpose (see section 1), whether its culture and values are a business model driver and whether value generated for other stakeholders is also key to generating economic value. These build upon the other elements already discussed above. Companies are increasingly articulating their values and indicating that they underpin the business model. A simple list of values is not something that investors believe is particularly insightful8. An explanation of how the values are instilled in the organisation and influence the success of the business model adds authenticity to such disclosure.
It was good to see 77% of companies identifying key inputs in their business model in the form of off‑balance sheet resources and relationships such as customers, employees, brand, and intellectual property. Yet it was disappointing to see that only just over half of these companies then went on to provide an indication of how these resources and relationships were being maintained or enhanced, anywhere in their annual report. For something so key to the business model, it would seem intuitive to explain, with long term sustainability of the company in mind, how these inputs were nurtured and grown by the directors. This in turn could be linked into any related principal risks identified by the board, especially those relating to the future availability of a key resource.
Compliance – problem areasOf the five companies not clearly describing their
business model, two provided most information suggested by the FRC albeit it was scattered around in different parts of the report. The other three only provided an explanation of what they do and details of their key divisions. The Lab’s report highlighted the importance of good business models, stating that the board and management’s unwillingness or inability to clearly articulate the business model raises concerns for investors about the quality of management, to the extent that some will not invest, while others will limit the capital they invest.
We found it remarkable that, of the 95 business models presented, 28 did not make it clear what the company did. Given many readers will turn straight to the business model this is something that companies should really address.
Of the 88 business models labelled as such, 6 used a purely visual presentation, 27 described their business model solely in words and 55 used a combination of words and diagrams. We thought that only half of the graphics used were considered to aid the understanding of the company‑specific value creation, which raises the question of whether preparers’ efforts and expense in producing them would have been better spent elsewhere. Those which did not add further understanding tended to be either generic (such as circular graphics which did not clearly relate to or explain the business) or simply unclear.
Linkage to principal risks, particularly those which are new or have changed, is valuable
in demonstrating the resilience of the business model and how it can react to changes in the market environment. The issue of Brexit was widely discussed, with 89 companies mentioning it in their annual report and 55 of these including Brexit within a principal risk. 31 companies mentioned whether Brexit might impact their business model. Of these 31, eight companies indicated their business model may change as a result of Brexit, while 21 made a positive statement that their business model would not be changing. Two companies indicated their business models have already changed in response to the impact that the Brexit vote and process has had on the marketplace.
18
Annual report insights 2017 | Surveying FTSE reporting
Examples of disclosure
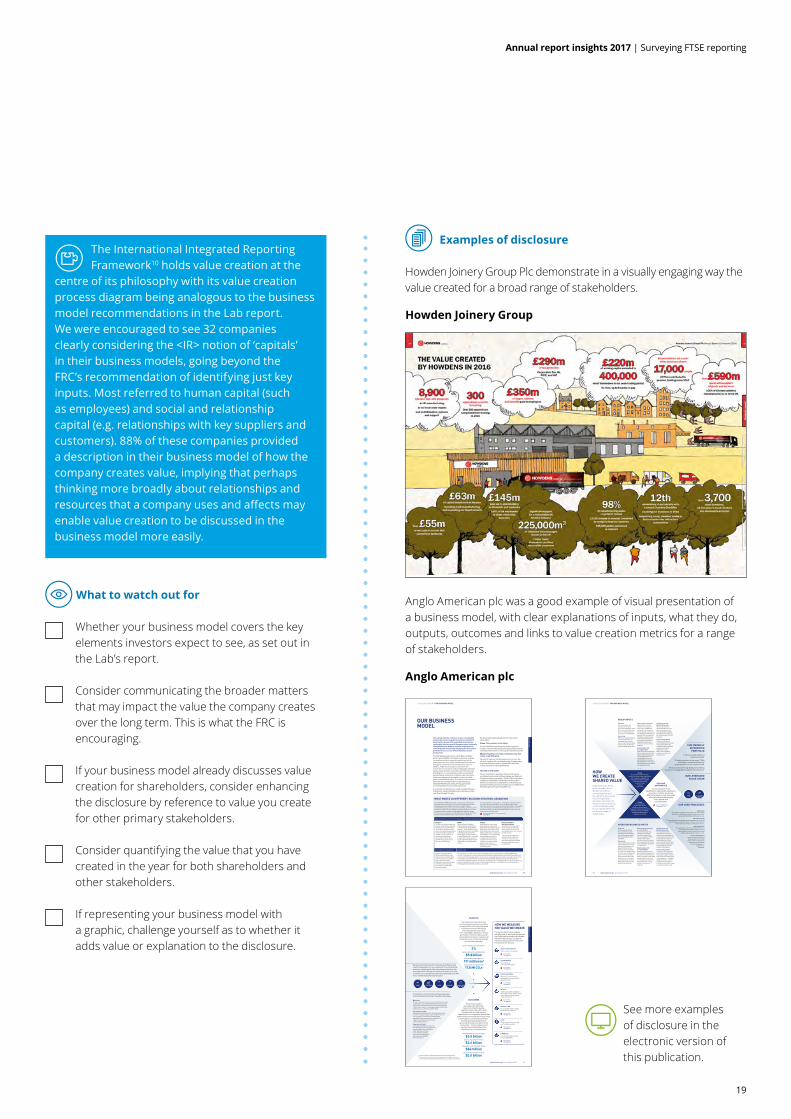
Howden Joinery Group Plc demonstrate in a visually engaging way the value created for a broad range of stakeholders.
Howden Joinery Group
Anglo American plc was a good example of visual presentation of a business model, with clear explanations of inputs, what they do, outputs, outcomes and links to value creation metrics for a range of stakeholders.
Anglo American plc
STRATEGIC REPORT OUR BUSINESS MODEL
OUR BUSINESS MODEL
The mining industry continues to face considerable external pressures as global economic and political uncertainties prevail. We responded decisively by sustainably improving cash flow generation, materially strengthening our balance sheet through selective asset disposals and actively managing our diversified portfolio to focus on our differentiated asset and product mix.
The high quality assets across our De Beers, platinum group metals (PGMs) and Copper businesses underpin our positions in those respective markets and are the cornerstone of a more resilient and competitive business, through the economic and commodity price cycle. In addition, Anglo American also benefits from the performance of a number of other high quality, individual assets across the bulk commodities and other minerals, including iron ore, coal and nickel, which are optimised operationally to continue to contribute cash and returns, while ensuring appropriate capital investment to both preserve and enhance value. The value from our mineral resources and market positions is optimised by our dedicated Marketing business, driving appropriate commercial decisions across the value chain.
In summary, our ambition is to create a resilient business that delivers robust profitability and sustainable, positive cash flows through the cycle.
We have a clearly defined approach for how we will achieve this:
Vision: To be partners in the future.
It is our belief that Anglo American, and mining as an industry, has both the potential and responsibility to act as a development partner, for the long term benefit of society.
Mission: Together, we create sustainable value that makes a real difference.
We cannot meet our ultimate objective on our own. We will work together with our diverse range of stakeholders to ensure we deliver value on a sustainable basis that makes a positive and lasting difference.
VALUES AT THE CORE
We are creating an organisation where all our people are treated in such a way that they willingly give their best. Acting according to our values – Safety, Care and respect, Integrity, Accountability, Collaboration and Innovation – defines our culture as an organisation, underpinning our reputation and the promise we make to all our stakeholders: Real Mining. Real People. Real Difference.
WHAT MAKES US DIFFERENT: BUILDING STRATEGIC ADVANTAGEAcross De Beers, PGMs and Copper, our assets are characterised by having world class orebodies, competitive industry cost positions, long reserve lives and significant resource potential, offering considerable organic growth opportunities, thereby representing three businesses in which we have leading competitive positions. These are complemented by a number of other high quality, individual assets across iron ore, coal and nickel. Underpinning our uniquely diversified portfolio of differentiated assets is Anglo American’s expertise
across a number of core processes – exploration, innovation, project development and sustainability – while our Marketing business optimises value from our resources and market positions. The benefits of a systematically embedded Operating Model and the functional governance structure of the Organisation Model combine to create optimal and sustainable value.
DIFFERENTIATED ASSETS IN A UNIQUELY DIVERSIFIED PORTFOLIO:
De Beers De Beers has a global leadership position in diamonds, producing and selling around one-third of the world’s rough diamonds by value. Our major diamond mining assets have large, long life and scalable resource bases and we have well-established partnerships in South Africa and with the governments of Botswana and Namibia.
PGMsWe are the world’s leading PGMs producer, with positions in the world’s two largest PGM deposits – the Bushveld Complex in South Africa and the Great Dyke in Zimbabwe. We operate the world’s highest margin platinum mine at Mogalakwena – a long life, scalable open pit operation that has the potential to lift production significantly as market demand requires.
CopperAnglo American has a world class position in copper, with the potential to establish a global leadership position built around its interests in two of the world’s largest copper mines – Los Bronces and Collahuasi – and its feasibility phase Quellaveco project in southern Peru. The mineral endowments of these assets underpin our organic copper growth opportunities, in addition to a number of future potential projects.
Bulk commodities and other minerals Anglo American also benefits from a number of other high quality assets across the bulk commodities of iron ore and coal, as well as nickel.
These assets are optimised operationally to continue to contribute cash and returns, while being allocated capital to preserve and enhance value, as appropriate.
DISTRIBUTION AND RETAIL MARKETING
De Beers’ leading position is further enhanced by its rough diamond sales operation selling to term customers, accredited buyers and auction sales customers. It also has a presence in the downstream through Forevermark™ and De Beers Diamond Jewellers.
The value from our mineral resources and market positions is optimised by our dedicated Marketing business. Built on direct customer relationships, Marketing creates value across the entire value chain from mine to market through appropriate commercial decisions aligned to our customers’ specific requirements – including product specification, volume and timing. In addition, Marketing proactively develops new markets for our products through, for example, investing in new technologies that are expected to drive new sources of demand for PGMs – such as fuel cell electric vehicles – and building consumer awareness in emerging platinum jewellery markets, such as India.
For more information on our core processesSee page 10
09
Strategic report
Anglo American plc Annual Report 2016
OUTPUTS
Our outputs are the products that meet the growing consumer and other demands of the world’s developed and
maturing economies. Mining and processing activities also result
in the unavoidable disturbance of land, generation of mineral residue, as well
as atmospheric and water emissions, all of which we strive to minimise through
our innovative approach.
GROUP PRODUCTION GROWTH(1)
2%CASH FLOWS FROM OPERATIONS
$5.8 billionNEW WATER CONSUMPTION
191 million m3
CO2 EQUIVALENT EMISSIONS
17.8 Mt CO2e
OUTCOMES
As a mining company, we create and sustain jobs,
help communities to develop new skills, support education, build
infrastructure, and help improve healthcare for our employees, their families
and the local communities around our mines. It is through our core business activities –
employing people, paying taxes to governments and procuring from host communities – that we make the most
significant and sustainably positive contribution to our host countries.
TAXES BORNE AND COLLECTED(2)
$3.5 billionWAGES AND BENEFITS PAID
$3.6 billionCOMMUNITY INVESTMENT SPEND
$84 millionLOCAL PROCUREMENT SPEND
$2.0 billion
PEOPLECreate sustainable competitive advantage through capable people and an effective, performance- driven organisation.
For our KPIsSee page 34
SAFETY AND HEALTHTo do no harm to our people.
For our KPIsSee page 34
ENVIRONMENTTo minimise our environmental footprint.
For our KPIsSee page 34
SOCIO-POLITICALTo partner in the benefits of mining with local communities and government.
For our KPIsSee page 34
FINANCIALTo deliver sustainable returns to our shareholders.
For our KPIsSee page 34
PRODUCTIONTo sustainably deliver valuable product to our customers.
For our KPIsSee page 34
COSTTo be competitive by operating as efficiently as possible.
For our KPIsSee page 34
Our seven pillars of value underpin everything we do. Each pillar has defined Key Performance Indicators and targets that we set the business and against which we measure performance, both financial and non-financial.
HOW WE MEASURE THE VALUE WE CREATE
Focusing on our core processes to leverage value chain investment to provide competitive advantage
Marketing The value from our mineral resources and market positions is optimised by our dedicated Marketing business, driving appropriate commercial decisions across the value chain – from mine to market – including working directly to tailor products to our customers’ specific needs.
Sustainability model Integrating sustainability into core business processes has been a longstanding priority for Anglo American. The corporate centre drives the sustainability agenda and offers expert advice, and hands-on support, to operations facing complex sustainability challenges.
Organisation Model Our Organisation Model ensures we have the right people in the right roles doing the right value-adding work at the right time, with clear accountabilities, thereby minimising work duplication and increasing capability and effectiveness.
We will invest in those points in the value chain that provide us with the best return on our investment. From the financial, technical, marketing and other expertise provided from the corporate centre, through our entire value chain from mine to market, it is our people that create the sustainable value that all our stakeholders demand and expect.
MOVEPROCESS MARKET END OF LIFE PLAN
MINE
(1) Pro forma growth in copper equivalent production, excluding disposals.(2) Taxes borne and collected are based on numbers disclosed within the Group’s
income statement and exclude the impact of certain associates and joint ventures.
11
Strategic report
Anglo American plc Annual Report 2016
STRATEGIC REPORT OUR BUSINESS MODEL
People Our simplified
organisation model allows our businesses to
design structures and roles that provide clear accountability
and appropriate authority to get our work done.
People Our people are the business.
We aim to resource the organisation with a capable, engaged and
productive workforce and are committed to ensuring
no harm comes to any of
our people.
Financial Our businesses’ strong focus on working capital management, productivity and cost discipline helps to drive sustainable positive cash flows.
Know-how Our businesses work closely with our Technical function and Marketing business to apply innovative mining methods and technologies to realise even greater value from our resource base, and optimise mine production plans to ensure we provide products to our customers around the world, meeting their specific technical and logistical requirements.
Other natural resources It is critical that our businesses responsibly manage all the natural resources used in their processes, given the finite nature of the mineral resources, scarcity of water and energy sources at some of our operations, and input cost pressures.
Relationships with our stakeholders Working within our social performance framework, it is the goal of our operations to build and sustain constructive relationships with our host communities and countries that are based on mutual respect, transparency and trust.
Ore Reserves and Mineral Resources Our exploration teams work with our businesses to discover mineral deposits in a safe and responsible way to replenish the resources that underpin our future success – both to extend the lives of existing mines and to provide longer term brown- and greenfield options.
Plant and equipment Our businesses implement local procurement policies that support suppliers based in the host communities close to our operations – making a significant socio-economic contribution and building stronger communities, as well as lowering logistics costs.
OPERATING BUSINESS INPUTS
GROUP INPUTS
Financial Our corporate centre allocates our financial resources where they can be put to work most effectively to deliver optimal financial returns for our shareholders.
Know-how We link our industry-leading technical and marketing knowledge to ensure we invest our efforts and capital in key leverage points in the ‘mine to market’ value chain.
Other natural resources Mining and processing activities have long been major users of water and energy. Our technical and social expertise combines to provide advice and hands-on support to the operations to mitigate our requirements, while also developing new technologies that have the potential to significantly reduce our environmental footprint.
Relationships with our stakeholders Open and honest engagement with our stakeholders is critical in gaining and maintaining our social and legal licences to operate and, therefore, the sustainability of our business. We engage with a wide range of stakeholders to ensure effective two-way relationships.
Ore Reserves and Mineral Resources We have an extensive resource base across our businesses and across a wide geographic footprint, providing a suite of options for delivering value over the long term.
Plant and equipment Our procurement and technical teams form strong relationships with major suppliers to deliver tailored equipment and other solutions to enable best in class operating performance and cost effectiveness.
HOW WE CREATE SHARED VALUE Anglo American draws upon a number of key inputs from both its central expertise and the operating businesses that, through expert allocation, development, extraction and marketing, create sustainable value for our shareholders and our diverse range of stakeholders.
RISK AND GOVERNANCE
Our robust system of risk identification, supported by established
governance controls, ensures we effectively respond to such risks, while
acting ethically and with integrity for the benefit of all our stakeholders.
PLAN AND BUILD
FIND
Exploration Our award winning exploration teams discover mineral deposits in a safe and responsible way to replenish the
resources that underpin our future success.
Innovation Model Our strengthened in-house technology capability provides world
class, innovative solutions across our assets, supporting the delivery of step change operating performance.
Operating Model The application of our Operating Model drives a
more stable, predictable and higher level of operating performance, resulting in improved
safety and productivity, and lower costs.
Project development The successful development
and execution of our capital projects reduces expenditure
and ensures predictability of outcome against our
performance objectives.
OUR CORE PROCESSES
OUR UNIQUELY DIVERSIFIED
PORTFOLIO 1 Focus on asset quality and
resource potential.
2 Leading positions in diamonds, PGMs and copper, complemented by high
quality assets in iron ore, coal and nickel.
3 Value optimised through dedicated marketing expertise, leveraging global supply/demand dynamics.
OUR LEVERAGED VALUE CHAIN
For our Principal RisksSee pages 41-45
10 Anglo American plc Annual Report 2016
The International Integrated Reporting Framework10 holds value creation at the
centre of its philosophy with its value creation process diagram being analogous to the business model recommendations in the Lab report. We were encouraged to see 32 companies clearly considering the <IR> notion of ‘capitals’ in their business models, going beyond the FRC’s recommendation of identifying just key inputs. Most referred to human capital (such as employees) and social and relationship capital (e.g. relationships with key suppliers and customers). 88% of these companies provided a description in their business model of how the company creates value, implying that perhaps thinking more broadly about relationships and resources that a company uses and affects may enable value creation to be discussed in the business model more easily.
See more examples of disclosure in the electronic version of this publication.
What to watch out for
Whether your business model covers the key elements investors expect to see, as set out in the Lab’s report.
Consider communicating the broader matters that may impact the value the company creates over the long term. This is what the FRC is encouraging.
If your business model already discusses value creation for shareholders, consider enhancing the disclosure by reference to value you create for other primary stakeholders.
Consider quantifying the value that you have created in the year for both shareholders and other stakeholders.
If representing your business model with a graphic, challenge yourself as to whether it adds value or explanation to the disclosure.
19
Annual report insights 2017 | Surveying FTSE reporting

5. Stakeholder engagement5. Stakeholder engagement
There was an indication that the following s172 considerations were considered somwhere in the annual report
Reflect acting fairly between members of the company
Desirability of the company maintainting a reputation for high standards of business conduct
The impact of the company’s operations on the community andthe environment
Fostering the company’s business relationships with customers
Fostering the company’s business relationships with suppliers
The interests of the company’s employees were considered
3% 41% 56%
72% 1% 27%
84% 3% 13%
69% 31%0%
38% 0% 62%
87% 1% 12%
Yes, in the strategic report Yes, elsewhere No
Stakeholders identified by the companies in the sample:
69% described, to some extent, how they engaged with wider stakeholders
75 discussedhuman rights
and7 explained why no discussion
12 companies referred to the UN’s Sustainable Development Goals
78 mentioned anti-briberyand corruption
20
Annual report insights 2017 | Surveying FTSE reporting

Compliance – positive trendsThe purpose of the strategic report is to inform
members and help them assess how the directors have performed their duty under s172. In light of the current debate, the FRC is updating its guidance on the Strategic Report to strengthen the link between s172 and the strategic report to help the report provide greater insight into whether boardroom decisions have taken wider stakeholder interests into account12.
Although not a specific reporting requirement, we saw 17 companies referring to the
requirements of s172 of Companies Act 2006, in particular the need to have regard to certain matters whilst promoting the success of the company for the benefit of its members as a whole. In general the statements were specific to the company and did not merely repeat or quote the exact wording from s172, adding to their authenticity, and tended to be made in the corporate governance statement.
No company explained how they did this in detail, but of the 17 just under half included an overarching comment to allow shareholders to assess how the directors have performed their duty. i.e. making clear they have had regard to the matters listed in s172.
The graph opposite shows that most discussed their impact on the environment, had regard to their employees and stated that they had a desire to maintain their reputation, demonstrated most often in their discussion of risks that might threaten their reputation/brand or by acknowledging that they need to earn a societal licence to operate. On the employee theme, there has been a marked increase in discussion of culture and values in annual reports. See section 8 to find out more.
Given most companies acknowledge customers and suppliers as relevant to the business (see below), it could be that the organisation is fostering relationships with both, but in the absence of a specific reporting requirement, are not providing enough detail to give an appreciation that they actively foster the relationships.
For example, most discussions of suppliers frequently referred to a code of conduct to be adhered to, but did not necessarily explain how companies were working with their suppliers, addressing supply chain risk or ensuring responsible sourcing. Regarding payment of suppliers, 15% of companies chose to include this new disclosure13 in their annual report voluntarily, given the requirement is to provide it in a Government Portal. 59% (2016: 34%) also chose to make a statement about modern slavery14 in their annual report. No companies disclosed information on gender pay gap in their annual report.
Most annual reports concentrate on long term value creation, particularly in light of the long term viability statement, but only 47% clearly distinguished it from short term value creation perhaps reflecting a move away from short‑termism towards long‑term investment. In a small number of annual reports we observed an absence of short term information. This was of particular note when a business had performed strongly in the reporting year and perhaps therefore was more focused on the longer term.
Compliance – problem areasA broad range of stakeholders, including employees,
the environment, suppliers and the community, are often described as being integral to how a company does business. Customer satisfaction, culture to create productive employees, supply chain and being ahead in technology are key drivers of value. It is surprising, then, that 85 companies still devote a distinct section of the strategic report to discussing relevant corporate social responsibility matters, in addition to the regulatory requirements in the directors’ report, rather than integrating the information in other sections of the strategic report. Of those, 34% did discuss corporate responsibility matters in the context of the main company strategy, demonstrating that maybe the reporting is lagging behind the thinking within the organisation when formulating the strategy and business model. Of the remaining 15, eight did not include a significant discussion on the broader non‑financial matters impacting the business, perhaps taking the view that discussion wasn’t necessary for an understanding of the development, performance or position of the business15 and we felt only seven had fully integrated these matters into the main strategy.
The government’s agenda for corporate governance reform places emphasis on the
conduct of business and, among other things, giving employees, customers and wider stakeholders a greater voice. Directors are required by law11 to act in the way they consider, in good faith, would be most likely to promote the success of the company for the benefit of its members as a whole having regard to a number of broader stakeholder matters (see graph opposite). Many of these are similar to matters already required to be discussed in the strategic report and required by the new Non‑financial Reporting (NFR) Directive.
21
Annual report insights 2017 | Surveying FTSE reporting

We found over 60 organisations explaining how they create value for a broad group of stakeholders, not just shareholders (see section 4). Their impact also came through in their discussion on risk (see section 6). Given the audience for the strategic report is the shareholder, any more detailed information regarding impact on the broader group of stakeholders could be cross referred to in the annual report. 40% (2016: 49%) of companies cross referred to a separate sustainability report or more detailed sustainability information on their website.
Discussion of anti‑bribery and corruption has been added to the strategic report requirements as a result of implementing the EU NFR Directive. Overall, 79 mentioned this in some way, with 16 of those discussing policies and outcomes, and 43 just looking at policies. None of those that omitted information explained the omission, something now legally required. The results for human rights discussions was similar, despite this not being a new requirement of the strategic report.
12 companies referred to the UN’s Sustainable Development Goals17 to varying levels of detail from saying they take them into account or that they have identified with some of the goals, to mapping material issues or strategic pillars to specific SDGs and explaining the contribution they have made. This demonstrates an increasing awareness of the 17 goals which were signed up to in 2015 by 193 world leaders with an aim to end extreme poverty, inequality and climate change by 2030.
Looking beyond complianceThe FRC is encouraging companies to report
on those broader matters that may impact the value of the company over the longer term. Companies’ relationships with their stakeholders is key to this.
The majority of companies acknowledged stakeholders other than shareholders in some way, and most identified at least one stakeholder group (other than shareholders) that it considers in how they do business – this is in the spirit of s172 which emphasises the need to appreciate the environment within which the company operates in and to understand its stakeholder needs. The illustration on the previous page shows the stakeholder groups mentioned. 77% of companies went further explaining which key relationships and off balance sheet resources were key inputs to the business.
Encouragingly, 90 companies described, to varying levels of detail, how they engaged with their stakeholders. Of these, 23% focused only on their engagement with investors. The remainder also covered how they engaged with at least one non‑investor stakeholder group. In most cases this included conducting employee engagement surveys, getting customer feedback or consulting shareholders on company policies. Most often the discussion covered only one or two stakeholder groups.
Just over a third (36%) of those engaging with stakeholders gave any indication of the outcome of that engagement. Examples included revising the remuneration policy as a result of shareholder feedback, reviewing product mix in response to customer feedback, changing pay structure for employees, improving internal communications and revising internal processes, all in response to employee engagement. 22 companies had reported on a major event during the year, which would have been assumed to have a major impact on stakeholders, such as a big restructuring or major acquisition. Only a fifth of these talked about the mechanism for gathering feedback in relation to the major event.
As well as factoring in the needs of stakeholders and the broader non‑financial factors that impact on the organisation’s ability to create value, organisations should consider the impact that they have on their stakeholders. This is something made more explicit in the NFR Directive15.
Stakeholder relationships are at the heart of integrated reporting, as a key
part of integrated thinking is the capacity of an organisation to respond to key stakeholders’ legitimate needs and interests. With regards to disclosure, an integrated report should provide insight into the nature and quality of the organisation’s relationships with its key stakeholders, including how and to what extent the organisation understands, takes into account and responds to their legitimate needs and interests. The <IR> Framework states that by doing so, the integrated report enhances transparency and accountability.
22
Annual report insights 2017 | Surveying FTSE reporting

What to watch out for
Make sure your strategic report meets its overall purpose. The FRC’s updated Guidance on the strategic report will give tips and guidance on how to achieve this.
Consider the requirement to discuss bribery and corruption (to the extent necessary for an understanding of the position and performance of the business). This is now a requirement of the strategic report.
Include discussion of payment practices and performance, modern slavery and gender18 pay gap in your strategic report if they are material matters for a shareholder. These are some of the newer disclosures aimed to increase transparency, but that need to be included on a website.
Examples of disclosure
Informa PLC, in the Chairman’s letter at the beginning of the Corporate Governance Statement, cross referred to the parts of the annual report that discuss engagement with stakeholders, to demonstrate consideration of responsibilities in s172.
Informa PLC
Standard Chartered PLC explained how they serve each of their stakeholder groups, engage with them, and the outcome of that engagement.
Standard Chartered PLC
See more examples of disclosure in the electronic version of this publication.
23
Annual report insights 2017 | Surveying FTSE reporting
6. Risks and opportunities6. Risks and opportunities
Selected risks disclosed
Brex
it (g
ener
al)
FTSE 250 Other
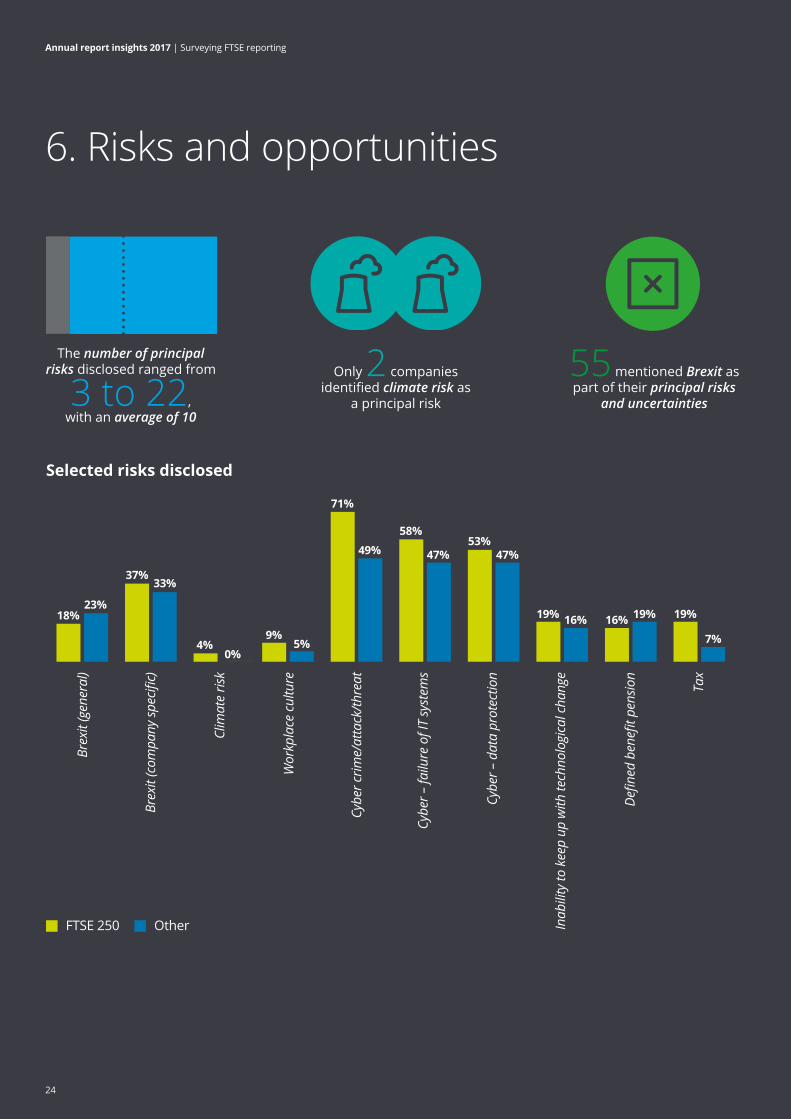
The number of principal risks disclosed ranged from
3 to 22, with an average of 10
Only 2 companies identified climate risk as
a principal risk
55 mentioned Brexit as part of their principal risks
and uncertainties
Brex
it (c
ompa
ny sp
ecifi
c)
Clim
ate
risk
Wor
kpla
ce c
ultu
re
Cybe
r crim
e/at
tack
/thre
at
Cybe
r – fa
ilure
of I
T sy
stem
s
Cybe
r – d
ata
prot
ectio
n
Inab
ility
to k
eep
up w
ith te
chno
logi
cal c
hang
e
Defin
ed b
enefi
t pen
sion
Tax
18%
37%33%
4%9%
5%
71%
49%
58%
47%53%
47%
19% 16% 16% 19% 19%
7%0%
23%
24
Annual report insights 2017 | Surveying FTSE reporting

Compliance – positive trendsThe Companies Act requires all companies
(which aren’t small) to disclose their principal risks and uncertainties, with the Code also requiring disclosure of risk identification process and management or mitigation activities. Investors place considerable value on such information and the FRC published guidance in 201419 calling for more insight in this area.
Companies continue to respond to this, with 62% (2016: 51%) indicating whether individual risks had changed in significance during the year, often through up/down arrows. Where economic uncertainties exist and evolve such information is insightful and reassures a reader that directors are actively monitoring risk exposures.
Two companies identified a material uncertainty around going concern, one in relation to raising equity to avoid a covenant breach, and the other regarding renegotiation of borrowing facility terms. It was good to see joined‑up thinking within both annual reports, with the specific risks being identified as principal risks (which, per the Code, should include those impacting solvency and liquidity) and also being discussed in detail in the viability statement and assessment of going concern.
Compliance – problem areasNot all of the recommendations in the
FRC’s guidance have been adopted so widely. While there is a steady positive trend in the number of companies disclosing the likelihood of all principal risks, we still only found 18% doing so (8% in 2016). Similarly, only 18% disclosed the possible magnitude of impact for each risk (increasing from 12% in 2016). Understanding how likely a risk is to materialise and the level of its impact gives readers a more in‑depth understanding of how the board made its assessment of which risks are truly principal and why and of the appropriateness of efforts taken to mitigate them.
The FRC remains keen on linkage, stating that the sections covering business model, strategy, principal risks and the viability statement should align20. But linkage still appears to be an area where companies struggle to communicate how their principal risks link to their strategy, with only 42% clearly doing so. Strategy discussion of the board’s risk appetite go hand in hand given the forward looking nature of these disclosures21.
Similarly, linkage between the viability statement and principal risks provides insight into how directors have considered risk in the context of the prospects of the company and their expectation that the company will be able to continue in operation. In their viability statement, we found 34 companies gave a reference to specific principal risks being considered when making the statement; 62 gave a reference to generic principal risks or a general cross‑reference; while the remaining four provided no reference at all.
Looking beyond complianceInnovative presentation of information around
risks can also be engaging and useful for clear and concise reporting. For example, 12 companies (2016: eight) presented a heat map to accompany the principal risk disclosure. This can be a very efficient and clear way of communicating multiple aspects of risk management, such as the likelihood, impact and movement year on year of each principal risk.
The FRC acknowledges that in identifying the material risks and uncertainties a company faces, directors should consider a range of factors. These should include “operational and financial considerations and risks in the broader environment in which it operates, such as cyber security and climate change”20.
25
Annual report insights 2017 | Surveying FTSE reporting

Risks are an important content element of an integrated report, too, considered
alongside opportunities that the organisation faces. The <IR> Framework encourages linkage to associated strategic objectives, strategies, policies, targets and KPIs, and the disclosure requirements are similar to those encouraged by the FRC.
In the context of the organisation’s strategic focus and future orientation, the <IR> Framework sees risks, opportunities and dependencies as flowing from the organisation’s market position and business model. 46% of companies clearly identified both risks and opportunities arising in the marketplace and discussed how they were applicable to the company, while 11% clearly identified only the risks and 26% identified only the opportunities. The identification of risks in the marketplace, particularly those which may not otherwise have been disclosed as a principal risk, further enhances a user’s understanding of the business and the environment in which it operates. Discussing the opportunities in the marketplace further complements this, and can support the justification for the company’s strategic direction.
We were encouraged to see companies consider the different aspects of cyber security risk, rather than disclosing one generic cyber security risk. As shown in the graph on the previous page, the risk of cyber‑attacks was identified as a principal risk by 71% of companies in the FTSE 350, and 49% of other companies. Cyber issues resulting from IT failures was also discussed by quite a few companies. See section 8 for discussion of cyber risk at a Board level.
Climate change risk is a current hot topic, with the Financial Stability Board, an international body that monitors and makes recommendations about the global financial system, establishing a Task Force on Climate‑related Financial Disclosure (TCFD). In July 2017 the TCFD published its recommendations – applicable to all organisations – focusing on climate‑related risks and opportunities, and related reporting metrics about the actual or possible financial impact of climate‑related risks. The FRC is adding additional emphasis around climate risk, including a new paragraph in its draft amendments to its guidance on the strategic report focusing on the identification and explanation of long term systemic risks.
Perhaps surprisingly, only two companies identified climate risk as a principal risk in itself. One was in the mining industry and the other in forestry and paper. Other environmental‑related and broader sustainability principal risks were identified by a number of other companies, so the TCFD’s recommendations are likely to be a challenge for directors to consider and explain why climate risk is or is not considered a principal risk for their company, particularly those in the banking, insurance, tourism and food production industries.
Regarding workplace culture, seven called it out as a specific risk. That is not to say that culture is not seen as important. Many mentioned it as a contributing factor, e.g. to a risk of employee retention or how not following values might contribute to a risk of failure to act with integrity. Others discussed it elsewhere in the report.
The FRC has also extended its advice around the boundaries of risk, encouraging companies to look beyond their own operations and consider risks arising from business relationships, products and services, including the other parts of the supply chain in which it sits21.
55 companies identified Brexit as a principal risk for the company, or as a contributing
factor to a principal risk relating to the market environment. For 35 the risk relating to Brexit was company specific. For 20 it was more generic and could have applied to any company. Until there is more certainty around the impact of Brexit, it will continue to be a challenge for boards to determine the magnitude of the impact and how it can be managed (see section 8 for Brexit discussions at a Board level). The FRC has said that it will be looking out for discussion of Brexit, and whether companies have considered it as a principal risk.
26
Annual report insights 2017 | Surveying FTSE reporting

What to watch out for
Discuss whether Brexit is a principal risk for the company – the FRC is looking out for this.
Consider the FRC’s updated guidance on the strategic report – some of the amendments cover risk disclosures.
Disclose the likelihood of the risk arising and the magnitude of its impact to add valuable insight; these can be presented together on a heat map.
Explain how individual risks change in significance during the year, particularly where the company is operating in uncertain economic environments.
Bear in mind the TCFD’s recommendations and whether climate risk is a principal risk.
Discuss both risks and opportunities in the context of the marketplace.
Vodafone Group Plc use a risk heat map to communicate the likelihood, impact and movement year on year of each principal risk.
Vodafone Group Plc
Examples of disclosure
See more examples of disclosure in the electronic version of this publication.
27
Annual report insights 2017 | Surveying FTSE reporting
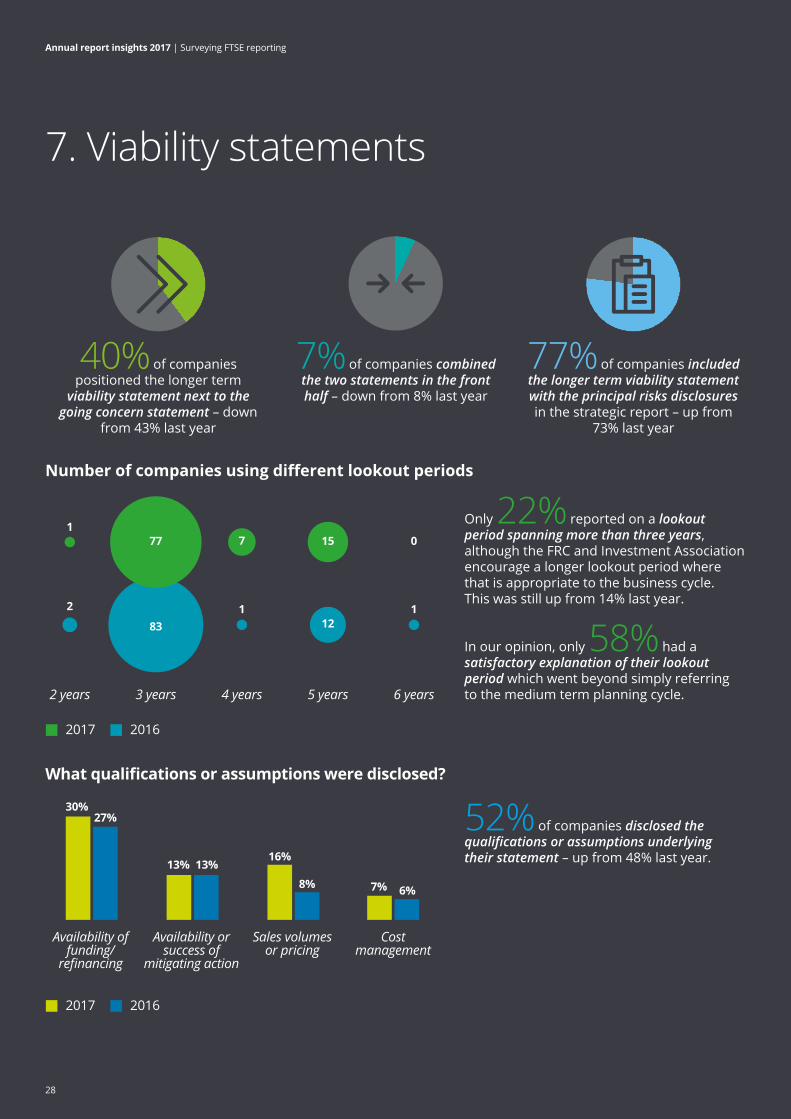
7. Viability statements7. Viability statements
40% of companies positioned the longer term
viability statement next to thegoing concern statement – down
from 43% last year
7% of companies combinedthe two statements in the fronthalf – down from 8% last year
77% of companies included the longer term viability statement with the principal risks disclosuresin the strategic report – up from
73% last year
2017 2016
2 years 3 years 4 years 5 years 6 years
Number of companies using different lookout periods
1
2
77
83
7
1 1
15
12
0
Only 22% reported on a lookout period spanning more than three years, although the FRC and Investment Association encourage a longer lookout period where that is appropriate to the business cycle.This was still up from 14% last year.
In our opinion, only 58% had a satisfactory explanation of their lookout period which went beyond simply referringto the medium term planning cycle.
What qualifications or assumptions were disclosed?
2017 2016
52% of companies disclosed the qualifications or assumptions underlying their statement – up from 48% last year.
Availability of funding/
refinancing
Cost management
Sales volumes or pricing
Availability or success of
mitigating action
30%27%
13% 13%16%
8% 7% 6%
28
Annual report insights 2017 | Surveying FTSE reporting
Compliance – positive trendsThis year, 100% of companies surveyed provided
a longer term viability statement as required by the UK Corporate Governance Code, Provision C.2.2, up from 99%.
The trend has been for more of these statements to be included in the strategic report, alongside the disclosure on principal risks, which is the location suggested by the FRC. 77% of companies included their statement in the strategic report this year (2016: 73%). This makes sense as the potential impact of the company’s principal risks is a key part of the directors’ assessment of longer term viability.
As required by the Code, 95% provided some explanation of why they used the lookout period they selected (2016: 92%). 58% of those offered a more satisfactory explanation than simply justifying the period based on the medium term planning cycle.
88% of companies referred to the nature of the analysis they undertook. A requirement of the Code is to report on how the directors have assessed the prospects of the company and we would expect all statements to meet this. The proportion of companies complying was 91% in our 2016 survey.
Of the 88 companies providing a description of the nature of the analysis they undertook, 87 (2016: over 80) discussed performing modelling, stress testing, sensitivity analysis or scenario planning with only one company indicating that its assessment was limited to consideration of qualitative factors only.
Compliance – problem areasAlthough there was an improvement in
companies explaining their lookout period, of the seven companies that changed their lookout period compared to the prior year, only three provided an explanation for the change.
Despite the FRC’s Guidance on Risk Management, Internal Control and Related Financial and Business Reporting calling for principal risks to be considered both individually and in combination when looking at the effect on longer term viability, only 45% of companies made it clear that they had taken this step (2016: 39%).
Only 52% of companies chose to disclose any qualifications or assumptions underlying their assessment, although this has increased from 48% last year.
Looking beyond complianceWe can see positive trends developing along
the lines of the requests from the FRC and from the Investment Association’s Guidelines on Viability Statements22. These include:
• longer lookout periods, with 22 companies reporting over four years or longer compared to 14 in our 2016 survey;
• 71% disclosed that they took the current state of the company’s affairs into consideration;
• 9% discussed prospects beyond the viability assessment period and 5% made the link to the sustainability of dividends; and
• 10% disclosed the use of reverse stress testing, a particularly robust testing methodology.
To follow up on one of the recommendations made by the Investment Association, we examined whether qualifications were clearly distinguished from assumptions. We found that many companies were found to have not attempted to differentiate the two.
The Investment Association’s description of the difference in the Guidelines on Viability Statements is: “Essentially a company will continue to be viable on the assumption an event or condition occurs or exists. On the other hand a qualification means that the company will not be viable if something occurs or exists.”
Of the 100 companies surveyed, we identified four disclosures of qualifications that we felt lay squarely within the Investment Association’s definition.
Of 26 companies that set out clear scenarios they had used to test the model for their viability statement, seven had presented a conclusion covering each scenario.
29
Annual report insights 2017 | Surveying FTSE reporting

What to watch out for
Consider whether a longer lookout period would be more appropriate for the life cycle of your business – and whatever the lookout period, include a clear and reasoned explanation as to why it is the right decision.
Explain the analysis you have undertaken and consider whether that could helpfully be more robust by assessing principal risks in combination or performing reverse stress testing.
Presenting clear testing scenarios is a helpful addition to the disclosure, particularly if conclusions are shown for each of those scenarios.
If you are subject to financing arrangements, remember that in most cases the viability assessment will make assumptions about those arrangements continuing, which should be disclosed.
Consider meeting investor requests for disclosure:
– How has the current state of the company’s affairs been taken into account?
– What are the prospects beyond the viability statement lookout period?
– Any helpful commentary on the sustainability of dividends?
Following the Article 50 notification in March, the date at which the UK will leave the EU is well within most viability statement lookout periods – has this been factored into your assessment and disclosures?
30
Annual report insights 2017 | Surveying FTSE reporting

National Grid plc gave a clear explanation of how the board concluded on the five year lookout period and a detailed description of the work performed in relation to the viability statement assessment, including the principal risks being assessed in combination, scenarios tested and conclusions on those scenarios.
National Grid plc
Examples of disclosure
See more examples of disclosure in the electronic version of this publication.
31
Annual report insights 2017 | Surveying FTSE reporting

8. Corporate governance8. Corporate governance
Common Codenon‑compliance:
Prov
ision
C.3
.1 –
Aud
it Co
mm
ittee
and
co
mpo
sitio
n
Prov
ision
B.1
.2 –
Boa
rd
com
posit
ion
– in
depe
nden
ce a
nd
non-
exec
utiv
es
Prov
ision
D.2
.1 –
Re
mun
erat
ion
Com
mitt
ee a
nd
com
posit
ion
Prov
ision
B.2
.1 –
N
omin
atio
n Co
mm
ittee
an
d co
mpo
sitio
n
Prov
ision
A.3
.1 –
In
depe
nden
ce o
f ch
airm
an
Governance hot topics discussed by boards in their corporate governance
statements included:
12
811
1310
69 9
79
2017 2016
Corporate culture Cyber risk Brexit
Stakeholders/s172 Workers on boards
69%
50%
44%
17% 1%
Of the 48% that partially complied with
the Code, 90% provided an adequate explanation of the reasons for any non-compliance
(2016: 68%)
100% of companies reported on compliance with the provisions of the UK Corporate Governance
Code and 52% reported that they had complied fully (2016: 100% and 56% respectively)
14 companies included a table or detailed statement outlining how the main principles
had been applied
Only 80% of companies included a statement indicating how they applied the main principles of the
Code, although 94% of the FTSE 100 companies surveyed included this statement
32
Annual report insights 2017 | Surveying FTSE reporting

Compliance – positive trendsComply or explain – the Listing Rules
supported by FRC guidance indicate that a meaningful explanation should be provided for any departure from the provisions of the applicable UK Corporate Governance Code, affording the reader the opportunity to understand the company’s governance journey. There was a noticeable improvement this year in the quality of explanations given for departures from Code provisions during the year, with 90% of those companies that did not fully comply with the Code providing a meaningful explanation, compared to 68% last year.
In a substantial minority of cases, explanations involved a non‑compliance with the Code having been remediated either prior to or shortly after the end of the financial year.
9% of companies indicated that their company had experienced some form of significant internal control breakdown during the year. Following the 2014 change in the FRC’s Guidance on Risk Management, Internal Control and Related Financial and Business Reporting on how to report on significant failings or weaknesses, which now calls for an explanation of what actions have been or are being taken to remedy any significant failing or weakness, 44% of those that had experienced a control breakdown provided a good disclosure regarding the actions that have been or are being taken. This compares to 50% of those companies identifying a significant failing or weakness in our 2016 survey making that disclosure.
Corporate culture has been an area of focus for the FRC in recent years with the report on Corporate Culture and the Role of Boards23 released in July 2016, indicating the importance of board focus on this topic in order to hold management to account. As well as on encouraging 82% of companies discussing culture or value in their strategic report we found 69% discussing this in their corporate governance statements. We considered that 44% offered a detailed discussion in the strategic report (2016: 26%) and 25% in their corporate governance statements (2016: 23%).
21% of companies included some detail on the tools and techniques the board uses to monitor culture and 6% indicated that the board obtains some type of assurance regarding corporate culture (2016: 2%). This type of disclosure helps the reader to understand the quality of the assessment techniques used by the board and how seriously they take the topic of understanding, developing and improving the culture and values embedded in their organisation.
In addition, 10% of companies helped bring their culture and values to life for the reader by providing illustrative case studies – a recommendation from the FRC’s report.
Compliance – problem areasThe Listing Rules require premium listed
companies to provide a statement regarding how they apply the Main Principles of the Code in a manner that would enable shareholders to evaluate how the principles have been applied. These principles are key to corporate governance in the UK as they represent a broad structure within which companies can identify the specific governance framework that works best for them. Only 80% of companies this year included a statement clearly indicating how they applied the main principles of the Code. However, 94% of the FTSE 100 companies surveyed included this statement, and 14 of the disclosures made by our survey sample in this area helpfully included a table or equally detailed statement outlining how the main principles had been applied.
Instead of reporting on compliance with the 2014 UK Corporate Governance Code, the version applicable to all the companies in our sample, 10% of companies instead reported on compliance with the 2016 UK Corporate Governance Code – which came into force for periods commencing on or after 17 June 2016. A further 21% did not clearly disclose which version of the Code they had used, many of these mentioning the new 2016 Code without indicating whether or not this was the version they had applied.
33
Annual report insights 2017 | Surveying FTSE reporting

The world of governance continues to move quickly and government, regulators and investors look for boards to respond promptly and with foresight. Some companies, particularly in the statements by company chairmen and in audit committee reporting, disclose how much thought is being put to these challenging topics and this is an encouraging trend. Disclosures on current “hot topics” this year included:
• 50% disclosed board attention on cyber risk/cyber security, including board training, presentations to the board or audit committee and externally provided projects regarding cyber security.
The preface to the UK Corporate Governance Code calls for chairmen to report personally on how the principles related to the role and effectiveness of the board have been applied, to give investors a clearer picture of the steps taken by boards to operate effectively. We looked for disclosures from chairmen focusing on these principles rather than those that spoke only in general terms about the importance of governance or that only covered director changes. This year, we noted an improvement in the proportion of chairmen reporting personally on these principles, up to 38% from 30% in 2016. However, this is still a minority of chairmen and more could be done by the others to demonstrate personal ownership of how their board operates effectively.
Looking beyond complianceAdditional information on director performance
and contribution is particularly helpful for FTSE 350 companies, where there is a requirement for annual re‑election. 35% of all companies in our sample included disclosure regarding director contribution (2016: 38%), increasing to 72% of the FTSE 100.
Code provision B.2.3 requires a rigorous review to be applied to a non‑executive director that has served for more than six years. Although there is no required disclosure, we do see some good practice around explaining the review that has been conducted exists, including the value and independence these longer serving directors continue to bring to their boards. This year, 39% of companies with longer serving directors included a clear disclosure around their continuing contribution and independence.
44% disclosed board attention to the topic of Brexit, where boards discussed strategy,
principal risks and mitigating actions, whilst audit committees mentioned foreign exchange and treasury risk, potential impairments, principal risks and viability statements.
17% disclosed board interest in broader stakeholder management or activity
undertaken with an eye to s172 of the Companies Act 2006, with particularly good disclosures provided by corporate responsibility committees.
Only one company spoke about how it incorporates the input of employees into board discussions, an area of recent focus for the Government and mentioned in the BEIS Select Committee’s April 2017 report24 on corporate governance.
34
Annual report insights 2017 | Surveying FTSE reporting

What to watch out for
Corporate governance reform is underway and boards will benefit from following developments closely. There is likely to be more information about the direction of travel by the time companies issue their next annual reports and boards may wish to consider incorporating expected disclosure requirements into their front half reporting. See section 5 for further information on incorporating broader stakeholder information into the strategic report.
Remember to provide a clear statement of appliance of the Code’s main principles in addition to a statement of compliance with the provisions.
Corporate culture is an area of continued focus and likely to be reflected in the FRC’s review of the Code – it is key for boards to understand how their companies tick and ideally to explain how they reach that understanding and what they do to improve matters.
Particularly if you are a FTSE 350 company, consider providing disclosure on the contribution your board members make and on the review of the continued independence and value provided by any non‑executive director that has served for more than six years.
Company vulnerability to cyber attack continues to be an area of concern for Government and for investors, who would like to see a keen interest from the board in managing and/or mitigating this risk.
Vodafone Group Plc explains clearly how the Code’s main principles have been applied and the whole corporate governance statement is structured following the sections of the Code.
Vodafone Group Plc
Rotork plc included a case study illustrating aspects of the culture and values of the organisation.
Rotork plc
See more examples of disclosure in the electronic version of this publication.
Examples of disclosure
35
Annual report insights 2017 | Surveying FTSE reporting

9. Nomination committee reporting9. Nomination committee reporting
Nomination committees had an average of 3.2 meetings during the year (2016: 3.2 meetings)
67% of nomination committees were involved in appointing a new director during the year; all of these committees held at least one meeting and
85% of them described the process used for specific board appointments during the year
93% of companies disclosed a board
evaluation in the year, 25% of thosewere external evaluations (28% of FTSE 350
board evaluations)
89% of companies presented a nomination committee report in accordance with the Code (2016: 86%)
How did boards disclose activity around succession planning?
2017 2016
No
refe
renc
e
FTSE 100 FTSE 250 Others
Men
tione
d bu
tno
det
ail
Clea
r exp
lana
tion
No
refe
renc
e
Men
tione
d bu
tno
det
ail
Clea
r exp
lana
tion
No
refe
renc
e
Men
tione
d bu
tno
det
ail
Clea
r exp
lana
tion
0 05
813 11
0 1
2428
1510 11
3024
10 82
Good descriptions of current year findings and actions arising from
performance evaluation
2017 2016
Overall FTSE 350 Others
41%
27%
56%
36%
21%14%
36
Annual report insights 2017 | Surveying FTSE reporting

Compliance – positive trendsThere has been an overall improvement in
nomination committee reporting this year.
With regard to succession planning, which is an area of focus for the FRC and for investors and which is likely to feature in the FRC’s review of the UK Corporate Governance Code25, nomination committees have started to show they are listening to the calls for better quality disclosure. The FRC’s feedback statement26 offers insight on information that could add value to succession planning disclosures.
As shown opposite, 89% of boards disclosed activity around succession planning, a substantial improvement from 69% in 2016. In addition, the quality of disclosure was significantly improved across all sizes of company. It is especially noticeable that the smaller companies outside the FTSE 350 started to include worthwhile disclosures on succession planning this year. 74% of chairmen demonstrated ownership of shaping the board and succession planning.
We considered that 41% of companies included disclosures that explained clearly the systems the board has in place to maintain good succession planning. We were looking for information such as whether the board uses a skills matrix, whether it is reviewed regularly, whether there is a regular update provided on succession planning for senior management.
19% of companies had disclosures that clearly showed that the succession plan and the talent programme were connected to the corporate strategy – an increase compared to 11% last year.
Finally, 27% of reports included information on the quality of the internal pipeline, generally in the nomination committee report. Although we expect to see an increase in this number over the next few years, it is a substantial improvement compared to 9% in 2016.
We also noticed a real improvement in board evaluation disclosures, with 41% of companies explaining the findings and related action points (2016: 27%). This improvement is being led by the FTSE 350, where 56% of companies in our sample included a good disclosure covering current year findings and action points (2016: 36%).
It is particularly helpful to be able to see the benefits companies have derived from their board evaluation and it demonstrates transparency, openness to change and commitment to the running of an efficient board when they are prepared to discuss areas for improvement in the annual report.
This is also a focus area for corporate governance reform, with the BEIS Select
Committee report on corporate governance27 calling for more robust education, role description and performance evaluation for non‑executive directors.
Compliance – problem areasCode provision B.2.4 lays out the requirements
relating to nomination committee reporting. These are still not fully met by the companies in our sample, despite the improvements noted above.
• Only 89% of companies this year met the requirement for a separate section of the annual report describing the work of the nomination committee (2016: 86%).
• Of the 67% of companies that appointed a new board director during the year, only 85% described the process used for those appointments, despite the Code provision asking for disclosure of “the process – used in relation to board appointments.”
However, some nomination committees helpfully described the general process
used for appointments despite not appointing a director during the year. In total, 66% of nomination committees disclosed the use of executive search agencies (in some cases searches in progress for appointments planned for subsequent years); in addition 2 of those companies had used open advertising.
• On a positive note, almost all the companies that did not use open advertising or an executive search agency in a director appointment provided a reasonable explanation of the reasons behind their decision.
• In the very few cases where neither executive search nor open advertising was used, the director appointed was either internal or identified through the nomination committee’s industry knowledge.
37
Annual report insights 2017 | Surveying FTSE reporting

What to watch out for
• More nomination committees are including informative disclosures on succession planning, covering the link to corporate strategy, the process used by the committee and an insight into the quality of the internal pipeline and any exercises to improve that pipeline.
The FRC’s consultation on the next iteration of the UK Corporate Governance Code is likely to include more detail on expectations regarding succession planning. For nomination committees that do not yet have a robust process, there is time to address this.
Board evaluation disclosures regarding current year findings and action points are improving – are yours?
Government drive and investor interest in board diversity continues to develop and boards should consider keeping updated on recent initiatives and enhancing their policies and disclosures in this area.
This coming year, the NFR Directive changes implemented in DTR 7.2.8A should improve disclosure on board diversity policies, targets and outcomes.
We consider that the requirements of the Non‑Financial Reporting Directive regarding diversity disclosures in the corporate governance statement (implemented in the UK through the Disclosure Guidance and Transparency Rules)28 should not be very different from the Code requirements for “a description of the board’s policy on diversity, including gender, any measurable objectives… and progress on achieving the objectives.”
However, in our judgement only 9% of companies this year would have met the new DTR requirement. Nomination committees should strive to provide more specifics of the policy, including where it goes beyond gender, to identify measurable objectives (only 16% of companies this year) and in particular to comment on outcomes achieved during the year.
Looking beyond compliance
Three Government backed reviews regarding diversity have published reports
over the past year. It is encouraging to see that some companies have picked up on these initiatives and a handful have provided information in their annual reports.
The Hampton‑Alexander review29 succeeded the Davies review into women on boards, broadening the focus to include direct reports to the executive board as well as the board itself. We identified eight companies that we felt they met the reporting recommendations. In addition, seven companies embraced the target of having 33% women on the board by 2020.
Several nomination committees mentioned that they would take account of the Parker review of the ethnic diversity of UK boards as part of future board succession planning and composition assessments. Three companies mentioned future targets for ethnic diversity on their boards.
The McGregor Smith review also covered ethnic diversity – this time throughout the workforce. One company included reporting along these lines in its strategic report.
38
Annual report insights 2017 | Surveying FTSE reporting

The Weir Group PLC indicated ways the company is aiming to increase diversity of different types, both at board level and throughout the organisation. They also disclosed targets for gender diversity and met the requested disclosures of the Hampton‑Alexander Review.
Weir Group PLC
See more examples of disclosure in the electronic version of this publication.
Marks and Spencer Group Plc demonstrated ownership by the Chairman, ongoing succession planning for different board appointments, a commitment to diversity reflected in succession plans and detailed information about senior leadership development and appointments with real focus on the “strength on the bench”. There was also a link back to the company’s strategy.
Marks and Spencer Group Plc
Examples of disclosure
39
Annual report insights 2017 | Surveying FTSE reporting

10. Audit committee reporting10. Audit committee reporting
100% of companies presented an audit committee report in accordance with the Code (2016: 99%).
93% of these were stand-alone reports (2016: 89%)
87% of audit committee chairmen showed clear ownership of their committee’s report, in most cases through either a personal introduction or through
signing the full report – this has continued to increase (2016: 84%, 2015: 74%).
89% of companies explained how they had assessed the effectiveness of the external audit process
– only 67% of companies with an internal audit function explained how they had assessed the
effectiveness of the internal audit function.
98% of companies disclosed the significant issues considered in relation to the financial statements and how
they were addressed. On average, audit committees
assessed four significant issues in relation to the financial statements and described how those had been
addressed. (2016: 5 issues).
On average, how many significant financial reporting issues were identified by the
audit committee?
2017 2016
FTSE 100 FTSE 250 Others
56
4 45
4
How comprehensive were the disclosures regarding the effectiveness of the
external audit process?
2017 2016
Comprehensive Moderate Brief
23%
38% 41% 38% 36%
24%
40
Annual report insights 2017 | Surveying FTSE reporting

Compliance – positive trendsThe Code requires audit committees to describe
the significant issues considered in relation to the financial statements and how those issues were addressed. This informs the reader on how the audit committee has exercised its responsibility to pursue the integrity of financial reporting. Only two companies did not provide this disclosure (2016: two companies).
However, in our judgement, only 26% were comprehensive disclosures adding substantially to the reader’s understanding of those issues and how the audit committee has considered and challenged them. For a disclosure to be considered comprehensive, we looked for a good level of information, but also for an audit committee to indicate the work it has done and how it has gone about challenging management regarding its conclusions. The FRC’s Guidance on Audit Committees calls upon audit committees to consider key matters of their own initiative rather than relying solely on the work of the external auditor. Where an audit committee appears to have relied almost entirely on the work of the external auditor, we did not consider this to be been given a comprehensive rating.
The Guidance on Audit Committees30 also calls for disclosure of the policy regarding non‑audit services. This year, 94% of companies disclosed their policy regarding non‑audit services, up from 90% in 2016. Of those explanations, we considered that 46% contained a good level of detail regarding the policy, including the nature of services the auditor is not permitted to perform, often also indicating any approval levels in place. 39% contained comparatively less detail and 16% said there was a policy, in some cases providing a cross‑reference to the external website (which is not a recognised approach under the 2016 Guidance).
59% of companies indicated they had changed their non‑audit services policy in light of the new Ethical Standard for Auditors31 which came into effect for periods commencing on or after 17 June 2016. A substantial minority provided information regarding the tendering of certain tax services now prohibited under the Ethical Standard. 24% of companies also mentioned the 70% cap on non‑audit services which will apply for companies with a December year end in 2020, comparing non‑audit fees in that year to the average of audit fees for the previous three years (assuming no change in auditor before that date, which would restart the clock).
Compliance – problem areasInternal audit has been a recent area of focus
– it is one of the “three lines of defence” and audit committees have been encouraged to spend more time ensuring internal audit is established properly, with independent lines of reporting, a clear remit and good linkage with the rest of the organisation. We did not see any particular improvement in the reporting of the role and activities of the internal audit function. As this area gets more attention with an expanded section on internal audit in the FRC’s 2016 Guidance on Audit Committees, we expect to see more next year.
Out of the companies which have an internal audit function, 90% of audit committees confirm that they have reviewed the plans and work of internal audit – a bare minimum disclosure. Only 53% stated that they have set internal audit plans with reference to the principal risks of the business (called for in the FRC’s 2016 Guidance on Audit Committees), although this is an improvement compared to 41% in 2016. Only four internal audit functions have been involved in a review of culture in any part of the organisation.
Only 67% of audit committees in companies with an internal audit function explain how they have assessed the effectiveness of the internal audit function, and many of these disclosures are very brief indeed. Some of the better disclosures are as comprehensive as those used to describe the assessment of the external audit process, and in some cases audit committees disclose that they use broadly the same approach for both assessments.
Also, for most FTSE 350 companies, it is the second year of reporting on compliance with the Competition & Markets Authority’s Statutory Audit Services for Large Companies Market Investigation (Mandatory Use of Competitive Tender Processes and Audit Committee Responsibilities) Order 2014 (the CMA Order). Although there is no good reason not to provide a statement of compliance and it remains a legal requirement to do so, only 74% of relevant companies included this disclosure (2016: 65%).
41
Annual report insights 2017 | Surveying FTSE reporting

• The new Guidance recommends disclosures about the audit partner in addition to the audit firm. 60% disclosed the tenure of the current audit partner, falling to 43% disclosing the name of the current audit partner – which of course in the absence of partner rotation is also provided at the foot of the auditor’s report.
We also looked at the disclosure of non‑audit services. 6% of companies indicated their auditor did not provide any non‑audit services. For those that did provide non‑audit services, the average ratio of non‑audit fees to audit fees over all companies was 62%, falling to 45% in the FTSE 350 part of our sample. These levels were distorted slightly by some companies having very high non‑audit fees associated with acquisitions or IPOs, the highest of these having been incurred prior to IPO with no non‑audit fees at all incurred following IPO.
Companies increased the explanation as to why they had engaged their auditor to provide any significant non‑audit services, with 37% of companies including an explanation this year (2016: 26%), although we considered that only 27% of those explanations were of a high quality (10 companies). For a high quality explanation, we looked for disclosure including elements such as a tender process, safeguards applied, the nature of the services provided and other clear reasons for selecting the auditor as provider – for example, because the service was an independent assurance service, or was required by law, or required knowledge the auditor had. The quality of explanations was not affected by the level of non‑audit fees, with 70% of the highest quality explanations associated with substantially lower than average non‑audit fees.
Looking beyond complianceThe changes to the 2016 UK Corporate
Governance Code affect the audit committee report: for years commencing on or after 17 June 2016, companies need to ensure the audit committee as a whole has sufficient, relevant sector competence and to report on any advance plans for tendering their audit. These are light touch changes designed to implement elements of EU law in the UK. The 2016 Code was accompanied by new Guidance on Audit Committees, which not only reflected these changes but also represented a pulling together of best practice over the past few years in areas such as audit committee reporting and internal audit.
We consider there is no time bar on implementing best practice and identified the following helpful disclosure trends which echoed the FRC’s Guidance on Audit Committees (whilst noting that only 19% of companies specifically mentioned the guidance):
• 89% described the composition of their audit committee, which could include references to biographies, independence of members and the recent and relevant financial experience called for by the Code. 35% included a disclosure about sector competence.
• 52% included some mention of the annual performance evaluation of the audit committee. This need not be extensive to be good. 13% included a good stand‑alone disclosure –identifying key findings and actions to address those, often along with detail on how the process was conducted, such as who was spoken to and whether via an interview or a written survey. 2% provided a cross‑reference to the main performance evaluation disclosure, which was a sensible alternative to a stand‑alone disclosure.
• 49% included some indication of when there might be a future external audit tender, in line with the new requirements of the 2016 UK Corporate Governance Code (2016: 49%). We think this would have been substantially higher if not for the high number of tenders conducted over the past few years, with many companies including a disclosure on their tender process or indicating their auditor was appointed very recently.
42
Annual report insights 2017 | Surveying FTSE reporting

What to watch out for
Implementing the 2016 Code and accompanying Guidance on Audit Committees should add substantial disclosures, particularly around the external auditor relationship – it is worth marking up an audit committee report if you have not yet implemented these changes.
The audit committee report should include disclosure about the audit committee’s sector competence.
Consider enhancing disclosures regarding the internal audit function and demonstrating the level of oversight applied by the audit committee. How has the committee assessed the effectiveness of the internal auditor?
Make it clear how the audit committee has applied challenge to management’s conclusions when looking at the significant issues affecting the financial statements – what information has been requested and what questions raised?
Where any significant non‑audit services have been obtained from the external auditor, consider including details of why the auditor has been selected as provider and, importantly, any safeguards applied – so the reader understands the audit committee’s conclusion.
If you are a FTSE 350 company, remember to include a statement of compliance regarding the CMA Order.
Internal audit has been a recent area of focus – it is one of the “three lines of defence” and audit committees have been encouraged to spend more time ensuring internal audit is established properly, with independent lines of reporting, a clear remit and good linkage with the rest of the organisation.
43
Annual report insights 2017 | Surveying FTSE reporting

Examples of disclosure
Johnson Matthey Plc gave a clear explanation of how the effectiveness of the external audit process has been assessed – including tools used, who was consulted, continuous assessment, conclusions. They also disclosed the name of the external audit partner and advance notice of a tender of the external audit. Discussion was also included on a recent review of the audit by the FRC’s Audit Quality Review team and how the results were discussed with the external auditor.
Johnson Matthey Plc
44
Annual report insights 2017 | Surveying FTSE reporting
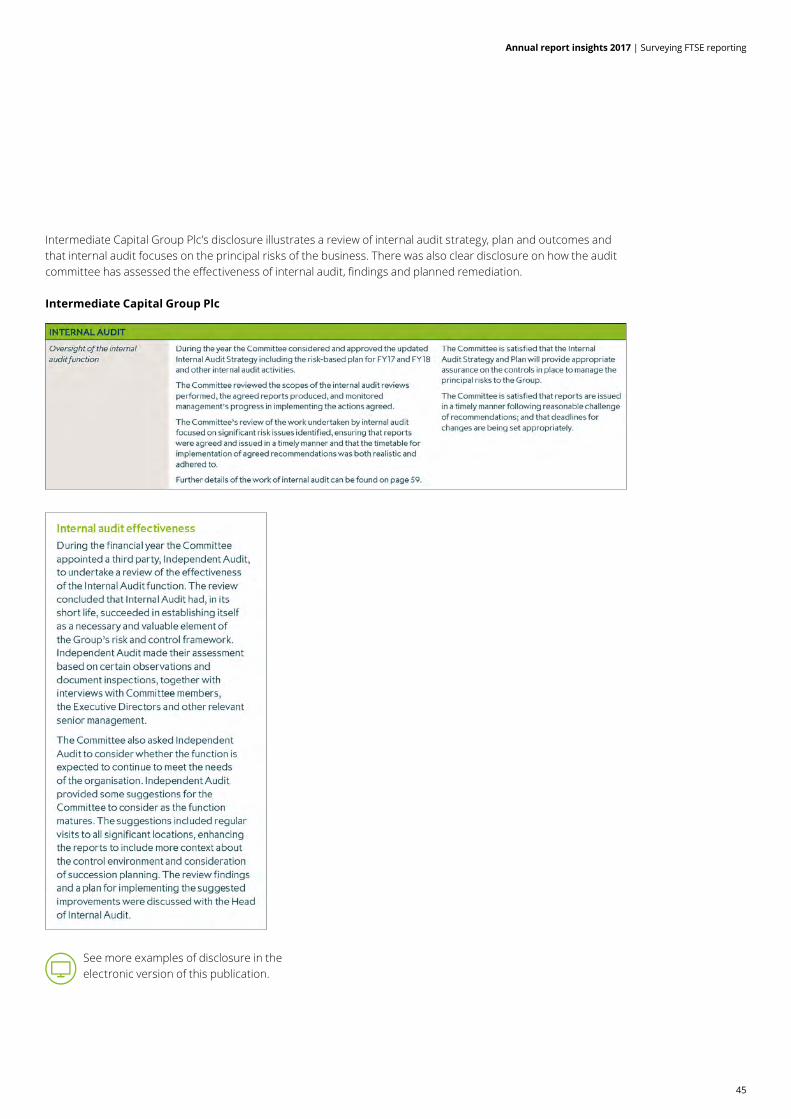
Intermediate Capital Group Plc’s disclosure illustrates a review of internal audit strategy, plan and outcomes and that internal audit focuses on the principal risks of the business. There was also clear disclosure on how the audit committee has assessed the effectiveness of internal audit, findings and planned remediation.
Intermediate Capital Group Plc
See more examples of disclosure in the electronic version of this publication.
45
Annual report insights 2017 | Surveying FTSE reporting

11. Judgements and estimates, tax and pensions11. Judgements and estimates, pensions and tax
The average number of critical judgements andkey sources of estimation uncertainty
dropped from 6 to 5.
Do those items appear to be company-specific?
All items company specific Some items generic
16
51
32
All items appeared generic
Disclosures on estimation uncertainties*
All items Some items
Changes to past assumptions
Range of reasonably possible outcomes
Sensitivities (unless stated impractable)
Quantified explanations of assumptions
Nature and amount of asset/liability (or obvious)
2%
2% 98%
7% 93%
4% 57%
60% 27%
* Of the 95 companies appearing to disclose key sources of estimation uncertainty
57% discussed the effective tax rate on their statutory profit in
their strategic report
76% gave some insightinto their anticipated future
effective tax rate
16% quantified all futurecontributions due under schedules
of contributions
67% still have defined benefit pension schemes
46
Annual report insights 2017 | Surveying FTSE reporting
The FRC has announced32 that they are undertaking focused thematic reviews of financial statements covering critical judgements and key sources of estimation uncertainty and pensions. The FRC has already completed a thematic review33 on tax, both from a financial and narrative reporting standpoint. We have focussed on the FRC’s key areas of concern and present the key findings below by topic.
Critical accounting judgements and key sources of estimation uncertainty34
Critical accounting judgements and key sources of estimation uncertainty are two disclosures that have often mistakenly been merged together, despite IAS 1 requiring separate and different disclosure for each. Disclosure of accounting judgements under IAS 1 specifically excludes those involving estimations, which are covered by the estimation uncertainty disclosures. We observed some progress here, with 52% of those surveyed (2016: 27%) now making clear which items they regard as estimates and which as judgements.
However, even where a distinction is made, confusion remains as it appeared to us that 15 companies had presented judgements as estimates or vice versa. For example, forecasting future cash flows for an impairment test will typically involve making estimates. The differing disclosures required for each mean this distinction matters and the FRC’s decision to undertake a thematic review highlights their concerns in this area. Also, the estimates disclosures apply only where there is a significant risk of material adjustment in the next year due to changes in assumptions and estimates, so not all areas of estimation are covered.
One of the FRC’s main concerns is that disclosures are too generic. Such a concern appears well‑founded, since a third of companies we looked at only provided narratives that were indeed so generic that they could have been equally applied to any other company. This was often the case in respect of goodwill impairment testing, defined benefit exposures, recognition of provisions and uncertain tax positions. Only 15 companies disclosed items that all appeared suitably company‑specific.
Pinpointing the specific complexities involved in judgements and uncertainties provides far more valuable insight.
For example, the risk of material adjustment in the next 12 months may be identified as relating specifically to one group of cash generating units (such as a single operating segment) and the associated goodwill balance, rather than affecting the goodwill balance in its entirety.
On areas of estimation uncertainty, the FRC has specifically stated that, under IAS 1, it expects a description of the relevant assets’ and liabilities’ nature and amount and quantified explanations of assumptions. Where material, it also expects information about the sensitivity of estimates to changes in assumptions, the range of reasonably possible outcomes and changes made to past assumptions during the year. As shown opposite, this is an area where many companies could improve. It should be noted that in many cases the only insight into sensitivities and ranges of reasonably possible outcomes was where other standards such as IAS 19 or IAS 36 require specific disclosures – few companies included disclosures where there was no subject‑specific requirement.
In 95% of cases it appeared to us that one or more items identified as critical judgements or key sources of estimation uncertainty were open to challenge on the grounds that, based purely on the disclosures provided, it seemed unlikely that the judgements could have a significant effect or that the areas of estimation uncertainty could see a material adjustment within the next 12 months.
On a similar note, 37 companies stated, typically in their goodwill note, that there were no reasonably possible changes that could give rise to an impairment of goodwill and yet 27 of these companies stated that there was a key source of estimation uncertainty associated with impairment testing of goodwill, suggesting that there could be a material adjustment in the next 12 months. This highlights the need for preparers to avoid feeling compelled to identify a list that is typically five or six items long with the same items as in their peer group’s financial statements.
TaxRecent times have seen greater scrutiny of the amount of tax companies are paying and the FRC’s thematic review highlighted areas for improvement in disclosures both in companies’ strategic reports and their financial statements.
47
Annual report insights 2017 | Surveying FTSE reporting

The level of insight into future contribution levels varied though, with only 15 companies appearing to quantify future contributions over the whole period covered by schedules of contributions. In other cases companies only provided quantification of contributions for the next year, with higher level narrative covering timeframes further out. Just over half the companies with defined benefit schemes (36) clearly identified and explained the risks inherent in their scheme asset investment strategy.
25 of the schemes were seen to be in surplus (on an IAS 19 basis), with 22 of those companies recognising the surplus as an asset. However, the justification for recognising an asset was only provided by 13 companies (in all cases on the grounds of an unconditional right to a refund). On a related note, no company recognised an additional liability for a minimum funding requirement that would have given rise to an irrecoverable surplus. This is an area where the FRC can challenge companies, focusing on matters such as trustees’ rights to enhance benefits.
What to watch out for
Distinguish between judgements (other than those relating to estimates) and estimates
Make the judgements and estimates company‑specific and meet the FRC’s expectations for all the accompanying detail, such as sensitivity information
Provide insight into the future expected tax rate
Provide the necessary disclosures around uncertain tax positions
Quantify future committed contributions to defined benefit schemes
Provide justification for recognition of a pension asset where a scheme is in surplus
Consider additional liabilities where minimum funding requirements will give rise to an irrecoverable pension surplus
New requirements35 call for large UK companies to publicly disclose their tax strategy before the end of financial years starting on or after 15 September 2016. In the annual reports we surveyed, 9% were providing more generic disclosures of their tax governance or strategy, whereas 29% of companies were providing some real insight beyond just generic boilerplate. Disclosures on the effective tax rate anticipated to be paid in the future were often relatively short, focusing on changes to tax rates announced in the budget.
One area of concern raised by the FRC is around uncertain tax positions, which are relatively common in large entities given the complexity of many tax regimes.
One area of concern raised by the FRC is around uncertain tax positions, which are relatively common in large entities given the complexity of many tax regimes. Despite 38% of companies identifying provisions for uncertain tax positions as a critical accounting judgement or key source of estimation uncertainty, only 18% of companies surveyed provided an accounting policy on uncertain tax positions. Of the 38 companies, only six quantified their uncertain tax provisions. 15 companies disclosed contingent liabilities related to tax, although only seven of those gave an estimate of the potential effect as required by IAS 37 where the probability of outflow is not remote.
Alongside IFRIC 23 Uncertainty over Income Tax Treatments, which provides clarity on the accounting (with effect from periods commencing on or after 1 January 2019), the FRC is promoting greater transparency in this area, through clearer disclosure of accounting policy and quantification of uncertain tax provisions. The FRC has stated that justification for non‑quantification will continue to be a regulatory focus in future.
PensionsWhilst many companies have closed their defined benefit pension schemes either to new entrants or to future accrual, ongoing obligations to fund such schemes can often be hugely significant. 67 companies surveyed had such schemes and in the majority of cases were giving some quantified insight into future funding levels – something the FRC is seeking improvements on.
48
Annual report insights 2017 | Surveying FTSE reporting

National Grid plc provided detailed sensitivity analyses in respect of their key sources of estimation uncertainty, part of which is shown below.
National Grid plc
See more examples of disclosure in the electronic version of this publication.
Examples of disclosure
49
Annual report insights 2017 | Surveying FTSE reporting
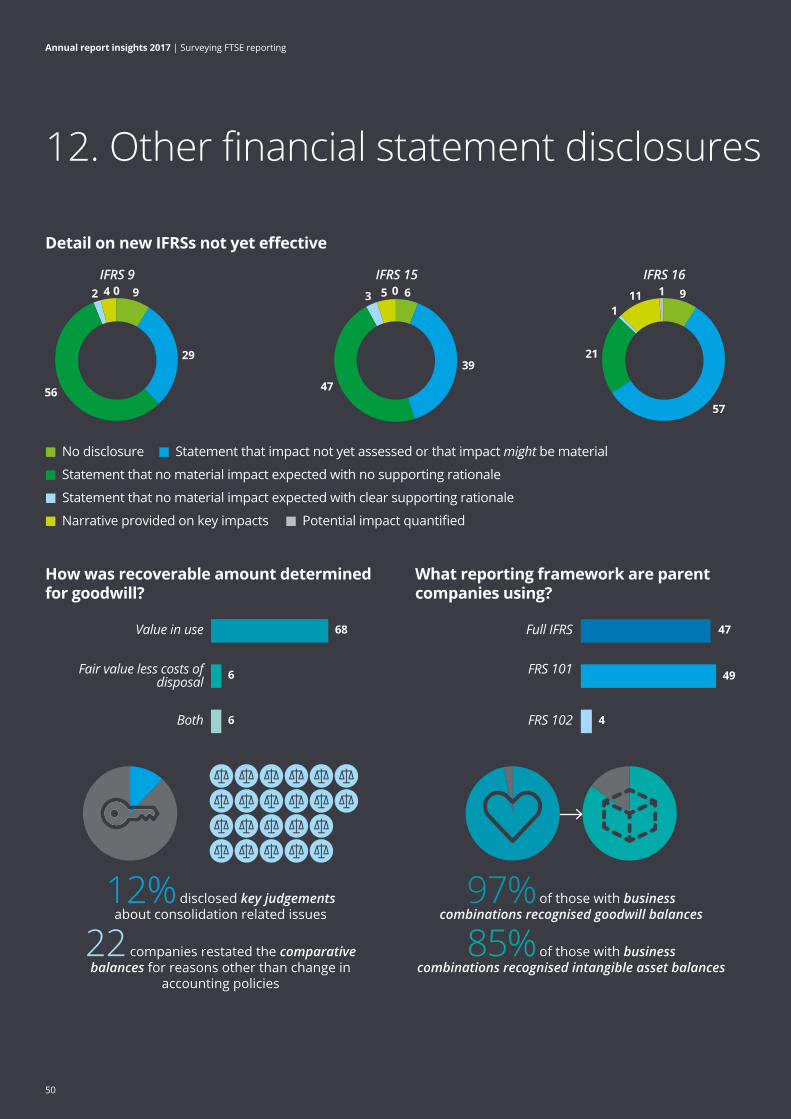
12. Other financial statement disclosures12. Other financial statement disclosures
Detail on new IFRSs not yet effective
IFRS 15 IFRS 16IFRS 9
No disclosure Statement that impact not yet assessed or that impact might be material
Statement that no material impact expected with no supporting rationale
Statement that no material impact expected with clear supporting rationale
Narrative provided on key impacts Potential impact quantified
How was recoverable amount determined for goodwill?
What reporting framework are parent companies using?
Value in use
Fair value less costs of disposal
Both
Full IFRS
FRS 101
FRS 102
68
29
56
2 4 0 9
39
47
3 5 0 6
57
21
111 1 9
6
6
47
49
4
97% of those with businesscombinations recognised goodwill balances
85% of those with businesscombinations recognised intangible asset balances
12% disclosed key judgementsabout consolidation related issues
22 companies restated the comparativebalances for reasons other than change in
accounting policies
50
Annual report insights 2017 | Surveying FTSE reporting
Impairment testing of goodwill80 companies had a goodwill balance at the year‑end, prompting IAS 36 disclosures around impairment testing, which investors, auditors and regulators will always pay close attention to. We were pleased to see that 76 companies disclosed key assumptions for determining recoverable amount. 68 companies determined the recoverable amount with reference to the value in use, 6 companies with reference to fair value less costs of disposal and 6 companies with reference to both value in use and fair value less costs of disposal. 67 companies also set out their process for determining assumptions, including whether they were based on past performance or external sources. 42 of those companies identified key assumptions beyond just their discount rate and the long term growth rate applied to periods beyond those covered by budgets, for example highlighting future profit margins.
35 companies provided some form of sensitivity analysis, with a further 37 pre‑empting any enquiries on the lack of disclosure by instead providing a negative statement that there were no reasonably possible changes in key assumptions that would cause an impairment. Only eight companies remained silent on the matter.
Business combinations – goodwill and intangible asset recognition37% of the FTSE 350 companies in our sample and 28% of those smaller listed companies surveyed had business combinations during the year (33 companies in total, 2016: 39). 97% of those with business combinations (2016: 95%) recognised goodwill balances and 85% (2016: 77%) recognised other intangibles, although it was not always possible to ascertain whether these were intangibles that had previously been recognised by the acquiree. Although only a high‑level insight, this seems relatively encouraging given that the FRC has repeatedly raised concerns that companies may not be identifying all required intangibles in their business combination accounting.
Key judgements – consolidationsDespite the prevalence of parent companies holding investments in subsidiaries, joint arrangements and associates, only 12 companies (2016: 12) disclosed key judgements about consolidation related issues. The FRC takes a keen interest in such matters, particularly around de facto control.
Impact of forthcoming standardsWith major new IFRSs on the horizon, covering revenue recognition, financial instruments and leasing, it was disappointing that, despite encouragement from the FRC and ESMA, so few companies were providing company‑specific detail on the potential impact of these new standards, as required by IAS 8. IFRS 9 and IFRS 15 become effective for periods commencing on or after 1 January 2018 and, at the time of their last reports, many companies still hadn’t determined whether or not there would be a material impact. Around half stated that no material impact was expected but there was no accompanying explanation to support this conclusion. Expectations of meaningful insight and quantification of known or reasonably estimable impacts will only increase in the coming reporting season, which for many companies will be their final reports before those standards become effective.
Fewer companies indicated that they did not expect a material impact from applying IFRS 16, the new leasing standard, which requires many operating leases to come onto lessees’ balance sheets. Again, expectations of this disclosure will increase as time passes, with quantification expected if known or reasonably estimable.
51
Annual report insights 2017 | Surveying FTSE reporting

What to watch out for
Newly effective IFRS amendments, set out in the regulatory overview appendix of the electronic overview of this publication, in particular IAS 7’s reconciliation of movements in liabilities arising from financing activities
Improve disclosures on the effect of standards that are in issue but not yet effective
Only include those accounting policies that are significant and relevant to the accounts
Don’t forget all the disclosures required by IFRS 13 if you have items making significant use of unobservable inputs (‘Level 3’ fair values)
Significant accounting policies and material disclosuresWhere accounting policies were presented in a separate note (as opposed to interspersed throughout multiple notes to the accounts), they were just under seven pages long on average, consistent with last year. Such an approach is still adopted by the majority of companies (88, 2016: 88). Although many companies indicated that they were disclosing their “significant” accounting policies, or words to similar effect, in some cases it appeared that redundant policies were still included.
On a similar theme, only six companies this year made reference to excluding financial statement disclosures on the grounds that the information was immaterial, consistent with the previous year. That said, companies may feel it is unnecessary to repeat year on year the fact that immaterial disclosures are being omitted, given such information is not required to be disclosed anyway per IAS 1.
RestatementsIn terms of restatements, other than for changes in accounting policy, 22 companies were seen to be adjusting comparative balances. The most common reasons for a restatement was to reflect changes in reportable segments following internal restructurings.
Company financial statementsChanges to the law have meant that companies reporting under FRS 101 or FRS 102 are now at liberty to use IFRS‑style presentation and terminology in their accounts rather than having to adhere to the more traditional UK GAAP statutory formats. We found two of the four parent companies adopting FRS 102 surveyed made use of this flexibility in their separate financial statements, as did 11 of the 49 FRS 101 reporters. The 47 parent companies reporting under IFRS may well gradually move across to FRS 101 in future periods, given the FRC’s removal of the requirement for such companies to notify shareholders of such a change.
52
Annual report insights 2017 | Surveying FTSE reporting

Capita plc provided company‑specific insight into the potential impact IFRS 15, the new IFRS on revenue, may have on them.
Capita plc
See more examples of disclosure in the electronic version of this publication.
Examples of disclosure
53
Annual report insights 2017 | Surveying FTSE reporting

When implementing the recommendations set out in this document, it is important to work to an achievable timetable. Getting as much as possible done in advance of the year end, when there is less pressure on the timetable, reduces the burden during the post year end reporting cycle. In order to help you achieve your objectives we have provided a suggested 2017/18 plan below, as well as suggestions for what could be on the agenda for your planning meeting.
Appendix 1 – The preparation process
October 2017By mid October
• Planning meeting of contributors to agree responsibilities, process and governance, including how to assess whether the report is fair, balanced and understandable, plus decide the overall structure for the report
• Identify opportunities to make the report clearer and more concise
November 2017Early to mid November
• Contributors draft templates for their areas of responsibility • Structure of draft report pulled together and reviewed for duplication • Areas for linkage identified and highlighted in the draft report
Late November/early December • Auditors review the structure of the report and provide comments
December 2017By mid December
• Disclosure Committee (or equivalent) approve overall structure and technical compliance of the report
January 2018
• Draft report presented to the Audit Committee for initial comment on key messages, themes and overall balance • Report sections updated for final messages based on year end results • Cross‑check for consistency with other planned or existing public reporting
February 2018
• Audit Committee assesses annual report on behalf of the Board – is it comprehensive and is it fair, balanced and understandable?
• Remuneration report reviewed by Remuneration Committee • Report sections formally presented for review • Chairmen of Audit, Remuneration and Nomination Committees compose introductions to their reports
By late February/March • Final report presented to Audit Committee, Remuneration Committee and Board for approval
A suggested timetable for 2017/18 (For December reporters)
54
Annual report insights 2017 | Surveying FTSE reporting

Suggested agenda for annual report planning meeting
• Consider how you will ensure that all elements of your annual report meet the regulatory requirements and effectively convey strategically important information to shareholders
• Agree the key messages and themes that will flow through the report, as far as they are understood at this stage, getting Audit Committee and Board buy in at a sufficiently early stage
• Discuss and agree how materiality will be applied to the annual report as a whole
• With the design team, discuss the key messages and themes and how these can be brought to life through design
• With the website team, discuss your approach to digital communication alongside the key messages and themes, to agree any advance design work to be done on the website
• Plan how you will avoid the “silo effect”:
– Arrange for regular communication between all teams involved
– Create an example storyboard identifying all elements to be included in the front half at the beginning of the process to help avoid duplication, and achieve a holistic, concise story
– Identify the relationships to be drawn out and links to be made in the report
– Identify who will do a “cold read” of the report in full to assess clarity of message, conciseness and duplication, as well as determining whether the report is fair, balanced and understandable
55
Annual report insights 2017 | Surveying FTSE reporting
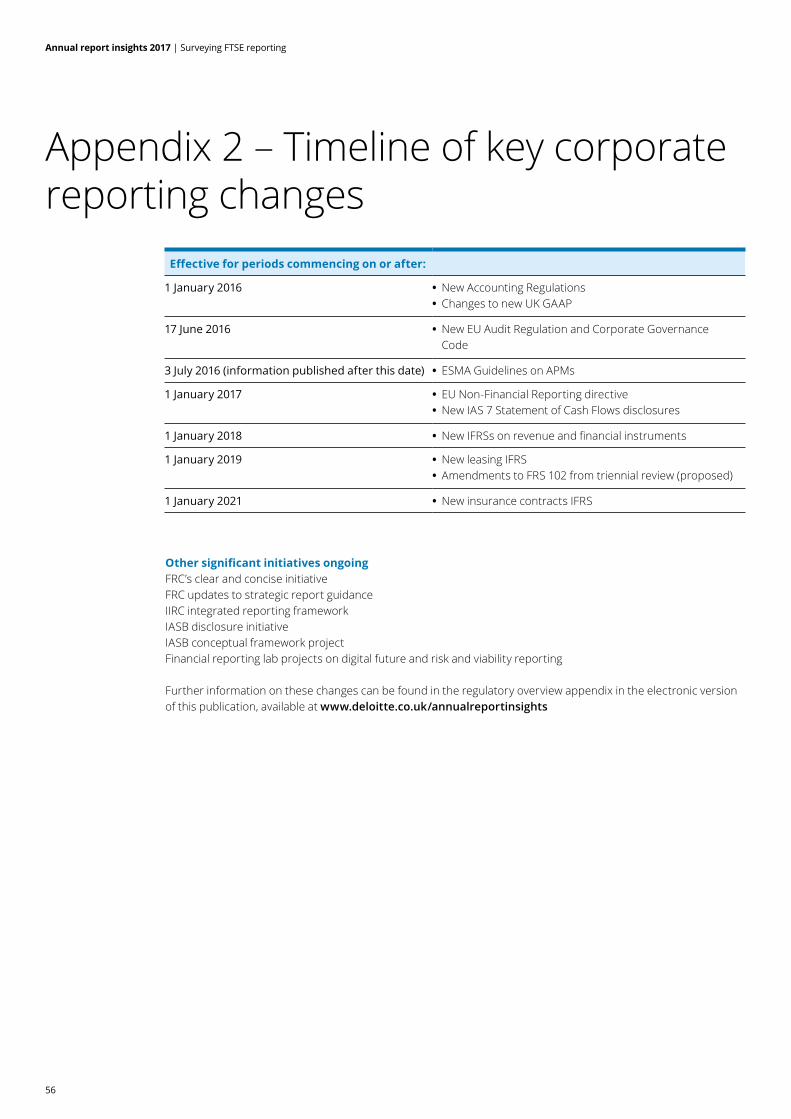
Effective for periods commencing on or after:
1 January 2016 • New Accounting Regulations • Changes to new UK GAAP
17 June 2016 • New EU Audit Regulation and Corporate Governance Code
3 July 2016 (information published after this date) • ESMA Guidelines on APMs
1 January 2017 • EU Non‑Financial Reporting directive • New IAS 7 Statement of Cash Flows disclosures
1 January 2018 • New IFRSs on revenue and financial instruments
1 January 2019 • New leasing IFRS • Amendments to FRS 102 from triennial review (proposed)
1 January 2021 • New insurance contracts IFRS
Other significant initiatives ongoingFRC’s clear and concise initiativeFRC updates to strategic report guidanceIIRC integrated reporting frameworkIASB disclosure initiativeIASB conceptual framework projectFinancial reporting lab projects on digital future and risk and viability reporting
Further information on these changes can be found in the regulatory overview appendix in the electronic version of this publication, available at www.deloitte.co.uk/annualreportinsights
Appendix 2 – Timeline of key corporate reporting changes
56
Annual report insights 2017 | Surveying FTSE reporting

Business model related disclosures 58
Stakeholder engagement disclosures 61
Risks and opportunities disclosures 63
Viability statement disclosures 65
Corporate governance disclosures 66
Nomination committee disclosures 69
Audit committee disclosures 72
Financial statement disclosures 75
Appendix 3 – Additional disclosure examples
This appendix sets out additional examples of good practice in disclosure. Click on the company names to go the relevant annual reports.

Business model related disclosuresAnglian Water plcA clear explanation, using narrative and limited graphics, of how Anglian Water creates value and the resources it relies upon.
Marks and Spencer Group plcMarks and Spencer Group plc provide an overview of “Connected Value”, demonstrating the linkage between strategy, business model, KPIs and Risks, and how these fit within the transformation of capitals as inputs to outcomes.
International Personal Finance plcThe Q&A format of the discussion of market trends in International Personal Finance plc annual report is particularly effective.
58
Appendix 3 – Additional disclosure examples

Charles Stanley Group PLCThe discussion of market trends in Charles Stanley Group PLC’s annual report includes explanations of how the company has responded to the trends and the opportunities that are presented.
Lonmin PlcLonmin Plc clearly disclosed the distribution of cash earned to stakeholders.
Fresnillo plcA good example of linkage between business model and other key elements of the strategic report was provided by Fresnillo plc.
59
Appendix 3 – Additional disclosure examples

EVRAZ plcEVRAZ plc’s business model includes many elements encouraged by the Lab, summarising them and providing cross‑references to further detail.
BT Group plcBT Group plc quantified both the financial and non‑financial value created for a range of stakeholder groups within its business model.
Berendsen plcBerendsen plc clearly identifies inputs and gives an indication of value created for all stakeholders.
60
Appendix 3 – Additional disclosure examples

Stakeholder engagement disclosuresMarks and Spencer PlcA good example from Marks and Spencer Plc with analysis and application of s172 of the Companies Act 2006 including specific reference to s172.
St James’ Place PlcA good example of explicit reference to s172 of the Companies Act 2006 as part of the approval of the strategic report from St James’ Place Plc.
Vodafone Group PlcA good example from Vodafone Group Plc of shareholder engagement providing a list of issues which shareholders have asked about.
61
Appendix 3 – Additional disclosure examples
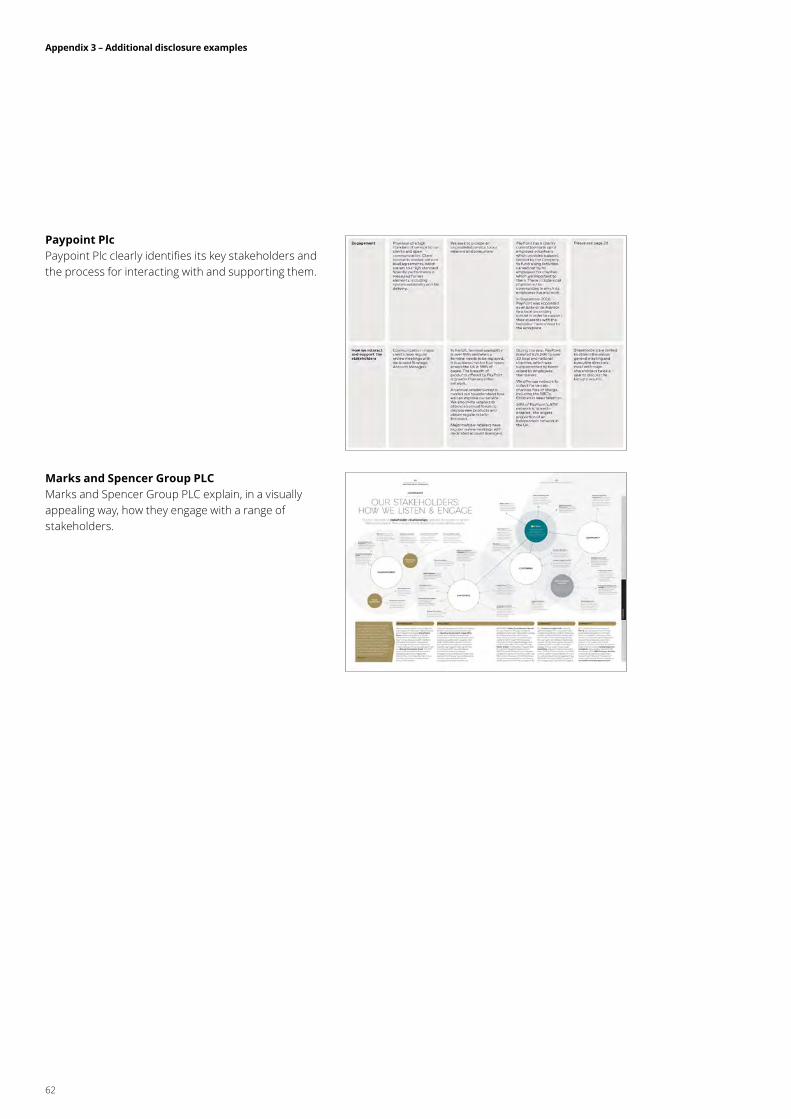
Paypoint PlcPaypoint Plc clearly identifies its key stakeholders and the process for interacting with and supporting them.
Marks and Spencer Group PLCMarks and Spencer Group PLC explain, in a visually appealing way, how they engage with a range of stakeholders.
62
Appendix 3 – Additional disclosure examples
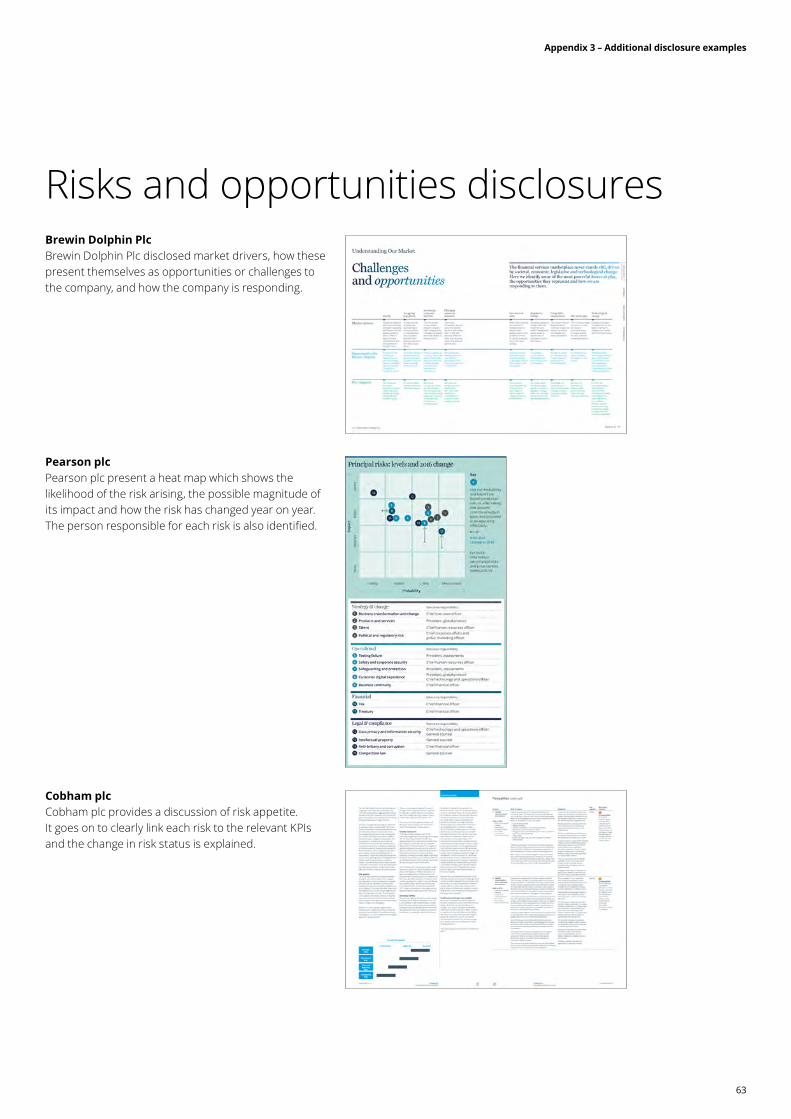
Brewin Dolphin PlcBrewin Dolphin Plc disclosed market drivers, how these present themselves as opportunities or challenges to the company, and how the company is responding.
Pearson plcPearson plc present a heat map which shows the likelihood of the risk arising, the possible magnitude of its impact and how the risk has changed year on year. The person responsible for each risk is also identified.
Cobham plcCobham plc provides a discussion of risk appetite. It goes on to clearly link each risk to the relevant KPIs and the change in risk status is explained.
Risks and opportunities disclosures
63
Appendix 3 – Additional disclosure examples
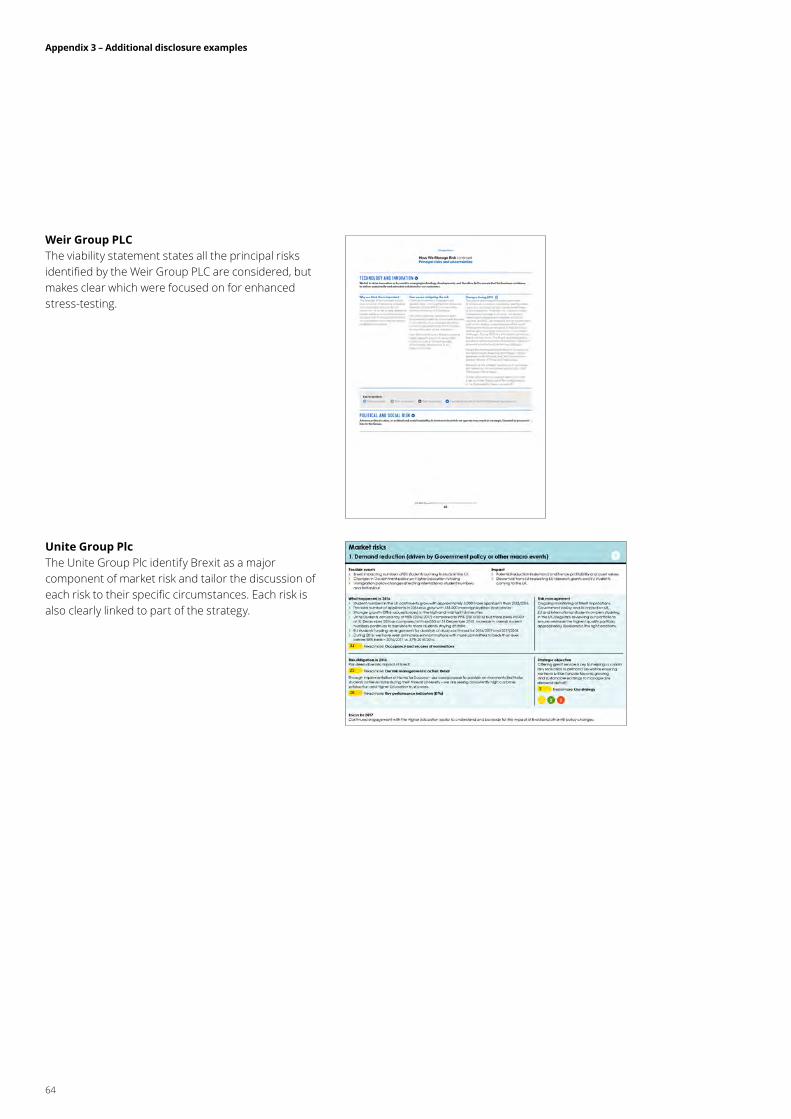
Weir Group PLCThe viability statement states all the principal risks identified by the Weir Group PLC are considered, but makes clear which were focused on for enhancedstress‑testing.
Unite Group PlcThe Unite Group Plc identify Brexit as a major component of market risk and tailor the discussion of each risk to their specific circumstances. Each risk is also clearly linked to part of the strategy.
64
Appendix 3 – Additional disclosure examples

NEXT plcNEXT plc explains with a diagram the shorter and longer term factors influencing its decision regarding the lookout period.
Shaftesbury PLCShaftesbury PLC provides and explains key assumptions relating to their viability assessment.
BT Group plcBT Group plc provides good detail about the current position, assessment of prospects and a horizon beyond the lookout period.
Viability statement disclosures
65
Appendix 3 – Additional disclosure examples

Fidessa group plcFidessa group plc explains the independence assessment and contribution to the board of a long serving director.
Vodafone Group PlcVodafone Group Plc explains the skills and experience each director brings to the board to enable shareholders better to understand their individual contribution.
IP Group PlcIP Group Plc describes the importance of cyber security, the reasons for audit and risk committee attention, the regularity of review, new initiatives and use of external advice.
Corporate governance disclosures
66
Appendix 3 – Additional disclosure examples
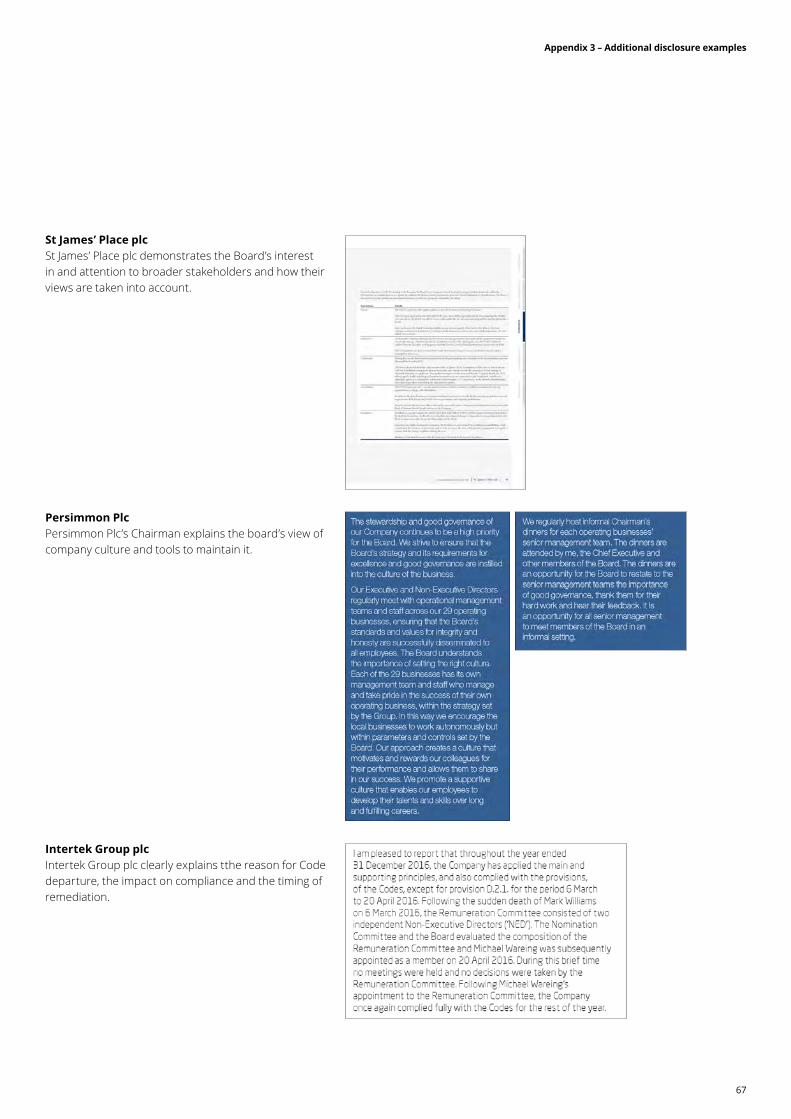
St James’ Place plcSt James’ Place plc demonstrates the Board’s interest in and attention to broader stakeholders and how their views are taken into account.
Persimmon PlcPersimmon Plc’s Chairman explains the board’s view of company culture and tools to maintain it.
Intertek Group plcIntertek Group plc clearly explains tthe reason for Code departure, the impact on compliance and the timing of remediation.
67
Appendix 3 – Additional disclosure examples

Barclays PLCBarclays PLC explains the importance of the principles and provides an index to where information can be found.
68
Appendix 3 – Additional disclosure examples

Nomination committee disclosuresPearson plcPearson plc provides a helpful table regarding board evaluation findings from the prior year and actions taken to remedy those during the past year.
St Modwen Properties PLCSt Modwen Properties PLC provides a diagrammatic explanation of the board evaluation supported by clear explanation, description of key findings and actions taken to date.
Lloyds Banking Group plcLloyds Banking Group plc provides the required gender table and also statistics regarding ethnicity of the workforce and disability.
69
Appendix 3 – Additional disclosure examples
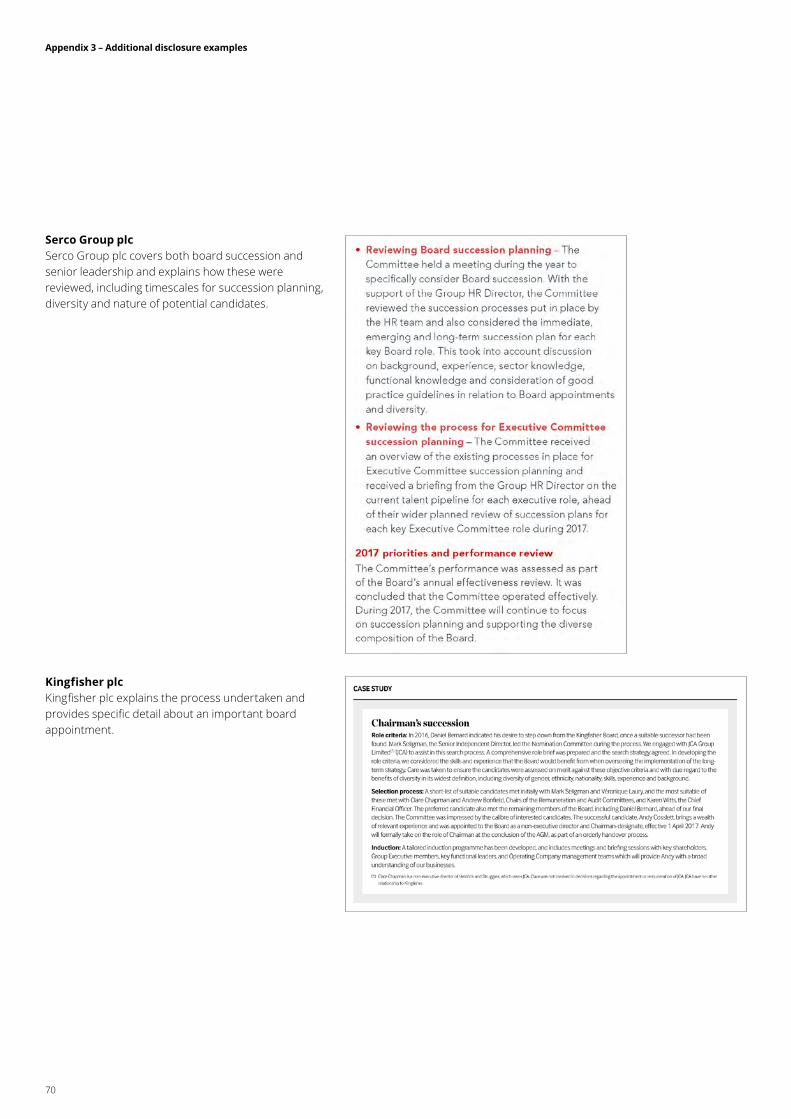
Serco Group plcSerco Group plc covers both board succession and senior leadership and explains how these were reviewed, including timescales for succession planning, diversity and nature of potential candidates.
Kingfisher plcKingfisher plc explains the process undertaken and provides specific detail about an important board appointment.
70
Appendix 3 – Additional disclosure examples

Lloyds Banking Group plcLloyds Banking Group plc uses simple diagrams to summarise how the director induction programme and professional development is managed.
Premier Oil plcPremier Oil plc uses a simple diagram to summarise how director induction and further development is managed.
71
Appendix 3 – Additional disclosure examples

Weir Group PLCIn respect of the Group’s internal control and risk management systems, the Weir Group PLC explains clearly the significant failing or weakness that has arisen during the year and the actions that have been taken to address this.
Mondi GroupMondi Group provides information on interaction with the FRC’s Corporate Reporting Review team and Audit Quality Review team.
EVRAZ plcEVRAZ plc describes how the effectiveness of the internal audit function was assessed, the scrutiny of the audit committee and the actions they have taken to ensure the internal audit plan is in line with risks, and references external frameworks such as the IIA.
Audit committee disclosures
72
Appendix 3 – Additional disclosure examples

National Grid plcNational Grid plc describes why they decided to engage their auditor for a significant non‑audit service.
Informa PlcInforma Plc offers a comprehensive non‑audit services policy together with clear description of changes in 2017.
Capita plcCapita plc explains the nature of the issue, the actions taken by the audit committee, taking into account the sources of information considered, and the conclusions including how the annual report has changed as a result.
73
Appendix 3 – Additional disclosure examples

Compass Group plcCompass Group plc provides the new recommended disclosure on audit committee overall sector competence.
74
Appendix 3 – Additional disclosure examples
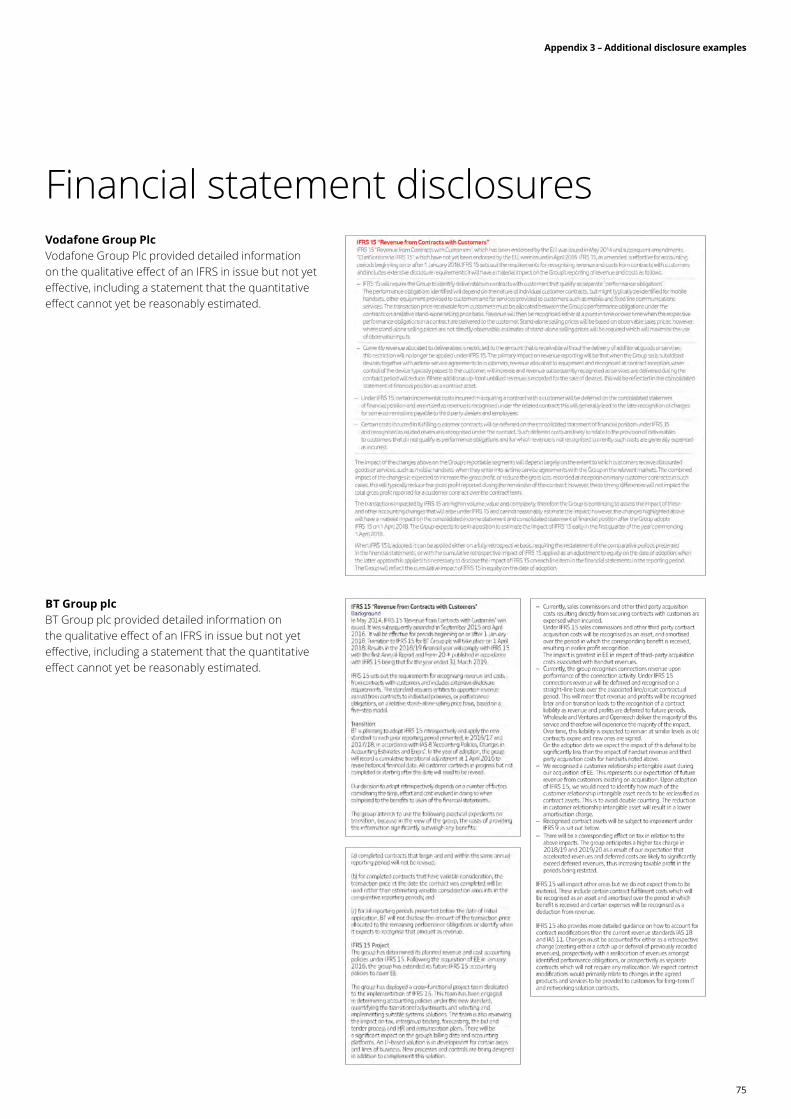
Vodafone Group PlcVodafone Group Plc provided detailed information on the qualitative effect of an IFRS in issue but not yet effective, including a statement that the quantitative effect cannot yet be reasonably estimated.
BT Group plcBT Group plc provided detailed information on the qualitative effect of an IFRS in issue but not yet effective, including a statement that the quantitative effect cannot yet be reasonably estimated.
Financial statement disclosures
75
Appendix 3 – Additional disclosure examples

Kingfisher plcKingfisher plc provided an analysis of plan assets in a defined benefit plan, and information on the liability‑driven investment strategy pursued in relation to the plan.
Kingfisher plcKingfisher plc presented a clear description of the responsibilities of trustees over its defined benefit pension plan.
76
Appendix 3 – Additional disclosure examples
Appendix 4 – Regulatory overview
The big picture 78
Narrative reporting 79
Corporate governance 82
Financial statements 85
Regulatory overview endnotes 88

The big pictureThe demands placed on companies in relation to their corporate reporting by regulators and investors continue to evolve. To assist companies in addressing these changing demands, the FRC continues to issue helpful guidance as part of its ‘Clear & Concise Reporting’ initiative, as well as through the work of its Financial Reporting Lab. In recognition of the particular challenges faced by smaller listed companies when trying to produce high quality annual reports, the FRC continues its project specifically intended to improve the reporting by smaller listed and AIM companies.
At the heart of the Clear & Concise project is the FRC’s Guidance on the Strategic Report1 (the ‘FRC Guidance’), issued in 2014, which is referred to throughout this publication. This document sets out a wealth of non‑mandatory guidance for companies on how to communicate effectively within their strategic report, as well as how to link it meaningfully to other parts of the report. The FRC has since concluded that companies are taking on board the objectives of their Clear & Concise initiative and that the overall quality of corporate reporting has improved since the introduction of the strategic report, although opportunities for further improvement still exist.2 With the adoption of the EU Non‑Financial Reporting Directive (EU NFR Directive)3, and the FRC’s subsequent consultation on proposed amendments to its Guidance4, the focus on non‑financial information within narrative reporting continues to increase. Particular emphasis is being placed on company purpose and how companies are impacting broader stakeholder groups beyond shareholders.
Since we published our last annual report insights survey, the Financial Reporting Lab has issued:
• Business model reporting5 (October 2016) which examined various characteristics of business models such as how various groups define a business model, the way in which business model disclosures are prepared, how investors use business model disclosures and what good business model reporting looks like;
• Disclosure of dividends – policy and practice implementation study6 (December 2016), which examines how companies have responded to investor calls for better disclosure of dividends, examples of good practice and areas for improvement; and
• Digital reporting – a framework for future digital reporting7 (May 2017), which identifies the benefits new mediums and technologies should offer, which technologies could do this and how companies can make the most of this opportunity.
78
Appendix 4 – Regulatory overview
Narrative reportingThis past year, the most significant development in narrative reporting was ESMA’s Guidelines on Alternative Performance Measures8 becoming effective. All of those companies surveyed clearly presenting key performance indicators (KPIs) included some which were APMs. Many aspects of ESMA’s Guidelines are commonly adhered to, although some companies may be open to challenge in terms of the level of prominence given to those APMs.
Existing requirementsOther than for small companies, which are exempt, the main component of the narrative section of an annual report is the strategic report, which was introduced in 2013 by section 414A of the Companies Act 2006. Companies are also required by section 415 of the Act to include a directors’ report, although since the introduction of the strategic report this contains mainly basic compliance disclosures.
The strategic report is required to include:
• a fair review of the company’s business, including (for quoted companies) elements such as a description of the company’s business model, its strategy and information about corporate social responsibility (see sections 4 and 5 for more details);
• to the extent necessary for an understanding of the development, performance or position of the company, analysis using financial and, where appropriate, non‑financial KPIs (see section 3 for more details); and
• a description of the principal risks and uncertainties facing the company. The UK Corporate Governance Code and associated guidance also contains requirements in this area (see section 6 for more details).
Also, many companies choose to present the longer term viability statement and going concern disclosures required by the 2014 Code as part of their strategic report (see section 7 for more details).
The FRC Guidance includes a lot of information for companies on how to present the content requirements of the strategic report most effectively. An updated version of the FRC Guidance is open for consultation at the time of writing. It reflects the new requirements of the EU NFR Directive (see below) and enhances the link between the purpose of the strategic report and the matters directors should have regard to under section 172 of the Companies Act 2006.
The <IR> Framework also gives guidance on reporting requirements that will be helpful to UK companies. However, the <IR> Framework goes further than this, introducing the concept of ‘Integrated Thinking’ – challenging and enabling companies to ‘live their story’ rather than merely tell it. Integrated reporting (<IR>) is discussed in more detail throughout this report – look out for the <IR> boxes.
Listed companies have been getting to grips with ESMA’s Guidelines on Alternative Performance Measures9 (APMs) this past year. These guidelines apply to a variety of documents but, in particular, include within their scope the narrative sections of annual reports (but not the financial statements themselves). Although they are described as ‘Guidelines’, ESMA has stated that they expect compliance with them to be enforced by national regulators. In a UK context the FRC has issued ESMA Guidelines on Alternative Performance Measures: Frequently Asked Questions10, which indicate that they are considering material inconsistencies with the ESMA Guidelines as part of the activities of their Conduct Committee, i.e. reviews of company annual reports. Deloitte has produced a practical guide to the ESMA Guidelines11 to assist preparers in complying with the new requirements. Similarly, ESMA itself has issued a set of Q&As in relation to its Guidelines12.
The Guidelines apply to documents published on or after 3 July 2016. They set out a framework for the presentation of APMs, also known as non‑GAAP measures, aimed at promoting their usefulness and transparency. In particular, they require that:
• APMs should be defined and the basis of calculation set out;
• APMs should be reconciled to the most directly reconcilable line item, subtotal or total presented in the financial statements;
• APMs should not be displayed with more prominence, emphasis or authority than the most directly comparable measure defined by the entity’s financial reporting framework;
79
Appendix 4 – Regulatory overview
• APMs should be accompanied by comparatives for the corresponding previous period; and
• APMs should be consistent over time, with changes in or the cessation of use of an APM explained.
Our findings on the presentation of APMs are discussed in section 3.
2016 was the first year that companies needed to publish a slavery and human trafficking statement, as required by the Modern Slavery Act 201513, although this does not need to be included in the annual report (unless the information is material and otherwise required under the above strategic report requirements). 59% of the companies we surveyed this year talked about modern slavery in some form in their annual report (see section 5).
New requirementsThe UK implementation of the EU Directive on disclosure of non‑financial and diversity information (EU NFR Directive) is effective for financial years beginning on or after 1 January 2017 . The way it has been implemented into UK law means that there are two similar, but different, sets of requirements operating in parallel for quoted companies, which leads to some complexity. They are:
1. the existing requirements of s414C of the Act regarding the contents of a strategic report, as set out above; and
2. the new requirement to produce a non‑financial information statement set out in the new s414CA and s414CB of the Act.
The scope of (1) remains as before. The requirement to produce a non‑financial information statement applies to all companies that are:
a. public‑interest entities, as defined by EU law (which includes all companies with debt or equity listed on a regulated market, such as the LSE main market); and
b. parents of a group with more than 500 employees.
Large quoted companies will fall into (1) and (2), smaller quoted companies will fall into (1) but not (2), and large unquoted banking and insurance companies will be included in (2) but not (1), if they have more than 500 employees.
The requirements of both (1) and (2) are similar but not identical so companies will need to be careful that they include all the relevant elements that apply to them. For large quoted companies, the non‑financial information statement builds on the existing requirements of the strategic report by introducing specific requirements to disclose information on anti‑corruption and bribery matters (including related policies) and to explain the impact of and risks relating to various non‑financial reporting matters. Disclosure will not need to be duplicated – there are exemptions from some of the existing requirements for companies which are required to apply the new ones as well.
We looked at whether companies are already taking on board the requirement to discuss anti‑corruption and bribery matters. Our findings are in section 5 (on stakeholder engagement).
Other additional reporting requirements for companies, aimed to increase transparency, have been finalised:
• gender pay gap reporting came into force on 6 April 2017 with the first disclosures being required by 4 April 201815;
• payment practices and performance disclosure needs to be made by large companies for years commencing on or after 6 April 201716; and
• large companies need to disclose their tax strategy17 before the end of their first financial year commencing on or after 15 September 2016, when the Finance Act received Royal Assent.
Publication of all the above is required to be on a website rather than as part of a company’s annual report. However, where issues in these areas are material to the business, companies will need to consider whether disclosure should also be provided to meet the above requirements of the strategic report. We looked at the extent to which companies are deciding to include this information in their annual report (see section 5).
80
Appendix 4 – Regulatory overview

Areas of regulatory focusThe following areas of regulatory focus have been identified in relation to narrative reporting.
• Presentation of non‑GAAP measures is a significant focus area given the new requirements introduced by the ESMA Guidelines. In addition, the identification of items excluded from non‑GAAP measures (often described as ‘exceptional items’) is also likely to be an area of continued focus – see the Financial statements section of this appendix for more detail.
• The business review included within the strategic report should be fair, balanced and comprehensive. This includes balancing analyses that use non‑GAAP measures with analyses that use unadjusted metrics and ensuring discussions of performance and position are suitably comprehensive and not omitting ‘bad news’. Companies should also ensure that they cover all relevant aspects of both financial position and performance in this review.
• A number of suggestions for improvement of disclosure of business models were made in the FRC’s Financial Reporting Lab’s report in 2016. Companies should, therefore, expect more scrutiny in this area.
• Identification of principal risks and uncertainties. Companies should ensure that the risks and uncertainties disclosed are genuinely principal and make sure they discuss how risks are managed or mitigated. Linkage between risks and strategic objectives and KPIs has been specifically highlighted as needing to be clearly disclosed. There is a particular focus on those systemic risks such as Brexit and cyber risk.
• Identification of key performance indicators (KPIs). Companies should consider whether ratios that are discussed prominently in the strategic report should be identified as KPIs, and that where non‑GAAP measures are identified as KPIs the information required by the ESMA Guidelines is given.
• Disclosure of dividend policy and practice (i.e. how the policy is applied in taking decisions to declare dividends) will be an area of focus, especially after the FRC’s Financial Reporting Lab report (published in December 2016) made a number of suggestions to improve disclosure.
• The linkage and consistency of the information included in the ‘front half’ and ‘back half’ of the annual report. Companies should ensure that there is cohesion between the information reported and effective linkage throughout the annual report. For example, consistency would be expected between the items identified as part of capital when discussing capital management in the front and back halves of the report. Similarly, the description of reconciling items in a company’s tax note should be consistent with discussions in the strategic report.
• The impact of the EU referendum decision has been highlighted as an area where the FRC expects to see more detailed disclosure as the economic and political effects become more certain in the medium and longer term.
On the horizonThe FRC will be publishing updated Guidance on the Strategic Report. This will reflect the government’s agenda for corporate governance reform, placing emphasis on the conduct of business and, amongst other things, giving employees, customers and wider stakeholders a greater voice. It will strengthen the link between s172 of the Companies Act 2006 and the strategic report to help the report provide greater insight into whether boardroom decisions have taken wider stakeholder interests into account18. Although not currently a specific reporting requirement, we saw 17 companies referring to the requirements of s172, in particular the need to have regard to certain matters whilst promoting the success of the company for the benefit of its members as a whole. The updated Guidance will also reflect the new disclosure requirements arising from the UK implementation of the EU NFR Directive.
81
Appendix 4 – Regulatory overview
This past year there have been no new formal requirements for companies and focus has instead been on areas being explored by the Financial Reporting Council (the FRC) for the purpose of improved communication between companies and investors, in particular culture and succession planning.
Boardroom diversity, which is subject to additional reporting requirements under the Disclosure Guidance and Transparency Rules changes reflecting the Non‑Financial Reporting Directive, has also been an area of substantial public focus.
Existing requirementsListed companies are required by the Listing Rules to make certain disclosures about corporate governance in their annual reports. Companies with a premium listing are required to state how they have applied the main principles set out in the UK Corporate Governance Code19 (the Code) issued by the FRC. This should be sufficient to enable shareholders to evaluate how the principles have been applied. They are also required to make a statement of compliance throughout the year with all relevant Code provisions, identifying provisions that have not been complied with and explaining their reasons for this non‑compliance. The FRC has issued guidance20 on what constitutes a meaningful explanation. The Listing Rules also require certain disclosures regarding certain provisions of the Code, including those on the preparation of financial statements on a going concern basis and the preparation of a longer term viability statement.
During the period covered by this year’s survey, companies had to report on their compliance with the 2014 Code, which is supported by the FRC’s Guidance on Board Effectiveness21, Guidance on Risk Management, Internal Control and Related Financial and Business Reporting22, and by the Guidance on Audit Committees23. The Guidance on Audit Committees was re‑issued in June 2016 to accompany the 2016 version of the Code and some companies have started to apply the best practice recommendations laid out in the new Guidance. The FRC’s guidance documents include recommendations regarding disclosure in the annual report.
The main components of a company’s corporate governance report are:
• a statement on how the company has applied the main principles of the Code and a statement of compliance with the detailed provisions of the Code, often with an introduction from the Chairman of the board focusing on the principles of accountability and effectiveness (see section 8 for more details);
• statements on the robust assessment of principal risks and the longer term viability statement, which some companies include as part of their corporate governance report, although the majority have presented these as part of their strategic report (see section 8 for more details);
• a report on the work of the audit committee, in particular its role in oversight of effectiveness of risk management and internal control systems, in assuring the integrity of the company’s financial reporting, such as its detailed consideration and challenge of management regarding the significant issues affecting the financial statements, and in its oversight of relationships with both internal audit and the external auditor, covering effectiveness and scope and (for the external auditor) tendering and non‑audit services; and
• reports from the other significant board committees, in particular the nomination committee regarding succession and diversity (see section 9 for more details), the remuneration committee and, where constituted, the risk committee.
Quoted companies reporting under the Act are required to include a directors’ remuneration report. This report must contain a statement by the chair of the remuneration committee telling the story of the year in respect of remuneration. The report is split into a policy report, which is not subject to audit and is not required to be presented in full in years where there will not be a vote on the company’s remuneration policy, and an annual report on remuneration, some elements of which are subject to audit. The policy report is subject to a binding shareholder vote every three years, or whenever the policy is to change. The annual report on remuneration is subject to an annual advisory vote and includes a “single figure” directors’ remuneration table. The GC100 and Investor Group has published guidance on these requirements, which was updated in August 201624.
Corporate governance
82
Appendix 4 – Regulatory overview

New requirementsFor financial periods commencing on or after 17 June 2016, the 2016 Code replaced the 2014 Code. The changes are minimal, with only a few amendments to section C.3:
• the audit committee as a whole will be required to have competence relevant to the sector in which the company operates;
• the Code provision on audit tendering for FTSE 350 companies has been removed; and
• the audit committee report will be required to provide advance notice of plans to retender the external audit.
Alongside the 2016 Code, a revised version of the FRC’s Guidance on Audit Committees was published, reflecting best practice developments and proposing a number of new audit committee actions and disclosures. A new FRC Ethical Standard for Auditors also became effective for periods commencing on or after 17 June 2016, which places additional restrictions on the non‑audit services that can be provided by the external auditor.
With the UK implementation of the revised EU Auditing Directive and Regulation also completed by 17 June 2016, all listed companies and other companies falling within the definition of an EEA Public Interest Entity (PIE) are now required to tender their audit at least every 10 years, with a change of auditor required at least every 20 years.
Non‑financial reporting changesUpdates to the Disclosure Guidelines and Transparency Rules (the DTR), reflecting the diversity requirements of the EU NFR Directive, come into effect for periods commencing on or after 1 January 2017.
These require companies within scope – public interest entities with at least 500 employees in the company or the group headed by the company – to describe their diversity policy in relation to the board, including aspects such as age, gender, geographical diversity and educational and professional background, in the corporate governance statement. As well as describing the policy, or providing a clear explanation if no such policy exists, they must explain the objectives of the policy, how it has been implemented and the results of the policy in the reporting period. Where this information is incorporated into existing disclosures outside the corporate governance statement, a suitable cross‑reference should be provided.
Areas of regulatory focusCorporate governance is currently an area of substantial focus for Government, regulators such as the FRC, and investors along with their representative organisations. Some of the areas that the regulator is focusing on include:
• The quality of explanations given where a company does not comply with one or more provisions of the Code. In January 2017, the FRC noted that, “overall, too many explanations of non‑compliance are of poor quality.”25 It went on to explain that the features of a good explanation for departure from a Code provision are that it should “set out the background, provide a clear rationale for the action being taken, and describe any mitigating activities. In addition, where deviation from a particular provision is intended to be limited in time, the explanation should indicate when the company expects to meet the provision.”
• Constructive reporting on longer term viability statements in line with the spirit of the Code. The FRC has called for more comprehensive reporting, including a clear rationale for the choice of timeframe, what qualifications and assumptions were made, and how the underlying analysis was performed. This has also been an area of focus for the investor community. The Investment Association has published Guidelines26 on Viability Statements and the FRC has encouraged investors to engage with companies to stem the risk of the viability statement becoming “boilerplate” reporting.
• More clarity and brevity in remuneration reporting with attention paid to the GC100 and Investor Group’s Guidelines (mentioned above). These encourage a clearer link between remuneration and strategy and clarification of items in the remuneration policy to be included in the single total figure of remuneration.
83
Appendix 4 – Regulatory overview
• Informative detail in the audit committee report about the actions the audit committee has taken, in particular the significant issues relating to the financial statements and interactions between the audit committee and the FRC’s Corporate Reporting Review team or the review of the company’s audit by the FRC’s Audit Quality Review team.
• Succession planning and corporate culture disclosures have each been the subject of recent FRC projects and are likely to feature in the update to the UK Corporate Governance Code later in 2017 (see ‘On the horizon’ below).
• The FRC is encouraging companies and investors to consider where disclosure may be required on areas of risk such as Brexit.
On the horizonCorporate governance reformThe Government is planning to introduce certain corporate governance reform initiatives, including some affecting corporate reporting. These will be introduced through a number of different mechanisms including secondary legislation, changes to the UK Corporate Governance Code and other industry‑led solutions.
The proposals relating to corporate reporting include:
1. Requirements for quoted companies to:
• report annually the ratio of CEO pay to the average pay of their UK workforce together with a narrative explaining changes in the ratio from year to year and setting the ratio in the context of pay and conditions across the wider workforce; and
• provide a clearer explanation in their remuneration policies of a range of potential outcomes from complex, share‑based incentive schemes.
2. Requirements for all companies of significant size (both public and private – suggested to be a threshold of 1,000 employees but will be subject to further consideration) to explain how their directors comply with the requirements of section 172 of the Companies Act 2006 to have regard to employee interests and to fostering relationships with suppliers, customers and others – this is in line with the FRC’s proposals in its updated Guidance on the Strategic Report, currently under consultation.
3. Requirements for all companies of a significant size to disclose their corporate governance arrangements in their directors’ report and on their website, including whether they follow any formal code. The Government’s initial view is that these requirements should apply to companies with more than 2,000 employees. A similar requirement for Limited Liability Partnerships of similar scale will also be considered. The current intention is to bring the reforms into effect by June 2018 to apply to company reporting years commencing on or after that date.
Code amendmentsThe FRC intends to consult on amendments to the UK Corporate Governance Code in the late Autumn, to be accompanied by updated Guidance on Board Effectiveness. Recent hot topics such as succession planning, corporate culture and diversity are likely to be included, along with updates reflecting the requests of Government and the tone of corporate governance reform, such as the importance of integrity.
84
Appendix 4 – Regulatory overview

No major changes in IFRSs came into force for the reports covered by our survey this year. Listed groups are required to prepare consolidated accounts under IFRSs as adopted by the EU and this will remain the case for the foreseeable future, despite the outcome of the referendum on the UK’s membership of the EU. Listed entities that are not parent companies, such as many investment trusts, can also choose to prepare financial statements using FRS 102 The Financial Reporting Standard applicable in the UK and Republic of Ireland (FRS 102).
The separate financial statements of a ‘qualifying entity’ can be prepared under FRS 101 Reduced Disclosure Framework (FRS 101), which closely reflects IFRS accounting but with reduced disclosures. If eligible, this may be an attractive option for many parent companies’ separate financial statements and for their subsidiaries. Another option is to apply FRS 102 with reduced disclosure. There is no longer a requirement for companies applying FRS 101 or 102 to notify their shareholders in writing.
New requirementsBelow is a list of the new IFRS requirements coming into force for financial years ending between September 2017 and August 2018 (depending in some cases on whether IFRSs as endorsed by the EU or as issued by the IASB are being applied). Hyperlinks to further information are included in the table.
Title
As issued by the IASB, mandatory for accounting periods starting on or after
Per the EU adopting regulation, mandatory for accounting periods starting on or after
Annual Improvements to IFRSs: 2014‑16 Cycle (Dec 2016) – IFRS 12 amendments
1 January 2017 TBC
Amendments to IAS 7 ( Jan 2016) – Disclosure Initiative 1 January 2017 TBC
Amendments to IAS 12 ( Jan 2016) – Recognition of Deferred Tax Assets for Unrealised Losses
1 January 2017 TBC
Areas of regulatory focusIn relation to financial statements, significant areas of regulatory focus at the moment include the following:
• Complete and distinct disclosures of critical judgements and key sources of estimation uncertainty. Companies are required to distinguish between critical judgements and key sources of estimation uncertainties and provide separate disclosures of these. Only sources of estimation uncertainty that have significant risk of resulting in a material adjustment to the carrying amount of assets and liabilities within the next financial year should be disclosed. Complete disclosures include sensitivities in relation to the estimation uncertainties and the range of reasonably possible outcomes.
• Various accounting issues relating to pensions, in particular:
– having quantified information about the level of funding of the pension scheme in future years; – clearly identifying and explaining risks inherent in the investment strategy, describing assets used in liability‑driven investment strategies, including sensitivity analyses and discussing interaction of assumptions;
– whether future committed contributions are in excess of any deficit recognised and, if so, whether this means any additional liability should be recognised;
– whether companies have a detailed and specific accounting policy and whether any critical judgements and key sources of estimation uncertainty are disclosed; and
– whether the strategic report describes significant risks and uncertainties relating to pensions.
Financial statements
85
Appendix 4 – Regulatory overview

• Tax accounting and disclosures remain a significant area of focus, in particular:
– narrative around tax strategy, policy and governance; – the completeness of disclosures of uncertain tax positions and the risk of material change in the tax liability; – identifying the effective tax rate and discussing what factors might affect that rate in future; – explanation of major reconciling items between profit before tax multiplied by an appropriate tax rate and the total tax charge, including distinguishing non‑recurring items from those expected to arise each year; and
– using an appropriate tax rate in the tax reconciliation and not simply defaulting to the domestic tax rate, e.g. where there are significant multi‑jurisdictional operations.
• Disclosures relating to forthcoming major new IFRSs: as implementation of IFRSs, 9, 15 and 16 draws closer, disclosures will need to become more specific and granular concerning the expected effects and how the company is addressing implementation. When the financial impact is known or reasonably estimable, disclosures will need to include quantification.
• The identification of “exceptional”, “non‑recurring” or similar items remains an area of focus, with challenge to be expected where similar amounts recur year on year.
• Disclosure of accounting policies should avoid unnecessary repetition of information, boilerplate or irrelevant items. Accounting policies should not be provided for items or transactions that are immaterial, non‑existent or no longer relevant.
• Correct accounting for and disclosure of business combinations. Care should be taken to distinguish between asset acquisitions and business combinations, to identify arrangements that are remuneration rather than consideration and not to inappropriately aggregate disclosures for different business combinations.
• Revenue recognition policies should be clear and tailored to reflect a company’s different revenue streams, giving suitable company‑specific detail rather than boilerplate.
• The impact of a low interest rate environment and uncertainties around the macro‑economic environment mean that scrutiny can be expected on issues such as impairments, recognition of deferred tax assets and fair value measurements.
86
Appendix 4 – Regulatory overview
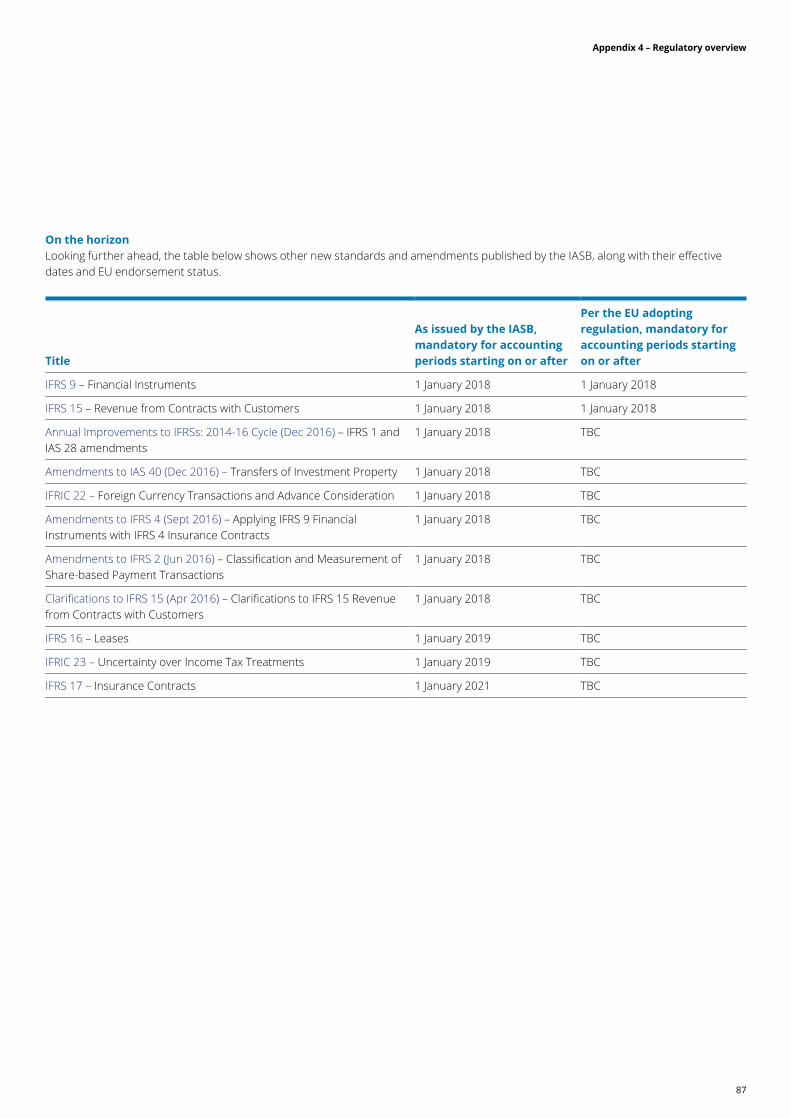
On the horizonLooking further ahead, the table below shows other new standards and amendments published by the IASB, along with their effective dates and EU endorsement status.
Title
As issued by the IASB, mandatory for accounting periods starting on or after
Per the EU adopting regulation, mandatory for accounting periods starting on or after
IFRS 9 – Financial Instruments 1 January 2018 1 January 2018
IFRS 15 – Revenue from Contracts with Customers 1 January 2018 1 January 2018
Annual Improvements to IFRSs: 2014‑16 Cycle (Dec 2016) – IFRS 1 and IAS 28 amendments
1 January 2018 TBC
Amendments to IAS 40 (Dec 2016) – Transfers of Investment Property 1 January 2018 TBC
IFRIC 22 – Foreign Currency Transactions and Advance Consideration 1 January 2018 TBC
Amendments to IFRS 4 (Sept 2016) – Applying IFRS 9 Financial Instruments with IFRS 4 Insurance Contracts
1 January 2018 TBC
Amendments to IFRS 2 (Jun 2016) – Classification and Measurement of Share‑based Payment Transactions
1 January 2018 TBC
Clarifications to IFRS 15 (Apr 2016) – Clarifications to IFRS 15 Revenue from Contracts with Customers
1 January 2018 TBC
IFRS 16 – Leases 1 January 2019 TBC
IFRIC 23 – Uncertainty over Income Tax Treatments 1 January 2019 TBC
IFRS 17 – Insurance Contracts 1 January 2021 TBC
87
Appendix 4 – Regulatory overview

Regulatory overview endnotes1. http://www.iasplus.com/en‑gb/news/2014/06/frc‑strategic‑report‑guide
2. https://www.iasplus.com/en‑gb/news/2015/12/frc‑narrative‑reporting‑report
3. https://www.iasplus.com/en‑gb/publications/uk/need‑to‑know/2017/ntk‑ec‑guidelines‑eu‑nfrd
4. https://www.iasplus.com/en‑gb/publications/uk/need‑to‑know/2017/need‑to‑know‑frc‑publishes‑consultation‑on‑amendments‑to‑its‑guidance‑on‑the‑strategic‑report
5. http://www.iasplus.com/en‑gb/news/2015/07/fr‑lab‑business‑model‑reporting
6. http://www.iasplus.com/en‑gb/news/2015/11/frc‑lab‑dividend‑policy‑and‑practice
7. https://www.frc.org.uk/getattachment/fd3054ee‑b0f3‑4968‑8b20‑d5bb262c4c54/Digital‑Future_final.pdf
8. http://www.iasplus.com/en‑gb/news/2015/06/esma‑apm
9. http://www.iasplus.com/en‑gb/news/2015/06/esma‑apm
10. http://www.iasplus.com/en‑gb/news/2016/05/frc‑apm
11. http://www.iasplus.com/en‑gb/publications/uk/need‑to‑know/2016/ntk‑apms
12. https://www.iasplus.com/en‑gb/news/2017/07/esma‑apm‑q‑a
13. http://www.iasplus.com/en‑gb/publications/corporate‑governance/governance‑in‑brief/gib‑modern‑slavery‑act
14. https://www.iasplus.com/en‑gb/publications/uk/need‑to‑know/2017/ntk‑non‑financial‑reporting‑regulations
15. https://www.iasplus.com/en‑gb/news/2017/04/gender‑pay‑gap‑duty‑to‑report
16. https://www.iasplus.com/en‑gb/news/2017/04/gender‑pay‑gap‑duty‑to‑report
17. https://www.iasplus.com/en‑gb/publications/corporate‑governance/governance‑in‑brief/gib‑tax‑strategy
18. www.frc.org.uk/News‑and‑Events/FRC‑Press/Press/2017/August/FRC‑consults‑on‑non‑financial‑reporting‑guidance.aspx
19. https://www.frc.org.uk/directors/corporate‑governance‑and‑stewardship/uk‑corporate‑governance‑code
20. https://www.frc.org.uk/getattachment/a39aa822‑ae3c‑4ddf‑b869‑db8f2ffe1b61/what‑constitutes‑an‑explanation‑under‑comply‑or‑exlpain.pdf
21. https://www.frc.org.uk/getattachment/11f9659a‑686e‑48f0‑bd83‑36adab5fe930/Guidance‑on‑board‑effectiveness‑2011.pdf
22. https://www.frc.org.uk/getattachment/d672c107‑b1fb‑4051‑84b0‑f5b83a1b93f6/Guidance‑on‑Risk‑Management‑Internal‑Control‑and‑Related‑Reporting.pdf
23. https://www.frc.org.uk/getattachment/6b0ace1d‑1d70‑4678‑9c41‑0b44a62f0a0d/Guidance‑on‑Audit‑Committees‑April‑2016.pdf
24. https://uk.practicallaw.thomsonreuters.com/Link/Document/Blob/Ib127ccfd606f11e698dc8b09b4f043e0.pdf?targetType=PLC‑multimedia&originationContext=document&transitionType=DocumentImage&uniqueId=08a8fab8‑97f7‑4a54‑8459‑1f8f28b8a196&contextData=(sc.Default)
25. Developments in Corporate Governance and Stewardship 2016, https://www.frc.org.uk/getattachment/ca1d9909‑7e32‑4894‑b2a7‑b971b4406130/Developments‑in‑Corporate‑Governance‑and‑Stewardship‑2016.pdf
26. https://www.ivis.co.uk/media/12490/Guidance‑viability‑statements‑final2.pdf
88
Appendix 4 – Regulatory overview

For more information visit www.deloitte.co.uk/annualreportingsights. If you would like advice on specific application of principles set out in this publication, or would like to meet with us to discuss your reporting issues, please contact your local Deloitte partner or:
Veronica PooleGlobal IFRS Leader and UK Head of Corporate Reporting+44 20 7007 [email protected]
Peter WestawayDirector+44 20 7007 [email protected]
Amanda SwaffieldDirector+44 20 7303 [email protected]
Contacts
89
Annual report insights 2017 | Surveying FTSE reporting

1. https://www2.deloitte.com/global/en/pages/about‑deloitte/articles/purpose‑2030‑good‑business‑better‑future.html#
2. Companies Act 2006 Section 172 Duty to promote the success of the company
3. www.frc.org.uk/Our‑Work/Publications/Accounting‑and‑Reporting‑Policy/Invitation‑to‑comment‑Draft‑Amendments‑to‑Strateg.pdf
4. https://www.frc.org.uk/getattachment/962031c1‑5282‑4324‑b5be‑af2a87615445/Bulletin‑Compendium‑of‑Illustrative‑Auditors‑Reports‑(1)‑Oct‑2016.pdf
5. https://www.esma.europa.eu/press‑news/esma‑news/esma‑publishes‑final‑guidelines‑alternative‑performance‑measures
6. https://www.esma.europa.eu/press‑news/esma‑news/esma‑publishes‑new‑qa‑alternative‑performance‑measures‑guidelines
7. Companies Act 2006 (s172)
8. http://www.frc.org.uk/Our‑Work/Publications/Financial‑Reporting‑Lab/FRC‑Lab‑Business‑model‑disclosure.pdf
9. https://frc.org.uk/document‑library/financial‑reporting‑lab/2015/lab‑project‑report‑disclosure‑of‑dividends‑%E2%80%93‑poli
10. http://integratedreporting.org/wp‑content/uploads/2013/12/13‑12‑08‑THE‑INTERNATIONAL‑IR‑FRAMEWORK‑2‑1.pdf
11. Companies Act 2006 (s172)
12. www.frc.org.uk/News‑and‑Events/FRC‑Press/Press/2017/August/FRC‑consults‑on‑non‑financial‑reporting‑guidance.aspx
13. https://www.iasplus.com/en‑gb/publications/corporate‑governance/governance‑in‑brief/gib‑payment‑practices
14. https://www.iasplus.com/en‑gb/publications/corporate‑governance/governance‑in‑brief/gib‑modern‑slavery‑act
15. Companies Act 2006 (s414C(7)(b)
16. Companies, Partnerships and Groups (Accounts and Non‑Financial Reporting) Regulations 2016 (SI 2016/1245)
17. https://sustainabledevelopment.un.org/post2015/transformingourworld for further information
18. https://www.iasplus.com/en‑gb/news/2017/04/gender‑pay‑gap‑duty‑to‑report
19. www.frc.org.uk/Our‑Work/Publications/Corporate‑Governance/Guidance‑on‑Risk‑Management,‑Internal‑Control‑and.pdf
20. https://www.frc.org.uk/Developments‑in‑Corporate‑Governance‑and‑Stewardship‑2016
21. www.frc.org.uk/News‑and‑Events/FRC‑Press/Press/2017/August/FRC‑consults‑on‑non‑financial‑reporting‑guidance.aspx
22. www.ivis.co.uk/media/12490/Guidance‑viability‑statements‑final2.pdf
23. https://www.frc.org.uk/Our‑Work/Publications/Corporate‑Governance/Corporate‑Culture‑and‑the‑Role‑of‑Boards‑Report‑o.pdf
24. https://publications.parliament.uk/pa/cm201617/cmselect/cmbeis/702/70202.htm
25. www.frc.org.uk/Our‑Work/Corporate‑Governance‑Reporting/Corporate‑governance/UK‑Corporate‑Governance‑Code.aspx
26. www.frc.org.uk/Our‑Work/Publications/Corporate‑Governance/Feedback‑Statement‑Succession‑Planning‑Discussion.pdf
27. https://publications.parliament.uk/pa/cm201617/cmselect/cmbeis/702/70202.htm
28. https://www.handbook.fca.org.uk/handbook/DTR/7/2.html
29. https://ftsewomenleaders.com/
30. https://frc.org.uk/Our‑Work/Publications/Corporate‑Governance/Guidance‑on‑Audit‑Committees‑(2).pdf
31. https://www.frc.org.uk/auditors/audit‑assurance/standards‑and‑guidance/2016‑ethical‑standards
32. https://frc.org.uk/news/december‑2016/frc’s‑2017‑18‑thematic‑reviews‑expected‑to‑prompt
33. www.frc.org.uk/Our‑Work/Publications/Corporate‑Reporting‑Review/Corporate‑Reporting‑Thematic‑Review‑Tax‑Disclosur.pdf
34. https://www.iasplus.com/en‑gb/publications/uk/need‑to‑know/2017/ntk‑key‑judgements‑and‑estimates
35. https://www2.deloitte.com/uk/en/pages/tax/articles/tax‑transparency.html
Endnotes
90
Annual report insights 2017 | Surveying FTSE reporting

This publication has been written in general terms and we recommend that you obtain professional advice before acting or refraining from action on any of the contents of this publication. Deloitte LLP accepts no liability for any loss occasioned to any person acting or refraining from action as a result of any material in this publication.
Deloitte LLP is a limited liability partnership registered in England and Wales with registered number OC303675 and its registered office at 2 New Street Square, London EC4A 3BZ, United Kingdom.
Deloitte LLP is the United Kingdom affiliate of Deloitte NWE LLP, a member firm of Deloitte Touche Tohmatsu Limited, a UK private company limited by guarantee (“DTTL”). DTTL and each of its member firms are legally separate and independent entities. DTTL and Deloitte NWE LLP do not provide services to clients. Please see www.deloitte.com/about to learn more about our global network of member firms.
© 2017 Deloitte LLP. All rights reserved.
Designed and produced by The Creative Studio at Deloitte, London. J13066