annual report - gubretas
TRANSCRIPT

2013
ANNUAL REPORT
GÜBRE FABRİKALARI TÜRK A. Ş.
ESENTEPE, KASAP SOKAK, NO: 22, 34394 ŞİŞLİ/İSTANBUL
T: (+90 212) 376 50 27
F: (+90 212) 272 56 78

2013 OPERATING REVIEW REPORT| 1
I. INTRODUCTION ................................................................................................................................................. 2
A. REPORTING PERIOD .............................................................................................................................................. 2
B. CORPORATE’S NAME ............................................................................................................................................ 2
C. BOARD OF DIRECTORS .......................................................................................................................................... 2
D. TOP MANAGEMENT .............................................................................................................................................. 2
E. CAPITAL STRUCTURE............................................................................................................................................. 3
F. INFORMATION ABOUT OUR FACILITIES ................................................................................................................ 3
G. AFFILIATES AND SUBSIDIARIES ............................................................................................................................. 4
H. DISTRIBUTION OF DIVIDENDS ............................................................................................................................... 6
İ. PERFORMANCE OF THE STOCK ............................................................................................................................. 6
II. TURKISH FERTILIZER INDUSTRY AND POSITION OF GÜBRETAŞ .......................................................................... 7
A. TURKISH FERTILIZER SECTOR PRODUCTION.......................................................................................................... 7
B. TURKISH FERTILIZER SECTOR SALES ...................................................................................................................... 8
III. GÜBRE FABRİKALARI T.A.Ş. ACTIVITIES .............................................................................................................. 9
A. PRODUCTION ........................................................................................................................................................ 9
B. SALES AND PURCHASES ...................................................................................................................................... 10
C. INVESTMENTS ..................................................................................................................................................... 12
D. RESEARCH AND DEVELOPMENT ACTIVITIES ....................................................................................................... 12
E. ADMINISTRATIVE ACTIVITIES .............................................................................................................................. 13
IV. ACTIVITIES OF RAZİ PETROCHEMICAL CO. .........................................................................................................15
A. PRODUCTION ...................................................................................................................................................... 15
B. SALES .................................................................................................................................................................. 15
C. INVESTMENTS ..................................................................................................................................................... 16
V. FINANCIAL STRUCTURE .....................................................................................................................................17
A. BALANCE SHEET ASSETS-TRL ............................................................................................................................... 17
B. BALANCE SHEET LIABILITY-TRL ............................................................................................................................ 18
C. INCOME STATEMENT-TRL ................................................................................................................................... 19
D. RATIOS ................................................................................................................................................................ 20
VI. EVENTS AFTER BALANCE SHEET DATE ...............................................................................................................20
VII. CORPORATE GOVERNANCE PRINCIPLES COMPLIANCE REPORT ........................................................................21
A. SECTION I – SHAREHOLDERS ............................................................................................................................... 21
B. SECTION II – PUBLIC DISCLOSURE AND TRANSPARENCY ..................................................................................... 23
C. SECTION III – STAKEHOLDERS ............................................................................................................................. 24
D. SECTION IV – BOARD OF DIRECTORS ................................................................................................................... 27
VIII. CONCLUSION ....................................................................................................................................................46

2013 OPERATING REVIEW REPORT| 2
I. INTRODUCTION
A. REPORTING PERIOD
01.01.2013 - 31.12.2013
B. CORPORATE’S NAME
Gübre Fabrikaları Türk Anonim Şirketi (Gübretaş)
C. BOARD OF DIRECTORS
Title Name Start date of employment
Chairman Abdullah KUTLU 19.04.2011
Vice Chairman Necdet DİRİK 25.10.2005
Member Dr. Erol DEMİR 10.04.2009
Member Ahmet BOYRAZ 26.04.2012
Member Ali SARI 31.07.2012
Member Hamdi GÖNÜLLÜ 20.09.2012
Member Osman BALTA 01.02.2012
Independent Member Prof. Dr. Lokman DELİBAŞ 26.04.2012
Independent Member İsmail TEKİN 26.04.2012
The members of Board of Director belong benefits which are noted in Articles of
Association and Turkish Commercial Code.
D. TOP MANAGEMENT
Title Name Start date of employment
General Manager Osman BALTA 01.02.2012
Assistant General Manager (Administration & Financing)
Ferhat ŞENEL 09.02.2004
Assistant General Manager (Sales & Marketing)
Tahir OKUTAN 20.01.2006
Assistant General Manager (Supply Chain & Purchasing)
İsmail BABACAN 22.06.2009
Assistant General Manager (Facilities)
Yakup GÜLER 01.03.2012

2013 OPERATING REVIEW REPORT| 3
E. CAPITAL STRUCTURE
As of 31.12.2013 registered capital of the company is 200.000.000 TRL and paid capital is
334.000.000 TRL.
Tablo 1 : CAPITAL STRUCTURE
Shareholders Share Amount -TRL Share
Central Union of Turkish Agricultural Credit Cooperatives 253.673.000 75,95%
Other 80.327.000 24,05%
Total 334.000.000 100,00%
F. INFORMATION ABOUT OUR FACILITIES
Our Company reached a total real estate area of 340.634 m², out of which is 134.372 m²
closed area including warehouses, business buildings and lands, convenient to be improved.
Yarımca Facilities has 685.000 tons/year fertilizer production capacity, İzmir Facilities has
25.000 tons/year liquid and powder fertilizer production capacity, Gübretaş has 710.000 tons/year
fertilizer production capacity in total.
The total capacity of our warehouses is 368.000 tons.
Table 2 : REAL ESTATES
Office Closed Area m² Warehouses Closed
Area m²
Head Office 1.592 Kocaeli Yarımca Warehouses 22.381
Yarımca Facilities - Office 2.145 Samsun Warehouses 6.324
İzmir Facilities - Office 570 Kocaeli Köseköy Warehouses 6.664
Akçay - Office 180 İzmir Helvacı Warehouses 14.720
Ankara Office 120 İskenderun Akçay Warehouses 10.923
Samsun Office 210 İskenderun Sarıseki Warehouses 18.474
Total 4.817 Tekirdağ Warehouses 7.189
Production Facilities Closed Area m² İzmir Foça Warehouses 1.733
Kocaeli Yarımca Facilities 23.616
Total 88.408
İskenderun Facilities 15.581
İzmir Facilities 1.750 Grand Total 134.372 m²
Foça Facilities 200
Total 41.147

2013 OPERATING REVIEW REPORT| 4
Table 3 : GÜBRETAŞ FERTILIZER PRODUCTION CAPACITY
Yarımca Capacity-Tons
TSP 185.000
NPK 1 (Compound Fertilizer) 200.000
NPK 2 (Compound Fertilizer) 300.000
Total 685.000
İzmir Capacity-Tons
Liquid and Powder Fertilizer 25.000
Grand Total 710.000
Table 4 : GÜBRETAŞ WAREHOUSE CAPACITY-TONS
Region Capacity-Tons
Yarımca Warehouses 121.000
İskenderun Warehouses 119.000
İzmir Warehouses 65.000
Samsun Warehouses 30.000
Tekirdağ Warehouses 30.000
İzmir Liquid Warehouses 3.000
Total 368.000
G. AFFILIATES AND SUBSIDIARIES
Razi Petrochemical Co. (RAZI)
Razi Petrochemical Co., founded in 1968, is one of the leading companies in Iran which
produces fertilizers and fertilizer raw materials. Razi has 3.515.000 tons/year production capacity
of both fertilizers and fertilizer raw materials and exports most of its products.
Gübretaş with its 48,88% stake in Razi, started to disclose its financial reports on the
consolidated base since June 2008.
Razi Petrochemical Co.’s İstanbul based affiliate company Raintrade Petrokimya ve Dış
Ticaret A.Ş. manages Razi’s foreign trade. (Razi Petrochemical Co.’nun %100 sermayesine sahip
olduğu bağlı ortaklığı olan Raintrade Petrokimya ve Dış Ticaret A.Ş. İstanbul’da yerleşik olup, Razi
Petrochemical Co.’nun dış ticaret işlemlerini yürütmektedir.)

2013 OPERATING REVIEW REPORT| 5
In 2012, Razi Petrochemical Co. has purchased 87,5% of Arya Jonoob Co. (Arya), located on
the same site with Razi. Arya has started its operations in 2010 and has a phosphoric acid
production facility with a capacity of 126.000 tons/year. In 2013, Razi had 100% share of Arya
Phosphoric Jonoob Co. by purchasing the 12,5% remaining part of Arya. Thus, Arya Phosphoric
Jonoob Co. has became affiliate of Razi Petrochemical Co.
Negmar Denizcilik Yatırım A.Ş.
Established in 2008, Negmar Denizcilik Yatırım A.Ş. operates in shipping industry.
In addition, İstanbul Lines Denizcilik Yatırım A.Ş., operating in Ro-Ro shipping, and Etis
Lojistik A.Ş., operating in logistics business are also Negmar Denizcilik ve Yatırım A.Ş.’ affiliates.
Tarkim Bitki Koruma Sanayi ve Ticaret A.Ş.
Tarkim Bitki Koruma Sanayi ve Ticaret A.Ş., was established in 2009 and is operating in the
field of plant protection products. Tarkim has a production capacity of 12.000 tons/year.
İmece Prefabrik Yapı Tarım Makineleri Temizlik ve Güvenlik Hizmetleri San. Tic. A.Ş.
İmece Prefabrik Yapı Tarım Makineleri Temizlik ve Güvenlik Hizmetleri San. Tic. A.Ş., was
established in 1974, and since then it is operating in the reinforced concrete and steel structure
construction including construction services and mould production business.
Tarnet Tarım Kredi Bilişim ve İletişim Hizmetleri A.Ş.
Tarnet Tarım Kredi Bilişim ve İletişim Hizmetleri A.Ş., was established in 1996 and it
operates in Information Technology industry.
Table 5 : AFFILIATES
Company Name Share %
Razi Petrochemical Co. 48,88
Table 6: SUBSIDIARIES
Company Name Share %
Negmar Denizcilik Yatırım A.Ş. 40,00
Tarkim Bitki Koruma San. ve Tic. A.Ş. 40,00
Tarnet Tar. Kre.Bil .Hiz.San Tic .A.Ş. 17,00
İmece Pref. Yapı Tar.Mak.Tem.Güv. Hiz. San.Tic.A.Ş. 15,00

2013 OPERATING REVIEW REPORT| 6
H. DISTRIBUTION OF DIVIDENDS
Dividend rates that have been distributed in the last five years are shown in Table 7:
Table 7 : DISTRIBUTION OF DIVIDENDS AS PER YEAR
2012 2011 2010 2009 2008
- - - - -
İ. PERFORMANCE OF THE STOCK
Our shares, traded on the Istanbul Stock Exchange, closing prices of three month periods in
2013 are as follows:
02.01.2013 29.03.2013 28.06.2013 30.09.2013 31.12.2013
3,60 4,16 3,42 3,67 2,76
Graph 1 : PERFORMANCE OF THE STOCK

2013 OPERATING REVIEW REPORT| 7
II. TURKISH FERTILIZER INDUSTRY AND POSITION OF GÜBRETAŞ
Turkey does not have the raw material resources used in production of chemical fertilizers.
95% of main inputs such as natural gas, phosphate rock, potassium salts are procured from foreign
markets. International market conditions and exchange rates, due to dependence on foreign
markets, are major effects on our sector.
Graph 2 : FERTILIZER PRICES IN INTERNATIONAL MARKETS - FOB US$/TON
A. TURKISH FERTILIZER SECTOR PRODUCTION
Turkey produces intermediate goods and compound fertilizers; however, inputs for these
are imported since Turkey lacks the needed natural resources.
Table 8 : TURKISH FERTILIZER SECTOR PRODUCTION CAPACITY –TONS
Year 2013 2012 2011 2010 2009 2008
Capacity 5.714.000 5.714.000 5.714.000 5.474.000 5.474.000 5.553.200
Fertilizer production was 3.661.156 tons in 2012; however, at the end of year 2013 it drops
by 2,31% to 3.576.598 tons. Compound fertilizers represent 42,37% of total production.

2013 OPERATING REVIEW REPORT| 8
Graph 3 : TURKISH FERTILIZER PRODUCTION AND GÜBRETAŞ’ SHARE IN PRODUCTION
B. TURKISH FERTILIZER SECTOR SALES
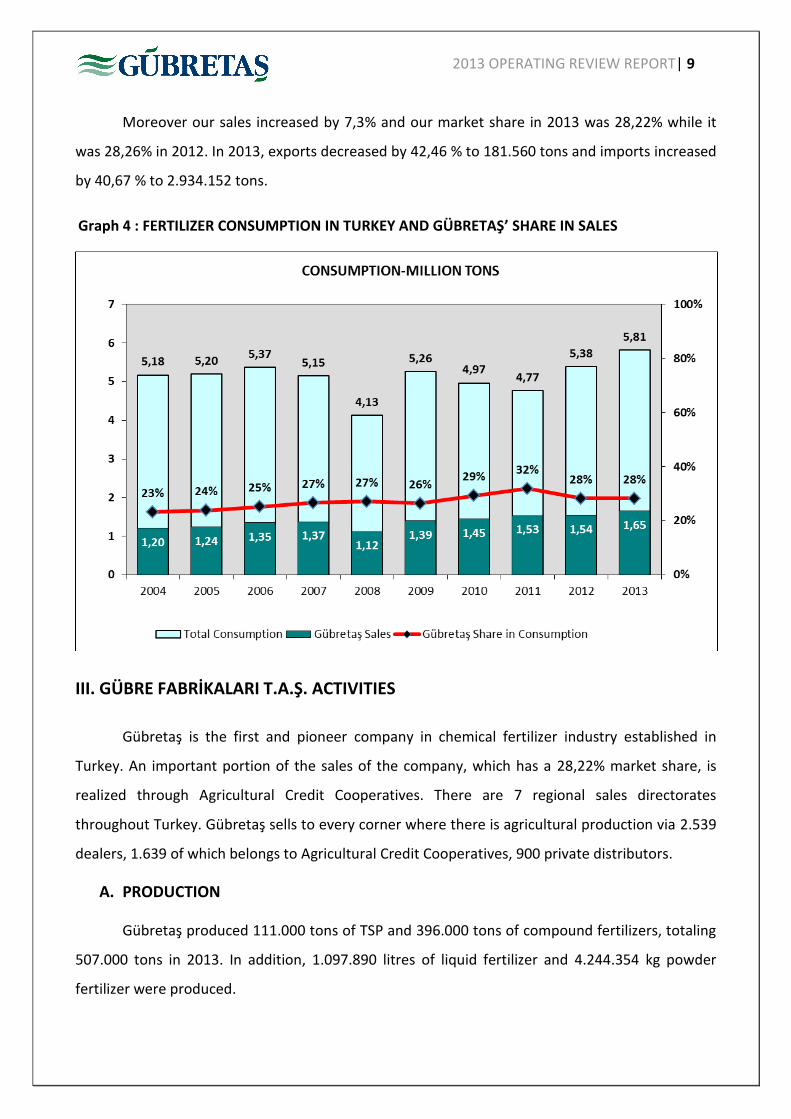
According to 2012 data, fertilizer consumption was 5.383.867 tons. In the end of 2013, this
figure has augmented to 5.813.612 tons, recording a 7,98% increase.
Table 9 : SECTOR SALES BY PRODUCT
Product 2013 2012 Change
COMPOUND 1.694.630 1.602.286 5,76%
AN 1.040.160 1.000.390 3,98%
UREA 1.100.864 887.792 24,00%
CAN 798.594 895.635 -10,83%
AS 499.101 468.292 6,58%
DAP 615.745 460.678 33,66%
P. NITRATE 22.700 25.865 -12,24%
TSP 26.166 24.222 8,03%
P. SULPHATE 13.707 15.719 -12,80%
NSP 1.945 2.988 -34,91%
Total 5.813.612 5.383.867 7,98%
2013 OPERATING REVIEW REPORT| 9
Moreover our sales increased by 7,3% and our market share in 2013 was 28,22% while it
was 28,26% in 2012. In 2013, exports decreased by 42,46 % to 181.560 tons and imports increased
by 40,67 % to 2.934.152 tons.
Graph 4 : FERTILIZER CONSUMPTION IN TURKEY AND GÜBRETAŞ’ SHARE IN SALES
III. GÜBRE FABRİKALARI T.A.Ş. ACTIVITIES
Gübretaş is the first and pioneer company in chemical fertilizer industry established in
Turkey. An important portion of the sales of the company, which has a 28,22% market share, is
realized through Agricultural Credit Cooperatives. There are 7 regional sales directorates
throughout Turkey. Gübretaş sells to every corner where there is agricultural production via 2.539
dealers, 1.639 of which belongs to Agricultural Credit Cooperatives, 900 private distributors.
A. PRODUCTION
Gübretaş produced 111.000 tons of TSP and 396.000 tons of compound fertilizers, totaling
507.000 tons in 2013. In addition, 1.097.890 litres of liquid fertilizer and 4.244.354 kg powder
fertilizer were produced.

2013 OPERATING REVIEW REPORT| 10
Solid fertilizer production increased by 5,29% in 2013 compared with 2012. Total fertilizer
production including solid, liquid and powder increased by 5,20% in 2013 compared with 2012.
416.681 tons of production sold, 90.319 tons of production were used as raw material.
Capacity utilisation rate was 74% in 2013.
Table 10: PRODUCTION BY PRODUCT-TONS
Product 2013 2012 Change
Solid Fertilizer Total 507.000 481.533 5,29%
Liquid Fertilizer 1.098 1.261 -12,93%
Powder Fertilizer 4.244 4.240 0,09%
Grand Total 512.342 487.034 5,20%
Graph 5 : PRODUCTION AND CAPACITY UTILIZATION RATES BY YEARS
B. SALES AND PURCHASES
Our Company sold 1.651.237 tons of solid, 1.826.930 litres of liquid and 14.342.919 kgs of
powder fertilizer in 2013. 1.538.196 tons of solid, 1.332.952 litres of liquid, 11.900.683 kgs of
powder fertilizer were sold in 2012.

2013 OPERATING REVIEW REPORT| 11
The volume of purchases reached 1.315.452 tons in 2012, and it decreased by % 44,8 to
1.904.845 tons in 2013. Export was 16.684 tons in 2012, while it was 10.908 tons in 2013.
Table 11: SALES, IMPORT AND DOMESTIC PURCHASES-TONS
2013 2012 Change
Domestic Purchases 309.006 402.818 -23,3%
Import 1.595.839 912.634 74,9%
Total Purchases 1.904.845 1.315.452 44,8%
Sales 1.651.237 1.538.196 7,3%
Table 12 : SALES BY PRODUCT GROUPS-TONS
Solid Chemical Fertilizers 2013 2012 Change
COMPOUND 587.737 555.776 6%
AN 306.597 262.549 17%
CAN 214.380 236.637 -9%
UREA 258.330 229.671 12%
DAP 186.654 149.847 25%
AS 91.611 97.555 -6%
Other 5.929 6.161 -4%
Solid Fertilizer Total 1.651.237 1.538.196 7,3%
Liqiud Fertilizer- 000 lt 1.827 1.333 37%
Powder Fertilizer-000 kg 14.343 11.901 20%
Grand Total 1.667.407 1.551.432 7,5%
Table 13 : SALES BY CUSTOMER TYPES-TONS
Sales Group 2013 2012 Change
Corporate Sales 1.215.361 1.138.358 7%
Distributor Sales 412.184 360.461 14%
Export 10.908 16.684 -35%
Other 12.784 22.693 -44%
Total 1.651.237 1.538.196 7,3%

2013 OPERATING REVIEW REPORT| 12
C. INVESTMENTS
In Yarımca Facility, twin NPK-DAP plant whose production capacity is 500.000 tons/year
and ammonia tank whose capacity is 25.000 tons are under construction. It is planning to launch
Twin NPK-DAP plant in August 2014.
Table 14 : INVESTMENTS IN 2013-TL
Investment Amount
Lands and Parcels 6.963.846
Land Improvements 52.750
Buildings 20.404.574
Plants Machinery and Equipment 676.873
Vehicles 1.257.285
Fixtures 479.354
Ongoing Investments 140.653.522
Total 170.488.204
D. RESEARCH AND DEVELOPMENT ACTIVITIES
Turkey Soil Productivity Map
Studies aiming to form Turkish soil fertility map within the framework of “Soil Map Project”
is continued. In this respect, current qualitative and quantative information is categorized
according to locational data, by means of a mapping software and is input as data into
subcategorizes under each different location. GPS device is used for position detection and
analyses from a total 5.800 locations are completed. Also, soil samples that are received from
farmers are being analyzed, Reports that include fertilization suggestions are sent to landowners.
Product Development and Quality Studies
In the context of product development works, the studies for “ALTIN TURUNÇ”, the
fertilizer specific for citrus, have been completed. The studies for slow release fertilizers and
aminoacid, organomineral organic ones continue. There have been new registry studies about our
solid, liquid and powder fertilizers.
Izmir Laboratory continues to serve with its recently added analysis features. The work
about the replacement of our İskenderun laboratory also continues.

2013 OPERATING REVIEW REPORT| 13
E. ADMINISTRATIVE ACTIVITIES
Company’s Top Management
Osman BALTA–General Manager (since 01.02.2012)
Mechanical Engineer - Manager
Osman Balta was born on 01.09.1963 in Erzurum. After receiving his university degree from
Istanbul Technical University Sakarya Engineering Department, he worked as production and
planning engineer in private sector until 1988’s end. After completing military service, he began to
work in Camialti Navy Yard in Türkiye Gemi Sanayi A.Ş., a subsidiary of ministry of transportation.
Until 2009 he has been in various high rank positions. In 2009 August, he joined Gübre Fabrikaları
T.A.Ş. as Assistant General Manager and thereafter he was assigned as General Manager as of
February 1, 2012. He is the Chairman of the Board of Directors of Razi Petrochemical Co., a
member of Board of Directors of Negmar Denizcilik ve Yatırım A.Ş., and the Vice Chairman of the
Board of Directors of Raintrade Petrokimya ve Dış Ticaret A.Ş. He is married, with three children;
he knows English and Arabic.
Ferhat ŞENEL – Deputy General Manager
Manager
Ferhat Şenel was born on 01.12.1960 in Tokat. He graduated from the Istanbul University
Business Administration Faculty in 1984. He started his career at Turkish Development Bank and
served at several positions until 1998. He assumed top management position in several
organizations between 1998-2004 and started to serve as Assistant General Manager at Gübre
Fabrikaları T.A.Ş. in 2004. Mr. Şenel is the Chairman of the Board of Directors of Arya Phosphoric
Jonoob Co., a member of the Board of Directors of Razi Petrochemical Co.. He is married, with two
children; he knows English.
Tahir OKUTAN – Deputy General Manager
Agricultural Engineer – Manager
Tahir Okutan was born in Afyon on 03.02.1966. After finishing his university education at
Atatürk University Agricultural Faculty in 1988, he graduated from Anadolu University Faculty of
Economics in 1998. He then completed master study at Dumlupınar University Institute of Social
Sciences Business Administration Management and Organization department. He started his
career at Turkish Agriculture Credit Cooperatives and served at several positions till 2006 and
started to serve as Assistant General Manager to Gübre Fabrikaları T.A.Ş in 2006. Tahir OKUTAN is

2013 OPERATING REVIEW REPORT| 14
also a member of the Board of Directors Tarkim Bitki Koruma San. Ve Tic. A.Ş. He is married, with
two children; he knows English.
İsmail BABACAN – Deputy General Manager
Educator - Manager
İsmail Babacan was born in Malatya on 01.05.1963. He got his university degree from
Marmara University, Department of Theology. He has done his master’s degree in Marmara
University, Department of Theology between 1985-1987. He has started his career as a teacher
and then continued his career in private sector. Until 2009 he has been in various high rank
positions. In 2009, he joined Gubre Fabrikalari T.A.S team as an Assistant General Manager. He is
also a member of the Board of Directors of Etis Lojistik A.Ş. and Raintrade Petrokimya ve Dış
Ticaret A.Ş. He is married, with three children; he knows English and Arabic.
Yakup GÜLER – Deputy General Manager
Mechanical Engineer - Manager
Yakup Güler was born in Bayburt on 20.09.1964. After completing his undergraduate level
of education in Yıldız Technical University Engineering Faculty Mechanical Engineering, he went
England for language education between the years 1987 and 1989. He completed his graduation
degree in Business Administration between the years 1998 and 1999. He started to work by
establishing his own company in 1990 and until 2012 he has been in various high rank positions in
private sector. In March 2012 he began to work as Assistant General Manager in Gübretaş. He is
also a member of Board of Directors of İstanbul Lines Denizcilik Yatırım A.Ş. He is married, with
four children; he knows English.
Number of Personnel
In 2013, changes in number of personnel are shown below in Table 15:
Table 15 : Personnel Status
PERSONNEL 2013 2012 Change
Head Office 89 86 3,5%
Yarımca Facilities 271 261 3,8%
Regional Sales Directorates 68 68 0%
TOTAL 428 415 3,1%

2013 OPERATING REVIEW REPORT| 15
Collective Labor Agreement
Current collective bargaining agreement contains 2013-2014. Collective Bargaining
Agreement was signed in 2013 for 2 years. In 2013 nothing negative was experienced in the
employer union – worker relationship.
Training Activities
Training activities are aimed at developing managerial, personal and professional
capabilities of the staff. Education activities of 2.157 hours with participation of 209 employees
were carried out in 2013.
IV. ACTIVITIES OF RAZİ PETROCHEMICAL CO.
A. PRODUCTION
Razi Petrochemical Co. is the biggest fertilizer and fertilizer raw materials production
facility with 877.000 m2 total area. Total established capacity of Razi Petrochemical that was
acquired in February 2008 reachs 3.515.000 tons/year. In Razi, total production was 1.601.228
tons and the capacity utilisation rate was 46% in 2013.
Table 16 : RAZİ PETROCHEMICAL CO. PRODUCTION-TONS
Product 2013 2012 Change Capacity 2013 CUR
Ammonia 674.620 738.601 -9% 1.336.000 50%
Urea 424.880 336.170 26% 594.000 72%
Sulphur 355.717 350.950 1% 508.000 70%
Sulphuric Acid 143.842 126.101 14% 627.000 23%
DAP 2.169 0 - 450.000 0%
Total 1.601.228 1.551.822 3% 3.515.000 46%
B. SALES
In 2013, Razi Petrochemical Co. sold 1.297.144 tons of fertilizer and achieved a revenue of
753.996.206 TL. Razi exported 906.522 tons and domesticly sold 390.622 tons in 2013. Share of
export in total sales was 70%.

2013 OPERATING REVIEW REPORT| 16
Table 17 : RAZİ PETROCHEMICAL CO. SALES-TONS
Ürün 2013 2012 Change
Ammonia 441.356 496.105 -11%
Urea 449.292 364.588 23%
Sulphur 261.127 319.801 -18%
Sulphuric Acid 136.025 126.874 7%
DAP 9.344 1.551 502%
Total 1.297.144 1.308.919 -1%
C. INVESTMENTS
In 2013, Razi has had 100% share of Arya Phosphoric Jonoob Co. by purchasing 12,5% of
Arya. In Razi Petrochemical Co. Facilities, it has realized the renovation investments and the
investments relating to the productivity increase of current facilities. In addition, ammonia tank,
which has 30.000 tons capacity, is presently under construction.
Table 18 : RAZİ PETROCHEMICAL CO. INVESTMENT-TRL
INVESTMENT AMOUNT-TRL
Buildings 4.109.398
Plants Machinery and Equipment 3.469.675
Vehicles 193.122
Fixtures 1.281.080
Ongoing Investments 36.897.400
TOTAL 45.950.675
2013 OPERATING REVIEW REPORT| 17
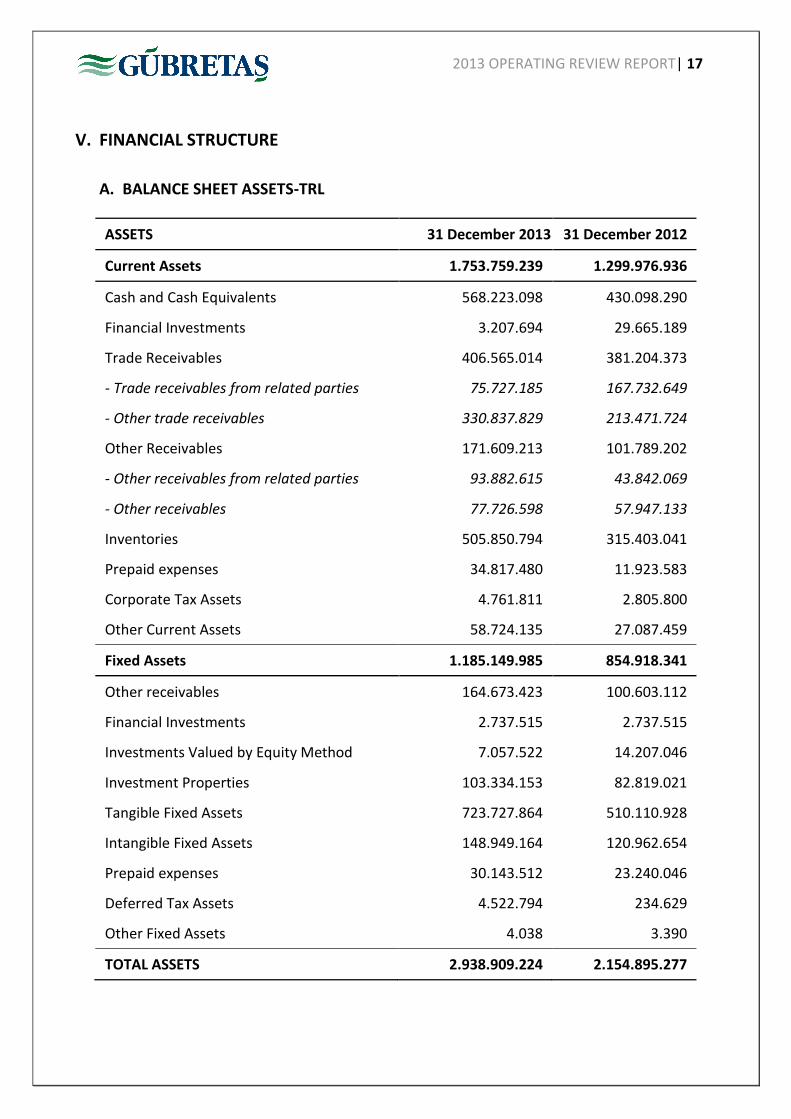
V. FINANCIAL STRUCTURE
A. BALANCE SHEET ASSETS-TRL
ASSETS 31 December 2013 31 December 2012
Current Assets 1.753.759.239 1.299.976.936
Cash and Cash Equivalents 568.223.098 430.098.290
Financial Investments 3.207.694 29.665.189
Trade Receivables 406.565.014 381.204.373
- Trade receivables from related parties 75.727.185 167.732.649
- Other trade receivables 330.837.829 213.471.724
Other Receivables 171.609.213 101.789.202
- Other receivables from related parties 93.882.615 43.842.069
- Other receivables 77.726.598 57.947.133
Inventories 505.850.794 315.403.041
Prepaid expenses 34.817.480 11.923.583
Corporate Tax Assets 4.761.811 2.805.800
Other Current Assets 58.724.135 27.087.459
Fixed Assets 1.185.149.985 854.918.341
Other receivables 164.673.423 100.603.112
Financial Investments 2.737.515 2.737.515
Investments Valued by Equity Method 7.057.522 14.207.046
Investment Properties 103.334.153 82.819.021
Tangible Fixed Assets 723.727.864 510.110.928
Intangible Fixed Assets 148.949.164 120.962.654
Prepaid expenses 30.143.512 23.240.046
Deferred Tax Assets 4.522.794 234.629
Other Fixed Assets 4.038 3.390
TOTAL ASSETS 2.938.909.224 2.154.895.277
2013 OPERATING REVIEW REPORT| 18
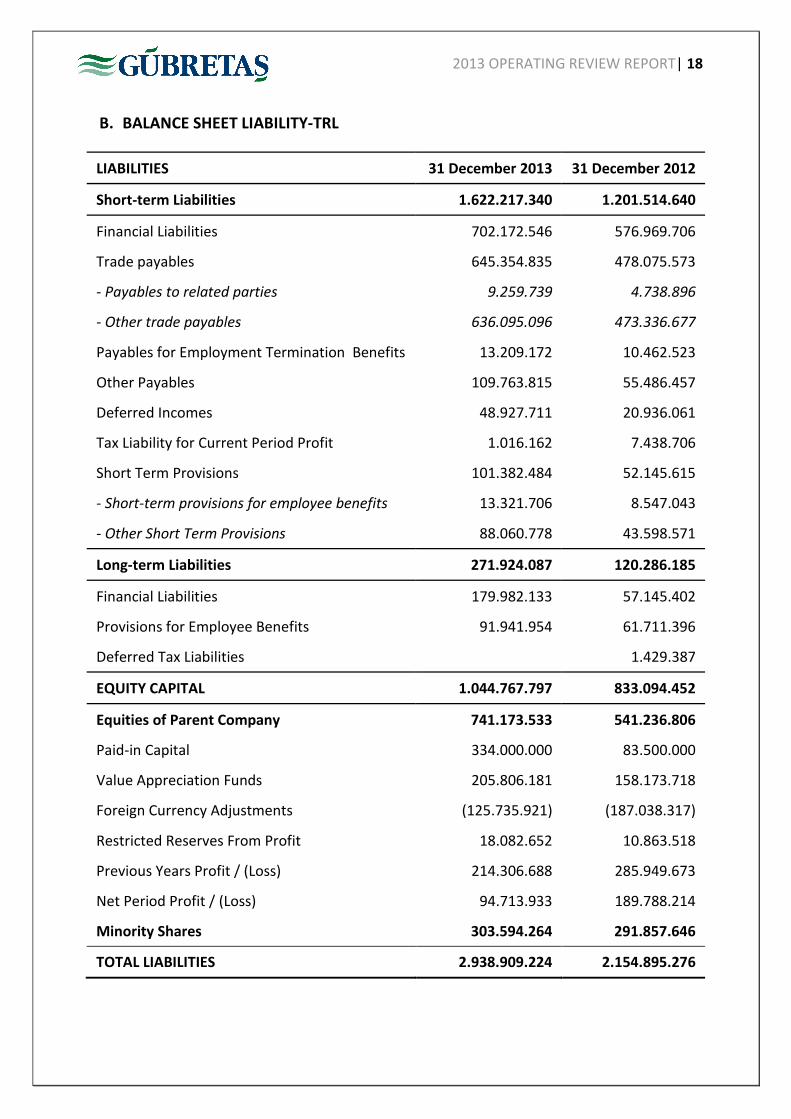
B. BALANCE SHEET LIABILITY-TRL
LIABILITIES 31 December 2013 31 December 2012
Short-term Liabilities 1.622.217.340 1.201.514.640
Financial Liabilities 702.172.546 576.969.706
Trade payables 645.354.835 478.075.573
- Payables to related parties 9.259.739 4.738.896
- Other trade payables 636.095.096 473.336.677
Payables for Employment Termination Benefits 13.209.172 10.462.523
Other Payables 109.763.815 55.486.457
Deferred Incomes 48.927.711 20.936.061
Tax Liability for Current Period Profit 1.016.162 7.438.706
Short Term Provisions 101.382.484 52.145.615
- Short-term provisions for employee benefits 13.321.706 8.547.043
- Other Short Term Provisions 88.060.778 43.598.571
Long-term Liabilities 271.924.087 120.286.185
Financial Liabilities 179.982.133 57.145.402
Provisions for Employee Benefits 91.941.954 61.711.396
Deferred Tax Liabilities
1.429.387
EQUITY CAPITAL 1.044.767.797 833.094.452
Equities of Parent Company 741.173.533 541.236.806
Paid-in Capital 334.000.000 83.500.000
Value Appreciation Funds 205.806.181 158.173.718
Foreign Currency Adjustments (125.735.921) (187.038.317)
Restricted Reserves From Profit 18.082.652 10.863.518
Previous Years Profit / (Loss) 214.306.688 285.949.673
Net Period Profit / (Loss) 94.713.933 189.788.214
Minority Shares 303.594.264 291.857.646
TOTAL LIABILITIES 2.938.909.224 2.154.895.276

2013 OPERATING REVIEW REPORT| 19
C. INCOME STATEMENT-TRL
CONTINUING OPERATIONS 31 December 2013 31 December 2012
Sales (net) 2.265.437.409 2.226.819.536
Costs of Sales (-) (1.683.267.296) (1.579.614.777)
GROSS PROFIT 582.170.113 647.204.759
Administrative Expenses (-) (84.344.878) (47.299.084)
Marketing, Sales and Distribution Expenses (-) (166.243.163) (118.334.983)
Other Operating Incomes 361.102.384 207.014.704
Other Operating Expenses (-) (293.898.582) (69.884.676)
OPERATION PROFIT/(LOSS) 398.785.874 618.700.720
Income from Investment Activities 52.814.347 61.868.087
Expenses from Investment Activities (-) (61.666.133) (30.401.278)
Shares in Profit/Loss of Investments Valued by Equity Method
(16.421.908) (7.534.678)
OPERATING PROFIT/LOSS BEFORE FINANCE EXPENSE
373.512.180 642.632.851
Financial Expenses (-) (97.451.106) (170.192.169)
PRE-TAX PROFIT/LOSS FROM CONTINUING OPERATIONS
276.061.074 472.440.682
Tax Expenses on Continuing Operations 4.690.544 (42.407.514)
- Period Tax Expense (-)/Income (3.315.313) (37.834.305)
- Deferred Tax Expense(-)/Income 8.005.857 (4.573.209)
PERIOD PROFIT/ (LOSS) 280.751.618 430.033.168
Distribution of Period Profit / (Loss)
Minority Shares 186.037.684 240.244.955
Parent Company’s Shares 94.713.933 189.788.214
Earnings / (Loss) Per Share 0,28 0,57

2013 OPERATING REVIEW REPORT| 20
D. RATIOS
2013 2012 2011 2010 2009
LIQUIDITY RATIOS
Current Ratio 1,08 1,08 1,12 0,93 0,81
Acid Test Ratio 0,77 0,82 0,77 0,60 0,53
FINANCIAL RATIOS
Financial Leverage Ratio 0,64 0,61 0,60 0,62 0,67
Equity / Asset 0,36 0,39 0,40 0,38 0,33
VERİMLİLİK ORANLARI
Inventory Turnover 4,10 3,72 3,58 5,08 3,88
Debt Collection Period 63,46 78,33 68,44 57,32 62,18
Asset Turnover 0,66 0,62 0,61 0,70 0,57
KARLILIK ORANLARI
Gross Profit Ratio 0,26 0,29 0,31 0,31 0,11
Operating Profit Ratio 0,15 0,22 0,23 0,24 0,03
EBITDA Ratio 0,17 0,24 0,27 0,29 0,10
VI. EVENTS AFTER BALANCE SHEET DATE
1) None

2013 OPERATING REVIEW REPORT| 21
VII. CORPORATE GOVERNANCE PRINCIPLES COMPLIANCE REPORT
1. Corporate Governance Principles Compliance Statement
The Company has carried out its activities in accordance with the Corporate Governance
Principles issued by the Capital Market Board.
A. SECTION I – SHAREHOLDERS
2. Shareholders Relations Department
Shareholders Relations is maintained by our Budget, Reporting, Investor and Affiliate
Relations Directorate. The department has undertaken company responsibilities for Capital
Market Board (SPK), Istanbul Stock Exchange (BIST) and Central Registry Agency (MKK) to handle
shareholders’ transactions at capital increase, dividend disbursement, to follow operations with
stock broker, reply and inform shareholders’ written and verbal requests.
In 2013, a lot of meetings held for giving detailed information to investors about the
activities of the company and we have been participated to three investor conferences. The
investor demands also responded via telephone and internet.
The list of responsible employees and their contact information is as follows:
Name Title Phone E-mail
Hüseyin Karakuş Manager +90 212 376 50 27 [email protected]
Kadir Budak Asistant Specialist +90 212 376 50 08 [email protected]
3. Use of Shareholders’ Rights to Obtain Information
All written and verbal information requests from the shareholders are replied, except
conFİdential business information and the information which is not publicly announced. Also
information related to shareholders and investors has been announced through Public Disclosure
Platform (www.kap.gov.tr), company’s website (www.gubretas.com.tr), Central Registry Agency e-
Compnay Portal and newspapers in accordance with Turkish Trade Law and Capital Market Code.
There is no clause about assigning a special auditor in the articles of association and we
have not received any request from investors on this subject.

2013 OPERATING REVIEW REPORT| 22
4. Information on General Assembly
General Assembly Meetings of the company are held in accordance with the Turkish
Commercial Code and the Capital Market Law.
61th Ordinary General Assembly Meeting for the accounting period 2012 was held at 10:00
a.m. on 8 May 2013 in the Meeting Hall of our Head Office located at the address of Kasap Sk.
Hilmi Hak İş Merkezi No: 22 Esentepe, Şişli - İstanbul with participation of about 81.7 % of the total
Company capital of 83.500.000,00 TL. 61th Ordinary General Assembly Meeting was firstly held in
electronic media synchronically with physical media according to the regulation of Capital Market
Law.
Stakeholders and media representatives also attended the assembly meeting.
Invitation for the meeting was made within its deadline; i.e. in the issue 8304 of Trade
Registry Gazette of Turkey dated 19 April 2013, Dünya and Star newspapers on 13 April 2013, and
the web addresses www.kap.gov.tr of Public Disclosure Platform and www.gubretas.com.tr of
Gübre Fabrikaları T.A.Ş.
24 days before the General Assembly, the General Assembly Information Document which
includes information on Board Member nominees, final version of the articles of association and
modified text of the articles of association and the reasons for the modifications was disclosed at
the web address of www.gubretas.com.tr and were made available at the head office of our
company.
24 days before the General Assembly, annual report, financial statements, auditor reports,
proposal of dividend distribution was disclosed at the web addresses of www.kap.gov.tr and
www.gubretas.com.tr and were made available at the head office of our company.
During the general assembly meeting, shareholders are asked if they have a say on the
article discussed before the voting takes place. At the ‘wishes and recommendations’ session of
the meeting, questions of the participants are answered by the company authorities on the
matters discussed.
Information was given as a separate agenda item at the General Assembly regarding
donations and aids during the period 01.01.2012-31.12.2012, which includes 1.969.764,53 TL for
building Gübretaş Primary School, locating İskenderun Denizciler, which was donated to Ministry
of National Education; 204.217,00,-TL as educational grant to 100 students from Agriculture
Faculties of various universities for 2011-2012 education period; 76.719,00 TL for education

2013 OPERATING REVIEW REPORT| 23
seminar intending to the students of Agriculture Faculties; 22.400,00 TL as food aid for
subcontractors who are implementing company operations. In addition to these donations and
aids, it was relieved in the amount of 10.000 TL to other institutions for social aid.
Minutes of the General Assembly were published in the issue 8326 of the Trade Registry
Gazette dated 23 May 2013 and they are also made available to stakeholders at the web address
of www.gubretas.com.tr.
5. Voting Rights and Minority Rights
There are no privileged rights on voting because there is no preferential stock issued.
6. Dividend Policy and Deadline for Dividend Distribution
Dividend distribution policy of our company is determination of the dividend amount as
per the decision taken at the General Assembly in line with the provisions of the Turkish
Commercial Code, Capital Markets Law and articles of incorporation, and distribution of such
amount within legal deadline defined by the Capital Markets Board.
There is no privilege in our company regarding dividend distribution.
7. Transfer of Shares
There is no clause that restricts transfer of shares in articles of association of the company.
B. SECTION II – PUBLIC DISCLOSURE AND TRANSPARENCY
8. Company Information Disclosure Policy
In terms of informing investors, our company acts within the framework of the present
legislation. Information can obtained through Public Disclosure Platform’s website at:
www.kap.gov.tr, our company’s website at: www.gubretas.com.tr and Central Registry Agency e-
Company Portal.
Personnel who are in charge of the conduct of the information policy and their
communication information are as follows:
Name Title Phone E-mail
Hüseyin Karakuş Manager +90 212 376 50 27 [email protected]
Nihat Vuran Manager +90 212 376 50 28 [email protected]
9. The Company’s Website and Its Contents
Website of our Company can be accessed through the address of www.gubretas.com.tr
both in Turkish and English.

2013 OPERATING REVIEW REPORT| 24
Information regarding Gübretaş and its affiliates, mission and vision of our company, board
of directors and top management, articles of association, shareholding structure, corporate
governance compatibility report, corporate social responsibility, information policy, documents of
the general assembly, profit distribution policy, information on the share certificates, annual
reports, financial and operational results, investor presentations, information society services,
trade registry informations, quality policy, company values, our products, our services,
announcements, publishments and articles are provided in the company’s website.
10. Annual Report
Our company annual report includes information mentioned in Capital Markets Board’s
Corporate Governance Principles.
C. SECTION III – STAKEHOLDERS
11. Informing Stakeholders
Gübre Fabrikaları T.A.Ş. provides guarantee in order to protect the interests of the parties
and investors who are involved in the process of reaching Gübretaş’ goals, whether their rights are
protected by legislations or not.
Stakeholders consist from shareholders, employees, creditors, customers, suppliers, trade
unions, non-governmental organizations and savers who consider to invest or to do business with
the state and the company. In order to minimize the conflict of interests between company and
the stakeholders or among the stakeholders, a balanced approach is adopted and their rights are
considered independently.
The company develops mechanisms and models, without blocking company activities, for
participation of stakeholders to company management.
The members of the Board of Directors and Managers avoid from disposals that will inflict
loss on the stakeholders or reduce assets. They manage the business based on coherent balance
between the company and stakeholders benefits.
12. Participation of the Stakeholders in the Management
The company holds meetings in order to exchange ideas with stakeholders. The outcome of
the meetings is used to shape the company decisions and policies to provide more effective,
efficient, better quality products and services.

2013 OPERATING REVIEW REPORT| 25
13. Human Resources Policy
We do not discriminate on the ground of ethnic, language, religion, gender, color or
political opinion when hiring personnel. Our only criterion is to find people who can share the
sense of us which Gübretaş adopts, take responsibility, have business ethics, are idealist, are
captious, are suitable for team work, renew and improve himself, have analytical thinking.
We do evaluate people according to their productivity, their adoption to the corporate
culture and objective success criteria. When we encounter the lack of knowledge and experience
among our employees after applying professional methods and techniques, we provide all the
necessary activities to develop their skills and educations.
We encourage personnel who demonstrate development horizontally and vertically,
reward them materially and spiritually.
We give importance to exchanging ideas with personal and trade union representatives
when taking decisions on personnel.
We prepare social and physical place that our personnel can realize their duties at highest
level by meeting requirements of all their material and spiritual needs.
Our human resources policy in Gübretaş is based on five fundamental principles:
-Equality
-Participative management and transparency
-Continious improvement of working conditions
-Productivity-based fees
-Respecting human rights
14. Ethical Rules and Social Responsibility
Operations of our company are conducted within the framework of the following ethical
rules, prepared by the Board of Directors and are communicated to our employees:
-Deep respect to human and consciousness of “human first”,
-Customer oriented thinking and working,
-Sense of responsibility towards the society and respect to the environment,
-Continuous improvement, systematical and logical thinking,
-Having a free atmosphere where opinions are expressed freely,
-Equality at management, transparency, accountability and responsibility,
-Merging high ethical and moral values with the corporate identity,

2013 OPERATING REVIEW REPORT| 26
-Service without discrimination on religious, language, race and gender,
-Forming a corporate and corporate culture that is remembered with the word of ‘Trust’
Turkey Soil Efficiency Map Project
The Project initiated in 2005 as a social responsibility project of Gübretaş, has been carried
out with all own opportunities.
The main objectives of Gübretaş in this Project are:
1) To provide conscious fertilizer consumption to partners of Turkish Agricultural
Cooperatives and determine fertilizer type regarding to land type. To provide Farmers solutions if
there is a problem in their land accourding to soil analysis report conclusion.
2) To provide data to Gübretaş’s product specialized fertilizers to develop new formulates
in R&D studies.
3) To create a database of efficiency map regarding to macro and micro nutrient elements
by our Country’s geographic regions and be a source for further studies.
4) To combine Gübretaş’s studies conclusions with studies of Ministry of Agriculture and
Universities and contribute to build a huge database for our Country s agriculture.
5) To provide applied training to minimum 10 tousand major farmers about agricultural
issues like getting soil examples, fertilizer and fertilizer use with this project.
Scholarships
Gübretaş is granting scholarships to the students of 27 Agricultural Faculties in Turkey, 107
of beneficiaries in total.
Training
Our training activities aimed at supporting Turkish Farmers agricultural knowledge for
more efficient agricultural production and raising profilibility via optimizing costs of inputs such as
fertilizers continued. Company’s Regional Sales Directorates informed farmers in all aspects of
agriculture in seminar meetings organized in cooperation with Turkish Agricultural Credit
Cooperatives. Specialist agricultural engineers enlightened farmers in these meetings on principles
of balanced and regulary fertilizer usage, plant nutriation techics and also soil analysis.
2013 OPERATING REVIEW REPORT| 27
School Buildings
In Hatay, İskenderun county-Denizciler town, “Denizciler GÜBRETAŞ Secondary School”,
which has 32 classrooms with 1920 student capacity, was builded for in the memory of 60th
anniversary of GÜBRETAŞ in 2013 and it was put into service with ceremony.
Similarly, in Kocaeli, Başiskele county,“Başiskele GÜBRETAŞ Primary School”, which has 24
classrooms with 720 student capacity, was finished and it will be put into service in 2014.
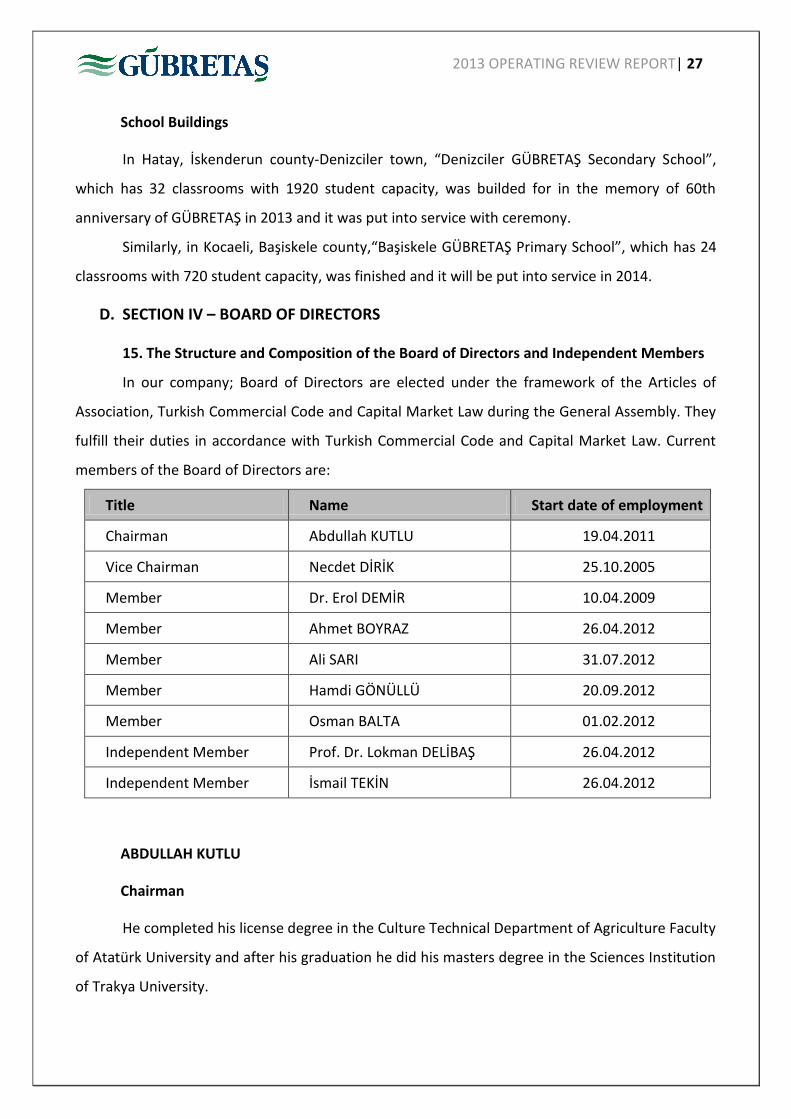
D. SECTION IV – BOARD OF DIRECTORS
15. The Structure and Composition of the Board of Directors and Independent Members
In our company; Board of Directors are elected under the framework of the Articles of
Association, Turkish Commercial Code and Capital Market Law during the General Assembly. They
fulfill their duties in accordance with Turkish Commercial Code and Capital Market Law. Current
members of the Board of Directors are:
Title Name Start date of employment
Chairman Abdullah KUTLU 19.04.2011
Vice Chairman Necdet DİRİK 25.10.2005
Member Dr. Erol DEMİR 10.04.2009
Member Ahmet BOYRAZ 26.04.2012
Member Ali SARI 31.07.2012
Member Hamdi GÖNÜLLÜ 20.09.2012
Member Osman BALTA 01.02.2012
Independent Member Prof. Dr. Lokman DELİBAŞ 26.04.2012
Independent Member İsmail TEKİN 26.04.2012
ABDULLAH KUTLU
Chairman
He completed his license degree in the Culture Technical Department of Agriculture Faculty
of Atatürk University and after his graduation he did his masters degree in the Sciences Institution
of Trakya University.

2013 OPERATING REVIEW REPORT| 28
Abdullah KUTLU started his business life as an engineer in Erzurum Regional Directorate of
Köy Hizmetleri, then he took office as a Senior Engineer in Regional Directorate of Agriculture
Credit Cooperatives, later on while he was working as chief in the same region, he was appointed
as Regional Assistant Manager of Erzurum Regional Union in 1992. In 1995, he became the
Regional Manager of the same Regional Union. In 1997 he was appointed as Consultant of the
General Directorate of Central Union and on 25.02.2003 he was appointed as Regional Manager of
Izmir Regional Union. While Abdullah KUTLU was carrying out this duty, he was appointed as the
Assistant General Manager of the General Directorate of Central Union on 01.08.2008 and then he
was appointed as the General Manager on 19.04.2011.
Duties Carried Out Within The Last 10 Years
A. Ongoing Duties
2003-2005 and 2008-2011, as the Chairman of the Board of Directors of İmece Plastik A.Ş.
2003-2006, as the Chairman of the Board of Directors of Denizli Yem A.Ş.
2007-2008, as the Vice Chairman of the Board of Directors of Tareks A.Ş.
24.03.2011-10.05.2011, as the Chairman of the Board of Directors of Tareks A.Ş.
2009-2011, as the Chairman of the Board of Directors of Tarkim A.Ş.
2010-2012, as the Chairman of the Board of Directors of the Foundation of Pension Fund,
2006-2007-2008, as the Member of the Board of Directors of Gübre Fabrikaları T.A.Ş.
He has been carrying out his duty as the Chairman of the Board of Directors of Gübre
Fabrikaları T.A.Ş. since 19.04.2011 up to this day.
NECDET DİRİK
Vice Chairman
Necdet Dirik completed his license degree in Economics and Administrative Sciences
Faculty of Marmara University (1982). Necdet Dirik started business life in an Accountant Office
and then he continued his career in Manisa Branch of the Turkish Religious Foundation and in
1985 in General Directorate of Central Union of Turkish Agriculture Credit Cooperatives, in 1989
he became chief, in 1994 he became Manager and then he worked respectively as the
Coordination Manager of Administrative and Agricultural Affairs, Trade Manager and Domestic
Purchases Manager, in 2003 he became expert, in 2005 he was appointed as the Chairman of the
Supply and Marketing Department and currently he has been carrying out the same duty.

2013 OPERATING REVIEW REPORT| 29
As of 1994 he worked in the following entities which are a participant of the Agriculture
Credit Cooperatives;
As a Member of the Board of Directors of Tareks A.Ş.,
As a Member of the Board of Directors of Toros Gübre ve Pazarlama companies,
As the Chairman of the Board of Directors of Delice Feed Factory,
As a Member of the Board of Directors of imece Feed Factory,
As a Member and Managing Member of the Board of Directors of Tarım Kredi Sigortacılık
ve Aracılık Şirketi,
As a Member and Managing Member of the Board of Directors of Tareks A.Ş. (second
time),
As a Member of the Board of Directors of Poyraz Feed Factory,
As a Member and Vice Chairman of the Board of Directors of Gübre Fabrikaları T.A.Ş.,
As a Member, Vice Chairman and Chairman of the Board of Directors of Tarkim
Duties Carried Out Within The Last 10 Years
A. Ongoing Duties
Head of Supply and Marketing Department
Vice Chairman of the Board of Directors of Gübre Fabrikaları T.A.Ş
Chairman of the Board of Directors of Tarkim Bitki Koruma Sanayi ve Ticaret A.Ş.
B. Duties Ended
Domestic Purchases Manager 2003 (Duty change)
Expert 2005 (Duty change)
Dr. Erol DEMİR
Member
Mr. Demir was born on 13.05.1968 in Kahramanmarafi; he started his business life in 1988
in Turkish Credit Cooperatives. In 1997 he did his masters degree in Business Administration-
Cooperation Business Department of Social Sciences Institution, in 2003 he did his Phd in
Agriculture Economics Department of Sciences Institution of Ankara University. He took Office in
various examination and research commissions which were established within the body of Turkish
Cooperation Agency.

2013 OPERATING REVIEW REPORT| 30
He worked in the regulation committee of the International Cooperation Congre for two
periods. He worked for the project of preparation of the Uniform Chart of Account for Turkish
Agriculture Credit Cooperatives. Besides, from time to time he participated as lecturer in the
training courses provided for the personnel of the agency. Currently, he has been working as the
Chairman of the Department of Fund Management and Accounting of the General Directorate of
the Turkish Agriculture Credit Committee.
Duties Carried Out Within The Last 10 Years
A. Ongoing Duties
Member of the Board of Directors of Gübre Fabrikaları T.A.Ş.
Member of the Board of Directors of Tarım Kredi Süt Sanayi ve Tic. A.Ş.
Member of the Board of Audit of Turkish Cooperation Agency
Member of the Board of Audit of Tareksav Education Foundation
B. Duties Ended
Vice Chairman of the Board of Directors of Tareks A.Ş. 2003-2007 (Resignation)
Member of the Board of Directors of Güven Sigorta Türk A.Ş. 2004-2008 (Resignation)
Ahmet BOYRAZ
Member
He graduated from Business Administration of Anadolu University. Ahmet BOYRAZ started
his business life as a clerk (1986-1991) in the Organization of the Agriculture Credit Cooperatives,
then he worked as Regional Chief of Malatya Regional Union of Agriculture Credit Cooperatives
(1991-1994), Regional Assistant Manager of Mersin Regional Union of Agriculture Credit
Cooperatives (1994-1999), Regional Assistant Manager of Malatya Regional Union of Agriculture
Credit Cooperatives (1999-2003), Regional Manager of Malatya Regional Union of Agriculture
Credit Cooperatives (2003-2009), Manager of the Administration and Technical Department of
General Directorate of Turkish Central Union of Agriculture Credit Cooperatives (2009-2011),
Regional Manager of Kayseri Regional Union of Agriculture Credit Cooperatives (2011-2012).
Ahmet BOYRAZ worked as Company and Foundation Chairman and Vice Chairman of Board of
Directors of; İmece Plastik A.Ş. which is a participant of Turkish Agriculture Credit Cooperatives
and operating in Antalya city, Altınova Yem ve Hayvancılık Sanayi A.Ş. which is operating in Elazığ

2013 OPERATING REVIEW REPORT| 31
city, İmece Yem A.Ş. which is operating in Ankara city, Foundation of Pension Fund of the
Agriculture Credit Cooperatives which is operating in Ankara city, imece Prefabrik A.Ş. which is
operating in Ankara city, Başak Yem Sanayi ve Ticaret A.Ş. and Başak Tarım İşletmeleri A.Ş. which
are operating in Yozgat city.
Ahmet BOYRAZ attended in various seminars and investigations regarding Agriculture and
Animal Breeding in Japan, Switzerland, Germany, Holland, France, Iran and Dubai and he is still
working as the Regional Manager of Ankara Regional Union of Agriculture Credit Cooperatives.
Duties Carried Out Within The Last 10 Years
A. Ongoing Duties
Regional Manager of Ankara Regional Union of Agriculture Credit Cooperatives
Member of the Board of Directors of Gübre Fabrikaları T.A.Ş.
Member of the Board of Directors of Tarım Kredi Yem Sanayi Ticaret A.Ş.
B. Duties Ended
Regional Chief of Malatya Regional Union of the Agriculture Credit Cooperatives 1991-1994
Appointment
Regional Assistant Manager of Mersin Regional Union of the Agriculture Credit
Cooperatives 1994-1999 Appointment
Regional Assistant Manager of Malatya Regional Union of the Agriculture Credit
Cooperatives 1999-2003 Appointment
Regional Manager of Malatya Regional Union of the Agriculture Credit Cooperatives 2003-
2009 Appointment
Head of the Department of General Directorate of Turkish Central Union of the Agriculture
Credit Cooperatives 2009-2011 Appointment
Regional Manager of Kayseri Regional Union of the Agriculture Credit Cooperatives 2011-
2012 Appointment
As the Chairman or the Vice Chairman in; Başak Yem A.Ş., Başak Tarım İşletmeleri A.Ş.
İmece Plastik, Altınova Yem, İmece Yem, Foundation of Pension Fund, İmece Prefabrik A.Ş.

2013 OPERATING REVIEW REPORT| 32
Ali SARI
Member
He completed his Masters Degree in Business Administration of Economics and
Administrative Sciences Faculty of Atatürk University in 1986. Ali SARI started his business life as
an independent accountant in 1986 and he took office as a clerk in Antalya Regional Union of the
Agriculture Credit Cooperatives in 1987. After working in various Agriculture Credit Cooperatives
of Isparta city (1989-2005), he was appointed as Chief of Antalya Regional Union in 2005.
He was appointed as Regional Assistant Manager in 2008. He was appointed as Regional
Manager of Kayseri Regional Union of the Agriculture Credit Cooperatives in 2012 and currently he
has been working in the same position.
Duties Carried Out Within The Last 10 Years
A. Ongoing Duties
Vice Chairman of the Board of Directors of Başak Tarım İşletmeleri A.Ş.
Member of the Board of Directors of Gübre Fabrikaları Türk A.Ş.
Manager of Kayseri Regional Union of the Agriculture Credit Cooperatives
B. Duties Ended
Member of Board of Directors of Denizli Yem A.Ş. 2008-2009 (Resignation)
Member of Board of Audit of 0mece Plastik San. ve Tic. A.Ş. 2009-2010 (Resignation)
Member of Board of Directors of 0mece Plastik San. ve Tic. A.Ş. 2010-2012 (Resignation)
Hamdi GÖNÜLLÜ
Member
He completed his license degree in financial Sciences Faculty of Afyon-Anadolu University
in 1984. Hamdi Gönüllü started his business life as Assistant Controller of the General Directorate
of Turkish Central Association of the Agriculture Credit Cooperatives in 1987 and he became a
Controller in the same Association by being successful in the qualifying exam in 1991. He worked
as Controller until 1997.
He took office as the Credits Manager between the years 1997-2005 in the same
Association and then he worked as the Head of the Department of Accounting and Financing
between the years 2005-2006. Hamdi Gönüllü was appointed as the Head of the Department of

2013 OPERATING REVIEW REPORT| 33
Credits in 2006 and still he has been working in the same position. Besides his aforementioned
positions; he worked as a Member of the Board of Audit of Güven Sigorta Türk A.Ş. (2001-2002), as
a Member of the Board of Audit of Poyraz Gıda Tarım Hayvancılık Sanayi ve Ticaret A.Ş.(2003), as a
Member of the Board of Directors of İmece Prefabrik Yapı Tarım Makinaları Temizlik ve Güvenlik
Hizmetleri A.Ş. (2003-2004) and as the Chairman of the Board of Directors of İmece Yem Tarım
Ürünleri ve Hayvancılık Sanayi Ticaret A.Ş. (2012).
He worked as a Member of the Board of Directors (1998-2001) and Member of the Board
of Audit (2009) of the Foundation of Social Aid For the Personnel of the Agriculture Credit
Cooperatives and Unions. He has been working as a Member of the Board of Directors of Gübre
Fabrikaları Türk A.Ş. since 2004, as the Vice Chairman of the Board of Directors of Tarnet Tarım
Kredi Bilişim ve İletişim Hizmetleri Sanayi ve Ticaret A.Ş.. since 2012 and as the Vice Chairman of
the Board of Directors of Tarnet iletişim Hizmetleri A.Ş. since 2012.
He has been working as a Member of the Board of Audit of the Foundation of Education,
Culture and Health of the Agriculture Credit Cooperatives since 2012.
Duties Carried Out Within The Last 10 Years
A. Ongoing Duties
Head of the Department of Credits of Central Union of the Agriculture Credit Cooperatives;
continuing.
Member of the Board of Directors of Gübre Fabrikaları T.A.Ş.; continuing.
Vice Chairman of the Board of Directors of Tarnet İletişim Hizmetleri A.Ş.; continuing.
Member of the Board of Audit of he Foundation of Education, Culture and Health of the
Agriculture Credit Cooperatives; continuing.
B. Duties Ended
Member of the Board of Directors of the Foundation of Social Aid For the Personnel of the
Agriculture Credit Cooperatives and Unions; 1998-2001 (Resignation)
Member of the Board of Audit of the Foundation of Social Aid For the Personnel of the
Agriculture Credit Cooperatives and Unions; 2009 (Resignation)
Member of the Board of Audit of Güven Sigorta Türk A.Ş.; 2001-2002 (Resignation)
Member of the Board of Audit of Poyraz Gıda Tarım Hayvancılık Sanayi ve Ticaret A.Ş.; 2003
(Resignation)

2013 OPERATING REVIEW REPORT| 34
Member of the Board of Directors of 0mece Prefabrik Yapı Tarım Mak. Tem. ve Güv. Hiz.
A.Ş.; 2003-2004 (Resignation)
Chairman of the Board of Directors of İmece Yem Tarım Ürünleri ve Hayv. San. Tic. A.Ş.;
2012 (He has not been a candidate)
Osman BALTA
Member
Osman Balta was born on 01.09.1963 in Erzurum. After receiving his university degree from
Istanbul Technical University Sakarya Engineering Department, he worked as production and
planning engineer in private sector until 1988’s end. After completing military service, he began to
work in Camialti Navy Yard in Türkiye Gemi Sanayi A.Ş., a subsidiary of ministry of transportation.
Until 2009 he has been in various high rank positions. In 2009 August, he joined Gübre Fabrikaları
T.A.Ş. as Assistant General Manager and thereafter he was assigned as General Manager as of
February 1, 2012. He is the Chairman of the Board of Directors of Razi Petrochemical Co., a
member of Board of Directors of Negmar Denizcilik ve Yatırım A.Ş., and the Vice Chairman of the
Board of Directors of Raintrade Petrokimya ve Dış Ticaret A.Ş. He is married, with three children;
he knows English and Arabic.
Duties Carried Out Within The Last 10 Years
A. Ongoing Duties
General Manager and Member of the Board of Directors of Gübre Fabrikaları T. A.Ş.
Chairman of the Board of Directors of Razi Petrochemical Co.
Member of the Board of Directors of Negmar Denizcilik Yatırım A.Ş.
Vice Chairman of the Board of Directors of Raintrade Petrokimya ve Dış Ticaret A.Ş.
Prof. Dr. Lokman DELİBAŞ
Independent Member
Lokman DELİBAŞ completed his license degree in Agriculture Faculty of Ataturk University
in 1980 and he worked as Senior Agriculture Engineer in the 9th Regional Directorate of Erzurum
Topraksu for 6 months and then he started to work as an assistant in Agriculture Faculty of Ataturk
University in 1981 and he completed his Phd education in Culture-technic Department of Sciences
Institution of Ataturk University in 1984.

2013 OPERATING REVIEW REPORT| 35
In 1987 he was appointed as the Vice Assistant Professor to the Department of Culture-
technic Department of Tekirdağ Agriculture Faculty of Trakya University. On 20 October 1989 he
was granted the title of Assistant Professor of the University due to his studies which he
performed regarding Culture-technic matters and accordingly he was appointed as Assistant
Professor to the Culture-technic Department of Tekirdağ Agriculture Faculty of Trakya University.
He conducted his duties as a member of the Commission of Purchase of the Faculty and as
a member of the Commission of Education-Learning in Tekirdağ Agriculture Faculty between the
years 1988 - 1990.
In 1993 he was appointed as the Founding Manager to the Lüleburgaz Vacational School of
Higher Education which was established under the Trakya University and he held office until 1996.
He was appointed as the Professor on 13 January 1995. He took office as the Head of the
Department of Agricultural Constructions and Irrigation of Tekirdağ Agriculture Faculty between
the years 1995-1997.
Lokman DELİBAŞ took office as Faculty Member under the title of Assistant Docent
between the years 1987-1990, under the title of Assistant Professor between the years 1990-1995,
under the title Professor between the years 1995-2006 in Tekirdağ Agriculture Faculty of Trakya
University. He was appointed to Namık Kemal University by transfer in 2006 and he has been
carrying out the duty of Faculty Member in Tekirdağ Agriculture Faculty which has been joined to
Namık Kemal University.
He has made a range of scientific publishing since 1987 and taught a range of license and
masters degree lectures. In the same period, several times he worked as a jury member regarding
foreign language and science, as a jury member regarding the duty of assistant professor, as a
director for masters degrees and Phd thesis and as a arbitrator in various scientific magazines.
Duties Carried Out Within The Last 10 Years
A. Ongoing Duties
Faculty Member in Namık Kemal University
Independent Member of the Board of Directors of Gübre Fabrikaları T.A.Ş.

2013 OPERATING REVIEW REPORT| 36
İsmail TEKİN
Independent Member
İSMAİL TEKİN finished his License Education in the Machine Department of Turkish Military
Academy and graduated as Tanker Lieutenant in 1986 and he finished the class-school training
ranking first in Armoured Forces School and Training Division Command. Following that, he
worked as Student and Course Batt, Sub-lieutenant Main Course Company Platoon
Commanderand Division Operation and Training Branch Plan Military Officer in the same unit
between the years 1987-1994.
He worked as 70th Mechanized Brigade Tank Batt, Tank Company Commander (Cizre)
between the years 1994-1997, Class-Military Officer and Class Authority in Ncos Preparatory
School Command (Balıkesir) between the years 1997-2001, Tank Company Commander in the
Turkish Batt Task Force of Kosovo in 2000 within the same period, Support Troops Commander in
the 172nd Mechanized Infantry Brigade (Islahiye) between the years 2001-2003, Tank Batt Task
Force Commander of the 9th Motorized Infantry Brigade (Sarıkamış) between the years 2003-
2006, Maneuver Lecturer in Battle Simulation Training Center of Command of the Cyprus-Turkish
Peace Forces between the years 2006-2008.
İsmail TEKİN completed his Masters Degree in the International Relations Department of
Girne American University between the period of 2007-2008, following that he was appointed as
the Chairman of the Tactics Board and General Matters of Armoured Forces School and Training
Division Command, he worked as Teacher, Military Officer of Plan and Chairman of the Board for
three years and he retired from Armed Forces in August 2011 and he worked as manager in a
Ankara-based Private Security company for one year in 2012.
İsmail TEKİN who has an authorization certificate of Documentation and Internal Controller
from TSE ISO 9001 Quality Assurance System and has attended the Teacher Trainee Course which
was established by the Educational Sciences Faculty of Ankara University and Command of
Armoured Forces School, is currently working as an Operating Manager in a business center.
Duties Carried Out Within The Last 10 Years
A. Ongoing Duties
Gübre Fabrikaları T.A.Ş. Independent Member of the Board of Directors
Bayraktar İnşaat Via Twins Business Center Operating Manager

2013 OPERATING REVIEW REPORT| 37
B. Duties Ended
9th Motorized İnfantry Brigade Tank Battalion Command 2003-2006 Appointment
Battalion Duty Forces Command (Sarıkamış),
Cyprus Turkish Peace Forces Command Coaching 2006-2008 Appointment
Combat Simulation Classroom
Armoured Forces School and Education Chairman 2008-2011 Retired
Division Command Tactics and General Issues
Board Chairmanship
Onur-Alp Özel Güvenlik Ltd.Şti. ANKARA Management 2011-2012 Resignation
Collective Declaration of Independency of our Independent Members of the Board of
Directors has been set forth as follows:
Declaration Of Independency
I hereby declare that I am a candidate to take office as an independent member of the
Board of Directors of Gübre Fabrikaları T.A.Ş. (the Company) within the scope of the criteria
specified under the Corporate Governance Principals which have been published by the
legislation, the articles of association and the Capital Market Board and in this context I declare
that;
a) Within the last five years; I, my wife and my third degree consanguine and my relatives
by marriage have not, directly or indirectly, been in a relationship of employment or substantial
trading with the Company, one of the parties which are in a relationship with the company or the
legal entities which are, in terms of management and capital, related to the shareholders, who
directly or indirectly hold 5% or more shares of the company capital.
b) Within the last five years, I have not worked in the companies which have been
conducting all or a part of the activities and organizations of the Company, primarily the
companies which conduct auditing, ranking and consultancy of the Company.
c) Within the last five years, I have not been a shareholder, an employee or a member of
the board of directors of any firm which provide substantial service and product to the company,

2013 OPERATING REVIEW REPORT| 38
d) I am not a shareholder of the company capital,
e) As it is seen from my attached resume, I have the professional education, knowledge
and experience to conduct the duties which I will undertake due to being an independent member
of the board of directors,
f) I do not work full-time in the public agencies and institutions due to the current
situation,
g) I am respected as a resident of Turkey under the Income Tax Law,
h) I can provide positive contributions to the activities of the company, I will remain
objective in cases of conflicting interests to be emerged between of the shareholders of the
company, I will make my decision freely taking into account the interests of the stakeholders,
i) I will allocate time for the company works to be able to follow up the the processes of
the company’s activities and fullfil the duties which I have undertaken to the fullest extent.
16. Principles of Activity of the Board of Directors
Provisions of the Articles of Association, Turkish Commercial Code and Capital Market Law
are complied with for the meetings and meeting quorums of the Board of Directors. Office
Directorate has been constituted to conduct the works with regard to the meetings of the Board
of Directors of the Company and to service the members of the board of directors under the
General Manager. They prepare their motions for the works regarding which resolutions (which
are regarding the departments of the Company) are needed and they transmit it to the Office
Directorate upon obtaining the approval of the General Directorate. An agenda regarding these
motions is formed and it is transmitted to the chairman of the board of directors with the
invitation letter for the meeting of the board of directors. The chairman of the board of directors
signs the invitation letter and sends the invitation letter to the members together with the
agenda. The resolutions which were taken in the meeting are sent to the relevant departments
after the meeting. 25 meetings of the board of directors have been made within the year. The
members of the board of directors do not have dominant voting right and negative veto right.
Principally, the members of the board of directors attend each meeting. The Board of Directors
meets regularly and within the framework of the provisions of the articles of association at least
once a month and the Board of Directors meets when necessary without complying with such

2013 OPERATING REVIEW REPORT| 39
timetable. Besides, the members of the Board of Audit attend the meetings of the Board of
Directors from time to time.
17. Numbers, Structures And Independencies Of The Committees Constituted By The
Board Of Directors
The Board of Directors has formed Committee of Audit, Committee of Corporate
Governance, Committee of Nomination, Committee of Early Determination of the Risk, and
Committee of Remuneration for the purposes of performance of its duties and responsibilities
wholesomely in accordance with the current position of the company and the needs of the
company. These Committees conduct their activities in accordance with the communiqués of the
Capital Market Board.
Committee of Audit
Name Title Duty
Prof. Dr. Lokman DELİBAŞ Head of Committee Board Member -Independent
İsmail TEKİN Committee Member Board Member –Independent
Committee of Audit has been constituted by the resolution of the Board of Directors dated
26.04.2012 pursuant to the Turkish Commercial Law, articles of association of the Company and
the Communiqué regarding Corporate Governance Principals of the Capital Market Board. The
Committee is composed of two members of the Board of Directors. Independent member Prof. Dr.
Lokman Delibaş is the Chairman of the Committee. Other member of the Committee is İsmail
Tekin.
Duties and responsibilities of the Committee are as follows;
To audit the financial statements and footnotes, both of which are disclosed to
public, in terms of compliance with the current legislation and international
accounting standards,
To review the activity report and to review the information indicated in the activity
report in terms of their accuracy and consistency compared to the information of
the Committee,

2013 OPERATING REVIEW REPORT| 40
To examine the complaints which are serious enough to affect the financial
statement submitted by the shareholders and stakeholders,
To review the efficiency of the internal audit activities,
To make sure that the important problems which are determined during or as a
result of the audits of the internal audit department of the company and to m**ake
sure that relevant proposals for elimination of these problems are notified to the
Committee on time,
To observe whether the activities of the company are conducted in accordance with
the current legislation and internal regulations of the company
Committee of Corporate Governance
Name Title Duty
Prof. Dr. Lokman DELİBAŞ Head of Committee Board Member -Independent
Dr. Erol DEMİR Committee Member Board Member
Hamdi GÖNÜLLÜ Committee Member Board Member
Committee of Corporate Governance has been constituted by the resolution of the Board
of Directors dated 26.04.2012 pursuant to the Turkish Commercial Law, articles of association of
the Company and the Communiqué regarding Corporate Governance Principals of the Capital
Market Board.
The Committee is composed of three members of the Board of Directors. Independent
member Prof. Dr. Lokman Delibafl is the Chairman of the Committee. Other members of the
Committee are Dr. Erol Demir and Hamdi Gönüllü.
Duties and responsibilities of the Committee are as follows;
To provide the constitution and adaptation of the importance and benefits of the
Corporate Governance Principals within the structure of the company,
To determine whether the Corporate Governance Principals are being applied and if
they are not applied to determine the reasons and to determine the conflicting
interests due to noncompliance with these principals accurately and to submit
reformatory recommendations to the Board of Directors regarding the procedures
of the corporate governance applications.

2013 OPERATING REVIEW REPORT| 41
Committee of Nomination
Name Title Duty
İsmail TEKİN Head of Committee Board Member -Independent
Ahmet BOYRAZ Committee Member Board Member
Ali SARI Committee Member Board Member
Committee of Nomination has been constituted by the resolution of the Board of Directors
dated 26.04.2012 pursuant to the Turkish Commercial Law, articles of association of the Company
and the Communiqué regarding Corporate Governance Principals of the Capital Market Board.
The Committee is composed of two members of the Board of Directors. Independent
member İsmail Tekin is the Chairman of the Committee. Other member of the Committee is
Ahmet Boyraz.
Duties and responsibilities of the Committee are as follows;
To form a transparent system for the determination, assessment and training of the
appropriate candidates for the Board of Directors and to determine policies and
strategies in this regard,
To make regular assessments regarding the structure and efficiency of the board of
directors and to submit recommendations to the Board of Directors regarding
changes in this regard,
To determine approaches, principals and procedures regarding the performance
assessment and career planning of the members of the Board of Directors and the
senior managers and to make supervision in this regard,
Committee of Early Determination of The Risk
Name Title Duty
Prof. Dr. Lokman DELİBAŞ Head of Committee Board Member-Independent
Dr. Erol DEMİR Committee Member Board Member
Hamdi GÖNÜLLÜ Committee Member Board Member
Committee of Early Determination of the Risk has been constituted by the resolution of the
Board of Directors dated 26.04.2012 pursuant to the Turkish Commercial Law, articles of

2013 OPERATING REVIEW REPORT| 42
association of the Company and the Communiqué regarding Corporate Governance Principals of
the Capital.
Market Board, for the purposes of early determination of the risks which may jeopardize
existence, development and continuance of the Company, application of the necessary measures
regarding the determined risks and management of the risk.
The Committee is composed of three members of the Board of Directors. Independent
member Prof. Dr. Lokman Delibaş is the Chairman of the Committee. Other members of the
Committee are Dr. Erol Demir and Hamdi Gönüllü.
Duties and responsibilities of the Committee are as follows;
To prepare the risk management strategies and policies to be followed up by the Company
and to submit them for the approval of the Board of Directors and to follow up the applications
closely,
To submit proposals to the Board of Directors in order to determine the limits with regard
to the major risks that the Company carries and track the limit violations,
To submit proposals to the Board of Directors with regard to making changes in the risk
management policies,
To provide the conduct of the tracking and communication during the process of risk
determination, identification, measurement, assessment and management.
To form a basis for the provision of the accuracy and reliability of the method and results
and of the risk.
The Committee has made 5 meetings in 2013 activity year.
Committee of Remuneration
Name Title Duty
İsmail TEKİN Head of Committee Board Member - Independent
Ahmet BOYRAZ Committee Member Board Member
Ali SARI Committee Member Board Member
Committee of Remuneration System has been constituted by the resolution of the Board of
Directors dated 26.04.2012 pursuant to the Turkish Commercial Law, articles of association of the

2013 OPERATING REVIEW REPORT| 43
Company and the Communiqué regarding Corporate Governance Principals of the Capital Market
Board.
The Committee is composed of two members of the Board of Directors. Independent
member İsmail Tekin is the Chairman of the Committee. Other member of the Committee is
Ahmet Boyraz.
Duties and responsibilities of the Committee are as follows;
To determine the proposals regarding the principals of the remuneration system of the
members of the Board of Directors and the senior managers taking into consideration the long
term targets of the company,
To determine the criteria which may be used for the remuneration system taking into
account the performance of the Company and the member,
To submit the proposals regarding the remunerations which will be paid to the members of
the Board of Directors and the senior managers, to the Board of Directors, taking into
consideration their level of meeting with the criteria.
18. Risk Management and Internal Control Mechanism
Department of Risk Management has been constituted for the purposes of early
determination of the risks which may jeopardize existence, development and continuance of
Gübre Fabrikaları T.A.Ş. application of the necessary measures regarding the determined risks and
management of the risk. Companywide, risks are tracked on the basis of four categories which are
financial risks, strategic risks, operational risks and other risks. Daily and monthly reports are
produced with regard to the risk management. Moreover Department of Internal Audit exists
which conducts its activities under the General Directorate of the Company and this Department
periodically audits the activities of our company and submits its reports to the General
Directorate.
19. Strategic Goals Of The Company
To be a company that benefits from contemporary technological changes as much as
possible, grounding on quality consciousness, efficient resource management, continous
improvement, productivity and customer oriented management; to be a leading company for
Turkish agriculture by creating synergy together with the academic world, relevant institutions and
Agriculture Credit Cooperatives.
2013 OPERATING REVIEW REPORT| 44
To become the leading company that can drive its sector with its infrastructure and well
known trademark name “Gübretaş”; to attain global competitive power with its production
technology.
Adopting the motto of ‘Human First’, to be a company which provides physical and social
facilities to its workers, both spiritual and material, keeps environment consciousness and human
health foreground, supports social projects.
To be a company which provides to customers different possibilities and alternatives in
agriculture sector, to provide product variety, information bank and accredited laboratories for
the need of farmers, to emphasize R & D works by following up the modern developments in the
world.
Encouraged by the company’s origin and past, to make manufacturing and procuring of
chemical fertilizer with best quality at our well equipped factories with our expert staff and
managements, creating the best marketing and distribution network to our customers,
To keep market advantage and preserving sustainable growth trend in accordance with
“highest quality, reasonable cost” approach.
To emphasize advertisement and public relations works by establishing communication
channels and bridges between Gübretaş - Public and Farmers and to do image development
activities convenient to Gübretaş’s corporate structure and spread them in and outside the
company,
To reach the quality that could compete with the world in sense of productivity, efficiency
and the world standards, procuring its raw material needs itself, efficient resource management,
having production and infrastructure establishments within the country and abroad and adopting
relevant policies.
To be a company that measures its success with the customer satisfaction who could find a
fast and best quality solutions to the needs of the customers.
20. Remuneration of the Board of Directors
The amounts of the attendance fees and and travel allowances to be paid to the Members
of the Board of Directors of our Company are determined by the General Assembly, and such
amounts are determined in accordance with the international standards and legal liabilities and
taking into account the members of the board of directors, top managers, economic data in the
market, current remuneration system policies in the market, company size and experiences,
2013 OPERATING REVIEW REPORT| 45
education levels and of the people, their contributions to the company and their current positions.
Options of the share certificates or payment plans based on the performance of the company are
not used for the remuneration system of the independent members of the board of directors. Also
any charges such as credit or lend have not been paid to the members of the Board of Directors.

2013 OPERATING REVIEW REPORT| 46
VIII. CONCLUSION
DEAR SHAREHOLDERS,
507.000 tons of various types of chemical fertilizer has been produced at our facilities in
2013 and 90.319 tons of produced fertilizer have been used as raw material. 1.904.845 tons of
nitrogenous fertilizer at first which cannot be produced in our facilities and is consumed too much
in our country is procured from domestic and foreign markets. On the other hand, 1.651.237 tons
of solid, 1.826.930 tons of liquid and 14.342.919 tons of powder fertilizers has been sold in 2013.
Net sale revenues realized as 1.367.557.790 TRL.
Also 1.601.228 tons of fertilizer has been produced, 922.314.666 TRL sale revenues has
been got by sale of 1.297.144 tons of fertilizer and fertilizer raw material in our affiliated company
Razi Petrochemical Co.
Our company reached to 2.265.437.409 TRL consolidated sales revenue. Beside this by
adding 1.683.267.296 TRL cost of goods sold, 187.382.039 TRL operation expenses, 97.451.106 TRL
financial expenses and 41.930.108 TL net effect of other income and expenses, 276.061.074 TRL
profit have been occurred before tax. 280.751.618 TRL net consolidated profit has been occured
after adding 8.005.857 TRL deferred tax and 3.315.313 TRL current period’s tax. 94.713.933 TRL
main shareholder profit has been occured after deducting 186.037.684 TRL shares of minority
shareholders.
We would kindly like to ask you to evaluate the results mentioned above regarding 2013
activities.
Best Regards,
BOARD OF DIRECTORS

GÜBRE FABRİKALARI T.A.Ş.
AND ITS SUBSIDIARIES
AUDITED CONSOLIDATED FINANCIAL
STATEMENTS FOR THE PERIOD
1 JANUARY - 31 DECEMBER 2013

CONVENIENCE TRANSLATION OF
INDEPENDENT AUDIT REPORT
INTO ENGLISH ORIGINALLY ISSUED IN TURKISH
INDEPENDENT AUDITORS’ REPORT
To the Board of Directors of
Gübre Fabrikaları T.A.Ş.
We have audited the accompanying consolidated financial statements of Gübre Fabrikaları T.A.Ş. ("Company")
and its subsidiaries (together “the Group”), which comprise of the consolidated balance sheet as of 31 December
2013 and the consolidated statement of profit of loss, consolidated statement of other comprehensive income,
consolidated statement of changes in equity and consolidated statement of cash flows for the year then ended and
a summary of significant accounting policies and other explanatory information.
Management Responsibility for the Financial Statements
Group Management is responsible for the preparation and fair presentation of these consolidated financial
statements in accordance with Turkish Accounting Standards (“TAS”) published by Public Oversight
Accounting and Auditing Standards Authority (“POA”), and for such internal control as management determines
is necessary to enable the preparation of consolidated financial statements that are free from material
misstatement, whether due to fraud or error.
Auditors’ Responsibility
Our responsibility is to express an opinion on these financial statements based on our audit. We conducted our
audit in accordance with auditing standards published by the Capital Markets Board. Those standards require
that we comply with ethical requirements and plan and perform the audit to obtain reasonable assurance whether
the financial statements are free from material misstatement.
An audit involves performing procedures to obtain audit evidence about the amounts and disclosures in the
financial statements. The procedures selected depend on the auditor’s judgment, including the assessment of the
risks of material misstatement of the financial statements, whether due to fraud or error. In making those risk
assessments, the auditor considers internal control relevant to the entity’s preparation and fair presentation of the
financial statements in order to design audit procedures that are appropriate in the circumstances, but not for the
purpose of expressing an opinion on the effectiveness of the entity’s internal control. An audit also includes
evaluating the appropriateness of accounting policies used and the reasonableness of accounting estimates made
by management, as well as evaluating the overall presentation of the financial statements.
We believe that the audit evidence we have obtained is sufficient and appropriate to provide a basis for our audit
opinion.

Opinion
In our opinion, the accompanying consolidated financial statement give a true and fair view of consolidated
financial position of Gübre Fabrikaları T.A.Ş., its subsidiaries and joint ventures as at 31 December 2013, and
their financial performance and cash flows for the year then ended in accordance with TMS (Note 2)
Reports on Other Legal and Regulatory Requirements
In accordance with Article 402 of Turkish Commercial Code No. 6102 (“TCC”), the Board of Directors provided
us all the required information and documentation in terms of audit; and nothing has come to our attention that
may cause us to believe that the Group’s set of accounts prepared for the period 1 January-31 December 2013
does not comply with the code and the provisions of the Company’s articles of association in relation to financial
reporting.
In accordance with Article 378 of Turkish Commercial Code No. 6102, in publicly traded companies, the board
of directors is obliged to establish a committee consisting of specialized experts, to run and to develop the
necessary system for the purposes of early identification of any risks that may compromise the existence,
development and continuation of the company; applying the necessary measures and remedies in this regard and
managing such risks. According to paragraph 4 of Article 398 of the same code, the auditor is required to prepare
a separate report explaining whether the Board of Directors has established the system and authorized committee
stipulated under Article 378 to identify risks that threaten or may threaten the company and to provide risk
management, and, if such a system exists, the report, the principles of which shall be announced by POA, shall
describe the structure of the system and the practices of the committee. This report shall be submitted to the
Board of Directors along with the auditor’s report. Our audit does not include the evaluation of the operational
efficiency and adequacy of the operations carried out by the management of the Group in order to manage these
risks. As of the balance sheet date, POA has not announced the principles of this report, yet. Therefore, no
separate report has been drawn up regarding this matter. On the other hand, the Company established the
mentioned committee in 20 April 2012, and the committee is comprised of 3 members. Since the date of its
establishment, the committee has held six meetings for the purposes of early identification of any risks that may
compromise the existence and development of the Company, applying the necessary measures and remedies in
this regard and managing such risks, and has submitted the relevant reports to the Board of Directors.
Other Matters
Without qualifying our opinion we would like to emphasise the following matters:
As explained in Note 18, Iran Tax Authority has performed tax assessments for the tax filings of Razi for the
years ended in 2012. As a result of these assessments, the Iran Tax Authority has identified that Razi has
recognized export sales as non-taxable income. The export sales were considered as taxable by the Iran Tax
Authority and Razi was imposed to a total of TRY 13 million additional tax charge. Razi has protested against
this claim. Based on the opinions of legal advisors and tax experts, the Group Management has not provided any
provisions in the consolidated financial statements.
As explained in Note 18, the sanctions imposed on Iran by United Nations and recently suspended at a certain
level for a period of six months, may have an effect on the operations of the subsidiary of the Group. The
economic stability of the Iran depends on the measures that will be taken by the government and the outcome of
the legal, administrative and political processes. These processes are beyond the control of the companies
established in the country. Consequently, the entities operating within Iran must consider risks that may not
necessarily be observable in other markets. These consolidated financial statements contain the Group
management’s estimations on the economic and financial positions of its subsidiaries and affiliates operating in
Iran. The future economic situation of Iran might differ from the Group’s expectations.
As explained in Note 18, İskenderun State Treasury Office (“Treasury”) has filed a lawsuit against the Group in
November, 2011 for the cancellation of its title deed and demanded enforced evacuation of Group’s 79.350 m2
property located in the Sarıseki province of İskenderun within the city of Hatay claiming that the property is
within the shoreline. The net book value of the property is TRY 82.819.021 and has been accounted as
investment property in the accompanying consolidated financial statements. The Group has objected the lawsuit
asked for a new expert report for the determination of shoreline and at the same time filed another lawsuit for a
compensation of its ownership right of the property. The litigation process is ongoing as of the report date. Based
on the opinions of legal advisors, the Group Management has not provided any provisions in the consolidated
financial statements for this lawsuit.

As explained in Note 9 and 18, Tabosan Mühendislik İmalat ve Montaj A.Ş. (“Tabosan”), one of the consortium
partners of the Group at the acquisition of Razi shares have filed a petition for adjournment of bankruptcy in 2011
but the bankruptcy court rejected the petition and decided on the bankruptcy of Tabosan and formation of a
trustee committee to manage the assets of Tabosan. The Group was the guarantor of Tabosan for the loans
obtained from financial institutions during the acquisition of Razi shares. The group has paid 48.722.651 TL for
the loan of Tabosan as the guarantor and and recognized this amount as other receivable from Tabosan. The
Group has not provided any provision for this receivable considering its right to buy Razi shares at the initial
acquisition share price and the pledged assets of Tabosan which are transferred from the financial institutions.
The negotiations between the Group and the trustee committee are ongoing as of the date of this report.
As explained in Note 2 and 35, Central Bank of Iran Islam Republic has been applying a fixed exchange rate
regime since 28 January 2012. All foreign currency transactions are accounted using the fixed exchange rate
which differs significantly from the market exchange rates in current period. In September 2012 Iran Islam
Republic government has incorporated a Foreign Exchange Center (“Center”) monitored by Central Bank of Iran
Islam Republic which announce foreign currency rates that are more close to the market rates. IAS 21 requires
companies to use the rate that the future cash flows represented by the transaction or balance could have been
settled if those cash flows had occurred at the measurement date. The Group management, considering the
unreliability of the market rates and the uncertainty in determining the rate that the future cash flows will be
settled has used the indicative rates published by the Center. Similarly market rates and the Center rates are used
in determining the average rate.
DRT BAĞIMSIZ DENETİM VE SERBEST MUHASEBECİ MALİ MÜŞAVİRLİK A.Ş.
Member of DELOITTE TOUCHE TOHMATSU LIMITED
Ferda Elerman, SMMM
Partner
İstanbul, 11 March 2014

INDEX PAGE
CONSOLIDATED BALANCE SHEET ......................................................................................................... 1- 2
CONSOLIDATED STATEMENT OF PROFIT OR LOSS .............................................................................. 3
CONSOLIDATED STATEMENT OF COMPREHENSIVE INCOME .......................................................... 4
CONSOLIDATED STATEMENT OF CHANGES IN EQUITY..................................................................... 5
CONSOLIDATED STATEMENTS OF CASH FLOWS ................................................................................... 6
NOTES TO THE AUDITED CONSOLIDATED FINANCIAL STATEMENTS
NOTE 1 ORGANIZATION AND OPERATIONS OF THE GROUP ......................................................... 7-8
NOTE 2 BASIS OF PRESENTATION OF FINANCIAL STATEMENTS ........................................... 8 - 24
NOTE 3 BUSINESS COMBINATIONS ..................................................................................................... 24
NOTE 4 SHARES IN OTHER BUSINESSES .......................................................................................... 25
NOTE 5 OPERATING SEGMENTS .................................................................................................... 25 - 28
NOTE 6 STATEMENTS OF RELATED PARTIES ........................................................................... . 29 - 30
NOTE 7 TRADE RECEIVABLES AND PAYABLES ........................................................................ 31 - 32
NOTE 8 RECEIVABLES FROM AND PAYABLES TO FINANCE SECTOR .................................... . .32
NOTE 9 OTHER RECEIVABLES AND PAYABLES ........................................................................ 32 - 33
NOTE 10 INVENTORIES ............................................................................................................................. 34
NOTE 11 LIVE ASSETS ................................................................................................................................ 34
NOTE 12 RECEIVABLES AND PAYABLES FROM FINANCE SECTOR ............................................... 34
NOTE 13 INVESTMENT PROPERTIES ...................................................................................................... 35
NOTE 14 TANGIBLE FIXED ASSETS ................................................................................................ 36 - 38
NOTE 15 INTANGIBLE FIXED ASSETS ................................................................................................... 39
NOTE 16 GOODWILL .................................................................................................................................. 39
NOTE 17 GOVERNMENT INCENTIVE AND GRANTS ........................................................................... 40
NOTE 18 PROVISIONS, CONTINGENT ASSETS AND LIABILITIES ............................................. 40 - 42
NOTE 19 COMMITMENTS................................................................................................................... 42 - 43
NOTE 20 EMPLOYEE BENEFITS ........................................................................................................ 43 - 44
NOTE 21 QUALITATIVE DISTRIBUTION OF EXPENSES ...................................................................... 44
NOTE 22 OTHER ASSETS AND LIABILITIES ........................................................................................ . 45
NOTE 23 CAPITAL, RESERVES AND OTHER EQUITY COMPONENTS ............................................. 45
NOTE 24 REVENUES ............................................................................................................................ 46 - 47
NOTE 25 CONSTRUCTION CONTRACTS ................................................................................................. 47
NOTE 26 GENERAL ADMINISTRATION EXPENSES, MARKETING EXPENSES, RESEARCH AND
DEVELOPMENT EXPENSES ..................................................................................................... 48
NOTE 27 OTHER REAL OPERATING INCOME AND EXPENSES … .................................................... 49
NOTE 28 INVESTMENT INCOME AND EXPENSES ............................................................................... 49
NOTE 29 FINANCIAL EXPENSES ............................................................................................................. 50
NOTE 30 ANALYSIS OF OTHER COMPRHENSIVE INCOME COMPONENTS ................................... 50
NOTE 31 NON-CURRENT ASSETS HELD FOR SALES AND DISCONTINUED OPERATIONS ........ 51
NOTE 32 INCOME TAXES (INCLUDING DEFERRED ASSETS AND LIABILITIES) ................... 51 - 53
NOTE 33 EARNINGS PER SHARE ............................................................................................................. 53
NOTE 34 FINANCIAL INSTRUMENTS .............................................................................................. 53 - 55
NOTE 35 THE QUALITY AND LEVEL OF FINANCIAL INSTRUMENT RISKS ............................ 56 - 65
NOTE 36 FINANCIAL INSTRUMENTS (FAIR VALUE EXPLANATIONS AND EXPLANATIONS
WITHIN THE FRAME OF HEDGE ACCOUNTING) ......................................................... 66 - 67
NOTE 37 EVENTS AFTER THE BALANCE SHEET DATE ..................................................................... 67
NOTE 38 OTHER MATTERS THAT MATERIALLY AFFECT THE FINANCIAL STATEMENTS
OR THAT NEED TO BE EXPLAINED FOR CLEAR, INTERPRETABLE AND
UNDERSTANDABLE FINANCIAL STATEMENTS .................................................................. 67
NOTE 39 EXPLANATIONS ABOUT STATEMENT OF CASH FLOW ..................................................... 68

GÜBRE FABRİKALARI T.A.Ş. AND ITS SUBSIDIARIES
AUDITED CONSOLIDATED BALANCE SHEET AS AT 31 DECEMBER 2013
(Amounts are expressed in thousands of Turkish Lira (“TRL”) unless otherwise stated.)
The accompanying notes form an integral part of these consolidated financial statements.
1
Cari Dönem Geçmiş Dönem
Independent Audited Independent Audited
Notes 31 December 2013 31 December 2012
ASSETS
Current Assets 1.753.759.239 1.299.976.936
Cash and cash equivalents 39 568.223.098 430.098.290
Financial Investments 34 3.207.694 29.665.189
Trade receivables 7 406.565.014 381.204.373
- Trade receivables from related parties 6 75.727.185 167.732.649
- Other trade receivables from not related
parties330.837.829 213.471.724
Other receivables 9 171.609.213 101.789.202
- Other receivables from related parties 6 93.882.615 43.842.069
- Other receivables from not related parties 77.726.598 57.947.133
Inventories 10 505.850.794 315.403.041
Prepaid expenses 12 34.817.480 11.923.583
Assets related to current tax 4.761.811 2.805.799
Other Current Assets 22 58.724.135 27.087.459
SUBTOTAL 1.753.759.239 1.299.976.936
Fixed Assets 1.185.149.985 854.918.341
Financial investments 34 2.737.515 2.737.515
Other receivables 9 164.673.423 100.603.112
Other receivables from related parties 6 118.039.402 75.382.511
Other receivables from third parties 46.634.021 25.220.601
Investments valued by equity method 4 7.057.522 14.207.046
Investment properties 13 103.334.153 82.819.021
Tangible fixed assets 14 723.727.864 510.110.928
Intangible fixed assets 148.949.164 120.962.654
Goodwill 16 148.811.828 120.811.461
Other intangible assets 15 137.336 151.193
Prepaid expenses 12 30.143.512 23.240.046
Deferred tax assets 32 4.522.794 234.629
Other non-current assets 4.038 3.390
TOTAL ASSETS 2.938.909.224 2.154.895.277
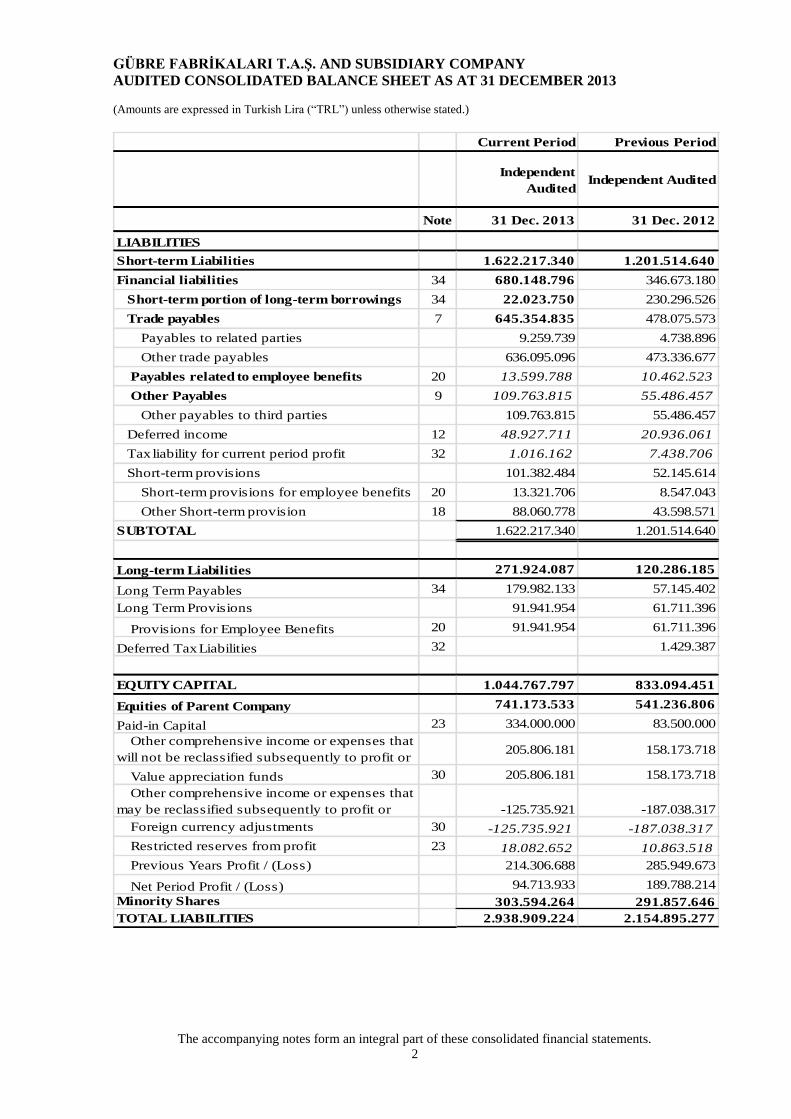
GÜBRE FABRİKALARI T.A.Ş. AND SUBSIDIARY COMPANY
AUDITED CONSOLIDATED BALANCE SHEET AS AT 31 DECEMBER 2013
(Amounts are expressed in Turkish Lira (“TRL”) unless otherwise stated.)
The accompanying notes form an integral part of these consolidated financial statements.
2
Current Period Previous Period
Independent
AuditedIndependent Audited
Note 31 Dec. 2013 31 Dec. 2012
LIABILITIES
Short-term Liabilities 1.622.217.340 1.201.514.640
Financial liabilities 34 680.148.796 346.673.180
Short-term portion of long-term borrowings 34 22.023.750 230.296.526
Trade payables 7 645.354.835 478.075.573
Payables to related parties 9.259.739 4.738.896
Other trade payables 636.095.096 473.336.677
Payables related to employee benefits 20 13.599.788 10.462.523
Other Payables 9 109.763.815 55.486.457
Other payables to third parties 109.763.815 55.486.457
Deferred income 12 48.927.711 20.936.061
Tax liability for current period profit 32 1.016.162 7.438.706
Short-term provisions 101.382.484 52.145.614
Short-term provisions for employee benefits 20 13.321.706 8.547.043
Other Short-term provision 18 88.060.778 43.598.571
SUBTOTAL 1.622.217.340 1.201.514.640
Long-term Liabilities 271.924.087 120.286.185
Long Term Payables 34 179.982.133 57.145.402
Long Term Provisions 91.941.954 61.711.396
Provisions for Employee Benefits 20 91.941.954 61.711.396
Deferred Tax Liabilities 32 1.429.387
EQUITY CAPITAL 1.044.767.797 833.094.451
Equities of Parent Company 741.173.533 541.236.806
Paid-in Capital 23 334.000.000 83.500.000
Other comprehensive income or expenses that
will not be reclassified subsequently to profit or 205.806.181 158.173.718
Value appreciation funds 30 205.806.181 158.173.718
Other comprehensive income or expenses that
may be reclassified subsequently to profit or -125.735.921 -187.038.317
Foreign currency adjustments 30 -125.735.921 -187.038.317
Restricted reserves from profit 23 18.082.652 10.863.518
Previous Years Profit / (Loss) 214.306.688 285.949.673
Net Period Profit / (Loss) 94.713.933 189.788.214
Minority Shares 303.594.264 291.857.646
TOTAL LIABILITIES 2.938.909.224 2.154.895.277

GÜBRE FABRİKALARI T.A.Ş. AND ITS SUBSIDIARY COMPANY
CONSOLIDATED STATEMENT OF PROFIT OR LOSS FOR YEAR THAT ENDED AS OF 31
DECEMBER 2013
(Amounts are expressed in Turkish Lira (“TRL”) unless otherwise stated.)
The accompanying notes form an integral part of these consolidated financial statements.
3
Current Period Previous Period
Independent Independent
Audited Audited
1 January – 1 January –
31 December 2013 31 December 2012
CONTINUING OPERATIONS
Sales (net) 24 2.265.437.409 2.226.819.536
Cost of Sales (-) 24 (1.683.267.296) (1.579.614.777)
GROSS PROFIT 582.170.113 647.204.759
Administrative Expenses (-) 26 (84.344.878) (47.299.084)
Marketing, Sales and Distribution Expenses (-) 26 (166.243.163) (118.334.983)
Other Operating Incomes 27 361.102.384 207.014.704
Other Operating Expenses (-) 27 (293.898.582) (69.884.676)
OPERATION PROFIT 398.785.874 618.700.720
Income from investment activities 28 52.814.347 61.868.087
Expenses from investment activities (-) 28 (61.666.133) (30.401.278)
Shares in Profit/Loss of Investments Valued by
Equity Method4 (16.421.908) (7.534.678)
OPERATING PROFIT/LOSS BEFORE FINANCE
EXPENSE373.512.180 642.632.851
Finance expenses (-) 29 (29.828.448) (17.126.478)
PRE-TAX PROFIT/LOSS FROM
CONTINUING OPERATIONS (37.834.305) (7.772.003)
Tax expense on continuing operations 4.690.544 (42.407.514)
Period tax expense (-) 32 (3.315.313) (37.834.305)
Deferred tax income / (expense) 32 8.005.857 (4.573.209)
PERIOD PROFIT/ (LOSS) 280.751.618 430.033.168
Distribution of Period Profit / (Loss)
Minority Shares 186.037.685 240.244.955
Parent Company’s Shares 94.713.933 189.788.214
Earnings / (Loss) Per Share 33 0,0028 0,0057
Note

GÜBRE FABRİKALARI T.A.Ş. AND SUBSIDIARY COMPANY
CONSOLIDATED OTHER COMPREHENSIVE STATEMENT OF PROFIT OR LOSS AS OF
31 DECEMBER 2013
(Amounts are expressed in Turkish Lira (“TRL”) unless otherwise stated.)
The accompanying notes form an integral part of these consolidated financial statements.
4
Current Period Previous Period
Independent Independent
Audited Audited
1 January – 1 January –
31 December 2013 31 December 2012
ONGOING ACTIVITIES
PERIOD PROFIT / (LOSS) 280.751.618 430.033.169
Items that will not be reclassified subsequently to profit or
loss47.632.463 13.040.178
Change in Fixed Assets Value Appreciation 50.139.435 13.726.503
Tax Incomes and Fiscal Charges Related to Other
Comprehensive Income Items(2.506.972) (686.325)
Items that may be reclassified subsequently to profit or loss 105.379.150 (578.096.009)
Foreign currency adjustments 105.379.150 (578.096.009)
OTHER COMPREHENSIVE
AFTER-TAX INCOME / (EXPENSE) 153.011.613 (565.055.831)
TOTAL COMPREHENSIVE INCOME / (EXPENSE) 433.763.231 (135.022.662)
Distribution of Total Comprehensive
Income / (Expense):433.763.231 (135.022.662)
- Minority Shares 230.114.437 -12.021.336
- Parent Company’s Shares 203.648.794 (123.001.326)
Note

GÜBRE FABRİKALARI T.A.Ş. AND SUBSIDIARY COMPANY
CONSOLIDATED STATEMENT OF CHANGES IN EQUITY FOR YEAR ENDED AS OF 31 DECEMBER 2013
(Amounts are expressed in Turkish Lira (“TRY”) unless otherwise stated)
The accompanying notes form an integral part of these consolidated financial statements.
5
Paid-in
capital
Growth
funds
Foreign
currency
conversion adjustments
Limited
provisions
segregated from profit
Gains from fixed
asset sales
Previous years profit /
(loss)
Net period
profit / (loss)
Equities of Parent
Company
Minority
Shares
Total
Equities
PRIOR PERIOD
Balances as of 1 January 2012
(Opening balances) 83.500.000 145.133.540 138.791.401 7.721.624 1.330.243 157.766.115 129.995.209 664.238.132 537.376.777 1.201.614.909
Previous year profit/transfer (at loss) 1.811.651 128.183.558 (129.995.209) - -
Minority shares purchase - (233.497.795) (233.497.795)
Total comprehensive income 13.040.178 (325.829.718) 189.788.214 (123.001.326) (12.021.336) (135.022.662)
Balances as of 31 December 2012
(Closing balances) 83.500.000 158.173.718 (187.038.317) 9.533.275 1.330.243 285.949.673 189.788.214 541.236.806 291.857.646 833.094.452
Increase/decrease due to changes in
proportion of ownership interest in
subsidiaries that does not result in loss of control
Paid-in
capital
Growth
funds
Foreign currency
conversion
adjustments
Limited
provisions
segregated
from profit
Gains
from fixed asset sales
Previous
years profit / (loss)
Net period
profit / (loss)
Equities of
Parent
Company
Minority
Shares
Total
Equities
CURRENT PERIOD
Blances as of 1 January 2013
(Opening balances) 83.500.000 158.173.718 (187.038.317) 9.533.275 1.330.243 285.949.673 189.788.214 541.236.806 291.857.646 833.094.452
Previous year profit/transfer (at loss) 7.166.725 182.621.489 (189.788.214) - -
Capital increase 250.500.000 (250.500.000) - -
Minority shares purchase - (214.553.092) (214.553.092)
Purchase of minority shares (3.712.065) (3.712.065) (3.824.727) (7.536.792)
Gains from fixed asset sales 52.409 (52.409) - -
Total comprehensive income 47.632.463 61.302.396 94.713.933 203.648.792 230.114.437 433.763.229
Balances as of 31 December 2013
(Closing balances) 334.000.000 205.806.181 (125.735.921) 16.700.000 1.382.652 214.306.688 94.713.933 741.173.533 303.594.264 1.044.767.797

GÜBRE FABRİKALARI T.A.Ş. AND SUBSIDIARY COMPANY
CONSOLIDATED CASH FLOW STATEMENT FOR YEAR THAT ENDED AS OF 31 DECEMBER 2013
(Amounts are expressed in Turkish Lira (“TRL”) unless otherwise stated.)
The accompanying notes form an integral part of these consolidated financial statements.
6
CCurrent Period Prior Period
1 January- 1 January-
Cash flows from operations 31 December 2013 31 December 2012
Net period profit/ (loss)
280.751.618 430.033.169
Depreciation and Amortization 62.029.486 51.795.966
Incomes/Expenses from subsidiaries valued by Equity Method 16.421.908 7.534.678
Provisions for termination indemnities, permission and seniority-based
incentives 43.123.551 17.982.261
Interest Income/ Expense 3.268.203 57.725.552
Exchange rate difference income / expense 7.871.112 (22.936.701,9
Gain on sales of assets (52.040) 714.682
Exchange Difference 46.513.303 (78.785.837)
Tax (4.690.544) 42.407.514
Deferred Financial Income / Expense 1.865.458 (892.634)
Depreciation of tangible fixed assets 16.136.427
Appreciation of investment properties (20.515.132) (21.069.426)
Provisions for Doubtful Receivable / Cancellation 970.406 (1.668.830)
Cash flows resulted from the operations before the change in the capital 453.693.757 482.840.394
Changes in the capital of the company
Increase / Decrease in trade receivables (13.599.807) 195.866.378
Increase / Decrease in other receivables (142.841.908) (1.569.156)
Increase / Decrease in Inventories (205.437.943) 208.621.467
Increase / Decrease in Other Current / Fixed Assets (22.685.738) 9.175.174
Increase / Decrease in commercial liabilities 167.533.040 (310.299.143)
Increase / Decrease in liabilities related to employee benefits 3.137.264 (3.081.457)
Deferred Income 27.991.650 4.489.216
Increase / Decrease in prepaid expenses (29.797.362) (1.225.700)
Increase / Decrease in other liabilities 45.004.974 (95.223.062)
Increase / Decrease in Provisions for Liabilities 44.462.207 (19.464.406)
Increase / Decrease in Other Short-term and Long-term Liabilities - (4.950.348)
Cash resulted from or used in the operations after the change in the capital
or the capital 327.460.133 465.179.357
Paid-up interest (20.653.087) (76.527.042)
Paid-up taxes (11.912.535) (29.209.909)
Paid-up termination indemnities (35.421.645) (17.084.998)
Net cash used in operations 259.472.866 342.357.408
Cash flows used in investments
Purchase of Tangible and Intangible Asset (194.514.159) -29.742.584
Cash gained from sales of tangible and intangible asset 2.824.754 2.597.514
Cash Flow related to financial assets 26.457.495 -
Purchases related to financial investments -40.465.189
Collected Interests 17.934.165 29.988.476
Paid-up cash for affiliates capital raise -7.536.792 -233.497.797
Dividends paid for minority shares -214.553.092 -37.130.308
Cash used / gained from Investment activities -369.387.629 -308.249.888
Cash Flows from financial activities
Cash Flow related to financial liabilities 266.053.446 125.839.300
Principal Repayment of Financial Liabilities -18.013.875 -57.559.252
Net Cash used / gained in financial activities 248.039.571 68.280.048
Net increase/decrease in cash and cash equivalents 138.124.808 102.387.568
Balance of Cash and Cash Equivalents at beginning of the year 430.098.290 327.710.722
Balance of Cash and Cash Equivalents at the period-end 568.223.098 430.098.290

GÜBRE FABRİKALARI T.A.Ş. AND ITS SUBSIDIARY COMPANY
FOOTNOTES FOR FINANCIAL STATEMENTS FOR YEAR THAT ENDED AS OF 31
DECEMBER 2013
(Amounts are expressed in Turkish Lira (“TRL”) unless otherwise stated.)
7
1. GROUP’S ORGANIZATION AND MAIN BUSINESS ACTIVITY
Gübre Fabrikaları T.A.Ş. and its subsidiary company (together referred as” Group”) consists of Gübre Fabrikaları
T.A.Ş. (“Gübretaş” or “Company”), its subsidiary company and two partnerships. Gübre Fabrikaları T.A.Ş. is a
company which was established in 1952 and has been operational in production and sales of chemical fertilizer.
The Company carries out a great deal of its operations in cooperation with the Agricultural Credit Cooperatives
Central Union in Turkey. The central office of the Company is based in İstanbul, but there are other offices and
production facilities as follows.
Unit Main Activity
Yarımca Facilities Production / Port/ Warehousing
İskenderun Facilities Port/ Warehousing (on hire)
İzmir Regional Directorate of Sales Sales-Marketing/ Liquid – Powder Fertilizer Production /Storage
Samsun Regional Directorate of Sales Sales-Marketing / Warehousing
İskenderun Regional Directorate of Sales Sales-Marketing / Warehousing
Tekirdağ Regional Directorate of Sales Sales-Marketing / Warehousing
Ankara Regional Directorate of Sales Sales-Marketing
Diyarbakır Regional Directorate of Sales Sales-Marketing
Antalya Regional Directorate of Sales Sales-Marketing
The Company and its subsidiaries have 1.534 employees as of 31 December 2013 (31 December 2012: 1.536)
% 25 out of the public shares of the Company is traded on Borsa İstanbul (BİST) and recorded at Capital Markets
Board (SPK).
Here is the list of shareholders which own 10% or more share in the capital of the Company:
Name Share Rate Share Amount Share Rate Share Amount
Turkish Agricultural Credit Cooperatives75,95% 253.684.607 75,95% 63.421.152
Others 24,05% 80.315.393 24,05% 20.078.848
TOTAL 100,00% 334.000.000 100,00% 83.500.000
31 December 2013 31 December 2012
Affiliate Companies
Gübretaş participated in Razi Petrochemical Co. (“Razi”) which produces and sells both chemical fertilizer and raw
materials used for chemical fertilizer in 24 May 2008. Gübretaş has 48,88% out of the capital of Razi as the balance
sheet date (31 December 2011: 48,88%). Gübertaş has right to assign 3 names for the 5-member executive
committee of Razi. So Razi is considered as an subsidiary company because Gübretaş controls the operational
management.
Razi established Raintrade Petrokimya ve Dış Ticaret A.Ş. (“Raintrade”) in Turkey for purpose of selling
petrochemical goods outside Iran at the end of 2010. Raintrade started its activities in April 2011.Razi’s share on
Raintrade is 99% and Groups indirect share on Raintrade is 48,88%. (31 December 2012: %48,88).

GÜBRE FABRİKALARI T.A.Ş. AND ITS SUBSIDIARY COMPANY
FOOTNOTES FOR FINANCIAL STATEMENTS FOR YEAR THAT ENDED AS OF 31
DECEMBER 2013
(Amounts are expressed in Turkish Lira (“TRL”) unless otherwise stated.)
8
1. GROUP’S ORGANIZATION AND MAIN BUSINESS ACTIVITY (Cont.)
Subsidiaries
The Company participated in Negmar Denizcilik Yatırım A.Ş. (“Negmar”) which is operational in sea transport in 30
June 2008. The participant rate is 40% as the balance sheet date. (31 December 2011: 40%).
The Company participated in Tarkim Bitki Koruma Sanayi ve Ticaret A.Ş. (“Tarkim”) which produces and sells
agricultural pesticide in Turkey. The participant rate is 40% as the balance sheet date. (31 December 2011: 40%).
Available Financial Assets for Sale
Except Group subsidaries and participants, it participated in İmece Prefabrik Yapı Tarım Makineleri Temizlik ve
Güvenlik Hizmetleri Tic. A.Ş. as %15, Tarnet Tarım Kredi Bilişim ve İletişim Hizmetleri A.Ş. as %17 which are
subsidaries of the controlling shareholder established in Turkey.
Approval of Financial statements:
The financial statements were approved to be disclosed 11 March 2013 by the board of directors. The General
Assembly has the right to amend the consolidated financial statements.
2. BASIS OF PRESENTATION OF FINANCIAL STATEMENTS
2.1 Basis of Presentation
Declaration of Conformity to TAS
The Company and its participations based in Turkey draft and keep their legal records, books and financial
statements in line with Turkish Trade Law (“TTL”) and accounting principles defined by tax legislation. However
the subsidiary company operating in Iran drafts its financial statements in currency of Iranian Riyal (“IRR”) and in
compliance with Iranian legislation.
The accompanying condensed consolidated financial statements have been prepared in accordance with the
Communiqué Series II, 14.1 “Communiqué on the Principles of Financial Reporting In Capital Markets” (“the
Communiqué”) announced by the Capital Markets Board (“CMB”) on 13 June 2013 which is published on Official
Gazette numbered 28676. Turkish Accounting Standards/Turkish Financial Reporting Standards and additions and
interpretations regarding these standards as adopted by the Public Oversight Accounting and Auditing Standards
Authority (“POA”) are predicated on in accordance with article 5th of the Communiqué.
Additionally, the financial statements and notes are presented in accordance with the formats complying with CMB’s
announcement dated 7 June 2013.
Financial statements are drafted in line with historical cost accounting, apart from appraisal of fixed assets and
investment properties. To determine the historical cost, it is needed to take a fair value of the amount paid for the
assets as a basis.
Functional currency
Each Group company drafts its financial statements with the currency of the economic environment where it is
operational and so we call this currency as functional currency. The currency used in the consolidated financial
statements by the Company is Turkish Lira (“TRY”).
However, the functional currency is Iranian Riyal (“IRR”) for the subsidiary company which operates in Iran.
According to IAS 21 “The Effects of Changes in Foreign Exchange Rates”; the assets and liabilities of the Group’s
participations abroad are converted into Turkish Lira in line with the parity of exchange on the balance sheet date.
Foreign currency conversion losses or gains are kept in account of foreign currency conversion adjustments in the
equities. At the end of period, these differences are noted as gain or loss.

GÜBRE FABRİKALARI T.A.Ş. AND ITS SUBSIDIARY COMPANY
FOOTNOTES FOR FINANCIAL STATEMENTS FOR YEAR THAT ENDED AS OF 31
DECEMBER 2013
(Amounts are expressed in Turkish Lira (“TRL”) unless otherwise stated.)
9
2. BASIS OF PRESENTATION OF FINANCIAL STATEMENTS (Cont.)
2.1 Basis of Presentation (Cont.)
Functional currency (Cont.)
Foreign currency conversion losses or gains are kept in account of foreign currency conversion adjustments in the
equities. At the end of period, these differences are noted as gain or loss.
Here are the rates used:
Foreign Currency
31 December 2013 31 December 2012
End of
Period
Grade Point
Average
End of
Period
Grade Point
Average
IRR 0,0000858 0,0000769 0,0000725 0,0000868
Amendment of Financial statements during High Inflation Periods
In accordance with the 17 March 2005 dated and 11/367 numbered decision by SPK, the inflation accounting was
ended as of 1 January 2005 for the companies operational in Turkey and drafting financial statement in line with
SPK Accounting Standards or IAS/IFRS. So 29 numbered “Financial Reporting in Highly Inflated Economies”
Standard (“IAS/TAS 29”) has not been applied since 1 January 2005.
Comparative Information and Amendment of Previous Periods’ Financial Statements
In order to determine financial situation and performance trends; Group’s consolidated financial statements are
drafted in comparison with the previous period. The comparative information is re-classified if necessary to comply
with the presentation of the current period consolidated financial statements and significant differences are stated. In
the period, Group made some classifications in previous term financial statements for accomodating the format
declared by SPK dated 7 June 2013. The qualification, reason and amounts of classification are presented as follow:
Order advances amounting to 11.048.476 TL and prepaid expenses amounting to 875.107 TL shown in
other current assets were classified seperately as “prepaid expenses” account in the balance sheet
Prepaid taxes and funds amounting to 2.805.800 TL shown in other current assets were classified seperately
as “Payables related to period tax” account in the balance sheet.
Order advances amounting to 23.240.046 shown in other fixed assets were classified seperately as long
term “prepaid expenses” account in the balance sheet.
Expense Recognition amounting to 4.369.501 TL shown in Other short term liabilities were classified to
“Trade payables” account; deferred tax amounting to 1.431.026 TL were classified seperately as Deferred
Incomes account in the balance sheet.
10.462.523 TL shown in Other Payables were classified to “Payables for Employment Termination
Benefits“ account
Recieved advances amounting to 19.505.035 TL shown in Other Payables were classified to “Deferred
Incomes” account.
Receivables amounting to 8.951.586 TL shown in Other Fixed Assets were classified to “Other Receivables
from not related parties” account.
These classifications have not any effects in “Statements of Profit or Loss”
Classifications made in previous period Profit or Loss and Other Comprehensive Income Statements is as follows:
Interest Income from Main Activities amounting to 13.884.364 TL shown in Financial Income; Foreign
Exchange Gain from Main Acitivities amounting to 139.443.265 TL; Financial Incomes from Main
Activities amounting to 16.133.375 TL were classified to “Other Income from Main Activities” account in
the Profit or Loss and Other Comprehensive Income Statements.

GÜBRE FABRİKALARI T.A.Ş. AND ITS SUBSIDIARY COMPANY
FOOTNOTES FOR FINANCIAL STATEMENTS FOR YEAR THAT ENDED AS OF 31
DECEMBER 2013
(Amounts are expressed in Turkish Lira (“TRL”) unless otherwise stated.)
10
2. BASIS OF PRESENTATION OF FINANCIAL STATEMENTS (Cont.)
Interest Expenses from Main Activities amounting to 36.649.017 TL shown in Financial Expenses;
Rediscount Interest Expenses from Main Acitivities amounting to 626.233 TL; Maturity difference
expenses from Main Activities amounting to 11.186.986 TL were classified to “Other Expenses from Main
Activities” account in the Profit or Loss and Other Comprehensive Income Statements.
Consolidation Principles
The consolidated financial statements include the financial statements of the corporations controlled by the
Company and its subsidiaries or jointly controlled. The control is provided by realizing situations by the Company
as follows:
Having power on invested company/assets
Being open to have variable returns from invested company/assets or having right for these returns; and
Being able to use power for having effect on returns.
In the case of emerging events or situation which can cause occuring any changes in at least one of criterias listed
above, The Company revaluate whether or not it has control power on its investment.
The Company has control power on invested company/assets at the situations of not having majority voting rights
on invested company/assets, if it has enough voting rights to be redirected or manage related investment activities
alone. The Company, including the following indicators, take into consideration all events and situations at the
evaluation of vote majoritiesto assess it is enough for providing control power in the related company/assets.
The Comparison of Company’s and other shareholders’s voting rights;
Potential voting rights of Company and other shareholder;
Rights arising from contractual other agreements; and
All other situations and events which show whether it has current power on managing of related activities
of Company (including the votes which were performed in the previous General Assembly Meetings).
Taking in consolidation’s scope of any subsadiaries begins with having control on subsidaries by Company and ends
with losing control. Subsidaries’ Incomes and Expenses which are purchased or disposed in the year, are included to
consolidated profit or loss and other comprehensive income statement until the dispose date from purchase date.
Each items of Profit and Loss and Other Comprhensive Income belong to Parent Company’s Shareholders and
minority shares. Even if minority shares concludes with reverse balance, total comprehensive incomes of
subsidaries transfers to parent company’s shareholders and minority shares.
If necessary, the accounting policies applied in the financial statements of the subsidiary companies are amended to
comply with the accounting policies followed by the Group.
All operations, incomes, expenses and balances inside the Group are eliminated in the consolidation
Changes in the Group’s ownership interests in existing subsidiaries Changes in the Group's ownership interests in subsidiaries that do not result in the Group losing control over the
subsidiaries are accounted for as equity transactions. The carrying amounts of the Group's interests and the
noncontrolling interests are adjusted to reflect the changes in their relative interests in the subsidiaries. Any
difference between the amount by which the non-controlling interests are adjusted and the fair value of the
consideration paid or received is recognized directly in equity and attributed to owners of the Group.

GÜBRE FABRİKALARI T.A.Ş. AND ITS SUBSIDIARY COMPANY
FOOTNOTES FOR FINANCIAL STATEMENTS FOR YEAR THAT ENDED AS OF 31
DECEMBER 2013
(Amounts are expressed in Turkish Lira (“TRL”) unless otherwise stated.)
11
2. BASIS OF PRESENTATION OF FINANCIAL STATEMENTS (Cont.)
Changes in the Group’s ownership interests in existing subsidiaries (Cont.)
When the Group loses control of a subsidiary, a gain or loss is recognized in profit or loss and is calculated as the
difference between (i) the aggregate of the fair value of the consideration received and the fair value of any retained
interest and (ii) the previous carrying amount of the assets (including goodwill), and liabilities of thesubsidiary and
any non-controlling interests. All amounts previously recognized in other comprehensive income in relation to that
subsidiary are accounted for as if the Group had directly disposed of the related assets or liabilities of the subsidiary.
(for example; according to TFRS standarts related to subject, be transferred to profit/loss or the transfer directly to
retained earnings). The fair value of any investment retained after the sales of a subsidiary at the date when control
is lost, is regarded as the fair value on initial recognition accounting within the scope of TAS 39 “Financial
Instruments: Recognition and Measurement”, when applicable, the cost on initial recognition of an investment in an
associate or a joint venture.
2.2 Amendments in Accounting Policies
Significant changes in the accounting policies are retroactively applied and the previous period’ financial statements
are revised. No significant change in accounting policies of the Group happened in the current period.
2.3 Amendments and Errors in Accounting Assumptions
If the amendments in accounting assumptions are related to one period, the amendment is applied in the current
period. But, if the amendment is related to the future periods, it will be applied both in the current period and future
periods. No significant change or amendment has happened in accounting assumptions of the Group over the current
year. If any accounting mistake is found out; previous periods’ financial statements will be revised.
2.4. New and Revised Turkish Financial Reporting Standards
(a) Amendments in TASs affecting the notes and amounts in the financial statements
Amendments in TFRSs were implemented in current period and it had affect on the reporting amounts in the
conslidated financial statemants.
TAS 1 (Amendments) Presentation of Items of Other Comprehensive Income
The amendments to TAS 1 “Presentation of Items of Other Comprehensive Income” are effective for the annual
periods beginning on or after 1 July 2012. The amendments introduce new terminology for the statement of
comprehensive income and income statement. Under the amendments to TAS 1, the “statement of comprehensive
income” is renamed as the “statement of profit or loss and other comprehensive income” and the “statement of
income” is renamed as the “statement of profit or loss”. The amendments to TAS 1 retain the option to present profit
or loss and other comprehensive income in either a single statement or in two separate but consecutive statements.
However, the amendments to TAS 1 require items of other comprehensive income to be grouped into two categories
in the other comprehensive income section: (a) items that will not be reclassified subsequently to profit or loss and
(b) items that may be reclassified subsequently to profit or loss when specific conditions are met. Income tax on
items of other comprehensive income is required to be allocated on the same basis. The amendments do not change
the option to present items of other comprehensive income either before tax or net of tax. The amendments can be
applied retrospectively. Other than the above mentioned presentation changes, the application of the amendments to
TAS 1 does not result in any impact on profit or loss, other comprehensive income and total comprehensive income.
New and revised Standards on consolidation, joint arrangements, associates and disclosures
In May 2011, a package of five standards on consolidation, joint arrangements, associates and disclosures was issued,
including TFRS 10, TFRS 11, TFRS 12, TAS 27 (as revised in 2011) and TAS 28 (as revised in 2011).
Key requirements of these five standards are described below:

GÜBRE FABRİKALARI T.A.Ş. AND ITS SUBSIDIARY COMPANY
FOOTNOTES FOR FINANCIAL STATEMENTS FOR YEAR THAT ENDED AS OF 31
DECEMBER 2013
(Amounts are expressed in Turkish Lira (“TRL”) unless otherwise stated.)
12
2. BASIS OF PRESENTATION OF FINANCIAL STATEMENTS (Cont.)
2.4. New and Revised Turkish Financial Reporting Standards (Cont.)
(a) Amendments in TASs affecting the notes and amounts in the financial statements (Cont.)
New and revised Standards on consolidation, joint arrangements, associates and disclosures (Cont.)
TFRS 10 replaces the parts of TAS 27 Consolidated and Separate Financial Statements that deal with consolidated
financial statements. SIC-12 Consolidation - Special Purpose Entities will be withdrawn upon the e[ective date of
TFRS 10. Under TFRS 10, there is only one basis for consolidation, that is control. In addition, IFRS 10 includes a new
definition of control that contains three elements: (a) power over an investee, (b) exposure, or rights, to variable returns
from its involvement with the investee, and (c) the ability to use its power over the investee to affect the amount of the
investor’s return. Extensive guidance has been added in TFRS 10 to deal with complex scenarios.
TFRS 11 replaces TAS 31 Interests in Joint Ventures. TFRS 11 deals with how a joint arrangement of which two or
more parties have joint control should be classified. SIC-13 Jointly Controlled Entities - Non-monetary Contributions
by Venturers will be withdrawn upon the effective date of TFRS 11. Under TFRS 11, joint arrangements are classified
as joint operations or joint ventures, depending on the rights and obligations of the parties to the arrangements. In
contrast, under TAS 31, there are three types of joint arrangements: jointly controlled entities, jointly controlled assets
and jointly controlled operations. In addition, joint ventures under TFRS 11 are required to be accounted for using the
equity method of accounting, whereas jointly controlled entities under TAS 31 can be accounted for using the equity
method of accounting or proportional consolidation.
TFRS 12 is a disclosure standard and is applicable to entities that have interests in subsidiaries, joint arrangements,
associates and/or unconsolidated structured entities. In general, the disclosure requirements in TFRS 12 are more
extensive than those in the current standards.
In June 2012, the amendments to TFRS 10, TFRS 11 and TFRS 12 were issued to clarify certain transitional guidance
on the application of these TFRSs for the first time.
TFRS 13 Fair value measurements
TFRS 13 establishes a single source of guidance for fair value measurements and disclosures about fair value
measurements. The Standard defines fair value, establishes a framework for measuring fair value, and requires
disclosures about fair value measurements. The scope of TFRS 13 is broad; it applies to both financial instrument
items and nonfinancial instrument items for which other TFRSs require or permit fair value measurements and
disclosures about fair value measurements, except in specified circumstances. In general, the disclosure
requirements in TFRS 13 are more extensive than those required in the current standards. For example, quantitative
and qualitative disclosures based on the three-level fair value hierarchy currently required for financial instruments
only under TFRS 7 Financial Instruments: Disclosures werebeing extended by TFRS 13 to cover all assets and
liabilities within its scope.
IAS 1 (Amendments) Presentation of Financial Statements
(as part of the Annual Improvements to TFRSs 2009-2011 Cycle issued in May 2012)
The amendments to IAS 1 as part of the Annual Improvements to IFRSs 2009-2011 Cycle are efective for the annual
periods beginning on or after 1 January 2013.
IAS 1 requires an entity that changes accounting policies retrospectively, or makes a retrospective restatement or
reclassification to present a statement of financial position as at the beginning of the preceding period (third
statement of financial position). The amendments to IAS 1 clarify that an entity is required to present a third
statement of financial position only when the retrospective application, restatement or reclassification has a material
efect on the information in the third statement of financial position and that related notes are not required to
accompany the third statement of financial position.

GÜBRE FABRİKALARI T.A.Ş. AND ITS SUBSIDIARY COMPANY
FOOTNOTES FOR FINANCIAL STATEMENTS FOR YEAR THAT ENDED AS OF 31
DECEMBER 2013
(Amounts are expressed in Turkish Lira (“TRL”) unless otherwise stated.)
13
2. BASIS OF PRESENTATION OF FINANCIAL STATEMENTS (Cont.)
2.4. New and Revised Turkish Financial Reporting Standards (Cont.)
(a) Amendments in TASs affecting the notes and amounts in the financial statements (Cont.)
TAS 19 Employee Benefits
The amendments to IAS 19 change the accounting for defined benefit plans and termination benefits. The most
significant change relates to the accounting for changes in defined benefit obligations and plan assets. The
amendments require the recognition of changes in defined benefit obligations and in fair value of plan assets when
they occur, and hence eliminate the “corridor approach” permitted under the previous version of IAS 19 and
accelerate the recognition of past service costs. The amendments require all actuarial gains and losses to be
recognized immediately through other comprehensive income in order for the net pension asset or liability
recognized in the consolidated statement of financial position to reflect the full value of the plan deficit or surplus.
Furthermore, the interest cost and expected return on plan assets used in the previous version of IAS 19 are replaced
with a “net-interest” amount, which is calculated by applying the discount rate to the net defined benefit liability or
asset. The Group recognized the actuarial gain and loss in profit and loss statement because of not reaching
significant amount.
(b) New and Revised TFRSs effective since the year 2013 with no material effect on financial statements with
amendments and interpretations on current TFRSs
TFRS 7 (Amendments) Offsetting Financial Assets and Financial Liabilities and the Related Disclosures
The amendments to IFRS 7 require entities to disclose information about rights of o[set and related arrangements
(such as collateral posting requirements) for financial instruments under an enforceable master netting agreement or
similar arrangement.
Annual Improvements to IFRSs 2009 - 2011 Cycle issued in May 2012
TAS 16 (Amendments) Tangible Fixed Assets;
TAS 32 (Amendments) Financial Instruments: Presentation; and
TAS 34 (Amendments) Interim Finacial Reporting
TAS 16 (Amendments)
The amendments to IAS 16 clarify that spare parts, stand-by equipment and servicing equipment should be classified
as property, plant and equipment when they meet the definition of property, plant and equipment in IAS 16 and as
inventory otherwise. The Group management does not anticipate that the amendments to IAS 16 will have a
significant effect on the Group’s consolidated financial statements.
TAS 32 (Amendments)
The amendments to IAS 32 clarify that income tax relating to distributions to holders of an equity instrument and to
transaction costs of an equity transaction should be accounted for in accordance with IAS 12 Income Taxes. The
Group management does not anticipate that the amendments to IAS 32 will have a significant efect on the Group’s
consolidated financial statements.
TAS 34 (Amendments)
The amendments to TAS 34 clarify that disclosure of the total assets and total liabilities for a particular reportable
segment is only required if a measure of total assets or total liabilities (or both) is regularly provided to the chief
operating decision maker and there has been a material change in those measures since the last annual financial
statements. The amendments to TAS 34 did not have an effect on the Group’s consolidated financial statements.

GÜBRE FABRİKALARI T.A.Ş. AND ITS SUBSIDIARY COMPANY
FOOTNOTES FOR FINANCIAL STATEMENTS FOR YEAR THAT ENDED AS OF 31
DECEMBER 2013
(Amounts are expressed in Turkish Lira (“TRL”) unless otherwise stated.)
14
2. BASIS OF PRESENTATION OF FINANCIAL STATEMENTS (Cont.)
(c) New and Revised TFRSs in issue but not yet effective
The Group has not applied the following new and revised TFRSs that have been issued but are not yet effective:
TFRS 9 Financial Instruments
TFRS 9 and TFRS 7 (Amendments) Mandatory Effective Date of IFRS 9 and Transition Disclosures
TAS 32 (Amendments) Offsetting Financial Assets and Financial Liabilities1
TFRS 10, 11, TAS 27 (Amendments) Investment Entities1
TAS 36 (Amendments) Recoverable Amount Disclosure for Non-Financial Assets1
TAS 39 (Amendments) Novation of Derivatives and Continuation of Hedge Accounting1
TFRS Interpretation 21 Levies1
1 Effective for annual periods beginning on or after 1 January 2014.
TFRS 9 Financial Instruments
TFRS 9, issued in November 2009, introduces new requirements for the classification and measurement of financial
assets. TFRS 9 was amended in October 2010 to include requirements for the classification and measurement of
financial liabilities and for derecognition.
TFRS 9 and TFRS 7 (Amendments) TFRS 9 and Mandatory Effective Date of Transition Disclosures
On November 2013, it is tentatively decided that the mandatory effective date of TFRS 9 will be no earlier than
annual periods beginning on or after 1 January 2017. This amendment has not been published by POA, yet.
TMS 32 (Amendments) Offsetting Financial Assets and Financial Liabilities
The amendments to TAS 32 clarify existing application issues relating to the offset of financial assets and financial
liabilities requirements. Specifically, the amendments clarify the meaning of “currently has a legally enforceable
right of set-off” and “simultaneous realization and settlement”.
TFRS 10, 11, TAS 27 (Amendments) Investment Companies
This amendment with the additional provisions of TFRS 10 provide 'investment entities' (as defined) an exemption
from the consolidation of particular subsidiaries and instead require that an investment entity measure the
investment in each eligible subsidiary at fair value through profit or loss.
TAS 36 (Amendments) Recoverable Amount Disclosure for Non-Financial Assets
As a consequence of TFRS 13 Fair Value Measurements, there are amendments in the explanations about the
measurement of the recoverable amount of an impaired asset. This amendment is limited to non-financial assets and
paragraphs 130 and 134 of TAS 36 has been changed.
TAS 39 (Amendments) Novation of Derivatives and Continuation of Hedge Accounting
This amendment to TAS 39 makes it clear that there is no need to discontinue hedge accounting if a hedging
derivative is novated, provided certain criteria are met.
TFRS Interpretation 21 Levies
TFRS Interpretation 21 identifies the obligating event for the recognition of a liability as the activity that triggers the
payment of the levy in accordance with the relevant legislation.
2.5 Summary of Significant Accounting Policies
The major accounting principles used for the attached financial statements are as follows:

GÜBRE FABRİKALARI T.A.Ş. AND ITS SUBSIDIARY COMPANY
FOOTNOTES FOR FINANCIAL STATEMENTS FOR YEAR THAT ENDED AS OF 31
DECEMBER 2013
(Amounts are expressed in Turkish Lira (“TRL”) unless otherwise stated.)
15
2. BASIS OF PRESENTATION OF FINANCIAL STATEMENTS (Cont.)
2.5 Summary of Significant Accounting Policies (Cont.)
Income
Incomes are calculated via fair value of the received or receivable amount.
Sales of Goods
The income from the sale of the goods is calculated after the following conditions are in place:
The Group hands over the property right, risks and gains to the buyer
Group has no longer effective control over the sold-out goods and administrative contribution linked to the
property right.
Income amount is reliably calculated.
Economical benefits related to the operation are possible to flow in the company.
The costs resulted / to-be resulted from the operation is reliably calculated.
Dividend and interest income
The interest income is realized at the related period at rate of the effective interest reducing the assumed cash input
gained from the related financial asset with the remaining principal amount over its expected life to the recorded
value of the asset.
Dividends from the share investments are recorded when the shareholders get right to receive the dividend
Lease Income
The rental income from the real estate is accounted in accordance with linear method during the related leasing
contract is in effect.
Inventories
Inventories are calculated with the lower one of the cost or net realizable value. The costs including a part of fixed and
changeable general production expenses are calculated with a method which the inventories depend on and generally
first-input-first-output method.
Net realizable value is calculated by deducting the completion cost and assumed costs for sale from the assumed sale
price fixed under normal commercial conditions. When the net realizable value of inventories falls below its cost, the
inventories value is reduced to net realizable value and reflected to the income statement as an expense on the year when
the value decrease happened. If the conditions causing the inventories to reduce to the net realizable value are no more
effective or if the net realizable value increase due to changing economical conditions; the provision for decrease in
value of the stocks is cancelled. The cancelled amount is limited with the earlier determined amount of decrease in value
of the inventories.
The inventories have no share from the loan costs.
The processing cost is used as a cost system. In the inventories, the first-in-first-output costing method is applied for
first material and goods as well as monthly moving average costing method is applied for the aids and spare parts.
Investment Properties
The investment properties are kept for rental income or/and value growth gain and they are first valued with their
main cost as well as operation cost. Following the first accounting, the investment properties are evaluated with the
fair values reflecting market realities as the balance sheet day. Gains / losses from the fair value amendments are
included in the income statement during the period when they happened.
The real estate used by the owner has been considered as amortization until they become investment properties
showed on the basis of fair value. Since then no amortization has been calculated.
To determine a fair value of the investment property, the value of machines and instruments used in leased factory
should also been considered. So such assets are separately displayed in the investment property account, too.

GÜBRE FABRİKALARI T.A.Ş. AND ITS SUBSIDIARY COMPANY
FOOTNOTES FOR FINANCIAL STATEMENTS FOR YEAR THAT ENDED AS OF 31
DECEMBER 2013
(Amounts are expressed in Turkish Lira (“TRL”) unless otherwise stated.)
16
2. BASIS OF PRESENTATION OF FINANCIAL STATEMENTS (Cont.) 2.5 Summary of Significant Accounting Policies (Cont.) Tangible Fixed Assets
Landed properties and buildings that are held in use for the purpose of delivering product /service or for
administrative purposes are expressed with their re-evaluated value. Re-evaluated value is determined by subtracting
accrued depreciation and accrued depredation that occur within the next period from fair value measured at the re-
evaluation date. The re-evaluations are done on a regular basis in such a way that it will not differ from book value
of fair value that is to be determined at the re-evaluation date.
Increase resulting from the re-evaluation of the aforementioned landed properties and buildings is recorded to re-
evaluation fund in equity. If there is a depredation that has been showed previously in income statement concerning
the tangible-fixed assets, increment value resulting from the re-evaluation is recorded to income statement at the rate
of said depredation. Decrease in book value resulting from the re-evaluation of mentioned landed property and
building is recorded to the income statement in case the said asset exceeds its balance in re-evaluation fund relating
its previous re-evaluation.
Depreciation of re-evaluated building is included in income statement. When the re-evaluated real estate is sold or
upon its retirement, remaining balance in re-evaluation fund is transferred to profits which are not distributed
directly. Unless the asset is excluded from the balance sheet, it shall not be transferred from re-evaluation fund to
profits which are not distributed directly.
Machines and equipments are sowed on the basis of the amount which is after subtracting the accrued depreciation
and accrued depredation from their cost value.
Machines and equipments are showed on the basis of the amount which is after subtracting the accrued depreciation
and accrued depredation from their cost value.
Except the lands and ongoing investments, cost value or valued amounts of tangible-fixed assets are subject to
deprecation by using the straight-line method according to their expected useful life. Expected useful life, residual
value and depreciation method are reviewed every year for possible effects of changes in estimations and if there is a
change in estimations, they are accounted in advance.
Proceeds and losses resulting from disposal or retirement of tangible-fixed assets are determined as a difference
between missing sale revenue and book value of the asset and included in income statement.
Except for lands having unrestricted use life, depreciation has been calculated over the inflation adjusted values of
fixed asset and according to ordinary depreciation method and on basis of prorate depreciation. Tangible-fixed assets
are amortized considering below-mentioned economic lives. (Footnote: 18)
Buildings, underground and aboveground systems
5-50 Years
Machines, facilities and devices 3-40 Years
Vehicles 4-10 Years
Flooring and fixtures 3-25 Years
Special costs 5 Years
Intangible-Fixed Assets
Intangible-fixed asset is accounted in case expected future economic benefits are possible for the business and the cost of the asset can be measured creditably. Intangible assets are accounted with their cost value at the initial recognition. The cost value of a separately acquired intangible asset is calculated by deducting all discounts from the purchase price and including import taxes and non-refundable purchase taxes as well as all other kind of costs linked to the asset in order to operationalize it. As of the purchase date, the historical costs of the intangible assets have been finally adjusted for the inflation rates on 31 December 2004. In the current period, the intangible assets are redeemed with straight line method according to their economical life based on the cost value. The amount noted at the financial statement is redeemed in 5 years. (Footnote 15)

GÜBRE FABRİKALARI T.A.Ş. AND ITS SUBSIDIARY COMPANY
FOOTNOTES FOR FINANCIAL STATEMENTS FOR YEAR THAT ENDED AS OF 31
DECEMBER 2013
(Amounts are expressed in Turkish Lira (“TRL”) unless otherwise stated.)
17
2. BASIS OF PRESENTATION OF FINANCIAL STATEMENTS (Cont.)
2.5 Summary of Significant Accounting Policies (Cont.)
Impairment of Assets
The unlimited assets like goodwill cannot be redeemed. Annually, an impairment test is applied for these assets.
However for those redeemed assets, the impairment test is applied only when it is impossible to regain the book
value because of a situation or events. If the asset is in the excess of the recoverable amount of the book value, a
provision for losses is noted. The recoverable amount is the bigger one of the used value or the fair value acquired
after deducting the sale costs. In order to evaluate the impairment, the assets are grouped at the lowest level which
there are separate identifiable cash flows (cash generating units). All redeemed non-financial assets - except from the
betterment - are reviewed at each reporting date for possible cancellation of the impairment.
Loan Costs For qualifying assets that require significant time to be ready for use and sale, the loan costs related to purchase, production or manufacture are included in the costs of the asset until the asset is ready for use or sale. All other loan costs are recorded at the income statement in the current period. All other loan costs are accounted in current period.
Goodwill
In consolidated financials goodwill or negative goodwill reviewed every year for any possible impairmen within the
scope of IFRS 3 Standard “Business Combinations”, the difference between percentage of Groups’ net assets fair
value and purchasing price,
Groups’ every producer of cash flow unit involved for goodwill test. Tests are likely to be made every year or more
often for indicative periods showing impairments for controlling whether there is impairment. In cases where cash
flow units’ recoverable value is lower than book value, impairment firstly to use in decreasing cash flow units
goodwill. Impairment reserved for goodwill cannot be canceled in next periods.
The amount is accounted as revenue in the period if negative goodwill related to acquisition exists. Gains and losses
arising from the sale of a company, includes the value of accounted goodwill over the sold organization.
Financial Instruments
Financial Assets
The financial assets - apart from those recorded at fair value and grouped as financial tools of which fair value
difference reflected as loss or profit - are accounted based on total amount of the expenses directly related to
purchase transaction and fair market value. The assets are recorded or charged off at the date of transaction in result
of purchase or sale of the financial assets linked to a contract indicating the delivery conditions of investment tools,
such as the deadline determined in line with market conditions.
Financial assets are classified as "financial assets of which fair value difference is reflected as profit or loss",
"financial assets which will be held till the due term", "financial assets which are ready for sale" and "credits and
receivables". The classification is determined at the first record as to qualifications and acquirement goals of the
financial asset.
Effective interest method
The effective interest method is a way to evaluate the financial asset with the amortised cost and to distribute the
related interest income to the related period. The effective interest method is the rate reducing the assumed total
receivable cash to its current net value as long as it is available over the life of financial tool.
The classified financial assets except from those of which fair value difference is reflected to profit or loss are
accounted by using the effective interest method.

GÜBRE FABRİKALARI T.A.Ş. AND ITS SUBSIDIARY COMPANY
FOOTNOTES FOR FINANCIAL STATEMENTS FOR YEAR THAT ENDED AS OF 31
DECEMBER 2013
(Amounts are expressed in Turkish Lira (“TRL”) unless otherwise stated.)
18
2. BASIS OF PRESENTATION OF FINANCIAL STATEMENTS (Cont.)
2.5 Summary of Significant Accounting Policies (cont.)
Financial Instruments (cont.)
Financial assets (cont.)
Financial assets of which fair value difference reflected to profit or loss
The financial assets of which fair value difference reflected to profit or loss, are the financial tools held for
commerce. When a financial asset is acquired for sale, it is classified in this category. These financial assets
constituting the derivatives which have not been designed as protective tool against financial risk are also
categorized as financial asset of which fair value difference reflected to profit or loss.
Held-to-maturity financials assets
Investments in debt securities with fixed or determinable payments and fixed maturity dates that the Group has the
positive intent and ability to hold to maturity are classified as held-to-maturity investments. Held-to-maturity
investments are recorded at amortized cost using the effective interest methodless impairment, with revenue
recognized on an effective yield basis.
Financial assets ready for sale
The equity instruments that are held by the Group and that are quoted on the stock exchange and transacted at an
active market as well as some debt securities are categorized as financial assets ready for sale and are recorded with
their fair value. The Group has also other equity instruments that are ready for sale, but neither quoted on the stock
exchange nor transacted at an active market. So they are recorded with their cost value as their fair value cannot be
determined via a trustable way.
Credits and receivables The commercial and other receivables that are not transacted and that have fixed and determinable payments as well as the credits are classified in this category. The credits and receivables are recorded by deducting the decrease in value from the cost amortised via effective interest method.
Impairment of financial assets
The financial assets or asset groups, except from the financial assets of which fair value difference reflected to profit
or loss, are evaluated on each balance sheet date as to whether there is any indication of being affected by decrease
in value. If more than one event happen after the initial recognition and there is a sideless indication of that the
future cash flows of the financial asset or asset group have been subjected to the decrease in value, the impairment
loss takes place. For the financial assets recorded with their amortised value, the amount of the decrease in value is
difference between its book value and current value accounted by reducing the expected future cash flows at the rate
of effective interest.
Decrease in value of all financial assets, except for trade receivables of which book value was decreased through
usage of a reserve account, is directly deducted from registered value of relevant financial asset. In case trade
receivable cannot be collected, the amount in question is written off by being deducted from reserve account.
Changes in reserve account are accounted in income statement.
Except for equity instruments ready for sale, in case that loss due to decrease in value reduces in the following
period and this reduction can be connected with an event occurred after accounting the loss due to decrease in value,
loss due to decrease in value which has been accounted before is deleted from income statement in a way so as not
to exceed amortized cost which decrease in value of investment would reach on the date decrease in value would be
cancelled in case it would not have been accounted at any time.
Increase in fair value of equity instruments ready for sale which occurred after decrease in value is directly
accounted in equities.

GÜBRE FABRİKALARI T.A.Ş. AND ITS SUBSIDIARY COMPANY
FOOTNOTES FOR FINANCIAL STATEMENTS FOR YEAR THAT ENDED AS OF 31
DECEMBER 2013
(Amounts are expressed in Turkish Lira (“TRL”) unless otherwise stated.)
19
2. BASIS OF PRESENTATION OF FINANCIAL STATEMENTS (Cont.)
2.5 Summary of Significant Accounting Policies(cont.)
Financial Instruments (cont.)
Cash and Cash equivalent
Cash and cash equivalent values are the short term investments made up of cash, demand deposits and other short
term investments with original maturities of 3 months or less, eligible to be immediately converted into cash without
being subjected to the risk of steep value changes and have high liquidity.
Financial liabilities
Financial liabilities and equity instruments of Group are designated in accordance with contractual arrangements and description of a financial liability and an instrument based on equity. The contract representing right in assets remained after all payables of Group are deducted is a financial instrument based on equity. Accounting policies applied for specific financial liabilities and financial instruments based on equity are explained below. Financial liabilities are classified as financial liabilities of which fair value deficit is reflected on profit or loss and other financial liabilities.
Financial liabilities which reflected to profit / loss as fair value difference
Financial liabilities of which fair value deficit is reflected on profit or loss are registered with their fair value and
reevaluated with their fair value at balance sheet date in each reporting period. Changes in their fair value are
accounted in income statement. Net income or loss which is accounted in income statement also includes interest
rate paid for financial liability in question.
Other financial liabilities
Other financial liabilities are accounted with their fair values which are freed from transaction costs in the beginning,
including financial payables.
Other financial liabilities are accounted over amortized cost amount by using effective interest method along with
interest expense calculated over effective interest rate in the following periods.
Effective interest method is the one in which amortized costs of financial liability are calculated and relevant interest
expense is distributed to related period. Effective interest rate is the one which reduces estimated cash payments to
be performed in future during the anticipated lifespan of financial instrument or a shorter period of time, in case
suitable, to exactly net present value of related financial liability.
Derivative financial instruments
Activities of Group actually expose the enterprise to financial risks caused by changes in exchange and interest rates. Group uses derivative financial instruments (essentially exchange rate forward contracts) in order to avoid financial risks associated with exchange rate fluctuations depending on specific binding commitments and anticipated future transactions.
Derivative financial instruments are calculated with their fair values at contract date and recalculated with their fair values in the following reporting periods.
Leasing- Group as Lessor
Leasing procedure in which a significant portion of risk and benefit arising from owning an asset belongs to lessor is
categorized as financial leasing. Other leasing procedures are categorized as operating lease.

GÜBRE FABRİKALARI T.A.Ş. AND ITS SUBSIDIARY COMPANY
FOOTNOTES FOR FINANCIAL STATEMENTS FOR YEAR THAT ENDED AS OF 31
DECEMBER 2013
(Amounts are expressed in Turkish Lira (“TRL”) unless otherwise stated.)
20
2. BASIS OF PRESENTATION OF FINANCIAL STATEMENTS (Cont.)
2.5 Summary of Significant Accounting Policies(cont.)
Financial Instruments (cont.)
Leasing- Group as Lessor (cont.)
There is no financial leasing transaction of Group in the current period.
Leasing incomes of operating lease are accounted by straight-line method during relevant leasing period. Straight-
line initial costs borne during leasing procedure and negotiation are added to cost of leased asset and it is amortized
during leasing period by straight-line method.
Leasing - Group as Tenant
Leasing procedure in which a significant portion of risk and benefit arising from owning an asset belongs to tenant
is categorized as financial leasing, while other leasing procedures are categorized as operating lease.
There is no financial leasing transaction of Group in the current period.
Payments performed for operating lease (incentives received or to be received from lessor for carrying out leasing
transaction are recorded in income statement by straight-line method during leasing period), are recorded in income
statement by straight-line method during leasing period.
Impacts of Exchange Rate
Financial statements of each enterprise of Group are presented with currency unit (functional currency unit) which is
valid for basic economic environment that they operate. Financial situation and operation results of each enterprise
are indicated as TRY which is valid currency unit for company and presentation unit for consolidated financial
statements.
Foreign currency unit based transactions (other currencies than TRY) made during the preparation of financial
statement of each enterprise are recorded based on foreign exchange rates that are applicable on the date of
transaction. The monetary assets and liabilities indexed to foreign currency used in balance sheet are converted to
Turkish Lira by using foreign exchange bid rates valid on balance sheet date. Those non-monetary items which are
followed with their fair value and recorded in foreign currency unit are converted to TRY based on exchange rates
on the date fair values are determined. Non-monetary items in foreign currency unit of which date is calculated over
cost are not subjected to conversion again.
Exchange rate differences, except for the conditions listed below, are accounted as profit or loss in the period which
they come into existence:
Exchange rate differences which are handled with as adjustment item to interest costs on payables that are
associated with assets constructed in order to use in future and indicated in foreign currency unit and which
are included in costs of such assets,
Exchange rate differences caused by transactions made in order to provide financial protection against risks
arising from foreign currency unit (accounting policies related to providing financial protection against
risks are explained below),
Exchange rate differences arising from monetary payables and receivables which compose a part of net
investment in foreign operation, are accounted in conversion reserve, are associated with profit and loss in
net investment sale and derive from foreign operation of which there is no payment intention or possibility.

GÜBRE FABRİKALARI T.A.Ş. AND ITS SUBSIDIARY COMPANY
FOOTNOTES FOR FINANCIAL STATEMENTS FOR YEAR THAT ENDED AS OF 31
DECEMBER 2013
(Amounts are expressed in Turkish Lira (“TRL”) unless otherwise stated.)
21
2. BASIS OF PRESENTATION OF FINANCIAL STATEMENTS (Cont.)
2.5 Summary of Significant Accounting Policies (cont.)
Impacts of Exchange Rate (cont.)
Assets and liabilities of Group in its foreign operations are expressed in consolidated financial statements in TL by
using exchange rates valid on the date of balance sheet. Income and expense items are converted by using average
exchange rates during the period, in case that no substantial fluctuation has been occurred on foreign exchange rates
during the period in which exchange rates valid on the date of transaction should be used (in case a substantial
fluctuation occurs, exchange rates on transaction date are used). Exchange rate difference which has occurred is
classified as equity and transferred to Group’s conversion fund. Conversion differences in question are recorded on
income statement in the period when foreign operations are sold out.
Goodwill and fair value adjustments arising from foreign operation purchase are considered as assets and liabilities
of foreign operation and converted by using period-end exchange rate.
Earnings per Share
Earnings per share stated in consolidated income statement is calculated by dividing net profit by weighted average
number of share certificate which exists in market during the year.
In Turkey companies increase their capitals by means of “non-paid up shares” which they distributed from their
previous year profit to their shareholders. Such kind of “non-paid up shares” distribution is evaluated as exported
shares in calculation of earnings per share. According to this, weighted average number of shares used in this
calculation is found by taking into account past effects of share distribution in question.
Events after Balance Sheet Date
Even though the events after balance sheet date have come up after any announcement made about profit or any
public announcement about other selected financial information, they cover all the events occurred between balance
sheet date and date of authorization for balance sheet publication.
In case that the events requiring adjustment have come up after balance sheet date, Group adjusts the amounts
included in financial statements in compliance with this new situation.
Provisions, Conditional Assets and Liabilities
A provision is reserved in financial statements, in case that there is a current liability arising from past events, it is
possible to carry out the liability and the amount of liability in question can be estimated in a safe way.
The amount reserved as provision is calculated by estimating in the safest way the expense to be made in order to
fulfill the liability as of balance sheet date by taking into account risks and uncertainties about liability.
In case that provision is measured by using estimated cash flow required for meeting current liability, the book value
of provision in question is equal to present value of relevant cash flows.
In case that either a part or whole of economic benefit required for paying the provision is expected to be met by
third parties, the amount to be collected is accounted in case that the collection of relevant amount is almost certain
and can be measured in a safe way.
Taxes Calculated On The Basis of The Company's Earnings
Since Turkish tax legislation does not allow preparation of consolidated tax statement of a main company with its
subsidiary, tax provisions are calculated separately based on each enterprise as it is reflected on attached
consolidated financial statements.
Expense of income tax consists of sum of current tax and deferred tax expense.

GÜBRE FABRİKALARI T.A.Ş. AND ITS SUBSIDIARY COMPANY
FOOTNOTES FOR FINANCIAL STATEMENTS FOR YEAR THAT ENDED AS OF 31
DECEMBER 2013
(Amounts are expressed in Turkish Lira (“TRL”) unless otherwise stated.)
22
2. BASIS OF PRESENTATION OF FINANCIAL STATEMENTS (Cont.)
2.5 Summary of Significant Accounting Policies (cont.)
Current Tax
Current year tax liability is calculated over the part of period income which is subjected to tax. The profit subjected
to tax is different than the profit included in income statement since it excludes the items which is taxable in other
years or is tax deductable as well as those which are impossible to tax or could not be tax deductable. Current tax
liability of Group has been calculated by using tax rate which has become legal as of the date of balance sheet or
become legal at a considerable extend.
Deferred Tax
Deferred tax liability or asset is found out by calculating temporary differences between the amounts of assets and
liabilities shown in financial statement and the amounts taken into consideration in calculation of legal tax base by
balance sheet method taking into account legalized tax rates of tax effects. While deferred tax liabilities are
calculated for all of taxable temporary differences, deferred tax assets consisting of deductible temporary differences
are calculated provided that benefiting from the differences in question is highly-likely by making profit subjected to
tax in future. The mentioned assets and liabilities are not accounted in case that they arise from inclusion of
temporary difference, goodwill related to transaction not affecting commercial or financial profit/loss or other assets
and liabilities in the financial statement for the first time (except for business enterprise merger).
Deferred tax liabilities are calculated for all of taxable temporary differences which are associated with investments
in subsidiaries and affiliates and shares in joint ventures except for the conditions under which Group is able to
control removal of temporary differences and under which possibility of removal of these differences in near future
is low. Deferred tax assets arising from taxable temporary differences which are associated with such kind of
investments and shares are calculated provided that benefiting from the differences in question is highly-likely by
making sufficient profit subjected to tax in near future and removal of relevant differences in future is possible.
Recorded value of deferred tax asset is reviewed as of each balance sheet date. Recorded value of deferred tax asset
is reduced at extend to which it is impossible to obtain financial profit which will enable to benefit from it partially
or wholly.
Deferred tax assets and liabilities are calculated over tax rate which has become legal or become legal at a
considerable extend (tax regulations) as of the date of balance sheet and which is expected to be valid in the period
during which assets will realize or liabilities will be fulfilled. During the calculation of deferred tax assets and
liabilities, tax results of methods anticipated for Group assets’ regaining their book value or fulfilling its liabilities as
of balance sheet date are taken into consideration.
Deferred tax assets and liabilities are deducted in case that there is a legal right related to deducting current tax
assets and current tax liabilities or assets and liabilities in question are associated with income tax collected by the
same taxation authority or Group has the intention to pay it by way of clarifying its current tax assets and liabilities.
Current and deferred tax of the period
Current tax except for those which are associated with the items accounted as receivable or payable directly in
equity (under these circumstances deferred tax related to relevant items are accounted directly in equity) or those
which arises from first recording of business enterprise mergers as well as deferred tax of the period are accounted
as income or expense in income statement. Tax effect is taken into account during business enterprise mergers,
calculation of cost control or determination of purchase-cost exceeding part of share obtained by purchaser at the
fair value of identifiable asset, liability and contingent payables of purchased subsidiary.
GÜBRE FABRİKALARI T.A.Ş. AND ITS SUBSIDIARY COMPANY
FOOTNOTES FOR FINANCIAL STATEMENTS FOR YEAR THAT ENDED AS OF 31
DECEMBER 2013
(Amounts are expressed in Turkish Lira (“TRL”) unless otherwise stated.)
23
2. BASIS OF PRESENTATION OF FINANCIAL STATEMENTS (Cont.)
2.5 Summary of Significant Accounting Policies (cont.)
Benefits for employees
Seniority Inventive
In accordance with provisions of current laws and collective labor agreements in Turkey, termination indemnity is
made in case of retirement or displacement. In compliance with IAS 19 Employee Benefits Standard (“IAS 19”)
which has been updated, such payments in question are described as identified retirement benefit plans. In fact,
Turkish and Iranian seniority indemnity systems are similar, there are not core differences between them. Moreover
while period of Razi’s privatization, the right of early retirement is given to employees and responsibility is
accounted in the scope of IAS 19 by Razi.
Termination indemnity liability which was accounted in balance sheet was calculated according to net present value
of estimated amount of liability which was expected to arise in future due to retirement of all employees and
reflected on financial statements. All calculated actuarial incomes and losses were reflected on income statement.
Seniority Incentive Premium; In accordance with the prevailing collective labor agreement, Termination indemnity
premium is paid to the staff within the scope of agreement in the years when they complete certain Termination
indemnity periods. The liability calculated for incentive premium in question is reflected on records. (Footnote: 24)
Holiday Provisions; The company makes a provision for the wages corresponding to the unused portion of vacation
allowances of its employees in the previous years. (Footnote: 24)
Statement of Cash Flow
The cash flows pertaining to the period are classified and reported in a manner that will include the costs of main activities, investments and financing. Cash flows originating from main activities indicate cash flow of Group arising from activities of fertilizer and petro chemical products sale. Cash flows related to investment operations indicate Group’s cash flow used in and obtained through investment operations (fixed investments and financial investments). Cash flows related to finance operations indicate resources of Group used in finance operations and repayment of these resources. Cash and cash equivalent values are the short term investments made up of cash, demand deposits and other short term investments with original maturities of 3 months or less, eligible to be immediately converted into cash without being subjected to the risk of steep value changes and have high liquidity.
Capital and Dividends
Ordinary shares are classified as equity capital. Dividends distributed on ordinary shares are recorded by deducting
from the accumulated profit in the period that the dividend payment decision is reached.
Critical accounting estimates and judgements
At the process of preparing of consolidated financial statements pursuant to Capital Market Board’s Financial Reporting Standards, The Group’s management should make critical accounting estimates and judgments that determines as date of reporting period, amount of income and expenses and amount of probable liabilities and guarantees that may be occurred as date of balance sheet. Although these forecasts and assumptions, is depend on the groups’ well knowledge that is associated current event and transactions, may differ from actual results. Forecasts are reviewed on a regular basis, required adjustments is made and reflected to periods’ income statement. In the next financial period, forecasts and assumptions that may risk of adjustment of assets and liabilities’ registered values, are shown as follows:

GÜBRE FABRİKALARI T.A.Ş. AND ITS SUBSIDIARY COMPANY
FOOTNOTES FOR FINANCIAL STATEMENTS FOR YEAR THAT ENDED AS OF 31
DECEMBER 2013
(Amounts are expressed in Turkish Lira (“TRL”) unless otherwise stated.)
24
2. BASIS OF PRESENTATION OF FINANCIAL STATEMENTS (Cont.)
2.5 Summary of Significant Accounting Policies (cont.)
Net Realizable Value
Stock is valued at lover of cost or net realizable value. Net realizable value is the estimated selling price in the ordinary
course of business, less the costs of completion and selling expenses.
Goodwill impairment
The Group reviews goodwill for impairment annually. Razi has been identified as the cash generating unit since the
goodwill balance has been recognized through the acquisition of Razi. The value in use calculations are based on
post-tax Turkish Lira cash flow projections as approved the Group management. 24% discount rate and 1% growth
rate (31 December 2013: discount 20%, growth 1%) have been used in calculations of the value in use. Discount
rate before tax for presentation is about 24% (31 December 2013: 21%)The discount rate represents the risk
associated with the entity. Based on the impairment analysis performed by Group management, no impairment of
goodwill has been identified. As of 31 December 2013, the Group does not determine impairment in goodwill
amount according to results of value impairment tests which was made by using the above assumptions
Deferred Tax
Group, recognized deferred tax asset and liability for temporary timing difference arising from difference between
its financial statement which constitute the basis of Tax and financial statement is prepared according to IFRS.
Deferred tax assets’ partially or whole recoverable amount is estimated in current circumstances. While evaluating,
projections of future profits, occurred loss in current period, deadline of use of inappropriate loss and other tax
assets and tax planning strategies can be used if necessary has been taken into account. In the light of data obtained,
if group’s taxable profit will be obtained in future is not enough to meet all deferred tax assets, partially or whole of
deferred tax is reserved. If operating results in future excess Group’s expectations, it may be required to enroll
unregistered/recorded deferred tax assets.
3. BUSINESS COMBINATIONS
Razi completed purchase of 2010 established, 126.000 tons/year capacity phosphoric acid plant Arya Phosphoric
Jonoob Co.’s (“Arya”) 87,5% of shares as of end of August. The Group has realized the purchasing in the remaining
non controlling shares as of balance sheet date.
Hence studies of measuring Arya’s fair valued net assets in the scope of UFRS 3 continues, temporal values
considered in 31 December 2012 dated financials involving purchase accounting.
As of 30 June 2013, studies of measuring Arya’s fair valued net assets was completed. Calculated goodwill of this
purchase due to temporal amounts is totally 5.294.555 TL
Details related to purchasing is as follows:
Amount in TL
The book value of Arya net assets at purchase date 4.807.019
Effect of fair value measurement 22.951.039
The total value of net assets valued with Fair Value 27.758.058
The share ratio of Group in net assets valued Fair Value %87,5
The Share amount of Group in net assets valued Fair value 24.288.301
Net Cash payed for Purchase 29.582.856
The Share amount of Group in net assets valued Fair value 24.288.301
Goodwill (Note 14) 5.294.555

GÜBRE FABRİKALARI T.A.Ş. AND ITS SUBSIDIARY COMPANY
FOOTNOTES FOR FINANCIAL STATEMENTS FOR YEAR THAT ENDED AS OF 31
DECEMBER 2013
(Amounts are expressed in Turkish Lira (“TRL”) unless otherwise stated.)
25
4. SHARES IN OTHER BUSINESSES
Condensed balance sheet and income statement of subsidiaries recognizing according to equity methods is as
follows:
Negmar Maritime Investment A.Ş.
Tarkim Pesticide Company A.Ş.
31 December 31 December
31 December 31 December
2013 2012
2013 2012
Current Assets 33.483.502 25.340.331
32.296.606 20.435.167
Fixed Assets 378.477.031 263.959.158
8.937.609 6.699.315
Short Term Liabilities 100.713.557 55.679.830
8.628.237 9.938.769
Long Term Liabilities 334.427.939 215.297.759
15.472.148 -
Net (Liabilities)/Assets (23.180.963) 18.321.900 17.133.830 17.195.713
Negmar Maritime Investment A.Ş.
Tarkim Pesticide Company A.Ş.
31 December 31 December
31 December 31 December
2013 2012
2013 2012
Net Sales 211.952.653 157.850.698
28.415.130 23.598.500
Net (Loss)/Profit (32.603.224) (18.761.330)
351.420 869.458
Condensed balance sheet and income statement of subsidiaries recognizing according to equity methods is as
follows:
31 December 31 December
2013 2012
Negmar Maritime Investment A.Ş. (9.272.385)
7.328.760
Tarkim Pesticide Company A.Ş. 7.057.523
6.878.286
Total Net (Liabilities)/Assets (2.214.862)
14.207.046
Condensed balance sheet and income statement of subsidiaries recognizing according to equity methods is as
follows:
31 December 31 December
2013 2012
Negmar Maritime Investment A.Ş. (16.601.145)
(7.853.037)
Tarkim Pesticide Company A.Ş. 179.237
318.359
Total (16.421.908)
(7.534.678)
5. OPERATING SEGMENTS
Group started to implement TFRS 8 Operating Segments as of 1 January 2009, and operation departments were
designated based on internal reports regularly reviewed by the competent authority of making decision on Group’s
activities.
Group’s competent authority of making decision reviews the results and activities based on geographical divisions
in order to make decision on resources to be allocated to departments and evaluate the performance of these
departments. The company operates in Turkey; whereas Razi, a subsidiary, operates in Iran.
The company undertakes chemical fertilizer production sales throughout Turkey. Razi Company on the other hand,
performs the production and sales of chemical fertilizer raw materials.

GÜBRE FABRİKALARI T.A.Ş. AND ITS SUBSIDIARY COMPANY
FOOTNOTES FOR FINANCIAL STATEMENTS FOR YEAR THAT ENDED AS OF 31
DECEMBER 2013
(Amounts are expressed in Turkish Lira (“TRL”) unless otherwise stated.)
26
5. OPERATING SEGMENTS (Cont.)
Since Company management evaluates operation results and performance through financial statements prepared in
accordance with TFRS, TFRS financial statements are used to prepare reports by departments.
The amounts of domestic and export sales are given in note 24. The distribution of department assets and liabilities
pertaining to the periods ending on 31 December 2013 and 31 December 2012 is as follows:
As of 30 September 2013 and 31 December 2012, the distribution of balance sheet by departments is as follows:
Turkey Iran
Consolidation
Adjustment Total
31 Dec. 2013 31 Dec. 2013 31 Dec. 2013 31 Dec. 2013
ASSETS
Current Assets 962.182.913 890.453.142 (98.876.816) 1.753.759.239
Fixed Assets 920.772.585 546.224.813 (281.847.413) 1.185.149.985
TOTAL ASSETS 1.882.955.498 1.436.677.955 (380.724.229) 2.938.909.224
LIABILITIES
Short Term Liabilities 1.041.329.042 659.467.037 (78.578.739) 1.622.217.340
Long Term Liabilities 180.631.376 91.292.711 - 271.924.087
Equities 660.995.084 685.918.203 (302.145.490) 1.044.767.797
TOTAL LIABILITIES 1.882.955.502 1.436.677.951 (380.724.229) 2.938.909.224
Turkey Iran
Consolidation
Adjustment Total
31 Dec. 2012 31 Dec. 2012 31 Dec. 2012 31 Dec. 2012
ASSETS
Current Assets 481.138.034 865.037.297 (46.198.395) 1.299.976.936
Fixed Assets 789.414.777 369.499.657 (303.996.093) 854.918.341
TOTAL LIABILITIES 1.270.552.811 1.234.536.954 (350.194.488) 2.154.895.277
LIABILITIES
Short Term Liabilities 717.220.782 515.137.715 (30.843.857) 1.201.514.640
Long Term Liabilities 36.905.228 83.380.957 - 120.286.185
Equities 516.426.801 636.018.282 (319.350.631) 833.094.452
TOTAL LIABILITIES 1.270.552.811 1.234.536.954 (350.194.488) 2.154.895.277

GÜBRE FABRİKALARI T.A.Ş. AND ITS SUBSIDIARY COMPANY
FOOTNOTES FOR FINANCIAL STATEMENTS FOR YEAR THAT ENDED AS OF 31
DECEMBER 2013
(Amounts are expressed in Turkish Lira (“TRL”) unless otherwise stated.)
27
5. OPERATING SEGMENTS (Cont.)
The distribution of income statements by departments for the periods ending on 31 December 2013 and 31
December 2012 is as follows:
Turkey Iran
Consolidation
Adjustment Total
01 Jan. 2013 01 Jan. 2013 01 Jan. 2013 01 Jan. 2013
31 Dec. 2013 31 Dec. 2013 31 Dec. 2013 31 Dec. 2013
OPERATING INCOMES
Sales (Net) 1.367.557.790 922.314.666 (24.435.047) 2.265.437.409
Cost of Sales (-) (1.217.051.314) (490.651.029) 24.435.047 (1.683.267.296)
Gross profit 150.506.476 431.663.637 - 582.170.113
Marketing, sales and distribution
expenses (83.964.964) (82.278.199) - (166.243.163)
General management expenses (27.606.839) (56.738.039) - (84.344.878)
Other incomes/expenses (39.863.952) 113.342.211 (6.274.458) 67.203.802
Operating profit (929.279) 405.989.610 (6.274.458) 398.785.874
Incomes/expenses from investment
activities 164.415.570 580.689 (173.848.045) (8.851.786)
Shares in profit/loss of investments
increase in value through equity method (16.421.908) - - (16.421.908)
Operating Profit/Loss Before Finance
Expense 147.064.384 406.570.299 (180.122.503) 373.512.180
Financial expenses (58.064.023) (39.387.083) - (97.451.106)
Pre-tax profit from maintained
activities 89.000.361 367.183.216 (180.122.503) 276.061.074
Tax expense - (3.315.313) - (3.315.313)
Deferred tax income / (expense) 7.935.486 70.371 - 8.005.857
Profit for the period 96.935.847 363.938.274 (180.122.503) 280.751.618

GÜBRE FABRİKALARI T.A.Ş. AND ITS SUBSIDIARY COMPANY
FOOTNOTES FOR FINANCIAL STATEMENTS FOR YEAR THAT ENDED AS OF 31
DECEMBER 2013
(Amounts are expressed in Turkish Lira (“TRL”) unless otherwise stated.)
28
5. OPERATING SEGMENTS (Cont.)
Turkey Iran
Consolidation
Adjustment Total
1 Jan. 2012- 1 Jan. 2012- 1 Jan. 2012- 1 Jan. 2012-
31 Dec. 2012 31 Dec. 2012 31 Dec. 2012 31 Dec. 2012
OPERATING INCOMES
Sales (Net) 1.307.788.037 951.334.013 (32.302.514) 2.226.819.536
Cost of Sales (-) (1.249.838.615) (362.078.676) 32.302.514 (1.579.614.777)
Gross profit 57.949.422 589.255.337 - 647.204.759
Marketing, sales and distribution
expenses (67.891.555) (50.443.428) - (118.334.983)
General management expenses (15.525.662) (31.773.422) - (47.299.084)
Other incomes/expenses 46.382.323 106.102.245 (15.354.540) 137.130.028
Operating profit 20.914.528 613.140.732 (15.354.540) 618.700.720
Incomes/expenses from investment
activities 233.223.385 1.329.489 (203.086.066) 31.466.809
Shares in profit/loss of investments
increase in value through equity method (7.534.678) - - (7.534.678)
Operating Profit/Loss Before Finance
Expense 246.603.236 614.470.221 (218.440.606) 642.632.851
Financial expenses (26.806.271) (143.385.898) - (170.192.169)
Pre-tax profit from maintained
activities 219.796.965 471.084.323 (218.440.606) 472.440.682
Tax expense (35.139.999) (2.694.306) - (37.834.305)
Deferred tax income / (expense) (6.165.033) 1.591.824 - (4.573.209)
Profit for the period 178.491.933 469.981.842 (218.440.606) 430.033.168
Capital expenditures pertaining to department assets for the periods ending on 31 December 2013 and 31 December
2012 are as follows:
Capital Expenditure 01 Jan. 2013 1 Jan. 2012-
31 Dec. 2013 31 Dec. 2012
Turkey 170.488.204 12.868.807
Iran 45.950.676 16.857.643
216.438.879 29.726.450
Amortization and Depreciation expenses pertaining to department assets for the periods ending on 31 December
2013 and 31 December 2012 are as follows:
Amortization / Depreciation 01 Jan. 2013 1 Jan. 2012-
31 Dec. 2013 31 Dec. 2012
Turkey 15.151.359 3.473.571
Iran 47.287.696 48.676.985
62.439.055 52.150.556
Product based values of regional sales are given in Note 24.

GÜBRE FABRİKALARI T.A.Ş. AND ITS SUBSIDIARY COMPANY
FOOTNOTES FOR FINANCIAL STATEMENTS FOR YEAR THAT ENDED AS OF 31
DECEMBER 2013
(Amounts are expressed in Turkish Lira (“TRL”) unless otherwise stated.)
29
6. STATEMENTS OF RELATED PARTIES
Balances Due from Related Parties
31 Dec.
31 Dec.
Trade Receivables (Parent Company) 2013
2012
Central Union of Turkish Agricultural Credit Cooperatives 67.249.148
167.732.649
Other related parties 8.478.037
-
Total 75.727.185
167.732.649
Other Receivables (Subsidiaries and other related
parties) (Short Term) 31 Dec. 2013
31 Dec.
2012
Negmar Maritime Company 1.945.063
10.172
Total 1.945.063
10.172
Other Receivables (non-controlling interest) (Short
Term) 31 Dec. 2013
31 Dec.
2012
Dividend Advances 91.937.552
43.831.897
Total 91.937.552
43.831.897
Total (Short Term) 93.882.615
43.842.069
Other Receivables (Subsidiaries and Other related
parties) (Long Term) 31 Dec. 2013
31 Dec.
2012
Negmar Maritime Company 70.147.828
53.643.704
Other related parties 47.891.574
21.738.807
Trade payables (Subsidiaries and other related parties) 31 Dec. 2013
31 Dec.
2012
Negmar Maritime Company 9.182.646
4.711.107
Tarnet A.Ş 67.172
27.789
Tarkim Pesticide Company 9.920
-
Total 9.259.739
4.738.896
Average maturity of sales to Central Union of Turkish Agricultural Credit Cooperatives are 30 days. Hence there
aren’t any delays in collection of revenues, there aren’t interest rate implemented. Receivables from subsidiaries and
other related parties include deposits and guarantees which is given by the Group for the transportation of Razi’s
productions.

GÜBRE FABRİKALARI T.A.Ş. AND ITS SUBSIDIARY COMPANY
FOOTNOTES FOR FINANCIAL STATEMENTS FOR YEAR THAT ENDED AS OF 31
DECEMBER 2013
(Amounts are expressed in Turkish Lira (“TRL”) unless otherwise stated.)
30
6. STATEMENTS OF RELATED PARTIES (Cont.)
Sales – Purchases
31 Dec.
31 Dec.
Sales (Main parent) Type
2013
2012
Central Union of Turkish Agricultural
Credit Cooperatives Goods
1.019.964.900
983.577.287
Sales (Subsidiaries)
Negmar Maritime Comp. and Affiliates Service
1.558.062
1.264.867
Tarkim Pesticide Company Goods
129.917
135.153
Other related parties Goods
8.079.356
-
Total
1.029.732.234
984.977.307
31 Dec.
31 Dec.
Purchases (Main parent) Type
2013
2012
Central Union of Turkish Agricultural
Credit Cooperatives Service
18.000
15.600
Purchases (Subsidiaries)
Tarkim Pesticide Company Goods
319.460
459.300
Negmar Maritime Comp. and Affiliates(*) Service
118.054.021
84.046.623
Tarnet A.Ş Service
548.477
449.619
Other related parties Service
81.972.193
105.501.270
Total
200.912.151
190.472.412
(*) Group gets service for logistics and handling from Negmar Denizcilik A.Ş. and its affiliates. Service’s due
payment is 7 days.
31 Dec. 31 Dec.
Other Type 2013 2012
Negmar Maritime Company and Affiliates Received / (Given) Depozits (net) - (52.937.276)
Negmar Maritime Company and Affiliates Interest 5.346.991 836.169
Other related parties Received / (Given) Depozits (net) (18.342.603) (21.760.954)
Total (12.995.612) (73.862.061)
Benefits Provided to Top Management
The total benefits the company has provided to its top managers as of 31 December 2013 shown below table:
31 Dec. 2013
31 Dec. 2012
Gubretas
Razi
Gubretas
Razi
Short-term employee benefits (*)
1.520.398
3.367.348
1.380.473
1.897.064
Total
1.520.398
3.367.348
1.380.473
1.897.064
(*) inc. attendance fees to the Board of Directors too.

GÜBRE FABRİKALARI T.A.Ş. AND ITS SUBSIDIARY COMPANY
FOOTNOTES FOR FINANCIAL STATEMENTS FOR YEAR THAT ENDED AS OF 31
DECEMBER 2013
(Amounts are expressed in Turkish Lira (“TRL”) unless otherwise stated.)
31
7. TRADE RECEIVABLES AND PAYABLES
Trade Receivables
Short Term Trade Receivables
31 Dec. 2013 31 Dec. 2012
Short term trade receivables
Trade receivables 280.928.014 176.577.903
Notes receivable 501.520 1.635.618
Trade receivables from related parties (Note 6) 75.727.185 167.732.649
Receivables from National Petrochemical Company ("NPC") 52.335.755 37.215.257
Provisions for doubtful trade receivables (-) (2.927.460) (1.957.054)
406.565.014 381.204.373
The relevant explanations related to credit risk of trade receivables are given in note 35.
Guarantees related to undue receivables:
31 Dec. 2013 31 Dec. 2012
Letters of Guarantee 240.924.896 216.517.648
Collateral Checks /Notes 3.171.401 820.001
244.096.297 217.337.649
Analysis of the receivables which are overdue and impaired: The company allocates provisions for doubtful receivables in case the receivables which are considered to be doubtful being without security and having a risk of collection.
Short Term Trade Receivables The data of the company regarding the doubtful receivables and allowances allocated regarding these receivables are as follows:
Doubtful Receivables
Overdue following the maturity 31 Dec. 2013 31 Dec. 2012
More than 9 months 2.927.460 1.957.054
2.927.460 1.957.054
Provision for doubtful receivables:
1 Jan.- 1 Jan.-
31 Dec. 31 Dec.
Provision for doubtful receivables 2013 2012
Opening balance 1.957.054 288.224
Expenses in term 973.307 1.668.830
Collections in period (2.901) -
Closing balance 2.927.460 1.957.054

GÜBRE FABRİKALARI T.A.Ş. AND ITS SUBSIDIARY COMPANY
FOOTNOTES FOR FINANCIAL STATEMENTS FOR YEAR THAT ENDED AS OF 31
DECEMBER 2013
(Amounts are expressed in Turkish Lira (“TRL”) unless otherwise stated.)
32
7. TRADE RECEIVABLES AND PAYABLES (Cont.)
Trade Payables
Short Term Trade Payables 31 Dec. 2013 31 Dec. 2012
Suppliers (Gübretaş) 439.424.356 278.357.134
Suppliers (Razi) 90.099.287 121.423.740
Payables to related parties (Note 6) 9.259.739 4.738.896
Payables to NPC (Razi) 69.555.812 60.768.048
Other Trade Payables 37.015.641 12.787.755
645.354.835 478.075.573
The explanations of the risks quality and level of trade payables was given at Note 35.
8. RECEIVABLES FROM AND PAYABLES TO FINANCE SECTOR
None. (31 December 2012: None).
9. OTHER RECEIVABLES AND PAYABLES
Other Short Term Receivables
Other Short Term Receivables 31 Dec.2013 31 Dec. 2012
Receivables from Non-controlling Shareholders (Note 6) 91.937.552 43.831.897
Other Various Receivables (*) 48.722.651 41.820.105
Value Added Tax Receivables 20.569.052 9.536.069
Other Various Receivables 5.855.260 5.190.649
Receivables from Staff 2.579.635 1.400.310
Other Recievables from Subsidiaries (Note 6) 1.945.063 10.172
171.609.213 101.789.202
(*)Tabosan Mühendislik İmalat ve Montaj A.Ş. (“Tabosan”), one of the consortium partners of the Group at the
acquisition of Razi shares have filed a petition for adjournment of bankruptcy in 2011 but the bankruptcy court
rejected the petition and decided on the bankruptcy of Tabosan and formation of a trustee committee to manage the
assets of Tabosan. The Group was the guarantor of Tabosan for the loans obtained from financial institutions during
the acquisition of Razi shares. The group has paid 48.722.651 TL (31 December 2012: 41.820.105 TL) for the loan
of Tabosan as the guarantor and recognized this amount as other receivable from Tabosan. The Group has not
provided any provision for this receivable considering its right to buy Razi shares at the initial acquisition share
price and the pledged assets of Tabosan which are transferred from the financial institutions. The negotiations
between the Group and the trustee committee are ongoing as of the date of this report.

GÜBRE FABRİKALARI T.A.Ş. AND ITS SUBSIDIARY COMPANY
FOOTNOTES FOR FINANCIAL STATEMENTS FOR YEAR THAT ENDED AS OF 31
DECEMBER 2013
(Amounts are expressed in Turkish Lira (“TRL”) unless otherwise stated.)
33
9. OTHER RECEIVABLES AND PAYABLES (Cont.)
Other Long Term Receivables
Other Long Term Receivables 31 Dec.2013 31 Dec. 2012
Deposits and Guarantees Given to Related Parties (Note 6) (*) 118.039.402 75.382.511
Deposits and Collateral Given 37.372.915 17.489.691
Receivables from Staff (**) 9.261.106 7.730.910
164.673.423 100.603.112
(*)Deposits and guarantees are given to related parties by “Group” for transporting the products which belong to
Razi.
(**) Receivables from staff are financials which are provided by Razi for its staff for housing.
Other Short Term Payables
Other Short Term Payables 31 Dec.2013 31 Dec. 2012
Dividend Payables to Non-controlling Shares 77.400.777 -
Payables to Iranian Privatization Org. (*) - 39.633.408
Liabilities Related to Financial Assets Recognised with the
Methods of the Purchase Share from Equity 9.272.385 -
Other Payables and Liabilities (**) 23.090.653 15.853.049
109.763.815 55.486.457
(*) In 2008, the consortium, also including the company, participated in the tender the Iranian Privatization
Administration and purchased the shares of the Razi Petrochemical Co. 20% of the sales price was paid in advance
and the balance is being paid in 6 monthly equal installments. As of 19 April 2013, last installments was paid (31
December 2012; TRY 39.633.408)
(**) It is debts relating to investments by Razi.

GÜBRE FABRİKALARI T.A.Ş. AND ITS SUBSIDIARY COMPANY
FOOTNOTES FOR FINANCIAL STATEMENTS FOR YEAR THAT ENDED AS OF 31
DECEMBER 2013
(Amounts are expressed in Turkish Lira (“TRL”) unless otherwise stated.)
34
10. INVENTORIES
31 Dec. 2013 31 Dec. 2012
Raw Materials 123.764.581 95.678.586
Finished Goods 98.584.210 70.804.501
Commodities 260.613.825 142.037.340
Other Inventories 22.888.178 6.882.614
505.850.794 315.403.041
Group carried out net realisable value analysis for inventories and regarding to conclusion of this analysis there is no
provision for inventory losses in current period. (2012: None). The inventories of Group which recorded as expense
through cost have been explained in Note 24.
11. LIVE ASSETS
None. (31 December 2012: None)
12. PREPAID EXPENSES VE DEFERRED INCOME
31 December 31 December
Short Term Prepaid Expenses 2013 2012
Advances given to suppliers 27.290.060 11.048.476
Prepaid expenses 7.527.420 875.107
34.817.480 11.923.583
31 December 31 December
Long Term Prepaid Expenses 2013 2012
Advances given for fixed asset 30.143.512 23.240.046
30.143.512 23.240.046
31 December 31 December
Short Term Deferred Income 2013 2012
Received order advances 48.831.609 20.839.959
Prepaid incomes 96.102 96.102
48.927.711 20.936.061

GÜBRE FABRİKALARI T.A.Ş. AND ITS SUBSIDIARY COMPANY
FOOTNOTES FOR FINANCIAL STATEMENTS FOR YEAR THAT ENDED AS OF 31
DECEMBER 2013
(Amounts are expressed in Turkish Lira (“TRL”) unless otherwise stated.)
35
13. INVESTMENT PROPERTIES
Group’s properties including lands, buildings, port and warehouses at İskenderun Sarıseki leased for 25 years to
Denizciler Birliği Deniz Nakliyatı ve Ticaret Anonim Şirketi regarding to agreement signed on 30.04.2007.
Afterwards leasing agreement increased to 30 years with collateral contract.
The fair value of investment properties of Group on 31 December 2013, was obtained through an assessment made
in December 2013 by Yetkin Gayrimenkul Değerleme ve Danışmanlık A.Ş. which has no relation with Group and is
an independent appraisal company. Appraisal Company is an independent appraisal company which has been
authorized by Capital Markets Board.
As of balance sheet date, there is no restriction about salability of investment properties and no liabilities arising
from purchasing, constructing or improving, maintenance, repair or rehabilitation contracts.
The Group has cancelled the rent contract with Denizciler biriliği in 2012. Denizciler Birliği did npot accept the
cancellation and the Group filed a lawsuit requesting evacuation in October 2012. The negotiations have been
ongoning between the Group and Denizciler Birliği as of the date of this report.
31 Dec. 2013
31 Dec. 2012
Lands and
Parcels Buildings Total
Lands and
Parcels Buildings Total
Net Value at the beginning of period 64.365.000 18.454.021 82.819.021
51.530.000 10.219.595 61.749.595
Rise in fair value (Note 27) 25.123.850 (4.608.718) 20.515.132
12.835.000 8.234.426 21.069.426
Net Value at the end of period 89.488.850 13.845.303 103.334.153
64.365.000 18.454.021 82.819.021
The Company had lease income amounting to 289.755 TL from its investment properties in the period ending on the
date of 31 June 2013 and paid no maintenance cost. (31 December 2012: 1.497.150 TL lease income, 256.267 TL
revenue share)
As of 31 December 2013, real estates for investments and fair value hierarchy related to subject assets of the Group
is presented as follows:
Fair Value Level as of Reporting Date
31 Dec. Level 1 Level 2 Level 3
2013 TL TL TL
Facilities at İskenderun Sarıseki 103.334.153 - 103.334.153 -
There is not any transactions between Level 1 and Level 2 in the current period.

GÜBRE FABRİKALARI T.A.Ş. AND ITS SUBSIDIARY COMPANY
FOOTNOTES FOR FINANCIAL STATEMENTS FOR YEAR THAT ENDED AS OF 31
DECEMBER 2013
(Amounts are expressed in Turkish Lira (“TRL”) unless otherwise stated.)
36
14. TANGIBLE FIXED ASSETS
The depreciation cost and amortization of the company is 62.439.055 TL as of 31 December 2013 and details are
given below.
Gübretaş
Razi
Total
Amortization Cost 14.986.502
47.287.696
62.274.198
Depreciation Cost 164.857
-
164.857
Total Amount 15.151.359
47.287.696
62.439.055
Out of the total of 62.439.055 TL depreciation and amortization costs; 51.235.609 TL have been included in General
Production Costs, 1.087.294 TL in Sales and Marketing Costs, 9.706.583 TL in General Administrative Costs, and
409.569 TL remained in inventories.
31 December 2012: Out of the total of 52.150.556 TL depreciation and amortization costs; 49.654.204 TL have been
included in General Production Costs, 566.590 TL in Sales and Marketing Costs, 1.575.172 TL in General
Management Costs, and 354.590 TL remained in inventories.)
As of 31 December 2013, parcels and buildings of the Group and fair value hierarchy related to subject assets of the
Group is presented as follows:
Fair Value Level as of Reporting Date
31 Dec. Level 1 Level 2 Level 3
2013 TRL TRL TRL
Production Facility in Parcel A
Parcel 45.404.638 - 45.404.638 -
Building 4.734.797 - 4.734.797 -
There is not any transactions between 1. Level and 2. Level in the current period.
Pledges and Mortgages on Assets
There are no pledges or mortgages on the fixed tangible fixed assets of the company as of the dates 31 December
2013 and 31 December 2012.

GÜBRE FABRİKALARI T.A.Ş. AND ITS SUBSIDIARY COMPANY
FOOTNOTES FOR FINANCIAL STATEMENTS FOR YEAR THAT ENDED AS OF 31 DECEMBER 2013
(Amounts are expressed in Turkish Lira (“TRL”) unless otherwise stated.)
37
14. TANGIBLE FIXED ASSETS (Cont.)
Lands and Surface and Buildings Facility, Vehicles Fixtures Special Ongoing Total
ParcelsUnderground
Improvement
Machinery and
DevicesCosts Investments
Cost Value
Opening balance on 1 January 2013 110.082.687 15.876.775 216.071.647 627.974.894 5.795.782 8.082.360 192.680 26.797.802 1.010.874.627
Translation differences 465.133 - 4.883.059 104.688.004 627.200 1.017.904 - 4.698.806 116.380.105
Valuation difference (*) 45.404.638 1.879.430 113.228.175 - - - - - 160.512.243
Purchases 6.963.846 52.750 24.513.972 4.146.548 1.450.407 1.760.434 - 155.551.474 194.439.431
Sales - - (2.754.271) (79.000) (702.125) (119.183) - - (3.654.580)
Decrease in Value - - - (16.136.427) - - - - (16.136.427)
Transfer from ongoing investments - 10.117.626 7.420.182 18.797 474.737 - - (18.031.342) -Transfer from Tangible Fixed Asset to
Goodwill (202.848) - (971.309) (4.754.938) 68.374 77.839 - - (5.782.882)
Closing Balance on 31 December 2013 162.713.457 27.926.580 362.391.454 715.857.878 7.714.375 10.819.354 192.680 169.016.740 1.456.632.518
Accrued depreciation
Opening balance on 1 January 2013 - (10.478.736) (151.307.527) (330.874.728) (3.300.661) (4.738.239) (63.808) - (500.763.699)
Translation differences - - (2.696.053) (57.067.807) (454.307) (645.996) - - (60.864.162)
Valuation difference (*) - (489.451) (109.883.356) - - - - - (110.372.807)
Expenses for the period - (880.566) (14.617.039) (45.435.123) (720.956) (586.588) (33.925) - (62.274.198)
Sales - - 294.554 13.167 458.018 116.128 - - 881.866Transfer from Tangible Fixed Asset to
Goodwill - - (26.440) 526.101 (7.774) (3.540) - - 488.347
Closing Balance on 31 December 2013 - (11.848.753) (278.235.861) (432.838.391) (4.025.680) (5.858.236) (97.733) - (732.904.654)
Net value on 31 December 2013 162.713.457 16.077.827 84.155.593 283.019.487 3.688.695 4.961.118 94.947 169.016.740 723.727.864
(*) The fair value of investment properties of Group on 31 December 2013, was obtained through an assessment made in December 2013 by Yetkin Real Estate Assessment
and Consulting Inc. Co.which has no relation with Group and is an independent expertise company. Appraisal Company is an independent appraisal company which has been
authorized by Capital Markets Board. Regarding to this assessment report, real estates assessed with peer comparison, lands assessed with reconstruction cost method.

GÜBRE FABRİKALARI T.A.Ş. AND ITS SUBSIDIARY COMPANY
FOOTNOTES FOR FINANCIAL STATEMENTS FOR YEAR THAT ENDED AS OF 31 DECEMBER 2013
(Amounts are expressed in Turkish Lira (“TRL”) unless otherwise stated.)
38
14. TANGIBLE FIXED ASSETS (Cont.)
Lands and Surface and Buildings Facility, Machinery Vehicles Fixtures Ongoing Investments Total
ParcelsUnderground
Improvementand Devices
Maliyet Değeri
Opening Balance on 1 Jan. 2012 112.881.326 12.019.576 137.425.916 1.264.580.033 9.019.933 13.076.256 40.751.084 1.589.754.124
Translation Differences (2.061.838) - (28.931.345) (686.749.989) (4.050.130) (6.019.695) (22.038.202) (749.851.199)
Revaluation Differences (*) 355.940 3.324.556 92.117.775 - - - - 95.798.271
Purchases 65.598 532.643 11.086.954 5.117.162 1.285.676 1.051.938 10.586.479 29.726.450
Sales (2.314.571) - (593.622) (383.503) (513.713) (74.500) - (3.879.909)
Transfer from ongoing investments - - 389.146 2.112.413 - - (2.501.559) -
Effect of Affiliate Acquisition 1.156.232 - 4.769.503 43.298.778 54.016 48.361 - 49.326.890
Closing Balance on 31 Dec. 2012 110.082.687 15.876.775 216.264.327 627.974.894 5.795.782 8.082.360 26.797.802 1.010.874.627
Accured Depreciation
Opening Balance on 1 Jan. 2012 - (9.259.200) (83.474.195) (606.750.294) (6.160.941) (7.611.336) - (713.255.966)
Translation Differences - - 16.173.659 322.951.962 3.130.302 3.755.690 - 346.011.613
Revaluation Differences (*) - (925.946) (81.145.823) - - - - (82.071.769)
Expenses for the period - (293.590) (3.000.469) (47.104.114) (686.566) (930.544) - (52.015.283)
Sales - - 75.493 27.718 416.544 47.951 - 567.706
Closing Balance on 31 Dec. 2012 - (10.478.736) (151.371.335) (330.874.728) (3.300.661) (4.738.239) - (500.763.699)
Net Value as of 31 Dec. 2012 110.082.687 5.398.039 64.892.992 297.100.166 2.495.121 3.344.121 26.797.802 510.110.928
(*) The fair value of investment properties of Group on 31 December 2012, was obtained through an assessment made in June 2012 by Emsal Real Estate Assessment and
Consulting Inc. Co. which has no relation with Group and is an independent expertise company. Appraisal Company is an independent appraisal company which has been
authorized by Capital Markets Board. Regarding to this assessment report, real estates assessed with peer comparison, lands assessed with reconstruction cost method.

GÜBRE FABRİKALARI T.A.Ş. AND ITS SUBSIDIARY COMPANY
FOOTNOTES FOR FINANCIAL STATEMENTS FOR YEAR THAT ENDED AS OF 31
DECEMBER 2013
(Amounts are expressed in Turkish Lira (“TRL”) unless otherwise stated.)
39
15. INTANGIBLE FIXED ASSETS
31 December 31 December
Rights 2013 2012
Opening Balance on 1 January 378.658 362.523
Purchases 74.728 16.135
Closing Balance on 31 December 453.386 378.658
Accured Depreciation
Opening Balance on 1 January (151.193) (92.192)
Amortization expenses for current period (164.857) (135.273)
Closing Balance on 31 December (316.050) (227.465)
Net Book Value 137.336 151.193
16. GOODWILL
31 December 31 December
2013 2012
Cost Value
Cost value at the beginning of period 120.811.461 279.484.282
Arya Goodwill (Note 3) 5.294.555 -
Translation Differences 22.705.812 (158.672.821)
Closing value 148.811.828 120.811.461
Razi completed purchase of 2010 established, 126.000 tons/year capacity phosphoric acid plant Arya Phosphoric
Jonoob Co.’s (“Arya”) 87,5% of shares as of end of August 2012. The Group has realized the purchasing in the
remaining non controlling shares as of balance sheet date.
Group checks Goodwill for any possible decrease every year. Goodwill is formed by Razi’s acquisition and Razi is
defined as cash generator for Goodwill impairment test.This usage value calculations includes discounted after tax
cash flow projections based on Turkish Lira. These projections based on annual budget confirmed by Groups
Administration. On usage value calculations, discount rate is taken 20% and growth is taken 1% (31 December
2012: discount %20, growth %1). Discount rate before tax for display purpose is approximately 21% (31 December
2012: 21%) Discount rate is after tax discount rate and it includes risks specific for the Company. Group does not
determine any depreciation on Goodwill by tests using aforementioned projections as of 31 December 2013.
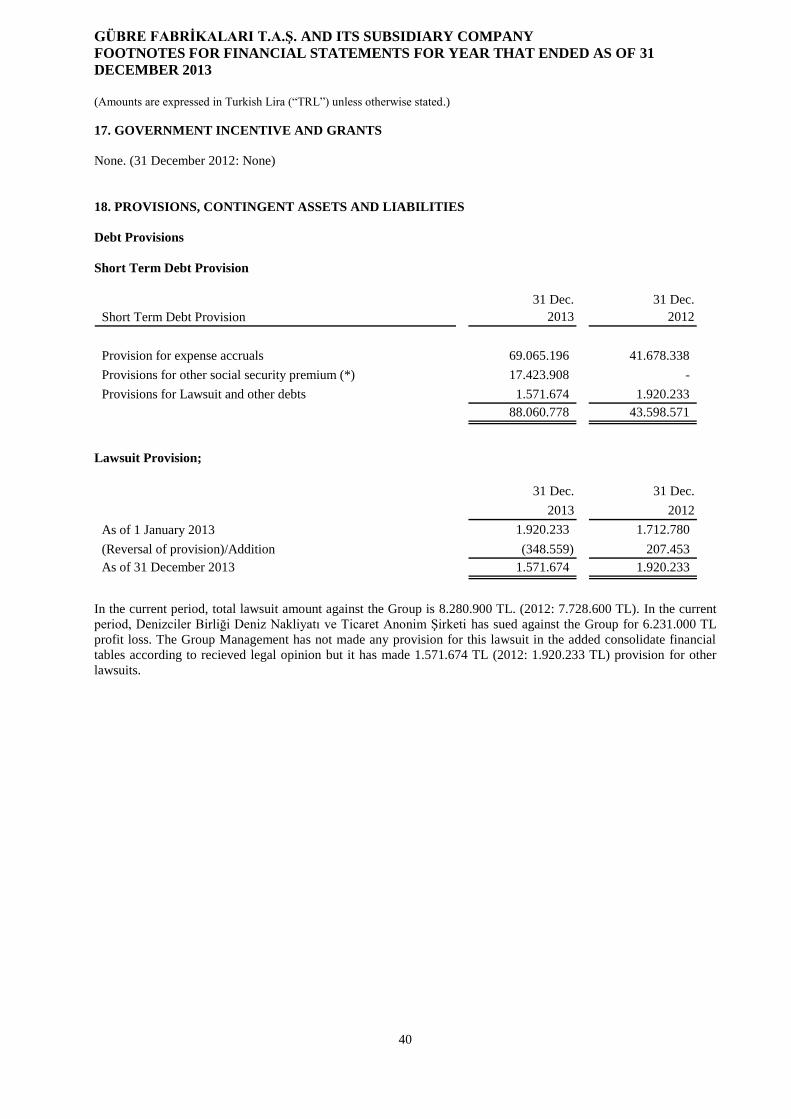
GÜBRE FABRİKALARI T.A.Ş. AND ITS SUBSIDIARY COMPANY
FOOTNOTES FOR FINANCIAL STATEMENTS FOR YEAR THAT ENDED AS OF 31
DECEMBER 2013
(Amounts are expressed in Turkish Lira (“TRL”) unless otherwise stated.)
40
17. GOVERNMENT INCENTIVE AND GRANTS
None. (31 December 2012: None)
18. PROVISIONS, CONTINGENT ASSETS AND LIABILITIES
Debt Provisions
Short Term Debt Provision
31 Dec. 31 Dec.
Short Term Debt Provision 2013 2012
Provision for expense accruals 69.065.196 41.678.338
Provisions for other social security premium (*) 17.423.908 -
Provisions for Lawsuit and other debts 1.571.674 1.920.233
88.060.778 43.598.571
Lawsuit Provision;
31 Dec. 31 Dec.
2013 2012
As of 1 January 2013 1.920.233 1.712.780
(Reversal of provision)/Addition (348.559) 207.453
As of 31 December 2013 1.571.674 1.920.233
In the current period, total lawsuit amount against the Group is 8.280.900 TL. (2012: 7.728.600 TL). In the current
period, Denizciler Birliği Deniz Nakliyatı ve Ticaret Anonim Şirketi has sued against the Group for 6.231.000 TL
profit loss. The Group Management has not made any provision for this lawsuit in the added consolidate financial
tables according to recieved legal opinion but it has made 1.571.674 TL (2012: 1.920.233 TL) provision for other
lawsuits.

GÜBRE FABRİKALARI T.A.Ş. AND ITS SUBSIDIARY COMPANY
FOOTNOTES FOR FINANCIAL STATEMENTS FOR YEAR THAT ENDED AS OF 31
DECEMBER 2013
(Amounts are expressed in Turkish Lira (“TRL”) unless otherwise stated.)
41
18. PROVISIONS, CONTINGENT ASSETS AND LIABILITIES (Cont.)
Assurance- Pledge-Hypothecs (“APH”)
As from 31 December 2013 and31 December2012, the tables related to the Group’s tables related to Assurance-
Pledge-Hypothecs position are as follows:
APH Given by the Company CurrencyCurrency
AmountAmount in TL Currency
Currency
AmountAmount in TL
TL 5.463.494 TL - 7.919.317
EUR - - EUR 13.333.324 31.355.978
B. Total amount of APH's given for the
partnerships included to full consolidation
(hypothec)
IRR mil. 1.870.000 160.505.952 - - -
USD 43.783.492 93.447.106 USD 17.248.277 30.746.779
EUR - - EUR 6.727.860 15.821.909
D. Total amount of other APH’s given - - - - - -
i. Total amount of APH’s given for main
partner - - - - - -
ii. Total amount of APH’s given for other
group companies not falling into the scope of
articles B and C (Assurance)
- - - - - -
iii. Total amount of APH’s given for 3rd
parties not falling in to the scope of article- - - - - -
Total 259.416.552 85.843.983
A. Total amount of APH's given for own legal
entity (Assurance)
C. APH given for guaranteeing the debts of
other 3rd parties for the performance of
ordinary business activities
As of 31 December 2013, “Other APH given by the Group/ the Group equity = 0%” (31 December 2012: 0%).

GÜBRE FABRİKALARI T.A.Ş. AND ITS SUBSIDIARY COMPANY
FOOTNOTES FOR FINANCIAL STATEMENTS FOR YEAR THAT ENDED AS OF 31
DECEMBER 2013
(Amounts are expressed in Turkish Lira (“TRL”) unless otherwise stated.)
42
18. PROVISIONS, CONTINGENT ASSETS AND LIABILITIES (Cont.)
Contingent Liabilities
Iran Tax Authority has performed tax assessments for the tax filings of Razi for the years ended in 2012. As a result
of these assessments, the Iran Tax Authority has identified that Razi has recognized export sales as non-taxable
income. The export sales were considered as taxable by the Iran Tax Authority and Razi was imposed to a total of TL
13 million additional tax charge. Razi has protested against this claim. Based on the opinions of legal advisors and
tax experts, the Group Management has not provided any provisions in the consolidated financial statements.
The sanctions imposed since 2010 on Iran by United Nations may have an effect on the operations of the subsidiary
of the Group. The economic stability of the Iran depends on the measures that will be taken by the government and
the outcome of the legal, administrative and political processes. These processes are beyond the control of the
companies established in the country. Consequently, the entities operating within Iran must consider risks that may
not necessarily be observable in other markets. These consolidated financial statements contain the Group
management’s estimations on the economic and financial positions of its subsidiaries and affiliates operating in Iran.
The future economic situation of Iran might differ from the Group’s expectations.
İskenderun State Treasury Office (“Treasury”) has filed a lawsuit against the Group in 2011 for the cancellation of
its title deed and demanded enforced evacuation of Group’s 79.350 m2 property located in the Sarıseki province of
İskenderun within the city of Hatay claiming that the property is within the shoreline. The net book value of the
property is 103.334.153 TL and has been accounted as investment property in the accompanying consolidated
financial statements. The Group has objected the lawsuit asked for a new expert report for the determination of
shoreline and at the same time filed another lawsuit for a compensation of its ownership right of the property. The
litigation process is ongoing as of the report date. Based on the opinions of legal advisors, the Group Management
has not provided any provisions in the consolidated financial statements for this lawsuit.
Tabosan Mühendislik İmalat ve Montaj A.Ş. (“Tabosan”), one of the consortium partners of the Group at the
acquisition of Razi shares have filed a petition for adjournment of bankruptcy in 2011 but the bankruptcy court
rejected the petition and decided on the bankruptcy of Tabosan and formation of a trustee committee to manage the
assets of Tabosan. The Group was the guarantor of Tabosan for the loans obtained from financial institutions during
the acquisition of Razi shares. The group has paid 48.722.651 TL for the loan of Tabosan as the guarantor and
recognized this amount as other receivable from Tabosan. The Group has not provided any provision for this
receivable considering its right to buy Razi shares at the initial acquisition share price and the pledged assets of
Tabosan which are transferred from the financial institutions. The negotiations between the Group and the trustee
committee are ongoing as of the date of this report.
19. COMMITMENTS
Razis’ Share Purchase
Regarding to Razis’ purchase agreement, all shares of Razi are put in pledge by Iranian Privatization Organisation
until Group and other consortium members pay all of debts. Group and consortium members have agreed that they
have no right to make any implement or change within period of pledge. Moreover, Group and consortium
members gave right to Iran Privatization Organisation for selling or taking over companys’ shares without any
condition if any contrary to the agreement like abusing companys’ rights and harm to collection of its receivables
happens, with an unsubmitted notarised letter of attorney. Group and consortium members have no right for
changing articles of association of company, transffering and selling assets unless they pay all of debts or have
written permission from Iranian Privatization Organization. As of balance sheet date, the Group and other
consortium members has paid all debts related to the purchase of shares to Iran Privatization Organisation.
Application has been made for removing pledges on shares, relevant process is ongoing as of the date of this report
Forward Contracts
As of 31 December 2013, Group has not foreign currency purchasing contracts. As of 31 December 2012, the
company finalized 4 foreign currency purchasing contracts with financial institutions against currency exchange
risk. The maturity date of the contracts was January 2013, and the total nominal value of contracts is USD
20.500.000.

GÜBRE FABRİKALARI T.A.Ş. AND ITS SUBSIDIARY COMPANY
FOOTNOTES FOR FINANCIAL STATEMENTS FOR YEAR THAT ENDED AS OF 31
DECEMBER 2013
(Amounts are expressed in Turkish Lira (“TRL”) unless otherwise stated.)
43
19. COMMITMENTS (Cont.)
Operational Lease
The company has operational lease contracts amounting to a total of 22.800 TL (31 December 2012: 32.045 TL).
The future payment terms and amounts belonging to these transactions, which completely belong to vehicle leasing.
Purchasing Commitments
Group has USD 15.449.501 accredited purchasing commitment as of 31 December 2013. (31 December 2012: USD
18.821.007).
20. EMPLOYEE BENEFITS
Payables within the context of Employee Benefits
31 December 31 December
2013 2012
Personnel Salaries 12.222.260 7.587.028
Social Security Premiums Payable 1.377.528 2.875.495
13.599.788 10.462.523
Short Term
31 December 31 December
2013 2012
Provisions for allowance and employee termination benefits 5.022.124 3.821.514
Provisions for Early Retirement Salary (*) 7.293.665 4.725.529
Provisions for premium 1.005.917 -
13.321.706 8.547.043
Long Term
31 December 31 December
2013 2012
Provisions for employee termination benefits (Gübretaş) 7.377.875 7.386.110
Provisions for employee termination benefits (Razi) 34.861.292 20.045.922
Provisions for Early Retirement Salary (*) 49.702.787 34.279.364
91.941.954 61.711.396
As of 31 December 2013, termination indemnity liability of the company has been calculated with and annual
inflation of 10,00 % and discount rate of 6,2 %, and by using 3,58 % real discount rate (31 December 2012; 2,00%).
As the termination indemnity cap of the company’s provision for termination indemnities is adjusted on every six
months basis, it is calculated as 3.429 TL, which is valid as of the date of 1 January 2014 onwards (31 December
2012: 3.129 TL).
The termination indemnity liability amount of Razi has not been discounted considering interest rate of İran Islamic
Rebuplic
(*) While period of Razi’s privatization, the right of early retirement is provided to employees and responsibility is
accounted in the scope of IAS 19 by Razi.

GÜBRE FABRİKALARI T.A.Ş. AND ITS SUBSIDIARY COMPANY
FOOTNOTES FOR FINANCIAL STATEMENTS FOR YEAR THAT ENDED AS OF 31
DECEMBER 2013
(Amounts are expressed in Turkish Lira (“TRL”) unless otherwise stated.)
44
20. EMPLOYEE BENEFITS (Cont.)
The movement of provision for termination indemnity throughout the year is as follows:
1 January- 1 January-
31 December 31 December
2013 2012
Provision as of 1 January 61.711.396 116.420.468
Service Cost 34.017.791 19.481.730
Interest Cost 4.331.097 5.948.981
Payed termination indemnity (35.421.645) (17.084.998)
Conversion differences 27.303.315 (63.054.785)
Provision as of 31 December 91.941.954 61.711.396
21. QUALITATIVE DISTRIBUTION OF EXPENSES
1 Jan.- 1 Jan.-
31 Dec. 31 Dec.
2013 2012
Personnel expenses 60.490.548 40.899.245
Outsourced benefits and services 148.011.642 100.865.319
Depreciation expenses 62.029.486 51.795.966
Taxes, duties and charges expenses 4.068.976 2.191.373
Other expenses 26.959.707 19.536.368
Cost of goods sold 649.458.797 648.897.136
Cost of commercial goods sold 981.905.471 860.235.121
Cost of other sales 930.710 20.828.316
1.933.855.337 1.745.248.844

GÜBRE FABRİKALARI T.A.Ş. AND ITS SUBSIDIARY COMPANY
FOOTNOTES FOR FINANCIAL STATEMENTS FOR YEAR THAT ENDED AS OF 31
DECEMBER 2013
(Amounts are expressed in Turkish Lira (“TRL”) unless otherwise stated.)
45
22. OTHER ASSETS AND LIABILITIES
Other Assets
31 December 31 December
Other Current Assets 2013 2012
Deferred VAT 33.129.279 12.517.344
Cash Advance 16.707.065 9.434.173
Restrict bank deposits 8.790.853 -
Derivative financial assets - 32.909
Other various current assets 96.938 5.103.033
58.724.135 27.087.459
23. CAPITAL, RESERVES AND OTHER EQUITY COMPONENTS
Paid-in capital
The equity structure as of 31 December 2013 and 31 December 2012 is as follows:
31 December 31 December
Partners % 2013 % 2012
Central Union of Turkish Agricultural Credit
Cooperative 75,95% 253.684.607 75,95% 63.421.152
Other 24,05% 80.315.393 24,05% 20.078.848
Issued Capital 100,00% 334.000.000 100,00% 83.500.000
Company’s capital is formed 33.400.000.000 pieces stocks. (2012: 8.350.000.000 pieces) Stocks’ nominal value is
0,01 TL. (2012: 0,01 TL)
Reserves on Retained Earnings
The legal reserves consist of first and second composition of legal reserves according to the Turkish Code of
Commerce. The first composition of legal reserves is composed of 5% of the previous period’s commercial profits
until the date it reaches 20% of the paid capital. The second composition of legal reserves is allocated as 10% of the
total cash dividend distributions following the first composition of legal reserves and dividends.
The retained earnings that were reclassified consist of the below items as of 31 December 2013 and 31 December
2012:
31 December 31 December
2013 2012
Legal reserves 16.700.000 9.533.275
Real estate sales gain to be added to capital 1.382.652 1.330.243
18.082.652 10.863.518
Regarding to legal records of company, sum of sources available for distribute is 107.694.984 TL(2012:171.911.199 TL).

GÜBRE FABRİKALARI T.A.Ş. AND ITS SUBSIDIARY COMPANY
FOOTNOTES FOR FINANCIAL STATEMENTS FOR YEAR THAT ENDED AS OF 31
DECEMBER 2013
(Amounts are expressed in Turkish Lira (“TRL”) unless otherwise stated.)
46
24. REVENUES
1 January- 1 January-
31 December 31 December
Sales 2013 2012
Domestic Sales 1.552.889.032 1.408.387.571
Overseas sales 731.330.313 852.720.096
Sales Returns (-) (446.446) (481.476)
Sales Discounts (-) (9.011.263) (8.811.580)
Other discounts from sales (-) (9.324.227) (24.995.075)
2.265.437.409 2.226.819.536
Sales Amount
a) Gübre Fabrikaları T.A.Ş. 1 Jan.- 1 Jan.-
31 Dec. 31 Dec.
Unit 2013 2012
TSP Tripe Super phosphate Ton 23.012 23.921
NPK Compound Fertilizer Ton 564.725 531.856
Urea Ton 258.330 229.671
Ammonium Nitrate Ton 306.597 262.549
DAP Ton 186.654 149.847
Ammonium Sulphate Ton 91.611 97.555
CAN Ton 214.380 236.637
Potasium Sulphate Ton 3.855 4.838
Map Ton 593 367
Other Ton 1.480 955
Total 1.651.237 1.538.196
Liquid Fertilizer Lt 1.826.930 1.332.952
Powder Fertilizer Kg 14.342.919 11.900.683
b) Razi Co. 1 Jan.- 1 Jan.-
31 Dec. 31 Dec.
Unit 2013 2012
Sulphur Ton 261.127 319.801
Ammonia Ton 441.356 496.105
Sulphuric acid Ton 136.025 126.874
Urea Ton 449.292 364.588
Dap Ton9.344 1.551
Total 1.297.144 1.308.919

GÜBRE FABRİKALARI T.A.Ş. AND ITS SUBSIDIARY COMPANY
FOOTNOTES FOR FINANCIAL STATEMENTS FOR YEAR THAT ENDED AS OF 31
DECEMBER 2013
(Amounts are expressed in Turkish Lira (“TRL”) unless otherwise stated.)
47
24. REVENUES (Cont.)
Cost of Sales (-)
1 January- 1 January-
31 December 31 December
Cost of Sales 2013 2012
Cost of Goods Produced 688.466.045 660.352.663
Change in the goods inventory 11.965.070 38.198.677
-Goods at the beginning of the period 82.084.413 109.003.178
- Goods at the end of the period (70.119.343) (70.804.501)
Cost of Goods Sold 700.431.115 698.551.340
- Merchandise inventories at the beginning of the period 142.037.341 243.964.456
- Purchases 1.168.212.893 758.308.005
- Merchandise inventories at the end
of the period (328.344.763) (142.037.340)
Cost of Merchandise Sold 981.905.471 860.235.121
Cost of other sales 930.710 20.828.316
1.683.267.296 1.579.614.777
Production Amount
a) Gübre Fabrikaları T.A.Ş. 1 Jan.- 1 Jan.-
31 Dec. 31 Dec.
Unit 2013 2012
TSP Tripe Super phosphate Ton 111.000 120.240
NPK Compound Fertilizer Ton 396.000 361.293
Total Ton 507.000 481.533
Liquid Fertilizer Lt 1.097.890 1.260.982
Powder Fertilizer Kg 4.244.354 4.240.180
b) Razi Co. 1 Jan.- 1 Jan.-
31 Dec. 31 Dec.
Unit 2013 2012
Sulphur Ton 355.717 350.950
Ammonia Ton 674.620 738.601
Sulphuric acid Ton 143.842 126.101
Urea Ton 424.880 336.170
Dap Ton 2.169 -
Total Ton 1.601.228 1.551.822
25. CONSTRUCTION CONTRACTS
None (31 December 2012: None).
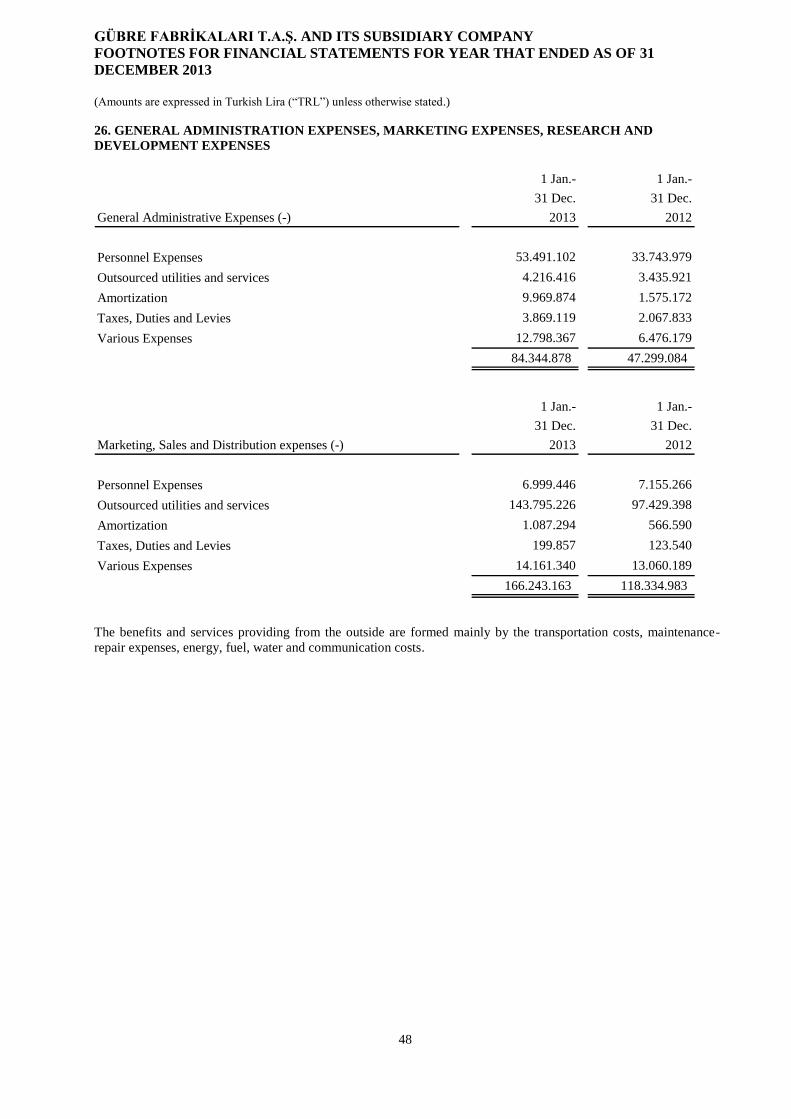
GÜBRE FABRİKALARI T.A.Ş. AND ITS SUBSIDIARY COMPANY
FOOTNOTES FOR FINANCIAL STATEMENTS FOR YEAR THAT ENDED AS OF 31
DECEMBER 2013
(Amounts are expressed in Turkish Lira (“TRL”) unless otherwise stated.)
48
26. GENERAL ADMINISTRATION EXPENSES, MARKETING EXPENSES, RESEARCH AND
DEVELOPMENT EXPENSES
1 Jan.- 1 Jan.-
31 Dec. 31 Dec.
General Administrative Expenses (-) 2013 2012
Personnel Expenses 53.491.102 33.743.979
Outsourced utilities and services 4.216.416 3.435.921
Amortization 9.969.874 1.575.172
Taxes, Duties and Levies 3.869.119 2.067.833
Various Expenses 12.798.367 6.476.179
84.344.878 47.299.084
1 Jan.- 1 Jan.-
31 Dec. 31 Dec.
Marketing, Sales and Distribution expenses (-) 2013 2012
Personnel Expenses 6.999.446 7.155.266
Outsourced utilities and services 143.795.226 97.429.398
Amortization 1.087.294 566.590
Taxes, Duties and Levies 199.857 123.540
Various Expenses 14.161.340 13.060.189
166.243.163 118.334.983
The benefits and services providing from the outside are formed mainly by the transportation costs, maintenance-
repair expenses, energy, fuel, water and communication costs.

GÜBRE FABRİKALARI T.A.Ş. AND ITS SUBSIDIARY COMPANY
FOOTNOTES FOR FINANCIAL STATEMENTS FOR YEAR THAT ENDED AS OF 31
DECEMBER 2013
(Amounts are expressed in Turkish Lira (“TRL”) unless otherwise stated.)
49
27. OTHER REAL OPERATING INCOME AND EXPENSES
Other Operating Income
1 Ocak- 1 Ocak-
31 Aralık 31 Aralık
2013 2012
Exchange difference incomes 288.591.848 139.443.265
Investment properties appreciation (Note 13) 20.515.132 21.069.426
Interest incomes 18.187.944 13.884.364
Trade receivables delay interest 14.596.698 16.960.038
Other incomes 19.210.762 15.657.611
361.102.384 207.014.704
Other Operating Expenses (-)
1 Ocak- 1 Ocak-
31 Aralık 31 Aralık
2013 2012
Exchange difference expenses 218.390.589 36.649.017
Trade payables delay interest 15.399.759 11.186.986
Interest expenses of trade payables 1.865.458 626.233
Other expenses 58.242.776 21.422.440
293.898.582 69.884.676
28. INVESTMENT INCOME AND EXPENSES
1 Jan.- 1 Jan.-
31 Dec. 31 Dec.
2013 2012
Interest income: - 3.472.078
Assets to be held until maturity - 3.472.078
Gains on marketable securities' sales 715.063 -
Exchange difference incomes related to investment 52.099.284 58.396.009
52.814.347 61.868.087
1 Jan.- 1 Jan.-
31 Dec. 31 Dec.
Investing expenses 2013 2012
Interest expenses: 7.218.122 30.401.278
Interest expenses arising from investment 7.218.122 30.401.278
Exchange difference expenses related to investment 54.448.011 -
61.666.133 30.401.278

GÜBRE FABRİKALARI T.A.Ş. AND ITS SUBSIDIARY COMPANY
FOOTNOTES FOR FINANCIAL STATEMENTS FOR YEAR THAT ENDED AS OF 31
DECEMBER 2013
(Amounts are expressed in Turkish Lira (“TRL”) unless otherwise stated.)
50
29. FINANCIAL EXPENSES
1 January -
1 January -
31 December 31 December
2013 2012
Interest expenses:
25.018.823
35.664.402
Interest expenses on bank loans 24.068.645 34.468.184
Other interest expenses 950.178 1.196.218
Total interest expenses 25.018.823 35.664.402
(-): Amount including to fixed assets cost (4.365.737) -
20.653.087
35.664.402
Net exchange difference expenses
81.718.463 133.803.053
(-): Amount including to fixed assets cost
(5.279.756) -
76.438.707
133.803.053
Other financial expenses
359.312 724.714
97.451.106
170.192.169
30. ANALYSIS OF OTHER COMPRHENSIVE INCOME COMPONENTS
Appreciation Fund
The total of appreciation fund is 198.285.266 TL, out of which 35.593.511 TL portion belongs to fixed asset
appreciation fund, 162.628.156 TL belongs to investment properties and 63.599 TL portion on the other hand
belongs to financial assets appreciation fund (31 Aralık 2012: 35.593.511 TL investment properties appreciation
fund, 122.516.608 TL fixed asset appreciation fund, 63.599 TL financial assets appreciation fund).
31 Dec. 31 Dec.
2013 2012
Fixed asset revaluation fund 170.149.071 122.516.608
Value increase in investment properties 35.593.511 35.593.511
Inflation adjustments on equity 63.599 63.599
205.806.181 158.173.718
Foreign Exchange Translation
1 Jan.-
31 Dec.
1 Jan.-
31 Dec.
2013 2012
Balance at beginning of year (187.038.317) 138.791.401
Foreign exchange differences related to conversion of
net assets of foreign affiliate 61.302.396 (325.829.718)
Balance at end of year (125.735.921) (187.038.317)
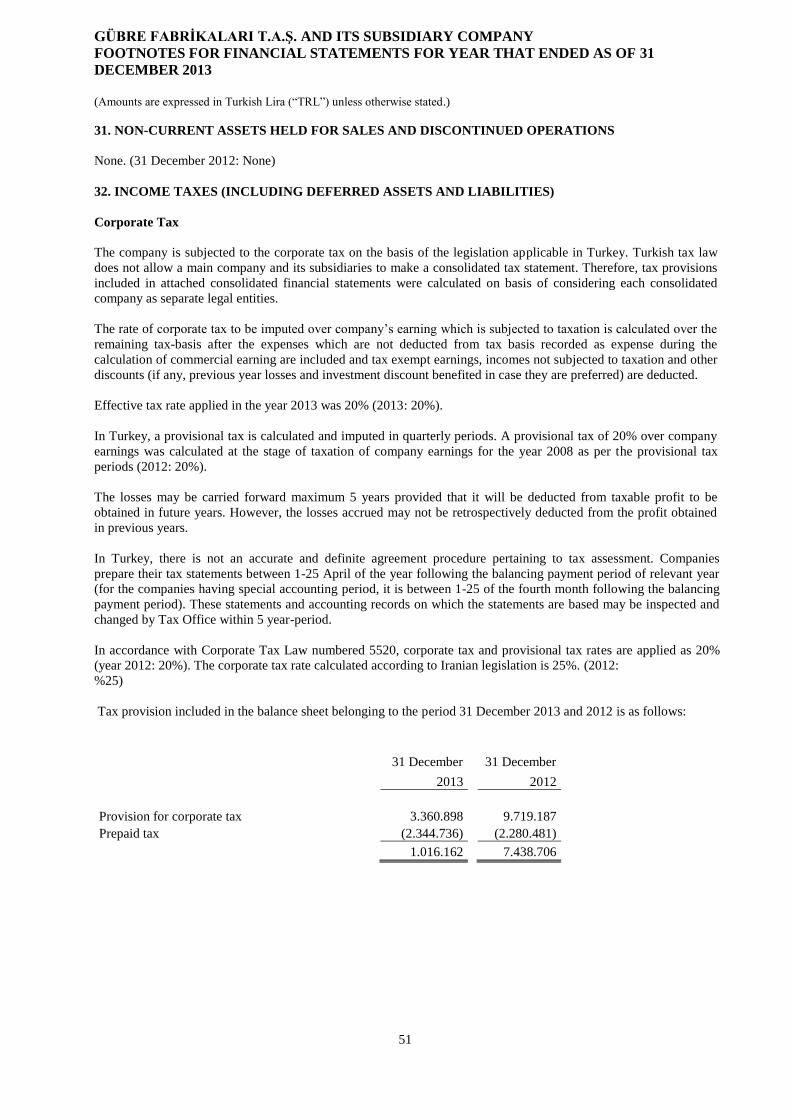
GÜBRE FABRİKALARI T.A.Ş. AND ITS SUBSIDIARY COMPANY
FOOTNOTES FOR FINANCIAL STATEMENTS FOR YEAR THAT ENDED AS OF 31
DECEMBER 2013
(Amounts are expressed in Turkish Lira (“TRL”) unless otherwise stated.)
51
31. NON-CURRENT ASSETS HELD FOR SALES AND DISCONTINUED OPERATIONS
None. (31 December 2012: None)
32. INCOME TAXES (INCLUDING DEFERRED ASSETS AND LIABILITIES)
Corporate Tax
The company is subjected to the corporate tax on the basis of the legislation applicable in Turkey. Turkish tax law
does not allow a main company and its subsidiaries to make a consolidated tax statement. Therefore, tax provisions
included in attached consolidated financial statements were calculated on basis of considering each consolidated
company as separate legal entities.
The rate of corporate tax to be imputed over company’s earning which is subjected to taxation is calculated over the
remaining tax-basis after the expenses which are not deducted from tax basis recorded as expense during the
calculation of commercial earning are included and tax exempt earnings, incomes not subjected to taxation and other
discounts (if any, previous year losses and investment discount benefited in case they are preferred) are deducted.
Effective tax rate applied in the year 2013 was 20% (2013: 20%).
In Turkey, a provisional tax is calculated and imputed in quarterly periods. A provisional tax of 20% over company
earnings was calculated at the stage of taxation of company earnings for the year 2008 as per the provisional tax
periods (2012: 20%).
The losses may be carried forward maximum 5 years provided that it will be deducted from taxable profit to be
obtained in future years. However, the losses accrued may not be retrospectively deducted from the profit obtained
in previous years.
In Turkey, there is not an accurate and definite agreement procedure pertaining to tax assessment. Companies
prepare their tax statements between 1-25 April of the year following the balancing payment period of relevant year
(for the companies having special accounting period, it is between 1-25 of the fourth month following the balancing
payment period). These statements and accounting records on which the statements are based may be inspected and
changed by Tax Office within 5 year-period.
In accordance with Corporate Tax Law numbered 5520, corporate tax and provisional tax rates are applied as 20%
(year 2012: 20%). The corporate tax rate calculated according to Iranian legislation is 25%. (2012:
%25)
Tax provision included in the balance sheet belonging to the period 31 December 2013 and 2012 is as follows:
31 December
31 December
2013
2012
Provision for corporate tax
3.360.898
9.719.187
Prepaid tax
(2.344.736)
(2.280.481)
1.016.162
7.438.706

GÜBRE FABRİKALARI T.A.Ş. AND ITS SUBSIDIARY COMPANY
FOOTNOTES FOR FINANCIAL STATEMENTS FOR YEAR THAT ENDED AS OF 31
DECEMBER 2013
(Amounts are expressed in Turkish Lira (“TRL”) unless otherwise stated.)
52
32. INCOME TAXES (INCLUDING DEFERRED ASSETS AND LIABILITIES) (Cont.)
Deferred Tax Assets and Liabilities
Group is accounting deferred tax assets and liabilities on the basis of the temporary timing differences arising from the
difference between financial statements that are prepared in accordance with IFRS and the statements prepared as
setting the basis for tax obligations. In general the subject matter differences result from some income and expense
amounts included in the tax based statements to take place in different periods in the financial statements that are
prepared in accordance with IFRS.
31 December 2013
31 December 2012
Reflected to the income statement
Deferred Tax
Provisional
differences
Deferred
tax, assets
and liab.
Provisional
differences
Deferred
tax, assets
and liab.
Provisions for termination indemnity
8.448.695
1.689.739
8.446.712
1.689.342
Expense accruals
1.571.674
314.335
63.496
12.699
Receivables rediscount
4.978.658
995.732
3.113.200
622.640
Inventories
10.812.936
2.162.587
8.942.840
1.788.568
Other
3.354.354
670.871
1.918.272
383.654
Loss of previous year
40.958.810
8.191.762
-
-
Deferred tax assets
70.125.127
14.025.025
22.484.520
4.496.903
Investment Property and Tangible Fixed
Assets Current Value Valuation Difference
188.278.159
9.413.908
166.498.651
5.857.935
Payables rediscount
562.640
112.528
308.862
61.772
Other
1.243.277
248.655
32.909
6.583
Deferred Tax Liabilities
190.084.076
9.775.091
166.840.422
5.926.290
Net Deferred Tax Asset (Liability)
4.249.934
(1.429.387)
Razi Co. Deferred Tax Asset / (Liability)
272.860
234.629
Total Deferred Tax Asset / (Liability)
4.522.794
(1.194.758)
Information related to deferred tax transaction table:
Amount reflected to income statement 31 Dec. 31 Dec.
Deferred tax asset/liability transactions 2013 2012
Opening balance on 1 January (1.194.758) 2.986.176
Razi ertelenmiş vergi çevrim farkı etkisi 218.667 1.078.600
Sub Total (976.091) 4.064.776
Deferred tax (income) / expense 8.005.857 (4.573.209)
Deferred tax expense of appreciation related with
tangible assets accounted directly in equity. (2.506.972) (686.325)
Balance sheet outstanding at the end of period 4.522.794 (1.194.758)

GÜBRE FABRİKALARI T.A.Ş. AND ITS SUBSIDIARY COMPANY
FOOTNOTES FOR FINANCIAL STATEMENTS FOR YEAR THAT ENDED AS OF 31
DECEMBER 2013
(Amounts are expressed in Turkish Lira (“TRL”) unless otherwise stated.)
53
32. INCOME TAXES (INCLUDING DEFERRED ASSETS AND LIABILITIES) (Cont.)
Deferred Tax Assets and Liabilities (Cont.)
Tax provision agreement:
1 Jan. 2013 1 Jan. 2012
31 Dec.
2013
31 Dec.
2012
Pre-tax profit / (loss) 276.061.075 472.440.683
20% 20%
Calculated tax (55.212.215) (94.488.136)
Impact of Foreign Subsidiaries subjected to different
tax rates
(14.552.275) (19.725.121)
Impact of expenditure tax not recognized legally (105.791.662) (125.953.084)
Tax effects of discount and exemptions 183.998.938 194.561.349
Other differences unrelated to tax (3.752.242) 3.197.478
Tax income / expense 4.690.544 (42.407.514)
33. EARNINGS PER SHARE
The weighted average of the shares and profit per share calculations of the company as of 31 December 2013 and 31
December 2012 are as follows.
1 Jan- 1 Jan.-
31 Dec. 2013 31 Dec. 2012
Net Profit / (loss) of the period 94.713.933 189.788.214
Number of weighted average shares 33.400.000.000 33.400.000.000
Profit/ loss per share (TL) 0,0028 0,0057
34. FINANCIAL INSTRUMENTS
Financial Investments
Short Term Financial Investments:
The detail of financial investments are shown as of 31 December 2013 and 31 December 2012 as below:
31 Dec. 31 Dec.
Financial instruments that has been reflected to profit/loss
over fair value 2013 2012
Private sector bonds and notes
3.207.694 29.665.189
3.207.694
29.665.189

GÜBRE FABRİKALARI T.A.Ş. AND ITS SUBSIDIARY COMPANY
FOOTNOTES FOR FINANCIAL STATEMENTS FOR YEAR THAT ENDED AS OF 31
DECEMBER 2013
(Amounts are expressed in Turkish Lira (“TRL”) unless otherwise stated.)
54
34. FINANCIAL INSTRUMENTS (Cont.)
Financial Investments (Cont.)
Long Term Financial Investments:
Financial Assets Ready for Sale
Title Subject of ActivityShare
(%)
Amount of
Participation
Share
(%)
Amount of
Participation
İmece Prefabrik Yapı Tarım Makineleri Temizlik
ve Güvenlik Hiz. San. Tic. A.Ş
Steel, Container,
Tower, Crane and
Spare part
Manifacture
15,00 2.013.888 15,00 2.013.888
Tarnet Tarım Kredi Bilişim ve İletişim Hiz. A.ŞInternet Service
Provider etc17,00 523.627 17,00 523.627
Tareksav
Agricultural Credit
Cooperative
Education
Foundation
200.000 200.000
Total 2.737.515 2.737.515
31 Dec. 2013 31 Dec. 2012
Financial investments ready for sale are valued with cost since they do not have an active market. Group does not
expect a value decrease in financial investments.
Financial Payables
31 Dec. 31 Dec.
2013 2012
Short Term Liabilities 680.148.796 346.673.180
Current portion of long-term debt 22.023.750 230.296.526
702.172.546 576.969.706
31 Dec. 31 Dec.
2013 2012
Short Term Financial Liabilities
a) Bank Credits (Gübretaş) 438.740.736 346.673.180
b) Other Financial Liabilities (Razi) (*) 263.431.810 230.296.526
702.172.546 576.969.706
31 Dec. 31 Dec.
2013 2012
Long Term Financial Liabilities
a) Bank Credits (Gübretaş) 173.253.500 28.089.730
b) Other Financial Liabilities (Razi) (*) 6.728.633 29.055.672
179.982.133 57.145.402

GÜBRE FABRİKALARI T.A.Ş. AND ITS SUBSIDIARY COMPANY
FOOTNOTES FOR FINANCIAL STATEMENTS FOR YEAR THAT ENDED AS OF 31
DECEMBER 2013
(Amounts are expressed in Turkish Lira (“TRL”) unless otherwise stated.)
55
34. FINANCIAL INSTRUMENTS (Cont.)
Financial Payables (Cont.)
Short Term Financial Payables:
Bank Credits
Interest Rate (%) MaturityForeign
Currency AmountAmount in TL Amount Amount in TL
3,56 - 5,76 Jan. 2014 EUR 31.271.957 91.830.101 - -
3,35 - 4,18 Jan. 2014 USD 162.540.709 346.910.635 - -
5,68-7,99 Jan. 13 - Apr. 13 EUR - - 17.041.135 40.075.638
3,56-4,60 Jan. 13 - Apr. 13 USD - - 30.250.188 53.923.985
5,85-11,83 Jan. 13 TRL - - - 252.673.557
Total 438.740.736 346.673.180
31 December 2013 31 December 2012
Other Financial Payables (*)
Interest Rate (%) Maturity
Foreign
Currency Amount Amount in TL Amount Amount in TL
Libor+0,5 Jan. 2014 EUR 78.963.040 231.874.967 - -
12 - 16 Jan. 2014 Million IRR 367.658 31.556.843 - -
Libor+0,5 - 4,5 Jan. 2013 EUR - - 88.013.565 206.981.502
16 Jan. 2013 Milyon IRR - - 321.435 23.315.024
Total 263.431.810 230.296.526
31 December 2013 31 December 2012
Long Term Financial Payables:
Bank Credits
Interest Rate (%) MaturityForeign
CurrencyAmount Amount in TL Amount Amount in TL
5,16 - 5,68 Jan. 2020 EUR 59.000.000 173.253.500 11.944.444 28.089.730
Total 173.253.500 28.089.730
31 December 2013 31 December 2012
Other Financial Payables (*)
Interest Rate (%) MaturityForeign
CurrencyAmount Amount in TL Amount Amount in TL
4,5% March 2015 EUR 2.291.378 6.728.633 12.355.178 29.055.672
Total 6.728.633 29.055.672
31 December 2013 31 December 2012
(*) Other financial payable amounts that take place within the short and long-term financial payables show the
payable amount which was taken from NPC as the previous owner of Razi Petrochemical Co. prior to privatization

GÜBRE FABRİKALARI T.A.Ş. AND ITS SUBSIDIARY COMPANY
FOOTNOTES FOR FINANCIAL STATEMENTS FOR YEAR THAT ENDED AS OF 31
DECEMBER 2013
(Amounts are expressed in Turkish Lira (“TRL”) unless otherwise stated.)
56
35. THE QUALITY AND LEVEL OF FINANCIAL INSTRUMENT RISKS
Capital Management
In capital management, the Group tries to ensure the continuity of its activities, while it, on the other hand, aims at
increasing its profit by using its payable and equity capital balance in the most effective way. The capital structure
of the company is comprised of equity capital items such as payables, cash and cash equivalents and other equity
capital items including issued capital, capital reserves and profit reserves, which are defined in footnote 27.
Top management of the Group continuously evaluates the risks associated with each capital level together with
capital cost and manages capital by trying to ensure the most appropriate payable/equity capital balance.
Payables/equity capital ratio is calculated dividing net payables by total capital. Net payable is calculated by
deducting cash and cash equivalent values from total payable amount.
Net payable/total capital ratio as of 31 December 2013 and 31 December 2012 is as follows:
31 December 2013 31 December 2012
Total Debt 1.894.141.427 1.321.800.825
Cash and cash equivalents (-) (568.223.098) (430.098.290)
Net Debt 1.325.918.329 891.702.535
Total shareholders’ equity 1.044.767.797 833.094.452
Net Debt/Total Capital ratio 127% 107%
Targets, Objectives and Policies of Financial Risk Management
The Group manages its financial instruments through finance department and top management. All the
developments in the market are monitored instantly, national and international markets are evaluated in daily
ordinary meetings, and hence financial instruments are managed taking into account cash inflows and outflows. The
Group prepares daily cash report and cash management strategies are developed by managers taking into
consideration all the information said. The Group has Risk Control Directorate tied to CFO, reporting top
management and related units. Also the Group has Risk Monitoring and Financial Control Unit under Finance
Directorate.The Group undertakes cash planning through forward-looking cash flow reports.
The financial instruments that the Group uses are cash, cash equivalents, liquidity funds, purchase and sale of stock
shares, credits and forward transactions. The true purpose of using these instruments is to create financing for the
operations of the Group. The Group has also financial instruments such as trade receivables and trade payables,
which directly arise from the operations of the Group.
The risks arising from instruments used are credit risk, liquidity risk, market and foreign exchange risk and interest
rate risk. The Group management manages these risks in the following stated manner.
Credit Risk Management
The Group is subjected to credit risk because of its trade receivables arising from the forward sales of the Group. Management decreases the credit risk to minimum level regarding its receivables by taking securities (such as bank letter of guarantee, mortgage, etc.) from customers (except for related parties). These credit risks are monitored continuously by the Group and evaluated by considering the quality of the trade receivables, past experiences and current economic condition and expressed in the balance sheet by its net amount after allowance for doubtful receivables is allocated for the receivables not to be collected. (Footnote:7). Approximately 45% of Group sales are related to the main shareholder Turkish Agricultural Credit Cooperatives Central Union.

GÜBRE FABRİKALARI T.A.Ş. AND ITS SUBSIDIARY COMPANY
FOOTNOTES FOR FINANCIAL STATEMENTS FOR YEAR THAT ENDED AS OF 31 DECEMBER 2013
(Amounts are expressed in Turkish Lira (“TRL”) unless otherwise stated.)
57
35. THE QUALITY AND LEVEL OF FINANCIAL INSTRUMENT RISKS (Cont.)
Credit Risk Management The credit risks being subjected by the financial instrument types as of 31 December 2013 and 31 December 2012 are as follows:
Credit risks on basis of financial instrument types
Credit risks on basis of financial instrument types
31 December 2013 Related Party Other Party Related Party Other Party Deposits in Bank
Derivative
financial
instruments
Cash and cash
equivalent
Maximum credit risk exposed as of reporting date (*) 75.727.185 330.837.829 211.922.017 77.726.598 555.159.319 - 13.063.779
- Part of maximum risk secured by guarantee, etc.(**) - 244.096.297 - - - - -
A. Net book value of financial assets which are undue or are not exposed to
depredation 75.727.185 316.707.077 211.922.017 77.726.598 555.159.319 - 13.063.779
B. Net book value of assets which are overdue but not exposed to depredation - 11.203.292 - - - - -
C. Net book value of assets which are exposed to depredation - - - - - - -
- Overdue (gross book value) - 2.927.460 - - - - -
- Value decrease (-) - (2.927.460) - - - - -
- Part of net value secured by guarantee, etc. - - - - - - -
- Undue (gross book value) - - - - - - -
- Value decrease (-) - - - - - - -
- Part of net value secured by guarantee, etc. - 10.886.715 - - - - -
D. Off-balance sheet elements carrying credit risk - - - - - - -
Receivables
Trade receivables Other receivables
(*) Guarantees taken, which provides increase in credit reliability didn’t consider while calculating. (**) Guarantees are guarantee bonos, guarantee checks and guarantee mortgages from clients.

GÜBRE FABRİKALARI T.A.Ş. AND ITS SUBSIDIARY COMPANY
FOOTNOTES FOR FINANCIAL STATEMENTS FOR YEAR THAT ENDED AS OF 31 DECEMBER 2013
(Amounts are expressed in Turkish Lira (“TRL”) unless otherwise stated.)
58
35. THE QUALITY AND LEVEL OF FINANCIAL INSTRUMENT RISKS (Cont.)
Credit risks on basis of financial instrument types
31 December 2012 Related Party Other Party Related Party Other Party Deposits in Bank
Derivative
financial
instruments
Cash and cash
equivalent
Maximum credit risk exposed as of reporting date (*) 167.732.649 213.471.724 119.224.580 57.947.133 427.161.556 32.909 2.936.734
- Part of maximum risk secured by guarantee, etc.(**) - 213.473.683 - - - - -
A. Net book value of financial assets which are undue or are not exposed to
depredation 167.732.649 201.765.855 119.224.580 57.947.133 427.161.556 - 2.936.734
B. Net book value of assets which are overdue but not exposed to depredation - 11.707.828 - - - - -
C. Net book value of assets which are exposed to depredation - - - - - - -
- Overdue (gross book value) - 1.957.054 - - - - -
- Value decrease (-) - (1.957.054) - - - - -
- Part of net value secured by guarantee, etc. - - - - - - -
- Undue (gross book value) - - - - - - -
- Value decrease (-) - - - - - - -
- Part of net value secured by guarantee, etc. - - - - - - -
D. Off-balance sheet elements carrying credit risk - - - - - 32.909 -
Trade receivables Other receivables
Receivables
(*) Guarantees taken, which provides increase in credit reliability didn’t consider while calculating. (**) Guarantees are guarantee bonos, guarantee checks and guarantee mortgages from clients.
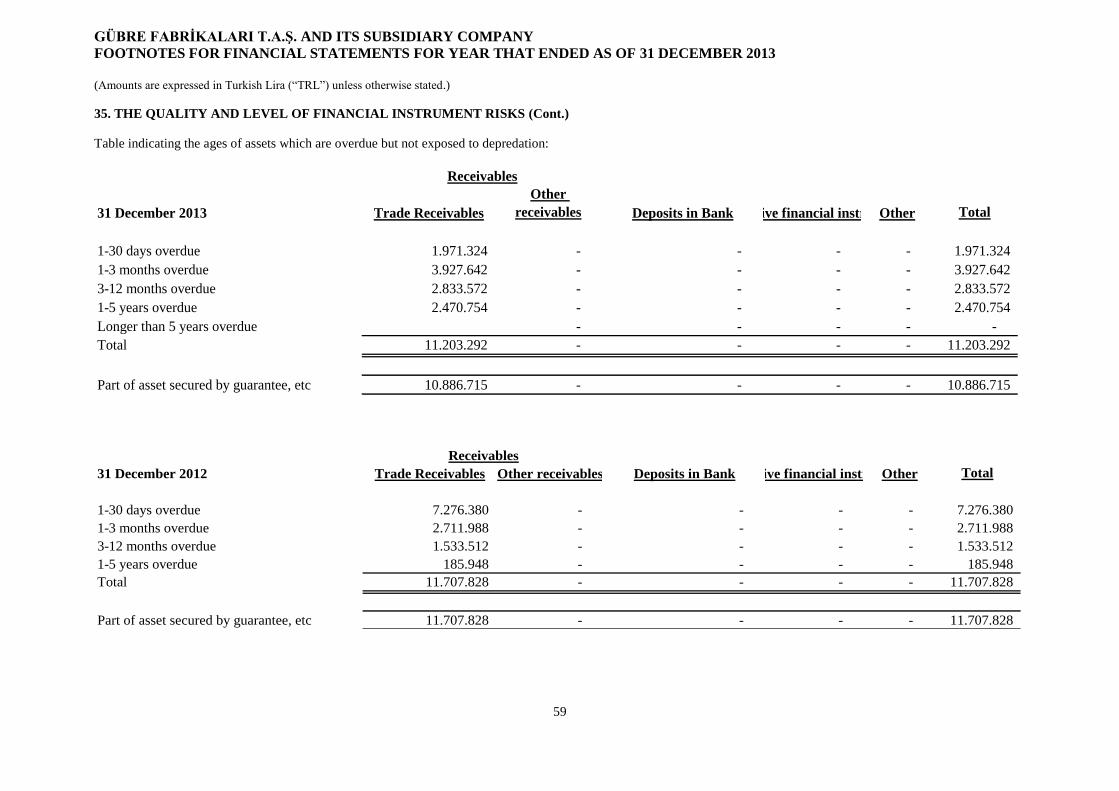
GÜBRE FABRİKALARI T.A.Ş. AND ITS SUBSIDIARY COMPANY
FOOTNOTES FOR FINANCIAL STATEMENTS FOR YEAR THAT ENDED AS OF 31 DECEMBER 2013
(Amounts are expressed in Turkish Lira (“TRL”) unless otherwise stated.)
59
35. THE QUALITY AND LEVEL OF FINANCIAL INSTRUMENT RISKS (Cont.)
Table indicating the ages of assets which are overdue but not exposed to depredation:
31 December 2013 Trade Receivables
Other
receivables Deposits in BankDerivative financial instrumentsOther Total
1-30 days overdue 1.971.324 - - - - 1.971.324
1-3 months overdue 3.927.642 - - - - 3.927.642
3-12 months overdue 2.833.572 - - - - 2.833.572
1-5 years overdue 2.470.754 - - - - 2.470.754
Longer than 5 years overdue - - - - -
Total 11.203.292 - - - - 11.203.292
Part of asset secured by guarantee, etc 10.886.715 - - - - 10.886.715
Receivables
31 December 2012 Trade Receivables Other receivables Deposits in BankDerivative financial instrumentsOther Total
1-30 days overdue 7.276.380 - - - - 7.276.380
1-3 months overdue 2.711.988 - - - - 2.711.988
3-12 months overdue 1.533.512 - - - - 1.533.512
1-5 years overdue 185.948 - - - - 185.948
Total 11.707.828 - - - - 11.707.828
Part of asset secured by guarantee, etc 11.707.828 - - - - 11.707.828
Receivables

GÜBRE FABRİKALARI T.A.Ş. AND ITS SUBSIDIARY COMPANY
FOOTNOTES FOR FINANCIAL STATEMENTS FOR YEAR THAT ENDED AS OF 31
DECEMBER 2013
(Amounts are expressed in Turkish Lira (“TRL”) unless otherwise stated.)
60
35. THE QUALITY AND LEVEL OF FINANCIAL INSTRUMENT RISKS (Cont.)
Liquidity Risk
The management of the company has formed an appropriate liquidity risk management for the short-, mid- and long-
term funding and liquidity requirements. The company manages the liquidity risk by providing the continuation of
sufficient funds and borrowing reserves by regularly following up the estimated and actual cash flows and by
matching the maturities of financial assets and liabilities.
The precautionary liquidity risk management expresses the ability to keep sufficient amount of cash, availability of
sufficient amount of credit transactions and fund sources and the power to close the market position.
The maturity distribution of the financial liabilities of the company with or without derivative character is mentioned
in the table below. The amounts included in the table indicate the cash flow amounts not reduced based on an
agreement as of 31 December 2013 and 31 December 2012:
31 December 2013
Due dates according to
contract Book value
Total of contractual
cash outflows
(I+II+III+IV)
Shorter than 3
months (I)
Between 3-12
months (II)
Between 1-5
years (III)
Longer
than 5
years (IV)
Non-derivative
financial liabilities
Financial Payables 882.154.679 882.530.801 709.277.301 173.253.500 -
Trade Payables 761.689.098 761.261.200 416.708.953 344.552.247 -
Other Payables 2.393.190 2.393.191 1.730.606 78 662.507
Other Liabilities 2.425.677 2.425.677 2.425.677 - -
Total Liabilities 1.648.662.644 1.648.610.869 1.130.142.537 517.805.825 662.507 -
31 December 2012
Due dates according to
contract Book value
Total of contractual
cash outflows
(I+II+III+IV)
Shorter than 3
months (I)
Between 3-12
months (II)
Between 1-5
years (III)
Longer
than 5
years (IV)
Non-derivative
financial liabilities
Financial Payables 634.115.108 634.856.963 346.931.221 258.386.275 29.539.467 -
Trade Payables 473.706.072 474.014.935 351.416.846 122.598.089 - -
Other Payables 85.454.015 85.454.016 42.391.363 42.578.857 483.796 -
Other Liabilities 5.800.527 5.800.527 5.800.527 - - -
Total Liabilities 1.199.075.722 1.200.126.441 746.539.957 423.563.221 30.023.263 -

GÜBRE FABRİKALARI T.A.Ş. AND ITS SUBSIDIARY COMPANY
FOOTNOTES FOR FINANCIAL STATEMENTS FOR YEAR THAT ENDED AS OF 31
DECEMBER 2013
(Amounts are expressed in Turkish Lira (“TRL”) unless otherwise stated.)
61
35. THE QUALITY AND LEVEL OF FINANCIAL INSTRUMENT RISKS (Cont.)
Liquidity Risk (Cont.)
31 December 2013: None
31 December 2012
Due dates according to
contract Book value
Total of contractual
cash outflows
(I+II+III+IV)
Shorter than 3
months (I)
Between 3-12
months (II)
Between 1-5
years (III)
Longer
than 5
years (IV)
Derivative
financial liabilities 32.909 32.909 32.909 - - -
Derivative Cash Inflow 36.758.159 36.758.159 36.758.159 - - -
Derivative Cash Outflow 36.725.250 36.725.250 36.725.250 - - -
Market and Currency Risk
The Group because of its activities is being subjected to financial risks regarding the changes on exchange rate and
interest rate. In order to control the risks associated with exchange rate and interest rate, company uses the financial
instruments also including the below mentioned ones:
A significant part of Group’s inputs from operations in Turkey is over foreign currency and almost all of the sales are
realized with prices determined over TL.
Besides sales prices are determined over TL, the sector is substantially dependent on import inputs; therefore, changes
in exchange rates affect the product sale prices directly. Because of this reason, significant changes in exchange rate are
simultaneously reflected on sales prices. On the other hand, some parts of deposits are kept in the foreign exchange
accounts. The Group is trying to decrease its foreign exchange risk to minimum by using financial instruments such as
forward and option operations. In Razi, inputs are mainly over domestic currency unit, Iranian Riyal, and sales incomes
are mainly over foreign currency (US$). No changes have been made on market risk which the company has been
subjected to in the current year, or on the method that it handles the faced risks or on the methods of measuring these
risks compared to previous years.
Receivables and payables of Razi which have been consolidated on Gübretaş financial statements and not been
subjected to elimination are also indicated on foreign exchange position table.
Foreign exchange position table of the foreign asset and liabilities of the company in terms of original and Turkish Lira
currency units as of 30 December 2013 and 31 December 2012 is as follows;

GÜBRE FABRİKALARI T.A.Ş. AND ITS SUBSIDIARY COMPANY
FOOTNOTES FOR FINANCIAL STATEMENTS FOR YEAR THAT ENDED AS OF 31
DECEMBER 2013
(Amounts are expressed in Turkish Lira (“TRL”) unless otherwise stated.)
62
35. THE QUALITY AND LEVEL OF FINANCIAL INSTRUMENT RISKS (Cont.)
Market and Currency Risk (Cont.)
Foreign Exchange Position Table
In TL
(Functional
currency) In US Dollar EUR Million IRR Yen
1.Trade receivables 226.109.987 25.724.832 14.602.867 1.495.061 -
2a. Monetary financial assets 295.390.810 107.530.707 340.250 755.358 2.715.101
2b.Non-monetary financial assets 128.080.723 7.772.713 1.433.151 1.249.917 -
3.Other - - - - -
4.CURRENT ASSETS 649.581.521 141.028.252 16.376.268 3.500.336 2.715.101
5. Trade Receivables - - - - -
6a. Monetary financial assets - - - - -
6b. Non-monetary financial assets 153.659.622 55.305.909 8.994.164 107.289 -
7.Other - - - - -
8.FIXED ASSETS 153.659.622 55.305.909 8.994.164 107.289 -
9.TOTAL ASSETS 803.241.143 196.334.161 25.370.432 3.607.625 2.715.101
10.Trade payables 726.119.987 198.308.246 7.926.191 3.257.471 -
11.Financial liabilities 702.172.547 162.540.709 110.234.997 367.658 -
12a.Monetary other liabilities 19.636 9.200 - - -
12b. Non-monetary other liabilities - - - - -
13.SHORT TERM LIABILITIES 1.428.312.169 360.858.155 118.161.188 3.625.129 -
14. Trade payables - - - - -
15. Financial liabilities 179.982.131 - 61.291.378 - -
16a. Monetary other liabilities - - - - -
16b. Non-monetary other liabilities - - - - -
17. LONG TERM LIABILITIES 179.982.131 - 61.291.378 - -
18.TOTAL LIABILITIES 1.608.294.301 360.858.155 179.452.566 3.625.129 -
- - - - -
- - - - -
- - - - -
20. Net Foreign Exchange Asset/ (liability) Position (9-
18+19) (805.053.158) (164.523.994) (154.082.134) (17.504) 2.715.101
(1.086.793.503) (227.602.617) (164.509.449) (1.374.710) 2.715.101
- - - - -
23.Amount of hedged portion of foreign currency assets - - - - -
24. Amount of hedged portion of foreign currency liabilities - - - - -
31 December 2013
19.Net Asset/ (liability) position of off-balance sheet
derivative financial instruments over foreign currency (19a-
19b)
19a. Amount of off-balance sheet derivative products
having active character and over foreign currency
19b. Amount of off-balance sheet derivative products
having passive character and over foreign currency
22.Total fair value of financial instruments used in foreign
currency hedge
21.Monetary items net foreign exchange asset/ (liability)
position (1+2a+5+6a-10-11-12a-14-15-16a)

GÜBRE FABRİKALARI T.A.Ş. AND ITS SUBSIDIARY COMPANY
FOOTNOTES FOR FINANCIAL STATEMENTS FOR YEAR THAT ENDED AS OF 31
DECEMBER 2013
(Amounts are expressed in Turkish Lira (“TRL”) unless otherwise stated.)
63
35. THE QUALITY AND LEVEL OF FINANCIAL INSTRUMENT RISKS (Cont.)
Market and Currency Risk (Cont.)
Foreign Exchange Position Table
In TL
(Functional
currency) In US Dollar EUR Million IRR Yen
1.Trade receivables 284.626.765 9.229.580 14.844.937 3.190.368 -
2a. Monetary financial assets 446.954.082 197.101.425 20.052.652 667.411 2.715.101
2b.Non-monetary financial assets - - - - -
3.Other
4.CURRENT ASSETS 731.580.847 206.331.005 34.897.589 3.857.779 2.715.101
5. Trade Receivables 91.817.714 42.287.956 - 226.693 -
6a. Monetary financial assets - - - - -
6b. Non-monetary financial assets - - - - -
7.Other - - - - -
8.FIXED ASSETS 91.817.714 42.287.956 - 226.693 -
9.TOTAL ASSETS 823.398.561 248.618.961 34.897.589 4.084.472 2.715.101
10.Trade payables 581.967.500 159.778.883 4.087.424 3.725.778 -
11.Financial liabilities 324.296.148 30.250.188 105.054.700 321.587 -
12a.Monetary other liabilities 395.249 221.726 - - -
12b. Non-monetary other liabilities - - - - -
13.SHORT TERM LIABILITIES 906.658.897 190.250.797 109.142.124 4.047.365 -
14. Trade payables - - - - -
15. Financial liabilities 57.145.419 - 24.299.621 - -
16a. Monetary other liabilities - - - - -
16b. Non-monetary other liabilities - - - - -
17. LONG TERM LIABILITIES 57.145.419 - 24.299.621 - -
18.TOTAL LIABILITIES 963.804.316 190.250.797 133.441.745 4.047.365 -
19.Net Asset/ (liability) position of off-balance sheet
derivative financial instruments over foreign currency (19a-
19b) 36.543.300 20.500.000 - - -
19a. Amount of off-balance sheet derivative products
having active character and over foreign currency 36.543.300 20.500.000 - - -
19b. Amount of off-balance sheet derivative products
having passive character and over foreign currency - - - - -
20. Net Foreign Exchange Asset/ (liability) Position (9-
18+19) (103.862.455) 78.868.164 (98.544.156) 37.107 2.715.101
21.Monetary items net foreign exchange asset/ (liability)
position (1+2a+5+6a-10-11-12a-14-15-16a) (140.405.755) 58.368.164 (98.544.156) 37.107 2.715.101
22.Total fair value of financial instruments used in
foreign currency hedge - - - - -
23.Amount of hedged portion of foreign currency assets - - - - -
24. Amount of hedged portion of foreign currency liabilities - - - - -
31 December 2012

GÜBRE FABRİKALARI T.A.Ş. AND ITS SUBSIDIARY COMPANY
FOOTNOTES FOR FINANCIAL STATEMENTS FOR YEAR THAT ENDED AS OF 31
DECEMBER 2013
(Amounts are expressed in Turkish Lira (“TRL”) unless otherwise stated.)
64
35. THE QUALITY AND LEVEL OF FINANCIAL INSTRUMENT RISKS (Cont.)
Market and Currency Risk (Cont.)
Gübretaş’s and fully consolidated Razi’s assets and liabilities, which are in foreign exchange other than TL that is
reporting currency unit, have been evaluated in foreign exchange and indicated in the tables.
In the years ending on 31 December 2013 and 31 December 2012, in case there is a (+)/(-)10% change in foreign
exchange rates when the other variables are kept fixed according to the net foreign exchange position on the balance
sheet of the company, the change on the pre-tax profit is as follows:
Foreign Exchange Rate Sensitivity Analysis Table
Foreign
Currency
Appreciates
Foreign
Currency
Depreciates
Foreign
Currency
Appreciates
Foreign
Currency
Depreciates
In case US Dollar currency appreciates/
depreciates by 10 percent:
1- Net asset/liability of US dollar (48.577.226) 48.577.226 10.404.709 (10.404.709)
2- Value secured against US dollar (-) - - - -
3- Net Effect of US dollar (1+2) (48.577.226) 48.577.226 10.404.709 (10.404.709)
In case Euro currency appreciates/
depreciates by 10 percent:
4- Net asset/liability of Euro (48.308.200) 48.308.200 (23.174.629) 23.174.629
5- Value secured against Euro (-) - - - -
6- Net Effect of Euro (4+5) (48.308.200) 48.308.200 (23.174.629) 23.174.629
In case Iranian Riyal currency
appreciates/depreciates by 10 percent:
7- Net asset/liability of Iranian Riyal (12.120.189) 12.120.189 269.028 (269.028)
8- Value secured against Iranian Riyal (-) - - - -
9- Net Effect of Iranian Riyal (7+8) (12.120.189) 12.120.189 269.028 (269.028)
10- Net effect of other foreign currencies 5.493 (5.493) 5.594 (5.594)
TOTAL (3+6+9+10) (109.000.122) 109.000.122 (12.495.298) 12.495.298
Profit / LossProfit / Loss
Current Period (31.12.2013) Previous Period (31.12.2012)
As explained in Note 2, the Group management has used the rates published by the Foreign Exchange Center
(“Center”) monitored by Central Bank of Iran Islam Republic. Had the Group used Turkish Lira /Iran Riyal market
rate based on expected American Dollar/Iran Riyal market rate and the current Turkish Lira/ American Dollar rate
net income would decrease by approximately 29 Million TL and the foreign currency adjustments would increase by
35 Million TL.

GÜBRE FABRİKALARI T.A.Ş. AND ITS SUBSIDIARY COMPANY
FOOTNOTES FOR FINANCIAL STATEMENTS FOR YEAR THAT ENDED AS OF 31
DECEMBER 2013
(Amounts are expressed in Turkish Lira (“TRL”) unless otherwise stated.)
65
35. THE QUALITY AND LEVEL OF FINANCIAL INSTRUMENT RISKS (Cont.)
Interest Rate Risk and Interest Rate Sensitivity
The assets and liabilities of the company with current interest rate are subject to interest rate risk since they are
affected by the changes in interest rates. However, a great portion of the bank credits received by the company have
fixed interest rates, the affect of this change does not reach to substantial amounts. The receivable/payable relation
of company over foreign exchange with relevant companies has also fixed interest rate. The interest position table as
of 31 December 2013 and 31 December 2012 is as follows
31 December 2013 31 December 2012
Financial Liabilities 617.302.892 512.025.739
Financial Liabilities 266.082.270 122.089.369
Fixed interest financial instruments
Floating rate financial instruments
Interest Position Table
Since floating rated liabilities are sensitive to changes on interest limits as of reporting date, just these financial
instruments have gone through a sensitivity analysis. In the sensitivity analysis performed, if the interest over Euro
currency unit was high/low by 100 base point (1%) on 31.12.2013 and all other variables remained fixed, the
profit/loss before taxation and consolidated equity of participations would be low/high by 1.230.484 TL (31
December 2012: 347.223 TL).

GÜBRE FABRİKALARI T.A.Ş. AND ITS SUBSIDIARY COMPANY
FOOTNOTES FOR FINANCIAL STATEMENTS FOR YEAR THAT ENDED AS OF 31 DECEMBER 2013
(Amounts are expressed in Turkish Lira (“TRL”) unless otherwise stated.)
66
36. FINANCIAL INSTRUMENTS (FAIR VALUE EXPLANATIONS AND EXPLANATIONS WITHIN THE FRAME OF HEDGE ACCOUNTING)
Financial instruments categories and fair values
31 December 2013 Book Value Note
Financial Assets
Cash and Cash Equivalents 568.223.098 - - - 568.223.098 39
Trade Receivables 330.837.829 - - - 330.837.829 7
Receivables from relevant parties 75.727.185 - - - 75.727.185 6
Other receivables 340.014.786 - - - 340.014.786 9
Other financial assets - 2.737.515 3.207.694 - 5.945.209 36
Financial Liabilities
Financial Payables - - - 882.154.680 882.154.680 34
Trade Payables - - - 633.765.521 633.765.521 7
Liabilities to relevant parties - - - 9.259.739 9.259.739 6
Other financial liabilities - - - 120.130.271 120.130.271 9
31 December 2012 Book Value Note
Financial Assets
Cash and Cash Equivalents 430.098.290 - - - 430.098.290 39
Trade Receivables 209.387.469 - - - 209.387.469 7
Receivables from relevant parties 167.732.649 - - - 167.732.649 6
Other receivables 118.058.217 - - - 118.058.217 9
Other financial assets - 2.737.515 29.665.189 - 32.402.704 36
Derivative financial assets - - 32.909 - 32.909
Financial Liabilities
Financial Payables - - - 634.115.108 634.115.108 34
Trade Payables - - - 464.882.922 464.882.922 7
Liabilities to relevant parties - - - 4.738.896 4.738.896 6
Other financial liabilities - - - 85.454.015 85.454.015 9
Credits and receivablesFinancial assets
avalaible for sale
Valuation difference
reflected
financial investments
Financial liabilities indicated
over its amortized value
Credits and receivables
(inc. cash and cash
equalavents)
Financial assets
avalaible for sale
Valuation difference
reflected
financial investments
Financial liabilities indicated
over its amortized value
Regarding to Group Administration; financial tools’ book values reflects the fair values.

GÜBRE FABRİKALARI T.A.Ş. AND ITS SUBSIDIARY COMPANY
FOOTNOTES FOR FINANCIAL STATEMENTS FOR YEAR THAT ENDED AS OF 31
DECEMBER 2013
(Amounts are expressed in Turkish Lira (“TRL”) unless otherwise stated.)
67
36. FINANCIAL INSTRUMENTS (FAIR VALUE EXPLANATIONS AND EXPLANATIONS WITHIN
THE FRAME OF HEDGE ACCOUNTING) (Cont.)
Fair values of financial instruments
The fair value of financial assets and liabilities are determined as follows:
First level: Financial assets and liabilities are valued over stock exchange prices used in active market for
assets and liabilities which are similar.
Second level: Financial assets and liabilities are valued over the inputs used to find out observable price of
relevant asset or liability directly or indirectly in the market other than its stock exchange price specified in
first level.
Third level: Financial assets and liabilities are valued over the inputs not based on an observable data in the
market, which is used to find out fair value of asset and liability.
Level classification of financial assets and liabilities indicated with their fair values is as follows:
1st level 2
nd level 3
rd level
Financial assets 31 Dec. 13 TRL TRL TRL
Financial assets ready for sale 2.737.515 - - 2.737.515
Financial assets, of which fair value
difference is reflected on profit/loss 3.207.694 - 3.207.694 -
Derivative financial instruments - - -
Total 5.945.209 - 3.207.694 2.737.515
1st level 2
nd level 3
rd level
Financial assets 31 Dec. 12 TRL TRL TRL
Financial assets ready for sale 2.737.515 - - 2.737.515
Financial assets, of which fair value
difference is reflected on profit/loss 29.665.189 - 29.665.189 -
Derivative financial instruments 32.909 - 32.909 -
Total 32.435.613 - 29.698.098 2.737.515
Fair value level
As of reporting date
Fair value level
As of reporting date
37. EVENTS AFTER THE BALANCE SHEET DATE
None.
38. OTHER MATTERS THAT MATERIALLY AFFECT THE FINANCIAL STATEMENTS OR THAT
NEED TO BE EXPLAINED FOR CLEAR, INTERPRETABLE AND UNDERSTANDABLE
FINANCIAL STATEMENTS
None.
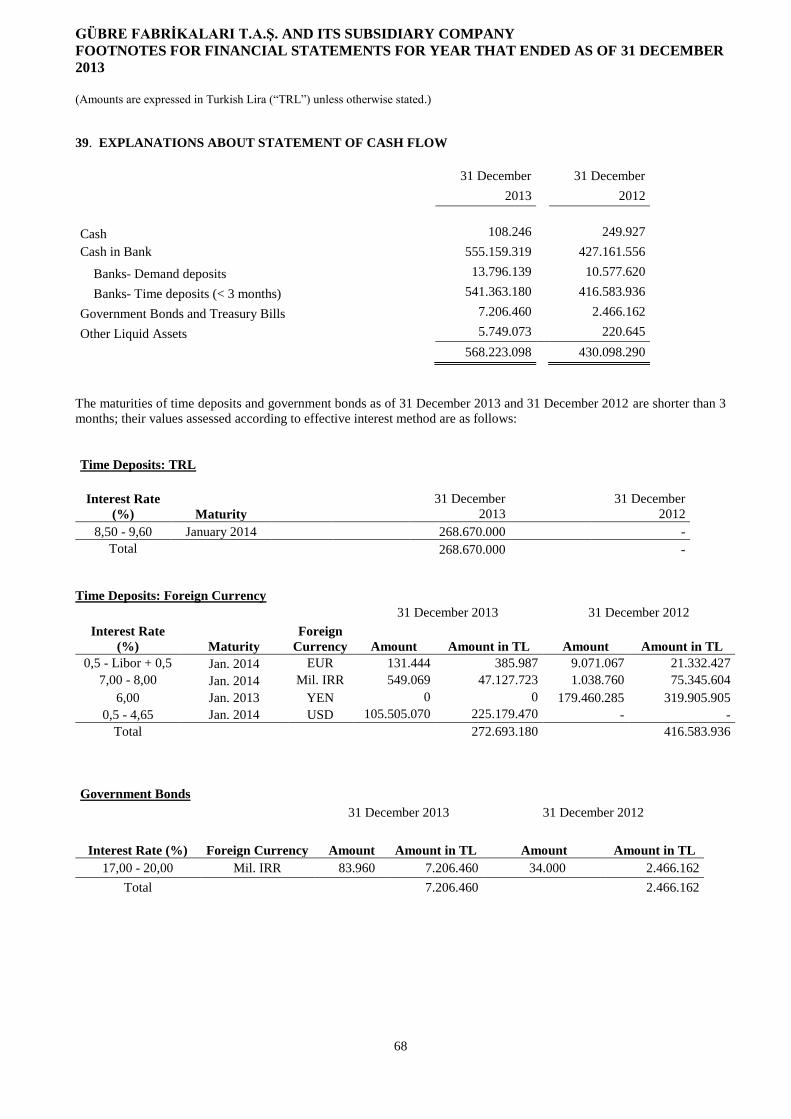
GÜBRE FABRİKALARI T.A.Ş. AND ITS SUBSIDIARY COMPANY
FOOTNOTES FOR FINANCIAL STATEMENTS FOR YEAR THAT ENDED AS OF 31 DECEMBER
2013
(Amounts are expressed in Turkish Lira (“TRL”) unless otherwise stated.)
68
39. EXPLANATIONS ABOUT STATEMENT OF CASH FLOW
31 December 31 December
2013 2012
Cash 108.246 249.927
Cash in Bank 555.159.319 427.161.556
Banks- Demand deposits 13.796.139 10.577.620
Banks- Time deposits (< 3 months) 541.363.180 416.583.936
Government Bonds and Treasury Bills 7.206.460 2.466.162
Other Liquid Assets 5.749.073 220.645
568.223.098 430.098.290
The maturities of time deposits and government bonds as of 31 December 2013 and 31 December 2012 are shorter than 3
months; their values assessed according to effective interest method are as follows:
Time Deposits: TRL
Interest Rate
(%) Maturity
31 December
2013
31 December
2012
8,50 - 9,60 January 2014 268.670.000 -
Total
268.670.000
-
Time Deposits: Foreign Currency
31 December 2013 31 December 2012
Interest Rate
(%) Maturity
Foreign
Currency Amount Amount in TL Amount Amount in TL
0,5 - Libor + 0,5 Jan. 2014 EUR 131.444 385.987 9.071.067 21.332.427
7,00 - 8,00 Jan. 2014 Mil. IRR 549.069 47.127.723 1.038.760 75.345.604
6,00 Jan. 2013 YEN 0 0 179.460.285 319.905.905
0,5 - 4,65 Jan. 2014 USD 105.505.070 225.179.470 - -
Total 272.693.180 416.583.936
Government Bonds
31 December 2013 31 December 2012
Interest Rate (%) Foreign Currency Amount Amount in TL Amount Amount in TL
17,00 - 20,00 Mil. IRR 83.960 7.206.460 34.000 2.466.162
Total 7.206.460 2.466.162