annual report for year ended 30 june 2021
TRANSCRIPT
HOLDINGS LIMITED
ABN 20 075 877 075 ANNUAL REPORT FOR YEAR ENDED 30 JUNE 2021 Page Corporate Directory 1
Chairman’s Report 2
CEO’s Report and Operational Review 3
Directors’ Report 12
Remuneration Report 15
Auditor’s Independence Declaration 23
Directors’ Declaration 24
Financial Report
• Consolidated Statement of Profit or Loss and Other Comprehensive Income
25
• Consolidated Balance Sheet 26
• Consolidated Statement of Changes in Equity 27
• Consolidated Statement of Cash Flows 28
• Notes to the Financial Statements 29
Shareholder information 51
Independent Auditor’s Report to the Members 53
1
CORPORATE DIRECTORY Directors Daniel Chan (Chairman) George Lam (Deputy Chairman)
Andrew Macintosh David Morris Bernard Ripoll
Executives Andrew Fogg (Chief Executive Officer)
Bruce Patrick (Chief Operating Officer) Company Secretary Suzanne Yeates Registered office Level 16, 344 Queen Street Brisbane QLD 4000 (07) 3229 6606 Share register Link Market Services Limited Level 19, 324 Queen Street Brisbane QLD 4000 (02) 8280 7454 Auditor RSM Australia Partners Level 6, 340 Adelaide Street Brisbane QLD 4000 (07) 3225 7800 Bankers Westpac Banking Corporation 388 Queen Eagle Street Brisbane QLD 4000 Stock exchange listing AustChina Holdings Limited shares are listed on the Australian Securities Exchange – using the stock code ‘AUH’. Website address www.austchinaholdings.com
Competent Person’s Statement
I Rowan Johnson confirm that I am the Competent Person for the Competent Person Report from which the information to be publicly released has been obtained and also confirm that:
• I have read and understood the requirements of the 2012 Edition of the Australasian Code for Reporting of Exploration Results, Mineral Resources and Ore Reserves (JORC Code, 2012 Edition), the 2014 Edition of the Australian Guidelines for the Estimation and Classification of Coal Resources and the relevant sections of Chapter 5 and Guidance Note 31 from the ASX Listing Rules.
• I am a Competent Person as defined by the JORC Code 2012 Edition, having 35 years of experience that is relevant to the coal types, quality and potential mining method(s) of the deposit(s) described in the Report. In addition, I have 25 years of experience in the estimation, assessment and evaluation of Coal Resources, the activity for which I am accepting responsibility.
• I am a Member of The Australasian Institute of Mining and Metallurgy. • I have reviewed the Report or Excerpt from the Report to which this Consent Statement applies.
I am a consultant working for McElroy Bryan Geological Services and have been engaged by AustChina Holdings Limited to prepare the documentation for the Blackall Coal Project – Inverness Deposit on which the Report is based. In addition:
• I have disclosed to AustChina Holdings Limited the full nature of the relationship between myself and the company, including any issues that could be perceived by investors as a conflict of interest.
• I verify that the Report is based on and fairly and accurately reflects in the form and context in which it appears, the information in my supporting documentation relating to Coal Resources.
• I consent to the release of the Report and this Consent Statement by the directors of AustChina Holdings Limited.

2
The Chairman’s Report On behalf of the AustChina Board I am pleased to introduce the Company’s 2021 Annual Report. AustChina will continue to build its multi-faceted energy business through ongoing direct and indirect investment in clean energy minerals and projects such as copper, biogas projects and development of its coal assets using clean energy technology, where possible.
The Blackall Coal Project remains a medium-term opportunity dependent in part on the increasing demand for thermal coal into South-east Asia and on any improvement in infrastructure economics that may arise from the progression of Galilee Basin projects. AustChina sees further potential in alternative technologies for the use for the coal on-site to produce energy and other by-products and is investigating these technologies. AustChina is confident that the Utilitas Group Pty Ltd (25.12% AustChina) is well positioned in the biogas (bioenergy and bioproducts) field in Australia. Utilitas continues the advancement in conjunction with its key project counterparts of its initial bioHub projects at Dandenong, the Hunter and Bundaberg, with Bankable Feasibility Studies underway. With the demand for copper increasing strongly going forward, the news post end of the 2021 financial year that our holding in copper explorer Sector Projects Pty Ltd (Sector) is evolving through the planned listing by Revolver Resources Holdings Limited (Revolver) over the coming months is welcomed.1 AustChina seeks to build a platform for wider exposure to developing energy markets through targeted minerals and energy focussed investments. During the year Mr. William Ko retired from the board, and I thank him for his contribution to the company. Both Mr. David Morris and Mr Bernard Ripoll were welcomed to the board. The company also would like to recognise the services of previous Company Secretary Leni Stanley who retired during the year after 19 years of service. I thanked Leni for her service to the company and welcomed Suzanne Yeates as the new Company Secretary. On behalf of the Board, I thank existing shareholders for your continued support and welcome new shareholders to the Company. I also take this opportunity to thank the Board of Directors and Management for their contributions to the company during the year. Daniel Chan Chairman
1 ASX announcement 23 August 2021: “Copper Investment to list on ASX through Revolver Resources”

3
CEO’S REPORT AND OPERATIONAL REVIEW ENERGY PORTFOLIO AUH is embracing technologies that have potential for the utilization of inorganic and organic solid fuel inputs including waste materials and coal to produce energy and potentially other products. AustChina’s Coal Project A schedule of the Exploration Permits held as of 30 June 2021 by AustChina is provided in Table 1.
TENEMENT PROJECT NAME OWNERSHIP % DATE GRANTED EXPIRY DATE
EPC 1719 BARCOO RIVER-BLACKALL RAIL 100 28/07/2010 27/07/2025
EPC 1993 BLACKALL SOUTH CORNER 100 17/03/2010 16/03/2026
Table 1: AustChina Holdings Limited Tenement Portfolio
The two current exploration permits for coal (EPCs) are located near Blackall in Central Queensland. EPCs 1719
and 1993 remain within a single project-based administration area approved by the Department of Natural
Resources, Mines and Energy.
On 5 January 2021 EPC1993 was renewed for a period of 5 years commencing on 17 March 2021.
AustChina’s coal exploration footprint is shown in Figure 1, with its focus on the Blackall Coal Project to the south of the township of Blackall contained within EPCs 1719 and 1993.
Figure 1: AustChina Coal Exploration Portfolio in Queensland at 30th June 2021.

4
Update of Mineral Resources and Reserves
The Company was pleased to announce on 16 June 20202 that it had upgraded the Resource Statement for its
Blackall Coal Project to 31 May 2020, with the inclusion for the first time of 30 million tonnes of Indicated
Resources in EPC1993.
This followed a cored drilling programme targeted to increase the stratigraphic, structural and coal quality
knowledge of a section within the overall resource area.
McElroy Bryan Geological Services Pty Limited (MBGS) provided an objective assessment of coal resources for
its Blackall Coal Project compliant with the JORC Code. Figure 2 shows the drill hole locations for the Blackall
Coal Project.
Figure 2: Drill Hole Location Plan – Blackall Coal Project
2 ASX: “Updated Coal Resource Statement for Blackall Project”

5
Tables 2 and 3 provide the updated Summary Coal Resources by Seam, Category and Depth for EPCs 1719 and 1993, respectively.
TABLE 2:
Seam Name
Block Area (km2)
Coal Area (km2)
Coal Thickness
(m)
In Situ Density (g/cc) (1)
Raw Ash (%) (2)
Specific Energy
(kcal/kg) (a.d.) (3)
Specific Energy
(kcal/kg) (2)
Total Sulphur (%) (2)
Inferred Resources (Mt)
Subcrop < 50m
50 -100m
100 - 150m Total
F 7.70 6.37 1.2 1.56 35 3090 2640 0.53 10 1 - 11 E 12.23 5.50 2.1 1.42 18 4480 3940 0.37 15 16 - 31 D 15.33 7.70 2.2 1.39 14 4800 4250 0.48 16 27 - 43 C 12.73 5.75 0.6 1.39 15 4880 4180 0.42 1 5 - 6 B 22.48 8.04 0.7 1.43 20 4500 3810 1.21 4 11 2 17
Notes: 1 In Situ Density generated from Ash regression at 25% moisture basis 2 Raw coal quality parameters reported at In Situ Moisture basis (25%) 3.Specific Energy reported at air dried basis 4. Default In Situ Density generated from available laboratory data 5. Default Raw Ash generated from default In Situ Density and ash/density regres
Inferred subtotal for EPC1719 46 60 2 108
Inferred Total for EPC1719 108
Inferred Total for EPC1719 (Rounded) 100
TABLE 3:
Seam Name
Block Area (km2)
Coal Area (km2)
Coal Thickness
(m)
In Situ Density (g/
cc) (1) Raw Ash
(%) (2)
Specific Energy (kcal/kg) (a.d.) (3)
Specific Energy
(kcal/kg) (2)
Total Sulphur
(%) (2)
Indicated Resources (Mt)
Subcrop < 50m
50 -100m
100- 150m Total
F 1.91 1.89 1.4 1.52 31 3343 2971 0.67 5.1 - - 5.1 E 2.83 2.13 0.7 1.44 22 4062 3666 0.34 17.9 2.9 - 20.8 D 2.29 1.27 0.5 1.39 15 4566 4150 0.34 3.4 2.2 - 5.6 C 0.47 0.43 0.3 1.35 10 4994 4551 0.39 0.02 0.4 - 0.4
Indicated Subtotal for EPC1993 26.4 5.5 - 31.9 Indicated Total for EPC1993 32
Indicated Total for EPC1993 (Rounded) 30 F 21.20 18.09 0.6 1.48 26 3837 3352 0.57 47 1 - 48 E 43.20 30.60 0.4 1.41 18 4416 3964 0.36 244 25 - 269 D 149.46 70.95 0.4 1.42 19 4334 3898 0.61 300 105 - 405 C 159.49 58.71 0.4 1.41 18 4415 3964 0.41 125 98 <1 224 B 173.57 75.11 1.1 1.43 20 4280 3810 1.31 36 114 9 159 A 56.07 17.67 1.0 1.38 (4) 14 (5) 4790 4290 - 10 17 30 57
Notes: 1. In Situ Density generated from Ash regression at 25% moisture basis 2. Raw coal quality parameters reported at In Situ Moisture basis (25%) 3. Specific Energy reported at air dried basis 4. Default In Situ Density generated from available laboratory data 5. Default Raw Ash generated from default In Situ Density and Ash/Density
i
Inferred Subtotal for EPC1993 761.86 361.2 39 1162 Inferred Total for EPC1993 1162
Inferred Total for EPC1993 (Rounded) 1200
There have been no material changes to the applicable geological information available and the resources reported in tables 2 and 3 above remain as reported in the AustChina Holdings Limited Annual Report for the financial year ended June 2020. There are no Mineral Reserves pertaining to the company’s tenements.

6
The Inverness Deposit is situated within a broad synclinal structure trending north-northwest throughout the 25-kilometre length of the deposit. The coal seams are relatively flat-lying and the upper seams sub-crop locally, controlled by the gentle structure.
Over 800Mt of the resources were estimated at less than 50 metres depth. AUH is reviewing technologies that have potential for the utilization of the resource that include on-site processing of coal to produce energy and potentially other products.
Investment in Biogas Renewable Energy Sector
AustChina holds 25.12% of Utilitas Group Pty Ltd (Utilitas), a Brisbane based privately owned company established in 2010 by Ms Fiona Waterhouse. The company is focused on the emerging biogas and biorefining industries in Australasia. Ms Waterhouse remains a major shareholder in Utilitas and continues as its Chief Executive Officer.
Biogas, mostly methane, is produced via a natural process called anaerobic digestion (AD) of organic material in the absence of oxygen. The world’s most flexible fuel, biogas can directly displace fossil sources of dispatchable electricity, gas and transport fuel and is generated from feedstock that reduces trade waste costs and risks for producers.
The complex nature of biogas projects, vast area of available land for waste disposal, and previously low electricity and gas prices in Australia has meant the local biogas industry has been slow to emerge, but this is changing as industry increasingly needs to demonstrate to governments, customers, investors and supply chains that it is on a transition away from fossil fuels to net-zero emissions across production and logistics.
Figure 3: The biogas cycle.
A regional bioHub aggregates organic waste and wastewater to produce energy, water, and other bio-products. It is centred around anaerobic digestion of wet organic waste streams. A Utilitas bioHub includes upstream and downstream processing and creates a platform for co-location of other biomanufacturing industries including the production of hydrogen. It provides infrastructure as a service to local industry and Councils.

7
In June 2020 Utilitas settled on the acquisition of the 3.5ha Bundaberg (QLD) bioHub site (Figure 4).
Figure 4: Bundaberg bioHub site
On 1 October 2020 Utilitas launched its first asset development, the Bundaberg bioHub, at the 9.5-acre former Bundaberg East Wastewater Treatment Plant site followed by the commencement of early works to prepare for new tenancies in the master-planned industrial park. Expressions of interest from potential tenants were received including from the Company’s own biogas to hydrogen project.
The first two tenants included tenants in the existing laboratories. Preparations for the remaining ten commercial/industrial tenancies commenced. A conceptual layout of the bioHub is presented in Figure 5.
Figure 5: Site Conceptual Layout for the Bundaberg bioHub.

8
Expressions of interest included a biogas technology company, a hydrogen technology company and letters of support secured from next generation vehicle, equipment and engine retrofit companies supporting the development of local supply chain capability.
Utilitas participated at the Bundaberg and Wide Bay Bio-Hydrogen Series event at Bargara in February 2021 along with ReCarbon, Inc. with which Utilitas has a Memorandum of Understanding towards building biogas-to-hydrogen plants across Australia.
In May 2021 Utilitas Group was recognised at the National Hydrogen Conference in Sydney by Bundaberg Regional Council (BRC) showcasing the success of the Bundaberg and Wide Bay BioHydrogen industry cluster in bringing together the supply chain from biogas (Utilitas) to BioHydrogen (ReCarbon) to enable the planned transition of the BRC waste truck fleet.
Utilitas Group is engaged with key project counterparts to validate advancing the company’s first 3 utility scale, commercial grade Renewable Natural Gas (RNG), (biomethane and Hydrogen), to gas grid and mobility projects at Dandenong bioHub, Hunter bioHub and Bundaberg bioHub.
The Clean Energy Finance Corporation (CEFC), in “Energising resource recovery: the Australian opportunity”3 provided its “Investment Outlook to 2025 for Bioenegy and Resource Recovery”. It points to a robust future: “New and expanded infrastructure requirements for waste, recycling and bioenergy projects in Australia have the potential to generate between $4 billion and $7.8 billion in new investments in the period to 2025”. Utilitas has a stated aim to develop 100 bioHubs over the next ten years (https://utilitas.com.au).
3 https://www.cefc.com.au/media/pd2izcqf/energising-resource-recovery-the-australian-opportunity.pdf

9
MINERALS PORTFOLIO Investment in Sector Projects Pty Ltd (AUH 5%)
Through the sale of its subsidiary Surat Gas Pty Ltd completed on 28 September 2018, AustChina acquired 5% of the issued capital of Sector Projects Pty Ltd (Sector).
Sector is 100% owner and operator of Exploration Permits for Minerals (EPMs) 18628, 18644, 18645, and 18647 together with EPMs 26419 and 26463 situated 220km north of Mt Isa in Queensland. Covering an area of 665 square kilometres, these tenements (comprising Project Osprey) have been the subject of a systematic program of exploration activity over the years in the search for world scale base minerals deposits, primarily copper (Figure 6).
The region is known to host a number of large-scale mineral deposits (Mt Isa, Century, George Fischer, Ernest Henry to name a few). The geology of the Sector tenements is known to contain the same host rocks; however, these tenements are overlain by cover material ranging from 40 to 200 metres deep. This cover material makes a more challenging environment for orebody identification when compared to areas closer to Mt Isa where many of the identified economic orebodies have outcropped at surface.
Figure 6: Sector Projects Exploration Area Location

10
Exploration Program
Commencing in H2 FYE 2019 and continuing into July 2019, a 4 hole 2,700m diamond drilling program was undertaken in EPM18628 (Figure 7). Encouraging signs of mineralisation, predominantly chalcopyrite, were seen in 3 of the 4 holes.
Sector undertook a SAMSON EM survey over a targeted area in EPM 18628, coincidently overlaying IP lines 5, 5B and 5C. SAMSON is a sensitive Deep Search technique. The system is excellent at discriminating highly conductive targets such as Cu and Ni Sulphide deposits – even when within conductive terrain.
The coincident use of IP and EM over targeted anomalies and have resulted in the definition of a zone of high conductivity approximately 400 metres south-west of the earlier 2019 drill hole and provided a further target for deep drilling.
Figure 7: Location of IP and SAMSON EM Lines
Sector was successful in obtaining a grant from the Queensland State Government Collaborative Drilling Initiative Round 4 - New Economy Mineral Initiative (NEMI).
This assisted in funding follow up drilling with a drill hole completed to a depth of 625m. It was drilled to basement using rotary mud and then completed with NQ2 coring. The drill core has been sampled for geophysical and petrophysical analysis of mineralized occurrences zones and magnetic susceptibility measurements, orientation was collected throughout the core. Sector is awaiting laboratory test results of the sampled drill core.
The purpose of the drill hole was targeting further evidence of Mt Isa style mineralization, which was encountered with obvious and visible chalcopyrite in quartz carbonate veining.
Note: Post end of 2021 financial year AustChina has agreed, subject to conditions precedent, to transfer its holding in Sector in return for shares in Revolver Resources Holdings Ltd (Holdings) which is the ultimate parent company of Sector. Holdings has lodged a prospectus with the ASX on 2nd August 2021 and is working towards a planned listing on the ASX in the following months.

11
Operations Outlook
The Blackall Coal Project remains a medium-term opportunity dependent in part on the increasing demand for thermal coal into South-east Asia and on any improvement in infrastructure economics that may arise from the progression of Galilee Basin projects. AustChina sees further potential in alternative technologies for the use for the coal on-site to produce energy and other by-products and is investigating these technologies. AustChina is confident that Utilitas is well positioned in the biogas (bioenergy and bioproducts) field in Australia. Utilitas continues the advancement with its key project counterparts of its initial bioHub projects at Dandenong, the Hunter and Bundaberg, with Bankable Feasibility Studies underway. The news post end of the 2021 financial year that our holding in copper explorer Sector is evolving through the planned listing by Revolver Resources Holdings Limited (Revolver) over the coming months is positive, with Revolver holding tenure over and around the historical Dianne Copper Mine NW of Mareeba. AustChina seeks to build a platform for wider exposure to developing energy markets through targeted minerals and energy focussed investments. It is reviewing technologies that have the potential for utilising inorganic and organic solid fuel inputs including waste materials and coal to produce energy and potentially other products. Andrew Fogg Chief Executive Officer

12
DIRECTORS’ REPORT Your directors present their report on the consolidated entity (referred to hereafter as the Group) consisting of AustChina Holdings Limited (“the company”) and the entities it controlled at the end of, or during, the year ended 30 June 2021. Throughout this report the consolidated entity is referred to as the group. Directors The following persons were Directors of AustChina Holdings during the whole of the year and up to the date of this report (unless otherwise stated):
D Chan G Lam A Macintosh David Morris (appointed 24 November 2020) Bernard Ripoll (appointed 10 March 2021) W Ko (resigned 30 November 2020)
Principal Activities During the year the principal continuing activity of the Group consisted of exploration and investment in energy and resources. Review of Operations The operating loss after income tax of the Group for the year was $1,118,036 (2020: loss $413,867). The current year loss includes a loss from equity accounted investment of $240,936 (2020: loss $83,311) and non-cash expense items including tenement expenditure expensed / exploration assets written off of $89,314 (2020: $546,104), gain on fair value of non-current investments of $nil (2020: $173,700), gain on recovery of prior year provision for non-recovery of convertible note of $nil (2020: gain $553,000). Information on the operations of AustChina Holdings Limited and its business strategies and prospects is set out in the CEO’s Report and Review of Operations on pages 3 to 11 of this annual report. Dividend The directors do not recommend the payment of a dividend. No dividend was paid during the year. Significant Changes in the State of Affairs There were no significant changes in the state of affairs of the Group during the financial year. Matters Subsequent to the End of the Financial Year On 5 August 2021, the Group raised $980,400 through the issue of 163,400,000 ordinary shares to sophisticated and professional investors at an issue price of $0.006. One attaching option (exercise price $0.012, expiring 2 August 2023) was issued to investors for every 2 ordinary shares issued under the placement. No other matters or circumstances have arisen since 30 June 2021 that has significantly affected the group’s operations, results or state of affairs, or may do so in future years. Likely Developments and Expected Results from Operations Comments on expected results of certain operations of the group are included in this annual report under the CEO’s report and review of operations on pages 3 to 11. Environmental Regulation The Group is subject to significant environmental regulation in respect of its exploration activities in Australia and is committed to undertaking all its operations in an environmentally responsible manner. To the best of the directors’ knowledge, the Group has adequate systems in place to ensure compliance with the requirements of all environmental legislation and is not aware of any breach of those requirements during the financial year and up to the date of the directors’ report.

13
Information on Directors D Chan CFA, MRICS. Non-executive director Experience and expertise
Mr Chan has extensive experience in the financial and investment arena and holds a Masters Degree in Finance from the Imperial College London and Chartered Financial Analyst (CFA) and is a member of the Royal Institute of Chartered Surveyors (MRICS). Mr Chan has over 13 years’ experience in China real estate investment.
Other current directorships
Nil
Former directorships in last 3 years
Nil
Special responsibilities Chairman, Member of the Audit and Risk Management Committee and Member of the Remuneration Committee. Mr Chan is also AustChina’s representative Director on Utilitas Group Pty Ltd.
Interests in shares and options
Indirect interest in 900,873,358 Ordinary Shares
G Lam BSc, MSc, MBA, DPA, MPA, LLB (Hons), LLM, PCLL, PhD, FHKIoD, FHKIArb, FCMA, FCPA(Aust.) Independent non-executive director Experience and expertise
Mr Lam has over 30 years of international experience in general management, strategy consulting, corporate governance, direct investment, investment banking and fund management across the telecommunications/media/technology (TMT), consumer/healthcare, infrastructure/real estates, energy/resources and financial services sectors.
Other current directorships
Nil
Former directorships in last 3 years
Nil
Special responsibilities Chairman of the Audit and Risk Management Committee and Chairman of the Remuneration Committee
Interests in shares and options
Nil
A Macintosh Independent non-executive director (from 4 July 2019) Experience and expertise
Mr Macintosh hold an MBA (Finance, Economics) and a Bachelor of Science (Computer Science, Mathematics). Mr Macintosh is non-executive Chairman of Acorus Investment Management, a China-Africa private equity fund and has extensive experience in investment banking and finance, both in Australia and overseas.
Other current directorships
Nil
Former directorships in last 3 years
Nil
Special responsibilities Nil Interests in shares and options
Nil
D Morris Independent non-executive director Experience and expertise
Mr Morris is a distinguished international expert on risks and opportunities in the international business environment, who has had a global career as diplomat, senior political adviser and international consultant.
Other current directorships
Nil
Former directorships in last 3 years
Nil
Special responsibilities Nil Interests in shares and options
Nil

14
B Ripoll Independent non-executive director Experience and expertise
Mr Ripoll is a director with public affairs firm SAS Group and his own consulting firm Fresh Advisory which has commercial interests focused on the financial services sector. He is also CEO of financial services and development company Smart Capital Group and the Ethical Development Fund Australia. Mr Ripoll served as the Parliamentary Secretary to the Treasurer with responsibility for Financial Services, the Australian Securities and Investments Commission (ASIC), the Australian Bureau of Statistics (ABS) and other agencies in the Treasury portfolio. Mr Ripoll is an entrepreneur in business development who continues to play a leading role in the financial services sector following a long career as a federal member of parliament from 1998 till retiring in 2016.
Other current directorships
Non-executive Chairman of Utilitas Group Pty Ltd.
Former directorships in last 3 years
Nil
Special responsibilities Nil Interests in shares and options
Nil
Company Secretary The company secretary is Suzanne Yeates CA, B.Bus. Suzanne was appointed to the position of company secretary in 2021. Suzanne is the principal in a Chartered Accounting firm and holds the office of company secretary with other ASX listed companies. Meetings of Directors The numbers of meetings of the company’s board of directors and of each board committee held during the year ended 30 June 2021, and the number of meetings attended by each director were:
Full Meetings of Directors
Meetings of Audit Committee
A B A B Daniel Chan 6 6 2 2 George Lam 6 6 2 2 Andrew Macintosh 6 6 2 2 David Morris 3 4 - 1 Bernard Ripoll 2 2 - - William Ko 2 2 1 1
A = Number of meetings attended B = Number of meetings held during the time the director held office or was a member of the committee during the year. There were no meetings of the Remuneration Committee during the year.

15
Remuneration Report (AUDITED) The directors are pleased to present AustChina Holdings Limited’s 2021 remuneration report which sets out remuneration information for AustChina Holdings Limited’s non-executive directors, executive directors, and other key management personnel. The report contains the following sections:
(a) Key management personnel disclosed in this report (b) Remuneration governance (c) Use of remuneration consultants (d) Executive remuneration policy and framework (e) Relationship between remuneration and AustChina Holdings Limited’s performance (f) Non-executive director remuneration policy (g) Voting and comments made at the company’s 2020 Annual General Meeting (h) Details of remuneration (i) Service agreements (j) Details of share-based compensation and bonuses (k) Equity instruments held by key management personnel (l) Loans to key management personnel (m) Other transactions with key management personnel
(a) Key management personnel disclosed in this report
Non-executive and executive directors (see page 13 for details about each director) Name Position Present: D Chan Non-executive Chairman – appointed 22 November 2013 G Lam Independent non-executive director – appointed 22 November 2013 A Macintosh Independent non-executive director – appointed 4 July 2019 D Morris Independent non-executive director – appointed 24 November 2020 B Ripoll Independent non-executive director – appointed 10 March 2021 Past: W Ko Independent non-executive director – appointed 5 December 2018;
resigned 30 November 2020 Other key management personnel Name Position Andrew Fogg Chief Executive Officer – appointed 2 December 2013 Bruce Patrick Chief Operating Officer – appointed 1 December 2013. Previously
served as Chief Executive Officer. There have been no changes in key management personnel since the end of the financial year. (b) Remuneration governance The board is responsible for: • the over-arching executive remuneration framework • operation of the incentive plans which apply to the executive team, including key performance indicators and
performance hurdles • remuneration levels of executive directors and other key management personnel, and • non-executive directors’ fees.
The objective is to ensure that remuneration policies and structures are fair and competitive and aligned with the long-term interests of the Group. (c) Use of remuneration consultants The Group has not engaged the services of any remuneration consultants during the current or prior financial years.
16
Remuneration Report (continued) (d) Executive remuneration policy and framework The combination of base pay and superannuation make up the executives’ fixed remuneration. Base pay for the executives is reviewed annually to ensure the executive’s pay is competitive with the market. Executive pay is linked to the performance of the company through the issue of performance rights and share options. The board ensures that executive reward satisfies the following key criteria for good reward governance practices:
• competitiveness and reasonableness • acceptability to shareholders • transparency • capital management.
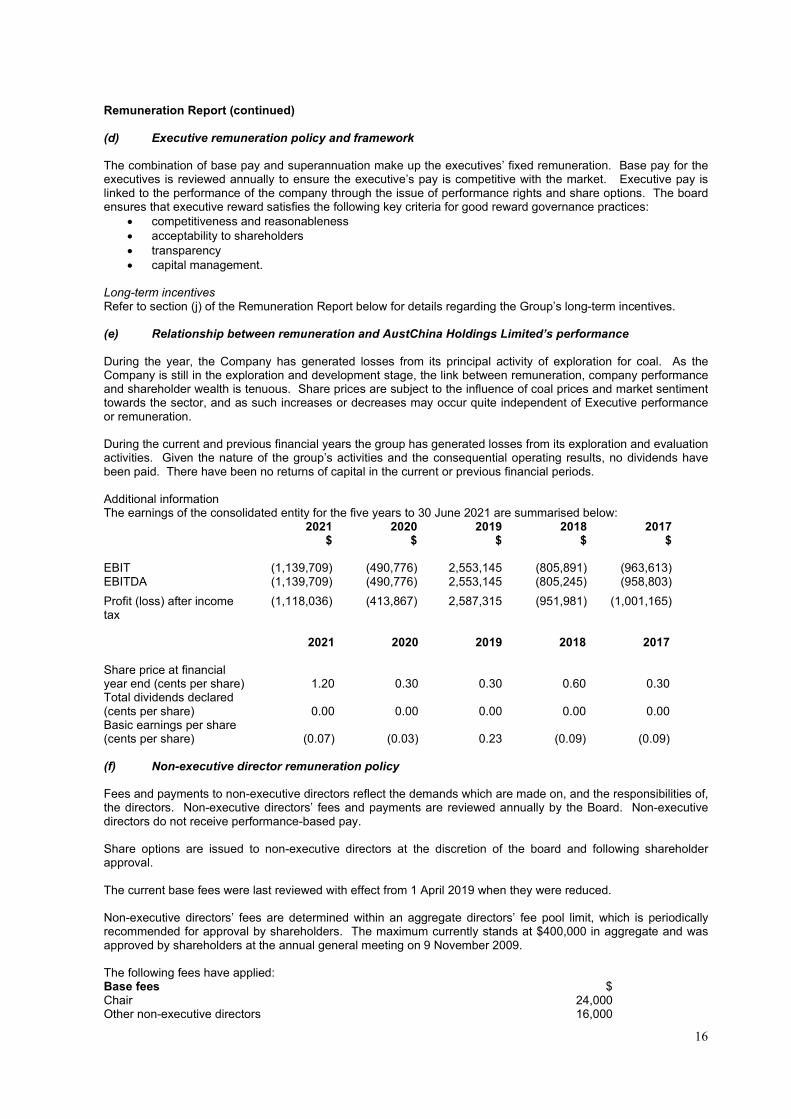
Long-term incentives Refer to section (j) of the Remuneration Report below for details regarding the Group’s long-term incentives. (e) Relationship between remuneration and AustChina Holdings Limited’s performance During the year, the Company has generated losses from its principal activity of exploration for coal. As the Company is still in the exploration and development stage, the link between remuneration, company performance and shareholder wealth is tenuous. Share prices are subject to the influence of coal prices and market sentiment towards the sector, and as such increases or decreases may occur quite independent of Executive performance or remuneration. During the current and previous financial years the group has generated losses from its exploration and evaluation activities. Given the nature of the group’s activities and the consequential operating results, no dividends have been paid. There have been no returns of capital in the current or previous financial periods. Additional information The earnings of the consolidated entity for the five years to 30 June 2021 are summarised below:
2021
$ 2020
$ 2019
$ 2018
$ 2017
$ EBIT
(1,139,709)
(490,776)
2,553,145
(805,891)
(963,613)
EBITDA (1,139,709) (490,776) 2,553,145 (805,245) (958,803) Profit (loss) after income tax
(1,118,036) (413,867) 2,587,315 (951,981) (1,001,165)
2021
2020
2019
2018
2017
Share price at financial year end (cents per share)
1.20
0.30
0.30
0.60
0.30
Total dividends declared (cents per share)
0.00
0.00
0.00
0.00
0.00
Basic earnings per share (cents per share)
(0.07)
(0.03)
0.23
(0.09)
(0.09)
(f) Non-executive director remuneration policy Fees and payments to non-executive directors reflect the demands which are made on, and the responsibilities of, the directors. Non-executive directors’ fees and payments are reviewed annually by the Board. Non-executive directors do not receive performance-based pay. Share options are issued to non-executive directors at the discretion of the board and following shareholder approval. The current base fees were last reviewed with effect from 1 April 2019 when they were reduced. Non-executive directors’ fees are determined within an aggregate directors’ fee pool limit, which is periodically recommended for approval by shareholders. The maximum currently stands at $400,000 in aggregate and was approved by shareholders at the annual general meeting on 9 November 2009. The following fees have applied: Base fees Chair Other non-executive directors
$ 24,000 16,000

17
(g) Voting and comments made at the company’s 2020 Annual General Meeting At the company’s 2020 Annual General Meeting the shareholders voted 99.98% in favour of the advisory remuneration report resolution on a poll. (h) Details of remuneration Amounts of remuneration Details of the remuneration of the directors and the key management personnel (as defined in AASB 124 Related Party Disclosures) of AustChina Holdings Limited are set out in the following tables. Key management personnel of AustChina Holdings Limited
2021 Short-term
benefits
Post-employment
benefits
Share-based
payments
Name
Cash
salary and fees
$
Super-annuation
$
Options $
Total $
A %
B %
Non-executive directors
D Chan, Chairman
24,000
-
68,000
92,000
26%
74%
Independent non-executive directors
G Lam W Ko (to 30 November 2020) A Macintosh D Morris (from 24 November 2020) B Ripoll (from 10 March 2021)
16,000 6,667
16,000 9,609 4,978
-
633 1,520
913 473
68,000
- 68,000
- -
84,000 7,300
85,520 10,522 5,451
19%
100% 20%
100% 100%
81%
- 80%
- -
Sub-total non-executive directors
77,254
3,539
204,000
284,793
28%
72%
Other key management personnel A Fogg – Chief Executive Officer B Patrick– Chief Operating Officer
108,500 125,000
- -
17,000 17,000
125,500 142,000
86% 88%
14% 12%
Total key management personnel compensation
310,754
3,539
238,000
552,293
57%
43%
A Proportion of remuneration that is fixed remuneration B Percentage of remuneration that is share-based payment

18
Remuneration Report (continued)
2020 Short-term
benefits
Post-employment
benefits
Share-based
payments
Name
Cash
salary and fees
$
Super-annuation
$
Options $
Total $
A %
B %
Non-executive directors
D Chan, Chairman from 7 June 2019
24,000
-
-
24,000
100%
-
Independent non-executive directors
G Lam W Ko A Macintosh (from 4 July 2019)
16,000 16,000 16,000
-
1,520 1,520
- - -
16,000 17,520 17,520
100% 100% 100%
- - -
Sub-total non-executive directors
72,000
3,040
-
75,040
100%
-
Other key management personnel A Fogg – Chief Executive Officer B Patrick– Chief Operating Officer
108,193 131,236
- -
- -
108,193 131,236
100% 100%
- -
Total key management personnel compensation
311,429
3,040
-
314,469
100%
-
A Proportion of remuneration that is fixed remuneration B Percentage of remuneration that is share-based payment (i) Service agreements The Company has a service agreement with NABJA Consulting Services Pty Ltd for the services of Mr Andrew Fogg, Chief Executive Officer. The service agreement was for an initial period of 5 years and commenced on 1 December 2013. The base fees were $15,833 per month. The contract includes a change of control clause which is triggered if Treasure Wheel Global Limited ceases to hold 25% or more of AustChina Holdings Limited. Under the change of control clause a compensation amount equal to one year remuneration is payable. In addition, under the contract the contractor or his nominee is entitled to receive five million performance rights in the Company, once the share price equals or exceeds two cents for five consecutive trading days. The initial contract term expired on 1 December 2019 and in accordance with the provisions of the contract it was extended. The current term expires 1 December 2021. The Company has a service agreement with Geomine Project Management Pty Ltd for the services of Mr Bruce Patrick, Chief Operating Officer. The service agreement is ongoing and commenced on 1 December 2013. The base fees are $13,333 per month. There are no termination benefits under the agreement. In addition, under the contract the contractor or his nominee is entitled to receive three million performance rights in the Company, once the share price equals or exceeds two cents for five consecutive trading days.

19
Remuneration Report (continued) (j) Details of share-based compensation and bonuses Options The terms and conditions of each grant of options affecting remuneration in the current or a future reporting period are as follows:
Grant date Vesting and
exercise date
Expiry date
Number Under option
Exercise price
Value per
option at grant date
Performance achieved
% vested
30/11/2020 30/11/2020 15/12/2023 70,000,000 $0.005 $0.0034 100% 100% The options carry no dividend or voting rights. When exercisable, each option is convertible into one ordinary share of AustChina Holdings Limited. The table below shows a reconciliation of options held by each Key Management Personnel from the beginning to the end of the financial year. No options were forfeited during the year.
2021 Name & Grant dates
Balance at the start of the year
Granted as compensation
Vested Balance at the end of the year
Unvested Vested Number % Vested and exercisable
Unvested
D Chan 30 November 2020
-
-
20,000,000
20,000,000
100%
20,000,000
-
A MacIntosh 30 November 2020
-
-
20,000,000
20,000,000
100%
20,000,000
-
G Lam 30 November 2020
-
-
20,000,000
20,000,000
100%
20,000,000
-
A Fogg 30 November 2020
-
-
5,000,000
5,000,000
100%
5,000,000
-
B Patrick 30 November 2020
-
-
5,000,000
5,000,000
100%
5,000,000
-
Shares provided on exercise of remuneration options There were no ordinary shares in the company issued on the exercise of remuneration options during the financial year (2020: nil). Performance rights There were no performance rights over ordinary shares in the company provided as remuneration during the financial year (2020: nil). Shares provided on exercise of performance rights There were no ordinary shares in the company issued to key management personnel during the financial year from the exercise of performance rights.
20
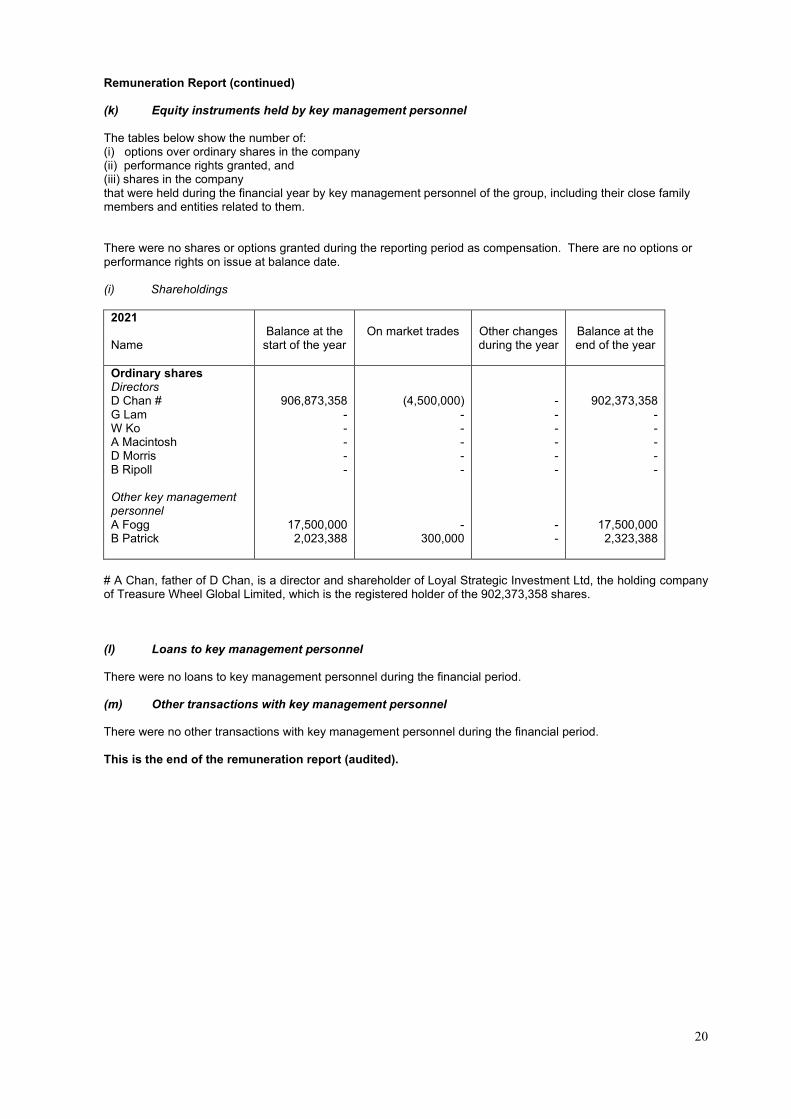
Remuneration Report (continued) (k) Equity instruments held by key management personnel The tables below show the number of: (i) options over ordinary shares in the company (ii) performance rights granted, and (iii) shares in the company that were held during the financial year by key management personnel of the group, including their close family members and entities related to them. There were no shares or options granted during the reporting period as compensation. There are no options or performance rights on issue at balance date. (i) Shareholdings
2021 Name
Balance at the
start of the year
On market trades
Other changes during the year
Balance at the end of the year
Ordinary shares Directors D Chan # G Lam W Ko A Macintosh D Morris B Ripoll
906,873,358 - - - - -
(4,500,000) - - - - -
- - - - - -
902,373,358 - - - - -
Other key management personnel A Fogg B Patrick
17,500,000 2,023,388
- 300,000
- -
17,500,000 2,323,388
# A Chan, father of D Chan, is a director and shareholder of Loyal Strategic Investment Ltd, the holding company of Treasure Wheel Global Limited, which is the registered holder of the 902,373,358 shares. (l) Loans to key management personnel There were no loans to key management personnel during the financial period. (m) Other transactions with key management personnel There were no other transactions with key management personnel during the financial period. This is the end of the remuneration report (audited).

21
Shares under Option Unissued ordinary shares of AustChina Holdings Limited under option at the date of this report are as follow:
Date options granted Expiry date Exercise price Number under option
30 November 2020 15 December 2023 $0.005 70,000,000 Shares Issued on the Exercise of Options There were no ordinary shares of AustChina Holdings Limited issued during or since the end of the year ended 30 June 2021 on the exercise of options. Insurance of Officers During the financial year AustChina Holdings Limited paid a premium to insure the directors and officers of the company. The policy prohibits disclosure of details of the cover and the amount of premium paid. The liabilities insured are legal costs that may be incurred in defending civil or criminal proceedings that may be brought against the officers in their capacity as officers of the entity, and any other payments arising from liabilities incurred by the officers in connection with such proceedings, other than where such liabilities arise out of conduct involving a willful breach of duty by the officers or the improper use by the officers of their position or of information to gain advantage for themselves or someone else or to cause detriment to the company. Agreement to Indemnify Officers AustChina Holdings Limited is party to an agreement to indemnify the directors and officers of the company. The indemnity relates to any liability: (a) incurred in connection with or as a consequence of the directors and officers acting in the capacity
including, without limiting the foregoing, representing the company on any body corporate, and (b) for legal costs incurred in defending an action in connection with or as a consequence of the director or
officer acting in the capacity. No liability has arisen under these indemnities as at the date of this report. Indemnity of auditors AustChina Holdings Limited has not, during or since the end of the financial year, indemnified or agreed to indemnify the auditor of the company or any related entity against a liability incurred by the auditor. During the financial year, AustChina Holdings Limited has not paid a premium in respect of a contract to insure the auditor of the company or any related entity. Proceedings on Behalf of Company No person has applied to the Court under section 237 of the Corporations Act 2001 for leave to bring proceedings on behalf of the company, or to intervene in any proceedings to which the company is a party, for the purpose of taking responsibility on behalf of the company for all or part of those proceedings. Non-audit services Details of the amounts paid or payable to the auditor for non-audit services provided during the financial year by the auditor are outlined in Note 22 to the financial statements. The directors are satisfied that the provision of non-audit services during the financial year, by the auditor (or by another person or firm on the auditor's behalf), is compatible with the general standard of independence for auditors imposed by the Corporations Act 2001. The directors are of the opinion that the services as disclosed in Note 22 to the financial statements do not compromise the external auditor's independence requirements of the Corporations Act 2001 for the following reasons: • all non-audit services have been reviewed by the Audit and Risk Management Committee to ensure they
do not impact the impartiality and objectivity of the auditor; and • none of the services undermine the general principles relating to auditor independence as set out in
APES 110 Code of Ethics for Professional Accountants issued by the Accounting Professional and Ethical Standards Board, including reviewing or auditing the auditor's own work, acting in a management or decision-making capacity for the company, acting as advocate for the company or jointly sharing economic risks and rewards.
Officers of the company who are former partners of RSM Australia Partners There are no officers of the Company who are former partners of RSM Australia Partners.

22
Auditor’s independence declaration A copy of the auditor’s independence declaration as required under section 307C of the Corporations Act 2001 is set out on page 23. Auditor RSM Australia Partners continues in office in accordance with section 327 of the Corporations Act 2001. This report is made in accordance with a resolution of the directors, pursuant to section 298(2)(a) of the Corporations Act 2001. D Chan Chairman Brisbane, 13 September 2021

23
THE POWER OF BEING UNDERSTOOD AUDIT | TAX | CONSULTING
RSM Australia Partners is a member of the RSM network and trades as RSM. RSM is the trading name used by the members of the RSM network. Each member of the RSM network is an independent accounting and consulting firm which practices in its own right. The RSM network is not itself a separate legal entity in any jurisdiction.
RSM Australia Partners ABN 36 965 185 036
Liability limited by a scheme approved under Professional Standards Legislation
RSM Australia Partners
Level 6, 340 Adelaide Street Brisbane QLD 4000 GPO Box 1108 Brisbane QLD 4001
T +61 (0) 7 3225 7800 F +61 (0) 7 3225 7880
www.rsm.com.au
AUDITOR’S INDEPENDENCE DECLARATION
As lead auditor for the audit of the financial report of AustChina Holdings Limited for the year ended 30 June 2021, I declare that, to the best of my knowledge and belief, there have been no contraventions of:
(i) the auditor independence requirements of the Corporations Act 2001 in relation to the audit; and
(ii) any applicable code of professional conduct in relation to the audit. RSM AUSTRALIA PARTNERS
Brisbane, Queensland Steve Stavrou Dated: 13 September 2021 Partner

24
DECLARATION BY DIRECTORS In the directors’ opinion: (a) the attached financial statements and notes are in accordance with the Corporations Act 2001,
including:
(i) complying with Australian Accounting Standards, the Corporations Regulations 2001 and other mandatory professional reporting requirements, and
(ii) giving a true and fair view of the consolidated entity’s financial position as at 30 June
2021 and of its performance for the financial year ended on that date; (b) there are reasonable grounds to believe that the company will be able to pay its debts as and
when they become due and payable, for the reasons provided in Note 3(iv); (c) Note 1(a) confirms that the financial statements also comply with International Financial Reporting
Standards as issued by the International Accounting Standards Board; and (d) the remuneration disclosures contained in the Remuneration Report comply with s300A of the
Corporations Act 2001. The directors have been given the declarations by the chief executive officer and the chief financial officer required by s295A of the Corporations Act 2001. This declaration is made in accordance with a resolution of the directors made pursuant to section 295(5)(a) of the Corporations Act 2001. D Chan Chairman Brisbane, 13 September 2021
25
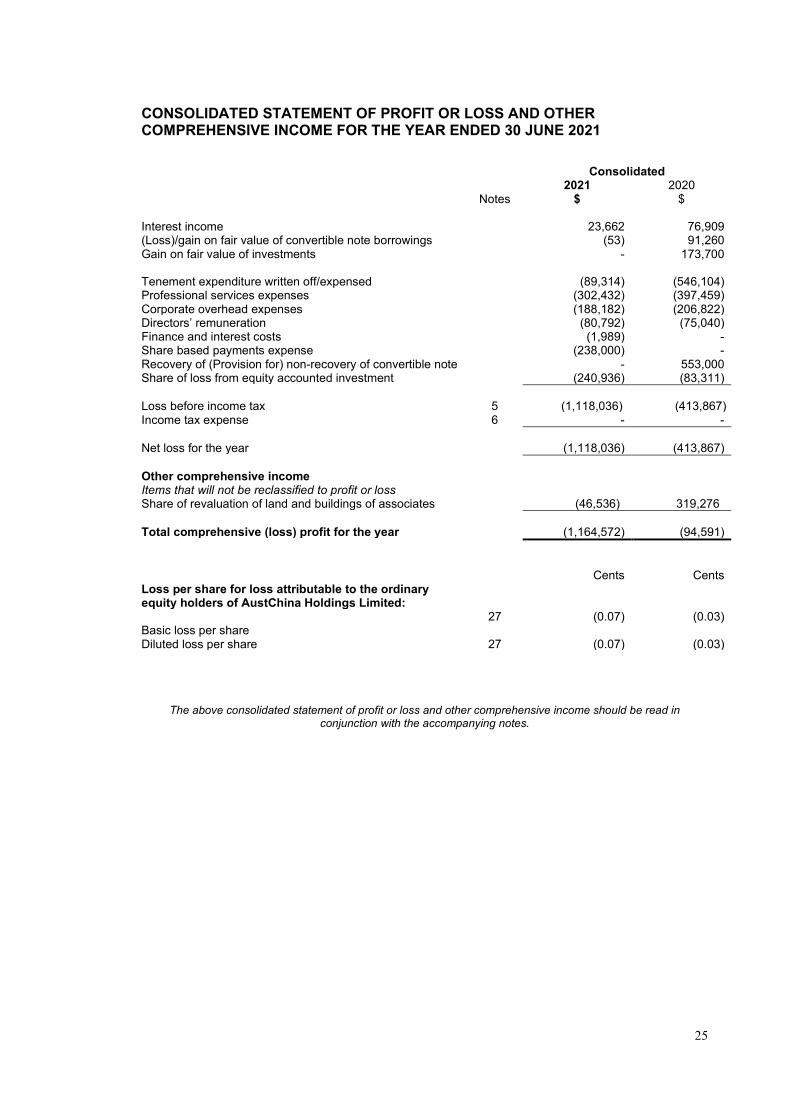
CONSOLIDATED STATEMENT OF PROFIT OR LOSS AND OTHER COMPREHENSIVE INCOME FOR THE YEAR ENDED 30 JUNE 2021 Consolidated
Notes 2021
$ 2020
$ Interest income
23,662
76,909
(Loss)/gain on fair value of convertible note borrowings (53) 91,260 Gain on fair value of investments - 173,700 Tenement expenditure written off/expensed (89,314) (546,104) Professional services expenses (302,432) (397,459) Corporate overhead expenses (188,182) (206,822) Directors’ remuneration (80,792) (75,040) Finance and interest costs (1,989) - Share based payments expense (238,000) - Recovery of (Provision for) non-recovery of convertible note - 553,000 Share of loss from equity accounted investment (240,936) (83,311) Loss before income tax
5
(1,118,036)
(413,867)
Income tax expense 6 - - Net loss for the year
(1,118,036)
(413,867)
Other comprehensive income Items that will not be reclassified to profit or loss Share of revaluation of land and buildings of associates (46,536) 319,276 Total comprehensive (loss) profit for the year (1,164,572) (94,591)
Cents
Cents Loss per share for loss attributable to the ordinary equity holders of AustChina Holdings Limited:
Basic loss per share
27 (0.07) (0.03)
Diluted loss per share 27 (0.07) (0.03)
The above consolidated statement of profit or loss and other comprehensive income should be read in conjunction with the accompanying notes.

26
CONSOLIDATED BALANCE SHEET AS AT 30 JUNE 2021 Consolidated
Notes 2021
$ 2020
$ ASSETS Current assets
Cash and cash equivalents 7 390,741 635,035 Trade and other receivables 8 25,473 27,851 Convertible notes 9 - 489,918 Total current assets
416,214
1,152,804
Non-current assets
Investments at fair value through profit or loss 11 250,000 250,000 Investments accounted for using equity method 12 725,006 1,012,478 Exploration and evaluation assets 13 15,562,167 15,542,886 Other assets 14 8,200 8,200 Total non-current assets
16,545,373
16,813,564
Total assets
16,961,587
17,966,368
LIABILITIES Current liabilities
Trade and other payables 15 96,360 174,622 Borrowings 16 648,804 648,751 Total current liabilities
745,164
823,373
Non-current liabilities
Other financial liabilities 17 1,500,000 1,500,000 Total non-current liabilities
1,500,000
1,500,000
Total liabilities
2,245,164
2,323,373
Net assets
14,716,423
15,642,995
EQUITY
Issued capital 18 66,749,129 66,749,129 Reserves 19(a) 4,038,783 3,847,319 Accumulated losses 19(b) (56,071,489) (54,953,453) Total equity
14,716,423
15,642,995
The above consolidated balance sheet should be read in conjunction with the accompanying notes.

27
CONSOLIDATED STATEMENT OF CHANGES IN EQUITY FOR THE YEAR ENDED 30 JUNE 2021
Notes
Issued Capital
$
Share-based
payment reserve
$
Revaluation Reserve
$
Accumulated
Losses $
Total $
Balance at 30 June 2019
65,389,553
3,528,043
-
(54,539,586)
14,378,010
Loss for the year Other comprehensive income
- -
- -
-
319,276
(413,867)
-
(413,867)
319,276
Total comprehensive loss - - 319,276 (413,867) (94,591) Transactions with owners in their capacity as owners: Contributions of equity, net of transaction costs Conversion of convertible note Equity component of convertible note
18
18
18
831,317
750,000
(221,741)
-
-
-
-
-
-
-
-
-
831,317
750,000
(221,741) Balance at 30 June 2020
66,749,129
3,528,043
319,276
(54,953,453)
15,642,995
Loss for the year Other comprehensive income
- -
- -
-
(46,536)
(1,118,036)
-
(1,118,036)
(46,536)
Total comprehensive loss - - (46,536) (1,118,036) (1,164,572) Transactions with owners in their capacity as owners: Contributions of equity, net of transaction costs Share-based payments
18
- -
- 238,000
- -
- -
- 238,000
Balance at 30 June 2021
66,749,129
3,766,043
272,740
(56,071,489)
14,716,423
The above consolidated statement of changes in equity should be read in conjunction with the accompanying notes.

28
CONSOLIDATED STATEMENT OF CASH FLOWS FOR THE YEAR ENDED 30 JUNE 2021
Consolidated
Notes 2021
$ 2020
$ Cash flows from operating activities
Receipts in the course of operations (inclusive of goods and services tax)
57,438
63,238
Payments to suppliers (inclusive of goods and services tax) (617,534) (718,377) Interest paid (1,989) Interest received 12,029 148,676 Net cash outflows from operating activities
24
(550,056)
(506,463)
Cash flows from investing activities
Payments for exploration and evaluation assets
(194,238)
(267,707)
Proceeds from part repayment of convertible note 500,000 500,000 Refunds for security deposits - 12,006 Net cash inflows from investing activities
305,762
244,299
Cash flows from financing activities
Proceeds from share issue - 831,318 Net cash inflows (outflows) from financing activities
-
831,318
Net increase (decrease) in cash and cash equivalents
(244,294)
569,154
Cash and cash equivalents at the beginning of the financial year
635,035
65,881
Cash and cash equivalents at the end of the financial year
7
390,741
635,035
The above Consolidated statement of cash flows should be read in conjunction with the accompanying notes.
29
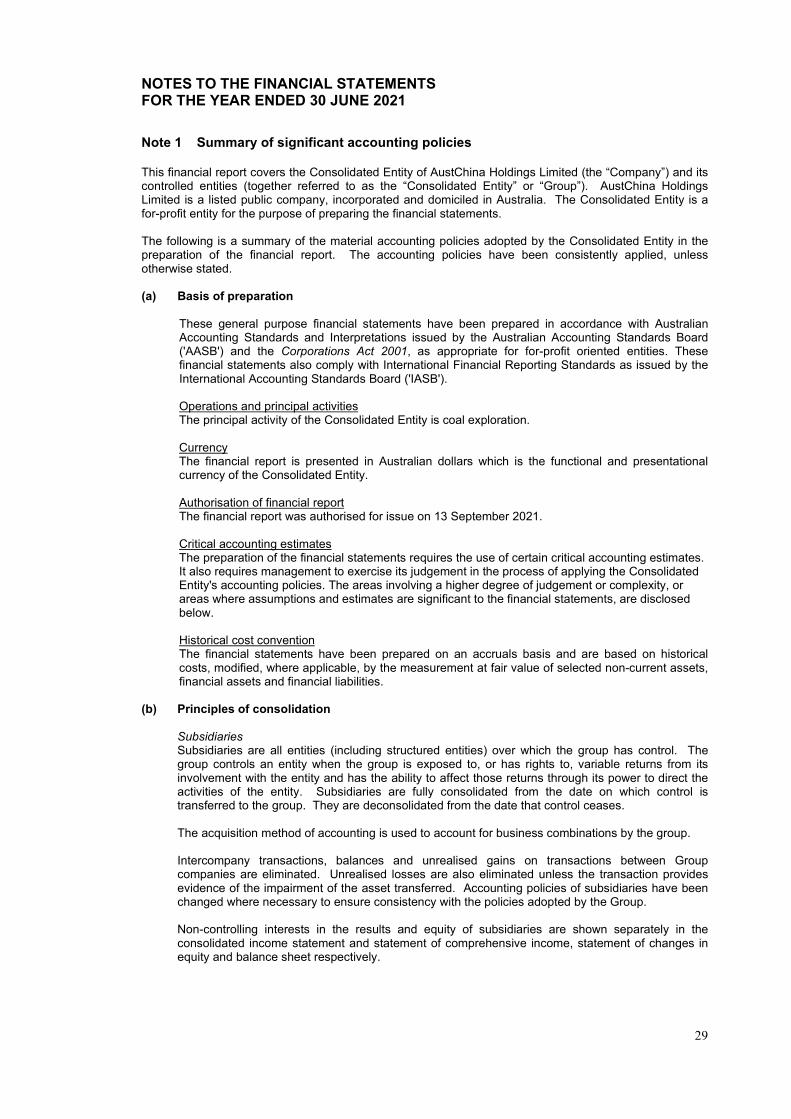
NOTES TO THE FINANCIAL STATEMENTS FOR THE YEAR ENDED 30 JUNE 2021 Note 1 Summary of significant accounting policies This financial report covers the Consolidated Entity of AustChina Holdings Limited (the “Company”) and its controlled entities (together referred to as the “Consolidated Entity” or “Group”). AustChina Holdings Limited is a listed public company, incorporated and domiciled in Australia. The Consolidated Entity is a for-profit entity for the purpose of preparing the financial statements. The following is a summary of the material accounting policies adopted by the Consolidated Entity in the preparation of the financial report. The accounting policies have been consistently applied, unless otherwise stated. (a) Basis of preparation
These general purpose financial statements have been prepared in accordance with Australian Accounting Standards and Interpretations issued by the Australian Accounting Standards Board ('AASB') and the Corporations Act 2001, as appropriate for for-profit oriented entities. These financial statements also comply with International Financial Reporting Standards as issued by the International Accounting Standards Board ('IASB').
Operations and principal activities The principal activity of the Consolidated Entity is coal exploration. Currency The financial report is presented in Australian dollars which is the functional and presentational currency of the Consolidated Entity. Authorisation of financial report The financial report was authorised for issue on 13 September 2021. Critical accounting estimates The preparation of the financial statements requires the use of certain critical accounting estimates. It also requires management to exercise its judgement in the process of applying the Consolidated Entity's accounting policies. The areas involving a higher degree of judgement or complexity, or areas where assumptions and estimates are significant to the financial statements, are disclosed below. Historical cost convention The financial statements have been prepared on an accruals basis and are based on historical costs, modified, where applicable, by the measurement at fair value of selected non-current assets, financial assets and financial liabilities.
(b) Principles of consolidation Subsidiaries
Subsidiaries are all entities (including structured entities) over which the group has control. The group controls an entity when the group is exposed to, or has rights to, variable returns from its involvement with the entity and has the ability to affect those returns through its power to direct the activities of the entity. Subsidiaries are fully consolidated from the date on which control is transferred to the group. They are deconsolidated from the date that control ceases. The acquisition method of accounting is used to account for business combinations by the group. Intercompany transactions, balances and unrealised gains on transactions between Group companies are eliminated. Unrealised losses are also eliminated unless the transaction provides evidence of the impairment of the asset transferred. Accounting policies of subsidiaries have been changed where necessary to ensure consistency with the policies adopted by the Group. Non-controlling interests in the results and equity of subsidiaries are shown separately in the consolidated income statement and statement of comprehensive income, statement of changes in equity and balance sheet respectively.

30
Note 1 Summary of significant accounting policies (continued) (c) Income taxes
The income tax expense or revenue for the period is the tax payable on the current period’s taxable income based on the applicable income tax rate for each jurisdiction adjusted by changes in deferred tax assets and liabilities attributable to temporary differences and to unused tax losses. Deferred income tax is provided in full, using the liability method, on temporary differences arising between the tax bases of assets and liabilities and their carrying amounts in the financial statements. However, the deferred income tax is not accounted for if it arises from initial recognition of an asset or liability in a transaction other than a business combination that at the time of the transaction affects neither accounting nor taxable profit or loss. Deferred income tax is determined using tax rates (and laws) that have been enacted or substantially enacted by the reporting date and are expected to apply when the related deferred income tax asset is realised or the deferred income tax liability is settled. Deferred tax assets are recognised for deductible temporary differences and unused tax losses only if it is probable that future taxable amounts will be available to utilise those temporary differences and losses. Deferred tax assets and liabilities are offset when there is a legally enforceable right to offset current tax assets and liabilities and when the deferred tax balances relate to the same taxation authority. Current tax assets and tax liabilities are offset where the entity has a legally enforceable right to offset and intends either to settle on a net basis, or to realise the assets and settle the liability simultaneously. Current and deferred tax is recognised in profit or loss, except to the extent that it relates to items recognised in other comprehensive income or directly in equity. In this case, the tax is also recognised in other comprehensive income or directly in equity, respectively.
(d) Exploration and evaluation assets
Exploration and evaluation assets incurred by or on behalf of the Group is accumulated separately for each area of interest until such time as the area of interest moves into development phase or is abandoned or sold. The realisation of the value of expenditure carried forward depends upon any commercial results that may be obtained through successful development and exploitation of the area of interest or alternatively by its sale. If an area of interest is abandoned or is considered to be of no further commercial interest the accumulated exploration costs relating to the area are written off against income in the year of abandonment.
(e) Acquisitions of assets
The purchase method of accounting is used for all acquisitions of assets. Cost is measured as the fair value of the assets given up, shares issued or liabilities undertaken at the date of acquisition plus incidental costs directly attributable to the acquisition.
(f) Impairment of non-financial assets
At the end of each reporting period the Group assesses whether there is any indication that individual assets are impaired. Where impairment indicators exist, recoverable amounts are determined and impairment losses are recognised in profit or loss where the asset’s carrying value exceeds its recoverable amount. Recoverable amount is the higher of an asset’s fair value less costs to sell and value in use. For the purpose of assessing value in use, the estimated future cash flows are discounted to their present value using a pre-tax discount rate that reflects current market assessments of the time value of money and the risks specific to the asset. Where it is not possible to estimate recoverable amount for an individual asset, recoverable amount is determined for the cash-generating unit to which the asset belongs.

31
Note 1 Summary of significant accounting policies (continued) (g) Property, plant and equipment
All property, plant and equipment are stated at historical cost, including costs directly attributable to bringing the asset to the location and condition necessary for it to be capable of operating in the manner intended by management, less depreciation, and any impairment.
Depreciation is calculated on a straight-line basis to write off the net cost or revalued amount of each item of property, plant and equipment over its expected useful life to the entity. Estimates of remaining useful lives are made on a regular basis for all assets, with annual reassessments for major items. The expected useful lives are as follows:
Plant and equipment 3 – 5 years (h) Trade and other payables
These amounts represent liabilities for goods and services provided to the Group prior to the end of the financial year and which are unpaid. These amounts are unsecured and usually have 30 day payment terms.
(i) Cash and cash equivalents
Cash and cash equivalents include cash on hand, deposits held at call with financial institutions, other short-term, highly liquid investments with original maturities of three months or less that are readily convertible to known amounts of cash and which are subject to an insignificant risk of changes in value.
(j) Issued capital and share-based payments
Ordinary shares are classified as equity. Incremental costs directly attributable to the issue of new shares or options are shown in equity as a deduction, net of tax, from the proceeds.
(k) Revenue Interest Income Interest income is recognised on a time proportion basis using the effective interest method. (l) Goods and Services Tax (“GST”) Revenues, expenses and assets are recognised net of the amount of GST, except where the
amount of GST incurred is not recoverable from the Australian Taxation Office (ATO). Receivables and payables are stated inclusive of the amount of GST receivable or payable. The
net amount of GST recoverable from, or payable to, the ATO is included in other receivables or payables in the Consolidated Balance Sheet.
Cash flows are presented on a gross basis. The GST components of cash flows arising from
investing or financing activities which are recoverable from, or payable to the taxation authority, are presented as operating cash flows.
(m) Earnings per share
(i) Basic earnings per share Basic earnings per share is calculated by dividing the profit attributable to equity holders of the company, excluding any costs of servicing equity other than ordinary shares, by the weighted average number of ordinary shares outstanding during the financial year, adjusted for bonus elements in ordinary shares issued during the year.
(ii) Diluted earnings per share Diluted earnings per share adjusts the figures used in the determination of basic earnings
per share to take into account the after income tax effect of interest and other financing costs associated with dilutive potential ordinary shares and the weighted average number of shares assumed to have been issued for no consideration in relation to dilutive potential ordinary shares.

32
Note 1 Summary of significant accounting policies (continued) (n) Financial instruments Initial recognition and measurement
Financial assets and financial liabilities are recognised when the entity becomes a party to the contractual provisions to the instrument. For financial assets, this is equivalent to the date that the group commits itself to either the purchase or sale of the asset (i.e. trade date accounting is adopted). Financial instruments are initially measured at fair value plus transaction costs, except where the instrument is classified ‘at fair value through profit or loss’, in which case transaction costs are expensed to profit or loss immediately. Classification and subsequent measurement Financial instruments are subsequently measured at either of fair value or amortised cost using the effective interest rate method. Fair value represents the amount for which an asset could be exchanged or a liability settled between knowledgeable, willing parties. Where available, quoted prices in an active market are used to determine fair value. In other circumstances valuation techniques are adopted. Amortised cost is calculated as: a. the amount at which the financial asset or financial liability is measured at initial recognition; b. less principal repayments; c. plus or minus the cumulative amortization of the difference, if any, between the amount initially
recognised and the maturity amount calculated using the effective interest rate method; and d. less any reduction for impairment. The effective interest method is used to allocate interest income or interest expense over the relevant period and is equivalent to the rate that exactly discounts estimated future cash payments or receipts (including fees, transaction costs and other premiums or discounts) through the expected life (or when this cannot be reliably predicted, the contractual term) of the financial instrument to the net carrying amount of the financial asset or liability. Revisions to expected future net cash flows will necessitate an adjustment to the carrying value with a consequential recognition of an income or expense in profit or loss. (i) Loans and receivables Loans and receivables are non-derivative financial assets with fixed or determinable payments that are not quoted in an active market and are subsequently measured at amortised cost. Loans and receivables are included in current assets, except for those which are not expected to mature within 12 months after the end of the reporting period. All other loans and receivables are classified as non-current assets. The group considers the probability of default upon initial recognition of an asset and whether there has been a significant increase in credit risk on an ongoing basis throughout each reporting period. To assess whether there is a significant increase in credit risk the group compares the risk of a default occurring on the asset as at the reporting date with the risk of default at the date of initial recognition. It considers available reasonable and supportive forward-looking information. Especially the following indicators are incorporated:
- internal credit rating; - external credit rating (as far as available); - actual or expected significant adverse changes in business, financial or economic
conditions that are expected to cause a significant change to the borrower’s ability to meet its obligations;
- actual or expected significant changes in the operating results of the borrower; - significant increases in credit risk on other financial instruments of the same borrower; - significant changes in the value of the collateral supporting the obligation or in the quality
of third-party guarantees or credit enhancements; - significant changes in the expected performance and behavior of the borrower, including
changes in the payment status of borrowers in the group and changes in the operating results of the borrower.
Regardless of the analysis above, a significant increase in credit risk is presumed if a debtor is more than 30 days past due in making a contractual payment.

33
Note 1 Summary of significant accounting policies (continued) A default on a financial asset is when the counterparty fails to make contractual payments within 60 days of when they fall due. (ii) Financial liabilities Financial liabilities, after initial recognition, are measured at either amortised cost using the effective interest rate method, or at fair value. Where an instrument contains an embedded derivative that component is, where appropriate, separately identified and measured at fair value. If the embedded derivative is not capable of being measured separately at acquisition or at the end of a reporting period, the entire instrument is measured at fair value. Derivative financial instruments Derivatives are initially recognised at fair value on the date a derivative contract is entered into and are subsequently remeasured to their fair value at each reporting date.
(o) Business combinations
The acquisition method of accounting is used to account for all business combinations, regardless of whether equity instruments or other assets are acquired. The consideration transferred for the acquisition of a subsidiary comprises the:
• fair values of the assets transferred, • liabilities incurred, • equity interests issued by the group, • fair value of any asset or liability resulting from a contingent consideration arrangement,
and • fair value of any pre-existing equity interest in the subsidiary
Identifiable assets acquired and liabilities and contingent liabilities assumed in a business combination are, with limited exceptions, measured initially at their fair values at the acquisition date. The group recognises any non-controlling interest in the acquired entity on an acquisition-by-acquisition basis either at fair value or at the non-controlling interest’s proportionate share of the acquired entity’s net identifiable assets. Acquisition-related costs are expensed as incurred.
The excess of the:
• consideration transferred, • amount of any non-controlling interest in the acquired entity, and • acquisition-date fair value of any previous equity interest in the acquired entity
over the fair value of the net identifiable assets acquired is recorded as goodwill. If those amounts are less than the fair value of the net identifiable assets of the subsidiary acquired, the difference is recognised directly in profit or loss as a bargain purchase.
(p) Parent entity financial information The financial information for the parent entity, AustChina Holdings Limited, disclosed in note 20 has
been prepared on the same basis as the consolidated financial statements except in respect of tax consolidation legislation.
AustChina Holdings Limited and its wholly owned Australian controlled entities have implemented the tax consolidation legislation.
The head entity, AustChina Holdings Limited, and the controlled entities in the tax consolidated
group account for their own current and deferred tax amounts. These tax amounts are measured as if each entity in the tax consolidated group continues to be a standalone taxpayer in its own right.
In addition to its own current and deferred tax amounts, AustChina Holdings Limited also recognises
the current tax liabilities (or assets) and the deferred tax assets arising from unused tax losses and unused tax credits assumed from controlled entities in the tax consolidated group.
The entities have also entered into a tax funding agreement under which the wholly-owned entities fully compensate AustChina Holdings Limited for any current tax payable assumed and are compensated by AustChina Holdings Limited for any current tax receivable and deferred tax assets relating to unused tax losses or unused tax credits that are transferred to AustChina Holdings Limited under the tax consolidation legislation. The funding amounts are determined by reference to the amounts recognised in the wholly owned entities’ financial statements.

34
Note 1 Summary of significant accounting policies (continued)
The amounts receivable/payable under the tax funding agreement are due upon receipt of the funding advice from the head entity, which is issued as soon as practicable after the end of each financial year. The head entity may also require payment of interim funding amounts to assist with its obligations to pay tax instalments.
Assets or liabilities arising under tax funding agreements with the tax consolidated entities are recognised as current amounts receivable from or payable to other entities in the group.
Any difference between the amounts assumed and amounts receivable or payable under the tax funding agreement are recognised as a contribution to (or distribution from) wholly owned tax consolidated entities.
(q) Fair value measurement
When an asset or liability, financial or non-financial, is measured at fair value for recognition or disclosure purposes, the fair value is based on the price that would be received to sell an asset or paid to transfer a liability in an orderly transaction between market participants at the measurement date; and assumes that the transaction will take place either: in the principle market; or in the absence of a principal market, in the most advantageous market.
Fair value is measured using the assumptions that market participants would use when pricing the asset or liability, assuming they act in their economic best interest. For non-financial assets, the fair value measurement is based on its highest and best use. Valuation techniques that are appropriate in the circumstances and for which sufficient data are available to measure fair value, are used, maximising the use of relevant observable inputs and minimising the use of unobservable inputs.
Assets and liabilities measured at fair value are classified, into three levels, using a fair value hierarchy that reflects the significance of the inputs used in making the measurements. Classifications are reviewed each reporting date and transfers between levels are determined based on a reassessment of the lowest level input that is significant to the fair value measurement.
For recurring and non-recurring fair value measurements, external valuers may be used when internal expertise is either not available or when the valuation is deemed to be significant. External valuers are selected based on market knowledge and reputation. Where there is a significant change in fair value of an asset or liability from one period to another, an analysis is undertaken, which includes a verification of the major inputs applied in the latest valuation and a comparison, where applicable, with external sources of data.
Derivative financial instruments have been valued using the fair value at the time of the receipt of the funds. The Group’s exploration and evaluation activities have not progressed to a stage to allow more reliable measurement of any future royalty payment obligations.
(r) New accounting standards and interpretations not yet mandatory or early adopted Australian Accounting Standards and Interpretations that have recently been issued or amended but are not yet mandatory, have not been early adopted by the consolidated entity for the annual reporting period ended 30 June 2021. These new or amended Accounting Standards and Interpretations, most relevant to the consolidated entity, are not expected to have any impact on the consolidated entity.

35
Note 2 Financial instruments The Group’s activities expose it to a variety of financial risks; credit risk, liquidity risk and cash flow interest rate risk. The Group holds the following financial instruments: Consolidated
2021
$ 2020
$ Financial assets Cash and cash equivalents 390,741 635,035 Convertible notes - 489,918 Security deposits 8,200 8,200 398,941 1,133,153 Financial liabilities
Trade and other payables 96,360 174,622 Other financial liabilities (including borrowings and derivatives) 2,148,804 2,148,751 2,245,164 2,323,373 The Board has overall responsibility for the determination of the Group’s risk management objectives and policies. The overall objective of the Board is to set policies that seek to reduce risk as far as possible without unduly affecting the Group’s competitiveness and flexibility. There have been no substantive changes to the Group’s exposure to financial instruments, its objectives, policies and processes for managing risks from previous periods. Credit risk Credit risk is managed on a Group basis. Credit risk arises primarily from cash and cash equivalents and deposits with banks and financial institutions. For bank and financial institutions, only independently rated parties with a minimum rating of ‘A’ are accepted. The credit quality of financial assets that are neither past due nor impaired can be assessed by reference to external credit ratings (if available). Consolidated
2021
$ 2020
$ Cash at bank and short-term bank deposits AA- 390,638 634,932 A 103 103 390,741 635,035 Liquidity risk Prudent liquidity risk management implies maintaining sufficient cash and marketable securities to meet obligations when due. The Group manages liquidity risk by continuously monitoring forecast and actual cash flows. No finance facilities were available to the Group at the end of the reporting period. Maturities of financial liabilities The table below analyses the Group’s financial liabilities into relevant maturity groupings. 30 June 2021 Less than
6 months 6 – 12
months Between 1 and 2 years
Between 2 and 5 years
Over 5 years
Total contractual cash flows
Non-derivatives $ $ $ $ $ $ Trade and other payables
96,360 - - - - 96,360
Borrowings - - - - 1,500,000 1,500,000
96,360
-
-
-
1,500,000
1,596,360
Derivatives Convertible notes 648,804 - - - - 648,804

36
Note 2 Financial risk management (continued) 30 June 2020 Less than
6 months 6 – 12
months Between 1 and 2 years
Between 2 and 5 years
Over 5 years
Total contractual cash flows
Non-derivatives $ $ $ $ $ $ Trade and other payables
174,622 - - - - 174,622
Borrowings - - - - 1,500,000 1,500,000
174,622
-
-
-
1,500,000
1,674,622
Derivatives Convertible notes 648,751 - - - - 648,751 Other financial liabilities of $1,500,000 (2020: $1,500,000) relate to a royalty agreement as outlined in Note 17. At this stage there is no known cash outflow arising from this liability. Cash flow and fair value interest rate risk As the Group has interest-bearing cash assets, the company’s income and operating cash flows are exposed to changes in market interest rates. The company manages its exposure to changes in interest rates by using fixed term deposits. At 30 June 2021 if interest rates had changed by -/+ 100 basis points from the year-end rates with all other variables held constant, post-tax loss for the year would have been $3,907 lower/higher (2020 – change of 100 bps: $9,547 higher/lower), as a result of higher/lower interest income from cash and cash equivalents. Fair Value The carrying value of all other assets and liabilities approximate their fair value. Note 3 Critical accounting estimates and judgements The preparation of financial statements in conformity with IFRS requires the use of certain critical accounting estimates. It also requires management to exercise its judgement in the process of applying the Consolidated Entity’s accounting policies. The directors evaluate estimates and judgements incorporated into the financial report based on historical knowledge and best available current information. Estimates assume a reasonable expectation of future events and are based on current trends and economic data, obtained both externally and within the Group. The estimates and underlying assumptions are reviewed on an ongoing basis. Revisions to accounting estimates are recognised in the period in which the estimate is revised if the revision effects only that period or in the period and future periods if the revision affects both current and future periods. There were no key adjustments during the year which required estimates and/or judgements. Key judgements and estimates (i) Carrying value of exploration and evaluation assets The Group has capitalised exploration expenditure of $15,562,167 (2020: $15,542,886). This amount includes costs directly associated with exploration. These costs are capitalised until assessment and/or drilling of the permit is complete and the results have been evaluated. These costs include employee remuneration, materials, rig costs, delay rentals and payments to contractors. The expenditure is carried forward until such a time as the area of interest moves into the development phase, is abandoned, sold or sub-blocks relinquished. Given exploration activities have not yet reached a stage which permits a reasonable assessment of the existence or otherwise of recoverable resources and the difficulty in forecasting cash flows to assess the fair value of exploration expenditure there is uncertainty as to the carrying value of exploration expenditure. The ultimate recovery of the carrying value of exploration expenditure is dependent upon the successful development and commercial exploitation or, alternatively, sale of the interests in the tenements. There are no factors or circumstances which suggest that the carrying amount of remaining exploration and evaluation assets may exceed recoverable amount. (ii) Fair value of the financial liabilities The Group has agreements with Oliver Lennox-King (Lennox-King), whereby Lennox-King has paid a net $1.5 million to the Group and in return the Group has agreed to pay Lennox-King a royalty equal to 1% of the gross value of coal sold from the tenements currently held by the Group, in the areas of the Moreton Energy Coal Project in the Clarence-Moreton Basin. The liability was initially recognised at fair value. Post initial recognition, the financial liability is accounted for in accordance with the Group policy for financial instruments set out in Note 1(n).

37
Note 3 Critical accounting estimates and judgements (continued) The royalty is only payable in the event of future production of coal. The Group’s exploration and evaluation activities have not progressed to a stage to allow more reliable measurement of any future royalty payment obligations. As such, the Board is of the view that the fair value at the time of the receipt of the funds remains the appropriate measure of fair value at reporting date. (iii) Share based payments The Group measures the cost of equity settled transactions with employees by reference to the fair value of the equity instruments at the date at which they are granted. The fair value is determined by using a Monte Carlo option pricing model taking into account the terms and conditions upon which the instruments were granted. The accounting estimates and assumptions, including share price volatility, interest rates and vesting periods would have no impact on the carrying amounts of assets and liabilities within the next annual reporting period but may impact the profit or loss and equity. (iv) Going concern The financial statements have been prepared on the going concern basis which contemplates continuity of normal business activities and the realisation of assets and discharge of liabilities in the ordinary course of business. As disclosed in the financial statements, the Group incurred a loss of $1,118,036 and had net cash outflows from operating activities of $550,056 for the year ended 30 June 2021. As at 30 June 2021, the Group had net current liabilities of $328,950. The ability of the Group to continue as a going concern is principally dependent upon one or more of the following:
• the ability of the company to raise capital as and when necessary; • the ability of the Group to meet its cashflow forecasts; and • disposing of non-core assets
The directors have concluded as a result of the requirement to raise funds in the future there exists a material uncertainty that may cast significant doubt regarding the Group’s ability to continue as a going concern and therefore, the Group may be unable to realise their assets and discharge their liabilities in the normal course of business. Nevertheless, after taking into account the current financial position of the Group, and the Group’s ability to raise further capital (as evidenced by the capital raising subsequent to year end as detailed in note 29), the directors have a reasonable expectation that the Group will have adequate resources to fund its future operational requirements and for these reasons they continue to adopt the going concern basis in preparing the financial report. Should the Group be unable to continue as a going concern, it may be required to realise its assets and extinguish its liabilities other than in the ordinary course of business, and at amounts that differ from those stated in the financial statements. The financial report does not include any adjustments relating to the recoverability and classification of recorded asset amounts or the amounts or classification of liabilities and appropriate disclosures that may be necessary should the Group be unable to continue as a going concern. (v) Recovery of deferred tax assets Deferred tax assets are recognised for deductible temporary difference only if the consolidated entity considers it is probable that future taxable amounts will be available to utilise those temporary differences and losses. Note 4 Segment information Identification of reportable segments The Group has identified its operating segments based on the internal reports that are reviewed and used by the Board of Directors in assessing performance and determining the allocation of resources. The Board of Directors carries out the role and is therefore the Chief Operating Decision Maker. Financial information provided to the board is currently at the consolidated level. Management currently identifies the consolidated entity as having only one reportable segment, being exploration of coal, oil and gas. All significant operating decisions are based upon analysis of the Group as one segment. The financial results from this segment are equivalent to the financial statements of the consolidated entity as a whole. The Group operates solely within Australia. The Group does not have any products or services that it derives revenue from.

38
Consolidated
2021 $
2020 $
Note 5 Expenses Loss before income tax from continuing operations includes the following specific expenses:
Superannuation expense
7,373
5,643
Exploration expenditure written off/expensed
89,314 556,110
Share of loss from equity accounted investment
240,936 83,311
Reversal of provision for non-recovery of convertible note
- (553,000)
Finance costs
Interest paid 1,989 - Finance costs expensed 1,989 -
Consolidated 2021
$ 2020
$ Note 6 Income tax expense (a) Income tax expense Current tax expense Deferred tax expense
- -
- -
Aggregate income tax expense - - (b) Numerical reconciliation of income tax expense to prima facie tax payable
(Loss) Profit from operations before income tax expense (1,118,036) (413,867) Tax at the Australian tax rate of 26% (2020: 27.5%)
(290,689)
(113,813)
Tax effect of amounts which are not deductible (taxable) in calculating taxable income:
Prior year adjustments (16,038) (184,668) Share based payments 61,880 - Other 504 (24,968) Amounts recognised in other comprehensive income Increase (decrease) in unrecognised deferred tax assets
(244,344) -
244,344
(323,450) 87,801
235,649 Income tax expense
-
-
(c) Deferred Tax Liabilities The balance comprises temporary differences attributable to: Exploration expenditure
4,046,164
4,273,647 Total deferred tax liabilities
4,046,164
4,273,647
Set-off of deferred tax assets pursuant to set-off provisions (4,046,164) (4,273,647) Net deferred tax liabilities
-
-

39
Note 6 Income tax expense (continued) (d) Deferred Tax Assets
The balance comprises temporary differences attributable to: Tax losses Accruals Business capital costs Fixed assets Investments Other financial liabilities
17,181,847 6,330
- 91
273,605 390,000
17,968,455 7,983 1,558
576 213,528 412,500
Total deferred tax assets
17,851,872
18,604,601
Set-off of deferred tax liabilities pursuant to set-off provisions (4,046,164) (4,273,647) Net adjustment to deferred tax assets not recognised (13,805,708) (14,330,953) Net deferred tax assets
-
-
(e) Unrecognised net deferred tax assets Unused tax losses for which no deferred tax asset has been recognised
53,098,877
49,799,299
Potential tax effect at 26% (2020: 27.5%) 13,805,708 13,694,807
Following the proportional takeover by Treasure Wheel Global Limited, the Group failed the Continuity of Ownership Test (COT). Unused tax losses are therefore carried forward under the Same Business Test (SBT). Management and the Directors are satisfied that the Group passes SBT on the basis that coal exploration has always been, and continues to be, the core focus of the business. Unused losses which have not been recognised as an asset, will only be obtained if: (i) the group derives future assessable income of a nature and of an amount sufficient to enable the
losses to be realised; (ii) the group continues to comply with the conditions for deductibility imposed by the law; and (iii) no changes in tax legislation adversely affect the group in realising the losses. (f) Tax consolidation legislation AustChina Holdings Limited and its wholly owned Australian subsidiaries have implemented the income tax consolidation legislation from 1 August 2010. AustChina Holdings Limited is the head entity of the tax consolidated group for the year ended 30 June 2021. The Australian Taxation Office has been notified of the formation of the AustChina Holdings Limited tax consolidated group.

40
Consolidated
2021
$ 2020
$ Note 7 Current assets – Cash and cash equivalents Cash at bank and on hand
119,791
278,213
Deposits at call 270,950 356,822
390,741
635,035
(a) Risk exposure
The Group’s exposure to interest rate risk is discussed in Note 2. The maximum exposure to credit risk at the end of the reporting period is the carrying amount of each class of cash and cash equivalents mentioned above. (b) Deposits at call
All deposits are at call bearing an interest rate of between 0% and 0.01% (2020 – 0% to 0.7%). Note 8 Current assets – Trade and other receivables
Consolidated
2021
$ 2020
$ Prepayments
14,588
15,908
Other debtors 10,885 11,943
25,473
27,851
Note 9 Current assets – Convertible Notes Consolidated
2021
$ 2020
$ Convertible note at face value Prepaid interest
- -
500,000 (10,082)
- 489,918 During the 2019 financial year as part consideration for the sale of Surat Gas Pty Ltd the company received a Convertible Note with a Face Value of $1,000,000 in Sector Projects Pty Ltd, the purchaser of Surat Gas Pty Ltd. During the financial year, Sector Projects Pty Ltd fully repaid $500,000 on the Convertible Note. The note accrued interest of 8% calculated daily and capitalised at the end of each calendar month.

41
Note 10 Non-current assets – Plant and equipment Consolidated
Plant & equipment
$
Total $
Year ended 30 June 2020 Opening net book amount Additions Disposals Depreciation charge
- - - -
- - - -
Closing net book amount
-
-
At 30 June 2020 At Cost Accumulated depreciation
6,495 (6,495)
6,495 (6,495)
Net book amount
-
-
Year ended 30 June 2021 Opening net book amount Additions Disposals Depreciation charge
- - - -
- - - -
Closing net book amount
-
-
At 30 June 2021 At Cost Accumulated depreciation
6,495 (6,495)
6,495 (6,495)
Net book amount
-
-
Consolidated
2021
$ 2020
$ Note 11 Non-current assets – Investments at fair value through profit or loss
Unlisted equity securities – at written down value 250,000 250,000 Unlisted securities are traded in inactive markets. Balance at the beginning of the year
250,000
76,300
Increment on revaluation - 173,700 Balance at the end of the year
250,000
250,000
The company holds shares with a Face Value of $1,000,000 in Sector Projects Pty Ltd, which was part consideration for the sale of Surat Gas Pty Ltd in prior years.
Consolidated
2021
$ 2020
$ Note 12 Non-current Asset – Investments accounted for using equity method
Investment in Associate 725,006 1,012,478
Refer to Note 28 for further information on investment in associate.

42
Note 13 Non-current assets – Exploration and evaluation assets
Consolidated
Exploration phase costs – at cost
2021 $
15,562,167
2020 $
15,542,886
The capitalised exploration assets carried forward above have been determined as follows:
Balance at the beginning of the year
15,542,886
15,755,652
Expenditure incurred during the year - additions 19,281 343,344 Exploration expenditure written off - (556,110) Balance at the end of the year
15,562,167
15,542,886
The ultimate recoupment of costs carried forward for exploration assets is dependent upon the successful development and commercial exploitation or alternatively sale of the interests in the tenements. Note 14 Non-current assets – Other assets Consolidated
2021
$ 2020
$ Security deposit 8,200 8,200 Security deposits represent amounts lodged with the Queensland Department of Natural Resources and Mines as security for tenements.
Note 15 Current liabilities – Trade and other payables
Consolidated
2021
$ 2020
$ Unsecured Trade and other payables
96,360
174,622
Note 16 Current liabilities – Borrowings Consolidated
2021
$ 2020
$ Convertible note
648,804
648,751
Borrowings – Convertible note Face value of notes issued 750,000 750,000 Other equity securities – value of conversion rights (101,196) (101,249) Current liability
648,804
648,751
Derivative financial instruments – Convertible note On 30 November 2016, the Company issued a Convertible Note to Treasure Wheel Global Limited. During the year the note holder granted an extension of the maturity date to 11 November 2021 and accordingly the convertible loan note is classified as a current liability. There is no interest payable on the convertible note. The initial fair value of the liability portion of the note was determined using a market interest rate for an equivalent non-convertible note at the issue date. The liability is subsequently recognised on an amortised cost basis until extinguished on conversion or maturity of the notes. The remainder of the proceeds is allocated to the conversion option and recognised in shareholders’ equity, net of income tax, and not subsequently re-measured.

43
Consolidated
2021
$ 2020
$ Note 17 Non-current liabilities – Other financial liabilities
Other financial liabilities 1,500,000 1,500,000
The Group has agreements with Oliver Lennox-King (Lennox-King), whereby Lennox-King has paid a net $1.5 million to the Group and in return the Group has agreed to pay Lennox-King a royalty equal to 1% of the gross value of coal sold from certain tenements currently held by the Group in the areas of the Moreton Energy Coal Project in the Clarence-Moreton Basis. The liability was initially recognised at fair value. Post initial recognition, the financial liability is accounted for in accordance with the Group policy for financial instruments set out in Note 1(n). The royalty is only payable in the event of future production of coal. There has been no movement in the balance of the liability. The Group has assessed that the fair value at the time of the initial transaction, which was at arm’s length, remains a reasonable assessment of the fair value at 30 June 2021 as no changes in the underlying circumstances have occurred since. The fair value would be Level 3 in the fair value hierarchy. The Group’s exploration and evaluation activities have not progressed to a stage to allow more reliable measurement of any future royalty payment obligations. Note 18 Issued capital
Consolidated Consolidated 2021
Shares 2020
Shares 2021
$ 2020
$ (a) Share capital
(i) Ordinary shares Fully paid
1,634,124,361
1,634,124,361
66,970,870
66,970,870 (ii) Other equity securities Value of conversion rights – convertible notes
-
-
(221,741)
(221,741) 1,634,124,361 1,634,124,361 66,749,129 66,749,129 (b) Movements in ordinary share capital:
Date Details Number of Shares
Issue Price
(cents)
$
1 July 2019
Balance
1,115,385,048
65,389,553
Placement 277,105,649 0.30 831,317 Part conversions of convertible note
(note 16) 241,633,664 0.31 750,000
Value of conversion rights of convertible notes converted during the year
-
(221,741)
30 June 2020 Balance 1,634,124,361 66,749,129 30 June 2021 Balance 1,634,124,361 66,749,129 (c) Ordinary shares Ordinary shares entitle the holder to participate in dividends and the proceeds on winding up of the
company in proportion to the number of and amounts paid on the shares held. On a show of hands every holder of ordinary shares present at a meeting in person or by proxy, is
entitled to one vote, and upon a poll each share is entitled to one vote. Ordinary shares have no par value and the company does not have a limited amount of authorised
capital.

44
Note 18 Issued capital (continued) (d) Options
At balance date there are 70,000,000 options over ordinary shares of AustChina Holdings Limited on issue.
(e) Other equity securities
The amount of $221,741 in the prior year shown for other equity securities is the value of the conversion rights relating to the convertible notes that were converted/repaid, details of which are shown in Note 16.
(f) Capital risk management The Group’s objectives when managing capital are to safeguard its ability to continue as a going concern, so that it can continue to provide returns for shareholders, benefits for other stakeholders and to maintain an optimal capital structure to reduce the cost of capital.
The capital structure of the Group includes equity attributable to equity holders, comprising of issued capital, reserves and accumulated losses. In order to maintain or adjust the capital structure, the company may issue new shares, sell assets to reduce debt or adjust the level of activities undertaken by the company.
The Group monitors capital on the basis of cash flow requirements for operational, and exploration and evaluation expenditure. The Group will continue to use capital market issues and joint venture participant funding contributions to satisfy anticipated funding requirements.
The Group has no externally imposed capital requirements. The Group’s strategy for capital risk management is unchanged from prior years.
Consolidated
2021
$ 2020
$ Note 19 Reserves and accumulated losses (a) Reserves
Share-based payments reserve
3,766,043
3,528,043
Movements: Balance 1 July
3,528,043
3,528,043 Share-based payments 238,000 - Balance 30 June
3,766,043
3,528,043
Asset revaluation reserve
272,740
319,276
Movements: Balance 1 July
319,276
- Share of revaluation of land and buildings of associates (46,536) 319,276 Balance 30 June
272,740
319,276
(b) Accumulated losses
Balance 1 July
(54,953,453)
(54,539,586)
(Loss) profit for the year (1,118,036) (413,867) Balance 30 June
(56,071,489)
(54,953,453)
Nature and purpose of reserves Share-based payments reserve The share-based payments reserve is used to recognise: (i) the grant date fair value of options issued to directors / contractors and vendors of assets (ii) the grant date fair value of performance rights issued to directors / contractors

45
Note 20 Parent entity information The following information relates to the parent entity, AustChina Holdings Limited. The information presented has been prepared using accounting policies that are consistent with those presented in Note 1 where applicable.
2021
$ 2020
$ Current assets
414,560
1,152,701
Non-current assets 9,416,715 9,683,355 Total assets
9,831,275
10,836,056
Current liabilities
745,164
823,373
Non-current liabilities 1,500,000 1,500,000 Total liabilities
2,245,164
2,323,373
Issued capital
66,749,129
66,749,129
Accumulated losses (63,201,801) (62,083,765) Share based payment reserve 3,766,043 3,528,043 Asset revaluation reserve 272,740 319,276 Total equity
7,586,111
8,512,683
Profit (loss) for the year
(1,118,036)
(132,237) Total comprehensive income
(46,536)
319,276 Guarantees AustChina Holdings Limited has not guaranteed any debts of its subsidiaries. Contingent liabilities The parent entity has no contingent liabilities as at 30 June 2021 and 30 June 2020. Capital commitments – Property, plant and equipment The parent entity had no capital commitments for property, plant and equipment as at 30 June 2021 and 30 June 2020.

46
Note 21 Director and key management personnel disclosures Key management personnel compensation Consolidated
2021
$ 2020
$ Short-term employee benefits
310,754
311,429
Post-employment benefits 3,539 3,040 Share-based payments 238,000 -
552,293
314,469
Note 22 Remuneration of auditors Consolidated
2021
$ 2020
$ During the year the following fees were paid, payable or accrued for services provided by the auditor or, its related practices and non-related audit firms:
RSM Australia Partners Audit services Audit and review of financial reports
43,900
39,470 Total remuneration for audit and other assurance services
43,900
39,470
Other services
Taxation services 7,100 27,650 Total remuneration for other services
7,100
27,650
51,000
67,120 Total auditor remuneration Note 23 Related parties (a) Parent entities The parent entity and ultimate Australian parent entity within the group is AustChina Holdings Limited. The ultimate parent entity is Treasure Wheel Global Limited which at 30 June 2021 owned 55.2% (2020: 55.5%). (b) Subsidiaries Interests in subsidiaries are set out in Note 26. (c) Key management personnel Disclosures relating to key management personnel are set out in Note 21. (d) Amounts payable to related parties During the current financial year a convertible note of $750,000 matured and the noteholder, Treasure Wheel Global Limited, granted an extension of the maturity date to 11 November 2021. No interest is payable on the convertible note. The note is convertible into ordinary shares of the parent entity, at any time at the option of the holder, at a price equal to 10 day VWAP x 0.915 for the 10 days immediately before the conversion date. At 30 June 2021 Included in trade payables was an amount of $28,573 (2020: $18,760) which represented amounts payable to directors for unpaid directors’ fees for the quarter ended 30 June 2021.

47
Note 24 Reconciliation of (loss) profit after income tax to net cash outflow from operating activities Consolidated
2021
$ 2020
$ (Loss) profit after income tax
(1,118,036)
(413,867)
Exploration expensed / written off Share-based payments Prepaid interest Share of loss from equity accounted investment (Reversal of) Provision for non-recovery of convertible note Loss (gain) on fair value of convertible note borrowings Gain on fair value of non-current investment
89,314
238,000 -
240,936 -
53
556,110
- 71,767 83,311
(553,000) (91,260)
(173,700) Change in operating assets and liabilities: (Increase)/decrease in trade and other receivables Increase/(decrease) in trade and other payables
(6,361) 6,038
(8,836) 23,012
Net cash outflow from operating activities
(550,056)
(506,463)
Note 25 Commitments for expenditure Consolidated
2021
$ 2020
$ Exploration commitments Commitments for payments under exploration permits for coal and petroleum in existence at the reporting date but not recognised as liabilities payable is as follows:
- payable within one year 32,500 60,000 - payable between one year and five years 237,917 155,417
270,417
215,417
So as to maintain current rights to tenure of various exploration tenements, the Group will be required to outlay amounts in respect of tenement exploration expenditure commitments. These outlays, which arise in relation to granted tenements are noted above. The outlays may be varied from time to time, subject to approval of the relevant government departments, and may be relieved if a tenement is relinquished. Exploration commitments are calculated on the assumption that each of these tenements will be held for its full term. Expenditure commitments on prospective ground will be met out of existing funds, joint ventures, farm-outs, and new capital raisings.

48
Note 26 Subsidiaries The consolidated financial statements incorporate the assets, liabilities and results of the following subsidiaries in accordance with the accounting policy described in Note 1(b): Name of entity Principal
Activities Country of
incorporation Class of shares Equity holding
2021 %
2020 %
Tambo Coal & Gas Pty Limited
Coal exploration
Australia Ordinary 100 100
Moreton Energy Pty Ltd Coal exploration
Australia Ordinary 100 100
Coalbank Qld Pty Ltd Coal exploration
Australia Ordinary 100 100
Note 27 Earnings per share
2021
Cents 2020 Cents
(a) Basic earnings per share
Total basic earnings per share attributable to the ordinary equity holders of the company
(0.07)
(0.03)
(b) Diluted earnings per share
Total diluted earnings per share attributable to the ordinary equity holders of the company
(0.07)
(0.03)
(c) Reconciliation of earnings used in calculating earnings per share
2021 $
2020 $
Basic earnings per share (Loss) profit attributable to the ordinary equity holders of the company used in calculating basic earnings per share
(1,118,036)
(413,867) Diluted earnings per share
(Loss) profit attributable to the ordinary equity holders of the company used in calculating diluted earnings per share
(1,118,036)
(413,867)
(d) Weighted average number of shares used as the denominator
2021 Number
2020 Number
Weighted average number of ordinary shares used as the denominator in calculating basic and diluted earnings per share
1,634,124,361
1,483,262,763
(e) Information concerning the classification of securities Options and rights Options and rights on issue during the year are not included in the calculation of diluted earnings per share because they are antidilutive for the year ended 30 June 2021. These options and rights could potentially dilute basic earnings per share in the future. Details relating to options and rights are set out in note 18.

49
Note 28 Investment in Associate accounted for using equity method Set out below is the associate of the group as at 30 June 2021 which, in the opinion of the directors, is material to the group. The associate has share capital consisting solely of ordinary shares, which are held directly by the group. The company holds 25.12% (2020: 25.14%) of the issued capital of Utilitas Group Pty Ltd, a company that is engaged in the Biogas Renewable Energy Sector. Utilitas Group Pty Ltd is incorporated in Australia and this is also its principal place of business. The proportion of ownership interest is the same as the proportion of voting rights held. AustChina Holdings Limited does not have any commitments or contingent liabilities in respect of its investment in Utilitas Group Pty Ltd. Consolidated
2021
$ 2020
$ Opening carrying amount 1,012,478 776,513 Share of loss from continuing operations after income tax (240,936) (83,311) Share of revaluation of land and buildings (46,536) 319,276 Closing carrying amount
725,006
1,012,478
The table below provides summarised financial information for the associate and reflects the amounts presented in the financial statements of the associate and not AustChina Holdings Limited’s share of those amounts. Summarised balance sheet
2021 $
2020 $
Total Current assets
593,339
615,676
Non-current assets 1,649,137 1,497,168 Total assets
2,242,476
2,112,843
Current liabilities
1,828,253
875,975
Non-current liabilities 375,151 68,775 Total liabilities
2,203,404
944,750
Net assets
39,072
1,168,094
Loss from continuing operations
(966,127)
(331,375) Other comprehensive income
170,000
1,269,945
Total comprehensive income (loss)
(796,127)
938,570
More details on the operations of Utilitas Group is set out under the CEO’s report and review of operations on pages 3 to 11. Note 29 Events after the reporting date On 5 August 2021, the Group raised $980,400 through the issue of 163,400,000 ordinary shares to sophisticated and professional investors at an issue price of $0.006. One attaching option (exercise price $0.012, expiring 2 August 2023) was issued to investors for every 2 ordinary shares issued under the placement. No other matters or circumstance has arisen since 30 June 2021 that has significantly affected the group’s operations, results or state of affairs, or may do so in future years.

50
Note 30 Share-based payments A summary of movements of all options issued is as follows: Number Weighted
Average Exercise Price
Options outstanding as at 30 June 2020 - -
Granted to key management personnel 70,000,000 $0.005
Expired - -
Exercised - -
Options outstanding as at 30 June 2021 70,000,000 $0.005
The weighted average remaining contractual life of options outstanding at year end was 2.5 years. On 30 November 2020, 70,000,000 options were granted to Directors and Key Management Personnel to take up ordinary shares. The options are exercisable at $0.005 each and expire on 15 December 2023. The options have no voting or dividend rights and are not transferable. The fair value of these options at grant date was $238,000. This value was calculated using a Monte Carlo option pricing model applying the following inputs:
Number of options 70,000,000 Exercise price $0.005 Grant date 30/11/2020 Expiry date 15/12/2023 Volatility 132% Dividend yield 0% Risk-free interest rate 0.11% Weighted average fair value at grant date $0.0034

51
SHAREHOLDER INFORMATION The shareholder information set out below was applicable as at 26 August 2021. A. Distribution of equity securities Analysis of numbers of equity security holders by size of holding:
Class of equity security
Ordinary Shares 1 – 1,000 73
1,001 – 5,000 30 5,001 – 10,000 128
10,001 – 100,000 346 100,001 and over 385
962
There were 536 holders of less than a marketable parcel of ordinary shares. B. Equity security holders Twenty largest quoted equity security holders The names of the twenty largest holders of quoted equity securities are listed below:
Ordinary shares Name Number
Held Percentage (%) of
issued shares Citicorp Nominees Pty Limited 904,075,127 50.30 Chimaera Capital Limited 277,105,649 15.42 KAMS Brother Holdings Limited 128,093,700 7.13 Ms Sihol Marito Gultom 51,000,000 2.84 Mr Peter Andrew Proksa 20,000,000 1.11 Group 4 Solutions Pty Ltd 17,500,000 0.97 Kingstone Venture Capital Pty Ltd 16,500,000 0.92 YUCAJA PTY LTD 13,674,498 0.76 Mr Jingwei Wang 11,428,571 0.64 Kevin Daniel Leary & Helen Patricia Leary 10,395,907 0.58 Kingston Investment Group Pty Ltd 10,000,000 0.56 Helen Randall 9,105,990 0.51 Anqi Wu 8,200,000 0.46 Sheng Huang 7,309,599 0.41 Aaron Jermaine Proksa 7,200,000 0.40 BNP Paribas Nominees Pty Ltd 7,130,995 0.40 Xiaolin Jiang 7,100,000 0.39 DVR Invest Pty Ltd 6,852,749 0.38 Ianaki Semerdziev 6,025,675 0.34 Square Resources Pty Ltd 5,937,500 0.33 1,524,635,960 84.85
Unquoted equity securities Number on issue Number of holders Share options 70,000,000 5 Holders of more than 20% of unquoted share options on issue Number held % of total on issue Daniel Chan 20,000,000 28.6% George Lam 20,000,000 28.6% Andrew Macintosh 20,000,000 28.6% C. Substantial shareholders Substantial shareholders as shown in substantial shareholder notices received by the company at 26 August 2021 are:
Number held
Percentage
Ordinary shares Treasure Wheel Global Limited Icon Venture Group Limited Kam’s Brother Holdings Limited
900,873,358 277,105,649 128,093,700
50.12% 16.96% 7.84%

52
D. Voting rights The voting rights attaching to each class of equity securities are set out below: (a) Ordinary shares On a show of hands every member present at a meeting in person or by proxy shall have one vote and
upon a poll each share shall have one vote. (b) Options No voting rights.

THE POWER OF BEING UNDERSTOOD AUDIT | TAX | CONSULTING
RSM Australia Partners is a member of the RSM network and trades as RSM. RSM is the trading name used by the members of the RSM network. Each member of the RSM network is an independent accounting and consulting firm which practices in its own right. The RSM network is not itself a separate legal entity in any jurisdiction.
RSM Australia Partners ABN 36 965 185 036
Liability limited by a scheme approved under Professional Standards Legislation
53
RSM Australia Partners
Level 6, 340 Adelaide Street Brisbane QLD 4000 GPO Box 1108 Brisbane QLD 4001
T +61 (0) 7 3225 7800 F +61 (0) 7 3225 7880
www.rsm.com.au
INDEPENDENT AUDITOR’S REPORT
To the Members of AustChina Holdings Limited
Opinion
We have audited the financial report of AustChina Holdings Limited (the Company) and its subsidiaries (the Group), which comprises the consolidated statement of financial position as at 30 June 2021, the consolidated statement of comprehensive income, the consolidated statement of changes in equity and the consolidated statement of cash flows for the year then ended, and notes to the financial statements, including a summary of significant accounting policies, and the directors' declaration.
In our opinion the accompanying financial report of the Group is in accordance with the Corporations Act 2001, including:
(i) giving a true and fair view of the Group's financial position as at 30 June 2021 and of its financial performance for the year then ended; and
(ii) complying with Australian Accounting Standards and the Corporations Regulations 2001.
Basis for Opinion
We conducted our audit in accordance with Australian Auditing Standards. Our responsibilities under those standards are further described in the Auditor's Responsibilities for the Audit of the Financial Report section of our report. We are independent of the Group in accordance with the auditor independence requirements of the Corporations Act 2001 and the ethical requirements of the Accounting Professional and Ethical Standards Board's APES 110 Code of Ethics for Professional Accountants (the Code) that are relevant to our audit of the financial report in Australia. We have also fulfilled our other ethical responsibilities in accordance with the Code.
We confirm that the independence declaration required by the Corporations Act 2001, which has been given to the directors of the Company, would be in the same terms if given to the directors as at the time of this auditor's report.
We believe that the audit evidence we have obtained is sufficient and appropriate to provide a basis for our opinion.
Material Uncertainty Related to Going Concern
We draw attention to Note 3 (iv) in the financial report, which indicates the Group incurred a loss after tax from continuing operations of $1,118,036 and had net cash outflows from operating activities of $550,056 for the year ended 30 June 2021. As at that date, the Group had net current liabilities of $328,950. As stated in Note 3 (iv), these events or conditions, along with other matters as set forth in Note 3 (iv), indicate that a material uncertainty exists that may cast significant doubt on the Group’s ability to continue as a going concern. Our opinion is not modified in respect of this matter.

54
Key Audit Matters
Key audit matters are those matters that, in our professional judgement, were of most significance in our audit of the financial report of the current period. These matters were addressed in the context of our audit of the financial report as a whole, and in forming our opinion thereon, and we do not provide a separate opinion on these matters. In addition to the matter described in the Material Uncertainty Related to Going Concern section, we have determined the matters described below to be the key audit matters to be communicated in our report.
Carrying Value of Capitalised Exploration Expenditure
Refer to Note 13 in the financial statements
The Group has capitalised exploration expenditure with a carrying value of $15,562,167 as at 30 June 2021. We determined this to be a key audit matter due to the significant management judgment involved in assessing the carrying value in accordance with AASB 6 Exploration for and Evaluation of Mineral Resources, including:
• Determination of whether expenditure can be associated with finding specific mineral resources, and the basis on which that expenditure is allocated to an area of interest;
• Assessing whether any indicators of impairment are present; and
• Determination of whether exploration activities have progressed to the stage at which the existence of an economically recoverable mineral reserve may be determined.
Our audit procedures in relation to the carrying value of capitalised exploration costs included:
• Ensuring that the right to tenure of the areas of interest was current through confirmation with the relevant government departments;
• Critically assessing and evaluating management’s assessment that no indicators of impairment existed;
• Agreeing a sample of the additions to capitalised exploration expenditure during the year to supporting documentation, and ensuring that the amounts were capitalised correctly; and
• Through discussions with the Group’s Directors, and review of the Group’s ASX announcements and other relevant documentation, assessing management’s determination that exploration activities have not yet progressed to the point where the existence or otherwise of an economically recoverable mineral resource may be determined.
Other Information
The directors are responsible for the other information. The other information comprises the information included in the Group's annual report for the year ended 30 June 2021, but does not include the financial report and the auditor's report thereon.
Our opinion on the financial report does not cover the other information and accordingly we do not express any form of assurance conclusion thereon.
In connection with our audit of the financial report, our responsibility is to read the other information and, in doing so, consider whether the other information is materially inconsistent with the financial report or our knowledge obtained in the audit or otherwise appears to be materially misstated.
If, based on the work we have performed, we conclude that there is a material misstatement of this other information, we are required to report that fact. We have nothing to report in this regard.

55
Responsibilities of the Directors for the Financial Report
The directors of the Company are responsible for the preparation of the financial report that gives a true and fair view in accordance with Australian Accounting Standards and the Corporations Act 2001 and for such internal control as the directors determine is necessary to enable the preparation of the financial report that gives a true and fair view and is free from material misstatement, whether due to fraud or error.
In preparing the financial report, the directors are responsible for assessing the ability of the Group to continue as a going concern, disclosing, as applicable, matters related to going concern and using the going concern basis of accounting unless the directors either intend to liquidate the Group or to cease operations, or have no realistic alternative but to do so.
Auditor's Responsibilities for the Audit of the Financial Report
Our objectives are to obtain reasonable assurance about whether the financial report as a whole is free from material misstatement, whether due to fraud or error, and to issue an auditor's report that includes our opinion. Reasonable assurance is a high level of assurance, but is not a guarantee that an audit conducted in accordance with the Australian Auditing Standards will always detect a material misstatement when it exists. Misstatements can arise from fraud or error and are considered material if, individually or in the aggregate, they could reasonably be expected to influence the economic decisions of users taken on the basis of this financial report.
A further description of our responsibilities for the audit of the financial report is located at the Auditing and Assurance Standards Board website at: https://www.auasb.gov.au/admin/file/content102/c3/ar2_2020.pdf
This description forms part of our auditor's report.
Report on the Remuneration Report
Opinion on the Remuneration Report
We have audited the Remuneration Report included in pages 15 to 20 of the directors' report for the year ended 30 June 2021.
In our opinion, the Remuneration Report of AustChina Holdings Limited, for the year ended 30 June 2021, complies with section 300A of the Corporations Act 2001.
Responsibilities
The directors of the Company are responsible for the preparation and presentation of the Remuneration Report in accordance with section 300A of the Corporations Act 2001. Our responsibility is to express an opinion on the Remuneration Report, based on our audit conducted in accordance with Australian Auditing Standards.
RSM Australia Partners Steve Stavrou Partner
Brisbane, Queensland Dated: 13 September 2021