annual report for amincome - aminvest · pdf fileannual report for 31 march 2017 amincome ....
TRANSCRIPT

Annual Report for
31 March 2017
AmIncome
AmIncome
TRUST DIRECTORY
Manager
AmFunds Management Berhad
9th & 10
th Floor, Bangunan AmBank Group
55 Jalan Raja Chulan
50200 Kuala Lumpur
Board of Directors
Raja Maimunah Raja Abdul Aziz
Mustafa Mohd Nor
Tai Terk Lin
Datin Maznah Mahbob
Sum Leng Kuang
Investment Committee
Sum Leng Kuang
Tai Terk Lin
Mustafa Mohd Nor
Zainal Abidin Mohd Kassim
Datin Maznah Mahbob
Trustee
HSBC (Malaysia) Trustee Berhad
Auditors and Reporting Accountants
Ernst & Young
Taxation Adviser
Deloitte Tax Services Sdn Bhd

AmIncome
CONTENTS
1 Manager’s Report
10 Independent Auditor’s Report to the Unitholders
13 Statement of Financial Position
14 Statement of Comprehensive Income
15 Statement of Changes In Equity
16 Statement of Cash Flows
17 Notes to the Financial Statements
43 Statement by the Manager
44 Trustee’s Report
45 Directory
1
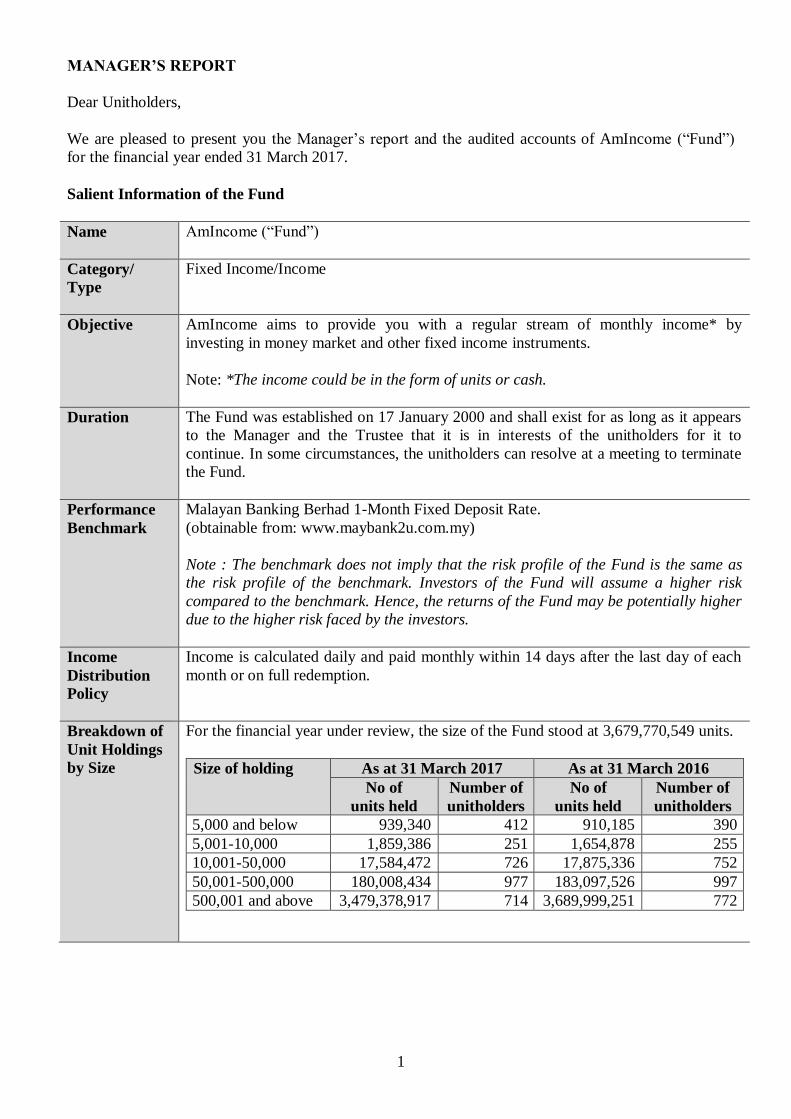
MANAGER’S REPORT
Dear Unitholders,
We are pleased to present you the Manager’s report and the audited accounts of AmIncome (“Fund”)
for the financial year ended 31 March 2017.
Salient Information of the Fund
Name AmIncome (“Fund”)
Category/
Type
Fixed Income/Income
Objective AmIncome aims to provide you with a regular stream of monthly income* by
investing in money market and other fixed income instruments.
Note: *The income could be in the form of units or cash.
Duration The Fund was established on 17 January 2000 and shall exist for as long as it appears
to the Manager and the Trustee that it is in interests of the unitholders for it to
continue. In some circumstances, the unitholders can resolve at a meeting to terminate
the Fund.
Performance
Benchmark
Malayan Banking Berhad 1-Month Fixed Deposit Rate.
(obtainable from: www.maybank2u.com.my)
Note : The benchmark does not imply that the risk profile of the Fund is the same as
the risk profile of the benchmark. Investors of the Fund will assume a higher risk
compared to the benchmark. Hence, the returns of the Fund may be potentially higher
due to the higher risk faced by the investors.
Income
Distribution
Policy
Income is calculated daily and paid monthly within 14 days after the last day of each
month or on full redemption.
Breakdown of
Unit Holdings
by Size
For the financial year under review, the size of the Fund stood at 3,679,770,549 units.
Size of holding As at 31 March 2017 As at 31 March 2016
No of
units held
Number of
unitholders
No of
units held
Number of
unitholders
5,000 and below 939,340 412 910,185 390
5,001-10,000 1,859,386 251 1,654,878 255
10,001-50,000 17,584,472 726 17,875,336 752
50,001-500,000 180,008,434 977 183,097,526 997
500,001 and above 3,479,378,917 714 3,689,999,251 772

2
Fund Performance Data
Portfolio
Composition
Details of portfolio composition of the Fund for the financial years as at 31 March are as
follows:
FY
2017
%
FY
2016
%
FY
2015
%
Corporate bonds 44.90 49.60 54.76
Cagamas bonds - - 0.59
Malaysian Government Securities 0.27 - -
Quasi-Government bonds 0.76 - -
Cash and others 54.07 50.40 44.65
Total 100.00 100.00 100.00
Note: The abovementioned percentages are calculated based on total net asset value.
Performance
Details
Performance details of the Fund for the for the financial years ended 31 March are as
follows:
FY
2017
FY
2016
FY
2015
Net asset value (RM)* 3,731,666,854 3,942,659,183 4,310,599,433
Units in circulation* 3,679,770,549 3,893,537,176 4,266,090,477
Net asset value per unit
(RM)* 1.0000
1.0000
1.0000
Highest net asset value per
unit (RM)* 1.0000 1.0000
1.0000
Lowest net asset value per
unit (RM)* 1.0000 1.0000
1.0000
Benchmark performance (%) 3.00 3.16 3.11
Total return (%)(1)
3.18 3.18 3.02
- Capital growth (%) - - -
- Income distribution (%) 3.18 3.18 3.02
Gross distribution (RM) 119,447,771 129,199,537 134,104,757
Net distribution (RM) 119,447,771 129,199,537 134,104,757
Management expense ratio
(%)(2)
0.85 0.85
0.80
Portfolio turnover ratio
(times)(3)
0.21 0.32
0.34
* Above price and net asset value per unit are shown as ex-distribution.
Note:
(1) Net asset value per unit is aimed to be maintained at RM1.00 as all income earned is
distributed on daily basis.
(2) Total return is the annualised return of the Fund for the respective financial years
computed based on the income return of the Fund net of all fees.
(3) Management expense ratio (“MER”) is calculated based on the total fees and
expenses incurred by the Fund divided by the average fund size calculated on a daily
basis.
(4) Portfolio turnover ratio (“PTR”) is calculated based on the average of the total

3
acquisitions and total disposals of investment securities of the Fund divided by the
average fund size calculated on a daily basis. The PTR decreased by 0.11 times
(34.4%) as compared to 0.32 times for the financial year ended 31 March 2016 mainly
due to decrease in investing activities.
Average Total Return (as at 31 March 2017)
AmIncome(a)
%
MBB(b)
%
One year 3.18 3.00
Three years 3.12 3.09
Five years 2.99 3.05
Ten years 2.92 2.87
Annual Total Return
Financial Years Ended
(31 March)
AmIncome (a)
%
MBB(b)
%
2017 3.18 3.00
2016 3.18 3.16
2015 3.02 3.11
2014 2.75 3.00
2013 2.81 2.99
(a) Source: Novagni Analytics and Advisory Sdn Bhd.
(b) Malayan Banking Berhad 1-month fixed deposit rate (“MBB”)
(Obtainable from: www.maybank2u.com.my).
The Fund performance is calculated based on daily returns of the Fund. Average total
return of the Fund and its benchmark for a period is computed based on the accumulated
returns for that period annualised over one year.
Note: Past performance is not necessarily indicative of future performance and that
unit prices and investment returns may go down, as well as up.
Fund
Performance
For the financial year under review, the Fund registered a return of 3.18% which was
entirely income distribution in nature.
Thus, the Fund’s return of 3.18% has outperformed the benchmark’s return of 3.00% by
0.18%.
As at 31 March 2017, the net asset value (“NAV”) per unit of the Fund is maintained at
RM1.0000, while units in circulation decreased by 5.49% from 3,893,537,176 units to
3,679,770,549 units.
The line chart below shows comparison between the annual performances of AmIncome
and its benchmark, MBB, for financial years ended 31 March.

4
2.81 2.75
3.02
3.18 3.182.99 3.00
3.11
3.163.00
1.00
1.50
2.00
2.50
3.00
3.50
4.00
To
tal R
etu
rn (%
)
Financial Years Ended (31 March)
AmIncome
MBB
Note: Past performance is not necessarily indicative of future performance and that
unit prices and investment returns may go down, as well as up.
Has the Fund
achieved its
objective?
The Fund has achieved its objective to provide investors with a regular stream of monthly
income* by investing in money market and other fixed income instruments.
Note: *The income could be in the form of units or cash.
Strategies
and Policies
Employed
For the financial year under review, the Fund seeks to achieve its objective by invested
primarily in short to medium term fixed income instruments (i.e. debt instruments with
maturity of no longer than five (5) years) with minimum short term local credit rating of
P2 (by RAM) or MARC2 (by MARC) or long-term credit rating of A3 (by RAM) or A-
(by MARC).
With the exception of unforeseeable circumstances (e.g. in the event of a default, the
restructuring or the recovery process may take longer than the maturity of the debt
instrument), the weighted average maturity of the Fund’s investments would not exceed
one year.
Portfolio
Structure
This table below is the asset allocation of the Fund for the financial years under review.
As at
31-3-2017
%
As at
31-3-2016
%
Changes
%
Corporate bonds 44.90 49.60 -4.70
Malaysian Government Securities 0.27 - 0.27
Quasi-Government bonds 0.76 - 0.76
Cash and others 54.07 50.40 3.67
Total 100.00 100.00

5
For the financial year under review, the Fund exposure to corporate bonds stood at
44.90% while the remaining 0.27%, 0.76% and 54.09% of the Fund are made up of
Malaysian Government Securities, Quasi-Government bonds and cash holdings.
Cross Trades
Cross trades are conducted between the Fund and other funds; and private mandates
managed by the Manager amounting to:
Financial Institutions
Transaction Value
(RM)
RHB Investment Bank Berhad 64,366,430.14
Malayan Banking Berhad 5,096,395.72
Hong Leong Bank Investment 13,518,776.44
Total 82,981,602.30
Funds
Transaction Value
(RM)
AmIncome Institutional 3 30,156,986.30
AmBond 13,518,776.44
AmDynamic Bond 9,103,290.41
AmIncome Regular 2 14,924,249.32
AmIslamic Fixed Income Conservative 15,278,299.83
Total 82,981,602.30
Distribution /
Unit splits
The Fund distributes the entire income on a monthly basis. For the financial year under
review, the Fund has distributed income totaling RM119,447,771 and no unit split was
declared.
State of
Affairs
There has been neither significant change to the state of affairs of the Fund nor any
circumstances that materially affect any interests of the unit holders during the financial
year under review.
Rebates
and Soft
Commission
It is our policy to pay all rebates to the Fund. Soft commission received from
brokers/dealers are retained by the Manager only if the goods and services provided are of
demonstrable benefit to unitholders of the Fund.
During the financial year under review, the Manager had received on behalf of the Fund,
soft commissions in the form of fundamental database, financial wire services, technical
analysis software and stock quotation system incidental to investment management of the
Fund. These soft commissions received by the Manager are deem to be beneficial to the
unitholders of the Fund.
Market
Review
In April 2016, Malaysia released its February exports number, which rebounded 6.7%
YoY. The increase was generally driven by electrical and electronics sector as well as
increase in palm oil and palm-based and timber and timber based products. On the
inflation front, CPI for March came in much weaker than expected at 2.6% YoY against
consensus expectations of 3.4%. The drop was due to lower transport cost as RON95
petrol price was reduced by 15 sen to RM1.60 per litre in March 2016 from RM1.75 in
February. Meanwhile, Bank Negara Malaysia (BNM) said that the reduction of the
statutory reserve requirement by 50 basis points on 1 February 2016 has had its desired
impact on the banking system’s interbank rates. The base rate of commercial banks, on

6
average, remained relatively stable at 3.89% in March (February: 3.88%). On the
consumer sentiment front, 1Q16 Consumer Sentiment Index (“CSI”) has rebounded to
72.9 points after plunging for six consecutive quarters. Recall that the index had hit its all-
time lows in the past two quarters, falling to 63.8 in 4Q15. In April, BNM’s international
reserves continue to climb steadily and were last seen at USD97b as at end-March 2016.
More pertinently, foreign holdings in Malaysian bonds of RM226.6 billion as at end
March has broken the previous record set in November 2014. Strengthening crude oil
prices and foreign fund inflows in both the bond as well as equities market has help turned
the Ringgit into Asia’s best-performing currency, confounding some analyst’s
expectation. The Ringgit has surged around 10% as at end April, the most in 43 years.
Finally, polling for Sarawak’s 11th state election has finally been announced to be on 7
May 2016.
In May 2016, Bank Negara Malaysia BNM kept the Overnight Policy Rate and Statutory
Reserve Requirement (“SRR”) ratio unchanged at 3.25% and 3.50% respectively as
widely expected in Datuk Muhammad Ibrahim’s inaugural Monetary Policy Committee
(“MPC”) meeting as BNM Governor. The tone of the MPC statement was largely neutral
with the stance broadly similar to the previous MPC statements. BNM also reiterated its
expectations for the domestic economy to expand by 4.0 – 4.5% in 2016 while inflation is
expected to trend lower for the remaining parts of the year from the average consumer
price index (“CPI”) of 3.4% in the first quarter of 2016 (“1Q16”). This followed the
release of Malaysia’s 1Q16 gross domestic product (“GDP”) data which grew at a slower
pace of 4.2% year-on-year (“YoY”), on the back of weakness in exports and soft private
investment growth while on a quarter to quarter basis, the domestic economy grew 1.0%,
compared to 1.5% previously.
In June 2016, Malaysia reported a positive growth in exports of 1.6% YoY for the month
of April 2016, while imports contracted by 2.3%, thus leaving a positive trade balance of
RM9.1b. Main contributors to exports came from the E&E sector which showed an
encouraging growth of 2.1% versus 0.5% in the preceding month. On the inflation front,
May’s CPI eases marginally to 2.0% YoY matching market expectations. Since the
implementation of GST in April 2015, the initial price shock has faded while the current
record low pump prices continue to keep inflationary pressure in check. Meanwhile,
Malaysia’s unemployment rate continued to inch up in April. At 3.6%, the unemployment
figure is at the highest since 2010. Finally, Malaysia’s Ringgit appreciated versus USD
by 2.9% from RM4.15 to RM4.03 at as end June. The Ringgit has been volatile in June
primarily due to two key events, the FOMC meeting as well as the UK Referendum on
Brexit.
In July 2016, Malaysia reported a negative growth in exports of -0.9% YoY for the month
of May 2016, its first drop in 4 months. This was against market expectation of 2.0%
growth. Nevertheless, Malaysia’s trade surplus continues to be in the positive albeit
narrowing to RM3.26b (April: RM9.06b) which brings cumulative trade surplus to
RM36.3b YTD. To recap, the biggest news of the month came from Bank Negara
Malaysia (“BNM”) which unexpectedly cut the Overnight Policy Rate (“OPR”) by 25bps
to 3.00% at its July 2016 meeting. This was the first monetary policy move since July
2014. BNM’s Governor was also reported as explaining that the cut was a pre-emptive
move in light of the recent UK Referendum on Brexit event as well as weaker global
growth prospects in the near term. On the inflation front, June’s CPI softened again to
1.6% YoY, below consensus expectations. Average inflation for 1H2016 is now around
2.7% which is in line with BNM’s guidance of 2 - 3% for 2016.
In August 2016, Malaysia exports bounced back into gain of 3.4% y-o-y in June after
falling by -0.9% in May and compared with +1.6% in April. Meanwhile, the foreign

7
exchange reserves increased marginally by USD0.1b to USD97.3b as at 29 July 2016. The
current account surplus in the balance of payments narrowed to MYR1.9bn in 2Q 2016,
after recording a surplus of MYR5.0bn in 1Q and compared with a surplus of MYR8.1bn
in 2Q 2015. This was attributed to a smaller surplus in the merchandise trade account and
a larger deficit in the income transfers. Meanwhile, the financial account registered a
higher net inflow of MYR9.5bn in 2Q, compared with an inflow of MYR5.8bn in the
previous quarter. The improvement was mainly due to a rebound in net inflow on other
investments and a larger net inflow of direct investments. On the other hand, the
slowdown in the Malaysian economy continued with real GDP growing at a slower pace
of 4.0% y-o-y in 2Q 2016, from +4.2% in 1Q and +4.5% in 4Q 2016. The overall growth
was dragged lower by a cutback in inventories and subdued exports.
In September 2016, Malaysia’s PMI reading rose to 48.6 in September from 47.4 in
August 2016. This marked the highest reading in eight months. Nevertheless, it was still
the eighteenth consecutive month of contraction as indicated by the sub 50 reading. On
the inflation front, headline inflation reading for August rebounded to 1.5% versus
consensus expectation of 1.3%. Main drivers were non-food items particularly cultural
services which saw inflation surging from 1.0% in July to 6.1% YoY in August. Finally,
the banking sector’s loan growth moderated for the twelfth consecutive month to 4.2%
YoY in August from 5.1% YoY in July. Notably, this is the lowest level in at least 13
years, as lending activities continue to face headwinds from a slowing economy, tepid
deposit growth and rising loan impairments.
In October 2016, Malaysia’s foreign exchange reserves rose by USD0.2bn to USD97.7bn
as at 30 September 2016, from USD97.5bn registered at end-August and compared to
USD95.3bn at end-December 2015. On the inflation front, the headline inflation rate
remained stable in September, as the easing in cost of food and beverages was mitigated
by the smaller magnitude of decline in cost of transport. The core inflation rate inched
lower in September. Growth of the broader money supply, M3, slowed to 2.2% y-o-y in
September, from +2.4% in August, due to a decline in external operations and a slowdown
in demand for funds by the private and public sector. Meanwhile, loan growth was stable
at 4.2% y-o-y in September, unchanged from the previous month but lower compared
with +5.6 in July, as the deceleration in growth of household loans were mitigated by the
marginal increase in business loans.
In November 2016, Malaysia’s foreign exchange reserves rose by USD0.5bn to
USD98.3bn as at 15 November 2016, from USD97.8bn registered at end-October 2016
and compared to USD95.3bn at end-December 2015. CPI for Oct 2016 came in
marginally lower at 1.4% YoY compared to Sep 2016’s reading on 1.5% YoY. 3Q GDP
was 4.3% YoY, higher than consensus expectations of 4.0% YoY (2Q: 4.0%, 1Q: 4.2%).
GDP growth was boosted by higher consumer spending which grew 6.4% YoY, supported
by wage and employment growth. Private investment eased slightly to 4.7% from 5.6% in
2Q, attributed to a decline in spending on machinery and equipment. Government
spending also slowed to 3.1% from 6.5% in 2Q, on the back of lower spending on supply
and services. Bank Negara Malaysia (BNM) left its Overnight Policy Rate(OPR)
unchanged at 3.00%, as expected by the market given the significant degree of financial
market volatility following Donald Trump's presidential victory. Compared to September,
BNM slightly upgraded its view on global growth in 2017, but retained its assessment that
the domestic economy remains on track to expand as projected in 2016 and 2017.
In December 2016, Malaysia’s manufacturing Purchasing Managers’ Index (PMI)
continue to remain below the 50-level mark coming in unchanged at 47.1 in December.
This was the twenty first consecutive months of contraction. On the trade front, exports
were below expectations, recording a contraction of 8.6% YoY in October (September: -

8
3.0%). Consensus expectations were for a contraction of -5.6%. Imports meanwhile also
fell by 6.6% YoY (September: -0.1%) driven by broad-based declines in capital imports (-
2.0%), intermediate imports (-8.9%), and consumption imports (-8.0%). Nevertheless,
trade surplus continues to be positive at RM9.76b (September: RM7.56b). Indicative of
the huge foreign outflows in the month of November, Malaysia’s foreign reserves fell
USD1.4b to USD96.4b. This was the lowest reserve level since March 2016. The current
level of reserves is sufficient to cover 1.2 times of short-term external debt and 8.3 months
of retained imports. During the month, Bank Negara Malaysia (“BNM”) announced
several measures to enhance onshore foreign exchange liquidity effective 5 December
2016. The measures include the liberalization and deregulation of the onshore MYR
hedging market, streamlining treatment for investment in foreign currency assets and
incentives and treatment of export proceeds. These pre-emptive measures were
implemented to stabilise the ringgit and support financial stability amid further broad
strengthening of the USD. Finally, the banking sector’s loan growth showed signs of
bottoming. For the month of November, growth accelerated to 5.3% YoY (October: 4.5%)
and a robust 0.9% MoM, resulting in YTD annualised loan growth improving to 4.7%
(10M2016: 4.0%). The main driver of loan growth was in working capital loans (+1.6%
MoM vs average MoM run rate of +0.3%). In terms of consumer loans, residential
property loan growth remained stable at 9.5% YoY while automobile loans remain mired
in negative territory at -0.8% YoY.
In January 2017, after increasing by USD 0.2b and USD 0.5b in October and November
respectively, Malaysia’s foreign reserves fell by USD3.7b to USD 94.6b in December.
This was the lowest reserve level the start of the year and the decline was spurred by
considerable foreign outflows. The current level of reserves is sufficient to cover 1.2 times
of short-term external debt and 8.3 months of retained imports. In comparison Malaysia’s
foreign reserves stood at USD 95.3bn at end-December 2015. On the trade front exports &
imports rebounded 11.2% YoY. BNM left the policy rate unchanged at 3.00% in its latest
meeting, with a more upbeat statement on the external sector and higher inflation
expectation for 2017. The general expectation is that BNM will leave the rate unchanged
in 2017, against the backdrop of expected Fed rate hike(s) during the year.
In February 2017, Malaysia’s 4Q16 GDP growth was printed at 4.5% vs consensus of
4.4%, in line with BNM’s forecasts of 4.0-4.5%. The growth came on the back of
moderate rebound in exports/imports and resilient domestic demand in the 4 Qtr. 2016
budget deficits met the 3.1% of GDP target allaying concerns on the sovereign’s ratings.
Further, despite the persistent weakness in the MYR, Malaysia external reserves remained
resilient; it stood unchanged from end-January at US$95b in mid-February. The January
CPI print came in much higher than expected today at 3.2%, vs consensus estimate of
2.7%. The upside surprise was driven by 2 factors: 1) domestic fuel price increases, and 2)
food prices due to bad weather and also lagged impact of cooking oil subsidy removals.
In March 2017, Bank Negara Malaysia (“BNM”) released the 2016 Annual Report where
the central bank projected Malaysia’s GDP to grow at 4.3% - 4.8% for 2017. The higher
growth projection is based on a rebound in exports as well as resilient domestic demand.
Inflation, however, is expected to spike upwards to 3% - 4% (2016: 2.1%) due mainly to
cost-driven factors i.e. pass-through impact from an elevated retail oil prices. In the same
report, BNM also projects Malaysia’s current account surplus to remain positive at
RM17.4b (2016: RM25.2b). Meanwhile, as at end 2016, the top five Foreign Direct
Investments (“FDI”) contributor was Singapore (RM115b), Japan (RM70b), China & HK
(RM53b), Netherlands (RM48b) and United States (RM36b). In 2016, out of the
RM207.9b approved investments, the Services sector command 68% while the
Manufacturing sector command a lower share of 28%. The bulk of investments in the
Manufacturing sector came from Petroleum Products, E&E Products, Basic Metal

9
Products and Transport Equipment while the usual Real Estate, Financial Services,
Utilities and Distributive Trade dominate the Services Sector. Finally, the banking
sector’s loan growth for February slipped slightly to 5.3% YoY from 5.6% YoY in the
previous month. The moderation in February’s loan growth was caused by a slower
Household loan growth of +5.1% whilst business loan was unchanged at 5.4%.
Market
Outlook
The US Federal Open Market Committee (“FOMC”) March rate hike was fully expected
by most investors but more importantly, the dovish guidance that accompanied the FOMC
statement was welcomed by all, especially Emerging Markets investors. With the FOMC
decision out of the way, investors’ attention is now tuned to how President Trump and his
team will maneuver all the election promises made last November starting with its China
policy.
Meanwhile, the rise in inflation outlook globally as well as in Malaysia is very much in
focus. Bank Negara Malaysia (“BNM”) has guided for 2017 headline inflation Consumer
Price Index (“CPI”) to fall within 3.0% - 4.0% in its latest Annual Report. We note that
the forecast is significantly higher than the 2.1% recorded for the whole of 2016. What is
more pertinent however is whether the recent surge in Malaysia’s CPI (Feb: 4.5%)
portends a potential change in BNM’s monetary policy given the current negative real rate
environment.
We do not think so, at least not in the next six months. The reason for the surge in the CPI
can be attributed to the lower base in prior year as well as the multiple price hikes in
petrol pump prices via RON95, RON97 and Diesel. In other words, Malaysia’s headline
inflation is largely cost-push and not demand-driven. In fact, core inflation remains below
3.0% (Feb: 2.5%) and BNM has acknowledged as much in its recent Monetary Policy
Index (“MPC”) statement stating that “the cost-driven inflation is not expected to have a
significant impact on the broader price trends given the stable domestic demand
conditions. Core inflation is expected to increase modestly.”
Given the above and based on BNM’s actions in the past, we opine that the current higher
inflation pressures are unlikely to trigger an Overnight Policy Rate (“OPR”) hike, given
lingering growth risks, and the absence of strong demand conditions leading to second-
round effects on domestic inflation.
Kuala Lumpur, Malaysia
AmFunds Management Berhad
8 May 2017

Independent auditors’ report to the unitholders of
AmIncome
Report on the financial statements
Opinion
Basis for opinion
Independence and other ethical responsibilities
Information other than the financial statements and auditors’ report thereon
We have audited the financial statements of AmIncome (“the Fund”), which comprise the statement
of financial position as at 31 March 2017, and the statement of comprehensive income, statement of
changes in equity and statement of cash flows for the year then ended, and notes to the financial
statements, including a summary of significant accounting policies, as set out on pages 13 to 42.
In our opinion, the accompanying financial statements give a true and fair view of the financial
position of the Fund as at 31 March 2017, and of its financial performance and its cash flows for the
year then ended in accordance with Malaysian Financial Reporting Standards and International
Financial Reporting Standards.
We conducted our audit in accordance with approved standards on auditing in Malaysia and
International Standards on Auditing. Our responsibilities under those standards are further described
in the Auditor’s Responsibilities for the Audit of the Financial Statements section of our report. We
believe that the audit evidence we have obtained is sufficient and appropriate to provide a basis for
our opinion.
We are independent of the Fund in accordance with the By-Laws (on Professional Ethics, Conduct
and Practice) of the Malaysian Institute of Accountants (“By-Laws”) and the International Ethics
Standards Board for Accountants’ Code of Ethics for Professional Accountants (“IESBA Code”),
and we have fulfilled our other ethical responsibilities in accordance with the By-Laws and the
IESBA Code.
The Manager is responsible for the other information. The other information comprises information
in the Annual Report, but does not include the financial statements of the Fund and our auditors’
report thereon.
Our opinion on the financial statements of the Fund does not cover the other information and we do
not express any form of assurance conclusion thereon.
In connection with our audit of the financial statements of the Fund, our responsibility is to read the
other information and, in doing so, consider whether the other information is materially inconsistent
with the financial statements of the Fund or our knowledge obtained in the audit or otherwise
appears to be materially misstated.
10

Independent auditors’ report to the unitholders of
AmIncome (cont’d.)
Responsibilities of the Manager and the Trustees for the financial statements
Auditor’s responsibilities for the audit of the financial statements
Identify and assess the risks of material misstatement of the financial statements of the Fund,
whether due to fraud or error, design and perform audit procedures responsive to those risks,
and obtain audit evidence that is sufficient and appropriate to provide a basis for our opinion.
The risk of not detecting a material misstatement resulting from fraud is higher than for one
resulting from error, as fraud may involve collusion, forgery, intentional omissions,
misrepresentations, or the override of internal control.
If based on the work we have performed, we conclude that there is a material misstatement of this
other information, we are required to report that fact. We have nothing to report in this regard.
The Manager is responsible for the preparation of the financial statements of the Fund that give a
true and fair view in accordance with Malaysian Financial Reporting Standards and International
Financial Reporting Standards. The Manager is also responsible for such internal control as the
Manager determines is necessary to enable the preparation of financial statements of the Fund that
are free from material misstatement, whether due to fraud or error.
In preparing the financial statements of the Fund, the Manager is responsible for assessing the
Fund’s ability to continue as a going concern, disclosing, as applicable, matters related to going
concern and using the going concern basis of accounting unless the Manager either intends to
liquidate the Fund or to cease operations, or has no realistic alternative to do so.
The Trustee is responsible for ensuring that the Manager maintains proper accounting and other
records as are necessary to enable true and fair presentation of these financial statements.
Our objectives are to obtain reasonable assurance about whether the financial statements of the Fund,
as a whole are free from material misstatement, whether due to fraud or error, and to issue an
auditors’ report that includes our opinion. Reasonable assurance is a high level of assurance, but is
not a guarantee that an audit conducted in accordance approved standards on auditing in Malaysia
and International Standards on Auditing will always detect a material misstatement when it exists.
Misstatements can arise from fraud or error and are considered material if, individually or in the
aggregate, they could reasonably be expected to influence the economic decisions of users taken on
the basis of these financial statements.
As part of an audit in accordance with the approved standards on auditing in Malaysia and
International Standards on Auditing, we exercise professional judgment and maintain professional
skepticism throughout the planning and performance of the audit. We also:
Obtain an understanding of internal control relevant to the audit in order to design audit
procedures that are appropriate in the circumstances, but not for the purpose of expressing an
opinion on the effectiveness of the Fund’s internal control.
11

Independent auditors’ report to the unitholders of
AmIncome (cont’d.)
Other matters
Ernst & Young Wan Daneena Liza Bt Wan Abdul Rahman
AF: 0039 No. 2978/03/18(J)
Chartered Accountants Chartered Accountant
Kuala Lumpur, Malaysia
8 May 2017
This report is made solely to the unitholders of the Fund, as a body, and for no other purpose. We do
not assume responsibility to any other person for the content of this report.
Evaluate the appropriateness of accounting policies used and the reasonableness of accounting
estimates and related disclosures made by the Manager.
Conclude on the appropriateness of the Manager’s use of the going concern basis of
accounting and, based on the audit evidence obtained, whether a material uncertainty exists
related to events or conditions that may cast significant doubt on the Fund’s ability to
continue as a going concern. If we conclude that a material uncertainty exists, we are required
to draw attention in our auditors’ report to the related disclosures in the financial statements
or, if such disclosures are inadequate, to modify our opinion. Our conclusions are based on the
audit evidence obtained up to the date of our auditors’ report. However, future events or
conditions may cause the Fund to cease to continue as a going concern.
Evaluate the overall presentation, structure and content of the financial statements of the
Fund, including the disclosures, and whether the financial statements of the Fund represent
the underlying transactions and events in a manner that achieves fair presentation.
We communicate with the Manager regarding, among other matters, the planned scope and timing of
the audit and significant audit findings, including any significant deficiencies in internal control that
we identify during our audit.
12

AmIncome
STATEMENT OF FINANCIAL POSITION
AS AT 31 MARCH 2017
2017 2016
Note RM RM
ASSETS
Investments 4 1,714,169,503 1,955,623,906
Deposits with financial institutions 5 2,022,803,222 1,910,736,315
Cash at banks 7,829,193 89,821,466
TOTAL ASSETS 3,744,801,918 3,956,181,687
LIABILITIES
Amount due to Manager 6 2,778,286 2,516,441
Amount due to Trustee 7 162,372 167,763
Distributions payable and to be reinvested 9,979,399 10,660,138
Sundry payables and accrued expenses 215,007 178,162
TOTAL LIABILITIES 13,135,064 13,522,504
EQUITY
Unitholders’ capital 9(a) 3,679,770,549 3,893,537,176
Accumulated losses 9(b) (152) (5,295)
Available-for-sale reserve 9(c) 1,830,452 1,424,586
Capital reserve 11 50,066,005 47,702,716
TOTAL EQUITY 9 3,731,666,854 3,942,659,183
TOTAL EQUITY AND LIABILITIES 3,744,801,918 3,956,181,687
UNITS IN CIRCULATION 9(a) 3,679,770,549 3,893,537,176
NET ASSET VALUE PER UNIT
− EX DISTRIBUTION 100.00 sen 100.00 sen
The accompanying notes form an integral part of the financial statements.
13

AmIncome
STATEMENT OF COMPREHENSIVE INCOME
FOR THE FINANCIAL YEAR ENDED 31 MARCH 2017
2017 2016
Note RM RM
INVESTMENT INCOME
Interest income 154,127,648 166,851,982
Other income 71,983 174,782
Net gain from investments:
− Gain on disposals of available-for-sale investments 388,716 111,086
Gross Income 154,588,347 167,137,850
EXPENDITURE
Manager’s fee 6 (28,936,880) (31,424,275)
Trustee’s fee 7 (1,929,125) (2,094,952)
Auditors’ remuneration (11,000) (12,000)
Tax agent’s fee (4,000) (4,000)
Other expenses 8 (1,891,139) (2,055,271)
Total Expenditure (32,772,144) (35,590,498)
NET INCOME BEFORE TAX 121,816,203 131,547,352
LESS: INCOME TAX 13 - -
NET INCOME AFTER TAX 121,816,203 131,547,352
OTHER COMPREHENSIVE INCOME THAT MAY BE
RECLASSIFIED TO PROFIT OR LOSS IN
SUBSEQUENT PERIODS:
− Fair value revaluation gain 794,582 2,376,322
− Reclassification of gain on financial investments
available-for-sale to profit or loss, net (388,716) (111,086)
TOTAL COMPREHENSIVE INCOME FOR THE
FINANCIAL YEAR 122,222,069 133,812,588
Total comprehensive income comprises the following:
Realised income 121,816,203 131,547,352
Unrealised gain 405,866 2,265,236
122,222,069 133,812,588
Distributions for the financial year:
Gross/net distributions 14 119,447,771 129,199,537
The accompanying notes form an integral part of the financial statements.
14

AmIncome
STATEMENT OF CHANGES IN EQUITY
FOR THE FINANCIAL YEAR ENDED 31 MARCH 2017
Retained Available-
earnings/ for-sale
Unitholders’ (accumulated (deficit)/ Capital Total
capital losses) reserve reserve equity
Note RM RM RM RM RM
At 1 April 2015 4,266,090,477 1,830 (840,650) 45,347,776 4,310,599,433
Total comprehensive income
for the financial year - 131,547,352 2,265,236 - 133,812,588
Transfer to capital
reserve 11 - (2,354,940) - 2,354,940 -
Creation of units 9(a) 6,079,351,082 - - - 6,079,351,082
Reinvestments of
distributions 9(a) 125,624,005 - - - 125,624,005
Cancellation of units 9(a) (6,577,528,388) - - - (6,577,528,388)
Distributions 14 - (129,199,537) - - (129,199,537)
Balance at 31 March 2016 3,893,537,176 (5,295) 1,424,586 47,702,716 3,942,659,183
At 1 April 2016 3,893,537,176 (5,295) 1,424,586 47,702,716 3,942,659,183
Total comprehensive income
for the financial year - 121,816,203 405,866 - 122,222,069
Transfer to capital
reserve 11 - (2,363,289) - 2,363,289 -
Creation of units 9(a) 4,272,531,144 - - - 4,272,531,144
Reinvestments of
distributions 9(a) 117,071,096 - - - 117,071,096
Cancellation of units 9(a) (4,603,368,867) - - - (4,603,368,867)
Distributions 14 - (119,447,771) - - (119,447,771)
Balance at 31 March 2017 3,679,770,549 (152) 1,830,452 50,066,005 3,731,666,854
The accompanying notes form an integral part of the financial statements.
15

AmIncome
STATEMENT OF CASH FLOWS
FOR THE FINANCIAL YEAR ENDED 31 MARCH 2017
2017 2016
RM RM
CASH FLOWS FROM OPERATING AND
INVESTING ACTIVITIES
Proceeds from maturity/sale of investments 891,198,130 3,043,047,673
Interest received 172,651,170 189,964,858
Other income received 71,983 174,782
Manager’s fee paid (28,675,035) (31,687,270)
Trustee’s fee paid (1,934,516) (2,112,485)
Tax agent’s fee paid (4,000) (4,000)
Payments for other expenses (1,865,294) (1,906,672)
Purchase of investments (1,072,910,476) (1,228,314,153)
Net cash (used in)/generated from operating and
investing activities (41,468,038) 1,969,162,733
CASH FLOWS FROM FINANCING
ACTIVITIES
Proceeds from creation of units 4,272,531,144 6,079,351,082
Payment for cancellation of units (4,603,368,867) (6,577,528,388)
Distributions paid (3,057,414) (4,463,701)
Net cash used in financing activities (333,895,137) (502,641,007)
NET (DECREASE)/INCREASE IN CASH AND
CASH EQUIVALENTS (375,363,175) 1,466,521,726
CASH AND CASH EQUIVALENTS AT
BEGINNING OF FINANCIAL YEAR 1,899,699,699 433,177,973
CASH AND CASH EQUIVALENTS AT
END OF FINANCIAL YEAR 1,524,336,524 1,899,699,699
Cash and cash equivalents comprise:
Deposits with financial institutions 1,516,507,331 1,809,878,233
Cash at banks 7,829,193 89,821,466
1,524,336,524 1,899,699,699
The accompanying notes form an integral part of the financial statements.
16

AmIncome
NOTES TO THE FINANCIAL STATEMENTS
1. GENERAL INFORMATION
2. BASIS OF PREPARATION OF FINANCIAL STATEMENTS
Standards effective during the financial year
Standards issued but not yet effective
MFRS 9: Financial Instruments
MFRS 15: Revenue From Contracts With Customers
AmIncome (“the Fund”) was established pursuant to a Deed dated 17 January 2000 as amended by Deeds
Supplemental thereto (“the Deed”), between AmFunds Management Berhad as the Manager, HSBC (Malaysia)
Trustee Berhad as the Trustee and all unitholders.
The Fund was set up with the objective of providing investors with a high stream of income returns. As
provided in the Deed, the “accrual period” or financial year shall end on 31 March and units in the Fund were
first offered for sale on 20 January 2000.
financial periods
The financial statements of the Fund have been prepared under the historical cost convention, unless otherwise
stated in the accounting policies.
The adoption of MFRS which have been effective during the financial year did not have any material financial
impact to the financial statements.
As at the date of authorisation of these financial statements, the following Standards, which are relevant to the
Fund, have been issued by MASB but are not yet effective and have not been adopted by the Fund.
1 January 2018
The financial statements of the Fund have been prepared in accordance with Malaysian Financial Reporting
Standards (“MFRS”) as issued by the Malaysian Accounting Standards Board (“MASB”) and are in
compliance with International Financial Reporting Standards.
beginning on or after
1 January 2018
Effective for
The Fund plans to adopt the above pronouncements when they become effective in the respective financial
periods. These pronouncements are expected to have no significant impact to the financial statements of the
Fund upon their initial application except as described below:
17

MFRS 9 Financial Instruments
3. SIGNIFICANT ACCOUNTING POLICIES
Income recognition
Income tax
Functional and presentation currency
Statement of cash flows
Distribution
Current taxes are recognised in profit or loss except to the extent that the tax relates to items recognised outside
profit or loss, either in other comprehensive income or directly in equity.
Distributions are at the discretion of the Fund. A distribution to the Fund’s unitholders is accounted for as a
deduction from realised reserves. A proposed distribution is recognised as a liability in the period in which it is
approved.
Functional currency is the currency of the primary economic environment in which the Fund operates that most
faithfully represents the economic effects of the underlying transactions. The functional currency of the Fund is
Ringgit Malaysia which reflects the currency in which the Fund competes for funds, issues and redeems units.
The Fund has also adopted Ringgit Malaysia as its presentation currency.
The Fund adopts the direct method in the preparation of the statement of cash flows.
Cash equivalents are short-term, highly liquid investments that are readily convertible to cash with insignificant
risk of changes in value.
Income is recognised to the extent that it is probable that the economic benefits will flow to the Fund and the
income can be reliably measured. Income is measured at the fair value of consideration received or receivable.
Interest income on fixed income securities and short-term deposits are recognised on an accrual basis using the
effective interest method, which includes the accretion of discounts and amortisation of premiums.
Current tax assets and liabilities are measured at the amount expected to be recovered from or paid to the tax
authorities. The tax rates and tax laws used to compute the amount are those that are enacted or substantively
enacted at the reporting date.
MFRS 9 reflects International Accounting Standards Board’s (“IASB”) work on the replacement of MFRS 139
Financial Instruments: Recognition and Measurement (“MFRS 139”). MFRS 9 will be effective for financial
year beginning on or after 1 January 2018. The Fund is in the process of quantifying the impact of the first
adoption of MFRS 9.
18

Unitholders’ capital
Capital reserve
Financial assets
(i) Available-for-sale investments
(ii) Loans and receivables
The Fund determines the classification of its financial assets at initial recognition, and the categories applicable
to the Fund include available-for-sale investments and loans and receivables.
Capital reserve of the Fund represents non-distributable amount as determined by the Manager that may be
applied to make good any losses incurred by the Fund, in order to maintain the Fund’s prices at RM1.00 per
unit, as approved by the Securities Commission.
Financial assets are recognised in the statement of financial position when, and only when, the Fund becomes a
party to the contractual provisions of the financial instrument.
The unitholders’ capital of the Fund meets the definition of puttable instruments and is classified as equity
instruments under MFRS 132 Financial Instruments: Presentation (“MFRS 132”).
When financial assets are recognised initially, they are measured at fair value, plus, in the case of financial
assets not at fair value through profit or loss, directly attributable transaction costs.
Subsequent to initial recognition, loans and receivables are measured at amortised cost using the effective
interest method. Gains and losses are recognised in profit or loss when the loans and receivables are
derecognised or impaired, and through the amortisation process.
Financial assets with fixed or determinable payments that are not quoted in an active market are classified
as loans and receivables.
Available-for-sale investments are measured at fair value. Any gains or losses from changes in fair value of
the investments are recognised in other comprehensive income, except that impairment losses, foreign
exchange gains and losses on monetary instruments and interest calculated using the effective interest
method are recognised in profit or loss. The cumulative gain or loss previously recognised in other
comprehensive income is reclassified from equity to profit or loss as a reclassification adjustment when the
investment is derecognised.
For investments in fixed income securities, fair value is determined based on the indicative prices from
Bond Pricing Agency Malaysia Sdn Bhd plus accrued interest, which includes the accretion of discount and
amortisation of premium.
19

Impairment of available-for-sale
Impairment of loans and receivables
Financial liabilities
The Fund assesses at each reporting date whether there is any objective evidence that a financial asset is
impaired.
To determine whether there is objective evidence that an impairment loss on financial assets has been incurred,
the Fund considers factors such as the probability of insolvency or significant financial difficulties of the debtor
and default or significant delay in payments.
If any such evidence exists, the amount of impairment loss is measured as the difference between the assets’s
carrying amount and the present value of estimated future cash flows discounted at the financial asset’s original
effective interest rate. The impairment loss is recognised in profit or loss.
The carrying amount of the financial asset is reduced through the use of an allowance account. When loans and
receivables become uncollectible, they are written off against the allowance account.
If in a subsequent period, the amount of the impairment loss decreases and the decrease can be related
objectively to an event occurring after the impairment was recognised, the previously recognised impairment
loss is reversed to the extent that the carrying amount of the asset does not exceed its amortised cost at the
reversal date. The amount of reversal is recognised in profit or loss.
For financial investments AFS, the Fund assesses at each reporting date whether there is objective evidence that
an investment is impaired. The amount of any impairment loss identified is measured as the difference between
the asset’s carrying amount and the present value of estimated future cash flows (excluding future expected
credit losses that have not yet been incurred). The present value of the estimated future cash flows is discounted
at the financial asset’s original effective interest rate. However, the amount recorded for impairment is the
cumulative loss measured as the difference between the amortised cost and the current fair value, less any
impairment loss on that investment previously recognised in profit or loss.
If, in a subsequent year, the fair value of a debt instrument increases and the increase can be objectively related
to an event occurring after the impairment loss was recognised in the profit or loss, the impairment loss is
reversed through the profit or loss.
Financial liabilities are classified according to the substance of the contractual arrangements entered into and
the definitions of a financial liability.
Financial liabilities, within the scope of MFRS 139, are recognised in the statement of financial position when,
and only when, the Fund becomes a party to the contractual provisions of the financial instrument.
The Fund’s financial liabilities are recognised initially at fair value plus directly attributable transaction costs
and subsequently measured at amortised cost using the effective interest method.
20

Classification of realised gains and losses
Significant accounting estimates and judgments
4. INVESTMENTS
2017 2016
Available-for-sale investments RM RM
At nominal value:
Quasi-Government Bonds 28,000,000 -
Corporate bonds 1,634,888,000 1,900,188,000
Malaysian Government Securities 10,000,000 -
1,672,888,000 1,900,188,000
At amortised cost:
Quasi-Government Bonds 28,298,052 -
Corporate bonds 1,673,959,438 1,954,199,320
Malaysian Government Securities 10,081,561 -
1,712,339,051 1,954,199,320
At fair value:
Quasi-Government Bonds 28,324,646 -
Corporate bonds 1,675,701,280 1,955,623,906
Malaysian Government Securities 10,143,577 -
1,714,169,503 1,955,623,906
No major judgments have been made by the Manager in applying the Fund’s accounting policies. There are no
key assumptions concerning the future and other key sources of estimation uncertainty at the reporting date,
that have a significant risk of causing a material adjustment to the carrying amounts of assets and liabilities
within the next financial year.
The preparation of the Fund’s financial statements requires the Manager to make judgments, estimates and
assumptions that affect the reported amounts of revenues, expenses, assets and liabilities, and the disclosure of
contingent liabilities at the reporting date. However, uncertainty about these assumptions and estimates could
result in outcomes that could require a material adjustment to the carrying amount of the asset or liability in the
future.
Realised gains and losses on disposals of financial instruments are calculated using the weighted average
method. They represent the difference between an instrument’s initial carrying amount and disposal amount.
21

Details of investments as at 31 March 2017 are as follows:
Carrying
value as a
percentage
Maturity Credit Nominal Fair Amortised of net asset
date Issuer rating value value cost value
RM RM RM %
Quasi-Government Bonds
09.06.2017 Pengurusan Air
SPV Berhad NR 10,000,000 10,125,811 10,115,983 0.27
16.06.2017 Pengurusan Air
SPV Berhad NR 15,000,000 15,181,818 15,165,988 0.41
25.08.2017 Malaysia Debt
Ventures Berhad NR 3,000,000 3,017,017 3,016,081 0.08
28,000,000 28,324,646 28,298,052 0.76
Corporate bonds
03.05.2017 ADCB Finance
(Cayman)
Limited AAA 10,000,000 10,173,834 10,173,569 0.27
12.05.2017 Jimah Energy
Ventures
Sdn Bhd AA 25,000,000 25,927,748 25,924,510 0.70
29.05.2017 TNB Northern
Energy
Berhad AAA 5,000,000 5,057,265 5,056,495 0.14
28.06.2017 Mukah Power
Generation
Sdn Bhd AA 1,000,000 1,028,446 1,027,967 0.03
28.06.2017 UMW Holdings
Berhad AA 15,000,000 15,133,071 15,149,322 0.41
30.06.2017 Sports Toto
Malaysia
Sdn Bhd AA 1,900,000 1,937,194 1,935,206 0.05
03.08.2017 Public Bank
Berhad AA 45,000,000 45,355,673 45,340,573 1.22
08.08.2017 Sabah
Development
Bank Berhad AA 20,000,000 20,096,847 20,096,176 0.54
15.08.2017 OCBC Bank
(Malaysia)
Berhad AA 10,000,000 10,049,815 10,037,032 0.27
29.08.2017 Celcom Networks
Sdn Bhd AA 50,000,000 50,017,808 50,080,185 1.34
(Forward)
22

Carrying
value as a
percentage
Maturity Credit Nominal Fair Amortised of net asset
date Issuer rating value value cost value
RM RM RM %
Corporate bonds
06.09.2017 AmBank Islamic
Berhad* AA 13,000,000 13,050,146 13,035,119 0.35
18.09.2017 CIMB Islamic
Bank Berhad AA 20,000,000 20,015,774 20,026,374 0.54
20.09.2017 AmBank Islamic
Berhad* AA 20,000,000 20,051,474 20,039,540 0.54
10.11.2017 Jimah Energy
Ventures
Sdn Bhd AA 9,000,000 9,526,096 9,519,877 0.25
22.11.2017 ADCB Finance
(Cayman)
Limited AAA 131,038,000 134,197,954 134,352,136 3.60
24.11.2017 Manjung Island
Energy Berhad AAA 5,000,000 5,071,669 5,078,471 0.14
30.11.2017 CIMB Bank
Berhad AA 235,000,000 238,341,990 238,445,173 6.39
30.11.2017 RHB Bank Berhad AA 22,000,000 22,376,744 22,366,797 0.60
08.12.2017 Malaysia
Building
Society Berhad AA 35,000,000 35,404,686 35,415,055 0.95
25.01.2018 Putrajaya Holdings
Sdn Bhd AAA 8,000,000 8,153,062 8,144,726 0.22
31.01.2018 Mecuro Properties
Sdn Bhd AAA 10,000,000 10,067,541 10,075,873 0.27
12.03.2018 The Export-Import
Bank of Korea
Berhad AAA 10,000,000 10,070,525 10,058,041 0.27
11.05.2018 Jimah Energy
Ventures
Sdn Bhd AA 43,000,000 46,447,377 46,378,158 1.24
22.06.2018 Sarawak Energy
Berhad AA 15,000,000 15,298,169 15,277,056 0.41
27.07.2018 Besraya (M)
Sdn Bhd AA 7,300,000 7,378,806 7,370,564 0.20
24.08.2018 YTL Power
International
Berhad AA 70,000,000 70,434,201 70,386,261 1.89
25.09.2018 Malayan Banking
Berhad AA 30,000,000 30,637,590 30,682,466 0.82
(Forward)
23

Carrying
value as a
percentage
Maturity Credit Nominal Fair Amortised of net asset
date Issuer rating value value cost value
RM RM RM %
Corporate bonds
05.10.2018 CIMB Bank
Berhad AA 43,000,000 45,606,955 45,553,171 1.22
12.11.2018 Jimah Energy
Ventures
Sdn Bhd AA 12,000,000 13,168,838 13,138,526 0.35
30.11.2018 Hong Leong
Financial
Group Berhad AA 5,000,000 5,073,323 5,067,918 0.14
10.12.2018 Malaysia
Building
Society Berhad AA 60,000,000 60,615,625 60,683,978 1.62
27.12.2018 BGSM
Management
Sdn Bhd AA 7,100,000 7,249,094 7,218,660 0.19
25.02.2019 Media Chinese
International
Limited AA 5,000,000 5,046,599 5,039,644 0.13
29.03.2019 RHB Bank Berhad A 57,800,000 61,404,361 61,241,209 1.64
17.04.2019 OCBC Bank
(Malaysia)
Berhad AA 20,000,000 21,388,973 21,313,065 0.57
15.05.2019 RHB Islamic Bank
Berhad AA 25,000,000 25,655,486 25,605,911 0.69
30.05.2019 Etiqa Takaful
Berhad AA 40,800,000 41,457,612 41,511,975 1.11
05.06.2019 PBFIN Berhad AA 44,200,000 47,821,354 47,560,793 1.28
25.06.2019 YTL Corporation
Berhad AA 5,000,000 5,078,145 5,053,768 0.14
28.06.2019 TF Varlik
Kiralama A.S. AA 18,000,000 18,307,499 18,341,077 0.49
18.07.2019 Sabah
Development
Bank Berhad AA 60,000,000 61,008,600 60,611,013 1.63
08.08.2019 AMMB Holdings
Berhad AA 25,000,000 25,030,024 24,915,125 0.67
09.08.2019 Sarawak Hidro
Sdn Bhd AAA 30,000,000 30,104,770 30,192,345 0.81
16.08.2019 Sabah
Development
Bank Berhad AA 45,000,000 45,207,376 45,262,853 1.21
(Forward)
24

Carrying
value as a
percentage
Maturity Credit Nominal Fair Amortised of net asset
date Issuer rating value value cost value
RM RM RM %
Corporate bonds
21.08.2019 Sabah
Development
Bank Berhad AA 26,200,000 26,317,308 26,350,162 0.70
29.08.2019 Celcom Networks
Sdn Bhd AA 15,000,000 14,779,165 15,039,612 0.40
08.11.2019 GB Services
Berhad AAA 20,000,000 20,746,288 20,780,867 0.56
25.11.2019 Manjung Island
Energy Berhad AAA 10,000,000 10,147,158 10,121,955 0.27
17.12.2019 RHB Bank
Berhad A 27,350,000 29,145,745 29,072,884 0.78
27.12.2019 BGSM
Management
Sdn Bhd AA 57,500,000 61,429,968 60,691,969 1.65
03.04.2020 CIMB Group
Holdings
Berhad AA 5,000,000 5,361,486 5,348,883 0.14
09.04.2020 Danga Capital
Berhad AAA 20,000,000 20,348,658 20,388,658 0.54
29.04.2020 RHB Bank Berhad AA 4,700,000 4,937,306 4,924,460 0.13
06.07.2020 Krung Thai Bank
Public
Company
Limited AA 10,000,000 10,290,867 10,302,453 0.27
03.12.2020 Rantau Abang
Capital Berhad AAA 40,000,000 40,700,457 40,563,414 1.09
21.12.2020 AmBank Islamic
Berhad* AA 20,000,000 20,618,594 20,295,994 0.55
23.06.2021 Sarawak Energy
Berhad AA 5,000,000 5,216,492 5,183,453 0.14
08.10.2021 Kesas Sdn Bhd AA 5,000,000 5,135,649 5,110,921 0.14
1,634,888,000 1,675,701,280 1,673,959,438 44.90
25

Carrying
value as a
percentage
Maturity Credit Nominal Fair Amortised of net asset
date Issuer rating value value cost value
RM RM RM %
Malaysian Government Securities
07.02.2018 Government
of Malaysia NR 10,000,000 10,143,577 10,081,561 0.27
Total investments 1,672,888,000 1,714,169,503 1,712,339,051 45.93
Excess of fair value over cost 1,830,452
* A licensed financial institution related to the Manager.
The weighted average effective yield on unquoted investments are as follows:
2017 2016
% %
Quasi-Government Bonds 3.53 -
Corporate bonds 4.42 4.31
Malaysian Government Securities 3.26 -
Less than 1 year to
1 year 5 years
RM RM
At nominal value:
Quasi-Government Bonds 28,000,000 -
Corporate bonds 700,938,000 933,950,000
Malaysian Government Securities 10,000,000 -
At nominal value:
Corporate bonds 711,900,000 1,188,288,000
Effective yield
2017
2016
Analyses of the remaining maturity of unquoted investments as at 31 March 2017 and 31 March 2016 are as
follows:
26

5. DEPOSITS WITH FINANCIAL INSTITUTIONS
2017 2016
RM RM
At nominal value:
Fixed deposits with a licensed bank 500,000,000 100,000,000
Short-term deposits with licensed banks/Islamic banks/
investment banks (tenure 7 days or less) 414,000,000 370,000,000
Short-term deposits with licensed banks/Islamic banks/
investment banks (more than 7 days) 1,100,000,000 1,436,000,000
2,014,000,000 1,906,000,000
At carrying value:
Fixed deposits with a licensed bank 506,295,891 100,858,082
Short-term deposits with licensed banks/Islamic banks/
investment banks (tenure 7 days or less) 414,057,496 370,046,397
Short-term deposits with licensed banks/Islamic banks/
investment banks (more than 7 days) 1,102,449,835 1,439,831,836
2,022,803,222 1,910,736,315
Details of deposits with financial institutions as at 31 March 2017 are as follows:
Carrying
value as a
percentage
Maturity Nominal Carrying Purchase of net asset
date value value cost value
RM RM RM %
Fixed deposit with a licensed bank
05.04.2017 RHB Bank 50,000,000 50,441,781 50,000,000 1.35
25.04.2017 Hong Leong
Bank Berhad 50,000,000 50,352,603 50,000,000 1.35
26.04.2017 AmBank Berhad* 100,000,000 100,694,521 100,000,000 2.70
12.07.2017 Sumitomo Mitsui
Banking
Corporation
Malaysia Berhad 150,000,000 153,718,356 150,000,000 4.12
26.07.2017 AmBank Berhad* 100,000,000 100,703,425 100,000,000 2.70
450,000,000 455,910,686 450,000,000 12.22
Fixed deposit with a licensed investment bank
17.04.2017
Bank Berhad 50,000,000 50,385,205 50,000,000 1.35
Total fixed deposit 500,000,000 506,295,891 500,000,000 13.57
Affin Hwang Investment
Bank
27

Carrying
value as a
percentage
Maturity Nominal Carrying Purchase of net asset
date value value cost value
RM RM RM %
Short-term deposits with licensed banks (tenure: 7 days or less)
03.04.2017 AmBank Berhad* 84,000,000 84,007,825 84,000,000 2.25
03.04.2017 Malayan Banking
Berhad 100,000,000 100,009,178 100,000,000 2.68
03.04.2017 National Bank Of
Abu Dhabi
Malaysia Berhad 60,000,000 60,011,178 60,000,000 1.61
03.04.2017 Public Bank Berhad 100,000,000 100,009,315 100,000,000 2.68
344,000,000 344,037,496 344,000,000 9.22
Short-term deposit with a licensed investment bank (tenure: 7 days or less)
04.04.2017 Hong Leong Investment
Bank 30,000,000 30,012,000 30,000,000 0.81
06.04.2017 Kaf Investment Bank
Berhad 40,000,000 40,008,000 40,000,000 1.07
70,000,000 70,020,000 70,000,000 1.88
Total short-term deposits
(tenure: 7 days or less) 414,000,000 414,057,496 414,000,000 11.10
Short-term deposits with licensed banks (tenure: more than 7 days)
03.04.2017 United Overseas Bank
(Malaysia) Bhd. 50,000,000 50,143,014 50,000,000 1.34
04.04.2017 Hong Leong Bank
Berhad 50,000,000 50,055,000 50,000,000 1.34
05.04.2017 RHB Bank Berhad 80,000,000 80,134,137 80,000,000 2.15
17.04.2017 United Overseas Bank
(Malaysia) Bhd. 50,000,000 50,208,219 50,000,000 1.35
20.04.2017 United Overseas Bank
(Malaysia) Bhd. 100,000,000 100,416,438 100,000,000 2.69
21.04.2017 United Overseas Bank
(Malaysia) Bhd. 50,000,000 50,203,014 50,000,000 1.34
28.04.2017 AmBank (M)
Berhad* 100,000,000 100,010,137 100,000,000 2.68
31.05.2017 AmBank (M)
Berhad* 100,000,000 100,010,411 100,000,000 2.68
580,000,000 581,180,370 580,000,000 15.57
Bank
28

Carrying
value as a
percentage
Maturity Nominal Carrying Purchase of net asset
date value value cost value
RM RM RM %
Short-term deposits with licensed investment banks (tenure: more than 7 days)
03.04.2017
Bank Berhad 100,000,000 100,177,534 100,000,000 2.69
03.04.2017
Berhad 40,000,000 40,086,795 40,000,000 1.07
06.04.2017
Bank Berhad 50,000,000 50,126,438 50,000,000 1.34
07.04.2017
Berhad 50,000,000 50,015,205 50,000,000 1.34
17.04.2017
Bank Berhad 30,000,000 30,044,384 30,000,000 0.81
24.04.2017
Bank Berhad 50,000,000 50,050,000 50,000,000 1.34
320,000,000 320,500,356 320,000,000 8.59
Short-term deposits with licensed Islamic banks (tenure: more than 7 days)
03.04.2017 Hong Leong Islamic
Bank Berhad 50,000,000 50,088,767 50,000,000 1.34
17.05.2017 Bank Islam Malaysia
Berhad 150,000,000 150,680,342 150,000,000 4.04
200,000,000 200,769,109 200,000,000 5.38
Total short-term deposits
(tenure: more than 7 days) 1,100,000,000 1,102,449,835 1,100,000,000 29.54
Total deposits with financial
institutions 2,014,000,000 2,022,803,222 2,014,000,000 54.21
* A licensed bank related to the Manager.
Public Investment Bank
Affin Hwang Investment
Affin Hwang Investment
Bank
Affin Hwang Investment
KAF Investment Bank
Affin Hwang Investment
The weighted average effective interest rate and average remaining maturity of short-term deposits are as
follows:
29

2017 2016 2017 2016
% % Days Days
Fixed deposits with a licensed bank 3.89 4.35 49 20
Short-term deposits with licensed
banks/ investment banks/ Islamic
banks (tenure: 7 days or less) 3.43 3.48 4 4
Short-term deposits with licensed
banks/ investment banks/ Islamic
banks (tenure: more than 7 days) 3.70 3.97 17 16
6. AMOUNT DUE TO MANAGER
7. AMOUNT DUE TO TRUSTEE
8. OTHER EXPENSES
9. TOTAL EQUITY
Total equity is represented by:
2017 2016
Note RM RM
Unitholders’ capital (a) 3,679,770,549 3,893,537,176
Retained earnings
− Realised loss (b) (152) (5,295)
Available-for-sale reserve (c) 1,830,452 1,424,586
Capital reserve 11 50,066,005 47,702,716
3,731,666,854 3,942,659,183
Weighted average effective
Manager’s fee was charged at a rate of 0.75% (2016: 0.75%) per annum on the net asset value of the Fund,
calculated on a daily basis.
The normal credit period in the previous and current financial years for Manager’s fee payable is one month.
Included in other expenses is Goods and Services Tax incurred by the Fund during the financial year amounting
to RM1,853,641 (2015: RM2,014,409).
Trustee’s fee was charged at a rate of 0.05% (2016: 0.05%) per annum on the net asset value of the Fund,
calculated on a daily basis.
The normal credit period in the previous and current financial years for Trustee’s fee payable is one month.
interest rate
Remaining
maturity
30

(a) UNITHOLDERS’ CAPITAL/UNITS IN CIRCULATION
Number of Number of
units RM units RM
At beginning of the
financial year 3,893,537,176 3,893,537,176 4,266,090,477 4,266,090,477
Creation during the
financial year 4,272,531,144 4,272,531,144 6,079,351,082 6,079,351,082
Distributions reinvested 117,071,096 117,071,096 125,624,005 125,624,005
Cancellation during the
financial year (4,603,368,867) (4,603,368,867) (6,577,528,388) (6,577,528,388)
At end of the financial
year 3,679,770,549 3,679,770,549 3,893,537,176 3,893,537,176
(b) REALISED – DISTRIBUTABLE
2017 2016
RM RM
At beginning of the financial year (5,295) 1,830
Total comprehensive income for the financial year 121,816,203 131,547,352
Transfer to capital reserve (Note 11) (2,363,289) (2,354,940)
Distributions out of realised reserve (Note 14) (119,447,771) (129,199,537)
Net increase/(decrease) in realised reserve for the financial year 5,143 (7,125)
At end of the financial year (152) (5,295)
(c) AVAILABLE-FOR-SALE RESERVE/(DEFICIT)
2017 2016
RM RM
At beginning of the financial year 1,424,586 (840,650)
Fair value revaluation gain 794,582 2,376,322
Reclassification of gain on financial investments
available-for-sale to profit or loss, net (388,716) (111,086)
At end of the financial year 1,830,452 1,424,586
10.NET ASSET VALUE ATTRIBUTABLE TO UNITHOLDERS
In line with the adoption of MFRS 139, unquoted available-for-sale investments have been valued at the
indicative prices at the close of business. However, the valuation, creation and cancellation of units will be
based on RM1.00 per unit as stated in the trust deed.
2017 2016
31

11.CAPITAL RESERVE
2017 2016
RM RM
At beginning of the financial year 47,702,716 45,347,776
Transfer from realised income [Note 9(b)] 2,363,289 2,354,940
At end of the financial year 50,066,005 47,702,716
12.UNITS HELD BY RELATED PARTIES
The related parties of and their relationship with the Fund are as follows:
Related parties Relationship
AmFunds Management Berhad The Manager
AmInvestment Bank Berhad
AMMB Holdings Berhad
Subsidiaries and associates of AMMB Subsidiaries and associate companies of the ultimate
holding
Number of Number of
units RM units RM
Subsidiaries and associates
of AMMB * 536,624,288 536,624,288 472,946,134 472,946,134
*
13.INCOME TAX
2017 2016
RM RM
Net income before tax 121,816,203 131,547,352
(Forward)
Ultimate holding company of the Manager
Holdings company of the Manager
A reconciliation of income tax expense applicable to net income before tax at the statutory income tax rate to
income tax expense at the effective income tax rate of the Fund is as follows:
The parties related to the Manager are the legal and beneficial owners of the units. The Manager did not
hold any units in the Fund as at 31 March 2017 and 31 March 2016.
Pursuant to Schedule 6 of the Income Tax Act, 1967, local interest income derived by the Fund is exempted
from tax.
2017 2016
Income tax payable is calculated on investment income less deduction for permitted expenses as provided for
under Section 63B of the Income Tax Act, 1967.
32

2017 2016
RM RM
Taxation at Malaysian statutory rate of 24% 29,236,000 31,571,400
Tax effects of:
Income not subject to tax (37,084,000) (40,071,100)
Restriction on tax deductible expenses for unit trust fund 6,260,800 6,797,600
Non-permitted expenses for tax purposes 908,900 988,800
Permitted expenses not used and not available for
future financial years 678,300 713,300
Tax expense for the financial year - -
14.DISTRIBUTIONS
2017 2016
RM RM
On redemption of units 1,189,990 857,848
Income entitlement distributed on:
30 April 2016/2015 10,116,511 10,576,521
31 May 2016/2015 10,271,306 10,538,253
30 June 2016/2015 9,842,588 10,084,519
31 July 2016/2015 10,257,374 10,036,755
31 August 2016/2015 10,133,826 10,669,071
30 September 2016/2015 9,801,139 10,344,649
31 October 2016/2015 10,010,891 10,946,304
30 November 2016/2015 9,475,506 11,033,262
31 December 2016/2015 9,639,365 11,924,262
31 January 2017/2016 9,584,177 11,396,833
29 February 2017/28 February 2016 9,145,699 10,131,122
31 March 2017/2016 9,979,399 10,660,138
119,447,771 129,199,537
Distributions to unitholders are from the following sources:
2017 2016
RM RM
Interest income 152,219,915 164,790,035
Less: Expenses (32,772,144) (35,590,498)
Total amount of distributions 119,447,771 129,199,537
Distributions made out of:
Realised reserve [Note 9(b)] 119,447,771 129,199,537
(Forward)
33

2017 2016
RM RM
Comprising:
Distributions reinvested 106,632,889 114,398,748
Distributions to be reinvested 9,845,605 10,438,207
Cash distributions 2,969,277 4,362,582
119,447,771 129,199,537
15.MANAGEMENT EXPENSE RATIO (“MER”)
2017 2016
% p.a. % p.a.
Manager’s fee 0.75 0.75
Trustee’s fee 0.05 0.05
Fund’s other expenses 0.05 0.05
Total MER 0.85 0.85
16.PORTFOLIO TURNOVER RATIO (“PTR”)
17.SEGMENTAL REPORTING
18.TRANSACTIONS WITH THE FINANCIAL INSTITUTIONS
The Fund’s MER is as follows:
The PTR of the Fund, which is the ratio of average total acquisitions and disposals of investments to the
average net asset value of the Fund calculated on a daily basis, is 0.21 times (2016: 0.32 times).
In accordance with the objective of the Fund, substantially all of the Fund’s investments are made in the form
of fixed income securities in Malaysia. The Manager is of the opinion that the risk and rewards from these
investments are not individually or segmentally distinct and hence the Fund does not have a separately
identifiable business or geographical segments.
The gross and net distributions of the Fund are of similar amounts as the Fund is not subject to tax. The above
distributions have no implication on unit prices as the net asset value per unit of the Fund was maintained at
RM1.00 throughout the financial year.
The MER of the Fund is the ratio of the sum of annualised fees and expenses incurred by the Fund to the
average net asset value of the Fund calculated on a daily basis.
Details of transactions with financial institutions for the financial year ended 31 March 2017 are as follows:
34

Financial institutions
RM %
Malayan Banking Berhad 26,209,223,570 28.68
RHB Bank Berhad 17,460,987,000 19.10
CIMB Bank Berhad 14,601,390,117 15.98
Public Bank Berhad 12,088,000,000 13.23
Ambank (M) Berhad* 6,676,145,644 7.30
KAF Investment Bank Berhad 2,710,000,000 2.97
Hong Leong Bank Berhad 2,305,880,975 2.52
Hong Leong Investment Bank Berhad 2,095,924,743 2.29
Kenanga Investment Bank Berhad 1,620,000,000 1.77
Affin Hwang Investment Bank Berhad 1,330,000,000 1.46
Other financial institutions# 4,298,117,769 4.70
Total 91,395,669,818 100.00
*
#
19. FINANCIAL INSTRUMENTS
(a) Classification of financial instruments
Loans and Financial
Available- receivables liabilities at
for-sale at amortised amortised
investments cost cost Total
RM RM RM RM
2017
Assets
Investments 1,714,169,503 - - 1,714,169,503
Deposits with financial
institutions - 2,022,803,222 - 2,022,803,222
(Forward)
The above transactions were in respect of fixed income instruments and money market deposits.
Transactions in these investments do not involve any commission or brokerage.
The significant accounting policies in Note 3 describe how the classes of financial instruments are
measured, and how income and expenses, including fair value gains and losses, are recognised. The
following table analyses the financial assets and liabilities of the Fund in the statement of financial
position by the class of financial instrument to which they are assigned, and therefore by the
measurement basis.
A financial institution related to the Manager. The Manager and the Trustee are of the opinion that the
above transactions have been entered in the normal course of business and have been established under
terms that are no less favourable than those arranged with independent third parties.
Transaction value
Included in the other brokers and financial institutions, there were transactions amounting to
RM50,000,000 with a related party, AmIslamic Bank Berhad. The Manager and the Trustee are of the
opinion that the above transactions have been entered in the normal course of business and have been
established under terms that are no less favourable than those arranged with independent third parties.
35

Loans and Financial
Available- receivables liabilities at
for-sale at amortised amortised
investments cost cost Total
RM RM RM RM
2017AssetsCash at banks - 7,829,193 - 7,829,193
Total financial assets 1,714,169,503 2,030,632,415 - 3,744,801,918
Liabilities
Amount due to Manager - - 2,778,286 2,778,286
Amount due to Trustee - - 162,372 162,372
Distributions to be
reinvested - - 9,979,399 9,979,399
Sundry payables and
accrued expenses - - 215,007 215,007
Total financial liabilities - - 13,135,064 13,135,064
2016
Assets
Investments 1,955,623,906 - - 1,955,623,906
Deposits with financial
institutions - 1,910,736,315 - 1,910,736,315
Cash at banks - 89,821,466 - 89,821,466
Total financial assets 1,955,623,906 2,000,557,781 - 3,956,181,687
Liabilities
Amount due to Manager - - 2,516,441 2,516,441
Amount due to Trustee - - 167,763 167,763
Distributions to be
reinvested - - 10,660,138 10,660,138
Sundry payables and accrued
expenses - - 178,162 178,162
Total financial liabilities - - 13,522,504 13,522,504
Income, expense, gains
and losses
2017 2016
RM RM
Net gain from disposals of investments
- Available-for-sale investments 388,716 111,086
Income, of which derived from:
- Interest income from available-for-sale investments 79,109,967 90,422,042
- Interest income from loans and receivables 75,017,681 76,429,940
36

(b) Financial instruments that are carried at fair value
Level 1: quoted (unadjusted) prices in active markets for identical assets or liabilities;
Level 2:
Level 3:
Level 1 Level 2 Level 3 Total
RM RM RM RM
2017
Investments - 1,714,169,503 - 1,714,169,503
2016
Investments - 1,955,623,906 - 1,955,623,906
(c)
Deposits with financial institutions
Cash at banks
Amount due to Manager
Amount due to Trustee
Distributions payable and to be reinvested
Sundry payables and accrued expenses
20. RISK MANAGEMENT POLICIES
The Fund uses the following hierarchy for determining and disclosing the fair value of financial
instruments by valuation technique:
other techniques for which all inputs which have a significant effect on the recorded fair
values are observable; either directly or indirectly; or
techniques which use inputs which have a significant effect on the recorded fair value that are
not based on observable market data.
The following table shows an analysis of financial instruments recorded at fair value by the level of the
fair value hierarchy:
The Fund’s financial assets and liabilities are carried at fair value.
Financial instruments that are not carried at fair value and whose carrying amounts are
reasonable approximation of fair value
The following are classes of financial instruments that are not carried at fair value and whose carrying
amounts are reasonable approximation of fair value due to their short period to maturity or short credit
period:
There were no other financial instruments which are not carried at fair values and whose carrying
amounts are not reasonable approximation of their respective fair values.
The Fund is exposed to a variety of risks that include market risk, credit risk, liquidity risk, single issuer
risk, regulatory risk, management risk,non-compliance risk and unstable NAV risk.
37

Market risk
(i)
Parallel shift in
yield curve by: 2017 2016
RM RM
+100 bps (24,723,729) (32,395,947)
-100 bps 25,306,618 33,497,512
Credit risk
(i) Credit quality of financial assets
As a % of As a % of
debt net asset
Credit rating RM securities value
2017
AAA 304,839,181 17.78 8.18
AA 1,280,311,993 74.69 34.30
A 90,550,106 5.28 2.42
(Forward)
Interest rate risk
Interest rate risk will affect the value of the Fund’s investments, given the interest rate movements,
which are influenced by regional and local economic developments as well as political developments.
Domestic interest rates on deposits and placements with licensed financial institutions are determined
based on prevailing market rates.
The result below summarised the interest rates sensitivity of the Fund’s NAV, or theoretical value
(applicable to money market deposit) due to the parallel movement assumption of the yield curve by
+100bps and -100bps respectively:
Risk management is carried out by closely monitoring, measuring and mitigating the above said risks,
careful selection of investments coupled with stringent compliance to investment restrictions as stipulated
by the Capital Markets and Services Act 2007, Securities Commission’s Guidelines on Unit Trust Funds
and the Deed as the backbone of risk management of the Fund.
Credit risk is the risk that the counterparty to a financial instrument will cause a financial loss to the Fund
by failing to discharge an obligation. The Fund invests up to 100% of its net asset value in money market
instruments, local fixed income securities and Malaysian Government Securities. As such the Fund would
be exposed to the risk of bond issuers and financial institutions defaulting on its repayment obligations
which in turn would affect the net asset value of the Fund.
The following table analyses the Fund’s portfolio of debt securities by rating category as at 31 March
2017 and 31 March 2016:
Market risk, in general, is the risk that the value of a portfolio would decrease due to changes in market
risk factors such as equity prices, foreign exchange rates, interest rates (yield curve) and commodity prices.
Sensitivity of the Fund’s NAV, or theoretical value
38

As a % of As a % of
debt net asset
Credit rating RM securities value
2017
NR* 38,468,223 2.25 1.03
1,714,169,503 100.00 45.93
2016
AAA 430,334,397 22.01 10.95
AA 1,384,415,781 70.79 35.09
A 137,845,936 7.05 3.48
NR* 3,027,792 0.15 0.08
1,955,623,906 100.00 49.60
* Non-rated
As a % ofAs a % of net asset
Credit rating RM deposits value
2017
P1/MARC-1 2,022,803,222 100.00 54.21
2016
P1/MARC-1 1,910,736,315 100.00 48.46
Cash at banks are held for liquidity purposes and are not exposed to significant credit risk.
(ii) Credit risk concentration
As a % of As a % of
debt net asset
Sector RM securities value
2017
Asset backed securities 10,067,541 0.59 0.27
Diversified holdings 149,939,393 8.75 4.02
Financial services 1,168,088,563 68.14 31.29
Infrastructure and utilities 340,047,286 19.84 9.11
Property and real estate 8,153,062 0.47 0.22
Public Finance 10,143,577 0.59 0.27
Trading and services 27,730,081 1.62 0.75
1,714,169,503 100.00 45.93
Concentration of risk is monitored and managed based on sectorial distribution. The table below
analyses the Fund’s portfolio of debt securities by sectorial distribution as at 31 March 2017 and 31
March 2016:
For deposits with financial institutions, the Fund only makes placements with financial institutions with
sound rating. The following table presents the Fund᾽s portfolio of deposits by rating category as at 31
March 2017 and 31 March 2016:
39

As a % of As a % of
debt net asset
Sector RM securities value
2016
Asset backed securities 10,073,093 0.51 0.26
Construction and engineering 7,577,036 0.39 0.19
Diversified holdings 233,805,187 11.95 5.94
Financial services 1,277,531,052 65.33 32.37
Infrastructure and utilities 366,613,939 18.75 9.32
Mining and petroleum 5,088,445 0.26 0.13
Plantation and agriculture 13,242,370 0.68 0.33
Property and real estate 16,327,200 0.83 0.42
Trading and services 20,270,487 1.04 0.51
Transportation 5,095,097 0.26 0.13
1,955,623,906 100.00 49.60
There is no geographical risk as the Fund invests only in investments in Malaysia.
Liquidity risk
Objectives and assumptions
(i) For bonds
(a) For zero-coupon bonds, the nominal amount will be returned at maturity date.
(b)
Cash received from bonds are calculated as follows:
$ = cash received
R = coupon rate p.a.
F = coupon frequency
For zero coupon bonds, F = 0
At maturity: $ = Nominal
For F > 0
Before maturity: coupon payment, $ = Nominal * (R/F)
At maturity: maturity payment, $ = Nominal + (Nominal * R/F)
For each security in the Fund, the cash flows are projected according to its asset class. Each asset class,
if any, follows the calculation method as below:
Liquidity risk is defined as the risk of being unable to raise funds or borrowings to meet payment
obligations as they fall due. The Fund maintains sufficient level of liquid assets, after consultation with the
Trustee, to meet anticipated payments and cancellation of units by unitholders. Liquid assets comprise of
deposits with licensed financial institutions and other instruments, which are capable of being converted
into cash within 5 to 7 days. The Fund’s policy is to always maintain a prudent level of liquid assets so as
to reduce liquidity risk.
For coupon-bearing bonds, the coupons could be paid on annual, bi-annual or quarterly
basis.
40

(ii) For money market instruments and deposits
$ = cash received
R = interest rate p.a.
F = time to maturity (days)
At maturity: $ = Nominal + (Nominal*R*F/365)
0 – 1 1 – 2 2 – 3 3 – 4 4 – 5
year years years years years
RM RM RM RM RM
2017
Financial assets
Investments 819,062,876 402,648,258 490,473,966 103,929,932 10,358,349
Deposits
with financial
institutions 2,028,607,693 - - - -
Cash at banks 7,829,193 - - - -
Total assets 2,855,499,762 402,648,258 490,473,966 103,929,932 10,358,349
Financial liabilities
Other
liabilities 3,289,459 - - - -
2016
Financial assets
Investments 802,962,683 477,458,558 336,758,635 401,857,285 93,246,600
Deposits
with financial
institutions 1,913,197,288 - - - -
Cash at banks 89,821,466 - - - -
Total assets 2,805,981,437 477,458,558 336,758,635 401,857,285 93,246,600
Financial liabilities
Other
liabilities 3,084,297 - - - -
Single issuer risk
Internal policy restricts the Fund from investing in securities issued by any issuer of not more than a
certain percentage of its net asset value. Under such restriction, the risk exposure to the securities of any
single issuer is diversified and managed by issuer is managed based on internal/external ratings.
Contractual cash flows (undiscounted)
The following table presents the undiscounted contractual cash flows from different asset and liability
classes in the Fund:
The nominal amount and interest will be paid at maturity date. Cash received are calculated as
follows:
41

Regulatory risk
Management risk
Non-compliance risk
Unstable NAV risk
21. CAPITAL MANAGEMENT
No changes were made in the objective, policies or processes during the financial years ended 31 March
2017 and 31 March 2016.
This is the risk of the Manager, the Trustee or the Fund not complying with internal policies, the Deed of
the Fund, securities law or guidelines issued by the regulators. Non-compliance risk may adversely affect
the investments of the Fund when the Fund is forced to rectify the non-compliance.
Poor management of the Fund may cause considerable losses to the Fund that in turn may affect the net
asset value of the Fund.
The primary objective of the Fund’s capital management is to ensure that it maximises unitholders’ value
by expanding its fund size to benefit from economies of scale and achieving growth in net asset value from
the performance of its investments.
The Fund manages its capital structure and makes adjustments to it, in light of changes in economic
conditions. To maintain or adjust the capital structure, the Fund may issue new or bonus units, make
distribution payment, or return capital to unitholders by way of redemption of units.
Any changes in national policies and regulations may have effects on the capital market and the net asset
value of the Fund.
Unstable NAV risk means that the actual NAV per unit of the Fund may fluctuate with the market and may
not be maintained at or above its initial price (RM1.00) at all times.
42

AmIncome
STATEMENT BY THE MANAGER
Kuala Lumpur, Malaysia
8 May 2017
I, DATIN MAZNAH MAHBOB, for and on behalf of the Manager, AmFunds Management
Berhad, for AmIncome do hereby state that in the opinion of the Manager, the accompanying
statement of financial position, statement of comprehensive income, statement of changes in equity,
statement of cash flows and the accompanying notes are drawn up in accordance with Malaysian
Financial Reporting Standards and International Financial Reporting Standards so as to give a true
and fair view of the financial position of the Fund as at 31 March 2017 and the comprehensive
income, the changes in equity and cash flows of the Fund for the financial year then ended.
DATIN MAZNAH MAHBOB
For and on behalf of the Manager
AmFunds Management Berhad
43

44
TRUSTEE’S REPORT

45
DIRECTORY
Head Office 9th Floor, Bangunan AmBank Group
55, Jalan Raja Chulan, 50200 Kuala Lumpur
Tel: (03) 2032 2888 Facsimile: (03) 2031 5210
Email: [email protected]
Postal Address AmFunds Management Berhad
P.O Box 13611, 50816 Kuala Lumpur
Related Institutional Unit Trust Agent
AmBank (M) Berhad Head Office
Company No. 8515-D 31st Floor, Menara AmBank
No. 8 Jalan Yap Kwan Seng, 50450 Kuala Lumpur
AmInvestment Bank Berhad Head Office
Company No. 23742-V 22nd Floor, Bangunan AmBank Group
55 Jalan Raja Chulan, 50200 Kuala Lumpur
For more details on the list of IUTAs, please contact the Manager.
For enquiries about this or any of the other Funds offered by AmFunds Management Berhad
please call 2032 2888 between 8.45 a.m. to 5.45 p.m. (Monday - Thursday),
Friday (8.45 a.m. to 5.00 p.m.)

Semi-Annual Report28 February 2015
03 2132 2888 | aminvest.com | [email protected]
AmFunds Management Berhad (155432-A)