annual report for 2011 on the uk pah monitoring and analysis network
TRANSCRIPT

NPL REPORT AS 71 Annual Report for 2011 on the UK PAH Monitoring and Analysis Network Report to the Department of Environment, Food and Rural Affairs; the Department of Environment Northern Ireland; the Welsh Government and the Scottish Government Andrew S. Brown Dimitris Sarantaridis David M. Butterfield Richard J. C. Brown Kevin J. Whiteside Paul Hughey Sharon L. Goddard Delwar Hussain Melanie Williams NOT RESTRICTED DECEMBER 2012


NPL Report AS 71
Annual Report for 2011 on the UK PAH Monitoring and Analysis Network
Report to the Department of Environment, Food and Rural Affairs; the Department of Environment Northern Ireland; the Welsh Government
and the Scottish Government
Andrew S. Brown, Dimitris Sarantaridis, David M. Butterfield,
Richard J. C. Brown, Kevin J. Whiteside, Paul Hughey, Sharon L. Goddard, Delwar Hussain and Melanie Williams
Analytical Science Division

NPL Report AS 71
© Queen’s Printer and Controller of HMSO 2012
ISSN 1754-2928
National Physical Laboratory Hampton Road, Teddington, Middlesex, TW11 0LW
Extracts from this report may be reproduced provided the source is acknowledged and the extract is not taken out of context.
Approved on behalf of NPLML by
Mr Alan Brewin, Head of Analytical Science Division.

NPL Report AS 71
Annual Report for 2011 on the UK PAH Monitoring and Analysis Network EXECUTIVE SUMMARY This annual report for 2011 for the UK PAH Monitoring and Analysis Network was prepared by the National Physical Laboratory (NPL) for the Department of Environment, Food and Rural Affairs; the Department of Environment Northern Ireland; the Welsh Government and the Scottish Government. The report contains:
• The measured annual (and where applicable, monthly or quarterly) mean concentrations of
benzo[a]pyrene (B[a]P) at each Network station, and at each TOMPs Network station. • Selected results from other PAHs at selected Network stations. • A comparison of the B[a]P annual mean concentrations against the target value and
assessment thresholds in the EC Fourth Daughter Directive. • A comparison of the performance of Network operation against the relevant data quality
objectives in the Fourth Daughter Directive. • An overview of the PAH Network, including a summary of Network operation, a description
of notable station maintenance issues and changes to the Network during 2011, and data capture statistics for 2011.
• A review of the sources of PAHs in the UK. • A discussion of PAH concentration trends across the Network, and the relationship between
PAH emissions and measured concentrations. • A summary of scientific research, international representation and other activities related to
the Network. In summary, during 2011:
• The EC target value for B[a]P (an annual mean concentration of 1 ng.m-3) was exceeded at three of the 31 stations where PM10 particulate samples were taken.
• The EC upper assessment threshold for B[a]P (an annual mean concentration of 0.6 ng.m-3)
was exceeded at a total of seven of these 31 stations. • The EC upper lower threshold for B[a]P (an annual mean concentration of 0.4 ng.m-3) was
exceeded at the same seven of these 31 stations. • The annual mean B[a]P concentrations in 2011 show a slight decrease from those measured
in 2010, which is likely to be an result of decreased residential and commercial heating activity due to the higher annual average temperature in 2011.

NPL Report AS 71

NPL Report AS 71
TABLE OF CONTENTS
EXECUTIVE SUMMARY TABLE OF CONTENTS
1 INTRODUCTION ......................................................................................... 1 2 POLYCYCLIC AROMATIC HYDROCARBONS & AIR QUALITY POLICY .............. 2 2.1 POLYCYCLIC AROMATIC HYDROCARBONS ................................................................... 2 2.2 AIR QUALITY POLICY ................................................................................................... 3 2.3 SOURCES OF PAHs IN THE UK ...................................................................................... 4 3 THE NETWORK .......................................................................................... 6 3.1 NETWORK OBJECTIVE ................................................................................................. 6 3.2 NETWORK OVERVIEW ................................................................................................. 6
3.2.1 Stations ...............................................................................................................................6 3.2.2 Samples ...............................................................................................................................7 3.2.3 Sampling equipment ...........................................................................................................8 3.2.4 Sampling quality control measures ................................................................................. 10 3.2.5 Relationship with TOMPs Network samples ................................................................... 11
3.3 NETWORK ACTIVITY DURING 2011 ............................................................................ 11 3.3.1 Station infrastructure and Network re-organisation ....................................................... 11 3.3.2 Station audits and calibrations ........................................................................................ 12 3.3.3 Equipment servicing, breakdowns, and station maintenance ........................................ 12
4 DATA CAPTURE ........................................................................................ 13 4.1 INTRODUCTION & METHODOLOGY ........................................................................... 13 4.2 DATA CAPTURE VALUES ............................................................................................ 13 5 ANALYSIS ................................................................................................. 16 5.1 PAHs MEASURED ...................................................................................................... 16 5.2 ANALYTICAL TECHNIQUES ......................................................................................... 16 5.3 ANALYTICAL QUALITY ASSURANCE & QUALITY CONTROL MEASURES ....................... 17 6 RESULTS & DISCUSSION ........................................................................... 18 6.1 ‘A’ (PARTICULATE) & ‘B’ (PARTICULATE + VAPOUR) SAMPLES ................................... 18
6.1.1 B[a]P: Annual concentrations and comparison against target values and air quality objectives ......................................................................................................................... 18
6.1.2 B[a]P: Monthly concentrations ........................................................................................ 20 6.1.3 Other PAHs: Monthly concentrations ............................................................................. 23 6.1.4 Comparison between ‘A’ and ‘B’ stations ....................................................................... 27 6.1.5 Events during 2011 resulting in unusual measured PAH concentrations ....................... 27

NPL Report AS 71
6.2 DEPOSITION (‘C’) SAMPLES ....................................................................................... 30 6.3 ANDERSEN SAMPLES FROM TOMPS NETWORK ........................................................ 30 7 TRENDS IN MEASURED DATA ................................................................... 32 7.1 UK TRENDS IN B[a]P CONCENTRATION DATA (2007-2010) ........................................ 32 7.2 RELATIONSHIP BETWEEN PAH EMISSIONS AND MEASURED CONCENTRATIONS ....... 33 7.3 ASSESSMENT OF CORRELATIONS BETWEEN PAHs ..................................................... 34 8 OTHER ACTIVITIES RELATED TO THE NETWORK ........................................ 40 8.1 STANDARDISATION & OTHER INTERNATIONAL ACTIVITIES ....................................... 40 8.2 PAPERS AND PRESENTATIONS .................................................................................. 40 8.3 PAHs IN NORTHERN IRELAND ................................................................................... 41
ANNEX A: NETWORK STATION LOCATIONS……………………………………………… 42 ANNEX B: SUMMARY OF EQUIPMENT SERVICING, BREAKDOWN AND
MAINTENANCE ISSUES DURING 2011……………………………………… 43 ANNEX C: MONTHLY & ANNUAL MEAN B[a]P CONCENTRATIONS – ‘A’ &
‘B’ STATIONS………………………………………………………………………….. 44 ANNEX D: FOUR-WEEKLY & ANNUAL MEAN B[a]P CONCENTRATIONS – ‘C’
(DEPOSITION) STATIONS…………………………………………………………. 45 ANNEX E: QUARTERLY & ANNUAL MEAN B[a]P CONCENTRATIONS – TOMPs NETWORK SAMPLES…………………………………………………... 46 REFERENCES……………………………………………………………………………..……………….. 47

NPL Report AS 71
1
1 INTRODUCTION This report was prepared by the National Physical Laboratory (NPL) as part of the 2010-2014 UK PAH Monitoring and Analysis Network (‘the Network’ or ‘the PAH Network’) contract number AQ0636 with the Department of Environment, Food and Rural Affairs; the Department of Environment Northern Ireland; the Welsh Government and the Scottish Government. NPL assumed full operation of the Network in October 2010 following a one month handover period from the previous contractor. This annual report therefore presents and discusses data from NPL’s first full year as operator of the Network. This annual report contains:
• An introduction to polycyclic aromatic hydrocarbons (PAHs) and air quality policy, including a
review of the sources of PAHs in the UK. • An overview of the Network, including a summary of Network operation, and a description of
notable station maintenance issues and changes to the Network during 2011. • Network data capture statistics for 2011. • A comparison of the performance of Network operation against the relevant data quality
objectives in the EC Fourth Daughter Directive. • Measured annual and monthly mean concentrations† of benzo[a]pyrene (B[a]P) at all
monitoring stations during 2011. • A comparison of the B[a]P annual mean concentrations against the target value and upper
and lower assessment thresholds in the Fourth Daughter Directive. • Measured monthly concentrations of selected other PAHs. • A discussion of events during 2011 that resulted in the measurement of unusual PAH
concentrations. • Results from the analysis of deposition samples at two Network stations. • Results from the analysis for PAHs of samples taken for the TOMPs (toxic organic
micropollutants) Network. • A discussion of PAH concentration trends across the Network, and the relationship between
PAH emissions and measured concentrations. • A summary of scientific research, international representation and other activities related to
the Network. The annexes of this report presents tables of data for the monthly concentrations of B[a]P at all Network stations. Monthly concentration data for all other PAHs at all Network stations can be found on the PAH Network data page of the UK-AIR website (http://uk-air.defra.gov.uk).
† Throughout this report, the term ‘concentration’ is used to denote mass concentration (mass per volume, i.e. ng.m-3).
NPL Report AS 71
2
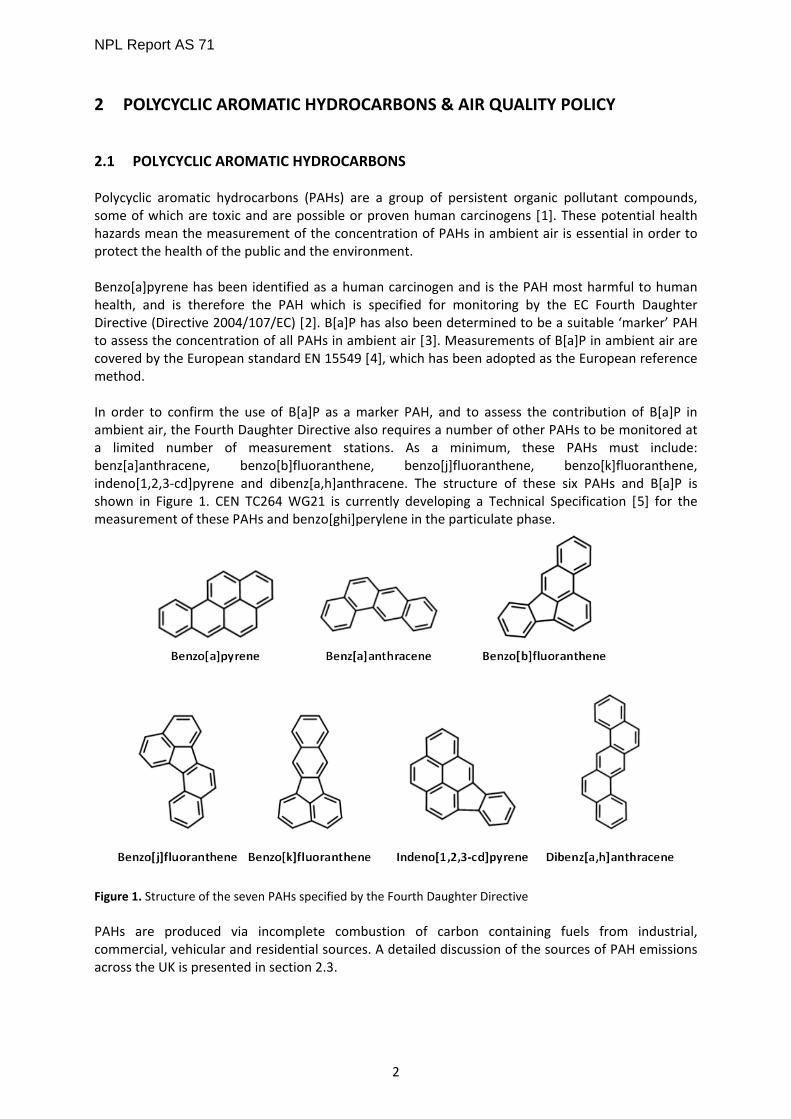
2 POLYCYCLIC AROMATIC HYDROCARBONS & AIR QUALITY POLICY 2.1 POLYCYCLIC AROMATIC HYDROCARBONS Polycyclic aromatic hydrocarbons (PAHs) are a group of persistent organic pollutant compounds, some of which are toxic and are possible or proven human carcinogens [1]. These potential health hazards mean the measurement of the concentration of PAHs in ambient air is essential in order to protect the health of the public and the environment. Benzo[a]pyrene has been identified as a human carcinogen and is the PAH most harmful to human health, and is therefore the PAH which is specified for monitoring by the EC Fourth Daughter Directive (Directive 2004/107/EC) [2]. B[a]P has also been determined to be a suitable ‘marker’ PAH to assess the concentration of all PAHs in ambient air [3]. Measurements of B[a]P in ambient air are covered by the European standard EN 15549 [4], which has been adopted as the European reference method. In order to confirm the use of B[a]P as a marker PAH, and to assess the contribution of B[a]P in ambient air, the Fourth Daughter Directive also requires a number of other PAHs to be monitored at a limited number of measurement stations. As a minimum, these PAHs must include: benz[a]anthracene, benzo[b]fluoranthene, benzo[j]fluoranthene, benzo[k]fluoranthene, indeno[1,2,3-cd]pyrene and dibenz[a,h]anthracene. The structure of these six PAHs and B[a]P is shown in Figure 1. CEN TC264 WG21 is currently developing a Technical Specification [5] for the measurement of these PAHs and benzo[ghi]perylene in the particulate phase.
Figure 1. Structure of the seven PAHs specified by the Fourth Daughter Directive PAHs are produced via incomplete combustion of carbon containing fuels from industrial, commercial, vehicular and residential sources. A detailed discussion of the sources of PAH emissions across the UK is presented in section 2.3.

NPL Report AS 71
3
In order to demonstrate compliance with legislation that imposes limit and target values relating to ambient air, and to measure human and environmental exposure, the concentration levels of PAHs need to be measured at multiple stations on nationwide air quality monitoring networks. The UK PAH Network is a regulatory air quality monitoring network that discharges the UK Government’s obligation under the EC Air Quality Fourth Daughter Directive to monitor the concentrations of B[a]P in the PM10 fraction (particles with an equivalent aerodynamic diameter of 10 μm or less) of ambient air. 2.2 AIR QUALITY POLICY Previously, the EC Air Quality Framework Directive (Directive 96/62/EC) [6] set a strategic framework for tackling air quality in a consistent way by setting Europe-wide limit values for twelve air pollutants in a series of Daughter Directives. It should be noted that a major review of EU air quality policy is currently underway [7], but as of the date of this report, the first three Daughter Directives have now been combined into the new Air Quality Directive 2008/50/EC [8]. As discussed above, The Fourth Daughter Directive sets a target values for B[a]P (and, additionally, target values for arsenic, cadmium and nickel, and measurement requirements for mercury). The target values and assessment thresholds set by the Fourth Daughter Directive for B[a]P are:
• Target value (for the total content in the PM10 fraction averaged over a calendar year): 1 ng.m-3.
• Upper assessment threshold: 0.6 ng.m-3. • Lower assessment threshold: 0.4 ng.m-3.
The Fourth Daughter Directive also specifies the data quality objectives outlined in Table 1:
Criterion B[a]P in PM10
Other PAHs in PM10
PAHs in deposition
Expanded uncertainty (fixed and indicative measurements) 50 % 50 % 70 % Expanded uncertainty (modelling) 60 % 60 % 60 % Minimum data capture 90 % 90 % 90 % Minimum time coverage (fixed measurements) 33 % - - Minimum time coverage (indicative measurements) 14 % 14 % 33 %
Table 1. Data quality objectives as specified by Annex V of the Fourth Daughter Directive. (Indicative measurements are defined as measurements which are performed at reduced regularity but fulfil the other data quality objectives.) The Fourth Daughter Directive also specifies requirements for the number and location of monitoring stations, by assessment of the B[a]P concentrations in the relevant zones and agglomerations within each member state. The UK national air quality objective for B[a]P in ambient air is an annual mean concentration of 0.25 ng.m-3. This value was proposed in 1999 by the UK Expert Panel on Air Quality Standards [9] with the intention of reducing any risk to the population from exposure to PAHs to be so small as to be undetectable. The Panel also commented that it does not necessarily follow that all exposure above this standard carries a significant risk, in view of the application of an additional tenfold safety

NPL Report AS 71
4
factor in deriving the standard. The annual mean concentration of 0.25 ng.m-3 for B[a]P was formally adopted in the UK Air Quality Strategy of 2007 [10]. 2.3 SOURCES OF PAHs IN THE UK Estimates of the quantities of PAHs emitted from the UK have been obtained from The National Atmospheric Emissions Inventory (NAEI; naei.defra.gov.uk), which is based on information in the UK Informative Inventory Report [11]. The NAEI contains data for the annual emissions of the ‘EPA priority 16 PAHs’‡ for every year since 1990. Throughout this section, the reader should be aware that all pollution emission measurements are subject to some uncertainty – in the case of PAHs, the NAEI estimates this uncertainty to be variable, but typically in excess of 60 %. As discussed in the 2010 PAH Network annual report [12], it should be noted that all of the PAH emission factors used in the NAEI for road transport during the period up to 2009 were significantly revised following a thorough review [13] in early 2011. The effect of this is that the emission estimates presented in this report, and in the 2010 Network annual report, cannot be compared with the data in the annual reports for 2009 and earlier years. There has also been an additional minor change in the emissions data since the 2010 Network annual report was published due to a review of some PAH emissions factors. The effects of these change is, however, negligible. As with most pollutants, PAH emissions in the UK have shown dramatic decreases over the last two decades as increasingly stringent emissions regulations and the decline of heavy industry have taken effect. Figure 2 shows that anthropogenic emissions of B[a]P have decreased remarkably over the last 21 years, such that the total B[a]P emissions in 2010 (the last year for which NAEI data is available) were approximately one-twentieth of those in 1990. Figure 2. Estimated UK anthropogenic emissions of B[a]P per sector from 1990 to 2010 (main chart). The period from 2005 to 2010 is shown enlarged.
‡ The ‘EPA (United States Environmental Protection Agency) priority 16 PAHs’ are: acenaphthene, acenaphthylene, anthracene, benz[a]anthracene, benzo[b]fluoranthene, benzo[k]fluoranthene, benzo[ghi]perylene, benzo[a]pyrene, chrysene, dibenz[a,h]anthracene, fluoranthene, fluorene, indeno[1,2,3-cd]pyrene, napththalene, phenanthrene and pyrene.

NPL Report AS 71
5
Emissions of B[a]P in the first half of the 1990s were dominated by emissions from metal production, and agricultural and waste burning. Emissions from metal production have declined significantly since the mid-1990s due to the closure of a number of metal processing plants, and the implementation of the Environmental Protection Act 1990, and now account for only 0.11 tonnes, or 3.4 % of the total anthropogenic UK B[a]P emissions. Emissions from agriculture and waste burning were effectively eliminated after 1992 due to the introduction of a ban on burning agricultural stubble. UK residential and commercial emissions of B[a]P dropped from 1990 onwards to a low point of only 1.64 tonnes in 2005, but have since risen again to 2.46 tonnes in 2010. Residential and commercial emissions were responsible for 76 % of the total UK B[a]P anthropogenic output in 2010, far in excess of the next highest contributing sector of anthropogenic emissions. It is also informative to compare the estimated anthropogenic emissions with those from natural sources such forest fires, long-range transport from volcanoes, and other natural combustion events. Natural emissions have been estimated as a constant 2.88 tonnes per year during the time period discussed here (1990-2010). In 1990, natural emissions contributed only 4.5 % to total UK B[a]P emissions, but by 2006 this had increased significantly to 49.1 %. Since 2006, the slight increase in anthropogenic emissions has meant that the percentage of total PAH emissions that result from natural sources had decreased to 47.2 % A recent report on PAHs in Northern Ireland [14] stated that in 2008, approximately 6.9 % of the UK’s anthropogenic emissions of B[a]P originate from Northern Ireland, meaning that PAH emissions are significantly higher per head in Northern Ireland compared to Great Britain. This emphasises the significant contribution of solid fuel use in Northern Ireland to PAH emissions profiles. The emission profiles of the other PAHs are not shown here, but are very strongly correlated to B[a]P, even though B[a]P only accounts for 0.5 % of the total emissions of the 16 PAHs considered by the NAEI. The total mass of anthropogenic UK PAH emissions decreased from 5,508 tonnes in 1990 to 622 tonnes in 2010. A discussion of the relationship between UK PAH emissions and the concentrations of PAHs in ambient air measured by this Network is given in section 7.2.

NPL Report AS 71
6
3 THE NETWORK 3.1 NETWORK OBJECTIVE The objective of the PAH Network is to determine the ambient concentrations of PAHs in ambient air in the UK through monitoring and chemical analysis, and therefore to deliver the following outputs:
• A UK-wide assessment of current concentrations of PAHs for assessment against the Fourth Daughter Directive and the UK Air Quality Strategy objectives, and provide information for future reviews of the Fourth Daughter Directive and UK Air Quality Strategy.
• Measurements and trends of airborne concentrations of PAHs in representative UK industrial, urban and other areas, and to compare and contrast them with those in rural locations.
• Data and metadata to demonstrate the UK’s compliance with the Fourth Daughter Directive, the OSPAR convention [15] and the UNECE Convention on Long Range Transboundary Air Pollutants [16].
• Data for submission to the UK-AIR Information Resource (http://uk-air.defra.gov.uk). • An improvement in the understanding of PAH source and emission estimates, and to
examine their agreement with the National Atmospheric Emissions Inventory (www.naei.org.uk). To also input into estimates of atmospheric PAH concentrations, future projections, and the identification of the key areas of uncertainty.
3.2 NETWORK OVERVIEW
3.2.1 Stations The Network in 2011 comprised of 31 stations, as specified in Annex A and shown in Figure 3. Twenty of these 31 stations were in England, four in Scotland, four in Wales and three in Northern Ireland. No new stations were installed during 2011, nor were any stations decommissioned; station activity and Network issues are discussed in more detail in Section 3.3.

NPL Report AS 71
7
Figure 3. Schematic map showing the location of the Network stations (red circles) and TOMPS Network stations (blue circles). Co-located PAHs & TOMPs stations are shown by a half blue / half red circle. The two stations marked with asterisks are Auchencorth Moss and Harwell, where Digitel particulate + vapour samples and deposition samples are also taken (see section 3.2.2).
3.2.2 Samples A full description of the sampling equipment is given in section 3.2.3. The Network requires the sampling and analysis of the following type of samples. ‘A’ (particulate) samples - samples taken from ‘A’ (Digitel filter only) stations. Samples of the PM10
fraction of ambient air on a filter. ‘A’ samples are taken daily at all 31 Network stations using Digitel samplers with automatic filter changers. Each sample is taken for 24 h, and a sample is taken every 24 h, with the sample changeover occurring at midnight. The samples are bulked into groups representing calendar months for analysis.

NPL Report AS 71
8
‘B’ (particulate + vapour) samples – samples taken from ‘B’ (Digitel filter + PUF) stations. Samples of the PM10
fraction of ambient air on a filter, plus the vapour phase of ambient air on a polyurethane foam (PUF) cartridge. ‘B’ samples are taken for three (non-consecutive) days per week at two Network stations (Auchencorth Moss B & Harwell B) using Digitel samplers with automatic filter and PUF changers. Each sample is taken for 24 h, and a sample is taken every 72 h. The samples are bulked into groups representing calendar months for analysis. ‘C’ (deposition) samples - samples taken from ‘C’ (deposition) stations. Deposition samples taken fortnightly at two Network stations (Auchencorth Moss C & Harwell C). Each sample is taken for 14 days, and a sample is taken every 14 days. The samples are bulked into groups representing a four-week time period for analysis. Extracts from TOMPs Network Hexane extracts are provided from six TOMPs Network stations by the coordinator of the TOMPs Network (see section 3.2.5). These solutions are extracted samples of the particulate and vapour phases of ambient air taken using Andersen samplers. One extract is provided per station per quarter.
3.2.3 Sampling equipment ‘A’ (particulate) samples: Digitel DHA-80 samplers (filter only) Prior to 2007, Andersen GPS-1 samplers were used at all stations in the PAHs Network. However, concerns over the ability of these instruments to representatively sample the PM10 fraction of ambient air resulted in them being replaced by Digitel DHA-80 samplers. Degradation of PAHs through exposure to ambient levels of ozone or other species in ambient air once sampled onto the filter [17] is also thought to be an issue with the Andersen sampler, as samples are typically taken for longer periods of time. Andersen GPS-1 samples are however still used in the TOMPs Network and were also utilised for a comparison of the B[a]P concentrations obtained from Andersen and Digitel samplers which concluded at the end of 2010 [12]. The Digitel DHA-80 samplers (see Figure 4(a)) now used throughout the Network are considered to be equivalent to the requirements of the European Standard for sampling PM10 matter (EN 12341). Evidence for this is available in a new version of the standard [18] which is currently being drafted to replace the Standard published in 1998 [19]. These samplers are therefore valid for use with the European Standard method for the measurement of B[a]P in ambient air (EN 15549). Samples are taken onto quartz fibre filters for a period of 24 h at a flowrate of 30 m3.h-1. ‘B’ (particulate + vapour) samples: Digitel DHA-80 samplers (filter + PUF) ‘B’ samples are taken at the Auchencorth Moss B & Harwell B stations using a Digitel DHA-80 sampler with a HVSKAW4 cartridge changer assembly (see Figure 4(b)) installed below the quartz filter. Pre-cleaned PUF cartridges are installed in the cartridge chamber, and these are used to sample vapour phase PAHs. A PUF cartridge is sampled for 24 h every three days and these cartridges are ‘paired’ with their respective filters for analysis. Filters that are sampled on the other two days during the three-day cycle (i.e. days when no PUF cartridge is sampled) are discarded.

NPL Report AS 71
9
Figure 4. (a) Photograph of a Digitel DHA-80 sampler; (b) diagram of a HVSKAW4 cartridge changer (not to scale). The cartridge changer is installed at the location shown by the red rectangle at the stations where particulate + vapour samples are required. ‘C’ (deposition samples). Deposition samples are taken at the Auchencorth Moss C & Harwell C stations using a deposition sampler (Figure 5) that meets the requirement of the European Standard for the measurement of the deposition of PAHs (EN 15980 [20]). The deposition samplers consist of a glass funnel and a 4 litre brown glass collection bottle, which are located inside a protective tube in order to minimise photochemical reactions and the degradation of PAHs. Spikes have been fitted to the top of the protective tubes to prevent damage and contamination by bird strikes. Deposition samples are taken for a period of two weeks. Extracts from TOMPs Network: Andersen GPS-1 samplers (filter + PUF) The Andersen GPS-1 samplers used throughout the TOMPs Network have been modified to allow particulate + vapour samples to be taken onto quartz fibre filters and PUF cartridges. Samples are taken for a period of two weeks at a flowrate of approximately 5.4 m3.h-1. It should however be noted that these samplers are not compliant with the requirements of the European Standard for sampling PM10 matter (EN 12341), and are therefore not valid for use with the European Standard method for the measurement of B[a]P in ambient air (EN 15549).
(a)
(b)

NPL Report AS 71
10
Figure 5. Photographs of (a) a deposition sampler; (b) a funnel and collection bottle (which are housed within the protective tube shown in (a)).
Figure 6. Photograph of an Andersen GPS-1 sampler.
3.2.4 Sampling quality control measures In order to ensure the quality of the sampling procedure, the following quality assurance and quality control measures were undertaken:
• Analysis of sample blanks and filter blanks. • Despatch and analysis of field blanks. • On-going communication with and (where necessary) re-training of LSOs following NPL’s
annual station audit visits. To aid this activity, an updated LSO site operation procedure manual was re-issued in 2011.

NPL Report AS 71
11
• Inspection of all sampling media prior to despatch to stations in accordance with the
specifications in EN 15549 and EN 15980. For example, filters are inspected for pinholes, loose material and non-uniformity.
• Inspection of all filters when returned from stations. Samples that are damaged (e.g. torn or wet filters) or returned un-sampled are rejected and the details of these samples are noted in NPL’s Network database.
• Rejection of any unidentifiable samples returned from stations. • Full investigation of any discrepant or unexpected sampling data (e.g. unexpectedly high or
low sample volumes).
3.2.5 Relationship with TOMPs Network samples The TOMPs Network was operated by the University of Lancaster throughout 2011. Full details of the TOMPs Network can be found in the TOMPs Network annual reports, which are available from the library page of the UK-AIR website (http://uk-air.defra.gov.uk/library). TOMPs Network samples are obtained using modified Andersen GPS-1 samplers fitted with filters and PUF cartridges (see section 3.2.3). Each sample (filter + PUF) was taken for approximately two weeks and extracted individually. The hexane extracts that correspond to a quarter of the year (usually six extracts in total) are then combined, and 10 % of this combined extract is sent to the contractor of the PAH Network for analysis. It should be noted that the responsibility for obtaining and extracting these samples rests with the contractor of the TOMPs Network. Extracts from samples taken at the following six TOMPs stations are analysed for PAHs:
• Auchencorth Moss • Hazelrigg • High Muffles • London Nobel House • Manchester Law Courts • Weybourne
The results (in ng of each PAH in the extract) are converted to quarterly mean PAH concentrations (in ng.m-3) by knowledge of the total volume of ambient air sampled, and the fraction of the extract received for analysis. 3.3 NETWORK ACTIVITY DURING 2011
3.3.1 Station infrastructure and Network re-organisation No new Network stations were installed during 2011, nor were any stations decommissioned. However, the sampler at South Hiendley was moved to a different location in the school grounds during late June to early July, but the distance of the move was sufficiently small that the old and new locations of the sampler can be assumed to experience the same pollution micro-climate.

NPL Report AS 71
12
3.3.2 Station audits and calibrations The following station audit and calibration activities were carried out during 2011:
• Audits were carried out at all Network stations. As part of these visits, the LSOs were audited (and, where necessary, retrained). In addition, an updated LSO site operation procedure manual was re-issued in 2011.
• Routine servicing of the samplers was carried out at all Network stations. • Quarterly calibrations of the flow rate of the samplers at all stations using NPL-designed
calibration kits are continuing. • Portable appliance testing, periodic (five-year) electrical testing and the updating of risk
assessments were also performed at the stations as necessary.
3.3.3 Equipment servicing, breakdowns, and station maintenance Full details of the breakdown and maintenance issues at each Network station during 2011 are given in Annex B. The main issues can be summarised as:
• The sampler at the High Muffles station was not operational for 22 days during January 2011 due to a motor failure caused by the sampler filling with ice.
• Sampling at the London Crystal Palace Parade station in 2011 only commenced on 22 January as the power supply to the station had been disconnected. This station has been fully operational since then as NPL has taken over the account for the electrical supply for the station.
• Samplers were replaced at two stations. • Motors were replaced at eight stations. • Two weeks of data loss were suffered at a number of stations (London Marylebone Road,
Newcastle Centre, Newport, Port Talbot Margam, Royston, Scunthorpe Low Santon, Scunthorpe Town, South Hiendley, Stoke Ferry and Swansea Cwm Level Park) during January because sufficient filter rings could not be supplied to stations to cover the Christmas and New Year period.
• A number of stations also experienced delays in receiving filters for the January 2011 period due to the extreme weather conditions in December 2010.

NPL Report AS 71
13
4 DATA CAPTURE 4.1 INTRODUCTION & METHODOLOGY The data capture data discussed in this section have been calculated assuming a target time coverage of 100 %. The data capture is therefore the percentage of the year during which samples that ultimately contributed to the monthly average concentration data were taken. Samples that were rejected on return from the stations as un-sampled or damaged, and samples rejected after analysis (e.g. those samples where the analytical recovery of d-B[a]P was reported as < 50 % - see section 5.3) are given a data capture value of 0 %.
4.2 DATA CAPTURE VALUES The annual average data capture values for 2011 are shown in Tables 2(a) – 2(c). The monthly data capture values (which are determined in the same manner as described above) are used to weight the monthly concentration data in order to calculate the annual mean concentrations. Station Data capture / % Station Data capture / % Auchencorth Moss A 85 Liverpool Speke 99 Ballymena Ballykeel 99 London Marylebone Road 79 Birmingham Tyburn 87 London Brent 100 Bolsover 99 Lynemouth 2 99 Cardiff Lakeside 96 Middlesbrough 100 Derry Brandywell 89 Newcastle Centre 88 London Crystal Palace Parade 90 Newport 94 Edinburgh St Leonards 100 Port Talbot Margam 95 Glasgow Centre 96 Royston 96 Harwell A 100 Salford Eccles 100 Hazelrigg 97 Scunthorpe Low Santon 91 High Muffles 87 Scunthorpe Town 86 Hove 97 South Hiendley 83 Kinlochleven 99 Stoke Ferry 90 Leeds Millshaw 95 Swansea Cwm Level Park 93 Lisburn Dunmurry High School 89 ‘A’ stations average: 94 Table 2(a). 2011 data capture values for ‘A’ (particulate) samples. Station Data capture /
% of total time Data capture /
% of target Auchencorth Moss B 38 88 Harwell B 38 88 ‘B’ stations average 38 88 Table 2(b). 2011 data capture values for ‘B’ (particulate + vapour) samples. Note that the maximum data capture for ‘B’ stations expressed as a percentage of total time is approximately 43 % as the PUF cartridges are sampled for three days per week. It is therefore the values in the final column (‘data capture / % of target’) which are directly comparable to the values in Tables 2(a) and 2(c), and the data quality objectives in Table 1.

NPL Report AS 71
14
Station Data capture / % Auchencorth Moss C 100 Harwell C 100 ‘C’ stations average 100 Table 2(c). 2011 data capture values for ‘C’ (deposition) samples In 2011, all Network stations reported an annual data capture of more than 75 % of the target data capture – this is an major improvement on 2010, where two stations that were operational throughout the year (Lisburn Dunmurry High School and Harwell B) failed to meet this criterion. Another example of the improved data capture during 2011 can be obtained by comparing the average data capture from the ‘A’ stations, which increased markedly from 83.9 % to 93.5 %. Of the total lost data capture for the ‘A’ stations, approximately:
• 29 % was a result of samples being rejected after analysis; • 19 % was a result of not being able to supply sufficient filter rings over the Christmas and
New Year period. • 3 % was a result of the re-location of the sampler at South Hindley; • 49 % of was a result of other sampling issues (e.g. samplers not being operational, delivery of
filters to stations being delayed due to transport issues, filters being returned un-sampled, and damaged filters rejected prior to analysis).
Figure 7 shows the 2010 and 2011 data capture data for the ‘A’ stations broken down by quarter, where it can be seen that a steady improvement in data capture has been achieved over the last year, to the point where a data capture of 97.6 % was achieved for 2011 Q4.
Figure 7. Average 2010 & 2011 quarterly data capture values for ‘A’ stations. NPL took over operation of the Network at the end of 2010 Q3.

NPL Report AS 71
15
This improvement in data capture during 2011 is mainly due to the following factors:
• The installation of rain heads on eight samplers during 2010 Q4, which has significantly reduced data capture loss due to water ingress.
• Re-training of all LSOs, which has enabled LSOs to deal with minor issues without the need to call on the support of the equipment support unit.
• Close supervision of the analytical laboratory, which has significantly reduced number of the samples rejected after analysis because the analytical recovery of d-B[a]P was reported as < 50 % (from eighteen in 2010 to six in 2011).

NPL Report AS 71
16
5 ANALYSIS 5.1 PAHs MEASURED The PAHs measured by the Network in 2011 for each sample type are indicated in red in Figure 8. The assessment of which PAHs to measure in each sample type was made following a study of co-located Digitel and Andersen samplers in 2007 [21].
Figure 8. PAHs measured by the Network in 2011 (shown in red). 5.2 ANALYTICAL TECHNIQUES The analysis of Network samples was sub-contracted to a commercial analytical laboratory for the whole of 2011. Analyses of ‘A’ (particulate) and ‘B’ (particulate + vapour) samples were carried out in accordance with EN 15549. Samples were bulked into monthly batches (where applicable) and Soxhlet extracted using dichloromethane as the extraction solvent. The extracts were reduced in volume to 10 ml and a 1 ml aliquot of this underwent a clean-up procedure using silica column chromatography. After clean-up, the sample was again reduced in volume to approximately 1 ml and analysed using gas chromatography – mass spectrometry (GC-MS). The GC-MS was calibrated using a series of

NPL Report AS 71
17
calibration standards containing all the PAHs shown in Figure 8 at a range of concentrations covering the concentrations expected in the samples. The relative expanded uncertainty in a typical analytical result from a Network sample was estimated to be 20 % - well within the data quality objective of an expanded uncertainty of 50 %. The limits of detection of the GC-MS method were determined by running a series of filter blanks every six months, and a solvent blank with every analytical run. Analysis of ‘C’ (deposition) samples was carried out in accordance with EN 15980. In summary, the deposition samples were bulked into four-weekly batches and extracted using liquid-liquid extraction. The resulting extract was dried, reduced to a volume of approximately 1 ml, and analysed using GC-MS as described above. Analysis of hexane extracts from the TOMPs Network did not require any sample preparation steps, only the GC-MS method described above. 5.3 ANALYTICAL QUALITY ASSURANCE & QUALITY CONTROL MEASURES In order to ensure the quality of the analytical data, the following QA and QC measures were undertaken:
• Regular assessment of the limit of detection of the GC-MS method. • Regular extraction and analysis of an appropriate certified reference material (NIST SRM
1649b) in order to check the recovery of the extraction methods. Recoveries must be within in the limits specified by EN 15549.
• Use of a range of deuterated PAH analogue species in order to assess (and correct for) the recovery of each sample. Following the criterion in EN 15549, if the analytical recovery of d-B[a]P for any sample was determined to be less than 50 %, the result was highlighted as not being valid for inclusion in the calculation of the annual mean concentration.
• The laboratory responsible for analysing Network samples participated in a 2010 PAH intercomparison operated by the European Commission Joint Research Centre. The provisional results from this exercise have now been published [22].
• All data was assessed for outliers by analysis of the monthly and annual trends observed for each PAH at each station.
• The data was ratified by an NPL quality circle of senior scientific experts independent of the scientists responsible for processing the analytical data.

NPL Report AS 71
18
6 RESULTS & DISCUSSION 6.1 ‘A’ (PARTICULATE) & ‘B’ (PARTICULATE + VAPOUR) SAMPLES This section presents and discusses the results from the 31 ‘A’ (Digitel filter only) stations and the two ‘B’ (Digitel filter + PUF) stations. The discussion focuses on B[a]P, but some data for other PAHs are also presented. Data for all PAHs for all stations is available from the UK-AIR website (http://uk-air.defra.gov.uk/).
6.1.1 B[a]P: Annual concentrations and comparison against target values and air quality objectives
The annual mean B[a]P concentration measured at all ‘A’ and ‘B’ stations is shown in Figure 9:
Figure 9: Annual mean B[a]P concentrations recorded at ‘A’ and ‘B’ stations during 2011. The colour coding of the data from each station indicates that the mean concentration is: Red: in excess of the EC target value (1 ng.m-3); Dark orange: in excess of EC upper assessment threshold (UAT; 0.6 ng.m-3), but less than the target value; Light orange: in excess of EC lower assessment threshold (LAT; 0.4 ng.m-3), but less than the UAT; Yellow: in excess of the UK air quality objective (0.25 ng.m-3), but less than the LAT; Green: below the UK air quality objective. From Figure 9 it can been seen that:
• Three stations have a measured annual mean B[a]P concentration above the EC target value of 1 ng.m-3, a decrease from seven stations in 2010.
• A total of seven stations have a measured annual mean B[a]P concentration above the EC upper assessment threshold of 0.6 ng.m-3, a decrease from eight stations in 2010.
• A total of seven stations have a measured annual mean B[a]P concentration above the EC lower assessment threshold of 0.4 ng.m-3, a decrease from eight stations in 2010.

NPL Report AS 71
19
• 13 stations have a measured mean annual B[a]P concentration above the UK air quality objective of 0.25 ng.m-3, a decrease from 20 stations in 2010.
Table 3 details the measured annual mean B[a]P concentrations at the stations where the EC lower assessment threshold of 0.4 ng.m-3 was exceeded in 2011 or 2010.
Station B[a]P conc. / ng.m-3
Station / area type [notes] 2011 2010
Scunthorpe Low Santon 3.03 1.80 Industrial / Urban Scunthorpe Town 1.28 1.30 Industrial / Urban Ballymena Ballykeel 1.12 2.01 Background / Urban [N. Ireland] Derry Brandywell 0.95 1.94 Background / Urban [N. Ireland] Lisburn Dunmurry High School 0.86 1.44 + Background / Suburban [N. Ireland] Royston 0.84 1.13 Industrial / Urban South Hiendley 0.68 0.63 Industrial / Urban Middlesbrough 0.35 0.44 Background / Urban Lynemouth 2 / Lynemouth * 0.30 1.06 + Industrial / Suburban Bolsover 0.22 0.50 Industrial / Urban
Table 3: Stations that recorded an annual mean B[a]P concentration greater than the EC lower assessment threshold of 0.4 ng.m-3 during either 2011 or 2010. The colours indicate the same exceedences as in Figure 9. An asterisk (*) notes that the values relate to the ‘Lynemouth’ station up to April 2010, then the ‘Lynemouth 2’ station from September 2010. A plus sign (+) indicates that the annual data capture was less than 75 % of the target data capture value. Note also that a number of the station / area type classifications have changed since 2010 – see Annex A for further details. The seven Network stations that exceeded the EC lower assessment threshold of 0.4 ng.m-3 during 2011 are all either industrial / urban stations in Great Britain, or background / urban or suburban stations in Northern Ireland with significant solid fuel use:
• Scunthorpe Santon & Scunthorpe Town: Downwind and upwind from steel works. • Ballymena Ballykeel, Derry Brandywell & Lisburn Dunmurry High School: Stations in Northern
Ireland with domestic solid fuel use. • Royston & South Hiendley : Upwind and downwind from coke works.
The three Network stations that exceeded the EC lower assessment threshold of 0.4 ng.m-3 during 2010, but not during 2011 are:
• Middlesbrough: The decrease in the B[a]P concentration recorded at the Middlesbrough station (which has been reclassified from industrial / urban to background / urban), may be a result of reduced industrial activity in the Teesside area. However, April 2012 saw the blast furnace at the Redcar steel plant relit, and measured PAH concentrations may therefore increase in the future.
• Lynemouth 2 / Lynemouth: The high B[a]P concentration recorded in 2010 was likely to be artificially elevated result as the sampling period covered only the months January – April and September – Decemeber. No sampling was therefore undertaken around the middle of the year, when PAH concentrations are typically at their lowest.
• Bolsover: The measured decrease in B[a]P may be a result of the diminishing influence of the major industrial source in the area, a former Coalite works (which closed in 2004).

NPL Report AS 71
20
6.1.2 B[a]P: Monthly concentrations The full dataset showing the mean B[a]P concentration for each month at each ‘A’ and ‘B’ Network station is shown in Annex C. The data are shown graphically in Figure 10:
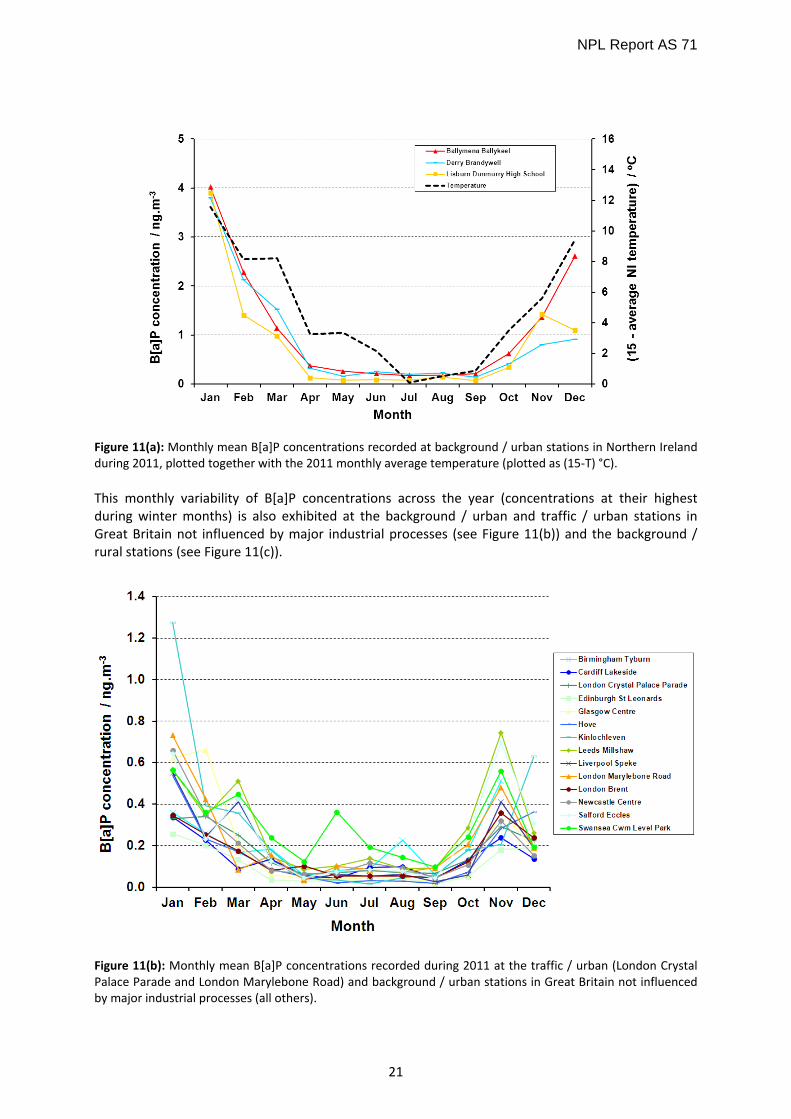
Figure 10: Monthly mean B[a]P concentrations recorded at ‘A’ and ‘B’ stations during 2011. Figure 10 shows that the highest monthly mean B[a]P concentration (7.3 ng.m-3) during 2011 was recorded at Scunthorpe Low Santon in December. This unusually high monthly concentration is discussed further in Section 6.1.5. Of particular note from Figure 10 is that the measured B[a]P concentrations at most stations were unusually low during December 2011 when compared to the other winter months during the year – PAHs usually exhibit strong seasonality with the highest concentrations being recorded at the beginning and the end of each year as a result of combustion processes peaking in winter. The concentrations measured in December 2011 were also much lower than those recorded in December 2010. December 2011 was a very mild month across the UK, and these unusual metrological conditions are a likely explanation for the low measured B[a]P concentrations. In fact, similar unusually low concentrations of other PAHs (see Section 6.1.5) and other ambient air pollutants measured by other air quality Networks (e.g. black carbon [23]) were also observed during the same month. The annual variation in B[a]P concentrations at all stations can be observed and analysed in more detail if the data from stations with similar characteristics are plotted together. These plots are shown in Figures 11(a) to (d). Figure 11(a) shows the monthly concentration of B[a]P measured at each of the Northern Irish monitoring stations in 2011, along with the monthly average temperature. It is evident that there is a very clear correlation of B[a]P emissions to temperature; one of the main contributory factors to this is thought to be the increase in domestic fuel heating during the winter months.
NPL Report AS 71
21
Figure 11(a): Monthly mean B[a]P concentrations recorded at background / urban stations in Northern Ireland during 2011, plotted together with the 2011 monthly average temperature (plotted as (15-T) °C). This monthly variability of B[a]P concentrations across the year (concentrations at their highest during winter months) is also exhibited at the background / urban and traffic / urban stations in Great Britain not influenced by major industrial processes (see Figure 11(b)) and the background / rural stations (see Figure 11(c)).
Figure 11(b): Monthly mean B[a]P concentrations recorded during 2011 at the traffic / urban (London Crystal Palace Parade and London Marylebone Road) and background / urban stations in Great Britain not influenced by major industrial processes (all others).

NPL Report AS 71
22
Two interesting trends in the data can be observed from Figure 11(b). Firstly, there is a marked increase in the B[a]P concentrations measured at Swansea Cwm Level Park in June and July. This is thought to be the result of a large industrial fire in the vicinity of the monitoring station, which is discussed further in Section 6.1.5. Secondly, the B[a]P concentrations measured in December 2011 at Kinlochleven (a small town in the Highlands of Scotland), Edinburgh and Hove (on the south coast of England) do not exhibit the same decrease from the November concentrations that is observed at most other UK sites. The three Northern Irish stations (Figure 11(a)) also show no or very little decrease in B[a]P concentrations from November to December. These observations may be a result of the temperature differences in these parts of the UK not being so extreme, or other issues relating to the sources of B[a]P that are difficult to quantify.
Figure 11(c): Monthly mean B[a]P concentrations recorded during 2011 at background / rural stations. In comparison, different seasonal trends are observed at the Network stations that are influenced by industrial processes (see Figure 11(d)), very little seasonality is seen at the stations recording the highest B[a]P concentration of this group of stations (Scunthorpe Low Santon and Scunthorpe Town; this is discussed further in Section 6.1.5), showing that these measurements are dominated by industrial processes that are relatively invariant throughout the year. An intermediate level of seasonality is observed at the other stations in Figure 11(d).

NPL Report AS 71
23
Figure 11(d): Monthly mean B[a]P concentrations recorded during 2011 at Network stations influenced by major industrial processes. The stations are: seven industrial / urban stations (Bolsover, Port Talbot Margam, Royston, Salford Eccles, Scunthorpe Low Santon, Scunthorpe Town & South Hiendley), one industrial / suburban station (Lynemouth 2) and two background / urban stations in Great Britain that are influenced by industrial plants (Middlesbrough & Newport).
6.1.3 Other PAHs: Monthly concentrations As discussed in section 2.1, the Fourth Daughter Directive also specifies that (at least) the following six PAHs should be monitored at a limited number of measurement stations: benz[a]anthracene, benzo[b]fluoranthene, benzo[j]fluoranthene, benzo[k]fluoranthene, indeno[1,2,3-cd]pyrene, and dibenz[a,h]anthracene. CEN TC264 WG21 is developing a Technical Specification for the measurement of the these PAHs and benzo[ghi]perylene in the particulate phase [5]. The Network measures all of these PAHs covered by the Technical Specification at all stations, as indicated below:
• Benz[a]anthracene: measured individually • Benzo[b]fluoranthene: measured as benzo[b+j]fluoranthene • Benzo[j]fluoranthene: measured as benzo[b+j]fluoranthene • Benzo[k]fluoranthene: measured individually • Indeno[1,2,3-cd]pyrene: measured individually • Dibenz[a,h]anthracene: measured as dibenz[a,h+a,c]anthracene • Benzo[ghi]perylene: measured individually
The monthly mean concentration of each of these PAHs (or groups of PAHs) measured at all ‘A’ and ‘B’ stations is shown in Figures 12(a)-12(f).

NPL Report AS 71
24
Figure 12(a): Monthly mean benz[a]anthracene concentrations recorded at ‘A’ and ‘B’ stations during 2011.
Figure 12(b): Monthly mean benzo[b+j]fluoranthene concentrations recorded at ‘A’ and ‘B’ stations during 2011.

NPL Report AS 71
25
Figure 12(c): Monthly mean benzo[k]fluoranthene concentrations recorded at ‘A’ and ‘B’ stations during 2011.
Figure 12(d): Monthly mean indeno[1,2,3-cd]pyrene concentrations recorded at ‘A’ and ‘B’ stations during 2011.

NPL Report AS 71
26
Figure 12(e): Monthly mean dibenz[a,h+a,c]anthracene concentrations recorded at ‘A’ and ‘B’ stations during 2011.
Figure 12(f): Monthly mean benzo[ghi]perylene concentrations recorded at ‘A’ and ‘B’ stations during 2011.

NPL Report AS 71
27
6.1.4 Comparison between ‘A’ and ‘B’ stations The Network collects ‘A’ (particulate) and ‘B’ (particulate + vapour) samples at two locations, Auchencorth Moss and Harwell, which allows the results from these two sets of parallel samplers to be compared. It should however be borne in mind that two results are not totally comparable as the ‘A’ and ‘B’ samplers do not take comparable samples of ambient air - the ‘A’ samples have a target data capture of 100 %, whereas the ‘B’ samples have a target data capture of only 43 % (as only those filters and PUF cartridges sampled every third day are analysed). The annual mean B[a]P concentrations recorded at these stations during 2011 are:
• Auchencorth Moss A B[a]P: 0.022 ng.m-3 • Auchencorth Moss B B[a]P: 0.027 ng.m-3
• Harwell A B[a]P: 0.073 ng.m-3 • Harwell B B[a]P: 0.055 ng.m-3
The annual mean concentrations from the ‘A’ and ‘B’ samples therefore agree well – there is no significant difference between the results at the 95 % confidence level. This agreement is not unexpected as B[a]P exists almost exclusively in the particulate phase. It may be more instructive to study the equivalent data from the PAH in the Fourth Daughter Directive with the lowest vapour pressure, benz[a]anthracene as this compound is known to partially exist in the vapour phase. For example, one study [24] found that 20 % of benz[a]anthracene in ambient air was in the vapour phase (although the uncertainty of these measurements was large). The annual mean benz[a]anthracene concentrations recorded at Auchencorth Moss and Harwell during 2011 are shown below, and as for B[a]P, the results from the respective ‘A’ and ‘B’ samples show no significant difference at the 95 % confidence level. These results are consistent with the fact that only a small proportion of benz[a]anthracene exists in the vapour phase.
• Auchencorth Moss A benz[a]anthracene: 0.012 ng.m-3 • Auchencorth Moss B benz[a]anthracene: 0.013 ng.m-3
• Harwell A benz[a]anthracene: 0.019 ng.m-3 • Harwell B benz[a]anthracene: 0.023 ng.m-3
The data from the ‘A’ and ‘B’ sites can theoretically be used to calculate the concentration of vapour-phase concentration of PAHs in ambient air by subtraction of the result from the ‘A’ site from that from the ‘B’ site. However, care must be taken when reporting vapour-phase concentrations determined in this manner as they are likely to be dominated by the calculated uncertainty.
6.1.5 Events during 2011 resulting in unusual measured PAH concentrations This section discusses the underlying reasons for two observations from the 2011 data that were highlighted in the discussion in Section 6.1.2: the high concentrations of PAHs recorded at Scunthorpe Low Santon in December 2011 and Swansea Cwm Level Park in June and July 2011.

NPL Report AS 71
28
(a) Scunthorpe Low Santon & Scunthorpe Town – December 2011 The monthly mean B[a]P concentration recorded at the Scunthorpe Low Santon and Scunthorpe Town stations are plotted in Figure 13. From the graph, it is clear that the concentration of B[a]P in December 2011 was unusually high at Scunthorpe Low Santon, and possibly lower than expected at Scunthorpe Town. (The same observation can also be made from the concentrations of other PAHs.)
Figure 13: Monthly mean B[a]P concentrations recorded during 2011 at Scunthorpe Low Santon and Scunthorpe Town. Previous PAH Network annual reports [25,26] have reported a strong correlation between wind direction and the PAH concentrations measured at these stations, which are located nominally upwind and nominally downwind of a major steel works (see Figure 14). Any variation in the prevailing wind direction may therefore cause large changes in measured PAH concentrations.
Figure 14: Map showing the locations of the Scunthorpe Low Santon and Scunthorpe Town monitoring stations. [Map copyright Ordnance Survey].

NPL Report AS 71
29
Figure 15 shows the wind data recorded at the Scunthorpe Town station during November and December 2011. This shows a significant shift in the wind direction from November to December, such that in December the wind is consistently south-westerly. As can be seen from the map in Figure 14, the Scunthorpe Low Santon station is directly downwind from the steel works when the wind blows from a south-westerly direction, and this may therefore explain the very high December 2011 B[a]P concentration at Scunthorpe Low Santon (and the relatively low concentration at Scunthorpe Town Figure 15: Wind data from the Scunthorpe Town station in (a) November 2011; (b) December 2011. The average wind speed and direction recorded for each month was 1.3 m.s-1 at 176° in November 2011 and 2.7 m.s-1 at 247° in December 2011. (b) Swansea Cwm Level Park – June & July 2011 The elevated concentrations of PAHs measured at the Swansea Cwm Level Park station during June and July 2011 are likely to be a result of a major fire of used tyres in Fforestfach, (OS grid co-ordinates 262783, 195700) from 16 June to 8 July 2011. As the map in Figure 16 shows, the fire, which was significant enough to be subject to regular reports on local and national media, was upwind of the monitoring station.
Figure 16: Map showing the locations of the Fforestfach tyre fire (red) and the Swansea Cwm Level Park monitoring station (magenta). [Map copyright Ordnance Survey]

NPL Report AS 71
30
The elevated B[a]P concentrations can be seen more clearly when the monthly mean B[a]P concentrations recorded at the two of the South Wales background / urban stations, Swansea Cwm Level Park and Cardiff Lakeside, during 2010 and 2011 are plotted - see Figure 17. The marked increase in the B[a]P concentration at Swansea Cwm Level Park during June 2011 (compared to the 2010 result), and the smaller increase for July are not replicated at the Cardiff Lakeside station. Figure 17: Monthly mean B[a]P concentrations recorded at (a) Swansea Cwm Level Park and (b) Cardiff Lakeside during 2010 and 2011. Despite the major tyre fire, it should be noted that the concentrations of B[a]P reported during June and July 2011 were still lower than those measured during winter months, and are also well below the target value of 1 ng.m-3. 6.2 DEPOSITION (‘C’) SAMPLES The four-weekly and annual mean B[a]P concentrations measured at each deposition Network station are presented in Annex D. The data for B[a]P, and for the other five PAHs (or groups of PAHs) covered by the European standard EN 15980 [20] show that, in general, background levels of PAHs in deposition have remained very low at both the Auchencorth Moss C and Harwell C stations during 2011, with the vast majority of results (60 out of 91 at Auchencorth Moss C, and 56 out of 91 at Harwell C) being less than the analytical limit of detection. 6.3 ANDERSEN SAMPLES FROM TOMPS NETWORK The quarterly and annual mean B[a]P concentration measured at the six TOMPs Network stations during each quarter of 2011 are presented in Annex E. These results have been determined from the analysis of hexane extracts provided by the University of Lancaster, who were also responsible for the operation of the Andersen samplers, and for providing NPL with flow volume data and data capture values.
(a) (b)

NPL Report AS 71
31
The annual mean concentration of B[a]P in each sample is presented in Table 4, where the results are also compared with those from co-located Digitel samplers on the PAH Network.
Table 4: Annual mean B[a]P concentration measured at the six TOMPs Network stations during 2011. The results are compared with those obtained from co-located Digitel samplers (a dash indicates that no co-located sampler exists). As in 2010, the annual mean B[a]P concentrations measured at the TOMPs Network stations are surprisingly low. Comparing the results from the TOMPs Network stations to those from co-located Digitel samplers on the PAH Network shows that the latter results are between approximately two and four times higher than those from the TOMPs samples. In addition, the results from the TOMPs stations at London Nobel House and Manchester Law Courts are up to an order of magnitude lower those measured at urban stations in the PAH Network (see Annex C). The most likely explanation for this is that the TOMPs samples taken using Andersen samples have undergone on-filter degradation by ozone or other species present in ambient air. The measured quarterly mean concentrations of B[a]P in the TOMPs samples are plotted in Figure 18. Despite the data being of lower temporal resolution than the monthly data from the PAH Network (Figure 11), the same seasonal trend is clearly demonstrated, with the measured B[a]P concentration being substantially higher in the colder months of the year.
Figure 18: Quarterly mean B[a]P concentrations measured at the six TOMPs Network stations during 2011. Data reported as below the limit of detection are plotted as a value of half of the limit of detection with error bars equal to half of the limit of detection.
Station Annual mean B[a]P concentration / ng.m-3
TOMPs (particulate + vapour)
Digitel ‘A’ (particulate)
Digitel ‘B’ (particulate + vapour)
Auchencorth Moss 0.012 0.020 0.027 Hazelrigg 0.015 0.064 -
High Muffles 0.027 0.061 - London Nobel House 0.029 - -
Manchester Law Courts 0.052 - - Weybourne 0.044 - -

NPL Report AS 71
32
7 TRENDS IN MEASURED DATA 7.1 UK TRENDS IN B[a]P CONCENTRATION DATA (2007-2010) Figure 19(a) shows the annual mean B[a]P concentrations measured at all ‘A’ and ‘B’ Network stations since the installation of Digitel samplers (in 2007 or 2008). Figure 19(b) shows the same data for all stations (except all stations in Northern Ireland and those stations in Great Britain influenced by major industrial processes) using an expanded concentration scale on the y-axis.
Figure 19(a): Annual mean B[a]P concentration measured at all ‘A’ & ‘B’ stations from 2007-2011 inclusive.
Figure 19(b): Annual mean B[a]P concentration measured at all ‘A’ & ‘B’ stations (except all stations in Northern Ireland, and those stations in Great Britain influenced by major industrial processes) from 2007-2011 inclusive.

NPL Report AS 71
33
The data for the background and rural stations shown in Figure 19(b) seem to suggest that there may be a slightly year-on-year decrease in PAH concentrations measured at these stations. However, any trend is very slight and this finding would be somewhat contradictory to the relatively constant levels of B[a]P emissions over the same time period (see Figure 2). 7.2 RELATIONSHIP BETWEEN PAH EMISSIONS AND MEASURED CONCENTRATIONS The relationship between UK emissions of PAHs (see Section 2.3) and their concentration in UK ambient air (as measured by the PAH Network) is discussed in this section. Although it is difficult to produce a representative average PAH concentration in UK ambient air because of the significant changes to Network over the last two decades, a reasonable representation of an average UK PAH concentration can be provided by the median yearly value across all stations on the Network. This median concentration is plotted against the total (anthropogenic plus natural) UK PAH emissions in Figure 20.
Figure 20. Comparison of UK B[a]P estimated emissions and UK median B[a]P measured concentrations from 1991 to 2011 (emissions data is only available up to 2010). It is clear from Figure 20 that both emissions and measured concentrations of B[a]P have in general fallen dramatically over the last 20 years, and that these decreases are highly correlated. This correlation was particularly strong between 1991 and 2007 – the variation from this correlation in recent years is mainly due to major reorganisation of the Network, in particular the replacement of the Andersen samplers with Digitel samplers. Figure 21 compares the B[a]P emissions and median concentrations for each year, assigning uncertainties to each value (for B[a]P concentrations this is the Fourth Daughter Directive data quality objective for expanded uncertainty of 50 %, and for B[a]P emissions this is the lower end of

NPL Report AS 71
34
the NAEI estimated uncertainty of 60 %). A generalised least squares approach, which has taken into account the uncertainties on both axes, has been used to fit the data.
Figure 21. Generalised least squares fit of UK median B[a]P concentration against total UK B[a]P emissions estimates from 1991 to 2010. Data from selected years are indicated by the arrows. The expanded uncertainties in each data point at the 95 % confidence interval are represented by the error bars. The plot confirms that the fall in B[a]P emissions is indeed strongly correlated to measured ambient concentrations. The extrapolation displayed produces a gradient of 0.021 ± 0.009 ng.m3.t-1, which is very similar to analogous figures for other UK pollutant data (e.g. nickel in ambient air [27]). This result implies that every tonne of B[a]P emitted into UK air contributes 0.021 ng.m-3 to B[a]P concentrations measured in ambient air. If a similar calculation is undertaken using only anthropogenic (rather than total) B[a]P emissions, the intercept of the generalised least-squares line of best fit with the y-axis represents the predicted concentration of B[a]P in ambient air in the absence of any anthropogenic emissions, i.e. an indication of the lower limit of ambient B[a]P which could ever be expected. Performing this calculation predicts this concentration to be 0.085 ± 0.040 ng.m-3. This can be compared to the NAEI estimate for B[a]P emissions from natural sources of 2.88 tonnes per year by using a sensitivity of 0.019 ± 0.007 ng.m-3.t-1 (the gradient of the line of best fit of the anthropogenic data), which gives a contribution to UK ambient air by natural sources of 0.055 ng.m-3, which is in agreement with the predicted concentration (0.085 ng.m-3) when the uncertainties of the calculation are taken into account. 7.3 ASSESSMENT OF CORRELATIONS BETWEEN PAHs The correlation between the concentrations of the various PAHs measured by the Network is examined in this section. As PAHs are emitted from combustion processes, it is expected that emissions from a given source (for instance where measured concentrations are dominated by domestic solid fuel use) will show similar PAH ratios, and strong correlations between the measured PAH concentrations should therefore exist. At locations where monitoring stations are impacted on
NPL Report AS 71
35
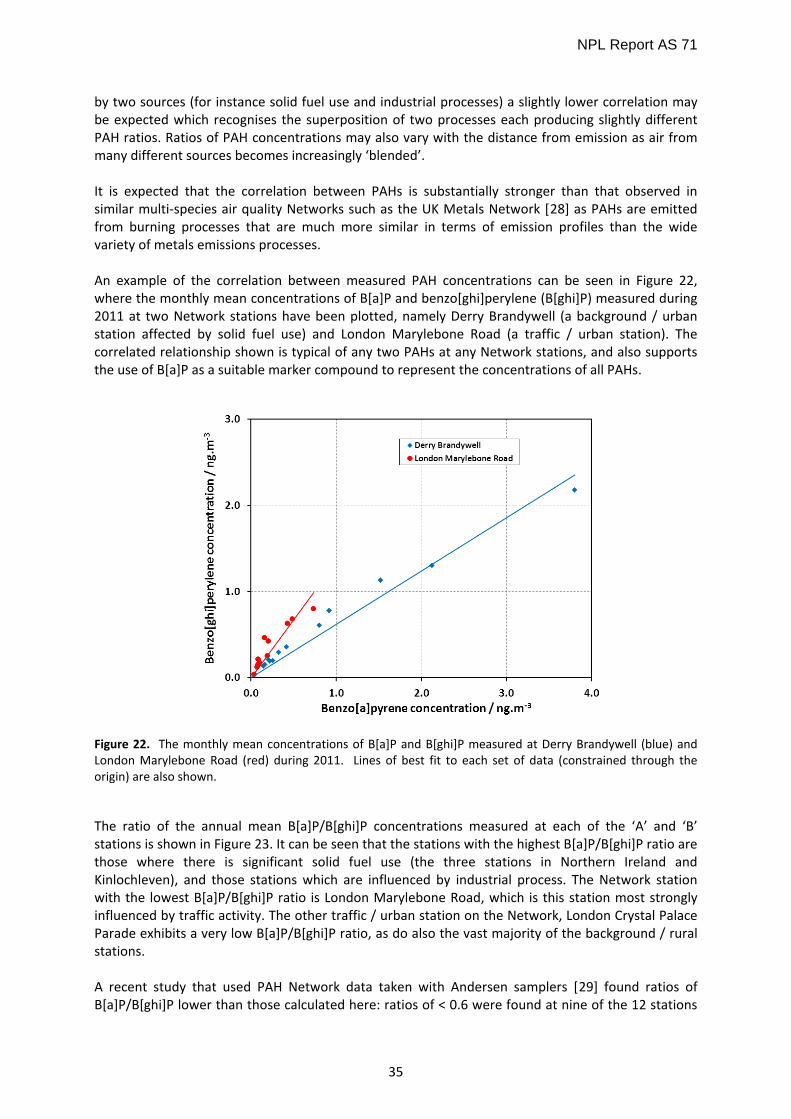
by two sources (for instance solid fuel use and industrial processes) a slightly lower correlation may be expected which recognises the superposition of two processes each producing slightly different PAH ratios. Ratios of PAH concentrations may also vary with the distance from emission as air from many different sources becomes increasingly ‘blended’. It is expected that the correlation between PAHs is substantially stronger than that observed in similar multi-species air quality Networks such as the UK Metals Network [28] as PAHs are emitted from burning processes that are much more similar in terms of emission profiles than the wide variety of metals emissions processes. An example of the correlation between measured PAH concentrations can be seen in Figure 22, where the monthly mean concentrations of B[a]P and benzo[ghi]perylene (B[ghi]P) measured during 2011 at two Network stations have been plotted, namely Derry Brandywell (a background / urban station affected by solid fuel use) and London Marylebone Road (a traffic / urban station). The correlated relationship shown is typical of any two PAHs at any Network stations, and also supports the use of B[a]P as a suitable marker compound to represent the concentrations of all PAHs.
Figure 22. The monthly mean concentrations of B[a]P and B[ghi]P measured at Derry Brandywell (blue) and London Marylebone Road (red) during 2011. Lines of best fit to each set of data (constrained through the origin) are also shown. The ratio of the annual mean B[a]P/B[ghi]P concentrations measured at each of the ‘A’ and ‘B’ stations is shown in Figure 23. It can be seen that the stations with the highest B[a]P/B[ghi]P ratio are those where there is significant solid fuel use (the three stations in Northern Ireland and Kinlochleven), and those stations which are influenced by industrial process. The Network station with the lowest B[a]P/B[ghi]P ratio is London Marylebone Road, which is this station most strongly influenced by traffic activity. The other traffic / urban station on the Network, London Crystal Palace Parade exhibits a very low B[a]P/B[ghi]P ratio, as do also the vast majority of the background / rural stations. A recent study that used PAH Network data taken with Andersen samplers [29] found ratios of B[a]P/B[ghi]P lower than those calculated here: ratios of < 0.6 were found at nine of the 12 stations

NPL Report AS 71
36
studied, with no obvious correlation between the calculated B[a]P/B[ghi]P ratio and the station type. However, these data were all obtained from samples taken for a period of two weeks using Andersen samplers, so these differences may be an artefact of the known effects of PAH degradation for samples taken for extended periods of time. The same study also casts doubt on the use of diagnostic ratios for source apportionment in the UK (unless monitoring is carried out close to the point source) at it suggests that any PAHs in ambient air are quickly ‘blended’ away from their sources, and undergo atmospheric reactions. The UK data in [29] and Figure 23 do indeed appear to contradict an earlier study [30], which reported that a ratio of B[a]P/B[ghi]P < 0.6 was indicative of PAHs emitted from non-traffic sources. In Figure 23, the two traffic / urban stations (London Marylebone Road and London Crystal Palace Parade) have the lowest and third lowest B[a]P/B[ghi]P ratio of all Network stations, and the B[a]P/B[ghi]P ratio at every station is > 0.6.
Figure 23. Ratio of the annual mean concentrations of B[a]P and B[ghi]P measured at all ‘A’ and ‘B’ stations during 2011. The extent of the correlation between PAHs can be investigated in more detail using principal component analysis (PCA). PCA allows consideration of a multivariate dataset (therefore more than just the two variables used in Figure 22) and enables the data to be plotted in two dimensions with respect to the axes which best describe the variability of the data set. In the resulting ‘loadings plot’ produced, the closer together analytes appear in the plot, the more correlated they are to each other. This correlation is stronger the nearer to the edge of the plot they are. Recent work at NPL [31] has used PCA, diagnostic ratios and a novel ‘combined PCA - diagnostic ratio approach’ to investigate the extent of the correlation of measured PAH concentrations at each of the Network stations from 2008 to 2010, and to reveal some information about the source apportionment of the PAHs.

NPL Report AS 71
37
Figure 24 shows the results of the PCA for the Network stations studied by using the mean concentration of each PAH recorded at each station over the time period investigated.
Figure 24. Loadings plot showing a projection of the variables of the PCA analysis (in this case the 14 PAHs considered) onto the first two principal components across all Network stations. The first two principal components encompass 98.7 % of the variability of the dataset. The abbreviations used in the Figure are: CPY = cyclopenta[c,d]pyrene, ANT = anthanthrene, BaA = benz[a]anthracene CHR = chrysene. The grouping identified by ‘other 10 PAHs’ includes B[a]P. Figure 24 shows a very strong correlation between the measured PAH concentrations at both stations – this is indicated by how all the PAHs are all located at, or very near the edge of the circle, and by the fact that all PAHs exhibit their largest projection onto the first principal component (the x-axis), which encompasses 93.4% of the variability of the dataset. These results can be plotted in principal component space to produce a scores plot (Figure 25), which enables the elucidation of the different source types impacting on the various UK stations. The stations are shown to lie in three clusters:
• A tight cluster of rural and urban stations, showing that there is very little variation in the type of emissions impacting on these locations.
• A grouping of the three stations in Northern Ireland where solid fuel use is extensive numbered 2, 8 & 18 on the chart).
• A grouping of six ‘industrial’ stations (i.e. stations influenced by major industrial processes): Middlesbrough (20), Port Talbot Margam (23), Royston (24), Scunthorpe Low Santon (25), Scunthorpe Town (26) and South Hindley (27),

NPL Report AS 71
38
Figure 25. Scores plot of the projection of the 30 Network stations studied onto the first two principal components. More detailed source apportionment information can be obtained by considering PAH diagnostic ratios. As an example, Figure 26 shows the following two diagnostic ratios plotted against each other:
• benzo[a]anthracene / (benzo[a]anthracene + chrysene) • indeno[1,2,3-cd]pyrene / (indeno[1,2,3-cd]pyrene + benzo[ghi]perylene)
Figure 26. Plot of the benzo[a]anthracene / (benzo[a]anthracene + chrysene) ratio against the indeno[1,2,3-cd]pyrene / (indeno[1,2,3-cd]pyrene + benzo[ghi]perylene) ratio for each Network stations.

NPL Report AS 71
39
Figure 26 provides a much clearer separation between the various sources of PAH, with separate clusters this time being observed for stations with high levels of solid fuel use (the three Northern Irish stations and Kinlochleven), the stations influenced by major industrial processes, rural stations and urban stations. Interestingly, the urban stations also begin to show some separation related to their influence to emissions from traffic. The IPY/(IPY+BPE) ratio decreases as the influence of traffic increases, with station 19 on the chart (London Marylebone Road) being the most extreme example of a traffic station on the PAH Network. Finally, the two approaches discussed above have been used in a ‘combined PCA – diagnostic ratio approach’, where PCA is carried on six selected diagnostic ratios. The results from this which are shown in Figure 27.
Figure 27. Scores plot of the projection of the six diagnostic PAH ratios considered onto the first two principal components. Figure 27 shows an even clearer delineation between groups of stations than shown in Figure 26, with areas of solid fuel use (the three stations in Northern Ireland and Kinlochleven) being even more distinct. The six stations influenced by major industrial sources can now be split further into four stations influenced by emissions from steel works (stations 20, 23, 25 & 26) and the two stations influenced by emissions from coke works (stations 24 & 27). The rural stations also form a distinct set, and are clearly separated from all other stations except for the four stations in South Wales(stations 7, 22, 23 & 30), which appear to be grouped together – this may indicate a unique PAH pollution climate in South Wales. The urban stations again show a transition from those of background nature to those of traffic nature and station 19 (London Marylebone Road) still stands out as having significantly different characteristics to the other urban traffic stations.

NPL Report AS 71
40
8 OTHER ACTIVITIES RELATED TO THE NETWORK 8.1 STANDARDISATION & OTHER INTERNATIONAL ACTIVITIES NPL continues to represent the UK’s interests on CEN TC264 WG21 (measurement method for B[a]P in ambient air). The activities of CEN TC264 WG21 during 2011 include:
• The CEN deposition standard, EN 15980:2011 - ‘Air quality — Determination of the deposition
of benz[a]anthracene, benzo[b]fluoranthene, benzo[j]fluoranthene, benzo[k]fluoranthene, benzo[a]pyrene, dibenz[a,h]anthracene and indeno[1,2,3-cd]pyrene’ [20] has now been published.
• Development of a draft Technical Speciation for the analysis of the PAHs specified by the Fourth Daughter Directive (other than B[a]P) in ambient air [5], which is expected to be published during 2012.
• Production of the first draft of a detailed Technical Report on oxy- and nitro-PAHs. The final report will include information on the origin, toxicity and ambient air concentrations of oxy- and nitro-PAHs, and suitable sampling and analytical methods for their measurement.
Other international activities of note include:
• Drafting of an AQUILA position paper on the revision on the Fourth Daughter Directive. NPL has led the development of the proposals for PAHs, heavy metals, OC/EC, VOCs and average exposure indicators.
• Two New NIST SRMs (standard reference materials) are available which are certified for PAHs (and a wide range of other analytes) in particulate matter: NIST SRMs 2786 & 2787. These SRMs were prepared from atmospheric particulate material collected from an air intake filtration system of a major exhibition centre in Prague. The collected particulate matter was re-suspended and then re-collected in different size fractions (< 4 μm for NIST SRM 2786 and < 10 μm for NIST SRM 2787). The latter of these will therefore be a useful validation tool for analytical laboratories, and will complement the recently-released PM10 European certified reference material (CRM) for PAHs, ERM-CZ100.
8.2 PAPERS AND PRESENTATIONS • NPL has co-authored a peer-reviewed paper reviewing methods for measuring PAHs in air: S. K.
Pandey, K-H. Kim and R. J. C. Brown, A review of techniques for the determination of polycyclic aromatic hydrocarbons in air, Trends in Analytical Chemistry, 30, 2011, 1716-1739.
• An NPL report, Polycyclic aromatic hydrocarbons in Northern Ireland, has been published as part of the PAHs in Northern Ireland work (see section 8.3).
• Dr Richard Brown (NPL) gave a presentation – The past, present and future of Metals and PAH
monitoring in the UK – at the RSC-AAMG ‘Monitoring Ambient Air 2011’ conference, London, 12 December 2011.

NPL Report AS 71
41
8.3 PAHs IN NORTHERN IRELAND The contract for the operation of the Network for the period 2010-2014 included the requirement to assess and model the concentrations of PAH in Northern Ireland for the Department of Environment Northern Ireland (DoENI). This work was completed in 2011, and the results and findings from the work were subsequently presented to a meeting of DoENI and Northern Irish district council representatives in Hillsborough on 8 February 2012, and published as an NPL Report [14]. The report contained the following recommendations to reduce the concentrations of PAHs in Northern Ireland:
1. Gas conversion schemes for privately owned/let homes ought to be encouraged, perhaps through the provision of financial support to aid the rate of conversion across Northern Ireland. Further conversions will help to reduce B[a]P emissions and concentrations as well as PM10 concentrations.
2. Increase the availability of natural gas through extending current pipelines and encouraging uptake in areas already served.
3. Continue / improve promotion of current energy efficiency schemes to increase the uptake rate and hence reduce emissions and improve quality of life.
4. Smoke control areas ought to be effectively enforced and the areas covered by smoke control legislation should be examined.
5. Use spare Aethalometers to quickly and cheaply screen projected hotspot areas for elevated PAH concentration prior to making measurements using the filter based method.
The fourth recommendation listed above was highlighted as being potentially able to deliver reduced reduce B[a]P emissions in a cost-effective manner.
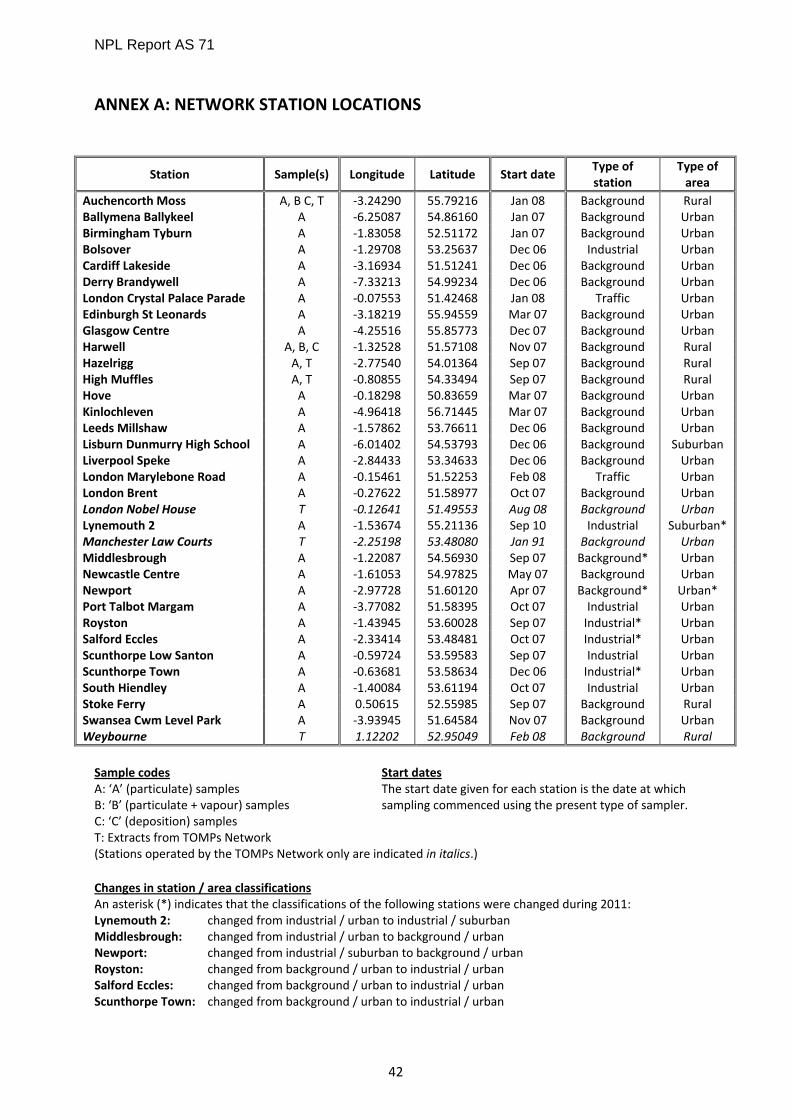
NPL Report AS 71
42
ANNEX A: NETWORK STATION LOCATIONS
Station Sample(s) Longitude Latitude Start date Type of station
Type of area
Auchencorth Moss A, B C, T -3.24290 55.79216 Jan 08 Background Rural Ballymena Ballykeel A -6.25087 54.86160 Jan 07 Background Urban Birmingham Tyburn A -1.83058 52.51172 Jan 07 Background Urban Bolsover A -1.29708 53.25637 Dec 06 Industrial Urban Cardiff Lakeside A -3.16934 51.51241 Dec 06 Background Urban Derry Brandywell A -7.33213 54.99234 Dec 06 Background Urban London Crystal Palace Parade A -0.07553 51.42468 Jan 08 Traffic Urban Edinburgh St Leonards A -3.18219 55.94559 Mar 07 Background Urban Glasgow Centre A -4.25516 55.85773 Dec 07 Background Urban Harwell A, B, C -1.32528 51.57108 Nov 07 Background Rural Hazelrigg A, T -2.77540 54.01364 Sep 07 Background Rural High Muffles A, T -0.80855 54.33494 Sep 07 Background Rural Hove A -0.18298 50.83659 Mar 07 Background Urban Kinlochleven A -4.96418 56.71445 Mar 07 Background Urban Leeds Millshaw A -1.57862 53.76611 Dec 06 Background Urban Lisburn Dunmurry High School A -6.01402 54.53793 Dec 06 Background Suburban Liverpool Speke A -2.84433 53.34633 Dec 06 Background Urban London Marylebone Road A -0.15461 51.52253 Feb 08 Traffic Urban London Brent A -0.27622 51.58977 Oct 07 Background Urban London Nobel House T -0.12641 51.49553 Aug 08 Background Urban Lynemouth 2 A -1.53674 55.21136 Sep 10 Industrial Suburban* Manchester Law Courts T -2.25198 53.48080 Jan 91 Background Urban Middlesbrough A -1.22087 54.56930 Sep 07 Background* Urban Newcastle Centre A -1.61053 54.97825 May 07 Background Urban Newport A -2.97728 51.60120 Apr 07 Background* Urban* Port Talbot Margam A -3.77082 51.58395 Oct 07 Industrial Urban Royston A -1.43945 53.60028 Sep 07 Industrial* Urban Salford Eccles A -2.33414 53.48481 Oct 07 Industrial* Urban Scunthorpe Low Santon A -0.59724 53.59583 Sep 07 Industrial Urban Scunthorpe Town A -0.63681 53.58634 Dec 06 Industrial* Urban South Hiendley A -1.40084 53.61194 Oct 07 Industrial Urban Stoke Ferry A 0.50615 52.55985 Sep 07 Background Rural Swansea Cwm Level Park A -3.93945 51.64584 Nov 07 Background Urban Weybourne T 1.12202 52.95049 Feb 08 Background Rural
Sample codes Start dates A: ‘A’ (particulate) samples The start date given for each station is the date at which B: ‘B’ (particulate + vapour) samples sampling commenced using the present type of sampler. C: ‘C’ (deposition) samples T: Extracts from TOMPs Network (Stations operated by the TOMPs Network only are indicated in italics.) Changes in station / area classifications An asterisk (*) indicates that the classifications of the following stations were changed during 2011: Lynemouth 2: changed from industrial / urban to industrial / suburban Middlesbrough: changed from industrial / urban to background / urban Newport: changed from industrial / suburban to background / urban Royston: changed from background / urban to industrial / urban Salford Eccles: changed from background / urban to industrial / urban Scunthorpe Town: changed from background / urban to industrial / urban

NPL Report AS 71
43
ANNEX B: SUMMARY OF EQUIPMENT SERVICING, BREAKDOWN AND MAINTENANCE ISSUES DURING 2011
Station Issue(s) Auchencorth Moss A • Sampler replaced
• Motor replaced Auchencorth Moss B - Ballymena Ballykeel - Birmingham Tyburn - Bolsover - Cardiff Lakeside • Sampler re-sealed to stop water ingress Derry Brandywell - London Crystal Palace Parade • Motor replaced Edinburgh St Leonards - Glasgow Centre • Motor replaced Harwell A - Harwell B - Hazelrigg - High Muffles • Motor replaced Hove - Kinlochleven • Motor replaced Leeds Millshaw - Lisburn Dunmurry High School • Motor replaced Liverpool Speke - London Marylebone Road - London Brent - Lynemouth 2 - Middlesbrough • Station electricity meter replaced Newcastle Centre - Newport - Port Talbot Margam - Royston - Salford Eccles - Scunthorpe Low Santon - Scunthorpe Town • Sampler filter changer occasionally jamming. Problem
rectified by the LSO and equipment support unit South Hiendley • Sampler re-located
• Motor replaced Stoke Ferry • Motor replaced Swansea Cwm Level Park -

NPL Report AS 71
44
ANNEX C: MONTHLY & ANNUAL MEAN B[a]P CONCENTRATIONS – ‘A’ & ‘B’ STATIONS
Station Mean B[a]P concentration / ng.m-3
Jan Feb Mar Apr May Jun Jul Aug Sep Oct Nov Dec Annual mean
Auchencorth Moss A <0.008 <0.028 0.061 0.020 0.015 0.007 0.010 <0.015 <0.009 0.013 0.051 0.030 0.020 Auchencorth Moss B 0.073 <0.005 0.058 0.035 0.010 0.008 0.013 0.011 0.006 0.014 0.077 0.047 0.027 Ballymena Ballykeel 4.0 2.3 1.1 0.37 0.26 0.21 0.17 0.18 0.21 0.62 1.4 2.6 1.1 Birmingham Tyburn 0.36 0.26 0.17 0.18 0.056 0.079 0.089 0.23 0.060 0.18 0.51 - 0.20 Bolsover 0.67 0.25 0.42 0.17 0.045 0.046 0.071 0.066 0.039 0.11 0.60 0.17 0.22 Cardiff Lakeside 0.34 0.23 0.087 0.14 0.054 0.042 0.094 0.098 0.043 0.13 0.24 0.14 0.13 Derry Brandywell 3.8 2.1 1.5 0.32 0.16 0.25 0.20 0.22 0.14 0.41 0.80 0.91 0.95 London Crystal Palace Parade 0.33 0.34 0.25 0.12 0.060 0.068 0.080 0.068 0.067 0.13 0.29 0.22 0.15 Edinburgh St Leonards 0.26 0.20 0.13 0.035 0.030 0.030 0.029 0.043 0.015 0.049 0.18 0.19 0.099 Glasgow Centre 0.62 0.66 0.20 0.058 0.046 0.038 0.044 0.043 0.025 0.058 0.37 0.19 0.19 Harwell A 0.17 0.11 0.083 0.043 0.063 0.019 0.043 0.049 0.015 0.040 0.18 0.059 0.073 Harwell B 0.14 <0.003 0.081 <0.014 0.021 0.014 0.047 0.063 0.016 0.032 0.23 0.071 0.054 Hazelrigg 0.22 0.13 0.071 0.030 0.020 0.012 0.016 0.044 0.020 0.038 0.13 0.067 0.064 High Muffles 0.16 0.17 0.11 0.029 0.028 0.025 0.037 0.018 0.028 0.068 0.14 0.081 0.061 Hove 0.54 0.23 0.17 0.084 0.050 0.020 0.031 0.027 0.017 0.072 0.28 0.36 0.15 Kinlochleven 1.3 0.39 0.36 0.18 0.041 0.035 0.016 0.044 0.059 0.18 0.20 0.63 0.28 Leeds Millshaw 0.57 0.34 0.51 0.15 0.084 0.10 0.14 0.087 0.091 0.29 0.74 0.26 0.27 Lisburn Dunmurry High School 3.9 1.4 0.98 0.13 0.078 0.089 0.077 0.14 0.070 0.34 1.4 1.1 0.86 Liverpool Speke 0.55 0.24 0.41 0.13 0.038 0.061 0.054 0.062 0.027 0.058 0.41 0.19 0.19 London Marylebone Road 0.73 0.42 0.083 0.15 0.035 0.098 0.085 0.071 0.093 0.21 0.48 0.19 0.22 London Brent 0.35 0.25 0.17 0.081 0.10 0.054 0.054 0.054 0.044 0.12 0.36 0.24 0.16 Lynemouth 2 0.65 0.52 0.27 0.26 0.23 0.090 0.083 0.13 0.12 0.25 0.51 0.45 0.30 Middlesbrough 0.55 0.31 0.78 0.75 0.19 0.28 0.32 0.31 0.044 0.092 0.45 0.17 0.35 Newcastle Centre 0.66 0.35 0.21 0.080 0.063 0.065 0.12 0.092 0.045 0.11 0.32 0.15 0.18 Newport 0.53 0.21 0.23 0.11 0.054 0.062 0.071 0.11 0.046 0.065 0.27 0.21 0.14 Port Talbot Margam 0.81 0.58 0.78 0.83 0.15 0.17 0.33 0.18 0.18 0.25 0.40 0.33 0.40 Royston 2.2 0.53 0.96 1.4 0.54 0.70 1.6 0.49 0.15 0.29 1.1 0.63 0.84 Salford Eccles 0.64 0.23 0.43 0.13 0.044 0.074 0.084 0.076 0.042 0.25 0.70 0.31 0.25 Scunthorpe Low Santon 3.7 4.6 1.5 1.5 3.5 1.8 1.4 3.9 2.2 2.7 1.6 7.3 3.0 Scunthorpe Town 2.8 1.6 2.0 1.7 2.0 0.56 0.89 0.80 0.35 0.46 2.9 0.30 1.3 South Hiendley 1.7 0.90 0.75 0.51 0.64 0.35 0.23 0.49 0.43 0.40 1.4 0.87 0.69 Stoke Ferry 0.55 0.18 0.14 0.037 0.031 0.021 0.024 0.096 0.023 0.063 0.21 0.13 0.12 Swansea Cwm Level Park 0.56 0.36 0.45 0.24 0.12 0.36 0.19 0.14 0.097 0.24 0.56 0.19 0.27

NPL Report AS 71
45
ANNEX D: FOUR-WEEKLY & ANNUAL MEAN B[a]P CONCENTRATIONS – ‘C’ (DEPOSITION) STATIONS
Period Start date End date Mean B[a]P concentration / ng.m-2.d-1
Auchencorth Moss C Harwell C
1 * 05.01.2011 16.02.2011 < 4.9 < 4.9 2 16.02.2011 16.03.2011 < 6.1 8.5 3 16.03.2011 13.04.2011 < 3.8 32 4 13.04.2011 11.05.2011 64 < 49 5 11.05.2011 08.06.2011 25 32 6 08.06.2011 06.07.2011 18 14 7 06.07.2011 03.08.2011 < 51 < 51 8 03.08.2011 31.08.2011 < 359 < 359 9 31.08.2011 28.09.2011 < 61 < 61
10 28.09.2011 26.10.2011 < 51 < 51 11 26.10.2011 23.11.2011 < 3.8 < 3.8 12 23.11.2011 21.12.2011 < 114 < 114 13 21.12.2011 18.01.2012 < 114 < 114
Annual mean: 35 34 Note * Period 1 encompasses six (not four) weeks.

NPL Report AS 71
46
ANNEX E: QUARTERLY & ANNUAL MEAN B[a]P CONCENTRATIONS – TOMPs NETWORK SAMPLES
Station Mean B[a]P concentration / ng.m-3
Q1 Q2 Q3 Q4 Annual mean *
Auchencorth Moss 0.027 < 0.0019 < 0.023 < 0.020 0.012 Hazelrigg < 0.0019 0.0079 < 0.018 0.044 0.012 High Muffles 0.029 0.016 0.022 0.044 0.027 London Nobel House 0.012 0.017 < 0.020 0.075 0.029 Manchester Law Courts 0.047 0.031 0.026 0.10 0.052 Weybourne < 0.021 0.028 0.036 0.068 0.044
Note * As the sampling periods for the TOMPs Network do not align exactly with the quarters of the year, the ‘annual means’ stated above do not in all cases cover the whole calendar year. The actual period covered for each station is:
• Auchencorth Moss: 01.01.11 – 31.12.11 • Hazelrigg: 01.01.11 – 26.12.11 • High Muffles: 01.01.11 – 29.12.11 • London Nobel House: 01.01.11 – 31.12.11 • Manchester Law Courts: 01.01.11 – 29.12.11 • Weybourne: 01.01.11 – 29.12.11

NPL Report AS 71
47
REFERENCES [1] WHO International Agency for Research on Cancer Monographs Evaluation of Carcinogenic
Risks to Humans: Volume 34 Polynuclear Aromatic Compounds, Part 3, Industrial Exposures in Aluminium Production, Coal Gasification, Coke Production and Iron and Steel Founding, 1998.
[2] Directive 2004/107/EC of the European Parliament and of the Council of 15 December 2004
relating to arsenic, cadmium, mercury, nickel and polycyclic aromatic hydrocarbons in ambient air, Official Journal L 023, 26/01/2005 P. 0003-0016.
[3] Ambient air pollution by polycyclic aromatic hydrocarbons (PAH): Position Paper, Office for
Official Publications of the European Communities, Luxembourg, 2001. [4] EN 15549:2008, Air quality – Standard method for the measurement of the concentration of
benzo[a]pyrene in ambient air. [5] CEN TC 264 WG 21 working document number N 287 (June 2012), Ambient air —
Measurement of benz[a]anthracene, benzo[b]fluoranthene, benzo[j]fluoranthene, benzo[k]fluoranthene, dibenz[a,h]anthracene, indeno[1,2,3-cd]pyrene and benzo[ghi]perylene.
[6] Directive 96/62/EC of 27 September 1996 on ambient air quality assessment and
management, Official Journal L 296, 21/11/1996, 55-63. [7] European Commission staff working paper on the implementation of EU air preparing for its
comprehensive review, SEC (2011) 342 final. [8] Directive 2008/50/EC of the European Parliament and of the Council of 21 May 2008 on
ambient air quality and cleaner air for Europe, Official Journal L 152, 11/06/2008, 1-44. [9] Polycyclic Aromatic Hydrocarbons, Expert Panel on Air Quality Standards report, The
Stationery Office, 1999. http://webarchive.nationalarchives.gov.uk/20060715141954/http:/www.defra.gov.uk/environment/airquality/aqs/index.htm
[10] The Air Quality Strategy for England, Scotland, Wales and Northern Ireland, Defra, the
Scottish Executive, Welsh Assembly Government and Department of the Environment Northern Ireland, 2007.
[11] N. R. Passant, T. P. Murrells, A. Misra, Y. Pang, H. L. Walker, R. Whiting, C. Walker, N. C. J.
Webb and J. MacCarthy, UK Informative Inventory Report (1980 to 2010), AEA Group, 2012. [12] A. S. Brown, D. M. Butterfield, R. J. C. Brown, P. Hughey, K. J. Whiteside, S. L. Goddard and M.
Williams, Annual Report for 2010 on the UK PAH Monitoring and Analysis Network, NPL Report number AS 62 (2011).
[13] N. R. Passant, A. Wagner, T. P. Murrells, Y. Li, S. Okamura, G. Thistlethwaite, S. Okamura, G.
Thistlethwaite, H. L. Walker, C. Walker, R. Whiting, S. Sneddon, R. A. Stewart, N. C. J. Brophy, J. MacCarthy, I. Tsagatakis and T. Bush, UK Informative Inventory Report (1980 to 2009), AEA Group, 2011.

NPL Report AS 71
48
[14] D. M. Butterfield and R. J. C. Brown, Polycyclic aromatic hydrocarbons in Northern Ireland,
NPL Report number AS 66 (2012). [15] The Convention for the Protection of the Marine Environment of the North-East Atlantic:
www.ospar.org [16] United Nations Economic Commission for Europe Convention on Long-range Transboundary
Air Pollution: www.unece.org/env/lrtap [17] E. Menichini, On-filter degradation of particle-bound benzo[a]pyrene by ozone during air
sampling: A review of the experimental evidence of an artefact, Chemosphere, 2009, 77, 1275-1284.
[18] Draft prEN 12341 (July 2012), Ambient air – Standard gravimetric measurement method for
the determination of the PM10 or PM2.5 mass concentration of suspended particulate matter. [19] EN 12341:1998, Air quality – Determination of the PM10 fraction of suspended particulate
matter – Reference method and field test procedure to demonstrate reference equivalence of measurement methods.
[20] EN 15980:2011, Air quality – Determination of the deposition of benz[a]anthracene,
benzo[b]fluoranthene, benzo[j]fluoranthene, benzo[k]fluoranthene, benzo[a]pyrene, dibenz[a,h]anthracene and indeno[1,2,3-cd]pyrene.
[21] Annual Report for 2007 on the UK PAH Monitoring and Analysis Network, AEA Technology
Report number AEAT/R/2686 (2008). [22] E. Grandesso, K. Kowalewski and P. Pérez Ballesta, First EC-JRC PAHs inter-laboratory
comparison on PM10 quartz filters, JRC Scientific and Technical Report EUR 25170 EN (2012). [23] D. Butterfield, S. Beccaceci, P. Quincey, B. Sweeney, K. Whiteside, G. Fuller, D. Green and A.
Grieve, 2011 Annual Report for the UK Black Carbon Network, Draft NPL Report (2012). [24] M. Possanzini, V. Di Palo, P. Gigliucci, M. Concetta, T. Scianò and A. Cecinato, Determination
of particulate-phase distributed PAH in Rome ambient air by a denuder/GC-MS method, Atmospheric Environment, 2004, 38, 1727-1734.
[25] Annual Report for 2008 on the UK PAH Monitoring and Analysis Network, AEA Technology
Report number AEAT/ENV/R/2905 (2009). [26] Annual Report for 2009 on the UK PAH Monitoring and Analysis Network, AEA Technology
Report number EAT/ENV/R/3059 (2010). [27] R. J. C. Brown, Comparison of estimated annual emissions and measured annual ambient
concentrations of metals in the UK 1980-2007, Journal of Environmental Monitoring, 2010, 12, 665-671.
[28] R. J. C. Brown, S. L. Goddard and A. S. Brown, Using principal component analysis to detect
outliers in ambient air monitoring studies, International Journal of Environmental Analytical Chemistry, 2010, 90, 761-772.

NPL Report AS 71
49
[29] A. Katsoyiannis, A. J. Sweetman, and K. C. Jones, PAH molecular diagnostic ratios applied to
atmospheric sources: a critical evaluation using two decades of source inventory and air concentration data from the UK, Environmental Science & Technology, 2011, 45, 8897-8906.
[30] M. B. Yunker, R. W. Macdonald, R. Vingarzan, R. H. Mitchell, D. Goyette and S. Sylvestre,
PAHs in the Fraser river basin: A critical appraisal of PAH ratios as indicators of PAH sources and composition, Organic Geochemistry, 2002, 33, 489–515.
[31] A. S. Brown and R J. C. Brown, Correlations in polycyclic aromatic hydrocarbon (PAH)
concentrations in UK ambient air and implications for source apportionment, Journal of Environmental Monitoring, 14, 2012, 2072-2082.