annual report & financial statements - university of sheffield/file/annual... · financial...
TRANSCRIPT

Annual Report & Financial Statements 2013–2014.


1
Annual Report 2013–2014
ContentsVice-Chancellor’s introduction 2
Foreword by the Chairman 6
Operating and financial review 8
Report of the Treasurer 8
Research and innovation 17
The student experience 18
Engaged University and Sheffield City Region 20
Strategic planning 22
Strategies 23
Our students 24
Rankings 30
Our University at a glance 32
Financial Statements 2013–2014 33

It is with tremendous pride in the work and achievements of the staff and students that I am writing the introduction to the Annual Report for The University of Sheffield for the period of 2013 to 2014.
The pages that follow this introduction provide statistics and examples of attainment which reflect not only talent and commitment, but also a determination to focus our resources on our core values.
The headlines tell an encouraging story. In purely financial terms, our income over the period has grown by 11.3 per cent, with tuition fees now 42.3 per cent of total income. We have achieved our operating surplus target of 3 per cent in each of last five years and have financial plans in place to achieve our medium-term target of 4.5 per cent – a much needed buffer to the loss of public funding of capital improvements and in the face of unpredictable changes in student recruitment.
However, what really matters is the work behind these figures. Consistently strong performance in research remains a hallmark of Sheffield’s national and international reputation. In addition to the quality of peer-reviewed research carried out by individual academics across the faculties, we have seen the growth of collaborative research on key themes such as food security and energy, advanced manufacturing, sustainable cities and new approaches to medical challenges such as infectious disease resistance and medical engineering. This success in research is all the more admirable as it has been achieved despite a wider national picture of reducing public and private funding making this success increasingly challenging.
The quality of our teaching and the experience of our students went from strength to strength over 2013–14, and we were pleased to see very real successes in the recruitment in all disciplines of exceptionally talented students from the UK and internationally.
National rankings also delivered a series of firsts to the University in such vital areas as the exceptional quality of our Library Services in underpinning academic success. The close relationship we treasure with the Number One Students’ Union in the UK also led to a whole University approach to student satisfaction. This partnership in depth was a crucial factor in the University receiving the wonderful accolade of being named First for Student Experience in the country – a tribute all the more meaningful as it was determined from the experience of our students themselves.
Working in partnership with students is indeed a key theme of the period covered by this Annual Report, and reflects the fact that students at The University of Sheffield are far more than simply consumers of a
Vice-Chancellor’s introduction
Professor Sir Keith Burnett, Vice-Chancellor
Vice-Chancellor’s introduction
2
Working in partnership with students is indeed a key theme of the period covered by this Annual Report, and reflects the fact that students at The University of Sheffield are far more than simply consumers of a university education.
university education. Our students are rather a vital part of our University from its governance to the daily workings of ensuring that we continually improve against our own rigorous standards of education and scholarship, challenging us to avoid complacency and to constantly address the needs of a changing society in ways which are relevant. Time and again this year, students from over 100 countries around the world have excelled not only within their own studies, but in social enterprise, volunteering and developing the programmes and approaches which are aligned with the instinct of our staff to translate our research and teaching into genuine benefit for individuals and society.
To make our aspirations a reality, however, our University must be both financially secure and alert to the many challenges we face in the wider Higher Education environment. Success in securing research funding, recruitment of the most talented home and international students and partnerships with leading companies are far more than metrics which stand alone for their own sake – our achievements have a powerful purpose. They are essential if we are to make a difference in the world, and to have the freedom to shape our own future.
A University committed to making a difference
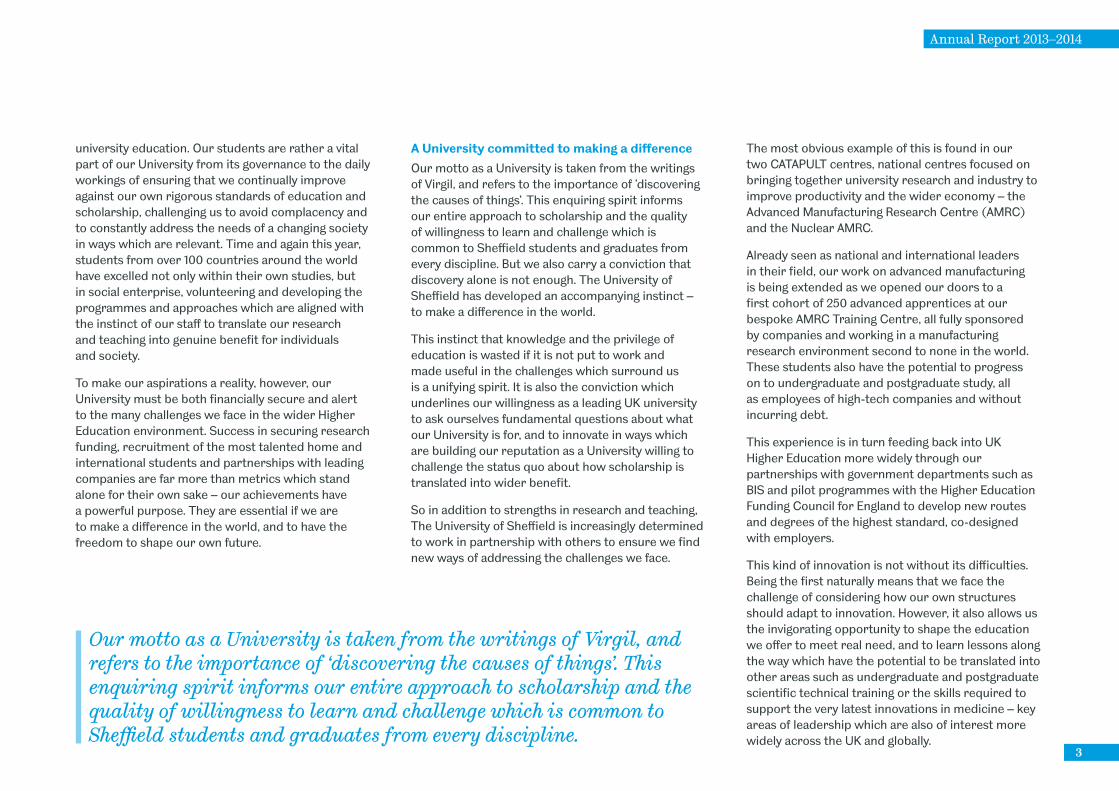
Our motto as a University is taken from the writings of Virgil, and refers to the importance of ‘discovering the causes of things’. This enquiring spirit informs our entire approach to scholarship and the quality of willingness to learn and challenge which is common to Sheffield students and graduates from every discipline. But we also carry a conviction that discovery alone is not enough. The University of Sheffield has developed an accompanying instinct – to make a difference in the world.
This instinct that knowledge and the privilege of education is wasted if it is not put to work and made useful in the challenges which surround us is a unifying spirit. It is also the conviction which underlines our willingness as a leading UK university to ask ourselves fundamental questions about what our University is for, and to innovate in ways which are building our reputation as a University willing to challenge the status quo about how scholarship is translated into wider benefit.
So in addition to strengths in research and teaching, The University of Sheffield is increasingly determined to work in partnership with others to ensure we find new ways of addressing the challenges we face.
The most obvious example of this is found in our two CATAPULT centres, national centres focused on bringing together university research and industry to improve productivity and the wider economy – the Advanced Manufacturing Research Centre (AMRC) and the Nuclear AMRC.
Already seen as national and international leaders in their field, our work on advanced manufacturing is being extended as we opened our doors to a first cohort of 250 advanced apprentices at our bespoke AMRC Training Centre, all fully sponsored by companies and working in a manufacturing research environment second to none in the world. These students also have the potential to progress on to undergraduate and postgraduate study, all as employees of high-tech companies and without incurring debt.
This experience is in turn feeding back into UK Higher Education more widely through our partnerships with government departments such as BIS and pilot programmes with the Higher Education Funding Council for England to develop new routes and degrees of the highest standard, co-designed with employers.
This kind of innovation is not without its difficulties. Being the first naturally means that we face the challenge of considering how our own structures should adapt to innovation. However, it also allows us the invigorating opportunity to shape the education we offer to meet real need, and to learn lessons along the way which have the potential to be translated into other areas such as undergraduate and postgraduate scientific technical training or the skills required to support the very latest innovations in medicine – key areas of leadership which are also of interest more widely across the UK and globally.
3
Annual Report 2013–2014
Our motto as a University is taken from the writings of Virgil, and refers to the importance of ‘discovering the causes of things’. This enquiring spirit informs our entire approach to scholarship and the quality of willingness to learn and challenge which is common to Sheffield students and graduates from every discipline.
Vice-Chancellor’s introduction
4
A University which works with others to lead the way
Underlying much of this innovation is a willingness to listen to our partners in our local communities and city, in industry, to patients and partner institutions. An approach of genuine partnership in turn allows our University to lead change secure in the knowledge that we are meeting real need.
Examples of this abound, but the continued success of work such as the Sheffield Institute for Translational Neuroscience not only exemplifies a spirt of partnership with patients, researchers and medical practitioners urgently seeking breakthroughs in dealing with some of the world’s most widespread and difficult diseases, but also reflects fundamental partnerships with those who willingly give much needed financial support. United by a common determination to make a difference, world-leading research is backed by our alumni and philanthropic donors from all over the world in ways which are deeply inspiring.
Our work on sustainable futures is another area where partnership and philanthropy are bearing fruit – sometimes literally. Programmes on food security and environmental sustainability in key areas of research strength are drawing in both major philanthropic support, including a major donation from Jeremy and Hannelore Grantham’s Foundation, as well as the excitement of student and community activists delighted that our University’s research is being put to work in an essential area of global challenge.
From the support of access to postgraduate study to our campaign to welcome international students which is now supported not only by the UK government, British Council and National Union of Students, but also 100 universities across the UK, it is clear that The University of Sheffield is making its mark as a national leader eager to make change in partnership with others.
Looking to the future
However, the achievements and sense of purpose which are such a source of pride must not be a source of complacency.
UK universities face very real challenges. Flat or decreasing public funding in real terms cannot be without consequences. A persistent reduction in the resources available to UK teaching and research combined with a perception of growing negativity on issues such as immigration and overseas students risk the UK’s reputation as a global leader in international education.
Commentators looking to the future of UK Higher Education raise concerns over changing trends and levels of student funding, and risks around the cost of pensions, the need to attract overseas talent, and the impact of foreign policy on such vital streams of funding as international student fees and EU-funded research.
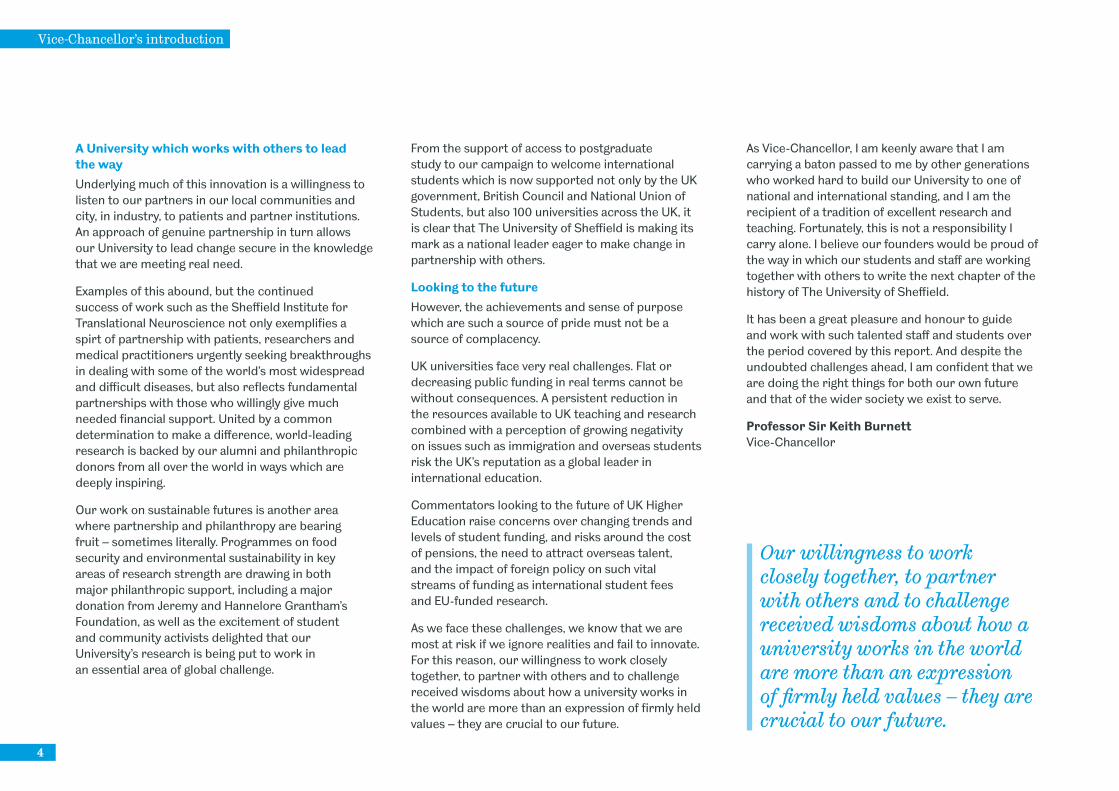
As we face these challenges, we know that we are most at risk if we ignore realities and fail to innovate. For this reason, our willingness to work closely together, to partner with others and to challenge received wisdoms about how a university works in the world are more than an expression of firmly held values – they are crucial to our future.
As Vice-Chancellor, I am keenly aware that I am carrying a baton passed to me by other generations who worked hard to build our University to one of national and international standing, and I am the recipient of a tradition of excellent research and teaching. Fortunately, this is not a responsibility I carry alone. I believe our founders would be proud of the way in which our students and staff are working together with others to write the next chapter of the history of The University of Sheffield.
It has been a great pleasure and honour to guide and work with such talented staff and students over the period covered by this report. And despite the undoubted challenges ahead, I am confident that we are doing the right things for both our own future and that of the wider society we exist to serve.
Professor Sir Keith BurnettVice-Chancellor
Our willingness to work closely together, to partner with others and to challenge received wisdoms about how a university works in the world are more than an expression of firmly held values – they are crucial to our future.

5
Annual Report 2013–2014

Despite continuing to face the challenge for Higher Education in the UK of a continuing national reduction in public funding for University research and teaching, 2013-14 has been a year of strong performance for the University of Sheffield.
Student recruitment was up on the previous year, with an increase in both undergraduate and postgraduate applications. For undergraduates, home and international recruitment saw an increase in applications of 16 per cent on the previous year and applications for postgraduate courses also increased.
Within the total number of students recruited, the University remains determined to seek to give access to study to people of talent from all backgrounds. This has required an increased number of scholarships, which has been made possible through the support of alumni and donors for which we are most grateful. Also, in this regard, an area of particular concern
has been that the true impact of an increase in undergraduate student fees would deter young people from considering the opportunity to continue to postgraduate level. To seek to offset this potential impact, we have worked closely with the Higher Education Funding Council for England to target access funding specifically towards high-quality potential postgraduate students who faced financial barriers to this level of study. We have led a national pilot with the biggest postgraduate scholarship scheme on record benefitting over 400 students.
Financially, the University’s position remains sound, with improved liquidity and reduced external borrowing as a percentage of income. This is particularly important in order to enable us to maintain the development of the high quality accommodation, which is so vital to our growth and success. In 2013-14 the University was able to make significant capital investment of almost £90 million.
A major example of our determination in this regard is the ongoing expansion of activities relating to engineering and advanced manufacturing. The superb facilities of the AMRC, which I highlighted last year, continue to expand, and planning permission has now been received for the construction of a £43 million Factory 2050 – the world’s first reconfigurable factory, with a unique ability to respond to changing production needs and to integrate the very latest state-of-the-art machinery and processes.
Also, work began on The Diamond, our biggest ever investment in teaching and learning. This £81 million six-storey building will provide world-class teaching and learning space for Engineering, as well as an expansion of IT and Library provision for students from across the University. And during the year we opened
the £21 million Pam Liversidge Building, providing state-of-the-art teaching and learning facilities for the Faculty of Engineering. The building includes an atrium named in recognition of a major gift to the Faculty of Engineering by Hong Kong businessman Sir S Y Cheung who himself came to The University of Sheffield on a postgraduate scholarship in 1948.
As a research intensive University, innovative research is a vital component of what we do. Through our 2022 Futures programme, we are making the step change required to ensure that our research can make the significant developments needed to address some of the world’s biggest challenges, such as infectious diseases and antimicrobial drug resistance.
At the heart of advances in understanding the fundamental biology behind this challenge is imaging. Imagine – Imaging life is our ambitious response to this need. With significant investment from EPSRC, MRC, the Wellcome Trust and the Wolfson Foundation to install state-of-the-art equipment, the Imagine – Imaging Life project is bringing together a unique combination of technology, specialist skills and academic expertise to enhance the University of Sheffield’s position as world-leading in biological imaging.
We see our university, not only as working in research and teaching for national and international benefit, but, vitally, as a key element of the life of our city region and its future economic development and I am delighted that the period covered by this Annual Report marked an increasingly close working relationship between the University and the city.
Foreword by the Chairman
Tony Pedder OBE, Chair of the University of Sheffield Council
Foreword by the Chairman
6

7
Annual Report 2013–2014
A particular example relates to the success of the AMRC and its links to post-16 education. I reported last year on the development of our pilot apprenticeship programme and to support this, in 2013-14 we opened the AMRC Training Centre as a state-of-the-art base for apprentice training. The apprentices we train, described by the Global Director of Manufacturing at Rolls-Royce as ‘a new kind of engineer’, are part of the University’s plans to open up new routes of progression in key vocational areas, and to offer opportunities for undergraduate and even postgraduate study while also gaining work experience and without incurring debt.
The University received a number of important accolades during the year. Of particular note, we were ranked number one for overall student satisfaction in the 2014 Times Higher Education Student Experience Survey. As well as the overall top spot, the University was number one for high-quality facilities (our refurbished Students’ Union Building was completed in the year), a good social life, good accommodation and a good Student’s Union. Student support, well-structured courses and our library service were also praised, and our Students’ Union has continued to be shortlisted for and to win a range of national awards, in particular for inspiring national campaigns in support of international students.
The quality of our student experience is vital and we continue to seek to enhance the support they need to ensure that they can translate a high-quality degree into excellent employment in an increasingly competitive and global job market.
I referred to our alumni earlier. They are a major asset of the University and we aim to continue to enhance our ongoing contact with them. Many continue to make their mark in a variety of ways across the globe including some receiving recognition through the British honours system. Among this category are award-winning authors Dr Joanne Harris, who was awarded an MBE, and Dame Hilary Mantel who became a Dame of the British Empire, both for their services to literature. Emeritus Professor Tony Crook was awarded a CBE for his services to housing and charitable governance, recognition of his outstanding commitment to work on housing research and policy.
In conclusion, I am delighted to report that 2013-14 has seen the University of Sheffield continue its proud tradition of top quality scholarship, research which delivers public and economic benefit, relentless focus on the interests of students and constructive civic engagement.
The sector is facing major challenges but I feel confident that our excellent staff will continue to meet these with professionalism and dedication to our mission.
Tony Pedder OBEChair of The University of Sheffield Council
2013-14 has been a year of strong performance for the University of Sheffield

Operating and financial review
88
Report of the Treasurer
Financial performance2013–14 has been another good year for the University and I am pleased to report an operating surplus of £20.4 million, which is 3.9 per cent of total income. Fee income and research income have both grown, offsetting declining HEFCE teaching and capital grants. Investment in our staff has continued so that we may continue to deliver our teaching and research ambitions into the future. We have also maintained investment in capital to deliver and provide the facilities to support these ambitions.
Summary income and expenditure account
Year ended 31 July 2014£m
Year ended 31 July 2013£m
Income
Grant income 99.2 107.5
Fee income 219.1 177.3
Research income 129.1 114.4
Other income 70.5 66.0
Total income 517.9 465.2
Expenditure
Staff costs 268.0 247.5
Other operating expenditure and interest payable 179.2 162.1
Depreciation 50.3 40.8
Total expenditure 497.5 450.4
Operating surplus 20.4 14.8
Profit on disposal of assets 0.4 –
Other items 0.1 (0.2)
Surplus on continuing operations 20.9 14.6
Historical cost adjustments 10.7 10.0
Historical cost surplus 31.6 24.6
David Young CBE, Treasurer
Financial highlights• Income growth of 11.3 per cent
• Operating surplus of £20.4 million (2012–13: £14.8 million)
• Cash generated from operations of £45.7 million (2012–13: £42.0 million)
• Continued capital investment of £89.8 million (2012–13: £107.9 million)

9
Annual Report 2013–2014
9
0%
2%
4%
6%
8%
10%
2013–142012–132011–122010–112009–10
Operating surplus as a percentage of income
4.5%
6.7%
4.3%
3.2%3.9%
EBITDA as a percentage of incomeOperating surplus as a percentage of income
Capital investment (£m)Net funds as a percentage of income
Key performance indicators
0%
3%
6%
9%
12%
15%
2013–142012–132011–122010–112009–10
EBITDA as a percentage of income
10.8%
13.2%
8.9%
7.4%8.7%
0%
3%
6%
9%
12%
15%
2013–142012–132011–122010–112009–10
Net funds as a percentage of income
0.5%
8.6%
12.5%
6.7%
4.8%
0
20
40
60
80
100
120
2013–142012–132011–122010–112009–10
Capital investment (£m)
53.0 54.7 54.7
107.9
89.9

Operating and financial review
1010
Income and expenditure accountOver the last five years, income has grown by an average of 5.3 per cent per annum to £517.9 million, with fee income increasingly becoming the dominant income stream.
0
100
200
300
400
500
600
Other income
Research grants and education contracts
Tuition fees and education contracts
Funding body grants
2013–142012–132011–122010–112009–10
£m
Income
Funding body grants
Tuition fees and education contracts
Research grants and contracts
Other income
Total income 2013–14
Total income (£m)
Funding body grants
Tuition fees and education contracts
Research grants and contracts
Other income
Over recent years, funding body grants have decreased, to be replaced by greater fee income, and this trend is expected to continue.
11
Annual Report 2013–2014
Research Councils
UK-based charities
Other research grants and contracts
11
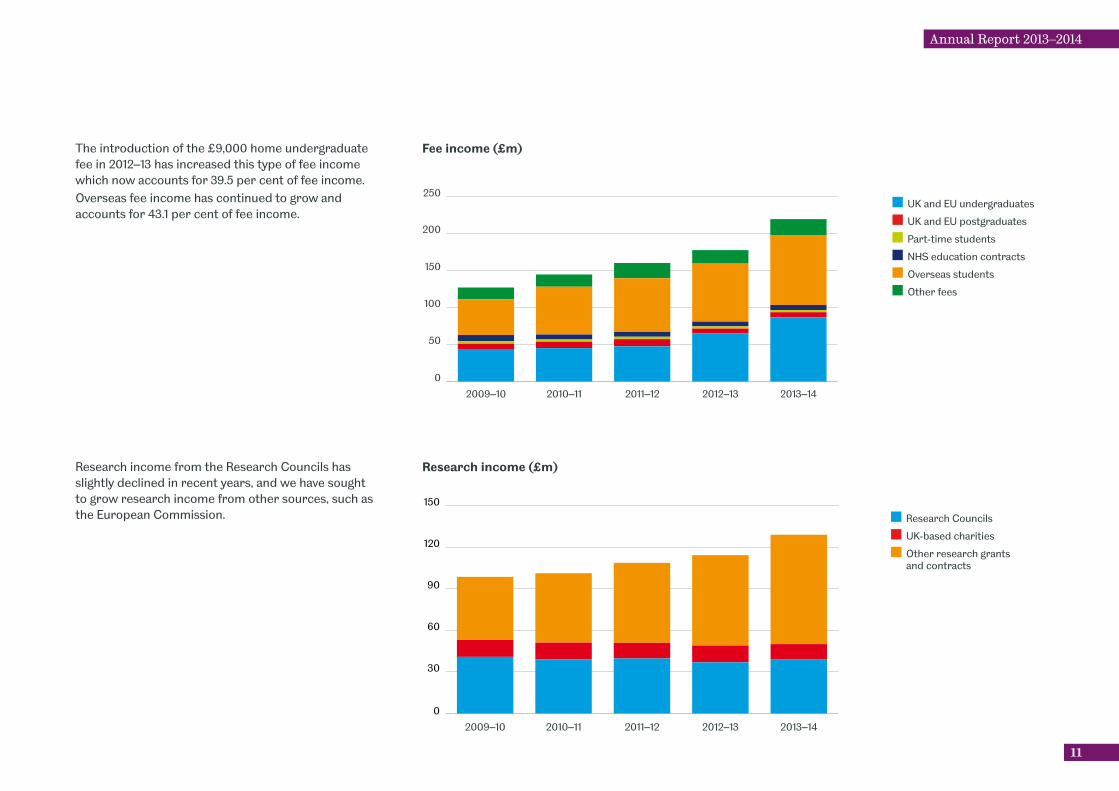
Research income from the Research Councils has slightly declined in recent years, and we have sought to grow research income from other sources, such as the European Commission.
Income
0
30
60
90
120
150
Other research grants and contracts
UK based charities
Research Councils
2013–142012–132011–122010–112009–10
Research income (£m)
The introduction of the £9,000 home undergraduate fee in 2012–13 has increased this type of fee income which now accounts for 39.5 per cent of fee income. Overseas fee income has continued to grow and accounts for 43.1 per cent of fee income.
UK and EU undergraduates
UK and EU postgraduates
Part-time students
NHS education contracts
Overseas students
Other fees
Fee income (£m)
0
50
100
150
200
250
Other fees
Overseas students
NHS education contracts
Part-time students
UK and EU postgraduates
UK and EU undergraduates
2013–142012–132011–122010–112009–10
£m
Income

Operating and financial review
1212
Staff costs remain our biggest single expenditure item.
Staff costs as a proportion of income have remained relatively constant since 2010–11 with investment in staff increasing in line with income growth.
Staff costs as a percentage of total incomeStaff costs as a percentage of total income
30%
35%
40%
45%
50%
55%
60%
HESA institutions average
Russell Group average
The University of Sheffield
2013–142012–132011–122010–112009–10
Expenditure
0
100
200
300
400
500
Depreciation
Other operating expenditure
Staff costs
2013–142012–132011–122010–112009–10
Total expenditure (£m)
Staff costs
Other operating expenditure
Depreciation
Expenditure has grown during the last five years by an average of 5.5 per cent per annum to £497.5 million. The proportions between the three expenditure categories have remained fairly consistent.

13
Annual Report 2013–2014
We have achieved our operating surplus target of 3 per cent in each of the last five years
13
Earnings before interest, taxation, depreciation and amortisation (EBITDA) enables institutional comparability, particularly as it excludes areas such as depreciation where institutions can apply a range of accounting policies. It is a proxy for cash flows and enables the University to have cash resources to fund capital and strategic initiatives.
Operating surplus as a percentage of total incomeGrant and fee income as % of total income
0%
1%
2%
3%
4%
5%
6%
7%
8%
4.5% target
3% target
The University of Sheffield
2013–142012–132011–122010–112009–10
EBITDA as a percentage of total incomeEBITDA as a percentage of total income
0%
3%
6%
9%
12%
15%
18%
HESA institutions average
Russell Group average
The University of Sheffield
2013–142012–132011–122010–112009–10
We have achieved our operating surplus target of 3 per cent in each of the last five years and have financial plans in place to achieve our medium term target of 4.5 per cent. The University uses revaluation accounting which results in higher depreciation charges and therefore lower operating surpluses when compared to many HE institutions.
Operating and financial review
1414
Discrectionary reserves as a percentage of total income
Current asset ratioCurrent asset ratio
0.0
0.5
1.0
1.5
2.0
2.5
3.0
HESA institutions average
Russell Group average
Target
The University of Sheffield
2013–142012–132011–122010–112009–10
Discrectionary reserves as a % of total income
0%
10%
20%
30%
40%
50%
60%
HESA institutions average
Russell Group average
Minimum
Target
The University of Sheffield
2013–142012–132011–122010–112009–10
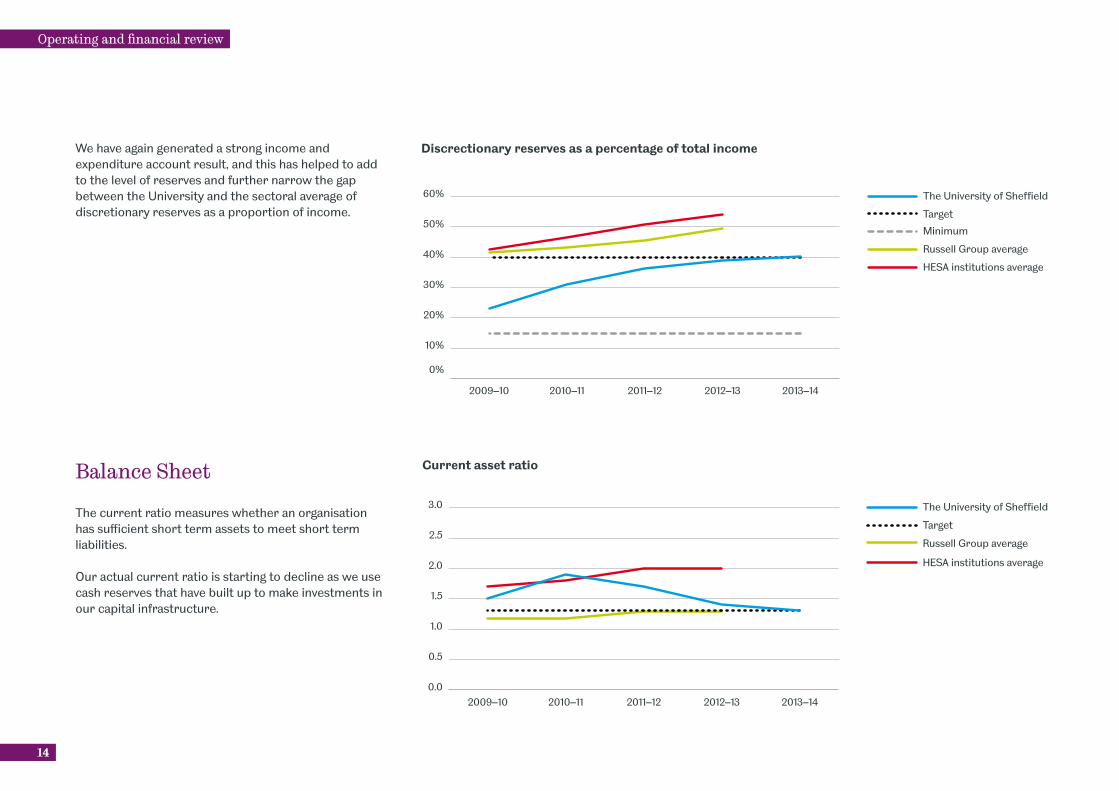
We have again generated a strong income and expenditure account result, and this has helped to add to the level of reserves and further narrow the gap between the University and the sectoral average of discretionary reserves as a proportion of income.
Balance Sheet
The current ratio measures whether an organisation has sufficient short term assets to meet short term liabilities.
Our actual current ratio is starting to decline as we use cash reserves that have built up to make investments in our capital infrastructure.

15
Annual Report 2013–2014
Capital expenditure and deferred capital grants (£m)
Expenditure
0
20
40
60
80
100
120Capital expenditure
2013–142012–132011–122010–112009–10
Deferred capital grants
Capital expenditure
15
Cash
Positive operating cash flows arising from healthy operating surpluses and externally funded capital investment has enabled us to remain in a net funds position throughout the last five years. In recent years, the increasing levels of self-financed capital expenditure have begun to reduce the net funds available.
Net funds (£m)Net funds (£m)
0
10
20
30
40
50
60 The University of Sheffield
2013–142012–132011–122010–112009–10
Capital
Capital expenditure in recent years has increased in line with capital investment plans. Whilst grant funding has declined, areas such as the AMRC continue to attract significant grant funding to invest in their infrastructure.

Conclusion2013–14 has been a healthy financial year. Income has grown significantly by 11.3 per cent, supporting investment in our capacity and a sound operating surplus of £20.4 million. We have continued to invest in our staff and facilities to maintain the level of resources required. Operations have generated the cash to allow us to continue to invest in, and deliver, our aspirations for the future. We are investing in buildings, such as The Diamond, to provide world class facilities for our teaching and research.
However, despite these healthy results and the significant changes in recent years, we face a period of uncertainty which will pose new challenges for us to address. We are planning for these challenges so that they will not become obstacles to our future aspirations.
The funding of home students, both undergraduate and postgraduate, declining UK funding of research, and major pension scheme pressures will all need to be addressed. We are continually reviewing our financial performance measures and targets to ensure that they remain fit for purpose throughout these challenging times.
Finally, I would like to join with the Vice-Chancellor in thanking our staff and students for enabling us to deliver our ambitions and the many successes of the past year.
David Young CBETreasurer
Operating and financial review
16
Atrium, Pam Liversidge Building
Students’ Union
AMRC Training Centre
Annual Report 2013–2014
17
We are among the top ten in the Russell Group, the association of leading UK research-intensive universities, according to the results of the independent 2008 Research Assessment Exercise (RAE).
Our research makes an impact on the wider world as well as benefiting the UK economy and its social, political and cultural life. The quality, breadth and volume of our research activity is demonstrated by the fact that research carried out by 93 per cent of the University’s academic staff submitted to the RAE is internationally recognised and in many cases world-leading. We’re collaborating with partners internationally and across Europe as well as nationally in the private, public and third sectors to find real world solutions to real world problems.
Among many significant research developments during the year, we were delighted to receive a £7.5 million boost for our world-leading lung imaging research. The grant, which is made up of £6.5 million from the Medical Research Council and a further £1 million from the British Heart Foundation, will allow the expansion of the ground-breaking image acquisition and processing facilities in Sheffield, in turn making the UK the leading nation in this important area of diagnostic pulmonary medicine.
We also won Investment from EPSRC (Engineering and Physical Sciences Research Council) into Centres for Doctoral Training (CDTs) to train the next generation of engineers and scientists - specialist areas being targeted as ‘vital for the UK’s economic growth’. A major part of the CDTs will involve collaboration with both national and international companies to bring both insight and relevance to the students’ training and reduce the gap between academic theory and industrial practice.
In total the University of Sheffield is receiving £17.5 million from EPSRC plus equivalent industry investment. This is in the five Sheffield-led CDTs and the three CDTs where the University of Sheffield is a partner.
Our research strategy upholds the ideals of discovery and acknowledges new ways of acquiring, investigating and developing knowledge. It also recognises universities’ wider responsibilities in applying knowledge. Our research culture supports academic freedom and independence, encourages radical thinking, and challenges orthodoxies.
It is the nature and scale of our interdisciplinary research that makes us stand out from other universities. We bring together people from diverse research backgrounds in virtual centres, physical institutes, or state-of-the-art environments designed to foster world-leading interdisciplinary research excellence. For the success and impact of our research knowledge transfer activities we are among the leading Russell Group universities.
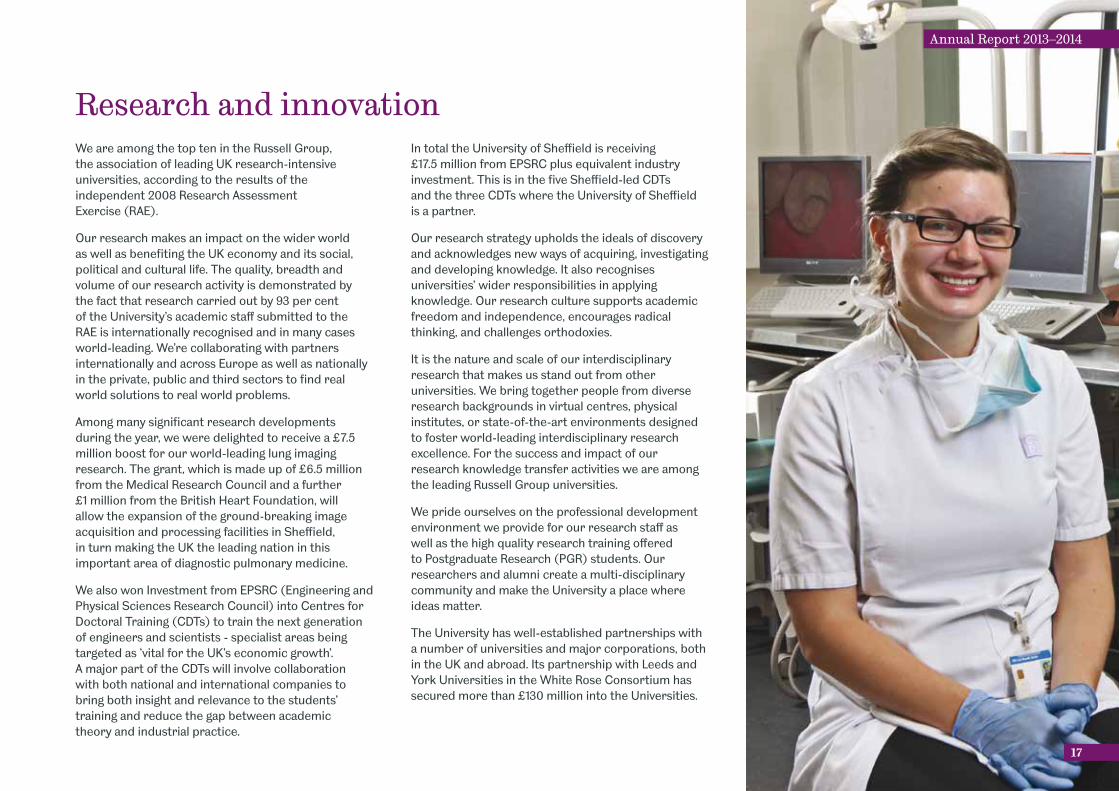
We pride ourselves on the professional development environment we provide for our research staff as well as the high quality research training offered to Postgraduate Research (PGR) students. Our researchers and alumni create a multi-disciplinary community and make the University a place where ideas matter.
The University has well-established partnerships with a number of universities and major corporations, both in the UK and abroad. Its partnership with Leeds and York Universities in the White Rose Consortium has secured more than £130 million into the Universities.
Research and innovation

We are one of the UK’s leading universities and are ranked amongst the leading universities in the UK. In 2014 we were voted number one for student experience in the Times Higher Education Student Experience Survey 2014-15. Our global reputation for teaching and research attracts students from over 120 countries, making Sheffield a truly international community.
Learning and Teaching
We pride ourselves on an excellent research-led learning and teaching environment, providing all undergraduate and postgraduate students with a distinctive experience that enables them to fulfil their potential. Leading researchers teach on our courses ensuring that teaching is always up-to-date and relevant. Achieve More is an exciting new addition to our undergraduate curriculum starting in September 2014. The aims are that students will engage with research from the outset of their studies, tackling some of the big global challenges, and working across disciplines to broaden knowledge and develop team working and problem-solving skills.
Student support
Our student support within the University community enables our students to develop life skills as they progress. We aim to enhance the well-being of our students and to contribute positively to the quality of their student experience. We recognise the importance to each student of building sound relationships with other students, within academic departments, and the importance of a sense of belonging in the University.
Operating and financial review
1818
The student experience
The University and Students’ Union have many services for employability skills, career planning and preparation for the workplace
SSiD is a one stop shop for students for information, help, support and guidance
STU
DEN
T SERVICES INFORMATION D
ESK
SSiDUNIVERSITY OF SHEFFIELD
STUDENT

19
Annual Report 2013–2014
19
Employability
Our institutional student employability strategy aims to encourage students to develop a broad range of achievements, skills, understanding and personal attributes to support successful employment and active citizenship. These attributes are fostered by the education we offer in our academic departments, alongside other forms of personal support within and beyond the academic department. Students develop these attributes with the support of cross-campus and central University services and through the opportunities provided to them by the wider University environment.
Widening participation and fair access
The University has a long-standing commitment to widening participation (WP) and fair access, not only to its own programmes of study, but also to the Higher Education (HE) experience in general. Our WP Strategic Assessment and Access Agreement priorities include increasing the opportunities for students from under-represented groups; ensuring that students have access to resources and support to fulfil their potential; and providing our students with opportunities to enhance their preparedness for graduate employment and capacity for further professional and academic study.
The Office for Fair Access (OFFA) has approved our Access Agreement which sets out our plans for ensuring fair access to students from under-represented groups through outreach work and financial support. Our plans within the Access Agreement are, therefore, an intrinsic part of the University’s strategy for widening participation.
Alumni achievements
During the past year, alumni of the University have achieved great success within their professions.
The Right Reverend Doctor John Hiang Chia Chew (PhD Biblical Studies 1983), Chairman of the Board of Governors of Trinity Theological College, Singapore, and a former Bishop of Singapore received an honorary LittD from the University.
Emeritus Professor Tony Crook AcSS, FRTPI, FRSA (PhD Town and Regional Planning 1989, Hon LittD 2013), was awarded a CBE for services to housing and charitable governance, recognising his outstanding commitment to work on housing research and policy.
Dr Joanne Harris (PGCE Education 1987, Hon LittD 2004), the award-winning author was awarded an MBE for her services to literature.
Dame Hilary Mantel DBE (BJur Law 1973; Hon LittD 2005), the double Booker prize winning author became a Dame of the British Empire for her services to literature.
Paul Mason (BA Music and Politics 1981), award-winning journalist and Culture and Digital Editor at Channel 4 News received an honorary LittD from the University.
Dr Jim O’Neill (BA Economics 1978, MA Economics 1980), eminent economist known for coining the BRIC acronym (Brazil, Russia, India and China) and former Chairman of Goldman Sachs Asset Management was awarded an honorary LittD by the University.
Lucy Prebble (BA English Literature 2002), the critically acclaimed, award-winning playwright of ENRON was presented with the University’s Professor Robert Boucher Distinguished Alumni Award, for her outstanding professional achievements and success.
Professor Tilli Tansey FMedSci, Hon FRCP (BSc Zoology 1974, PhD Zoology 1978, DSc 2011) received an OBE for services to research in the medical sciences and to the public understanding of science.

Operating and financial review
2020
The University of Sheffield was founded over 100 years ago, inspired by the belief that a University could make a powerful difference in the lives, health, prosperity and well-being of the people of Sheffield. This desire to use education to do good for those beyond the University continues to inspire research and teaching. We are a world class research university and one of the most popular UK destinations for talented students across the globe.
The economic benefits to the City of Sheffield are enormous, and there are many opportunities for the local community. Our students are active in contributing positively to the life of the City of Sheffield through volunteering and other community activities.
The University recognises that the presence of so many predominantly young students has a significant impact. We are committed to building good community relations and are determined that our students are aware of their responsibilities in the neighbourhood.
The University has a strong commitment to the people in the Sheffield City Region. In addition to well-established areas of partnership – research collaboration and medical placements within the region’s hospitals, outreach activities with 150 local schools and alliances with business – the University is committed to public engagement and collaborations which reflect our educational vision and civic heritage.
Our leading academics are working with the city on raising the profile of the public realm, with the Schools of Architecture and Landscape Architecture doing innovative practice-based intervention in the city and bringing international speakers to inspire both students and public alike.
Through our public engagement with research programmes we have delivered and continue to deliver an inspirational, cross collaborative series of events for the public of Sheffield in particular through the Festival of the Mind which attracted 26,500 visitors to 150 events in 15 venues throughout the city.
Engaged University and Sheffield City Region
The economic benefits to the City of Sheffield are enormous, and there are many opportunities for the local community.

21
Annual Report 2013–2014
21
Engaged University and Sheffield City Region

Operating and financial review
2222
The University of Sheffield’s mission, vision and identity frames our approach to strategic planning. Our guiding principles are applied to the changing situations and conditions we face, and to new ways of working and we see them as enduring over time. They stand as the touchstone of the kind of university we aspire to be, guiding the choices we all make in our daily work. These are underpinned by the Strategic Plan 2010-2015 and informed by a range of performance indicators which demonstrate our areas of strength and focus.
The University’s Mission
Our purpose has long been to improve the world by seeking to understand it better. The University’s motto, “Rerum Cognoscere Causas”, comes from Virgil’s Georgics and means ‘to know the causes of things’. We now define the University’s mission in more contemporary language as ‘to discover and understand’. We remain committed today to the goal of changing the world for the better through the power and application of ideas and knowledge.
The University’s Vision
The University of Sheffield will be one of the best universities in the world, renowned for the excellence, impact and distinctiveness both of its research and its research-led learning and teaching. This vision is grounded in a strong belief in a culture of higher education built on a positive interaction between learning, teaching and research.
The University’s Identity
The University has expanded from its original intake of 114 students to more than 26,000, who now study across a broad range of areas spanning arts and humanities, social sciences, medicine, science and engineering. We promote the potential for higher education to transform people’s lives and welcome a hugely diverse range of staff and students from around the world to our city. We recognise too that some issues of international importance in the 21st century are entirely different from those of the past. We seek to play a leading role in the research and teaching needed to address the biggest issues facing our world today.
Over the years, the growing extent of our ambition and the increasing number of exchanges of people and ideas has developed the University’s reach. We are now a truly international university with a world-wide reputation. The University holds charitable status as an Exempt Charity and the Council and senior management have had due regard to the Charity Commission’s public benefit guidance. Public benefit is integral to the culture of the University, and is embedded in its historical foundations.
The University’s Guiding Principles
The University’s Strategic Plan 2010-2015 is structured around six guiding principles that underpin the University’s mission and inform all our strategic decisions. They combine to constitute a shared framework for our activities. The guiding principles are:
• Achieving Excellence
• Cultivating Ambition
• Making a Difference
• Working Together
• Protecting the Future
• Leading the Way
Institutional Sustainability
The University has a range of Performance Indicators (PI’s) that are used to monitor progress and inform action in seeking to meet the ambitions set out in the strategic plan. The financial health PIs additionally provide an input to the institutional sustainability assessment which has been developed following recommendations from the HEFCE Financial Sustainability Strategy Group (FSSG). The results are illustrated in the table below which demonstrates positive progress against most of these indicators.
Strategic planning
Rolling average key performance indicators
31 July 2010 31 July 2011 31 July 2012 31 July 2013 31 July 2014
Historical cost surplus as percentage of income 2.9% 5.9% 4.2% 3.4% 4.9%
Discretionary reserves (excluding pension liability) as percentage of income
24.9% 33.7% 35.1% 35.8% 42.0%
External borrowing as percentage of income 21.6% 19.3% 17.8% 15.3% 22.0%
Net cash flow as percentage of income 7.6% 8.7% 8.3% 7.7% 9.3%
Net liquidity days 103 92 67 63 91

23
Annual Report 2013–2014
23
Financial Operating Strategy
The achievement of the University’s mission, vision and identity depends on the University creating and maintaining a healthy financial position. Our financial situation provides both the opportunities and constraints for our future development. It enables and is affected by all of our activities within the University.
The overall financial objective of the University is to provide a robust, solvent and sustainable position that supports the University’s core activities and which facilitates the strategic planning, development and implementation of activities and decision making in all academic and support areas to achieve the University’s vision. This is facilitated through specific objectives and an agreed set of financial targets to ensure that it is operating on a financially sound basis.
People Strategy
The University’s People Strategy ensures that we will attract, grow and engage a diverse range of talented staff who have the ingenuity, energy, skills and knowledge to be at the forefront of our pioneering work and ambitious plans, with a commitment to continually enhancing the reputation of the University.
As our staff are key to the achievement of the Strategic Plan and the Guiding Principles of the University, the successful delivery of the attract, grow and engage priorities of the People Strategy are critical to the success of the University.
Efficient and effective use of staff resources in line with the University’s strategy is seen as crucial to the future success of the organisation.
Estates Strategy
Our estate is a key resource that needs to be well planned, managed and continually improved in order to support the achievement of our academic
priorities in teaching and learning, research and knowledge exchange. Providing a high quality learning and research environment fit for purpose for a world leading Research University in the 21st century is an essential component of our Strategic Plan; one which aims to give all students an outstanding educational and social experience, and staff the facilities they need to work creatively and effectively.
Since the start of the new century, we have completed a number of iconic and innovative projects that have attracted international attention such as the Jessop West Building and the Nuclear Advanced Manufacturing Research Centre (NAMRC). Recently completed major renovation and refurbishment of landmark buildings in the city have similarly received widespread acclaim for the quality of the restoration work and the sympathetic treatment of our urban heritage. Building on these successes, our aim is to enhance our remaining estate and the city landscape with investment in a mixture of appropriate new development and refurbishment of legacy buildings.
The challenges we face are many and varied. Over the coming years we will continue to grow our activities. Expansion is occurring differentially in response to strong demand from students, industry, sponsors and other organisations with which we are developing partnerships. We are establishing clear priorities in line with our academic objectives, obtaining best value from a wide range of investment sources, continuing to press downwards on our operating costs, and keeping our plans within the bounds of what is affordable and realistic.
Environmental Policy
The University shows its commitment to environmental best practice. Our Environmental Policy provides the framework for all our work,
whether it be in relation to energy saving, waste and recycling or sustainable transport.
We recognise the challenge posed by climate change, and we have set challenging environmental targets to continue to improve our environmental performance. We will allocate sufficient staff, finances and other resources to carry out our broad environmental aims and objectives. We recognise that reducing our environmental impact requires joint effort and commitment by staff and students, and will work in partnership with the Union of Students to achieve this.
Risk Management Strategy
The Risk Review Group was established in 2008 to oversee all strategic and operational levels of risk and opportunity management. Responsibilities and reporting processes have been fully integrated in the Faculties and Professional Services in line with the Risk Policy which is reviewed annually and approved by Council, most recently in June 2014.
We have developed a statement of appetite for risk which supports the risk management across the institution. We take a balanced approach to risk across the full range of our activities. We have a low risk appetite for mission critical risks; however the risk appetite of individual Faculties and Professional Services may vary. A low institutional appetite for risk provides context and support for a less risk averse approach by the Faculties and this variation in risk appetite is both positive and beneficial for the institution.
However, where the University seeks strategic advantage, initiative or change, it will be receptive to understanding and sharing internally the inherent risks if the anticipated benefit warrants, within limits, the risks described.
Strategies

Our students
24

25
Annual Report 2013–2014
Our students Our student population – applications
1 August 2010 – 31 July 2011
UG Home 29,918
UG Overseas 5,700
PGT Home 5,119
PGT Overseas 19,725
PGR Home 1,403
PGR Overseas 2,619
Total applications 64,484
1 August 2012 – 31 July 2013
UG Home 29,243
UG Overseas 7,363
PGT Home 3,923
PGT Overseas 25,967
PGR Home 1,757
PGR Overseas 3,196
Total applications 71,449
1 August 2013 – 31 July 2014
UG Home 30,206
UG Overseas 7,845
PGT Home 3,860
PGT Overseas 29,679
PGR Home 2,196
PGR Overseas 3,168
Total applications 76,954
1 August 2011 – 31 July 2012
UG Home 25,272
UG Overseas 6,316
PGT Home 4,415
PGT Overseas 24,217
PGR Home 1,939
PGR Overseas 2,988
Total applications 65,147

Our students
26
Our students Full-time students Undergraduate Postgraduate
Faculty Home/EC Overseas Sub total Home/EC Overseas Sub total Total
Faculty of Arts and Humanities
2,369 19 2,388 319 175 494 2,882
Faculty of Engineering 2,007 1,147 3,154 538 1,023 1,561 4,715
Faculty of Medicine, Dentistry and Health
1,955 149 2,104 308 269 577 2,681
Faculty of Science 3,138 536 3,674 519 202 721 4,395
Faculty of Social Sciences 4,314 1,212 5,526 899 1,704 2,603 8,129
Total 13,783 3,063 16,846 2,583 3,373 5,956 22,802
Part-time students
Undergraduate Postgraduate
Faculty Home/EC Overseas Sub total Home/EC Overseas Sub total Total
Faculty of Arts and Humanities
88 6 94 219 24 243 337
Faculty of Engineering 165 38 203 69 30 99 302
Faculty of Medicine, Dentistry and Health
228 50 278 559 59 618 896
Faculty of Science 58 14 72 81 5 86 158
Faculty of Social Sciences 404 75 479 652 129 781 1,260
Total 943 183 1,126 1,580 247 1,827 2,953
Additional students
Modern Languages students abroad 217
Students on optional year outs 152
Erasmus and Year Abroad students 316
Total 685
Student numbers 2013–2014

27
Annual Report 2013–2014
First degree award classifications
Faculty 1 2.1 2.2 3 Pass Unclassified
Grand total
Faculty of Arts and Humanities 180 656 65 0 5 0 906
Faculty of Engineering 227 323 140 25 21 0 736
Faculty of Medicine, Dentistry and Health
75 100 34 3 296 43 551
Faculty of Science 263 491 186 18 12 0 970
Faculty of Social Sciences 277 1,154 320 23 80 0 1,854
Grand total 1,022 2,724 745 69 414 43 5,017
Certificates and Diploma awards
Faculty Diploma CertGrand
total
Faculty of Arts and Humanities 2 1 3
Faculty of Science 0 17 17
Faculty of Social Sciences 103 7 110
Faculty of Medicine, Dentistry and Health
44 0 44
Grand total 149 25 174
Number of taught postgraduate degrees awarded
Award Total
PhD 517
Other Doctorates 56
Masters 3,335
Diplomas 338
Grand total 4,246

Our students
28
International students
During the year we led a ground-breaking campaign to highlight the crucial value of international student to the UK. The pioneering #weareinternational campaign was jointly founded by the University’s Vice Chancellor and the Students’ Union President and has been backed by more than 100 universities, education institutions and international organisations, including the University of Cambridge, Cardiff University, the University of St Andrews and Queen’s University Belfast.
The campaign, which received cross-party support at Parliament, was developed in partnership with the British Council and the UK Council for International Students and has built links with the Home Office and Cabinet Office to reinforce the message that the UK actively welcomes talented students.
As part of the campaign, the University of Sheffield produced innovative materials to inform prospective students about the student visa application process to study in the UK, including two short student-focused films in both India and China.
The campaign was the winner of the Internationalising the Student Experience category at the National Union of Students (NUS) and UK Council for Student Affairs (UKCISA) Internationalisation Awards 2014.
Students’ Union
The Students’ Union was voted best in the UK for the third year running in the National Student Survey 2014 and for the sixth year running in the Times Higher Education Student Experience Survey 2014.
The Students’ Union, which underwent a £20 million state-of-the-art refurbishment, completed in September 2013, retained the prestigious title
after being awarded a 94 per cent overall satisfaction rate – an increase from the previous year’s figure of 93 per cent.
The radically revamped Students’ Union building, which broke new ground when it was unveiled almost 50 years ago, features state-of-the-art facilities for student services, an amphitheatre styled space for special events within the new Octagon Piazza, as well as more social and study spaces open for longer hours.
University House, which was one of the first glass curtain walled buildings in the world when it was completed in 1963, has now been integrated with the University’s Students’ Union in one single building.
The new Students’ Union Building also now houses additional bookable spaces for use as contemporary exhibition and business spaces and boasts improvements to the City View Cafe, as well as the venue space: Foundry, Studio and Fusion.
In addition, significant improvements have been made to pedestrian access and landscaping, and the new building features a bridge joining the Octagon building to the Students’ Union, bringing all facilities together under one roof at the heart of the campus. The work has also brought the building up-to-date with modern efficiency standards, radically reducing annual energy consumption and the building’s carbon footprint.
Advice and welfare
The Student Advice Centre continued to provide advice and guidance to students from across the University. In 2013-14 their advisers dealt with 3,220 cases, and gained £142,000 for students as a result of Student Advice Centre work.
Activities and sports
35 new societies last year brought the total number of societies and working committees, supported by the Activities and Sports Zone, to over 300, an increase on last year and our highest total ever. The staff team provides advice, support, and training to the 2,500 students holding leadership positions on society committees and ensures all activities are run safely, democratically and inclusively.
Student Voice
Student Voice works with students to make sure they can influence what happens in the SU, the University and the wider world. In 2013-14, we had our highest number of candidates put themselves forward to become one of our eight Students’ Union officers. 45 students stood, and 9,213 students voted to choose the successful officer candidates. These officers are trustees and represent students across a range of governance and planning bodies in the University.
We also collaborated with the University on the #weareinternational campaign and gave evidence on student voter engagement to a government select committee.
Entertainments and events
Sheffield Students’ Union offers a wide variety of arts, cultural and entertainments events, including partnerships with local initiatives such as the Off The Shelf literature festival, and Tramlines music festival. In 2013-14 there were over 100 large events organised directly by our students committees and societies - including the LGBT Committee’s National Coming Out Day, ‘World Week’, the expansion of ‘Women’s Week’ and a national conference for dental students from across the UK.

29
Annual Report 2013–2014
The Times Higher Education Student Experience Survey 2014 rated our student experience as the best in the country.
Student satisfaction
The University achieved an overall satisfaction rate of 89 per cent in the National Student Survey 2014, one percent lower than the previous year, but still above the 86 per cent sector-wide average. This score put the University joint first in the Yorkshire region for the second year running, ahead of the University of Leeds and University of York.
The University also achieved an overall satisfaction score of 94 per cent for practice placements offered to students during their studies to give them real-life employment experience. This invaluable opportunity helps students increase their employability skills giving them the best foundations to compete in the graduate jobs market after obtaining their degree from a first-class university.
The University of Sheffield was rated highest nationally for five subjects: Orthoptics (100 per cent), Landscape Design (93 per cent), Information Services (95 per cent), German and Scandinavian Studies (98 per cent), and Music (100 per cent).
The outstanding library services and IT resources at the University were recognised with high satisfaction scores of 91 per cent and 90 per cent respectively.
This year the University’s response rate to the National Student Survey increased by three per cent with 72 per cent of eligible students taking the time to share their thoughts about the institution.
Top in the country for student experience
The Times Higher Education Student Experience Survey 2014 rated our student experience as the best in the country.
As well as coming top in the accommodation and facilities categories, we were also judged to be the best for social life and the Students’ Union. The University was also judged joint third for its well-structured courses.
More than 14,000 students from universities across the country took part in the survey which assesses 21 different attributes of their institutions, including teaching, good community atmosphere, good support and extra-curricular activities.

Rankings
30

31
Annual Report 2013–2014
We are a world 100 university and currently the top-ranked institution in the country for student satisfaction.
We were delighted to be ranked first overall in the 2014 Times Higher Education Student Experience Survey 2014, with first place positions for good social life, good Students’ Union, facilities and accommodation, and joint third for well- structured courses.
We also jumped two places in the QS World University Rankings, moving from 71st place to 69th out of more than 2,500 institutions in the world.
Rankings
World, European and UK rankings Position
QS World University Rankings 2014 69th
Times Higher Education World Rankings 2014-15 18th (in the UK)
Times Higher Education World Rankings 2014-15 50th (in Europe)
Times Higher Education World Rankings 2014-15 121st (in the world)
Times Higher Education Student Experience Survey 1st
The Times and Sunday Times Good University Guide 2015 21st
Research Assessment Exercise 2008 Top 10
We are a world 100 university and currently the top-ranked institution in the country for student satisfaction.

Vice-Chancellor’s Introduction
32
Our University at a glance
32
Officers of the University Session 2013-14
The Chancellor Sir Peter Middleton
The Pro ChancellorsMr A P Pedder OBE (Chair of Council) Mrs S H Harkness
The TreasurerMr D E Young CBE
The Vice-ChancellorProfessor Sir Keith Burnett
The Deputy Vice-ChancellorProfessor P E White (from April 2014)
The Cross Cutting Pro-Vice-ChancellorsProfessor R A L Jones, Research and InnovationProfessor A M Peat, Learning and Teaching (from April 2014)Professor P E White, Learning and Teaching (until March 2014)
The Faculty Pro-Vice-ChancellorsProfessor J Labbe, Arts and Humanities Professor M J Hounslow, EngineeringProfessor A P Weetman, Medicine, Dentistry and HealthProfessor A J Ryan, ScienceProfessor G Valentine, Social Sciences
Registrar and SecretaryDr P K Harvey (until July 2014)
The Council of the University Session 2013-14
Ex-officio membersThe Pro ChancellorsThe TreasurerThe Vice-Chancellor
One Pro-Vice-ChancellorProfessor P E White
Persons appointed by the CouncilProfessor D C van den BoomDr D BottDr S F Eden Mr J G KellyMs A M Legg Mr R MaysonMr B Wrigley
One Faculty Pro-Vice-Chancellor appointed annually by the Vice-ChancellorProfessor M J Hounslow
Three members of the Senate elected by the SenateProfessor R F W JacksonMr M J LewisMr R Sykes
The President of the Union of StudentsMr A Buckle
One person who is not a member of the academic or academic-related staffMr A D Kerr
Secretary to the CouncilThe Registrar and Secretary
Arts and HumanitiesArchaeologyBiblical StudiesSchool of EnglishFrenchGermanic StudiesHispanic StudiesHistorySchool of Modern Languages and
Linguistics (SOMLAL)MusicPhilosophyRussian and Slavonic Studies
EngineeringAerospace EngineeringAutomatic Control and Systems
EngineeringBioengineeringChemical and Biological EngineeringCivil and Structural EngineeringComputer ScienceElectronic and Electrical EngineeringMaterials Science and Engineering Mechanical Engineering
Medicine, Dentistry and HealthCardiovascular ScienceSchool of Clinical Dentistry School of Health and Related Research
(ScHARR)Human Communication SciencesHuman MetabolismInfection and ImmunityThe Medical SchoolNeuroscienceSchool of Nursing and MidwiferyOncology
ScienceAnimal and Plant SciencesBiomedical ScienceChemistry School of Mathematics and StatisticsMolecular Biology and BiotechnologyPhysics and AstronomyPsychology
Social SciencesArchitectureEast Asian StudiesEconomicsSchool of EducationGeographyInformation SchoolJournalism StudiesLandscapeLawManagementPoliticsSociological StudiesTown and Regional Planning
The Institute for Lifelong Learning
International – City College, ThessalonikiBusiness Administration and EconomicsComputer ScienceExecutive Education CentreHumanities and Social SciencesPsychology
Our University at a glanceOfficers and the Council Faculties and Departments

33
Financial Statements 2013–2014.
33
Financial Statements 2013–2014

Vice-Chancellor’s Introduction
3434
Financial Statements 2013–2014

35
Financial Statements 2013–2014
The following statement is given to assist readers of the Financial Statements to obtain an understanding of the Governance and legal structure of the University of Sheffield. The University is an independent corporation whose legal status derives from a Royal Charter granted in 1905. It is an educational charity, with exempt status, regulated by the Higher Education Funding Council for England (HEFCE) in its capacity as Principal Regulator. The University’s objectives, powers and governance framework are set out in its Charter and supporting Statutes. The University’s Charter requires the existence of the following two bodies whose main functions are detailed below.
The Senate
The Senate is the academic authority of the University, whose role is to direct and regulate the teaching and research work of the University. Chaired by the Vice-Chancellor, its membership is drawn mainly from the academic staff of the University and also includes student representatives.
The Council
The University’s Council is the governing body of the University and its board of Trustees, responsible for the strategic development and overall performance of the University’s business. Subject to the powers of the Senate, it has ultimate responsibility for all areas of operation. The Council’s membership is set out in full on page 32 and comprises lay and academic persons, including student representatives, appointed under the Statutes of the University, the majority of whom are non-executive. The role of the Chair of the Council is separate from that of the University’s Chief Executive, the Vice-Chancellor.
The performance of the Vice-Chancellor is monitored through the provisions of Section 6 of the Charter and Regulation VI: 5 and through the existence and application of the Staff Review and Development Scheme, carried out by the Chair of the Council. The appointment of the Secretary to the Council with appropriate separation in the lines of accountability is through the provisions of Regulation VI: 7.
The matters specially reserved to the Council for decision are set out in the Statutes of the University, by custom and under the Financial Memorandum with the Higher Education Funding Council for England. The Council holds to itself the responsibilities for the ongoing strategic direction of the University, approval of major developments and the receipt of regular reports from Executive Officers on the day-to-day operations of its business and its subsidiary companies. Council delegates its powers to other bodies and individuals as appropriate and in accordance with the Scheme of Delegation set out in Regulation III.
In addition to Nominations Committee and Senior Remuneration Committee which are formally constituted committees of the Council, much of the work of the Council is carried out through the following principal committees:
• The Finance Committee is the body responsible for advising the Council on all matters relating to the finances of the University. The Committee recommends to the Council the University’s Financial Statements for approval, annual revenue and capital budgets, monitors performance in relation to the approved budgets and monitors the execution of financial policies adopted by the Council.
• The Estates Committee acts as an expert Advisory Panel to the Council on estates matters in support of the Council’s responsibility for the stewardship and development of the University estate and specifically to monitor the implementation of the University’s Estate Strategy. The Committee reviews and appraises capital schemes to ensure effective and efficient procurement and scrutinises strategic development of the estate in terms of acquisitions and disposals. The Committee considers the implications of changing legislation, planning and governance requirements and monitors statistics required by HEFCE.
• The Audit Committee is constituted in line with guidance issued by HEFCE and comprises both lay members of the University Council and external co-optees with special expertise. Whilst senior executives attend meetings of the Audit Committee, they are not members of it. Both the External and Internal Auditors have independent access to the Committee, and vice versa. The Audit Committee is responsible for making recommendations to the governing body on the appointment of both the Internal and External auditors to the University. The Committee meets with the External Auditors to discuss their audit findings, and to review and approve the audit aspects of the annual financial statements; and it provides the governing body with its own opinions as required by the HEFCE Code. It also approves and influences the annual audit plan prepared by the University’s internal auditors, and considers completed audit reports; these deal with recommendations for the improvement of the University’s systems of internal control.
Corporate governance

36
Financial Statements 2013–2014
The Committee also reviews management responses to audit reports and monitors implementation of recommendations. The Committee also receives and considers reports from HEFCE as they affect the University’s business and monitors adherence to the regulatory requirements.
• The Human Resources Committee is responsible for making recommendations to the Council for new or revised Human Resources policies to support overall strategic Human Resources objectives. The Human Resources Committee also approves procedures and receives and considers reports from the Director of Human Resources, including Annual Reports of meetings with Campus Unions.
Full Statement of internal control
1. As the governing body of the University of Sheffield, the Council has responsibility for maintaining a sound system of internal control that supports the achievement of policies, aims and objectives, while safeguarding the public and other funds and assets for which we are responsible, in accordance with the responsibilities assigned to the governing body in the Charter and Statutes and the Financial Memorandum with HEFCE.
2. The system of internal control is designed to manage rather than eliminate the risk of failure to achieve policies, aims and objectives; it can therefore only provide reasonable and not absolute assurance of effectiveness.
3. The system of internal control is based on an ongoing process designed to identify the principal risks to the achievement of policies, aims and objectives, to evaluate the nature and extent of those risks and to manage them efficiently,
effectively and economically. This process has been in place for the year ended 31st July 2014 and up to the date of approval of the annual report and financial statements and accords with HEFCE guidance. The process is regularly reviewed by the Council and accords with the relevant Financial Reporting Council guidance. The University has formally adopted the CUC (Committee of University Chairs) Governance Code of Practice which is principally committed to improving the effectiveness of governance structures and processes. The University manages risks through a Corporate Risk Register, which is reviewed regularly throughout the year and is considered by Council and Audit Committee. There are also Faculty and Professional Services Risk Registers, and Departmental Risk Registers for both academic and professional service departments. The Risk Review Group (a sub-group of the University Executive Board) oversees these different levels of risk. The University’s risk management policy is reviewed annually by the Risk Review Group and by Council.
4. The following processes have been established:
a. The performance, plans and strategic direction of the institution are specifically considered at one of the regular meetings of the Council every year.
b. The Council undertakes an annual assessment for the purpose of making its public statement on internal controls. This assessment considers issues dealt with in the periodic reports received.
c. The Council receives periodic reports from the Chair of the Audit Committee concerning internal control and risk management.
d. The Council has delegated its responsibility for overseeing the management of strategic risks to the Risk Review Group, which is a subgroup of the University Executive Board.
e. The Audit Committee receives regular reports from Internal Audit, which include Internal Audit’s independent opinion on the adequacy and effectiveness of the institution’s system of internal control, together with recommendations for improvement. The Audit Committee may also request additional reports to gain assurance from other parties on areas of concern. A Data Assurance Group exists to support Audit Committee in its evaluation of assurance for statutory returns.
f. A risk prioritisation methodology based on risk ranking has been established.
g. An organisation-wide risk register is maintained for corporate level risks.
h. A reporting structure has been implemented whereby high-level strategic opportunities and risks are overseen by the Risk Review Group and reported to the Council. The University Executive Board receives reports on the action taken on all corporate level risks, along with suggestions for additions to and deletions from the risk register.
i. The University has established a basket of Performance Indicators (PIs), which can be benchmarked against other publicly available data sources, and which is regularly reviewed by the Council.
j. A five yearly effectiveness review of the Council is undertaken. This is a self evaluation of the Council’s effectiveness and that of its Committees. The last review was considered

37
at the November 2010 Council meeting. Annual reviews based on feedback from Council members are also undertaken.
k. The University keeps under regular review the policies, procedures and powers delegated by the Council to other bodies and individuals, including the Vice-Chancellor.
l. The Secretary to Council is responsible for ensuring that the University’s constitution is followed at all times, taking advice where appropriate.
5. The institution has contracted its internal audit function to an external provider, which operates to standards defined in the HEFCE Audit Code of Practice and whose work is subject to review for effectiveness by the HEFCE Audit Service. The provider’s supervising partner for the assignment functions as the institution’s Head of Internal Audit. The internal auditors submit regular reports, which include the Head of Internal Audit’s independent opinion on the adequacy and effectiveness of the institution’s system of internal control, with recommendations for improvement.
6. Our review of the effectiveness of the system of internal control is informed by the work of Internal Audit and by the executive managers within the institution, who have responsibility for the development and maintenance of the internal control framework, and by comments made by the external auditors in their management letter and other reports.
Financial Statements 2013–2014

38
Financial Statements 2013–2014
We have audited the financial statements of the University of Sheffield for the year ended 31 July 2014 set out on pages 40 to 64. The financial reporting framework that has been applied in their preparation is applicable law and United Kingdom Accounting Standards (United Kingdom Generally Accepted Accounting Practice).
This report is made solely to the Council in accordance with the Charters and Statutes of the University. Our audit work has been undertaken so that we might state to the Council those matters we are required to state to them in an auditor’s report and for no other purpose. To the fullest extent permitted by law, we do not accept or assume responsibility to anyone other than the Council for our audit work, for this report, or for the opinions we have formed.
Respective responsibilities of the University Council and Auditor
As explained more fully in the Statement of Responsibilities of Council Statement set out on page 39 the Council is responsible for the preparation of financial statements which give a true and fair view. Our responsibility is to audit, and express an opinion, on the financial statements in accordance with applicable law and International Standards on Auditing (UK and Ireland). Those standards require us to comply with the Auditing Practices Board’s Ethical Standards for Auditors.
Scope of the audit of the financial statements
A description of the scope of an audit of financial statements is provided on the Financial Reporting Council’s website at www.frc.org.uk/auditscopeukprivate.
Opinion on financial statements
In our opinion the financial statements:
• give a true and fair view of the state of the affairs of the Group and University as at 31st July 2014 and of the Group’s income and expenditure, recognised gains and losses and cash flows for the year then ended;
• have been properly prepared in accordance with United Kingdom Generally Accepted Accounting Practice; and
• have been prepared in accordance with the Statement of Recommended Practice – Accounting for Further and Higher Education.
Opinion on other matters prescribed in the HEFCE Audit Code of Practice issued under the Further and Higher Education Act 1992
In our opinion, in all material respects:
• funds from whatever source administered by the University for specific purposes have been properly applied to those purposes;
• income has been applied in accordance with the University’s Statutes; and
• funds provided by HEFCE have been applied in accordance with the Financial Memorandum and any other terms and conditions attached to them.
Matters on which we are required to report by exception
The HEFCE Audit Code of Practice issued under the Further and Higher Education Act 1992 requires us to report to you if, in our opinion:
• the statement of internal control included as part of the Corporate Governance Statement is inconsistent with our knowledge of the University and group.
We have nothing to report in respect of this matter.
Clare PartridgeFor and on behalf of KPMG LLP, Statutory AuditorChartered Accountants 1 The EmbankmentNeville StreetLeeds, LS1 4DW
24 November 2014
Independent auditor’s report to the Council of the University of Sheffield

39
Financial Statements 2013–2014
In accordance with the University’s Statutes, the Council of the University of Sheffield is responsible for the strategic development and overall performance of the University of Sheffield and is required to present audited financial statements for each financial year.
The Council is required to ensure that the financial statements are prepared in accordance with the University’s Statutes, the Statement of Recommended Practice: Accounting for Further and Higher Education (2007) and other relevant accounting standards. In addition, within the terms and conditions of a Financial Memorandum agreed between the Higher Education Funding Council for England and the Council of the University of Sheffield, the Council, through its designated office holder, is required to prepare financial statements for each financial year which give a true and fair view of the state of affairs at the balance sheet date of the University of Sheffield and of the surplus or deficit and cash flows for that year.
In causing the financial statements to be prepared, the Council has to ensure that:
• Suitable accounting policies are selected and applied consistently;
• Judgements and estimates are made that are reasonable and prudent;
• Applicable accounting standards have been followed, subject to any material departures disclosed and explained in the financial statements;
• Financial statements are prepared on the going concern basis unless it is inappropriate to presume that the University of Sheffield will continue in operation. The Council is satisfied that the University has adequate resources to continue in operation for the foreseeable future. For this reason the going concern basis continues to be adopted in the preparation of the financial statements.
The Council has taken reasonable steps to:
• Ensure that funds from the Higher Education Funding Council for England and the Training and Development Agency for Schools are used only for the purposes for which they have been given, and in accordance with the Financial Memorandum with the Funding Council and the Funding Agreement with the Training and Development Agency for Schools and any other conditions which the Funding Council or the Training and Development Agency for Schools may from time to time prescribe;
• Ensure that there are appropriate financial and management controls in place to safeguard public funds and funds from other sources;
• Safeguard the assets of the University and prevent and detect fraud;
• Secure the economical, efficient and effective management of the University of Sheffield’s resources and expenditure.
Responsibilities of the Council of the University of Sheffield

40
Financial Statements 2013–2014
1. Basis of preparation
These financial statements have been prepared in accordance with the Statement of Recommended Practice (SORP): Accounting for Further and Higher Education (2007) and in accordance with applicable accounting standards. The financial statements are prepared in accordance with the historical cost convention modified by the revaluation of certain fixed assets.
2. Basis of consolidation
The consolidated financial statements include the University and all its U.K. subsidiaries for the financial year to 31 July 2014. The results of subsidiaries acquired or disposed of during the period are included in the consolidated income and expenditure account from the date of acquisition or up to the date of disposal. Intra-group transactions are eliminated on consolidation.
In accordance with FRS2, the consolidated financial statements do not include those of the Students’ Union because the University does not control those activities.
3. Joint venture entities and associates
The University’s share of income and expenditure in joint venture entities is recognised in the University’s income and expenditure account in accordance with FRS 9. Similarly the University’s share of assets and liabilities in associate entities is recognised in the University’s balance sheet in accordance with FRS 9.
The gross equity method is used when consolidating joint venture entities and associate entities are consolidated using the equity method in accordance with FRS 9.
4. Intra-group transactions
Gains or losses on any intra-group transactions are eliminated in full. Amounts in relation to debts and claims between undertakings included in the consolidation are also eliminated. Balances between the University and its associates and joint ventures are not eliminated; unsettled normal trading transactions are included as current assets or liabilities. Any gains or losses are included in the carrying amount of assets of either entity; the part relating to the University’s share is eliminated.
5. Income recognition
Funding council block grants are accounted for in the period to which they relate.
Fee income is stated gross and credited to the income and expenditure account over the period in which students are studying. Where the amount of the tuition fee is reduced, by a discount or fee waiver, income receivable is shown net of the discount. Bursaries and scholarships are accounted for gross as expenditure and not deducted from income.
Recurrent income from grants, contracts and other services rendered are accounted for on an accruals basis and included to the extent of the completion of the contract or service concerned; any payments received in advance of such performance are recognised on the balance sheet as liabilities.
Donations with restrictions are recognised when relevant conditions have been met; in many cases recognition is directly related to expenditure incurred on specific purposes. Donations which are to be retained for the benefit of the University are recognised in the statement of total recognised gains
and losses and in endowments; other donations are recognised by inclusion as other income in the income and expenditure account.
Non-recurrent grants received in respect of the acquisition or construction of fixed assets are treated as deferred capital grants. Such grants are credited to deferred capital grants and an annual transfer made to the income and expenditure account over the useful economic life of the asset, at the same rate as the depreciation charge on the asset for which the grant was awarded.
Income from the sale of goods or services is credited to the income and expenditure account when the goods or services are supplied to the external customers or the terms of the contract have been satisfied.
Endowment and investment income is credited to the income and expenditure account on a receivable basis. Income from restricted endowments not expended in accordance with the restrictions of the endowment is transferred from the income and expenditure account to restricted endowments. Any realised gains or losses from dealing in the related assets are retained within the endowment in the balance sheet.
Increases or decreases in value arising on the revaluation or disposal of endowment assets i.e. the appreciation or depreciation of endowment assets, is added to or subtracted from the funds concerned and accounted for through the balance sheet by debiting or crediting the endowment asset, crediting or debiting the endowment fund and is reported in the statement of total recognised gains and losses.
Statement of principal accounting policies

41
Financial Statements 2013–2014
Any increase in value arising on the revaluation of fixed asset investments is carried as a credit to the revaluation reserve, via the statement of total recognised gains and losses; a diminution in value is charged to the income and expenditure account as a debit, to the extent that it is not covered by a previous revaluation surplus.
All other income is credited to the income and expenditure account in the period in which it is earned.
6. Agency arrangements
Funds the University receives and disburses as paying agent on behalf of a funding body are excluded from the income and expenditure of the University where the University is exposed to minimal risk or enjoys minimal economic benefit related to the transaction.
7. Leases and hire purchase contracts
Costs in respect of operating leases are charged on a straight-line basis over the lease term.
Finance leases, which substantially transfer all the benefits and risks of ownership of an asset to the University, are treated as if the asset had been purchased outright. The assets are included in fixed assets and the capital elements of the leasing commitments are shown as obligations under finance leases. The lease rentals are treated as consisting of capital and interest elements. The capital element is applied in order to reduce outstanding obligations and the interest element is charged to the income and expenditure account in proportion to the reducing capital element outstanding. Assets held under finance leases are depreciated over the shorter of the lease term or the useful economic lives of equivalent owned assets.
8. Taxation
The University is an exempt charity within the meaning of schedule 2 of the Charities Act 1993. It is therefore a charity within the meaning of Para 1 of schedule 6 to the Finance Act 2010 and accordingly, the University is potentially exempt from taxation in respect of income or capital gains received within categories covered by section 478-488 of the Corporation Tax Act 2010 (CTA 2010) (formerly enacted in Section 505 of the Income and Corporation Taxes Act 1988 (ICTA) or section 256 of the Taxation of Chargeable Gains Act 1992), to the extent that such income or gains are applied to exclusively charitable purposes. The University’s subsidiaries are liable to Corporation Tax in the same way as any other commercial organisation.
The University receives no similar exemption in respect of Value Added Tax. Irrecoverable VAT on inputs is included in the costs of such inputs. Any irrecoverable VAT allocated to tangible fixed assets is included in their cost.
Deferred tax is provided in full on timing differences which result in an obligation at the balance sheet date to pay more tax, or a right to pay less tax, at a future date, at rates expected to apply when they crystallise based on current rates and law. Timing differences arise from the inclusion of items of income and expenditure in taxation computations in periods different from those in which they are included in financial statements. Deferred tax assets are recognised to the extent they are regarded as more likely than not that they will be recovered. Deferred tax assets and liabilities are not discounted.
9. Accounting for goodwill and intangible fixed assets
Goodwill arises on consolidation and is based on the difference between the fair value of the consideration given for the undertaking acquired and the fair value of its separable net assets at the date of acquisition. Goodwill is amortised over its estimated economic life. Where goodwill and intangible assets are regarded as having limited useful economic lives, they are amortised over those lives up to a maximum of 20 years. Impairment tests are carried out at the end of the first year and thereafter subject to normal periodic reviews for indications of impairment. Where there is impairment in the carrying value of goodwill, the loss is incurred in the results for the period.
Positive purchased goodwill is capitalised and classified as an asset on the balance sheet. Negative goodwill is separately disclosed on the face of the balance sheet in fixed assets and is released to the income and expenditure account.
10. Land and Buildings
Land and buildings are stated at valuation. All valuations are carried out by parties external to the University. The basis of valuation is as follows:
Specialised properties depreciated replacement cost
Non-specialised properties open market value on existing use basis
Residential accommodation open market value – operational assets
Residential accommodation open market value – non operational assets

42
Financial Statements 2013–2014
An interim valuation of the University’s halls of residence and other residential properties was carried out on 31 July 2013 by Saxton Mee Commercial.
An interim valuation of the University’s land upon which Catalyst Higher Education Sheffield PLC (Catalyst) has built the Student Village in accordance with the redevelopment of student residential provision, was carried out on 31 July 2013 by Saxton Mee Commercial.
An interim valuation of academic, office, ancillary and support buildings as at 31 July 2014 was carried out by Gerald Eve LLP, an independent chartered surveyor, in accordance with RICS valuation standards.
The valuation was on a depreciated replacement cost basis in respect of specialised property and on a market value basis in respect of non-specialised property. Specialised property is rarely, if ever, sold in the market, except by way of sale of the entity of which it is part. The depreciated replacement cost method of valuation is defined as the current cost of replacing an asset with its modern equivalent asset less deductions for physical deterioration and all relevant forms of obsolescence and optimisation.
Costs incurred in relation to a tangible fixed asset, after its initial purchase or production, and prior to valuation, are capitalised to the extent that they increase the expected future benefits to the University from the existing tangible fixed asset beyond its previously assessed standard of performance; the cost of any such enhancements are added to the gross carrying amount of the tangible fixed asset concerned. Fixtures and fittings costing
more than £50,000 that are purchased specifically to bring a building into use are capitalised over the appropriate useful economic life. Assets are depreciated on a straight line basis.
Freehold land is not depreciated as it is considered to have an indefinite useful life. Freehold buildings are depreciated over their expected useful lives of up to a maximum of 50 years and leasehold land over the life of the lease up to a maximum of 50 years. Refurbishments are depreciated over their expected useful lives, up to a maximum of 20 years. Where material, a depreciable asset’s anticipated useful economic life is reviewed annually and the accumulated and future depreciation adjusted in accordance with FRS 15.
Specialised short-life assets, for example synthetic sports pitches, are depreciated over their expected useful lives up to a maximum of seven years.
Depreciation is charged against individual assets as soon as their full, unrestricted use becomes available to the University. In the year of acquisition, the depreciation charged against the asset is in proportion to the part of the year the asset is available for use.
No depreciation is charged on assets in the course of construction.
Where buildings are acquired with the aid of specific grants they are capitalised and depreciated as above. The related grants are treated as deferred capital grants and released to income over the expected useful life of the related asset on a basis consistent with the depreciation policy.
These valuations are retained subject to the requirement to test assets for impairment in accordance with FRS 11. A review for impairment of a fixed asset is carried out if events or changes in circumstances indicate that the carrying amount of a fixed asset may not be recoverable. Where assets funded by deferred capital grants are impaired, the related deferred capital grant is released to income.
A value is attributed to the benefit of assets which the University does not own and for which no annual or nominal rental is paid, and are capitalised, with a corresponding credit to deferred capital grants, and thereafter depreciated over the period of use.
11. Equipment
Equipment, including computers and software, costing less than £20,000 per individual item is written off in the year of acquisition. All other equipment, including groups of equipment, is capitalised.
Capitalised equipment is stated at cost and depreciated over an expected useful life of a maximum of ten years, with the exception of equipment acquired for specific research projects, which is depreciated over the average project life of three years.
Depreciation is charged against individual assets as soon as their full, unrestricted use becomes available to the University. In the year of acquisition, the depreciation charged against the asset is in proportion to the part of the year the asset is available for use.
Where equipment is acquired with the aid of specific grants it is capitalised and depreciated as above. The related grant is treated as a grant received in advance

43
Financial Statements 2013–2014
and released to income over the expected useful life of the equipment.
Donated equipment is capitalised at its market value and depreciated over five years.
12. Assets held for resale
Tangible fixed assets surplus to requirements are held at the lower of cost and net realisable value.
13. Heritage assets
The University is in possession of a small number of artworks, a museum collection of glassware and a zoology collection. Many of these items have been donated to the University. The University conducted an independent valuation of heritage assets by Andrew Firth, Fine Art and Antiques Limited at 31 July 2008 which showed that the value of these items was not material, and accordingly no heritage assets have been capitalised.
14. Investments
Listed investments held as fixed assets or endowment assets are shown at market value.
Investments in subsidiary undertakings are shown at the lower of cost or net realisable value, and investments in associates are shown in the consolidated balance sheet at attributable share of net assets.
Current asset investments, which may include listed investments, are shown at the lower of cost and net realisable value.
Interests in land and buildings held for their investment potential are included in the balance sheet at their market value without charging depreciation.
15. Stock
Stock is stated at the lower of cost and net realisable value. Where necessary, provision is made for obsolete, slow moving and defective stock.
16. Cash flows and liquid resources
Cash flows comprise increases or decreases in cash. Cash includes cash in hand, cash at bank, and deposits repayable on demand. Deposits are repayable on demand if they are available within 24 hours without penalty. No other investments, however liquid, are included as cash.
Liquid resources comprise assets held as a readily disposable store of value. They include term deposits, government securities and loan stock held as part of the University’s treasury management activities. They exclude any such assets held as endowment asset investments.
17. Foreign currency translations
Transactions denominated in foreign currencies are recorded at the rate of exchange ruling at the dates of the transactions.
Monetary assets and liabilities denominated in foreign currencies are translated at the rates of exchange ruling at the Balance Sheet date, with all resulting exchange differences being taken to the income and expenditure account in the period in which they arise.
18. Accounting for research and development
Expenditure on pure and applied research is treated as a part of the continuing activities of the University. Expenditure on development activities is carried forward and amortised over the period expected to benefit.
19. Financial instruments
The University uses derivative financial instruments to reduce exposure to exchange rate movements. Such derivative financial instruments are not held for speculative purposes and relate to actual assets or liabilities or to probable commitments.
All hedging instruments undertaken in respect of interest rate and foreign currency exposure and any amounts receivable or payable on hedging contracts are accounted for on a consistent basis with the underlying assets or liabilities. Interest payable and receivable is accounted for on an accruals basis. Premiums or charges incurred in respect of the hedge instruments are deferred and amortised over the term of the instrument. In instances where the derivative financial instrument ceases to be a hedge for an actual asset or liability, then it is marked to market and any resulting profit or loss recognised at that time.
A financial asset and a financial liability are offset only when there is a legally enforceable right to set off the recognised amounts and an intention either to settle on a net basis, or to realise the asset and settle the liability simultaneously
20. Maintenance of premises
The University has a rolling maintenance plan, which is reviewed on an annual basis. The cost of routine corrective maintenance is charged to the income and expenditure account as incurred.
21. Accounting for charitable donations
Unrestricted donationsCharitable donations are recognised in the accounts when the charitable donation has been received or if, before receipt, there is sufficient evidence to provide

44
Financial Statements 2013–2014
the necessary certainty that the donation will be received and the value of the incoming resources can be measured with sufficient reliability.
Endowment fundsWhere charitable donations are to be retained for the benefit of the University as specified by the donors, these are accounted for as endowments.
There are three main types:
1. Unrestricted permanent endowments – the donor has specified that the fund is to be permanently invested to generate an income stream for the general benefit of the University.
2. Restricted expendable endowments – the donor has specified a particular objective other than the purchase or construction of tangible fixed assets, and the University can convert the donated sum into income.
3. Restricted permanent endowments – the donor has specified that the fund is to be permanently invested to generate an income stream to be applied to a particular objective.
Total return on investment for permanent endowmentsTotal return is the whole of the investment return received by the University on the permanent endowment funds regardless of how it has arisen.
The total return, less any part of the return which has previously been applied for the purposes of the University, remains in the unapplied total return fund. This fund remains part of the permanent endowment until such time as a transfer is made to the income and expenditure account.
Donations for fixed assetsDonations received to be applied to the cost of a tangible fixed asset are shown on the balance sheet as a deferred capital grant. The deferred capital grant is released to the income and expenditure account over the same estimated useful life that is used to determine the depreciation charge associated with the tangible fixed asset.
Gifts in kindGifts in kind are included in ‘other income’ or ‘deferred capital grants’ as appropriate using a reasonable estimate of their gross value or the amount actually realised.
22. Accounting for retirement benefits
The two principal pension schemes for the University’s staff are the Universities Superannuation Scheme (USS) and the University of Sheffield Pension Scheme (1975) (USPS). The schemes are defined-benefit schemes. The USS scheme is externally funded and contracted out of the State Second Pension (S2P). The USPS scheme is externally funded but is no longer contracted out of S2P. Each fund is valued every three years by professionally qualified independent actuaries. A small number of staff remain in other pension schemes.
Pension costs are assessed on the latest actuarial valuations of the Schemes and are accounted for on the basis of FRS17, except for the USS, a multi-employer scheme, for which contributions are charged directly to the income and expenditure account as if the scheme were a defined contribution scheme. The USPS scheme’s assets are included at market value and scheme liabilities are measured on an actuarial basis using the projected unit method. The post-retirement benefit surplus or deficit is
included on the University’s balance sheet, net of the related amount of deferred tax. Surpluses are only included to the extent that they are recoverable through reduced contributions in the future or through refunds from the schemes. The current service cost and any past service costs are included in the profit and loss account within operating expenses and the expected return on the schemes’ assets, net of the impact of the unwinding of the discount on scheme liabilities, is included within other finance income. Actuarial gains and losses, including differences between the expected and actual return on scheme assets, are recognised, net of the related deferred tax, in the statement of total recognised gains and losses.
23. Provisions, contingent liabilities and contingent assets
Provisions are recognised in the financial statements when the University has a present obligation (legal or constructive) as a result of a past event, it is probable that a transfer of economic benefits will be required to settle the obligation and a reliable estimate can be made of the amount of the obligation. The amount recognised as a provision is discounted to present value where the time value of money is material. The discount rate used reflects current market assessments of the time value of money and reflects any risks specific to the liability.
Contingent liabilities are disclosed by way of a note, when the definition of a provision is not met and includes three scenarios: possible rather than a present obligation; a possible rather than a probable outflow of economic benefits; an inability to measure the economic outflow. Contingent assets are disclosed by way of a note, where there is a possible, rather than present, asset arising from a past event.

45
Statement of group total recognised gains and losses
Financial Statements 2013–2014
Year ended 31 July 2014
Note
Year ended 31 July 2014
£m
Year ended 31 July 2013
£m
Surplus on continuing operations after depreciation of assets at valuation, disposal of assets, tax and transfers to endowments
20.9 14.6
Unrealised surplus on revaluation of fixed assets 22 101.9 1.2
Appreciation in market value of endowment asset investments
21 0.5 3.6
Appreciation in market value of fixed asset investments 22 4.0 1.1
Endowment income (utilised)/retained for year 21 (0.1) 0.2
New endowments less realisations 21 0.9 –
Actuarial loss in respect of pension scheme 30 (3.7) (19.4)
Total recognised gains relating to the period 124.4 1.3
Reconciliation
Opening reserves and endowments 376.0 374.7
Total recognised gains for the year 124.4 1.3
Closing reserves and endowments 500.4 376.0
Consolidated income and expenditure account Statement of group historical cost surpluses and deficits
Year ended 31 July 2014
Note
Year ended 31 July 2014
£m
Year ended 31 July 2013
as restated£m
Income
Funding Council grants 1 99.2 107.5
Tuition fees and education contracts 2 219.1 177.3
Research grants and contracts 3 129.1 114.4
Other income 4 72.2 68.3
Endowment and investment income 5 1.7 2.7
Total income 521.3 470.2
Less: Share of income from joint ventures (3.4) (5.0)
Net income 517.9 465.2
Expenditure
Staff costs 6 268.0 247.5
Other operating expenses 7 173.6 155.9
Depreciation and impairment of assets 12,13 50.3 40.8
Interest payable 8 5.6 6.2
Total expenditure 9 497.5 450.4
Surplus after depreciation of assets at valuation and before tax
20.4 14.8
Share of operating profit in joint venture – –
Share of operating profit in associate – –
Profit on sale of investments – 0.1
Profit/(loss) on disposal of assets 0.4 (0.1)
Surplus after depreciation of assets at valuation,disposal of assets and before tax
11 20.8 14.8
Taxation 10 – –
Surplus on continuing operations after depreciation of assets at valuation, disposal of assets and tax
20.8 14.8
Minority interests – –
Deficit/(surplus) for the year transferred from/(to) accumulated income in endowment funds
0.1 (0.2)
Surplus for the year retained within general reserves 20.9 14.6
Year ended 31 July 2014
Note
Year ended 31 July 2014
£m
Year ended 31 July 2013
£m
Surplus on continuing operations before tax, minority interests and transfers to endowments
20.8 14.8
Difference between historical cost depreciation and the actual charge for the year calculated on the revalued amount
22 8.1 9.3
Realisation of property revaluation gains of previous years 22 2.6 0.7
Historical cost surplus before tax, minority interests and transfers to endowments
31.5 24.8
Historical cost surplus after tax, minority interests and transfers to endowments
31.6 24.6
The income and expenditure account is in respect of continuing activities

46
Financial Statements 2013–2014
Balance sheet as at 31 July 2014
Note
As at 31 July 2014 As at 31 July 2013
Group £m
University £m
Group £m
University £m
Fixed assets
Tangible assets 12 814.7 813.0 678.1 671.7
Investments 13 15.0 22.2 10.9 24.6
Investment in joint ventures
Share of gross assets 13 1.5 – 1.9 –
Share of gross liabilities 13 (1.2) – (1.5) –
Investment in associates 13 1.1 – 1.1 –
831.1 835.2 690.5 696.3
Endowment assets 21 37.8 37.8 36.5 36.5
Debtors: due after more than one year
14 14.8 16.9 15.3 15.3
Current assets
Stock 0.8 0.3 0.4 0.4
Asset intended for sale 1.6 1.6 1.6 1.6
Debtors 15 70.8 70.5 54.4 54.7
Investments 72.4 72.4 86.8 86.8
Cash at bank and in hand 29.6 20.4 24.3 11.3
175.2 165.2 167.5 154.8
Creditors: amounts falling due within one year
16 (151.2) (148.3) (131.7) (131.3)
Net current assets 24.0 16.9 35.8 23.5
Total assets less current liabilities
907.7 906.8 778.1 771.6
Less creditors: amounts falling due after more than one year
17 (79.6) (79.6) (82.2) (82.2)
Less: provisions for liabilities 19 (0.6) (0.6) (1.4) (1.4)
Total net assets excluding pension liability
827.5 826.6 694.5 668.0
Net pension liability 30 (68.4) (68.4) (70.2) (70.2)
Total net assets including pension liability
759.1 758.2 624.3 617.8
Note
As at 31 July 2014 As at 31 July 2013
Group £m
University £m
Group £m
University £m
Deferred capital grants 20 258.8 258.8 248.4 248.4
Endowments
Expendable 21 8.1 8.1 8.0 8.0
Permanent 21 29.7 29.7 28.5 28.5
37.8 37.8 36.5 36.5
Reserves
Revaluation reserve 22 328.7 332.1 233.5 236.0
Pension reserve 24 (68.4) (68.4) (70.2) (70.2)
General reserve 23 202.3 197.9 176.1 167.0
462.6 461.6 339.4 332.8
Minority interests (0.1) – – –
Total funds 759.1 758.2 624.3 617.8
The financial statements on pages 40 to 64 were approved by the Council on 24 November 2014and were signed on its behalf by:
Mr. D. E. YOUNG CBE, Treasurer
Professor Sir K. BURNETT, Vice-Chancellor
Mr. R. RABONE, Chief Financial Officer
The University of Sheffield

47
For the year ended 31 July 2014
Note
Year ended 31 July 2014
£m
Year ended 31 July 2013
£m
Net cash inflow from operating activities 25 45.7 42.0
Returns on investments and servicing of finance 26 (3.2) (2.2)
Taxation 10 – –
Capital expenditure and financial investment 27 (48.9) (64.4)
Management of liquid resources 14.3 25.3
Financing 28 (2.6) (2.6)
Increase/(decrease) in cash in the period 29 5.3 (1.9)
Note of movement in cash available on demand and short term deposits
Movement in year
£m
Movement in year
£m
Decrease in short term deposits (14.3) (25.3)
Increase/(decrease) in cash at bank and call accounts 5.3 (1.9)
Total decrease in cash and liquid resources (9.0) (27.2)
Note
Year ended 31 July 2014
£m
Year ended 31 July 2013
£m
Increase/(decrease) in cash for the year 5.3 (1.9)
Decrease in short term deposits (14.3) (25.3)
Decrease in debt 2.6 2.6
Movement in net funds in the year (6.4) (24.6)
Net funds at 1 August 31.4 56.0
Net funds at 31 July 29 25.0 31.4
Consolidated cash flow statement Reconciliation of net cash flow to movement in net funds
Financial Statements 2013–2014

48
Financial Statements 2013–2014
Note 1 Funding council grantsYear ended 31 July 2014
£m
Year ended 31 July 2013
£m
Recurrent grant 85.2 94.9
Specific grants
Teaching Agency grant – 0.1
Higher Education Innovation Fund 3.1 2.6
Other 1.7 1.1
Deferred capital grants released in year
Buildings (Note 20) 9.2 8.7
Equipment (Note 20) – 0.1
99.2 107.5
Notes to the accounts
Note 2 Tuition fees and education contractsYear ended 31 July 2014
£m
Year ended 31 July 2013
as restated £m
Home full-time undergraduate students 86.5 64.7
Home full-time postgraduate students 6.9 6.7
Home part-time students 3.1 3.0
Overseas students 94.5 78.2
NHS education contracts 6.7 6.4
Research training support grants and other fees 21.4 18.3
219.1 177.3
Note 3 Research grants and contractsYear ended 31 July 2014
£m
Year ended 31 July 2013
£m
Research councils 39.3 36.9
UK-based charities 10.8 12.2
European Commission 20.4 18.0
Other grants and contracts 45.7 38.7
Release from deferred capital grants (Note 20) 12.9 8.6
129.1 114.4
Note 4 Other incomeYear ended 31 July 2014
£m
Year ended 31 July 2013
£m
Residences, catering and conferences 19.5 16.0
Other services rendered 19.6 17.2
Health authorities 7.9 8.6
Releases from deferred capital grants (Note 20) 3.8 3.4
Other income 18.0 18.1
Income from joint ventures 3.4 5.0
72.2 68.3
Note 5 Endowment and investment incomeYear ended 31 July 2014
£m
Year ended 31 July 2013
£m
Income from expendable endowments (Note 21) 0.1 0.2
Income from permanent endowments (Note 21) 0.9 0.9
Other investment income 0.7 1.6
1.7 2.7
The financial statements for the year to 31 July 2013 included within income the gross value of tuition fees before deduction of a waiver or discount. The cost of the waiver or discount was included within expenditure. In the year to 31 July 2014 the treatment of these waivers and discounts has been revised, with tuition fee income now being shown net of waivers and discounts and the cost of this no longer shown as expenditure. There was no impact on the operating surplus of the University in the current or prior year arising from this change in treatment. To ensure consistency the comparative amounts for the year to 31 July 2013 have been reduced by £14.6 million, with an equivalent reduction in expenditure shown in note 7.

49
Note 6 StaffYear ended 31 July 2014
£m
Year ended 31 July 2013
£m
Staff costs:
Wages and salaries 208.7 192.9
Social security costs 17.3 16.4
Occupational Pension Scheme Costs (Note 28)
Employer contributions 48.2 44.2
FRS17 Adjustments (6.2) (6.0)
268.0 247.5
Year ended 31 July 2014
£’000
Year ended 31 July 2013
£’000
Emoluments of the Vice-Chancellor included abovefor the period 1 August 2013 to 31 July 2014
Salary 374 370
Benefits in kind 4 4
378 374
Employer pension contributions – –
Year ended 31 July 2014
£’000
Year ended 31 July 2013
£’000
Compensation for loss of office payable to members of staff earning in excess of £100,000 per annum
80 –
Note 6 Staff (continued)Year ended 31 July 2014
Year ended 31 July 2013
Number Number
£100,000 – £109,999 17 18
£110,000 – £119,999 18 18
£120,000 – £129,999 16 13
£130,000 – £139,999 9 13
£140,000 – £149,999 8 14
£150,000 – £159,999 12 8
£160,000 – £169,999 5 6
£170,000 – £179,999 7 4
£180,000 – £189,999 – 1
£190,000 – £199,999 – 1
£200,000 – £209,999 1 –
£210,000 – £219,999 1 –
£220,000 – £229,999 – 1
£230,000 – £239,999 – –
£240,000 – £249,999 – –
£250,000 – £259,999 – –
£260,000 – £269,999 1 1
The above payment is a provision as the final value is uncertain and has not been paid in 2013–14.
Salary is the contractual salary before adjusting for salary sacrifice.
Information relating to the Vice-Chancellor’s expenses claims paid in the financial year 2013–14 is available from the University’s Freedom of Information Publication Scheme website.
Remuneration of other higher paid staff, excluding employer’s pension contributions but including payments made on behalf of the NHS in respect of its contractual obligations to University staff under separate NHS contracts of employment, are shown below. The salary used to derive this information is before adjustment for salary sacrifice.
Full time equivalents
Full time equivalents
Staff Numbers
Academic 2,296 2,034
Academic services 647 608
Central administration and services 559 517
Premises 457 430
Research, grants and contracts 1,505 1,539
Residences, catering and conferences 147 159
Staff and student facilities 165 164
5,776 5,451
Financial Statements 2013–2014

50
Financial Statements 2013–2014
Note 7 Other operating expensesYear ended 31 July 2014
£m
Year ended 31 July 2013
as restated£m
Consumables and laboratory expenditure 15.4 14.8
Books and periodicals 5.2 4.6
Printing, stationery and postage 4.1 4.1
Rates 1.7 1.1
Fellowships, scholarships, bursaries and prizes 27.3 24.0
Furniture and equipment 18.4 16.8
Heat, light, water and power 11.5 11.6
Repairs and general maintenance 15.4 14.0
Grants to University of Sheffield Students' Union 3.4 3.9
Rents 6.6 7.1
Auditors' remuneration 0.1 0.1
Auditors' remuneration in respect of non-audit services 0.1 0.1
Professional fees and bought in services 18.4 16.4
Provision for bad and doubtful debts – (0.5)
Administrative expenses 10.7 6.7
Travel and subsistence expenses 10.1 9.2
Payments to non-contracted staff 7.2 8.2
Conference and meeting expenditure 2.1 1.6
Professional subscriptions 1.6 1.7
Restructuring costs and redundancy payments 0.5 0.1
Student placement fees 1.9 2.0
Other expenses 11.9 8.3
173.6 155.9
Auditors’ remuneration for the University of Sheffield was £65,342 (2013: £64,062).Travel and subsistence expenses includes £5,524 paid to members of the University Council (2013: £3,779). No remuneration was paid to members of the University Council in the year (2013: £0).The provision for bad and doubtful debts as at 31 July 2014 was £1,071,000.The financial statements for the year to 31 July 2013 included within income the gross value of tuition fees before deduction of a waiver or discount. The cost of the waiver or discount was included within Fellowships, scholarships, bursaries and prizes. In the year to 31 July 2014 the treatment of these waivers and discounts has been revised, with tuition fee income now being shown net of waivers and discounts and the cost of this no longer shown as expenditure. There was no impact on the operating surplus of the University in the current or prior year arising from this change in treatment. To ensure consistency the comparative amounts shown above for the year to 31 July 2013 have been reduced by £14.6 million, with an equivalent reduction in income shown in note 2.
Note 8 Interest payable and similar chargesYear ended 31 July 2014
£m
Year ended 31 July 2013
£m
Loans not wholly repayable within five years 4.8 4.9
Finance pension costs 0.8 1.3
5.6 6.2
Note 9 Analysis of 2013–2014 expenditure by activityStaff
costs £m
Operating expenses
£m
Depreciation
£m
Interest payable
£m
Total
£m
Academic departments 137.5 35.6 3.4 – 176.5
Academic services 22.2 13.6 1.7 – 37.5
Central administration and services
16.4 9.5 – – 25.9
General educational expenditure 5.0 20.0 – – 25.0
Staff and student facilities 6.0 5.6 1.0 – 12.6
Research grants and contracts 53.4 30.7 13.0 – 97.1
Residences, catering and conferences
4.0 13.2 2.0 – 19.2
Premises 10.8 26.3 17.2 4.8 59.1
Other expenses 12.7 19.1 12.0 0.8 44.6
268.0 173.6 50.3 5.6 497.5
The depreciation charge has been funded by:
Deferred capital grants released (Note 20) 25.9
Revaluation reserve released (Note 22) 8.1
General income 16.3
50.3
Notes to the accounts

51
Note 10 Taxation
The University has a group corporation tax charge of £18,600 (2012-2013: £48,100).
The deferred tax provided is £23,000 (2012-2013: £15,000).
No provision has been made for deferred taxation on the revaluation reserve relating to the potential profits in the University Group following the intragroup transfer of certain properties in the year to 31 July 2005.
Profits on sale of the properties arise in Escafeld Estates Limited and are paid in total to the University under a Deed of Covenant, reducing profits chargeable to tax in Escafeld to nil. At the balance sheet date, no tax liability was expected to crystallise within the group. However, following a change to Charity Commission guidance on donations by a company to its parent charity, this issue is under review.
The full potential liability to tax if the Deed of Covenant were not in place is disclosed below.
Year ended 31 July 2014
£m
Year ended 31 July 2013
£m
Total 0.2 1.4
Note 11 Surplus on continuing operations for the periodYear ended 31 July 2014
£m
Year ended 31 July 2013
£m
The surplus on continuing operations for theperiod is made up as follows:
University’s surplus for the period before profit or loss on disposal of fixed assets
21.6 14.3
Profit on disposal of fixed assets and investments 0.4 –
Consolidation of subsidiary companies (1.2) 0.5
Surplus on continuing operations before tax 20.8 14.8
Note 12 Tangible assets (Group)Land and Buildings Equipment Total
Freehold£m
Longleasehold
£m
Assets incourse of
construction£m
£m
£m
Valuation/Cost
At 1 August 2013
Valuation 469.7 33.4 – 1.0 504.1
Cost 135.3 5.7 77.4 138.0 356.4
Additions at cost 33.0 – 40.3 16.5 89.8
Transfers 53.0 0.3 (63.5) 10.2 –
Gain on revaluation 70.8 7.4 – – 78.2
Loss on revaluation (57.3) (10.6) – – (67.9)
Disposals
Valuation (5.8) – – – (5.8)
Cost – – – (8.5) (8.5)
At 31 July 2014
Valuation 477.4 30.2 – 1.0 508.6
Cost 221.3 6.0 54.2 156.2 437.7
Depreciation
At 1 August 2013 73.2 5.3 – 103.9 182.4
Charge for year 29.0 2.6 – 17.8 49.4
Impairment write down 0.9 – – – 0.9
Revaluation (84.6) (7.0) – – (91.6)
Eliminated on disposals (1.1) – – (8.4) (9.5)
At 31 July 2014 17.4 0.9 – 113.3 131.6
Net book value
At 31 July 2014 681.3 35.3 54.2 43.9 814.7
At 1 August 2013 531.8 33.8 77.4 35.1 678.1
Financial Statements 2013–2014
Academic, office, ancillary and support buildings were revalued as at 31 July 2014 by Gerald Eve LLP, an independent chartered surveyor, in accordance with RICS valuation standards. These buildings were revalued at £651.9 million, which compares to the net book value of these buildings on a historical cost basis of £374.5 million. Details of the valuation basis are included in the statement of principal accounting policies.

52
Financial Statements 2013–2014
Note 12 Tangible assets (University)Land and Buildings Equipment Total
Freehold£m
Longleasehold
£m
Assets incourse of
construction£m
£m
£m
Valuation/Cost
At 1 August 2013
Valuation 457.3 33.3 – 1.0 491.6
Cost 141.6 5.7 77.4 137.6 362.3
Additions at cost 33.1 – 40.3 16.1 89.5
Transfers 53.0 0.3 (63.5) 10.2 –
Gain on revaluation 70.8 7.4 – – 78.2
Loss on revaluation (57.3) (10.6) – – (67.9)
Disposals
Valuation (1.1) – – – (1.1)
Cost – – – (8.5) (8.5)
At 31 July 2014
Valuation 469.7 30.1 – 1.0 500.8
Cost 227.7 6.0 54.2 155.4 443.3
Depreciation
At 1 August 2013 73.3 5.3 – 103.6 182.2
Charge for year 28.9 2.6 – 17.6 49.1
Impairment write down 0.9 – – – 0.9
Revaluation (84.6) (7.0) – – (91.6)
Eliminated on disposals (1.1) – – (8.4) (9.5)
At 31 July 2014 17.4 0.9 – 112.8 131.1
Net book value
At 31 July 2014 680.0 35.2 54.2 43.6 813.0
At 1 August 2013 525.6 33.7 77.4 35.0 671.7
Note 13 Fixed asset investmentsAs at 31 July 2014 As at 31 July 2013
Group£m
University£m
Group£m
University£m
Balance at 1 August 12.4 24.6 11.3 29.9
Appreciation on revaluation 4.0 8.7 1.1 1.0
Impairment of fixed asset investments – (11.6) – (6.3)
Other net gains – 0.5 – –
Balance at 31 July 16.4 22.2 12.4 24.6
Represented by:
Fixed interest stocks 1.4 1.4 1.4 1.4
Equities 13.5 13.5 4.8 4.8
Equities – group holdings 1.5 6.5 6.2 17.6
Loans to investments – 0.8 – 0.8
Total fixed asset investments 16.4 22.2 12.4 24.6
Fixed Interest and equities at cost and bank balances
2.4 8.2 2.3 19.3
Investments in joint ventures and associates
The institution has shareholdings in joint ventures and associates as detailed in note 33. Associates are accounted for using the equity method. Joint ventures are accounted for using the gross equity method, such that the appropriate percentage of the companies gross assets and liabilities are incorporated into the consolidated balance sheet of the University and the appropriate percentage of net income is reported in the University’s consolidated income and expenditure account. The impact of the associates and joint ventures upon the consolidated accounts is not material.
Notes to the accounts
Academic, office, ancillary and support buildings were revalued as at 31 July 2014 by Gerald Eve LLP, an independent chartered surveyor, in accordance with RICS valuation standards. These buildings were revalued at £651.9 million, which compares to the net book value of these buildings on a historical cost basis of £374.5 million. Details of the valuation basis are included in the statement of principal accounting policies.

53
Note 14 Debtors: Amounts falling due after one yearAs at 31 July 2014 As at 31 July 2013
Group £m
University £m
Group £m
University £m
Prepayment: capital contribution to residences project
14.8 14.8 15.3 15.3
Loans to group companies – 2.1 – –
14.8 16.9 15.3 15.3
Note 15 Debtors: Amounts falling due within one yearAs at 31 July 2014 As at 31 July 2013
Group £m
University £m
Group £m
University £m
Debtors 51.2 48.4 39.6 39.9
Prepayment: capital contribution to residences project
0.5 0.5 0.5 0.5
Other prepayments and accrued income
19.1 21.6 14.3 14.3
70.8 70.5 54.4 54.7
Note 16 Creditors: Amounts falling due within one yearAs at 31 July 2014 As at 31 July 2013
Group£m
University£m
Group£m
University£m
Bank loans and overdrafts 2.7 2.7 2.7 2.7
Payments received in advance 90.7 89.7 67.5 67.5
Creditors 34.5 32.7 35.9 35.5
Social security and other taxation payable 5.7 5.7 5.4 5.4
Accruals 17.6 17.5 20.2 20.2
151.2 148.3 131.7 131.3
Note 17 Creditors: Amounts falling due after more than one yearAs at 31 July 2014 As at 31 July 2013
Group£m
University£m
Group£m
University£m
Unsecured loans repayable:
Between one and two years 2.7 2.7 2.7 2.7
Between two and five years 8.0 8.0 8.0 8.0
In five years or more 68.5 68.5 71.1 71.1
Long term creditor 0.4 0.4 0.4 0.4
79.6 79.6 82.2 82.2
Note 18 Borrowings: Summary of University borrowing at 31 July 2014
Institution Date Term Type InterestDue within
one year £m
Due in more than one year
£m
Unifund Plc
31 May 2007 40 years Private placement
Fixed – 5.3300%
– 59.8
Scottish Widows
30 November 2007
15 years Term loan Fixed – 5.4750%
Variable – 0.6832%
2.7 19.4
2.7 79.2
Amounts due within one year are included within bank loans and overdrafts in Note 16. Amounts due in more than one year are included in Note 17.
Financial Statements 2013–2014

54
Financial Statements 2013–2014
Note 19 Provisions for liabilities and charges (Group and University)Retirement
Costs £m
Other
£m
Total
£m
At 31 July 2013 0.6 0.8 1.4
Utilised in year (0.2) (0.6) (0.8)
At 31 July 2014 0.4 0.2 0.6
The provision for early retirement is the estimated liability that will arise from agreed early retirements under the University’s restructuring arrangements.
Other provisions include potential liabilities in relation to contractual claims.
Other provisions also include the final disposal costs of sealed sources as defined by the High Activity Sealed Source Regulations of 2005 (S12005 No. 2686). The current estimates for the provision are £1,500 for the disposal of a large Sr-90 source and £78,500 for the disposal of two IBL 437C irradiators. These provisions will be renewed on a biennial basis.
Note 20 Deferred capital grants (Group and University)
Funding Council
£m
Other Grants &
Benefactions £m
Total £m
Balance at 31 July 2013
Buildings 116.0 98.2 214.2
Equipment 12.3 21.9 34.2
Total 128.3 120.1 248.4
Cash received
Buildings 4.6 9.0 13.6
Equipment – 22.7 22.7
Total 4.6 31.7 36.3
Released to income and expenditure
Buildings (Notes 1, 3 and 4) (9.2) (4.0) (13.2)
Equipment (Notes 1, 3 and 4) – (12.7) (12.7)
Total (9.2) (16.7) (25.9)
At 31 July 2014
Buildings 111.4 103.2 214.6
Equipment 12.3 31.9 44.2
Total 123.7 135.1 258.8
Notes to the accounts

55
Note 21 Endowment funds and linked charities (Group and University)
Unrestricted Permanent
£m
Restricted Permanent
£m
Total Permanent
£m
Restricted Expendable
£m
Total Year Ended 31 July 2014
£m
Balances at 31 July 2013
Capital 7.4 17.2 24.6 7.3 31.9
Accumulated income – 3.9 3.9 0.7 4.6
7.4 21.1 28.5 8.0 36.5
New endowments received – 0.8 0.8 0.1 0.9
Investment income (Note 5) 0.3 0.6 0.9 0.1 1.0
Expenditure (0.2) (0.7) (0.9) (0.2) (1.1)
Increase in market value 0.1 0.3 0.4 0.1 0.5
At 31 July 2014 7.6 22.1 29.7 8.1 37.8
Representing:
Fellowships and scholarship funds
– 13.3 13.3 1.9 15.2
Prize funds – 1.4 1.4 0.6 2.0
Chairs and lectureship funds
– 3.9 3.9 0.1 4.0
Other funds 7.6 3.5 11.1 5.5 16.6
7.6 22.1 29.7 8.1 37.8
Represented by:
Capital 7.6 18.3 25.9 7.4 33.3
Accumulated income – 3.8 3.8 0.7 4.5
7.6 22.1 29.7 8.1 37.8
The value of Endowment Asset Investments at 31 July 2014 was represented by:
Fixed interest stocks 8.1
Equities 24.8
Bank balances 4.9
Total endowment assets 37.8
Linked charitiesIncluded in the endowments (opposite) are a small number of linked (Paragraph (w)) charities.
BroughtForward
£m
Additionsand
Transfers£m
Change inMarket
Value£m
Income£m
Expenditure£m
Carried
Forward£m
Funds and charities with income over £100,000:Yorkshire Cancer Research Endowment
4.5 – – 0.2 (0.1) 4.6
Funds and charities with income below £100,000:Endowed funds (4) and non-endowed funds (1)
0.5 – – – – 0.5
The main charitable purpose of the Yorkshire Cancer Research Endowment is the funding of cancer research.
The Funds and charities with income below £100,000 comprise two lecture funds, a prize fund, a fund to support scholarships and small projects, and a fund to support an Alumni association.
Note 22 Revaluation reserveAs at 31 July 2014 As at 31 July 2013
Group£m
University£m
Group£m
University£m
Balance at 1 August – Tangible assets 228.3 231.1 237.1 237.7
– Investments 5.2 4.9 4.1 3.8
233.5 236.0 241.2 241.5
Revaluation in year – Tangible assets 101.9 101.9 1.2 2.5
– Investments 4.0 8.7 1.1 1.1
Released to income and expenditure account on sale of tangible asset
(2.6) (6.5) (0.7) (0.7)
Contribution to depreciation (8.1) (8.0) (9.3) (8.4)
Balance at 31 July – Tangible assets 319.5 318.5 228.3 231.1
– Investments 9.2 13.6 5.2 4.9
328.7 332.1 233.5 236.0
Financial Statements 2013–2014

56
Financial Statements 2013–2014
Note 23 General reserveAs at 31 July 2014 As at 31 July 2013
Group£m
University£m
Group£m
University£m
Balance at 1 August 176.1 167.0 156.2 148.6
Surplus after depreciation of assets 20.9 21.8 14.6 14.2
Release from revaluation reserve 10.7 14.5 10.0 9.0
207.7 203.3 180.8 171.8
Pension surplus transferred to pension reserve
(5.4) (5.4) (4.7) (4.7)
Balance at 31 July 202.3 197.9 176.1 167.1
Note 24 Pension reserveAs at 31 July 2014 As at 31 July 2013
Group£m
University£m
Group£m
University£m
Balance at 1 August (70.2) (70.2) (55.4) (55.4)
Actuarial loss in respect of pension scheme (3.6) (3.6) (19.5) (19.5)
Pension surplus retained in reserve 5.4 5.4 4.7 4.7
Balance at 31 July (68.4) (68.4) (70.2) (70.2)
Note 25 Reconciliation of consolidated operating surplus to net cash inflow from operating activities
Year ended 31 July 2014
£m
Year ended 31 July 2013
£m
Surplus for the year 20.9 14.6
Depreciation and impairments 50.3 40.8
Loss/(gain) on disposal of assets 0.3 (0.7)
Deferred capital grants released to income (Note 20) (25.9) (20.8)
Pension costs less contributions payable (5.4) (4.7)
Investment income (1.7) (2.7)
Interest payable 4.8 4.9
Increase in stocks (0.4) –
(Increase)/decrease in debtors (15.9) 7.8
Increase in creditors 19.5 2.7
(Decrease)/increase in provisions (0.8) 0.1
Net cash inflow from operating activities 45.7 42.0
Note 26 Returns on investments and servicing of financeYear ended 31 July 2014
£m
Year ended 31 July 2013
£m
Income from endowments 1.0 1.1
Income from short-term investments 0.6 1.6
Interest paid (4.8) (4.9)
Net cash outflow from returns on investments and servicing of finance
(3.2) (2.2)
Notes to the accounts

57
Note 27 Capital expenditure and financial investmentYear ended 31 July 2014
£m
Year ended 31 July 2013
£m
Tangible assets acquired (89.9) (107.9)
Endowment asset investments acquired (0.9) –
Total fixed and endowment asset investments acquired (90.8) (107.9)
Fixed asset investments acquired (0.1) –
Receipts from sales of fixed assets 4.9 –
Deferred capital grants received 36.3 43.1
Utilisation of endowment fund balances (0.1) 0.2
Endowments received 0.9 0.2
Net cash outflow from capital expenditure and financial investment
(48.9) (64.4)
Note 28 Analysis of changes in financing during the yearYear ended 31 July 2014
£m
Year ended 31 July 2013
£m
Balance at 1 August 84.5 87.1
Capital repayments (2.7) (2.6)
Balance at 31 July 81.8 84.5
Note 29 Analysis of changes in net fundsAt
1 August 2013£m
Cash Flows
£m
At 31 July 2014
£m
Cash at bank and in hand
Endowment assets 4.8 0.1 4.9
Other 24.2 4.6 28.8
Deposits repayable on demand 0.1 0.7 0.8
Total cash at bank and in hand 29.1 5.4 34.5
Short-term deposits 86.8 (14.4) 72.4
Debt due within one year (2.7) – (2.7)
Debt due after one year (81.8) 2.6 (79.2)
Total net funds 31.4 (6.4) 25.0
Financial Statements 2013–2014

58
Financial Statements 2013–2014
Different categories of staff have in the past been eligible to join one of four different schemes:
• Universities’ Superannuation Scheme (USS)
• University of Sheffield Pension Scheme (USPS)
• Federated Superannuation System for Universities (FSSU)
• National Health Service Pension Scheme (NHSPS).
The two main schemes, being USS and USPS, are both defined-benefit schemes. The USS scheme is contracted out of the State Second Pension (S2P). The assets of both schemes are held in separate trustee-administered funds.
The other two schemes are firstly the Federated Superannuation System for Universities (FSSU), a money purchase scheme contracted into the State Second Pension (S2P), which covered a small number of academic staff who elected not to transfer to USS when the new scheme was established in 1975. Contributions to this scheme have ceased. Secondly, the National Health Service Pension Scheme (NHSPS), a defined-benefit scheme contracted out of the State Second Pension (S2P), which was restricted to a number of clinical staff who, when transferring from the Health Service to the University, opted to remain in the Health Service Scheme. Both schemes are administered nationally and their assets are held independently of the University.
The total pension cost to the University was:
Note 30 Pension schemes Note 30 Pension schemes (continued)
Year ended 31 July 2014
£m
Year ended 31 July 2013
£m
USS 37.4 34.4
USPS employer contributions 9.3 8.3
USPS FRS 17 adjustments (6.2) (6.0)
NHSPS 1.5 1.5
42.0 38.2
(i) The Universities’ Superannuation Scheme (USS) The institution participates in the Universities Superannuation Scheme (USS), a defined benefit scheme which is contracted out of the State Second Pension (S2P). The assets of the scheme are held in a separate fund administrated by the trustee, Universities Superannuation Scheme Limited.
The latest triennial actuarial valuation of the scheme was at 31 March 2011. This was the second valuation for USS under the scheme-specific funding regime introduced by the Pensions Act 2004, which requires schemes to adopt a statutory funding objective, which is to have sufficient and appropriate assets to cover their technical provisions. The actuary also carries out regular reviews of the funding levels. In particular, he carries out a review of the funding level each year between triennial valuations and details of his estimate of the funding level at 31 March 2014 are also included in this note.
The triennial valuation was carried out using the projected unit method. The assumptions which have the most significant effect on the result of the valuation are those relating to the rate of return on investments (i.e. the valuation rate of interest), the rates of increase in salary and pensions and the assumed rates of mortality. The financial assumptions were derived from market yields prevailing at the valuation date. An “inflation risk premium” adjustment was also included by deducting 0.3 per cent from the market-implied inflation on account of the historically high level of inflation implied by government bonds (particularly when compared to the Bank of England’s target of 2 per cent for CPI which corresponds broadly to 2.75 per cent for RPI per annum).
To calculate the technical provisions, it was assumed that the valuation rate of interest would be 6.1 per cent per annum, salary increases would be 4.4 per cent per annum (with short-term general pay growth at 3.65 per cent per annum and an additional allowance for increases in salaries due to age and promotion reflecting historic scheme experience, with a further cautionary reserve on top for past service liabilities) and pensions would increase by 3.4 per cent per annum for 3 years following the valuation then 2.6 per cent per annum thereafter.
At the valuation date the value of the assets of the scheme was £32,433.5 million and the value of the scheme’s technical provisions was £35,343.7m indicating a shortfall of £2,910.2 million. The assets therefore were sufficient to cover 92 per cent of the benefits which had accrued to members after allowing for expected future increases in earnings.
The actuary also valued the scheme on a number of other bases as at the valuation date. On the scheme’s historic gilts basis, using a valuation rate of interest in respect of past service liabilities of 4.4 per cent per annum (the expected return on gilts) the funding level was approximately 68 per cent. Under the Pension Protection Fund regulations introduced by the Pensions Act 2004 the scheme was 93 per cent funded; on a buy-out basis (i.e. assuming the Scheme had discontinued on the valuation date) the assets would have been approximately 57 per cent of the amount necessary to secure all the USS benefits with an insurance company; and using the FRS17 formula as if USS was a single employer scheme, using AA bond discount rate of 5.5 per cent per annum based on spot yields, the actuary estimated that the funding level at 31 March 2011 was 82 per cent.
As part of this valuation, the trustee has determined, after consultation with the employers, a recovery plan to pay off the shortfall by 31 March 2021. In 2011 the actuary estimated that if experience remained in line with the assumptions made, the shortfall at 31 March 2014 would be £2.2 billion, equivalent to a funding level of 95 per cent.
However, changes in market conditions between March 2011 and March 2014 have had an impact on scheme funding. The next formal triennial actuarial valuation will take place as at 31 March 2014, and work is currently underway to update the actuarial assumptions and allow for any adjustments to the overall funding approach adopted by the trustee board in consultation with stakeholders.
Notes to the accounts

59
As work on the 2014 valuation is not yet complete the trustee cannot provide the final figure. However, an estimate has been provided using the assumptions used to deliver the 2011 actuarial valuation. On that basis, the actuary has estimated that the funding level under the scheme specific funding regime will have fallen from 92 per cent at 31 March 2011 to 85 per cent at 31 March 2014. This estimate is based on the results from the valuation at 31 March 2011 allowing primarily for investment returns and changes to market conditions.
The funding level has decreased mainly due to a decrease in real gilt yields, reducing the implied net discount rate and therefore placing a higher value on the scheme liabilities. The increase has been partially offset by a higher than expected net investment return.
On the FRS17 basis, using an AA bond discount rate of 4.5 per cent per annum based on spot yields, the actuary estimates that the funding level at 31 March 2014 was 75 per cent. An estimate of the funding method measured on a historic gilts basis at that date was approximately 61 per cent.
Surpluses and deficits which arise at future valuations may impact on the institution’s future contribution commitment. A deficit may require additional funding in the form of higher contribution requirements, where a surplus could, perhaps, be used to similarly reduce contribution requirements.
The technical provisions relate essentially to the past service liabilities and funding levels, but it is also necessary to assess the ongoing cost of newly accruing benefits. The cost of future accrual was calculated using the same assumptions as those used to calculate the technical provisions but the allowance for promotional salary increases was not as high. Analysis has shown very variable levels of growth over and above general pay increases in recent years, and the salary growth assumption built into the cost of future accrual is based on more stable, historic, salary experience. However, when calculating the past service liabilities of the scheme a cautionary reserve has been included, in addition, on account of the variability mentioned above.
At the 2011 valuation the scheme was still a fully Final Salary Scheme for future accruals and the prevailing employer contribution rate was 16 per cent of Salaries.
Following UK government legislation, from 2011 statutory pension increases or revaluations are based on the Consumer Prices Index measure of price inflation. Historically these increases had been based on the Retail Prices Index measure of price inflation.
Since the valuation effective date of 31 March 2011 there have been a number of changes to the benefits provided by the scheme although these became effective from October 2011. These include:
New EntrantsOther than in specific, limited circumstances, new entrants are now provided benefits on a Career Revalued Benefits (CRB) basis rather then a Final Salary (FS) basis.
Normal Pension ageThe Normal pension age was increased for future service and new entrants, to age 65.
Flexible RetirementFlexible retirement options were introduced.
Members contributions increasedContributions were uplifted to 7.5 per cent p.a. and 6.5 per cent p.a for FS Section members and CRB Section members respectively.
Cost SharingIf the total contribution level exceeds 23.5 per cent of salaries per annum, the employers will pay 65 per cent of the excess over 23.5 per cent and members would pay the remaining 35 per cent to the fund as additional contributions.
Pension increase capFor service derived after 30 September 2011, USS will match increases in official pensions for the first 5 per cent. If official pensions increase by more than 5 per cent then USS will pay half of the difference up to a maximum increase of 10 per cent.
USS is a “last man standing” scheme so that in the event of the insolvency of any of the participating employers in USS, the amount of any pension funding shortfall (which cannot otherwise be recovered) in respect of that employer will be spread across the remaining participant employers and reflected in the next actuarial valuation of the scheme.
At 31 March 2014, USS had over 162,000 active members and the institution had 4,368 active members participating in the scheme.
The total pension cost for the institution was £37.4 million (2012-2013 £34.4 million). The contribution rate payable by the institution was 16 per cent of pensionable salaries.
FRS 17 (Retirement Benefits)Disclosure is not required under Financial Reporting Standard 17 for the Universities Superannuation Scheme or the NHS Pension Scheme, because although they are defined benefit schemes it is not possible to identify surpluses and deficits by individual employer. These schemes are accordingly accounted for as if they were defined contribution schemes, which are exempt from FRS 17 disclosure requirements.
Under the definitions set out in FRS17, disclosure is required for the University of Sheffield Pension Scheme.
(ii) The University of Sheffield Pension Scheme (USPS)
The University of Sheffield Pension Scheme and ex-gratia pension liabilities FRS17 disclosure information for accounting period ending 31 July 2014
The University operates a cash balance defined benefit pension scheme that non-academic employees of the University can participate in, called the University of Sheffield Pension Scheme (USPS). The scheme is externally funded but is no longer contracted-out of the state second-tier of pension provision. Accrual up to 30 November 2011 was on a final salary basis and certain members retain a salary link.
The last formal actuarial valuation of the scheme was performed as at 1 April 2011 by a professionally qualified actuary.
During the year to 31 July 2014 the University paid contributions in accordance with the tiered contribution structure that had been effective from 1 December 2011.
The University also provides ex-gratia pension benefits to certain employees and former employees who previously did not join other pension arrangements. Ex-gratia benefits have now ceased accruing for all such employees. The University currently pays ex-gratia pensions of £434,000 pa. These liabilities are not separately funded.
Note 30 Pension schemes (continued) Note 30 Pension schemes (continued)
Financial Statements 2013–2014

60
Financial Statements 2013–2014
AssumptionsThe financial assumptions used to calculate scheme liabilities under FRS17 are:
The most significant non-financial assumption is the assumed level of longevity. The table below shows the life expectancy assumptions used in the accounting assessments based on the life expectancy of male and female members at age 65.
Scheme assets and expected rate of return for USPSThe expected return on assets has been derived as the weighted average of the expected returns from each of the main asset classes. The expected return for each asset class reflects a combination of historical performance analysis, the forward looking views of the financial markets (as suggested by the yields available) and the views of investment organisations.
The assets in the scheme were:
Note 30 Pension schemes (continued)
Males Females
Pensioner Non-pensioner(currently aged 45)
Pensioner Non-pensioner (currently aged 45)
At 31 July 2013 21.7 23.9 24.5 26.8
At 31 July 2014 21.8 24.0 24.5 26.9
Fair value as at31 July 2014
£m
Fair value as at31 July 2013
£m
Fair value as at31 July 2012
£m
Equities 92.4 91.1 85.8
Government bonds 1.0 6.1 10.1
Corporate bonds 29.0 27.2 1.9
Property 11.8 – 5.7
Cash 0.8 1.1 3.8
Total 135.0 125.5 107.3
31 July 2014 % pa
31 July 2013% pa
31 July 2012 % pa
The weighted average expected long-term rates of return were:
6.29 6.24 5.76
Notes to the accounts
Note 30 Pension schemes (continued)
* Ex-gratia pensions for non-academics are subject to fixed 3 per cent pa increases. The assumption shown here is for the increases to ex-gratia pensions for academic members.
At 31 July 2014%pa
At 31 July 2013%pa
Price Inflation (RPI) 3.16 3.26
Price Inflation (CPI) 2.16 2.46
Rate of increase in salaries 4.41 4.51
Rate of increase of pensions in payment for USPS members 2.16 2.46
Rate of increase of pensions in payment for ex-gratia pensioners*
3.16 3.26
Increases to deferred pensions before retirement 2.16 2.46
Discount rate 4.18 4.48

61
Year to 31 July 2014
£m
Year to 31 July 2013
£m
Analysis of the amount shown in the balance sheet for USPS and ex-gratia pensions:
Scheme assets 135.0 125.5
Scheme liabilities (203.4) (195.7)
Deficit in the scheme – net pension liability (68.4) (70.2)
Analysis of the amount charged to staff costs within operating surplus for USPS:
Current service cost 3.0 2.3
Past service costs – –
Total operating charge: 3.0 2.3
Analysis of the amount charged to interest payable/credited to other finance income for USPS and ex-gratia pensions
Interest cost 8.7 7.6
Expected return on assets (7.9) (6.3)
Net charge to other finance income 0.8 1.3
Total profit and loss charge before deduction for tax 3.8 3.6
Analysis of amounts recognised in STRGL for USPS and ex-gratia pensions:
Loss /(gain) on assets 1.1 (9.0)
Experience loss/(gain) on liabilities 0.1 (0.1)
Loss on liabilities 2.5 28.5
Total gain recognised in STRGL before deduction for tax 3.7 19.4
The tables below include, where applicable, disclosures for the USPS and ex-gratia pensions combinedto enable clear presentation. The ex-gratia pensions account for £4.9 million of the total liabilities of £203.4 million and £0 million of the total assets.
Note 30 Pension schemes (continued) Note 30 Pension schemes (continued)
History of experience gains and losses – USPS and ex-gratia pensions
Year to 31 July
2014£m
Year to 31 July
2013£m
Year to 31 July
2012 £m
Year to 31 July
2011 £m
Year to 31 July
2010 £m
Difference between actual and expected return on scheme assets:
Amount (£m) 1.1 (9.0) 11.1 (5.5) (7.8)
% of assets at end of year 1% 7% 10% 5% 8%
Experience gains on scheme liabilities:
Amount (£m) (0.4) (0.1) (9.5) – (0.2)
% of liabilities at end of year – – 6% – 3%
Financial Statements 2013–2014

62
Financial Statements 2013–2014
At 31 July 2014£m
At 31 July 2013£m
Cumulative actuarial loss recognised in the statement of totalrecognised gains and losses for USPS and ex-gratia pensions
Cumulative actuarial losses recognised at the start of the year 36.3 16.9
Cumulative actuarial losses recognised at the end of the year 40.0 36.3
Year to 31 July 2014
£m
Year to 31 July 2013
£m
Analysis of movement in the present value of USPS and ex-gratia liabilities
Present value of USPS and ex-gratia liabilities at the start of the year
195.7 162.7
Current service cost (net of member contributions) 3.0 2.3
Past service cost – –
Interest cost 8.7 7.6
Actual member contributions (including notional contributions) 0.3 0.3
Actuarial loss 2.6 28.4
Actual benefit payments (6.9) (5.6)
Present value of USPS and ex-gratia liabilities at the end of the year
203.4 195.7
Note 30 Pension schemes (continued) Note 30 Pension schemes (continued)
Year to 31 July 2014
£m
Year to 31 July 2013
£m
Analysis of movement in the fair value of scheme assets
Fair value of assets at the start of the year 125.5 107.3
Expected return on assets 7.9 6.2
Actuarial (loss)/gain on assets (1.1) 9.0
Actual contributions paid by University 8.8 7.9
Actual member contributions (including notional contributions) 0.3 0.2
Actual benefit payments (6.4) (5.1)
Fair value of scheme assets at the end of the year 135.0 125.5
USPS assets do not include any of the institution’s own financial instruments, or any property occupied by the institution.
31 July 2014 £m
31 July 2013 £m
Actual return on scheme assets
Expected return on scheme assets 7.9 6.2
Asset (loss)/gain (1.1) 9.0
Actual return on scheme assets 6.8 15.2
Estimated contributions for USPS in the Financial Year 2014–15 is £9.2 million.
Notes to the accounts

63
Note 31 Capital commitmentsAt 31 July 2014
£m At 31 July 2013
£m
Commitments contracted for 57.2 85.9
Authorised but not contracted for 45.5 39.7
102.7 125.6
Note 32 Financial commitments
At 31 July 2014 £m
At 31 July 2013 £m
Operating lease commitments in respect of buildings and equipment for the 2013–2014 financial year, on leases expiring:
Within one year 0.2 –
Between two and five years 1.5 1.3
Over five years 0.4 0.1
2.1 1.4
As part of the Student Residences Strategy the University entered into a project agreement during 2005-2006 with Catalyst Higher Education Sheffield PLC (Catalyst), to build 3,533 new bed spaces, deliver 401 refurbished bed spaces and take over 257 transferred bed spaces. The project cost £162 million and was partly financed by a bond issue by Catalyst of £155 million. This project does not form part of the University Balance Sheet. The ownership of the student residences have been transferred to Catalyst but under the terms of the land lease will revert to the University after 41 years.
Note 33 University companies
Subsidiary companies %
AMRC Management Ltd 76.0 Advanced manufacturing researchCastings Technology International Ltd 100.0 Advanced casting manufacturing and researchepiGenesys Ltd 100.0 Custom software solutions and web applicationsEscafeld Estates Ltd 100.0 Property disposal for student residences strategyFaraPack Polymers Ltd 100.0 Innovative packaging solutionsIn-Tend Ltd 75.0 Procurement software Risk2Value Ltd 75.0 Insurance ServicesSheffield Advisory Services Sdn Bhd 100.0 University Malaysian OfficeSheffield University Enterprises Ltd 100.0 Business and management consultancyThe National Metals Technology Centre Ltd * Licensing of NAMTEC name to the UniversityTitanium Castings UK Limited 100.0 Titanium casting manufacturingTUOS Parking Ltd 100.0 Car park servicesUnicus Ltd 100.0 Hotel services
Note 33 University companies (continued)
Associate Companies %
Blastech Ltd 24.9 Blast, impact and ballistic testing services
Conteque Ltd 24.9 Novel reinforcement systems for structural concrete
Enactus Sheffield Ltd * Social enterprise company
Energy and Power Technology Ltd 42.0 Testing services for research and development
Full Scale Dynamics Ltd 25.0 Technical testing and analysis
High Value Manufacturing Catapult 28.6 Grants management
Knowledge Now Ltd 50.0 Semantic based solutions for knowledge sharing
Knowledge Flo Ltd 46.6 Holding company
Limit State Ltd 25.0 Computational limit analysis and software design
Rivelin Healthcare 20.5 Healthcare
The University also has an interest in the following joint venture companies:
Myscience.co Ltd 25.0 Provision, maintenance and support of the teaching and learning of science
N8 Ltd 12.5 A partnership of research-intensive universities in the north of England
The Centre for Low Carbon Futures 20.0 Promotion of research into low carbon innovations
Worldwide Universities Network 16.7 Promotes research and distributes e-learning
YHMAN Ltd 12.5 Procurement, operation and management of a metropolitan area network
Apart from Sheffield Advisory Services Sdn Bhd, which is incorporated in Malaysia, all companies are incorporated in Great Britain.
Financial Statements 2013–2014
* Limited by guarantee
* Limited by guarantee

64
Financial Statements 2013–2014
Note 34 Hardship fundsYear ended 31 July 2014
£m
Year ended 31 July 2013
£m
Balance unspent at 1 August – –
Funding council grants 0.3 0.3
0.3 0.3
Disbursed to students and administration expenses (0.3) (0.3)
Balance unspent at 31 July – –
Funding Council grants are available solely for students: the University acts only as a paying agent.The grants and related disbursements are therefore excluded from the income and expenditureaccount.
Note 35 ITT training bursariesYear ended 31 July 2014
£m
Year ended 31 July 2013
£m
Balance unspent at 1 August 0.1 –
Grant received 1.3 1.4
1.4 1.4
Disbursed to students (1.3) (1.3)
Balance unspent at 31 July 0.1 0.1
Teaching Agency grants for ITT Bursaries are available solely for students: the University acts only as a paying agent. The grants and related disbursements are therefore excluded from the income and expenditure account.
Related Party
Income£m
Expenditure£m
Balances at 31 July 2014
due to/(from) the University
£m
University companiesBlastech Ltd (0.1) – –N8 Ltd (0.2) – –Northern Consortium UK Ltd – 0.5 –Risk2Value Ltd (0.1) 0.2 –Sheffield Advisory Services Sdn Bhd
– 0.1 –
The Russell Group of Universities
– 0.1 –
Worldwide Universities Network – 0.1 –
Organisations and companies in which members of Council or senior management have an interest:Centre for Low Carbon Futures – 0.1 – Professor Sir K
Burnett
Mercer Ltd – 0.1 – Sir Peter Middleton
Rotherham NHS Foundation Trust (0.1) 0.2 – Ms A M Legg
Sheffield Teaching Hospitals NHS Fdn Trust
(12.9) 2.2 (3.0) Mr A P Pedder OBE, Professor A P Weetman
University of Amsterdam – 0.2 – Professor Dr D C van den Boom
Note 36 Related party disclosure
Due to the nature of the University’s operations and the composition of its Council (being drawn from local public and private sector organisations) and senior management team, it is inevitable that transactions will take place with organisations in which a member of Council or the senior management team may have an interest. All transactions involving organisations in which a member of Council or the senior management team may have an interest, including those identified below, are conducted at arms length and in accordance with the University’s financial regulations and usual procurement procedures. Transactions with wholly owned subsidiaries which have been consolidated in the Group accounts are not disclosed below, in accordance with the exemption given in FRS8 (Related Party Disclosures).
Notes to the accounts

Copyright © 2014 The University of Sheffield 0278Mktg
This publication can be made available in different formats on request. To request an alternative format: Tel: +44 (0) 114 222 1303 Email: [email protected]

www.sheffield.ac.uk