annual report - ergo · signatures to annual report 2014 ... still sporadic with marked divergences...
TRANSCRIPT
ERGO INSURANCE SE ANNUAL REPORT 2014
1
ERGO Insurance SE
ANNUAL REPORT2014

ERGO INSURANCE SE ANNUAL REPORT 2014
2
Annual report
Company name: ERGO Insurance SERegistry number: 10017013Address: A. H. Tammsaare tee 47, 11316 Tallinn Republic of Estonia
Telephone: +372 610 6500Fax: +372 610 6501E-mail: [email protected]: www.ergo.eeCore business: non-life insurance
Beginning of financial year: 1 January 2014
End of financial year: 31 December 2014
Chairman of the management board: Kęstutis Bagdonavičius
Auditor: KPMG Baltics OÜ
Accompanying documents: 1. Independent auditor’s report 2. Profit allocation proposal 3. Information on the sole shareholder 4. List of business activities

ERGO INSURANCE SE ANNUAL REPORT 2014 ERGO INSURANCE SE ANNUAL REPORT 2014
32
Contents
Review of operations .................................................................................................................................... 4Financial statements .................................................................................................................................... 14
Income statement ...................................................................................................................................... 14Statement of comprehensive income ................................................................................................. 14Statement of financial position .............................................................................................................. 15Statement of cash flows .......................................................................................................................... 16Statement of changes in equity ............................................................................................................ 17
Notes to the financial statements ......................................................................................................... 18Note 1. Significant accounting policies ................................................................................................ 18Note 2. Insurance and financial risks ................................................................................................... 27
2.1. Insurance risks ............................................................................................................................ 272.2. Financial risk management .................................................................................................... 332.3. Capital management ................................................................................................................ 362.4. Operational risk .......................................................................................................................... 362.5. Reputational risk ........................................................................................................................ 372.6. Strategic risk ................................................................................................................................ 37
Note 3. Premium income .......................................................................................................................... 38Note 4. Commission income .................................................................................................................... 39Note 5. Investment income ..................................................................................................................... 39Note 6. Other income ................................................................................................................................. 39Note 7. Claims and benefits ..................................................................................................................... 40Note 8. Expenses ......................................................................................................................................... 42Note 9. Foreign exchange differences .................................................................................................. 43Note 10. Property and equipment ......................................................................................................... 43Note 11. Deferred acquisition costs ...................................................................................................... 44Note 12. Other intangible assets ........................................................................................................... 44Note 13. Investments in associates ..................................................................................................... 45Note 14. Investments in financial instruments ................................................................................ 45
14.1. Equities and fund units .......................................................................................................... 4614.2. Available-for-sale debt securities and other fixed-income securities .................. 4614.3. Loans ........................................................................................................................................... 47
Note 15. Reinsurance assets ................................................................................................................... 47Note 16. Insurance and other receivables ......................................................................................... 48Note 17. Cash and cash equivalents ..................................................................................................... 48Note 18. Shareholders and share capital ............................................................................................ 49Note 19. Capital reserve ............................................................................................................................ 49Note 20. Fair value reserve ....................................................................................................................... 50Note 21. Insurance contract provisions and reinsurance assets ................................................ 50Note 22. Reinsurance payables .............................................................................................................. 53Note 23. Insurance payables .................................................................................................................. 53Note 24. Other payables and accrued expenses .............................................................................. 53Note 25. Other provisions ......................................................................................................................... 53Note 26. Fair value of financial instruments ...................................................................................... 54Note 27. Operating and finance leases ............................................................................................... 55Note 28. Income tax ................................................................................................................................... 55Note 29. Transactions with related parties ........................................................................................ 56Note 30. Events after the reporting period ......................................................................................... 57
Signatures to annual report 2014 ........................................................................................................... 58Independent auditor’s report ................................................................................................................... 59Profit allocation proposal ........................................................................................................................... 60Information on the sole shareholder ..................................................................................................... 61List of business activities ........................................................................................................................... 62
ERGO INSURANCE SE ANNUAL REPORT 2014
4
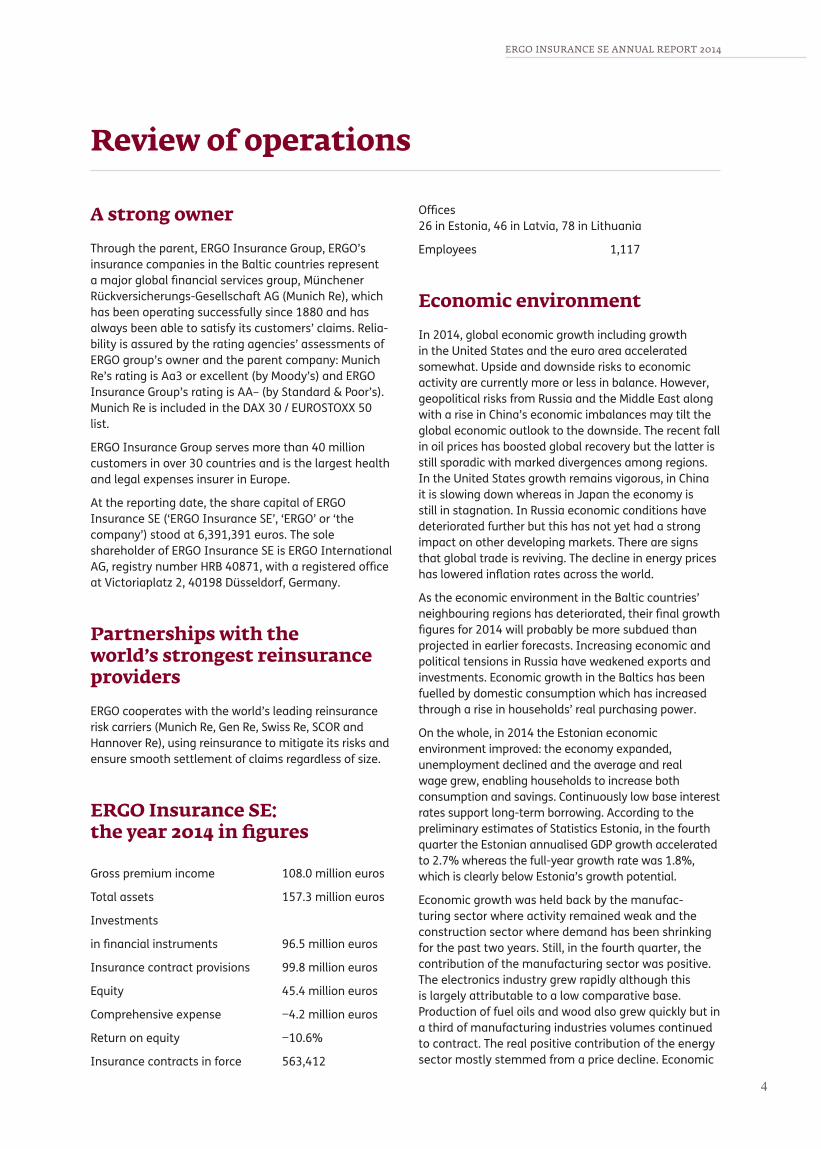
A strong owner
Through the parent, ERGO Insurance Group, ERGO’s insurance companies in the Baltic countries represent a major global financial services group, Münchener Rückversicherungs-Gesellschaft AG (Munich Re), which has been operating successfully since 1880 and has always been able to satisfy its customers’ claims. Relia-bility is assured by the rating agencies’ assessments of ERGO group’s owner and the parent company: Munich Re’s rating is Aa3 or excellent (by Moody’s) and ERGO Insurance Group’s rating is AA– (by Standard & Poor’s). Munich Re is included in the DAX 30 / EUROSTOXX 50 list.
ERGO Insurance Group serves more than 40 million customers in over 30 countries and is the largest health and legal expenses insurer in Europe.
At the reporting date, the share capital of ERGO Insurance SE (‘ERGO Insurance SE’, ‘ERGO’ or ‘the company’) stood at 6,391,391 euros. The sole shareholder of ERGO Insurance SE is ERGO International AG, registry number HRB 40871, with a registered office at Victoriaplatz 2, 40198 Düsseldorf, Germany.
Partnerships with the world’s strongest reinsurance providers
ERGO cooperates with the world’s leading reinsurance risk carriers (Munich Re, Gen Re, Swiss Re, SCOR and Hannover Re), using reinsurance to mitigate its risks and ensure smooth settlement of claims regardless of size.
ERGO Insurance SE: the year 2014 in figures
Gross premium income 108.0 million euros
Total assets 157.3 million euros
Investments
in financial instruments 96.5 million euros
Insurance contract provisions 99.8 million euros
Equity 45.4 million euros
Comprehensive expense −4.2 million euros
Return on equity −10.6%
Insurance contracts in force 563,412
Offices 26 in Estonia, 46 in Latvia, 78 in Lithuania
Employees 1,117
Economic environment
In 2014, global economic growth including growth in the United States and the euro area accelerated somewhat. Upside and downside risks to economic activity are currently more or less in balance. However, geopolitical risks from Russia and the Middle East along with a rise in China’s economic imbalances may tilt the global economic outlook to the downside. The recent fall in oil prices has boosted global recovery but the latter is still sporadic with marked divergences among regions. In the United States growth remains vigorous, in China it is slowing down whereas in Japan the economy is still in stagnation. In Russia economic conditions have deteriorated further but this has not yet had a strong impact on other developing markets. There are signs that global trade is reviving. The decline in energy prices has lowered inflation rates across the world.
As the economic environment in the Baltic countries’ neighbouring regions has deteriorated, their final growth figures for 2014 will probably be more subdued than projected in earlier forecasts. Increasing economic and political tensions in Russia have weakened exports and investments. Economic growth in the Baltics has been fuelled by domestic consumption which has increased through a rise in households’ real purchasing power.
On the whole, in 2014 the Estonian economic environment improved: the economy expanded, unemployment declined and the average and real wage grew, enabling households to increase both consumption and savings. Continuously low base interest rates support long-term borrowing. According to the preliminary estimates of Statistics Estonia, in the fourth quarter the Estonian annualised GDP growth accelerated to 2.7% whereas the full-year growth rate was 1.8%, which is clearly below Estonia’s growth potential.
Economic growth was held back by the manufac-turing sector where activity remained weak and the construction sector where demand has been shrinking for the past two years. Still, in the fourth quarter, the contribution of the manufacturing sector was positive. The electronics industry grew rapidly although this is largely attributable to a low comparative base. Production of fuel oils and wood also grew quickly but in a third of manufacturing industries volumes continued to contract. The real positive contribution of the energy sector mostly stemmed from a price decline. Economic
Review of operations
ERGO INSURANCE SE ANNUAL REPORT 2014 ERGO INSURANCE SE ANNUAL REPORT 2014
54
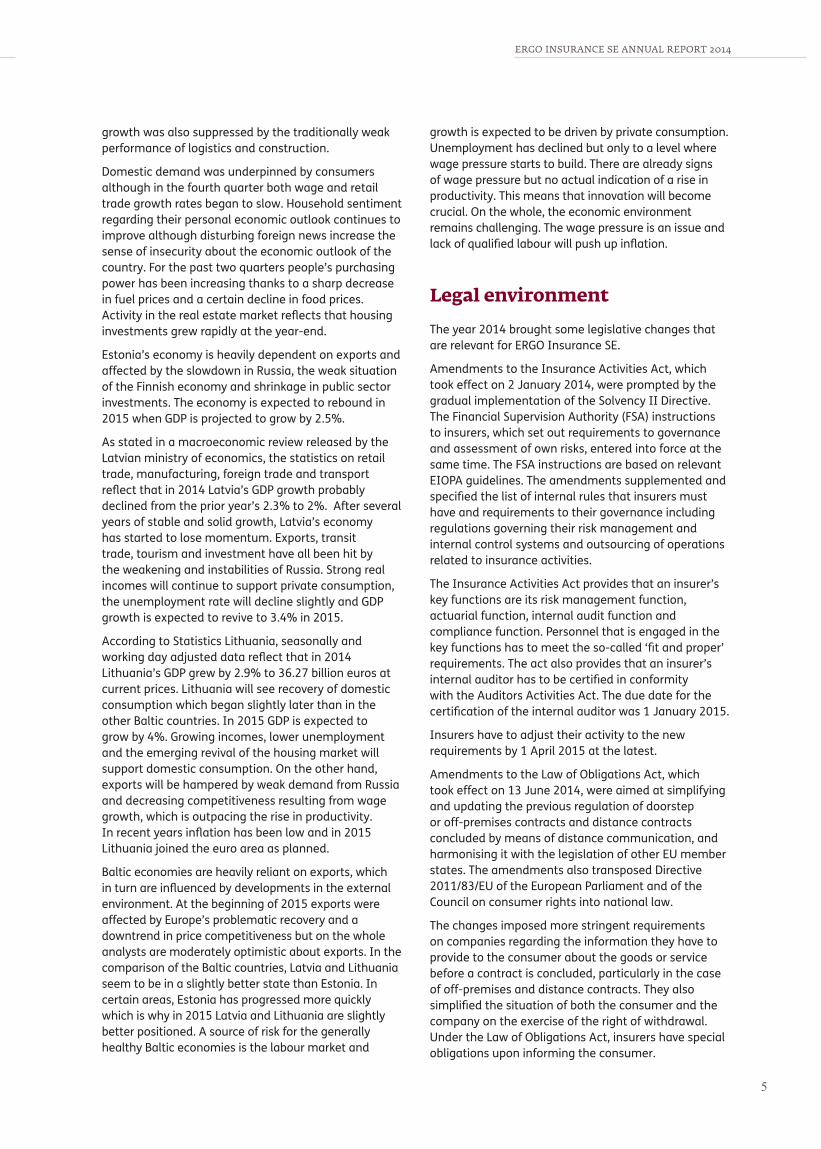
growth was also suppressed by the traditionally weak performance of logistics and construction.
Domestic demand was underpinned by consumers although in the fourth quarter both wage and retail trade growth rates began to slow. Household sentiment regarding their personal economic outlook continues to improve although disturbing foreign news increase the sense of insecurity about the economic outlook of the country. For the past two quarters people’s purchasing power has been increasing thanks to a sharp decrease in fuel prices and a certain decline in food prices. Activity in the real estate market reflects that housing investments grew rapidly at the year-end.
Estonia’s economy is heavily dependent on exports and affected by the slowdown in Russia, the weak situation of the Finnish economy and shrinkage in public sector investments. The economy is expected to rebound in 2015 when GDP is projected to grow by 2.5%.
As stated in a macroeconomic review released by the Latvian ministry of economics, the statistics on retail trade, manufacturing, foreign trade and transport reflect that in 2014 Latvia’s GDP growth probably declined from the prior year’s 2.3% to 2%. After several years of stable and solid growth, Latvia’s economy has started to lose momentum. Exports, transit trade, tourism and investment have all been hit by the weakening and instabilities of Russia. Strong real incomes will continue to support private consumption, the unemployment rate will decline slightly and GDP growth is expected to revive to 3.4% in 2015.
According to Statistics Lithuania, seasonally and working day adjusted data reflect that in 2014 Lithuania’s GDP grew by 2.9% to 36.27 billion euros at current prices. Lithuania will see recovery of domestic consumption which began slightly later than in the other Baltic countries. In 2015 GDP is expected to grow by 4%. Growing incomes, lower unemployment and the emerging revival of the housing market will support domestic consumption. On the other hand, exports will be hampered by weak demand from Russia and decreasing competitiveness resulting from wage growth, which is outpacing the rise in productivity. In recent years inflation has been low and in 2015 Lithuania joined the euro area as planned.
Baltic economies are heavily reliant on exports, which in turn are influenced by developments in the external environment. At the beginning of 2015 exports were affected by Europe’s problematic recovery and a downtrend in price competitiveness but on the whole analysts are moderately optimistic about exports. In the comparison of the Baltic countries, Latvia and Lithuania seem to be in a slightly better state than Estonia. In certain areas, Estonia has progressed more quickly which is why in 2015 Latvia and Lithuania are slightly better positioned. A source of risk for the generally healthy Baltic economies is the labour market and
growth is expected to be driven by private consumption. Unemployment has declined but only to a level where wage pressure starts to build. There are already signs of wage pressure but no actual indication of a rise in productivity. This means that innovation will become crucial. On the whole, the economic environment remains challenging. The wage pressure is an issue and lack of qualified labour will push up inflation.
Legal environment
The year 2014 brought some legislative changes that are relevant for ERGO Insurance SE.
Amendments to the Insurance Activities Act, which took effect on 2 January 2014, were prompted by the gradual implementation of the Solvency II Directive. The Financial Supervision Authority (FSA) instructions to insurers, which set out requirements to governance and assessment of own risks, entered into force at the same time. The FSA instructions are based on relevant EIOPA guidelines. The amendments supplemented and specified the list of internal rules that insurers must have and requirements to their governance including regulations governing their risk management and internal control systems and outsourcing of operations related to insurance activities.
The Insurance Activities Act provides that an insurer’s key functions are its risk management function, actuarial function, internal audit function and compliance function. Personnel that is engaged in the key functions has to meet the so-called ‘fit and proper’ requirements. The act also provides that an insurer’s internal auditor has to be certified in conformity with the Auditors Activities Act. The due date for the certification of the internal auditor was 1 January 2015.
Insurers have to adjust their activity to the new requirements by 1 April 2015 at the latest.
Amendments to the Law of Obligations Act, which took effect on 13 June 2014, were aimed at simplifying and updating the previous regulation of doorstep or off-premises contracts and distance contracts concluded by means of distance communication, and harmonising it with the legislation of other EU member states. The amendments also transposed Directive 2011/83/EU of the European Parliament and of the Council on consumer rights into national law.
The changes imposed more stringent requirements on companies regarding the information they have to provide to the consumer about the goods or service before a contract is concluded, particularly in the case of off-premises and distance contracts. They also simplified the situation of both the consumer and the company on the exercise of the right of withdrawal. Under the Law of Obligations Act, insurers have special obligations upon informing the consumer.
ERGO INSURANCE SE ANNUAL REPORT 2014
6
Amendments to the Income Tax Act, which took effect on 1 September 2014, adjusted the rules for exempting compensation paid to employees for use of a personal car for work purposes from tax and increased the ceiling of tax exempt compensation from the previous 256 euros to 335 euros per month. According to law, tax exempt compensation can be paid only if separate records are kept and the rate is 0.3 euros per km.
The new Motor Insurance Act, which took effect on 1 October 2014, made the formalities resulting from a traffic accident more convenient for the injured party and rendered motor third party liability (motor TPL) insurance contracts more similar to other insurance contracts. A motor TPL insurance contract can now be concluded, changed and terminated similarly to other insurance contracts. Motor TPL insurance is linked to registration in the motor vehicle register. A vehicle entered in the motor vehicle register must have a valid motor TPL insurance contract regardless of whether it is used in traffic or not. Insurers determine transfer of ownership of a vehicle based on the entry made in the motor vehicle register, not based on the actual date of transfer. When a vehicle is not used for an extended period, it has to be deleted (temporarily) from the motor vehicle register. A motor TPL insurance contract may be concluded by any person that has an insurable interest and it can be concluded for a specified term only.
The law brought about a systemic change in the compensation of motor TPL insurance claims: the injured party may now claim compensation from its own motor TPL insurance provider.
The law also established the system of automatic motor insurance. This is a compulsory insurance system that extends automatic insurance cover to vehicles entered in the motor vehicle register that do not have a compulsory motor TPL insurance contract. The new act maintained those provisions of the previous act that operated effectively and updated provisions that had become out of date because the previous Motor Insurance Act entered into force in 2001, i.e. before the Estonian private law reform was completed and before Estonia joined the European Union.
The purpose of the Act to Amend the Value Added Tax Act, which took effect on 1 November 2014 and partly on 1 July 2014, was to reduce possibilities for concealing supply, to improve the competitive environment and to increase tax revenue by reducing losses resulting from breaches of the Value Added Tax Act. The law established an annex to the value added tax (VAT) return. The annex is for recording the data of invoices issued to and received from legal persons, sole proprietors and state, rural municipality and city authorities and institutions and the registry codes or, in the case of notaries and bailiffs, the personal identi-fication codes issued to transaction partners in Estonia. An invoice on which the transferor of the goods or the provider of the service has recorded supply subject
to 20% or 9% VAT, except for an invoice submitted under a special arrangement, has to be recorded in the appendix if the total amount of the invoice or invoices excluding VAT is at least 1,000 euros per transaction partner during the taxation period. The transaction-partner based limit applies separately to purchase and sales invoices.
Additional amendments to the Value Added Tax Act took effect on 1 December 2014. In place of limiting the taxation of self-supply of company cars, the law restricts deduction of input VAT paid on the acquisition of cars or use of cars under contracts of use (including rental and lease contracts) and acquisition of goods and services for such cars (motor fuel, repair and maintenance services, etc.). When a car is acquired or used under a contract of use and when goods and services are acquired for such a car, input VAT is deducted in proportion to the use of the car for business purposes but not in excess of 50%, taking into account the proportions of taxable and exempt supply. The purpose of the act was to introduce a fairer system for the taxation of cars on the assumption that this would also increase state revenue. An insurer that settles an insurance claim related to a vehicle belonging to a company has to take into account the rate of refund of input VAT eligible to the company. The amendment has a direct impact on the scope of an insurer’s compensation obligation.
Financial performance of ERGO Insurance SE
Gross premium income for 2014 was 108.0 million euros by which ERGO Insurance SE maintained the second position in the Estonian non-life insurance market and the third position in the Baltic non-life insurance market. Claims and benefits incurred totalled 63.5 million euros, accounting for 58.8% of gross premium income. Net expense ratio was 37.3% (2013: 37.0%). Professional risk assessment has improved the quality of the insurance portfolio and the net loss ratio was 61.8% (2013: 67.2%).
Thanks to an improvement in the loss ratio, the net combined ratio for 2014 was 99.2% (2013: 104.1%). ERGO Insurance SE ended 2014 with total compre-hensive expense of 4.2 million euros. The insurance result was positive at 0.9 million euros, net investment income was 1.6 million euros and other activities generated a loss of 7.7 million euros. Comprehensive expense was also influenced by a 1.0 million euro increase in the value of available-for-sale financial assets.
At the end of 2014, ERGO Insurance SE had total assets of 157.3 million euros (2013: 159.7 million euros). Investments in financial instruments totalled 96.5 million euros (2013: 89.4 million euros), breaking down
ERGO INSURANCE SE ANNUAL REPORT 2014 ERGO INSURANCE SE ANNUAL REPORT 2014
76
as follows: debt securities 81.0% (2013: 80.7%), loans 2.0% (2013: 2.2%) and equities and fund units 17.0% (2013: 17.1%). Altogether, investments in financial instruments accounted for 61.3% (2013: 56.0%) of total assets. Insurance provisions totalled 99.8 million euros (2013: 96.8 million euros), accounting for 89.2%
(2013: 88.7%) of total liabilities and 63.4% (2013: 60.6%) of total assets. At the year-end, insurance provisions were backed with investments in financial instruments and reinsurance assets, which exceeded insurance provisions by 11.3 million euros (2013: 6.9 million euros), providing the company with an adequate liquidity buffer.
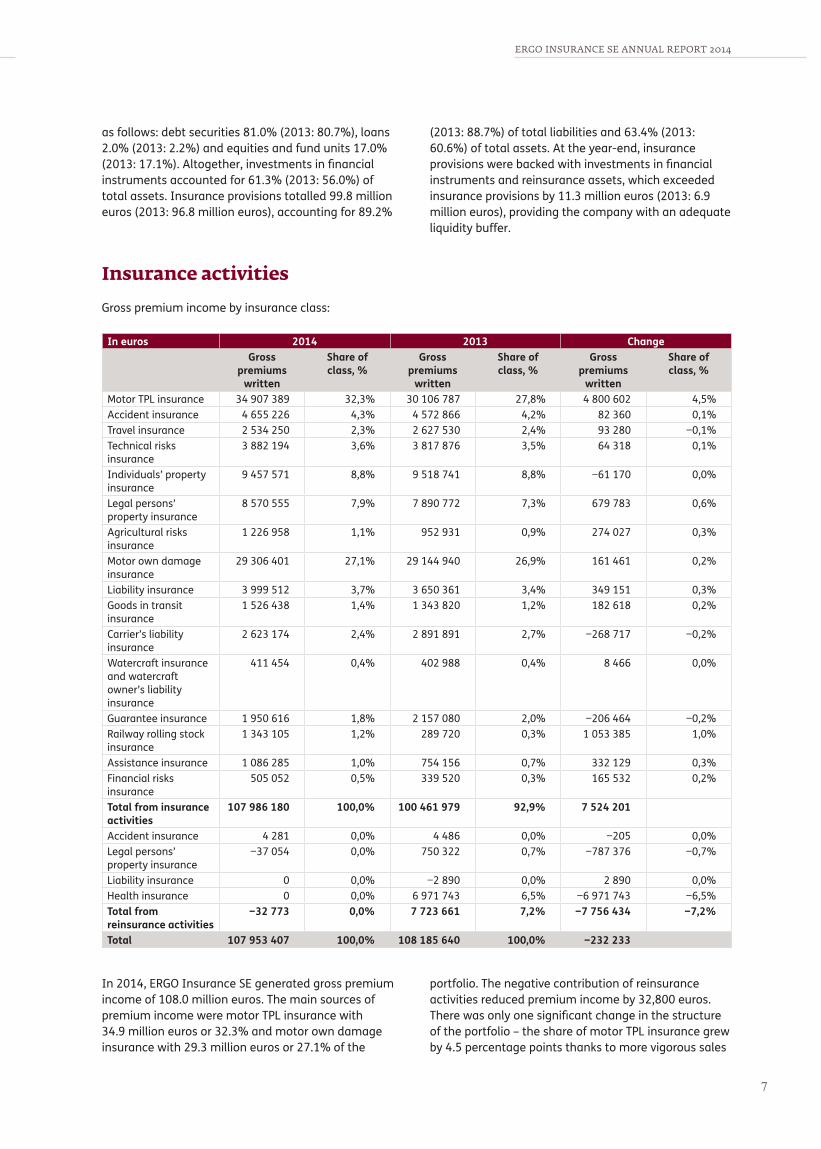
Insurance activities
Gross premium income by insurance class:
In euros 2014 2013 ChangeGross
premiums written
Share of class, %
Gross premiums
written
Share of class, %
Gross premiums
written
Share of class, %
Motor TPL insurance 34 907 389 32,3% 30 106 787 27,8% 4 800 602 4,5%Accident insurance 4 655 226 4,3% 4 572 866 4,2% 82 360 0,1%Travel insurance 2 534 250 2,3% 2 627 530 2,4% 93 280 −0,1%Technical risks insurance
3 882 194 3,6% 3 817 876 3,5% 64 318 0,1%
Individuals’ property insurance
9 457 571 8,8% 9 518 741 8,8% −61 170 0,0%
Legal persons’ property insurance
8 570 555 7,9% 7 890 772 7,3% 679 783 0,6%
Agricultural risks insurance
1 226 958 1,1% 952 931 0,9% 274 027 0,3%
Motor own damage insurance
29 306 401 27,1% 29 144 940 26,9% 161 461 0,2%
Liability insurance 3 999 512 3,7% 3 650 361 3,4% 349 151 0,3%Goods in transit insurance
1 526 438 1,4% 1 343 820 1,2% 182 618 0,2%
Carrier’s liability insurance
2 623 174 2,4% 2 891 891 2,7% −268 717 −0,2%
Watercraft insurance and watercraft owner’s liability insurance
411 454 0,4% 402 988 0,4% 8 466 0,0%
Guarantee insurance 1 950 616 1,8% 2 157 080 2,0% −206 464 −0,2%Railway rolling stock insurance
1 343 105 1,2% 289 720 0,3% 1 053 385 1,0%
Assistance insurance 1 086 285 1,0% 754 156 0,7% 332 129 0,3%Financial risks insurance
505 052 0,5% 339 520 0,3% 165 532 0,2%
Total from insurance activities
107 986 180 100,0% 100 461 979 92,9% 7 524 201
Accident insurance 4 281 0,0% 4 486 0,0% −205 0,0%Legal persons’ property insurance
−37 054 0,0% 750 322 0,7% −787 376 −0,7%
Liability insurance 0 0,0% −2 890 0,0% 2 890 0,0%Health insurance 0 0,0% 6 971 743 6,5% −6 971 743 −6,5%Total from reinsurance activities
−32 773 0,0% 7 723 661 7,2% −7 756 434 −7,2%
Total 107 953 407 100,0% 108 185 640 100,0% −232 233
In 2014, ERGO Insurance SE generated gross premium income of 108.0 million euros. The main sources of premium income were motor TPL insurance with 34.9 million euros or 32.3% and motor own damage insurance with 29.3 million euros or 27.1% of the
portfolio. The negative contribution of reinsurance activities reduced premium income by 32,800 euros. There was only one significant change in the structure of the portfolio – the share of motor TPL insurance grew by 4.5 percentage points thanks to more vigorous sales

ERGO INSURANCE SE ANNUAL REPORT 2014
8
Claims and benefits paid by insurance class:
In euros 2014 2013 ChangeClaims and
benefits paidShare of class,
%Claims and
benefits paidShare of class,
% Claims and
benefits paidShare of class,
%Motor TPL insurance 21 356 602 35,5% 22 777 404 34,2% −1 420 802 1,4%Accident insurance 2 400 006 4,0% 2 163 746 3,2% 236 260 0,7%Travel insurance 1 155 060 1,9% 1 344 858 2,0% −189 798 −0,1%Technical risks insurance
1 604 611 2,7% 1 328 111 2,0% 276 500 0,7%
Individuals’ property insurance
4 790 111 8,0% 4 850 023 7,3% −59 912 0,7%
Legal persons’ property insurance
2 979 932 5,0% 3 440 718 5,2% −460 786 −0,2%
Agricultural risks insurance
2 618 278 4,4% 730 468 1,1% 1 887 810 3,3%
Motor own damage insurance
19 000 670 31,6% 21 501 026 32,3% −2 500 356 −0,6%
Liability insurance 1 037 423 1,7% 1 449 936 2,2% −412 513 −0,4%Goods in transit insurance
292 313 0,5% 194 043 0,3% 98 270 0,2%
Carrier’s liability insurance
1 490 446 2,5% 1 616 057 2,4% −125 611 0,1%
Watercraft insurance and watercraft owner’s liability insurance
527 310 0,9% 372 110 0,6% 155 200 0,3%
Guarantee insurance 164 491 0,3% 105 556 0,2% 58 935 0,1%Railway rolling stock insurance
8 555 0,0% 114 0,0% 8 441 0,0%
Assistance insurance 636 736 1,1% 328 086 0,5% 308 650 0,6%Financial risks insurance
20 869 0,0% 4 180 0,0% 16 689 0,0%
Health insurance 0 0,0% 4 422 160 6,6% −4 422 160 −6,6%Total 60 083 413 100,0% 66 628 596 100,0% −6 545 183
Claims and benefits paid in 2014 totalled 60.1 million euros. Claims incurrence trends did not change significantly. The largest proportion of claims was settled in motor TPL insurance – 21.4 million euros or 35.5% of claims paid.
On 1 January 2014, the Latvian branch discontinued provision of reinsurance to ERGO Life Insurance SE Latvian branch, which had a strong impact on premiums written and claims paid in health insurance.
Investing activities
Strategic investment management is the responsibility of the company’s asset and liability management committee that includes highly qualified specialists from Estonia and Germany. Under the investment management system implemented in 2005, tactical investment management was the responsibility of AS Trigon Funds that delivered the service in accordance with the strategic investment management plan and risk profile approved by the management board of ERGO Insurance SE. In January 2015, tactical investment management was taken over by the group’s investment
management company MEAG (Munich ERGO AG).
In 2014, ERGO Insurance SE maintained a conservative interest rate and credit risk policy. By credit ratings, the debt securities portfolio broke down as follows: 47.2% (2013: 47.7%) had an AAA (by Standard & Poor’s) or Aaa (by Moody’s) rating, 27% (2013: 29.9%) were rated AA or Aa, 9.9% (2013: 10%) had an A rating and 15.9% (2013: 12.4%) were rated BBB or Baa.
The year-end structure of the investment portfolio was as follows: investments in associates of 3.1 million euros (2013: 2.6 million euros), debt securities of 78.2 million euros (2013: 72.1 million euros), loans of 1.9 million euros (2013: 2.0 million euros), no term deposits, and investments in equities and fund units of 16.4 million euros (2013: 15.3 million euros).
Income on assets with interest rate risk amounted to 1.2 million euros. Realisation of equities and fund units resulted in a gain of 0.1 million euros and realisation of debt securities resulted in a gain of 0.4 million euros. Dividend income was 0.2 million euros and the fair value reserve increased by 0.95 million euros. Thus, the overall yield of the investment portfolio was 3.1%. Investment management expenses accounted for 0.34% of the carrying value of managed investments.

ERGO INSURANCE SE ANNUAL REPORT 2014 ERGO INSURANCE SE ANNUAL REPORT 2014
98
Development
Business performance and future outlookIn 2014, the Baltic insurance market continued to grow. In addition, there was a major takeover (PZU’s acquisition of RSA) which triggered energetic activity among market players interested in increasing their market share.
ERGO’s growth outpaced overall market growth. Compared to the Baltic insurance market that grew by 4% (from 802.8 million to 835.1 million euros) in 2014, ERGO grew by 7.6% (from 100.4 million to 108.0 million euros) and increased its market share from 12.5% to 12.9%.
In the second quarter of 2014, ERGO’s Estonian insurance portfolio resumed its upward trend. Annual growth figures were 3% in Estonia, 7.1% in Lithuania and 20.3% in Latvia.
In 2014, claims paid to ERGO’s non-life insurance customers in the Baltics totalled 60.1 million euros. The largest claims resulted from serious train accidents in Estonia. In one of them a whole railcar had to be written off and the settlement is the maximum amount under motor TPL insurance, which is one million euros. Besides, we incurred large property insurance claims connected with goods damaged in transport, numerous motor TPL claims and personal injury claims covered by motor insurance. In the summer there were large insured loss events related to sea yachts and in the winter extensive fires in dwellings.
According to the forecast for 2015, the insurance market will sustain modest growth at a rate that corresponds to the anticipated economic growth. The market will adjust the prices of motor TPL insurance that is currently causing losses for almost all insurers.
In Estonia, the new Motor Insurance Act that took effect in 2014 allows the injured parties of traffic accidents to choose whether to submit a claim to their own insurer or the insurer of the party that caused the accident. Implementation of the new act should also help improve the quality of the motor vehicle register.
Sales and service offeringIn 2014 ERGO adopted several measures to improve the efficiency of its sales organisation, increase sales and lower its operating expenses.
The pillars of ERGO’s new strategy are customer focus, a strong price-quality ratio and innovative services. ERGO’s goal is to be an insurer with the highest customer satisfaction rating that cares about its
customers and offers better service than any other insurance company. According to a continuous customer satisfaction survey (NPS), in 2014 we achieved this goal in Estonia.
In Latvia, we continue to maintain and develop our service quality by using the mystery shopping technique, which reflects adequately the current customer experience and helps identify the targets that need to be met.
In 2014, we reviewed and restructured our customer portfolio with a view to providing services that better meet the interests of our focus group customers. The insurance department launched several product developments aimed at improving its competitiveness and customer satisfaction.
In the Estonian unit, the main focus was on the implementation of the new Motor Insurance Act, which involved allocation of major IT resources for adjusting the sales platform and training the sales staff for offering the best customer service. At the year-end, we made preparations for implementing a regulatory amendment scheduled to take effect in 2015 that allows the injured parties of traffic accidents to submit their claims also via their own insurance provider.
ERGO wishes to offer its customers the best solutions and meet customer needs through swift, fair and thorough claims handling. ERGO ensures the quality of its claims handling by systemic control, which allows obtaining quick customer and partner feedback on ERGO’s claims handling.
In Latvia, we will continue with the organic growth strategy, focusing equally on underwriting and claims handling. We will continue implementing the phone service: from 2014 claims can also be reported by phone. We evaluate our sales results using performance indicators that measure the performance of each unit. In 2014 we adopted a new remuneration system for the sales staff.
The German management systems certification body has certified ERGO Insurance Group’s claims handling as compliant with (DGS) DIN EN ISO 9001. The same practice is applied by ERGO Insurance SE.
ServicesERGO is committed to offering quality insurance services. The main indicators of quality are the scope of insurance cover and active and professional sales and claims handling services.
In 2014, our e-channel was thoroughly developed and we began preparations for creating a more convenient and informative website with a more modern look. As customers are moving from physical offices to e-offices they must also be able to obtain advice from the website. Accordingly, customer information should be
ERGO INSURANCE SE ANNUAL REPORT 2014
10
presented as clearly and coherently as possible so that customers could make informed insurance purchase decisions.
In 2014, we stopped offering crop insurance as there had been no demand for it for several years.
Sustainable pricing policyTo offer service at the market’s best price-quality ratio, ERGO sets its rates based on rigorous risk assessment and claims statistics. A pricing policy that is underpinned by thorough claims analysis and stringent risk assessment helps ensure sustainable claims settlement, which is also relevant in a stabilised insurance market, where premium income is still modest and the structure of claims may fluctuate from time to time due to numerous seasonal claims.
ERGO offers a 15% discount on home insurance and a 10% discount on travel insurance purchased via the e-channel. The discounts are available in the e-channel only. The purpose is to encourage the customers to use the e-channel.
In 2014, a new motor TPL insurance pricing scheme was adopted in Latvia which allows to assess risks and new segments considerably more accurately and thus to increase relevant business. The process of purchasing motor own damage insurance was made shorter and easier for the customer.
The Lithuanian market has become more price sensitive. Brokerage channels make it easy to compare competing prices and often customers choose the insurer on the basis of price only. To be more competitive, ERGO’s Lithuanian team set up a separate pricing and reinsurance unit. ERGO analyses price differences to determine the customers’ risk levels and purchasing behaviour.
PartnersIn autumn 2014, ERGO and DNB Pank partnered up and began offering in the Estonian market a unique service by which people that lease cars can insure themselves against settlement difficulties resulting from unemployment or incapacity for work. When customers unexpectedly lose their job or capacity for work, ERGO will cover their lease payments for up to a year. In order to be eligible for insurance benefits, the customer must have been unwillingly out of work or without capacity for work following an accident for at least one month. If the lessee dies as a result of an accident, ERGO will cover the entire remaining lease liability which means that the lessee’s family will be able to keep the vehicle.
In 2014, ERGO offered travel insurance in cooperation with over 40 travel agencies. In addition, ERGO works with over 20 insurance brokers across Estonia in order to offer the most suitable insurance cover to people’s property.
Organisational development and efficiencyIn 2014, ERGO Insurance Group sold its pension funds in Estonia and Lithuania in order to focus on its core business, which is non-life, life and health insurance. In Estonia, the pension funds were sold to Nordea, which has delivered strong performance in fund management. In Lithuania, the new owner of the funds is DNB Pank.
By the end of 2014, ERGO Insurance SE finalised its new Baltic management strategy and action plan, which rests on three pillars: customer focus, a strong price-quality ratio and service innovation. The highest priority is given to customer focus. For better implementation of the new strategy, we also adjusted the management model by shifting the focus from regional to local management, particularly in sales. In connection with this, the areas of responsibility of members of the management board changed and one board member, Maarika Liivamägi, ERGO’s team leader in Estonia, decided to step down. Her position as team leader in Estonia was taken over by ERGO’s former chief actuary Tarmo Koll who has been working for ERGO for 20 years. Deniss Sazonovs has been CFO since the end of 2014. The team leader of ERGO in Latvia is Ingrida Kirse and the team leader of ERGO in Lithuania is Saulius Jokubaitis. The chairman of the management board of ERGO in the Baltic countries is Kęstutis Bagdonavičius.
We continued creating pan-Baltic synergies by combining the support services. In autumn 2014, a new uniform Baltic management model was adopted in the accounting function that is led by Jelena Panfilova, the former chief accountant of ERGO in Estonia. We are also planning to streamline our other support functions.
MarketingDuring the year, we conducted various campaigns to draw people’s attention to the need to make sure that their close ones would be able to keep what can be acquired for money, should they themselves suffer an accident.
ERGO is the only insurer in Estonia that offers travel insurance whereby the plane ticket and accommo-dation costs of a customer that has suffered trip interruption are settled immediately.
In 2014, regular study of the Recommendation Index reflected that ERGO’s customers continue to give ERGO a higher Recommendation Index than they do to ERGO’s competitors.
In Latvia, ERGO launched home insurance campaign Start to offer convenient and favourably priced home insurance to owners of less expensive suburban real estate. The goal was to interest the customer segment in insuring their homes because people are most vulnerable when something happens to their uninsured home.
ERGO INSURANCE SE ANNUAL REPORT 2014 ERGO INSURANCE SE ANNUAL REPORT 2014
1110
In the second half-year, ERGO’s Latvian team carried out a liability insurance campaign aimed at families with children. Life has shown that people with children are more likely to incur expenses from damage caused to others and it would be reasonable to acquire relevant insurance cover.
Sponsoring and social responsibilityERGO values the principles of corporate social respon-sibility. Therefore, at the beginning of 2014 ERGO became a member of the Responsible Business Forum in Estonia.
ERGO has a long-standing role in supporting social projects in the Baltic countries.
ERGO supports Estonia’s participation in the Olympic Games through long-standing cooperation with the Estonian Olympic Committee. We insure athletes’ trips to competitions and their vehicles.
ERGO also appreciates people’s desire and opportunities to invest in health and supports various grassroots sport events. In September 2014, the events culminated with Tallinn marathon where over a thousand runners took advantage of the opportunity to sign a favourably priced accident insurance contract.
In April, the 15th ERGO Jazz Session brought to Estonia The Hi-Fly Orchestra from Germany, which plays lively jazz dance music. ERGO Jazz Session is a series of concerts organized by ERGO and Jazzkaar since 2008 that features artists who either come from or represent Germany.
In August, ERGO’s Estonian team and the Police and Border Guard Board distributed over 4,000 free reflective vests to increase safety awareness, particularly outside big cities.
For the second consecutive year, ERGO decided not to purchase Christmas gifts but to donate 4,000 euros to a children’s and young people’s crisis programme that helps children that have lost their close ones cope with the situation.
Since 2013, ERGO has been a partner of Vilnius Interna-tional Film Festival ‘Kino Pavasaris’ (Cinema Spring). Last year, this influential Eastern European festival attracted over 100,000 viewers and the programme featured around 250 films from 67 countries.
ERGO also supported Lithuania’s largest cycling event Velomarathon 2014. Last year the event, which is held in Vilnius was attended by over 12,000 amateur cyclists.
ERGO was one of the major sponsors and the official insurance partner of the events of Riga the 2014 European Capital of Culture. In addition, ERGO supports a beach volleyball championship series that is gaining popularity in Latvia.
For years, ERGO has been arranging traffic safety campaigns in Latvia which promote responsible driving and raise pedestrians’ safety awareness. Before the Midsummer Eve, which is the most popular holiday in Latvia, we carried out a safety campaign aimed at noticing, and notifying the authorities, about drunk drivers.
Future developmentAt the end of 2014, ERGO’s management board adopted a new strategy that is going to be implemented in 2015. The strategy, which is underpinned by three pillars: customer focus, innovation and the best price-quality ratio, foresees offering easily comprehensible services so that the company would be equally recognised for its sales & contract renewal and claims handling. To achieve the goal, we will first have to streamline our internal processes and then focus on cross-sales. All these measures should also help increase ERGO’s market share.
During the year, the Lithuanian team made preparations for the adoption of the euro.
One of the targets for 2015 is to complete the implementation of our new sales strategy for which we right-sized the retail network and created three sales channels. We are planning to implement CRM and review the remuneration and incentives of our sales staff. To be competitive, we need a more customer-focused approach.
Organisation and management
At the end of 2014, ERGO Insurance SE had 1,117 employees: 629 in Lithuania, 184 in Latvia and 304 in Estonia. Compared with the previous year-end, headcount decreased in all three countries. Since the Estonian team was able to automate sales accounting and implementation of a uniform Baltic accounting structure created synergies, the largest personnel decrease occurred in the accounting function.
On 19 March 2014, the supervisory board of ERGO Versicherungsgruppe AG extended the contract of Torsten Oletzky, chairman of the board of management, for another five years. The contracts of the management board members of ERGO Insurance SE and ERGO Life Insurance SE were also extended. On 1 April 2014, the contract of Maarika Liivamägi, an Estonian management board member, was renewed for another five years but at the end of November she resigned early due to changes in the company’s organi-sational structure.
ERGO INSURANCE SE ANNUAL REPORT 2014
12
The main structural changes have been as follows. On 1 March 2014, the administration and human resource (HR) departments merged into HR and administration department. On 1 May 2014, the claims handling department was supplemented with a customer service group that serves claims handling customers. On 18 October 2014, the structure of the accounting department changed. Responsibility for cost and payroll accounting was assigned to assistant chief accountant and most sales accounting positions were eliminated.
The Baltic management structure changed on 1 December 2014. The new local team leader and member of the management board Tarmo Koll took charge of the insurance, claims handling, sales, marketing and customer contract management departments which, along with the sales support and development department that was merged with the sales department, became locally managed departments.
On 28 October, the former sales director Annika Sööt resigned and the former partner relations director Hiljar Kõiv was appointed acting sales director.
The roles and responsibilities of the members of the management board are as follows. • Chairman of the management board Kęstutis
Bagdonavičius is responsible for the following pan-Baltic departments: communication, corporate strategy, HR and administration, legal and compliance control, regional development, internal audit, business management and innovation.
• Member of the management board and chief financial officer Deniss Sazonovs is responsible for financial management and the following departments: accounting, planning and controlling, actuaries, risk management and IT.
• Member of the management board and ERGO’s team leader in Latvia Ingrida Kirse is responsible for life, health and pension insurance in the Baltics as well as property insurance, claims handling, sales and marketing in Latvia.
• Member of the management board and ERGO’s team leader in Lithuania Saulius Jokubaitis is responsible for reinsurance and pricing in the Baltics and property insurance, claims handling, sales and marketing in Lithuania.
• Member of the management board and ERGO’s team leader in Estonia Tarmo Koll is responsible for bank insurance in the Baltics and property insurance, claims handling, sales and marketing and customer contract management in Estonia.

ERGO INSURANCE SE ANNUAL REPORT 2014 ERGO INSURANCE SE ANNUAL REPORT 2014
1312
Key financial indicators
In thousands of euros, except for ratiosAs at 31 December or for the year 2014 2013
For the yearGross premiums written 107 953 108 186Gross earned premiums 104 588 109 287Gross claims and benefits incurred 63 512 76 831Gross expenses 37 699 38 985Gross loss ratio 60,7% 70,3%Net loss ratio 61,8% 67,2%Gross expense ratio 36,0% 35,7%Net expense ratio 37,3% 37,0%Gross combined ratio 96,8% 106,0%Net combined ratio 99,2% 104,1%Claims handling ratio 9,9% 10,4%Claims paid ratio 55,7% 61,6%At the year-endTotal assets 157 337 159 694Ratio of investments to total assets 63,4% 57,7%Ratio of equity to total assets 28,9% 31,7%Ratio of insurance provisions to total assets 63,4% 60,6%Profitability indicatorsInsurance result (technical result) 907 −4 070Investment result 2 600 1 747Loss for the financial year −5 106 −1 379ROE −10,6% −2,7%ROA −3,2% −0,9%ROI 2,7% 1,9%
Explanation of figures and ratios
Gross earned premiums gross premiums written + change in provision for unearned premiumsGross claims and benefits incurred
claims and benefits incurred + change in provision for claims outstanding + change in provision for unexpired risks
Gross loss ratio gross claims and benefits incurred / gross earned premiums Net loss ratio net claims and benefits incurred / net earned premiums
Gross expense ratio (acquisition costs + administrative expenses + membership fee to Motor Insurance Fund) / gross earned premiums
Net expense ratio (acquisition costs + administrative expenses – reinsurance commission income + membership fee to Motor Insurance Fund) / net earned premiums
Gross combined ratio gross loss ratio + gross expense ratioNet combined ratio net loss ratio + net expense ratioClaims handling ratio claims handling costs / claims and benefits incurredClaims paid ratio claims paid / gross premiums writtenGross expenses acquisition costs + administrative expenses + membership fee to Motor Insurance FundInsurance result (technical result)
net earned premiums + reinsurance commissions − net claims and benefits incurred – gross expenses
Investment result investment income and expenses + change in the fair value reserve in equityReturn on equity (ROE) profit / period’s average equity Return on assets (ROA) profit / period’s average assets Return on investments (ROI) investment result / period’s average investments
Conclusion
The management board of ERGO Insurance SE reports that in 2014 the company developed in line with the insurance market and achieved its main business goals and targets. .
Kęstutis BagdonavičiusChairman of the management board
ERGO INSURANCE SE ANNUAL REPORT 2014
14
Financial statements
Income statement
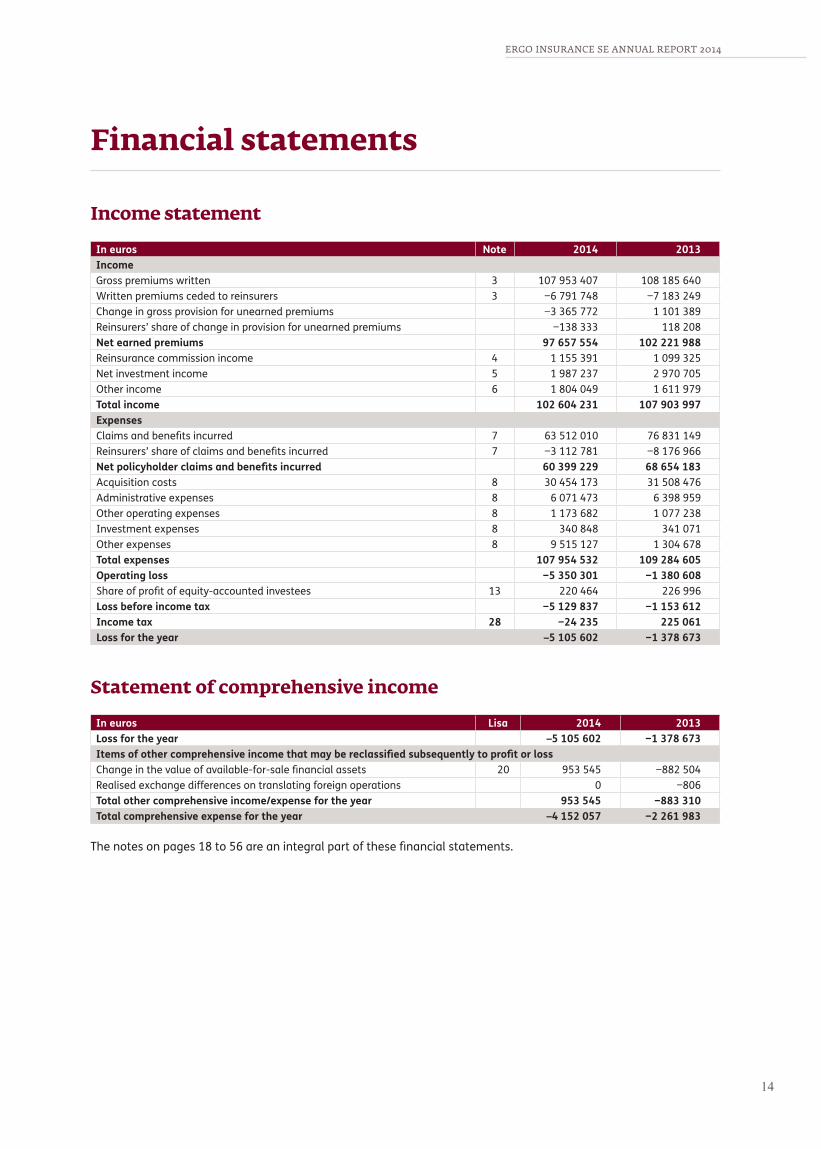
In euros Note 2014 2013IncomeGross premiums written 3 107 953 407 108 185 640Written premiums ceded to reinsurers 3 −6 791 748 −7 183 249Change in gross provision for unearned premiums −3 365 772 1 101 389Reinsurers’ share of change in provision for unearned premiums −138 333 118 208Net earned premiums 97 657 554 102 221 988Reinsurance commission income 4 1 155 391 1 099 325Net investment income 5 1 987 237 2 970 705Other income 6 1 804 049 1 611 979Total income 102 604 231 107 903 997Expenses Claims and benefits incurred 7 63 512 010 76 831 149Reinsurers’ share of claims and benefits incurred 7 −3 112 781 −8 176 966Net policyholder claims and benefits incurred 60 399 229 68 654 183Acquisition costs 8 30 454 173 31 508 476Administrative expenses 8 6 071 473 6 398 959Other operating expenses 8 1 173 682 1 077 238Investment expenses 8 340 848 341 071Other expenses 8 9 515 127 1 304 678Total expenses 107 954 532 109 284 605Operating loss −5 350 301 −1 380 608Share of profit of equity-accounted investees 13 220 464 226 996Loss before income tax −5 129 837 −1 153 612Income tax 28 −24 235 225 061Loss for the year –5 105 602 −1 378 673
Statement of comprehensive income
In euros Lisa 2014 2013Loss for the year –5 105 602 −1 378 673Items of other comprehensive income that may be reclassified subsequently to profit or loss Change in the value of available-for-sale financial assets 20 953 545 −882 504Realised exchange differences on translating foreign operations 0 −806Total other comprehensive income/expense for the year 953 545 −883 310Total comprehensive expense for the year –4 152 057 −2 261 983
The notes on pages 18 to 56 are an integral part of these financial statements.
ERGO INSURANCE SE ANNUAL REPORT 2014 ERGO INSURANCE SE ANNUAL REPORT 2014
1514
Statement of financial positionAssetsIn euros Note 31.12.2014 31.12.2013Property and equipment 10 9 880 738 10 293 232Intangible assets
Deferred acquisition costs 11 3 739 080 3 595 706Other intangible assets 12 6 397 924 14 310 594
Investments in associates 13 3 300 580 2 642 653Investments in financial instruments
Equities and fund units 14 16 382 770 15 289 607Debt securities 14 78 184 180 72 138 559Loans 14 1 908 397 2 011 203
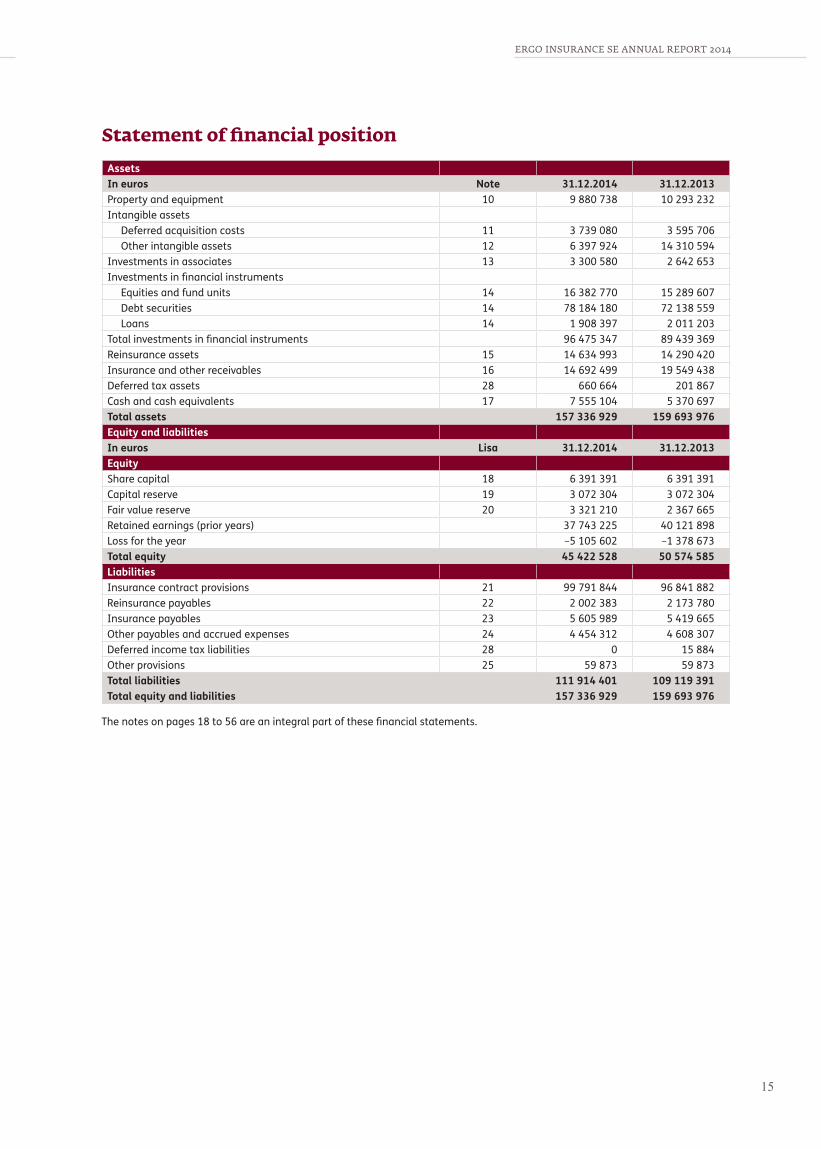
Total investments in financial instruments 96 475 347 89 439 369Reinsurance assets 15 14 634 993 14 290 420Insurance and other receivables 16 14 692 499 19 549 438Deferred tax assets 28 660 664 201 867Cash and cash equivalents 17 7 555 104 5 370 697Total assets 157 336 929 159 693 976Equity and liabilities In euros Lisa 31.12.2014 31.12.2013Equity Share capital 18 6 391 391 6 391 391Capital reserve 19 3 072 304 3 072 304Fair value reserve 20 3 321 210 2 367 665Retained earnings (prior years) 37 743 225 40 121 898Loss for the year –5 105 602 –1 378 673Total equity 45 422 528 50 574 585Liabilities Insurance contract provisions 21 99 791 844 96 841 882Reinsurance payables 22 2 002 383 2 173 780Insurance payables 23 5 605 989 5 419 665Other payables and accrued expenses 24 4 454 312 4 608 307Deferred income tax liabilities 28 0 15 884Other provisions 25 59 873 59 873Total liabilities 111 914 401 109 119 391Total equity and liabilities 157 336 929 159 693 976
The notes on pages 18 to 56 are an integral part of these financial statements.

ERGO INSURANCE SE ANNUAL REPORT 2014
16
Statement of cash flowsIn euros
(Inflow + , outflow –) Note 2014 2013Net cash from/used in operating activities Note 3 769 715 −4 744 611Insurance premiums received 108 781 480 101 194 265Claims, benefits and handling costs paid −57 815 492 −58 566 914Settlements with reinsurers –2 897 129 −2 091 482Paid in operating expenses −43 170 375 −40 367 996Other income and expenses 3 140 303 −3 408 465Acquisition of equities and fund units –2 686 805 −6 878 772Disposal of equities and fund units 2 262 742 3 148 468Acquisition of debt and other fixed income securities –18 596 242 −46 166 814Disposal of debt and other fixed income securities 12 152 217 45 134 462Interest received 2 379 421 3 548 311Dividends received 142 394 107 061Corporate income tax paid –2 381 −305 484Paid in investment expenses 79 582 −91 251Net cash used in investing activities –1 585 308 −2 259 214Acquisition of an associate –437 464 0Loans to group companies 0 −1 300 000Repayment of loans to group companies 100 000 0Interest received from group companies 169 690 35 836Disposal of an associate 0 297 657Dividends paid –1 000 000 −650 000Acquisition of property and equipment and intangible assets –432 067 −1 291 919Proceeds from sale of property and equipment and intangible assets 14 533 649 212Net cash used in financing activities 0 −18 322Payment of finance lease principal 0 −18 224Interest paid 0 −98Net cash inflow/outflow 2 184 407 −7 022 147Cash and cash equivalents at beginning of year 5 370 697 12 392 844Increase/decrease in cash and cash equivalents 2 184 407 −7 022 147Cash and cash equivalents at end of year 17 7 555 104 5 370 697
The notes on pages 18 to 56 are an integral part of these financial statements.

ERGO INSURANCE SE ANNUAL REPORT 2014 ERGO INSURANCE SE ANNUAL REPORT 2014
1716
Statement of changes in equity
In euros Sharecapital
Capitalreserve
Translationreserve
Fairvalue
reserve
Retainedearnings
Totalequity
Balance at 31 December 2012
6 391 391 3 072 304 806 3 250 169 40 771 898 53 486 568
Dividend distribution 0 0 0 0 −650 000 −650 000Total transactions with owners
0 0 0 0 −650 000 −650 000
Loss for the year 0 0 0 0 −1 378 673 −1 378 673Other comprehensive expense 0 0 −806 −882 504 0 −883 310Total comprehensive expense for the year
0 0 −806 −882 504 −1 378 673 −2 261 983
Balance at 31 December 2013
6 391 391 3 072 304 0 2 367 665 38 743 225 50 574 585
Dividend distribution 0 0 0 0 –1 000 000 –1 000 000Total transactions with owners
0 0 0 0 –1 000 000 –1 000 000
Loss for the year 0 0 0 0 –5 105 602 –5 105 602Other comprehensive income 0 0 0 953 545 0 953 545Total comprehensive expense for the year
0 0 0 953 545 –5 105 602 –4 152 057
Balance at 31 December 2014
6 391 391 3 072 304 0 3 321 210 32 637 623 45 422 528
The notes on pages 18 to 56 are an integral part of these financial statements.
ERGO INSURANCE SE ANNUAL REPORT 2014
18
Notes to the financial statements
Note 1. Significant accounting policies
ERGO Insurance SE is a non-life insurance company incorporated and domiciled in Estonia. The company’s legal address is A. H. Tammsaare tee 47, 11316 Tallinn. The company’s core activities are motor own damage insurance, motor third party liability (motor TPL) insurance and individuals’ and legal persons’ property insurance
The financial statements of ERGO Insurance SE for 2014 include the financial statements of ERGO Insurance SE’s head office in Estonia and the financial statements of its Latvian and Lithuanian branches.
These financial statements were authorised for issue by the management board on 17 March 2015. Under the Estonian Commercial Code, final approval of the annual report including the financial statements that has been prepared by the management board and approved by the supervisory board rests with the general meeting. Shareholders may decide not to approve the annual report and may demand preparation of a new annual report.
(a) Statement of compliance
The financial statements of ERGO Insurance SE have been prepared in accordance with the International Financial Reporting Standards issued by the Interna-tional Accounting Standards Board (IASB) and their interpretations as adopted by the European Union (IFRS EU) to be effective for the year 2014.
(b) Basis of preparation
These financial statements are presented in euros. The head office and the branches prepare their financial statements in the currency of the primary economic environment in which they operate (see accounting policy (c)).
The financial statements are prepared on the historical cost basis except that the following assets and liabilities are measured at their fair values:
• financial assets at fair value through profit or loss;• available-for sale financial assets.
Non-current assets held for sale are measured at the lower of their carrying amount and fair value less costs to sell.
Use of significant estimates and judgements
The preparation of financial statements in conformity with IFRSs as adopted by the EU requires management to make judgements, estimates and assumptions that affect the application of policies and the reported amounts of assets and liabilities and income and expenses.
The estimates and associated assumptions are based on historical experience and various other factors that are believed to be reasonable under the circumstances, the results of which form the basis of making judgements about the carrying amounts of assets and liabilities that are not readily apparent from other sources. Although the estimates are based on management’s best judgement and facts, actual results may differ from those estimates.
The estimates and underlying assumptions are reviewed on an ongoing basis. Revisions to accounting estimates are recognised in the year in which the estimate is revised if the revision affects only that year, or in the year of the revision and future years, if the revision affects both the year of revision and future years.
The most significant estimates in the financial statements are related to insurance provisions. The company employs a responsible actuary. Estimation and recognition of insurance provisions and deferred acquisition costs are described in this note, in policies (f) and (l) (i) respectively.
Estimates are also applied on determining the fair value of financial assets (see accounting policies (l) and (m)).
Information about the main estimation criteria that affect the amounts recognised in the financial statements is presented in the following notes:
• Note 12 Other intangible assets• Note 14 Investments in financial instruments • Note 15 Reinsurance assets• Note 21 Insurance contract provisions• Note 25 Other provisions.
The risks and estimation uncertainties related to insurance contracts and financial instruments are described in note 2.
ERGO INSURANCE SE ANNUAL REPORT 2014 ERGO INSURANCE SE ANNUAL REPORT 2014
1918
(c) Branches
A branch is an economic entity established for offering services on behalf of a company. A branch is not an independent legal person. The company is liable for the obligations arising from the activities of a branch. The accounts of foreign branches are maintained separately. Branches prepare their financial statements for the same periods and using the same accounting policies. Any balances, income and expenses and gains and losses arising from intra-company transactions are eliminated in full.
Translation of the financial statements of foreign operations
The financial statements of the head office and the branches are prepared in the currency of the primary economic environment in which they operate (the functional currency). The company’s presentation currency is the euro. Accordingly, the assets and liabilities of foreign operations, including fair value adjustments, are translated to euros at the foreign exchange rates ruling at the reporting date.
The income and expenses of foreign operations are translated to euros using the exchange rates at the dates of the transactions. At 31 December 2014, the exchange rate of the Lithuanian litas against the euro was 3.4528 Lithuanian litas.
(d) Associates
Associates are entities over which the company has significant influence but not control. Significant influence is presumed to exist when the company holds directly or indirectly through subsidiaries 20-50% of an entity’s voting power.
Investments in associates are accounted for using the equity method. Upon initial recognition, investments in associates are measured at cost. The cost of an investment includes directly attributable transaction charges. The financial statements include the company’s share of an associate’s profit or loss from the date the significant influence commences to the date the significant influence ceases to exist.
(e) Classification of insurance contracts
Non-life insurance
Contracts under which the company accepts significant insurance risk from another party (the policyholder) by agreeing to compensate the policyholder or other beneficiary if a specified uncertain future event (the insured event) adversely affects the policyholder or other beneficiary are classified as insurance contracts.
All contracts issued by the company constitute insurance contracts. The company does not issue investment contracts.
Non-life insurance contracts have generally a term of one year. Exceptions include open-ended motor TPL insurance contracts under which policies are issued for a maximum term of one year, and travel insurance contracts covering one trip whose term is generally less than one year.
Incoming reinsurance
Reinsurance contracts are contracts under which the reinsurer undertakes to assume the insurance risks of another insurer (the ceding insurer) and to pay that ceding insurer compensation of an agreed amount for losses incurred in connection with an insured event specified in an insurance contract entered into between the ceding insurer and a policyholder. Reinsurance contracts are entered into for a period of one year. Reinsurance contracts fall into two main categories – obligatory non-proportional and obligatory propor-tional.
Risks that exceed the limits of obligatory reinsurance contracts or fall outside their scope are reinsured under facultative reinsurance contracts. Facultative reinsurance contracts are entered into for covering a particular (single) risk. In its activities as a reinsurer, the company’s main objective is to use its capital optimally and to disperse the risks by diversifying the locations of the insured property. Reinsurance contracts are entered into with the insurance companies of ERGO group only.
(f) Recognition and measurement of insurance contracts
Insurance premiums
Premium incomeAt the Estonian entity, the first instalment of a premium payment is recognised at the date of inception of the insurance contract. The following instalment payments are recognised at the earlier of their due date and settlement date. Accordingly, premium income includes both income from contracts concluded in the current financial year and the previous financial year.
At the Latvian and Lithuanian entities, all premiums receivable (the entire premium income) under a contract are recognised immediately regardless of whether the instalment payments relate to the reporting period in part or in full.
Premiums are recognised as income in their gross amount without deducting brokerage fees. Premiums are considered earned when the insurance cover expires. Premiums earned are recognised on a daily basis.
ERGO INSURANCE SE ANNUAL REPORT 2014
20
Provision for unearned premiumsThe unearned premiums provision is established for covering the costs of insured events of active contracts that occur after the reporting date and for related contract management expenses. The unearned premiums provision is calculated in all lines of business under the 365-day pro rata temporis method. Calcu-lations are made separately for each individual contract. The provision for a contract makes up the same percentage of gross premiums written under the contract as the post-reporting date term of the contract makes up of the entire term of the contract. In the case of motor TPL insurance, gross premiums written are first reduced by the portion that has to be transferred to the Motor Insurance Fund.
The reinsurers’ share of the unearned premiums provision is calculated only for those contracts that fall in the scope of a proportional reinsurance contract. Reinsurers’ share of the provision for unearned premiums makes up the same percentage of the provision for unearned premiums for contracts with proportionate reinsurance cover as ceded reinsurance premiums make up of relevant gross premiums written.
Claims and provisions for claims outstanding and unexpired risks
Claims and benefits incurred Claims and benefits incurred from insurance activities consist of claims paid in the financial year, associated claims handling costs and changes in the provision for claims outstanding. Claims paid include claims that have been settled and their handling costs, less salvage and subrogation recoveries.
Subrogation revenue is recognised upon its collection or when it is probable that subrogation revenue will flow to the company. Revenue from salvage recoveries is recognised on the transfer of the asset. The amount recognised as revenue from a salvage recovery is a conservative estimate of probable sales revenue less the costs incurred in connection with the transaction.
Provision for claims outstanding The provision for claims outstanding is established for covering the claims incurred but not settled by the reporting date and corresponding claims handling costs. The provision for claims outstanding includes the provision for claims incurred but not yet reported.
The provision for claims outstanding comprises of the following components:
• claims reported but not completely handled and settled (RBNS);
• claims incurred but not reported (IBNR);• indirect claims handling costs.
Claims handling experts estimate the outstanding amount of incurred and reported claims separately for
each case, taking into account all available information at the date of estimation and estimates of future changes in the claim. A provision for an outstanding claim is recognised immediately when a claim has been reported, the claim file has been opened and preliminary calculations of the loss have been made. Settlements made are deducted and when the last settlement has been made and the file has been closed, the provision is reduced to zero.
Future direct claims handling costs, including the costs of expert opinions and legal assistance, related claims, etc. are also estimated case-by-case.
If an incurred claim is settled in periodic disbursements, a pension annuity provision is established in the provision for claims outstanding.
In calculating the provision for claims outstanding, discounting is applied only to pensions arising from the Motor Insurance Act. The applied effective interest rate is 0.75%. In other cases, discounting is not applied.
The IBNR component is estimated using various statistical methods. For each year of loss incurrence, the ultimate loss is estimated. The ultimate loss estimate is reduced by claims paid and individual case-based provisions established as at the reporting date. The difference is the basis for determining IBNR. The IBNR component is estimated taking into account the effect of inflation on prior period losses and using estimates of future inflation rates.
For covering the costs of future indirect claims handling costs of claims incurred, a provision for indirect claims handling costs is established within the provision for claims outstanding.
Reinsurers’ share of the case-based provision for claims outstanding is calculated according to reinsurance contracts precisely. Reinsurers’ share of the estimated portions of the claims outstanding provision is determined for only those classes and underwriting years that fall within the scope of an effective propor-tional reinsurance contract. In the latter case it is assumed that the corresponding part of the provision is split between the reinsurer and the ceding insurer in the same way as the whole liability of the line of business in the underwriting year in question.
Provision for unexpired risks The provision for unexpired risks is established when estimates indicate that the provision for unearned premiums is not sufficient for covering the claims incurred after the reporting date in respect of insurance contracts that took effect before the reporting date and corresponding contract management expenses.
Outgoing reinsurance
The company cedes reinsurance in the normal course of business for the purpose of limiting its net loss potential
ERGO INSURANCE SE ANNUAL REPORT 2014 ERGO INSURANCE SE ANNUAL REPORT 2014
2120
by diversifying its risks. Reinsurance arrangements do not relieve the company from its direct obligations to its policyholders.
Premiums ceded and benefits reimbursed are presented in the income statement and statement of financial position on a gross basis. Reinsurance assets comprise of debit balances due from reinsurers for ceded insurance liabilities. Amounts recoverable from reinsurers are measured on the basis of the provision for claims outstanding or the settled claims of policies falling within the scope of a reinsurance contract.
Reinsurance contracts are concluded for a term of one year. The main forms of contract are the obligatory non-proportional and the obligatory proportional reinsurance contract. Risks exceeding the limits of obligatory reinsurance contracts or falling outside their scope are reinsured on a facultative basis. All reinsurance contracts are used to transfer a significant portion of insurance risk. The company does not use financial reinsurance. The deferral calculations of prepaid reinsurance commissions are performed separately for each class of business. The basis for the calculations is relevant data (reinsurance premiums and commissions) for the past six months.
Prepaid reinsurance commissions make up the same proportion of reinsurance commissions as the reinsurers’ share of the unearned premium provision makes up of total reinsurance premiums.
Indemnities receivable under reinsurance contracts are assessed for impairment at reach reporting date. Relevant assets are impaired if, as a result of an event that occurred after their initial recognition, there is objective evidence indicating that the company may not be able to recover all amounts that are due and that the event has had a reliably measurable impact on the amounts the company can recover from the reinsurer.
Liability adequacy test
The insurance portfolio is assessed with the liability adequacy test by estimating the future cash flows under the insurance contracts and comparing those against the carrying amounts of liabilities after the deduction of deferred acquisition costs. Liability adequacy is assessed separately for liabilities related to unexpired risks (insurance contracts in force) and liabilities related to expired risks (claims incurred but not yet settled). Liability adequacy is tested considering all cash flows from insurance activities including estimated future claims, claims handling costs and fixed costs.
The liabilities arising from unexpired risks and cash outflows from future claims are estimated by forecasting the amount of claims outstanding for each
year of loss incurrence using various mathematical methods. The results are used to find the expected loss ratio, which is used to estimate future cash flows. Expected cash outflows from claims handling activities are estimated by determining the proportion of actual claims handling costs in the amount of claims paid in the previous calendar year and by applying the ratio to the estimated amount of future claims.
Future cash outflows that are necessary for the company’s operation are estimated on the basis of the fixed cost ratio for the past calendar year.
Cash inflows comprise estimated future investment income.
Where the liability adequacy test shows a deficiency in the carrying amount of insurance liabilities, first the deferred acquisition costs are reduced. If this does not suffice, an additional unexpired risks provision is recognised. The liability adequacy test is applied to the gross amounts of provisions, i.e. the effect of reinsurance is not taken into account.
(g) Other income
Rental income from investment property is recognised on a straight-line basis over each lease term. Other payments associated with the lease are recognised in the income statement as an integral part of rental income.
(h) Operating lease expenses
Operating lease payments are recognised as an expense on a straight-line basis over the lease term. Other payments associated with the lease are recognised in the income statement as an integral part of lease expense.
(i) Income tax
Under the Income Tax Act, in Estonia corporate income tax is not levied on profits earned but on dividends distributed. The income tax payable on dividends is recognised as the income tax expense of the period in which the dividends are declared irrespective of the period for which the dividends are declared or the period in which they are ultimately distributed.
In 2013 the tax payable on dividends was calculated as 21/79 of the amount distributed as the net dividend. In 2014 the tax rate was the same. Because of the specific nature of the taxation concept, the term tax base of assets and liabilities does not have economic substance and deferred income tax liabilities and assets do not arise.
The maximum income tax liability that could arise on a dividend distribution is disclosed in note 28.
ERGO INSURANCE SE ANNUAL REPORT 2014
22
In Latvia and Lithuania corporate profit is subject to income tax. Before taxation, profit is adjusted for permanent and temporary differences as permitted by local tax laws. In the reporting period, the corporate income tax rate in Latvia and Lithuania was 15% (the same as in the previous year).
At foreign entities, deferred tax is recognised using the liability method whereby the deferred tax assets and liabilities arising from temporary differences between the carrying amounts and tax bases of assets and liabilities are recognised in the statement of financial position. Deferred tax liabilities are reported in the statement of financial position.
(j) Foreign currency transactions
Transactions in foreign currencies are recorded by applying the exchange rates of the European Central Bank at the dates of the transactions. Assets and liabilities denominated in a foreign currency at the reporting date are retranslated using the exchange rates of the European Central Bank ruling at that date. Exchange gains and losses are recognised in the income statement in the period in which they arise.
(k) Property and equipment
(i) Owned assets
Items of property and equipment are carried at cost or deemed cost less accumulated depreciation (see below) and impairment losses (see accounting policy (r)). Property that is being constructed or developed for future use as investment property is classified as property and equipment and measured using the cost model until construction or development is complete, at which time it is reclassified to investment property.
Where major identifiable parts of an item of property and equipment have different useful lives, they are accounted for separately.
Assets are recognised as property and equipment if their useful life extends beyond one year.
(ii) Leased assets
Leases that transfer substantially all the risks and rewards incidental to ownership of an asset to the company are classified as finance leases. An asset acquired with a finance lease is carried in the statement of financial position at an amount equal to its fair value or, if lower, the present value of the minimum lease payments, less any accumulated depreciation (see below) and any impairment losses (see accounting policy (r)).
Lease payments are accounted for as described in accounting policy (h). Property held under operating leases that would otherwise meet the definition of investment property may be classified as investment property on a property-by-property basis.
The company as lessorAssets subject to operating leases are presented in the statement of financial position according to the nature of the asset. Operating lease payments are recognised as income on a straight-line basis over the lease term.
The company as a lesseeFinance leases are recognised in the statement of financial position as assets and liabilities at amounts equal to the fair value of the leased property. Lease payments are apportioned between the finance charge and the reduction of the outstanding liability. The finance charge is recognised over the lease term.
Operating lease payments are expensed on a straight-line basis over the lease term.
(iii) Subsequent costs
The company recognises in the carrying amount of an item of property and equipment the cost of replacing part of such an item when that cost is incurred, if it is probable that future economic benefits embodied within the part will flow to the company and the cost of the part can be measured reliably. All other costs are recognised as an expense as incurred.
(iv) Depreciation
Depreciation is charged to the income statement on a straight-line basis over the estimated useful life of each part of an item of property and equipment. Land is not depreciated.
The estimated useful lives are as follows:
Computer equipment 3 years Cars, office and communications equipment 5 yearsFurniture 6-7 yearsSafes and reinforced cabinets 10 yearsBuildings 33 yearsBuilding rights (right of superficies) 50 years
Depreciation is charged on the difference between cost and residual value. If residual value cannot be estimated reliably or is insignificant, it is presumed to be equal to zero.

ERGO INSURANCE SE ANNUAL REPORT 2014 ERGO INSURANCE SE ANNUAL REPORT 2014
2322
(l) Intangible assets
(i) Deferred acquisition costs – insurance contracts
Deferred acquisition costs include all direct costs incurred in acquiring insurance contracts. Deferred acquisition costs represent the proportion of direct acquisition costs that corresponds to the proportion of gross premiums written that is unearned at the reporting date.
Deferred acquisition cost are direct costs such as agents’ fees, brokerage fees, relevant stationery and printed matter costs, the costs of making photos of insured assets and other costs directly attributable to the acquisition of insurance contracts.
The deferral calculations for acquisition costs are performed separately for each class of business. Deferred acquisition costs are recalculated at each reporting date.
(ii) Other intangible assets
Other acquired intangible assets are measured at cost less accumulated amortisation (see below) and impairment losses (see accounting policy (r)). Intangible assets comprise acquired software and licences that are amortised over their useful lives using the straight-line method. The average annual amortisation rate is 25%. As an exception, the useful life assigned to insurance software ALICE is 10 years. Intangible assets are amortised on the assumption that their residual value is zero. Internally generated goodwill and the costs attributable to the development of brands are recognised as an expense as incurred.
(m) Financial assets
Financial assets comprise investments in equity and debt instruments, trade and other receivables, cash and cash equivalents, loans provided and derivative financial instruments.
Financial assets are classified into four categories, depending on the purpose of acquisition:
• financial assets at fair value through profit or loss;• loans and receivables • held-to-maturity investments;• available-for-sale financial assets.
Financial assets at fair value through profit or loss are financial assets which on initial recognition are designated as at fair value through profit or loss.
Derivatives are classified as held for trading and are designated as at fair value through profit or loss unless they are designated and used as effective hedging instruments.
Held-to-maturity investments are non-derivative financial assets with fixed or determinable payments
and fixed maturities which the company intends and is able to hold to maturity.
Loans and receivables are non-derivative financial assets with fixed determinable payments that are not quoted in an active market.
Available-for-sale financial assets are non-derivative financial assets that are either designated to this category or are not classified to any of the other categories.
Purchases of financial assets are recognised at the settlement date. A financial asset is derecognised when contractual rights to receive cash flows from the asset expire, or where the asset, together with substan-tially all the risks and rewards of ownership, has been transferred.
Financial assets are initially measured at their fair value. After initial recognition, the company measures financial assets at fair value through profit or loss and available-for-sale financial assets at their fair value, without any deduction for the transaction costs it may incur on disposal. The fair value of a quoted financial asset is its quoted bid price at the reporting date. If the market for a financial asset is not active, the company determines fair value using valuation techniques. These include the use of recent arm’s length market transactions, references to another instrument that is substantially the same, discounted cash flow analysis and option pricing models. If the value of equity instruments cannot be measured reliably, they are measured at cost.
Held-to-maturity investments are measured at amortised cost less impairment losses using the effective interest method. Loans and receivables are measured at amortised cost using the effective interest rate method.
The effective interest rate is the rate that exactly discounts estimated future cash payments or receipts through the expected life of the financial instrument to the net carrying amount of the financial asset or liability. When calculating the effective interest rate, cash flows are estimated considering all contractual terms of the financial instrument excluding future credit losses. The calculation includes all fees paid or received between parties to the contract, direct transaction costs, and all other premiums or discounts.
Realised gains and losses and unrealised gains and losses arising from changes in the fair value of financial assets at fair value through profit or loss are recognised in the income statement in the period in which they arise. Unrealised gains and losses arising from changes in the fair value of available-for-sale financial assets are recognised directly in other comprehensive income or expense. When available-for-sale financial assets are sold or become impaired, the cumulative gains or losses
ERGO INSURANCE SE ANNUAL REPORT 2014
24
previously recognised in other comprehensive income or expense are recognised in the income statement. Where these investments are interest-bearing, the interest income calculated using the effective interest rate method is recognised in the income statement.
(n) Derivative financial instruments
The company uses derivative financial instruments to hedge the risk of fluctuations in the value of assets that arise from changes in foreign exchange rates, share prices and interest rates. When a derivate financial instrument is recognised initially, it is measured at its fair value.
After initial recognition, derivative financial instruments are re-measured to fair value at each subsequent reporting date. Derivatives with a positive fair value are classified as assets and derivatives with a negative fair value are classified as liabilities. A gain or loss arising from a change in the fair value of a derivative, except for a gain and loss arising from a derivative that is part of a hedging relationship that qualifies for hedge accounting, is recognised in profit or loss. The company does not have any derivatives that are part of hedging relationships which qualify for hedge accounting. A derivative is derecognised when it matures or is transferred or cancelled.
(o) Receivables
Receivables are measured at their amortised cost and presented in the statement of financial position net of any doubtful and irrecoverable items. Irrecoverable receivables are accounted for off the statement of financial position. Receivables are measured on an individual basis and expensed or deducted from corresponding income when they become doubtful or irrecoverable.
(p) Cash and cash equivalents
Cash and cash equivalents in the statement of financial position comprise cash on hand, demand deposits and overnight deposits. In the statement of cash flows, cash flows are presented using the direct method.
(r) Impairment of assets
(i) Financial assets
A financial asset is assessed at each reporting date to determine whether there is any objective evidence that it is impaired. A financial asset is considered to be impaired if objective evidence indicates that one or more events have had a negative effect on the estimated future cash flows of that asset.
An impairment loss in respect of a financial asset measured at amortised cost is calculated as the difference between its carrying amount and the present value of the estimated future cash flows discounted at the original effective interest rate. An impairment loss in respect of an available-for-sale financial asset is calculated by reference to its fair value.
Individually significant financial assets are tested for impairment on an individual basis. The remaining financial assets are assessed for impairment collec-tively in groups that share similar credit risk characte-ristics.
All impairment losses are recognised in the income statement. In the event of impairment, any cumulative loss in respect of an available-for-sale financial asset recognised previously in other comprehensive income or expense is transferred to the income statement.
When a previously recognised impairment loss decreases and the decrease can be objectively related to an event occurring after the loss was recognised, the impairment loss is reversed. For financial assets measured at amortised cost, the reversal is recognised in the income statement.
(ii) Non-financial assets
The carrying amounts of non-financial assets are reviewed at each reporting date to determine whether there is any indication of impairment. If any such indication exists, the asset’s recoverable amount is estimated. An impairment loss is recognised if the carrying amount of an asset or its cash-generating unit exceeds its estimated recoverable amount. Impairment losses are recognised in the income statement.
(s) Employee benefits
Termination benefits are payable when the company terminates an employee’s employment before the normal retirement date or when an employee decides to accept voluntary redundancy in exchange for those benefits. The company recognises termination benefits when it is demonstrably committed to terminate the employment of an employee or a group of employees under a detailed formal plan for the termination and is without realistic possibility of withdrawal or is demonstrably committed to provide termination benefits as a result of an offer made to encourage voluntary redundancy. Where termination benefits fall due more than 12 months after the reporting date, they are discounted.
(t) Allocation of expenses
Expenses are first allocated on the basis of cost centres
ERGO INSURANCE SE ANNUAL REPORT 2014 ERGO INSURANCE SE ANNUAL REPORT 2014
2524
that are divided into categories according to their function: administration, sales, investment and claims handling. If a cost centre is related to more than one function, expenses are re-allocated. Reallocations are made based on expert opinions derived from analyses that are generally valid for at least one year.
(u) Other provisions
Other provisions are recognised when• the company has a present legal or constructive
obligation as a result of a past event;• it is probable that an outflow of resources will be
required to settle the obligation; and• a reliable estimate can be made of the amount of
the provision.
A provision is recognised by reference to management’s best estimates of the expenditure required to settle the obligation and the time the obligation ought to be settled.
(v) Dividends
Dividends are recognised as a liability on an accrual basis in the period in which they are declared.
(w) Events after the reporting period
The annual financial statements reflect all significant events affecting the valuation of assets and liabilities that became evident between the reporting date (31 December 2014) and the date on which the financial statements were authorised for issue but are related to the reporting or prior periods.
Subsequent events that are indicative of conditions that arose after the reporting date but which will have a significant effect on the result of the next financial year are disclosed in the notes to the annual financial statements.
(x) New and revised International Financial Reporting Standards and new interpretations originated by the International Financial Reporting Interpretations Committee (IFRIC)
The following new standards and amendments took effect on 1 January 2014 but had no impact on the company’s financial statements:• SIFRS 10 Consolidated Financial Statements• IFRS 11 Joint Arrangements• IFRS 12 Disclosure of Interests in Other Entities• IAS 27 (2011) Separate Financial Statements• IAS 28 (2011) Investments in Associates and Joint
Ventures• Amendments to IAS 27 Investment Entities
• Amendments to IAS 32 Offsetting Financial Assets and Financial Liabilities
• Amendments to IAS 36 Recoverable Amount Disclosures for Non-Financial Assets
• Amendments to IAS 39 Novation of Derivatives and Continuation of Hedge Accounting.
The following new and revised standards and interpre-tations were not yet effective for the year ended 31 December 2014 and have therefore not been applied in preparing these financial statements:
Amendments to IAS 19 Defined Benefit Plans: Employee Contributions are effective for annual periods beginning on or after 1 February 2015. The amendments are to be applied retrospectively with earlier application permitted.
The amendments are relevant only to defined benefit plans that involve contributions from employees or third parties that are:• set out in the formal terms of the plan;• linked to service; and• independent of the number of years of service.
When these criteria are met, a company is permitted (but not required) to recognise them as a reduction of the service cost in the period in which the related service is rendered.
The company does not expect the amendments to have any impact on its financial statements since it does not have defined benefit plans that involve contributions from employees or third parties.
IFRIC 21 Levies is effective for annual periods beginning on or after 17 June 2014. The interpretation is to be applied retrospectively with earlier application permitted.
The interpretation provides guidance on the identi-fication of an obligating event giving rise to a liability, and to the timing of recognising a liability to pay a levy imposed by a government.
In accordance with the interpretation, an obligating event is an activity that triggers the payment of a levy, as identified in relevant legislation and as a consequence, the liability for paying the levy is recognised when this event occurs.
The liability to pay a levy is recognised progressively if the obligating event occurs over a period of time.
If the obligating event is the reaching of a minimum activity threshold, the corresponding liability is recognised when that minimum activity threshold is reached.
The interpretation sets out that an entity cannot have a constructive obligation to pay a levy that will be triggered by operating in a future period as a result of the entity being economically compelled to continue to operate in that future period.

ERGO INSURANCE SE ANNUAL REPORT 2014
26
It is expected that the interpretation, when initially applied, will not have a material impact on the company’s financial statements, since it does not result in a change in the company’s accounting policy regarding levies imposed by governments.
Annual Improvements to IFRSs introduce eleven amendments to nine standards and consequential amendments to other standards and interpretations. Most of these amendments are applicable to annual
periods beginning on or after 1 February 2015, with earlier adoption permitted. Another four amendments to four standards are applicable to annual periods beginning on or after 1 January 2015, with earlier adoption permitted.
None of these amendments are expected to have a significant impact on the company’s financial statements.

ERGO INSURANCE SE ANNUAL REPORT 2014 ERGO INSURANCE SE ANNUAL REPORT 2014
2726
Note 2. Insurance and financial risks
The business model of ERGO Insurance SE assumes taking, assessing and managing both insurance and financial risks. The logic of the business model exposes the company to various risks and renders risk awareness and prudent risk management priorities. The company puts a lot of effort in enhancing its risk management systems. At present, they cover predomi-nantly areas where risks are higher either in terms of potential adverse impact or probability.
2.1. Insurance risks
The insurance environment is regulated by the Law of Obligations Act and the Insurance Activities Act. In certain areas, the Motor Insurance Act is applied. As the Baltic countries are members of the EU, all legislation and regulations have to comply with relevant EU directives. Amendment or potential amendment of laws and regulations by the legislator increases business risk.
Management of insurance risks is an important part of the company’s risk management system. The core elements of the system include management of risk trends, constant monitoring of the methods and assumptions used to calculate insurance premiums and liabilities, and checking the adequacy of liabilities. Insurance risks are also mitigated through appropriate underwriting guidelines, actuarial analyses and adequate reinsurance cover.
Risk management policies and policies for mitigating insurance risk
The company’s insurance activity assumes the risk that a loss event involving a person or property directly related to an insurance contract may occur. The risk may relate to property, liability, health, accident, financial, or other loss that may arise from an insured event whose time of occurrence and severity are unknown at the date the insurance contract is concluded.
The company is also exposed to market risks through its insurance and investment activities.
The company manages its insurance risk through underwriting limits, approval procedures for transactions that involve new products or exceed set limits, pricing guidelines and centralised management of reinsurance.
The company uses several methods to assess and monitor insurance risk exposures both for individual types of risks insured and general insurance risks. These
methods include internal risk measurement models, sensitivity analyses, scenario analyses and stress testing.
The methods of the theory of probability are applied to pricing and calculating provisions for the portfolio of insurance contracts. The principal risk is that the frequency and severity of claims is greater than expected. Insurance events are, by nature, random, and the actual number and size of events during any year may vary from those estimated using statistical techniques.
The key risks associated with insurance services are underwriting risk and competition risk. The company is also exposed to the risk of dishonest actions by policy-holders.
Underwriting risk is the risk that the company is unable to estimate the probability of an insured event and the size of a potential loss sufficiently accurately and, as a result, insufficient insurance premiums are charged. The risks of a specific contract may be influenced by factors such as the location of the policyholder and the insured property, the safety measures in place, the nature of the policyholder’s business, the age of the property etc. In calculating a premium that is commen-surate with the risk insured, the company relies on the loss incurrence statistics for similar risks and the specific features of the risk insured. If insurance risk is systematically underestimated, the company may not be able to indemnify losses and perform its obligations under its insurance contracts.
The risks associated with policyholder claims involve the risk that the insured will make false or invalid claims or will exaggerate the amount claimed following a loss. The category also includes the risk of intentional or unintentional underinsurance.
The process used to determine assumptions is intended to result in neutral estimates of the most likely or expected outcome. The sources of data used as inputs for assumptions are internal and external and based on detailed studies that are carried out annually. Assumptions are checked to ensure that they are consistent with observable market prices or other published information. Special attention is paid to assumptions which change over time. Where there is insufficient information to make a reliable best estimate, conservative assumptions are used.
Underwriting strategy
The company’s underwriting strategy seeks diversity to ensure a balanced portfolio. The company believes that
ERGO INSURANCE SE ANNUAL REPORT 2014
28
a large portfolio of similar risks ensures a better predic-tability of the outcomes.
The underwriting strategy is set out in the annual business plan that sets out the classes of business to be written and the industry sectors to which the company is prepared to expose itself. The strategy is cascaded down to individual underwriters through detailed underwriting guidelines that set out the limits that any one underwriter can write in terms of line size, class and industry in order to enforce appropriate risk selection within the portfolio. All non-life insurance contracts are annual in nature and underwriters may refuse to renew the contract or may change contract terms and conditions on renewal.
Insurance services are designed and updated in accordance with the company’s internal regulations that provide a framework for insurance services, definitions of insurance risks, and a list of risks and/or assets that are not to be insured. Adherence to underw-riting rights is determined through a series of exception reports that are run on a quarterly basis covering insurance classes and services.
General insurance contracts
Liability insuranceLiability insurance is considered a long-tail line as handling and settling claims for a given insured event takes relatively long. The term for reporting a claim depends on the insurance cover and the terms and conditions of the insurance contract. The speed of claim handling depends on the speed of reporting, the cover provided, the jurisdiction, and specific policy terms and conditions.
The majority of liability covers are written on a ‘claims made’ or ‘act committed’ trigger. The main exception is motor TPL insurance that is written on an occurrence basis. Liability contracts provide the extent of the liability also in geographical terms. Generally, the scope of liability is limited to the country where the company providing the insurance cover is located.
Motor TPL insurance is the insurance of the civil liability of a person in possession of a major source of danger. It covers the losses that may be incurred from activities associated with the ownership or use of a vehicle. Motor TPL insurance is also valid outside the Baltic countries and covers relevant damages incurred in the EU countries and countries that have joined the Green Card Convention. Losses are indemnified in accordance with the liability rates of the country in which the traffic accident occurs. In some countries liability is unlimited. Therefore, in principle, motor TPL insurance contracts are contracts with unlimited liability. This means that policies are written without a limit although tariffs are set taking into account the actual value of the largest possible claim.
Motor TPL insurance covers property damages and personal injuries inflicted on third persons and, locally, also the medical treatment expenses of the driver that caused the insured event. This means that the nature of losses differs.
Property losses are handled quickly but the handling of personal injury claims may take years. In the case of personal injuries that have to be indemnified with periodic payments (pensions) the insurer may not indemnify the damages in an agreed lump sum. In the case of traffic accidents that occur in the Baltic countries, motor TPL insurance does not cover unearned income. Due to a longer handling period and also because personal injuries are directly related to many other socio-economic factors, the proportion of personal injury claims is increasing rapidly.
Motor TPL insurance contracts are entered into for an unspecified term. The maximum term of a policy is twelve months. A specific feature of the product is that when the policy expires, the insurer’s liability does not expire unless the policyholder has concluded a new insurance contract. An insurer may not refuse to conclude a contract. This increases the importance of risk assessment.
Liability insurance is typically the greatest source of uncertainty in the estimation of provisions. Claims with long reporting lags result in greater inherent risk. Claims with long latencies also increase the potential recognition lag, i.e. the lag between writing a type of policy in a certain market and the recognition that such policies have potential mass tort and/or latent claim exposure. As a rule, liability insurance services have long reporting lags and claims involve several parties and large potential amounts. Therefore, estimation of provisions for liability insurance is subject to greater uncertainties than that of other classes.
Property insuranceThe company offers property insurance for property located in the Baltic countries. Property insurance indemnifies, subject to limits and restrictions that result from insured amounts and insurance terms and condi-tions, policyholders against loss of or damage to their property and losses arising from associated business interruption.
The event (e.g. a fire or burglary) giving rise to a claim for compensating damage to buildings or property located therein usually occurs suddenly and the cause and time are generally easily determinable. The claim is generally notified promptly and can be settled without delay. Delays may result from the determination of the cause of the insured event, restoring the property and making relevant preparations.
Property business is therefore classified as ‘short-tailed’ meaning that the increase in costs over time and investment return are of negligible importance. This
ERGO INSURANCE SE ANNUAL REPORT 2014 ERGO INSURANCE SE ANNUAL REPORT 2014
2928
contrasts with the ‘long-tailed’ classes (e.g. liability insurance) where the ultimate cost of a claim takes longer to determine, making costs and investment return considerably more important.
Marine and transport insurance
This category comprises the insurance of watercraft and the transport of goods such as goods in transit insurance, carrier’s liability insurance and forwarding agent’s liability insurance. The classes incorporate the features of both property insurance and liability insurance. Similarly to liability insurance, reporting and handling are long-term processes.
Product-specific risks include claims related to violation of customs regulations. The risks related to property insurance are more indeterminate because insurance cover is valid also outside the Baltic countries.
Pricing risks
The premium rates and tariffs applied by the company are usually calculated for a year and their adequacy is checked on a regular basis. Premium rates and tariffs may be changed due to changes in claim incurrence statistics, market trends and the broadening or limitation of insurance cover. The company has a routine procedure for changing premium rates and tariffs.
Tariffs are calculated based on mathematical assumptions. Therefore, there exists the risk that the frequency and severity of losses will surpass the assumptions. This risk is mitigated by checking the validity of assumptions applied in routine reporting.
Another pricing risk is related to the sales process. The ultimate price of an insurance service depends on various risk factors, some of which are subjective. Therefore, there exists the risk that risk factors are intentionally or unintentionally altered. The company has mitigated the risk by excluding the possibility of price manipulations on the sale of mass products. In classes where each item of insured property has to be assessed on an individual basis, the underwriting process entails risk assessment and supervision by the company’s insurance department.
Claims handling risks
The keywords of the company’s claims handling operations are transparency and prudence. Transparency assumes the clarity of the handling process and its compliance with established guidelines and regulations. On the one hand this is in the customer’s best interests and on the other allows monitoring and checking the handling process. The risks inherent in the process are mitigated by the absence of cash risk and applying proper quality controls, separating the process into stages, and adhering to signature rules.
In line with the principle of prudence each reported claim is evaluated on an individual basis taking into account the circumstances surrounding the claim, the information obtained during the handling process and historical evidence about the size of similar claims. The nature of the business makes it very difficult to predict with certainty the likely outcome of any particular claim and the ultimate cost of reported claims. Therefore, case estimates are reviewed regularly and updated as and when new information becomes available. However, the ultimate liabilities may vary as a result of subsequent developments. The impact of many factors affecting the ultimate loss is difficult to estimate. Provision estimation difficulties, which differ by class of business, depend also on the terms of the underlying insurance contract, claim complexity and volume, determination of the date of occurrence, and reporting lags.
Provisioning risks
The company’s exposure to latent bodily injury claims arises mainly from motor TPL insurance contracts and, to a lesser extent, accident insurance contracts. The company’s estimate of its ultimate liability for such exposures includes case-based provisions and a provision for liabilities incurred but not reported (IBNR). The IBNR provision is established based on various methods taking into account claims development, frequency and severity.
The costs of IBNR provisions are estimated using several statistical methods such as the chain ladder and Bornhuetter Ferguson methods. Such methods extrapolate the development of paid and incurred claims, average cost per claim and ultimate number of claims for each year based upon observed developments of earlier years and expected loss ratios.
The key methods that are used and have remained unchanged from prior years are:
• chain ladder methods, which use historical data to estimate the ratio of paid and incurred claims to forecasted ultimate claims cost;
• expected loss ratio methods, which use the company’s expectation of the loss ratio for a class of insurance.
The actual method or blend of methods used varies by the year of incurrence, the class of business and observed historical claims development.
The methods rely on historical claims development information and assume that the historical pattern will occur again in the future. There are reasons why this may not be the case and which are considered, where possible, by modifying the methods. Such reasons include:
• changes in the processes that affect the development/recording of claims paid and forecasted (such as changes in claims provisioning procedures);

ERGO INSURANCE SE ANNUAL REPORT 2014
30
• economic, legal, political and social trends that cause the rate of inflation differ from the forecast;
• changes in the mix of business; • random fluctuations, including the impact of large
losses.
IBNR provisions are initially estimated at a gross level and separate calculations are made to estimate the size of reinsurance recoveries.
ERGO calculates its insurance provisions using the principle of best actuarial estimates, i.e. an insurance provision is recognised in an amount that best reflects the expected future net cash outflows. In addition to direct claim and benefit payments, the expected future cash outflows comprise claims handling and other potential costs as well as expected future income from salvage and subrogation recoveries.
The laws of Latvia and Lithuania set a monetary ceiling to the emotional distress, pain and suffering claims related to compulsory motor TPL insurance (5,000 euros in Lithuania and 570 euros in Latvia). According to the judgement of the European Court of Justice in case C-277/12 against an insurer operating in Latvia, such restrictions are not in compliance with the EU directives.
At the date these financial statements are authorised for issue, local laws have not been amended to eliminate the non-compliance. Accordingly, there is uncertainty about the amount of damages that may be assigned, whether application of the change could be retrospective, and to what extent the liabilities, if any, would have to be borne by insurers. At 31 December 2014, the IBNR provision for motor third party liability insurance and thus the amount exposed to uncertainty was 3,092,909 euros. Management monitors the matter
on an ongoing basis and will review its estimates as and when new information becomes available.
Concentration risks
Within the insurance process, concentration risk may arise where a particular event or series of events has a strong impact on the company’s liabilities. Such concentration may arise from a single insurance contract or through a large number of related contracts.
Recognition of losses due to such events will accurately reflect the events that have taken place. The company’s cash flows resulting from a high-severity risk such as a flood may differ significantly from the cash flows resulting from an ordinary insured event.
The company is engaged in non-life insurance, providing cover for various risks. In property insurance, the company needs to monitor the geographical concentration of risks because external factors such as adverse weather conditions may have an adverse impact on a large proportion of insured property in a particular geographical area.
Claim-triggering perils such as storms, floods, fires, explosions, and growth in crime may occur on a regional basis, meaning that the company has to manage its geographical risk dispersion very carefully. The company assesses and mitigates the geographical concentration of risks by using contemporary tools for analysing geographical information.
In geographical terms, insurance contract liabilities break down as follows.
In euros 2014 2013Gross
provisionsReinsurers’
shareNet
provisionsGross
provisionsReinsurers’
shareNet
provisionsEstonia 30 014 634 2 911 384 27 103 250 30 457 092 2 806 899 27 650 193Latvia 25 264 999 7 324 803 17 730 965 27 089 656 7 277 894 19 530 568Lithuania 44 512 211 4 398 806 40 322 636 39 295 134 4 205 627 35 370 701Total 99 791 844 14 634 993 85 156 851 96 841 882 14 290 420 82 551 462
Impact of catastrophic events
Probable events that could have the strongest impact on the insurance portfolio are natural disasters such as floods and storms. In Estonia, the probable frequency of a severe natural disaster comparable to the storm on 9 January 2005 is once in twenty years. In order to limit the impact of a potential catastrophe, the company has bought natural catastrophe reinsurance with an insured amount of 26 million euros and retention of 3.0 million euros. In addition, the company constantly limits its risk concentration by spreading its insurance risks across Estonia and limiting its contractual exposure to any single peril in the event of a natural disaster.
The biggest possible losses resulting from single events relate to motor TPL insurance and property insurance. The company has bought non-proportional peril-based reinsurance cover, limiting its net liability to 1.5 million euros per insurance contract in property insurance and to 1.0 million euros per insured event in motor TPL insurance.
Reinsurance strategy
The company reinsures a certain part of the risks for which it provides insurance cover under insurance contracts. The purpose of reinsurance is to reduce the
ERGO INSURANCE SE ANNUAL REPORT 2014 ERGO INSURANCE SE ANNUAL REPORT 2014
3130
Distribution of reinsurance retention by class of insurance as at 31 December 2014 was as follows (on a forward looking basis):
Class of insurance Retention (in euros)Property and technical risks insurance 1 500 000Motor TPL insurance 1 000 000 Liability insurance 500 000Goods in transit, watercraft, accident, travel, carrier’s liability, and animal insurance 300 000Motor own damage insurance and guarantee insurance 250 000
Claims development
The claims development table allows comparing the claims outstanding estimates included in the financial statements with the claims incurred in previous years and reflects the company’s ability to estimate the total value of claims.
The table provides an overview of current estimates of cumulative claims (including claims paid and case-based provisions and IBNR, but excluding claims handling costs and the provision for claims handling costs) and demonstrates how claims estimates have changed at subsequent year-ends. An estimate is increased or reduced as claims are paid and more
information becomes available about the frequency and severity of claims outstanding.
Various factors may distort current estimates of provisions and cumulative prior year provisions.
While the information in the table provides a historical perspective of the adequacy of claims outstanding estimates, it does not provide a basis for extrapolating surpluses or shortfalls of the past on current claims outstanding balances. The company believes that the estimates of claims outstanding as at the end of 2014 are adequate. However, due to the inherent uncertainties of the provisioning process, it cannot be guaranteed that the balances will prove adequate.
Analysis of claims development – gross (as at 31 December 2014)
In euros Year of loss incurrenceEstimate of cumulative claims 2009 2010 2011 2012 2013 2014
At end of year of incurrence 84 578 353 71 111 848 68 364 655 69 438 065 77 091 746 64 433 543One year later 76 282 901 67 771 751 65 590 736 65 021 928 75 950 590Two years later 74 712 085 66 380 011 63 447 380 64 122 774Three years later 68 837 920 63 769 821 62 400 489Four years later 66 036 592 63 166 864Five years later 66 012 520Cumulative payments until31 December 2014 64 829 925 62 081 786 60 693 255 60 492 795 58 188 599 42 877 449
Provision for claims outstanding (incl. IBNR) at 31 December 2014
1 182 595 1 085 078 1 707 234 3 629 979 17 761 991 21 556 094
At 31 December 2014, the provision for claims outstanding for earlier years of loss incurrence amounted to 10,885,121 euros (2013: 8,222,807 euros).
The following sensitivity analysis reflects the effect of a 5% change in the provisions for claims outstanding on the company’s net loss ratio, profit or loss for the year and equity
company’s share of losses and to limit the potential net loss through the diversification of risks. The main contract forms in reinsurance are peril-based obligatory non-proportional and peril-based obligatory proportional reinsurance, accompanied by catastrophe reinsurance for aggregated risks related to the whole portfolio. Risks exceeding the limits of obligatory reinsurance contracts or falling outside their scope are reinsured on a facultative basis.
Reinsurance is acquired on the guiding principle that the net loss should not exceed 1.5 million euros for each individual insured item and/or each individual event. Retention for additional natural catastrophe reinsurance is 3.0 million euros. Standard exclusions from reinsurance contracts are losses arising from nuclear energy and terrorism.
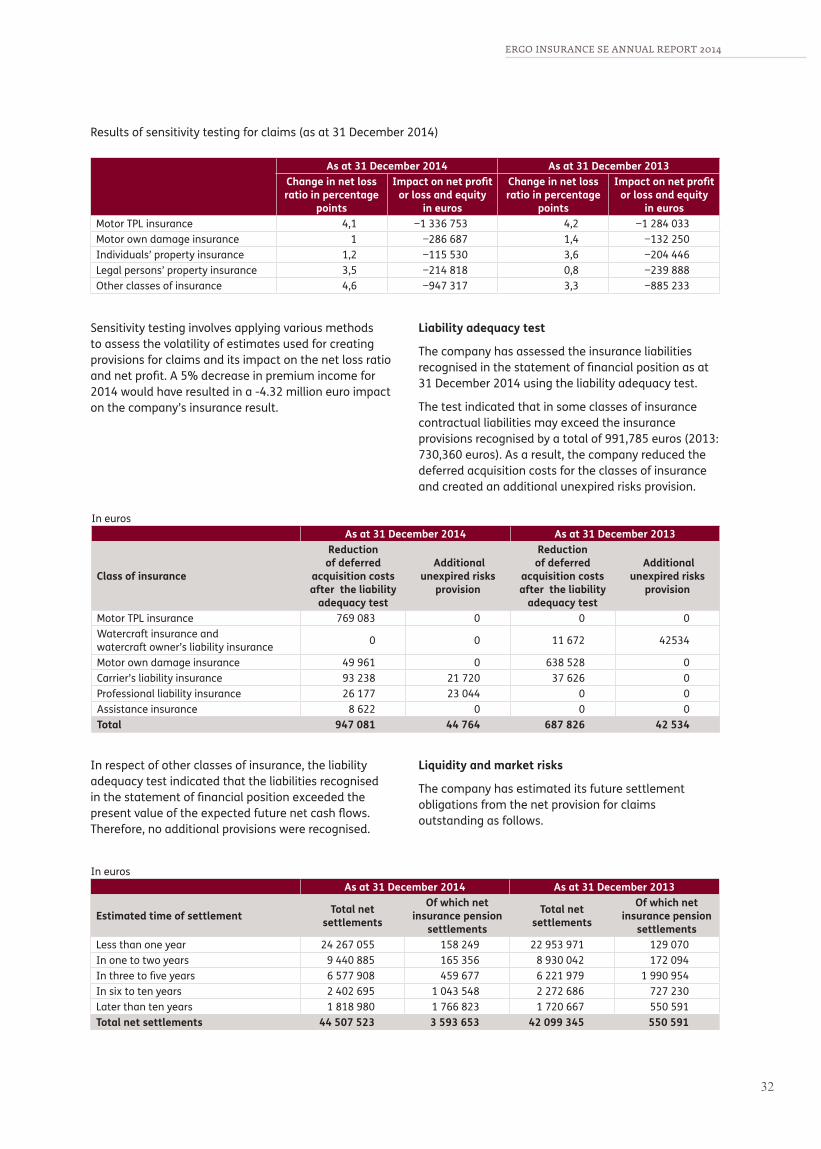
ERGO INSURANCE SE ANNUAL REPORT 2014
32
Sensitivity testing involves applying various methods to assess the volatility of estimates used for creating provisions for claims and its impact on the net loss ratio and net profit. A 5% decrease in premium income for 2014 would have resulted in a -4.32 million euro impact on the company’s insurance result.
Liability adequacy test
The company has assessed the insurance liabilities recognised in the statement of financial position as at 31 December 2014 using the liability adequacy test.
The test indicated that in some classes of insurance contractual liabilities may exceed the insurance provisions recognised by a total of 991,785 euros (2013: 730,360 euros). As a result, the company reduced the deferred acquisition costs for the classes of insurance and created an additional unexpired risks provision.
In eurosAs at 31 December 2014 As at 31 December 2013
Class of insurance
Reduction of deferred
acquisition costs after the liability
adequacy test
Additional unexpired risks
provision
Reduction of deferred
acquisition costs after the liability
adequacy test
Additional unexpired risks
provision
Motor TPL insurance 769 083 0 0 0Watercraft insurance and watercraft owner’s liability insurance 0 0 11 672 42534
Motor own damage insurance 49 961 0 638 528 0Carrier’s liability insurance 93 238 21 720 37 626 0Professional liability insurance 26 177 23 044 0 0Assistance insurance 8 622 0 0 0Total 947 081 44 764 687 826 42 534
In eurosAs at 31 December 2014 As at 31 December 2013
Estimated time of settlement Total net settlements
Of which net insurance pension
settlements
Total net settlements
Of which net insurance pension
settlementsLess than one year 24 267 055 158 249 22 953 971 129 070In one to two years 9 440 885 165 356 8 930 042 172 094In three to five years 6 577 908 459 677 6 221 979 1 990 954In six to ten years 2 402 695 1 043 548 2 272 686 727 230Later than ten years 1 818 980 1 766 823 1 720 667 550 591Total net settlements 44 507 523 3 593 653 42 099 345 550 591
In respect of other classes of insurance, the liability adequacy test indicated that the liabilities recognised in the statement of financial position exceeded the present value of the expected future net cash flows. Therefore, no additional provisions were recognised.
Liquidity and market risks
The company has estimated its future settlement obligations from the net provision for claims outstanding as follows.
Results of sensitivity testing for claims (as at 31 December 2014)
As at 31 December 2014 As at 31 December 2013Change in net loss ratio in percentage
points
Impact on net profit or loss and equity
in euros
Change in net loss ratio in percentage
points
Impact on net profit or loss and equity
in eurosMotor TPL insurance 4,1 −1 336 753 4,2 −1 284 033Motor own damage insurance 1 −286 687 1,4 −132 250Individuals’ property insurance 1,2 −115 530 3,6 −204 446Legal persons’ property insurance 3,5 −214 818 0,8 −239 888Other classes of insurance 4,6 −947 317 3,3 −885 233

ERGO INSURANCE SE ANNUAL REPORT 2014 ERGO INSURANCE SE ANNUAL REPORT 2014
3332
Liquidity risk is mitigated through asset and liability management (ALM). The main market risk is a potential inflation-triggered increase in future obligations. The risk has been hedged by estimating the IBNR component of the provision for claims outstanding on the assumption that the annual rate of inflation is 2.5% and not discounting case-based claims provisions. In view of the nature of its business and the small proportion of its long-term liabilities, the company believes that the impacts of liquidity and market risks are moderately low.
Credit risk
In its insurance activities, the company’s main credit risk is payment default by a broker or reinsurer. The company’s credit risk arises principally from its insurance and reinsurance receivables. In each business line, risk management measures are applied to protect the company’s financial position. The company has rules for consistent monitoring and management of overdue receivables. Receivables that are more than 60 days overdue are written down.
To mitigate the risk arising from reinsurance, the company enters into obligatory reinsurance contracts only with reinsurers whose rating is above AA– (according to Standard & Poor’s) and into facultative reinsurance contracts only with reinsurers whose rating is above BBB (according to Standard & Poor’s). Exceptions include facultative reinsurance contracts signed with other members of ERGO group but their volume is insignificant.
Distribution of reinsurance assets by credit rating.
Standard & Poor’s, as at 31 December
2014 2013
AA 8 828 238 8 496 131A 3 136 537 4 009 849BBB 4 921 388 966BB 0 1 522Without rating 2 665 297 1 393 952Total 14 634 993 14 290 420
2.2. Financial risk management
Management of the risks related to financial assets is embedded in the company’s risk management policy, predetermined risk profile, strategic investment of assets and specific risk management processes.
The company manages its asset risk by preparing a new investment policy on an annual basis. The policy comprises both short- and long-term investment strategies. Implementation of the strategy and adherence to restrictions is monitored by a multi-level structure. In 2014, tactical decisions were made and implemented by AS Trigon Funds, an investment management company hired by ERGO, in cooperation with the Investment Committee (IC) that included the specialists of AS Trigon Funds and the investment manager. From 2015, tactical management of the company’s assets is the responsibility of MEAG.
In addition to IC, the compliance of investments with the adopted strategy is monitored by the Asset and Liability Management (ALM) Team. If problems arise, they are reviewed by the ALM Committee (that includes qualified members from Estonia and Germany) and the management board. Many ERGO group entities are also involved in planning, monitoring and managing investment risks.
Credit risk
The credit risk of investments is the risk that the issuer of a security will not discharge its obligations. The risk is mitigated by acquiring securities from issuers with a high credit rating. The following table describes the company’s debt securities portfolio by the issuer’s credit rating. At the year-end, the weighted average rating of fixed-income securities was AA- (2013: AA-). The company believes that its credit risk exposure to other financial assets is low due to their small proportion. The assets presented in the table below have at least one rating of the respective rating group provided by one of the named rating agencies.
Rating As at 31 December 2014 As at 31 December 2013
Standard & Poor’s Moody’s Fair value in euros
Proportion of debt securities, %
Fair value in euros
Proportion of debt securities, %
AAA Aaa 36 878 945 47,2 34 396 349 47,7AA Aa 21 115 976 27,0 21 575 388 29,9A A 7 728 887 9,9 7 245 199 10,0BBB and below Baa 12 460 372 15,9 8 921 623 12,4Total 78 184 180 100,0 72 138 559 100,0
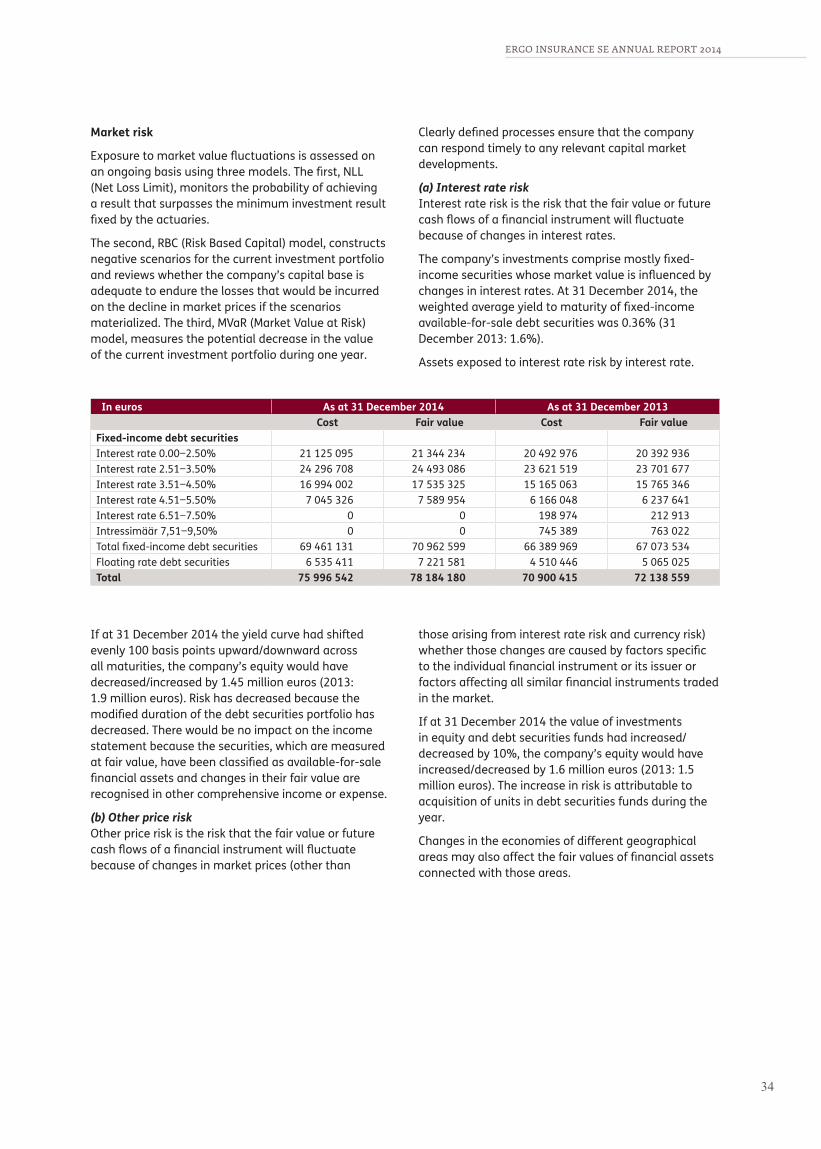
ERGO INSURANCE SE ANNUAL REPORT 2014
34
Market risk
Exposure to market value fluctuations is assessed on an ongoing basis using three models. The first, NLL (Net Loss Limit), monitors the probability of achieving a result that surpasses the minimum investment result fixed by the actuaries.
The second, RBC (Risk Based Capital) model, constructs negative scenarios for the current investment portfolio and reviews whether the company’s capital base is adequate to endure the losses that would be incurred on the decline in market prices if the scenarios materialized. The third, MVaR (Market Value at Risk) model, measures the potential decrease in the value of the current investment portfolio during one year.
Clearly defined processes ensure that the company can respond timely to any relevant capital market developments.
(a) Interest rate riskInterest rate risk is the risk that the fair value or future cash flows of a financial instrument will fluctuate because of changes in interest rates.
The company’s investments comprise mostly fixed-income securities whose market value is influenced by changes in interest rates. At 31 December 2014, the weighted average yield to maturity of fixed-income available-for-sale debt securities was 0.36% (31 December 2013: 1.6%).
Assets exposed to interest rate risk by interest rate.
In euros As at 31 December 2014 As at 31 December 2013Cost Fair value Cost Fair value
Fixed-income debt securitiesInterest rate 0.00−2.50% 21 125 095 21 344 234 20 492 976 20 392 936Interest rate 2.51−3.50% 24 296 708 24 493 086 23 621 519 23 701 677Interest rate 3.51−4.50% 16 994 002 17 535 325 15 165 063 15 765 346Interest rate 4.51−5.50% 7 045 326 7 589 954 6 166 048 6 237 641Interest rate 6.51−7.50% 0 0 198 974 212 913Intressimäär 7,51−9,50% 0 0 745 389 763 022Total fixed-income debt securities 69 461 131 70 962 599 66 389 969 67 073 534Floating rate debt securities 6 535 411 7 221 581 4 510 446 5 065 025Total 75 996 542 78 184 180 70 900 415 72 138 559
If at 31 December 2014 the yield curve had shifted evenly 100 basis points upward/downward across all maturities, the company’s equity would have decreased/increased by 1.45 million euros (2013: 1.9 million euros). Risk has decreased because the modified duration of the debt securities portfolio has decreased. There would be no impact on the income statement because the securities, which are measured at fair value, have been classified as available-for-sale financial assets and changes in their fair value are recognised in other comprehensive income or expense.
(b) Other price riskOther price risk is the risk that the fair value or future cash flows of a financial instrument will fluctuate because of changes in market prices (other than
those arising from interest rate risk and currency risk) whether those changes are caused by factors specific to the individual financial instrument or its issuer or factors affecting all similar financial instruments traded in the market.
If at 31 December 2014 the value of investments in equity and debt securities funds had increased/decreased by 10%, the company’s equity would have increased/decreased by 1.6 million euros (2013: 1.5 million euros). The increase in risk is attributable to acquisition of units in debt securities funds during the year.
Changes in the economies of different geographical areas may also affect the fair values of financial assets connected with those areas.

ERGO INSURANCE SE ANNUAL REPORT 2014 ERGO INSURANCE SE ANNUAL REPORT 2014
3534
Available-for sale debt securities by issuer’s domicile.
In euros As at 31 December 2014 As at 31 December 2013Austria 1 859 296 3 046 795Belgium 0 464 526Estonia 536 327 512 319Spain 3 983 894 0Netherlands 4 062 889 4 139 102Italy 1 046 161 0Lithuania 7 219 074 6 787 359Latvia 1 444 671 607 585Norway 4 853 504 4 913 474Poland 773 506 906 972France 4 979 241 3 429 233Sweden 4 578 113 4 923 178Germany 22 973 388 22 964 588Slovakia 0 1 117 036Slovenia 0 1 014 364Finland 6 058 292 5 601 985Great Britain 8 033 724 7 148 951Denmark 2 137 485 2 155 700Czech Republic 211 459 371 057European Investment Bank 3 433 156 2 034 337Total 78 184 180 72 138 559
(c) Currency riskCurrency risk is the risk that the fair value or future cash flows of a financial instrument will fluctuate because of changes in foreign exchange rates.
The company’s liabilities in different currencies are covered with assets denominated in the same currencies. Currency risk is countered by monitoring that no uncovered currency exposure would exceed
5% of assets. The restriction does not apply to local currencies: the euro (EUR) and the Lithuanian litas (LTL). The exchange rate of the litas was fixed and in 2015 Lithuania adopted the euro. Therefore, in 2014 currency risk arising from litas was minimal .
The following assets and liabilities are exposed to currency risk:
In euros As at 31 December 2014 As at 31 December 2013USD USD
Insurance and other receivables 41 986 15 403Reinsurance assets 49 817 46 870Investments in financial instruments – available-for-sale debt securities
3 154 776 0
Insurance contract provisions 63 393 194 812Insurance payables 2 977 3 257Reinsurance payables 36 715 16 603Total 3 349 664 276 945
Liquidity risk
The company has to be able to discharge its payment obligations at any time. This is ensured by liquidity planning that is embedded in the asset and liability management (ALM) model.
To be able meet its settlement commitments at any time, the company needs to know its liabilities and has to acquire a suitable investment portfolio. This is achieved by close cooperation between actuaries, the investment manager and the ALM Team.
The debt securities portfolio is composed by taking
into account the average duration of liabilities and modifying the duration of assets and liabilities with duration matching. In addition, a large share of the company’s assets is invested in highly liquid securities, which should ensure the availability of sufficient monetary resources even under stressed circums-tances. At the year-end, the company’s liquid funds totalled 85.7 million euros (available-for-sale debt securities of 78.2 million euros plus cash and cash equivalents of 7.6 million euros).
Available-for-sale debt securities by maturity (carrying amounts).
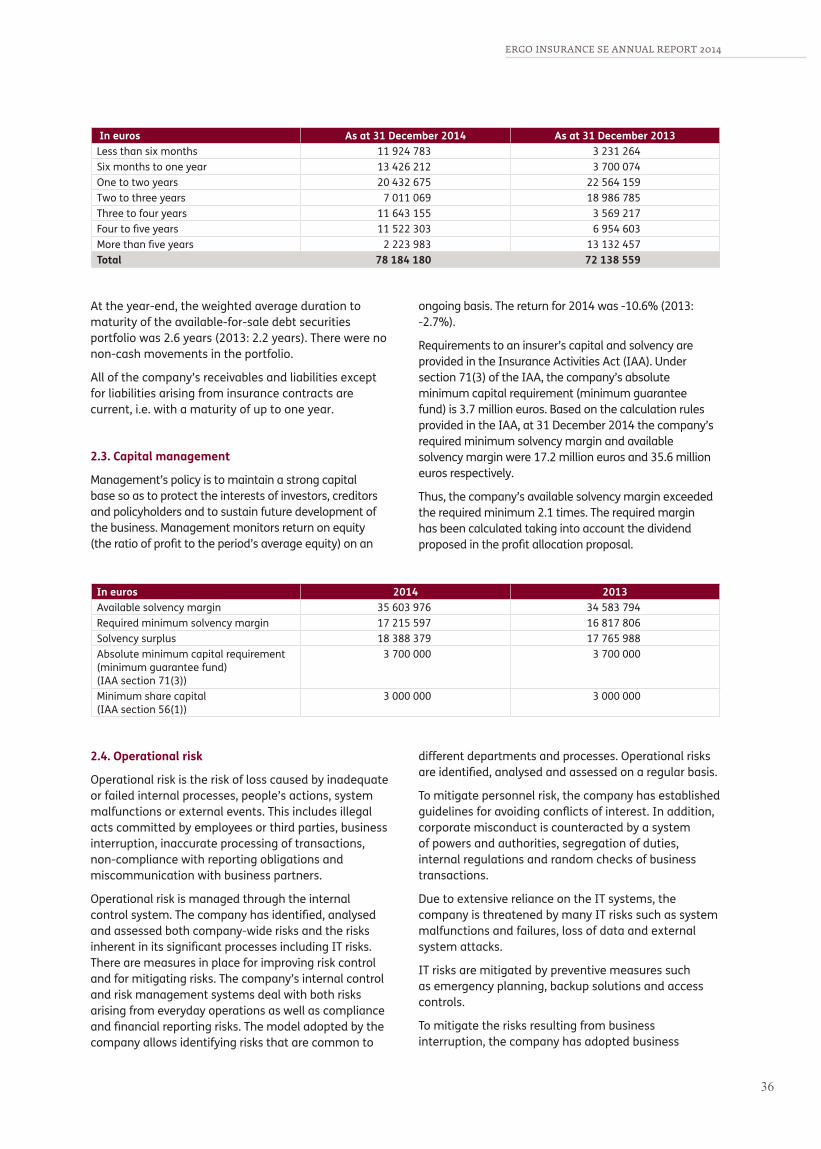
ERGO INSURANCE SE ANNUAL REPORT 2014
36
At the year-end, the weighted average duration to maturity of the available-for-sale debt securities portfolio was 2.6 years (2013: 2.2 years). There were no non-cash movements in the portfolio.
All of the company’s receivables and liabilities except for liabilities arising from insurance contracts are current, i.e. with a maturity of up to one year.
2.3. Capital management
Management’s policy is to maintain a strong capital base so as to protect the interests of investors, creditors and policyholders and to sustain future development of the business. Management monitors return on equity (the ratio of profit to the period’s average equity) on an
ongoing basis. The return for 2014 was -10.6% (2013: -2.7%).
Requirements to an insurer’s capital and solvency are provided in the Insurance Activities Act (IAA). Under section 71(3) of the IAA, the company’s absolute minimum capital requirement (minimum guarantee fund) is 3.7 million euros. Based on the calculation rules provided in the IAA, at 31 December 2014 the company’s required minimum solvency margin and available solvency margin were 17.2 million euros and 35.6 million euros respectively.
Thus, the company’s available solvency margin exceeded the required minimum 2.1 times. The required margin has been calculated taking into account the dividend proposed in the profit allocation proposal.
In euros 2014 2013Available solvency margin 35 603 976 34 583 794Required minimum solvency margin 17 215 597 16 817 806Solvency surplus 18 388 379 17 765 988Absolute minimum capital requirement (minimum guarantee fund) (IAA section 71(3))
3 700 000 3 700 000
Minimum share capital (IAA section 56(1))
3 000 000 3 000 000
2.4. Operational risk
Operational risk is the risk of loss caused by inadequate or failed internal processes, people’s actions, system malfunctions or external events. This includes illegal acts committed by employees or third parties, business interruption, inaccurate processing of transactions, non-compliance with reporting obligations and miscommunication with business partners.
Operational risk is managed through the internal control system. The company has identified, analysed and assessed both company-wide risks and the risks inherent in its significant processes including IT risks. There are measures in place for improving risk control and for mitigating risks. The company’s internal control and risk management systems deal with both risks arising from everyday operations as well as compliance and financial reporting risks. The model adopted by the company allows identifying risks that are common to
different departments and processes. Operational risks are identified, analysed and assessed on a regular basis.
To mitigate personnel risk, the company has established guidelines for avoiding conflicts of interest. In addition, corporate misconduct is counteracted by a system of powers and authorities, segregation of duties, internal regulations and random checks of business transactions.
Due to extensive reliance on the IT systems, the company is threatened by many IT risks such as system malfunctions and failures, loss of data and external system attacks.
IT risks are mitigated by preventive measures such as emergency planning, backup solutions and access controls.
To mitigate the risks resulting from business interruption, the company has adopted business
In euros As at 31 December 2014 As at 31 December 2013Less than six months 11 924 783 3 231 264Six months to one year 13 426 212 3 700 074One to two years 20 432 675 22 564 159Two to three years 7 011 069 18 986 785Three to four years 11 643 155 3 569 217Four to five years 11 522 303 6 954 603More than five years 2 223 983 13 132 457Total 78 184 180 72 138 559

ERGO INSURANCE SE ANNUAL REPORT 2014 ERGO INSURANCE SE ANNUAL REPORT 2014
3736
continuity plans which include instructions on how to act as well as alternative and recovery procedures for emergency and crisis situations.
Legal and regulatory changes including changes in supervision regulations may have a strong impact on the insurance business. Every change entails both threats and opportunities. Therefore, legal and regulatory changes are monitored on an ongoing basis. To mitigate the risks, the company participates in the Estonian Insurance Association and its subsidiary bodies.
To increase the organisation’s risk awareness, the company includes in risk management specialists from different departments. The policy of improving risk recognition and awareness and establishing an appropriate risk culture is consistently enforced. The company’s approach is that it is important to learn from mistakes and to accept them as development opportunities.
2.5. Reputational risk
Reputational risk is the risk of damage to the company’s public image or reputation among its customers, shareholders, employees, partners or other parties including supervision authorities. Reputational risk may result from the realisation of some other risk, particularly operational risk. Reputational risks are monitored and
controlled through the internal control system (see section 2.4. Operational risk).
Reputational risks may also result from making or failing to make a business decision. Sometimes the risks are difficult to identify and their financial impacts may be hard to assess. The company’s strategy is to avoid reputational risk. Risk exposure is limited by analysing, assessing and reporting on reputational risks on a regular basis.
2.6. Strategic risk
Strategic risk is the risk of loss from wrong business decisions, poor implementation of decisions or failure to adapt to changes in the operating environment. The company’s current and future operations involve strategic risks, which generally evolve over an extended period and occur in combination with other risks. Strategic risk factors are divided into two major categories: external (insurance market, competitors, customers and services) and internal (business strategy, achievement of strategic targets). Determi-nation of activities and allocation of resources required for managing strategic risks is the responsibility of the company’s management board. Each major risk factor is assigned to a person who is responsible for adopting measures for mitigating the risk and for reporting to the management board.
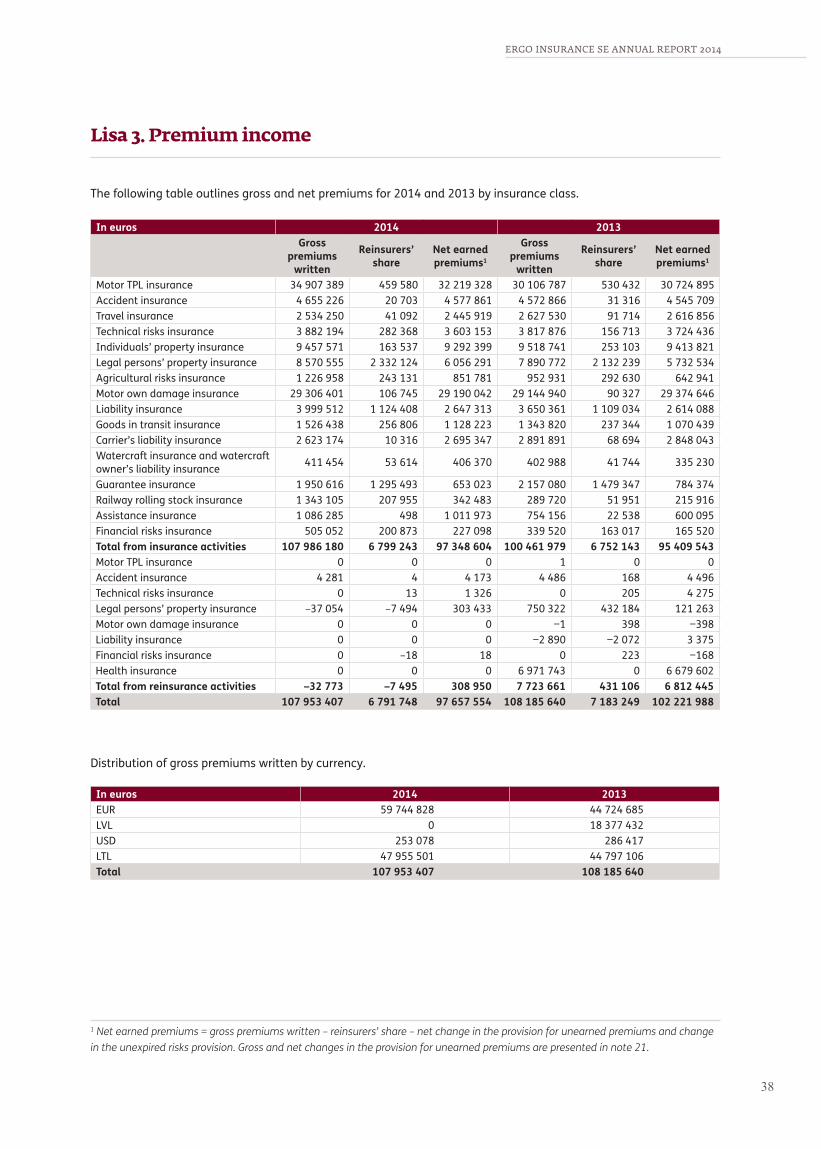
ERGO INSURANCE SE ANNUAL REPORT 2014
38
Lisa 3. Premium income
The following table outlines gross and net premiums for 2014 and 2013 by insurance class.
In euros 2014 2013Gross
premiums written
Reinsurers’ share
Net earned premiums1
Gross premiums
written
Reinsurers’ share
Net earned premiums1
Motor TPL insurance 34 907 389 459 580 32 219 328 30 106 787 530 432 30 724 895Accident insurance 4 655 226 20 703 4 577 861 4 572 866 31 316 4 545 709Travel insurance 2 534 250 41 092 2 445 919 2 627 530 91 714 2 616 856Technical risks insurance 3 882 194 282 368 3 603 153 3 817 876 156 713 3 724 436Individuals’ property insurance 9 457 571 163 537 9 292 399 9 518 741 253 103 9 413 821Legal persons’ property insurance 8 570 555 2 332 124 6 056 291 7 890 772 2 132 239 5 732 534Agricultural risks insurance 1 226 958 243 131 851 781 952 931 292 630 642 941Motor own damage insurance 29 306 401 106 745 29 190 042 29 144 940 90 327 29 374 646Liability insurance 3 999 512 1 124 408 2 647 313 3 650 361 1 109 034 2 614 088Goods in transit insurance 1 526 438 256 806 1 128 223 1 343 820 237 344 1 070 439Carrier’s liability insurance 2 623 174 10 316 2 695 347 2 891 891 68 694 2 848 043Watercraft insurance and watercraft owner’s liability insurance 411 454 53 614 406 370 402 988 41 744 335 230
Guarantee insurance 1 950 616 1 295 493 653 023 2 157 080 1 479 347 784 374Railway rolling stock insurance 1 343 105 207 955 342 483 289 720 51 951 215 916Assistance insurance 1 086 285 498 1 011 973 754 156 22 538 600 095Financial risks insurance 505 052 200 873 227 098 339 520 163 017 165 520Total from insurance activities 107 986 180 6 799 243 97 348 604 100 461 979 6 752 143 95 409 543Motor TPL insurance 0 0 0 1 0 0Accident insurance 4 281 4 4 173 4 486 168 4 496Technical risks insurance 0 13 1 326 0 205 4 275Legal persons’ property insurance –37 054 –7 494 303 433 750 322 432 184 121 263Motor own damage insurance 0 0 0 −1 398 −398Liability insurance 0 0 0 −2 890 −2 072 3 375Financial risks insurance 0 –18 18 0 223 −168Health insurance 0 0 0 6 971 743 0 6 679 602Total from reinsurance activities –32 773 –7 495 308 950 7 723 661 431 106 6 812 445Total 107 953 407 6 791 748 97 657 554 108 185 640 7 183 249 102 221 988
Distribution of gross premiums written by currency.
In euros 2014 2013EUR 59 744 828 44 724 685LVL 0 18 377 432USD 253 078 286 417LTL 47 955 501 44 797 106Total 107 953 407 108 185 640
1 Net earned premiums = gross premiums written – reinsurers’ share – net change in the provision for unearned premiums and change in the unexpired risks provision. Gross and net changes in the provision for unearned premiums are presented in note 21.
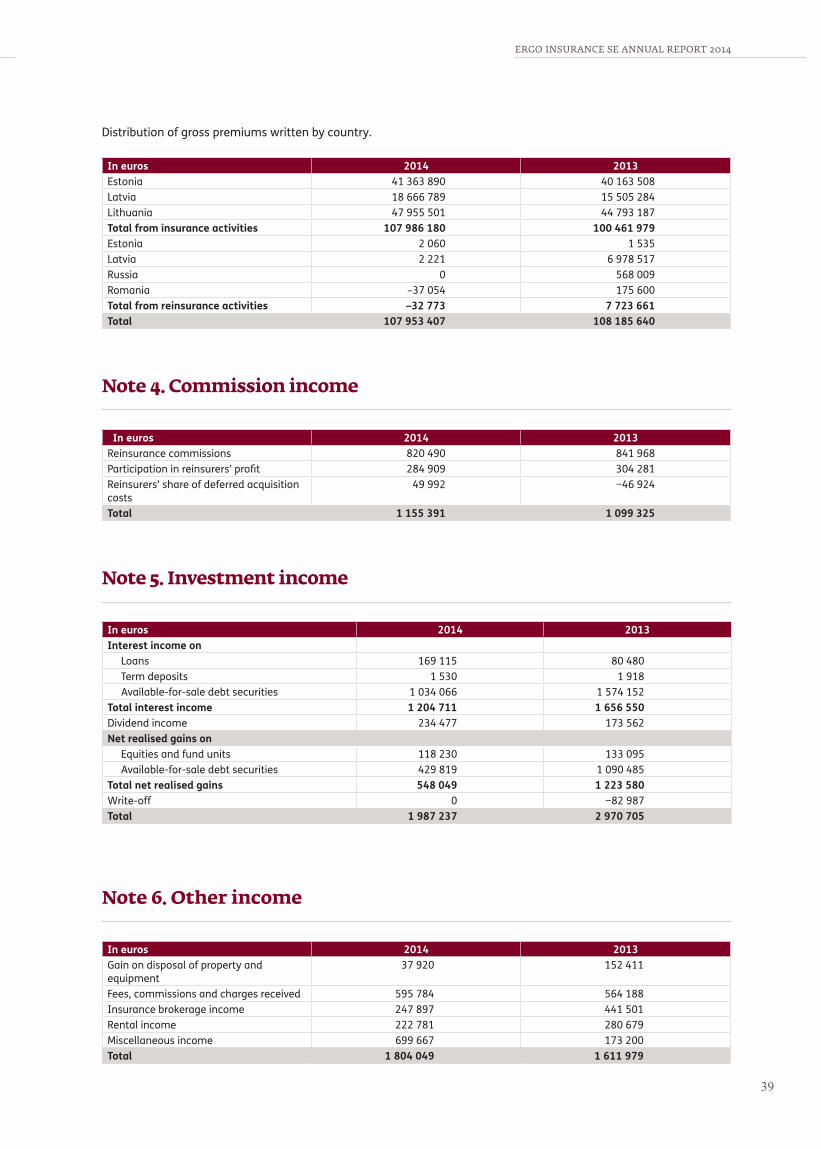
ERGO INSURANCE SE ANNUAL REPORT 2014 ERGO INSURANCE SE ANNUAL REPORT 2014
3938
Distribution of gross premiums written by country.
In euros 2014 2013Estonia 41 363 890 40 163 508Latvia 18 666 789 15 505 284Lithuania 47 955 501 44 793 187Total from insurance activities 107 986 180 100 461 979Estonia 2 060 1 535Latvia 2 221 6 978 517Russia 0 568 009Romania –37 054 175 600Total from reinsurance activities –32 773 7 723 661Total 107 953 407 108 185 640
Note 4. Commission income
In euros 2014 2013Reinsurance commissions 820 490 841 968Participation in reinsurers’ profit 284 909 304 281Reinsurers’ share of deferred acquisition costs
49 992 −46 924
Total 1 155 391 1 099 325
Note 5. Investment income
In euros 2014 2013Interest income on
Loans 169 115 80 480Term deposits 1 530 1 918Available-for-sale debt securities 1 034 066 1 574 152
Total interest income 1 204 711 1 656 550Dividend income 234 477 173 562Net realised gains on
Equities and fund units 118 230 133 095Available-for-sale debt securities 429 819 1 090 485
Total net realised gains 548 049 1 223 580Write-off 0 −82 987Total 1 987 237 2 970 705
Note 6. Other income
In euros 2014 2013Gain on disposal of property and equipment
37 920 152 411
Fees, commissions and charges received 595 784 564 188Insurance brokerage income 247 897 441 501Rental income 222 781 280 679Miscellaneous income 699 667 173 200Total 1 804 049 1 611 979
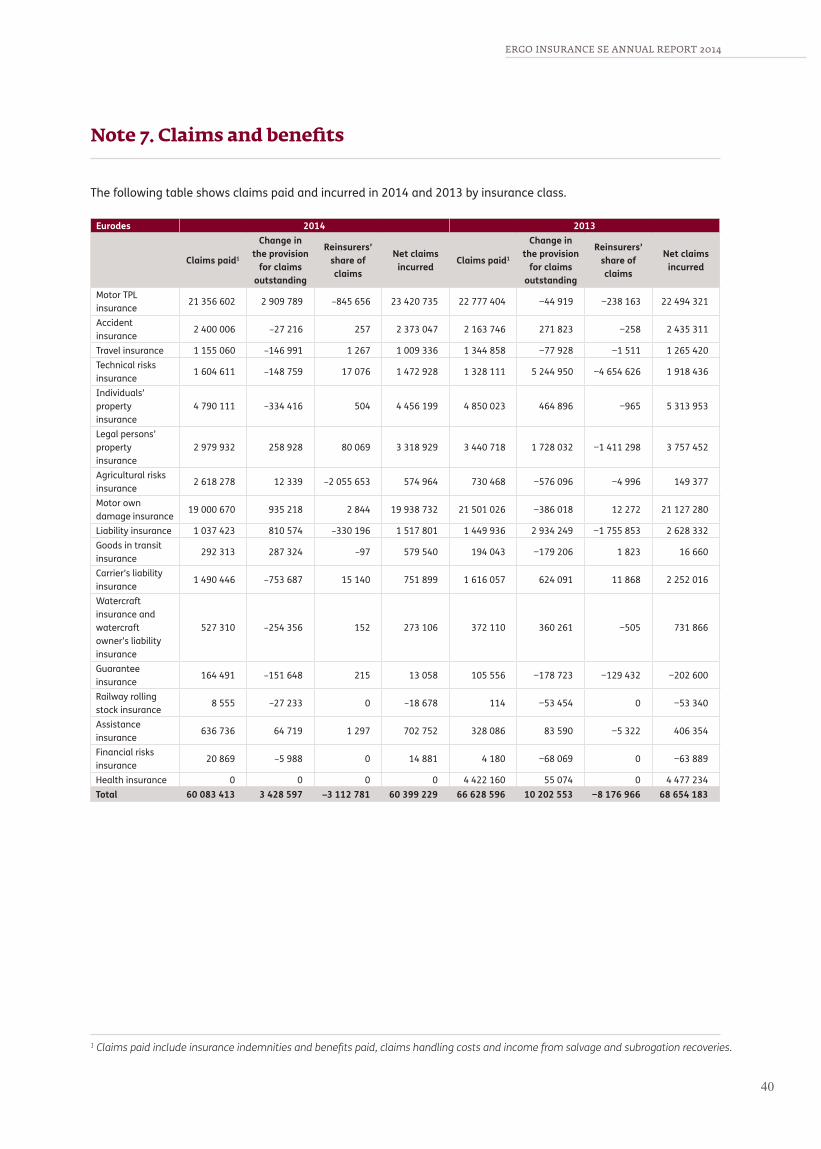
ERGO INSURANCE SE ANNUAL REPORT 2014
40
Note 7. Claims and benefits
The following table shows claims paid and incurred in 2014 and 2013 by insurance class.
Eurodes 2014 2013
Claims paid1
Change in the provision
for claims outstanding
Reinsurers’ share of claims
Net claims incurred Claims paid1
Change in the provision
for claims outstanding
Reinsurers’ share of claims
Net claims incurred
Motor TPL insurance
21 356 602 2 909 789 –845 656 23 420 735 22 777 404 −44 919 −238 163 22 494 321
Accident insurance
2 400 006 –27 216 257 2 373 047 2 163 746 271 823 −258 2 435 311
Travel insurance 1 155 060 –146 991 1 267 1 009 336 1 344 858 −77 928 −1 511 1 265 420Technical risks insurance
1 604 611 –148 759 17 076 1 472 928 1 328 111 5 244 950 −4 654 626 1 918 436
Individuals’ property insurance
4 790 111 –334 416 504 4 456 199 4 850 023 464 896 −965 5 313 953
Legal persons’ property insurance
2 979 932 258 928 80 069 3 318 929 3 440 718 1 728 032 −1 411 298 3 757 452
Agricultural risks insurance
2 618 278 12 339 –2 055 653 574 964 730 468 −576 096 −4 996 149 377
Motor own damage insurance
19 000 670 935 218 2 844 19 938 732 21 501 026 −386 018 12 272 21 127 280
Liability insurance 1 037 423 810 574 –330 196 1 517 801 1 449 936 2 934 249 −1 755 853 2 628 332Goods in transit insurance
292 313 287 324 –97 579 540 194 043 −179 206 1 823 16 660
Carrier’s liability insurance
1 490 446 –753 687 15 140 751 899 1 616 057 624 091 11 868 2 252 016
Watercraft insurance and watercraft owner’s liability insurance
527 310 –254 356 152 273 106 372 110 360 261 −505 731 866
Guarantee insurance
164 491 –151 648 215 13 058 105 556 −178 723 −129 432 −202 600
Railway rolling stock insurance
8 555 –27 233 0 –18 678 114 −53 454 0 −53 340
Assistance insurance
636 736 64 719 1 297 702 752 328 086 83 590 −5 322 406 354
Financial risks insurance
20 869 –5 988 0 14 881 4 180 −68 069 0 −63 889
Health insurance 0 0 0 0 4 422 160 55 074 0 4 477 234Total 60 083 413 3 428 597 –3 112 781 60 399 229 66 628 596 10 202 553 −8 176 966 68 654 183
1 Claims paid include insurance indemnities and benefits paid, claims handling costs and income from salvage and subrogation recoveries.
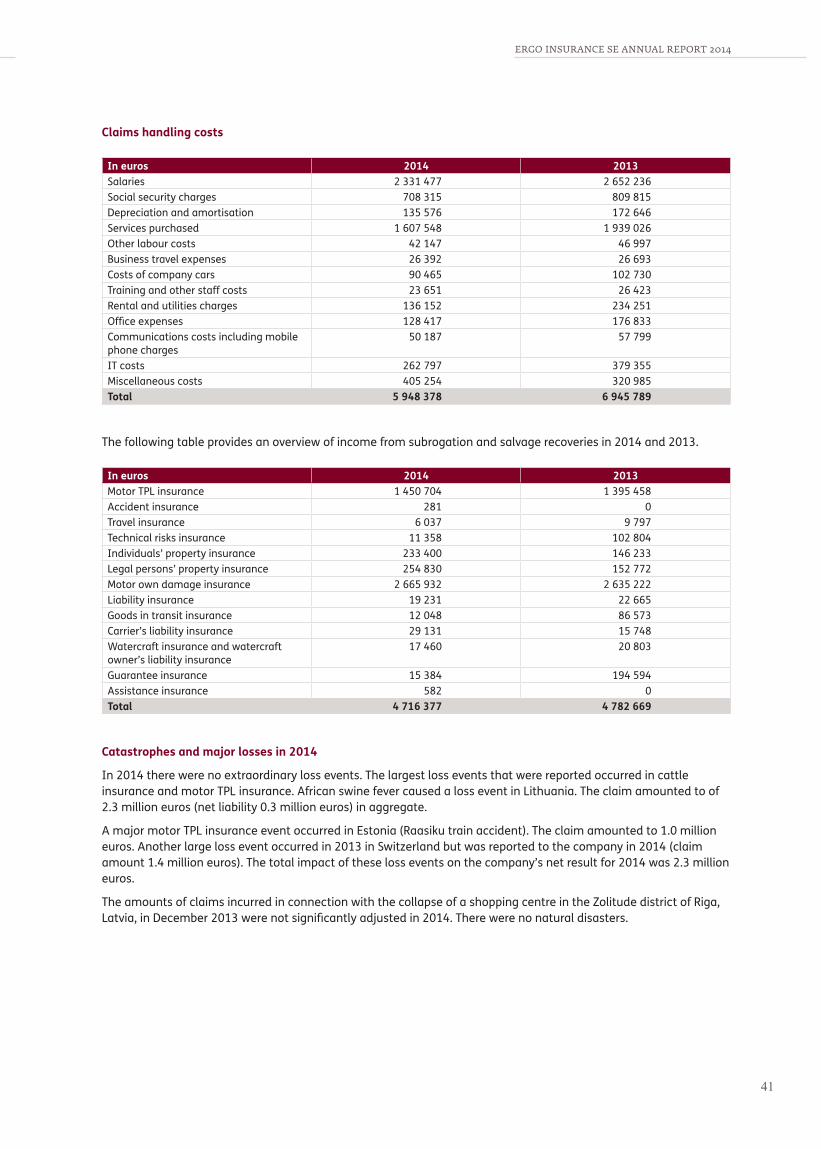
ERGO INSURANCE SE ANNUAL REPORT 2014 ERGO INSURANCE SE ANNUAL REPORT 2014
4140
Claims handling costs
In euros 2014 2013Salaries 2 331 477 2 652 236Social security charges 708 315 809 815Depreciation and amortisation 135 576 172 646Services purchased 1 607 548 1 939 026Other labour costs 42 147 46 997Business travel expenses 26 392 26 693Costs of company cars 90 465 102 730Training and other staff costs 23 651 26 423Rental and utilities charges 136 152 234 251Office expenses 128 417 176 833Communications costs including mobile phone charges
50 187 57 799
IT costs 262 797 379 355Miscellaneous costs 405 254 320 985Total 5 948 378 6 945 789
The following table provides an overview of income from subrogation and salvage recoveries in 2014 and 2013.
In euros 2014 2013 Motor TPL insurance 1 450 704 1 395 458Accident insurance 281 0Travel insurance 6 037 9 797Technical risks insurance 11 358 102 804Individuals’ property insurance 233 400 146 233Legal persons’ property insurance 254 830 152 772Motor own damage insurance 2 665 932 2 635 222Liability insurance 19 231 22 665Goods in transit insurance 12 048 86 573Carrier’s liability insurance 29 131 15 748Watercraft insurance and watercraft owner’s liability insurance
17 460 20 803
Guarantee insurance 15 384 194 594Assistance insurance 582 0Total 4 716 377 4 782 669
Catastrophes and major losses in 2014
In 2014 there were no extraordinary loss events. The largest loss events that were reported occurred in cattle insurance and motor TPL insurance. African swine fever caused a loss event in Lithuania. The claim amounted to of 2.3 million euros (net liability 0.3 million euros) in aggregate.
A major motor TPL insurance event occurred in Estonia (Raasiku train accident). The claim amounted to 1.0 million euros. Another large loss event occurred in 2013 in Switzerland but was reported to the company in 2014 (claim amount 1.4 million euros). The total impact of these loss events on the company’s net result for 2014 was 2.3 million euros.
The amounts of claims incurred in connection with the collapse of a shopping centre in the Zolitude district of Riga, Latvia, in December 2013 were not significantly adjusted in 2014. There were no natural disasters.

ERGO INSURANCE SE ANNUAL REPORT 2014
42
Note 8. Expenses
In euros Note 2014 2013Acquisition costs 30 454 173 31 508 476
Salaries 7 641 123 7 816 163Social security charges 2 894 475 2 979 626Depreciation and amortisation 1 306 710 1 012 418Service fees and commissions 11 734 262 12 539 746Change in deferred acquisition costs 11 –143 374 559 661Other labour costs 215 865 202 569Business travel expenses 133 511 128 958Costs of company cars 331 227 362 345Training and other staff costs 142 104 100 691Rental and utilities charges 1 932 749 1 994 911Office expenses 617 624 717 990Communications expenses including mobile phone charges
409 613 439 282
IT costs 1 280 416 864 601Marketing expenses 1 202 162 1 312 610Miscellaneous expenses 755 706 476 905
Administrative expenses 6 071 473 6 398 959Salaries 2 679 671 2 577 487Social security charges 747 736 787 624Depreciation and amortisation 308 977 352 379Other labour costs 143 388 289 410Business travel expenses 116 978 171 269Costs of company cars 87 233 103 344Training and other staff costs 62 576 92 679Rental and utilities charges 750 103 684 019Office expenses 101 321 175 766Communications expenses including mobile phone charges
50 296 73 410
IT costs 436 778 681 921Miscellaneous expenses 586 416 409 651
Other operating expenses 1 173 682 1 077 238Membership fee to Estonian Motor Insurance Fund 1 173 682 1 077 238
Investment expenses 340 848 341 071Salaries 117 764 81 915Social security charges 30 225 26 130Services purchased 61 771 127 935Other labour costs 2 551 3 756Business travel expenses 19 263 20 725Training and other staff costs 469 2 668Rental and utilities charges 7 675 11 566Office expenses 1 156 3 297Communications expenses including mobile phone charges
3 656 4 508
IT costs 0 2 190Other services 28 420 27 003Miscellaneous expenses 67 898 29 378
Other expenses 9 515 127 1 304 678Membership fees to Financial Supervision Authority and professional associations
322 928 109 100
Insurance brokerage expenses 91 755 295 964Audit and legal fees 254 561 55 566Loss on sale of property and equipment 9 048 34 311Write-off of intangible assets 12 8 045 888 150 202Write-off of property and equipment 10 3 563 105Finance lease interest payments 68 344Expenses related to leasing out premises 41 070 48 260State fees, stamp duties and late payment interest 0 0Miscellaneous expenses 746 246 610 826

ERGO INSURANCE SE ANNUAL REPORT 2014 ERGO INSURANCE SE ANNUAL REPORT 2014
4342
Note 9. Foreign exchange differences
In the reporting period, the net amount of foreign exchange differences recognised in the income statement excluding those arising on financial instruments at fair value through profit or loss was 175,255 euros (2013: 265,492 euros).
Note 10. Property and equipment
Property and equipment comprises tangible assets employed in the company’s activity whose useful life exceeds one year and land and buildings that are in the company’s own use. Items of property and equipment are depreciated using the straight-line method.
At 31 December 2014, the cost of fully depreciated items still in use was 5,090,186 euros (31 December 2013: 3,658,929 euros). ERGO Insurance SE does not have any items of property and equipment that are not in own use.
In euros
Asset class Land BuildingsImprovements
to leased premises
Assets being acquired with finance lease
Equipment and other
itemsTotal
CostAs at 31 December
2012 203 630 2 807 807 682 699 175 271 2 721 062 6 590 469
Business combination 1 043 644 7 874 266 0 0 4 037 551 12 955 461Additions 0 4 837 8 614 0 633 188 646 639Sales 0 –4 326 0 0 –1 821 745 –1 826 071Write-off 0 –582 568 0 –175 271 –139 191 –897 030
As at 31 December 2013 1 247 274 10 100 016 691 313 0 5 430 865 17 469 468
PrepaymentsAdditions 0 20 389 0 0 395 225 415 614Sales 0 –188 352 0 0 0 –188 352Write-off –12 0 –52 400 0 –600 269 –652 681
As at 31 December 2014 1 247 262 9 932 053 638 913 0 5 225 821 17 044 049
Accumulated depreciationAs at 31 December
2012 0 529 058 407 389 75 077 2 223 002 3 234 526
Business combination 0 1 728 634 0 0 3 504 267 5 232 901Depreciation for the year 0 237 213 57 986 6 680 472 451 774 330
Sales 0 –994 0 0 –1 724 826 –1 725 820Write-off 0 –118 749 0 –81 757 –139 191 –339 697
As at 31 December 2013 0 2 375 162 465 375 0 4 335 703 7 176 240
Depreciation for the year 0 233 095 45 393 0 387 572 666 060
Sales 0 –47 434 0 0 0 –47 434Write-off 0 0 –51 010 0 –580 545 –631 555
As at 31 December 2014 0 2 560 823 459 758 0 4 142 730 7 163 311
Carrying amountAs at 31 December
2013 1 247 274 7 724 854 225 938 0 1 095 162 10 293 228
As at 31 December 2014 1 247 262 7 371 230 179 155 0 1 083 091 9 880 738
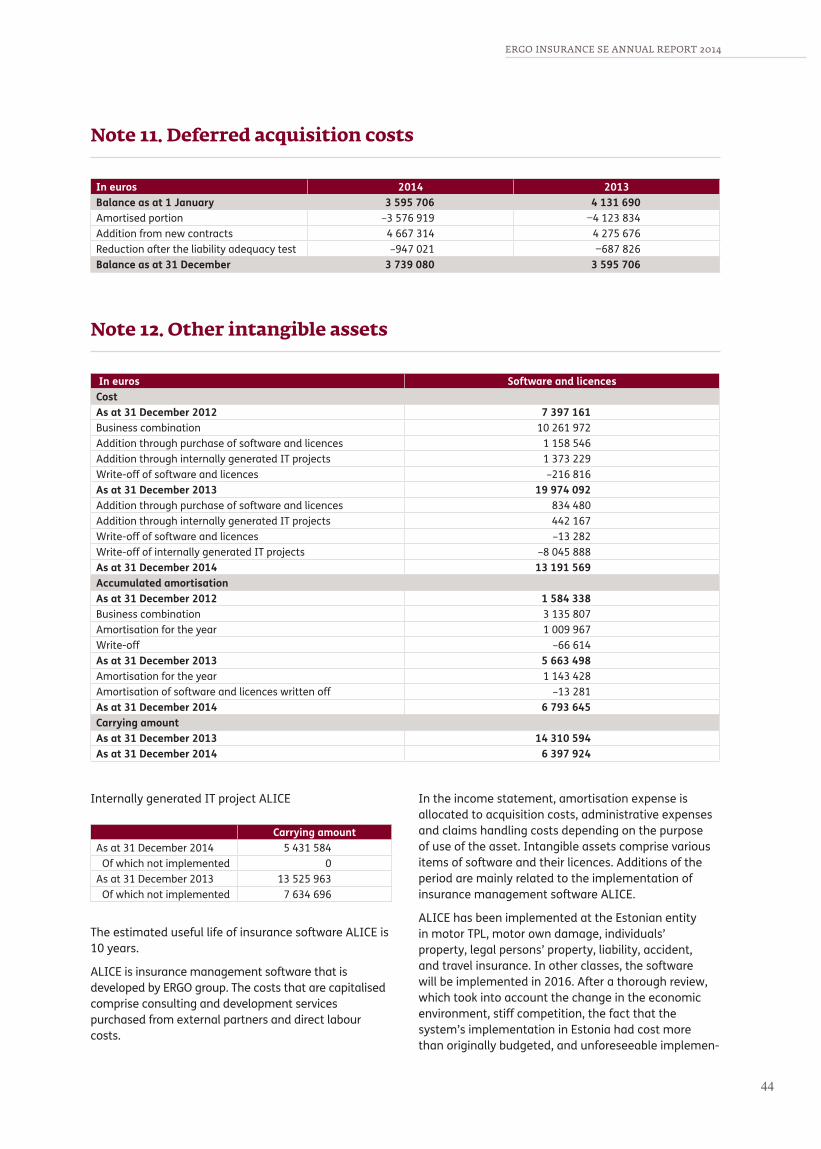
ERGO INSURANCE SE ANNUAL REPORT 2014
44
Note 11. Deferred acquisition costs
In euros 2014 2013Balance as at 1 January 3 595 706 4 131 690Amortised portion –3 576 919 −4 123 834Addition from new contracts 4 667 314 4 275 676Reduction after the liability adequacy test –947 021 −687 826Balance as at 31 December 3 739 080 3 595 706
Note 12. Other intangible assets
In euros Software and licencesCost As at 31 December 2012 7 397 161Business combination 10 261 972Addition through purchase of software and licences 1 158 546Addition through internally generated IT projects 1 373 229Write-off of software and licences –216 816As at 31 December 2013 19 974 092Addition through purchase of software and licences 834 480Addition through internally generated IT projects 442 167Write-off of software and licences –13 282Write-off of internally generated IT projects –8 045 888As at 31 December 2014 13 191 569Accumulated amortisation As at 31 December 2012 1 584 338Business combination 3 135 807Amortisation for the year 1 009 967Write-off –66 614As at 31 December 2013 5 663 498Amortisation for the year 1 143 428Amortisation of software and licences written off –13 281As at 31 December 2014 6 793 645Carrying amount As at 31 December 2013 14 310 594As at 31 December 2014 6 397 924
Internally generated IT project ALICE
Carrying amountAs at 31 December 2014 5 431 584
Of which not implemented 0As at 31 December 2013 13 525 963
Of which not implemented 7 634 696
The estimated useful life of insurance software ALICE is 10 years.
ALICE is insurance management software that is developed by ERGO group. The costs that are capitalised comprise consulting and development services purchased from external partners and direct labour costs.
In the income statement, amortisation expense is allocated to acquisition costs, administrative expenses and claims handling costs depending on the purpose of use of the asset. Intangible assets comprise various items of software and their licences. Additions of the period are mainly related to the implementation of insurance management software ALICE.
ALICE has been implemented at the Estonian entity in motor TPL, motor own damage, individuals’ property, legal persons’ property, liability, accident, and travel insurance. In other classes, the software will be implemented in 2016. After a thorough review, which took into account the change in the economic environment, stiff competition, the fact that the system’s implementation in Estonia had cost more than originally budgeted, and unforeseeable implemen-

ERGO INSURANCE SE ANNUAL REPORT 2014 ERGO INSURANCE SE ANNUAL REPORT 2014
4544
tation costs at the branches, it was decided not to implement ALICE in Latvia and Lithuania. As a result of the decision, the cost of developments of 8,045,888 euros that had cumulated in Latvia and Lithuania was written off.
No intangible assets were sold in the reporting period. At 31 December 2014, the cost of fully amortised assets still in use was 3,101,738 euros (31 December 2013: 2,877,691 euros)
Note 13. Investments in associates
On the acquisition of interests in ERGO Latvija Invest SIA and CJSC ERGO Ins. Co, ERGO Insurance SE acquired signi-ficant influence but not control over the entities. Accordingly, the investments are accounted for as investments in associates.
In euros 2014 2013 2014 2013ERGO Latvija Invest SIA CJSC ERGO Ins. Co
Ownership interest 38,00% 38,00% 35,00% 35,00%Number of shares held 1 254 1 254 6 591 6 591Nominal value of a share
1,4 euros 1 lats 1 145 370 rubles 250 000 rubles
Nominal value of investment
1 784 euros 1 254 lats 7 549 133 670 rubles 1 647 750 000 rubles
Share capital 4 696 euros 3 300 lats 21 570 753 210 rubles 4 708 250 000 rublesTotal number of shares 3 300 3 300 18 833 18 833Cost of investment 488 106 488 106 1 073 809 636 346Company’s share of investee’s equity
2 247 764 2 221 764 1 122 553 628 765
Carrying amount 2 030 096 1 963 262 1 270 484 679 391Company’s share of investee’s profit
66 834 95 506 153 630 131 490
Assets 7 738 185 7 833 912 8 687 867 7 635 483Liabilities 1 823 017 1 987 165 5 480 308 5 838 864Equity 5 915 168 5 846 747 3 207 559 1 796 619Income 965 440 1 126 473 5 488 094 5 370 678Expenses −739 065 −797 512 −4 868 352 −4 910 561Profit 175 880 251 331 438 980 375 717
On 13 October 2014, the owners decided to increase the share capital of CJSC ERGO Ins. Co by 16,862,503,210 rubles (1,250,000.24 euros). The contribution of ERGO Insurance SE amounted to 5,901,383,670 rubles or 437,463.58 euros. The par value of a share was increased from 250,000 rubles to 1,145,370 rubles. The overall number of shares and the owners’ interests remained unchanged. On 23 October 2014, ERGO Insurance SE transferred its share of the contri-bution to the share capital to the current account of CJSC ERGO Ins. Co.
Note 14. Investments in financial instruments
In euros, As at 31 December Note 2014 2013Available-for-sale financial assetsEquities and fund units 14.1 16 382 770 15 289 607Debt and other fixed-income securities 14.2 78 184 180 72 138 559Total available-for-sale financial assets 94 566 950 87 428 166Loans and receivables Loans 14.3 1 908 397 2 011 203Total loans and receivables 1 908 397 2 011 203Total 96 475 347 89 439 369
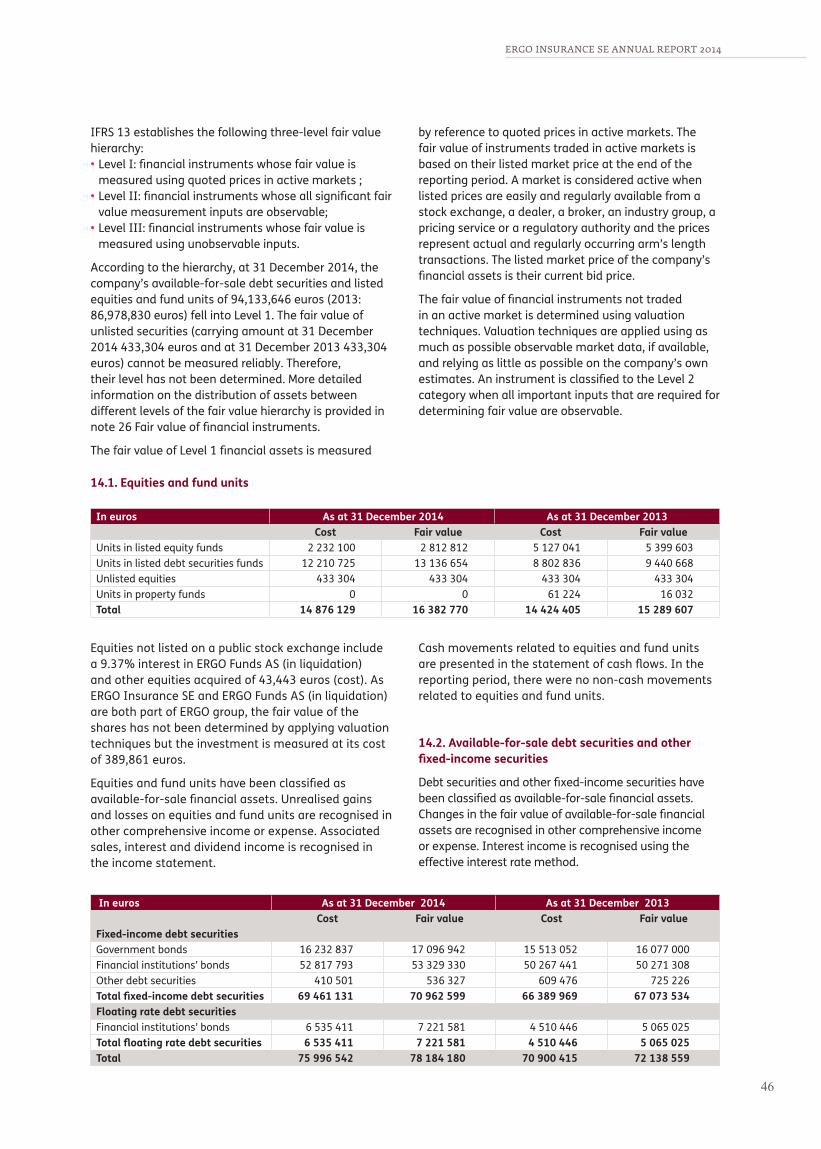
ERGO INSURANCE SE ANNUAL REPORT 2014
46
IFRS 13 establishes the following three-level fair value hierarchy:• Level I: financial instruments whose fair value is
measured using quoted prices in active markets ;• Level II: financial instruments whose all significant fair
value measurement inputs are observable;• Level III: financial instruments whose fair value is
measured using unobservable inputs.
According to the hierarchy, at 31 December 2014, the company’s available-for-sale debt securities and listed equities and fund units of 94,133,646 euros (2013: 86,978,830 euros) fell into Level 1. The fair value of unlisted securities (carrying amount at 31 December 2014 433,304 euros and at 31 December 2013 433,304 euros) cannot be measured reliably. Therefore, their level has not been determined. More detailed information on the distribution of assets between different levels of the fair value hierarchy is provided in note 26 Fair value of financial instruments.
The fair value of Level 1 financial assets is measured
by reference to quoted prices in active markets. The fair value of instruments traded in active markets is based on their listed market price at the end of the reporting period. A market is considered active when listed prices are easily and regularly available from a stock exchange, a dealer, a broker, an industry group, a pricing service or a regulatory authority and the prices represent actual and regularly occurring arm’s length transactions. The listed market price of the company’s financial assets is their current bid price.
The fair value of financial instruments not traded in an active market is determined using valuation techniques. Valuation techniques are applied using as much as possible observable market data, if available, and relying as little as possible on the company’s own estimates. An instrument is classified to the Level 2 category when all important inputs that are required for determining fair value are observable.
14.1. Equities and fund units
In euros As at 31 December 2014 As at 31 December 2013Cost Fair value Cost Fair value
Units in listed equity funds 2 232 100 2 812 812 5 127 041 5 399 603Units in listed debt securities funds 12 210 725 13 136 654 8 802 836 9 440 668Unlisted equities 433 304 433 304 433 304 433 304Units in property funds 0 0 61 224 16 032Total 14 876 129 16 382 770 14 424 405 15 289 607
Equities not listed on a public stock exchange include a 9.37% interest in ERGO Funds AS (in liquidation) and other equities acquired of 43,443 euros (cost). As ERGO Insurance SE and ERGO Funds AS (in liquidation) are both part of ERGO group, the fair value of the shares has not been determined by applying valuation techniques but the investment is measured at its cost of 389,861 euros.
Equities and fund units have been classified as available-for-sale financial assets. Unrealised gains and losses on equities and fund units are recognised in other comprehensive income or expense. Associated sales, interest and dividend income is recognised in the income statement.
Cash movements related to equities and fund units are presented in the statement of cash flows. In the reporting period, there were no non-cash movements related to equities and fund units.
14.2. Available-for-sale debt securities and other fixed-income securities
Debt securities and other fixed-income securities have been classified as available-for-sale financial assets. Changes in the fair value of available-for-sale financial assets are recognised in other comprehensive income or expense. Interest income is recognised using the effective interest rate method.
In euros As at 31 December 2014 As at 31 December 2013Cost Fair value Cost Fair value
Fixed-income debt securitiesGovernment bonds 16 232 837 17 096 942 15 513 052 16 077 000Financial institutions’ bonds 52 817 793 53 329 330 50 267 441 50 271 308Other debt securities 410 501 536 327 609 476 725 226Total fixed-income debt securities 69 461 131 70 962 599 66 389 969 67 073 534Floating rate debt securitiesFinancial institutions’ bonds 6 535 411 7 221 581 4 510 446 5 065 025Total floating rate debt securities 6 535 411 7 221 581 4 510 446 5 065 025Total 75 996 542 78 184 180 70 900 415 72 138 559

ERGO INSURANCE SE ANNUAL REPORT 2014 ERGO INSURANCE SE ANNUAL REPORT 2014
4746
Available-for-sale debt securities comprise government bonds and debt securities issued by financial institutions and companies.
The fair value of debt securities is determined by reference to the Bloomberg Generic (BGN) Prices available on the information systems of Bloomberg. Where BGN prices are not available, fair value is determined by reference to quoted market prices. If there is a broker on the market whose price quotation includes the quantity purchased, that quotation is relied on. If a quotation including the quantity purchased is not available, one without quantity is used. If a debt security does not have a listed price, valuation models
are applied. If the models cannot be used or it would be impracticable, the security is measured at cost. At 31 December 2014, the portfolio did not include any debt securities measured at cost.
Cash movements related to available-for-sale debt securities are presented in the statement of cash flows. In the reporting period, there were no non-cash movements related to available-for-sale debt securities.
14.3. Loans
Other loans by maturity.
In euros As at 31 December 2014 As at 31 December 2013One to six months 8 397 11 203Total 8 397 11 203
Mortgage loans by maturity.
In euros As at 31 December 2014 As at 31 December 2013Three to four years 600 000 600 000More than five years 1 300 000 1 400 000Total 1 900 000 2 000 000
At 31 December 2014, ERGO Insurance SE’s statement of financial position included a mortgage loan of 1,300,000 euros (31 December 2013: 1,400,000 euros) provided to CJSC ERGO Ins. Co at 10.1% interest
per year and a mortgage loan of 600,000 euros (31 December 2013: 600,000 euros) provided to ERGO Invest SIA at 6.3% interest per year.
Note 15. Reinsurance assets
At the reporting date, reinsurers’ share of insurance provisions was as follows.
In euros, As at 31 December 2014 2013Provision for unearned premiums 1 334 423 1 472 756
Provision for claims outstanding – claims incurred and reported 11 560 427 10 708 637 Provision for claims outstanding – IBNR 43 470 137 893 Provision for insurance pension annuities 1 696 672 1 971 134
Total provision for claims outstanding 13 300 569 12 817 664Total 14 634 993 14 290 420
Information on reinsurance assets is provided also in note 21.
Other reinsurance receivables are reported within insurance receivables (see note 16).

ERGO INSURANCE SE ANNUAL REPORT 2014
48
Reinsurance result
In euros Note 2014 2013Premiums paid to reinsurers 3 –6 791 748 −7 183 249Reinsurers’ share of the change in the provision for unearned premiums –138 333 118 208Commissions and profit participation paid by reinsurers 4 1 105 398 1 146 249Reinsurers’ share of claims paid 7 2 629 876 661 387Reinsurers’ share of the change in the provision for claims outstanding 7 482 905 7 515 579Reinsurers’ share of deferred acquisition costs 4 49 993 −46 924Total –2 661 909 2 211 250
Note 16. Insurance and other receivables
In euros, As at 31 December 2014 2013Receivables from policyholders 10 240 163 9 830 774Receivables from brokers and other intermediaries 1 029 540 727 867Receivables from reinsurers 715 825 5 759 931Receivables from holders of reinsurance policies 0 0Subrogation and salvage receivables 305 127 242 803Total insurance receivables 12 290 655 16 561 375Other receivables 1 231 811 649 141Accrued income – interest receivable 11 180 7 438Total other financial assets 13 533 646 17 217 954Prepaid taxes 20 885 765 948Prepaid expenses 1 137 968 1 565 536Total non-financial assets 1 158 853 2 331 484Total 14 692 499 19 549 438
Note 17. Cash and cash equivalents
The balance of cash and cash equivalents consists of demand deposits with banks.
In euros, As at 31 December 2014 2013Demand deposits 7 555 104 5 370 697Total 7 555 104 5 370 697
Cash and cash equivalents by original currency.
As at 31 December 2014 2013EUR 5 542 253 2 096 844USD 119 938 160 479LVL 0 308 188LTL 6 609 411 9 383 815PLN 0 20
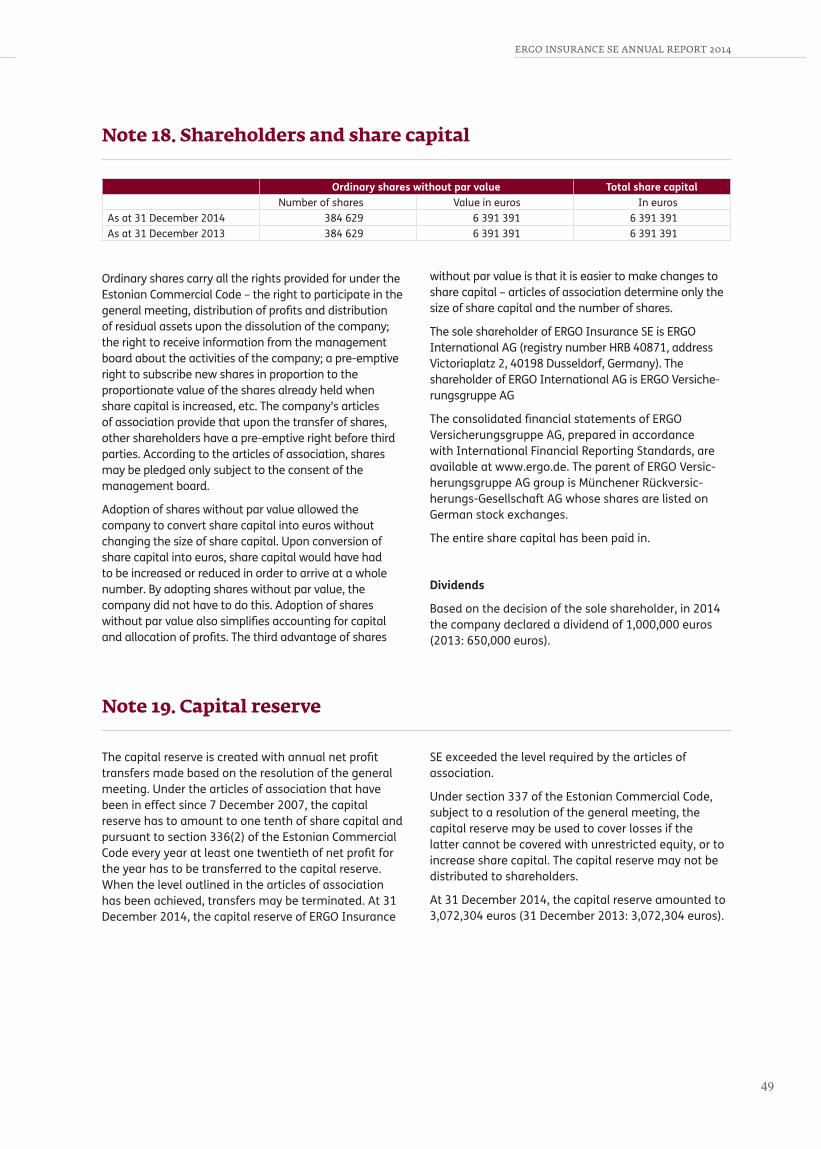
ERGO INSURANCE SE ANNUAL REPORT 2014 ERGO INSURANCE SE ANNUAL REPORT 2014
4948
Note 18. Shareholders and share capital
Ordinary shares without par value Total share capitalNumber of shares Value in euros In euros
As at 31 December 2014 384 629 6 391 391 6 391 391As at 31 December 2013 384 629 6 391 391 6 391 391
Ordinary shares carry all the rights provided for under the Estonian Commercial Code – the right to participate in the general meeting, distribution of profits and distribution of residual assets upon the dissolution of the company; the right to receive information from the management board about the activities of the company; a pre-emptive right to subscribe new shares in proportion to the proportionate value of the shares already held when share capital is increased, etc. The company’s articles of association provide that upon the transfer of shares, other shareholders have a pre-emptive right before third parties. According to the articles of association, shares may be pledged only subject to the consent of the management board.
Adoption of shares without par value allowed the company to convert share capital into euros without changing the size of share capital. Upon conversion of share capital into euros, share capital would have had to be increased or reduced in order to arrive at a whole number. By adopting shares without par value, the company did not have to do this. Adoption of shares without par value also simplifies accounting for capital and allocation of profits. The third advantage of shares
without par value is that it is easier to make changes to share capital – articles of association determine only the size of share capital and the number of shares.
The sole shareholder of ERGO Insurance SE is ERGO International AG (registry number HRB 40871, address Victoriaplatz 2, 40198 Dusseldorf, Germany). The shareholder of ERGO International AG is ERGO Versiche-rungsgruppe AG
The consolidated financial statements of ERGO Versicherungsgruppe AG, prepared in accordance with International Financial Reporting Standards, are available at www.ergo.de. The parent of ERGO Versic-herungsgruppe AG group is Münchener Rückversic-herungs-Gesellschaft AG whose shares are listed on German stock exchanges.
The entire share capital has been paid in.
Dividends
Based on the decision of the sole shareholder, in 2014 the company declared a dividend of 1,000,000 euros (2013: 650,000 euros).
Note 19. Capital reserve
The capital reserve is created with annual net profit transfers made based on the resolution of the general meeting. Under the articles of association that have been in effect since 7 December 2007, the capital reserve has to amount to one tenth of share capital and pursuant to section 336(2) of the Estonian Commercial Code every year at least one twentieth of net profit for the year has to be transferred to the capital reserve. When the level outlined in the articles of association has been achieved, transfers may be terminated. At 31 December 2014, the capital reserve of ERGO Insurance
SE exceeded the level required by the articles of association.
Under section 337 of the Estonian Commercial Code, subject to a resolution of the general meeting, the capital reserve may be used to cover losses if the latter cannot be covered with unrestricted equity, or to increase share capital. The capital reserve may not be distributed to shareholders.
At 31 December 2014, the capital reserve amounted to 3,072,304 euros (31 December 2013: 3,072,304 euros).
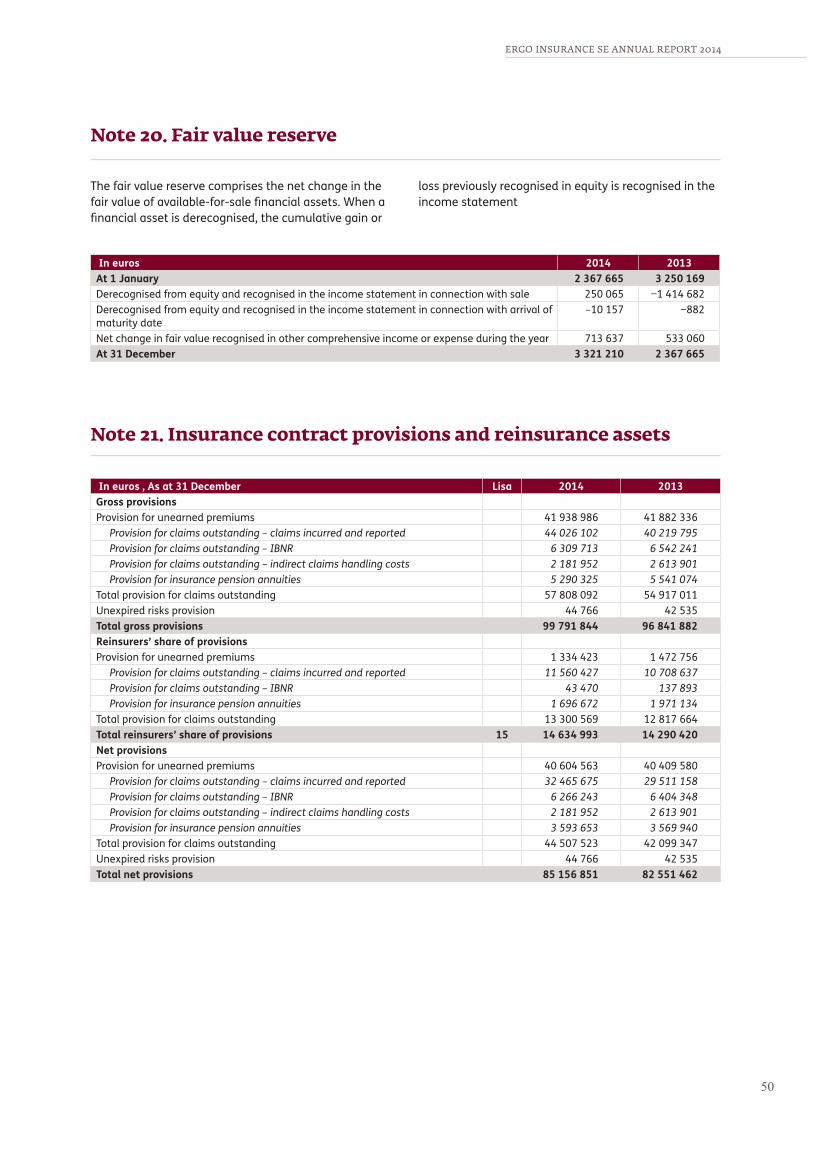
ERGO INSURANCE SE ANNUAL REPORT 2014
50
Note 20. Fair value reserve
Note 21. Insurance contract provisions and reinsurance assets
In euros , As at 31 December Lisa 2014 2013Gross provisionsProvision for unearned premiums 41 938 986 41 882 336
Provision for claims outstanding – claims incurred and reported 44 026 102 40 219 795Provision for claims outstanding – IBNR 6 309 713 6 542 241Provision for claims outstanding – indirect claims handling costs 2 181 952 2 613 901Provision for insurance pension annuities 5 290 325 5 541 074
Total provision for claims outstanding 57 808 092 54 917 011Unexpired risks provision 44 766 42 535Total gross provisions 99 791 844 96 841 882Reinsurers’ share of provisionsProvision for unearned premiums 1 334 423 1 472 756
Provision for claims outstanding – claims incurred and reported 11 560 427 10 708 637Provision for claims outstanding – IBNR 43 470 137 893Provision for insurance pension annuities 1 696 672 1 971 134
Total provision for claims outstanding 13 300 569 12 817 664Total reinsurers’ share of provisions 15 14 634 993 14 290 420Net provisionsProvision for unearned premiums 40 604 563 40 409 580
Provision for claims outstanding – claims incurred and reported 32 465 675 29 511 158Provision for claims outstanding – IBNR 6 266 243 6 404 348Provision for claims outstanding – indirect claims handling costs 2 181 952 2 613 901Provision for insurance pension annuities 3 593 653 3 569 940
Total provision for claims outstanding 44 507 523 42 099 347Unexpired risks provision 44 766 42 535Total net provisions 85 156 851 82 551 462
The fair value reserve comprises the net change in the fair value of available-for-sale financial assets. When a financial asset is derecognised, the cumulative gain or
loss previously recognised in equity is recognised in the income statement
In euros 2014 2013At 1 January 2 367 665 3 250 169Derecognised from equity and recognised in the income statement in connection with sale 250 065 −1 414 682Derecognised from equity and recognised in the income statement in connection with arrival of maturity date
–10 157 −882
Net change in fair value recognised in other comprehensive income or expense during the year 713 637 533 060At 31 December 3 321 210 2 367 665
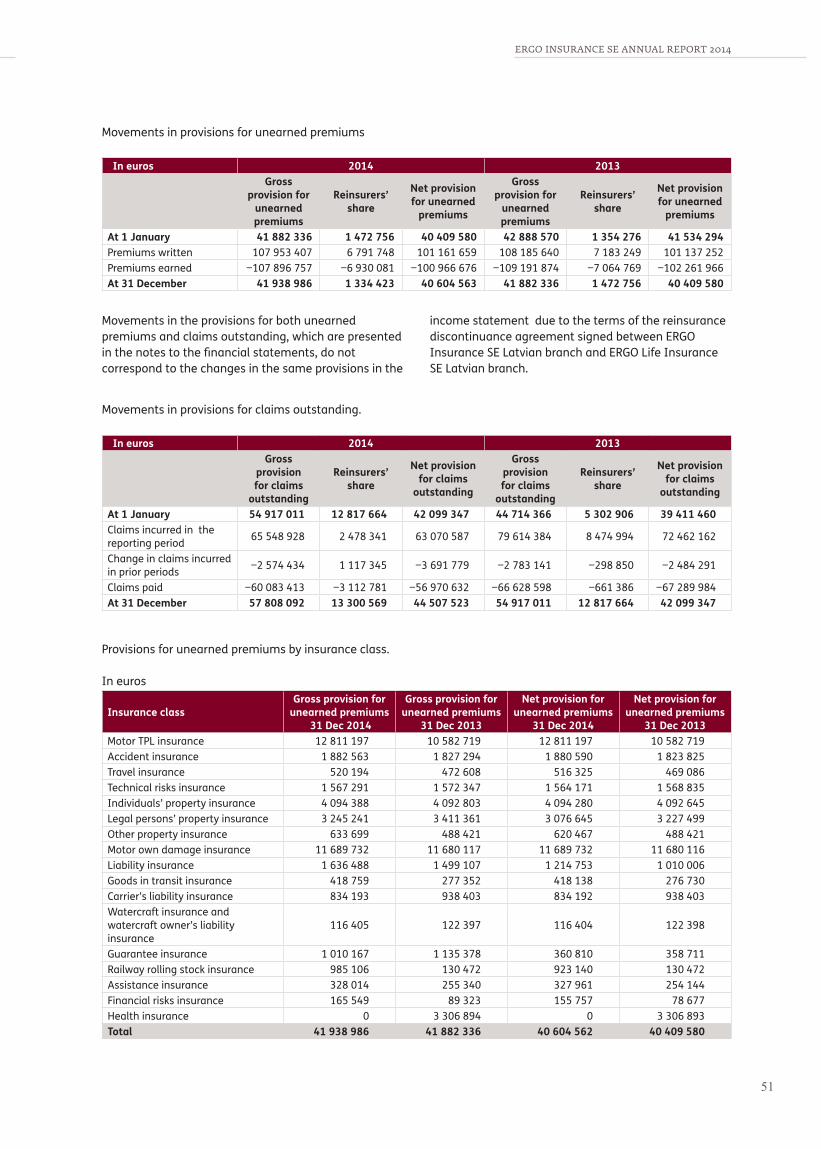
ERGO INSURANCE SE ANNUAL REPORT 2014 ERGO INSURANCE SE ANNUAL REPORT 2014
5150
Movements in provisions for unearned premiums
In euros 2014 2013
Gross provision for
unearned premiums
Reinsurers’ share
Net provision for unearned
premiums
Gross provision for
unearned premiums
Reinsurers’ share
Net provision for unearned
premiums
At 1 January 41 882 336 1 472 756 40 409 580 42 888 570 1 354 276 41 534 294Premiums written 107 953 407 6 791 748 101 161 659 108 185 640 7 183 249 101 137 252Premiums earned −107 896 757 −6 930 081 −100 966 676 −109 191 874 −7 064 769 −102 261 966At 31 December 41 938 986 1 334 423 40 604 563 41 882 336 1 472 756 40 409 580
Movements in provisions for claims outstanding.
In euros 2014 2013
Gross provision for claims
outstanding
Reinsurers’ share
Net provision for claims
outstanding
Gross provision for claims
outstanding
Reinsurers’ share
Net provision for claims
outstanding
At 1 January 54 917 011 12 817 664 42 099 347 44 714 366 5 302 906 39 411 460Claims incurred in the reporting period 65 548 928 2 478 341 63 070 587 79 614 384 8 474 994 72 462 162
Change in claims incurred in prior periods −2 574 434 1 117 345 −3 691 779 −2 783 141 −298 850 −2 484 291
Claims paid −60 083 413 −3 112 781 −56 970 632 −66 628 598 −661 386 −67 289 984At 31 December 57 808 092 13 300 569 44 507 523 54 917 011 12 817 664 42 099 347
Provisions for unearned premiums by insurance class.
In euros
Insurance classGross provision for
unearned premiums 31 Dec 2014
Gross provision for unearned premiums
31 Dec 2013
Net provision for unearned premiums
31 Dec 2014
Net provision for unearned premiums
31 Dec 2013Motor TPL insurance 12 811 197 10 582 719 12 811 197 10 582 719Accident insurance 1 882 563 1 827 294 1 880 590 1 823 825Travel insurance 520 194 472 608 516 325 469 086Technical risks insurance 1 567 291 1 572 347 1 564 171 1 568 835Individuals’ property insurance 4 094 388 4 092 803 4 094 280 4 092 645Legal persons’ property insurance 3 245 241 3 411 361 3 076 645 3 227 499Other property insurance 633 699 488 421 620 467 488 421Motor own damage insurance 11 689 732 11 680 117 11 689 732 11 680 116Liability insurance 1 636 488 1 499 107 1 214 753 1 010 006Goods in transit insurance 418 759 277 352 418 138 276 730Carrier’s liability insurance 834 193 938 403 834 192 938 403Watercraft insurance and watercraft owner’s liability insurance
116 405 122 397 116 404 122 398
Guarantee insurance 1 010 167 1 135 378 360 810 358 711Railway rolling stock insurance 985 106 130 472 923 140 130 472Assistance insurance 328 014 255 340 327 961 254 144Financial risks insurance 165 549 89 323 155 757 78 677Health insurance 0 3 306 894 0 3 306 893Total 41 938 986 41 882 336 40 604 562 40 409 580
Movements in the provisions for both unearned premiums and claims outstanding, which are presented in the notes to the financial statements, do not correspond to the changes in the same provisions in the
income statement due to the terms of the reinsurance discontinuance agreement signed between ERGO Insurance SE Latvian branch and ERGO Life Insurance SE Latvian branch.

ERGO INSURANCE SE ANNUAL REPORT 2014
52
Provisions for claims outstanding by insurance class.
In euros
Insurance class
Gross provision for claims
outstanding 31 Dec 2014
Gross provision for claims
outstanding31 Dec 2013
Net provision for claims
outstanding31 Dec 2014
Net provision for claims
outstanding31 Dec 2013
Motor TPL insurance 28 589 714 25 680 665 24 059 934 21 631 512Accident insurance 1 005 762 1 032 980 1 005 763 1 032 722Travel insurance 460 432 607 423 459 933 605 489Technical risks insurance 5 784 660 5 933 417 1 147 110 1 278 792Individuals’ property insurance 2 310 585 2 645 001 2 310 585 2 644 496Legal persons’ property insurance 4 347 848 4 088 920 2 869 469 2 439 431Other property insurance 63 075 50 736 63 075 50 736Motor own damage insurance 5 733 716 4 797 757 5 733 716 4 797 757Liability insurance 6 028 687 5 218 113 3 815 348 3 262 829Goods in transit insurance 516 486 229 162 502 320 207 821Carrier’s liability insurance 1 801 439 2 555 126 1 761 627 2 496 053Watercraft insurance and watercraft owner’s liability insurance 317 644 572 000 317 644 571 848
Guarantee insurance 638 241 789 889 251 195 365 911Railway rolling stock insurance 9 221 36 455 9 221 36 455Assistance insurance 195 954 131 235 195 955 129 360Financial risks insurance 4 628 10 617 4 628 10 617Health insurance 0 537 515 0 537 515Total 57 808 092 54 917 011 44 507 523 42 099 347
In motor TPL insurance, the provision for claims outstanding includes the provision for insurance pension annuities. At 31 December 2014, annuity claim
Unexpired risks provision
In accordance with the company’s accounting policies, the adequacy of insurance provisions has to be tested with a liability adequacy test. Where the test indicates a shortfall in provisions, the company has to first reduce deferred acquisition costs and then, if necessary, create an additional provision for unexpired risks. The liability adequacy test performed as at 31 December 2014 indicated that the provisions made for some classes of insurance were not adequate to cover ERGO Insurance
files were open for 155 persons: 107 in Estonia, 34 in Latvia and 11 in Lithuania.
SE’s obligations in these classes. Based on the test results, deferred acquisition costs were reduced by 947,021 euros and the company recognised an additional unexpired risks provision of 44,764 euros (see note 2.1). The company’s action plan foresees increasing the proportion of property insurance classes in order to balance the portfolio structure and reduce reliance on a single insurance class. The company also reviews its expense structure on a regular basis and has set itself the target to consistently lower the expense ratio in the next few years.
The following table shows pension annuity provisions by years of claim incurrence.
In euros Year of incurrence
2014 2013 2012 2011 2010 2009and earlier Total
Gross provision for pension annuities 79 300 510 132 192 635 131 748 261 239 4 115 271 5 290 325
Net provision for pension annuities 79 300 510 132 192 635 131 748 261 239 2 418 599 3 593 653
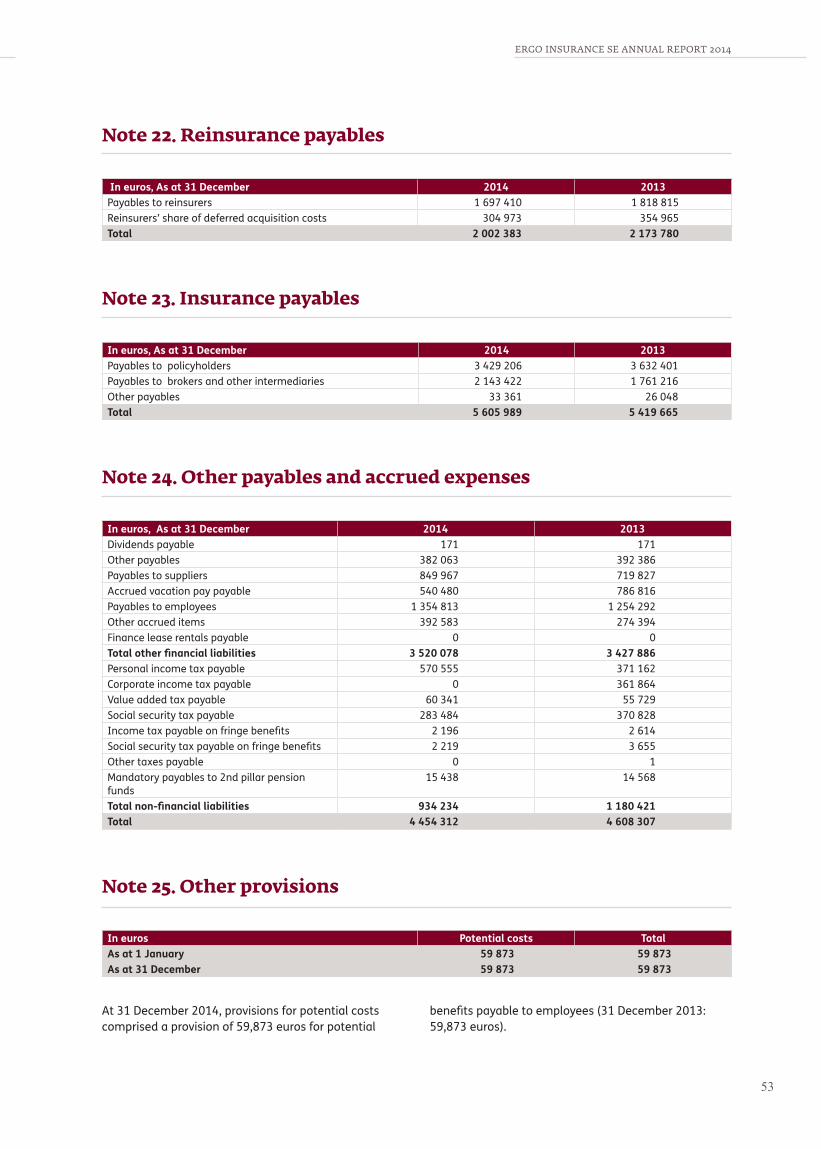
ERGO INSURANCE SE ANNUAL REPORT 2014 ERGO INSURANCE SE ANNUAL REPORT 2014
5352
Note 22. Reinsurance payables
In euros, As at 31 December 2014 2013Payables to reinsurers 1 697 410 1 818 815Reinsurers’ share of deferred acquisition costs 304 973 354 965Total 2 002 383 2 173 780
Note 23. Insurance payables
In euros, As at 31 December 2014 2013Payables to policyholders 3 429 206 3 632 401Payables to brokers and other intermediaries 2 143 422 1 761 216Other payables 33 361 26 048Total 5 605 989 5 419 665
Note 24. Other payables and accrued expenses
In euros, As at 31 December 2014 2013Dividends payable 171 171Other payables 382 063 392 386Payables to suppliers 849 967 719 827Accrued vacation pay payable 540 480 786 816Payables to employees 1 354 813 1 254 292Other accrued items 392 583 274 394Finance lease rentals payable 0 0Total other financial liabilities 3 520 078 3 427 886Personal income tax payable 570 555 371 162Corporate income tax payable 0 361 864Value added tax payable 60 341 55 729Social security tax payable 283 484 370 828Income tax payable on fringe benefits 2 196 2 614Social security tax payable on fringe benefits 2 219 3 655Other taxes payable 0 1Mandatory payables to 2nd pillar pension funds
15 438 14 568
Total non-financial liabilities 934 234 1 180 421Total 4 454 312 4 608 307
Note 25. Other provisions
In euros Potential costs TotalAs at 1 January 59 873 59 873As at 31 December 59 873 59 873
At 31 December 2014, provisions for potential costs comprised a provision of 59,873 euros for potential
benefits payable to employees (31 December 2013: 59,873 euros).
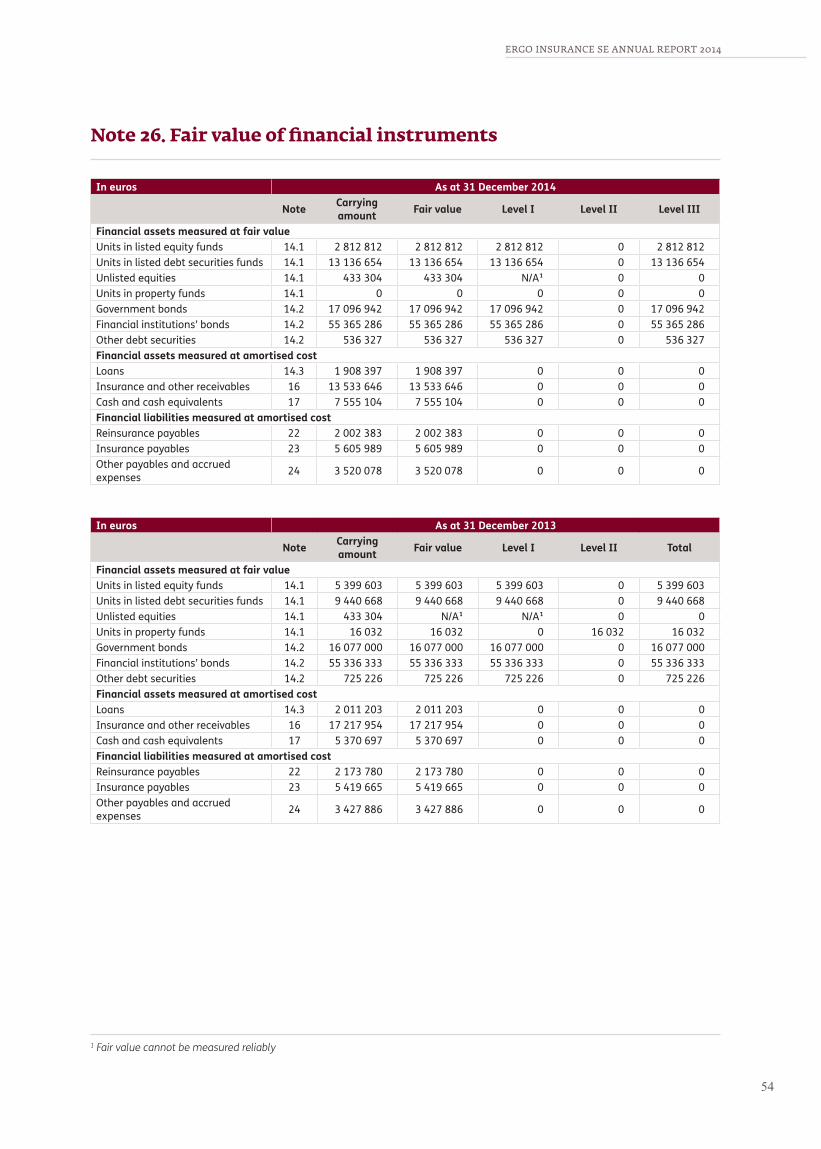
ERGO INSURANCE SE ANNUAL REPORT 2014
54
Note 26. Fair value of financial instruments
In euros As at 31 December 2014
Note Carrying amount Fair value Level I Level II Level III
Financial assets measured at fair valueUnits in listed equity funds 14.1 2 812 812 2 812 812 2 812 812 0 2 812 812Units in listed debt securities funds 14.1 13 136 654 13 136 654 13 136 654 0 13 136 654Unlisted equities 14.1 433 304 433 304 N/A¹ 0 0Units in property funds 14.1 0 0 0 0 0Government bonds 14.2 17 096 942 17 096 942 17 096 942 0 17 096 942Financial institutions’ bonds 14.2 55 365 286 55 365 286 55 365 286 0 55 365 286Other debt securities 14.2 536 327 536 327 536 327 0 536 327Financial assets measured at amortised costLoans 14.3 1 908 397 1 908 397 0 0 0Insurance and other receivables 16 13 533 646 13 533 646 0 0 0Cash and cash equivalents 17 7 555 104 7 555 104 0 0 0Financial liabilities measured at amortised costReinsurance payables 22 2 002 383 2 002 383 0 0 0Insurance payables 23 5 605 989 5 605 989 0 0 0Other payables and accrued expenses 24 3 520 078 3 520 078 0 0 0
In euros As at 31 December 2013
Note Carrying amount Fair value Level I Level II Total
Financial assets measured at fair valueUnits in listed equity funds 14.1 5 399 603 5 399 603 5 399 603 0 5 399 603Units in listed debt securities funds 14.1 9 440 668 9 440 668 9 440 668 0 9 440 668Unlisted equities 14.1 433 304 N/A¹ N/A¹ 0 0Units in property funds 14.1 16 032 16 032 0 16 032 16 032Government bonds 14.2 16 077 000 16 077 000 16 077 000 0 16 077 000Financial institutions’ bonds 14.2 55 336 333 55 336 333 55 336 333 0 55 336 333Other debt securities 14.2 725 226 725 226 725 226 0 725 226Financial assets measured at amortised costLoans 14.3 2 011 203 2 011 203 0 0 0Insurance and other receivables 16 17 217 954 17 217 954 0 0 0Cash and cash equivalents 17 5 370 697 5 370 697 0 0 0Financial liabilities measured at amortised costReinsurance payables 22 2 173 780 2 173 780 0 0 0Insurance payables 23 5 419 665 5 419 665 0 0 0Other payables and accrued expenses 24 3 427 886 3 427 886 0 0 0
1 Fair value cannot be measured reliably
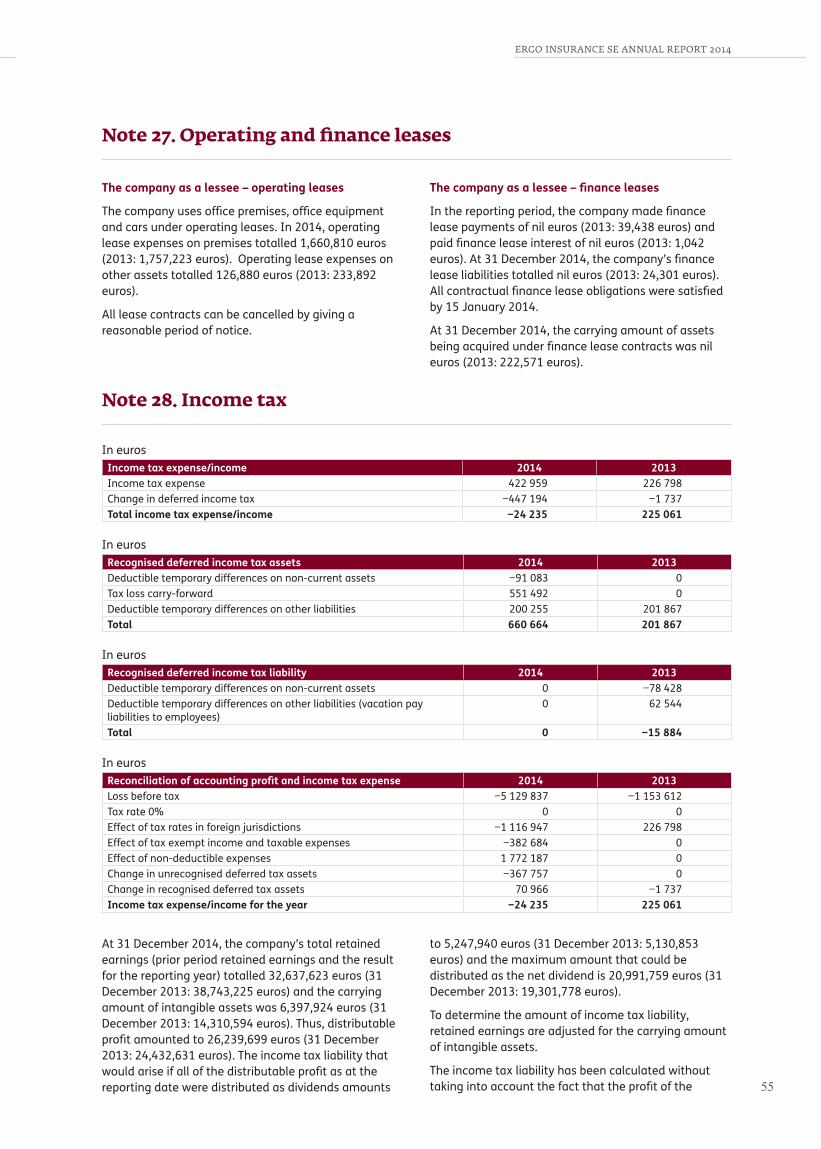
ERGO INSURANCE SE ANNUAL REPORT 2014 ERGO INSURANCE SE ANNUAL REPORT 2014
5554
Note 27. Operating and finance leases
The company as a lessee – operating leases
The company uses office premises, office equipment and cars under operating leases. In 2014, operating lease expenses on premises totalled 1,660,810 euros (2013: 1,757,223 euros). Operating lease expenses on other assets totalled 126,880 euros (2013: 233,892 euros).
All lease contracts can be cancelled by giving a reasonable period of notice.
The company as a lessee – finance leases
In the reporting period, the company made finance lease payments of nil euros (2013: 39,438 euros) and paid finance lease interest of nil euros (2013: 1,042 euros). At 31 December 2014, the company’s finance lease liabilities totalled nil euros (2013: 24,301 euros). All contractual finance lease obligations were satisfied by 15 January 2014.
At 31 December 2014, the carrying amount of assets being acquired under finance lease contracts was nil euros (2013: 222,571 euros).
Note 28. Income tax
In eurosIncome tax expense/income 2014 2013Income tax expense 422 959 226 798Change in deferred income tax −447 194 −1 737Total income tax expense/income −24 235 225 061
In eurosRecognised deferred income tax assets 2014 2013Deductible temporary differences on non-current assets −91 083 0Tax loss carry-forward 551 492 0Deductible temporary differences on other liabilities 200 255 201 867Total 660 664 201 867
In eurosRecognised deferred income tax liability 2014 2013Deductible temporary differences on non-current assets 0 −78 428Deductible temporary differences on other liabilities (vacation pay liabilities to employees)
0 62 544
Total 0 −15 884
In eurosReconciliation of accounting profit and income tax expense 2014 2013Loss before tax −5 129 837 −1 153 612Tax rate 0% 0 0Effect of tax rates in foreign jurisdictions −1 116 947 226 798Effect of tax exempt income and taxable expenses −382 684 0Effect of non-deductible expenses 1 772 187 0Change in unrecognised deferred tax assets −367 757 0Change in recognised deferred tax assets 70 966 −1 737Income tax expense/income for the year −24 235 225 061
At 31 December 2014, the company’s total retained earnings (prior period retained earnings and the result for the reporting year) totalled 32,637,623 euros (31 December 2013: 38,743,225 euros) and the carrying amount of intangible assets was 6,397,924 euros (31 December 2013: 14,310,594 euros). Thus, distributable profit amounted to 26,239,699 euros (31 December 2013: 24,432,631 euros). The income tax liability that would arise if all of the distributable profit as at the reporting date were distributed as dividends amounts
to 5,247,940 euros (31 December 2013: 5,130,853 euros) and the maximum amount that could be distributed as the net dividend is 20,991,759 euros (31 December 2013: 19,301,778 euros).
To determine the amount of income tax liability, retained earnings are adjusted for the carrying amount of intangible assets.
The income tax liability has been calculated without taking into account the fact that the profit of the
ERGO INSURANCE SE ANNUAL REPORT 2014
56
Latvian and Lithuanian entities is taxed in their domiciles when earned.
The maximum possible income tax liability has been calculated on the assumption that the net dividend and the dividend tax recognised in the income statement
for 2015 cannot exceed the company’s distributable profit as at 31 December 2014.
In the reporting period dividends were distributed from the earnings taxed at the company’s foreign branches. Therefore, no income tax on dividends was recognised.
Note 29. Transactions with related parties
The company considers parties to be related if one controls the other or exerts significant influence on the other’s operating decisions. Related parties include:
• the parent company ERGO International AG and the ultimate controlling party Münchener Rückversic-herungs-Gesellschaft AG;
• subsidiaries and associates;• other companies belonging to the same group;• members of the company’s management and
supervisory boards and individuals with a significant shareholding, except where the above cannot exert significant influence on the company’s operating decisions.
In addition, related parties include close relatives of and companies related to the above.
The remuneration, performance bonuses and benefits provided the members of the management board for the reporting period totalled 460,332 euros (2013: 452,590 euros). Members of the supervisory board did not receive any remuneration from the company.
The remuneration of a member of the management board consists of fixed remuneration and performance
benefits. Performance benefits depend on the achievement of targets and objectives that are agreed between the chairman of the supervisory board and each member of the management board before the beginning of the financial year. Payment of performance benefits is decided by the chairman of the supervisory board after the general meeting has approved the company’s results for the financial year.
When the agreed targets are not achieved, the company may decide not to pay any performance benefits. The share of maximum performance benefits in the annual income of members of the management board is considerably smaller than that of their basic remuneration. The targets that underlie provision of performance benefits include financial metrics applicable to the whole group as well as personal metrics applicable at the local level. Depending on the terms of their contracts and the circumstances of termination, members of the management board may be eligible to termination benefits for a period that may extend to the end of their term of office. Generally the term of office of members of the management board is three years.
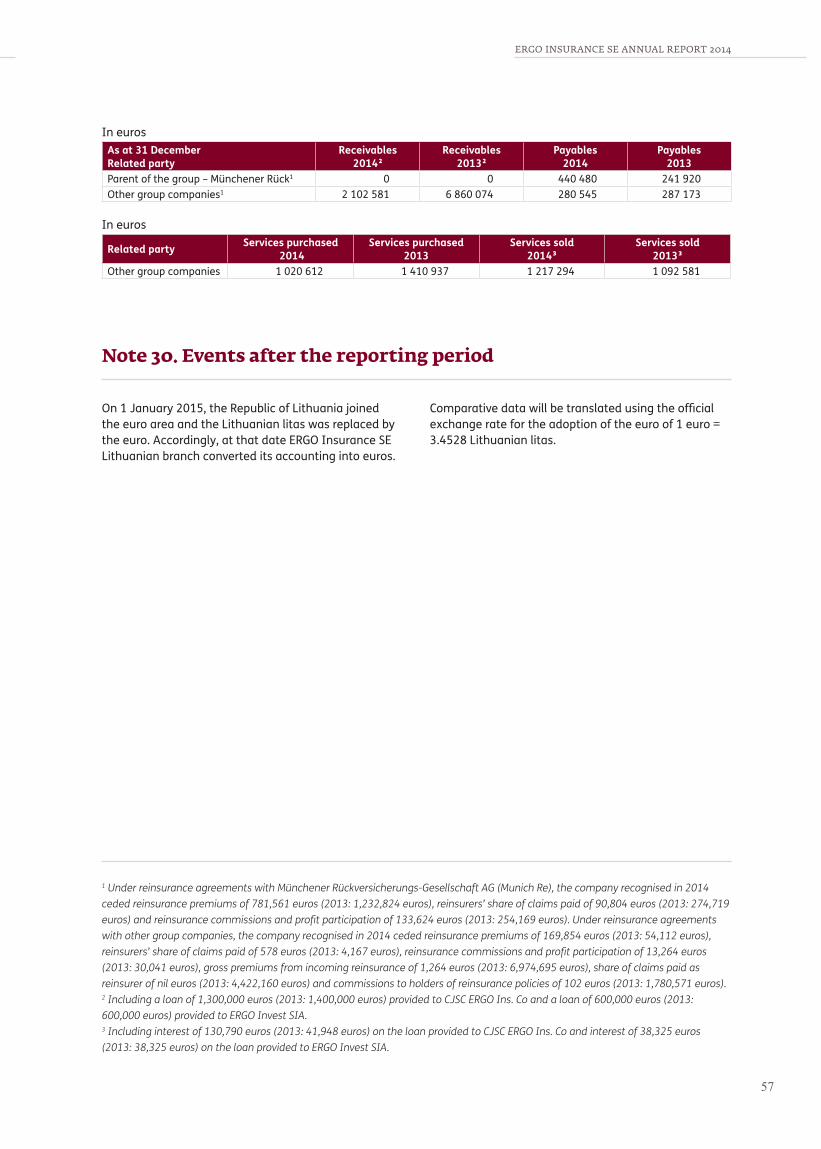
ERGO INSURANCE SE ANNUAL REPORT 2014 ERGO INSURANCE SE ANNUAL REPORT 2014
5756
In eurosAs at 31 DecemberRelated party
Receivables 2014²
Receivables 2013²
Payables 2014
Payables 2013
Parent of the group – Münchener Rück1 0 0 440 480 241 920Other group companies1 2 102 581 6 860 074 280 545 287 173
In euros
Related party Services purchased 2014
Services purchased 2013
Services sold 2014³
Services sold 2013³
Other group companies 1 020 612 1 410 937 1 217 294 1 092 581
1 Under reinsurance agreements with Münchener Rückversicherungs-Gesellschaft AG (Munich Re), the company recognised in 2014 ceded reinsurance premiums of 781,561 euros (2013: 1,232,824 euros), reinsurers’ share of claims paid of 90,804 euros (2013: 274,719 euros) and reinsurance commissions and profit participation of 133,624 euros (2013: 254,169 euros). Under reinsurance agreements with other group companies, the company recognised in 2014 ceded reinsurance premiums of 169,854 euros (2013: 54,112 euros), reinsurers’ share of claims paid of 578 euros (2013: 4,167 euros), reinsurance commissions and profit participation of 13,264 euros (2013: 30,041 euros), gross premiums from incoming reinsurance of 1,264 euros (2013: 6,974,695 euros), share of claims paid as reinsurer of nil euros (2013: 4,422,160 euros) and commissions to holders of reinsurance policies of 102 euros (2013: 1,780,571 euros).2 Including a loan of 1,300,000 euros (2013: 1,400,000 euros) provided to CJSC ERGO Ins. Co and a loan of 600,000 euros (2013: 600,000 euros) provided to ERGO Invest SIA.3 Including interest of 130,790 euros (2013: 41,948 euros) on the loan provided to CJSC ERGO Ins. Co and interest of 38,325 euros (2013: 38,325 euros) on the loan provided to ERGO Invest SIA.
Note 30. Events after the reporting period
On 1 January 2015, the Republic of Lithuania joined the euro area and the Lithuanian litas was replaced by the euro. Accordingly, at that date ERGO Insurance SE Lithuanian branch converted its accounting into euros.
Comparative data will be translated using the official exchange rate for the adoption of the euro of 1 euro = 3.4528 Lithuanian litas.
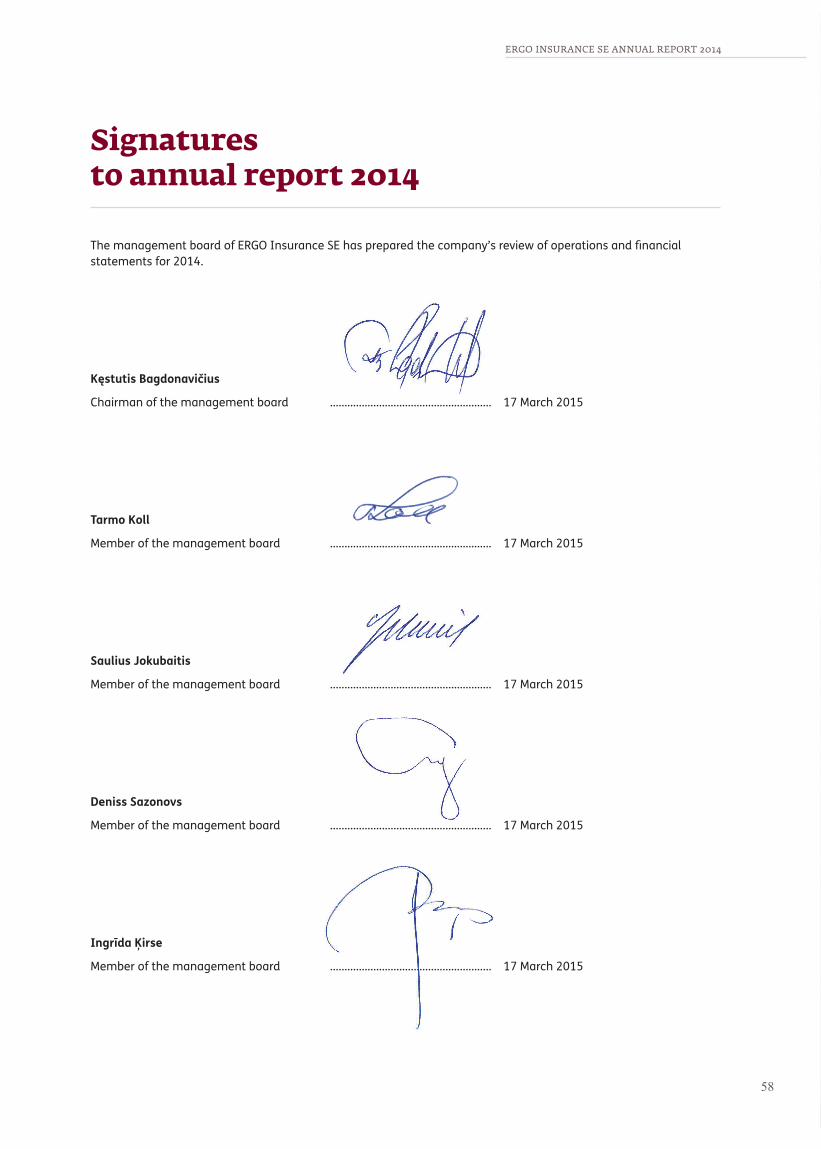
ERGO INSURANCE SE ANNUAL REPORT 2014
58
Signatures to annual report 2014
The management board of ERGO Insurance SE has prepared the company’s review of operations and financial statements for 2014.
Kęstutis Bagdonavičius
Chairman of the management board ........................................................ 17 March 2015
Tarmo Koll
Member of the management board ........................................................ 17 March 2015
Saulius Jokubaitis
Member of the management board ........................................................ 17 March 2015
Deniss Sazonovs
Member of the management board ........................................................ 17 March 2015
Ingrīda Ķirse
Member of the management board ........................................................ 17 March 2015
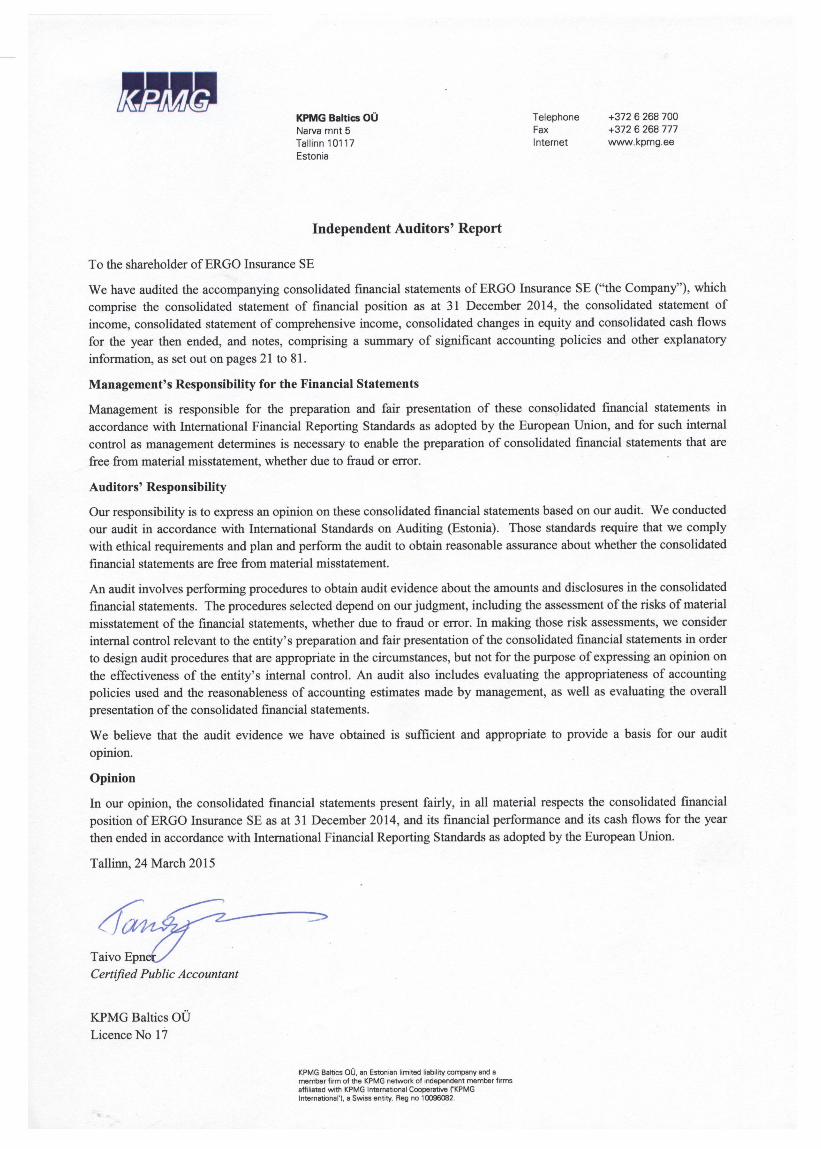
ERGO INSURANCE SE ANNUAL REPORT 2014
58

ERGO INSURANCE SE ANNUAL REPORT 2014
60
In accordance with subsections 2 and 3 of section 332 of the Estonian Commercial Code, the management board of ERGO Insurance SE makes the sole shareholder ERGO International AG a proposal that:
1) no transfers be made to the capital reserve because the capital reserve exceeds the level required by the articles of association;
2) no transfers be made to other reserves;3) the net loss for 2014 of 5,105,602 (five million one hundred and five thousand six hundred and two) euros be
transferred to retained earnings;4) the sole shareholder be paid a dividend of 1,700,000 (one million seven hundred thousand) euros;5) After the allocations, retained earnings will amount to 30,937,623 (thirty million nine hundred and thirty-seven
thousand six hundred and twenty-three) euros.
Profit allocation proposal
On behalf of the management board of ERGO Insurance SE
Kęstutis Bagdonavičius
Chairman of the management board

ERGO INSURANCE SE ANNUAL REPORT 2014 ERGO INSURANCE SE ANNUAL REPORT 2014
6160
Information on the sole shareholder
This information is presented as of 17 March 2015.
The information is disclosed in accordance with section 334(2) of the Estonian Commercial Code.
Name of sole shareholder: ERGO International Aktiengesellschaft
Legal address: Victoriaplatz 2, 40198 Düsseldorf, Germany
Registry number: HRB 40871, entered in the Commercial Register of Dusseldorf District Court, Germany.
Dates of acquisition and subscription of the shares.
1. Ordinary shares with no par value:
- 287,439 shares, 30 May 2000
- 61,550 shares, 29 May 2001
- 32,088 shares, 3 December 2001
- 65 shares, 3 June 2002
- 17 shares, 24 July 2002
- 77 shares, 10 September 2002
- 2 shares, 10 September 2002
- 62 shares, 17 September 2002
- 17 shares, 18 September 2002
- 5 shares, 2 December 2002
- 5 shares, 2 December 2002
- 865 shares, 18 November 2003
- 2 shares, 26 October 2004
- 3 shares, 2 December 2004
- 2,366 shares, 17 May 2006
- 23 shares, 24 May 2006
- 43 shares, 7 December 2007

ERGO INSURANCE SE ANNUAL REPORT 2014
62
Activities during the period 1 January 2014 – 31 December 2014 Amount
Non-life insurance (65121) 107 986 180 Reinsurance (65201) −32 773
Activities planned for the period 1 January 2015 – 31 December 2015
Non-life insurance (65121) Reinsurance (65201)
List of business activities