annual report - ekmangroup.com · annual report and consolidated financial statements 2017 ekman...
TRANSCRIPT

Annual Reportand Consolidated Financial Statements
2017
Ekman empowers global trade flows with an unrivaled combination of experience, knowledge and foresight. We strive to be an indispensable trade partner.

EKMAN ANNUAL REPORT AND CONSOLIDATED FINANCIAL STATEMENTS 2017
Annual Report and Consolidated Financial Statements for Ekman & Co AB
The Board of Directors and the CEO of Ekman & Co AB hereby submit the Annual Report and Consolidated Financial Statements for the financial year starting on Jan. 1, 2017, and ending on Dec. 31, 2017. The Annual Report is a trans lation of the original in Swedish.
Directors’ Report ....................................................................... 1Income Statements .................................................................... 4Balance Sheets ........................................................................... 5Consolidated Statements of Changes in Equity ......................... 7Cash Flow Statements ............................................................... 8Notes, common to Parent Company and Group ....................... 9Auditor’s Report ...................................................................... 23
This Annual Report includes:
This is Ekman
Ekman is a global sales and marketing organization strategically aligning buyers and sellers of forest products around the world. We make international trade easy and profitable for partners in more than 100 countries.
With global presence and local excellence, we add value throughout the business process by offering competitive purchasing, strong financial solutions and efficient logistics.
Ekman has more than 280 employees in 40 offices worldwide and handles around 4.5 million tonnes of forest products every year.

1EKMAN ANNUAL REPORT AND CONSOLIDATED FINANCIAL STATEMENTS 2017
Directors’ ReportOwnership structureEkman & Co AB is a wholly owned subsidiary of Ekman Invest Holding AB (corporate registration number 556712-1602), with its registered office in Gothenburg, which is in turn owned by the Ekman family both directly and via foundations, as well as by employees within the Ekman Group.
Nature and purpose of businessEkman & Co AB is an international trading house with business that includes selling wood pulp, paper, packag-ing, recovered materials and products within the bio-energy sector. The business is conducted through sub-sidiaries and agents in all parts of the world.
Significant events during the financial year and afterwardsAs in previous years, the demand pattern for forest products is largely driven by China. Demand in China increased significantly from 2016 to 2017 for pulp and containerboard, resulting in increased prices for both of these product groups. This was caused in part by increased
import restrictions on recovered paper, which drove up demand for pulp and increased demand for imported containerboard. In addition, domestic Chinese produc-tion is in the process of conversion to achieve greater sustainability, which is reducing domestic production temporarily. This also contributed to greater demand for imported pulp and containerboard. China’s increased import restrictions on recovered paper also caused uncer-tainty on the world market, resulting in changed trade flows and price declines for recovered materials.
In consideration of factors outside of China, pulp prices have also been driven up by a delay in the expected global production capacity expansion and unexpected down time at several pulp mills.
The Ekman Group has been well equipped to meet these changes in demand and price patterns during the year and has utilized its global organization to adapt its operations to these new conditions. The demand and price increases have also had a positive effect on the Group’s profit. All divisions increased their sales volumes in the past year.
SEK million 2017 2016 2015 2014 2013
Revenue, including agency sales 20,331 17,031 17,780 16,115 16,444Profit after financial items 82.8 52.5 78.5 62.7 72.2Net profit for the year 59.5 28.6 51.0 36.4 18.8Total assets 2,426 2,208 2,042 2,489 2,080Equity 446.2 398.7 386.2 349.5 319.5Return on equity, % 19.0 12.1 19.1 16.3 11.5Equity ratio, % 18.4 18.1 18.9 14.0 15.4Average number of employees 283 279 267 270 277
Definitions“Net profit for the year” refers to the net profit attributable to the Parent Company’s shareholder“Equity” refers to the equity attributable to the Parent Company’s shareholder “ Return on equity” is calculated as income before taxes less the share due to non-controlling interests, divided by average total equity
“Equity ratio” is calculated as total equity attributable to the Parent Company’s shareholder divided by total assets
Group five year summaryA summary of financial ratios spanning the past five years is presented below. The financial ratios for 2013 through 2017 have been impacted by the transition to the general
advice of the Swedish Accounting Standards Board (Bok-föringsnämnden) in its standard BFNAR 2012:1 Annual Reports and Consolidated Accounts (“K3”) in 2014.

2 EKMAN ANNUAL REPORT AND CONSOLIDATED FINANCIAL STATEMENTS 2017
The Group’s revenue amounted to SEK 16,003 million (SEK 12,714 million). In addition, agency sales totaled SEK 4,328 million (SEK 4,317 million). Accordingly, the Group’s total business volume was SEK 20,331 million (SEK 17,031 million). The Group’s profit after financial items totaled SEK 82.8 million, compared to SEK 52.5 million in the preceding year. During the year, the trans-action volume reached 4.6 million tons of forest products (4.3 million tons). The number of employees in the Group increased during the year from 279 in 2016 to 283 in 2017. The corresponding number for the Parent Company is 47 employees in both 2017 and 2016.
The Parent Company, Ekman & Co AB, posted a profit after financial items of SEK 86.9 million in 2017, in com-parison to SEK 37.1 million in 2016.
Sustainability disclosuresThe sustainability disclosures required to understand the Company’s growth, financial position or results of operations are published on the Company’s website, www.ekmangroup.com.
Future outlookAs in previous years, the business climate for forest products in 2018 is forecast to be dependent on the global economic trend with a focus on China and Asia in particular. The business climate for the forest indus-try is relatively strong at this time, but there is uncer-tainty concerning how long the relatively high price levels for both pulp and containerboard will hold up. The development of China’s import restrictions for recovered materials is also expected to affect prices and trade patterns for pulp, containerboard and recovered materials in 2018. We expect increased volatility in terms of both price and demand for all of the Group’s products in the coming year.
Significant risks and uncertaintiesManagement has a constant focus on minimizing various risks so as not to jeopardize the Group’s balance sheet and income statement. The most significant risks can be divided into the following categories:– Price risk– Credit risk– Interest rate risk– Currency risk
Each different risk category is described below along with measures the Group takes to limit its exposure to these risks.
Price riskThe Group’s main price risk is related to changes in the world market prices for pulp. These risks are normally managed by structuring business transactions in such a way that the effects of price changes are minimized.
Credit riskCredit risk is defined as the risk of counterparties being unable to meet their contractual obligations to the Group. Credit risks are mainly related to outstanding accounts receivable and outstanding advance payments to suppliers.
For many years, the Group has maintained a global credit insurance policy which substantially limits its expo-sure to credit risks.
The Group’s credit policy defines the measures taken to minimize its exposure to credit risks, which include busi-ness intelligence analyses, a structured procedure for assessing the credit rating of counterparties and for mak-ing credit decisions, the use of individual credit limits, the adaptation of credit terms and conditions and collection procedures.
Credit risks are divided between several different coun-terparties and are also divided geographically between many different markets, which reduces the concentration risk of the Group’s receivables.

3EKMAN ANNUAL REPORT AND CONSOLIDATED FINANCIAL STATEMENTS 2017
Interest rate riskThe Group’s interest rate risk is mainly related to out-standing accounts receivable and external borrowing. The Group’s policy is to match the terms of external borrow-ings with the average credit periods granted to customers to the greatest extent possible. Interest rate derivatives are rarely cost-effective in hedging working capital financing. Interest rate derivatives may be used for financing with long terms, such as financing for acquisitions, if the inter-est rate risk is considered substantial.
Currency riskThe Group’s business is global and exposed to currency risks via business transactions in different currencies, via assets and liabilities recognized in different currencies and via the translation of the income statements and balance sheets of foreign subsidiaries to the Group’s presentation currency. The Group’s target is to eliminate currency risks to the greatest degree possible and several processes have been implemented to ensure that this target is met on an ongoing basis. In accordance with the Group’s risk man-agement policy, currency derivatives are used to hedge transaction exposure in currencies and to hedge against imbalances in assets and liabilities in foreign currencies. Forward contracts are usually used for these hedging pur-poses. In addition, the Group actively employs various methods to minimize the net exposure in different cur-rencies between recognized assets and liabilities in foreign currencies for each Group company.
The Group also hedges exposure to currency risk in net investments in foreign subsidiaries using derivative instru-ments. The amount of the hedge is estimated quarterly, taking into account changes in net investment in different currencies.
The Group employs hedge accounting in cases where currency derivatives are used to hedge currency risks.
Proposed distribution of earningsThe following earnings are at the disposal of the Annual General Meeting:
Retained earnings 242,719,189Profit/loss for the year 74,982,978 SEK 317,702,167
The Board of Directors proposes that the following amount is to be distributed to the shareholders 19,082,316 carried forward 298,619,851 SEK 317,702,167
Subject to the approval of the Annual General Meeting, Group contributions have been paid to Ekman & Co AB’s parent company totaling SEK 688,897. Group contribu-tions totaling SEK 543,232 were paid to Ekman & Co AB’s subsidiaries.
It is the Board’s view that the proposed distribution of earnings and the proposed Group contributions will not prevent the Company from meeting its obligations in the short or long term or from completing necessary investments. Therefore, the proposed value transfer can be justified in accordance with the provisions of Article 17, Section 3, Paragraphs 2 and 3 of the Swedish Compa-nies Act (prudence rule).
In regards to the profit for the year of the Group and the Parent Company, their financial position on the reporting date as well as financing and capital utilization during the year, please refer to the following financial statements. All figures are reported in thousands of SEK unless otherwise indicated.

4 EKMAN ANNUAL REPORT AND CONSOLIDATED FINANCIAL STATEMENTS 2017
Income StatementsGroup Parent Company
Thousands of SEK Note Dec. 31, 2017 Dec. 31, 2016 Dec. 31, 2017 Dec. 31, 2016
RevenueNet sales 4, 5 15,923,216 12,645,735 4,434,315 3,280,530Other operating income 79,640 68,504 — —
16,002,856 12,714,239 4,434,315 3,280,530
Operating expensesGoods for resale 5 –14,869,496 –11,853,227 –3,989,842 –2,995,285Other external expenses 6, 7 –660,170 –472,853 –325,942 –219,420Personnel costs 8 –348,725 –299,827 –65,866 –57,777Depreciation/amortization of non-current assets 12 –11,663 –13,286 –867 –1,890Profit/loss from holdings in affiliated companies 14 –692 —Operating profit/loss 112,110 75,046 51,798 6,158
Profit/loss from financial itemsProfit/loss from holdings in Group companies 9 — — 38,211 40,786Interest income from Group companies 538 451 8,529 7,647Interest income and similar items 10 607 455 390 2,380Exchange rate effects on derivative instruments 3 — — 6,422 –5,441Interest expenses and similar items 10 –30,490 –23,429 –16,142 –11,030Interest expenses to Group companies — — –2,301 –3,445Profit/loss after financial items 82,765 52,523 86,907 37,055
AppropriationsGroup contributions received — — 290 398Group contributions paid –689 –659 –1,232 –697Profit/loss before tax 82,076 51,864 85,965 36,756
Tax on profit for the year 11 –20,930 –18,789 –10,982 248Net profit for the year 61,146 33,075 74,983 37,004
Share of net profit attributable to– The Parent Company’s shareholder 59,517 28,560– Non-controlling interests 1,628 4,515

5EKMAN ANNUAL REPORT AND CONSOLIDATED FINANCIAL STATEMENTS 2017
Balance SheetsGroup Parent Company
Thousands of SEK Note Dec. 31, 2017 Dec. 31, 2016 Dec. 31, 2017 Dec. 31, 2016
AssetsNon-current assetsIntangible assets 12Goodwill 15,868 22,262 — —Other intangible assets 771 1,766 473 1,296
16,639 24,028 473 1,296
Tangible assets 12Buildings and land 12,578 4,482 — —Machinery and equipment 20,940 26,309 1,387 1,553
33,518 30,791 1,387 1,553
Financial assetsHoldings in Group companies 13 — — 129,671 129,671Holdings in affiliated companies 14 5,898 2,037 2,037 2,037Other investments 1,267 823 60 60Deferred tax assets 15 14,953 25,544 5,430 16,413Other non-current receivables 19,438 20,576 1,826 1,439
41,556 48,980 139,024 149,620Total non-current assets 91,713 103,799 140,884 152,469
Current assetsInventoriesFinished goods and goods for resale 367,406 250,370 37,915 47,151Advance payments to suppliers 120,672 200,090 29 3,821
488,078 450,460 37,944 50,972
Current receivablesAccounts receivable 1,591,453 1,396,254 479,067 352,757Receivables from Group companies 80,883 80,744 473,852 549,100Tax receivable 2,992 5,375 2,152 2,149Other receivables 71,842 45,448 9,387 8,693Prepaid expenses and accrued income 16 49,723 62,008 31,106 38,049
1,796,893 1,589,829 995,564 950,748
Cash and bank balances 49,020 63,474 30,445 4,601Total current assets 2,333,991 2,103,763 1,063,953 1,006,321Total assets 2,425,704 2,207,562 1,204,837 1,158,790
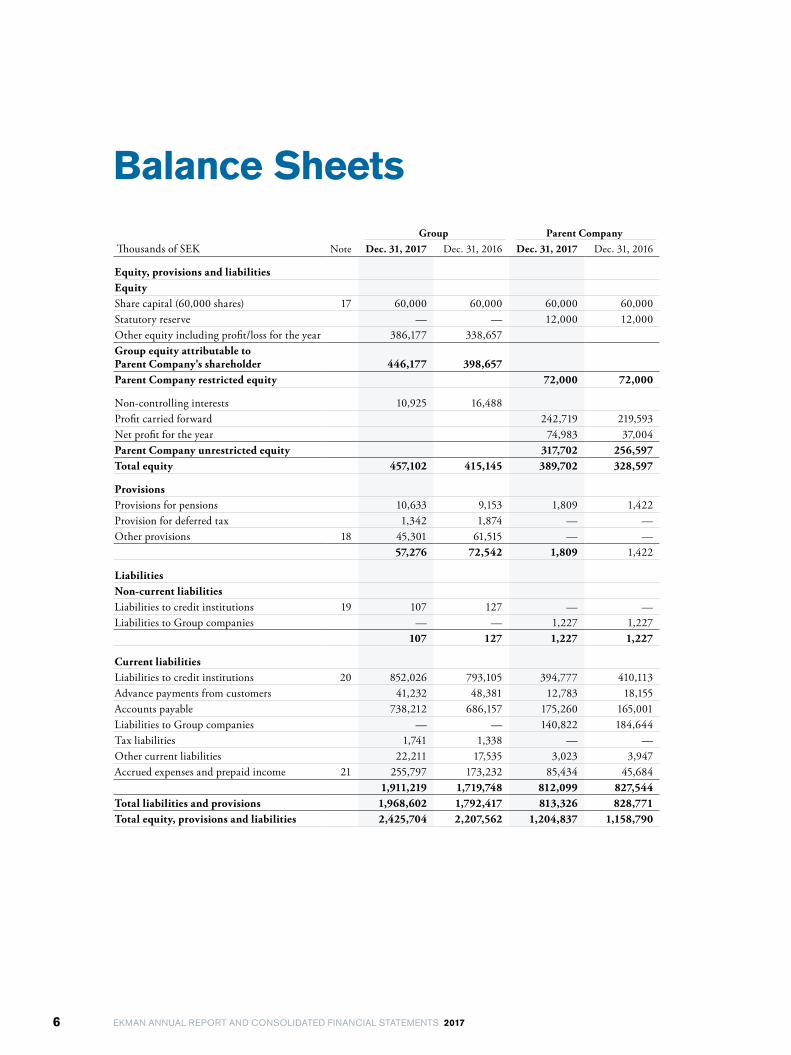
6 EKMAN ANNUAL REPORT AND CONSOLIDATED FINANCIAL STATEMENTS 2017
Group Parent CompanyThousands of SEK Note Dec. 31, 2017 Dec. 31, 2016 Dec. 31, 2017 Dec. 31, 2016
Equity, provisions and liabilitiesEquityShare capital (60,000 shares) 17 60,000 60,000 60,000 60,000Statutory reserve — — 12,000 12,000Other equity including profit/loss for the year 386,177 338,657Group equity attributable to Parent Company's shareholder 446,177 398,657Parent Company restricted equity 72,000 72,000
Non-controlling interests 10,925 16,488Profit carried forward 242,719 219,593Net profit for the year 74,983 37,004Parent Company unrestricted equity 317,702 256,597Total equity 457,102 415,145 389,702 328,597
ProvisionsProvisions for pensions 10,633 9,153 1,809 1,422Provision for deferred tax 1,342 1,874 — —Other provisions 18 45,301 61,515 — —
57,276 72,542 1,809 1,422
LiabilitiesNon-current liabilitiesLiabilities to credit institutions 19 107 127 — —Liabilities to Group companies — — 1,227 1,227
107 127 1,227 1,227
Current liabilitiesLiabilities to credit institutions 20 852,026 793,105 394,777 410,113Advance payments from customers 41,232 48,381 12,783 18,155Accounts payable 738,212 686,157 175,260 165,001Liabilities to Group companies — — 140,822 184,644Tax liabilities 1,741 1,338 — —Other current liabilities 22,211 17,535 3,023 3,947Accrued expenses and prepaid income 21 255,797 173,232 85,434 45,684
1,911,219 1,719,748 812,099 827,544Total liabilities and provisions 1,968,602 1,792,417 813,326 828,771Total equity, provisions and liabilities 2,425,704 2,207,562 1,204,837 1,158,790
Balance Sheets

7EKMAN ANNUAL REPORT AND CONSOLIDATED FINANCIAL STATEMENTS 2017
Consolidated Statement of Changes in Equity
Group Share capital
Other equity incl. profit/loss
for the year
Total equityattributable
to Parent Company’s shareholder
Non- controlling
interests Total equity
Opening balance, Jan. 1, 2016 60,000 326,166 386,166 16,053 402,219Profit/loss for the year 28,560 28,560 4,515 33,075Translation differences 411 411 1,789 2,200Total changes in value — 28,971 28,971 6,304 35,275Transactions with owners– Payout to non-controlling interests –5,869 –5,869– Dividends to shareholders –16,480 –16,480 –16,480Total transactions with owners — –16,480 –16,480 –5,869 –22,349Closing balance, Dec. 31, 2016 60,000 338,657 398,657 16,488 415,145
Opening balance, Jan. 1, 2017 60,000 338,657 398,657 16,488 415,145Profit/loss for the year 59,517 59,517 1,628 61,145Translation differences 1,881 1,881 –994 887Total changes in value — 61,398 61,398 634 62,032Transactions with owners– Payout to non-controlling interests — — –6,197 –6,197– Dividends to shareholders –13,878 –13,878 — –13,878Total transactions with owners — –13,878 –13,878 –6,197 –20,075Closing balance, Dec. 31, 2017 60,000 386,177 446,177 10,925 457,102
Restricted equity Unrestricted equity
Parent CompanyShare
capitalStatutory
reserve
Profit/loss carried forward
Profit/lossfor the year
Totalequity
Opening balance, Jan. 1, 2016 60,000 12,000 186,430 49,643 308,073Transfer of past year’s profit/loss 49,643 –49,643 —Net profit for the year — 37,004 37,004Total changes in value — — 49,643 –12,639 37,004Transactions with owner– Dividends –16,480 –16,480Total transactions with owner — — –16,480 — –16,480Closing balance, Dec. 31, 2016 60,000 12,000 219,593 37,004 328,597
Opening balance, Jan. 1, 2017 60,000 12,000 219,593 37,004 328,597Transfer of past year’s profit/loss 37,004 –37,004 —Net profit for the year — 74,983 74,983Total changes in value — — 37,004 37,979 74,983Transactions with owner– Dividends –13,878 –13,878Total transactions with owner — — –13,878 — –13,878Closing balance, Dec. 31, 2017 60,000 12,000 242,719 74,983 389,702

8 EKMAN ANNUAL REPORT AND CONSOLIDATED FINANCIAL STATEMENTS 2017
Group Parent CompanyThousands of SEK Note Dec. 31, 2017 Dec. 31, 2016 Dec. 31, 2017 Dec. 31, 2016
Operating activitiesOperating profit/loss 112,802 75,046 51,798 6,158Adjustment for items not included in cash flow– Depreciation/amortization and disposals 11,663 13,286 1,238 1,890– Change in provisions –9,418 –830 — —– Other items 22 –38,213 –35,426 2,408 2,029Interest received 1,145 906 6,506 7,998Interest paid –27,606 –21,151 –19,372 –14,547Income tax paid –11,892 –15,492 — —Cash flow from operating activities before changes in working capital 38,481 16,339 42,578 3,528
Cash flow from changes in working capitalDecrease(+)/increase(–) in inventories –37,618 –7,118 9,236 2,155Decrease(+)/increase(–) in accounts receivable –195,199 –130,151 –126,310 –23,273Decrease(+)/increase(–) in current receivables –14,937 10,730 84,344 604Decrease(–)/increase(+) in accounts payable 52,055 137,879 10,260 79,059Decrease(–)/increase(+) in current liabilities 117,640 78,083 –9,439 –4,282Cash flow from operating activities –39,578 105,762 10,669 57,791
Investing activitiesInvestments in subsidiaries — — — –16,262Change in currency hedge of equity in subsidiaries 3 — — 6,422 –5,441Capital contributions to subsidiaries — — — –100Investments in intangible assets –19 –10,697 — –48Disposals of tangible assets — — — —Investments in tangible assets –10,877 –3,045 –247 –444Acquisitions of affiliated companies –4,794 — — —Cash flow from investing activities –15,690 –13,742 6,175 –22,295
Financing activitiesChange in liabilities to credit institutions 58,901 –30,471 –15,335 –60,621Change in non-current receivables 3,227 –5,178 — —Dividends received — — 38,211 41,028Dividends paid –13,878 –16,480 –13,878 –16,480Payout to non-controlling interests –6,197 –5,869 — —Change in other non-current liabilities — — 2 3,328Cash flow from financing activities 42,053 –57,998 9,000 –32,745
Cash flow for the year –13,215 34,022 25,844 2,751Cash and cash equivalents at the beginning of the year 63,474 25,029 4,601 1,850Exchange rate differences in cash and cash equivalents –1,239 4,423 — —Cash and cash equivalents at the end of the year 49,020 63,474 30,445 4,601
Cash Flow Statements

9EKMAN ANNUAL REPORT AND CONSOLIDATED FINANCIAL STATEMENTS 2017
Notes Common to Parent Company and Group
Ekman & Co AB’s annual report and consolidated finan-cial statements have been prepared in accordance with the Swedish Annual Accounts Act (1995:1554) and the gen-eral advice of the Swedish Accounting Standards Board (Bokföringsnämnden) in its standard BFNAR 2012:1 Annual Reports and Consolidated Accounts (“K3”).
Consolidated financial statementsThe consolidated financial statements have been prepared in accordance with the purchase method and include the Parent Company, Ekman & Co AB, and companies in which the Parent Company directly or indirectly has a voting majority or otherwise exercises a controlling inter-est. The revenue and expenses of a subsidiary are incorpo-rated into the consolidated financial statements from the time of the acquisition until such a time as the Parent Company no longer has a controlling influence over the subsidiary. The assets and liabilities of foreign subsidiaries are translated to SEK for the consolidated financial state-ments using the exchange rate on the balance sheet date. Revenue and expense items are translated using the aver-age exchange rate for the period. Any translation differ-ences that arise are recognized directly in equity.
Holdings in affiliated companiesAn affiliated company is a company in which the Group exercises a substantial influence, but not a controlling influence. This normally includes companies in which the Group holds 20–50% of the votes. The Group generally recognizes holdings in affiliated companies using the equity method. Affiliated companies with negligible sig-nificance or which in another way meet the requirements of the Swedish Annual Accounts Act (Chapter 7) for exemption from the equity method are recognized at cost less impairment and only distributions of profits received are recognized as revenue in such cases.
RevenueRevenue relates primarily to the sale of goods and agency commissions. Revenue is recognized when the risks and rewards, in all significant respects, are transferred to the buyer, primarily based on the terms of delivery. Costs of materials are accrued to match the related sales revenue.
LeasesLeases are classified as either finance leases or operating leases in both the consolidated financial statements and the Parents Company’s financial statements depending on the economic substance of the lease. A finance lease is a lease under which the economic risks and rewards of own-ership of an asset are substantially transferred from the lessor to the lessee. Other leases are classified as operating leases.
Receivables and liabilitiesReceivables are recognized in the amounts expected to be received. Liabilities are recognized at their nominal amount. Receivables and liabilities with a maturity period of more than one year are classified as non- current.
Translation of items in foreign currencyMonetary items in foreign currency are translated on each balance sheet date using the exchange rate on the balance sheet date. Non-monetary items measured at historical cost in a foreign currency are not translated. Exchange rate differences are recognized in the period they arise, except in the case of hedging transactions that meet the requirements of hedge accounting.
Employee benefitsEmployee benefits in the form of wages, salaries, bonuses, paid vacations, paid sickness absences etc. and pensions are recognized as earned. Pensions and other post-employ-ment benefits are classified as defined contribution or defined benefit pension plans. The Group mainly has defined contribution pension plans. There are no other long-term employee benefits.
Note 1 Accounting and measurement policies

10 EKMAN ANNUAL REPORT AND CONSOLIDATED FINANCIAL STATEMENTS 2017
Income taxesReported income taxes include tax that is to be paid or recovered in relation to the current year, adjustments relating to previous years’ taxes and changes in deferred tax. All tax liabilities and assets are measured at their nominal amounts in accordance with the tax regulations and rates in effect on the balance sheet date.
Tax effects relating to items recognized in the income statement are also reported in the income statement. The tax effects of items recognized directly in equity are recog-nized in equity. Deferred tax assets related to losses car-ried forward or other future tax deductions are recognized to the extent it is probable that the deduction can be off set against a surplus in future taxation. Tax estimates in the Group do not take into account the additional foreign taxation that could be charged against consolidated earn-ings if transferred to the Parent Company.
Tangible and intangible non-current assetsAll tangible and intangible non-current assets are acquired externally and are recognized at cost less accu-mulated depreciation/amortization and any impairment. The amortization period for goodwill can vary from 5 to 10 years depending on the estimated useful life. The amortization period is considered 10 years for strategic acquisitions. Depreciation of tangible assets is expensed in such a way that the cost of the asset, less its estimated residual value if applicable, is depreciated on a straight-line basis over its estimated useful life. Estimates of the useful lives of different non-current assets:
Goodwill 5–10 yearsOther intangible assets 5 yearsCapitalized expenses for computer software 5 yearsBuildings 20–50 yearsComputer equipment 5 yearsOther equipment 5–7 years
The estimated useful lives and depreciation/amortization methods are reviewed in the event of indications that the expected consumption has changed significantly in com-parison to the estimate of the previous balance sheet date. The effect of such a change is recognized prospectively.
Financial instrumentsA financial asset or liability is recognized in the balance sheet when the Group becomes a party pursuant to the contract terms and conditions of the instrument. A finan-cial asset is derecognized from the balance sheet when the contractual rights to receive the cash flows of the asset
lapse or are settled, or when the Group loses control over it. A financial liability, or a component of a financial lia-bility, is derecognized from the balance sheet when the contractual obligation is met or is otherwise extinguished.
Current assets and liabilities are measured at cost upon initial recognition. Non-current receivables and liabilities are measured at amortized cost upon initial recognition. Borrowing costs are accrued as a part of the interest expenses of the borrowing.
Current assets are measured after initial recognition at the lower of cost and net realizable value at the balance sheet date. Current liabilities are measured at their nomi-nal amount. Non-current receivables and liabilities are measured at amortized cost after initial recognition.
The Group uses hedge accounting to reduce fluctua-tions in its profit or loss resulting from currency risks. Currency forwards are mainly used for hedging receiv-ables or liabilities in foreign currencies, but other deriva-tive instruments may be used as well. The hedged item is measured at the forward rate. In cases where there are substantial differences between the forward rate and the spot rate, the receivable or liability is measured at the spot rate and the forward premium is accrued over the term of the forward contract.
Future cash flows in foreign currencies are only hedged to the extent that they are related to binding contracts and are therefore highly likely to occur.
The Group uses currency forwards, and in some cases borrowings, in foreign currencies to hedge net invest-ments in foreign currency. The hedging instrument and the hedged item are recognized in the consolidated finan-cial statements at the exchange rate on the balance sheet date. The effective component of the re-measurements is recognized directly in equity.
Financial assets are evaluated at every balance sheet date for indications that one or more assets have decreased in value. For financial assets measured at amortized cost, the impairment is calculated as the difference between the carrying amount of the asset and the present value of management’s best estimate of future cash flows. The asset is discounted using an interest rate equal to the original effective interest rate of the asset. The interest rate on the balance sheet date is used for assets with a variable interest rate.
For financial assets not measured at amortized cost, the impairment is calculated as the difference between the carrying amount of the asset and the higher of fair value less costs of disposal and the present value of manage-ment’s best estimate of the future cash flows the asset is expected to generate.
Note 1 cont.

11EKMAN ANNUAL REPORT AND CONSOLIDATED FINANCIAL STATEMENTS 2017
InventoriesInventories are measured at the lower of cost and net real-izable value at the balance sheet date. Cost is calculated using the first-in first-out (FIFO) method.
Cash and cash equivalentsCash and cash equivalents include cash on hand and available balances with banks and other credit institutions as well as other short-term liquid investments that are easily convertible to cash, are subject to an insignificant risk of fluctuations in value and have a term shorter than three months.
ProvisionsA provision is recognized in the balance sheet when the company has a formal or informal obligation as the result of an event that has occurred and it is probable that an outflow of resources is required to settle the obligation and a reliable estimate of the amount can be made. Obli-gations not recognized as liabilities or provisions are rec-ognized as contingent liabilities.
Cash flow statementThe cash flow statement has been prepared using the indirect method.
Accounting and measurement policies specifically related to the Parent CompanyThis section covers the accounting policies of the Parent Company which deviate from the accounting policies of the Group or which are not applicable to the Group.
Holdings in subsidiaries are recognized at cost. Divi-dends from subsidiaries are recognized as revenue when the Parent Company’s right to receive the dividend is established and can be calculated reliably.
Group contributions paid and received are recognized as appropriations in the income statement.
Significant sources of uncertainty in esti-mates and significant judgements in relation to the application of the Group’s accounting policiesOne of the main focuses of the Group is to minimize risks and uncertainties that may impact the Group’s financial results and financial position. However, there is always a certain degree of uncertainty involving risks of losses in respect of accounts receivable, provisions in insurance operations and the measurement of inventories. Manage-
ment’s estimates of the amounts required for provisions for such risks of losses and estimates of any inventory val-uation provisions form the basis for the amounts at which these items are recognized in the Group’s balance sheet.
Estimates of future use and cash flows are used for establishing impairment losses on non-current assets. In addition, the measurement of deferred taxes related to tax loss carryforwards are based on estimates of the possibili-ties of offsetting these tax loss carryforwards against future profit.
Note 2 Significant estimates and judgements
12 EKMAN ANNUAL REPORT AND CONSOLIDATED FINANCIAL STATEMENTS 2017
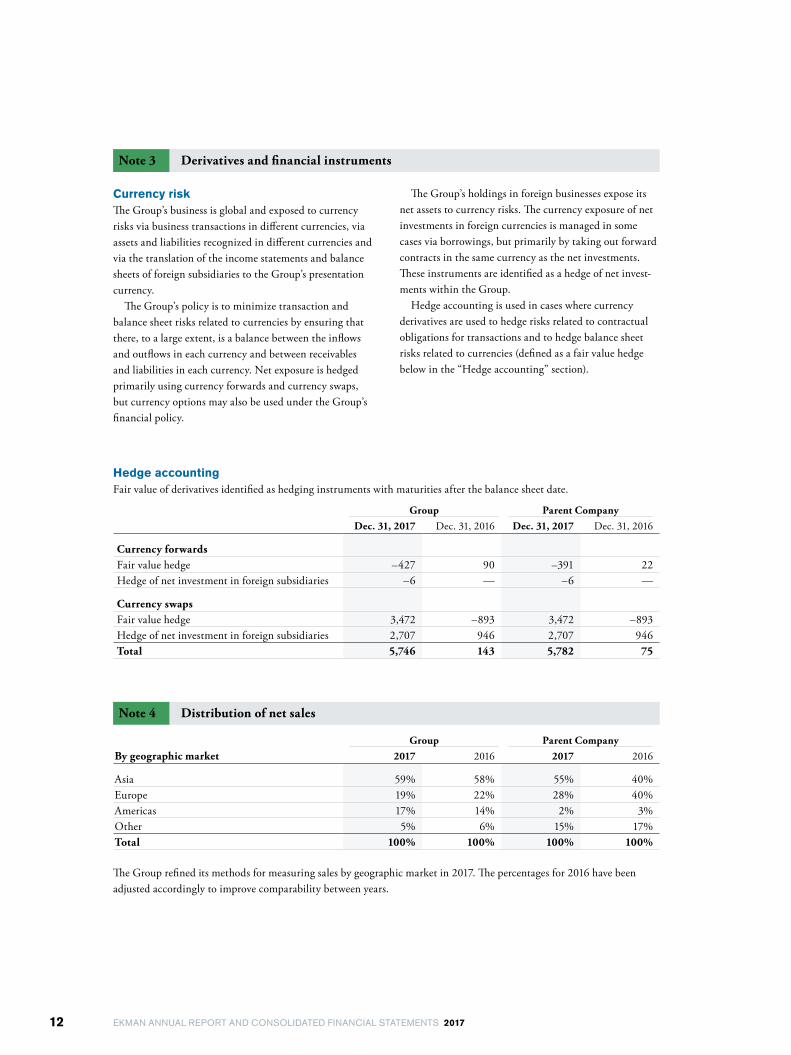
Hedge accountingFair value of derivatives identified as hedging instruments with maturities after the balance sheet date.
Group Parent CompanyDec. 31, 2017 Dec. 31, 2016 Dec. 31, 2017 Dec. 31, 2016
Currency forwardsFair value hedge –427 90 –391 22Hedge of net investment in foreign subsidiaries –6 — –6 —
Currency swapsFair value hedge 3,472 –893 3,472 –893Hedge of net investment in foreign subsidiaries 2,707 946 2,707 946Total 5,746 143 5,782 75
Note 4 Distribution of net sales
Group Parent CompanyBy geographic market 2017 2016 2017 2016
Asia 59% 58% 55% 40%Europe 19% 22% 28% 40%Americas 17% 14% 2% 3%Other 5% 6% 15% 17%Total 100% 100% 100% 100%
The Group refined its methods for measuring sales by geographic market in 2017. The percentages for 2016 have been adjusted accordingly to improve comparability between years.
Currency riskThe Group’s business is global and exposed to currency risks via business transactions in different currencies, via assets and liabilities recognized in different currencies and via the translation of the income statements and balance sheets of foreign subsidiaries to the Group’s presentation currency.
The Group’s policy is to minimize transaction and balance sheet risks related to currencies by ensuring that there, to a large extent, is a balance between the inflows and outflows in each currency and between receivables and liabilities in each currency. Net exposure is hedged primarily using currency forwards and currency swaps, but currency options may also be used under the Group’s financial policy.
The Group’s holdings in foreign businesses expose its net assets to currency risks. The currency exposure of net investments in foreign currencies is managed in some cases via borrowings, but primarily by taking out forward contracts in the same currency as the net investments. These instruments are identified as a hedge of net invest-ments within the Group.
Hedge accounting is used in cases where currency derivatives are used to hedge risks related to contractual obligations for transactions and to hedge balance sheet risks related to currencies (defined as a fair value hedge below in the “Hedge accounting” section).
Note 3 Derivatives and financial instruments

13EKMAN ANNUAL REPORT AND CONSOLIDATED FINANCIAL STATEMENTS 2017
Note 5 Intra-group sales and purchases
The table below shows the percentage of the sales and purchases attributable to Group companies.
Parent Company2017 2016
Purchases 1.3% 2.9%Sales 1.4% 1.6%
Note 7 Leases
The Group is a lessee mainly for buildings and premises under operating leases. The Group has no material finance leases. Expensed lease payments for the year for operating leases totaled 31,350 (27,774) for the Group and 5,576 (5,510) for the Parent Company. Future minimum lease payments for operating leases that cannot be terminated are due as follows:
Group Parent CompanyDue date 2017 2016 2017 2016
Within one year 29,809 19,283 3,773 3,335Later than one year but within five years 34,307 22,212 13,622 1,713Later than five years — 128 — —Total 64,116 41,623 17,395 5,048
Note 6 Disclosure on auditors’ fees
Group Parent Company2017 2016 2017 2016
DeloitteAudit engagements 1,700 1,719 695 695Tax advice 131 527 80 419Other services 120 17 82 17
Other auditorsAudit engagements 1,050 1,175 — —Tax advice 661 649 — —Other services 137 90 — —
The “Audit engagements” line item refers to the auditor’s fee for the statutory audit, which involves auditing the Annual Report and Consolidated Financial Statements, accounting records, the management of the Board of Directors and the CEO, as well as fees for audit advice provided in relation to the audit engagement.
Group Parent CompanyBy segment 2017 2016 2017 2016
Pulp 63% 60% 72% 68%Paper & Packaging 21% 22% 20% 25%Recovered Materials 14% 15% 4% 4%Bioenergy 3% 3% 4% 3%Total 100% 100% 100% 100%
14 EKMAN ANNUAL REPORT AND CONSOLIDATED FINANCIAL STATEMENTS 2017
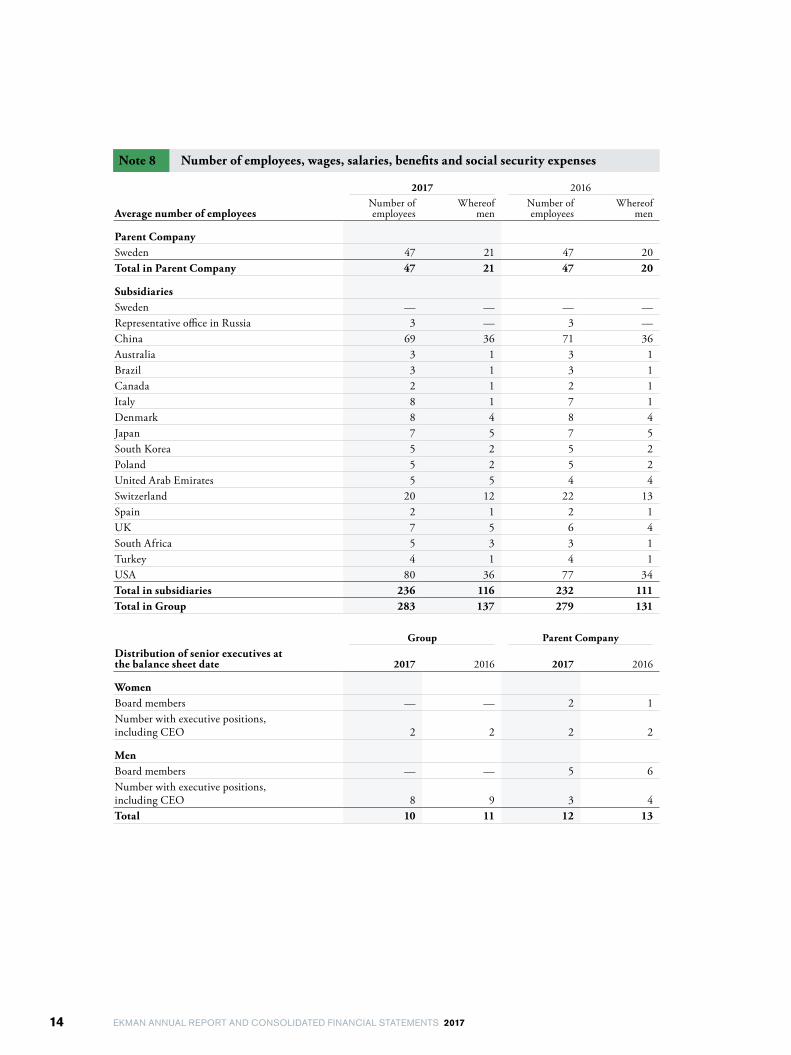
Note 8 Number of employees, wages, salaries, benefits and social security expenses
2017 2016
Average number of employeesNumber of employees
Whereof men
Number of employees
Whereof men
Parent CompanySweden 47 21 47 20Total in Parent Company 47 21 47 20
SubsidiariesSweden — — — —Representative office in Russia 3 — 3 —China 69 36 71 36Australia 3 1 3 1Brazil 3 1 3 1Canada 2 1 2 1Italy 8 1 7 1Denmark 8 4 8 4Japan 7 5 7 5South Korea 5 2 5 2Poland 5 2 5 2United Arab Emirates 5 5 4 4Switzerland 20 12 22 13Spain 2 1 2 1UK 7 5 6 4South Africa 5 3 3 1Turkey 4 1 4 1USA 80 36 77 34Total in subsidiaries 236 116 232 111Total in Group 283 137 279 131
Group Parent CompanyDistribution of senior executives at the balance sheet date 2017 2016 2017 2016
WomenBoard members — — 2 1Number with executive positions, including CEO 2 2 2 2
MenBoard members — — 5 6Number with executive positions, including CEO 8 9 3 4Total 10 11 12 13

15EKMAN ANNUAL REPORT AND CONSOLIDATED FINANCIAL STATEMENTS 2017
Note 9 Profit/loss from holdings in Group companies
Parent Company 2017 2016
Dividends 38,211 41,028Profit/loss from liquidation of subsidiaries — –142Capital contributions to subsidiaries — –100
38,211 40,786
Wages, salaries, other benefits etc.
2017 2016
Personnel
Wages,salaries,
other benefits
Social security expenses
(of which pension costs)
Wages,salaries,
other benefits
Social security expenses
(of which pension costs)
Parent Company 42,791 22,755 34,370 19,713(7,383) (6,425)
Subsidiaries 226,252 37,104 190,934 34,755(11,985) (12,267)
269,043 59,859 225,304 54,468(19,368) (18,692)
Pension costs for the Board of Directors and CEO amounted to 0 (0) for the Parent Company and 350 (669) for the Group.
Distribution of wages, salaries and other benefits by board members and CEO, and other employees
2017 2016
Personnel
Board and CEO (of which
bonuses, etc.)Other
employees
Board and CEO (of which
bonuses, etc.)Other
employees
Parent Company 900 41,891 750 33,620(—) (—)
Subsidiaries 57,625 168,627 42,448 148,486(15,850) (3,997)
Total Group 58,525 210,518 43,198 182,106(15,850) (3,997)
The Group’s CEO and Deputy CEO are entitled to 12 months’ dismissal pay and a pension agreement based on the highest amount deductible for tax purposes. Other senior executives in the Group are entitled to 6–12 months’ dismissal pay. There are no severance pay agreements in addition to this, regardless of which party initiates the termination.

16 EKMAN ANNUAL REPORT AND CONSOLIDATED FINANCIAL STATEMENTS 2017
Note 10 Financial items
In addition to interest, “Interest income and similar items” and “Interest expenses and similar items” also include other income and expenses related to liquidity management and financing the Group’s operations. These items also include certain foreign exchange effects.
Note 11 Taxes
Group Parent CompanyTax on profit for the year 2017 2016 2017 2016
Current tax –12,872 –13,399 — —Deferred tax –8,058 –5,390 –10,982 248Total –20,930 –18,789 –10,982 248
The Parent Company has unutilized tax loss carryforwards. Tax effects relating to hedging equity in foreign subsidiaries are recognized directly in the Group’s equity, as well as the hedging effects.
Group Parent CompanyBreakdown of tax expenses for the year 2017 2016 2017 2016
Accounting profit/loss before tax 82,076 51,864 85,965 36,756Tax calculated using Swedish tax rate (22%) –18,057 –11,410 –18,912 –8,086Tax effect of permanently non-deductible expenses –3,935 –5,897 –477 –722Tax effect of permanently non-taxable income 1,082 499 8,408 9,069Impact of differences in tax rates in different countries –327 –2,863 — —Total –21,237 –19,671 –10,982 260Adjustments to current/deferred tax of previous years 307 882 — –12Reported tax expenses for the year –20,930 –18,789 –10,982 248
Note 12 Intangible and tangible non-current assets
GroupGoodwill Dec. 31, 2017 Dec. 31, 2016
Opening cost 182,880 162,301Acquisitions — 10,649Translation differences –8,712 9,930Closing cost 174,168 182,880
Opening accumulated amortization –160,618 –148,086Amortization for the year –4,406 –4,525Translation differences 6,725 –8,006Closing accumulated amortization –158,299 –160,618Closing carrying amount 15,868 22,262

17EKMAN ANNUAL REPORT AND CONSOLIDATED FINANCIAL STATEMENTS 2017
Group Parent CompanyOther intangible assets Dec. 31, 2017 Dec. 31, 2016 Dec. 31, 2017 Dec. 31, 2016
Opening cost 27,925 28,656 22,662 26,389Investments 19 48 — 48Disposals –1,708 –3,823 –1,708 –3,775Translation differences –2,856 3,044 — —Closing cost 23,380 27,925 20,954 22,662
Opening accumulated amortization –26,159 –25,415 –21,366 –23,782Amortization for the year –659 –1,554 –458 –1,359Disposals 1,343 3,823 1,343 3,775Translation differences 2,866 –3,013 — —Closing accumulated amortization –22,609 –26,159 –20,481 –21,366Closing carrying amount 771 1,766 473 1,296
“Other intangible assets” consist primarily of capitalized expenses for computer software.
GroupBuildings and land Dec. 31, 2017 Dec. 31, 2016
Opening cost 10,337 9,860Investments 9,033 —Translation differences –250 –232Reclassifications –109 709Closing cost 19,011 10,337
Opening accumulated depreciation –5,855 –5,170Depreciation for the year –673 –396Translation differences 361 –430Reclassifications –265 141Closing accumulated depreciation –6,432 –5,855Closing carrying amount 12,579 4,482
Group Parent CompanyEquipment Dec. 31, 2017 Dec. 31, 2016 Dec. 31, 2017 Dec. 31, 2016
Opening cost 67,682 61,966 7,416 7,098Investments 1,844 3,045 247 444Disposals –1,790 –1,833 –812 –126Translation differences –4,175 4,461 — —Reclassifications 754 43 — —Closing cost 64,315 67,682 6,851 7,416
Opening accumulated depreciation –41,373 –33,687 –5,861 –5,457Depreciation for the year –5,925 –6,811 –408 –530Disposals 1,731 1,558 806 126Translation differences 2,357 –2,430 — —Reclassifications –165 –3 — —Closing accumulated depreciation –43,375 –41,373 –5,464 –5,861Closing carrying amount 20,940 26,309 1,387 1,555

18 EKMAN ANNUAL REPORT AND CONSOLIDATED FINANCIAL STATEMENTS 2017
Note 13 Holdings in Group companies
Carrying amount
Parent Company holdingsCorporate
reg. no.Registered
officeShare of
equity %Number of
sharesDec. 31,
2017Dec. 31,
2016
Ekman Investment AB 556022-1268 Gothenburg 100 400,000 32,834 32,834AB Jan Liebig Ltd 556195-1525 Gothenburg 100 500 600 600Scandinavian Overseas Paper Co AB 556231-4004 Gothenburg 100 5,000 500 500Percy von Schultz & Co AB 556050-1727 Stockholm 100 4,000 317 317Leje & Thurne AB 556021-8538 Gothenburg 100 400 250 250Delthirna Shipping AB 556025-7510 Gothenburg 100 100 110 110Jan Liebig International AB 556214-8857 Gothenburg 100 500 100 100Ekman Recycling Europe AB 556039-7142 Gothenburg 100 500 75 75Ekman Pulp AB 556013-5047 Gothenburg 100 2,400 — —Consolidated Shipping AB 556819-0663 Gothenburg 100 500 50 50Ekman Holding Inc. US 100 1,000 62,689 62,689Ekman Iberica S.A. ES 100 10,000 2,862 2,862Ekman Pulp & Paper Co Ltd JP 51 2,394 954 954Ekman do Brasil Com. Ltda. BR 100 665,500 2,744 2,744Ekman Benelux SA BE 100 619 513 513Ekman Pty Ltd AU 100 5,999 88 88Ekman Italia S.r.l. IT 98 1,862 1,469 1,469Reliance Fibres Ltd UK 100 100,000 16,288 16,288Ekman Polska Sp.z.o.o. PL 100 2,000 453 453Ekman & Co GmbH DE 100 5,000 3,610 3,610Ekman Africa (Pty) Ltd ZA 100 100 — —Ekman Holding UK Ltd UK 100 100 1 1Ekman Holding Canada Inc. CA 100 1,000 6 6Ekman & Co (Korea) Ltd KO 100 40,000 2,620 2,620Ekman Middle East (SAIF) UAE 100 1,500 291 291Delthirna Latvia SIA LV 100 2,000 0 0Ekman Pulp & Paper Ltd HK 100 99,999 133 133Kwok Fung Holding Ltd HK 1001) 165 1 1Ekman Denmark A.p.s. DK 100 80,000 96 96Ekman DIS Ticaret Ltd Sirketi TR 90 4,500 17 17Ekman South Africa (Pty) Ltd. ZA 100 100 — —Total 129,671 129,671
1) Non-controlling interests hold preferred shares that entitle them to a share of profits, but do not have a share in other capital.

19EKMAN ANNUAL REPORT AND CONSOLIDATED FINANCIAL STATEMENTS 2017
Subsidiary holdingsRegistered
officeShare of
equity %Number of
shares
Ekman AG CH 100 999Protector Insurance Ltd UK 100 6,499,999Ekman & Co China Ltd CN 100 10,000Ekman & Co Inc US 100 1,000K-C International LLC US 100 —Ekman UK Ltd UK 100 446,000Ekman Asia Pte Ltd SN 100 2,400,000Secondary Pulp & Paper Inc CA 100 1,020John Claes Pulp S.A. BE 100 300Ekman Italia S.r.l. IT 2 38Coastal Pulp & Paper LLC US 100 —Coastal Pulp & Paper Ltd HK 100 10,000Kwok Fung (Sino HK) Enterprise Ltd HK 100 3,500,000Ekman DIS Ticaret Ltd Sirketi TR 10 500Yuan Feng Paper (Shen Zhen) Co., Limited CN 100 —Ding Feng Paper (Shen Zhen) Co., Limited CN 100 —
Parent CompanyCarrying amount of holdings in Group companies 2017 2016
Opening carrying amount 129,671 113,409Acquisition of Reliance Fibres Ltd — 16,288Liquidation of Delthirna Latvia SIA — –26Closing carrying amount 129,671 129,671
Note 14 Holdings in affiliated companies
Carrying amount
Parent Company holdingsRegistered
officeShare of
equity, %Number of
shares Dec. 31, 2017 Dec. 31, 2016
Ekman Converting SA MA 34 17,000 2,037 2,037
This holding is recognized using the cost method. Dividends received were 0 (0).
Carrying amount
Subsidiary holdingsRegistered
officeShare of
equity, %Number of
shares Dec. 31, 2017 Dec. 31, 2016
TTO US 45 3,150,000 3,861 —
The holdings are recognized in accordance with the basic policies described for recognition of affiliated companies in Note 1. Dividends received were 0 (0).

20 EKMAN ANNUAL REPORT AND CONSOLIDATED FINANCIAL STATEMENTS 2017
Note 16 Prepaid expenses and accrued income
Group Parent Company2017 2016 2017 2016
Accrued transactions (trade) 34,953 41,570 28,325 35,175Other items 14,770 20,438 2,781 2,874Total 49,723 62,008 31,106 38,049
All expense and revenue items related to incomplete transactions at the balance sheet date are recognized as accrued or prepaid expenses under the “Accrued transactions (trade)” line item.
Note 20 Current liabilities to credit institutions
The Group’s utilized facilities are reported in the “Liabilities to credit institutions” line item. The bank overdraft facilities granted for the Group amount to SEK 1,215,627 (1,486,100) and to SEK 498,708 (599,370) for the Parent Company. There are various covenants for the Group’s financing. These covenants have been met as per December 31, 2017.
Note 19 Non-current liabilities to credit institutions
Liabilities to credit institutions are due for payment within five years of the balance sheet date.
Note 17 Share capital disclosures
The share capital consists of 60,000 Class A shares with a quota value of SEK 1,000.
Note 18 Other provisions
Group2017 2016
Opening provision 61,515 62,084Change in provision –10,366 –6,104Foreign exchange effects –5,848 5,535Closing provision 45,301 61,515
The “Other provisions” line item refers to provisions for risks of losses in insurance operations.
Note 15 Deferred tax assets
Group Parent CompanyDeferred tax assets 2017 2016 2017 2016
Deferred tax on tax loss carryforwards 6,249 20,298 4,895 15,495Other items 8,704 5,246 535 918Total 14,953 25,544 5,430 16,413
The “Other items” line item refers to temporary differences between the accounting and tax values of assets and liabilities.

21EKMAN ANNUAL REPORT AND CONSOLIDATED FINANCIAL STATEMENTS 2017
Note 21 Accrued expenses and prepaid income
Group Parent CompanyDec. 31, 2017 Dec. 31, 2016 Dec. 31, 2017 Dec. 31, 2016
Accrued transactions (trade) 152,128 124,206 51,955 27,668Accrued social security expenses 3,957 3,124 1,128 2,125Vacation liabilities 5,940 4,726 3,616 2,606Other personnel-related liabilities 61,201 27,829 14,549 4,399Other items 32,571 13,347 14,186 8,885Total 255,797 173,232 85,434 45,683
All expense and revenue items related to incomplete transactions at the balance sheet date are recognized as accrued or prepaid expenses under the “Accrued transactions (trade)” line item.
Note 23 Pledged assets and contingent liabilities
Group Parent CompanyDec. 31, 2017 Dec. 31, 2016 Dec. 31, 2017 Dec. 31, 2016
Pledged assetsImport documents 12,055 10,344 12,055 10,344Total 12,055 10,344 12,055 10,344
Contingent liabilitiesGuarantee in favour of Group companies — — 686,360 567,289Other contingent liabilities 3,107 3,018 3,107 3,018Total 3,107 3,018 689,467 570,307
Note 22 Other items in cash flow
Other non-cash items in cash flow are attributable to unrealized exchange rate effects as well as remuneration to employees that has been earned but not paid out.
Note 24 Ownership structure
Ekman & Co AB is a wholly owned subsidiary of Ekman Invest Holding AB (corporate registration number 556712-1602), with its registered office in Gothenburg, which is in turn owned by the Ekman family both directly and via foundations, as well as by employees within the Group.
Note 25 Events after the balance sheet date
No significant events have occurred after the end of the financial year that are considered to be of material significance for understanding the Group’s or Parent Company’s results of operations or financial position as reported in this report.

22 EKMAN ANNUAL REPORT AND CONSOLIDATED FINANCIAL STATEMENTS 2017
Gothenburg, March 13, 2018
Matts Ekman Jan Svensson Chairman CEO
Caroline Ekman Frank Graves Board member Board member
Michael Olsson Oscar Ekman Board member Board member
Jessica Bodin Employee Representative
Our auditor’s report was submitted on March 16, 2018. Deloitte AB
Hans Warén Authorized Public Accountant
Note 26 Proposed distribution of earnings
The following earnings are at the disposal of the Annual General Meeting:
Retained earnings 242,719,189Profit/loss for the year 74,982,978
SEK 317,702,167
The Board of Directors proposes that the following amount is to be distributed to the shareholders 19,082,316carried forward 298,619,851
SEK 317,702,167
Subject to the approval of the Annual General Meeting, Group contributions have been paid to Ekman & Co AB’s parent company totaling SEK 688,897.
Group contributions totaling SEK 543,232 were paid to Ekman & Co AB’s subsidiaries.
It is the Board’s view that the proposed distribution of earnings and the proposed Group contributions will not prevent the Company from meeting its obligations in the short or long term or from completing necessary invest-ments. Therefore, the proposed value transfer can be justified in accordance with the provisions of Article 17, Section 3, Paragraphs 2 and 3 of the Swedish Companies Act (prudence rule).
In regards to the profit for the year of the Group and the Parent Company, their financial position on the reporting date as well as financing and capital utilization during the year, please refer to the financial statements above. All figures are reported in thousands of SEK unless otherwise indicated.

23EKMAN ANNUAL REPORT AND CONSOLIDATED FINANCIAL STATEMENTS 2017
Report on the annual accounts and consolidated accounts
OpinionsWe have audited the annual accounts and consolidated accounts of Ekman & Co AB for the financial year 2017-01-01–2017-12-31.
In our opinion, the annual accounts and consolidated accounts have been prepared in accordance with the Annual Accounts Act and present fairly, in all material respects, the financial position of the parent company and the group as of December 31, 2017 and its financial per-formance and cash flow for the year then ended in accor-dance with the Annual Accounts Act. The statutory administration report is consistent with the other parts of the annual accounts.
We therefore recommend that the general meeting of shareholders adopts the income statement and balance sheet for the parent company and the group.
Basis for opinionsWe conducted our audit in accordance with International Standards on Auditing (ISA) and generally accepted auditing standards in Sweden. Our responsibilities under those standards are further described in the Auditor’s responsibility section. We are independent of the Parent Company and the Group in accordance with professional ethics for accountants in Sweden and have otherwise ful-filled our ethical responsibilities in accordance with these requirements.
We believe that the audit evidence we have obtained is sufficient and appropriate to provide a basis for our opin-ions.
Responsibilities of the Board of Directors and the Managing DirectorThe Board of Directors and the Managing Director are responsible for the preparation of the annual accounts and that they give a fair presentation in accordance with the Annual Accounts Act. The Board of Directors and the Managing Director are also responsible for such internal control as they determine is necessary to enable the prepa-
ration of annual accounts and consolidated accounts that are free from material misstatement, whether due to fraud or error.
In preparing the annual accounts and consolidated accounts, the Board of Directors and the Managing Director are responsible for the assessment of the company’s and the group’s ability to continue as a going concern. They disclose, as applicable, matters related to going concern and using the going concern basis of accounting. The going concern basis of accounting is however not applied if the Board of Directors and the Managing Director intend to liquidate the company, to cease operations, or have no realistic alternative but to do so.
Auditor’s responsibilityOur objectives are to obtain reasonable assurance about whether the annual accounts and consolidated accounts as a whole are free from material misstatement, whether due to fraud or error, and to issue an auditor’s report that includes our opinions. Reasonable assurance is a high level of assurance, but is not a guarantee that an audit conducted in accordance with ISAs and generally accepted auditing standards in Sweden will always detect a material misstatement when it exists. Misstatements can arise from fraud or error and are considered material if, individually or in the aggregate, they could reasonably be expected to influence the economic decisions of users taken on the basis of these annual accounts and consoli-dated accounts.
As part of an audit in accordance with ISAs, we exer-cise professional judgment and maintain professional scepticism throughout the audit. We also: • Identify and assess the risks of material misstatement
of the annual accounts and consolidated accounts, whether due to fraud or error, design and perform audit procedures responsive to those risks, and obtain audit evidence that is sufficient and appropriate to pro-vide a basis for our opinions. The risk of not detecting a material misstatement resulting from fraud is higher than for one resulting from error, as fraud may involve collusion, forgery, intentional omissions, misrepresen-tations, or the override of internal control.
Corporate reg. no. 556020-4595
Auditor’s Report This auditor’s report is a translation of the Swedish language original. In the events of any differences between this translation and the Swedish original the latter shall prevail.
To the general meeting of shareholders of Ekman & Co AB Corporate identity number 556020-4595

24 EKMAN ANNUAL REPORT AND CONSOLIDATED FINANCIAL STATEMENTS 2017
• Obtain an understanding of the company’s internal control relevant to our audit in order to design audit procedures that are appropriate in the circumstances, but not for the purpose of expressing an opinion on the effectiveness of the company’s internal control.
• Evaluate the appropriateness of accounting policies used and the reasonableness of accounting estimates and related disclosures made by the Board of Directors and the Managing Director.
• Conclude on the appropriateness of the Board of Directors’ and the Managing Director’s use of the going concern basis of accounting in preparing the annual accounts and consolidated accounts. We also draw a conclusion, based on the audit evidence obtained, as to whether any material uncertainty exists related to events or conditions that may cast signifi-cant doubt on the company’s ability to continue as a going concern. If we conclude that a material uncer-tainty exists, we are required to draw attention in our auditor’s report to the related disclosures in the annual accounts and consolidated accounts or, if such disclo-sures are inadequate, to modify our opinion about the annual accounts and consolidated accounts. Our con-clusions are based on the audit evidence obtained up to the date of our auditor’s report. However, future events or conditions may cause the company to cease to continue as a going concern.
• Evaluate the overall presentation, structure and con-tent of the annual accounts and consolidated accounts, including the disclosures, and whether the annual accounts represent the underlying transactions and events in a manner that achieves fair presentation.
• Obtain sufficient and appropriate audit evidence regarding the financial information of the entities or business activities within the group to express an opin-ion on the consolidated accounts. We are responsible for the direction, supervision and performance of the group audit. We remain solely responsible for our opinions.
We must inform the Board of Directors of, among other matters, the planned scope and timing of the audit. We must also inform of significant audit findings during our audit, including any significant deficiencies in internal control that we identified.
Report on other legal and regulatory requirements
OpinionsIn addition to our audit of the annual accounts and con-solidated accounts, we have also audited the administra-tion of the Board of Directors and the Managing Director of Ekman & Co AB for the financial year 2017-01-01–2017-12-31 and the proposed appropriations of the com-pany’s profit or loss.
We recommend to the general meeting of shareholders that the profit to be appropriated in accordance with the proposal in the statutory administration report and that the members of the Board of Directors and the Managing Director be discharged from liability for the financial year.
Basis for opinionsWe conducted the audit in accordance with generally accepted auditing standards in Sweden. Our responsibili-ties under those standards are further described in the Auditor’s responsibility section. We are independent of the Parent Company and the Group in accordance with professional ethics for accountants in Sweden and have otherwise fulfilled our ethical responsibilities in accor-dance with these requirements.
We believe that the audit evidence we have obtained is sufficient and appropriate to provide a basis for our opin-ions.
Responsibilities of the Board of Directors and the Managing DirectorThe Board of Directors is responsible for the proposal for appropriations of the company’s profit or loss. At the proposal of a dividend, this includes an assessment of whether the dividend is justifiable considering the requirements which the company’s and the group’s type of operations, size and risks place on the size of the Parent Company’s and the Group’s equity, consolidation requirements, liquidity and position in general.

EKMAN ANNUAL REPORT AND CONSOLIDATED FINANCIAL STATEMENTS 2017
The Board of Directors is responsible for the company’s organization and the administration of the company’s affairs. This includes among other things continuous assess-ment of the company’s financial situation and ensuring that the company’s organization is designed so that the accoun-ting, management of assets and the company’s financial affairs otherwise are controlled in a reassuring manner. The Managing Director shall manage the ongoing administra-tion according to the Board of Directors’ guidelines and instructions and among other matters take measures that are necessary to fulfill the company’s accounting in accor-dance with law and handle the management of assets in a reassuring manner.
Auditor’s responsibilityOur objective concerning the audit of the administration, and thereby our opinion about discharge from liability, is to obtain audit evidence to assess with a reasonable degree of assurance whether any member of the Board of Directors or the Managing Director in any material respect:• has undertaken any action or been guilty of any omis-
sion which can give rise to liability to the company, or• in any other way has acted in contravention of the
Companies Act, the Annual Accounts Act or the Articles of Association.
Our objective concerning the audit of the proposed appropriations of the company’s profit or loss, and thereby our opinion about this, is to assess with reasonable degree of assurance whether the proposal is in accordance with the Companies Act.
Reasonable assurance is a high level of assurance, but is not a guarantee that an audit conducted in accordance with generally accepted auditing standards in Sweden will always detect actions or omissions that can give rise to liability to the company, or that the proposed appropriations of the company’s profit or loss are not in accordance with the Companies Act.
As part of an audit in accordance with generally accepted auditing standards in Sweden, we exercise professional judgment and maintain professional scepticism throughout the audit. The examination of the administration and the proposed appropriations of the company’s profit or loss is based primarily on the audit of the accounts. Additional audit procedures performed are based on our professional judgment with starting point in risk and materiality. This means that we focus the examination on such actions, areas and relationships that are material for the operations and where deviations and violations would have particular im-portance for the company’s situation. We examine and test decisions undertaken, support for decisions, actions taken and other circumstances that are relevant to our opinion concerning discharge from liability. As a basis for our opi-nion on the Board of Directors’ proposed appropriations of the company’s profit or loss we examined the Board of Directors’ reasoned statement and a selection of supporting evidence in order to be able to assess whether the proposal is in accordance with the Companies Act.
Gothenburg, March 16, 2018Deloitte AB
Hans WarénAuthorized public accountant

ekmangroup.com
BRINGING THE WORLD TO YOUR BUSINESS
Sol
berg
• P
rint:
Göt
ebor
gstr
ycke
riet