annual report 2012sableholdings.co.za/downloads/sable annual report 2012.pdfibc shareholders’...
TRANSCRIPT

ANNUAL REPORT 2012

B SABLE HOLDINGS L IM ITED • Annual Report 2012
SABLE’S PROFILE
Sable Holdings Limited (“Sable”) is a public company, registered in the Republic of South Africa, with a listing on the Alt-X Board of the JSE Limited (“JSE”). Sable is a property investment company with interests in various property related activities. The property portfolio as detailed in the group property portfolio on pages 54 and 55, comprises property investments and developments in the retail, industrial, residential and commercial sectors located in Gauteng and Cape Town, South Africa. Sable’s market capitalisation was R169,4 million on 30 June 2012.
1SABLE HOLDINGS L IM ITED • Annual Report 2012
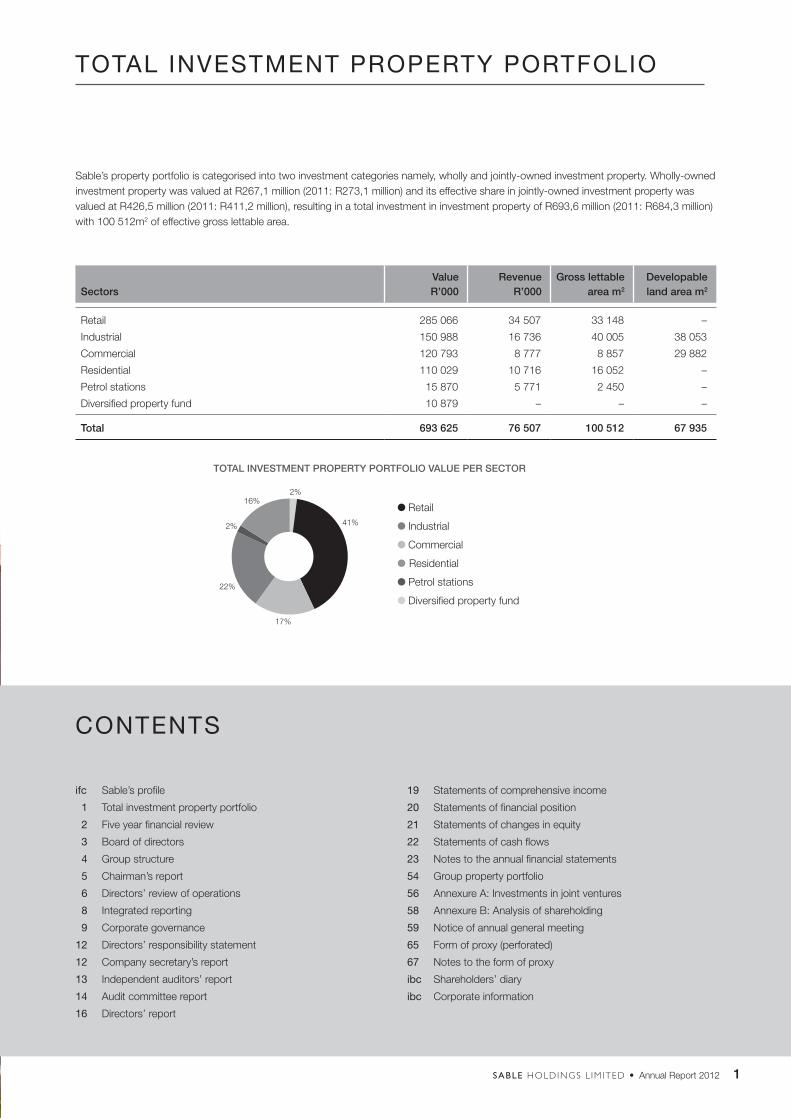
TOTAL INVESTMENT PROPERTY PORTFOLIO
Sable’s property portfolio is categorised into two investment categories namely, wholly and jointly-owned investment property. Wholly-owned investment property was valued at R267,1 million (2011: R273,1 million) and its effective share in jointly-owned investment property was valued at R426,5 million (2011: R411,2 million), resulting in a total investment in investment property of R693,6 million (2011: R684,3 million) with 100 512m2 of effective gross lettable area.
SectorsValueR’000
RevenueR’000
Gross lettablearea m2
Developable land area m2
Retail 285 066 34 507 33 148 –
Industrial 150 988 16 736 40 005 38 053
Commercial 120 793 8 777 8 857 29 882
Residential 110 029 10 716 16 052 –
Petrol stations 15 870 5 771 2 450 –
Diversified property fund 10 879 – – –
Total 693 625 76 507 100 512 67 935
TOTAL INVESTMENT PROPERTY PORTFOLIO VALUE PER SECTOR
2%
16%
17%
22%
41%
2%
Retail
Industrial
Commercial
Residential
Petrol stations
Diversified property fund
CONTENTS
ifc Sable’s profile
1 Total investment property portfolio
2 Five year financial review
3 Board of directors
4 Group structure
5 Chairman’s report
6 Directors’ review of operations
8 Integrated reporting
9 Corporate governance
12 Directors’ responsibility statement
12 Company secretary’s report
13 Independent auditors’ report
14 Audit committee report
16 Directors’ report
19 Statements of comprehensive income
20 Statements of financial position
21 Statements of changes in equity
22 Statements of cash flows
23 Notes to the annual financial statements
54 Group property portfolio
56 Annexure A: Investments in joint ventures
58 Annexure B: Analysis of shareholding
59 Notice of annual general meeting
65 Form of proxy (perforated)
67 Notes to the form of proxy
ibc Shareholders’ diary
ibc Corporate information
2 SABLE HOLDINGS L IM ITED • Annual Report 2012
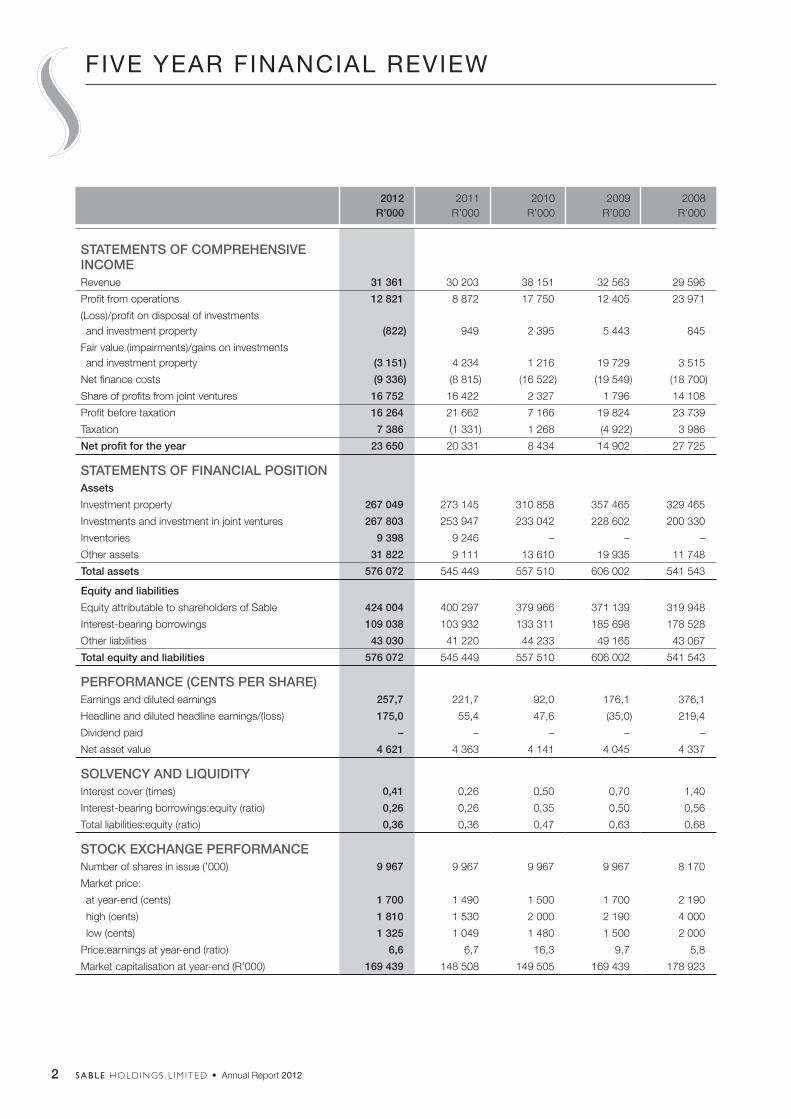
FIVE YEAR FINANCIAL REVIEW
2012R’000
2011R’000
2010R’000
2009R’000
2008R’000
STATEMENTS OF COMPREHENSIVE INCOMERevenue 31 361 30 203 38 151 32 563 29 596
Profit from operations 12 821 8 872 17 750 12 405 23 971
(Loss)/profit on disposal of investments and investment property (822) 949 2 395 5 443 845
Fair value (impairments)/gains on investments and investment property (3 151) 4 234 1 216 19 729 3 515
Net finance costs (9 336) (8 815) (16 522) (19 549) (18 700)
Share of profits from joint ventures 16 752 16 422 2 327 1 796 14 108
Profit before taxation 16 264 21 662 7 166 19 824 23 739
Taxation 7 386 (1 331) 1 268 (4 922) 3 986
Net profit for the year 23 650 20 331 8 434 14 902 27 725
STATEMENTS OF FINANCIAL POSITION Assets
Investment property 267 049 273 145 310 858 357 465 329 465
Investments and investment in joint ventures 267 803 253 947 233 042 228 602 200 330
Inventories 9 398 9 246 – – –
Other assets 31 822 9 111 13 610 19 935 11 748
Total assets 576 072 545 449 557 510 606 002 541 543
Equity and liabilities
Equity attributable to shareholders of Sable 424 004 400 297 379 966 371 139 319 948
Interest-bearing borrowings 109 038 103 932 133 311 185 698 178 528
Other liabilities 43 030 41 220 44 233 49 165 43 067
Total equity and liabilities 576 072 545 449 557 510 606 002 541 543
PERFORMANCE (CENTS PER SHARE)Earnings and diluted earnings 257,7 221,7 92,0 176,1 376,1
Headline and diluted headline earnings/(loss) 175,0 55,4 47,6 (35,0) 219,4
Dividend paid – – – – –
Net asset value 4 621 4 363 4 141 4 045 4 337
SOLVENCY AND LIQUIDITY
Interest cover (times) 0,41 0,26 0,50 0,70 1,40
Interest-bearing borrowings:equity (ratio) 0,26 0,26 0,35 0,50 0,56
Total liabilities:equity (ratio) 0,36 0,36 0,47 0,63 0,68
STOCK EXCHANGE PERFORMANCENumber of shares in issue (’000) 9 967 9 967 9 967 9 967 8 170
Market price:
at year-end (cents) 1 700 1 490 1 500 1 700 2 190
high (cents) 1 810 1 530 2 000 2 190 4 000
low (cents) 1 325 1 049 1 480 1 500 2 000
Price:earnings at year-end (ratio) 6,6 6,7 16,3 9,7 5,8
Market capitalisation at year-end (R’000) 169 439 148 508 149 505 169 439 178 923
3SABLE HOLDINGS L IM ITED • Annual Report 2012
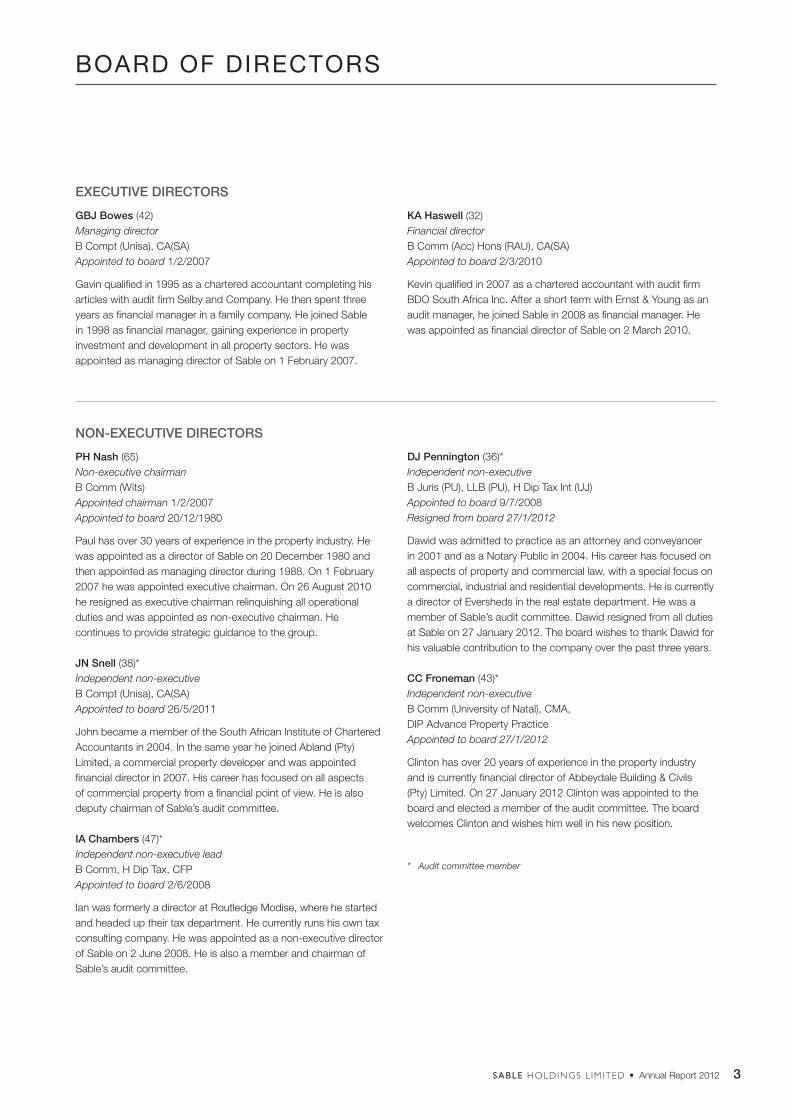
BOARD OF DIRECTORS
EXECUTIVE DIRECTORS
GBJ Bowes (42)Managing directorB Compt (Unisa), CA(SA)Appointed to board 1/2/2007
Gavin qualified in 1995 as a chartered accountant completing his articles with audit firm Selby and Company. He then spent three years as financial manager in a family company. He joined Sable in 1998 as financial manager, gaining experience in property investment and development in all property sectors. He was appointed as managing director of Sable on 1 February 2007.
NON-EXECUTIVE DIRECTORS
PH Nash (65)Non-executive chairmanB Comm (Wits)Appointed chairman 1/2/2007 Appointed to board 20/12/1980
Paul has over 30 years of experience in the property industry. He was appointed as a director of Sable on 20 December 1980 and then appointed as managing director during 1988. On 1 February 2007 he was appointed executive chairman. On 26 August 2010 he resigned as executive chairman relinquishing all operational duties and was appointed as non-executive chairman. He continues to provide strategic guidance to the group.
JN Snell (38)*Independent non-executiveB Compt (Unisa), CA(SA)Appointed to board 26/5/2011
John became a member of the South African Institute of Chartered Accountants in 2004. In the same year he joined Abland (Pty) Limited, a commercial property developer and was appointed financial director in 2007. His career has focused on all aspects of commercial property from a financial point of view. He is also deputy chairman of Sable’s audit committee.
IA Chambers (47)*Independent non-executive lead B Comm, H Dip Tax, CFPAppointed to board 2/6/2008
Ian was formerly a director at Routledge Modise, where he started and headed up their tax department. He currently runs his own tax consulting company. He was appointed as a non-executive director of Sable on 2 June 2008. He is also a member and chairman of Sable’s audit committee.
DJ Pennington (36)*Independent non-executiveB Juris (PU), LLB (PU), H Dip Tax Int (UJ)Appointed to board 9/7/2008Resigned from board 27/1/2012
Dawid was admitted to practice as an attorney and conveyancer in 2001 and as a Notary Public in 2004. His career has focused on all aspects of property and commercial law, with a special focus on commercial, industrial and residential developments. He is currently a director of Eversheds in the real estate department. He was a member of Sable’s audit committee. Dawid resigned from all duties at Sable on 27 January 2012. The board wishes to thank Dawid for his valuable contribution to the company over the past three years.
CC Froneman (43)*Independent non-executive B Comm (University of Natal), CMA, DIP Advance Property PracticeAppointed to board 27/1/2012
Clinton has over 20 years of experience in the property industry and is currently financial director of Abbeydale Building & Civils (Pty) Limited. On 27 January 2012 Clinton was appointed to the board and elected a member of the audit committee. The board welcomes Clinton and wishes him well in his new position.
* Audit committee member
KA Haswell (32)Financial directorB Comm (Acc) Hons (RAU), CA(SA)Appointed to board 2/3/2010
Kevin qualified in 2007 as a chartered accountant with audit firm BDO South Africa Inc. After a short term with Ernst & Young as an audit manager, he joined Sable in 2008 as financial manager. He was appointed as financial director of Sable on 2 March 2010.
4 SABLE HOLDINGS L IM ITED • Annual Report 2012
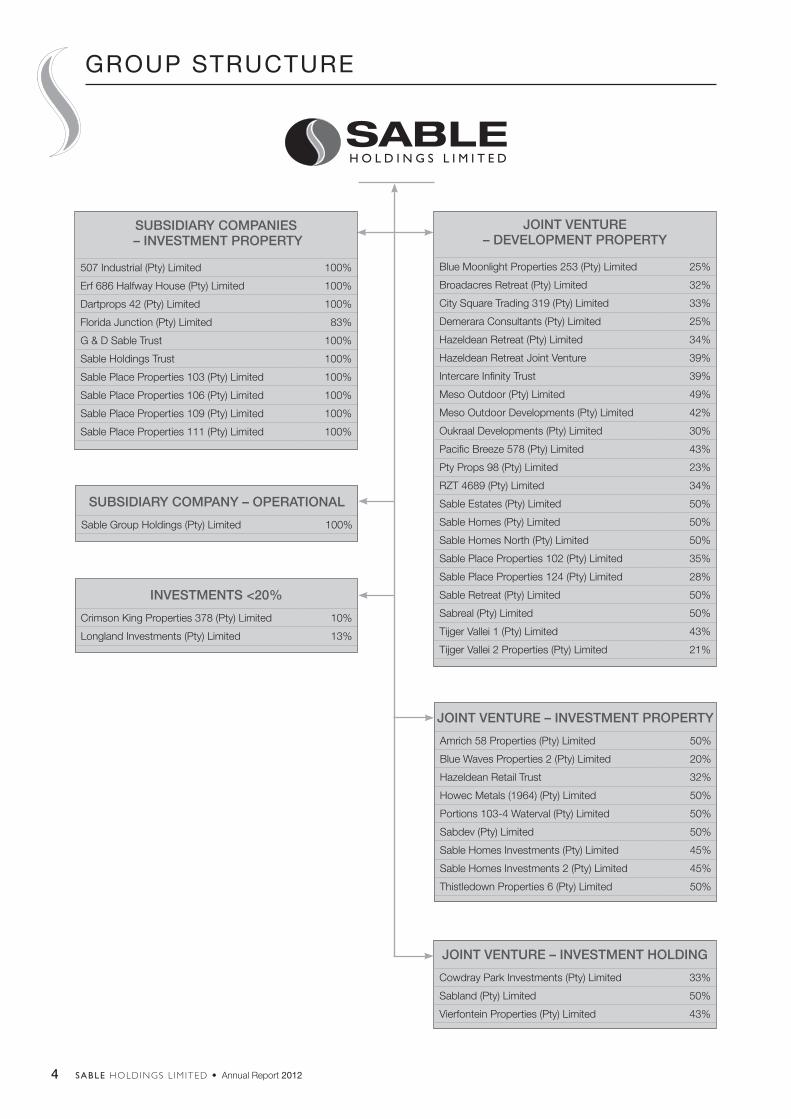
SUBSIDIARY COMPANIES – INVESTMENT PROPERTY
507 Industrial (Pty) Limited 100%
Erf 686 Halfway House (Pty) Limited 100%
Dartprops 42 (Pty) Limited 100%
Florida Junction (Pty) Limited 83%
G & D Sable Trust 100%
Sable Holdings Trust 100%
Sable Place Properties 103 (Pty) Limited 100%
Sable Place Properties 106 (Pty) Limited 100%
Sable Place Properties 109 (Pty) Limited 100%
Sable Place Properties 111 (Pty) Limited 100%
SUBSIDIARY COMPANY – OPERATIONAL
Sable Group Holdings (Pty) Limited 100%
INVESTMENTS <20%
Crimson King Properties 378 (Pty) Limited 10%
Longland Investments (Pty) Limited 13%
JOINT VENTURE – INVESTMENT HOLDING
Cowdray Park Investments (Pty) Limited 33%
Sabland (Pty) Limited 50%
Vierfontein Properties (Pty) Limited 43%
JOINT VENTURE – INVESTMENT PROPERTY
Amrich 58 Properties (Pty) Limited 50%
Blue Waves Properties 2 (Pty) Limited 20%
Hazeldean Retail Trust 32%
Howec Metals (1964) (Pty) Limited 50%
Portions 103-4 Waterval (Pty) Limited 50%
Sabdev (Pty) Limited 50%
Sable Homes Investments (Pty) Limited 45%
Sable Homes Investments 2 (Pty) Limited 45%
Thistledown Properties 6 (Pty) Limited 50%
JOINT VENTURE – DEVELOPMENT PROPERTY
Blue Moonlight Properties 253 (Pty) Limited 25%
Broadacres Retreat (Pty) Limited 32%
City Square Trading 319 (Pty) Limited 33%
Demerara Consultants (Pty) Limited 25%
Hazeldean Retreat (Pty) Limited 34%
Hazeldean Retreat Joint Venture 39%
Intercare Infinity Trust 39%
Meso Outdoor (Pty) Limited 49%
Meso Outdoor Developments (Pty) Limited 42%
Oukraal Developments (Pty) Limited 30%
Pacific Breeze 578 (Pty) Limited 43%
Pty Props 98 (Pty) Limited 23%
RZT 4689 (Pty) Limited 34%
Sable Estates (Pty) Limited 50%
Sable Homes (Pty) Limited 50%
Sable Homes North (Pty) Limited 50%
Sable Place Properties 102 (Pty) Limited 35%
Sable Place Properties 124 (Pty) Limited 28%
Sable Retreat (Pty) Limited 50%
Sabreal (Pty) Limited 50%
Tijger Vallei 1 (Pty) Limited 43%
Tijger Vallei 2 Properties (Pty) Limited 21%
GROUP STRUCTURE
5SABLE HOLDINGS L IM ITED • Annual Report 2012
CHAIRMAN’S REPORT
OVERVIEW OF RESULTSThe group reported a net profit of R23,7 million (2011: R20,3 million) for the year ended 30 June 2012. Earnings per share increased by 16,2% from 221,7 cents to 257,7 cents, with no dilution in either year, whilst headline earnings per share increased by 215,9% from 55,4 cents to 175,0 cents per share.
INVESTMENT OVERVIEWInvestment properties increased from R684,3 million to R693,6 million. Sable’s investment property portfolio is categorised into two categories, namely wholly and jointly-owned property, as discussed separately below.
Wholly-ownedInvestment property decreased from R273,1 million to R267,1 million.
Sable has commenced along with fellow shareholder Abland, the 35 000m² upmarket commercial park development known as Hertford Office Park, located in Midrand, Johannesburg. Development costs to date amount to R14,0 million. Fairlands Shopping Centre was disposed of for R16,6 million. A further two mini units located in Laserdowns, Johannesburg, have been disposed of for R3,2 million. Commercial office leasing still remains challenging with rental rates remaining static as most property owners endeavour to re-sign leases at competitive rental rates.
Jointly-ownedInvestment property increased from R411,2 million to R426,5 million, with the major identifiable aspects discussed below:
Hobart Grove Shopping Centre The R68,0 million re-development of Hobart Grove Retail Shopping Centre located in Bryanston, Johannesburg, has completed its first year of trade. With anchor tenants such as Super Spar, Tops, La Campagnola restaurant, Simply Asia and many other quality retail offerings, the centre continues to trade well despite the newly opened regional mall in Bryanston, Johannesburg.
Visiomed Office ParkOffice sectional title located in Northcliff, Johannesburg, has been earmarked for sale and to date 800m2 of the original 4 200m2 acquired has been sold for R8,1 million.
Hazeldean Retreat Residential development located in Hazeldean, Pretoria East, continues unabated with the third, fourth and fifth phases of the retirement village, assisted-living apartments and traditional family cluster units being launched. Sales in regard to these offerings are encouraging with quality and affordability being paramount in achieving sustained home buying interest.
Hazeldean Square Shopping CentreThe centre has recently added an Engen petrol station to its offering and the centre now boasts 17 938m² of gross lettable area. The better-quality tenant mix has improved rental cashflow and customer patronage.
Gosforth Park and Longland The unbundling disposal of 60 694m² industrial zoned land situated in Gosforth Park, Germiston, Johannesburg, to a development company in which Sable is a 50% co-owner, allows for a more proactive rollout of large industrial warehousing developments within a 273 000m² industrial estate. A similar share restructure and land disposal is currently being concluded at a commercial site next to Montecasino, Fourways, Johannesburg.
CORPORATE ACTIVITY – DELISTINGThe company’s board of directors are considering a possible delisting of the company’s shares from the JSE. Any delisting proposal would be accompanied by a cash offer (at a price verified by an independent expert as being fair, subject to directors’ approval) to be made to all shareholders who wish to monetise their investment in the company. Discussions in this regard are ongoing and accordingly shareholders are advised to continue to exercise caution when dealing in their shares in the company.
PROSPECTSSable, with its joint venture partner, is investigating the feasibility of an R80,0 million conversion of two existing properties in Midrand, Johannesburg, into an 8 361m² retail shopping centre with national anchors and franchisee retailers. The development is subject to pre-requisite leasing, financing and town planning conditions. To date letters of intent have been signed with Pick ’n Pay and Food Lovers Market which will account for 52% of the gross lettable area. Further interest has been shown by national line shops which will complement the strong tenant offering.
APPRECIATION AND THANKS
Sable has enjoyed a year of operational and asset consolidation, which has seen management identify and dispose of lesser performing assets whilst continuing to invest funds into new property assets within Sable’s development portfolio. Sable’s team has enjoyed a fruitful year in which growth projects within its existing portfolio are being exploited. A special word of appreciation to the Sable team is extended.
PH NashChairman
5 December 2012Sandton
6 SABLE HOLDINGS L IM ITED • Annual Report 2012
DIRECTORS’ REVIEW OF OPERATIONS
The directors have pleasure in presenting the directors’ review of operations for the year ended 30 June 2012.
DIRECTORS’ COMMENTARY ON RESULTSComparative analysis between 30 June 2012 and 30 June 2011The group reported a net profit of R23,7 million (2011: R20,3 million) for the year ended 30 June 2012. Earnings per share increased by 16,2% from 221,7 cents to 257,7 cents, with no dilution in either year, whilst headline earnings per share increased by 215,9% from 55,4 cents to 175,0 cents per share. Operating profit for the year was R12,8 million (2011: R8,9 million) whilst disposals and fair value adjustments on investments and investment property resulted in a net loss of R4,0 million (2011: R5,2 million – net gain). Share of profit from joint ventures reported for the year was R16,8 million (2011: R16,4 million), of which fair value adjustments and disposals were R13,5 million (2011: R15,3 million).
Consolidated condensed statement of comprehensive incomeRevenue for the year increased by 3,9% from R30,2 million to R31,4 million owing to better occupancy levels achieved within the group as well as recognising the impact on billing of disposals of industrial and commercial investment property in 2011 valued at R40,6 million.
(Loss)/profit on disposal of investments and investment property decreased from a profit of R0,9 million to a loss of R0,8 million. A R1,0 million loss was incurred on the disposal of Fairlands Shopping Centre, due to the disposal value being below stated fair value. Investments in listed shares were disposed of at a profit of R0,2 million during the year.
Fair value (impairment)/gains on investments and investment property decreased from a net gain of R4,2 million to a net impairment of R3,2 million. The net impairment was attributable to Norbuy Office Park and Patterson Candy, a commercial and industrial park respectively, that were revalued to cost due to high vacancy levels within these parks.
Finance costs, net of investment and finance income, increased from R8,8 million to R9,3 million. The increase in finance costs was attributable to increased borrowings required to fund the new office building development at Hertford Office Park, located in Midrand, Johannesburg.
Share of profit from joint ventures increased from R16,4 million to R16,8 million. Profit from operations increased from R5,0 million to R5,7 million. Fair value gains and profit from disposal of investment property decreased from R11,4 million to R11,0 million. The most
notable movements during the year were as follows: Hobart Grove Retail Shopping Centre and Visiomed Office Park were revalued for the first time and yielded fair value gains of R5,5 million and R3,7 million respectively. The Amrich property portfolio reflected a fair value increase of R5,6 million.
Taxation for the year ended increased from a taxation charge of R1,3 million to a taxation credit of R7,4 million. This is due to the change in method of calculating deferred taxation on investment property based on the early adoption of the amendment to IAS 12: Rebuttable presumption introduced that investment property would be recovered through sale, being at the capital gains taxation rate of 18,67%. The adoption had no material impact on prior year figures.
Consolidated statement of financial position as at 30 June 2012Investment propertyInvestment property, which comprises wholly and jointly-owned properties and investments, has increased from R684,3 million to R693,6 million. The review of each category is noted below.
Investment property (wholly-owned) has decreased from R273,1 million to R267,1 million. This is due to the disposal of Fairlands Shopping Centre for R16,6 million. Development costs of R14,0 million were, however, invested in Hertford Office Park. An industrial park located in Laserdowns, Johannesburg, has been disposed of for R3,2 million and has been classified as a non-current asset held for sale.
Investment property (jointly-owned) has increased from R376,8 million to R392,3 million. This is due to the fair value gains of R15,3 million, loss on disposal of investment property R1,8 million and additions of R1,9 million.
Investment property (investments) has remained unchanged over the past year and is valued at R34,2 million.
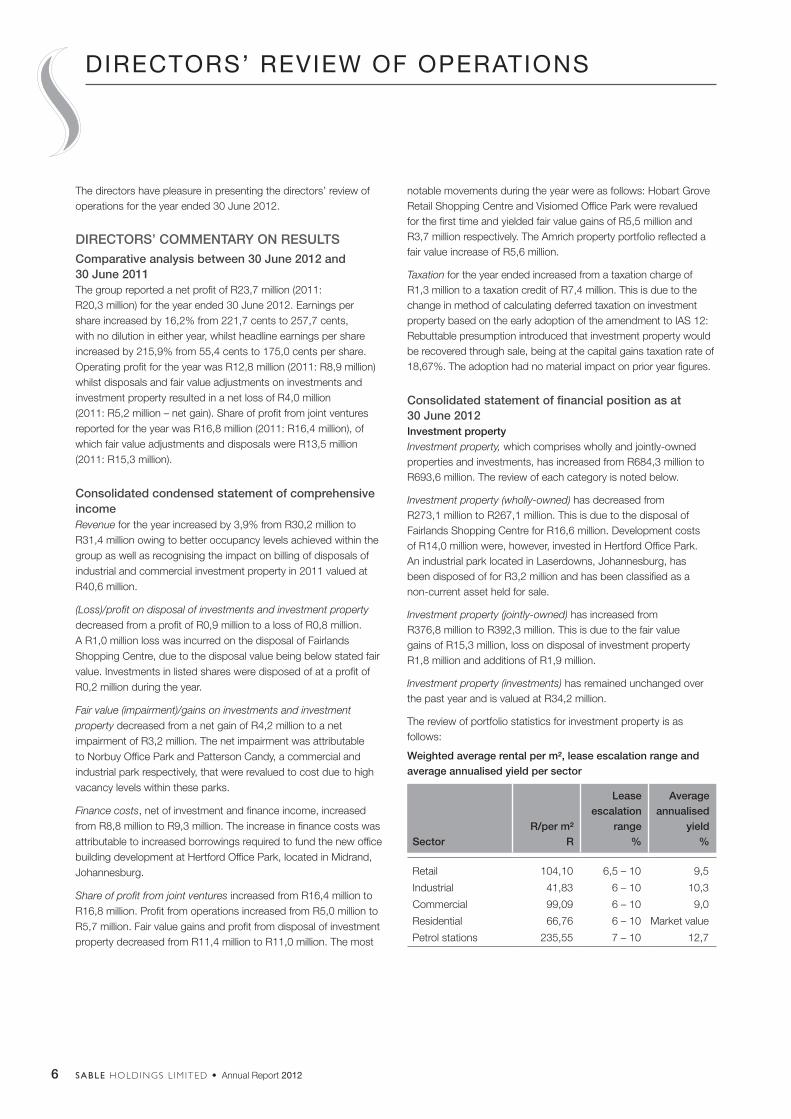
The review of portfolio statistics for investment property is as follows:
Weighted average rental per m², lease escalation range and average annualised yield per sector
SectorR/per m²
R
Leaseescalation
range %
Average annualised
yield%
Retail 104,10 6,5 – 10 9,5
Industrial 41,83 6 – 10 10,3
Commercial 99,09 6 – 10 9,0
Residential 66,76 6 – 10 Market value
Petrol stations 235,55 7 – 10 12,7
7SABLE HOLDINGS L IM ITED • Annual Report 2012
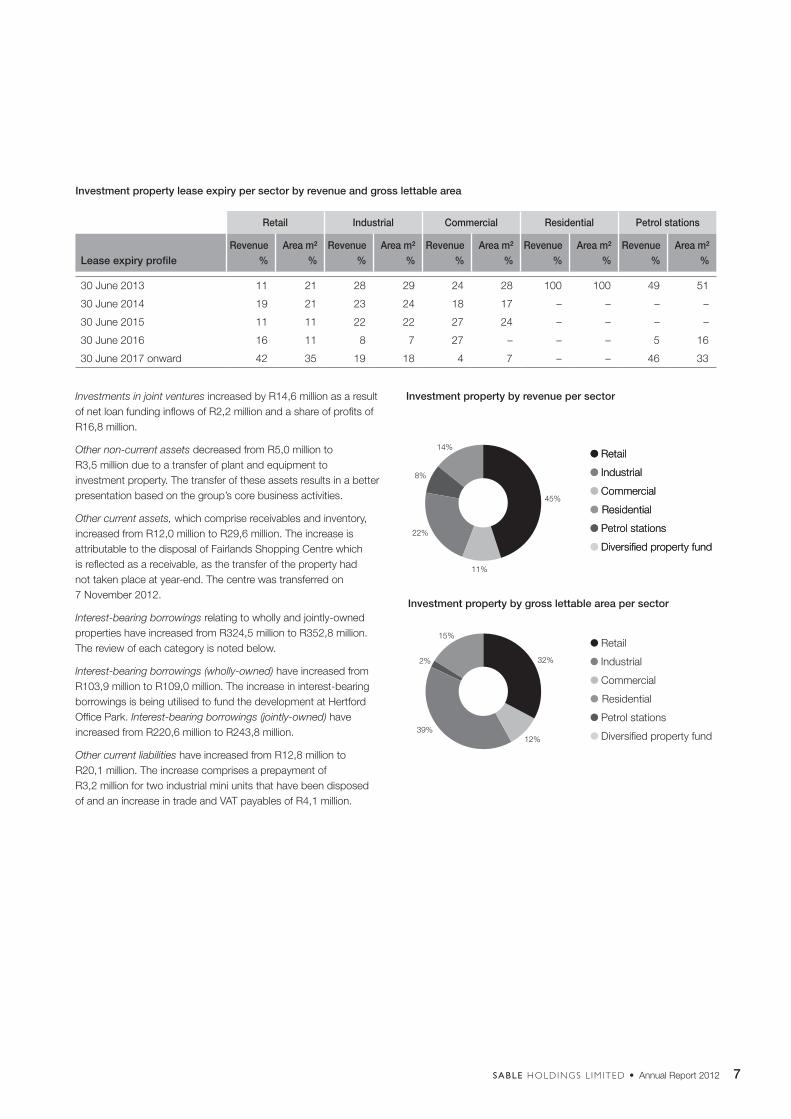
Investment property lease expiry per sector by revenue and gross lettable area
Retail Industrial Commercial Residential Petrol stations
Lease expiry profileRevenue
%Area m²
%Revenue
%Area m²
%Revenue
%Area m²
%Revenue
%Area m²
%Revenue
%Area m²
%
30 June 2013 11 21 28 29 24 28 100 100 49 51
30 June 2014 19 21 23 24 18 17 – – – –
30 June 2015 11 11 22 22 27 24 – – – –
30 June 2016 16 11 8 7 27 – – – 5 16
30 June 2017 onward 42 35 19 18 4 7 – – 46 33
Investments in joint ventures increased by R14,6 million as a result of net loan funding inflows of R2,2 million and a share of profits of R16,8 million.
Other non-current assets decreased from R5,0 million to R3,5 million due to a transfer of plant and equipment to investment property. The transfer of these assets results in a better presentation based on the group’s core business activities.
Other current assets, which comprise receivables and inventory, increased from R12,0 million to R29,6 million. The increase is attributable to the disposal of Fairlands Shopping Centre which is reflected as a receivable, as the transfer of the property had not taken place at year-end. The centre was transferred on 7 November 2012.
Interest-bearing borrowings relating to wholly and jointly-owned properties have increased from R324,5 million to R352,8 million. The review of each category is noted below.
Interest-bearing borrowings (wholly-owned) have increased from R103,9 million to R109,0 million. The increase in interest-bearing borrowings is being utilised to fund the development at Hertford Office Park. Interest-bearing borrowings (jointly-owned) have increased from R220,6 million to R243,8 million.
Other current liabilities have increased from R12,8 million to R20,1 million. The increase comprises a prepayment of R3,2 million for two industrial mini units that have been disposed of and an increase in trade and VAT payables of R4,1 million.
Investment property by revenue per sector
8%
14%
11%
22%
45%
Retail
Industrial
Commercial
Residential
Petrol stations
Diversified property fund
Retail
Industrial
Commercial
Residential
Petrol stations
Diversified property fund
Retail
Industrial
Commercial
Residential
Petrol stations
Diversified property fund
Investment property by gross lettable area per sector
2%
15%
12%39%
32%
8 SABLE HOLDINGS L IM ITED • Annual Report 2012
INTEGRATED REPORTING
Sable hereby presents the group’s second integrated annual report aimed at meeting the principles outlined in the King Code of Governance Principles for South Africa 2009 (“King III”).
There are areas where Sable can improve its reporting and is therefore committed to addressing these areas in subsequent years of the integrated report. Integrated reporting will no doubt improve and provide stakeholders with an insight into Sable’s activities for the year.
BUSINESS ACTIVITYSable is a public company, registered in South Africa, with a listing on the Alt-X Board of the JSE. Sable is a property investment company with interests in various property-related activities. Sable also manages a sizeable portion of its portfolio of investment property.
INTEGRATED REPORTThe integrated report will discuss financial and sustainability issues and identifies key stakeholders.
FINANCIAL AND SUSTAINABILITYSable’s primary objective is building strong contractual cashflows from its investment property portfolio resulting in long-term sustainable capital appreciation of its net asset value. Sable aims to actively build relationships with tenants, suppliers and key suppliers of capital. Community involvement, although in its initial stages, will become more important in the near future.
KEY STAKEHOLDERSSable is accountable to all its stakeholders. This report aims to provide the various categories of stakeholders with essential, practical and user-friendly information. Sable has identified the following key stakeholder categories:
Financial stakeholdersStakeholders – Institutional, individual and corporate investors. Providers of capital – commercial and investment banks.
Commercial stakeholdersTenants who occupy available retail, commercial, industrial and residential lettable area.
Community stakeholdersServices provided by suppliers include security, cleaning, maintenance, construction and other property related services. General public, direct neighbours and surrounding communities.
Other stakeholdersSable also recognises the government as well as its own employees as stakeholders.
RISK MANAGEMENTThe risk management process identifies, assesses and monitors any risks to which the group is exposed. It further recommends and monitors mitigation strategies. The board is cognisant of the need to set the levels of risk tolerance and formalise the risk management policy of the group. The risk management process will be reviewed further in 2013.
9SABLE HOLDINGS L IM ITED • Annual Report 2012
CORPORATE GOVERNANCE
Sable subscribes to ethical standards and principles of corporate governance. The group’s corporate governance practices are a platform to meet the board’s objective in building strong contractual cashflows from its investment property portfolio resulting in long-term sustainable capital appreciation of its net asset value.
REGULATORY ENVIRONMENTSable is a group incorporated in South Africa under the Companies Act 2008, as amended (“Companies Act”). The group operates in South Africa and is listed on the Alt-X Board of the JSE.
APPLICATION OF KING IIIThe Sable board subscribes to the fundamental principles of good financial, social, ethical and environmental practice as set out in the King III report and the King Report on Governance for South Africa 2009. The board is in the process of reviewing King III recommendations and applying the recommendations on an on-going basis.
The directors acknowledge that they are responsible for implementing practices of good governance and that the company no longer acts independently from the societies and the environment in which it operates. The board is aware that shareholders and stakeholders have become insistent on high standards of corporate governance requiring increasing levels of transparency, integrity, openness and accountability by directors.
STATEMENT OF NON-APPLICATIONThe board has conducted a full assessment of its compliance to King III. With the possibility of the company delisting it’s shares from the JSE, the board has applied these recommendations noted below at a board level and further not created additional committees during the year. Should the delisting of the company’s shares not proceed successfully, the board is ready to apply the additional King III requirements with immediate effect. Whilst the board is of the opinion that the group complies in all material respects with the principles embodied in King III, it notes the following exceptions:
Governance element Principles not fully applied which will be focused on in 2013 and 2014
Ethical leadership and corporate citizenship • A social and ethics committee is currently being formalised by the board and will be implemented in 2013.
Board and directors • A new board charter is currently being reviewed by the board and will be formally adopted in 2013.
• A formal board evaluation in respect of composition, independence, skills and performance is planned for 2013.
• The group has appointed a managing director and a financial director who, for the purposes of King III, are the CEO (“chief executive officer”) and the CFO (“chief financial officer”) respectively.
• Board committees – nomination and remuneration committees are being considered for formalisation in 2013. No risk committee has been formed as the board considers this function to be fulfilled by the audit committee.
• The board will seek to implement and develop a formal remuneration policy for 2013.
Board governance of risk • The board has assigned this responsibility to the audit committee and will address a policy for risk management within the audit committee in 2013.
The governance of information technology • An information technology charter and policy will be addressed in 2013.
Internal audit • The audit committee decided, based on the size, nature and scope of the group audit, that an internal audit function is not required.
Governing stakeholder relationships • The formal dispute resolution process will be developed by the board in 2013.
Integrated reporting and disclosure • The board will be improving the integrated report during 2013.
10 SABLE HOLDINGS L IM ITED • Annual Report 2012
• The audit committee having independent non-executive directors;
• All directors having access to the advice and services of the company secretary; and
• A lead independent director being appointed due to the chairman not being independent. PH Nash (chairman) is a representative of the main shareholder of Sable.
KEY ACTIVITIESDuring the year, the board, along with the executive committee, performed key activities, including the consideration of:• Attendance of the Alt-X directors induction course by the
majority of the directors which will assist in improving corporate governance;
• Re-assessing the group’s percentage of interest-bearing borrowing facilities which are not fixed in terms of group policy;
• The application of the new Companies Act; and• Ensuring all suretyships and financial assistance given to
subsidiaries and joint ventures within the group, were approved as required by the Companies Act.
The board further has further initiated the following processes:• Review of all areas of King III non-application;• Appointment of a new designated advisor;• Appointment of a new company secretary;• The improvement of the integrated report for 2013; and• Consideration of the Consumer Protection Act.
BOARD AND COMPANY SECRETARY EVALUATIONBoard evaluationA self-review of the composition, independence, skills and performance of the board will be conducted during the year ending 30 June 2013.
Company secretary evaluationThe board has assessed Brendan Graham, company secretary to have the necessary qualifications, competence and expertise to meet his responsibilities in his position, as required by the JSE and the Companies Act.
BOARD OF DIRECTORSComposition and appointment of directorsThe details of the directors appear on page 3 of the annual report.
DirectorsAt the date of the report, the board consisted of six directors:
Non-executive director:PH Nash (chairman)
Executive directors:GBJ Bowes (managing director) KA Haswell (financial director)
Independent non-executive directors:IA Chambers (lead independent) JN Snell CC Froneman
The Sable board operates a unitary board, consisting of two executive directors, three independent non-executive directors and one non-executive director. The roles of chairperson and managing director are separated. An independent lead director has also been appointed, as the chairman of the board is not considered to be independent. The board aims to ensure that there is an appropriate balance of power and authority on the board, such that no one individual has unfettered powers of decision making. Management and governance of the group is ensured through frequent management meetings. This encompasses participating in and monitoring the progress of strategic direction and policy, acquisitions and disposals, the approval of major capital expenditure, consideration of significant financial matters and reviewing the activities of executive management. All directors are, in terms of the Memorandum of Incorporation (“MoI”), subject to retirement by rotation to re-election by shareholders. Any director can call for an informal meeting. Appointments to the board for new directorships are formalised and nominated by the board.
INDEPENDENCE OF DIRECTORSThe board of directors’ independence from the executive management team is ensured by the following:• Separation of the roles of chairman and managing director;• The board being dominated by non-executive directors;
CORPORATE GOVERNANCECONTINUED
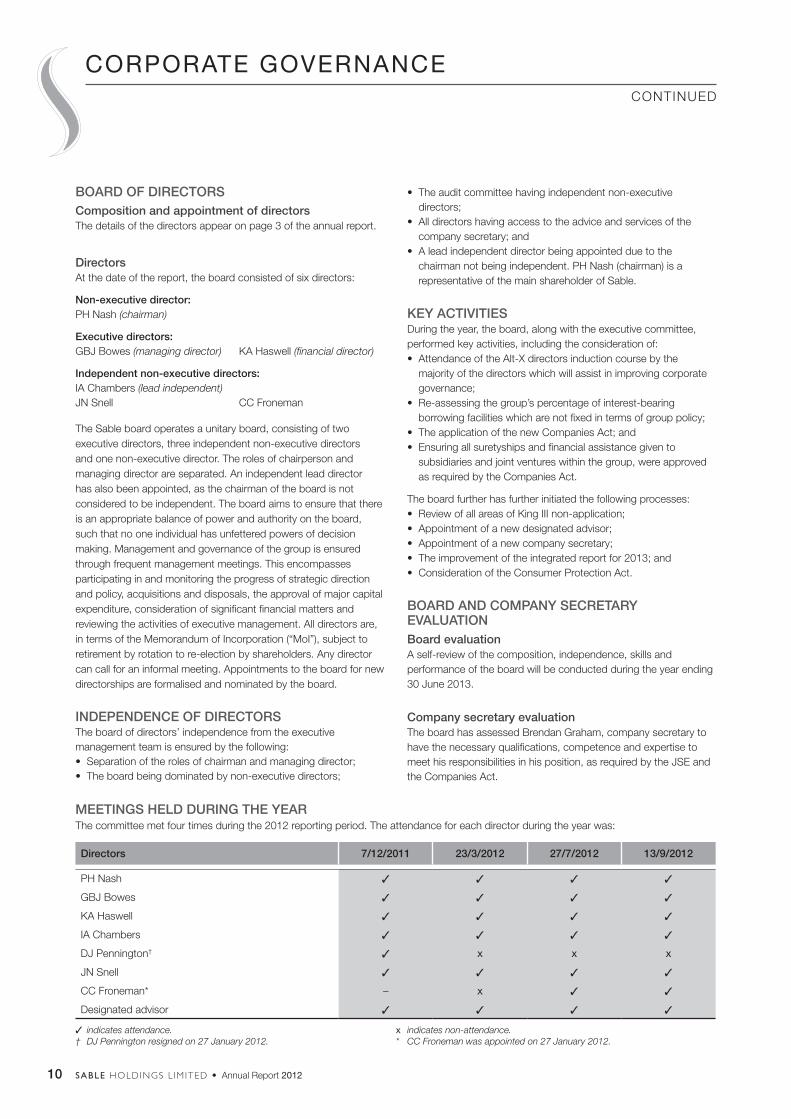
MEETINGS HELD DURING THE YEARThe committee met four times during the 2012 reporting period. The attendance for each director during the year was:
Directors 7/12/2011 23/3/2012 27/7/2012 13/9/2012
PH Nash 3 3 3 3
GBJ Bowes 3 3 3 3
KA Haswell 3 3 3 3
IA Chambers 3 3 3 3
DJ Pennington† 3 x x x
JN Snell 3 3 3 3
CC Froneman* – x 3 3
Designated advisor 3 3 3 3
3 indicates attendance. x indicates non-attendance.† DJ Pennington resigned on 27 January 2012. * CC Froneman was appointed on 27 January 2012.
11SABLE HOLDINGS L IM ITED • Annual Report 2012
AUDIT COMMITTEEThe current members of this committee are IA Chambers (chairman), JN Snell (deputy chairman) and newly appointed CC Froneman. The report by the audit committee is set out on pages 14 and 15 of the annual report.
REMUNERATION FORMAL POLICYThe company has no formal remuneration committee. This responsibility has been delegated to the board. The board meets on an annual basis to discuss matters concerning directors’ remuneration, salary increases, bonus payments and other relevant issues. Refer to the directors’ and prescribed officer’s remuneration note in the directors’ report. The non-executive directors do not hold service contracts and their remuneration is not linked to the performance of Sable. The remuneration of the top three employees other than the directors will be disclosed in the 2013 annual report.
ETHICAL STANDARDSThe group’s code of ethics commits to the highest standards of integrity, conduct and ethics in dealing with all parties concerned, including directors, managers, employees, customers, competitors, investors, shareholders and the public in general. The directors and staff are expected to fulfil their ethical obligations in such a way that the business is run strictly according to fair commercial competitive practices.
EMPLOYMENT EQUITYSable is committed to creating and maintaining an environment that provides equal opportunities to all its employees, with special consideration to historically disadvantaged groups.
Sable undertakes to:• Promote the constitutional right of equality;• Eliminate unfair discrimination in employment;• Pursue a diverse workforce, which is representative of its people;• Promote economic development and efficiency in the workforce;• Re-address historical, legal, social and economic discrimination;
and• Establish conditions which will further the creation of equality of
opportunity and development for all employees.
COMMUNICATIONCommunication by the board of directors addresses matters that are of material interest and concern to Sable’s shareholders and other stakeholders. The quality of information is based on the guidelines of promptness, relevance, openness and substance over form. All employees are required to maintain the highest level of professionalism and integrity in ensuring that the group’s business practices are conducted in a manner which is above reproach in all reasonable circumstances.
PH Nash GBJ BowesChairman Managing Director
5 December 2012Sandton
DEALING IN SECURITIES BY DIRECTORS, PRESCRIBED OFFICERS AND SENIOR EMPLOYEESThe chairman has to approve any buy or sell transaction by directors, prescribed officers and senior employees in Sable. Directors, prescribed officers and senior employees’ dealings in the company’s shares are subject to the rules and requirements of the JSE. During the year no director, prescribed officer or senior employee traded in any securities of Sable.
COMPANY SECRETARYAll directors have unfettered access to the company secretary who, inter alia, is responsible for ensuring that good corporate governance is followed with regard to board matters. It will require a decision of the board as a whole to remove the company secretary, should this become necessary. Directors’ information packs are prepared before each board meeting so as to fully inform the directors of the issues at hand. Directors are furthermore entitled to ask questions to any personnel and have unrestricted access to all company documentation, information and property.
ACCESS TO INFORMATIONWhere deemed necessary, the company and its directors make use of independent professional consultants, in relation to any legal and accounting matters pertaining to the company’s business. All these costs are borne by the company.
COMPLIANCE WITH LAWS, CODES, RULES AND STANDARDSThe board is not aware of any contravention of any law, codes, rules or standards during the current year.
INTERNAL CONTROLThe board is responsible for the company’s system of internal control. The board, supported by the audit committee, reviews the company’s risk profile annually. Responsibility for the adequacy, extent and operation of these systems is delegated to the executive directors. To fulfil this responsibility, accounting records and appropriate systems of internal control are developed and maintained. The directors report that the company’s internal controls and systems are designed to provide reasonable, but not absolute, assurance as to the integrity and reliability of the financial statements, to safeguard, verify and maintain accountability for its assets and to detect and minimise fraud, potential liability, loss and material misstatement, while complying with applicable laws and regulations.
BOARD COMMITTEESThe group has two board committees covering defined aspects of its responsibilities. The audit committee is chaired by a lead non-executive director. The committee operates transparently and reports to the board. The board is satisfied that the audit committee has fulfilled its responsibilities in line with its respective terms of reference for the year under review. The board has assessed the viability of both a nomination and risk committee. Although recommended by King III, the board has assessed the group to be too small to warrant a nomination or risk committee. The main board will assume the responsibility of these committees if required. An ethics committee charter is being drafted for 2013.
12 SABLE HOLDINGS L IM ITED • Annual Report 2012
DIRECTORS’ RESPONSIBILITY STATEMENT
COMPANY SECRETARY’S REPORT
The annual financial statements set out on pages 16 to 55 are the responsibility of the directors. The directors are responsible for selecting and adopting sound accounting practices, for maintaining an adequate and effective system of accounting records, for the safeguarding of assets and for developing and maintaining a system of internal controls that, amongst other things, will ensure the preparation of annual financial statements that achieve fair presentation. The directors are satisfied that the annual financial statements comply with IFRS, AC 500 standards, Companies Act and the JSE Listings Requirements. The annual financial statements have been audited in compliance with all applicable requirements of the Companies Act. After conducting appropriate procedures, the directors are satisfied that the company will be a going concern for the foreseeable future and have continued to adopt the going concern basis in preparing the annual financial statements. The annual financial statements were published on 14 December 2012. KA Haswell CA (SA), financial director of Sable, prepared the June 2012 annual financial statements. The annual financial statements were approved by the directors and are signed on their behalf by:
GBJ Bowes KA HaswellManaging director Financial director
5 December 2012Sandton
In my capacity as company secretary, I hereby confirm that, in terms of section 33 together with section 88 of the Companies Act, 2008, as amended, for the year ended 30 June 2012, the company has lodged with the Companies and Intellectual Properties Commissions, all such returns as are required of a public company in terms of this Act and that all such returns are true, correct and up-to-date.
B GrahamWatermans North Registered AuditorsCompany secretary
5 December 2012Sandton
13SABLE HOLDINGS L IM ITED • Annual Report 2012
INDEPENDENT AUDITORS’ REPORT
TO THE SHAREHOLDERS OF SABLE HOLDINGS LIMITEDWe have audited the group annual financial statements and annual financial statements of Sable Holdings Limited, which comprise the consolidated and separate statements of financial position as at 30 June 2012 and the consolidated and separate statements of comprehensive income, changes in equity and cash flows for the year then ended, and a summary of significant accounting policies and other explanatory notes, and the directors’ report, as set out on pages 16 to 55.
DIRECTORS’ RESPONSIBILITY FOR THE FINANCIAL STATEMENTSThe company’s directors are responsible for the preparation and fair presentation of these financial statements in accordance with International Financial Reporting Standards and in the manner required by the Companies Act of South Africa. This responsibility includes: designing, implementing and maintaining internal controls relevant to the preparation and fair presentation of financial statements that are free from material misstatement, whether due to fraud or error; selecting and applying appropriate accounting policies; and making accounting estimates that are reasonable in the circumstances.
AUDITORS’ RESPONSIBILITYOur responsibility is to express an opinion on these financial statements based on our audit. We conducted our audit in accordance with International Standards on Auditing. Those standards require that we comply with ethical requirements and plan and perform the audit to obtain reasonable assurance whether the financial statements are free from material misstatement. An audit involves performing procedures to obtain audit evidence about the amounts and disclosures in the financial statements. The procedures selected depend on the auditor’s judgement, including the assessment of the risks of material misstatement of the financial statements, whether due to fraud or error. In making those risk assessments, the auditor considers internal control relevant to the entity’s preparation and fair presentation of the financial statements in order to design audit procedures that are appropriate in the circumstances, but not for the purpose of expressing an opinion on the effectiveness of the entity’s internal control. An audit also includes evaluating the appropriateness of accounting policies used and the reasonableness of accounting estimates made by management, as well as evaluating the overall presentation of the financial statements. We believe that the audit evidence we have obtained is sufficient and appropriate to provide a basis for our audit opinion.
OPINIONIn our opinion, these financial statements present fairly, in all material respects, the consolidated and separate financial position of Sable Holdings Limited as at 30 June 2012 and its consolidated and separate financial performance and consolidated and separate cash flows for the year then ended in accordance with International Financial Reporting Standards and in the manner required by the Companies Act of South Africa.
MazarsRegistered AuditorPartner: Shaun VorsterRegistered Auditor
14 December 2012Johannesburg
14 SABLE HOLDINGS L IM ITED • Annual Report 2012
AUDIT COMMITTEE REPORT
and practices adopted in the preparation of the annual financial statements.
The company changed designated advisors during the year. On 1 July 2012 the mandate of Sasfin Capital, a division of Sasfin Bank Limited, was terminated and Java Capital Trustees and Sponsors (Proprietary) Limited was appointed as designated advisor to the company, with effect from 1 July 2012. The committee is satisfied that the audit staff had unhindered access to all financial records of the company. This has been confirmed in a meeting with the auditors.
MEETINGS OF THE AUDIT COMMITTEE – ITEMS ON THE AGENDAIn terms of the charter of the audit committee meeting, the audit committee meets three times per annum at which meetings the following issues were addressed:• Ratification of the previous year’s audit fee (refer to notes 3 and
4 of the annual report);• Discussions surrounding relevant changes in respect of IFRS,
Standards or Exposure Drafts that are effective in the current year and ensuring that the changes have been considered and where applicable effected;
• Review and approve the audit plan and ensure that it is consistent with the scope of the audit engagement;
• Discussion surrounding the annual report from the prior year and discussion of changes which should be implemented and considered for the current year’s annual report;
• Corporate governance issues;• Ratification and approval of the audit fee budget for the
company;• Presentation by the auditors of a report on the effectiveness of
internal controls tested, the application thereof and suggested improvements;
• Update obtained from auditors that the control environment and level of accounting competence was in accordance with their expectation in presenting their original budget;
• Discussion of the annual report skeleton and amendments thereto;
• Discussion of the auditor’s management report for joint ventures;• Discussion of the auditor’s management report;• Confirmation in conjunction with the auditors that the control
environment and level of accounting competence was in accordance with their expectations;
• Confirmation that the group budget is in line with the actual audit fee;
• Recommendation to the board for approval of the financial statements, interim results, group property valuations for the six months ended 31 December 2011; and
• Recommendation to the board for approval of the financial statements, annual report, group property valuations for the year ended 30 June 2012.
The audit committee’s report and recommendations are submitted to the board for approval. The primary role of the audit committee is to ensure the integrity of financial reporting and the audit process, and that sound risk management and internal control systems are maintained. In pursuing these objectives, the audit committee oversees relations with the external auditors. The activities of the audit committee are determined by its charter. The audit committee seeks to review its terms of reference to ensure alignment with the principles of King III and has been guided by the principles of King III in determining its charter.
COMPOSITION OF AUDIT COMMITTEE
Director Period of service
IA Chambers (chairman) 2/6/2008 – current
JN Snell (deputy chairman) 21/7/2011 – current
CC Froneman 23/3/2012 – current
DJ Pennington 9/7/2008 – 27/1/2012
The chairman has requisite experience in accounting and financial management as well as commercial experience to effectively chair the audit committee. The deputy chairman acts as a financial director of a large private company and has audit experience as well as extensive accounting and financial management experience. The members are independent non-executive directors of the company.
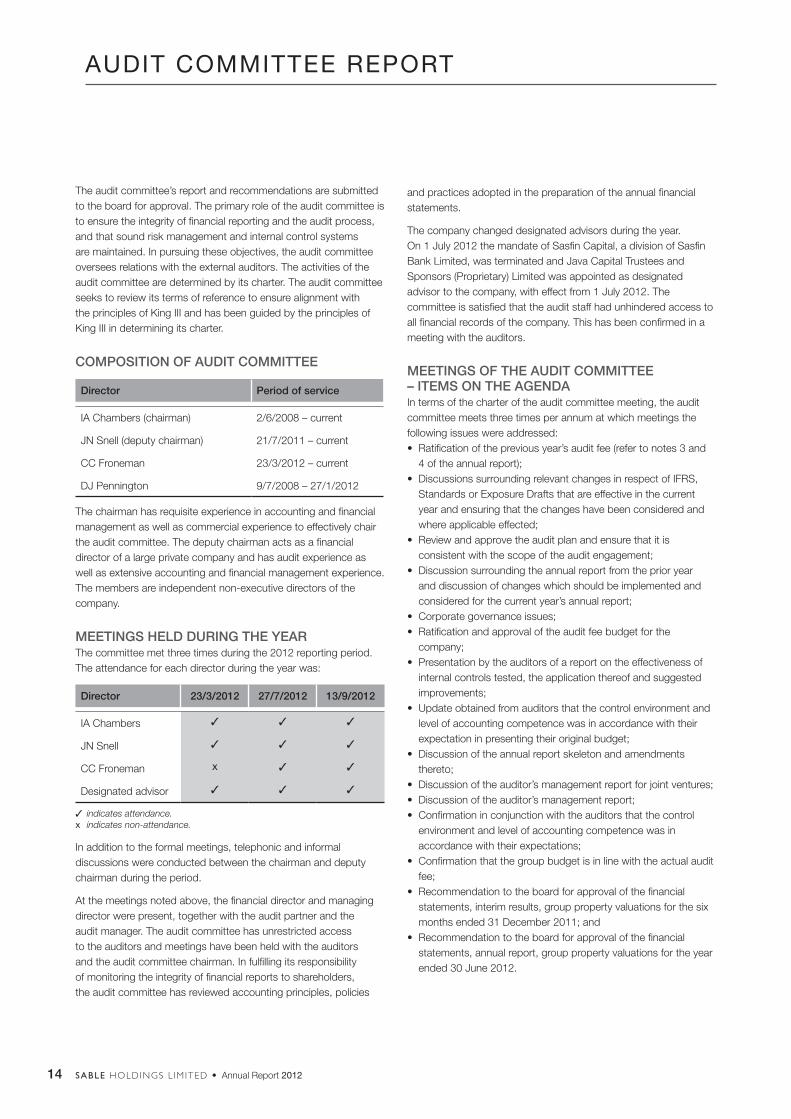
MEETINGS HELD DURING THE YEARThe committee met three times during the 2012 reporting period. The attendance for each director during the year was:
Director 23/3/2012 27/7/2012 13/9/2012
IA Chambers 3 3 3
JN Snell 3 3 3
CC Froneman x 3 3
Designated advisor 3 3 3
3 indicates attendance.x indicates non-attendance.
In addition to the formal meetings, telephonic and informal discussions were conducted between the chairman and deputy chairman during the period.
At the meetings noted above, the financial director and managing director were present, together with the audit partner and the audit manager. The audit committee has unrestricted access to the auditors and meetings have been held with the auditors and the audit committee chairman. In fulfilling its responsibility of monitoring the integrity of financial reports to shareholders, the audit committee has reviewed accounting principles, policies
15SABLE HOLDINGS L IM ITED • Annual Report 2012
EFFECTIVENESS OF INTERNAL CONTROLThe committee is satisfied as to the levels of internal control exercised by management.
REGULATORY COMPLIANCEThe audit committee has complied with all applicable legal and regulatory responsibilities.
COMPETENCE OF FINANCIAL DIRECTORThe committee believes that Mr KA Haswell, the group’s financial director, possesses the appropriate expertise and experience to meet his responsibilities in that position, as required by the JSE.
The committee is satisfied with the:• Expertise and adequacy of resources within the finance
function, and• Experience of the senior financial staff.
In making these assessments, the committee has obtained feedback from the external audit. Based on the processes and assurances obtained, the committee believes that the accounting practices are effective.
RECOMMENDATIONS OF AUDIT COMMITTEEBased on the processes and assurances obtained, the committee recommend that the board accept the results of the group for the year ended 30 June 2012 as confirmed by the external auditors of the company.
On behalf of the audit committee
IA ChambersAudit Committee Chairman
5 December 2012Sandton
EXTERNAL AUDITA key factor that may impair an auditor’s independence is a lack of control over non-audit services provided by the external auditors. In essence, the external auditor’s independence is deemed to be impaired if the auditors provide a service which:• Results in auditing of own work by the auditors;• Results in the auditors acting as a manager or employee
in the company; or• Creates a mutuality of interest between the auditors and the
company.
The company manages this potential conflict by ensuring that the audit committee agrees to and signs off on all non-audit work performed by the auditors. During the reporting period under review, the auditors conducted no non-audit work. The audit committee further ensures that the scope of the auditor’s work is sufficient and that the auditors are fairly remunerated. Finally, the audit committee has the primary responsibility for making recommendations to the board on the appointment, re-appointment and removal of the external auditors. The audit committee approved the external auditor’s terms of engagement, scope of work and the process for the 2012 interim and 2012 annual audit. Based on written reports received by the committee from the external auditors, the audit committee is satisfied with their findings and confirmed that all matters had been satisfactorily resolved.
A close co-operation has evolved between the auditors of the joint ventures and the company’s auditors, thereby enhancing the audit procedures and results.
Based on processes followed and assurances received, nothing has come to the committee’s attention with regard to the external auditor’s independence. Based on the committee’s satisfaction with the results of the activities outlined above, the committee has recommended to the board that Mazars should be reappointed for the financial year ending 30 June 2013.
INTERNAL AUDITDue to the size of the head office staff and the nature of the operations, the committee is satisfied that there is no need for the establishment of an internal audit division. This opinion will be re-assessed on an annual basis.
16 SABLE HOLDINGS L IM ITED • Annual Report 2012
Your directors have pleasure in presenting the annual report, which forms part of the audited annual financial statements of the group and company for the year ended 30 June 2012.
NATURE OF BUSINESSSable is a public company, registered in South Africa, with a listing on the Alt-X Board of the JSE Limited. Sable is a property investment company with interests in various property-related activities.
The property portfolio, as detailed in the group property portfolio on pages 54 and 55, comprises property investments and developments in property in the residential, industrial, commercial and retail sectors located in Gauteng and Cape Town, South Africa. There have been no changes in the nature of the business of the group or the company during the year.
FINANCIAL RESULTSThe statements of financial position and the statements of comprehensive income reflect the results of the operations of the group and the company for the year ended 30 June 2012.
ULTIMATE HOLDING COMPANYThe majority shareholder and ultimate holding company of the group is Isdale Holdings BV with a shareholding of 75,9%.
GROUP STRUCTUREThe group structure and activities of the group are presented on page 4 of this report.
REVIEW OF GROUP OPERATIONSThe financial statements and notes thereto on pages 16 to 58 set out fully the financial position, results of operations and cashflows of the group for the year.
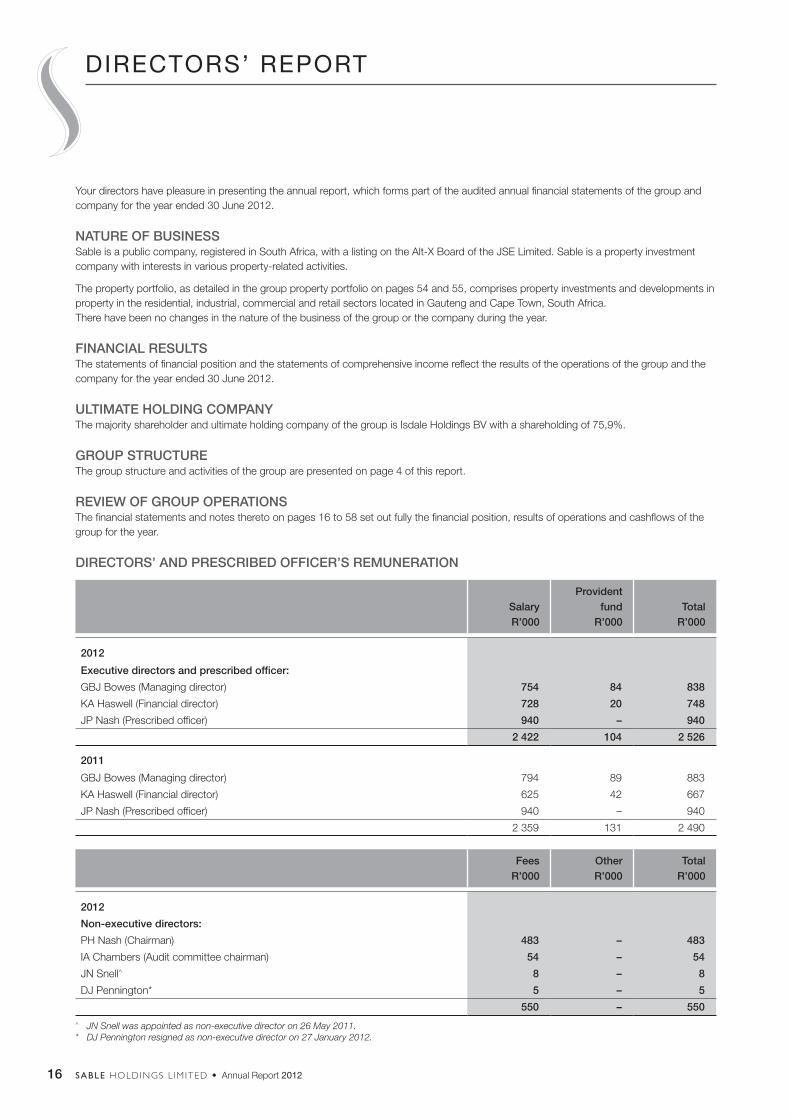
DIRECTORS’ AND PRESCRIBED OFFICER’S REMUNERATION
SalaryR’000
Provident fund
R’000Total
R’000
2012
Executive directors and prescribed officer:
GBJ Bowes (Managing director) 754 84 838
KA Haswell (Financial director) 728 20 748
JP Nash (Prescribed officer) 940 – 940
2 422 104 2 526
2011
GBJ Bowes (Managing director) 794 89 883
KA Haswell (Financial director) 625 42 667
JP Nash (Prescribed officer) 940 – 940
2 359 131 2 490
FeesR’000
OtherR’000
TotalR’000
2012
Non-executive directors:
PH Nash (Chairman) 483 – 483
IA Chambers (Audit committee chairman) 54 – 54
JN Snell^ 8 – 8
DJ Pennington* 5 – 5
550 – 550 ^ JN Snell was appointed as non-executive director on 26 May 2011.* DJ Pennington resigned as non-executive director on 27 January 2012.
DIRECTORS’ REPORT
17SABLE HOLDINGS L IM ITED • Annual Report 2012
FeesR’000
OtherR’000
TotalR’000
2011
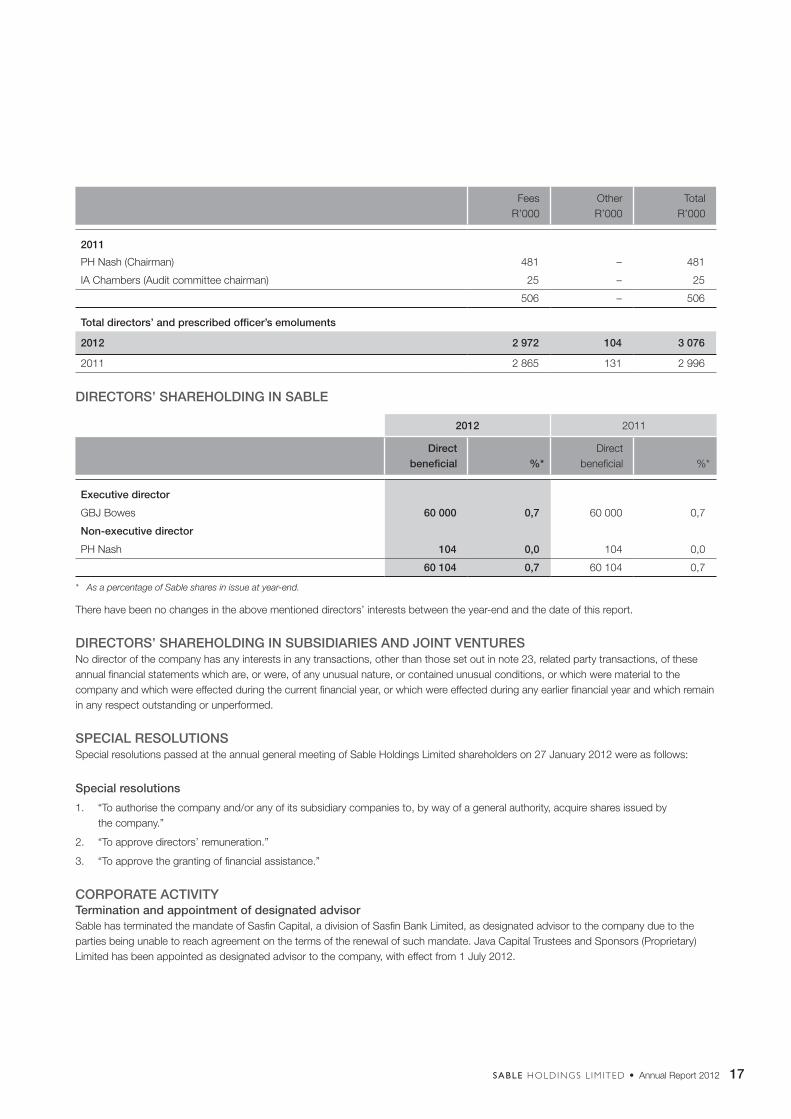
PH Nash (Chairman) 481 – 481
IA Chambers (Audit committee chairman) 25 – 25
506 – 506
Total directors’ and prescribed officer’s emoluments
2012 2 972 104 3 076
2011 2 865 131 2 996
DIRECTORS’ SHAREHOLDING IN SABLE
2012 2011
Direct beneficial %*
Direct beneficial %*
Executive director
GBJ Bowes 60 000 0,7 60 000 0,7
Non-executive director
PH Nash 104 0,0 104 0,0
60 104 0,7 60 104 0,7
* As a percentage of Sable shares in issue at year-end.
There have been no changes in the above mentioned directors’ interests between the year-end and the date of this report.
DIRECTORS’ SHAREHOLDING IN SUBSIDIARIES AND JOINT VENTURESNo director of the company has any interests in any transactions, other than those set out in note 23, related party transactions, of these annual financial statements which are, or were, of any unusual nature, or contained unusual conditions, or which were material to the company and which were effected during the current financial year, or which were effected during any earlier financial year and which remain in any respect outstanding or unperformed.
SPECIAL RESOLUTIONSSpecial resolutions passed at the annual general meeting of Sable Holdings Limited shareholders on 27 January 2012 were as follows:
Special resolutions
1. “To authorise the company and/or any of its subsidiary companies to, by way of a general authority, acquire shares issued by the company.”
2. “To approve directors’ remuneration.”
3. “To approve the granting of financial assistance.”
CORPORATE ACTIVITYTermination and appointment of designated advisorSable has terminated the mandate of Sasfin Capital, a division of Sasfin Bank Limited, as designated advisor to the company due to the parties being unable to reach agreement on the terms of the renewal of such mandate. Java Capital Trustees and Sponsors (Proprietary) Limited has been appointed as designated advisor to the company, with effect from 1 July 2012.

18 SABLE HOLDINGS L IM ITED • Annual Report 2012
DIRECTORATEDetails of the directors containing their ages, qualifications and a brief curriculum vitae are set out on page 3 of the annual report.Changes in the directorate during the yearMr Dawid Pennington resigned and was replaced by Mr Clinton Froneman being appointed as an independent non-executive director. Mr Froneman’s knowledge of investment property coupled with his strong financial background will complement the existing board and audit committee. The board would like to welcome Mr Froneman and wish him all the best in his new position. The board wishes to thank Mr Pennington for his valuable contribution to the company over the past three years.
SECRETARYThe group company changed company secretary with effect from 1 January 2012. The company secretary is Watermans North Registered Auditors, based at 1st floor, Building 7, Pinewood Office Park, 33 Riley Road, Woodmead, Sandton, 2146, PO Box 4349, Rivonia, 2194.
SHARE CAPITALIssued share capital and authorised share capitalThere have been no changes to issued and authorised share capital during the year.
DIVIDENDSThe board of directors has resolved not to declare a dividend for the year ended 30 June 2012. All cash reserves have been earmarked for funding development and investment property opportunities within the group.
AUDITORSMazars will continue in office in accordance with the Companies Act.
SHARE INCENTIVE SCHEMEThe group does not have a share incentive scheme.
LITIGATION STATEMENTOn 17 November 2011, the group received notification of an application made to the High Court against a group company seeking to claim compensation for alleged dealings conducted prior to 2001. The matter is being defended and the directors and group’s legal advisors consider the likelihood of action against the group company being successful, as remote. Except for the above, the directors are not aware of any legal or arbitration proceedings active, pending or threatened against or being brought by the company, which may have a material effect on the group’s financial position or which have had a material effect during the twelve months preceding the date of these annual financial statements.
GOING CONCERNThe directors are not aware of any material events after the reporting period date that could affect continuance and are of the opinion that the group has adequate resources to continue in operation for the foreseeable future. The annual financial statements have accordingly been prepared on a going concern basis.
EVENTS AFTER THE REPORTING PERIOD-ENDSable’s board of directors are not aware of any reportable material events that have occurred between the end of the financial year and the date of this report.
DIRECTORS’ REPORTCONTINUED
19SABLE HOLDINGS L IM ITED • Annual Report 2012
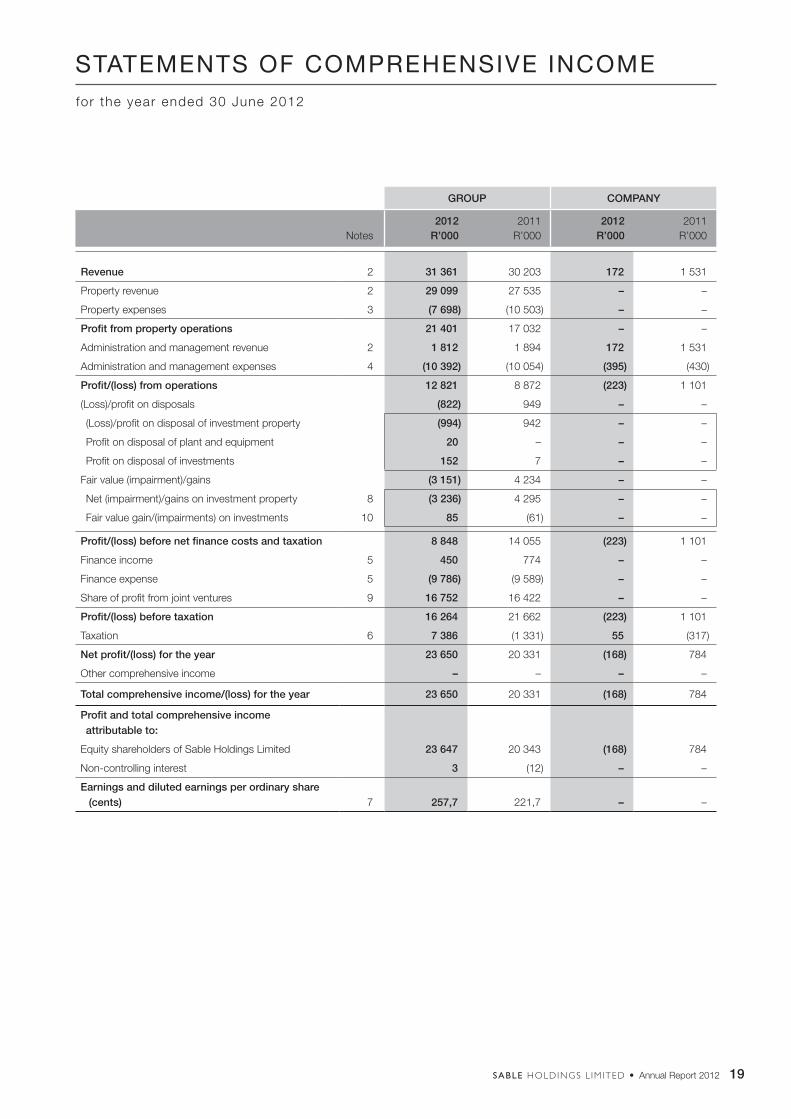
STATEMENTS OF COMPREHENSIVE INCOMEfor the year ended 30 June 2012
GROUP COMPANY
Notes2012
R’0002011
R’000 2012R’000
2011R’000
Revenue 2 31 361 30 203 172 1 531
Property revenue 2 29 099 27 535 – –
Property expenses 3 (7 698) (10 503) – –
Profit from property operations 21 401 17 032 – –
Administration and management revenue 2 1 812 1 894 172 1 531
Administration and management expenses 4 (10 392) (10 054) (395) (430)
Profit/(loss) from operations 12 821 8 872 (223) 1 101
(Loss)/profit on disposals (822) 949 – –
(Loss)/profit on disposal of investment property (994) 942 – –
Profit on disposal of plant and equipment 20 – – –
Profit on disposal of investments 152 7 – –
Fair value (impairment)/gains (3 151) 4 234 – –
Net (impairment)/gains on investment property 8 (3 236) 4 295 – –
Fair value gain/(impairments) on investments 10 85 (61) – –
Profit/(loss) before net finance costs and taxation 8 848 14 055 (223) 1 101
Finance income 5 450 774 – –
Finance expense 5 (9 786) (9 589) – –
Share of profit from joint ventures 9 16 752 16 422 – –
Profit/(loss) before taxation 16 264 21 662 (223) 1 101
Taxation 6 7 386 (1 331) 55 (317)
Net profit/(loss) for the year 23 650 20 331 (168) 784
Other comprehensive income – – – –
Total comprehensive income/(loss) for the year 23 650 20 331 (168) 784
Profit and total comprehensive income attributable to:
Equity shareholders of Sable Holdings Limited 23 647 20 343 (168) 784
Non-controlling interest 3 (12) – –
Earnings and diluted earnings per ordinary share (cents) 7 257,7 221,7 – –
20 SABLE HOLDINGS L IM ITED • Annual Report 2012
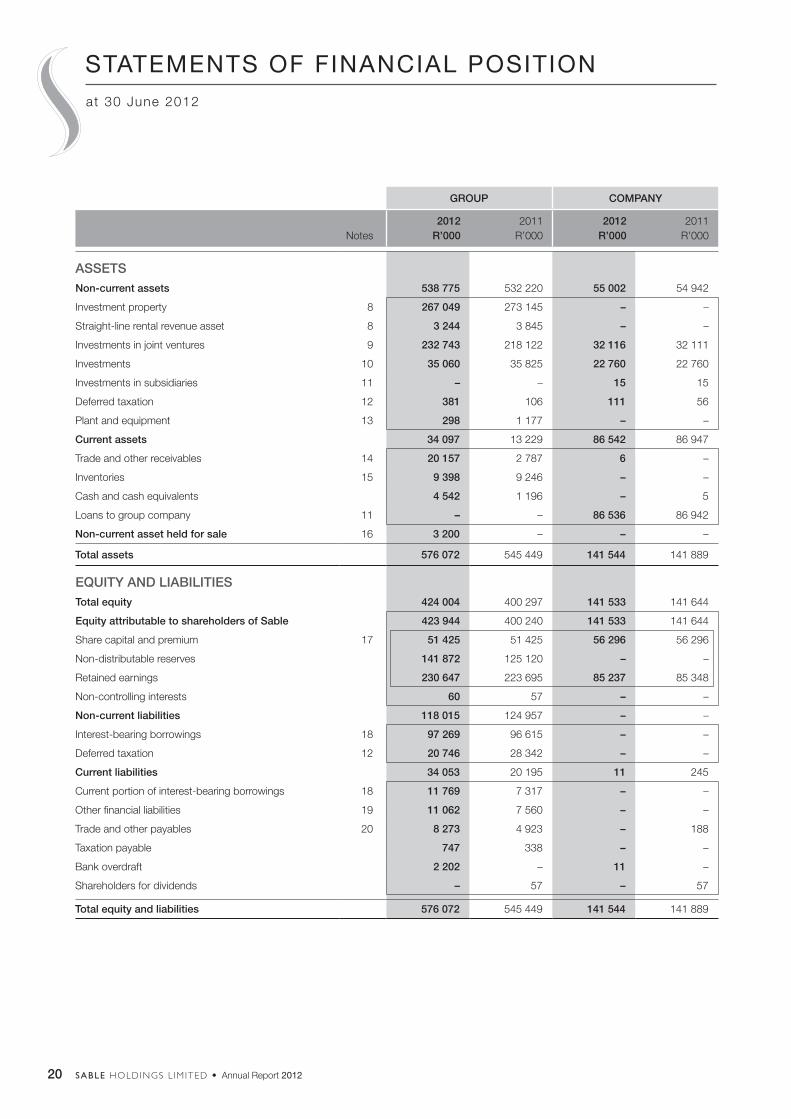
STATEMENTS OF FINANCIAL POSITIONat 30 June 2012
GROUP COMPANY
Notes2012
R’0002011
R’000 2012R’000
2011R’000
ASSETSNon-current assets 538 775 532 220 55 002 54 942
Investment property 8 267 049 273 145 – –
Straight-line rental revenue asset 8 3 244 3 845 – –
Investments in joint ventures 9 232 743 218 122 32 116 32 111
Investments 10 35 060 35 825 22 760 22 760
Investments in subsidiaries 11 – – 15 15
Deferred taxation 12 381 106 111 56
Plant and equipment 13 298 1 177 – –
Current assets 34 097 13 229 86 542 86 947
Trade and other receivables 14 20 157 2 787 6 –
Inventories 15 9 398 9 246 – –
Cash and cash equivalents 4 542 1 196 – 5
Loans to group company 11 – – 86 536 86 942
Non-current asset held for sale 16 3 200 – – –
Total assets 576 072 545 449 141 544 141 889
EQUITY AND LIABILITIESTotal equity 424 004 400 297 141 533 141 644
Equity attributable to shareholders of Sable 423 944 400 240 141 533 141 644
Share capital and premium 17 51 425 51 425 56 296 56 296
Non-distributable reserves 141 872 125 120 – –
Retained earnings 230 647 223 695 85 237 85 348
Non-controlling interests 60 57 – –
Non-current liabilities 118 015 124 957 – –
Interest-bearing borrowings 18 97 269 96 615 – –
Deferred taxation 12 20 746 28 342 – –
Current liabilities 34 053 20 195 11 245
Current portion of interest-bearing borrowings 18 11 769 7 317 – –
Other financial liabilities 19 11 062 7 560 – –
Trade and other payables 20 8 273 4 923 – 188
Taxation payable 747 338 – –
Bank overdraft 2 202 – 11 –
Shareholders for dividends – 57 – 57
Total equity and liabilities 576 072 545 449 141 544 141 889
21SABLE HOLDINGS L IM ITED • Annual Report 2012
for the year ended 30 June 2012
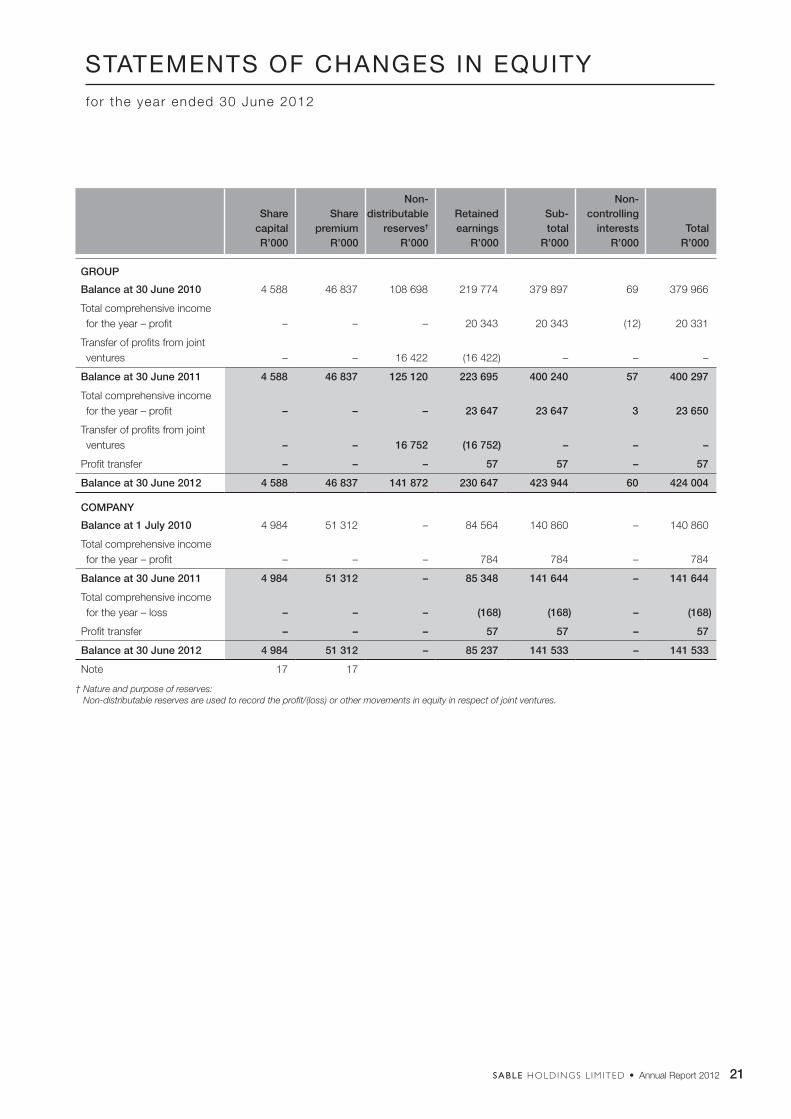
STATEMENTS OF CHANGES IN EQUITY
Share capitalR’000
Share premium
R’000
Non-distributable
reserves†
R’000
Retainedearnings
R’000
Sub-total
R’000
Non-controlling
interestsR’000
TotalR’000
GROUP
Balance at 30 June 2010 4 588 46 837 108 698 219 774 379 897 69 379 966
Total comprehensive income for the year – profit – – – 20 343 20 343 (12) 20 331
Transfer of profits from joint ventures – – 16 422 (16 422) – – –
Balance at 30 June 2011 4 588 46 837 125 120 223 695 400 240 57 400 297
Total comprehensive income for the year – profit – – – 23 647 23 647 3 23 650
Transfer of profits from joint ventures – – 16 752 (16 752) – – –
Profit transfer – – – 57 57 – 57
Balance at 30 June 2012 4 588 46 837 141 872 230 647 423 944 60 424 004
COMPANY
Balance at 1 July 2010 4 984 51 312 – 84 564 140 860 – 140 860
Total comprehensive income for the year – profit – – – 784 784 – 784
Balance at 30 June 2011 4 984 51 312 – 85 348 141 644 – 141 644
Total comprehensive income for the year – loss – – – (168) (168) – (168)
Profit transfer – – – 57 57 – 57
Balance at 30 June 2012 4 984 51 312 – 85 237 141 533 – 141 533
Note 17 17
† Nature and purpose of reserves: Non-distributable reserves are used to record the profit/(loss) or other movements in equity in respect of joint ventures.
22 SABLE HOLDINGS L IM ITED • Annual Report 2012
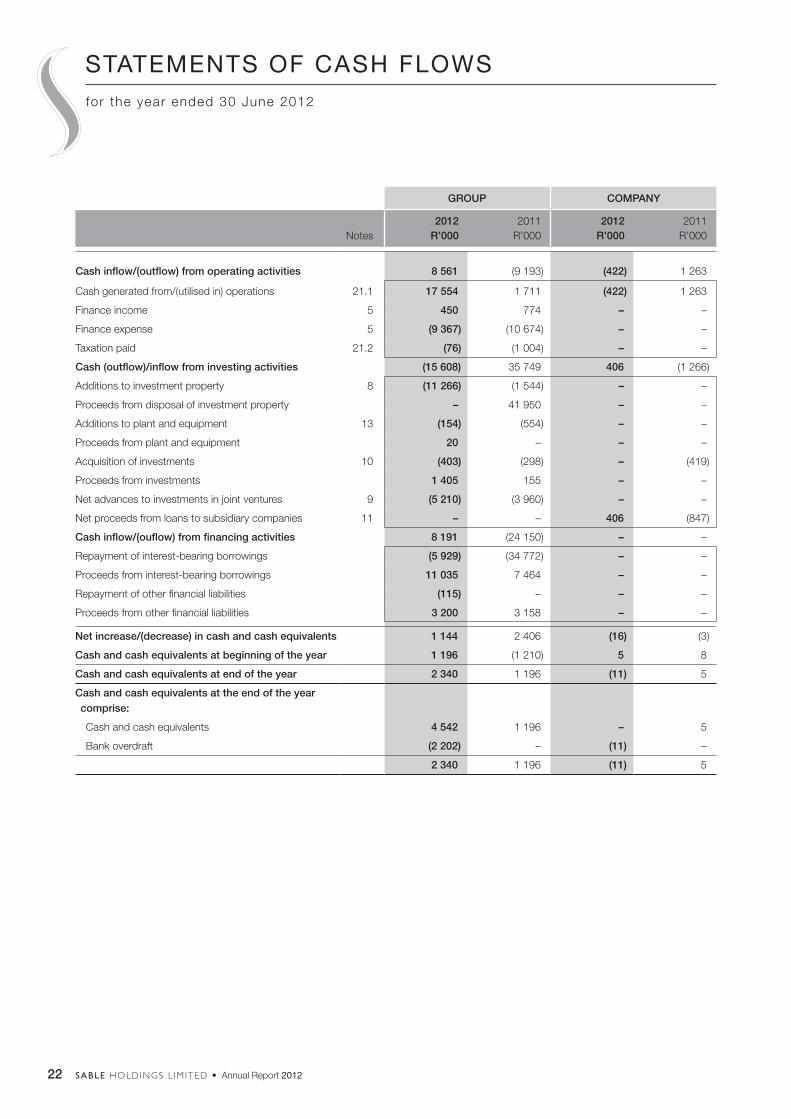
STATEMENTS OF CASH FLOWSfor the year ended 30 June 2012
GROUP COMPANY
Notes2012
R’0002011
R’000 2012R’000
2011R’000
Cash inflow/(outflow) from operating activities 8 561 (9 193) (422) 1 263
Cash generated from/(utilised in) operations 21.1 17 554 1 711 (422) 1 263
Finance income 5 450 774 – –
Finance expense 5 (9 367) (10 674) – –
Taxation paid 21.2 (76) (1 004) – –
Cash (outflow)/inflow from investing activities (15 608) 35 749 406 (1 266)
Additions to investment property 8 (11 266) (1 544) – –
Proceeds from disposal of investment property – 41 950 – –
Additions to plant and equipment 13 (154) (554) – –
Proceeds from plant and equipment 20 – – –
Acquisition of investments 10 (403) (298) – (419)
Proceeds from investments 1 405 155 – –
Net advances to investments in joint ventures 9 (5 210) (3 960) – –
Net proceeds from loans to subsidiary companies 11 – – 406 (847)
Cash inflow/(ouflow) from financing activities 8 191 (24 150) – –
Repayment of interest-bearing borrowings (5 929) (34 772) – –
Proceeds from interest-bearing borrowings 11 035 7 464 – –
Repayment of other financial liabilities (115) – – –
Proceeds from other financial liabilities 3 200 3 158 – –
Net increase/(decrease) in cash and cash equivalents 1 144 2 406 (16) (3)
Cash and cash equivalents at beginning of the year 1 196 (1 210) 5 8
Cash and cash equivalents at end of the year 2 340 1 196 (11) 5
Cash and cash equivalents at the end of the year comprise:
Cash and cash equivalents 4 542 1 196 – 5
Bank overdraft (2 202) – (11) –
2 340 1 196 (11) 5
23SABLE HOLDINGS L IM ITED • Annual Report 2012
NOTES TO THE ANNUAL FINANCIAL STATEMENTSfor the year ended 30 June 2012
ACCOUNTING POLICIES AND BASIS OF PREPARATION
1. BASIS OF PREPARATION The group and company annual financial statements are prepared in accordance with and comply with International Financial
Reporting Standards (“IFRS”) and the AC 500-series as issued by the Accounting Practices Board, the JSE Limited Listings Requirements and in the manner required by the Companies Act. The accounting policies are consistent with those used in the annual financial statements for the annual financial year ended 30 June 2011 except for the South African Companies Act 71 of 2008, which came into effect on 1 May 2011.
The consolidated annual financial statements have been prepared under the historical cost convention, as modified by the revaluation of investment property and financial instruments that are held at fair value through profit and loss.
1.1 Accounting policies Sable (the ”company”) is a company domiciled in South Africa. The consolidated annual financial statements of the company
for the year ended 30 June 2012 comprise the company, its subsidiaries and joint ventures (together referred to as the ”group”). The annual financial statements were authorised for issue by the directors on 5 December 2012.
1.2 Basis of consolidation Group annual financial statements The consolidated annual financial statements incorporate the annual financial statements of the company and its subsidiaries
and joint ventures. Subsidiaries are all entities over which the group has the power to govern the financial and operating policies generally accompanying a shareholding of more than one half of the voting rights. The existence and effect of potential voting rights that are currently exercisable or convertible are considered when assessing whether the group controls another entity.
Operating results of the subsidiaries are included from the effective date of acquisition to the effective date of disposal. Subsidiaries acquired with the intention of disposal within a short period of time, provided IFRS 5 conditions are met, are not consolidated, but accounted for in terms of IFRS 5 – Non-Current Assets Held For Sale and Discontinued Operations. All intra-group transactions, balances and unrealised profit/loss are eliminated on consolidation.
At the date of acquisition of a subsidiary, the cost of the investment is allocated to the fair value of individual identifiable assets, liabilities and contingent liabilities of the subsidiary.
Non-controlling interests in the net assets (excluding goodwill) of consolidated subsidiaries are identified separately from the group’s interest therein. Losses are allocated to both the group and non-controlling interest.
In the company figures in the annual financial statements, all subsidiary investments are initially recognised at cost, being the fair value of the consideration given and including acquisition charges associated with the investment. After initial recognition, the company’s investments in subsidiaries and joint ventures continue to be held at cost less any accumulated impairment. Investments in subsidiaries and joint ventures are reviewed annually for impairment indicators.
1.3 Investment in joint ventures The group’s investment in its joint ventures is accounted for using the equity method. A joint venture is an entity in which the
group exercises joint control.
Under the equity method, the investment in the joint ventures is carried in the Statements of Financial Position (“SOFP”) at cost plus post-acquisition changes in the group’s share of net assets of the joint venture. Goodwill relating to the joint ventures is included in the carrying amount of the investment and is neither amortised nor individually tested for impairment.
The Statements of Comprehensive Income (“SOCI”) reflect the share of the results of operations of the joint ventures. Unrealised gains and losses resulting from transactions between the group and the joint ventures are eliminated to the extent of the interest in joint ventures.
The share of profit and other comprehensive income of joint ventures is shown on the face of the SOCI. The annual financial statements of joint ventures are prepared for the same reporting period as the parent company.
After application of the equity method, the group determines whether it is necessary to recognise an additional impairment loss on the group’s investment in its joint ventures. The group determines at each reporting date whether there is any objective evidence that the investment in joint ventures is impaired. If this is the case, the group calculates the amount of impairment as the difference between the recoverable amount of joint ventures and its carrying value and recognises the amount in the SOCI.
24 SABLE HOLDINGS L IM ITED • Annual Report 2012
1. BASIS OF PREPARATION (continued)
1.3 Investment in joint ventures (continued) Upon loss of joint control over a joint venture, the group measures and recognises any remaining investment at its fair value.
Any difference between the carrying amount of the joint ventures upon loss of joint control and the fair value of the remaining investment and proceeds from disposal, is recognised in profit and loss.
1.4 Investment property Investment property is defined as property held for rental producing purposes or for capital appreciation or both, rather than for
use in the production or supply of goods or services or for administrative purposes.
Investment property is measured initially at cost, including related transaction costs. Subsequent expenditure is charged to the asset’s carrying value only when it is probable that the future economic benefits associated with the item will flow to the group and the cost of the item can be measured reliably. All other repairs and maintenance costs are charged to the SOCI during the financial period in which they are incurred.
After initial recognition, investment property is carried at fair value. Investment property is valued annually by the directors with an external valuation being performed every three years. External independent professional valuers, with appropriate and recognised professional qualifications and recent experience in the location and category of property being valued, are used for external valuations.
Gains or losses arising from changes in the fair values are included in profit and loss for the period in which they arise.
1.5 Plant and equipment Plant and equipment are stated at cost less accumulated depreciation. Plant and equipment comprise furniture and fixtures,
motor vehicles, IT equipment, tenant installations, other sundry assets and generators. Historical cost includes expenditure that is directly attributable to the acquisition of the asset.
Subsequent costs are included in the asset’s carrying amount only when it is probable that future economic benefits associated with the item will flow to the group and the cost of the item can be measured reliably. All other repairs and maintenance costs are charged to profit and loss during the financial period in which they are incurred. Plant and equipment are depreciated over the estimated useful life of the assets on a straight-line basis to adjust their costs to their residual values. The rates used for this purpose are:
• Furniture and fixtures 10,0% straight-line • Motor vehicles 20,0% straight-line • IT equipment 33,3% straight-line • Tenant installations lease dependent • Other sundry assets 20% – 33,3% straight-line • Generators 20,0% straight-line
The nature of the assets is such that they need not be classified into components. The assets’ residual values and useful lives are reviewed and adjusted, if appropriate, at each SOFP date. Any gain or loss on the disposal is recognised in the SOCI and is calculated as the difference between the proceeds and the carrying value of the asset.
1.6 Non-current assets held for sale Non-current assets and disposal groups classified as held for sale are measured at the lower of carrying amount and fair
value less costs to sell except for investment property’s that are measured in accordance with the investment property policy. Non-current assets and disposal groups are classified as held for sale if their carrying amounts will be recovered through a sale transaction rather than through continuing use. This condition is regarded as met only when the sale is highly probable and the asset or disposal group is available for immediate sale in its present condition. Management must be committed to the sale, which should be expected to qualify for recognition as a completed sale within one year from the date of classification. The impairment loss for a disposal group is recognised through profit and loss. Plant and equipment and investment property once classified as held for sale are not depreciated or amortised.
NOTES TO THE ANNUAL FINANCIAL STATEMENTSCONTINUEDfor the year ended 30 June 2012

25SABLE HOLDINGS L IM ITED • Annual Report 2012
1.7 Financial instruments Initial recognition and measurement Financial assets within the scope of IAS 39 are classified as financial assets at fair value through profit and loss or loans and
receivables. The group determines the classification of its financial assets at initial recognition.
All financial assets are recognised initially at fair value and, in the case of investments not at fair value through profit and loss, directly attributable transaction costs.
The group’s financial assets include cash and cash equivalents, investments which are held at fair value though profit and loss, trade and other receivables and loans to group companies.
Subsequent measurement Subsequent recognition of financial assets depends on their classification as follows:
Cash and cash equivalents For the purpose of the statements of cash flows, cash and cash equivalents comprise cash on hand, deposits held at call with
banks and investments in money market instruments, net of bank overdrafts, all of which are available for use by the group.
Cash and cash equivalents comprise cash on hand and demand deposits and other short-term highly liquid investments that are readily convertible to a known amount of cash and are subject to an insignificant risk of changes in value. Cash and cash equivalents are measured at amortised cost using the effective interest rate (“EIR”) method.
Loans and receivables Trade and other receivables Appropriate allowances for estimated irrecoverable amounts are recognised in profit and loss when there is objective evidence
that the asset is impaired. The allowance recognised is measured as the difference between the asset’s carrying amount and the present value of estimated future cash flows discounted at the EIR method computed at initial recognition.
Trade receivables that are assessed not to be impaired individually are subsequently assessed for impairment on a collective basis. Objective evidence of impairment for a portfolio of receivables could include the group’s past experience of collecting payments, an increase in the number of delayed payments in the portfolio past the average credit period of 60 days, as well as observable changes in national or local economic conditions that correlate with default on receivables. Trade and other receivables are measured at amortised cost using the EIR method.
Loans to group companies Loans to group companies are non-derivative financial assets with fixed or determinable payments that are not quoted in an
active market. After initial measurement, such financial assets are subsequently measured at amortised cost using the EIR method, less any impairment. Amortised cost is calculated by taking into account any discount or premium on acquisition and fees or costs that are an integral part of the EIR. The EIR amortisation is included in finance income in the SOCI. The losses arising from impairment are recognised in the SOCI in finance costs.
Investments held at fair value through profit and loss Investments held at fair value through profit and loss include financial assets held for trading at fair value through profit and loss.
Investments held at fair value through profit and loss are carried in the SOFP at fair value with changes in fair value recognised in finance income in the SOCI.
Impairment of financial assets The group assesses at each reporting date whether there is any objective evidence that a financial asset or a group of financial
assets is impaired. A financial asset or a group of financial assets is deemed to be impaired if there is objective evidence of impairment as a result of one or more events that has occurred after the initial recognition of the asset (an incurred loss event) and that loss event has an impact on the estimated future cash flows of the financial asset or the group of financial assets that can be reliably estimated. Evidence of impairment may include indications that the debtor or a group of debtors is experiencing significant financial difficulty, default or delinquency in interest or principal payments, the probability that they will enter bankruptcy or other financial re-organisation and where observable data indicate that there is a measurable decrease in the estimated future cash flows, such as changes in arrears or economic conditions that correlate with defaults.
The carrying amount of the financial asset is reduced by the impairment loss directly for all financial assets except for trade receivables, where the carrying amount is reduced through the use of an allowance account. When a trade receivable is considered uncollectable, it is written off against the allowance account. Subsequent recoveries of amounts previously impaired are credited against the allowance account. Changes in the carrying amount of the allowance account are recognised in profit and loss.
26 SABLE HOLDINGS L IM ITED • Annual Report 2012
1. BASIS OF PREPARATION (continued)
1.7 Financial instruments (continued) Derecognition of financial assets A financial asset is derecognised when the rights to receive cash flows from the asset have expired.
Financial liabilities Initial recognition and measurement Financial liabilities within the scope of IAS 39 are classified as financial liabilities at fair value through profit and loss or loans and
borrowings at amortised cost. The group determines the classification of its financial liabilities at initial recognition.
All financial liabilities are recognised initially at fair value and, in the case of loans and borrowings at amortised cost, directly attributable transaction costs.
The group’s financial liabilities include trade and other payables, bank overdrafts, loans and borrowings.
Subsequent measurement Subsequent recognition of financial liabilities depends on their classification as follows:
Financial liabilities at amortised cost Trade and other payables Trade payables are measured at amortised cost, using the EIR method.
Loans and borrowings After initial recognition, loans and borrowings are subsequently measured at amortised cost using the EIR method. Gains
and losses are recognised in the SOCI when the liabilities are derecognised as well as through the EIR method amortisation process.
Amortised cost is calculated by taking into account any discount or premium on acquisition and fees or costs that are an integral part of the EIR. The EIR amortisation is included in finance costs in the SOCI.
Financial liabilities held at fair value through profit and loss Forward rate agreements Financial liabilities held at fair value through profit and loss include financial liabilities held for trading and financial liabilities
designated upon initial recognition as at fair value through profit and loss. Financial liabilities are classified as held for trading if they are acquired for the purpose of selling in the near term. This category includes derivative financial instruments entered into by the group that are not designated as hedging instruments in hedge relationships as defined by IAS 39. Gains or losses on liabilities held for trading are recognised in the SOCI.
Derecognition A financial liability is derecognised when the obligation under the liability is discharged or cancelled or expires.
1.8 Inventories Property development inventory consists of land held for construction and is valued at the lower of actual cost and net
realisable value. Actual cost includes the cost of acquiring the land plus all expenditure related directly to the project, together with an allocation of fixed and variable overheads incurred in the construction activities based on normal operating capacity. Net realisable value is the estimated selling price in the ordinary course of business, less the estimated costs of completion and selling expenses.
1.9 Equity instruments An equity instrument is any contract that evidences a residual interest in the assets of an entity after deducting all of its liabilities.
1.10 Treasury shares Own equity instruments which are reacquired (treasury shares) are recognised at cost and deducted from equity. No gain
or loss is recognised in the SOCI on the purchase, sale, issue or cancellation of the group’s own equity instruments. Any difference between the carrying amount and the consideration is recognised in other capital reserves.
NOTES TO THE ANNUAL FINANCIAL STATEMENTSCONTINUEDfor the year ended 30 June 2012
27SABLE HOLDINGS L IM ITED • Annual Report 2012
1.11 Revenue Revenue includes property rental revenue, interest income and dividend income.
Revenue is recognised as follows:
Property revenue The group’s policy for recognition of property rental revenue from operating leases is described in 1.13 below. Property rental
revenue includes rental income and operating expense recoveries from investment property and is recognised as it accrues.
Interest income Interest income is recognised as it accrues, using the EIR method.
Dividend income Dividend income is recognised in the SOCI on the date the group’s or company’s right to receive payment is established, which
in the case of quoted securities is usually the ex-dividend date.
1.12 Borrowing costs Borrowing costs directly attributable to the acquisition, construction or production of qualifying assets, which are assets that
necessarily take a substantial period of time to get ready for their intended use or sale, are added to the cost of those assets, until such time as the assets are substantially ready for their intended use or sale. Investment income earned on the temporary investment of specific borrowings pending their expenditure on qualifying assets is deducted from the borrowing costs eligible for capitalisation. Capitalisation ceases when substantially all activities necessary to prepare the qualifying asset for its intended use are complete. All other borrowing costs are recognised in profit and loss in the period in which they are incurred.
1.13 Leasing A lease is classified as a finance lease if it transfers substantially all the risks and rewards incidental to ownership. A lease is
classified as an operating lease if it does not transfer substantially all the risks and rewards incidental to ownership. Land and buildings are assessed separately for lease classification.
Operating leases – lessor Rental income from operating leases is recognised on a straight-line basis over the term of the relevant lease. Initial direct costs
incurred in negotiating an operating lease are added to the carrying amount of the leased asset and recognised on a straight-line basis over the lease term.
1.14 Employee benefits Post-employment benefits The group provides for retirement benefits for employees by payments to independent defined contribution funds and
contributions are charged against income as the employee provides the related service. A defined contribution plan is a plan under which the group pays fixed contributions into a separate entity. The group has no legal or constructive obligation to pay further contributions, if the fund does not hold sufficient assets to pay all employees the benefits relating to employee service in the current and prior periods.
Short-term employee benefits The cost of all short-term employee benefits is recognised during the period in which the employee renders the related service.
The employee entitlement to wages, salaries and annual leave represented in the amounts, which the group has a present obligation to pay as a result of the employees’ services provided in the statement of financial position that have been incurred.
1.15 Taxation The charge for current tax is based on the results for the year as adjusted for items which are non-assessable or disallowed.
Taxation is calculated using tax rates that have been enacted or substantively enacted by the SOFP date.
Deferred tax liabilities are recognised for all taxable temporary differences, unless the deferred tax liability arises from: • the initial recognition of goodwill; or • the initial recognition of an asset or liability in a transaction which: – is not a business combination, and – at the time of the transaction, affects neither accounting profit nor taxable profit.
28 SABLE HOLDINGS L IM ITED • Annual Report 2012
1. Basis of preparation (continued)
1.15 Taxation (continued) Deferred tax assets are recognised for all deductible temporary differences to the extent that it is probable that taxable profit
will be available against which the deductible temporary difference can be utilised, unless the deferred tax asset arises from: • the initial recognition of an asset or liability in a transaction which: – is not a business combination, and – at the time of the transaction, affects neither accounting profit nor taxable profit.
Deferred income tax is provided on temporary differences arising on investments in subsidiaries and joint ventures, except where the timing of the reversal of the temporary difference is controlled by the group and it is probable that the temporary difference will not reverse in the foreseeable future.
Current tax and deferred taxes are charged or credited directly to equity if the tax relates to items that are credited or charged directly in the same or a different period to equity.
Deferred tax assets are recognised for all unused tax losses to the extent that it is probable that taxable profit will be available against which the losses can be utilised. Significant management judgement is required to determine the amount of deferred tax assets that can be recognised, based upon the likely timing and the level of future taxable profits together with future tax planning strategies.
Withholding taxation on companies is recognised as part of the current tax charge in the SOCI when the related dividend is declared.
1.16 Earnings per share The group presents basic earnings per share (“EPS”) for its ordinary shares. Basic EPS is calculated by dividing the profit and
loss attributable to ordinary shareholders of the company by the weighted average number of ordinary shares outstanding during the period.
Headline earnings per ordinary share are calculated using the weighted average number of ordinary shares in issue during the period and are based on the earnings attributable to ordinary shareholders, after excluding those items as required by Circular 3/2009 issued by the South African Institute of Chartered Accountants.
1.17 Segment reporting An operating segment is a component of an entity that engages in business activities from which it may earn revenues or incur
expenses for which discrete financial information is available and whose operating results are regularly reviewed by the entity’s chief operating decision maker. The segments are reported based on the nature of the tenants and have accordingly been split into commercial, residential, industrial and retail segments.
1.18 Critical accounting judgements and key sources of estimation uncertainty In preparing the annual financial statements, management is required to make estimates and assumptions that affect
the amounts represented in the annual financial statements and related disclosures. Use of available information and the application of judgement is inherent in the formation of estimates. Actual results in the future could differ from these estimates which may be material to the annual financial statements.
Significant judgements and estimates include: • Testing for impairments and allocation of goodwill notes 1.2 and 1.3; • Fair value estimation of investment property notes 1.4 and 8; • Application and determination of the residual value and useful lives of plant and equipment note 1.5; • Determination of the fair value of non-current assets held for sale note 1.6; • Valuation of financial assets held at fair value through profit and loss note 1.7; • Determination of estimated operating lease receipts note 1.13; • Impaired rental receivables note 14; and • Recognition of deferred tax assets note 1.15.
NOTES TO THE ANNUAL FINANCIAL STATEMENTSCONTINUEDfor the year ended 30 June 2012
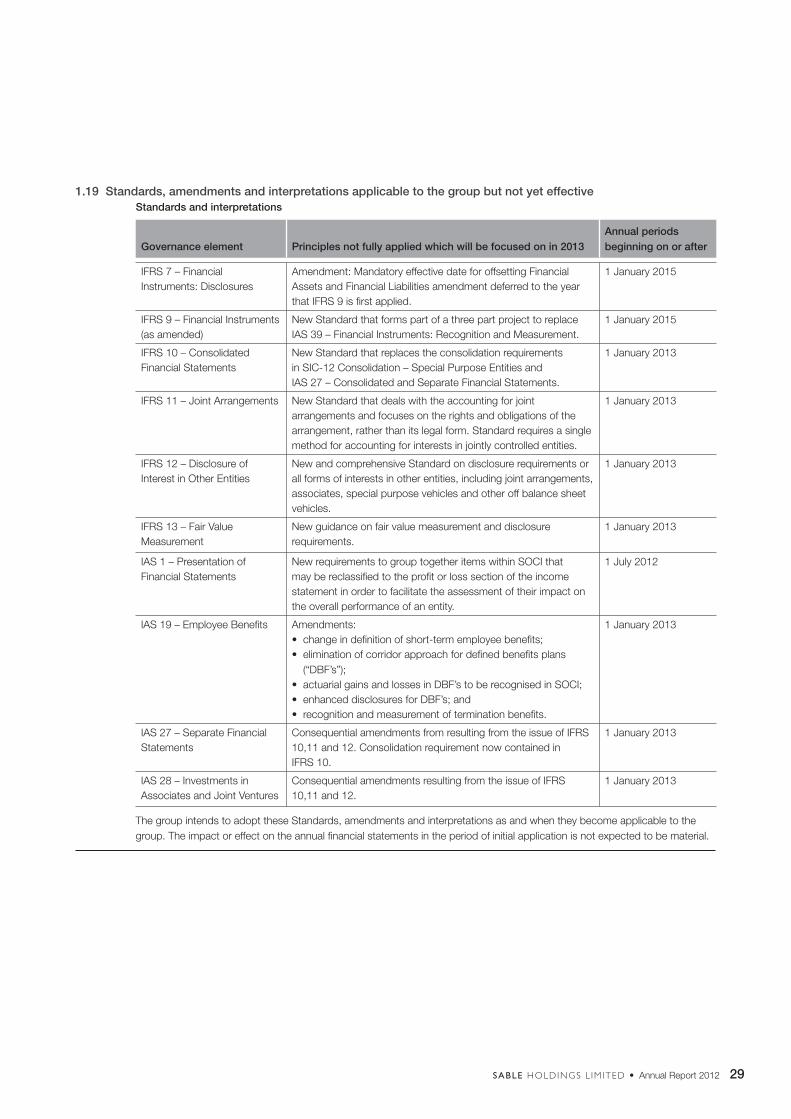
29SABLE HOLDINGS L IM ITED • Annual Report 2012
1.19 Standards, amendments and interpretations applicable to the group but not yet effective Standards and interpretations
Governance element Principles not fully applied which will be focused on in 2013Annual periods beginning on or after
IFRS 7 – Financial Instruments: Disclosures
Amendment: Mandatory effective date for offsetting Financial Assets and Financial Liabilities amendment deferred to the year that IFRS 9 is first applied.
1 January 2015
IFRS 9 – Financial Instruments (as amended)
New Standard that forms part of a three part project to replace IAS 39 – Financial Instruments: Recognition and Measurement.
1 January 2015
IFRS 10 – Consolidated Financial Statements
New Standard that replaces the consolidation requirements in SIC-12 Consolidation – Special Purpose Entities and IAS 27 – Consolidated and Separate Financial Statements.
1 January 2013
IFRS 11 – Joint Arrangements New Standard that deals with the accounting for joint arrangements and focuses on the rights and obligations of the arrangement, rather than its legal form. Standard requires a single method for accounting for interests in jointly controlled entities.
1 January 2013
IFRS 12 – Disclosure of Interest in Other Entities
New and comprehensive Standard on disclosure requirements or all forms of interests in other entities, including joint arrangements, associates, special purpose vehicles and other off balance sheet vehicles.
1 January 2013
IFRS 13 – Fair Value Measurement
New guidance on fair value measurement and disclosure requirements.
1 January 2013
IAS 1 – Presentation of Financial Statements
New requirements to group together items within SOCI that may be reclassified to the profit or loss section of the income statement in order to facilitate the assessment of their impact on the overall performance of an entity.
1 July 2012
IAS 19 – Employee Benefits Amendments:• change in definition of short-term employee benefits;• elimination of corridor approach for defined benefits plans
(“DBF’s”);• actuarial gains and losses in DBF’s to be recognised in SOCI;• enhanced disclosures for DBF’s; and• recognition and measurement of termination benefits.
1 January 2013
IAS 27 – Separate Financial Statements
Consequential amendments from resulting from the issue of IFRS 10,11 and 12. Consolidation requirement now contained in IFRS 10.
1 January 2013
IAS 28 – Investments in Associates and Joint Ventures
Consequential amendments resulting from the issue of IFRS 10,11 and 12.
1 January 2013
The group intends to adopt these Standards, amendments and interpretations as and when they become applicable to the group. The impact or effect on the annual financial statements in the period of initial application is not expected to be material.
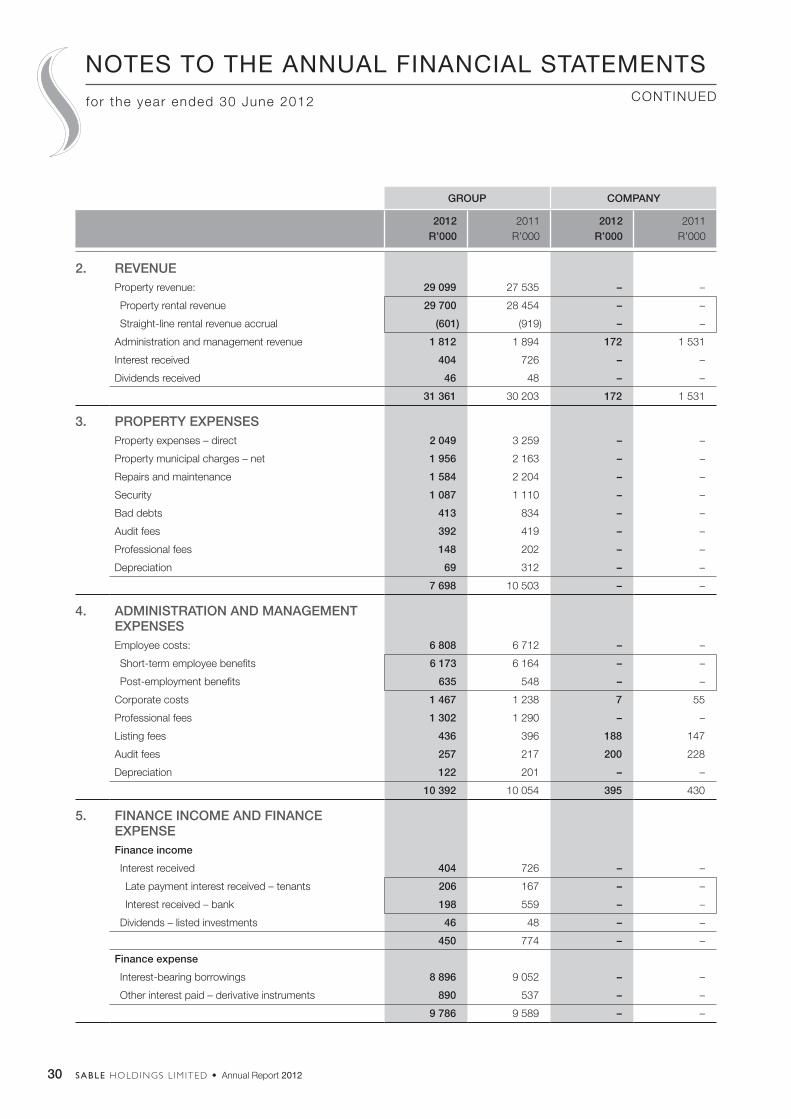
30 SABLE HOLDINGS L IM ITED • Annual Report 2012
GROUP COMPANY
2012R’000
2011R’000
2012R’000
2011R’000
2. REVENUEProperty revenue: 29 099 27 535 – –
Property rental revenue 29 700 28 454 – –
Straight-line rental revenue accrual (601) (919) – –
Administration and management revenue 1 812 1 894 172 1 531
Interest received 404 726 – –
Dividends received 46 48 – –
31 361 30 203 172 1 531
3. PROPERTY EXPENSESProperty expenses – direct 2 049 3 259 – –
Property municipal charges – net 1 956 2 163 – –
Repairs and maintenance 1 584 2 204 – –
Security 1 087 1 110 – –
Bad debts 413 834 – –
Audit fees 392 419 – –
Professional fees 148 202 – –
Depreciation 69 312 – –
7 698 10 503 – –
4. ADMINISTRATION AND MANAGEMENT EXPENSESEmployee costs: 6 808 6 712 – –
Short-term employee benefits 6 173 6 164 – –
Post-employment benefits 635 548 – –
Corporate costs 1 467 1 238 7 55
Professional fees 1 302 1 290 – –
Listing fees 436 396 188 147
Audit fees 257 217 200 228
Depreciation 122 201 – –
10 392 10 054 395 430
5. FINANCE INCOME AND FINANCE EXPENSEFinance income
Interest received 404 726 – –
Late payment interest received – tenants 206 167 – –
Interest received – bank 198 559 – –
Dividends – listed investments 46 48 – –
450 774 – –
Finance expense
Interest-bearing borrowings 8 896 9 052 – –
Other interest paid – derivative instruments 890 537 – –
9 786 9 589 – –
NOTES TO THE ANNUAL FINANCIAL STATEMENTSCONTINUEDfor the year ended 30 June 2012
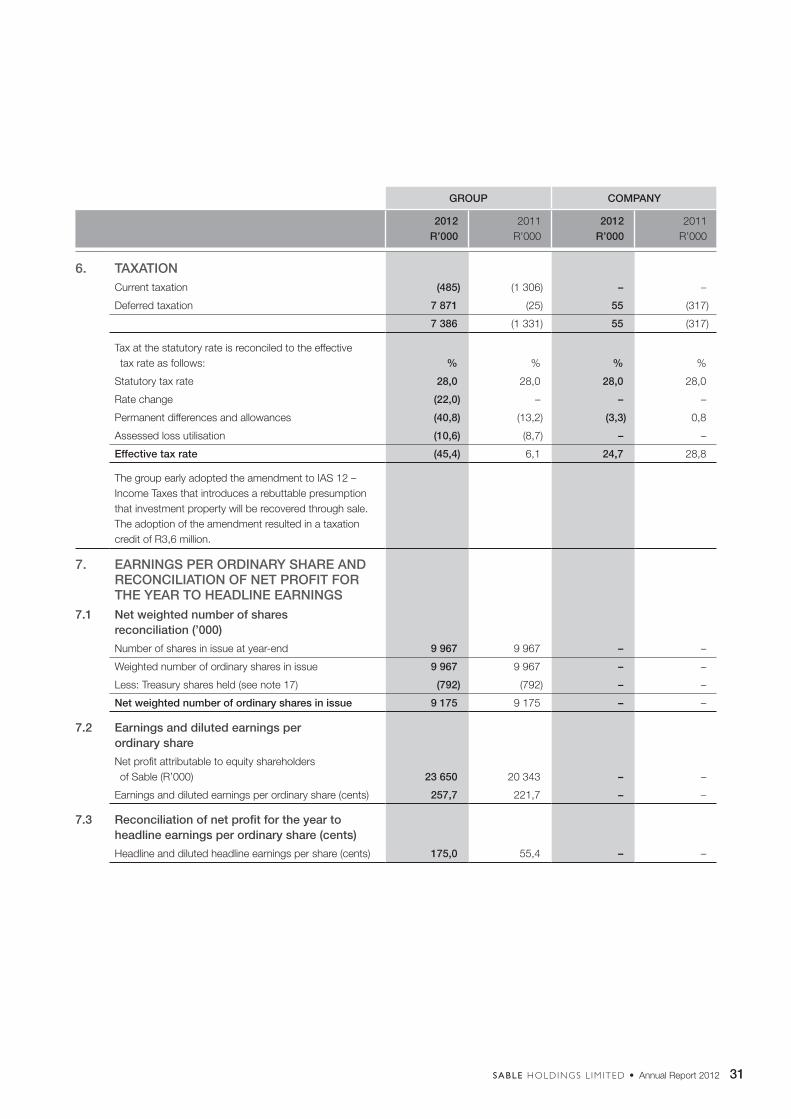
31SABLE HOLDINGS L IM ITED • Annual Report 2012
GROUP COMPANY
2012R’000
2011R’000
2012R’000
2011R’000
6. TAXATIONCurrent taxation (485) (1 306) – –
Deferred taxation 7 871 (25) 55 (317)
7 386 (1 331) 55 (317)
Tax at the statutory rate is reconciled to the effective tax rate as follows: % % % %
Statutory tax rate 28,0 28,0 28,0 28,0
Rate change (22,0) – – –
Permanent differences and allowances (40,8) (13,2) (3,3) 0,8
Assessed loss utilisation (10,6) (8,7) – –
Effective tax rate (45,4) 6,1 24,7 28,8
The group early adopted the amendment to IAS 12 – Income Taxes that introduces a rebuttable presumption that investment property will be recovered through sale. The adoption of the amendment resulted in a taxation credit of R3,6 million.
7. EARNINGS PER ORDINARY SHARE AND RECONCILIATION OF NET PROFIT FOR THE YEAR TO HEADLINE EARNINGS
7.1 Net weighted number of shares reconciliation (’000)
Number of shares in issue at year-end 9 967 9 967 – –
Weighted number of ordinary shares in issue 9 967 9 967 – –
Less: Treasury shares held (see note 17) (792) (792) – –
Net weighted number of ordinary shares in issue 9 175 9 175 – –
7.2 Earnings and diluted earnings per ordinary share
Net profit attributable to equity shareholders of Sable (R’000) 23 650 20 343 – –
Earnings and diluted earnings per ordinary share (cents) 257,7 221,7 – –
7.3 Reconciliation of net profit for the year to headline earnings per ordinary share (cents)
Headline and diluted headline earnings per share (cents) 175,0 55,4 – –
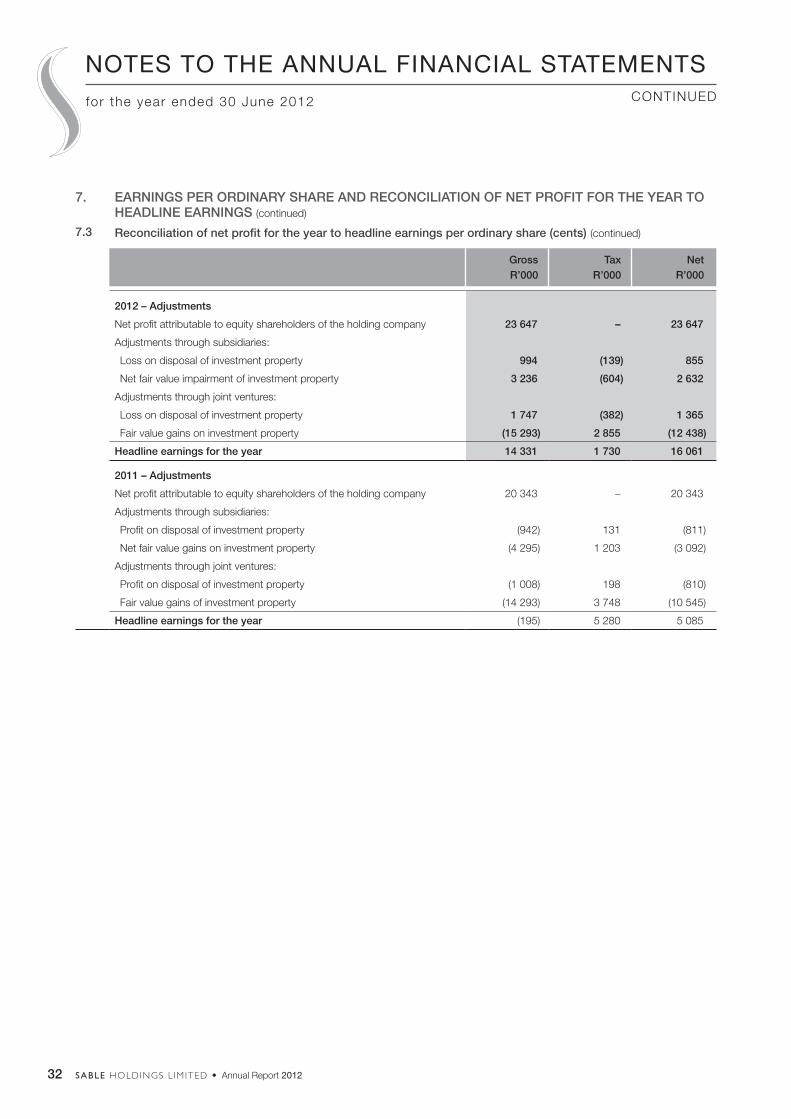
32 SABLE HOLDINGS L IM ITED • Annual Report 2012
7. EARNINGS PER ORDINARY SHARE AND RECONCILIATION OF NET PROFIT FOR THE YEAR TO HEADLINE EARNINGS (continued)
7.3 Reconciliation of net profit for the year to headline earnings per ordinary share (cents) (continued)
GrossR’000
Tax R’000
NetR’000
2012 – Adjustments
Net profit attributable to equity shareholders of the holding company 23 647 – 23 647
Adjustments through subsidiaries:
Loss on disposal of investment property 994 (139) 855
Net fair value impairment of investment property 3 236 (604) 2 632
Adjustments through joint ventures:
Loss on disposal of investment property 1 747 (382) 1 365
Fair value gains on investment property (15 293) 2 855 (12 438)
Headline earnings for the year 14 331 1 730 16 061
2011 – Adjustments
Net profit attributable to equity shareholders of the holding company 20 343 – 20 343
Adjustments through subsidiaries:
Profit on disposal of investment property (942) 131 (811)
Net fair value gains on investment property (4 295) 1 203 (3 092)
Adjustments through joint ventures:
Profit on disposal of investment property (1 008) 198 (810)
Fair value gains of investment property (14 293) 3 748 (10 545)
Headline earnings for the year (195) 5 280 5 085
NOTES TO THE ANNUAL FINANCIAL STATEMENTSCONTINUEDfor the year ended 30 June 2012
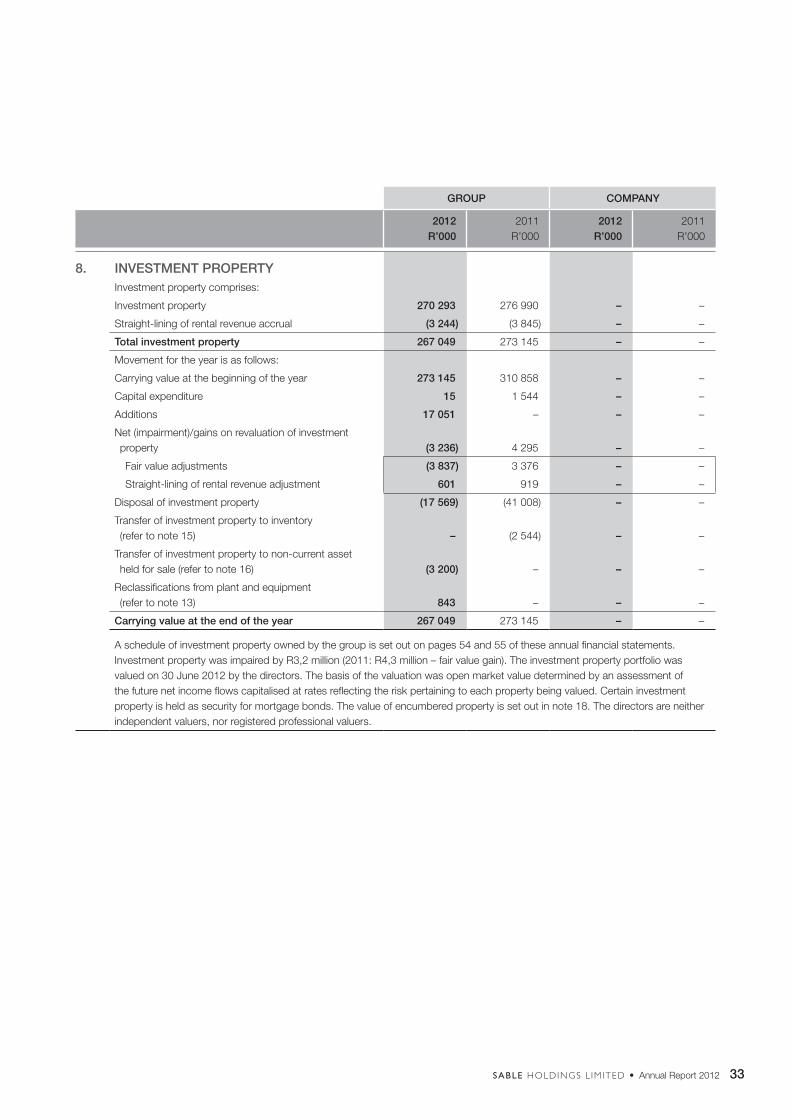
33SABLE HOLDINGS L IM ITED • Annual Report 2012
GROUP COMPANY
2012R’000
2011R’000
2012R’000
2011R’000
8. INVESTMENT PROPERTY Investment property comprises:
Investment property 270 293 276 990 – –
Straight-lining of rental revenue accrual (3 244) (3 845) – –
Total investment property 267 049 273 145 – –
Movement for the year is as follows:
Carrying value at the beginning of the year 273 145 310 858 – –
Capital expenditure 15 1 544 – –
Additions 17 051 – – –
Net (impairment)/gains on revaluation of investment property (3 236) 4 295 – –
Fair value adjustments (3 837) 3 376 – –
Straight-lining of rental revenue adjustment 601 919 – –
Disposal of investment property (17 569) (41 008) – –
Transfer of investment property to inventory (refer to note 15) – (2 544) – –
Transfer of investment property to non-current asset held for sale (refer to note 16) (3 200) – – –
Reclassifications from plant and equipment (refer to note 13) 843 – – –
Carrying value at the end of the year 267 049 273 145 – –
A schedule of investment property owned by the group is set out on pages 54 and 55 of these annual financial statements. Investment property was impaired by R3,2 million (2011: R4,3 million – fair value gain). The investment property portfolio was valued on 30 June 2012 by the directors. The basis of the valuation was open market value determined by an assessment of the future net income flows capitalised at rates reflecting the risk pertaining to each property being valued. Certain investment property is held as security for mortgage bonds. The value of encumbered property is set out in note 18. The directors are neither independent valuers, nor registered professional valuers.
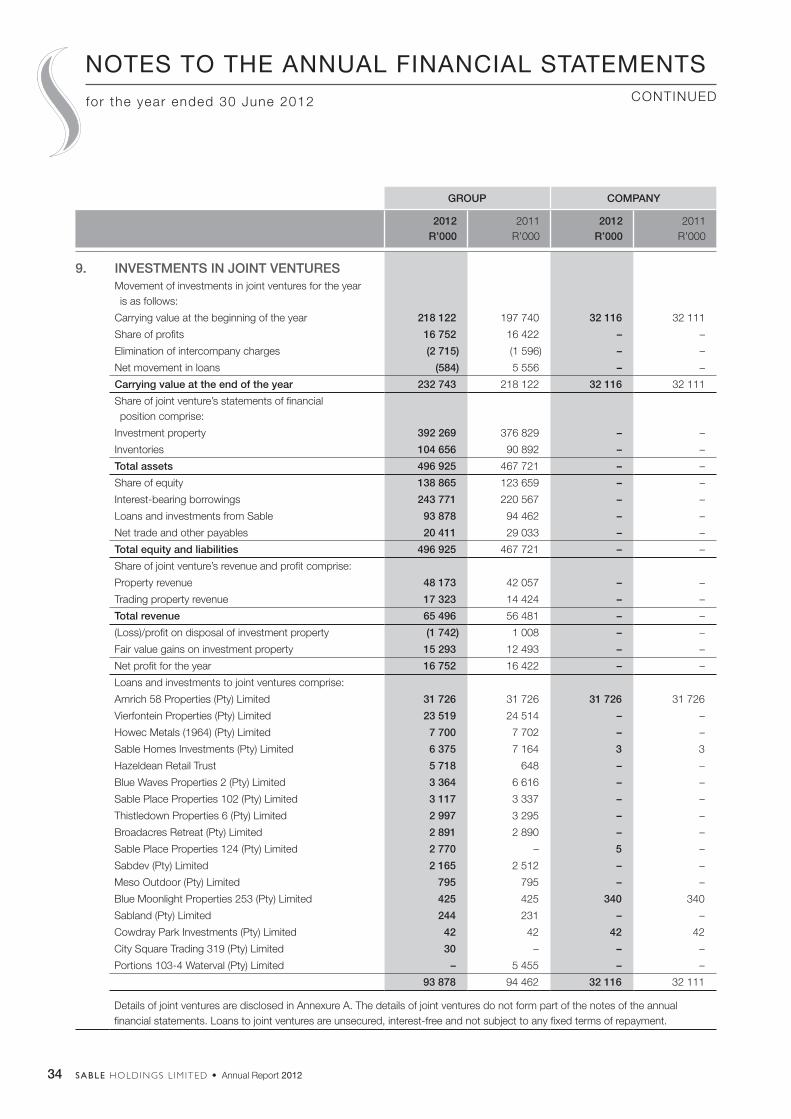
34 SABLE HOLDINGS L IM ITED • Annual Report 2012
GROUP COMPANY
2012R’000
2011R’000
2012R’000
2011R’000
9. INVESTMENTS IN JOINT VENTURESMovement of investments in joint ventures for the year is as follows:
Carrying value at the beginning of the year 218 122 197 740 32 116 32 111
Share of profits 16 752 16 422 – –
Elimination of intercompany charges (2 715) (1 596) – –
Net movement in loans (584) 5 556 – –
Carrying value at the end of the year 232 743 218 122 32 116 32 111
Share of joint venture’s statements of financial position comprise:
Investment property 392 269 376 829 – –
Inventories 104 656 90 892 – –
Total assets 496 925 467 721 – –
Share of equity 138 865 123 659 – –
Interest-bearing borrowings 243 771 220 567 – –
Loans and investments from Sable 93 878 94 462 – –
Net trade and other payables 20 411 29 033 – –
Total equity and liabilities 496 925 467 721 – –
Share of joint venture’s revenue and profit comprise:
Property revenue 48 173 42 057 – –
Trading property revenue 17 323 14 424 – –
Total revenue 65 496 56 481 – –
(Loss)/profit on disposal of investment property (1 742) 1 008 – –
Fair value gains on investment property 15 293 12 493 – –
Net profit for the year 16 752 16 422 – –
Loans and investments to joint ventures comprise:
Amrich 58 Properties (Pty) Limited 31 726 31 726 31 726 31 726
Vierfontein Properties (Pty) Limited 23 519 24 514 – –
Howec Metals (1964) (Pty) Limited 7 700 7 702 – –
Sable Homes Investments (Pty) Limited 6 375 7 164 3 3
Hazeldean Retail Trust 5 718 648 – –
Blue Waves Properties 2 (Pty) Limited 3 364 6 616 – –
Sable Place Properties 102 (Pty) Limited 3 117 3 337 – –
Thistledown Properties 6 (Pty) Limited 2 997 3 295 – –
Broadacres Retreat (Pty) Limited 2 891 2 890 – –
Sable Place Properties 124 (Pty) Limited 2 770 – 5 –
Sabdev (Pty) Limited 2 165 2 512 – –
Meso Outdoor (Pty) Limited 795 795 – –
Blue Moonlight Properties 253 (Pty) Limited 425 425 340 340
Sabland (Pty) Limited 244 231 – –
Cowdray Park Investments (Pty) Limited 42 42 42 42
City Square Trading 319 (Pty) Limited 30 – – –
Portions 103-4 Waterval (Pty) Limited – 5 455 – –
93 878 94 462 32 116 32 111
Details of joint ventures are disclosed in Annexure A. The details of joint ventures do not form part of the notes of the annual financial statements. Loans to joint ventures are unsecured, interest-free and not subject to any fixed terms of repayment.
NOTES TO THE ANNUAL FINANCIAL STATEMENTSCONTINUEDfor the year ended 30 June 2012
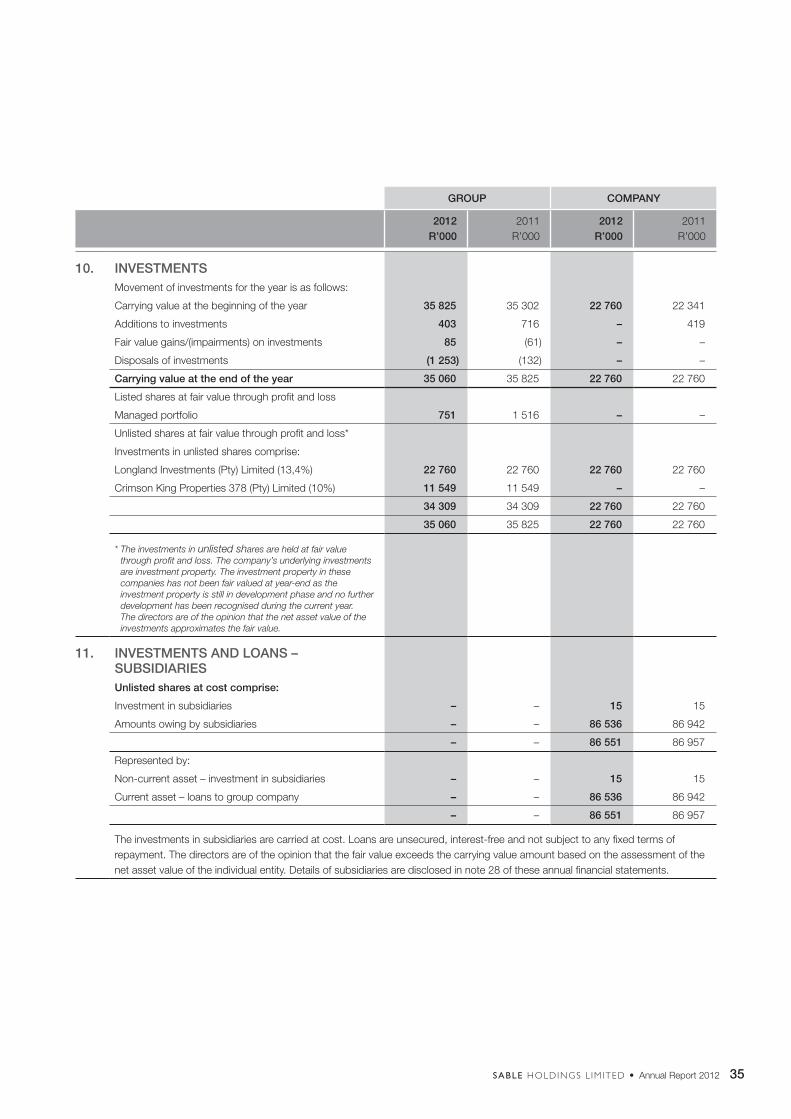
35SABLE HOLDINGS L IM ITED • Annual Report 2012
GROUP COMPANY
2012R’000
2011R’000
2012R’000
2011R’000
10. INVESTMENTSMovement of investments for the year is as follows:
Carrying value at the beginning of the year 35 825 35 302 22 760 22 341
Additions to investments 403 716 – 419
Fair value gains/(impairments) on investments 85 (61) – –
Disposals of investments (1 253) (132) – –
Carrying value at the end of the year 35 060 35 825 22 760 22 760
Listed shares at fair value through profit and loss
Managed portfolio 751 1 516 – –
Unlisted shares at fair value through profit and loss*
Investments in unlisted shares comprise:
Longland Investments (Pty) Limited (13,4%) 22 760 22 760 22 760 22 760
Crimson King Properties 378 (Pty) Limited (10%) 11 549 11 549 – –
34 309 34 309 22 760 22 760
35 060 35 825 22 760 22 760
* The investments in unlisted shares are held at fair value through profit and loss. The company’s underlying investments are investment property. The investment property in these companies has not been fair valued at year-end as the investment property is still in development phase and no further development has been recognised during the current year. The directors are of the opinion that the net asset value of the investments approximates the fair value.
11. INVESTMENTS AND LOANS – SUBSIDIARIESUnlisted shares at cost comprise:
Investment in subsidiaries – – 15 15
Amounts owing by subsidiaries – – 86 536 86 942
– – 86 551 86 957
Represented by:
Non-current asset – investment in subsidiaries – – 15 15
Current asset – loans to group company – – 86 536 86 942
– – 86 551 86 957
The investments in subsidiaries are carried at cost. Loans are unsecured, interest-free and not subject to any fixed terms of repayment. The directors are of the opinion that the fair value exceeds the carrying value amount based on the assessment of the net asset value of the individual entity. Details of subsidiaries are disclosed in note 28 of these annual financial statements.
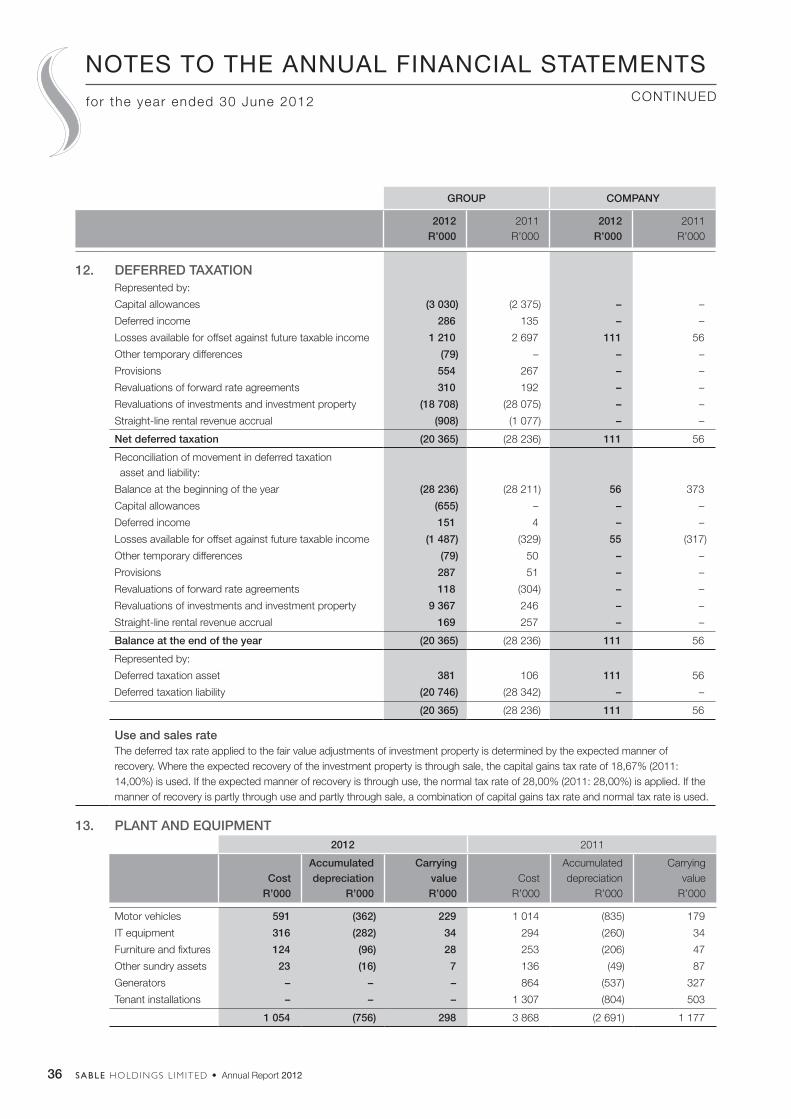
36 SABLE HOLDINGS L IM ITED • Annual Report 2012
GROUP COMPANY
2012R’000
2011R’000
2012R’000
2011R’000
12. DEFERRED TAXATIONRepresented by:
Capital allowances (3 030) (2 375) – –
Deferred income 286 135 – –
Losses available for offset against future taxable income 1 210 2 697 111 56
Other temporary differences (79) – – –
Provisions 554 267 – –
Revaluations of forward rate agreements 310 192 – –
Revaluations of investments and investment property (18 708) (28 075) – –
Straight-line rental revenue accrual (908) (1 077) – –
Net deferred taxation (20 365) (28 236) 111 56
Reconciliation of movement in deferred taxation asset and liability:
Balance at the beginning of the year (28 236) (28 211) 56 373
Capital allowances (655) – – –
Deferred income 151 4 – –
Losses available for offset against future taxable income (1 487) (329) 55 (317)
Other temporary differences (79) 50 – –
Provisions 287 51 – –
Revaluations of forward rate agreements 118 (304) – –
Revaluations of investments and investment property 9 367 246 – –
Straight-line rental revenue accrual 169 257 – –
Balance at the end of the year (20 365) (28 236) 111 56
Represented by:
Deferred taxation asset 381 106 111 56
Deferred taxation liability (20 746) (28 342) – –
(20 365) (28 236) 111 56
Use and sales rateThe deferred tax rate applied to the fair value adjustments of investment property is determined by the expected manner of recovery. Where the expected recovery of the investment property is through sale, the capital gains tax rate of 18,67% (2011: 14,00%) is used. If the expected manner of recovery is through use, the normal tax rate of 28,00% (2011: 28,00%) is applied. If the manner of recovery is partly through use and partly through sale, a combination of capital gains tax rate and normal tax rate is used.
13. PLANT AND EQUIPMENT2012 2011
CostR’000
Accumulated depreciation
R’000
Carrying valueR’000
CostR’000
Accumulated depreciation
R’000
Carrying value
R’000
Motor vehicles 591 (362) 229 1 014 (835) 179
IT equipment 316 (282) 34 294 (260) 34
Furniture and fixtures 124 (96) 28 253 (206) 47
Other sundry assets 23 (16) 7 136 (49) 87
Generators – – – 864 (537) 327
Tenant installations – – – 1 307 (804) 503
1 054 (756) 298 3 868 (2 691) 1 177
NOTES TO THE ANNUAL FINANCIAL STATEMENTSCONTINUEDfor the year ended 30 June 2012
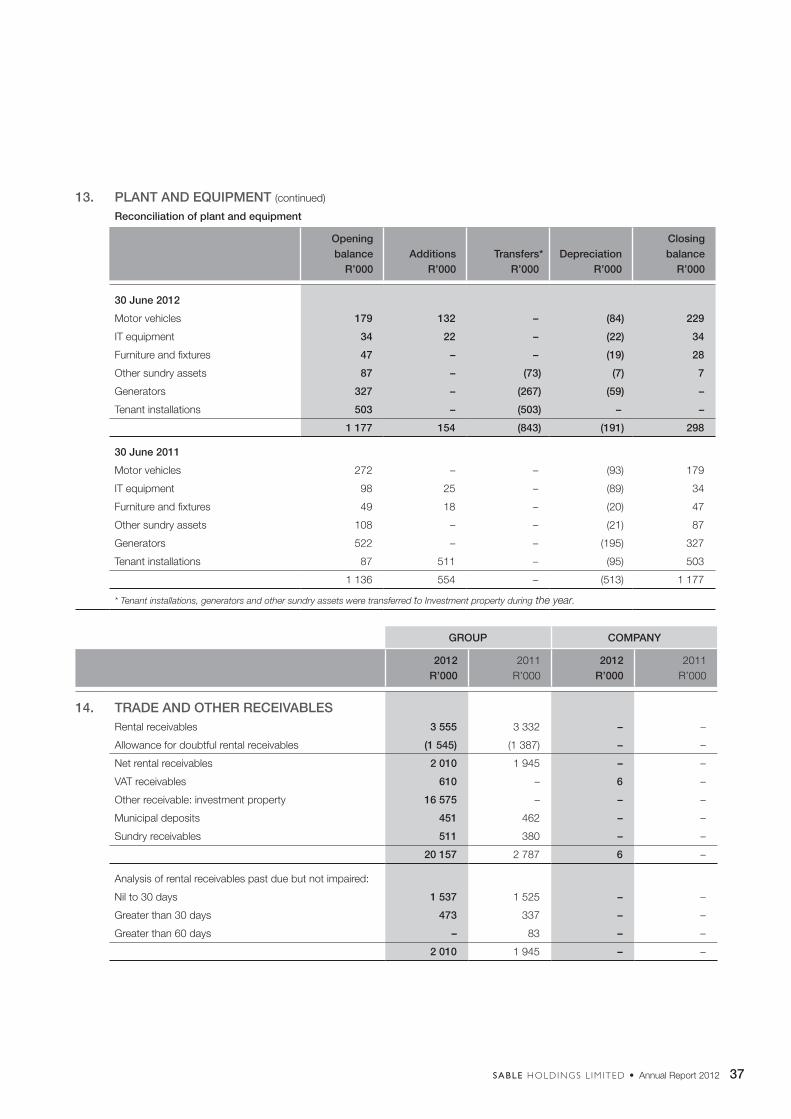
37SABLE HOLDINGS L IM ITED • Annual Report 2012
13. PLANT AND EQUIPMENT (continued)
Reconciliation of plant and equipment
Opening balance
R’000Additions
R’000Transfers*
R’000Depreciation
R’000
Closing balance
R’000
30 June 2012
Motor vehicles 179 132 – (84) 229
IT equipment 34 22 – (22) 34
Furniture and fixtures 47 – – (19) 28
Other sundry assets 87 – (73) (7) 7
Generators 327 – (267) (59) –
Tenant installations 503 – (503) – –
1 177 154 (843) (191) 298
30 June 2011
Motor vehicles 272 – – (93) 179
IT equipment 98 25 – (89) 34
Furniture and fixtures 49 18 – (20) 47
Other sundry assets 108 – – (21) 87
Generators 522 – – (195) 327
Tenant installations 87 511 – (95) 503
1 136 554 – (513) 1 177
* Tenant installations, generators and other sundry assets were transferred to Investment property during the year.
GROUP COMPANY
2012R’000
2011R’000
2012R’000
2011R’000
14. TRADE AND OTHER RECEIVABLESRental receivables 3 555 3 332 – –
Allowance for doubtful rental receivables (1 545) (1 387) – –
Net rental receivables 2 010 1 945 – –
VAT receivables 610 – 6 –
Other receivable: investment property 16 575 – – –
Municipal deposits 451 462 – –
Sundry receivables 511 380 – –
20 157 2 787 6 –
Analysis of rental receivables past due but not impaired:
Nil to 30 days 1 537 1 525 – –
Greater than 30 days 473 337 – –
Greater than 60 days – 83 – –
2 010 1 945 – –
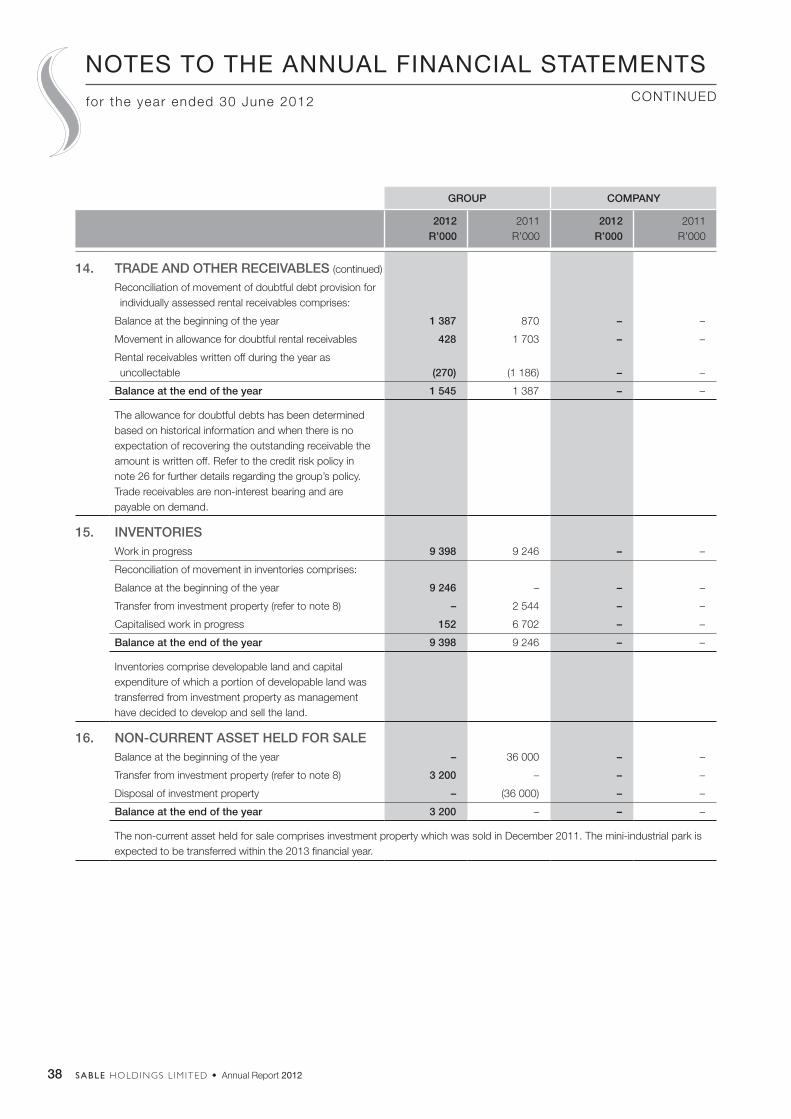
38 SABLE HOLDINGS L IM ITED • Annual Report 2012
GROUP COMPANY
2012R’000
2011R’000
2012R’000
2011R’000
14. TRADE AND OTHER RECEIVABLES (continued)
Reconciliation of movement of doubtful debt provision for individually assessed rental receivables comprises:
Balance at the beginning of the year 1 387 870 – –
Movement in allowance for doubtful rental receivables 428 1 703 – –
Rental receivables written off during the year as uncollectable (270) (1 186) – –
Balance at the end of the year 1 545 1 387 – –
The allowance for doubtful debts has been determined based on historical information and when there is no expectation of recovering the outstanding receivable the amount is written off. Refer to the credit risk policy in note 26 for further details regarding the group’s policy. Trade receivables are non-interest bearing and are payable on demand.
15. INVENTORIESWork in progress 9 398 9 246 – –
Reconciliation of movement in inventories comprises:
Balance at the beginning of the year 9 246 – – –
Transfer from investment property (refer to note 8) – 2 544 – –
Capitalised work in progress 152 6 702 – –
Balance at the end of the year 9 398 9 246 – –
Inventories comprise developable land and capital expenditure of which a portion of developable land was transferred from investment property as management have decided to develop and sell the land.
16. NON-CURRENT ASSET HELD FOR SALEBalance at the beginning of the year – 36 000 – –
Transfer from investment property (refer to note 8) 3 200 – – –
Disposal of investment property – (36 000) – –
Balance at the end of the year 3 200 – – –
The non-current asset held for sale comprises investment property which was sold in December 2011. The mini-industrial park is expected to be transferred within the 2013 financial year.
NOTES TO THE ANNUAL FINANCIAL STATEMENTSCONTINUEDfor the year ended 30 June 2012
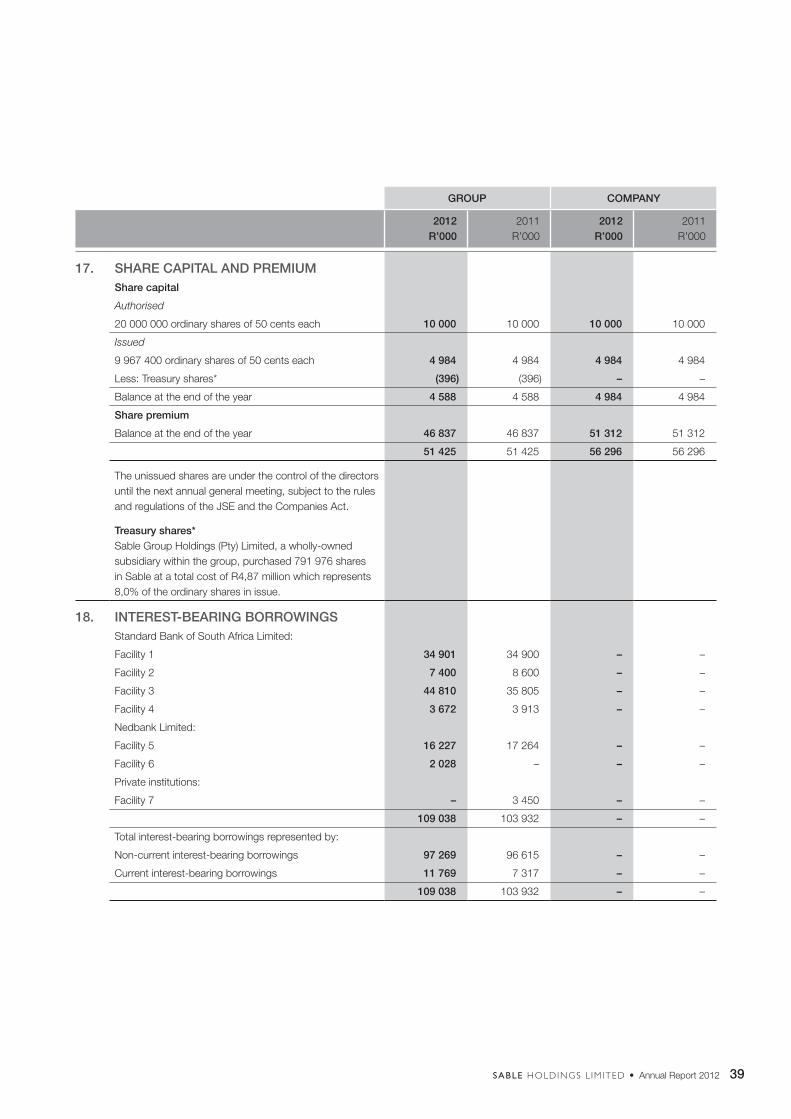
39SABLE HOLDINGS L IM ITED • Annual Report 2012
GROUP COMPANY
2012R’000
2011R’000
2012R’000
2011R’000
17. SHARE CAPITAL AND PREMIUMShare capital
Authorised
20 000 000 ordinary shares of 50 cents each 10 000 10 000 10 000 10 000
Issued
9 967 400 ordinary shares of 50 cents each 4 984 4 984 4 984 4 984
Less: Treasury shares* (396) (396) – –
Balance at the end of the year 4 588 4 588 4 984 4 984
Share premium
Balance at the end of the year 46 837 46 837 51 312 51 312
51 425 51 425 56 296 56 296
The unissued shares are under the control of the directors until the next annual general meeting, subject to the rules and regulations of the JSE and the Companies Act.
Treasury shares*Sable Group Holdings (Pty) Limited, a wholly-owned subsidiary within the group, purchased 791 976 shares in Sable at a total cost of R4,87 million which represents 8,0% of the ordinary shares in issue.
18. INTEREST-BEARING BORROWINGSStandard Bank of South Africa Limited:
Facility 1 34 901 34 900 – –
Facility 2 7 400 8 600 – –
Facility 3 44 810 35 805 – –
Facility 4 3 672 3 913 – –
Nedbank Limited:
Facility 5 16 227 17 264 – –
Facility 6 2 028 – – –
Private institutions:
Facility 7 – 3 450 – –
109 038 103 932 – –
Total interest-bearing borrowings represented by:
Non-current interest-bearing borrowings 97 269 96 615 – –
Current interest-bearing borrowings 11 769 7 317 – –
109 038 103 932 – –
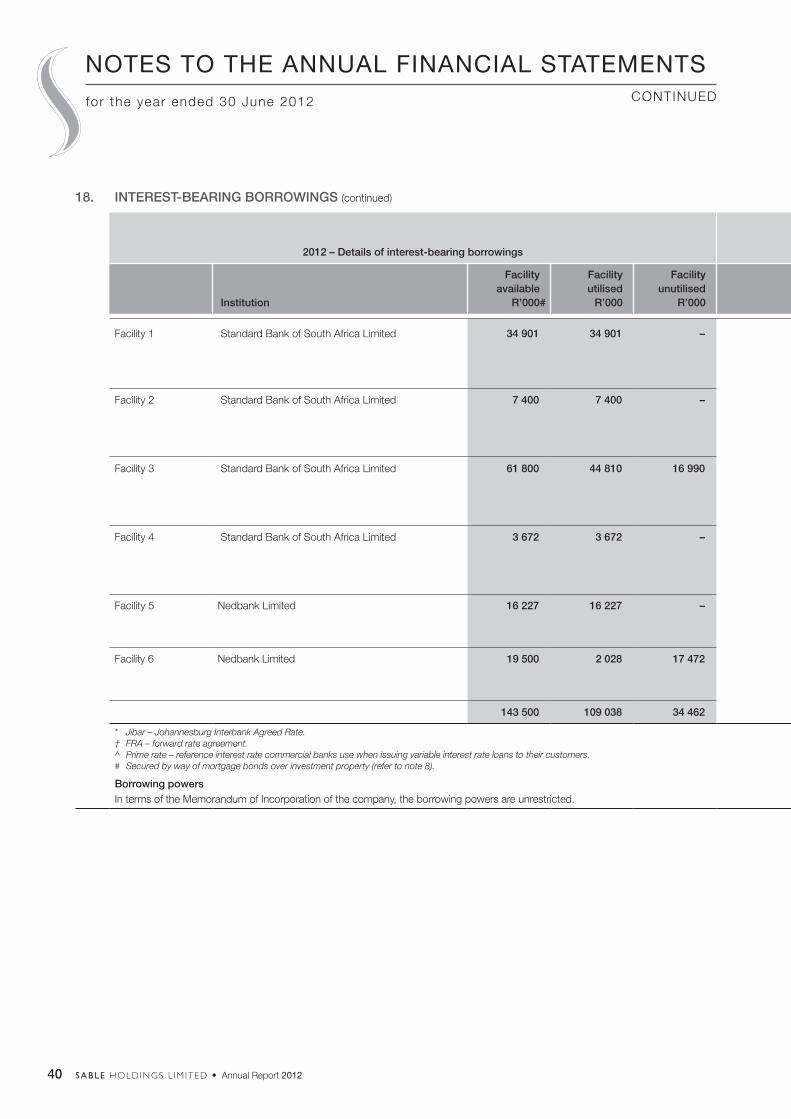
40 SABLE HOLDINGS L IM ITED • Annual Report 2012
18. INTEREST-BEARING BORROWINGS (continued)
2012 – Details of interest-bearing borrowings
Variable interest-bearing
borrowings
Fixed interest-bearing
borrowings
Institution
Facility available
R’000#
Facility utilised
R’000
Facility unutilised
R’000 Amount
R’000 RateAmount
R’000 Rate
Maturity date
of FRA†Repayment terms
Facility 1 Standard Bank of South Africa Limited 34 901 34 901 – 14 123 8,29% (1 month
Jibar* +1,50%)
7 412
13 366
8,17%
9,49%
3 month Jibar*
30 April 2014
Interest is repaid monthly. Capital will be repaid in full by 30 April 2014 per a structured repayment plan.
Facility 2 Standard Bank of South Africa Limited 7 400 7 400 – 7 400 7,75% (Prime^
less 1,25%)
– – – Interest is repaid monthly. Capital will be repaid in full by 31 March 2016 per a structured repayment plan.
Facility 3 Standard Bank of South Africa Limited 61 800 44 810 16 990 18 310 7,35% (Prime^
less 1,65%)
26 500 10,34% 31 October 2013
Interest is repaid monthly. Capital will be repaid in full by 31 March 2019 per a structured repayment plan.
Facility 4 Standard Bank of South Africa Limited 3 672 3 672 – 3 672 8,50% (Prime^
less 0,50%)
– – – Interest is repaid monthly. Capital will be repaid in full by 30 September 2014 per a structured repayment plan.
Facility 5 Nedbank Limited 16 227 16 227 – 16 227 7,35% (Prime^
less 1,65%)
– – – Interest is repaid monthly. Capital will be repaid in full by 31 July 2020.
Facility 6 Nedbank Limited 19 500 2 028 17 472 2 028 9,00% (Prime^)
– – – Interest is repaid monthly. Capital will be repaid in full by 31 October 2022.
143 500 109 038 34 462 61 760 47 278
* Jibar – Johannesburg Interbank Agreed Rate.† FRA – forward rate agreement.^ Prime rate – reference interest rate commercial banks use when issuing variable interest rate loans to their customers.# Secured by way of mortgage bonds over investment property (refer to note 8).
Borrowing powersIn terms of the Memorandum of Incorporation of the company, the borrowing powers are unrestricted.
NOTES TO THE ANNUAL FINANCIAL STATEMENTSCONTINUEDfor the year ended 30 June 2012
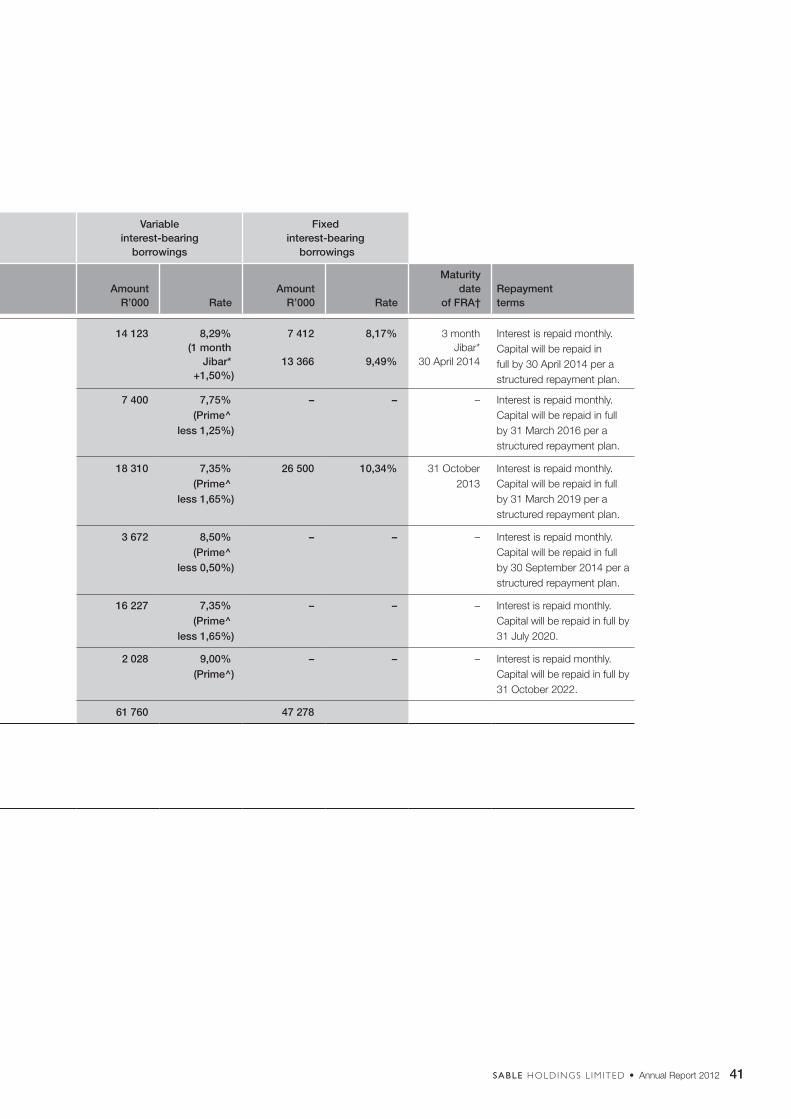
41SABLE HOLDINGS L IM ITED • Annual Report 2012
18. INTEREST-BEARING BORROWINGS (continued)
2012 – Details of interest-bearing borrowings
Variable interest-bearing
borrowings
Fixed interest-bearing
borrowings
Institution
Facility available
R’000#
Facility utilised
R’000
Facility unutilised
R’000 Amount
R’000 RateAmount
R’000 Rate
Maturity date
of FRA†Repayment terms
Facility 1 Standard Bank of South Africa Limited 34 901 34 901 – 14 123 8,29% (1 month
Jibar* +1,50%)
7 412
13 366
8,17%
9,49%
3 month Jibar*
30 April 2014
Interest is repaid monthly. Capital will be repaid in full by 30 April 2014 per a structured repayment plan.
Facility 2 Standard Bank of South Africa Limited 7 400 7 400 – 7 400 7,75% (Prime^
less 1,25%)
– – – Interest is repaid monthly. Capital will be repaid in full by 31 March 2016 per a structured repayment plan.
Facility 3 Standard Bank of South Africa Limited 61 800 44 810 16 990 18 310 7,35% (Prime^
less 1,65%)
26 500 10,34% 31 October 2013
Interest is repaid monthly. Capital will be repaid in full by 31 March 2019 per a structured repayment plan.
Facility 4 Standard Bank of South Africa Limited 3 672 3 672 – 3 672 8,50% (Prime^
less 0,50%)
– – – Interest is repaid monthly. Capital will be repaid in full by 30 September 2014 per a structured repayment plan.
Facility 5 Nedbank Limited 16 227 16 227 – 16 227 7,35% (Prime^
less 1,65%)
– – – Interest is repaid monthly. Capital will be repaid in full by 31 July 2020.
Facility 6 Nedbank Limited 19 500 2 028 17 472 2 028 9,00% (Prime^)
– – – Interest is repaid monthly. Capital will be repaid in full by 31 October 2022.
143 500 109 038 34 462 61 760 47 278
* Jibar – Johannesburg Interbank Agreed Rate.† FRA – forward rate agreement.^ Prime rate – reference interest rate commercial banks use when issuing variable interest rate loans to their customers.# Secured by way of mortgage bonds over investment property (refer to note 8).
Borrowing powersIn terms of the Memorandum of Incorporation of the company, the borrowing powers are unrestricted.
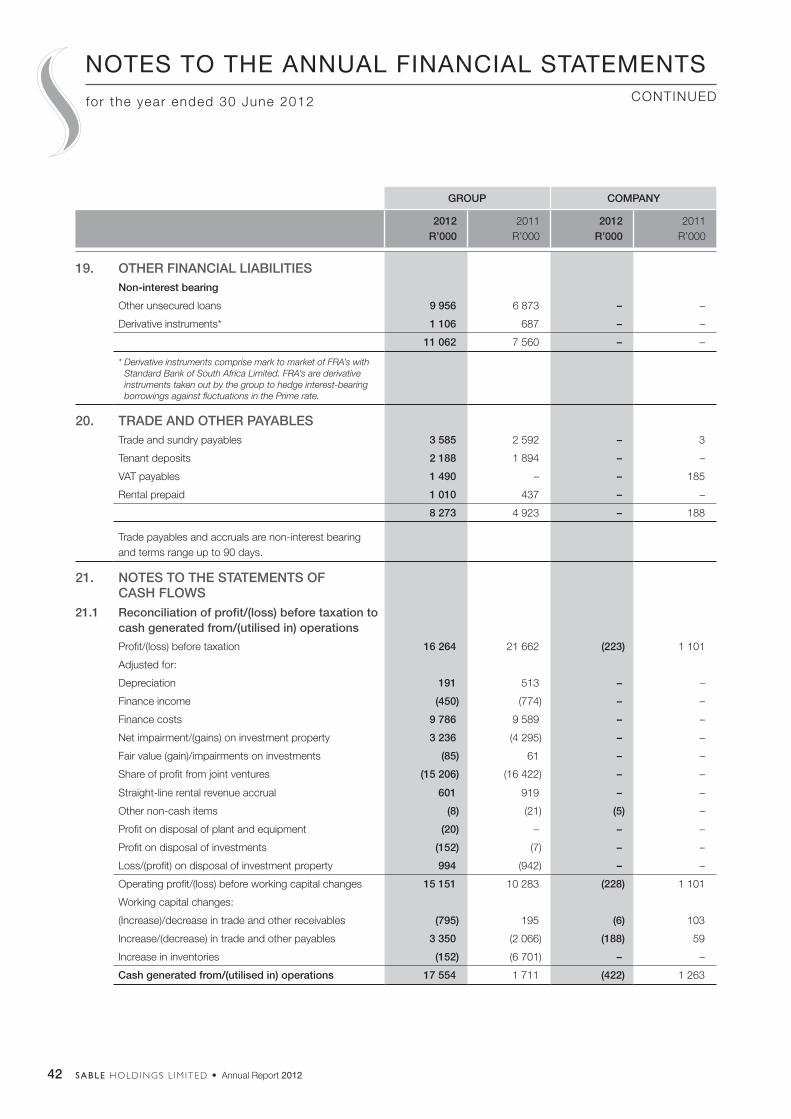
42 SABLE HOLDINGS L IM ITED • Annual Report 2012
GROUP COMPANY
2012R’000
2011R’000
2012R’000
2011R’000
19. OTHER FINANCIAL LIABILITIESNon-interest bearing
Other unsecured loans 9 956 6 873 – –
Derivative instruments* 1 106 687 – –
11 062 7 560 – –
* Derivative instruments comprise mark to market of FRA’s with Standard Bank of South Africa Limited. FRA’s are derivative instruments taken out by the group to hedge interest-bearing borrowings against fluctuations in the Prime rate.
20. TRADE AND OTHER PAYABLESTrade and sundry payables 3 585 2 592 – 3
Tenant deposits 2 188 1 894 – –
VAT payables 1 490 – – 185
Rental prepaid 1 010 437 – –
8 273 4 923 – 188
Trade payables and accruals are non-interest bearing and terms range up to 90 days.
21. NOTES TO THE STATEMENTS OF CASH FLOWS
21.1 Reconciliation of profit/(loss) before taxation to cash generated from/(utilised in) operations
Profit/(loss) before taxation 16 264 21 662 (223) 1 101
Adjusted for:
Depreciation 191 513 – –
Finance income (450) (774) – –
Finance costs 9 786 9 589 – –
Net impairment/(gains) on investment property 3 236 (4 295) – –
Fair value (gain)/impairments on investments (85) 61 – –
Share of profit from joint ventures (15 206) (16 422) – –
Straight-line rental revenue accrual 601 919 – –
Other non-cash items (8) (21) (5) –
Profit on disposal of plant and equipment (20) – – –
Profit on disposal of investments (152) (7) – –
Loss/(profit) on disposal of investment property 994 (942) – –
Operating profit/(loss) before working capital changes 15 151 10 283 (228) 1 101
Working capital changes:
(Increase)/decrease in trade and other receivables (795) 195 (6) 103
Increase/(decrease) in trade and other payables 3 350 (2 066) (188) 59
Increase in inventories (152) (6 701) – –
Cash generated from/(utilised in) operations 17 554 1 711 (422) 1 263
NOTES TO THE ANNUAL FINANCIAL STATEMENTSCONTINUEDfor the year ended 30 June 2012
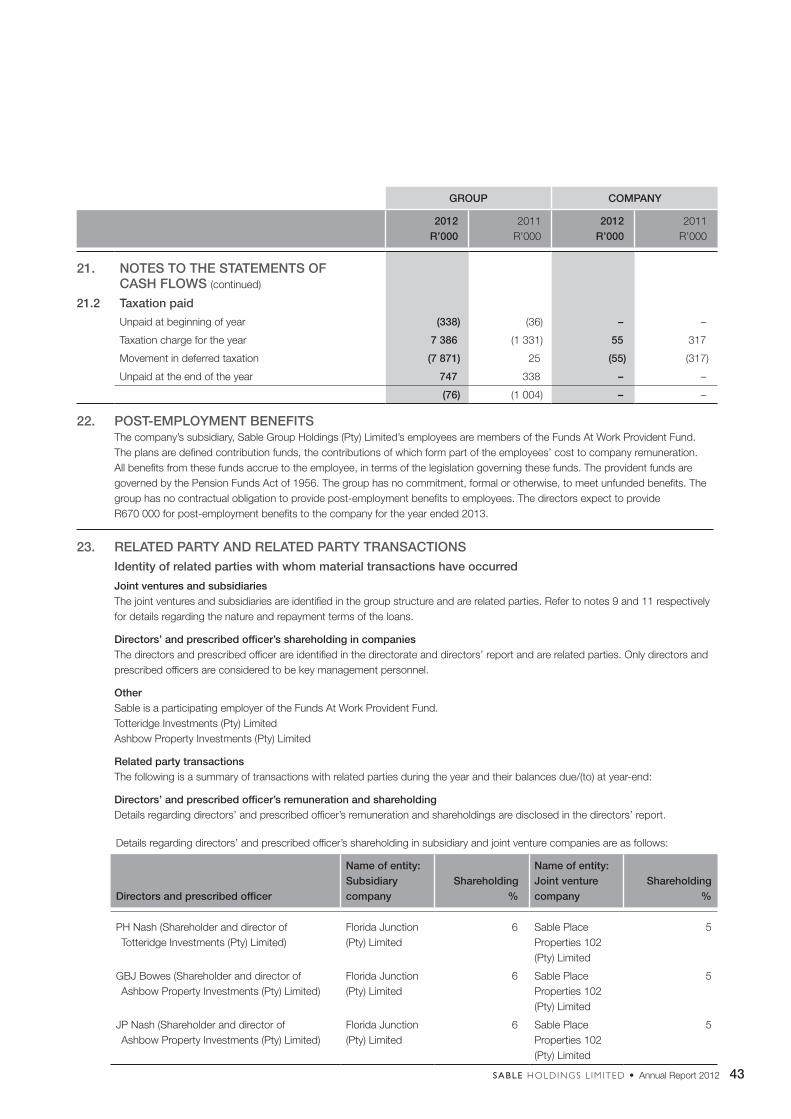
43SABLE HOLDINGS L IM ITED • Annual Report 2012
GROUP COMPANY
2012R’000
2011R’000
2012R’000
2011R’000
21. NOTES TO THE STATEMENTS OF CASH FLOWS (continued)
21.2 Taxation paid
Unpaid at beginning of year (338) (36) – –
Taxation charge for the year 7 386 (1 331) 55 317
Movement in deferred taxation (7 871) 25 (55) (317)
Unpaid at the end of the year 747 338 – –
(76) (1 004) – –
22. POST-EMPLOYMENT BENEFITS The company’s subsidiary, Sable Group Holdings (Pty) Limited’s employees are members of the Funds At Work Provident Fund.
The plans are defined contribution funds, the contributions of which form part of the employees’ cost to company remuneration. All benefits from these funds accrue to the employee, in terms of the legislation governing these funds. The provident funds are governed by the Pension Funds Act of 1956. The group has no commitment, formal or otherwise, to meet unfunded benefits. The group has no contractual obligation to provide post-employment benefits to employees. The directors expect to provide R670 000 for post-employment benefits to the company for the year ended 2013.
23. RELATED PARTY AND RELATED PARTY TRANSACTIONS Identity of related parties with whom material transactions have occurred
Joint ventures and subsidiaries The joint ventures and subsidiaries are identified in the group structure and are related parties. Refer to notes 9 and 11 respectively
for details regarding the nature and repayment terms of the loans.
Directors’ and prescribed officer’s shareholding in companies The directors and prescribed officer are identified in the directorate and directors’ report and are related parties. Only directors and
prescribed officers are considered to be key management personnel.
Other Sable is a participating employer of the Funds At Work Provident Fund. Totteridge Investments (Pty) Limited Ashbow Property Investments (Pty) Limited
Related party transactions The following is a summary of transactions with related parties during the year and their balances due/(to) at year-end:
Directors’ and prescribed officer’s remuneration and shareholding Details regarding directors’ and prescribed officer’s remuneration and shareholdings are disclosed in the directors’ report.
Details regarding directors’ and prescribed officer’s shareholding in subsidiary and joint venture companies are as follows:
Directors and prescribed officer
Name of entity: Subsidiary company
Shareholding %
Name of entity: Joint venture company
Shareholding %
PH Nash (Shareholder and director of Totteridge Investments (Pty) Limited)
Florida Junction (Pty) Limited
6 Sable Place Properties 102 (Pty) Limited
5
GBJ Bowes (Shareholder and director of Ashbow Property Investments (Pty) Limited)
Florida Junction (Pty) Limited
6 Sable Place Properties 102 (Pty) Limited
5
JP Nash (Shareholder and director of Ashbow Property Investments (Pty) Limited)
Florida Junction (Pty) Limited
6 Sable Place Properties 102 (Pty) Limited
5
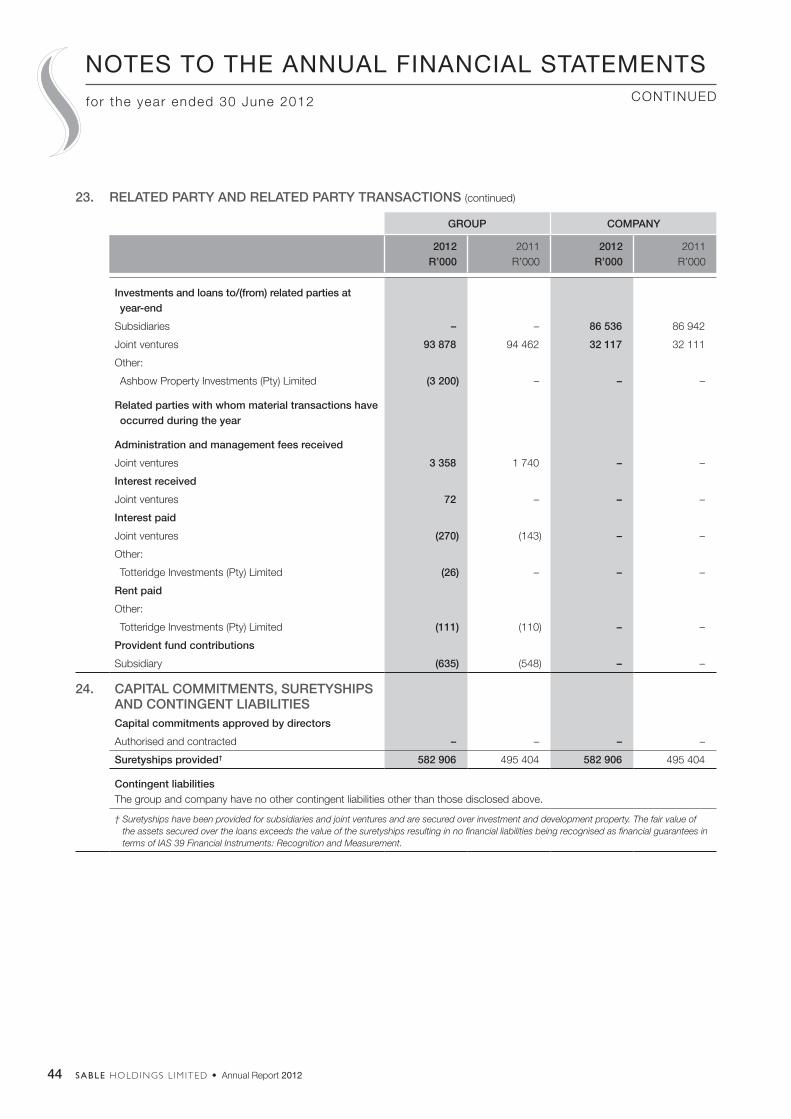
44 SABLE HOLDINGS L IM ITED • Annual Report 2012
23. RELATED PARTY AND RELATED PARTY TRANSACTIONS (continued)
GROUP COMPANY
2012R’000
2011R’000
2012R’000
2011R’000
Investments and loans to/(from) related parties at year-end
Subsidiaries – – 86 536 86 942
Joint ventures 93 878 94 462 32 117 32 111
Other:
Ashbow Property Investments (Pty) Limited (3 200) – – –
Related parties with whom material transactions have occurred during the year
Administration and management fees received
Joint ventures 3 358 1 740 – –
Interest received
Joint ventures 72 – – –
Interest paid
Joint ventures (270) (143) – –
Other:
Totteridge Investments (Pty) Limited (26) – – –
Rent paid
Other:
Totteridge Investments (Pty) Limited (111) (110) – –
Provident fund contributions
Subsidiary (635) (548) – –
24. CAPITAL COMMITMENTS, SURETYSHIPS AND CONTINGENT LIABILITIESCapital commitments approved by directors
Authorised and contracted – – – –
Suretyships provided† 582 906 495 404 582 906 495 404
Contingent liabilities The group and company have no other contingent liabilities other than those disclosed above.
† Suretyships have been provided for subsidiaries and joint ventures and are secured over investment and development property. The fair value of the assets secured over the loans exceeds the value of the suretyships resulting in no financial liabilities being recognised as financial guarantees in terms of IAS 39 Financial Instruments: Recognition and Measurement.
NOTES TO THE ANNUAL FINANCIAL STATEMENTSCONTINUEDfor the year ended 30 June 2012
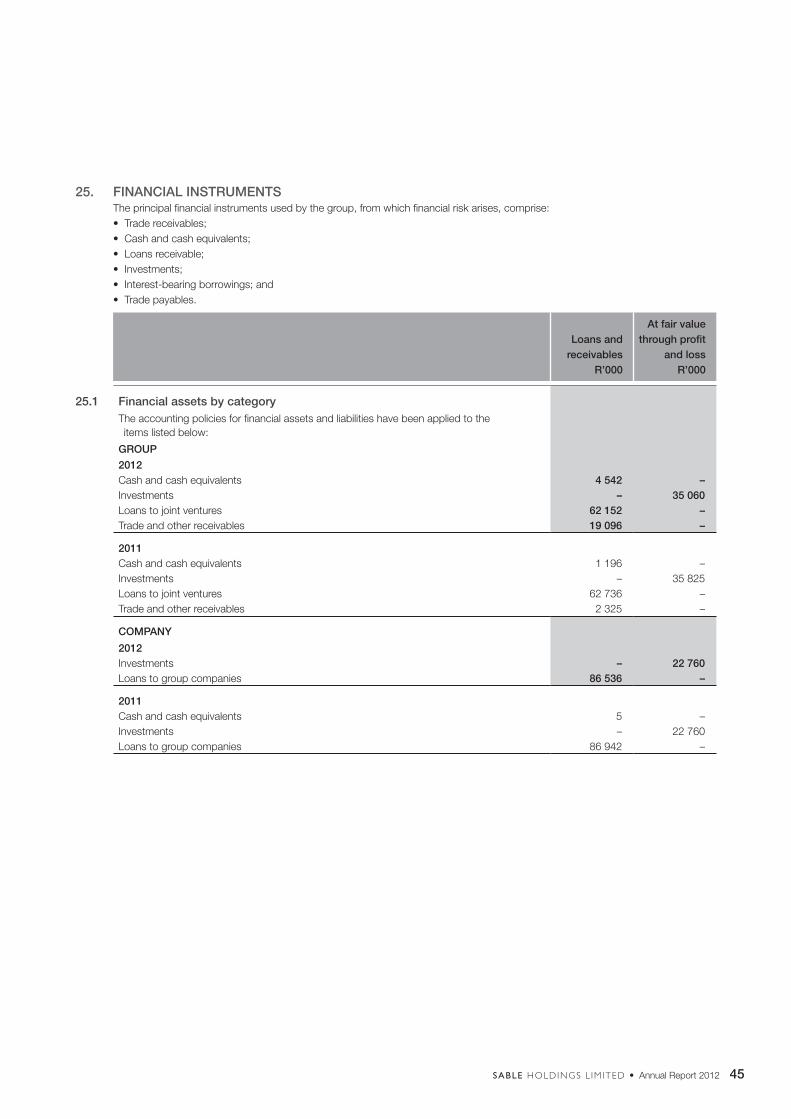
45SABLE HOLDINGS L IM ITED • Annual Report 2012
25. FINANCIAL INSTRUMENTS The principal financial instruments used by the group, from which financial risk arises, comprise: • Trade receivables; • Cash and cash equivalents; • Loans receivable; • Investments; • Interest-bearing borrowings; and • Trade payables.
Loans and receivables
R’000
At fair value through profit
and lossR’000
25.1 Financial assets by categoryThe accounting policies for financial assets and liabilities have been applied to the items listed below:
GROUP
2012 Cash and cash equivalents 4 542 – Investments – 35 060 Loans to joint ventures 62 152 –Trade and other receivables 19 096 –
2011Cash and cash equivalents 1 196 – Investments – 35 825 Loans to joint ventures 62 736 – Trade and other receivables 2 325 –
COMPANY
2012Investments – 22 760 Loans to group companies 86 536 –
2011Cash and cash equivalents 5 – Investments – 22 760 Loans to group companies 86 942 –

46 SABLE HOLDINGS L IM ITED • Annual Report 2012
25. FINANCIAL INSTRUMENTS (continued)
25.1 Financial assets by category (continued)
Financial liabilities at
amortised cost
R’000
At fair value through
profit and loss
R’000
Financial liabilities by category
GROUP
2012
Interest-bearing borrowings 109 038 – Trade and other payables 3 585 – Other financial liabilities 9 956 1 106 Bank overdraft 2 202 –
2011
Interest-bearing borrowings 103 932 – Trade and other payables 2 592 – Other financial liabilities 6 873 687
COMPANY
2012
Trade and other payables – –
Bank overdraft 5 –
2011
Trade and other payables 3 –
25.2 Fair value hierarchy disclosures Financial assets and liabilities at fair value through profit and loss by category:
Level 1R’000
Level 2R’000
Level 3R’000
TotalR’000
GROUP
2012
Total assets 751 – 34 309 35 060
Total liabilities – 1 106 – 1 106
2011
Total assets 1 516 – 34 309 35 825
Total liabilities – 687 – 687
COMPANY
2012
Total assets – – 22 760 22 760
Total liabilities – – – –
2011
Total assets – – 22 760 22 760
Total liabilities – – – –
NOTES TO THE ANNUAL FINANCIAL STATEMENTSCONTINUEDfor the year ended 30 June 2012

47SABLE HOLDINGS L IM ITED • Annual Report 2012
25. FINANCIAL INSTRUMENTS (continued)
25.2 Fair value hierarchy disclosures (continued) Categorisation within the hierarchy has been determined on the basis of the lowest level input that is significant to the fair value
measurement of the relevant levels, is as follows:
Level 1 – valued using quoted prices in active markets for identical assets (listed shares);
Level 2 – valued by reference to valuation techniques using observable inputs other than quoted prices within level 1 (derivative instruments); and
Level 3 – valued by reference to valuation techniques using inputs that are not based on observable market data (unlisted shares). There have been no transfers during the year between levels 1 and 2. A reconciliation of fair value measurements in level 3 is not required as there have been no changes in fair value.
26. RISK MANAGEMENT The group’s overall risk management programme seeks to minimise potential adverse effects on the group’s financial performance.
Risk management is carried out by management under policies approved by the board. Management evaluates financial risks in close co-operation with the group’s operating units. The board provides principles for overall risk management, as well as policies covering specific areas, such as interest rate and credit risk.
The group is exposed to risks from its use of financial instruments. This note describes the group’s objectives, policies and processes for managing those risks and the methods used to measure them. Further quantitative information in respect of these risks is presented throughout these annual financial statements.
The group is currently exposed to: • Credit risk; • Liquidity risk; • Market risk which comprises cash flow interest rate risk; and • Fair value interest rate risk.
There have been no substantive changes to the group’s exposure to financial instrument risks, its objectives, policies and processes for managing those risks or the methods used to measure them from previous periods unless otherwise stated in this note. Information disclosed has not been disaggregated, with the exception of trade receivables and trade payables, as the remaining financial instruments used by the company share the same economic characteristics and market conditions. The carrying amount of cash and cash equivalents, trade receivables and trade payables approximate fair value due to their short-term nature. The fair value of non-current liabilities is determined using the current EIR for the group. The fair values determined do not differ materially from the carrying amounts.
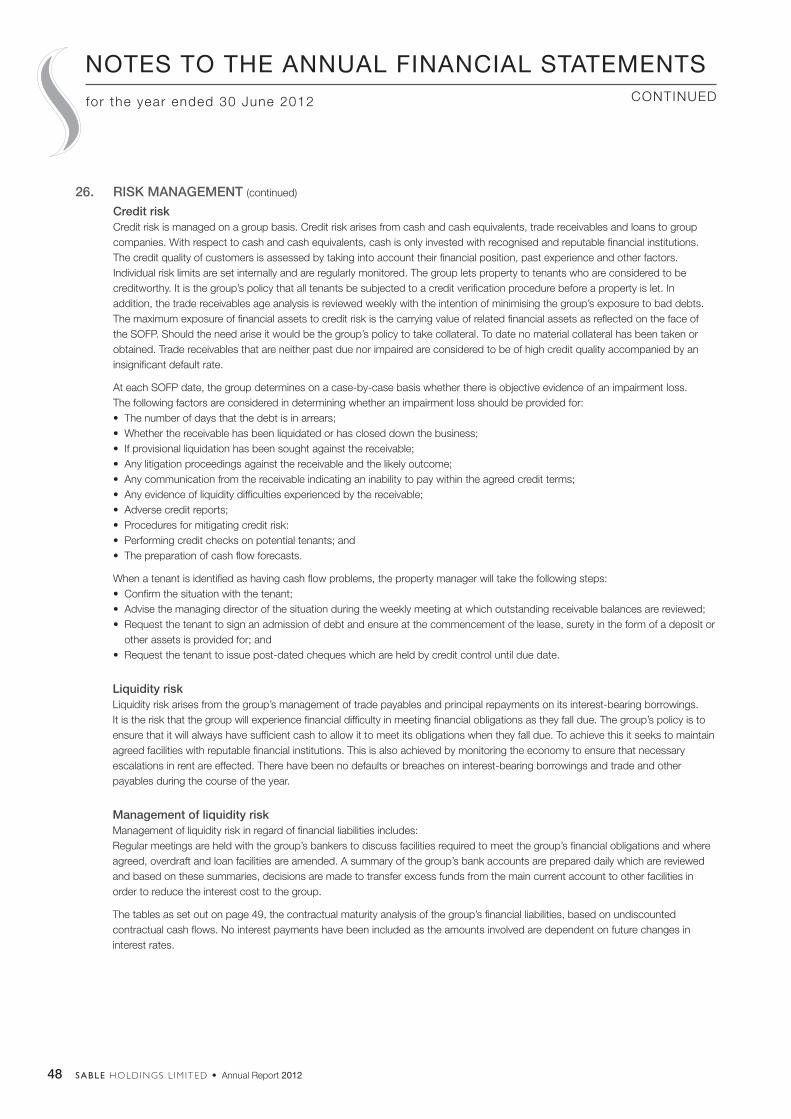
48 SABLE HOLDINGS L IM ITED • Annual Report 2012
26. RISK MANAGEMENT (continued)
Credit risk Credit risk is managed on a group basis. Credit risk arises from cash and cash equivalents, trade receivables and loans to group
companies. With respect to cash and cash equivalents, cash is only invested with recognised and reputable financial institutions. The credit quality of customers is assessed by taking into account their financial position, past experience and other factors. Individual risk limits are set internally and are regularly monitored. The group lets property to tenants who are considered to be creditworthy. It is the group’s policy that all tenants be subjected to a credit verification procedure before a property is let. In addition, the trade receivables age analysis is reviewed weekly with the intention of minimising the group’s exposure to bad debts. The maximum exposure of financial assets to credit risk is the carrying value of related financial assets as reflected on the face of the SOFP. Should the need arise it would be the group’s policy to take collateral. To date no material collateral has been taken or obtained. Trade receivables that are neither past due nor impaired are considered to be of high credit quality accompanied by an insignificant default rate.
At each SOFP date, the group determines on a case-by-case basis whether there is objective evidence of an impairment loss. The following factors are considered in determining whether an impairment loss should be provided for:
• The number of days that the debt is in arrears; • Whether the receivable has been liquidated or has closed down the business; • If provisional liquidation has been sought against the receivable; • Any litigation proceedings against the receivable and the likely outcome; • Any communication from the receivable indicating an inability to pay within the agreed credit terms; • Any evidence of liquidity difficulties experienced by the receivable; • Adverse credit reports; • Procedures for mitigating credit risk: • Performing credit checks on potential tenants; and • The preparation of cash flow forecasts.
When a tenant is identified as having cash flow problems, the property manager will take the following steps: • Confirm the situation with the tenant; • Advise the managing director of the situation during the weekly meeting at which outstanding receivable balances are reviewed; • Request the tenant to sign an admission of debt and ensure at the commencement of the lease, surety in the form of a deposit or
other assets is provided for; and • Request the tenant to issue post-dated cheques which are held by credit control until due date.
Liquidity risk Liquidity risk arises from the group’s management of trade payables and principal repayments on its interest-bearing borrowings.
It is the risk that the group will experience financial difficulty in meeting financial obligations as they fall due. The group’s policy is to ensure that it will always have sufficient cash to allow it to meet its obligations when they fall due. To achieve this it seeks to maintain agreed facilities with reputable financial institutions. This is also achieved by monitoring the economy to ensure that necessary escalations in rent are effected. There have been no defaults or breaches on interest-bearing borrowings and trade and other payables during the course of the year.
Management of liquidity risk Management of liquidity risk in regard of financial liabilities includes: Regular meetings are held with the group’s bankers to discuss facilities required to meet the group’s financial obligations and where
agreed, overdraft and loan facilities are amended. A summary of the group’s bank accounts are prepared daily which are reviewed and based on these summaries, decisions are made to transfer excess funds from the main current account to other facilities in order to reduce the interest cost to the group.
The tables as set out on page 49, the contractual maturity analysis of the group’s financial liabilities, based on undiscounted contractual cash flows. No interest payments have been included as the amounts involved are dependent on future changes in interest rates.
NOTES TO THE ANNUAL FINANCIAL STATEMENTSCONTINUEDfor the year ended 30 June 2012
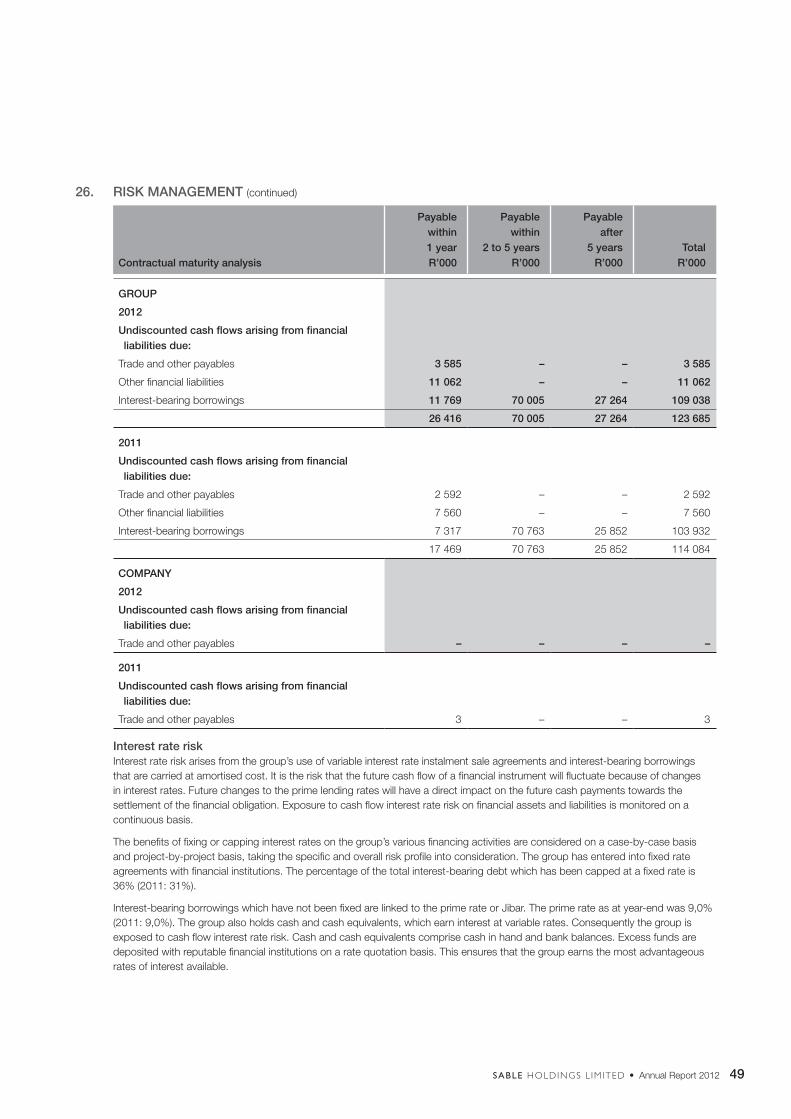
49SABLE HOLDINGS L IM ITED • Annual Report 2012
26. RISK MANAGEMENT (continued)
Contractual maturity analysis
Payable within 1 yearR’000
Payable within
2 to 5 yearsR’000
Payable after
5 yearsR’000
TotalR’000
GROUP
2012
Undiscounted cash flows arising from financial liabilities due:
Trade and other payables 3 585 – – 3 585
Other financial liabilities 11 062 – – 11 062
Interest-bearing borrowings 11 769 70 005 27 264 109 038
26 416 70 005 27 264 123 685
2011
Undiscounted cash flows arising from financial liabilities due:
Trade and other payables 2 592 – – 2 592
Other financial liabilities 7 560 – – 7 560
Interest-bearing borrowings 7 317 70 763 25 852 103 932
17 469 70 763 25 852 114 084
COMPANY
2012
Undiscounted cash flows arising from financial liabilities due:
Trade and other payables – – – –
2011
Undiscounted cash flows arising from financial liabilities due:
Trade and other payables 3 – – 3
Interest rate risk Interest rate risk arises from the group’s use of variable interest rate instalment sale agreements and interest-bearing borrowings
that are carried at amortised cost. It is the risk that the future cash flow of a financial instrument will fluctuate because of changes in interest rates. Future changes to the prime lending rates will have a direct impact on the future cash payments towards the settlement of the financial obligation. Exposure to cash flow interest rate risk on financial assets and liabilities is monitored on a continuous basis.
The benefits of fixing or capping interest rates on the group’s various financing activities are considered on a case-by-case basis and project-by-project basis, taking the specific and overall risk profile into consideration. The group has entered into fixed rate agreements with financial institutions. The percentage of the total interest-bearing debt which has been capped at a fixed rate is 36% (2011: 31%).
Interest-bearing borrowings which have not been fixed are linked to the prime rate or Jibar. The prime rate as at year-end was 9,0% (2011: 9,0%). The group also holds cash and cash equivalents, which earn interest at variable rates. Consequently the group is exposed to cash flow interest rate risk. Cash and cash equivalents comprise cash in hand and bank balances. Excess funds are deposited with reputable financial institutions on a rate quotation basis. This ensures that the group earns the most advantageous rates of interest available.
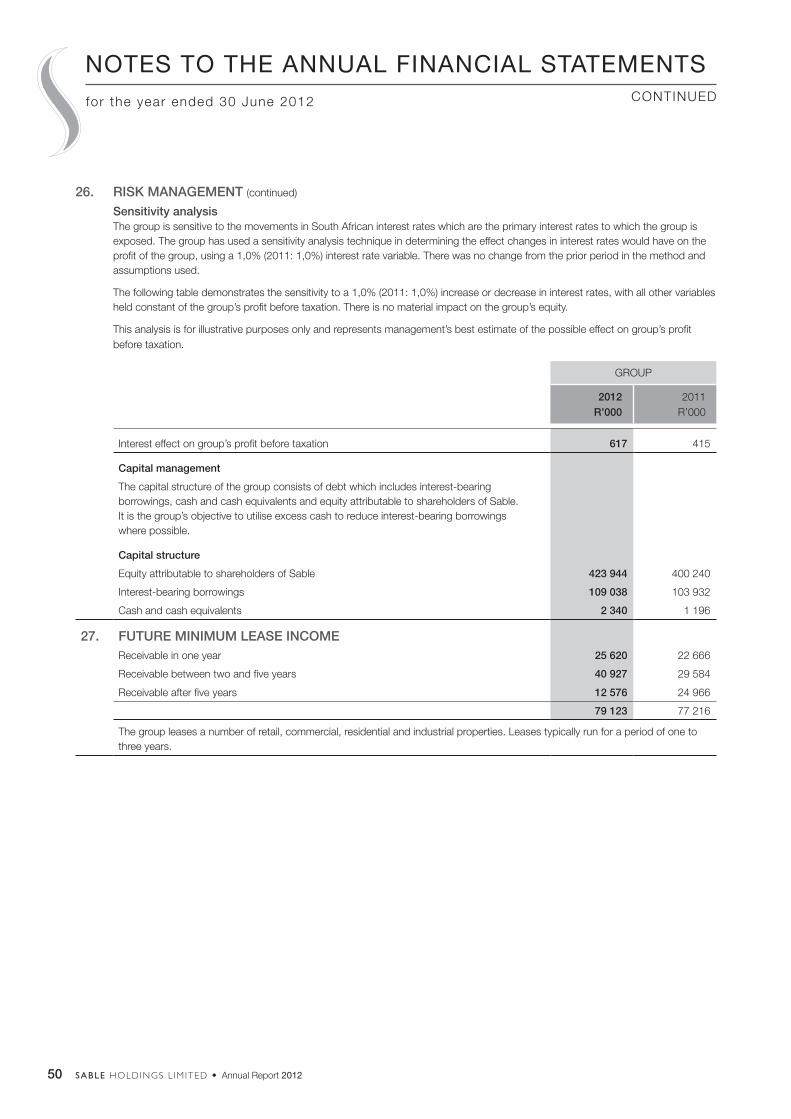
50 SABLE HOLDINGS L IM ITED • Annual Report 2012
26. RISK MANAGEMENT (continued)
Sensitivity analysis The group is sensitive to the movements in South African interest rates which are the primary interest rates to which the group is
exposed. The group has used a sensitivity analysis technique in determining the effect changes in interest rates would have on the profit of the group, using a 1,0% (2011: 1,0%) interest rate variable. There was no change from the prior period in the method and assumptions used.
The following table demonstrates the sensitivity to a 1,0% (2011: 1,0%) increase or decrease in interest rates, with all other variables held constant of the group’s profit before taxation. There is no material impact on the group’s equity.
This analysis is for illustrative purposes only and represents management’s best estimate of the possible effect on group’s profit before taxation.
GROUP
2012R’000
2011R’000
Interest effect on group’s profit before taxation 617 415
Capital management
The capital structure of the group consists of debt which includes interest-bearing borrowings, cash and cash equivalents and equity attributable to shareholders of Sable. It is the group’s objective to utilise excess cash to reduce interest-bearing borrowings where possible.
Capital structure
Equity attributable to shareholders of Sable 423 944 400 240
Interest-bearing borrowings 109 038 103 932
Cash and cash equivalents 2 340 1 196
27. FUTURE MINIMUM LEASE INCOMEReceivable in one year 25 620 22 666
Receivable between two and five years 40 927 29 584
Receivable after five years 12 576 24 966
79 123 77 216
The group leases a number of retail, commercial, residential and industrial properties. Leases typically run for a period of one to three years.
NOTES TO THE ANNUAL FINANCIAL STATEMENTSCONTINUEDfor the year ended 30 June 2012
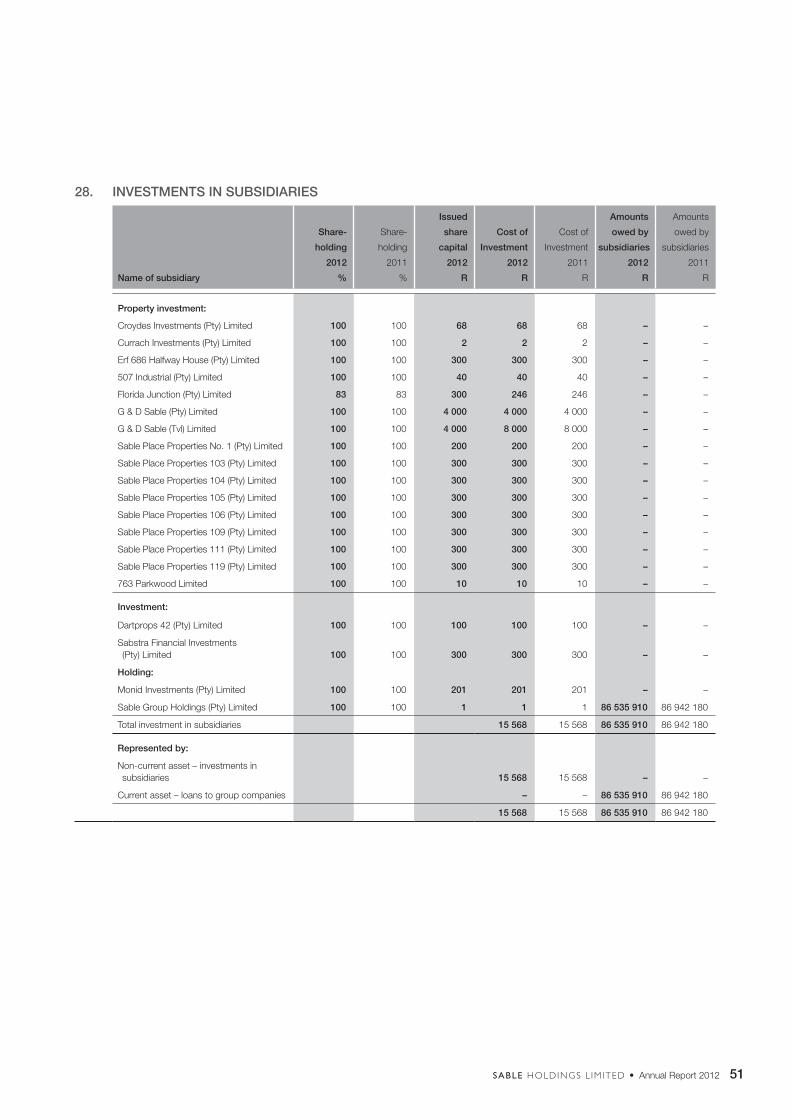
51SABLE HOLDINGS L IM ITED • Annual Report 2012
28. INVESTMENTS IN SUBSIDIARIES
Name of subsidiary
Share-
holding
2012
%
Share-
holding
2011
%
Issued
share
capital
2012
R
Cost of
Investment
2012
R
Cost of
Investment
2011
R
Amounts
owed by
subsidiaries
2012
R
Amounts
owed by
subsidiaries
2011
R
Property investment:
Croydes Investments (Pty) Limited 100 100 68 68 68 – –
Currach Investments (Pty) Limited 100 100 2 2 2 – –
Erf 686 Halfway House (Pty) Limited 100 100 300 300 300 – –
507 Industrial (Pty) Limited 100 100 40 40 40 – –
Florida Junction (Pty) Limited 83 83 300 246 246 – –
G & D Sable (Pty) Limited 100 100 4 000 4 000 4 000 – –
G & D Sable (Tvl) Limited 100 100 4 000 8 000 8 000 – –
Sable Place Properties No. 1 (Pty) Limited 100 100 200 200 200 – –
Sable Place Properties 103 (Pty) Limited 100 100 300 300 300 – –
Sable Place Properties 104 (Pty) Limited 100 100 300 300 300 – –
Sable Place Properties 105 (Pty) Limited 100 100 300 300 300 – –
Sable Place Properties 106 (Pty) Limited 100 100 300 300 300 – –
Sable Place Properties 109 (Pty) Limited 100 100 300 300 300 – –
Sable Place Properties 111 (Pty) Limited 100 100 300 300 300 – –
Sable Place Properties 119 (Pty) Limited 100 100 300 300 300 – –
763 Parkwood Limited 100 100 10 10 10 – –
Investment:
Dartprops 42 (Pty) Limited 100 100 100 100 100 – –
Sabstra Financial Investments (Pty) Limited 100 100 300 300 300 – –
Holding:
Monid Investments (Pty) Limited 100 100 201 201 201 – –
Sable Group Holdings (Pty) Limited 100 100 1 1 1 86 535 910 86 942 180
Total investment in subsidiaries 15 568 15 568 86 535 910 86 942 180
Represented by:
Non-current asset – investments in subsidiaries 15 568 15 568 – –
Current asset – loans to group companies – – 86 535 910 86 942 180
15 568 15 568 86 535 910 86 942 180
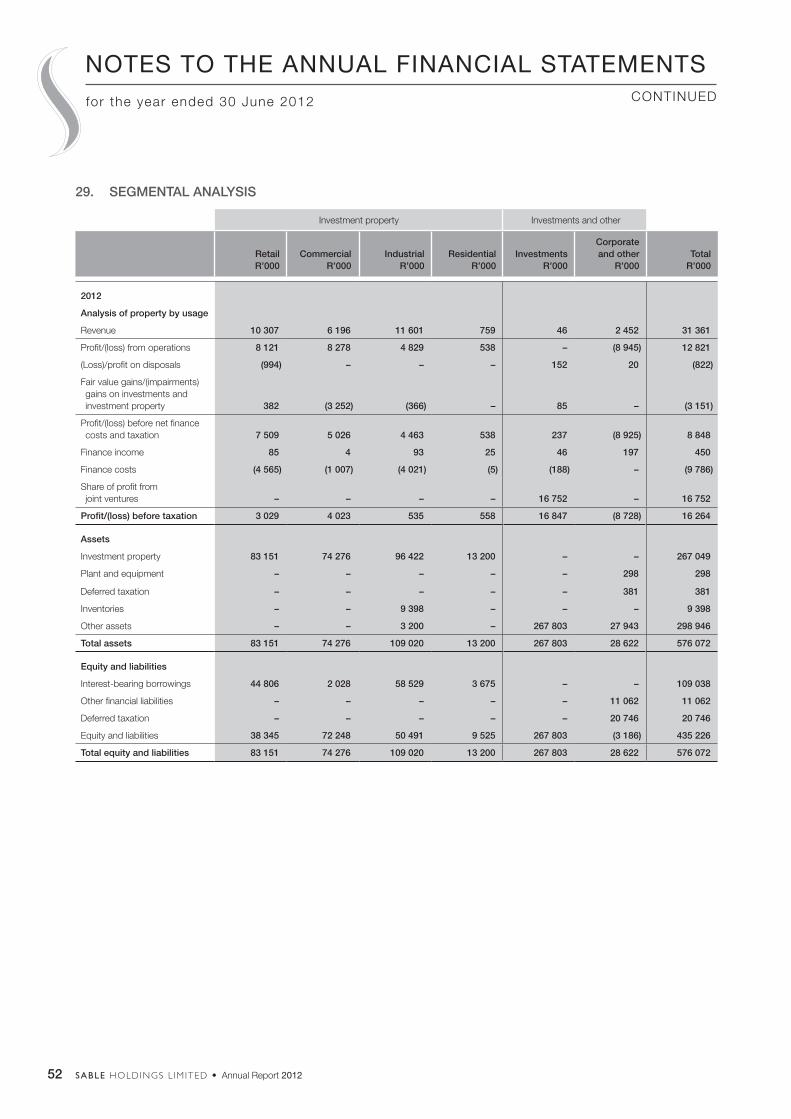
52 SABLE HOLDINGS L IM ITED • Annual Report 2012
NOTES TO THE ANNUAL FINANCIAL STATEMENTSCONTINUED
29. SEGMENTAL ANALYSIS
Investment property Investments and other
RetailR’000
CommercialR’000
IndustrialR’000
ResidentialR’000
InvestmentsR’000
Corporate and other
R’000 Total
R’000
2012
Analysis of property by usage
Revenue 10 307 6 196 11 601 759 46 2 452 31 361
Profit/(loss) from operations 8 121 8 278 4 829 538 – (8 945) 12 821
(Loss)/profit on disposals (994) – – – 152 20 (822)
Fair value gains/(impairments) gains on investments and investment property 382 (3 252) (366) – 85 – (3 151)
Profit/(loss) before net finance costs and taxation 7 509 5 026 4 463 538 237 (8 925) 8 848
Finance income 85 4 93 25 46 197 450
Finance costs (4 565) (1 007) (4 021) (5) (188) – (9 786)
Share of profit from joint ventures – – – – 16 752 – 16 752
Profit/(loss) before taxation 3 029 4 023 535 558 16 847 (8 728) 16 264
Assets
Investment property 83 151 74 276 96 422 13 200 – – 267 049
Plant and equipment – – – – – 298 298
Deferred taxation – – – – – 381 381
Inventories – – 9 398 – – – 9 398
Other assets – – 3 200 – 267 803 27 943 298 946
Total assets 83 151 74 276 109 020 13 200 267 803 28 622 576 072
Equity and liabilities
Interest-bearing borrowings 44 806 2 028 58 529 3 675 – – 109 038
Other financial liabilities – – – – – 11 062 11 062
Deferred taxation – – – – – 20 746 20 746
Equity and liabilities 38 345 72 248 50 491 9 525 267 803 (3 186) 435 226
Total equity and liabilities 83 151 74 276 109 020 13 200 267 803 28 622 576 072
for the year ended 30 June 2012
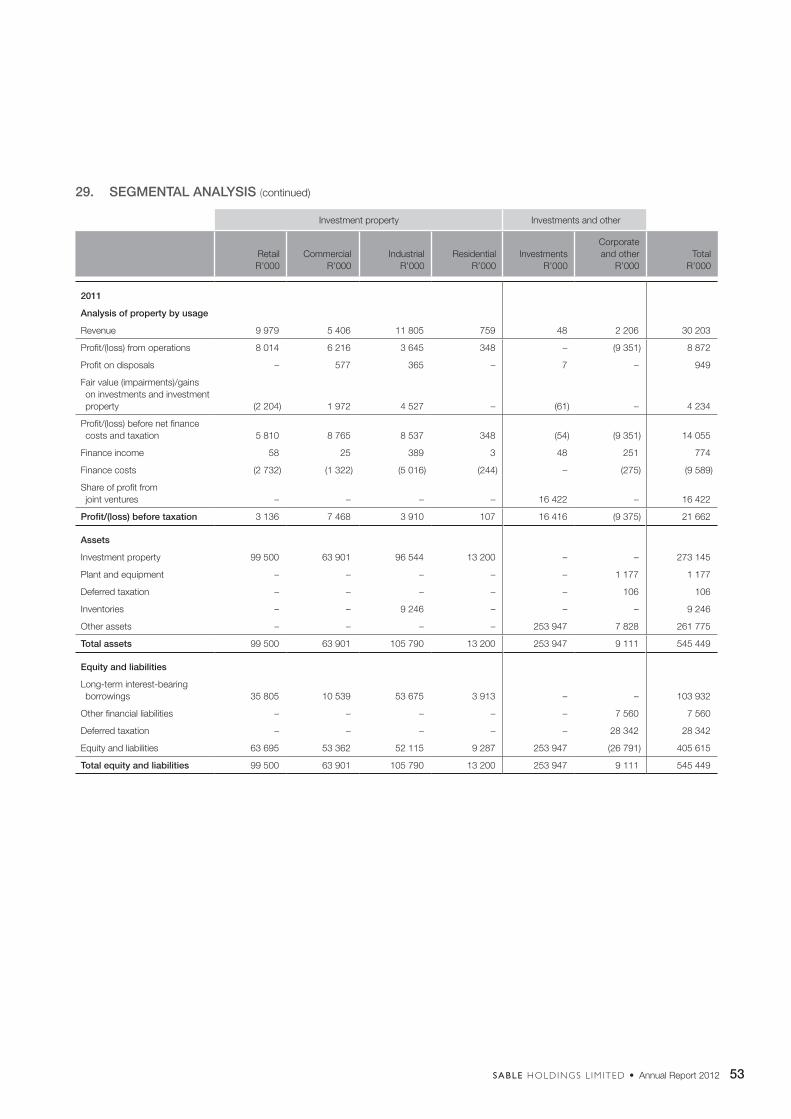
53SABLE HOLDINGS L IM ITED • Annual Report 2012
29. SEGMENTAL ANALYSIS (continued)
Investment property Investments and other
RetailR’000
CommercialR’000
IndustrialR’000
ResidentialR’000
InvestmentsR’000
Corporate and other
R’000 Total
R’000
2011
Analysis of property by usage
Revenue 9 979 5 406 11 805 759 48 2 206 30 203
Profit/(loss) from operations 8 014 6 216 3 645 348 – (9 351) 8 872
Profit on disposals – 577 365 – 7 – 949
Fair value (impairments)/gains on investments and investment property (2 204) 1 972 4 527 – (61) – 4 234
Profit/(loss) before net finance costs and taxation 5 810 8 765 8 537 348 (54) (9 351) 14 055
Finance income 58 25 389 3 48 251 774
Finance costs (2 732) (1 322) (5 016) (244) – (275) (9 589)
Share of profit from joint ventures – – – – 16 422 – 16 422
Profit/(loss) before taxation 3 136 7 468 3 910 107 16 416 (9 375) 21 662
Assets
Investment property 99 500 63 901 96 544 13 200 – – 273 145
Plant and equipment – – – – – 1 177 1 177
Deferred taxation – – – – – 106 106
Inventories – – 9 246 – – – 9 246
Other assets – – – – 253 947 7 828 261 775
Total assets 99 500 63 901 105 790 13 200 253 947 9 111 545 449
Equity and liabilities
Long-term interest-bearing borrowings 35 805 10 539 53 675 3 913 – – 103 932
Other financial liabilities – – – – – 7 560 7 560
Deferred taxation – – – – – 28 342 28 342
Equity and liabilities 63 695 53 362 52 115 9 287 253 947 (26 791) 405 615
Total equity and liabilities 99 500 63 901 105 790 13 200 253 947 9 111 545 449
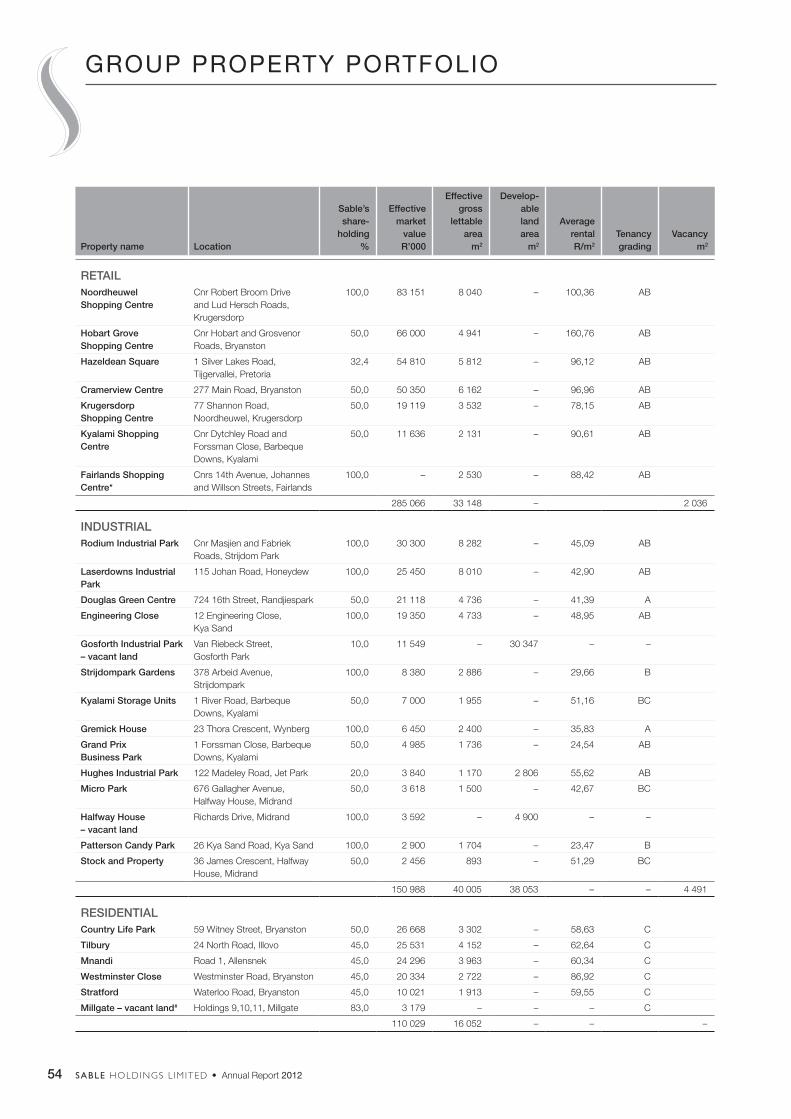
54 SABLE HOLDINGS L IM ITED • Annual Report 2012
Property name Location
Sable’sshare-
holding%
Effectivemarket
valueR’000
Effectivegross
lettablearea
m2
Develop-able landarea
m2
AveragerentalR/m2
Tenancygrading
Vacancym2
RETAILNoordheuwel Shopping Centre
Cnr Robert Broom Drive and Lud Hersch Roads, Krugersdorp
100,0 83 151 8 040 – 100,36 AB
Hobart Grove Shopping Centre
Cnr Hobart and Grosvenor Roads, Bryanston
50,0 66 000 4 941 – 160,76 AB
Hazeldean Square 1 Silver Lakes Road, Tijgervallei, Pretoria
32,4 54 810 5 812 – 96,12 AB
Cramerview Centre 277 Main Road, Bryanston 50,0 50 350 6 162 – 96,96 AB
Krugersdorp Shopping Centre
77 Shannon Road, Noordheuwel, Krugersdorp
50,0 19 119 3 532 – 78,15 AB
Kyalami Shopping Centre
Cnr Dytchley Road and Forssman Close, Barbeque Downs, Kyalami
50,0 11 636 2 131 – 90,61 AB
Fairlands Shopping Centre*
Cnrs 14th Avenue, Johannes and Willson Streets, Fairlands
100,0 – 2 530 – 88,42 AB
285 066 33 148 – 2 036
INDUSTRIALRodium Industrial Park Cnr Masjien and Fabriek
Roads, Strijdom Park 100,0 30 300 8 282 – 45,09 AB
Laserdowns Industrial Park
115 Johan Road, Honeydew 100,0 25 450 8 010 – 42,90 AB
Douglas Green Centre 724 16th Street, Randjiespark 50,0 21 118 4 736 – 41,39 A
Engineering Close 12 Engineering Close, Kya Sand
100,0 19 350 4 733 – 48,95 AB
Gosforth Industrial Park – vacant land
Van Riebeck Street, Gosforth Park
10,0 11 549 – 30 347 – –
Strijdompark Gardens 378 Arbeid Avenue, Strijdompark
100,0 8 380 2 886 – 29,66 B
Kyalami Storage Units 1 River Road, Barbeque Downs, Kyalami
50,0 7 000 1 955 – 51,16 BC
Gremick House 23 Thora Crescent, Wynberg 100,0 6 450 2 400 – 35,83 A
Grand Prix Business Park
1 Forssman Close, Barbeque Downs, Kyalami
50,0 4 985 1 736 – 24,54 AB
Hughes Industrial Park 122 Madeley Road, Jet Park 20,0 3 840 1 170 2 806 55,62 AB
Micro Park 676 Gallagher Avenue, Halfway House, Midrand
50,0 3 618 1 500 – 42,67 BC
Halfway House – vacant land
Richards Drive, Midrand 100,0 3 592 – 4 900 – –
Patterson Candy Park 26 Kya Sand Road, Kya Sand 100,0 2 900 1 704 – 23,47 B
Stock and Property 36 James Crescent, Halfway House, Midrand
50,0 2 456 893 – 51,29 BC
150 988 40 005 38 053 – – 4 491
RESIDENTIALCountry Life Park 59 Witney Street, Bryanston 50,0 26 668 3 302 – 58,63 C
Tilbury 24 North Road, Illovo 45,0 25 531 4 152 – 62,64 C
Mnandi Road 1, Allensnek 45,0 24 296 3 963 – 60,34 C
Westminster Close Westminster Road, Bryanston 45,0 20 334 2 722 – 86,92 C
Stratford Waterloo Road, Bryanston 45,0 10 021 1 913 – 59,55 C
Millgate – vacant land# Holdings 9,10,11, Millgate 83,0 3 179 – – – C
110 029 16 052 – – –
GROUP PROPERTY PORTFOLIO
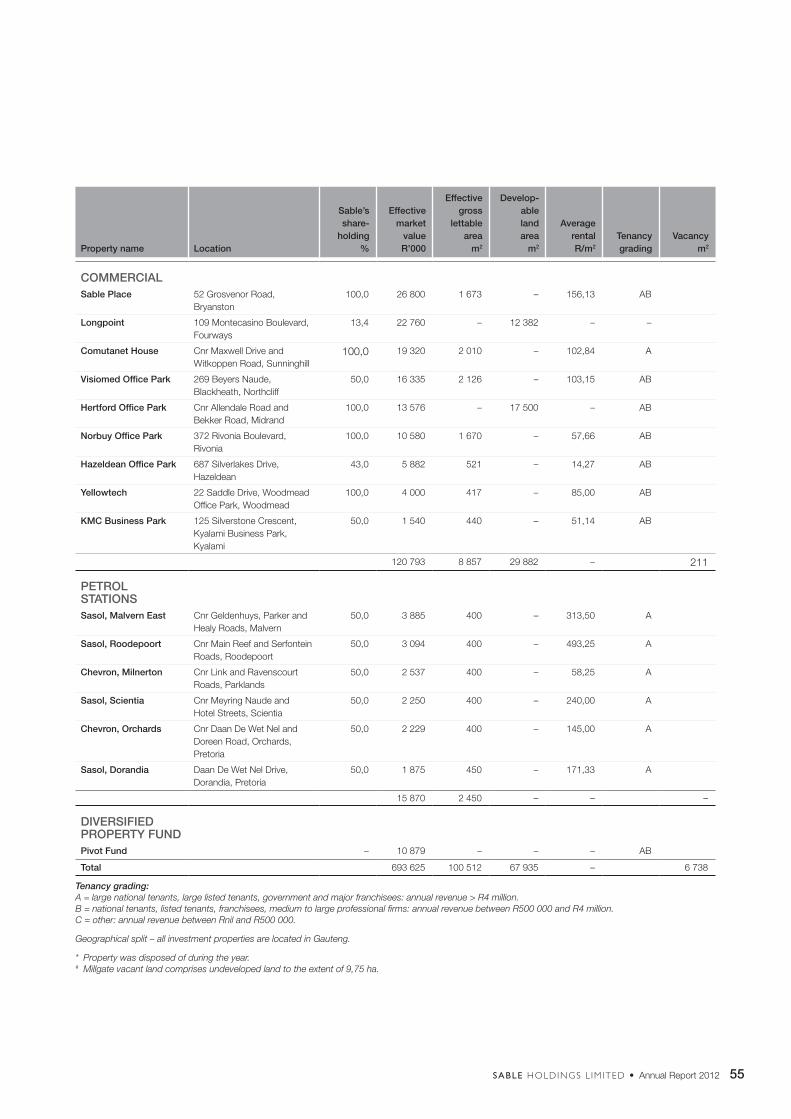
55SABLE HOLDINGS L IM ITED • Annual Report 2012
Property name Location
Sable’sshare-
holding%
Effectivemarket
valueR’000
Effectivegross
lettablearea
m2
Develop-ableland area
m2
AveragerentalR/m2
Tenancygrading
Vacancym2
COMMERCIALSable Place 52 Grosvenor Road,
Bryanston 100,0 26 800 1 673 – 156,13 AB
Longpoint 109 Montecasino Boulevard, Fourways
13,4 22 760 – 12 382 – –
Comutanet House Cnr Maxwell Drive and Witkoppen Road, Sunninghill
100,0 19 320 2 010 – 102,84 A
Visiomed Office Park 269 Beyers Naude, Blackheath, Northcliff
50,0 16 335 2 126 – 103,15 AB
Hertford Office Park Cnr Allendale Road and Bekker Road, Midrand
100,0 13 576 – 17 500 – AB
Norbuy Office Park 372 Rivonia Boulevard, Rivonia
100,0 10 580 1 670 – 57,66 AB
Hazeldean Office Park 687 Silverlakes Drive, Hazeldean
43,0 5 882 521 – 14,27 AB
Yellowtech 22 Saddle Drive, Woodmead Office Park, Woodmead
100,0 4 000 417 – 85,00 AB
KMC Business Park 125 Silverstone Crescent, Kyalami Business Park, Kyalami
50,0 1 540 440 – 51,14 AB
120 793 8 857 29 882 – 211
PETROL STATIONSSasol, Malvern East Cnr Geldenhuys, Parker and
Healy Roads, Malvern 50,0 3 885 400 – 313,50 A
Sasol, Roodepoort Cnr Main Reef and Serfontein Roads, Roodepoort
50,0 3 094 400 – 493,25 A
Chevron, Milnerton Cnr Link and Ravenscourt Roads, Parklands
50,0 2 537 400 – 58,25 A
Sasol, Scientia Cnr Meyring Naude and Hotel Streets, Scientia
50,0 2 250 400 – 240,00 A
Chevron, Orchards Cnr Daan De Wet Nel and Doreen Road, Orchards, Pretoria
50,0 2 229 400 – 145,00 A
Sasol, Dorandia Daan De Wet Nel Drive, Dorandia, Pretoria
50,0 1 875 450 – 171,33 A
15 870 2 450 – – –
DIVERSIFIED PROPERTY FUNDPivot Fund – 10 879 – – – AB
Total 693 625 100 512 67 935 – 6 738
Tenancy grading:A = large national tenants, large listed tenants, government and major franchisees: annual revenue > R4 million.B = national tenants, listed tenants, franchisees, medium to large professional firms: annual revenue between R500 000 and R4 million.C = other: annual revenue between Rnil and R500 000.
Geographical split – all investment properties are located in Gauteng.
* Property was disposed of during the year.# Millgate vacant land comprises undeveloped land to the extent of 9,75 ha.
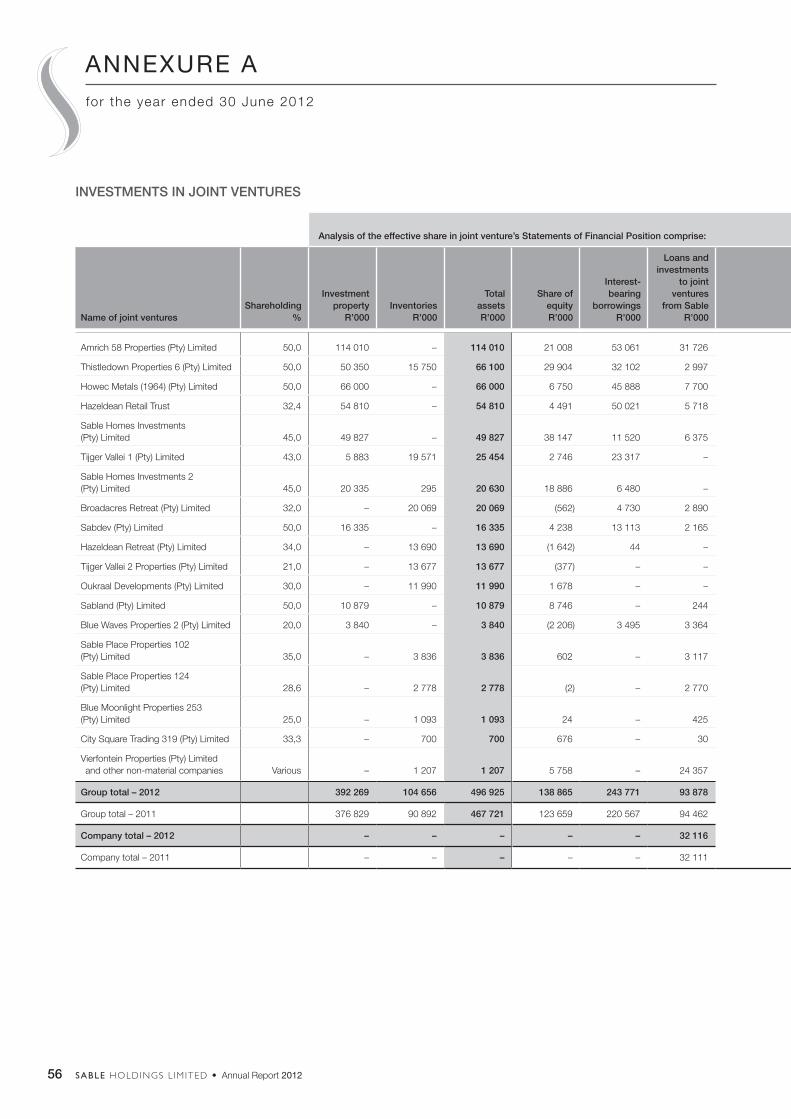
56 SABLE HOLDINGS L IM ITED • Annual Report 2012
INVESTMENTS IN JOINT VENTURES
Analysis of the effective share in joint venture’s Statements of Financial Position comprise:Analysis of the effective share in joint venture’s
revenue and net profit/(loss) comprise: Analysis of investment in joint ventures comprise:
Name of joint venturesShareholding
%
Investment property
R’000Inventories
R’000
Total assetsR’000
Share of equityR’000
Interest-bearing
borrowingsR’000
Loans and investments
to joint ventures
from Sable R’000
Net trade and other
(receivables)/ payables
R’000
Total equity and
liabilitiesR’000
Property revenue
R’000
Inventories revenue
R’000
Net profit/(loss)
for the year
R’000
Share of equity
R’000
Loans from
SableR’000
Investment from
SableR’000
Total investment
R’000
Amrich 58 Properties (Pty) Limited 50,0 114 010 – 114 010 21 008 53 061 31 726 8 215 114 010 16 701 – 10 158 21 008 31 726 – 52 734
Thistledown Properties 6 (Pty) Limited 50,0 50 350 15 750 66 100 29 904 32 102 2 997 1 097 66 100 5 974 – 1 567 29 904 2 997 – 32 901
Howec Metals (1964) (Pty) Limited 50,0 66 000 – 66 000 6 750 45 888 7 700 5 662 66 000 7 942 – 6 570 6 750 7 700 – 14 450
Hazeldean Retail Trust 32,4 54 810 – 54 810 4 491 50 021 5 718 (5 420) 54 810 5 591 – (481) 4 491 5 718 – 10 209
Sable Homes Investments (Pty) Limited 45,0 49 827 – 49 827 38 147 11 520 6 375 (6 215) 49 827 4 992 – 946 38 147 6 375 – 44 522
Tijger Vallei 1 (Pty) Limited 43,0 5 883 19 571 25 454 2 746 23 317 – (609) 25 454 162 – (909) 2 746 – – 2 746
Sable Homes Investments 2 (Pty) Limited 45,0 20 335 295 20 630 18 886 6 480 – (4 736) 20 630 2 151 456 239 18 886 – – 18 886
Broadacres Retreat (Pty) Limited 32,0 – 20 069 20 069 (562) 4 730 2 890 13 011 20 069 495 – (130) (562) 2 890 – 2 328
Sabdev (Pty) Limited 50,0 16 335 – 16 335 4 238 13 113 2 165 (3 181) 16 335 2 192 – 3 954 4 238 2 165 – 6 403
Hazeldean Retreat (Pty) Limited 34,0 – 13 690 13 690 (1 642) 44 – 15 288 13 690 70 1 380 (639) (1 642) – – (1 642)
Tijger Vallei 2 Properties (Pty) Limited 21,0 – 13 677 13 677 (377) – – 14 054 13 677 – 1 644 (273) (377) – – (377)
Oukraal Developments (Pty) Limited 30,0 – 11 990 11 990 1 678 – – 10 312 11 990 300 1 201 120 1 678 – – 1 678
Sabland (Pty) Limited 50,0 10 879 – 10 879 8 746 – 244 1 889 10 879 – – (242) 8 746 244 – 8 990
Blue Waves Properties 2 (Pty) Limited 20,0 3 840 – 3 840 (2 206) 3 495 3 364 (813) 3 840 652 – (790) (2 206) 3 364 – 1 158
Sable Place Properties 102 (Pty) Limited 35,0 – 3 836 3 836 602 – 3 117 117 3 836 – 8 (94) 602 3 117 – 3 719
Sable Place Properties 124 (Pty) Limited 28,6 – 2 778 2 778 (2) – 2 770 10 2 778 – – (2) (2) 2 765 5 2 768
Blue Moonlight Properties 253 (Pty) Limited 25,0 – 1 093 1 093 24 – 425 644 1 093 – – (15) 24 85 340 449
City Square Trading 319 (Pty) Limited 33,3 – 700 700 676 – 30 (6) 700 – – (29) 676 30 – 706
Vierfontein Properties (Pty) Limited and other non-material companies Various – 1 207 1 207 5 758 – 24 357 (28 908) 1 207 951 12 634 (3 198) 5 758 24 313 44 30 115
Group total – 2012 392 269 104 656 496 925 138 865 243 771 93 878 20 411 496 925 48 173 17 323 16 752 138 865 93 489 389 232 743
Group total – 2011 376 829 90 892 467 721 123 659 220 567 94 462 29 033 467 721 42 057 14 424 16 422 123 659 94 080 383 218 122
Company total – 2012 – – – – – 32 116 – 32 116 – – – – 31 728 389 32 116
Company total – 2011 – – – – – 32 111 – 32 111 – – – – 31 728 383 32 111
ANNEXURE Afor the year ended 30 June 2012
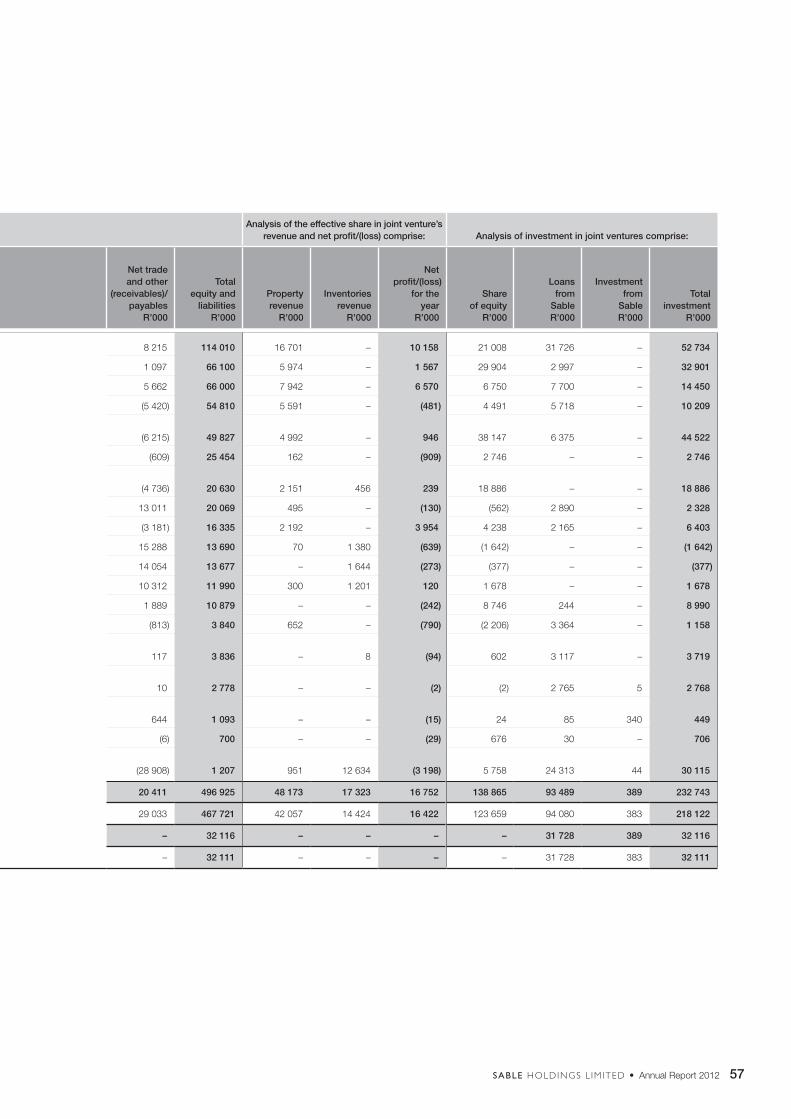
57SABLE HOLDINGS L IM ITED • Annual Report 2012
INVESTMENTS IN JOINT VENTURES
Analysis of the effective share in joint venture’s Statements of Financial Position comprise:Analysis of the effective share in joint venture’s
revenue and net profit/(loss) comprise: Analysis of investment in joint ventures comprise:
Name of joint venturesShareholding
%
Investment property
R’000Inventories
R’000
Total assetsR’000
Share of equityR’000
Interest-bearing
borrowingsR’000
Loans and investments
to joint ventures
from Sable R’000
Net trade and other
(receivables)/ payables
R’000
Total equity and
liabilitiesR’000
Property revenue
R’000
Inventories revenue
R’000
Net profit/(loss)
for the year
R’000
Share of equity
R’000
Loans from
SableR’000
Investment from
SableR’000
Total investment
R’000
Amrich 58 Properties (Pty) Limited 50,0 114 010 – 114 010 21 008 53 061 31 726 8 215 114 010 16 701 – 10 158 21 008 31 726 – 52 734
Thistledown Properties 6 (Pty) Limited 50,0 50 350 15 750 66 100 29 904 32 102 2 997 1 097 66 100 5 974 – 1 567 29 904 2 997 – 32 901
Howec Metals (1964) (Pty) Limited 50,0 66 000 – 66 000 6 750 45 888 7 700 5 662 66 000 7 942 – 6 570 6 750 7 700 – 14 450
Hazeldean Retail Trust 32,4 54 810 – 54 810 4 491 50 021 5 718 (5 420) 54 810 5 591 – (481) 4 491 5 718 – 10 209
Sable Homes Investments (Pty) Limited 45,0 49 827 – 49 827 38 147 11 520 6 375 (6 215) 49 827 4 992 – 946 38 147 6 375 – 44 522
Tijger Vallei 1 (Pty) Limited 43,0 5 883 19 571 25 454 2 746 23 317 – (609) 25 454 162 – (909) 2 746 – – 2 746
Sable Homes Investments 2 (Pty) Limited 45,0 20 335 295 20 630 18 886 6 480 – (4 736) 20 630 2 151 456 239 18 886 – – 18 886
Broadacres Retreat (Pty) Limited 32,0 – 20 069 20 069 (562) 4 730 2 890 13 011 20 069 495 – (130) (562) 2 890 – 2 328
Sabdev (Pty) Limited 50,0 16 335 – 16 335 4 238 13 113 2 165 (3 181) 16 335 2 192 – 3 954 4 238 2 165 – 6 403
Hazeldean Retreat (Pty) Limited 34,0 – 13 690 13 690 (1 642) 44 – 15 288 13 690 70 1 380 (639) (1 642) – – (1 642)
Tijger Vallei 2 Properties (Pty) Limited 21,0 – 13 677 13 677 (377) – – 14 054 13 677 – 1 644 (273) (377) – – (377)
Oukraal Developments (Pty) Limited 30,0 – 11 990 11 990 1 678 – – 10 312 11 990 300 1 201 120 1 678 – – 1 678
Sabland (Pty) Limited 50,0 10 879 – 10 879 8 746 – 244 1 889 10 879 – – (242) 8 746 244 – 8 990
Blue Waves Properties 2 (Pty) Limited 20,0 3 840 – 3 840 (2 206) 3 495 3 364 (813) 3 840 652 – (790) (2 206) 3 364 – 1 158
Sable Place Properties 102 (Pty) Limited 35,0 – 3 836 3 836 602 – 3 117 117 3 836 – 8 (94) 602 3 117 – 3 719
Sable Place Properties 124 (Pty) Limited 28,6 – 2 778 2 778 (2) – 2 770 10 2 778 – – (2) (2) 2 765 5 2 768
Blue Moonlight Properties 253 (Pty) Limited 25,0 – 1 093 1 093 24 – 425 644 1 093 – – (15) 24 85 340 449
City Square Trading 319 (Pty) Limited 33,3 – 700 700 676 – 30 (6) 700 – – (29) 676 30 – 706
Vierfontein Properties (Pty) Limited and other non-material companies Various – 1 207 1 207 5 758 – 24 357 (28 908) 1 207 951 12 634 (3 198) 5 758 24 313 44 30 115
Group total – 2012 392 269 104 656 496 925 138 865 243 771 93 878 20 411 496 925 48 173 17 323 16 752 138 865 93 489 389 232 743
Group total – 2011 376 829 90 892 467 721 123 659 220 567 94 462 29 033 467 721 42 057 14 424 16 422 123 659 94 080 383 218 122
Company total – 2012 – – – – – 32 116 – 32 116 – – – – 31 728 389 32 116
Company total – 2011 – – – – – 32 111 – 32 111 – – – – 31 728 383 32 111
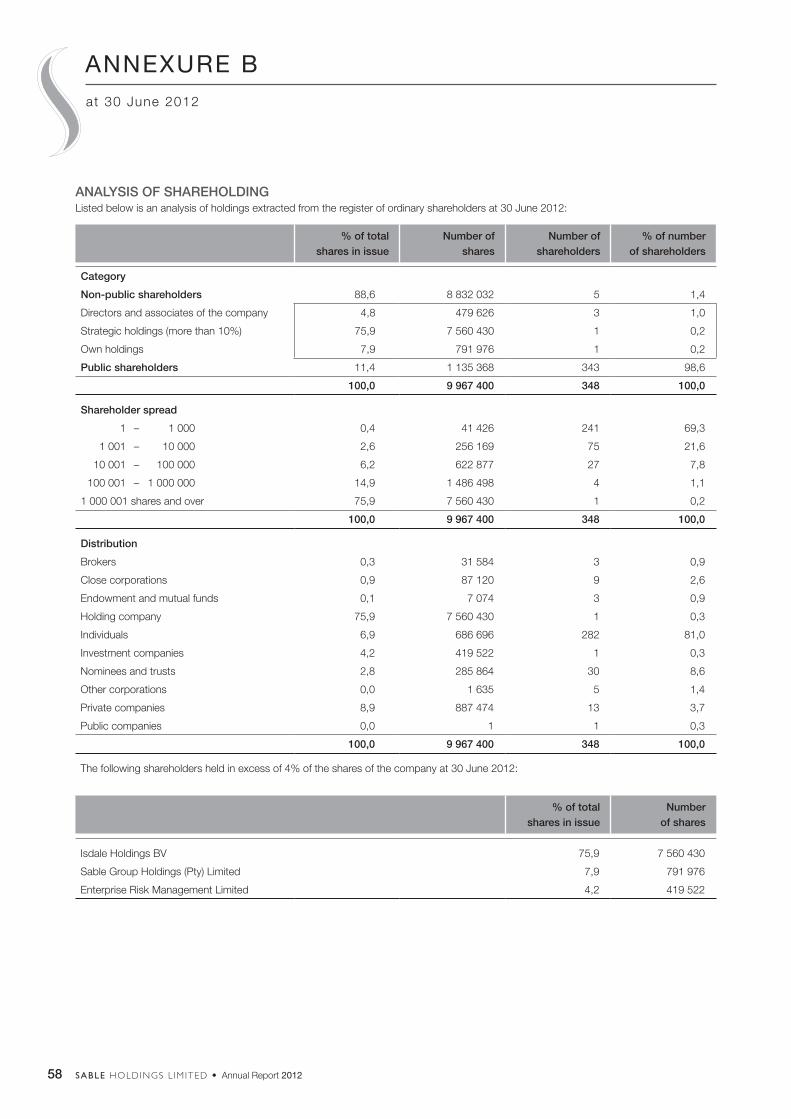
58 SABLE HOLDINGS L IM ITED • Annual Report 2012
at 30 June 2012
ANNEXURE B
ANALYSIS OF SHAREHOLDINGListed below is an analysis of holdings extracted from the register of ordinary shareholders at 30 June 2012:
% of total shares in issue
Number of shares
Number of shareholders
% of number of shareholders
Category
Non-public shareholders 88,6 8 832 032 5 1,4
Directors and associates of the company 4,8 479 626 3 1,0
Strategic holdings (more than 10%) 75,9 7 560 430 1 0,2
Own holdings 7,9 791 976 1 0,2
Public shareholders 11,4 1 135 368 343 98,6
100,0 9 967 400 348 100,0
Shareholder spread
1 – 1 000 0,4 41 426 241 69,3
1 001 – 10 000 2,6 256 169 75 21,6
10 001 – 100 000 6,2 622 877 27 7,8
100 001 – 1 000 000 14,9 1 486 498 4 1,1
1 000 001 shares and over 75,9 7 560 430 1 0,2
100,0 9 967 400 348 100,0
Distribution
Brokers 0,3 31 584 3 0,9
Close corporations 0,9 87 120 9 2,6
Endowment and mutual funds 0,1 7 074 3 0,9
Holding company 75,9 7 560 430 1 0,3
Individuals 6,9 686 696 282 81,0
Investment companies 4,2 419 522 1 0,3
Nominees and trusts 2,8 285 864 30 8,6
Other corporations 0,0 1 635 5 1,4
Private companies 8,9 887 474 13 3,7
Public companies 0,0 1 1 0,3
100,0 9 967 400 348 100,0
The following shareholders held in excess of 4% of the shares of the company at 30 June 2012:
% of total shares in issue
Number of shares
Isdale Holdings BV 75,9 7 560 430
Sable Group Holdings (Pty) Limited 7,9 791 976
Enterprise Risk Management Limited 4,2 419 522
59SABLE HOLDINGS L IM ITED • Annual Report 2012
NOTICE OF ANNUAL GENERAL MEETING
SABLE HOLDINGS LIMITED(Incorporated in the Republic of South Africa)(Registration number: 1968/010636/06)Share code: SBL | ISIN: ZAE000006383(“Sable” or “the company”)
Notice is hereby given that the annual general meeting of shareholders of the company will be held in the boardroom at the offices of the company, Sable Place, Fairway Office Park, 52 Grosvenor Road, Bryanston at 14:00, Friday, 25 January 2013 (the “annual general meeting”), for the purpose of transacting the following business, with or without amendment:
1. To consider, receive and adopt the annual financial statements of the company and the group for the year ended 30 June 2012, together with the reports of the directors, the audit committee and the auditors thereon;
2. To transact such other business as may be transacted at an annual general meeting of a company including the re-appointment of the auditors and re-election of retiring directors; and
3. To consider and, if deemed fit, to pass, with or without modification, the special and ordinary resolutions set out herein.
Important dates to note:Record date for receipt of notice purposes Friday, 7 December 2012 Last day to trade in order to be eligible to vote Friday, 11 January 2013Record date for voting purposes (voting record date) Friday, 18 January 2013Last day to lodge forms of proxy by 14:00 on Wednesday, 23 January 2013
In terms of section 62(3)(e) of the Companies Act, 71 of 2008 (the “Companies Act” or the “Act”):• A shareholder who is entitled to attend and vote at the annual
general meeting is entitled to appoint a proxy or two or more proxies to attend and participate in and vote at the annual general meeting in the place of the shareholder, by completing the form of proxy in accordance with the instructions set out therein;
• A proxy need not be a shareholder of the company;• Sable shareholders recorded in the register of the company on
the voting record date (including proxies) are required to provide reasonably satisfactory identification before being entitled to attend or participate in the annual general meeting: in this regard, all Sable shareholders recorded in the register of the company on the voting record date will be required to provide identification satisfactory to the chairman of the annual general meeting. Forms of identification include valid identity documents, driver’s licences and passports.
ORDINARY RESOLUTION 1Adoption of annual financial statements“Resolved that the annual financial statements of the company for the year ended 30 June 2012, including the directors’ report and the report of the audit committee, be and are hereby received and adopted.”
The minimum percentage of voting rights that is required for this resolution to be adopted is 50% of the voting rights plus one vote to be cast on the resolution.
ORDINARY RESOLUTION NUMBER 2Re-appointment of auditors“Resolved that Mazars be and are hereby appointed as independent auditors of the company, the designated auditor being S Vorster, from the conclusion of this annual general meeting until the conclusion of the next annual general meeting.”
The audit committee has nominated Mazars for appointment as auditors of the company, under section 90 of the Companies Act.
The minimum percentage of voting rights that is required for this resolution to be adopted is 50% of the voting rights plus one vote to be cast on the resolution.
ORDINARY RESOLUTION NUMBER 3Ordinary resolution number 3(a)Re-election of GBJ Bowes as director “Resolved that GBJ Bowes, who retires by rotation in terms of the company’s Memorandum of Incorporation (“MoI”) and who is eligible for re-election, be and is hereby re-elected as a director of the company.”
Ordinary resolution number 3(b)Re-election of KA Haswell as director“Resolved that KA Haswell, who retires by rotation in terms of the Company’s MoI and who is eligible for re-election, be and is hereby re-elected as a director of the company.”
Ordinary resolution number 3(c)Re-election of PH Nash as director“Resolved that PH Nash, who retires by rotation in terms of the company’s MoI and who is eligible for re-election, be and is hereby re-elected as a director of the company.”
Ordinary resolution number 3(d)Re-election of IA Chambers as director“Resolved that IA Chambers, who retires by rotation in terms of the company’s MoI and who is eligible for re-election, be and is hereby re-elected as a director of the company.”
60 SABLE HOLDINGS L IM ITED • Annual Report 2012
ORDINARY RESOLUTION NUMBER 5General authority to issue shares for cash“Resolved that, subject to the restrictions set out below and subject to the provisions of the Companies Act and the Listings Requirements of the JSE Limited (the “Listings Requirements”), the directors of the company be and are hereby authorised until this authority lapses at the next annual general meeting of the company, provided that this authority shall not extend beyond 15 months, to allot and issue shares of the company for cash on the following conditions:
1. The allotment and issue of the shares must be made to public shareholders as defined in the Listings Requirements and not to “related parties”;
2. The shares which are the subject of the issue for cash must be of a class already in issue, or where this is not the case, must be limited to such shares or rights that are convertible into a class already in issue;
3. Shares which are the subject of general issues for cash: • in aggregate in any one financial year may not exceed 15%
of the company’s shares in issue of that class (for purposes of determining the shares comprising the 15% number in any one year, account must be taken of the dilution effect in the year of issue of options or convertible securities, by including the number of any equity securities which may be issued in future arising out of the issue of such options/convertible securities);
• of a particular class will be aggregated with any securities that are compulsorily convertible into securities of that class and, in the case of the issue of compulsorily convertible securities, by including the number of equity securities which may be issued in future arising out of the issue of such options/convertible securities;
• as regards the number of shares which may be issued (the 15% number), same shall be based on the number of shares of that class in issue added to those that may be issued in future (arising from the conversion of options/convertible securities), at the date of such application:
– less any shares of the class issued, or to be issued in future arising from options/convertible securities issued, during the current financial year (which commenced 1 July 2012);
– plus any shares of that class to be issued pursuant to: – a rights issue which has been announced, is irrevocable
and is fully underwritten; or – an acquisition (in respect of which final terms have been
announced) which acquisition issue securities may be included as though they were securities in issue at the date of application;
4. The maximum discount at which ordinary shares may be issued is 10% of the weighted average traded price of those shares over the 30 business days prior to the date that the price of the issue is agreed between the company and the party subscribing for the securities or any other price agreed to by the JSE; and
Ordinary resolution number 3(e)Re-election of JN Snell as director“Resolved that JN Snell, who retires by rotation in terms of the company’s MoI and who is eligible for re-election, be and is hereby re-elected as a director of the company.”
Ordinary resolution number 3(f)Re-election of CC Froneman as director“Resolved that CC Froneman, who retires by rotation in terms of the company’s MoI and who is eligible for re-election, be and is hereby re-elected as a director of the company.”
In order for each of ordinary numbers 3(a) to 3(f) to be adopted, the minimum percentage of voting rights that is required for each of these resolutions to be adopted is 50% of the voting rights plus one vote to be cast on the resolution.
A brief CV of each director is available on page 3 of this annual report.
ORDINARY RESOLUTION NUMBER 4Re-appointment of the members of the audit committee “Resolved that the following independent non-executive directors, being eligible, be and are hereby appointed or re-appointed, as the case may be, by separate vote, as members of the audit committee, in terms of section 94(2) of the Companies Act, upon the recommendation by the board of directors, with effect from the end of this annual general meeting until the next annual general meeting of the company.”
Ordinary resolution number 4(a)Re-election of IA Chambers as chairperson of the audit committee“Resolved that IA Chambers, who retires by rotation and is eligible for re-election, be and is hereby re-elected as a chairperson of the audit committee.”
Ordinary resolution number 4(b)Re-election of JN Snell as a member of the audit committee“Resolved that JN Snell, who retires by rotation and is eligible for re-election, be and is hereby re-elected as audit committee member.”
Ordinary resolution number 4(c)Re-election of CC Froneman as a member of the audit committee“Resolved that CC Froneman, who retires by rotation and is eligible for re-election, be and is hereby re-elected as audit committee member.”
In order for each of ordinary resolutions 4(a) to 4(c) to be adopted, the minimum percentage of voting rights that is required to be adopted is 50% of the voting rights plus one vote to be cast on the resolution.”
A brief CV of each director is available on page 3 of this annual report.
NOTICE OF ANNUAL GENERAL MEETINGCONTINUED
61SABLE HOLDINGS L IM ITED • Annual Report 2012
subsidiary) of the company’s issued share capital as at the date of passing of this general resolution;
4. Repurchases of shares may not be made at a price greater than 10% above the weighted average of the market value of the securities for the five business days immediately preceding the date on which the transaction was effected;
5. Repurchases may not be undertaken by the company or any of its wholly-owned subsidiaries during a prohibited period (as defined in paragraph 3.67 of the Listings Requirements), unless a repurchase programme is in place where the dates and quantities of securities to be traded during the relevant period are fixed and full details of the programme have been disclosed in an announcement over SENS prior to the commencement of the prohibited period;
6. After the company has acquired shares which constitute, on a cumulative basis, 3% of the initial number of shares in issue (at the time that authority from shareholders for the repurchase is granted) of the relevant class of securities and for each 3% in aggregate of the initial number of that class acquired thereafter, the company shall publish an announcement containing full details of such repurchase;
7. The company (or any subsidiary) is duly authorised by its MoI to do so;
8. This general authority shall be valid until the company’s next annual general meeting, provided that it shall not extend beyond 15 months from the date of passing this special resolution; and
9. The board of directors of the company must resolve that the repurchase is authorised, the company and its subsidiaries have passed a resolution authorising the repurchase and that the company has passed the solvency and liquidity test contained in section 4 of the Companies Act, and that since the test was done, there have been no material changes to the financial position of the group.”
The effect of the general resolution and the reason therefor is to extend the general authority given to the directors of the company or any subsidiary of the company in terms of the Companies Act and the Listings Requirements for the acquisition by the company or its subsidiaries of the company’s securities which authority shall be used at the directors’ discretion during the course of the period authorised.
In accordance with the Listings Requirements, the directors record that although there is no immediate intention to effect a repurchase of shares of the company, the directors will utilise the renewed general authority to repurchase securities to serve shareholders’ interests, as and when suitable opportunities present themselves, which opportunities may require expeditious and immediate action.
The directors undertake that, after considering the maximum number of securities which may be repurchased and the price at which the repurchases may take place pursuant to the buy-back general authority, for a period of 12 months after the date of the general repurchase:
5. After the company has issued shares for cash which represent, on a cumulative basis within a financial year, 5% or more of the number of shares in issue prior to that issue, the company shall publish an announcement containing full details of the issue, including:
• the number of shares issued; • the average discount to the weighted average traded price
of the shares over the 30 business days prior to the date that the price of the issue is agreed in writing between the issuer and the party subscribing for the shares; and
• the effect of the issue on net asset value, net tangible asset value, earnings and headline earnings per share.”
In terms of the Listings Requirements, a 75% majority of the votes cast by shareholders present or represented by proxy at the annual general meeting must be obtained.
Ordinary resolution number 6 Unissued ordinary shares“Resolved that the authorised but unissued share capital of the company be and is hereby placed under the control of the directors of the company until the next annual general meeting, with the authority to allot and issue all or part thereof in their discretion, subject to the Companies Act and the Listings Requirements.”
The minimum percentage of voting rights that is required for this resolution to be adopted is 50% of the voting rights plus one vote to be cast on the resolution.
Ordinary resolution number 7Remuneration philosophy“Resolved that the remuneration philosophy of the company as set out on page 16 of this annual report, be and is hereby approved by way of a non-binding advisory vote.”
The minimum percentage of voting rights that is required for this resolution to be adopted is 50% of the voting rights plus one vote to be cast on the resolution.
SPECIAL RESOLUTION NUMBER 1General authority to repurchase shares “Resolved that the company or any of its subsidiaries be and are hereby authorised by way of a general approval to acquire ordinary shares issued by the company, in terms of sections 46 and 48 of the Companies Act, and in terms of the Listings Requirements, being that:
1. Any repurchase of securities must be effected through the order book operated by the JSE trading system and done without any prior understanding or arrangement between the company and the counter party;
2. At any point in time, the company may only appoint one agent to effect any repurchases on its behalf;
3. The number of shares which may be repurchased pursuant to this authority in any financial year may not in the aggregate exceed 20% (or 10% where the acquisitions are effected by a
62 SABLE HOLDINGS L IM ITED • Annual Report 2012
NOTICE OF ANNUAL GENERAL MEETINGCONTINUED
2(a) “Resolved that, in terms of section 66(9) of the Companies Act, the fees payable to non-executive directors for their services as directors (in terms of section 66 of the Companies Act) for the year ending 30 June 2013 be and are hereby approved for a period of two years from the passing of this resolution as listed below:
Fees 30 June 2013
Chairman of audit committee R50 000
Member of audit committee R500/hour
Chairman of board R500 000
Member of board R500/hour
2(b) Resolved that an annual increase not exceeding 10% of the fees payable by the company to the non-executive directors for their services as directors be and is hereby approved for a period of two years from the passing of this resolution or until its renewal, whichever is the earliest.”
The reason for special resolution number 2 is to obtain shareholder approval by special resolution for directors’ remuneration for services as directors in compliance with the Companies Act.
The minimum percentage of voting rights that is required for each of special resolution numbers 2(a) and 2(b) to be adopted is at least 75% of the voting rights exercised on the resolution.
SPECIAL RESOLUTION NUMBER 3Approval of the granting of financial assistance “Resolved that to the extent required by the Companies Act, the board of directors of the company may, subject to compliance with the requirements of the company’s MoI, the Companies Act and the Listings Requirements, each as presently constituted and as amended from time to time, authorise the company to provide direct or indirect financial assistance, as contemplated in section 45 of the Companies Act by way of loans, guarantees, the provision of security or otherwise, to any of its present or future subsidiaries and/or any other company or corporation that is or becomes related or inter-related (as defined in the Companies Act) to the company for any purpose or in connection with any matter, such authority to endure until the next annual general meeting provided that such authority shall not extend beyond two years.”
Reason and effectThe reason for and effect of this special resolution is to allow Sable to grant direct or indirect financial assistance to any company or corporation forming part of its group, including in the form of loans or the guaranteeing of their debts. This authority will be in place for a period of two years from the date of adoption of this special resolution number 3.
The minimum percentage of voting rights that is required for this resolution to be adopted is at least 75% exercised on the resolution.
Notice in terms of section 45(5) of the Companies Act in respect of special resolution number 3 Notice is hereby given to shareholders of the company in terms of section 45(5) of the Companies Act of a resolution adopted by the
• The company and the group will be able to pay their debts in the ordinary course of business;
• The consolidated assets of the company and of the group will be in excess of the liabilities of the company and the group; the assets and liabilities being recognised and measured in accordance with the accounting policies used in the latest audited group annual financial statements;
• The share capital and reserves of the company and of the group are adequate for ordinary purposes; and
• The working capital of the company and the group will be adequate for ordinary business.
The minimum percentage of voting rights that is required for this special resolution to be adopted is at least 75% of the voting rights exercised on the resolution.
The following additional information, some of which may appear elsewhere in the annual report of which this notice forms part, is provided in terms of paragraph 11.26 of the Listings Requirements for purposes of this general authority:• Directors and management page 3; • Major beneficial shareholders page 58;• Directors’ interests in shares pages 17, 58; and• Capital structure of the company page 39.
LITIGATION STATEMENTIn terms of section 11.26 of the Listings Requirements, the directors, whose names appear on page 3 of the annual report of which this notice forms part, other than disclosed or accounted for in this annual report, are not aware of any legal or arbitration proceedings including proceedings that are pending or threatened, that may have or have had in the recent past (being at least the previous 12 months) a material effect on Sable’s financial position.
DIRECTORS’ RESPONSIBILITY STATEMENTThe directors whose names appear on page 3 of the annual report of which this notice forms part, collectively and individually accept full responsibility for the accuracy of the information pertaining to this special resolution and certify that, to the best of their knowledge and belief, there are no facts that have been omitted which would make any statement false or misleading, and that all reasonable enquiries to ascertain such facts have been made by way of this special resolution to contain all information required by the Companies Act and the Listings Requirements.
MATERIAL CHANGESOther than the facts and developments reported on in the annual report of which this notice forms part, there have been no material changes in the affairs or financial position of the company and its subsidiaries since the date of signature of the audit report for the financial year ended 30 June 2012 and up to the date of this notice.
SPECIAL RESOLUTION NUMBER 2Approval of directors’ remunerationTo consider and if deemed fit, to pass with or without modification the following special resolutions by way of separate resolutions:
63SABLE HOLDINGS L IM ITED • Annual Report 2012
Johannesburg, 2001 (PO Box 61051, Marshalltown, 2107), for the purposes of being entitled to attend, participate in and vote at the annual general meeting, is Friday, 18 January 2013.
VOTING AND PROXIESA shareholder of the company entitled to attend, speak, and vote at the annual general meeting is entitled to appoint a proxy or proxies to attend, speak and on a poll vote in his stead. The proxy need not be a shareholder of the company. A form of proxy is attached for the convenience of any certificated shareholder and own name registered dematerialised shareholder who cannot attend the annual general meeting, but who wishes to be represented. Additional forms of proxy may also be obtained on request from the company’s registered office. The completed forms of proxy must be deposited at, posted or faxed to the transfer secretaries, Computershare Investor Services (Proprietary) Limited, 70 Marshall Street, Johannesburg 2001 (PO Box 61051, Marshalltown, 2107) to be received by no later than 14:00 on Wednesday, 23 January 2013.
Shareholders who have dematerialised their ordinary shares through a CSDP or broker, other than own name registered dematerialised shareholders, and who wish to attend the annual general meeting must request their CSDP or broker to issue them with a Letter of Representation. Alternatively dematerialised shareholders other than own name registered dematerialised shareholders, who wish to be represented, must provide their CSDP or broker with their voting instructions in terms of the custody agreement between them and their CSDP or broker in the manner and by the time-frame stipulated.
Any shareholder of the company may authorise any person to act as its representative at the annual general meeting.
Kindly also note that section 63(1) of the Companies Act, requires that persons wishing to participate in the annual general meeting (including the aforementioned representative) provide satisfactory identification before they may so participate.
Voting will be performed by way of a poll so that each shareholder present or represented by way of a poll will be entitled to vote the number of shares held or represented by them.
Holders of unlisted securities (if applicable) and shares held as treasury shares may not vote.
ELECTRONIC PARTICIPATIONShareholders or their proxies may participate in the annual general meeting by way of telephone conference call. Shareholders or their proxies who wish to participate in the annual general meeting by telephone conference call as aforesaid, will be required to advise the Company thereof by no later than 14:00 on Wednesday, 23 January 2013 by submitting, by email, to Kevin Haswell at [email protected], or by fax, to be faxed to +27 11 267 5710 marked for the attention of Kevin Haswell, relevant contact details including an email address, cellular number and landline, as well as full details of the shareholder’s title to shares issued by the company and proof of identity, in the form of copies of identity documents and share certificates (in the case of certificated shareholders), and (in the case of dematerialised
board authorising the company to provide such direct or indirect financial assistance as specified in the special resolution above:• By the time that this notice of annual general meeting is delivered
to shareholders of the company, the board will have adopted a resolution (“section 45 board resolution”) authorising the company to provide, at any time and from time to time during the period of 2 (two) years commencing on the date on which the special resolution is adopted, any direct or indirect financial assistance as contemplated in section 45 of the Companies Act to any 1 (one) or more related or inter-related companies or corporations of the company and/or to any 1 (one) or more members of any such related or inter-related company or corporation and/or to any 1 (one) or more persons related to any such company or corporation;
• The section 45 board resolution will be effective only if and to the extent that the special resolution under the heading “special resolution number 3” is adopted by the shareholders of the company, and the provision of any such direct or indirect financial assistance by the company, pursuant to such resolution, will always be subject to the board being satisfied that (i) immediately after providing such financial assistance, the company will satisfy the solvency and liquidity test as referred to in section 45(3)(b)(i) of the Companies Act, and that (ii) the terms under which such financial assistance is to be given are fair and reasonable to the company as referred to in section 45(3)(b)(ii) of the Companies Act; and
• In as much as the section 45 board resolution contemplates that such financial assistance will in the aggregate exceed one-tenth of one percent of the company’s net worth at the date of adoption of such resolution, the company hereby provides notice of the section 45 board resolution to shareholders of the company.
ORDINARY RESOLUTION NUMBER 8Signature of documentation “Resolved that any director of the company or the company secretary be and is hereby authorised to sign all such documentation and do all such things as may be necessary for or incidental to the implementation of ordinary resolution number’s 1, 2, 3, 4, 5, 6 and 7 and special resolution number’s 1, 2 and 3, which are passed by the shareholders with and subject to the terms thereof.”
The minimum percentage of voting rights that is required for this resolution to be adopted is 50% of the voting rights plus one vote to be cast on the resolution.
QUORUMA quorum for the purposes of considering the resolutions above shall consist of three shareholders of the company personally present (and if the shareholder is a body corporate, must be represented) and entitled to vote at the annual general meeting. In addition, a quorum shall comprise 25% of all voting rights entitled to be exercised by shareholders in respect of the resolutions above.
The date on which shareholders must be recorded as such in the register maintained by the transfer secretaries, Computershare Investor Services (Proprietary) Limited, 70 Marshall Street,
64 SABLE HOLDINGS L IM ITED • Annual Report 2012
NOTICE OF ANNUAL GENERAL MEETINGCONTINUED
shareholders) written confirmation from the shareholder’s CSDP confirming the shareholder’s title to the dematerialised shares.
Upon receipt of the required information, the shareholder concerned will be provided with a secure code and instructions to access the electronic communication during the annual general meeting. Shareholders must note that access to the electronic communication will be at the expense of the shareholders who wish to utilise the facility. Shareholders who wish to participate in the annual general meeting by electronic participation must further note that they will not be able to vote during the annual general meeting. Such shareholders, should they wish to have their vote counted at the annual general meeting, must, to the extent applicable:
(i) complete the form of proxy; or
(ii) contact their CSDP or stockbroker,
for both instances as set out above.
By order of the board
B GrahamWatermans North Registered AuditorsCompany Secretary
5 December 2012Sandton
65SABLE HOLDINGS L IM ITED • Annual Report 2012
FORM OF PROXY
SABLE HOLDINGS LIMITED(Incorporated in the Republic of South Africa)(Registration number: 1968/010636/06)Share code: SBL | ISIN: ZAE000006383(“Sable” or “the company”)
FORM OF PROXY FOR USE BY CERTIFICATED AND “OWN NAME” DEMATERIALISED ORDINARY SHAREHOLDERS ONLY AT AN ANNUAL GENERAL MEETING OF SHAREHOLDERS OF THE COMPANY TO BE HELD AT 14:00 ON FRIDAY, 25 JANUARY 2013 (THE “ANNUAL GENERAL MEETING”).
A certificated or “own name” dematerialised Sable ordinary shareholder entitled to attend and vote at the annual general meeting of shareholders of the company, convened to be held in the boardroom, Sable Place, Fairway Office Park, 52 Grosvenor Road, Bryanston at 14:00 on Friday, 25 January 2013, is entitled to appoint a proxy or proxies, to attend, speak and vote thereat in his/her stead. A proxy need not be a shareholder of the company. All forms of proxy must be lodged with the transfer secretaries, Computershare Investor Services (Proprietary) Limited, 70 Marshall Street, Johannesburg, 2001 (PO Box 61051, Marshalltown, 2107), by not later than 14:00 on Wednesday, 23 January 2013.
Dematerialised shareholders who wish to attend the annual general meeting or vote by way of proxy must contact their CSDP or broker who will provide them with the necessary Letter of Representation to vote or carry out their instructions. This must be effected in terms of the custody agreement entered into between the shareholder and the CSDP or broker concerned.
I/We (Name in full – block letters)
of (address)
being the holder(s) of: ordinary shares
in the company, hereby appoint: (see note 1)
1. or failing him/her
2. or failing him/her
3. the chairman of the annual general meeting as my/our proxy to act for me/us on my/our behalf at the annual general meeting of the company convened to be held at 14:00 on Friday, 25 January 2013, for the purpose of considering and, if deemed fit, passing, with or without modification, the ordinary and special resolutions to be proposed thereat and at each adjournment thereof and to vote for or against the said ordinary and special resolutions or to abstain from voting in respect of the shares in the issued capital of the company registered in my/our name(s), in accordance with the following instructions (see note 5):
For Against Abstain
Ordinary resolution number 1Adoption of annual financial statements
Ordinary resolution number 2Re-appointment of auditors
Ordinary resolution number 3(a)To re-elect GBJ Bowes as director
Ordinary resolution number 3(b)To re-elect KA Haswell as director
Ordinary resolution number 3(c)To re-elect PH Nash as director
Ordinary resolution number 3(d)To re-elect IA Chambers as director
66 SABLE HOLDINGS L IM ITED • Annual Report 2012
FORM OF PROXYCONTINUED
For Against Abstain
Ordinary resolution number 3(e)To re-elect JN Snell as director
Ordinary resolution number 3(f)To re-elect CC Froneman as director
Ordinary resolution number 4(a)To re-elect IA Chambers as chairman of the audit committee
Ordinary resolution number 4(b)To re-elect JN Snell as a member of the audit committee
Ordinary resolution number 4(c)To re-elect CC Froneman as a member of the audit committee
Ordinary resolution number 5To authorise the directors by way of general authority to issue shares in the company for cash
Ordinary resolution number 6To place the unissued ordinary shares under the control of the directors
Ordinary resolution number 7To approve the remuneration philosophy of the company
Special resolution number 1To authorise the company and/or any of its subsidiary companies to, by way of general authority, acquire shares issued by the company
Special resolution number 2(a)To approve the directors’ remuneration
Special resolution number 2(b)To approve the annual increase to directors’ remuneration
Special resolution number 3To approve the granting of financial assistance
Ordinary resolution number 8To approve signature of documentation
Insert an “X” in the relevant spaces above according to how you wish your votes to be cast. However, if you wish to cast your votes in respect of a lesser number of shares than you own in the company, insert the number of ordinary shares held in respect of which you desire to vote (see note 5).
Signed at on 2012/13
Signature
Assisted by me (where applicable)
Each shareholder is entitled to appoint one or more proxies (who need not be a shareholder of the company) to attend, speak and, on a poll, vote in place of that member at the annual general meeting.
Kindly read the notes on the reverse side of this form of proxy.
67SABLE HOLDINGS L IM ITED • Annual Report 2012
1. This form of proxy is only to be completed by those ordinary shareholders who are:
• holding ordinary shares in certificated form; or • recorded in the sub-register in electronic form in their own
name, on the date on which shareholders must be recorded as
such in the register maintained by the transfer secretaries, Computershare Investor Services (Proprietary) Limited, being Friday, 18 January 2013, and who wish to appoint another person to represent them at the annual general meeting.
2. Certificated shareholders wishing to attend the annual general meeting have to ensure beforehand with the transfer secretaries of the company (being Computershare Investor Services (Proprietary) Limited) that their shares are registered in their name.
3. Beneficial shareholders whose shares are not registered in their own name, but in the name of another, for example, a nominee, may not complete a proxy form, unless a form of proxy is issued to them by a registered shareholder and they should contact the registered shareholder for assistance in issuing instruction on voting their shares, or obtaining a proxy to attend, speak and, on a poll, vote at the annual general meeting.
4. A shareholder may insert the name of a proxy or the names of two alternative proxies of the shareholder’s choice in the space(s) provided, with or without deleting “the chairman of the annual general meeting”, but any such deletion must be initialled by the shareholder. The person whose name stands first on the form of proxy and who is present at the annual general meeting will be entitled to act as proxy to the exclusion of those whose names follow.
5. Please insert an “X” in the relevant spaces according to how you wish your votes to be cast. However, if you wish to cast your votes in respect of a lesser number of shares than you own in the company, insert the number of ordinary shares held in respect of which you desire to vote. Failure to comply with the above will be deemed to authorise the proxy to vote or to abstain from voting at the annual general meeting as he/she deems fit in respect of all the shareholders votes exercisable thereat. A shareholder or his/her proxy is not obliged to use all the votes exercisable by the shareholder or by his/her proxy, but the total of the votes cast and in respect whereof abstention is recorded may not exceed the total of the votes exercisable by the shareholder or by his/her proxy.
6. Forms of proxy must be lodged with or posted to the transfer secretaries, Computershare Investor Services (Proprietary) Limited, 70 Marshall Street, Johannesburg 2001 (PO Box 61051, Marshalltown, 2107), to be received by not later than 14:00 on Wednesday, 23 January 2013.
7. The completion and lodging of this form of proxy will not preclude the relevant shareholder from attending the annual general meeting and speaking and voting in person thereat to
the exclusion of any proxy appointed in terms hereof, should such shareholder wish to do so.
8. Documentary evidence establishing the authority of a person signing this form of proxy in a representative capacity must be attached to this form of proxy unless previously recorded by the company’s transfer secretaries or waived by the chairman of the annual general meeting.
9. Any alteration or correction made to this form of proxy must be initialled by the signatory/(ies).
10. A minor must be assisted by his/her parent or guardian unless the relevant documents establishing his/her legal capacity are produced or have been registered by the transfer secretaries of the company.
11. The chairman of the annual general meeting may accept any form of proxy which is completed other than in accordance with these notes, if the chairman of the annual general meeting is satisfied as to the manner in which the shareholder wishes to vote.
12. The date must be filled in on this form of proxy when it is signed.
13. The appointment of a proxy is revocable unless the proxy appointment expressly states otherwise. If the appointment of a proxy is revocable, a shareholder may revoke the proxy appointment by cancelling it in writing, or making a later inconsistent appointment of a proxy and delivering a copy of the revocation instrument to the proxy and to the company. The revocation will take effect on the later of (i) the date stated in the revocation instrument; or (ii) the date on which the revocation instrument was delivered to the proxy and the company.
14. A proxy may delegate his/her authority to act on your behalf to another person, subject to any restriction set out in this proxy form.
15. Where there are joint holders of shares: • any one holder may sign the form of proxy; and • the vote of the senior (for that purpose seniority will be
determined by the order in which the names of shareholders appear in the register of members) who tenders a vote (whether in person or by proxy) will be accepted to the exclusion of the vote(s) of the other joint holder(s) of shares.
16. If duly authorised, companies and other corporate bodies who are shareholders of the company having shares registered in their own name may, instead of completing this form of proxy, appoint a representative to represent them and exercise all of their rights at the annual general meeting by giving written notice of the appointment of that representative. This notice will not be effective at the annual general meeting unless it is accompanied by a duly certified copy of the resolution or other authority in terms of which that representative is appointed and is received at Computershare Investor Services
NOTES TO THE FORM OF PROXY
68 SABLE HOLDINGS L IM ITED • Annual Report 2012
(c) if the appointment is revocable, a shareholder may revoke the proxy appointment by:
(i) cancelling it in writing, or making a later inconsistent appointment of a proxy; and
(ii) delivering a copy of the revocation instrument to the proxy, and to the Company.
5. The revocation of a proxy appointment constitutes a complete and final cancellation of the proxy’s authority to act on behalf of the shareholder as of the later of:
(a) the date stated in the revocation instrument, if any; or (b) the date on which the revocation instrument was delivered
as required in subsection (4)(c)(ii).6. If the instrument appointing a proxy or proxies has been
delivered to a company, as long as that appointment remains in effect, any notice that is required by this Act or the Company’s Memorandum of Incorporation to be delivered by the Company to the shareholder must be delivered by the Company to:
(a) the shareholder; or (b) the proxy or proxies, if the shareholder has: (i) directed the Company to do so, in writing; and (ii) paid any reasonable fee charged by the Company for
doing so.7. A proxy is entitled to exercise, or abstain from exercising,
any voting right of the shareholder without direction, except to the extent that the Memorandum of Incorporation, or the instrument appointing the proxy, provides otherwise.
8. If a company issues an invitation to shareholders to appoint one or more persons named by the Company as a proxy, or supplies a form of instrument for appointing a proxy:
(a) the invitation must be sent to every shareholder who is entitled to notice of the meeting at which the proxy is intended to be exercised;
(b) the invitation, or form of instrument supplied by the Company for the purpose of appointing a proxy, must:
(i) bear a reasonably prominent summary of the rights established by this section;
(ii) contain adequate blank space, immediately preceding the name or names of any person or persons named in it, to enable a shareholder to write in the name and, if so desired, an alternative name of a proxy chosen by the shareholder; and
(iii) provide adequate space for the shareholder to indicate whether the appointed proxy is to vote in favour of or against any resolution or resolutions to be put at the meeting, or is to abstain from voting;
(c) the Company must not require that the proxy appointment be made irrevocable; and
(d) the proxy appointment remains valid only until the end of the meeting at which it was intended to be used, subject to subsection (5).
9. Subsection (8)(b) and (d) do not apply if the Company merely supplies a generally available standard form of proxy appointment on request by a shareholder.
(Proprietary) Limited, 70 Marshall Street, Johannesburg, 2001 or posted to PO Box 61051, Marshalltown, 2107, so as to be received by no later than 14:00 on Wednesday, 23 January 2013.
17. This form of proxy may be used at any adjournment or postponement of the annual general meeting, including any postponement due to a lack of quorum, unless withdrawn by the shareholder.
18. The aforegoing notes contain a summary of the relevant provisions of section 58 of the Companies Act, 2008 (the “Companies Act”), as required in terms of that section. In addition, an extract from the Companies Act reflecting the provisions of section 58 of the Companies Act, is set out below.
EXTRACT FROM THE COMPANIES ACT SECTION 58 – SHAREHOLDER RIGHT TO BE REPRESENTED BY PROXY1. At any time, a shareholder of a company may appoint any
individual, including an individual who is not a shareholder of that company, as a proxy to:
(a) participate in, and speak and vote at, a shareholders meeting on behalf of the shareholder; or
(b) give or withhold written consent on behalf of the shareholder to a decision contemplated in section 60.
2. A proxy appointment: (a) must be in writing, dated and signed by the shareholder;
and (b) remains valid for: (i) one year after the date on which it was signed; or (ii) any longer or shorter period expressly set out in the
appointment, unless it is revoked in a manner contemplated in subsection
(4)(c), or expires earlier as contemplated in subsection (8)(d).3. Except to the extent that the Memorandum of Incorporation of
a company provides otherwise: (a) a shareholder of that company may appoint two or more
persons concurrently as proxies, and may appoint more than one proxy to exercise voting rights attached to different securities held by the shareholder;
(b) a proxy may delegate the proxy’s authority to act on behalf of the shareholder to another person, subject to any restriction set out in the instrument appointing the proxy; and
(c) a copy of the instrument appointing a proxy must be delivered to the Company, or to any other person on behalf of the Company, before the proxy exercises any rights of the shareholder at a shareholders meeting.
4. Irrespective of the form of instrument used to appoint a proxy: (a) the appointment is suspended at any time and to the extent
that the shareholder chooses to act directly and in person in the exercise of any rights as a shareholder.
(b) the appointment is revocable unless the proxy appointment expressly states otherwise; and
NOTES TO THE FORM OF PROXYCONTINUED
SHAREHOLDERS’ DIARY
Interim period-end Monday, 31 December 2012
Annual general meeting Friday, 25 January 2013
Interim report Friday, 15 March 2013
Financial year-end Sunday, 30 June 2013
Preliminary audited results Monday, 30 September 2013
CORPORATE INFORMATION
SABLE HOLDINGS LIMITEDRegistration number: 1968/010636/06Share code: SBL ISIN: ZAE000006383Sector: Alt-X Board
REGISTERED OFFICESable PlaceFairway Office Park52 Grosvenor Road, BryanstonJohannesburg, 2021PO Box 786390, Sandton, 2146Fax: +27 011 267 5710Email: [email protected]
WEBSITEwww.sableholdings.co.za
COMPANY SECRETARYWatermans North Registered Auditors1st Floor, Building 7, Pinewood Office Park,33 Riley Road, Woodmead, Sandton, 2146PO Box 4349, Rivonia, 2194
ATTORNEYSEversheds International22 Fredman Drive, Sandton,Johannesburg, 2196 PO Box 78333, Sandton, 2146
AUDITORSMazars2nd Floor Mazars House5 St Davids Place, Parktown,Johannesburg, 2193 PO Box 6997, Johannesburg, 2000
DESIGNATED ADVISORJava Capital2 Arnold Road, Rosebank, 2196PO Box 2087, Parklands, 2121
TRANSFER SECRETARIESComputershare Investor Services (Pty) Limited70 Marshall Street, Johannesburg, 2001PO Box 61051, Marshalltown, 2107
PRINCIPAL BANKERSStandard Bank of South Africa Limited7th Floor, Building No. 3, Standard Bank Centre,5 Simmonds Street, Johannesburg, 2001PO Box 61029, Marshalltown, 2107
www.sableholdings.co.za