annual report and audited financial statements · butterfield asset management funds plc (an...
TRANSCRIPT

Butterfield Asset Management Funds plc
(an umbrella fund with segregated liability between sub-funds)
Annual Report and Audited Financial
Statements
For the year ended 31 January 2014

Butterfield Asset Management Funds plc
2
Table of contents Page Company information 3 Directors’ report 4 Investment Manager's report 6 Report of the Custodian to the shareholders 9 Independent Auditors’ report 10 Balance sheet 12 Profit and loss account 14 Statement of changes in net assets attributable to holders of redeemable participating shares 16 Notes to the financial statements 18 Schedule of investments 37 Statement of significant portfolio movements (unaudited) 44 Appendix 1: Underlying Collective investment schemes fees (unaudited) 49

Butterfield Asset Management Funds plc
3
Company information Directors of the Company
Peter Cleavely (British) John Hamrock (Irish resident) (Independent) Richard Saunders (British) Bronwyn Wright (Irish resident) (Independent) (All Directors are non-executive)
Registered Office
2nd Floor, 2 Grand Canal Square Grand Canal Harbour Dublin 2 Ireland
Investment Manager, Distributor and Promoter
Butterfield Bank (UK) Limited 99 Gresham Street London EC2V 7NG England
Manager Capita Financial Managers (Ireland) Limited 2nd Floor, 2 Grand Canal Square Grand Canal Harbour Dublin 2 Ireland
Custodian
BNY Mellon Trust Company (Ireland) Limited Guild House Guild Street, IFSC Dublin 1 Ireland
Administrator and Company Secretary
Capita Financial Administrators (Ireland) Limited 2nd Floor, 2 Grand Canal Square Grand Canal Harbour Dublin 2 Ireland
Independent Auditor
Deloitte & Touche Chartered Accountants and Statutory Audit Firm Deloitte & Touche House Earlsfort Terrace Dublin 2 Ireland
Irish Legal Advisor
Arthur Cox Earlsfort Centre Earlsfort Terrace Dublin 2 Ireland
Company number 511970 (Registered in Ireland)

Directors’ report Butterfield Asset Management Funds plc
For the year ended 31 January 2014
4
The Directors of Butterfield Asset Management Funds plc (the “Company”) present herewith their annual report and audited financial statements for the year ended 31 January 2014. The Company was incorporated on 16 April 2012 and is authorised as an Undertaking for Collective Investment in Transferable Securities (“UCITS”) by the Central Bank of Ireland. The Company is an umbrella type investment company with segregated liability between sub-funds. As of the date of this report the Company is comprised of five sub-funds, each of which launched on 26 October 2012. Statement of directors’ responsibilities Irish company law requires the Directors to prepare financial statements for each financial year which give a true and fair view of the state of affairs of the Company and of the profit or loss for that year. In preparing those financial statements, the Directors are required to:
• select suitable accounting policies and then apply them consistently; • make judgements and estimates that are reasonable and prudent; and
• prepare the financial statements on the going concern basis unless it is inappropriate to presume that the Company will continue in
business. The Directors are responsible for keeping proper books of account which disclose with reasonable accuracy at any time the financial position of the Company and enable them to ensure that the financial statements are prepared in accordance with accounting standards generally accepted in Ireland and comply with Irish Statute comprising the Companies Acts, 1963 to 2013 and the European Communities (Undertakings for Collective Investment in Transferable Securities) Regulations, 2011, as amended (the “UCITS Regulations”). They are also responsible for safeguarding the assets of the Company and hence for taking reasonable steps for the prevention and detection of fraud and other irregularities. The Company has appointed BNY Mellon Trust Company (Ireland) Limited to carry out the custodial functions of the Company including the safekeeping of assets, trustee duties and the operation and maintenance of bank accounts. Basis of preparation The format and certain wordings of the financial statements have been adapted from those contained in the Companies (Amendment) Act 1986 so that, in the opinion of the Directors, they more appropriately reflect the nature of the Company’s business as an investment fund. Principal activities The Company is an open-ended investment company with variable capital and limited liability which has been authorised by the Central Bank of Ireland as a UCITS pursuant to the UCITS Regulations. Directors’ statement on proper books of account The measures which the Directors have taken to ensure that proper books of account are kept are the adoption of suitable policies for recording transactions, assets and liabilities and the appointment of a suitable service organisation, Capita Financial Administrators (Ireland) Limited (the “Administrator”). The books of accounts of the Company are located at the offices of the Administrator. Activities and business review A comprehensive overview of the Company’s trading activities is detailed in the Investment Manager’s report for each sub-fund on pages 6 to 8. Risks and uncertainties The principal risks and uncertainties faced by the Company are outlined in the prospectus. These risks include market price risk, currency risk, interest rate risk, liquidity risk and credit risk as per FRS 29. The Investment Manager reviews and agrees policies for managing each of these risks and these are detailed in note 14 to the financial statements. Directors The Directors as at the reporting date and their country of residence are as stated on page 3. All the Director’s serve in a non-executive capacity. Directors’ interests in the shares of the Company See note 21 to the financial statements. Transactions involving Directors Other than as disclosed in note 21 to the financial statements, there were no contracts or arrangements of any significance in relation to the business of the Company in which the Directors had any interest, as defined in the Companies Act, 1990, at any time during the year. Results of operations The results of operations for the year are set out in the profit and loss account on page 14. Distributions The Directors declared dividends during the year ended 31 January 2014. See note 17 for further details. Independent Auditors The Auditors, Deloitte & Touche have indicated their willingness to remain in office in accordance with section 160(2) of the Companies Act, 1963.
Investment Manager’s report Butterfield Asset Management Funds plc
For the year ended 31 January 2014
6
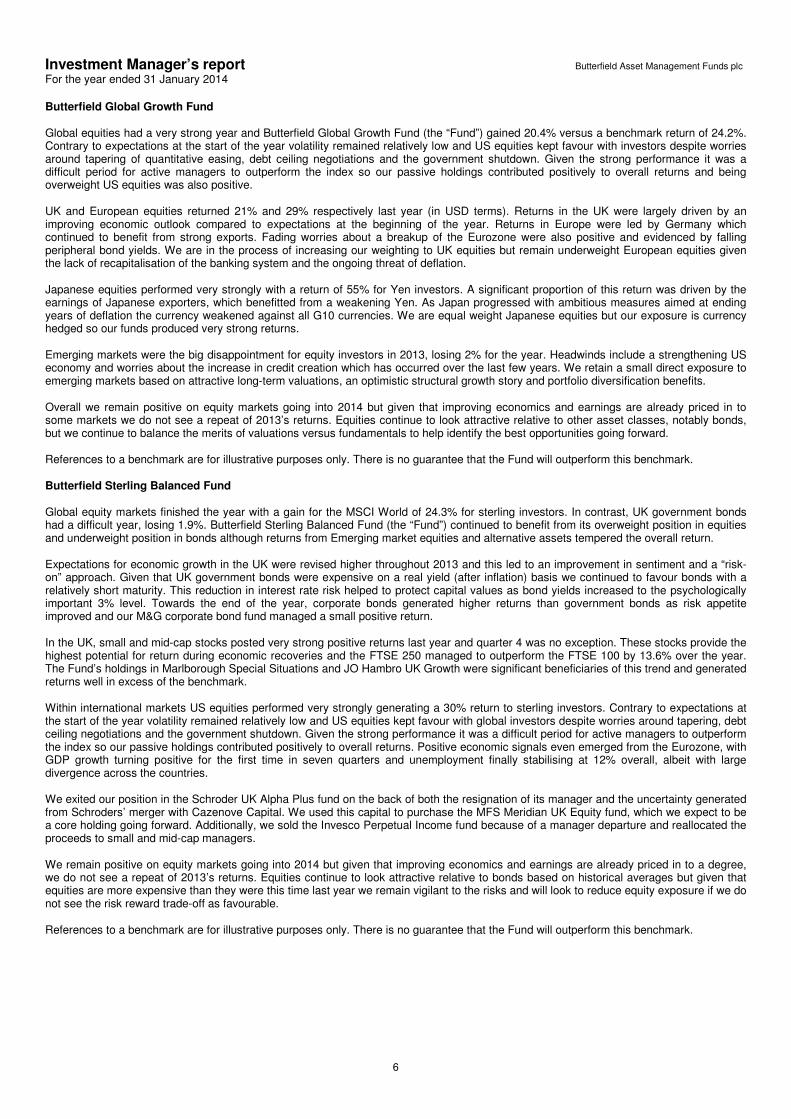
Butterfield Global Growth Fund
Global equities had a very strong year and Butterfield Global Growth Fund (the “Fund”) gained 20.4% versus a benchmark return of 24.2%. Contrary to expectations at the start of the year volatility remained relatively low and US equities kept favour with investors despite worries around tapering of quantitative easing, debt ceiling negotiations and the government shutdown. Given the strong performance it was a difficult period for active managers to outperform the index so our passive holdings contributed positively to overall returns and being overweight US equities was also positive.
UK and European equities returned 21% and 29% respectively last year (in USD terms). Returns in the UK were largely driven by an improving economic outlook compared to expectations at the beginning of the year. Returns in Europe were led by Germany which continued to benefit from strong exports. Fading worries about a breakup of the Eurozone were also positive and evidenced by falling peripheral bond yields. We are in the process of increasing our weighting to UK equities but remain underweight European equities given the lack of recapitalisation of the banking system and the ongoing threat of deflation.
Japanese equities performed very strongly with a return of 55% for Yen investors. A significant proportion of this return was driven by the earnings of Japanese exporters, which benefitted from a weakening Yen. As Japan progressed with ambitious measures aimed at ending years of deflation the currency weakened against all G10 currencies. We are equal weight Japanese equities but our exposure is currency hedged so our funds produced very strong returns.
Emerging markets were the big disappointment for equity investors in 2013, losing 2% for the year. Headwinds include a strengthening US economy and worries about the increase in credit creation which has occurred over the last few years. We retain a small direct exposure to emerging markets based on attractive long-term valuations, an optimistic structural growth story and portfolio diversification benefits.
Overall we remain positive on equity markets going into 2014 but given that improving economics and earnings are already priced in to some markets we do not see a repeat of 2013’s returns. Equities continue to look attractive relative to other asset classes, notably bonds, but we continue to balance the merits of valuations versus fundamentals to help identify the best opportunities going forward.
References to a benchmark are for illustrative purposes only. There is no guarantee that the Fund will outperform this benchmark.
Butterfield Sterling Balanced Fund
Global equity markets finished the year with a gain for the MSCI World of 24.3% for sterling investors. In contrast, UK government bonds had a difficult year, losing 1.9%. Butterfield Sterling Balanced Fund (the “Fund”) continued to benefit from its overweight position in equities and underweight position in bonds although returns from Emerging market equities and alternative assets tempered the overall return.
Expectations for economic growth in the UK were revised higher throughout 2013 and this led to an improvement in sentiment and a “risk-on” approach. Given that UK government bonds were expensive on a real yield (after inflation) basis we continued to favour bonds with a relatively short maturity. This reduction in interest rate risk helped to protect capital values as bond yields increased to the psychologically important 3% level. Towards the end of the year, corporate bonds generated higher returns than government bonds as risk appetite improved and our M&G corporate bond fund managed a small positive return.
In the UK, small and mid-cap stocks posted very strong positive returns last year and quarter 4 was no exception. These stocks provide the highest potential for return during economic recoveries and the FTSE 250 managed to outperform the FTSE 100 by 13.6% over the year. The Fund’s holdings in Marlborough Special Situations and JO Hambro UK Growth were significant beneficiaries of this trend and generated returns well in excess of the benchmark.
Within international markets US equities performed very strongly generating a 30% return to sterling investors. Contrary to expectations at the start of the year volatility remained relatively low and US equities kept favour with global investors despite worries around tapering, debt ceiling negotiations and the government shutdown. Given the strong performance it was a difficult period for active managers to outperform the index so our passive holdings contributed positively to overall returns. Positive economic signals even emerged from the Eurozone, with GDP growth turning positive for the first time in seven quarters and unemployment finally stabilising at 12% overall, albeit with large divergence across the countries.
We exited our position in the Schroder UK Alpha Plus fund on the back of both the resignation of its manager and the uncertainty generated from Schroders’ merger with Cazenove Capital. We used this capital to purchase the MFS Meridian UK Equity fund, which we expect to be a core holding going forward. Additionally, we sold the Invesco Perpetual Income fund because of a manager departure and reallocated the proceeds to small and mid-cap managers.
We remain positive on equity markets going into 2014 but given that improving economics and earnings are already priced in to a degree, we do not see a repeat of 2013’s returns. Equities continue to look attractive relative to bonds based on historical averages but given that equities are more expensive than they were this time last year we remain vigilant to the risks and will look to reduce equity exposure if we do not see the risk reward trade-off as favourable.
References to a benchmark are for illustrative purposes only. There is no guarantee that the Fund will outperform this benchmark.

Investment Manager’s report (continued) Butterfield Asset Management Funds plc
For the year ended 31 January 2014
7
Butterfield Sterling Income Fund
UK fixed income markets have experienced a disappointing year with official interest rates stuck at 0.5%, while longer dated bond yields have risen and yield curves steepened. During the last 12 months, the benchmark index has remained broadly unchanged while Butterfield Sterling Income Fund (the “Fund”) has posted a small loss of 0.55% after fees.
It has now been more than 12 months since the UK implemented any form of quantitative easing (“QE”). With the US also now starting down the path of reducing and ultimately winding up QE, we believe that Central Banks in developed economies (ex Japan) are moving into a new era where ‘forward guidance’ will be a key policy tool in influencing interest rate markets beyond the overnight rate. To this extent, Central Bankers in the US and UK have been at great pains to note that despite economic data improving faster than originally anticipated (especially employment numbers), the current low level of official interest rates would be administered for an extended period through 2014 and at least into 2015. This leaves the market with a relatively steep yield curve – long rates are pricing in an improving economic outlook, while short rates remained nailed to the floor through Central Bank policy. A positive economic surprise or signs of higher inflation could certainly push rates higher still, while disappointment on the economic front could see yields decrease and forward guidance extended.
Economically, the UK appears to be entering a relative sweet spot, where quarterly economic growth figures tick higher and ahead of consensus, the unemployment rate is falling and inflation is moving back towards the Bank of England’s target rate. Initial strength appears to be driven by renewed activity in the housing market, although the most recent data suggest that the recovery is becoming increasingly broad based. While this is naturally good news for the economy, it is important to understand that while sentiment is improving, it is coming from a low base and projected growth rates still remain below those historically achieved through recent decades. Bond markets will take comfort that inflation is less of a near-term issue and the improved growth outlook should assist the poor state of government finances, but on balance, an improving growth outlook, falling unemployment (especially if accompanied by more progressive wage settlements) and the exceptionally low level of real rates suggests that bond yields will continue to tick marginally higher through 2014 as growth becomes ingrained.
Recent investment strategy, as detailed in previously quarterly reports has helped mitigate against the worst of the yield curve steepening witnessed through the latter part of 2013. Focus has been on the higher yields available in strong, investment grade corporate and financial bonds, while interest rate risk has been limited through shorter duration bonds. Looking forward, markets have moved a long way towards pricing in a higher interest rate environment, perhaps ahead of where official forward guidance would suggest. Therefore, the steepness of the yield curve is becoming more attractive and the level of carry available for extending term is in excess of historical norms. However, this needs to be weighed against the low level of nominal and real yields available and the ongoing acceptance that Central Banks are focussing upon growth ahead of the potential for inflation in the future. Over recent weeks, we have started to add a little duration to the Fund as bonds mature, but continue to remain short of benchmark duration at this time.
References to a benchmark are for illustrative purposes only. There is no guarantee that the Fund will outperform this benchmark.
Butterfield UK Growth Fund
2013 was a strong year for UK equity markets; the benchmark MSCI UK index returned 18.8% compared to a 10.7% return the year before and a decline of 2.5% in 2011.
The UK outlook has steadily improved with a strong housing market, declining unemployment and a partial rebound in consumer sentiment. As consumer and business confidence increased, cyclical sectors fared particularly well: consumer discretionary stocks returned 32.6% and information technology stocks 39.9%. However, the best performing sector in 2013 was telecommunication services, returning 61.7%. This was almost entirely attributable to Vodafone which makes up three-quarters of the index sector: the long-awaited sale of its stake it Verizon materialised and the stock price gained 61.5% during the year. In contrast, the materials sector performed the worst, losing 10.4% over the year due to a combination of low commodity prices, rising costs and slower growth in key economies like China. Valuations are reasonably attractive and the long term structural drivers for the sector are positive despite muted earnings in the near-term. We retain our neutral view on the sector.
The Butterfield UK Growth Fund (the “Fund”) returned 14.1%, underperforming the index. The two primary reasons for this were our underweight exposure to the telecommunication services sector and an overweight in the energy sector. In hindsight, the reasoning for both looks to hold true: telecoms is low growth, extremely competitive, highly regulated and capital intensive; energy continues to look good value and offers enticing yields, whilst a normalising global economy and tight supply/demand balance bodes well for future earnings.
We look forward to 2014 with cautious optimism. A repetition of last year seems highly unlikely, as valuations have increased as the market has risen. The year has begun in cautious mood as tapering in the US combined with slower global growth has caused disruption in emerging markets. However, the risk/reward trade-off remains positive, as does the outlook for the UK economy.
References to a benchmark are for illustrative purposes only. There is no guarantee that the Fund will outperform this benchmark.

Investment Manager’s report (continued) Butterfield Asset Management Funds plc
For the year ended 31 January 2014
8
Butterfield USD Balanced Fund
Global equity markets finished the year with a gain for the MSCI World in 2013 of 27.4% for USD investors. In contrast, US government bonds had a difficult year as yields rose, losing 0.3%. The Butterfield USD Balanced Fund (the “Fund”) again benefitted from its overweight position in equities and its underweight position in bonds although returns from emerging market equities and alternative assets tempered overall returns.
US economic growth numbers were better than expected in quarter 3 and the improving economic environment was positive for equities but negative for bonds. Given that US government bonds were expensive on a real yield (after inflation) basis we continued to favour bonds with a relatively short maturity. This reduction in interest rate risk helped to protect capital values as bond yields increased to the psychologically important 3% level. Toward the end of the year, corporate bonds generated higher returns than government bonds as risk appetite improved and our PIMCO investment grade bond fund produced a pleasing positive return.
US equities performed very strongly generating a 32% return over the year. Contrary to expectations at the start of the year volatility remained relatively low and US equities kept favour with global investors despite worries around tapering, debt ceiling negotiations and the government shutdown. Given the strong performance it was a difficult period for active managers to outperform the index so our passive holdings contributed positively to overall returns and being overweight US equities was also positive.
Within international equities Japan was the standout performer with a return of 55% in local currency. A significant proportion of this return was driven by the earnings of Japanese exporters, which benefitted from a weakening Yen. As Japan progressed with ambitious measures aimed at ending years of deflation the currency weakened against all G10 currencies. We are equal weight Japanese equities but our exposure through Polar Capital is currency hedged so our Fund performed very strongly. Positive economic signals even emerged from the Eurozone, with GDP growth turning positive for the first time in seven quarters and unemployment finally stabilising at 12% overall, albeit with large divergence across the countries.
We exited our position in the Allianz US Equity fund on the back of the departure of its manager and the uncertainty generated from the change in investment process. We reallocated this capital across other managers as it was not a large portion of the portfolio.
Overall we remain positive on equity markets going into 2014 but given that improving economics and earnings are already priced in to some markets we do not see a repeat of 2013’s returns. Equities continue to look attractive relative to bonds based on historical averages but given that equities are more expensive than they were this time last year we remain vigilant to the risks and will look to reduce equity exposure if we do not see the risk reward trade-off as favourable.
Butterfield Bank (UK) Limited February 2014


Notes to the financial statements Butterfield Asset Management Funds plc
For the year ended 31 January 2014
18
1. General information
Butterfield Asset Management Funds plc (the “Company”), was incorporated on 16 April 2012 under the Companies Acts 1963 to 2013 as an investment company with variable capital. The Company has been authorised in Ireland as an Undertakings for Collective Investment in Transferable Securities (“UCITS”) and an open-ended umbrella fund with segregated liability between sub-funds pursuant to the European Communities (Undertakings for Collective Investment in Transferable Securities) Regulations, 2011, as amended (the “UCITS Regulations”).
The Company is currently comprised of five sub-funds, Butterfield Global Growth Fund, Butterfield Sterling Balanced Fund, Butterfield Sterling Income Fund, Butterfield UK Growth Fund and Butterfield USD Balanced Fund. All sub-funds launched on the 26 October 2012. Each sub-fund has a distinct portfolio of investments. Each sub-fund aims to achieve its investment objective, as set out below, while spreading investment risks through investment in transferable securities and liquid financial assets in accordance with the UCITS Regulations. The transferable securities and liquid financial assets in which a sub-fund may invest generally must be listed, traded or dealt in on a regulated market except that, provided that it is set out in the investment policies of the relevant sub-fund, up to 10% of the net asset value (“NAV”) of a sub-fund may be invested in transferable securities and liquid financial assets which are not so listed, traded or dealt. 2. Significant accounting policies
(a) Basis of preparation
The audited financial statements of the Company have been prepared in accordance with accounting standards generally accepted in Ireland and Irish statute comprising the Companies Acts, 1963 to 2013 and the UCITS Regulations. Accounting standards generally accepted in Ireland in preparing financial statements, giving a true and fair view, are those published by Chartered Accountants Ireland and issued by the Financial Reporting Council (FRC).
The format and certain wordings of the audited financial statements has been adapted from those contained in the Companies (Amendment) Act, 1986 and Financial Reporting Standard (“FRS”) No. 3 “Reporting Financial Performance” so that, in the opinion of the Directors, they more appropriately reflect the nature of the Company’s business as an investment fund. The financial statements have been prepared under the historical cost convention as modified by the revaluation of financial assets and liabilities at fair value through profit or loss. The Company has availed of the exemption available to open-ended investment funds under FRS 1 “Cash Flow Statements” not to prepare a cash flow statement.
(b) Foreign currency
(i) Functional and presentation currency
The functional currency of Butterfield Global Growth Fund, Butterfield Sterling Balanced Fund, Butterfield Sterling Income Fund and Butterfield UK Growth Fund is British Pound (“GBP”) and the functional currency of Butterfield USD Balanced Fund is U.S. Dollar (“USD”). The Company has adopted the GBP as its presentation currency.
(ii) Foreign currency translation
Assets and liabilities denominated in currencies other than the functional currency of the sub-fund’s are translated into the functional currency using exchange rates prevailing at year end. Foreign exchange gains and losses resulting from the settlement of such transactions and from the translation at year end exchange rates of assets and liabilities that are denominated in foreign currencies are recognised in profit or loss in the period in which they arise.
(iii) Notional foreign exchange adjustment
The foreign exchange adjustment arises due to the use of exchange rates at the reporting date to translate sub-funds that have a functional currency that differs to the presentation currency of the Company. The translation of the sub-funds functional currencies into the presentation currency of the Company is recognised separately through the statement of changes in net assets attributable to holders of redeemable participating shares. For the reporting date, the translation adjustment was a notional loss of £184,467; which has no impact on the NAV of each individual sub-fund (31 January 2013: notional gain of £34,291).
(c) Financial assets at fair value through profit or loss
(i) Classification
The Company classifies its financial assets into the categories below in accordance with FRS 26 “Financial Instruments: Recognition and Measurement”.
o Financial assets held for trading are those acquired or incurred principally for the purpose of selling or repurchasing in the short term.
o Financial assets designated at fair value through profit or loss at inception are those that are managed and their performance evaluated on a fair value basis in accordance with each sub-fund’s investment strategy.
The Company has classified all of its financial assets at fair value through profit or loss as held for trading for the reporting dates 31 January 2014 and 31 January 2013.
(ii) Recognition
All “regular way” purchases and sales of financial instruments are recognised using trade date accounting, the day that the Company commits to purchase or sell the asset. From this date any gains and losses arising from changes in fair value of the financial assets or financial liabilities are recorded. Regular way purchases, or sales, are purchases and sales of financial assets that require delivery of the asset within a time frame generally established by regulation or convention in the market place.

Notes to the financial statements (continued) Butterfield Asset Management Funds plc
For the year ended 31 January 2014
19
2. Significant accounting policies (continued)
(c) Financial assets at fair value through profit or loss (continued)
(iii) Measurement
At initial recognition financial assets categorised at fair value through profit or loss are recognised initially at fair value, with transaction costs for such instruments being recognised directly in the profit and loss account.
Subsequent to initial recognition, all instruments classified at fair value through profit or loss, are measured at fair value with changes in their fair value recognised in the profit and loss account.
• Investments in listed equity positions and debt securities are valued at their latest traded price. • Investments in investment funds are valued at their NAV as calculated by the relevant administrator.
In the event of it being impossible or incorrect to carry out a valuation of a specific investment in accordance with the valuation rules set out in the prospectus or if such valuation is not representative of an asset’s fair market value, a competent person appointed by the Company and approved for the purpose by BNY Mellon Trust Company (Ireland) Limited (the “Custodian”) is entitled to use such other generally recognised valuation method in order to reach a proper valuation of that specific instrument, provided that such method of valuation has been approved by the Custodian.
(iv) Derecognition
Financial assets are derecognised when the contractual rights to the cash flows from the investments have expired or the Company has transferred substantially all risks and rewards of ownership.
(v) Offsetting
The Company only offsets financial assets at fair value through profit or loss if the Company has a legally enforceable right to set off the recognised amounts and either intends to settle on a net basis, or to realise the asset and settle the liability simultaneously.
(d) Income
Dividends and interest arising on the investments are recognised as income of the Company on an ex-dividend or interest date, and for deposits of the Company, on an accrual basis.
(e) Net gain/(loss) from financial instruments at fair value through profit or loss
Net gain/(loss) from financial instruments at fair value through profit or loss includes all realised and unrealised fair value changes and foreign exchange differences. Net realised gain/(loss) from financial instruments at fair value through profit or loss is calculated using the average cost method.
(f) Cash at bank
Cash at bank comprises of deposits with banks and bank overdrafts held with the Bank of New York Mellon SA/NV, a sub-custodian of the Custodian and fixed term deposits with Butterfield Private Bank (private banking section of Butterfield Bank (UK) Limited). See note 4 for further details.
(g) Expenses
All expenses are recognised in the profit and loss account on an accrual basis.
(h) Redeemable participating shares
Redeemable participating shares are redeemable at the shareholders option and are classified as financial liabilities. Any distribution on these shares is recognised in the profit and loss account as finance costs.
(i) Withholding tax
The Company currently incurs withholding taxes imposed by certain countries on investment income. Such income is recorded gross of withholding taxes in the profit and loss account. Withholding taxes are shown as a separate item in the profit and loss account.
(j) Transaction costs
Transaction costs are incremental costs, which are separately identifiable and directly attributable to the acquisition, issue or disposal of a financial asset or financial liability. Transaction costs are included in the profit and loss account as part of net gain of financial assets at fair value through profit or loss and foreign exchange.
The following costs are included in the transaction costs disclosure:
- identifiable brokerage charges and commissions; - identifiable transaction related taxes and other market charges; - separately identifiable transaction costs related to derivatives. (k) Securities purchased payable
Securities purchased payable represents payable amounts for securities that have been contracted for but not yet settled or delivered on the reporting date. These amounts are recognised at cost and include all transaction costs and commissions due in relation to the trade.

Notes to the financial statements (continued) Butterfield Asset Management Funds plc
For the year ended 31 January 2014
20
3. Financial assets at fair value through profit or loss
(i) Net gains on financial assets at fair value through profit or loss
For the year ended 31 January 2014
Butterfield Global Growth
Fund
Butterfield Sterling Balanced
Fund
Butterfield Sterling Income
Fund
Butterfield UK Growth
Fund
Butterfield USD Balanced
Fund Total GBP GBP GBP GBP USD GBP
Net realised gain on financial assets at fair value through profit or loss and foreign exchange 220,043 808,185 4,909 34,651 72,188 1,113,793 Change in unrealised gain/(loss) on financial assets at fair value through profit or loss and foreign exchange 158,870 727,811 (6,994) 316,467 547,838 1,545,287 Net gain/(loss) on financial assets at fair value through profit or loss and foreign exchange 378,913 1,535,996 (2,085) 351,118 620,026 2,659,080 For the period ended 31 January 2013
Butterfield Global Growth
Fund
Butterfield Sterling Balanced
Fund
Butterfield Sterling Income
Fund
Butterfield UK Growth
Fund
Butterfield USD Balanced
Fund Total GBP GBP GBP GBP USD GBP
Net realised gain/(loss) on financial assets at fair value through profit or loss and foreign exchange 6,062 16,309 (508) 21,036 4,877 45,936 Change in unrealised gain/(loss) on financial assets at fair value through profit or loss and foreign exchange 240,690 1,068,219 24,039 415,320 198,528 1,871,882 Net gain on financial assets at fair value through profit or loss and foreign exchange 246,752 1,084,528 23,531 436,356 203,405 1,917,818

Notes to the financial statements (continued) Butterfield Asset Management Funds plc
For the year ended 31 January 2014
21
3. Financial assets at fair value through profit or loss (continued)
(ii) Fair value of financial instruments
FRS 26 requires investments in securities held long to be valued at bid price. The difference between the dealing NAV and the FRS 26 adjusted NAV was deemed immaterial for adjustment for the reporting dates 31 January 2014 and 31 January 2013.
FRS 29 establishes a fair value hierarchy for inputs used in measuring fair value that classifies investments according to how observable the inputs are. Observable inputs are those that market participants would use in pricing the asset or liability based on market data obtained from sources independent of the Company. Unobservable inputs reflect the Company’s assumptions, made in good faith, about the inputs market participants would use in pricing the asset or liability developed based on the best information available in the circumstances. The fair value hierarchy is categorised into three levels based on the inputs as follows:
Level 1 - Valuations based on quoted prices in active markets for identical assets or liabilities;
Level 2 - Valuations based on quoted prices in markets that are not active or inputs other than quoted prices for which all significant inputs are observable, either directly (as prices) or indirectly (derived from prices); and
Level 3 - Valuations based on inputs that are unobservable and significant to the overall fair value measurement.
Inputs are used in applying the various valuation techniques and broadly refer to the assumptions that market participants use to make valuation decisions, including assumptions about risk. Inputs may include price information, volatility statistics, specific and broad credit data, liquidity statistics, and other factors. A financial instrument’s level within the fair value hierarchy is based on the lowest level of any input that is significant to the fair value measurement. Observable data is considered to be market data which is readily available, regularly distributed or updated, reliable and verifiable, not proprietary, and provided by independent sources that are actively involved in the relevant market. The categorisation of a financial instrument within the hierarchy is based upon the pricing transparency of the instrument and does not necessarily correspond to Butterfield Bank (UK) Limited’s (the “Investment Manager”) perceived risk of that instrument.
There were no transfers between level 1 and level 2 during the year.
As at 31 January 2014
Level 1 Level 2 Level 3 Total
Butterfield Global Growth Fund GBP GBP GBP GBP Held for trading CIS 1,180,264 2,069,702 - 3,249,966
Financial assets at fair value through profit or loss 1,180,264 2,069,702 - 3,249,966 Butterfield Sterling Balanced Fund GBP GBP GBP GBP Held for trading Debt securities - 2,843,286 - 2,843,286 Other transferable securities 1,132,088 - - 1,132,088 CIS 1,311,362 22,344,996 - 23,656,358
Financial assets at fair value through profit or loss 2,443,450 25,188,282 - 27,631,732
Butterfield Sterling Income Fund GBP GBP GBP GBP Held for trading Debt securities - 5,480,873 - 5,480,873 CIS - 3,377,158 - 3,377,158
Financial assets at fair value through profit or loss - 8,858,031 - 8,858,031
Butterfield UK Growth Fund GBP GBP GBP GBP Held for trading CIS - 241,815 - 241,815 Equity securities 10,112,219 - - 10,112,219
Financial assets at fair value through profit or loss 10,112,219 241,815 - 10,354,034
Butterfield USD Balanced Fund USD USD USD USD Held for trading Debt securities - 806,002 - 806,002 Other transferable securities 307,869 - - 307,869 CIS 1,706,528 4,474,220 - 6,180,748
Financial assets at fair value through profit or loss 2,014,397 5,280,222 - 7,294,619 As at 31 January 2013 Level 1 Level 2 Level 3 Total
Butterfield Global Growth Fund GBP GBP GBP GBP Held for trading CIS 851,405 2,093,684 - 2,945,089
Financial assets at fair value through profit or loss 851,405 2,093,684 - 2,945,089

Notes to the financial statements (continued) Butterfield Asset Management Funds plc
For the year ended 31 January 2014
22
3. Financial assets at fair value through profit or loss (continued)
(ii) Fair value of financial instruments (continued)
As at 31 January 2013 (continued) Level 1 Level 2 Level 3 Total
Butterfield Sterling Balanced Fund GBP GBP GBP GBP Held for trading Debt securities - 2,013,435 - 2,013,435 Other transferable securities 923,776 - - 923,776 CIS - 17,301,563 - 17,301,563
Financial assets at fair value through profit or loss 923,776 19,314,998 - 20,238,774
Butterfield Sterling Income Fund GBP GBP GBP GBP Held for trading Debt securities - 6,584,367 - 6,584,367 CIS - 3,354,678 - 3,354,678
Financial assets at fair value through profit or loss - 9,939,045 - 9,939,045
Butterfield UK Growth Fund GBP GBP GBP GBP Held for trading Equity securities 9,910,016 - - 9,910,016
Financial assets at fair value through profit or loss 9,910,016 - - 9,910,016 Butterfield USD Balanced Fund USD USD USD USD Held for trading Debt securities - 709,019 - 709,019 Other transferable securities 187,222 - - 187,222 CIS 658,314 2,663,420 - 3,321,734
Financial assets at fair value through profit or loss 845,536 3,372,439 - 4,217,975
4. Cash at bank
Cash at bank represents the cash balances held at the Custodian and Butterfield Private Bank. The Standard & Poor’s credit rating for The Bank of New York, the parent Company of the Custodian, is AA- as at 31 January 2014 (31 January 2013: AA-). The Custodian is not rated. 5. Investment management fee
Under the investment management agreement, Capita Financial Managers (Ireland) Limited (the “Manager”) procures that the Company will pay to the Investment Manager an investment management fee at the rates specified in the following table, which accrues daily and is paid monthly in arrears. The Investment Manager is also entitled to be reimbursed out of the assets of the Company for its reasonable out-of pocket expenses.
Sub-fund % NAV Actual fee charged during the
reporting period
Butterfield Global Growth Fund Up to 1.50% 1.50% Butterfield Sterling Balanced Fund Up to 1.50% 1.43% Butterfield Sterling Income Fund Up to 1.50% 0.74% Butterfield UK Growth Fund Up to 1.50% 0.87% Butterfield USD Balanced Fund Up to 1.50% 1.50% Total investment management fees accrued at the reporting date and charged during the year are disclosed in the balance sheet and profit and loss account respectively. 6. Management and administration fee
Under the management agreement, the Company pays to the Manager an annual management fee up to 5% of the NAV of each sub-fund subject to a minimum fee of an amount equal to the greater of 0.12% per annum of the NAV of the Company or an annual minimum fee across all existing sub-funds of €375,000. (In the event of the creation of additional sub-funds, this minimum amount of €375,000 may be increased). The management fee is apportioned between the sub-funds pro rata to the NAV of the sub-funds during the relevant period. Such fees accrue daily and are paid monthly in arrears. The Company pays financial statement production fees, transaction fees, account fees and corporate secretarial fees to the Manager at normal commercial rates. Such fees accrue daily and, with the exception of the corporate secretarial fees, are paid monthly in arrears. The corporate secretarial fees are paid in advance. In addition, the Manager is entitled to be reimbursed its reasonable vouched out-of-pocket expenses. Each sub-fund bears its pro rata share of such out-of pocket expenses. The Manager discharges the fees and out-of-pocket expenses of Capita Financial Administrators (Ireland) Limited (the “Administrator”) from the fee it receives from the Company. Total management and administration fees accrued at the reporting date and charged during the year are disclosed in the balance sheet and profit and loss account respectively.

Notes to the financial statements (continued) Butterfield Asset Management Funds plc
For the year ended 31 January 2014
23
7. Custodian fee
The Custodian receives a fee which is accrued daily and paid monthly in arrears at the annual rate of up to 0.02% of the NAV of each of the sub-funds, subject to a minimum fee of €25,000 per sub-fund per annum.
The Custodian is entitled to be reimbursed its reasonable out-of-pocket expenses, transaction and account costs at normal commercial rates, from the assets of each of the sub-funds. The Custodian is further entitled to be reimbursed any sub-custodian fees and expenses, at normal commercial rates.
Total custodian fees accrued at the reporting date and charged during the year are disclosed in the balance sheet and profit and loss account respectively. 8. Directors’ fee
The Company pays the Directors such annual remuneration for acting as Directors of the Company as the Directors may from time to time agree, provided, however, that the annual aggregate remuneration per Director shall not exceed €45,000. The Directors are entitled to reimbursement by the Company for all reasonable disbursements and out of pocket expenses incurred by them.
Total directors’ fee accrued at the reporting date and charged during the year are disclosed in the balance sheet and profit and loss account respectively. 9. Audit fee
Fees and expenses charged by the Company’s statutory Auditor, Deloitte & Touche, in respect of the reporting period ended 31 January 2014, entirely relate to the audit of the financial statements of the Company €15,500 (31 January 2013: €13,500 exclusive of VAT). The amount reflected in the profit and loss account is inclusive of VAT of 23% and is an estimate and will differ to the above amounts.
There were no other fees or expenses charged in respect of other assurance, non routine tax advisory or non-audit services provided by the statutory Auditor for the year ended 31 January 2014 (2013: nil).
Notes to the financial statements (continued) Butterfield Asset Management Funds plc
For the year ended 31 January 2014
24
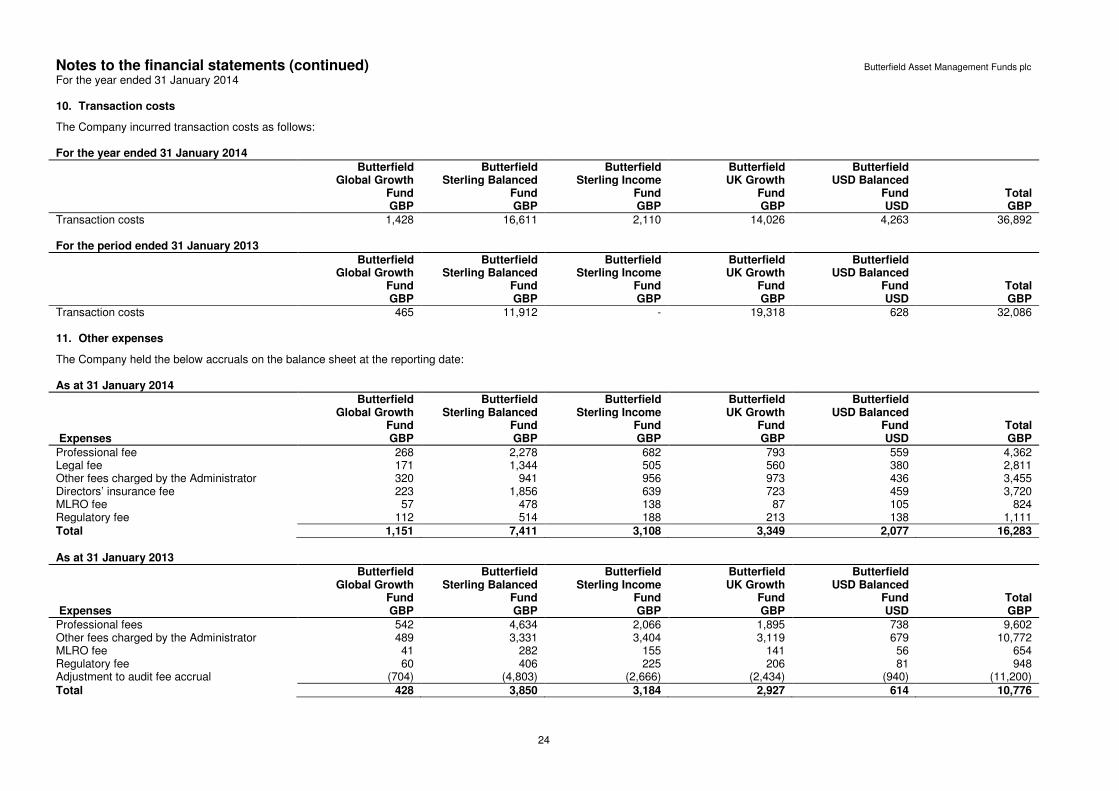
10. Transaction costs
The Company incurred transaction costs as follows: For the year ended 31 January 2014
Butterfield Global Growth
Fund
Butterfield Sterling Balanced
Fund
Butterfield Sterling Income
Fund
Butterfield UK Growth
Fund
Butterfield USD Balanced
Fund Total GBP GBP GBP GBP USD GBP
Transaction costs 1,428 16,611 2,110 14,026 4,263 36,892 For the period ended 31 January 2013
Butterfield Global Growth
Fund
Butterfield Sterling Balanced
Fund
Butterfield Sterling Income
Fund
Butterfield UK Growth
Fund
Butterfield USD Balanced
Fund Total GBP GBP GBP GBP USD GBP Transaction costs 465 11,912 - 19,318 628 32,086 11. Other expenses
The Company held the below accruals on the balance sheet at the reporting date: As at 31 January 2014
Butterfield Global Growth
Fund
Butterfield Sterling Balanced
Fund
Butterfield Sterling Income
Fund
Butterfield UK Growth
Fund
Butterfield USD Balanced
Fund Total Expenses GBP GBP GBP GBP USD GBP
Professional fee 268 2,278 682 793 559 4,362 Legal fee 171 1,344 505 560 380 2,811 Other fees charged by the Administrator 320 941 956 973 436 3,455 Directors’ insurance fee 223 1,856 639 723 459 3,720 MLRO fee 57 478 138 87 105 824 Regulatory fee 112 514 188 213 138 1,111 Total 1,151 7,411 3,108 3,349 2,077 16,283
As at 31 January 2013
Butterfield Global Growth
Fund
Butterfield Sterling Balanced
Fund
Butterfield Sterling Income
Fund
Butterfield UK Growth
Fund
Butterfield USD Balanced
Fund Total Expenses GBP GBP GBP GBP USD GBP
Professional fees 542 4,634 2,066 1,895 738 9,602 Other fees charged by the Administrator 489 3,331 3,404 3,119 679 10,772 MLRO fee 41 282 155 141 56 654 Regulatory fee 60 406 225 206 81 948 Adjustment to audit fee accrual (704) (4,803) (2,666) (2,434) (940) (11,200) Total 428 3,850 3,184 2,927 614 10,776

Notes to the financial statements (continued) Butterfield Asset Management Funds plc
For the year ended 31 January 2014
25
11. Other expenses (continued)
The below fees were charged through the profit and loss account up to the reporting date: For the year ended 31 January 2014
Butterfield Global Growth
Fund
Butterfield Sterling Balanced
Fund
Butterfield Sterling Income
Fund
Butterfield UK Growth
Fund
Butterfield USD Balanced
Fund Total Expenses GBP GBP GBP GBP USD GBP
Professional fees 529 4,192 1,147 1,556 1,509 8,386 Legal fee 1,370 11,117 3,902 4,299 2,887 22,528 Other fees charged by the Administrator 3,156 19,017 10,590 11,442 4,949 47,358 Directors’ insurance fee 766 5,501 2,836 2,480 1,214 12,357 MLRO fees 743 4,974 1,876 1,984 1,589 10,590 Regulatory fees 394 1,555 606 1,268 766 4,311 Bank charges 444 3,177 1,181 1,285 1,259 6,889 VAT expense 386 3,207 1,152 1,234 872 6,535 Total 7,788 52,740 23,290 25,548 15,045 118,954 For the period ended 31 January 2013
Butterfield Global Growth
Fund
Butterfield Sterling Balanced
Fund
Butterfield Sterling Income
Fund
Butterfield UK Growth
Fund
Butterfield USD Balanced
Fund Total Expenses GBP GBP GBP GBP USD GBP Professional fees 701 5,729 2,653 2,426 958 12,106 Other fees charged by the Administrator 1,052 6,339 5,215 4,708 1,515 18,257 Directors’ insurance fee 193 1,706 732 669 265 3,465 MLRO fees 135 925 512 467 184 2,154 Regulatory fees 60 406 225 206 81 947 Bank charges 500 500 500 500 546 2,340 Adjustment to audit fee accrual (704) (4,803) (2,666) (2,434) (940) (11,192) Total 1,937 10,802 7,171 6,542 2,609 28,077

Notes to the financial statements (continued) Butterfield Asset Management Funds plc
For the year ended 31 January 2014
26
12. Exchange rates
The following spot foreign exchange rates were used to convert the assets and liabilities held in foreign currencies other than the functional currency of the Company at the reporting date. 31 January 2014 31 January 2013 Currency Exchange rate to GBP Exchange rate to GBP Euro 0.820563 0.858682 United States Dollar 0.608480 0.630740 13. Share capital
Authorised The Company has an authorised share capital of 500,000,000,000 shares of no par value. Subscriber shares The issued share capital of the Company is €2 represented by 2 subscriber shares (issued for the purposes of the incorporation of the Company) which are beneficially owned by the Investment Manager. The subscriber shares do not form part of the NAV of the Company and are thus disclosed in the financial statements by way of this note only. In the opinion of the Directors, this disclosure reflects the nature of the Company’s business as an investment fund. Redeemable participating shares Redeemable participating shares carry the right to a proportionate share in the assets of the sub-funds and the holders of redeemable participating shares are entitled to attend and vote at all meetings of the Company and the relevant sub-fund. Shares are redeemable by holders of the relevant share class at the respective NAV per share. Issued share capital The Company had the following shareholder transactions during the reporting period: For the reporting period ended 31 January 2014
Butterfield Global
Growth Fund
Butterfield Sterling
Balanced Fund
Butterfield Sterling Income
Fund
Butterfield UK
Growth Fund
Butterfield USD
Balanced Fund
Accumulating Class Opening balance 3,091,090.3470 21,254,731.6640 - - 4,061,072.0437 Shares issued 739,712.9322 7,850,776.6457 - - 3,218,144.3018 Shares redeemed (877,888.2752) (2,748,395.7066) - - (720,371.0096) Closing balance 2,952,915.0040 26,357,112.6031 - - 6,558,845.3359
Income Class Opening balance - - 10,568,135.2529 9,576,755.9971 - Shares issued - - 1,785,871.2613 1,556,150.2812 - Shares redeemed - - (2,621,014.1226) (1,336,097.8179) - Closing balance - - 9,732,992.3916 9,796,808.4604 - For the reporting period ended 31 January 2013
Butterfield Global
Growth Fund
Butterfield Sterling
Balanced Fund
Butterfield Sterling Income
Fund
Butterfield UK
Growth Fund
Butterfield USD
Balanced Fund
Accumulating Class Opening balance - - - - - Shares issued 3,164,672.5553 21,683,142.8177 - - 4,317,121.5780 Shares redeemed (73,582.2083) (428,411.1537) - - (256,049.5343) Closing balance 3,091,090.3470 21,254,731.6640 - - 4,061,072.0437
Income Class Opening balance - - - - - Shares issued - - 12,626,486.0734 10,157,419.1205 - Shares redeemed - - (2,058,350.8205) (580,663.1234) - Closing balance - - 10,568,135.2529 9,576,755.9971 - 14. Financial instruments and risk management
The main risks to which the Company is exposed are set out in the prospectus and any consideration of the risks here should be viewed in the context of the prospectus which is the primary document governing the operation of the Company. The Company’s investment activities expose it to various types of risks that are associated with the financial investments and markets in which it invests. Asset allocation is determined by the Investment Manager, who manages the distribution of assets to achieve the investment objectives. Divergence from target asset allocation and the composition of the portfolios of the sub-funds is closely monitored by the Investment Manager.

Notes to the financial statements (continued) Butterfield Asset Management Funds plc For the year ended 31 January 2014
27
14. Financial instruments and risk management (continued)
As a high proportion of the Company’s investments are in other CIS, the Company may be subject to valuation risk due to the manner and timing of valuations of the relevant sub-funds' investments. Underlying CIS may be valued by fund administrators affiliated to fund managers, or by the fund managers themselves, or, for open-ended underlying funds that are not valued daily, on the basis of the latest available NAV, resulting in valuations which are not verified by an independent third party on a regular or timely basis. Accordingly there is a risk that (i) the valuations of CIS may not reflect the true value of underlying CIS holdings at a specific time which could result in significant losses or inaccurate pricing for these CIS and/or (ii) valuation may not be available on the valuation day for a sub-fund so that some or all of the assets of the sub-fund may be valued on an estimated basis.
The Investment Manager has developed mechanisms designed to ensure that risk is controlled effectively and systematically in all markets, strategies and sectors and if total risk deviates outside pre-determined thresholds, the risk is brought back within acceptable limits. The nature and extent of the financial instruments outstanding at the reporting date and the specific risk management policies employed by the Investment Manager in respect of the sub-funds are discussed below. Market risk Market risk arises from uncertainty about future prices of financial investments held by a sub-fund, whether those changes are caused by factors specific to individual financial instruments, or other factors affecting a number of similar financial instruments traded in the markets.
It represents the potential loss a sub-fund might suffer through holding market positions in the face of price movements. Usually the maximum risk resulting from financial instruments is determined by the opening fair value of the instruments.
Market risk consists of currency risk, interest rate risk and other price risk.
(i) Currency risk
Currency risk is the risk that the value of financial instruments will fluctuate due to changes in foreign exchange rates. A portion of the net assets of the sub-funds are denominated in currencies other than the functional currency with the effect that the financial statements and total return can be significantly affected by currency movements. The Company does not actively manage currency risk. The following table sets out the Company’s total exposure to foreign currency risk: As at 31 January 2014 Butterfield
Global Growth Fund
Butterfield Sterling Balanced
Fund
Butterfield Sterling Income
Fund
Butterfield UK Growth
Fund
Butterfield USD Balanced
Fund GBP GBP GBP GBP USD British Pound - - - - 2,790,799 Euro - - - 5,869 - United States Dollar 1,592,106 2,626,941 - 2,382 - Total 1,592,106 2,626,941 - 8,251 2,790,799 As at 31 January 2013 Butterfield
Global Growth Fund
Butterfield Sterling Balanced
Fund
Butterfield Sterling Income
Fund
Butterfield UK Growth
Fund
Butterfield USD Balanced
Fund GBP GBP GBP GBP USD British Pound - - - - 1,578,235 United States Dollar 1,331,311 2,813,382 - - - Total 1,331,311 2,813,382 - - 1,578,235
The following table demonstrates the impact on net assets attributable to holders of redeemable participating shares of a movement in local currencies against each sub-funds’ functional currency. The table assumes a 10% upwards movement in the value of the local currencies (a negative 10% would have an equal, but opposite, effect). Sub-fund Currency 31 January 2014 31 January 2013
Butterfield Global Growth Fund GBP 159,211 133,131 Butterfield Sterling Balanced Fund GBP 262,694 281,338 Butterfield Sterling Income Fund GBP - - Butterfield UK Growth Fund GBP 825 - Butterfield USD Balanced Fund USD 279,080 157,824
(ii) Interest rate risk
If not reflected in the market price itself, the effect of interest rate movements on the present value of future payments represents an additional risk in the value of securities to be considered.
Interest rate risk represents the potential losses that a sub-fund might suffer due to adverse movements in relevant interest rates. The value of fixed interest securities may be affected by changes in the interest rate environment and the amount of income receivable from floating rate securities and bank balances, or payable on overdrafts, will also be affected by fluctuations in interest rates.
The Investment Manager monitors the sub-funds' securities and cash positions on a daily basis to ensure each sub-fund is not suffering from adverse fluctuations in interest rates (e.g. running a large overdraft balance).
Notes to the financial statements (continued) Butterfield Asset Management Funds plc For the year ended 31 January 2014
28
14. Financial instruments and risk management (continued)
Market risk (continued)
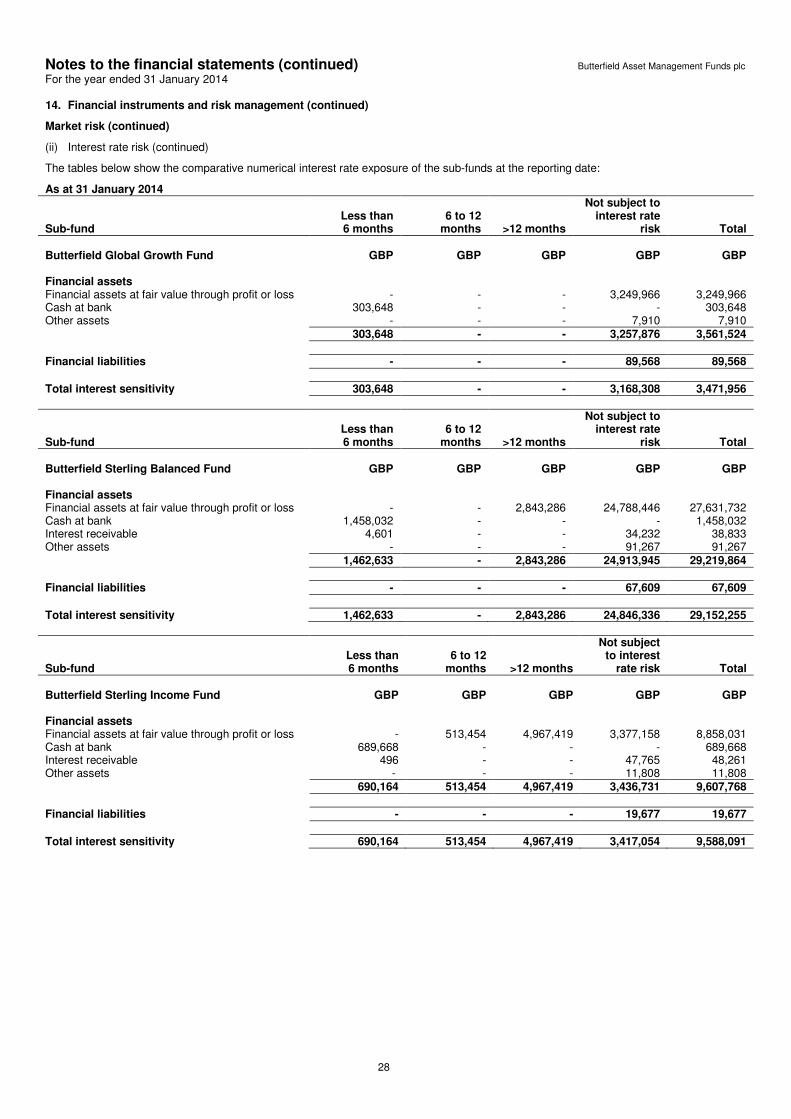
(ii) Interest rate risk (continued)
The tables below show the comparative numerical interest rate exposure of the sub-funds at the reporting date:
As at 31 January 2014
Sub-fund Less than 6 months
6 to 12 months >12 months
Not subject to interest rate
risk Total
Butterfield Global Growth Fund GBP GBP GBP GBP GBP Financial assets Financial assets at fair value through profit or loss - - - 3,249,966 3,249,966 Cash at bank 303,648 - - - 303,648 Other assets - - - 7,910 7,910 303,648 - - 3,257,876 3,561,524
Financial liabilities - - - 89,568 89,568
Total interest sensitivity 303,648 - - 3,168,308 3,471,956
Sub-fund Less than 6 months
6 to 12 months >12 months
Not subject to interest rate
risk Total Butterfield Sterling Balanced Fund GBP GBP GBP GBP GBP Financial assets Financial assets at fair value through profit or loss - - 2,843,286 24,788,446 27,631,732 Cash at bank 1,458,032 - - - 1,458,032 Interest receivable 4,601 - - 34,232 38,833 Other assets - - - 91,267 91,267 1,462,633 - 2,843,286 24,913,945 29,219,864
Financial liabilities - - - 67,609 67,609
Total interest sensitivity 1,462,633 - 2,843,286 24,846,336 29,152,255
Sub-fund Less than 6 months
6 to 12 months >12 months
Not subject to interest
rate risk Total Butterfield Sterling Income Fund GBP GBP GBP GBP GBP Financial assets Financial assets at fair value through profit or loss - 513,454 4,967,419 3,377,158 8,858,031 Cash at bank 689,668 - - - 689,668 Interest receivable 496 - - 47,765 48,261 Other assets - - - 11,808 11,808 690,164 513,454 4,967,419 3,436,731 9,607,768
Financial liabilities - - - 19,677 19,677
Total interest sensitivity 690,164 513,454 4,967,419 3,417,054 9,588,091

Notes to the financial statements (continued) Butterfield Asset Management Funds plc For the year ended 31 January 2014
29
14. Financial instruments and risk management (continued)
Market risk (continued)
(ii) Interest rate risk (continued)
The tables below show the comparative numerical interest rate exposure of the sub-funds at the reporting date (continued):
As at 31 January 2014 (continued)
Sub-fund Less than 6 months
6 to 12 months >12 months
Not subject to interest
rate risk Total
Butterfield UK Growth Fund GBP GBP GBP GBP GBP Financial assets Financial assets at fair value through profit or loss - - - 10,354,034 10,354,034 Cash at bank 160,183 - - - 160,183 Other assets - - - 25,929 25,929 160,183 - - 10,379,963 10,540,146
Financial liabilities - - - 23,256 23,256
Total interest sensitivity 160,183 - - 10,356,707 10,516,890
Sub-fund Less than 6 months
6 to 12 months >12 months
Not subject to interest rate
risk Total Butterfield USD Balanced Fund USD USD USD USD USD Financial assets Financial assets at fair value through profit or loss 10,139 13,352 782,511 6,488,617 7,294,619 Cash at bank 66,957 - - - 66,957 Interest receivable - - - 7,145 7,145 Other assets - - - 19,330 19,330 77,096 13,352 782,511 6,515,092 7,388,051
Financial liabilities - - - 21,230 21,230
Total interest sensitivity 77,096 13,352 782,511 6,493,862 7,366,821 As at 31 January 2013
Sub-fund Less than 6 months
6 to 12 months >12 months
Not subject to interest
rate risk Total
Butterfield Global Growth Fund GBP GBP GBP GBP GBP Financial assets Financial assets at fair value through profit or loss - - - 2,945,089 2,945,089 Cash at bank 394,260 - - - 394,260 Other assets - - - 10,023 10,023 394,260 - - 2,955,112 3,349,372
Financial liabilities - - - 9,513 9,513
Total interest sensitivity 394,260 - - 2,945,599 3,339,859

Notes to the financial statements (continued) Butterfield Asset Management Funds plc For the year ended 31 January 2014
30
14. Financial instruments and risk management (continued)
Market risk (continued)
(ii) Interest rate risk (continued)
The tables below show the comparative numerical interest rate exposure of the sub-funds at the reporting date (continued):
As at 31 January 2013 (continued)
Sub-fund Less than 6 months
6 to 12 months >12 months
Not subject to interest
rate risk Total
Butterfield Sterling Balanced Fund GBP GBP GBP GBP GBP Financial assets Financial assets at fair value through profit or loss - - 2,013,435 18,225,339 20,238,774 Cash at bank 3,259,176 - - - 3,259,176 Other assets - - - 91,102 91,102 3,259,176 - 2,013,435 18,316,441 23,589,052
Financial liabilities - - - 1,316,132 1,316,132
Total interest sensitivity 3,259,176 - 2,013,435 17,000,309 22,272,920
Sub-fund Less than 6 months
6 to 12 months >12 months
Not subject to interest
rate risk Total Butterfield Sterling Income Fund GBP GBP GBP GBP GBP Financial assets Financial assets at fair value through profit or loss 506,045 2,687,051 3,391,271 3,354,678 9,939,045 Cash at bank 578,945 - - - 578,945 Other assets - - - 68,049 68,049 1,084,990 2,687,051 3,391,271 3,422,727 10,586,039
Financial liabilities - - - 28,033 28,033
Total interest sensitivity 1,084,990 2,687,051 3,391,271 3,394,694 10,558,006
Sub-fund Less than 6 months
6 to 12 months >12 months
Not subject to interest
rate risk Total Butterfield UK Growth Fund GBP GBP GBP GBP GBP Financial assets Financial assets at fair value through profit or loss - - - 9,910,016 9,910,016 Cash at bank 114,093 - - - 114,093 Other assets - - - 48,174 48,174 114,093 - - 9,958,190 10,072,283
Financial liabilities - - - 27,452 27,452
Total interest sensitivity 114,093 - - 9,930,738 10,044,831
Sub-fund Less than 6 months
6 to 12 months >12 months
Not subject to interest
rate risk Total
Butterfield USD Balanced Fund USD USD USD USD USD Financial assets Financial assets at fair value through profit or loss 54,385 - 654,634 3,508,956 4,217,975 Cash at bank 203,211 - - - 203,211 Other assets - - - 12,778 12,778 257,596 - 654,634 3,521,734 4,433,964
Financial liabilities - - - 192,805 192,805
Total interest sensitivity 257,596 - 654,634 3,328,929 4,241,159

Notes to the financial statements (continued) Butterfield Asset Management Funds plc For the year ended 31 January 2014
31
14. Financial instruments and risk management (continued)
Market risk (continued)
(iii) Other price risk
Other price risk arises mainly from uncertainty about future prices of investments held. It represents the potential loss the Company might suffer through holding market positions in the face of price movements. The Investment Manager manages each sub-fund’s market price risk on a daily basis in accordance with each sub-fund’s investment objective and policies.
The following table demonstrates the impact on net assets attributable to holder’s of redeemable participating shares of a movement in market prices. The table assumes a 10% upwards movement in investment market prices (a negative 10% would have an equal, but opposite, effect).
Other price sensitivity 31 January 2014 31 January 2013
Butterfield Global Growth Fund £324,997 £294,509 Butterfield Sterling Balanced Fund £2,478,845 £2,023,877 Butterfield Sterling Income Fund £337,716 £993,905 Butterfield UK Growth Fund £1,035,403 £991,002 Butterfield USD Balanced Fund $644,862 $421,798 Liquidity risk Liquidity risk is the risk that the Company may not be able to settle or meet its obligations on time or at a reasonable price. In some circumstances, investments may be relatively illiquid making it difficult to acquire or dispose of them at the prices quoted on the various exchanges. Accordingly, the sub-fund’s ability to respond to market movements may be impaired and the sub-fund may experience adverse price movements upon liquidation of its investments. There can be no assurance that the liquidity of the investments of underlying CIS will always be sufficient to meet redemption requests as and when made. Any lack of liquidity may affect the liquidity of the shares of a sub-fund and the value of its investments.
The liquidity of the exchanges and the individual stocks are monitored by the Investment Manager and, where liquidity issues arise, the Investment Manager will trade accordingly. The main liability of the Company is the net assets attributable to redeemable participating shareholders which may be redeemed by shareholders on any dealing day.
The below table summarises the Company’s financial liabilities into relevant maturity groupings based on the remaining period at the reporting date to the contractual maturity date:
As at 31 January 2014
Butterfield Global Growth Fund
Less than 1 month
GBP
1 to 3 Months
GBP
3 months to 1 year
GBP
No stated Maturity
GBP Total GBP
Liabilities Other liabilities 89,568 - - - 89,568 Net assets attributable to holders of redeemable participating shares 3,471,956 - - - 3,471,956 3,561,524 - - - 3,561,524
Butterfield Sterling Balanced Fund
Less than 1 month
GBP
1 to 3 Months
GBP
3 months to 1 year
GBP
No stated Maturity
GBP Total GBP
Liabilities Other liabilities 67,609 - - - 67,609 Net assets attributable to holders of redeemable participating shares 29,152,255 - - - 29,152,255 29,219,864 - - - 29,219,864
Butterfield Sterling Income Fund
Less than 1 month
GBP
1 to 3 Months
GBP
3 months to 1 year
GBP
No stated Maturity
GBP Total GBP
Liabilities Other liabilities 19,677 - - - 19,677 Net assets attributable to holders of redeemable participating shares 9,588,091 - - - 9,588,091 9,607,768 - - - 9,607,768
Butterfield UK Growth Fund
Less than 1 month
GBP
1 to 3 Months
GBP
3 months to 1 year
GBP
No stated Maturity
GBP Total GBP
Liabilities Other liabilities 23,256 - - - 23,256 Net assets attributable to holders of redeemable participating shares 10,516,890 - - - 10,516,890 10,540,146 - - - 10,540,146
Notes to the financial statements (continued) Butterfield Asset Management Funds plc For the year ended 31 January 2014
32
14. Financial instruments and risk management (continued)
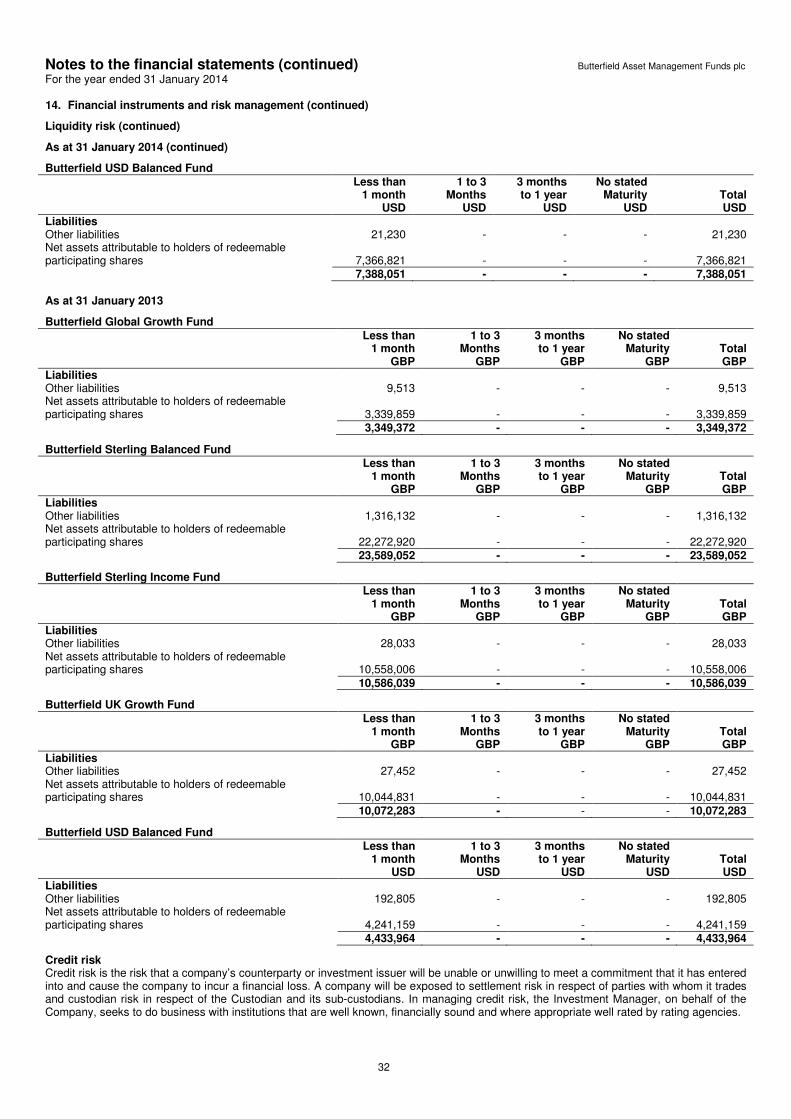
Liquidity risk (continued)
As at 31 January 2014 (continued)
Butterfield USD Balanced Fund
Less than 1 month
USD
1 to 3 Months
USD
3 months to 1 year
USD
No stated Maturity
USD Total USD
Liabilities Other liabilities 21,230 - - - 21,230 Net assets attributable to holders of redeemable participating shares 7,366,821 - - - 7,366,821 7,388,051 - - - 7,388,051
As at 31 January 2013
Butterfield Global Growth Fund
Less than 1 month
GBP
1 to 3 Months
GBP
3 months to 1 year
GBP
No stated Maturity
GBP Total GBP
Liabilities Other liabilities 9,513 - - - 9,513 Net assets attributable to holders of redeemable participating shares 3,339,859 - - - 3,339,859 3,349,372 - - - 3,349,372
Butterfield Sterling Balanced Fund
Less than 1 month
GBP
1 to 3 Months
GBP
3 months to 1 year
GBP
No stated Maturity
GBP Total GBP
Liabilities Other liabilities 1,316,132 - - - 1,316,132 Net assets attributable to holders of redeemable participating shares 22,272,920 - - - 22,272,920 23,589,052 - - - 23,589,052
Butterfield Sterling Income Fund
Less than 1 month
GBP
1 to 3 Months
GBP
3 months to 1 year
GBP
No stated Maturity
GBP Total GBP
Liabilities Other liabilities 28,033 - - - 28,033 Net assets attributable to holders of redeemable participating shares 10,558,006 - - - 10,558,006 10,586,039 - - - 10,586,039
Butterfield UK Growth Fund
Less than 1 month
GBP
1 to 3 Months
GBP
3 months to 1 year
GBP
No stated Maturity
GBP Total GBP
Liabilities Other liabilities 27,452 - - - 27,452 Net assets attributable to holders of redeemable participating shares 10,044,831 - - - 10,044,831 10,072,283 - - - 10,072,283
Butterfield USD Balanced Fund
Less than 1 month
USD
1 to 3 Months
USD
3 months to 1 year
USD
No stated Maturity
USD Total USD
Liabilities Other liabilities 192,805 - - - 192,805 Net assets attributable to holders of redeemable participating shares 4,241,159 - - - 4,241,159 4,433,964 - - - 4,433,964
Credit risk Credit risk is the risk that a company’s counterparty or investment issuer will be unable or unwilling to meet a commitment that it has entered into and cause the company to incur a financial loss. A company will be exposed to settlement risk in respect of parties with whom it trades and custodian risk in respect of the Custodian and its sub-custodians. In managing credit risk, the Investment Manager, on behalf of the Company, seeks to do business with institutions that are well known, financially sound and where appropriate well rated by rating agencies.

Notes to the financial statements (continued) Butterfield Asset Management Funds plc For the year ended 31 January 2014
33
14. Financial instruments and risk management (continued)
Credit risk (continued) Settlement risk: Most transactions in listed securities are settled on delivery versus payment basis (“DVP”) with settlement a few days after execution. Default by the Broker could expose the Company to an adverse price movement in the security between execution and default. Because the Company would only be exposed to a potentially adverse market move (rather than 100% of the principal sum) during a short period, this risk is limited. In addition, default by regulated Brokers in the major markets is rare.
Custodian risk: Custody risk is the risk of loss of assets held in custody. This is not a “primary credit risk” as the unencumbered assets of the Company are segregated from the Custodian’s own assets and the Custodian requires its sub-custodians likewise to segregate non-cash assets. This mitigates custody risk but does not entirely eliminate it. The Custodian has the power to appoint sub-custodians, although, in accordance with the terms of the custodian agreement, the Custodian’s liability shall not be affected by the fact that it has entrusted some or all of the assets in safekeeping to any third party (in order for the Custodian to discharge this responsibility, the Custodian must exercise care and diligence in choosing and appointing a third party as a safe-keeping agent so as to ensure that the third party has and maintains the expertise, competence and standing appropriate to discharge the responsibilities concerned and the Custodian must maintain an appropriate level of supervision over the safe-keeping agent and make appropriate enquiries from time to time to confirm that the obligations of the agent continue to be competently discharged).
Custody and title risk: The Custodian is under a duty to take into custody and to hold the property of each sub-fund of the Company on behalf of its shareholders. The Central Bank of Ireland requires the Custodian to hold legally separately the non-cash assets of each sub-fund and to maintain sufficient records to clearly identify the nature and amount of all assets that it holds, the ownership of each asset and where the documents of title to such assets are physically located. When the Custodian employs a sub-custodian the Custodian retains responsibility for the assets of the sub-fund. However, it should be noted that not all jurisdictions have the same rules and regulations as Ireland regarding the custody of assets and the recognition of the interests of a beneficial owner such as a sub-fund. Therefore, in such jurisdictions, there is a risk that if a sub-custodian becomes bankrupt or insolvent, the sub-fund’s beneficial ownership of the assets held by such sub-custodian may not be recognised and consequently the creditors of the sub-custodian may seek to have recourse to the assets of the sub-fund. In those jurisdictions where the sub-fund’s beneficial ownership of its assets is ultimately recognised, the sub-fund may suffer delay and cost in recovering those assets. The Funds may invest in markets where custodial and/or settlement systems are not fully developed, the assets of a Fund which are traded in such markets and which have been entrusted to sub-custodians, in circumstances where the use of such sub-custodians is necessary, may be exposed to risk in circumstances whereby the Custodian will have no liability.
The Standard & Poor’s credit rating for the Bank of New York, the parent Company of the Custodian, is AA- at the reporting date (31 January 2013: AA-). The Custodian is not rated. 15. Taxation
The Company qualifies as an investment undertaking as defined in Section 739B (1) of the Taxes Consolidation Act, 1997, (the “Taxes Act”) as amended from time to time. Under current Irish law and practice, the Company is not chargeable to Irish tax on its income and gains. However, tax can arise on the happening of a “chargeable event” in the Company. A chargeable event includes any distribution payments to shareholders or any encashment, redemption, cancellation, transfer or deemed disposal (a deemed disposal will occur at the expiration of a relevant period) of shares or the appropriation or cancellation of shares of a shareholder by the Company for the purposes of meeting the amount of tax payable on a gain arising on a transfer.
No tax will arise on the Company in respect of chargeable events in respect of a shareholder who is neither Irish resident nor ordinarily resident in Ireland at the time of the chargeable event provided that a relevant declaration is in place and the Company is not in possession of any information which would reasonably suggest that the information contained therein is no longer materially correct.
Dividends, interest and capital gains (if any) which the Company or any sub-fund receives with respect to their investments (other than securities of Irish issuers) may be subject to taxes, including withholding taxes, in the countries in which the issuers of investments are located. It is anticipated that the Company may not be able to benefit from reduced rates of withholding tax in double taxation agreements between Ireland and such countries. If this position changes in the future and the application of a lower rate results in a repayment to the Company the NAV will not be re-stated and the benefit will be allocated to the existing shareholders rateably at the time of the repayment. Any reclaims due to the sub-funds are accounted for on a receipt basis.
No stamp duty is payable in Ireland on the issue, transfer, repurchase or redemption of shares in the Company. Where any subscription or redemption of shares is satisfied by the in specie transfer of securities, property or other types of assets, Irish stamp duty may arise on the transfer of such assets. No Irish stamp duty will be payable by the Company on the conveyance or transfer of stock or marketable securities provided that the stock or marketable securities in question have not been issued by a company registered in Ireland and provided that the conveyance or transfer does not relate to any immovable property situated in Ireland or any right over or interest in such property or to any stocks or marketable securities of a company (other than a company which is an investment undertaking within the meaning of the Taxes Act) which is registered in Ireland. Further details on tax applicable to the Company can be found in the prospectus. 16. Net asset values
Net asset value Currency 31 January 2014 31 January 2013
Butterfield Global Growth Fund Accumulation Class GBP £3,471,956 £3,339,859 Butterfield Sterling Balanced Fund Accumulation Class GBP £29,152,255 £22,272,920

Notes to the financial statements (continued) Butterfield Asset Management Funds plc For the year ended 31 January 2014
34
16. Net asset values (continued)
Net asset value Currency 31 January 2014 31 January 2013 Butterfield Sterling Income Fund Income Class GBP £9,588,091 £10,558,006 Butterfield UK Growth Fund Income Class GBP £10,516,890 £10,044,831 Butterfield USD Balanced Fund Accumulation Class USD $7,366,821 $4,241,159 Net asset value per share Currency 31 January 2014 31 January 2013
Butterfield Global Growth Fund Accumulation Class GBP £1.1758 £1.0805 Butterfield Sterling Balanced Fund Accumulation Class GBP £1.1060 £1.0479 Butterfield Sterling Income Fund Income Class GBP £0.9851 £0.9990 Butterfield UK Growth Fund Income Class GBP £1.0735 £1.0489 Butterfield USD Balanced Fund Accumulation Class USD $1.1232 $1.0443 17. Distributions
The Directors intend to declare dividends in respect of income classes of shares. Income class shares are shares that distribute net income from time to time, subject to Directors’ discretion, on a distribution date. The amount of any distribution on different share classes of income class shares in a sub-fund may vary to reflect any differing charges and expenses suffered by such share classes. Any such distribution shall be made from net income on a distribution date. Net income includes all interest, dividends and other amounts deemed by the Company to be in the nature of income less the expenses of the sub-fund applicable to that dividend period. The distribution allocated to a shareholder will reflect equalisation account adjustments as described below and will be adjusted for the aggregate of any shares subscribed for and redeemed, including any income equalisation amounts paid upon subscription and redemption.
The Company, with the consent of the Custodian, shall operate such provisions for the equalisation of income as it thinks fit so as to ensure that shareholders participate in income on an equitable basis. Accordingly, the subscription price for shares subscribed for, and the redemption price for any shares redeemed, during that year shall contain an amount called equalisation which represents the proportion of the net income of the sub-fund that has accrued up to the date of subscription/redemption, as appropriate. The amount of equalisation is averaged across all the shareholders of such shares and shall be refunded to such shareholders as part of their distribution.
The share classes for all sub-funds were accepted into the UK Reporting Fund Regime with effect from 26 October 2012. If sufficient net income after expenses is available in the sub-fund, the Directors intend to make a single distribution to income class shareholders of substantially the whole of the net income of the sub-fund.
The following tables shows the distributions charged during the reporting period 31 January 2014:
Butterfield Sterling Income Fund
Class Currency Distribution
per share
Final Distribution
paid
Income received on
subscriptions
Income deducted on redemptions
Net Distribution
charge Ex-date
Income Class GBP £0.0025 £26,420 (£2,153) £4,029 £28,296 01 February 2013 Income Class GBP £0.0059 £61,342 (£3,521) £804 £58,625 01 August 2013 Butterfield UK Growth Fund
Class Currency Distribution
per share
Final Distribution
paid
Income received on
subscriptions
Income deducted on redemptions
Net Distribution
charge Ex-date
Income Class GBP £0.0090 £86,191 (£1,396) £1,865 £86,660 01 February 2013 Income Class GBP £0.0200 £202,356 (£8,677) £5,956 £199,635 01 August 2013 There were no distributions made during the reporting period 31 January 2013. 18. Soft commission arrangements
During the reporting period 31 January 2014, the Investment Manager engaged in soft commission arrangements with two brokers in exchange for equity research; Oppenheimer and Nomura. Other than dealing commission, no amounts were paid to these brokers. This arrangement was in place at the reporting date.

Notes to the financial statements (continued) Butterfield Asset Management Funds plc For the year ended 31 January 2014
35
19. Capital management
The redeemable shares issued by the Company provide a shareholder with the right to require redemption at a value proportionate to the shares in the sub-fund’s net assets on each dealing day and are classified as liabilities. The sub-fund’s objectives in managing the redeemable shares are to ensure a stable base to maximise returns to all investors and to manage liquidity risk arising from redemptions. 20. Segregated liability
The Company was incorporated as an umbrella fund with segregated liability between sub-funds in accordance with the provisions of the Investment Funds, Companies and Miscellaneous Provisions Act, 2005 and as such, as a matter of Irish law the assets of the Company will not be exposed to the liabilities of the Company’s other sub-funds. Each sub-fund of the Company will be responsible for paying its fees and expenses regardless of the level of its profitability. Notwithstanding the foregoing, there can be no assurance that, should an action be brought against the Company in the courts of another jurisdiction, the segregated nature of the sub-funds would necessarily be upheld. 21. Related party disclosures
In accordance with FRS 8 ‘Related Party Disclosures’ the related parties to the Company are outlined below. As per note 6, not all fees are paid directly by the Company so not all fees will be reflected in the profit and loss account.
Investment Manager The Investment Manager was appointed by the Manager to provide investment management services to the Company. The Investment Manager is considered a related party due to Peter Cleavely and Richard Saunders holding positions of significant influence at the Investment Manager, as well as being Directors of the Company. Peter Cleavely is Head of Risk and Compliance and Richard Saunders is Head of European Asset Management at the Investment Manager. Each sub-fund will pay the Investment Manager fees at the rates set out in note 5.
Details of fees charged are outlined below: 31 January 2014 31 January 2013 GBP GBP
Investment management fees 673,418 145,585 The following table details cash balances held with Butterfield Private Bank at the reporting date: 31 January 2014 31 January 2013 GBP GBP Butterfield Sterling Balanced Fund 690,000 - Butterfield Sterling Income Fund 400,000 500,000 Distributor The Investment Manager was appointed by the Manager to promote and market the sale of shares and to use all reasonable endeavours to procure subscribers for shares. The Distributor does not receive a fee in its capacity as a distributor to the Company.
Directors The Directors are also considered to be related parties. The Company pays the Directors annual remuneration for acting as Directors of the Company. Fees charged during the reporting period are as follows:
Director 31 January 2014
EUR 31 January 2013
EUR
Peter Cleavely Waived Waived Richard Saunders Waived Waived Bronwyn Wright 15,000 11,906 John Hamrock 15,000 11,906 Related party shareholder transactions None of the Directors or other related parties held shares in any of the sub-funds of the Company as at the reporting date (31 January 2013: nil). 22. Significant events during the year
There have been no significant events during the year that affect these financial statements. 23. Changes to the prospectus
An updated prospectus dated 11 July 2013 was issued during the reporting period. There were no material changes in the prospectus.

Notes to the financial statements (continued) Butterfield Asset Management Funds plc For the year ended 31 January 2014
36
24. Events after the reporting date
The following table shows the distributions declared following the reporting date: Butterfield Sterling Income Fund
Class Currency Distribution
per share
Final Distribution
paid
Income received on
subscriptions
Income deducted on redemptions
Net Distribution
charge Ex-date Income Class GBP £0.0062 £60,345 (£2,897) £5,468 £62,916 03 February 2014 Butterfield UK Growth Fund
Class Currency Distribution
per share
Final Distribution
paid
Income received on
subscriptions
Income deducted on redemptions
Net Distribution
charge Ex-date
Income Class GBP £0.0175 £171,444 (£3,834) £6,955 £174,565 03 February 2014 25. Approval of the financial statements
The financial statements were authorised for issue by the Board of Directors on 29 May 2014.

Schedule of investments Butterfield Asset Management Funds plc
As at 31 January 2014
37
Butterfield Global Growth Fund Currency
Nominal Holdings
Fair value in GBP % NAV
Financial assets at fair value through profit or loss CIS (*UCITS) Ireland Findlay Park American Fund* USD 7,611 322,014 9.27% HSBC S&P 500 UCITS ETF* USD 54,800 597,079 17.20% iShares S&P 500 UCITS ETF Inc* USD 28,400 307,599 8.86% Polar Capital Funds PLC - Healthcare Opportunities Fund* GBP 10,300 198,790 5.73% Polar Capital Funds PLC - Japan Fund* USD 14,500 147,343 4.24% SPDR S&P US Dividend Aristocrats UCITS ETF* USD 9,600 207,428 5.97% Vanguard FTSE 100 UCTIS ETF* GBP 2,250 68,158 1.96% Veritas Funds PLC - Global Equity Income Fund* GBP 1,063 166,360 4.79% 2,014,771 58.02% Luxembourg MFS Meridian Funds - U.K. Equity Fund* GBP 620 75,088 2.16% Schroder International Selection Fund - Global Energy* GBP 7,800 146,562 4.22% 221,650 6.38% United Kingdom Aberdeen UK ICVC - Aberdeen Asia Pacific Equity Fund* GBP 71,635 132,368 3.81% AXA Framlington UK Select Opportunities Fund* GBP 62,000 77,686 2.24% Cazenove Investment Fund Company - European Fund* GBP 33,000 202,831 5.84% Henderson Global Funds - Global Technology Fund* GBP 19,058 157,001 4.52% M&G Global Dividend Fund* GBP 109,043 174,916 5.04% Morgan Stanley Funds UK - Global Brands Fund* GBP 3,580 152,047 4.38% Schroder Global Emerging Markets Fund* GBP 232,000 116,696 3.36% 1,013,545 29.19%
Total CIS 3,249,966 93.59%
Total financial assets at fair value through profit or loss 3,249,966 93.59% Cash at bank and other net assets 221,990 6.41% Net assets attributable to holders of redeemable participating shares 3,471,956 100.00%
Analysis of total assets % of total assets
UCITS CIS 91.25% Other assets 8.75% 100.00%

Schedule of investments (continued) Butterfield Asset Management Funds plc
As at 31 January 2014
38
Butterfield Sterling Balanced Fund Currency
Nominal Holdings
Fair value in GBP % NAV
Financial assets at fair value through profit or loss CIS (*UCITS) Ireland Findlay Park American Fund* USD 35,133 1,486,405 5.10% J O Hambro Capital Management Umbrella Fund PLC - UK Growth Fund* GBP 480,820 1,409,764 4.84% Polar Capital Funds PLC - Healthcare Opportunities Fund* GBP 65,000 1,254,500 4.30% Polar Capital Funds PLC - Japan Fund* GBP 36,000 601,920 2.06% Vanguard FTSE 100 UCTIS ETF* GBP 43,290 1,311,362 4.50% Veritas Funds PLC - Global Equity Income Fund* GBP 13,695 2,142,782 7.35% 8,206,733 28.15% Luxembourg MFS Meridian Funds - U.K. Equity Fund* GBP 14,411 1,745,344 5.99% Schroder International Selection Fund - Emerging Markets Debt Absolute Return* GBP 51,021 1,222,979 4.20% Schroder International Selection Fund - Global Energy* GBP 44,182 830,180 2.85% 3,798,503 13.04% United Kingdom AXA Framlington UK Select Opportunities Fund* GBP 1,120,306 1,403,743 4.82% Henderson Global Funds - Global Technology Fund* GBP 117,516 968,100 3.32% M&G Global Dividend Fund* GBP 1,169,871 2,245,217 7.70% M&G Investment Funds 3 - Corporate Bond Fund* GBP 2,551,756 971,964 3.33% Marlborough Special Situations Fund* GBP 149,110 1,463,813 5.02% Morgan Stanley Funds UK - Global Brands Fund* GBP 30,196 1,282,553 4.40% Neptune Investment Funds - Income Fund* GBP 1,611,714 1,724,534 5.92% Royal London US Index Tracker Fund* GBP 548,607 922,208 3.16% Schroder Global Emerging Markets Fund* GBP 1,330,000 668,990 2.29% 11,651,122 39.96%
Total CIS 23,656,358 81.15% Debt securities Corporate bond Germany KFW 5.5% 12/7/2015 GBP 431,000 468,007 1.61%
468,007 1.61% Ireland GE Capital UK Funding 4.125% 9/28/2017 GBP 420,000 451,650 1.55% 451,650 1.55% Netherlands Bank Nederlandse Gemeenten 1.875% 12/7/2018 GBP 455,000 450,692 1.55%
450,692 1.55% Supranational European Investment Bank 4.375% 7/8/2015 GBP 693,000 728,931 2.50% 728,931 2.50% United Kingdom Network Rail Infrastructure Finance PLC 4.875% 11/27/2015 GBP 693,000 744,006 2.55% 744,006 2.55%
Total corporate bond 2,843,286 9.76%
Total debt securities 2,843,286 9.76%
Other transferable securities Jersey ETFS Physical Gold/Jersey USD 15,380 1,132,088 3.88%
1,132,088 3.88%
Total financial assets at fair value through profit or loss 27,631,732 94.79%
Cash at bank and other net assets 1,520,523 5.21% Net assets attributable to holders of redeemable participating shares 29,152,255 100.00%

Schedule of investments (continued) Butterfield Asset Management Funds plc
As at 31 January 2014
39
Butterfield Sterling Balanced Fund (continued)
Analysis of total assets % of total assets Transferable securities listed on an official stock exchange or dealt on another regulated market 13.61% UCITS CIS 80.96% Other assets 5.43% 100.00%
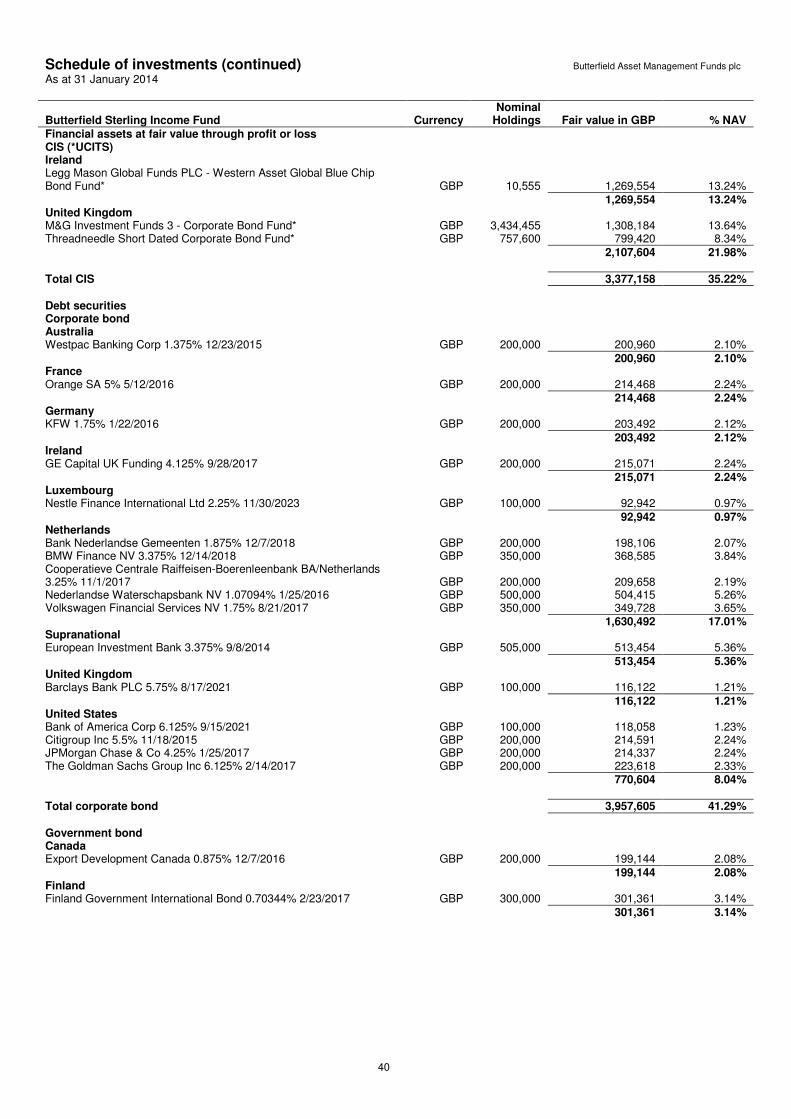
Schedule of investments (continued) Butterfield Asset Management Funds plc
As at 31 January 2014
40
Butterfield Sterling Income Fund Currency
Nominal Holdings Fair value in GBP % NAV
Financial assets at fair value through profit or loss CIS (*UCITS) Ireland Legg Mason Global Funds PLC - Western Asset Global Blue Chip Bond Fund* GBP 10,555 1,269,554 13.24% 1,269,554 13.24% United Kingdom M&G Investment Funds 3 - Corporate Bond Fund* GBP 3,434,455 1,308,184 13.64% Threadneedle Short Dated Corporate Bond Fund* GBP 757,600 799,420 8.34% 2,107,604 21.98%
Total CIS 3,377,158 35.22% Debt securities Corporate bond Australia Westpac Banking Corp 1.375% 12/23/2015 GBP 200,000 200,960 2.10% 200,960 2.10% France Orange SA 5% 5/12/2016 GBP 200,000 214,468 2.24% 214,468 2.24% Germany KFW 1.75% 1/22/2016 GBP 200,000 203,492 2.12%
203,492 2.12% Ireland GE Capital UK Funding 4.125% 9/28/2017 GBP 200,000 215,071 2.24% 215,071 2.24% Luxembourg Nestle Finance International Ltd 2.25% 11/30/2023 GBP 100,000 92,942 0.97% 92,942 0.97% Netherlands Bank Nederlandse Gemeenten 1.875% 12/7/2018 GBP 200,000 198,106 2.07% BMW Finance NV 3.375% 12/14/2018 GBP 350,000 368,585 3.84% Cooperatieve Centrale Raiffeisen-Boerenleenbank BA/Netherlands 3.25% 11/1/2017 GBP 200,000 209,658 2.19% Nederlandse Waterschapsbank NV 1.07094% 1/25/2016 GBP 500,000 504,415 5.26% Volkswagen Financial Services NV 1.75% 8/21/2017 GBP 350,000 349,728 3.65% 1,630,492 17.01% Supranational European Investment Bank 3.375% 9/8/2014 GBP 505,000 513,454 5.36%
513,454 5.36% United Kingdom Barclays Bank PLC 5.75% 8/17/2021 GBP 100,000 116,122 1.21% 116,122 1.21% United States Bank of America Corp 6.125% 9/15/2021 GBP 100,000 118,058 1.23% Citigroup Inc 5.5% 11/18/2015 GBP 200,000 214,591 2.24% JPMorgan Chase & Co 4.25% 1/25/2017 GBP 200,000 214,337 2.24% The Goldman Sachs Group Inc 6.125% 2/14/2017 GBP 200,000 223,618 2.33% 770,604 8.04% Total corporate bond 3,957,605 41.29%
Government bond Canada Export Development Canada 0.875% 12/7/2016 GBP 200,000 199,144 2.08% 199,144 2.08% Finland Finland Government International Bond 0.70344% 2/23/2017 GBP 300,000 301,361 3.14% 301,361 3.14%

Schedule of investments (continued) Butterfield Asset Management Funds plc
As at 31 January 2014
41
Butterfield Sterling Income Fund (continued) Currency
Nominal Holdings Fair value in GBP % NAV
Financial assets at fair value through profit or loss (continued) Debt securities (continued) Government bond (continued) United Kingdom United Kingdom Gilt Inflation Linked 1.25% 11/22/2017 GBP 350,000 504,768 5.26% United Kingdom Gilt Inflation Linked 1.875% 11/22/2022 GBP 350,000 517,995 5.40% 1,022,763 10.66%
Total government bond 1,523,268 15.88%
Total debt securities 5,480,873 57.17%
Total financial assets at fair value through profit or loss 8,858,031 92.39% Cash at bank and other net assets 730,060 7.61% Net assets attributable to holders of redeemable participating shares 9,588,091 100.00% Analysis of total assets % of total assets
Transferable securities listed on an official stock exchange or dealt on another regulated market 57.05% UCITS CIS 35.15% Other assets 7.80% 100.00%

Schedule of investments (continued) Butterfield Asset Management Funds plc
As at 31 January 2014
42
Butterfield UK Growth Fund Currency
Nominal Holdings
Fair value in GBP % NAV
Financial assets at fair value through profit or loss Equities Jersey Petrofac Ltd GBP 14,000 161,700 1.54% Shire PLC GBP 9,250 281,478 2.68% 443,178 4.22% Netherlands Royal Dutch Shell PLC GBP 9,000 189,315 1.80% 189,315 1.80% United Kingdom Alent PLC GBP 35,000 109,795 1.04% AMEC PLC GBP 17,500 180,250 1.71% AstraZeneca PLC GBP 10,750 414,789 3.94% BAE Systems PLC GBP 61,000 261,751 2.49% Barclays PLC GBP 68,750 187,344 1.78% BG Group PLC GBP 24,000 245,280 2.33% BHP Billiton PLC GBP 11,500 206,483 1.96% BP PLC GBP 103,700 495,685 4.71% British American Tobacco PLC GBP 8,870 258,649 2.46% BT Group PLC GBP 56,500 216,565 2.06% Centrica PLC GBP 29,500 91,804 0.87% Compass Group PLC GBP 27,600 251,298 2.39% Croda International PLC GBP 6,000 144,720 1.38% Diageo PLC GBP 14,900 268,275 2.55% Elementis PLC GBP 56,000 143,304 1.36% GlaxoSmithKline PLC GBP 21,350 333,914 3.18% Greene King PLC GBP 29,350 251,676 2.39% HSBC Holdings PLC GBP 103,000 645,809 6.14% Imperial Tobacco Group PLC GBP 12,950 287,879 2.74% London Stock Exchange Group PLC GBP 12,000 220,800 2.10% Old Mutual PLC GBP 90,000 155,250 1.48% Prudential PLC GBP 15,900 195,252 1.86% Reckitt Benckiser Group PLC GBP 6,710 306,177 2.91% Reed Elsevier PLC GBP 27,500 243,925 2.32% Rexam PLC GBP 30,500 150,365 1.43% Rio Tinto PLC GBP 6,700 217,315 2.07% Rolls-Royce Holdings PLC GBP 23,000 273,010 2.60% Royal Dutch Shell PLC GBP 17,900 398,275 3.79% Smith & Nephew PLC GBP 29,850 261,486 2.49% Smiths Group PLC GBP 19,000 273,220 2.60% Standard Chartered PLC GBP 10,800 133,920 1.27% Standard Life PLC GBP 49,000 179,144 1.70% Tesco PLC GBP 80,400 257,561 2.45% The Sage Group PLC GBP 51,730 211,214 2.01% Tullow Oil PLC GBP 19,400 153,357 1.46% Unilever PLC GBP 12,000 280,680 2.67% United Utilities Group PLC GBP 16,500 118,140 1.12% Vodafone Group PLC GBP 201,000 455,365 4.33% 9,479,726 90.14% Total equities 10,112,219 96.16%
CIS (Non-UCITS**) United Kingdom Land Securities Group PLC** GBP 23,500 241,815 2.30% 241,815 2.30%
Total CIS 241,815 2.30%
Total financial assets at fair value through profit or loss 10,354,034 98.46%
Cash at bank and other net assets 162,856 1.54% Net assets attributable to holders of redeemable participating shares 10,516,890 100.00%
Analysis of total assets % of total assets Transferable securities listed on an official stock exchange or dealt on another regulated market 95.94% Non-UCITS CIS 2.29% Other assets 1.77% 100.00%

Schedule of investments (continued) Butterfield Asset Management Funds plc
As at 31 January 2014
43
Butterfield USD Balanced Fund Currency
Nominal Holdings
Fair value in USD % NAV
Financial assets at fair value through profit or loss CIS (*UCITS) Ireland Findlay Park American Fund* USD 10,747 747,259 10.14% HSBC S&P 500 UCITS ETF* USD 44,300 793,247 10.77% iShares S&P 500 UCITS ETF Inc* USD 32,356 575,936 7.82% PIMCO Funds Global Investors Series PLC - Global Investment Grade Credit Fund* USD 22,195 343,138 4.66% Polar Capital Funds PLC - Healthcare Opportunities Fund* GBP 11,700 371,105 5.04% Polar Capital Funds PLC - Japan Fund* USD 16,800 280,560 3.81% SPDR S&P US Dividend Aristocrats UCITS ETF* USD 9,500 337,345 4.58% Veritas Funds PLC - Global Equity Income Fund* GBP 1,691 434,901 5.90% 3,883,491 52.72% Luxembourg Schroder International Selection Fund - Emerging Markets Debt Absolute Return* USD 16,926 318,556 4.32% Schroder International Selection Fund - Global Energy* GBP 7,100 219,250 2.98% 537,806 7.30% United Kingdom AXA Framlington American Growth Fund* GBP 90,142 215,547 2.93% Henderson Global Funds - Global Technology Fund* GBP 19,018 257,481 3.50% Legg Mason Funds ICVC - US Smaller Companies Fund* GBP 40,123 168,806 2.29% M&G Global Dividend Fund* GBP 177,506 559,870 7.60% Morgan Stanley Funds UK - Global Brands Fund* GBP 5,148 359,351 4.88% Schroder Global Emerging Markets Fund* GBP 240,000 198,396 2.69% 1,759,451 23.89%
Total CIS 6,180,748 83.91%
Debt securities Corporate bond Germany KFW 4.125% 10/15/2014 USD 13,000 13,352 0.18% KFW 1.25% 10/26/2015 USD 323,000 326,584 4.43% Landwirtschaftliche Rentenbank 0.875% 9/12/2017 USD 150,000 147,778 2.01% 487,714 6.62% Netherlands Bank Nederlandse Gemeenten 1.375% 3/19/2018 USD 150,000 148,778 2.02% 148,778 2.02% Supranational European Bank for Reconstruction & Development 5% 5/19/2014 USD 10,000 10,139 0.14% European Investment Bank 3.75% 4/15/2015 USD 153,000 159,371 2.16% 169,510 2.30% Total corporate bond 806,002 10.94%
Total debt securities 806,002 10.94% Other transferable securities Jersey ETFS Physical Gold/Jersey USD 2,545 307,869 4.18% 307,869 4.18%
Total financial assets at fair value through profit or loss 7,294,619 99.03% Cash at bank and other net assets 72,202 0.97% Net assets attributable to holders of redeemable participating shares 7,366,821 100.00% Analysis of total assets % of total assets
Transferable securities listed on an official stock exchange or dealt on another regulated market 15.08% UCITS CIS 83.66% Other assets 1.26% 100.00%

Statement of significant portfolio movements (unaudited) Butterfield Asset Management Funds plc
For the year ended 31 January 2014
44
Butterfield Global Growth Fund
Cost Purchases GBP
Findlay Park American Fund 209,744 HSBC S&P 500 UCITS ETF 204,901 iShares S&P 500 UCITS ETF Inc 164,978 Polar Capital Funds PLC - Healthcare Opportunities Fund 147,393 Schroder Global Emerging Markets Fund 140,476 AXA Framlington UK Select Opportunities Fund 78,926 MFS Meridian Funds - U.K. Equity Fund 78,752 Vanguard FTSE 100 UCTIS ETF 70,618 Veritas Funds PLC - Global Equity Income Fund 38,000 Aberdeen UK ICVC - Aberdeen Asia Pacific Equity Fund 35,914 Cazenove Investment Fund Company - European Fund 35,740 SPDR S&P US Dividend Aristocrats UCITS ETF 33,453
Proceeds Sales GBP
Invesco Perpetual UK Investment Series - Income Fund 182,414 iShares S&P 500 UCITS ETF Inc 170,248 Old Mutual Global Investors Series PLC - Healthcare Fund 168,845 M&G Global Dividend Fund 159,816 HSBC S&P 500 UCITS ETF 145,839 Morgan Stanley Funds UK - Global Brands Fund 145,030 Polar Capital Funds PLC - Japan Fund 84,663 Findlay Park American Fund 80,324 Cazenove Investment Fund Company - European Fund 65,508 Absolute Insight Equity Market Neutral Fund 49,645 Aberdeen UK ICVC - Aberdeen Asia Pacific Equity Fund 36,729 Veritas Funds PLC - Global Equity Income Fund 20,923 Henderson Global Funds - Global Technology Fund 20,706 UCITS Notices issued by the Central Bank of Ireland require the top 20 largest purchases and sales to be disclosed, however due to trading volumes, the above details all the purchases and sales during the year.

Statement of significant portfolio movements (unaudited) (continued) Butterfield Asset Management Funds plc
For the year ended 31 January 2014
45
Butterfield Sterling Balanced Fund
Cost Purchases GBP
MFS Meridian Funds - U.K. Equity Fund 1,736,382 Veritas Funds PLC - Global Equity Income Fund 1,491,628 Vanguard FTSE 100 UCTIS ETF 1,360,506 Polar Capital Funds PLC - Healthcare Opportunities Fund 930,150 Schroder International Selection Fund - Emerging Markets Debt Absolute Return 865,557 Schroder Global Emerging Markets Fund 805,315 Schroder International Selection Fund - Emerging Markets Debt Absolute Return 663,023 Neptune Investment Funds - Income Fund 529,110 ETFS Physical Gold/Jersey 510,398 Morgan Stanley Funds UK - Global Brands Fund 501,043 GE Capital UK Funding 4.125% 9/28/2017 455,658 Bank Nederlandse Gemeenten 1.875% 12/7/2018 453,271 AXA Framlington UK Select Opportunities Fund 442,000 Findlay Park American Fund 406,041 Marlborough Special Situations Fund 318,886 M&G Global Dividend Fund 318,304 J O Hambro Capital Management Umbrella Fund PLC - UK Growth Fund 310,247 Schroder International Selection Fund - Global Energy 221,258 Invesco Perpetual UK Investment Series - Income Fund 149,039 Henderson Global Funds - Global Technology Fund 136,609 Proceeds Sales GBP
Invesco Perpetual UK Investment Series - Income Fund 1,845,971 Schroder UK Alpha Plus Fund 1,510,396 Veritas Funds PLC - Global Equity Income Fund 1,057,727 Old Mutual Global Investors Series PLC - Healthcare Fund 907,953 Schroder International Selection Fund - Emerging Markets Debt Absolute Return 663,023 Absolute Insight Equity Market Neutral Fund 386,349 Royal London US Index Tracker Fund 269,280 Findlay Park American Fund 266,336 KFW 5.5% 12/7/2015 369 Network Rail Infrastructure Finance PLC 4.875% 11/27/2015 225 European Investment Bank 4.375% 7/8/2015 215 UCITS Notices issued by the Central Bank of Ireland require the top 20 largest purchases and sales to be disclosed, however due to trading volumes, the above details all the sales during the year.

Statement of significant portfolio movements (unaudited) (continued) Butterfield Asset Management Funds plc
For the year ended 31 January 2014
46
Butterfield Sterling Income Fund
Cost Purchases GBP
Fixed Rate Deposit 1.25% 04/28/2014 400,000 BMW Finance NV 3.375% 12/14/2018 367,850 Volkswagen Financial Services NV 1.75% 8/21/2017 350,350 Finland Government International Bond 0.70344% 2/23/2017 302,550 Cooperatieve Centrale Raiffeisen-Boerenleenbank BA/Netherlands 3.25% 11/1/2017 212,000 KFW 1.75% 1/22/2016 203,700 Bank Nederlandse Gemeenten 1.875% 12/7/2018 203,600 Export Development Canada 0.875% 12/7/2016 199,060 Bank of America Corp 6.125% 9/15/2021 117,180 Barclays Bank PLC 5.75% 8/17/2021 115,100 Nestle Finance International Ltd 2.25% 11/30/2023 91,650 International Bank for Reconstruction & Development 1.25% 12/10/2013 375 KFW 5.375% 1/29/2014 253 Proceeds Sales GBP Bank Nederlandse Gemeenten 2.625% 12/10/2013 1,021,651 International Bank for Reconstruction & Development 1.25% 12/10/2013 960,160 Kommunalbanken AS 2.25% 12/30/2013 606,081 European Investment Bank 2.875% 3/7/2013 505,066 KFW 5.375% 1/29/2014 76,000 European Investment Bank 3.375% 9/8/2014 68 UCITS Notices issued by the Central Bank of Ireland require the top 20 largest purchases and sales to be disclosed, however due to trading volumes, the above details all the purchases and sales during the year.

Statement of significant portfolio movements (unaudited) (continued) Butterfield Asset Management Funds plc
For the year ended 31 January 2014
47
Butterfield UK Growth Fund
Cost Purchases GBP
HSBC Holdings PLC 513,253 Shire PLC 226,440 Royal Dutch Shell PLC 200,982 Standard Chartered PLC 192,296 Standard Life PLC 187,965 Barclays PLC 175,471 Elementis PLC 140,543 Alent PLC 131,750 Compass Group PLC 114,087 Vodafone Group PLC 99,443 Reed Elsevier PLC 90,190 Greene King PLC 85,343 Tullow Oil PLC 73,298 BP PLC 65,376 Imperial Tobacco Group PLC 43,933 Petrofac Ltd 34,798 Diageo PLC 33,019 Reckitt Benckiser Group PLC 24,825 AstraZeneca PLC 24,802 Tesco PLC 20,963 Proceeds Sales GBP
Tullow Oil PLC 302,245 Smith & Nephew PLC 256,080 BG Group PLC 253,090 BT Group PLC 141,605 African Barrick Gold PLC 138,205 GlaxoSmithKline PLC 129,553 Glencore Xstrata PLC 125,483 AstraZeneca PLC 122,221 London Stock Exchange Group PLC 99,539 Prudential PLC 93,307 Croda International PLC 80,236 Rio Tinto PLC 73,991 Old Mutual PLC 63,105 Royal Dutch Shell PLC 62,340 Reckitt Benckiser Group PLC 58,855 BP PLC 55,063 Rexam PLC 49,762 Shire PLC 41,737 Diageo PLC 41,690 Unilever PLC 41,453

Statement of significant portfolio movements (unaudited) (continued) Butterfield Asset Management Funds plc
For the year ended 31 January 2014
48
Butterfield USD Balanced Fund
Cost Purchases USD
HSBC S&P 500 UCITS ETF 575,381 SPDR S&P US Dividend Aristocrats UCITS ETF 308,478 Findlay Park American Fund 286,195 Polar Capital Funds PLC - Healthcare Opportunities Fund 253,935 Schroder International Selection Fund - Emerging Markets Debt Absolute Return 243,516 Schroder Global Emerging Markets Fund 219,666 Veritas Funds PLC - Global Equity Income Fund 201,446 Morgan Stanley Funds UK - Global Brands Fund 184,838 ETFS Physical Gold/Jersey 181,980 M&G Global Dividend Fund 169,619 AXA Framlington American Growth Fund 157,687 Landwirtschaftliche Rentenbank 0.875% 9/12/2017 148,425 Bank Nederlandse Gemeenten 1.375% 3/19/2018 147,900 PIMCO Funds Global Investors Series PLC - Global Investment Grade Credit Fund 130,891 Henderson Global Funds - Global Technology Fund 93,121 Schroder International Selection Fund - Global Energy 89,595 Old Mutual Global Investors Series PLC - Healthcare Fund 67,626 Polar Capital Funds PLC - Japan Fund 48,330 KFW 4.125% 10/15/2014 428 European Investment Bank 3.75% 4/15/2015 423 Proceeds Sales USD
Old Mutual Global Investors Series PLC - Healthcare Fund 233,954 Allianz International Investment Funds - Allianz US Equity Fund 196,265 AXA Framlington American Growth Fund 157,687 Veritas Funds PLC - Global Equity Income Fund 114,813 Absolute Insight Equity Market Neutral Fund 79,200 KFW 4.125% 10/15/2014 74,326 iShares S&P 500 UCITS ETF Inc 74,033 European Bank for Reconstruction & Development 5% 5/19/2014 63,495 International Bank for Reconstruction & Development 3.625% 5/21/2013 54,000 KFW 1.25% 10/26/2015 146 UCITS Notices issued by the Central Bank of Ireland require the top 20 largest purchases and sales to be disclosed, however due to trading volumes, the above details all the sales during the year.

Appendix 1: Underlying Collective investment schemes fees (unaudited) Butterfield Asset Management Funds plc
For the year ended 31 January 2014
49
A UCITS which invests more than 20% of its assets in other CIS must disclose the management fees charged to the underlying CIS. The table below shows the management fee and the total expense ratio (TER) of each CIS held by the Company. Collective Investment Schemes
% NAV
Management Fee Rate
TER
Butterfield Global Growth Fund Findlay Park American Fund 9.27% 1.00% 1.09% HSBC S&P 500 UCITS ETF 17.20% 0.09% 0.09% iShares S&P 500 UCITS ETF Inc 8.86% 0.40% 0.40% Polar Capital Funds PLC - Healthcare Opportunities Fund 5.73% 1.00% 1.24% Polar Capital Funds PLC - Japan Fund 4.24% 1.00% 1.22% SPDR S&P US Dividend Aristocrats UCITS ETF 5.97% 0.35% 0.35% Vanguard FTSE 100 UCTIS ETF 1.96% 0.10% 0.10% Veritas Funds PLC - Global Equity Income Fund 4.79% 0.75% 0.90% MFS Meridian Funds - U.K. Equity Fund 2.16% 0.85% 1.00% Schroder International Selection Fund - Global Energy 4.22% 1.00% 1.29% Aberdeen UK ICVC - Aberdeen Asia Pacific Equity Fund 3.81% 1.00% 1.89% AXA Framlington UK Select Opportunities Fund 2.24% 0.75% 0.80% Cazenove Investment Fund Company - European Fund 5.84% 0.75% 0.85% Henderson Global Funds - Global Technology Fund 4.52% 0.75% 1.03% M&G Global Dividend Fund 5.04% 0.75% 1.01% Morgan Stanley Funds UK - Global Brands Fund 4.38% 0.75% 1.00% Schroder Global Emerging Markets Fund 3.36% 0.75% 0.97%
93.59% Butterfield Sterling Balanced Fund Findlay Park American Fund 5.10% 1.00% 1.09% J O Hambro Capital Management Umbrella Fund PLC - UK Growth Fund 4.84% 0.75% 0.84% Polar Capital Funds PLC - Healthcare Opportunities Fund 4.30% 1.00% 1.24% Polar Capital Funds PLC - Japan Fund 2.06% 1.00% 1.22% Vanguard FTSE 100 UCTIS ETF 4.50% 0.10% 0.10% Veritas Funds PLC - Global Equity Income Fund 7.35% 0.75% 0.90% MFS Meridian Funds - U.K. Equity Fund 5.99% 0.85% 1.00% Schroder International Selection Fund - Emerging Markets Debt Absolute Return 4.20% 0.90% 1.22% Schroder International Selection Fund - Global Energy 2.85% 1.00% 1.29% AXA Framlington UK Select Opportunities Fund 4.82% 0.75% 0.80% Henderson Global Funds - Global Technology Fund 3.32% 0.75% 1.03% M&G Global Dividend Fund 7.70% 0.75% 1.01% M&G Investment Funds 3 - Corporate Bond Fund 3.33% 0.50% 0.66% Marlborough Special Situations Fund 5.02% 1.50% 1.51% Morgan Stanley Funds UK - Global Brands Fund 4.40% 0.75% 1.00% Neptune Investment Funds - Income Fund 5.92% 0.75% 0.80% Royal London US Index Tracker Fund 3.16% 0.20% 0.23% Schroder Global Emerging Markets Fund 2.29% 0.75% 0.97%
81.15% Butterfield Sterling Income Fund Legg Mason Global Funds PLC - Western Asset Global Blue Chip Bond Fund 13.24% 0.35% 0.51% M&G Investment Funds 3 - Corporate Bond Fund 13.64% 0.50% 0.66% Threadneedle Short Dated Corporate Bond Fund 8.34% 0.40% 0.50%
35.22% Butterfield USD Balanced Fund Findlay Park American Fund 10.14% 1.00% 1.09% HSBC S&P 500 UCITS ETF 10.77% 0.09% 0.09% iShares S&P 500 UCITS ETF Inc 7.82% 0.40% 0.40% PIMCO Funds Global Investors Series PLC - Global Investment Grade Credit Fund 4.66% 0.49% 0.49% Polar Capital Funds PLC - Healthcare Opportunities Fund 5.04% 1.00% 1.24% Polar Capital Funds PLC - Japan Fund 3.81% 1.00% 1.22% SPDR S&P US Dividend Aristocrats UCITS ETF 4.58% 0.35% 0.35% Veritas Funds PLC - Global Equity Income Fund 5.90% 0.75% 0.90% Schroder International Selection Fund - Emerging Markets Debt Absolute Return 4.32% 0.90% 1.22% Schroder International Selection Fund - Global Energy 2.98% 1.00% 1.29% AXA Framlington American Growth Fund 2.93% 0.75% 0.79% Henderson Global Funds - Global Technology Fund 3.50% 0.75% 1.03% Legg Mason Funds ICVC - US Smaller Companies Fund 2.29% 1.00% 1.25% M&G Global Dividend Fund 7.60% 0.75% 1.01% Morgan Stanley Funds UK - Global Brands Fund 4.88% 0.75% 1.00% Schroder Global Emerging Markets Fund 2.69% 0.75% 0.97% 83.91% 1.00% 1.09%