annual report and accounts - … · (dft) plays a pivotal role in promoting the growth of the uk...
TRANSCRIPT

Annual Report and Accounts 2016-17

Department for Transport
Annual Report and Accounts 2016-17
(For the year ended 31 March 2017)
Accounts presented to the House of Commons pursuant to Section 6(4) of the Government Resources and Accounts Act 2000
Annual Report presented to the House of Commons by Command of Her Majesty
Ordered by the House of Commons to be printed on 19 July 2017
HC9

This is part of a series of departmental publications which, along with the Main Estimates 2016-17 and the document Public Expenditure: Statistical Analyses 2016, present the Government’s outturn for 2016-17 and planned expenditure for 2017-18.
© Crown copyright 2017
This publication is licensed under the terms of the Open Government Licence v3.0 except where otherwise stated. To view this licence, visit nationalarchives.gov.uk/doc/open-government-licence/version/3 or write to the Information Policy Team, The National Archives, Kew, London TW9 4DU, or email: [email protected].
Where we have identified any third party copyright information you will need to obtain permission from the copyright holders concerned.
This publication is available at www.gov.uk/government/publications
Any enquiries regarding this publication should be sent to us at https://forms.dft.gov.uk/contact-dft-and-agencies/
Print ISBN 9781474144377 Web ISBN 9781474144384
ID P002877051 07/17
Printed on paper containing 75% recycled fibre content minimum
Printed in the UK by the Williams Lea Group on behalf of the Controller of Her Majesty’s Stationery Office

Contents
Foreword by the Secretary of State 4
Foreword by the Permanent Secretary 5
Performance Report 6
1. How we have performed 7
Our purpose 7Overview 8How we have performed 9Boosting economic growth and opportunity 10Building a One Nation Britain 16Improving journeys 17Safe, secure and sustainable transport 19Other corporate reporting 26Climate change, sustainability and the environment 27
The Accountability Report 39
Report from the Lead Non-Executive Board Member 40
2. The Directors’ Report 41
How we were structured in 2016-17 41Register of interests 47Personal data related incidents 47Auditors 47Statement of Accounting Officer’s Responsibilities 48Statement regarding the disclosure of information to the auditors 49
3. The Governance Statement 50
Introduction 50Corporate governance, management and controls 50Financial governance, management and controls 62Assurance 65Conclusion 69
4. Remuneration and Staff Report 70
Introduction 70Talent and Succession 71Employee Policy 73Remuneration policy – Senior Civil Service 74Remuneration and pension entitlements 76Pay multiples 86Non-Executive Board Members 86Staff costs and numbers (Departmental Group including delivery bodies) 87Recruitment practice 91Expenditure on consultancy, temporary and off-payroll staff 92Exit packages 97
5. Parliamentary accountability and audit report 98
Statement of Parliamentary Supply 98Long term expenditure trends 109Financial performance 111Parliamentary accountability disclosures 115Fees and charges information 118Remote contingent liabilities 119The certificate and report of the Comptroller and Auditor General to the House of Commons 121
Financial Statements 123
6. Financial Statements 124
Group Statement of ComprehensiveNet Expenditure 124Group Statement of Financial Position 125Group Statement of Cash Flows 127Group Statement of Changes in Taxpayers’ Equity 130Notes to the Financial Statements 135
Annexes 229Total departmental spending, 2012-13 to 2019-20 230
Annual Report and Accounts 2016-17 3

Foreword by the Secretary of State
I am delighted to be introducing the DfT’s Annual Report after my first full year as Secretary of State.
The DfT’s aim should always be to put passengers and users at the heart of everything it does. Over the course of 2016-17 we have made some significant achievements which go towards improving our country’s transport network including some landmark moments.
We have announced our support for new airport capacity in the South-East, confirming our preference for a new runway at London Heathrow airport, and launching a public consultation on a draft National Policy Statement. Our plans for new high speed rail routes to provide much needed capacity and improvements in journey times took a leap forward when Parliament passed the legislation to build the first phase of HS2 between London and Birmingham.
The importance of good local transport infrastructure is fundamental to supporting local economies and we are continuing to invest heavily. We saw the completion of the Midland Metro tram extension to Birmingham New Street and the opening of a new bus station in Accrington, part of the Pennine Reach bus improvement package as just two examples. The March 2017 Budget is providing a further £690 million for tackling congestion.
We continue to invest to improve our motorways and major highways. The completion of the A160/A180 Port of Immingham scheme will provide an improved link to the port, supporting economic growth.
Improving safety on our roads is also a priority and we have doubled the penalties to deter drivers from using mobile phones at the wheel.
The Maritime sector contributes about £13.5 billion to our economy and employs over 110,000 people. We have been working with the sector to attract maritime businesses to the UK’s shores, and to support the best and the brightest reach their potential in maritime careers. There has been a significant increase in vessels on the UK Ship Register in the last two years – a trend we would like to see continue.
We are delivering improvements to our rail network at pace with new franchise agreements, significant investment in infrastructure and the completion of Crossrail clearly in sight.
Looking ahead the Department is preparing well for a structured departure from the European Union. I would like to thank my ministerial team and everyone in the DfT group for their hard work and commitment over the past year – and I look forward to achieving more together in the year ahead.
Rt Hon Chris Grayling MPSecretary of State for Transport
Annual Report and Accounts 2016-174

Foreword by the Permanent Secretary
The Annual Report and Accounts sets out what the Department and its delivery bodies have achieved over the past year with the money allocated by Parliament, as well as providing an overview of how we are organised and governed.
Last year we continued to deliver the Government’s ambitious plans for investing in national infrastructure and delivering high quality services for the public. Significant milestones have been achieved on HS2 including Royal Assent for the Phase 1, London to Birmingham, Hybrid Bill and we have been taking forward the work on airport capacity with a major public consultation on a draft Airports National Policy Statement.
We also worked with our delivery partners Network Rail and Highways England to deliver a major rail and road investment programme including the installation of the Ordsall Chord rail bridge and completing upgrades to the M1 Junction 19.
Our Executive Agencies DVLA, DVSA, VCA and MCA continue to ensure the services they provide the public are relevant to today’s world. This was the first full year of the MCA operating the new British-built search and rescue helicopters and the DVSA and VCA established a Market Surveillance Unit to check that vehicles on UK roads comply with legislative standards.
Looking ahead we will continue to lead the way in developing new technology such as autonomous vehicles and our digital railway programme. We will continue to deliver the Government’s priorities for transport and supporting the country as we leave the European Union.
Ensuring that we and the transport sector have the right skills and capabilities now and for the future is a key management focus.
The Department is working with industry partners to deliver 30,000 apprenticeships in roads and rail over the 5 years to 2020. Delivering a highly skilled workforce is vital if we are to deliver the substantial investments in our rail, roads and local transport.
Recently, the DfT has been recognised for its leadership on workplace gender equality by being included in The Times Top 50 Employers for Women 2017. DfT’s inclusion is recognition of our commitment to make the Department a great place to work, through our culture of equality and inclusivity and the great strides we have made to raise the number of women in senior positions.
During 2016-17 we have introduced a number of new schemes to help develop and grow our own workforce. The chapter on our people sets out the progress we have made over the year to build a strong and capable workforce.
Since becoming Permanent Secretary in April 2017, I have met many people from across the DfT and its agencies and delivery partners and have been greatly impressed by the skills and professionalism of our people and what they do to support the transport industry. I would like to thank everyone for all that we have achieved over the past year. As we look ahead to 2017-18 I am confident we have strong and capable teams to take the Government’s agenda forward.
Bernadette KellyPermanent Secretary
Annual Report and Accounts 2016-17 5

Performance Report

1. How we have performed
Our purpose1.1 The Department for Transport (DfT) plays a pivotal role in promoting the growth of the UK economy by planning and delivering excellent transport infrastructure; enabling people, goods and services to be transported efficiently; and supporting investment and employment. The Government is investing to make journeys better, simpler, faster and more reliable. Our plan will support jobs, enable business growth, and bring our country closer together.
What we do1.2 The Department works with its agencies and partners to support the transport network and invest in transport infrastructure, including:
» providing policy, guidance, and funding to English local authorities to help them run and maintain their road networks, improve passenger and freight travel, and develop new major transport schemes;
» investing in, maintaining and operating around 4,300 miles of the motorway and trunk road network in England through Highways England;
» setting the strategic direction for the rail industry in England and Wales – funding investment in infrastructure through Network Rail, awarding and managing rail franchises, and regulating rail fares;
» improving English bus services through funding and regulation;
» working to make our roads less congested and polluted by promoting lower carbon transport, including cycling and walking;
» encouraging use of new technology such as smart ticketing and ultra low emission vehicles;
» maintaining high standards of safety and security in transport;
» leading maritime and ports policy in areas such as safety and security, environment, growth, skills, as well as supporting port development and connectivity; and
» setting national aviation policy, working with airlines, airports, the Civil Aviation Authority and NATS (the UK’s air traffic service).
Annual Report and Accounts 2016-17 7

Overview
Transport in numbers
Transport, and the transport sector, remain an essential part of Britain’s economy.
Transport usage has been growing...
1.7 billionrail passenger journeys in Great Britain in 2016-17; numbers have more than doubled since privatisation in 1994-95.
268 million terminal passengers at UK airports in 2016, the sixth successive year of growth, taking numbers to new record levels.
324 billionvehicle miles travelled on Great Britain’s roads in 2016, a new record high.
...and we are delivering improvements, including:
50+local authorities being supported to boost cycling and walking up to 2020 through DfT’s Access Fund.
5,000+
new train vehicles will be delivered into service between now and 2021.
286additional lane miles from Smart Motorway schemes are planned for delivery by 2020.
3 millionroad goods vehicles travelled from Great Britain to mainland Europe in 2016-17, a record high.
44%
23%
21%
5%4% 3%
1.6mUK people
employed in transport
Land transport
Warehousing, storage &support activities for transportation
Postal & Courier
AirRail Water Source: Labour Force
Survey, Oct-Dec 2016
34%
24%
£74bntransport
contribution to economic output
(GVA)
Rail
Postal & Courier
Warehousing, storage & support activities for transportation
Air
Water
Land transport
14%
12%
10%
Source: ONS National Accounts, 2016
7%
Annual Report and Accounts 2016-178

How we have performed1.3 The Department has published a Single Department Plan (SDP) which details what we will deliver up to the year 2020. The SDP sets out four strategic objectives (Figure 1), and contains a range of indicators that will allow the Department’s progress against the objectives to be monitored.
1.4 The following sections set out how the Department is performing, and reports progress for each indicator as at the end of March 2017. Further information and updates on the SDP and indicators is published at: www.gov.uk/government/publications/dft-single-departmental-plan-2015-to-2020
Figure 1: DfT’s strategic objectives
Strategic Objective 1Boosting economic growth and opportunity
Investing in infrastructure
Supporting the UK transport sector
Getting the regulatory framework right
Strategic Objective 2Building a One Nation Britain
Rebalancing the economy
Devolving powers
Keeping transport affordable and accessible to all
Strategic Objective 3Improving journeys
Enhancing and maintaining
Technology and innovation
Strategic Objective 4Safe, secure and sustainable transport
Ensuring safety
Maintaining and improving security
Protecting the environment and public health
£
Annual Report and Accounts 2016-17 9
Performance Report How we have performed

Boosting economic growth and opportunity1.5 Modern transport infrastructure is essential to ensuring that the UK remains a competitive and strong economy. The Government plans to invest over £78 billion between 2016-17 and 2020-21, an increase of around 50% compared to the period 2010-15. This will fund upgrades to our railway network, the remainder of the first Road Investment Strategy, improvements to local transport networks, and take forward a number of major capital programmes including HS2, Thameslink and Crossrail to ensure business, communities and individuals have access to the transport networks they need.
Investing in infrastructure1.6 The Department’s Road Investment Strategy (RIS), which is delivered by Highways England, sets out how the Department will invest £15 billion in the UK’s strategic road network by 2021. As part of this commitment the Department invested £2 billion in major schemes and renewals during 2016-17. A further £1 billion was spent operating the network (including maintenance and on-road operations). During 2016-17 we have:
» started a £1.5 billion upgrade of the A14;
» announced the preferred route for a new Lower Thames Crossing; and
» completed important upgrades to the strategic road network, including M1 Junction 19 (Midlands), A556 Knutsford to Bowdon (North West) and A1 Coalhouse to Metro Centre (North East).
1.7 The National Audit Office report Progress with the Road Investment Strategy found that the first RIS represents a significant improvement in the efficient management of the strategic road network, whilst also noting that this is a large-scale and challenging programme, which involves a step-change in what is required of Highways England.1 It also noted that a significant number of the major enhancement projects contained in the Strategy are scheduled to start in 2019-20, which may cause a high level of disruption to the road network, increase prices and put pressure on resources at Highways England. The Department is considering the findings of the report and is working with Highways England to get best value for money for the tax payer.
1 www.nao.org.uk/report/progress-with-the-road-investment-strategy/
Annual Report and Accounts 2016-1710

Summary of Resource and Capital Outturn 2016-17
DepartmentalTotal£12690m
Tolledcrossings(£94m) LocalAuthority
Transport£1,886m
FundingofALBs1(net)£573m
Otherrailways£512m
Sustainabletravel£304m
Bussubsidies&concessionaryfares
£255m
GLAtransportgrants
£1,220m
Aviation,maritime,securityandsafety
£50mMaritime&CoastguardAgency
£328m
Motoringagencies£96m
Science,researchandsupportfunctions£48m
Centraladministration
£208mIncome from PassengerRailServices(£1,289m)
HighSpeedTwo£450m
TransportDevelopmentFund£14m
NetworkRail£12,841m
HighwaysEngland£4,256m
DepartmentForTransport£21,659m
1.Consisting ofHS2Ltd,BTPA/BTP,TransoprtFocusandtheAirTravelTrustFund.
Resource Capital AME
Note: Red outline denotes net income
2. The circles are not in ratio but are illustrative of the size of spend.
Annual R
eport and Accounts 2016-17
11
Perform
ance Report
How
we have perform
ed

1.8 During 2016-17 the Department, together with Network Rail, has continued to make progress in delivering the recommendations of the Hendy review. This review, undertaken by the Chair of Network Rail last year, considered which rail projects would be undertaken in the current investment period (Control Period 5 2014-2019) following affordability and deliverability challenge in some schemes. Improvements made on the rail network this year include:
» installing the world’s first asymmetrical network arch rail bridge as part of the Ordsall Chord project in Manchester. The bridge represents an important milestone in improving the rail network that will enable new direct rail services from the North East to Manchester Airport; and
» introducing the new Thameslink trains between Bedford and Brighton, the Wimbledon loop and on routes into Kent as part of the Thameslink programme. The new trains will increase capacity and passenger comfort, and are lighter reducing long term impacts on the infrastructure. The Department worked closely with the industry to resolve some technical issues with this new generation of trains.
1.9 In 2016-17 several important HS2 milestones were achieved which will enable work to progress towards construction. These include:
» awarding the enabling works contracts worth a total of £900 million and covering three sections of the Phase 1 route from London to Birmingham;
» announcing the route for Phase 2b of HS2 (Crewe to Manchester and West Midlands to Leeds); and
» achieving Royal Assent for the HS2 Phase 1 Hybrid Bill, which provides the powers to assemble land required for the construction of the Phase’s route and stations.
1.10 Aviation is important to building a strong economy. The Department has led a number of projects to grow the sector and support economic growth. During 2016-17 we have:
» responded to the Airport Commission’s final report with the Government announcing support for a new North-West runway at London Heathrow as our preferred scheme for delivering additional airport capacity in the South-East of England. A consultation on a draft Airports National Policy Statement (NPS) was launched in February 2017 and closed on 25 May 2017;
» in parallel to the NPS consultation, we have undertaken work to consider potential delivery plans with Heathrow Airport Limited and other delivery organisations in order that the scheme and surface access arrangements can be delivered in a timely way if the NPS is approved and subsequently designated; and
» announced planning approval for a £344 million expansion of London City Airport.
Annual Report and Accounts 2016-1712

Supporting the UK transport sector1.11 The Department published its Transport Infrastructure Skills Strategy in January 2016 as a response to the risks to our investment programme from skills shortages and gaps.2 The strategy sets stretching ambitions for the creation of new apprenticeships and recognises the need to promote transport as a career to young people. In April 2016 we established the Strategic Transport Apprenticeship Taskforce (STAT) to deliver the skills strategy. Original members include Highways England, Network Rail, Crossrail, Transport for London, the Rail Delivery Group and the Trades Union Congress.
1.12 Progress is already being made to deliver the strategy’s targets. Some 2,000 new apprenticeships have been created, exceeding the Taskforce’s original forecast. The Department is expecting a significant increase in the number of apprentices in the coming years as new contracts with suppliers take effect and the apprentice levy becomes more widely used.
2 You can find more information here: https://www.gov.uk/government/publications/transport-infrastructureskills-strategy-building-sustainable-skills
1.13 The Taskforce is working to promote the apprenticeship agenda more widely across the transport sector. Both Heathrow Airport Ltd and the freight industry (through the former senior traffic commissioner) have joined the Taskforce. Work is also underway with the maritime and ports sector. Initial analysis indicated the potential of an additional 25,000 apprenticeships.
1.14 The Department continued to work with the aviation industry to maximise the opportunities to grow the UK’s aviation market, including:
» agreeing new routes to Costa Rica, Iceland, India, Peru, California, Chile, Sri Lanka and Iran and signing new bilateral deals with China and India to allow more flights between our countries;
» Manchester Airport announcing new long-haul routes to Texas, China and Singapore and London Stansted deciding to invest in a new arrivals terminal, reflecting growth and confidence in the sector; and
Annual Report and Accounts 2016-17 13
Performance Report How we have performed

» publishing a consultation in February 2017 on a new policy framework to support the modernisation of our airspace.
1.15 The UK maritime sector makes an important contribution to the UK’s economy. The UK is seen as the world’s most important maritime centre. The Department is working in partnership with the maritime industry to maintain and enhance this vital sector. During 2016-17 we have:
» completed analysis on future UK seafarer needs and support for maritime training and apprenticeships;
» supported Maritime UK’s first overseas trade mission to China working closely with the Department for International Trade; and
» focused on greater commercialisation of the UK Ship Register with key appointments in place to drive further growth. The register has grown by 9% between April 2015 and March 2017.
On 3 September 2016 – Merchant Navy Day – the Shipping Minister, the Rt Hon John Hayes MP, announced the first recipients of the new Merchant Navy Medal for Meritorious Service. This first year saw 14 recipients awarded the medal for a range of meritorious service, from leading the way on international safety standards to the harrowing work rescuing distressed migrants at sea. The medals were presented by HRH The Princess Royal at a ceremony at Trinity House on 15 November 2016.
Annual Report and Accounts 2016-1714

Getting the regulatory framework right1.16 A focus of the Department has been on ensuring the regulatory framework for transport in the UK helps business to take advantage of new opportunities and technology. During 2016-17 DfT and its agencies have conducted 86 public consultation exercises,3 including:
» benefits of drones to the UK economy;
» modernising the licensing framework for air traffic services; and
» updating the in-service exhaust emission standards for road vehicles.
1.17 The Department has undertaken a rolling programme of post-implementation reviews so that it can check that regulations affecting business are working. It also makes use of alternatives to regulation where possible, for example through awareness campaigns about drink and drug driving, and vulnerable road users.
3 Details about DfT’s public consultation including their current status can be found at: https://www.gov.uk/government/publications?keywords=&publication_filter_option=consultations&topics%5B%5D=all&departments%5B%5D=department-for-transport&official_document_status=all&world_locations%5B%5D=all&from_date=&to_date=
1.18 For the first time, in response to strong feedback from business, independent regulators will be under a legal obligation to assess and report on the impacts of their actions on business. For transport, this will bring the Civil Aviation Authority, the Office of Rail and Road and the General Lighthouse Authorities within scope of the Better Regulation Framework.
1.19 A small and micro business assessment is carried out for all proposals with gross costs to business of over £1 million in any one year to reduce regulatory burdens on these businesses where possible.
1.20 In April 2016, DfT published its first statutory review and it continues to conduct these as outlined in Reviewing Regulation: Setting out DfT’s commitments.4
4 www.gov.uk/government/publications/reviewing-regulation-setting-out-dfts-commitments
Annual Report and Accounts 2016-17 15
Performance Report How we have performed

Building a One Nation Britain1.21 Transport investment and improved connectivity is key to unlocking the potential of all cities, regions and rural areas. The Department is committed to working with other government departments and agencies to ensure that every part of Britain benefits from a growing economy.
Rebalancing the economy1.22 The Department has continued to work to ensure that transport investment benefits every region. In the past 12 months we have:
» supported air travel from small airports either directly or by providing financial support for several routes, such as London Stansted to Dundee;
» announced a £2 billion investment in the South-West, including work to upgrade the A303 and improving the link between the M3 and M5;
» completed the first phase of upgrades on the Calder Valley rail line between Manchester and Leeds; and
» contributed funding to 12 Local Authority led major road schemes which opened during 2016-17 and allocated £1.3 billion to local highway authorities for maintaining the local road network in England outside London.5
5 Including Heysham to M6 Link Road (North West); Midland Metro Birmingham City Centre Extension (Midlands); South Bristol Link (South West); and Morpeth Northern Bypass (North East).
Devolving Powers1.23 During 2016-17 the Department has worked to establish new bodies to ensure regions have both the voice and powers to help deliver the transport priorities and investment they need. These organisations are taking on increasing levels of responsibility. During 2016-17:
» Transport for the North (TfN) continued its preparations to receive statutory powers in 2017;
» Midlands Connect published their strategy ‘Powering the Midlands Engine’; and
» England’s Economic Heartland worked with the Department to develop a transport strategy for the Cambridge-Milton Keynes-Oxford corridor.
Keeping transport affordable and accessible to all1.24 The Department has worked to ensure that transport is affordable to all. Since 2014 the Department has frozen average regulated rail fares in real terms and since 2015 individual regulated rail fares have also been frozen in real terms. During 2016-17 we took further steps to improve options for passengers including:
» the introduction of the ‘Delay Repay 15’ scheme which allows passengers to claim compensation when trains are more than 15 minutes late. The scheme is currently available to Southern rail passengers but will be included in all future franchise competitions; and
» investing £80 million to ensure every passenger has the choice of travelling by rail with a smart ticket by the end of 2018.
Annual Report and Accounts 2016-1716

Improving journeys1.25 Ensuring we have the most efficient transport network and services is not only important to the economic wealth of the country but also important to ensuring that people can make the best use of their time, travel is affordable and that everyone can access the transport network. We need to continue to put people at the heart of the transport system.
Enhancing and maintaining1.26 The Department awarded three rail franchises during 2016-17, for East Anglia, South Western and West Midlands, as well as a Direct Award on Cross Country. These new franchises will deliver a range of improvements for passengers, including:
» new services for example London to Norwich in 90 minutes and Ipswich in 60 minutes;
» increased capacity with 52,000 extra seats daily in and out of London Waterloo;
» new trains including a fleet of 90 new trains on South Western route; and
» free Wi-Fi on trains and at stations for passengers.
1.27 The growth in passenger numbers over the last twenty years has resulted in increased demand on the rail network and train services. To keep up with this growing demand, the Department is leading a large programme of enhancements across the country, with Network Rail delivering these improvements. The programme of enhancements is essential to ensure the long term reliability, performance and capacity of the network to meet the growing passenger numbers. The scale of this programme of
work does have an impact on passengers, who have experienced disruptions to their journeys while the upgrades to their routes take place. We work closely with Network Rail to minimise the disruption as far as possible and with the Train Operating Companies to ensure passengers are notified in advance of when work will be taking place.
1.28 Network Rail is improving its planning and management of engineering works on the rail network to minimize the impact on passengers. Over the Christmas period 2016-17 Network Rail completed 200 projects with a team of 24,000 and returned 98.5% of the engineering possessions on time.
1.29 An extended series of strikes on Southern Railways caused significant and prolonged disruption to Southern passengers, particularly around the Christmas period. While the disputes are for unions and the train operators to resolve, the Government has made continued efforts to ensure performance on Southern improves. The Secretary of State commissioned Chris Gibb to provide advice on how to deliver improvements to train services across the Govia Thameslink Railway (GTR) franchise, the train operator for Southern services. Chris Gibb’s report sets out the root causes of the disruptions and his assessment and recommendations of the best means of addressing these factors now and for the future. Work is already underway to deliver on the recommendations of the report, including £300 million for Network Rail to improve rail infrastructure and resilience along the Southern and Thameslink rail networks.
Annual Report and Accounts 2016-17 17
Performance Report How we have performed

1.30 The Department is undertaking long term planning to ensure the strategic road network can meet future demand. The Department is investing more than £100 million in six strategic road studies to address some of the country’s most longstanding roads challenges, including connections across the Pennines and congestion around Manchester and London.
1.31 We are also continuing to develop a longer term alternative to Operation Stack (queuing HGVs on sections of the M20) for dealing with the impacts that disruption to cross-Channel services (ferry and rail) has on the road network in Kent.
1.32 The Department continues to work with the aviation industry on ways to improve the passenger experience. An important part of this is ensuring that passengers get the protection they need when things go wrong. In the last year we consulted on reforms to modernise the Air Travel Organisers’ Licence (ATOL) holiday financial protection scheme and published our consultation response in January 2017.
Technology and innovation1.33 Connected and automated vehicle (CAV) technology could transform the way we travel by road, encourage new business models as well as offer new industrial opportunities. The joint DfT and Department for Business, Energy and Industrial Strategy (BEIS) policy unit, the Centre for Connected and Autonomous Vehicles (CCAV) was created in 2015 to help the UK take advantage of this new technology. During 2016-17 we have:
Figure 2: National Road Users Satisfaction Survey – journey satisfaction score* England
60
70
80
90
100 92%
90%
93%
87%
63%
Safety
Upkeep
Information
JourneyTime
Roadworksmanagement
2012-13
*Satisfaction score is a composite measure of satisfaction with journey time, roadworks management, upkeep, information provision and safety on motorways and trunk roads
2013-14 2014-15
% very or fairly satisfied with thefollowing on their last journey,2016-17
2015-16 2016-17
Sat
isfa
ctio
n sc
ore
Annual Report and Accounts 2016-1718

» continued to establish the UK as a ‘world leader’ for CAV cyber security;
» prepared legislative measures to introduce automated vehicle insurance;
» explored the potential benefits for the UK from “Mobility as a Service”;6 and
» provided grant funding to strengthen the UK’s testing ecosystem for CAVs and funded over 40 ‘world leading’ proposals for CAV technology from the Intelligent Mobility Fund.7
1.34 With the help of the plug-in car grant, in 2016 more electric cars were sold in the UK than any other country in the EU.8 Recently, total uptake of electric cars passed the milestone of 100,000 vehicles.
1.35 The UK’s network of electric vehicle chargepoints also continues to grow and in 2016-17 the Office for Low Emission Vehicles launched new schemes for charging on residential streets and at workplaces. Highways England is developing a programme to support the uptake of electric cars by installing rapid chargepoints every 20 miles along 95% of the strategic road network. In addition, an initial network of 12 hydrogen refueling stations was completed with the Department’s support. These stations will support the introduction of hydrogen fuel cell electric vehicles.
6 https://ts.catapult.org.uk/intelligent-mobility/ im-resources/maasreport/
7 Funding provided by BEIS.8 Includes battery electric cars, plug-in hybrid electric
cars, and fuel cell electric cars.
Safe, secure and sustainable transportEnsuring safety1.36 Britain continues to have some of the safest roads in the world but we are determined to do more. Since 2006 the numbers killed or seriously injured on roads in Britain have reduced by 21%. During 2016-17 we have:
» announced a new ‘Safer Roads Fund’ to target £175 million on improving the safety of 50 of England’s most dangerous local A-road sections where the risk of collisions causing death and serious injury is highest. The fund spans four financial years from 2017-18;
» doubled the number of fixed penalty points and the fine for using a hand-held mobile phone when driving. This measure means that drivers risk being banned quicker than before and novice drivers (within two years of passing their test) face having their licences revoked after a single offence if they are caught using a hand-held phone at the wheel;
» piloted a new practical driving test to better reflect real life driving situations; and
» continued to work with police to ensure the new drug driving offence is enforced.Early analysis suggests the new offence has been a success, with arrests and convictions having increased since its introduction.
1.37 The UK Search and Rescue Helicopter Programme (UKSARH) had a successful 2016-17. It was the first full year of operation using over 20 brand new state-of-the-art aircraft, including the British-built
Annual Report and Accounts 2016-17 19
Performance Report How we have performed

AgustaWestland AW189 helicopter. The helicopters are tasked and coordinated from the new Aeronautical Rescue Coordination Centre based at the Coastguard’s National Maritime Operations Centre in Hampshire. During 2016-17 the UKSARH conducted over 2,500 missions and rescued or assisted over 1,900 people.
Maintaining and improving security1.38 The UK has extensive expertise on aviation safety and security. We have continued to work closely with the Civil Aviation Authority to ensure that the regulatory framework is used to keep passengers safe. We have also continued to take a leading role in global aviation security, helping to export some of this expertise to other countries. In September 2016, we negotiated the first ever UN Security Council resolution on aviation security, securing agreement that countries need to work with the International Civil Aviation Organisation (ICAO) to confront the terrorist threat, with all the global co-operation, training and technical assistance available to us.
1.39 The Government’s National Cyber Security Strategy was published in
2016 setting out the importance of the UK effectively managing its cyber risks. To support this work the Department established a Cyber Security Team to:
» understand the cyber threat that the transport sector faces;
» help mitigate the cyber risks; and
» ensure the transport sector responds effectively to incidents.
Protecting the environment and public health1.40 During 2016-17 the Department continued to deliver against its commitments to deliver sustainable transport.
1.41 Aviation brings benefits to the economy and society, but this growth is often associated with environmental costs at both the local and global level. We therefore have a role in ensuring that the aviation sector is grown in a sustainable way. In October 2016, we worked with ICAO to secure a new global market-based measure to control CO2 emissions from international aviation. Over 190 countries agreed on the measure which
Figure 3: New registrations of ultra low emission vehicles (ULEV), UK, 2010 to 2016
05
15
25
3530
20
10
4540
00.2
0.60.8
0.4
1.61.41.21.0
Thou
sand
Perc
enta
ge
Year to endDec 2010 Dec 2011 Dec 2012 Dec 2013 Dec 2014 Dec 2016Dec 2015
Thousands of ULEVs
ULEVs as a percentageof all new registrations
Annual Report and Accounts 2016-1720

sent a clear message that aviation will play its part in combating climate change.
1.42 In 2016 the Department published its Cycle and Walking Investment Strategy (CWIS) for consultation. Alongside the CWIS we announced that £64 million will be committed between 2017 and 2020 to encourage more cycling and walking to work, including road safety measures and mapping information for pedestrians.
1.43 The Department continues to work with the Department for Environment, Food and Rural Affairs (Defra) and other key partners to reduce air pollution. During 2016-17:
» we established the Joint Air Quality Unit (a team staffed jointly by civil servants from DfT and Defra) which will produce a revised National Air Quality Plan for Nitrogen Dioxide. This is due to be published by the end of July 2017;
» we worked with Local Authorities to develop a Clean Air Zone framework which will help areas affected by air pollution take a consistent approach to tackling the problem;
» we worked to clean up the vehicle fleet, including distributing the additional £150 million committed in the 2016 Autumn Statement to support low emission buses and taxis;
» we supported work being undertaken using the Highways England designated fund for air quality, such as the installation of 24 new automatic air quality monitoring stations alongside the SRN and delivering a programme of 10 pilot studies into new approaches to improving air quality;
» we set up a Market Surveillance Unit to check that vehicles on UK roads comply with the legislative standards that they were approved to; and
» we published the results of the Vehicle Emissions Testing Programme that checked whether other vehicles on the UK’s roads were not manipulating emissions tests.
Annual Report and Accounts 2016-17 21
Performance Report How we have performed

Single Departmental Plan indicators1.44 Tables 1 to 4 set out, under the four SDP objectives, the latest year-end position for each of our new SDP indicators.9
Table 1: Boosting economic growth and opportunity
SDP indicator Previous Current10
Value for money
DfT’s appraised project spend assessed to be high or very high value for money (current data = 2016, previous = 2015)
80% 95%
Boosting Infrastructure: number of transport infrastructure projects and programmes in construction and completed
(i) Number of transport schemes from the National Infrastructure and Construction Pipeline (NICP) that are currently in construction in England (current data = December 2016, previous = April 201611)
5140 projects &
93 programmes
(ii) Number of Highways England and local major transport schemes that have been completed in England since 2015 (current data = June 2017, previous = December 201512)
8 73
Boosting skills
We have set an ambition to deliver 30,000 apprenticeships in road and rail by 2020. The ‘Transport Infrastructure Skills Strategy’, published on 28 January 2016, sets out how we will monitor and report on progress. (current data = end June 2017, previous = N/A).
- 2,000
Savings to business as a result of better regulation
Annual saving since the beginning of the reporting period13 (current data = 31 March 2017, previous = 31 March 2016)
£4.5m £8.8m
9 As some indicators are being measured for the first time historical data is not always available.
10 The years (current & previous) used vary between indicators. The precise year used is referred to in the indicator description, for all indicator sections.
11 Data is not comparable due to differences in the way data is captured and recorded over time.
12 This indicator is based on administrative data. Updates on rail schemes are available via Network Rail’s website: www.networkrail.co.uk
13 The Business Impact Target (BIT) is a target for savings to business as a result of better government regulation. The target reporting period lasts for the duration of a parliament (May 2015 to June 2017).
Annual Report and Accounts 2016-1722

Table 2: Building a One Nation Britain
SDP indicator Previous Current
Boosting infrastructure outside of London and the South East: number of transport infrastructure projects and programmes in construction and completed
(i) Number of transport schemes from the National Infrastructure and Construction Pipeline (NICP) that are currently in construction in England outside London and the South East (current data = December 2016, previous = April 201614)
3730 projects &
41 programmes
(ii) Number of Highways England and local major transport schemes that have been completed in England since 2015 outside London and the South East (current data = June 2017, previous = December 201515)
7 70
Average minimum travel times to key services in England16
(i) Public transport/walking - 17
(ii) Pedal cycle - 14
(iii) Car - 10
(minutes, current data = 2014, previous = N/A17)
14 Data is not always comparable due to differences over time in the way the data has been captured and recorded.
15 This indicator is based on administrative data. Updates on rail schemes are available via Network Rail’s website: www.networkrail.co.uk
16 The key services included in this measure are: centres of employment, primary and secondary schools and further education colleges, GPs, hospitals, food stores and town centres.
17 Data for 2015 is due to be published in July 2017 at: www.gov.uk/government/collections/journey-time-statistics
Annual Report and Accounts 2016-17 23
Performance Report How we have performed

Table 3: Improving journeys
SDP indicator Previous Current
National Rail Passenger Survey, Great Britain
Passengers satisfied with their journey (current data = Autumn 2016, previous = Autumn 2015)
83% 81%
National Road User Satisfaction Survey, England
(i) Satisfaction score for most recent journey taken on the strategic road network (out of 100, current data = 2016-17, previous = 2015-16)
89% 89%
(ii) Users very or fairly satisfied with elements of their most recent journey
(a) Safety 92% 92%
(b) Upkeep 90% 90%
(c) Information provision 92% 93%
(d) Journey time 88% 87%
(e) Roadworks management 65% 63%
(current data = 2016-17, previous = 2015-16)
Proportion of trains running on time, Great Britain18 (current data = 2016-17, previous = 2015-16)
89.1% 87.7%
Proportion of non-frequent bus services running on time, England19 (current data = 2016-17, previous = 2015-16)
82.9% 82.6%
Average excess waiting time for frequent bus services, England
Data is available at local authority level (see source)See footnote20
Average delay on strategic roads and average delay on local ‘A’ roads, England
(i) Strategic road network 8.9 9.0
(ii) Local ‘A’ roads 44.8 46.0
(seconds per vehicle per mile, current data = 2016-17, previous = 2015-16)
Proportion of flights on time (within 15 minutes), UK (current data = 2016, previous = N/A21)
- 73%
18 A train is defined as on time if it arrives at its destination within five minutes of the scheduled arrival time for London and South East and regional operators, or within ten minutes for long-distance operators.
19 Defined as five or fewer bus services per hour.20 For available local authority data see: https://www.
gov.uk/government/collections/bus-statistics. National figures are not available.
21 The number of airports monitored increased from 10 in 2014 to 23 in 2015 and 24 in 2016. Therefore data prior to 2016 is not available on the same basis.
Annual Report and Accounts 2016-1724

Table 4: Safe, secure and sustainable transport
SDP indicator Previous Current
Number of fatalities and serious injuries in reported road traffic accidents, by road user, Great Britain (Jan-Sep 2016 data provisional)
Fatalities and serious injuries in reported road traffic accidents
(i) Car occupants 6,103 7,110
(ii) Motorcyclists 4,164 4,430
(iii) Pedestrians 3,705 3,830
(iv) Pedal cyclists 2,580 2,720
(v) Other 959 800
(current data = Jan to Sep 2016, previous = Jan to Sep 2015)
Total domestic greenhouse gas emissions from transport, UK (tonnes of CO2 equivalent, current data = 2015, previous = 2014)
118 million 120 million
New registrations of ultra low emission vehicles, total number and proportion of all new registrations, UK22
(i) New registrations of ultra low emission vehicles (current data = 2016, previous = 2015)
29,965 41,819
(ii) As a proportion of all new vehicle registrations (current data = 2016, previous = 2015)
0.9% 1.3%
Annual number of trip stages per person made by bicycle, England (latest data = 2015, previous = 2014)
19 18
22 For this indicator ‘ultra low emission vehicle’ includes any vehicle which is fully electrically powered and any car or van with a carbon emission rating of less than 75 grams per kilometre.
Annual Report and Accounts 2016-17 25
Performance Report How we have performed

Other corporate reportingPayment of suppliers1.45 The Department complies with the Prompt Payment Code of paying 80% of
undisputed supplier invoices within five working days of receipt, and 98% within 30 days of receipt. Figure 4 shows performance of DfTc and its executive agencies during 2016-17.
Figure 4: Compliance with the Prompt Payment Code
0
20
40
60
80
100
DFTc MCA DVLA DVSA VCA
■ 5 working days ■ 30 working days
92.5% 98.98% 88.3% 97.92% 87.8% 99.95% 99.5% 99.99% 97.3% 99.21%
Annual Report and Accounts 2016-1726

Climate change, sustainability and the environmentClimate Change1.46 UK transport networks must be resilient to both transport incidents and extreme weather to minimise disruption. Transport policies have to be robust in the face of changing weather patterns, greater incidence of extreme events and sea-level rise caused by climate change. This will be ever more important in the future, as travel and freight demands on our transport systems continue to grow.
1.47 DfT has been taking forward recommendations from the National Flood Resilience Review published in September 2016. This work includes identifying areas of the country that could become isolated under certain flood scenarios as well as identifying key bridges on the local road network that could be vulnerable to flooding. It is expected this work and analysis will be completed by summer 2017.
1.48 Local authorities have responsibility for the construction and maintenance of non-trunk roads (approximately 98% of all roads in England). In October 2016 DfT, with the UK Roads Liaison Group and other key stakeholders, published the Code of Practice on Well Managed Highway Infrastructure which provides advice to authorities about the management and maintenance of their highway assets. This contained a section specifically relating to climate change and adaptation and further guidance about being resilient to extreme weather events.
1.49 Adapting the strategic road network (SRN) to become more resilient to weather and climate factors is a priority for Highways England – as set out in their Sustainable Development Strategy23. The Highways England Climate Adaptation Risk Assessment Progress Update24 set out progress in adapting to the current and future predicted effects of climate change on the strategic road network.
1.50 DfT works closely with our delivery bodies and partners to understand and mitigate against the impacts of climate change on the railway. We have funded the Tomorrow’s Railway and Climate Change Adaptation programme, which concluded in 2016 and was led by the Rail Safety and Standards Board. This explored ways of improving the resilience of railway infrastructure to climate change, including asset vulnerability mapping, advanced condition monitoring and improved coordination between agencies.
1.51 The HS2 Ltd Sustainability Policy sets out the aim to “build a network which is resilient for the long term and seek to minimise the combined effect of the project and climate change on the environment”. HS2 Ltd considers how climate change, in combination with the impacts of the proposed scheme, may affect communities, business and the natural, historic and built environment through the Hybrid Bill process.
23 https://www.gov.uk/government/publications/highways-england-sustainable-development-strategy
24 https://www.gov.uk/government/publications/climate-adaptation-reporting-second-round-highways-england As reported to Defra as part of the second round of the adaptation reporting powers under the Climate Change 2008 Act.
Annual Report and Accounts 2016-17 27
Performance Report How we have performed

1.52 Climate change adaptation is covered in the draft Airports National Policy Statement (NPS) (February 2017), relating to new runway capacity and infrastructure at airports in the South East of England. The document also sets out how the developer and Government will take into account the wider effects of climate change when developing and considering applications for airport infrastructure.
Air Quality1.53 The Department’s work on improving Air Quality is set out in the earlier section Protecting the Environment and Public Health.
Rural proofing of DfT policies and programmes1.54 The Department incorporates Defra’s refreshed 2017 National Rural Proofing Guidelines into its appraisal system. Policy makers address particular questions and actions at each stage of the policy cycle, including the design, development and the implementation. This rural proofing impact assessment is designed to operate as a checklist to ensure key impacts are picked up for further consideration as part of the comprehensive appraisal system.
1.55 The Department also provides extensive appraisal guidance for investments in transport schemes in the form of the Web-based Transport Analysis Guidance (WebTAG), which highlights in several places the need to consider rural impacts.
Sustainability1.56 The Department continues to strive to deliver a more sustainable transport system and manage our own estate and business travel in an equally sustainable manner.
1.57 There is strong senior level support for sustainable procurement at the Department. This year the focus has been on:
» meeting Government targets for the amount of Departmental spend going to small and medium enterprises;
» drafting and gaining agreement to an ethical charter for suppliers;
» improving the consistency of approach to sustainability KPIs in high risk contracts across the Department;
» continuing to improve knowledge of sustainable procurement across the DfT; and
» implementing and measuring the success of the Transport Infrastructure Skills Strategy.
1.58 There are Government drivers in the form of the Greening Government Commitments (GGC) which provide the structure and standard of sustainability performance to be achieved.
1.59 The DfT Executive Committee receives six-monthly reports on DfT performance against the GGC measures.
Annual Report and Accounts 2016-1728

1.60 The data reported covers the central Department, DVLA, Highways England (HE), MCA, VCA, British Transport Police (BTP) and HS2 Ltd. The DVSA is not included as it sits outside of the accounting boundary. Whilst this report will highlight some of the activities undertaken by these organisations to improve sustainable performance, more detail can be found in the individual Annual Reports and Accounts for each organisation.
Summary of performance1.61 In 2016-17 we continued to make good progress in reducing our greenhouse gas emissions, our natural resource consumption and minimising our waste generation. Details of our sustainability performance metrics are set out in the tables on the following pages.
1.62 Our greenhouse gas (GHG) emissions have reduced by 10%, in comparison to our 2015-16 performance. Our performance against the GGC 2009-10 baseline is a 33% reduction.
1.63 These changes are a result of:
» fleet renewals with lower emissions vehicles;
» more energy efficient light fittings;
» a decrease of 22% in business travel car mileage;
» continued rationalisation of our built estate and maximising the use of the remaining sites; and
» issuing a staff guide to energy efficiency.
Annual Report and Accounts 2016-17 29
Performance Report How we have performed

Table 5: Greenhouse gas emissions
Greenhouse Gas (GHG) Emissions 2012-13 2013-14 2014-15 2015-16 2016-17
Gross Emissions (tonnes CO2e)25
Scope 1: Direct emissions
13,057 13,606 13,416 15,860 15,190
Scope 2: Indirect emissions
117,017 113,402 120,650 100,894 88,692
Scope 3: Business Travel emissions
3,300 3,192 3,007 3,567 4,133
Total Emissions 133,374 130,200 137,072 120,321 108,015
Related Consumption Data
Estates electricity (kWh)
47,884,521 50,920,097 54,850,674 52,837,662 48,331,369
kWh per head 3,062 2,340 2,068 2,668 2,371
Estates (HE road network) electricity (kWh)
188,496,743 186,168,000 172,988,659 165,494,778 166,906,488
Private car usage (million road miles)
3.09 3.60 2.86 3.88 2.93
Hire car usage (million road miles)
4.03 4.32 4.44 5.83 4.66
Financial Indicators
Total energy expenditure
£30,397,297 £32,932,245 £35,119,593 £29,287,925 £30,320,622
CRC related expenditure
£1,265,756 £2,554,760 £2,330,046 £2,391,340 £2,001,105
Expenditure on business travel
£10,509,126 £12,565,380 £10,363,072 £11,813,208 £10,886,562
Direct Impacts
Scope 1 – this includes direct consumption of gas, LPG and Gas Oil to our built estate and fuel consumption by vehicles owned by DfT and its Agencies.Scope 2 – this covers electricity supplies to our buildings, our surplus property portfolio and the strategic road network.Scope 3 – Business travel undertaken by staff using 3rd party transport (including hire car use).
Indirect Impacts
One of the biggest contributors of Greenhouse Gas emissions for the UK is the emissions from vehicles travelling on the road network. Across the Department for Transport we are working to reduce this impact through policy change that encourages the use of lower emissions vehicles (i.e. promoting the installation of electric vehicle charging points) or alternative lower emission forms of transport, improving the information that is available to drivers to reduce fruitless journeys and the active management of the network (i.e. smart motorways, variable speed limits, hard shoulder running) to reduce emissions by minimising time spent in queues.
25 tCO2e = tonnes of carbon dioxide equivalent emissions
Annual Report and Accounts 2016-1730

1.64 Our total water consumption has increased by 0.9% when compared to 2015-16 as a result of the continued growth of HS2 Ltd and increasing staffing levels. The office water consumption figure per head has decreased to 6.68 m3. We continually seek to improve our management and understanding of water use with the aim of reducing both overall and FTE water consumption.
Table 6: Water sustainability
Water 2012-13 2013-14 2014-15 2015-16 2016-17
Non – Financial Indicators
Estates water 121,015 128,954 127,475 134,891 136,140
m3 per head 7.18 5.71 6.82 6.81 6.68
Emissions from water consumption (tonnes CO2e)
41.15 44.37 43.86 46.42 46.85
Table 7: Waste sustainability
2016-17 Department for Transport Sustainability Report
Waste 2012-13 2013-14 2014-15 2015-16 2016-17
Non – Financial Indicators
Total admin waste 2,719.18 2,848.30 2,579.29 2,535.40 2,898.75
Recycled waste 1,675.22 2,043.97 2,073.06 2,127.33 2,303.97
Kg per head 162.52 126.16 137.96 128.00 142.22
Percentage recycled 62% 72% 80% 84% 79%
Direct and Indirect Impacts
Highways England continues to collect more than 150,000 sacks of litter each year on the strategic road network.
1.65 We have increased the volume of waste generated from our administrative estate by 14% when compared to 2015-16. This increase is as a result of:
» growth of the HS2 Ltd estate; and
» a rise in the reported figures for waste generated by British Transport Police as a result of improved data collection.
Annual Report and Accounts 2016-17 31
Performance Report How we have performed

1.66 Some 79% of our office waste was sent for recycling. We continually seek to minimise the amount of office waste that goes to landfill by segregating waste at our sites and working with waste contractors to understand exactly which non-landfill waste streams they are utilising for disposal.
Sustainable procurement1.67 The Department is committed to delivering 33% of procurement spend through small and medium-sized enterprises (SMEs) by 2019-20. To deliver this, the Department is working closely with Network Rail, Highways England, HS2 Ltd and their supply chains, along with the Department’s wider executive agencies and Non-Departmental Public Bodies (NDPBs).
1.68 In order to deliver its commitment the Department is:
» improving payment terms for SMEs and access to information on the Department’s indirect expenditure;
» continuing to implement project bank accounts, and Building and Information Modelling;
» measuring adherence to its Fair Payment Charter;
» breaking contracts into smaller lots wherever possible;
» promoting strong engagement across its supply chains and markets through meet the buyer and trade events, engaging with Local Enterprise Partnerships, and holding regional and national roadshows where local businesses are encouraged to bid for emerging opportunities, such as HS2; and
» working with tier 1 contractors to share procurement pipelines and encourage tier 1 contractors to advertise opportunities in their supply chains.
1.69 The Department delivered 26% of procurement spend through SMEs in 2016-17.
Correspondence1.70 The Department aims to respond to correspondence within 20 working days. In 2016-17 we responded to just over 25,000 correspondence cases from MPs, Peers, key stakeholders (MC cases) and members of the public (TO cases), 35% higher than the number of cases received in 2015-16. We replied to 91% of cases within our target timescales, including correspondence responded to by Ministers and officials. Figure 5 shows a breakdown by month.
Annual Report and Accounts 2016-1732

Information rights
1.71 In 2016-17 the Department including its executive agencies received 2,466 requests for information which were handled under either the Freedom of Information (FOI) Act or the Environmental Information Regulations. We met the statutory response deadlines in 97% of these cases, matching the timeliness level achieved in 2015-16.
1.72 The central Department publishes a list of its responses to FOI requests where some or all of the requested information was disclosed. This can be viewed on our disclosure log on the website www.gov.uk under: Publications, sub-section, FOI releases.
Figure 5: Performance in responding to correspondence
0
500
1000
1500
2000
2500
3000
Apr-16 May-16 Jun-16 Jul-16 Aug-16 Sep-16 Oct-16 Nov-16 Dec-16 Jan-17 Feb-17 Mar-17
■ Cases within target ■ Cases outside target
Annual Report and Accounts 2016-17 33
Performance Report How we have performed

Complaints handling including to the Parliamentary Ombudsman1.73 The number of complaints handled by DfT and its delivery bodies for 2016-17 and the previous two years is found in Table 8.26
Table 8: Number of complaints
Year 2014-15 2015-16 2016-17
DfTc 18 24 23
DVLA 7282 5283 4495
DVSA 11802 15704 11553
VCA 0 10 8
MCA 13 25 15
Highways England 1250 2259 488027
HS2 Ltd 50 47 56
CAA 102 143 178
Total 20517 23495 21208
1.74 Where a complainant feels that their complaint has not been handled properly and is not satisfied with the response they can have the matter reviewed by an Independent Complaints Assessor (ICA).
1.75 The ICAs are individuals experienced in resolving complaints through reviewing the issues and recommending solutions to remedy a complaint satisfactorily as a final stage in the Department’s complaint handling process.28
26 Network Rail and ORR do not report data to the Department.
27 The increase in Highways England is due to a change in the complaints process and how complaints have been recorded since July 2016.
28 More details on the ICAs and their Annual Reports are available here; https://www.gov.uk/government/collections/ independent-complaints-assessors-for-thedepartment- for-transport
1.76 The number of complaints that were reviewed by the ICAs in 2016-17 and the previous two years is shown in Table 9.
Table 9: Number of complaints reviewed by ICAs
Year 2014-15 2015-16 2016-17
DfTc 3 0 4
DVLA 121 126 188
DVSA 38 28 42
VCA 0 0 0
MCA 1 4 3
Highways England 11 6 24
HS2 Ltd 3 1 8
CAA - - 4
Total 177 166 273
1.77 The Parliamentary & Health Service Ombudsman (PHSO) investigates complaints about the Department and its delivery bodies referred to it by a Member of Parliament on behalf of a complainant. Generally the PHSO will expect the ICAs to have reviewed the matter before they launch an investigation. Where the PHSO believes there is evidence that there has been maladministration, unfair treatment, or poor service, it will investigate the issues, review the remedy provided, and may recommend further actions to resolve the matter.
Annual Report and Accounts 2016-1734

1.78 Table 10 shows the numbers of complaints upheld in full or in part or not upheld during 2016-17.29
Table 10: Investigations by the PHSO
Org
anis
atio
n
Com
plai
nts
ac
cept
ed fo
r in
vest
igat
ion
Inve
stig
atio
ns
uphe
ld o
r pa
rtly
up
held
Inve
stig
atio
ns
not u
phel
d
DfTc 0 1 1
DVLA 15 7 4
DVSA 0 0 1
VCA 0 0 0
MCA 1 0 1
Highways England 1 0 1
HS2 Ltd 2 0 1
CAA 1 1 1
Independent Complaints Assessor
1 0 1
Total 21 9 11
Further details are available here: https://www.ombudsman.org.uk/publications/complaints-about-uk-government-departments-and-agencies-and-some-uk-public-0
29 The introduction of a new casework management system by PHSO means data for 2016-17 cannot be compared to previous years.
Health and safety1.79 Health and safety continues to be a priority for the Department and its executive agencies. Table 11 sets out the numbers of RIDDOR reports (reports under the Reporting of Injuries, Diseases and Dangerous Occurrence Regulations 1998) to the Health and Safety Executive for the year 2016-17 and previous years. The figures for DVSA remain greater than for the rest of the DfT group due to the nature of the risks involved in carrying out their operational duties.
Table 11: Number of RIDDOR reportable incidents for DfTc and executive agencies
RIDDOR reportable incidents
Organisation 2014-15 2015-16 2016-17
DfTc 2 3 0
DVLA 12 8 0
DVSA 30 21 23
MCA 6 5 10
VCA 1 0 0
Total 63 37 42
Publicity and advertising1.80 Since May 2010, all publicity and advertising campaigns require the approval of the Efficiency and Reform Group in Cabinet Office. This year, DfT approved activity included the THINK! road safety campaign with a focus on cycle safety, drink driving, reducing speed on country roads and raising awareness of the change in legislation for using a hand-held mobile phone while driving.
Annual Report and Accounts 2016-17 35
Performance Report How we have performed

Keep your phone in here if you want to keep your licence.
It’s 6 points if you hold and use your phone while driving. If you’ve passed your test in the last 2 years, you’ll lose your licence.
1.81 On March 1st 2017 THINK! launched a new mobile phones campaign. This campaign aimed to raise awareness of the change in legislation for using a hand-held mobile phone while driving and also the risk associated with this behavior. The campaign targeted all drivers in England and Wales.
1.82 We used traditional broadcast media such as radio and outdoor posters to inform all drivers that the penalties were getting tougher.
1.83 Targeted video content was also used to highlight the risks of using your mobile while driving.
1.84 Social media and other communications supported the campaign message and all activity was underpinned by a single call to action: THINK! Put your phone away.
Evaluation1.85 KPIs will be measured through post campaign tracking. We will use media, web and social media analytics to monitor awareness and engagement, and post campaign tracking to measure campaign effectiveness. These results will be published in Autumn 2017.
Sponsorship agreements1.86 As in previous years, the central Department has not received any cash sponsorship but has received support from key partners who have linked with our THINK! road safety campaign. These include the following:
» for the ninth consecutive year, THINK! partnered with Coca-Cola to deliver the annual ‘Designated Driver’ campaign. This campaign provided drivers with a buy-one-get-one-free offer on Coca-Cola drinks in 8,200 venues nationwide and provided a positive, in-context solution to help drivers to make the right decision to not drink and drive;
» THINK! also partnered with Budweiser on their substantial anti-drink drive Christmas campaign, fronted by Helen Mirren. This campaign also provided drivers with an in-context solution to avoid drink driving by offering free taxi rides for all those who tweeted their support for the campaign;
Annual Report and Accounts 2016-1736

» THINK! Mobile partnerships: THINK! created a piece of content at no cost with online influencer Anto Sharp to communicate the dangers of using a phone while driving. Anto has 14k Twitter followers and more than 1.3m likes on his Facebook page. Anto posted the film on his social channels, obtaining 600k views; and
» THINK! secured partnerships with 14 commercial organisations, including Halfords Autocare, BSM and Red Driving School, to distribute campaign merchandise to drivers. Over 450,000 car sticker and hang tag units were distributed in total.
Bernadette Kelly 17 July 2017 Permanent Secretary and Accounting Officer
Department for Transport Great Minster House 33 Horseferry Road London SW1P 4DR
Annual Report and Accounts 2016-17 37
Performance Report How we have performed

Annual Report and Accounts 2016-1738

The Accountability Report

Report from the Lead Non-Executive Board Member
During 2016-17, the Department continued to focus on the delivery of large scale projects and to ensure that our transport systems are running effectively and safely for the public and for businesses.
This year, the Non-Executive Board Members have continued to support various areas of work across the Department, by acting as a sounding board outside meetings to provide additional challenge and scrutiny and acting as independent members on interview panels for senior appointments. Additional contributions from the Non-Executives have included: leading a review of the plans for the Euston HS2 station; conducting a review of the governance and design of the Network Rail Asset Disposals programme; and reviewing the Department’s Management Information systems and reporting processes.
The recent Board Effectiveness evaluation highlighted the positive impact that the Non-Executives bring individually and collectively across the DfT Group.
The information provided to the Board, which enables it to advise and challenge the Department on its strategic direction and on the operational implications and effectiveness of its portfolio, continues to develop. The reports discussed at both the Board Investment Commercial Committee and at the Board, provide increased scrutiny and strategic insights into the management and progress of our significant projects.
The Board and the supporting sub-committee called the Executive and Non-Executives Meeting have considered a strategic programme of business through 2016-17, including transport scenario planning; Departmental capability; strategic programme discussions on rail, roads,
aviation and HS2; and the Industrial Strategy. The Department has also further improved the assurance provided to the Board on the Department’s delivery bodies and the risks that they manage.
There were a number of changes to the Board during 2016-17. Chris Grayling replaced Patrick McLoughlin as Secretary of State and we welcomed back John Hayes along with Paul Maynard in his first ministerial post. Tony Poulter was appointed as a new Non-Executive Board Member and we said goodbye to Dame Colette Bowe.
At the end of March 2017, Philip Rutnam left the Department to join the Home Office as Permanent Secretary. Since joining the Department in April 2012, he has been pivotal to the development of good governance, assurance processes and controls across the Department and its delivery bodies, embedding an improved culture of rigour, challenge and scrutiny in his role as Accounting Officer.
The publication of the Department for Transport’s Single Departmental Plan (SDP) provided a strong focus to the Board for 2016-17, setting out how the Department contributes to the delivery of the Government’s programme and works collaboratively across Government. In line with the SDP, the Department’s focus has been on: transport and infrastructure investment; building and rebalancing the economy; improving journeys and passenger experiences and; the delivery of safe, secure and sustainable transport. There will be significant challenges ahead managing the exit from the EU but the Department is in a good position to deal with them effectively.
Ed Smith CBE, FCA Lead Non-Executive Board Member
Annual Report and Accounts 2016-1740

Corporate Governance Report2. The Directors’ Report
How we were structured in 2016-17
Ministers and the Departmental Board as at 31 March 201730 Ministers
The Rt Hon Chris Grayling MP Secretary of State for Transport
The Rt Hon John Hayes CBE MPMinister of State for Transport
Andrew Jones MP Parliamentary Under Secretary of State for Transport
Lord Ahmad Parliamentary Under Secretary of State for Transport
Paul Maynard MPParliamentary Under Secretary of State for Transport
Non-Executive Board Members
Ed Smith CBE, FCA Lead non-executive board member
Mary Reilly FCA Non-executive board member
Richard Brown CBE Non-executive board member
Tony PoulterNon-executive board member
Dame Colette Bowe PhD Non-executive board member (until 28 February 2017)
Executive Board Members
Philip Rutnam Permanent Secretary
David Prout Director General, High Speed Rail Group
Lucy Chadwick Director General, International, Security and Environment Group
Jonathan Moor CBE, FCA Director General, Resources and Strategy Group
Bernadette Kelly CB Director General, Rail Group
Patricia Hayes Director General, Roads, Devolution and Motoring Group
30 Other board members who served during 2016-17 are shown in Table 13.
Annual Report and Accounts 2016-17 41
The Accountability Report The Directors’ Report

DfT Group2.1 DfT Group comprises the central (core) Department (DfTc), executive agencies and a range of other delivery bodies including Government owned companies and executive and tribunal non-departmental public bodies (NDPBs), and public corporations. For a full list of the entities related to DfT’s activities, see Note 19 to the accounts.
2.2 Figure 6 shows DfT’s partner organisations.
Figure 6: DfT and its delivery bodies
The central Department (DfTc)2.3 DfTc is organised into five Director General-led groups with some areas of work reporting directly to the Permanent Secretary (non-group). The main responsibilities for each group are shown in Figure 7.
Annual Report and Accounts 2016-1742
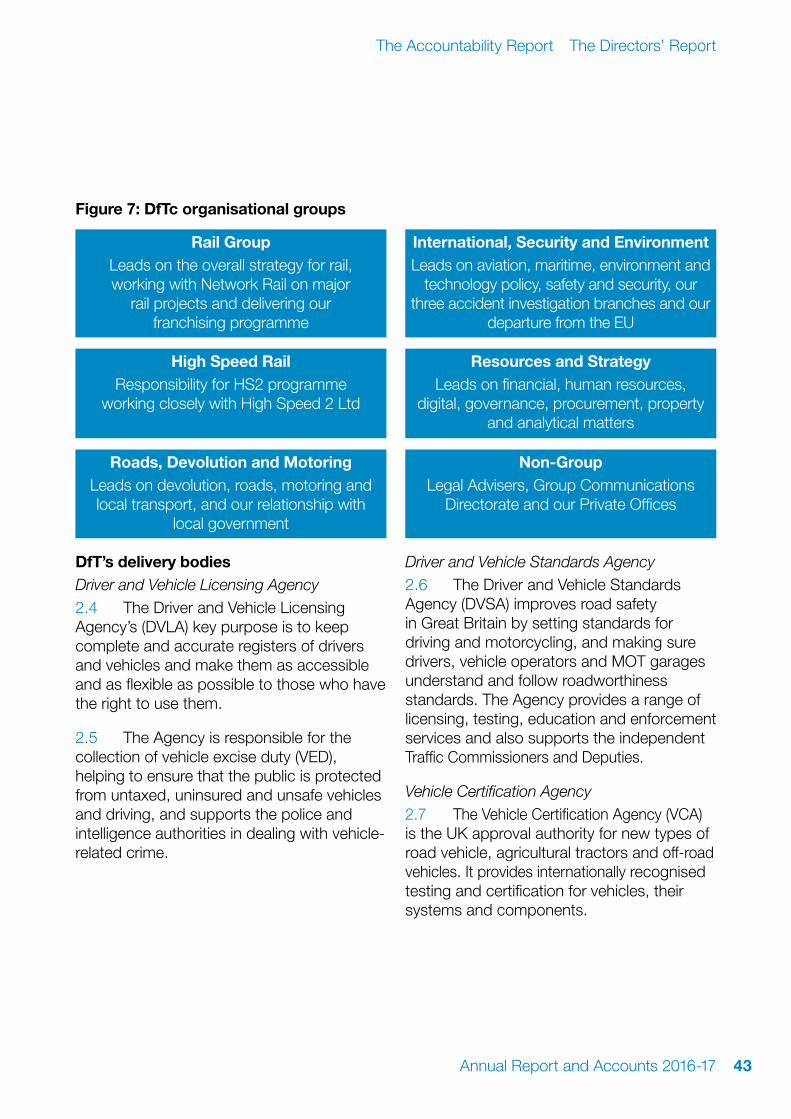
Figure 7: DfTc organisational groups
Rail GroupLeads on the overall strategy for rail, working with Network Rail on major
rail projects and delivering our franchising programme
International, Security and EnvironmentLeads on aviation, maritime, environment and
technology policy, safety and security, our three accident investigation branches and our
departure from the EU
High Speed RailResponsibility for HS2 programme
working closely with High Speed 2 Ltd
Resources and StrategyLeads on financial, human resources,
digital, governance, procurement, property and analytical matters
Roads, Devolution and MotoringLeads on devolution, roads, motoring and local transport, and our relationship with
local government
Non-GroupLegal Advisers, Group Communications
Directorate and our Private Offices
DfT’s delivery bodiesDriver and Vehicle Licensing Agency2.4 The Driver and Vehicle Licensing Agency’s (DVLA) key purpose is to keep complete and accurate registers of drivers and vehicles and make them as accessible and as flexible as possible to those who have the right to use them.
2.5 The Agency is responsible for the collection of vehicle excise duty (VED), helping to ensure that the public is protected from untaxed, uninsured and unsafe vehicles and driving, and supports the police and intelligence authorities in dealing with vehicle-related crime.
Driver and Vehicle Standards Agency2.6 The Driver and Vehicle Standards Agency (DVSA) improves road safety in Great Britain by setting standards for driving and motorcycling, and making sure drivers, vehicle operators and MOT garages understand and follow roadworthiness standards. The Agency provides a range of licensing, testing, education and enforcement services and also supports the independent Traffic Commissioners and Deputies.
Vehicle Certification Agency2.7 The Vehicle Certification Agency (VCA) is the UK approval authority for new types of road vehicle, agricultural tractors and off-road vehicles. It provides internationally recognised testing and certification for vehicles, their systems and components.
Annual Report and Accounts 2016-17 43
The Accountability Report The Directors’ Report

Maritime and Coastguard Agency2.8 The Maritime and Coastguard Agency (MCA) facilitates international maritime trade and economic growth. The MCA also co-ordinates search and rescue at sea through Her Majesty’s Coastguard, and ensures ships meet UK and International safety standards.
Network Rail2.9 Network Rail runs, maintains and develops Britain’s rail tracks, signaling, bridges, tunnels, level crossings, viaducts and 19 key stations.
Highways England2.10 Highways England is responsible for approximately 4,300 miles of motorways and all-purpose trunk roads (the strategic road network), which carry around a third of all traffic. Its role is to support the growth of the UK’s economy by operating, maintaining and improving the strategic road network in England.
High Speed 2 Ltd2.11 High Speed Two (HS2) Limited is the company responsible for developing and promoting the UK’s new high speed rail network, with a planned route stretching from London to Birmingham, Leeds and Manchester. It leads on the planning and execution of the programme in its entirety.
British Transport Police Authority2.12 The British Transport Police Authority (BTPA) is the independent body responsible for ensuring an efficient and effective British Transport Police force. The BTPA oversees the police force, sets its targets and allocates funding for its budget.
Transport Focus2.13 Transport Focus is the independent watchdog representing the interests of Britain’s rail passengers, bus and tram passengers in England (outside of London) and passengers on scheduled domestic coach services in England. It also represents users of England’s major roads (the strategic road network). Transport Focus offers advice to the public and takes up passengers’ complaints that train companies have failed to resolve.
London and Continental Railways2.14 London and Continental Railways (LCR) manages, develops and disposes of property assets within a railway context, and in particular assets associated with major infrastructure projects. As guardians of public land, they have a role to play in the Government’s drive for homes, jobs and economic growth.
Annual Report and Accounts 2016-1744

Northern Lighthouse Board2.15 The Northern Lighthouse Board is the General Lighthouse Authority for Scotland and the Isle of Man. It provides marine navigation aids to assist the safe passage of mariners through waters in these areas. It is also responsible for marking and dispersing wrecks which are a danger to navigation.
Trinity House2.16 Trinity House is a charity dedicated to safeguarding shipping and seafarers, providing education, support and welfare to the seafaring community with a statutory duty as a General Lighthouse Authority to deliver a reliable, efficient and cost-effective aids to navigation service for the benefit and safety of all mariners.
Commissioners of Irish Lights2.17 The Commissioners of Irish Lights is jointly sponsored by the UK Government and the Irish Government. It receives its funding from the General Lighthouse Fund, its commercial work, and a contribution from the Irish Government. The accounts of the Commissioners of Irish Lights are consolidated with those of Trinity House Lighthouse Service and the Northern Lighthouse Board to form part of the DfT accounts.
Directly Operated Railways2.18 Directly Operated Railways Limited (DOR) managed the East Coast rail franchise until it was re-let to a new private operator in March 2015. The company is currently being wound down.
Disabled Persons Transport Advisory Committee2.19 The Disabled Persons Transport Advisory Committee (DPTAC) advises the Government on transport legislation, regulations and guidance and on the transport needs of disabled people, ensuring disabled people have the same access to transport as everyone else. During 2016-17 it was re-classified as an Expert Committee.
RegulatorsOffice of Rail and Road2.20 The Office of Rail and Road (ORR) is a statutory body that acts as an independent regulator. In status it is a non-ministerial department. It is responsible for ensuring that railway operators comply with health and safety law. It regulates Network Rail’s activities and funding requirements, regulates access to the railway network, licenses the operators of railway assets and publishes rail statistics.
2.21 Since April 2015, ORR has been monitoring Highways England to hold the company to account on its commitments to improve the performance and efficiency of England’s strategic road network.
Civil Aviation Authority2.22 The Civil Aviation Authority (CAA) is a statutory independent regulator. In status it is a public corporation. It is responsible for the regulation of aviation safety in the UK, determining policy for the use of airspace, the economic regulation of Heathrow, Gatwick and Stansted airports, the licensing and financial fitness of airlines and the management of the ATOL financial protection scheme for holidaymakers.
Annual Report and Accounts 2016-17 45
The Accountability Report The Directors’ Report

Table 12: DfT’s delivery bodies31
Executive Agencies
Driver and Vehicle Licensing Agencywww.gov.uk/government/organisations/driver-and-vehicle- licensing-agency
Driver and Vehicle Standards Agencywww.gov.uk/government/organisations/driver-and-vehicle-standards-agency
Vehicle Certification Agency www.dft.gov.uk/vca/
Maritime and Coastguard Agencywww.gov.uk/government/organisations/maritime-and-coastguard-agency
Government owned companies
Highways England www.gov.uk/government/organisations/highways-england
Network Rail www.networkrail.co.uk
London and Continental Railways www.lcrhq.co.uk/
Executive NDPBs
British Transport Police Authority (BTPA) www.btpa.police.uk
Transport Focus (TF) www.transportfocus.org.uk
High Speed 2 Ltd (HS2 Ltd) www.hs2.org.uk
Directly Operated Railways Ltd (DOR) www.directlyoperatedrailways.co.uk
Northern Lighthouse Board (NLB) www.nlb.org.uk
Trinity House Lighthouse Service www.trinityhouse.co.uk
Commissioner of Irish Lights www.irishlights.ie
Tribunal NDPBs
Traffic Commissioners and Deputies (TCs) www.gov.uk/government/organisations/traffic-commissioners
Expert Committees
Disabled Persons Transport Advisory Committee (DPTAC)
www.gov.uk/government/organisations/disabled-persons-transport-advisory-committee
Regulators
Office of Rail and Road www.orr.gov.uk
Civil Aviation Authority www.caa.co.uk
31 The Cabinet Office sets out the different categories of the UK’s public bodies in a public bodies handbook - www.gov.uk/government/publications/classification-of-public-bodies-information-and-guidance.
Annual Report and Accounts 2016-1746

Register of interests2.23 The register of Ministers’ interests is maintained by the Cabinet Office. Non-executive board members are asked to declare any personal or business interests that may influence, or appear to influence, their judgment in performing their obligations to the Department. No members of the Board have flagged company directorships or other significant interests that may conflict with their management responsibilities.
Personal data related incidents2.24 Serious data breaches need to be reported to the Information Commissioner’s Office, following procedures set out by the ICO. In 2016-17 no personal data incidents were formally reported by DfTc or its Executive Agencies to the ICO.
Auditors2.25 This section sets out the costs of auditing the DfT Group accounts along with the costs of auditing the organisations which form part of the DfT Group. The Comptroller and Auditor General carries out the audit of the consolidated Accounts of the Departmental Group, as well as the audits of the following executive agencies:32
» Maritime and Coastguard Agency;
» Driver and Vehicle Licensing Agency; and
» Vehicle Certification Agency.
2.26 These audits are conducted under the Government Resources and Accounts Act
32 The DVSA is not part of the DfT Group for accounting purposes. The costs of auditing the DVSA’s Accounts can be found in the Annual Report and Accounts for DVSA.
2000, at an annual notional cost of £599,000 (2015-16, £648,000).
2.27 The audits of the following entities are completed by the Comptroller and Auditor General, but incur a cash or real charge of £1.1m (2015-16, £919,520):
» Network Rail Limited;
» Highways England Company Ltd;
» British Transport Police Authority;
» HS2 Ltd;
» Transport Focus;
» CTRL Section 1 Finance PLC; and
» LCR Finance PLC.33
2.28 PWC audits the following entities, providing audit assurance to the Comptroller and Auditor General as the Group auditor. These audits incur a real cost charge of £136,647 (2015-16, £217,000):
» Directly Operated Railways Limited;
» Air Safety Support International Limited; and
» Network Rail subsidiary bodies.
2.29 Deloitte audits the following entity, providing audit assurance to the Comptroller and Auditor General as the Group auditor. This audit incurs a real cost charge of £49,033 (2015-16, £43,800):
» Air Travel Trust Fund.
33 Both CTRL Section 1 Finance PLC and LCR Finance PLC were audited by KPMG in 2015-16.
Annual Report and Accounts 2016-17 47
The Accountability Report The Directors’ Report

» The three General Lighthouse Authorities are consolidated into the General Lighthouse Fund accounts, which are audited by the Comptroller and Auditor General. The cost of this audit is borne by the General Lighthouse Fund.
2.30 The National Audit Office in its work to scrutinise public spending for Parliament also performs other statutory audit activity, including value-for-money and assurance work.
Statement of Accounting Officer’s Responsibilities2.31 Under the Government Resources and Accounts Act 2000 (the GRAA), HM Treasury has directed the Department for Transport to prepare, for each financial year, consolidated resource accounts detailing the resources acquired, held or disposed of, and the use of resources, during the year by the Department (inclusive of its Executive Agencies) and its sponsored Non-Departmental and other Arm’s Length Bodies (ALBs) designated by order made under the GRAA by Statutory Instrument 2016 No.323 amended by GRAA Amendment Order 1243 (together known as the ‘Departmental Group’, consisting of the Department and sponsored bodies listed at Note 19 to the Accounts).
2.32 The Accounts are prepared on an accruals basis and must give a true and fair view of the state of affairs of the Department and the Departmental Group and of the net resource outturn, application of resources, changes in taxpayers’ equity and cash flows for the financial year.
2.33 In preparing the Accounts, the Accounting Officer of the Department is required to comply with the requirements of the Government Financial Reporting Manual and in particular to:
» observe the Accounts Direction issued by HM Treasury, including the relevant accounting and disclosure requirements, and apply suitable accounting policies on a consistent basis;
» ensure that the Department has in place appropriate and reliable systems and procedures to carry out the consolidation process;
» make judgements and estimates on a reasonable basis, including those judgements involved in consolidating the accounting information provided by Non- Departmental and other ALBs;
» state whether applicable accounting standards as set out in the Government Financial Reporting Manual have been followed, and disclose and explain any material departures in the Accounts; and
» prepare the Accounts on a going concern basis.
2.34 HM Treasury has appointed the Permanent Secretary of the Department as the Accounting Officer. The Accounting Officer has also appointed the Chief Executives or equivalents of its sponsored Non-Departmental and other ALBs as Accounting Officers of those bodies.
2.35 The Accounting Officer of the Department is responsible for ensuring that appropriate systems and controls are in place to ensure that any grants that the
Annual Report and Accounts 2016-1748

Department makes to its sponsored bodies are applied for the purposes intended and that such expenditure and the other income and expenditure of the sponsored bodies are properly accounted for, for the purposes of consolidation within the resource Accounts. Under their terms of appointment, the Accounting Officers of the sponsored bodies are accountable for the use, including the regularity and propriety, of the grants received and the other income and expenditure of the sponsored bodies.
2.36 The responsibilities of an Accounting Officer, including responsibility for the propriety and regularity of the public finances for which the Accounting Officer is answerable, for keeping proper records and for safeguarding the assets of the Department or Non-Departmental and other ALBs for which the Accounting Officer is responsible, are set out in ‘Managing Public Money’ published by HM Treasury.
Statement regarding the disclosure of information to the auditors 2.37 As Accounting Officer, I have taken all of the necessary steps to make myself aware of any relevant audit information and to establish that the National Audit Office has been made aware of that information in connection with its audit.
2.38 Philip Rutnam was Principal Accounting Officer during the whole of the 2016-17 financial year. He moved to the Home Office on 3 April 2017 and between 3 April and 18 April 2017 Jonathan Moor, Director General for Resources and Strategy, was appointed as the acting Permanent Secretary and Principal Accounting Officer before I was formally appointed. Over this
short period both Jonathan Moor and I received handover briefings from Philip Rutnam and the Finance Director to ensure a smooth handover from one Principal Accounting Officer to another. On taking up the post of Permanent Secretary I have continued to receive assurance on the effectiveness of the system of internal control to enable me to have confidence in these accounts.
2.39 I confirm that the Accounts have been prepared on a going concern basis, the Annual Report and Accounts as a whole is fair, balanced and understandable. I take personal responsibility for the Annual Report and Accounts and the judgements required for determining that it is fair, balanced and understandable.
2.40 Insofar as I know, there is no relevant audit information of which the National Audit Office is not aware.
Bernadette Kelly 17 July 2017Permanent Secretary and Accounting Officer
Department for Transport Great Minster House 33 Horseferry Road London SW1P 4DR
Annual Report and Accounts 2016-17 49
The Accountability Report The Directors’ Report

3. The Governance Statement
Introduction3.1 The Governance Statement describes how the Board and its supporting governance structures work and how they have performed. It provides an assessment of how the Department has been managed, including the effectiveness of the systems of internal control, risk management and accountability.
Corporate governance, management and controlsGovernance3.2 The Departmental Board and its sub-committees oversee the work of the Department and provide layers of control, scrutiny and assurance to ensure that the Department has been achieving its aims and objectives in line with an appropriate level of control. Figure 8 provides an illustration of the top-level committees that operate in the Department and the chair of each committee.
Figure 8: Board Committee Structure
DepartmentalBoard
Secretaryof State
Group Audit &Risk Assurance
CommitteeAudit Non-ExecutiveBoard Investment
& Commercial CommitteePermanentSecretary
Nominations & Governance
CommitteeLead Non-
Executive DirectorExecutive
CommitteePermanent Secretary
Strategy Committee
Director GeneralRoads, Devolution
and Motoring
PeopleCommittee
Director GeneralResources &
Strategy
Capability Comittee
Director GeneralResources &
Strategy
Group People Committee
Director GeneralRoads, Devolution
and Motoring
Executive Non-Executive Meeting
PermanentSecretary
MinistersNon-ExecutivesOfficials
Annual Report and Accounts 2016-1750

Departmental Board3.3 The Secretary of State chairs the Departmental Board. It advises and challenges the Department on its strategic direction, and on the operational implications and effectiveness of its portfolio. The Board achieves this by drawing on the commercial, operational and political expertise of its members, which comprises Ministers, civil service leaders and Non-Executive Board Members.
3.4 During 2016-17 the Board met on five occasions and provided:
» advice on the Department’s strategic vision, helping to inform major projects such as High Speed 2, aviation capacity, and road and rail investments;
» scrutiny and oversight on the overall performance and financial position of the central Department and its agencies, to ensure that the design, capacity and capability of the organisation matched current and future commitments and plans; and
» monitoring and review of key risks and the effectiveness of risk management processes within the Department.
The Board Effectiveness Review3.5 This year’s Board Effectiveness Review has been overseen by Ed Smith, Lead Non-Executive Board Member. This year’s review was independently assured by Sir Theodore Agnew, Lead Non-Executive Member at the Ministry of Justice. The review sought views on:
» the ways in which the Board worked well;
» areas for improvement; and,
» good practices which could further strengthen the Board’s effectiveness.
3.6 Stakeholders reported a high level of satisfaction with the operation of the Board and committee contribution to the Department. The Board was seen collectively as fulfilling its role in an advisory capacity to Ministers and to officials whilst also maintaining an appropriate level of governance oversight for a departmental board. However the Board will undergo significant change in Non-Executive Board Membership during 2017 and good succession management will be important as well as effective induction so that the Board continues to be effective both during and after the transition.
Sub-committees to the Board3.7 Supporting the Departmental Board are a number of sub-committees that have contributed to the work of the Department over the past year:
» Executive Committee (ExCo) – meets weekly to steer strategic vision, maintain a strategic oversight and scrutiny of the Department’s major delivery commitments, and to take key management decisions on the everyday running of the Department. ExCo has four sub-committees that work alongside it;
» Executive and Non-Executive Meeting (ENEM) – provides an opportunity for more in-depth support, advice and scrutiny from the Non-Executive Board Members;
Annual Report and Accounts 2016-17 51
The Accountability Report The Governance Statement

» Board Investment and Commercial Committee (BICC) – reviews ‘Tier 1’ projects and programmes to provide challenge and guidance to project and programme leads and to inform advice to Ministers;
» Nominations and Governance Committee – is concerned with developing leadership and potential of staff; succession planning and appointments of senior posts and implementation of corporate governance policy; and
» Group Audit and Risk Assurance Committee (GARAC) – chaired by Non- Executive Board Member Mary Reilly, supports the Permanent Secretary in their role as head of the Department and Principal Accounting Officer. The committee focuses on the Department’s risk management processes, group assurance activities, and works closely with Internal Audit and the National Audit Office. There are five other non-executive members of GARAC, one from the DfT Board (Richard Brown); the audit committee chair from Highways England (David Hughes); and the Senior Independent Director for Network Rail and Chair of DVSA from March 2017 (Bridget Rosewell). In August 2016, two new independent members were appointed. These were: Niamh McBreen, a director at UK Government Investments and Amarjit Atkar, the director of Assurance at the Ministry of Defence. In September 2016, the GARAC Chair brought together the Non-Executive Chairs of the DfT ALB Audit Committees to exchange views on governance, risk and control within the DfT family and to discuss common areas of interest.
Compliance with the Corporate Governance Code3.8 An assessment of the Department’s compliance with the Corporate Governance Code for Central Government Departments was completed in 2016-17. The assessment found that the Department is compliant with the spirit and principles of the Code across the majority of its aspects. A gap was identified in the supporting provisions of arm’s length bodies oversight where a number of framework agreements were outside their review periods.
3.9 During 2016-17 a number of Framework Agreements have been updated and going forward a review programme is being managed by Governance Division to ensure Framework Documents are regularly reviewed.
3.10 The Cabinet Office has updated the Corporate Governance Code for Central Government Departments, and from 2017-18, the Department will ensure compliance with this new version of the code. The Department is refreshing its internal Corporate Governance Framework to reflect the changes made by the Cabinet Office to its Code.
Annual Report and Accounts 2016-1752

Table 13: Overview of Board and sub-committee attendance for 2016-1734, 35
Name of Board Member
Departmental Board
ENEM Executive Committee
Group Audit and Risk Assurance Committee
Board Investment Commercial Committee
Nominations and Governance Committee
Rt Hon Chris Grayling MP
2/2
Rt Hon John Hayes MP
2/2
Paul Maynard MP 2/2
Andrew Jones MP 5/5
Lord Ahmad of Wimbledon
5/5
Rt Hon Patrick McLoughlin MP
2/3
Robert Goodwill MP 3/3
Claire Perry MP 3/3
Ed Smith 5/5 4/4 2/2
Richard Brown 3/5 4/4 5/8
Mary Reilly 5/5 4/4 8/8
Colette Bowe 5/5 3/4 0/2
Tony Poulter 3/3 2/2
Philip Rutnam 4/5 4/4 42/49 20/23 2/2
David Prout 4/5 4/4 40/49 18/23
Jonathan Moor 4/5 3/4 38/49 20/23 2/2
Lucy Chadwick 4/5 3/4 39/49 16/23
Bernadette Kelly 5/5 4/4 39/49 16/23
Patricia Hayes 4/5 4/4 43/49 20/23
Bridget Rosewell 8/8
David Hughes 6/8
Amarjit Akhtar 2/3
Niamh McBreen 3/3
34 For each sub-committee only Departmental Board- level members who are permanent members of the sub-committee concerned are included.
35 Part-time working patterns may affect ability to attend all meetings.
Annual Report and Accounts 2016-17 53
The Accountability Report The Governance Statement

DfT’s delivery bodies3.11 DfT operates in a large and complex landscape and much of its business is conducted with and through other organisations from smaller non-departmental public bodies (NDPBs) to executive agencies such as the DVLA and DVSA and government owned companies such as Network Rail and Highways England.
3.12 Within the DfTc, client, sponsor or shareholder teams manage the relationship with delivery bodies at a working level by following the principles set out in a Framework Agreement. Each Framework Agreement is developed with the delivery body, setting out the accountabilities and key relationships between the delivery body and the Department and describing the governance arrangements that support it.
3.13 The Government’s new Code of Good Practice on Partnerships between Departments and Arm’s Length Bodies sets out the principles and standards of effective working relationships.36 In relation to the Code the Department already follows many of the best practice examples and is learning from others to strengthen our relationships further.
3.14 The DfT Board is updated on the performance of executive agencies and other key delivery bodies through a regular agenda item on management information. Each delivery body follows the Department’s management assurance process, the results of which are reviewed at GARAC.
3.15 During the year it came to light that two of the Department’s delivery bodies,
36 www.gov.uk/government/publications/partnerships-with-arms-length-bodies-code-of-good-practice
HS2 Ltd and Transport Focus, made redundancy and ex-gratia payments to staff without prior approval of either the Department or HM Treasury, despite the requirement for this being clearly set out in Managing Public Money and the framework agreements between the Department and the bodies concerned. The Department is working to strengthen its control environment and Management Assurance process with its delivery bodies to address these weaknesses.
3.16 The Department is required to regularly review its Executive Agencies, NDPBs and NMDs through the Cabinet Office Tailored Review programme. Tailored Reviews are an opportunity to examine public bodies with the aim to ensure they remain fit for purpose, well governed and properly accountable for what they do. During 2016-17 we have been reviewing the status of Directly Operated Railways focusing on its public body classification as an NDPB.
Our approach to risk3.17 Risk management is part and parcel of everything we do, from how we manage our programmes and our money, to how we develop our policy and work with our delivery bodies.
3.18 The DfT Board has signed up to the following risk management principles:
» DfT promotes a transparent ‘no surprises’, ‘no blame’ culture where we understand that considered and well-managed risk taking is necessary to deliver our business. However our priority is still to reduce those risks that affect our transport infrastructure, our finances, programme delivery and reputation;
Annual Report and Accounts 2016-1754

» Managers lead by example to encourage the right behaviours; and
» Risk management behaviours should be embedded into all Departmental activities.
3.19 Following a risk management maturity exercise at the end of March 2016 to identify where we could be better, we have worked to strengthen our risk management processes. A new approach has been agreed which will allow Directors and Boards to have better risk discussions and reduce the administrative load. As well as doing new things to strengthen our processes, we are also building on what is already best practice, including:
» The ‘Senior Leadership Risk Group’ established in 2016-17. This new Group ensures that we have identified all our top corporate threats and are doing enough to counter them. The Group also undertakes reviews of each Director General-led Group’s top-level risk registers, as a further part of the ‘second-line of defence’ assurance process;
» Completing a set of risk ‘Deep Dives’. These ‘Deep Dives’ focus on how we are managing some of our key threats and are carried out by GARAC. GARAC focuses on risk process and gives assurance directly to the Board;
» Continuing to train staff engaged in managing our risks with a new training programme being developed to support the proposed new approach mentioned above; and
» Using the new ‘Management of risk in government’ framework to make sure our new approach aligns with this best-practice document. Numerous examples cited in the framework originate from this Department, which further illustrates how DfT is striving to be ever better by building on existing best-practice.
Annual Report and Accounts 2016-17 55
The Accountability Report The Governance Statement

Our approach can be summarised in Figure 9:
Figure 9: Overview of DfT’s risk processes
Monthly reporting on risk to enable the Departmentto better deliver its objectives. ‘Deep Dive’ reviews are
carried out by the Group Audit and Risk AssuranceCommittee to further assure the Board and ExCo.
How do we check and oversee what’s done?Who does what?
Assuring that the strategic risks identified are theright ones and are being managed appropriately.ExCo set the tone and act as exemplars ofrisk management.
DGs and Directors are responsible andaccountable for individual, complex riskscutting across DfT and within business areas.They provide oversight to the portfolio ofrisks and issues.
An ‘open’ risk appetite, signed up to byExCo, has been set for the Department,reflecting the role the Department playsin strengthening the UK’s infrastructure.
Effective risk management is delivered through an active approach to managing risks, clear roles and responsibilities and committee structures. Supporting a cohesive approach to department-wide system.
Roleof theBoard
Role of Directors
Risk appetite
Risk and governance process, including how we run our programmes
and steward ourdelivery bodies
Information and Communication– Feedback loop
Mandate of Corporate
Risk Management
Assurance andthree linesof defence
Risk process – managementand control
Risk maturity
CultureResources and
capability
To support delivery of the Department’sRisk Management Policy and Strategyby working with Directors Generaland their teams to enableimprovements in effectiveapplication of risk management.
Frameworks exist to identify,assess and control current andemerging risks across thedepartment – with a newapproach being broughtin to strengthen.
Challenge and risk reporting in DfT.
Monthly review of risks at to monitor strategic risksand escalate to ExCo, if required. A new director-led
Senior Leadership Risk Group, provides robustchallenge and quality assurance on how well
we are managing our top-level Corporateand Group risk sets.
Monthly reviews facilitate challenge ofthe gap between risk exposure and
tolerance, as well as the levelof tolerance set.
Governance Division act as a centre ofexcellence and challenge using
key stakeholders and fora, such asthose on investment, to assess and
challenge the current situation.
The Group Audit & Risk Assurance Committee reviews the risk
management framework with GIAA providing an independent
annual opinion.
Risk maturity is assessedyearly with weaknesses
addressed to strengthenrisk capability.
RiskCo-ordinator
network.
A comprehensive Performance and
Risk Management information system
with trained risk coordinators
Risk managementis understood to beeveryone’s responsibilityand is built into theway we work toenable appropriatebehaviours.
Annual Report and Accounts 2016-1756

Top level risks in 2016-17 and key mitigating factors3.20 The nature of the Department’s business means that it has to manage a range of risks.
3.21 Our delivery bodies also have their own risk management systems and compile their own ‘top level’ registers, which we have oversight of.
3.22 Table 14 sets out the top-level risks, that affected the Department in 2016-17.
Table 14: DfT’s top-level risks 2016-17
Main top-level risks What are doing about them?
High Speed Rail is not delivered to time and to cost
Further to the Periodic Update on HS2 costs (as given at the Public Accounts Committee on 14 September 2016), we are working with HS2 Ltd to further develop the programme schedule to increase confidence and incorporate efficiencies which will improve budget confidence, providing best value for money to the UK taxpayer.
This includes:
» Further developing the schedule for each phase of HS2 to increase delivery confidence levels.
» Designing the HS2 route to be as cost efficient as possible, whilst still meeting requirements of the business and maximising all potential realisation of benefits.
» Incentivising the supply chain to drive efficiency through the contracts for design and construction.
» Benchmarking costs against other major infrastructure projects to drive efficiencies.
Annual Report and Accounts 2016-17 57
The Accountability Report The Governance Statement

Table 14: DfT’s top-level risks 2016-17
Main top-level risks What are doing about them?
Impacts for transport services and associated industries arising from EU exit
Until negotiations are further advanced, the future regulatory arrangements for international transport operators will be uncertain. The Department is undertaking the necessary work to allow the transport industry and their customers to adapt as smoothly as possible to the successor regime. Steps we are taking to mitigate this risk include:
» Ensuring the needs and interests of the transport industry and its customers are understood as negotiations commence.
» Keeping under constant review the various plausible outcomes, and identifying any Government actions that would help smooth the transition.
» Ensuring sufficient resource and capability is in place to support this work.
That new Airport Capacity is not delivered in a timely way in the South East
» Heathrow north-west runway scheme announced as Government’s preferred vehicle for delivering additional capacity in the south-east.
» A consultation on a draft airports National Policy Statement (NPS) was launched in February 2017 and the Department has led a proactive communications campaign to publicise the consultation.
» Work is underway to consider potential plans and delivery structures with Heathrow Airport Limited (HAL) and other delivery bodies, in order that the scheme and surface access arrangements can be progressed in a timely way if the NPS is designated.
» The Civil Aviation Authority (CAA) has been commissioned to oversee airport – airline engagement on potential scheme design. The CAA are also undertaking a number of consultations on the regulatory framework for airport expansion.
» Continued engagement across Government on a range on interdependent areas including air quality.
Impacts on public health and the environment if air quality and carbon targets are not met
» The National Emission Reduction Plan detailing how Government plans to achieve its carbon budget targets will be published during 2017. Transport measures are likely to play a significant part in the plan and DfT has been working very closely with BEIS on the development of the plan.
» The Joint Defra/ DfT Air Quality Unit (JAQU) has been expanded to deliver a revised draft Air Quality plan focused on Nitrogen Oxides. A draft plan was published on 5 May and a comprehensive final plan setting out a cost effective and rapid route to compliance will be published by 31 July 2017.
» There has also been continuous work to improve the emissions compliance of existing vehicles, push for tougher standards at European level and accelerate the longer term transition to zero emission vehicles where the UK is now a leading market.
Annual Report and Accounts 2016-1758
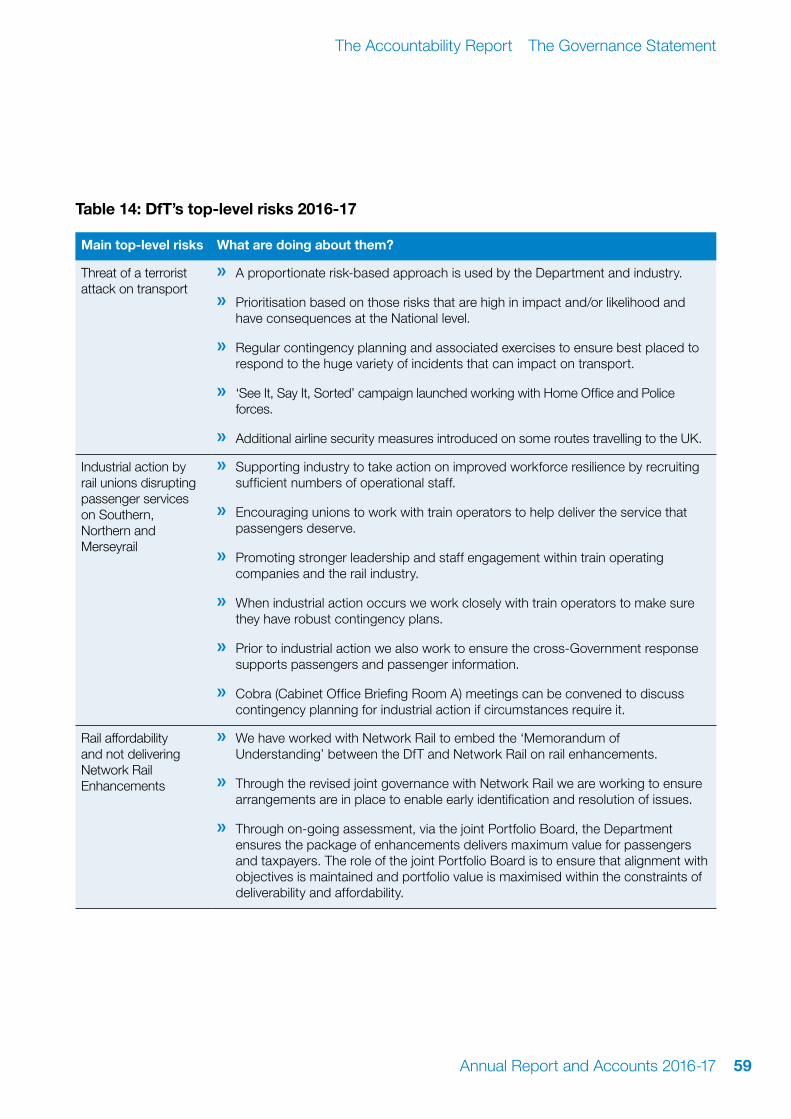
Table 14: DfT’s top-level risks 2016-17
Main top-level risks What are doing about them?
Threat of a terrorist attack on transport
» A proportionate risk-based approach is used by the Department and industry.
» Prioritisation based on those risks that are high in impact and/or likelihood and have consequences at the National level.
» Regular contingency planning and associated exercises to ensure best placed to respond to the huge variety of incidents that can impact on transport.
» ‘See It, Say It, Sorted’ campaign launched working with Home Office and Police forces.
» Additional airline security measures introduced on some routes travelling to the UK.
Industrial action by rail unions disrupting passenger services on Southern, Northern and Merseyrail
» Supporting industry to take action on improved workforce resilience by recruiting sufficient numbers of operational staff.
» Encouraging unions to work with train operators to help deliver the service that passengers deserve.
» Promoting stronger leadership and staff engagement within train operating companies and the rail industry.
» When industrial action occurs we work closely with train operators to make sure they have robust contingency plans.
» Prior to industrial action we also work to ensure the cross-Government response supports passengers and passenger information.
» Cobra (Cabinet Office Briefing Room A) meetings can be convened to discuss contingency planning for industrial action if circumstances require it.
Rail affordability and not delivering Network Rail Enhancements
» We have worked with Network Rail to embed the ‘Memorandum of Understanding’ between the DfT and Network Rail on rail enhancements.
» Through the revised joint governance with Network Rail we are working to ensure arrangements are in place to enable early identification and resolution of issues.
» Through on-going assessment, via the joint Portfolio Board, the Department ensures the package of enhancements delivers maximum value for passengers and taxpayers. The role of the joint Portfolio Board is to ensure that alignment with objectives is maintained and portfolio value is maximised within the constraints of deliverability and affordability.
Annual Report and Accounts 2016-17 59
The Accountability Report The Governance Statement

Table 14: DfT’s top-level risks 2016-17
Main top-level risks What are doing about them?
The Rail Franchising Programme is not delivered
» Ongoing and extensive senior level engagement with the market.
» Supporting potential new bidders by reducing barriers to entry, including undertaking teach-ins on the processes.
» Amendments to the commercial model for franchising, to address bidder concerns on level of risk transfer and amounts of risk capital required.
» Closely monitoring existing franchise performance; have the operator of last resort to take over in the event of failure.
» The Franchise schedule is kept under close review, giving the market clarity on the direction of travel of the programme. Maintaining a continuous sustainable deal flow to the market supports delivery of the benefits of competition and innovation.
That the first Road Investment Strategy (RIS1) is not delivered to the scale and pace expected
» There has been increased engagement by Highways England with the Office of Rail and Road in producing the latest capital baseline for the 2016-17 Delivery Plan update.
» DfT has been working closely with Highways England to ensure that the capital programme is optimised.
» The following is in place to monitor and maintain progress:
– Monthly reporting by Highways England on performance;
– Monthly/Quarterly DfT sponsor meetings held between DfT and Highways England to discuss delivery; and
– Regular updates to Ministers and Accounting Officer;
» An agreed, revised and optimised schedule is being put in place, into a formal change control programme. This will be in the annual delivery plan update in 2017.
» A review of assurance is to be conducted in 2017.
Annual Report and Accounts 2016-1760

Table 14: DfT’s top-level risks 2016-17
Main top-level risks What are doing about them?
Insufficient capacity and capability to deliver the Department’s key Priorities
» A Strategic Workforce Plan was developed in December 2016 which identifies actions across four key areas to ensure DfT has the capability it needs by; establishing and developing professional capability, building core skills, improving diversity; and realising efficiencies by being more joined-up
» A capability Committee has been established to drive forward activity across all professions, with a focus on improving Commercial, Project Delivery and Digital skills.
» Continued focus on building strong and capable leaders through our established leadership development programmes.
» Recruitment of a third cohort for our Commercial Development Programme and launched a new Commercial Expertise Programme for more senior staff. Strengthening pipelines into Project Delivery and Digital roles through the Fast Streams and Apprenticeships.
Annual Report and Accounts 2016-17 61
The Accountability Report The Governance Statement

Managing information and information security3.23 The Department is committed to looking after and making the best use of its information. All information assets are protected in line with the Government’s Security Policy Framework,37 with more sensitive assets being managed by a network of trained information asset owners (IAOs).
3.24 A health check is carried out annually to provide assurance on DfT’s compliance with the Security Policy Framework, with the outcome reported to Cabinet Office. Whilst the check for 2016-17 is currently ongoing (the deadline for completion is 14 July 2017), the one for 2015-16 was subject to peer review by another government department, and our approach was found to be “mature and well run”.
3.25 Last year we reported on a cross-DfT review into cyber security resilience, as well as an audit into the central Department’s cyber security governance arrangements. During 2016-17 we have taken steps to implement the actions from those reviews. A key outcome was the Cyber Security Forward Plan, which sets out 10 areas for further improvements to our cyber security arrangements to be made during 2017-18.
3.26 In 2016-17 the Department engaged with the Government Digital Records Management Project, and undertook work to address the recommendations made within the Better Information for Better Government report.38 This includes initiating a project
37 www.gov.uk/government/publications/security-policy-framework/hmg-security-policy-framework
38 www.gov.uk/government/publications/better-information-for-better-government
to modernise our approach to information management, as well as inviting The National Archives to carry out an Information Management Assessment during May 2017.
3.27 The Department has made further progress in maintaining compliance with the Public Records Act. More than 1,200 paper files have been reviewed and those of historical significance were transferred to The National Archives. This has brought DfT in line with the legislative ‘20 year-rule’ timescales for 2016.
Financial governance, management and controls3.28 It is a key responsibility of the Principal Accounting Officer to ensure that the Department uses its resources efficiently, economically and effectively. All those concerned with the administration of the Department support the Principal Accounting Officer in discharging those responsibilities, including following appropriate governance and management processes. They are supported by specialists in corporate functions who maintain processes to ensure that suitable arrangements are in place in areas such as financial governance; financial and corporate planning; financial loss; fraud, bribery and whistleblowing; and localism and accountability.
Financial governance3.29 The Department’s business planning process allocates the budget voted by Parliament to all parts of the organisation. Group Finance Directorate monitors budget changes to ensure they have been implemented in accordance with decisions made by Ministers and the Board, and reviews the actual and forecast outturns each month to check that expenditure is
Annual Report and Accounts 2016-1762

managed in line with approved budgets. This monitoring is designed to ensure that the Department does not breach any of the Parliamentary control totals (resource DEL, capital DEL, resource AME, capital AME, cash and administration), while also providing advice on options to ensure best use of available resources.
Ministerial Direction3.30 The Permanent Secretary sought a Ministerial direction on 24 May 2016 over a proposed extension of the Department’s liabilities associated with the Garden Bridge project. The Garden Bridge Trust had asked the Department to underwrite up to £15 million of the costs that would be triggered in the event that the project had to be cancelled, as an extension to the Department’s existing contribution to the project’s development costs. The Trust had argued that the project could not continue without such an underwriting, and that no other backer was prepared to provide it. The Permanent Secretary considered that agreeing to this request would disproportionately increase the Department’s exposure to the consequences of failure of a project where there remained a number of serious risks to delivery, and whose transport benefits were limited.
3.31 The then Secretary of State provided a direction to confirm the Department would underwrite the costs. He considered that benefits to the London economy were wider than those captured by the Department’s assessment, and that a failure to underwrite the potential cancellation costs would be highly likely to trigger the cancellation of the project, meaning that the money already contributed to the project by the public sector would be wasted.
3.32 On 28 April 2017, the Mayor of London wrote to the Garden Bridge Trust to say that the Greater London Authority could no longer provide the necessary Mayoral guarantees in respect of the Bridge’s ongoing maintenance costs.
Financial and corporate planning3.33 This year’s Business Planning process confirmed budgets for 2017-18, aimed at aligning both people and financial resources to the Department’s objectives and Ministers’ priorities. Forecasts were made for each work stream to enable prioritisation decisions to be taken against a backdrop of increased capital investment and tighter resource budgets. The budget allocation for 2017-18 was then recommended for approval by Ministers at the Department’s Executive Committee in early March 2017.
Fraud, bribery and whistleblowing3.34 The Department follows the Cabinet Office guidelines and takes a ‘zero tolerance’ approach in the event of any fraud or bribery. Within the Department and its agencies, any suspected cases of fraud or corruption are investigated fully and disciplinary and/or legal action is taken where appropriate. During 2016-17 Counter Fraud became a civil service profession and a number of counter fraud standards have now been agreed and rolled out by Cabinet Office. Going forward the Department will have an annual Action Fraud Plan that focuses on activities to help identify and prevent fraud.
3.35 The Department holds quarterly meetings of its Fraud, Error and Debt Group, comprising fraud officers and other representatives from business units across the Department, its agencies and other arm’s length bodies. It considers updates
Annual Report and Accounts 2016-17 63
The Accountability Report The Governance Statement
from group members on counter-fraud activity across the Department, advice and initiatives from the Cabinet Office and other agencies, information sharing, best practice and any areas of concern impacting on the Department’s policies and procedures. All staff in the central Department are required to undertake on-line fraud awareness training.
3.36 In the financial year 2016-17, there was one confirmed fraud case reported in DfTc. This related to a fraudulent grant payment of £200,000. DfTc also received a grant application for £197,000 which was deemed to be fraudulent and payment was stopped before being progressed further. Where appropriate, incidents occurring within the Department’s agencies and arm’s length bodies during 2016-17 have been noted in their own governance statements.
3.37 Whistleblowing has remained a high priority throughout 2016-17, and activity has continued to ensure a culture of confidence and safe environment to raise a concern is preserved in the Department. In the financial year 2016-17 the Department had 20 whistleblowing cases raised, 5 of which were dismissed as whistleblowing cases and 10 of which are still ongoing. There was a 50:50 split of known to anonymous whistleblowers, and we believe this reflects positively on the Department’s open culture. Our 2016 Staff Survey results showed that 64% of our people felt confident that if they raised a concern it would be investigated properly. This has fallen from last year’s figures, and is slightly below the Civil Service average.
3.38 We currently have eight Nominated Officers across the DfT Group, with at least one in each executive agency. This year our Permanent Secretary appointed the Director of Group Assurance as the Group Nominated
Officer. Responsibilities include supporting local Nominated Officers, acting as a channel of escalation and collecting records for internal and external reporting purposes.
3.39 In October 2016, DfT participated in the Civil Service Whistleblowing Awareness Week, using Civil Service Employee Policy materials, ensuring that staff were aware of the resources available to them, and how the whistleblowing policy works to protect those who blow the whistle.
3.40 In April 2017, the Department held its first annual network meeting for Nominated Officers. The event provided an opportunity for the Department to hear about their experiences of using the policy, identify lessons learnt and best practice and, explore with them areas for improvement i.e. strengthening the robustness of our data collection for reporting purposes and exploring what further steps could be taken to help improve the trust of our employees in the organisation.
Shared Services3.41 DfT has an outsourced arrangement with Arvato for Shared Services covering Finance, HR, Procurement and Payroll transactions and the supporting ERP platform, including hosting, licensing and service management. This arrangement provides services to 14,000 users across the DFT family, and will increase to 16,000 user by September 2017 following the migration of Driver and Vehicle Standards Agency. Following negotiations in 2016 responsibility for the contact was novated back to DfT from Cabinet Office, and the relationship with the supplier re-set. The service has since been stable and will continue to meet DfT family needs until contract end in 2020. We have a well-developed strategy for improving
Annual Report and Accounts 2016-1764

the supporting technology to deliver a more intuitive user experience in the period to 2020, and then further modernise the service at contract end.
Local funding3.42 The Department distributes a number of grants to local government from its departmental expenditure limit (DEL). These can be classified into five broad groups: formula grants, challenge or bid-based grants, the Greater London Authority’s transport grant, the Crossrail grant, or payments to local government in relation to rail services.
3.43 Accountability for this local funding is set out in the Department’s Accounting Officer System Statement.39
Assurance3.44 The Department relies on assurance from multiple sources, consistent with good practice:
» Front-line and business operational areas: the Department has established assurance arrangements over how well objectives are being met and risks managed. These include monthly management reporting, risk registers, reports on the routine system controls, the directors’ annual Management Assurance returns and other management information;
» Management oversight and expert review: separate from the work of those responsible for delivery, this includes investment approval work undertaken by the Department’s investment boards, the
39 www.gov.uk/government/publications/accountability-system-statement
central centres of excellence, analytical assurance, as well as work undertaken by other corporate functions (e.g. Human Resources) and the departmental security teams;
» Independent and objective assurance: this includes the work of internal audit and independent specialists; and
» External reviews: this covers external and independent assurance commissioned by bodies outside the organisation. These include reviews by the National Audit Office and parliamentary select committees. These reviews are usually conducted after a project or event and are a particularly valuable source of learning for the organisation.
3.45 The Department has developed a draft Assurance Framework which clarifies and structures the central Department’s approach to assurance. It covers the Department’s main areas of activity and risk:
» projects and programmes;
» delivery bodies (Arm’s Length Bodies);
» corporate functions; and
» policy and regulation.
3.46 The Assurance Framework sets out the common principles and standard assurance activities that the Department expects to be in place, and how these should be assessed and reported. It aims to embed good assurance practice and to facilitate organisational learning.
Annual Report and Accounts 2016-17 65
The Accountability Report The Governance Statement

Management Assurance3.47 The Department assesses its compliance with its internal controls annually. Each Directorate of DfTc and all of the Department’s delivery bodies complete a return that sets out how each performs against 38 key internal management controls (the revisions for the 2016-17 process resulted in 3 categories of controls being merged together, and the addition of 8 new categories of controls). Responses from each DfTc Directorate were moderated at Directors General chaired challenge sessions. Responses from delivery bodies were reviewed by each body’s Audit and Risk Committee. The Department’s overall results were reviewed by the Group Audit and Risk Assurance Committee.
3.48 The 2016-17 review identified that for DfTc 29 of the 38 areas of internal control the Department overall was rated at ‘substantial’. For the seven areas of internal control where there was evidence of a lack of full compliance, DfTc appointed senior responsible owners to identify the actions required to deliver the necessary improvements. For the delivery bodies included in the process there were 15 areas of internal control where there was evidence of a lack of full compliance. Individual delivery bodies have actions plans in place to identify the actions required to deliver the necessary improvements.
3.49 An internal audit of the 2016-17 Management Assurance process recognised the improvements that had been made since last year, while still outlining areas to strengthen. These included further reviewing some of the questions to ensure all responses could be evidenced by teams and considering if there are options for reducing
the administrative burden of the exercise. The Department will therefore be reviewing process and the content of the returns template that will be used in the 2017-18 Management Assurance cycle.
Analytical assurance3.50 In line with the recommendations of the MacPherson Review of Quality Assurance of Government Analytical Models,40 we developed and published our analytical assurance framework Strength in Numbers41 in June 2014. This is now embedded within the organisation, and has notably improved practices regarding the specification, production and use of analysis.
3.51 As part of the framework, we maintain a register of Business Critical models, each of which has an appointed Senior Model Owner responsible for ensuring appropriate quality assurance of the model and its outputs throughout its lifecycle. Analytical Assurance Statements are routinely produced to accompany submissions to Ministers and Tier 1 and Tier 2 investment boards42 where analysis is used to underpin decisions. These statements highlight the strengths, limitations and uncertainties in the analysis, ensuring decision-makers are fully informed.
3.52 In early 2017 we commenced a review to better understand how our analytical assurance framework is being applied in practice and how well it is meeting
40 www.gov.uk/government/publications/review-of-quality-assurance-of-government-models
41 www.gov.uk/government/publications/dft-analytical-assurance-framework-strength-in-numbers
42 The Tier 2 programmes and projects are reviewed by Director General-led investment boards and have delegation limits of £50-500m for Roads and NR; £10-100m for Motoring Services; £30-100m for High Speed Rail; and £50-100m for all other programmes.
Annual Report and Accounts 2016-1766

its objectives and current needs. As part of this we commissioned an internal audit of quality assurance of business critical models. This has identified some good practice, as well as opportunities to strengthen our approach to quality assurance which we will be looking to address as part our wider programme of work. During the coming year we will continue our active participation in the cross-government Quality Assurance working group, enabling us to share best practice, learn from others and help strengthen analytical assurance across Whitehall.
Project assurance3.53 The Department is committed to building the project delivery capabilities of all its staff and is working closely with the Infrastructure Projects Authority (IPA) to ensure coherency with activities across government. Within its portfolio the Department has 16 projects that form part of the Government Major Projects Portfolio (GMPP) requiring quarterly reporting to the IPA.
3.54 Good assurance remains a priority for the Department and it has formalised the requirement for all top tier projects to have an up to date Integrated Assurance and Approvals Plan (IAAP) signed off by the SRO, promoting this as good practice for all tiers of projects. The Project Delivery Team conduct deep dives each quarter into two IAAPs to assess their robustness and progress against them. The Department will, as part of its portfolio reporting, monitor assurance and approvals to ensure that projects are planning and undertaking appropriate assurance and approvals at relevant points in the project lifecycle.
3.55 The Department continues to grow and maintain good practice application of project delivery. A Centre of Excellence provides centralised advice, guidance and support to the project delivery community and provides a Project and Programme Management (PPM) toolkit & delivery framework. Getting the right people on the right projects at the right time is also a key focus for the Department. A Capability Board ensures that individuals are supported in their professional development activities and that succession planning and help with project delivery recruitment is managed.
3.56 The IPA will publish its annual report on the GMPP in July 2017. In parallel with this, the Department publishes its 2016-17 Quarter 2 GMPP project list which includes the IPA delivery confidence rating, derived from a combination of project size, scale, the degree of risk, complexity and timeframes involved, noting that it is not unusual for projects of a large scale and early on in their lifecycle to have a low delivery confidence assessment.
Independent Assurance 3.57 DfT’s internal audit service is provided by the Government Internal Audit Agency (GIAA), an Executive Agency of HM Treasury. GIAA operates to the public sector internal audit standards, confirmed through its last External Quality Assessment undertaken by the Institute of Internal Auditors in January 2016. The Group Head of Internal Audit (Group HIA) provides the Department’s Accounting Officer with an independent opinion on the adequacy and effectiveness of the Department’s systems of internal control, and makes recommendations for improvement. The work of GIAA is based on its analysis of the Department’s risks, and its
Annual Report and Accounts 2016-17 67
The Accountability Report The Governance Statement

audit programme is endorsed by GARAC. Regular reports are provided by GIAA to the Department’s management, to GARAC and, as appropriate, to the Executive Committee.
3.58 The Group HIA has provided the Permanent Secretary with an annual report on internal audit activity in the Department and its ALBs over the course of 2016-17. This report summarises each of the individual Head of Internal Audit annual opinions for the Department and its ALBs, and provides the Permanent Secretary with the Group HIA’s independent opinion on the adequacy and effectiveness of the Department’s governance, risk management and internal control arrangements.
3.59 The report showed that across the Department and its ALBs, internal audit found evidence that the control environment was improving, with pockets of significant work undertaken over the course of 2016-17 to enhance control frameworks in light of last year’s ‘limited’ Group HIA opinion. Of particular note is the work DVSA and MCA have undertaken to strengthen their control environments, as well as work in DfTc on developing a new simpler approach to risk management, improving the 1st line of defence assurance process, and strengthening the relationship with Network Rail.
3.60 A number of the control weaknesses identified by internal audit across the Department and its ALBs in 2015-16, and which led to last year’s ‘limited’ Group HIA opinion, were still in evidence over the course of this year, and have contributed to the Group HIA providing a ‘limited’ opinion for 2016-17. These control weaknesses are in the following areas:
» Raising awareness within the 1st line of defence of the need to consistently sustain focus on ensuring key controls are well understood and applied, particularly in finance and HR business processes;
» The 2nd line of defence being more agile in identifying areas of non-compliance within the 1st line, with earlier escalation of non-compliance through the department’s governance framework;
» The need to continue to shift focus from an overly mechanistic and theoretical approach to risk identification, to a more practical demonstration of active risk mitigation;
» The need to continue to develop the Department’s relationship with its ALB family to ensure clarity of accountability, delivery, and information and assurance requirements;
» Continued improvements are required on enhancing controls on programmes & projects, particularly the Department’s large, complex rail programmes; and
» Increased focus on ensuring IT operating environments keep pace with the changing needs of users, while maintaining adequate operational controls, particularly on data security and information assurance.
Annual Report and Accounts 2016-1768
3.61 The Department and its ALBs have either developed, or are in the process of developing, action plans to address these challenges, with some action plans in an advanced stage of delivery (eg the refreshing of DfT’s risk management policy).
Conclusion3.62 As Accounting Officer, I have responsibility for reviewing the effectiveness of the system of internal control. I am supported by the work of Internal Audit, by the management assurance reporting of the executive managers within the Department who are responsible for the development and maintenance of the internal control framework and by comments made by the external auditors in their management letter and other reports.
3.63 Philip Rutnam was Principal Accounting Officer during the whole of the 2016-17 financial year. He moved to the Home Office on 3 April 2017 and between 3 April and 18 April 2017 Jonathan Moor, Director General for Resources and Strategy, was appointed as the acting Permanent Secretary and Principal Accounting Officer before I was formally appointed. Over this short period both Jonathan Moor and I received handover briefings from Philip Rutnam and the Finance Director to ensure a smooth handover from one Principal Accounting Officer to another. On taking up the post of Permanent Secretary I have continued to receive assurance on the effectiveness of the system of internal control to enable me to have confidence in these accounts.
3.64 I have been advised by the Chair of the Group Audit and Risk Assurance Committee of reviews and recommendations
carried out during the year on governance, risk and assurance. A plan is in place to address the weaknesses identified by the Group HIA to ensure that continuous improvement is in place.
3.65 I have noted the opinion of the Head of Internal Audit (HIA). The Department and our delivery bodies have been working to strengthen our systems of internal control since last year’s limited assurance opinion by the Group HIA. This includes a refreshed risk policy, greater focus on delivery body governance and new capacity and capability in finance. Whilst I am disappointed that the opinion remains unchanged this year I am encouraged by the recognition that progress has been made and am committed to continuing improvements over the coming year.
Bernadette Kelly 17 July 2017Permanent Secretary and Accounting Officer
Department for Transport Great Minster House 33 Horseferry Road London SW1P 4DR
Annual Report and Accounts 2016-17 69
The Accountability Report The Governance Statement

4. Remuneration and Staff Report
Introduction4.1 The Department for Transport has a diverse workforce, working across Britain in a wide range of roles, from policy developers to critical front line staff such as accident investigators, driving examiners and marine surveyors.
4.2 Since 2010, DfT has made significant workforce efficiencies, whilst balancing the need for people with the right skills to deliver our ambitious capital programmes. In 2016-17 we developed a Workforce Plan to predict future recruitment and build the capability we need now and in the future.
4.3 This section of the Annual Report focuses on our people and our related policies.
Building a strong and capable Workforce4.4 The Department can only fulfil its obligations to the transport agenda through ensuring that our people have the confidence and capability to deliver their objectives. In 2016-17 our focus has been on building strong professions, particularly in our priority areas: commercial, digital and project delivery.
4.5 During 2016-17 each of our professions has conducted a thorough self-assessment and created tailored plans to progress career pathways, talent management and continual professional development. Their work is overseen by the DfT Capability Committee which acts as a forum to maintain, govern, challenge and drive this work.
4.6 DfTc and its executive agencies signed-up 247 apprentices across the UK into schemes in 2016-17, of which 89 were in England. New and existing staff are able to take advantage of apprenticeships. These have ranged from digital apprenticeships to business administration. The Maritime and Coastguard Agency successfully achieved the first ‘single employer’ trailblazer standard for their maritime operations officer role. During 2017 everyone employed into this role will complete this new apprenticeship.
Developing industry capability4.7 The Transport Infrastructure Skills Strategy was published in January 2016 as a response to the risks to our investment programme. These risks are as a result of skills shortages and gaps compounded by an ageing workforce, a lack of diversity and the challenge of attracting talent, all of which are key factors in the stagnating productivity of our sector.
4.8 The strategy sets out stretching ambitions for the creation of apprenticeships, tackling our sector’s poor record on diversity, and recognised the need to collaborate on promoting transport as a career to young people, parents and teachers. Chief Executives (or equivalent) of Network Rail, Highways England, Crossrail, HS2 Limited, and Transport for London all committed to the strategy. STAT was established in April 2016 to drive implementation of the strategy.
4.9 STAT is a voluntary collaboration of transport employers. The Chair is agreed by the Secretary of State for Transport, and ministers are kept informed of progress.
Annual Report and Accounts 2016-1770

Under Chair Mike Brown, Commissioner for Transport for London, and previous Chair Simon Kirby (formerly CEO of HS2 Limited), membership has expanded beyond the original partners to include the Rail Delivery Group, representing train operators, and the Trades Union Congress representing employees. We have also more recently invited participation from the maritime, aviation and road freight sectors. Apprentices have also been introduced to the board to bring their first-hand experience.
Strong Leadership4.10 DfT is committed to developing leadership and management capability at all levels. In 2016-17 we continued our focus on building a strong Senior Civil Service (SCS) leadership community. This included launching the second year of our DfT leadership development programme ‘Momentum’ in collaboration with Civil Service Learning Providers, Kornferry Hay Group.
4.11 In addition, there are a number of programmes across the department for our people in grades below the SCS which aim to build leadership and management capability. For example DfTc runs a programme called Velocity for our Grade 6/7 community and Ignite for our AO to SEO community. These programmes aim to build collaboration and capability amongst the communities.
Talent and Succession4.12 Attracting, developing and retaining talented people has continued to be a priority for DfT. This section highlights our key areas of progress this year.
4.13 The Nominations and Governance Committee, a sub-committee of the Board, reviewed and scrutinised plans for succession into our most senior leadership roles. The Department’s Pay and Performance Committee also reviewed talent and succession plans for the SCS. The DfTc People Committee has continued to oversee talent below director level.
4.14 DfT participated in a number of cross-civil service talent programmes and ran a number of DfT-specific initiatives in 2016-2017 that support talent development across all the grades, including:
4.15 Three Directors were successful in applying for the cross-Government High Potential Development Scheme and nine Deputy Directors successfully applied for the Senior Leaders Scheme following two distinct competitive processes. This is an increase from one and four respectively in 2015-16. One Deputy Director completed the new cross-government talent programme ‘Accelerate’. This programme is aimed at Deputy Directors with a disability or from an ethnic minority background.
4.16 Fifteen people at Grades 6/7 were successful in joining the cross-Government Future Leaders Scheme following a competitive process – an increase from eleven in 2015-16.
4.17 We have developed a high potential network for our people on the corporate talent programmes. This growing network comes together on a quarterly basis.
4.18 We have continued to focus on building our Project Delivery capability through participation on the Major Projects
Annual Report and Accounts 2016-17 71
The Accountability Report Remuneration and Staff Report
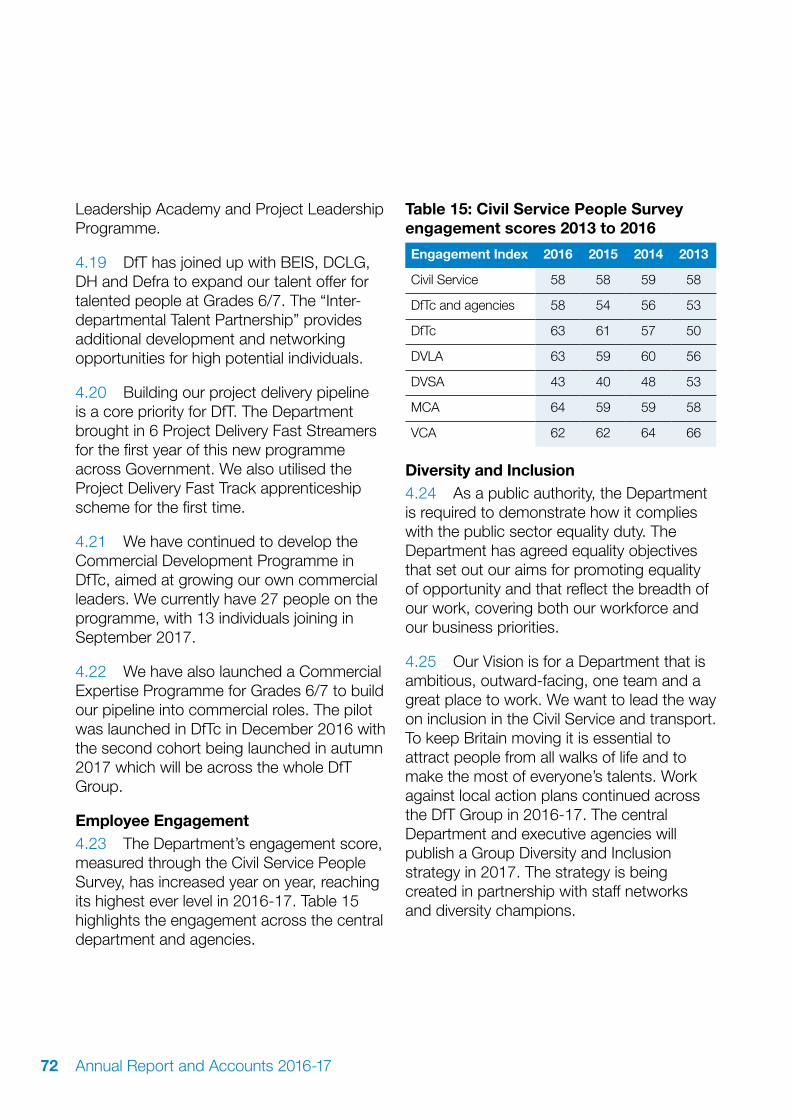
Leadership Academy and Project Leadership Programme.
4.19 DfT has joined up with BEIS, DCLG, DH and Defra to expand our talent offer for talented people at Grades 6/7. The “Inter-departmental Talent Partnership” provides additional development and networking opportunities for high potential individuals.
4.20 Building our project delivery pipeline is a core priority for DfT. The Department brought in 6 Project Delivery Fast Streamers for the first year of this new programme across Government. We also utilised the Project Delivery Fast Track apprenticeship scheme for the first time.
4.21 We have continued to develop the Commercial Development Programme in DfTc, aimed at growing our own commercial leaders. We currently have 27 people on the programme, with 13 individuals joining in September 2017.
4.22 We have also launched a Commercial Expertise Programme for Grades 6/7 to build our pipeline into commercial roles. The pilot was launched in DfTc in December 2016 with the second cohort being launched in autumn 2017 which will be across the whole DfT Group.
Employee Engagement4.23 The Department’s engagement score, measured through the Civil Service People Survey, has increased year on year, reaching its highest ever level in 2016-17. Table 15 highlights the engagement across the central department and agencies.
Table 15: Civil Service People Survey engagement scores 2013 to 2016
Engagement Index 2016 2015 2014 2013
Civil Service 58 58 59 58
DfTc and agencies 58 54 56 53
DfTc 63 61 57 50
DVLA 63 59 60 56
DVSA 43 40 48 53
MCA 64 59 59 58
VCA 62 62 64 66
Diversity and Inclusion4.24 As a public authority, the Department is required to demonstrate how it complies with the public sector equality duty. The Department has agreed equality objectives that set out our aims for promoting equality of opportunity and that reflect the breadth of our work, covering both our workforce and our business priorities.
4.25 Our Vision is for a Department that is ambitious, outward-facing, one team and a great place to work. We want to lead the way on inclusion in the Civil Service and transport. To keep Britain moving it is essential to attract people from all walks of life and to make the most of everyone’s talents. Work against local action plans continued across the DfT Group in 2016-17. The central Department and executive agencies will publish a Group Diversity and Inclusion strategy in 2017. The strategy is being created in partnership with staff networks and diversity champions.
Annual Report and Accounts 2016-1772

4.26 DfT publishes its equality monitoring data annually on the gov.uk website.
4.27 DfT has Level 3 Disability Confident Leader status. This means that our progress against all core Disability Confident actions has been verified by an external assessor. We are also undertaking leadership activity, such as providing support and assessment to other organisations.
4.28 The Department provides workplace adjustments to employees with medical conditions, and appropriate training when needed. The Department was twice runner- up for a diversity award for the standard of reasonable adjustments provided.
4.29 The Department also supports positive action initiatives (such as positive action pathways) by which employees from under-represented groups are considered for positive action programmes. The Department has active staff networks, for example the network for disabled employees who are key partners in making the department more disability confident. The Department has a Director General Champion for disability who actively supports the network and challenges the business to become more disability confident. Work by the gender equality network during the 2016-17 year led to DfT being included in the Times Top 50 Employers for Women list in April 2017.
4.30 The Department’s professional body memberships include the Business Disability Forum, which provides consultancy, training and best practice sharing.
Employee Policy4.31 The Department regularly consults with staff representative bodies on all matters that affect its people and ensures that staff are consulted and informed of any changes that are made that will affect them through line manager briefings, written communications and staff updates.
4.32 Average working days lost to sickness absence for the 12 month period ending 31 March 2017 for DfTc and its executive agencies was 8.4 days. This is no change on the year to 31 March 2016. All absence is reviewed to ensure that support is offered and occupational health reports, action plans and interventions are progressed as appropriate. The Department has a working group which considers work to improve wellbeing and reduce sickness absence, and has a programme in place to support staff and improve wellbeing.
Annual Report and Accounts 2016-17 73
The Accountability Report Remuneration and Staff Report
Remuneration policy – Senior Civil Service4.33 Senior Civil Service (SCS) pay and conditions are not delegated to individual departments. The SCS is a corporate resource, employed with a common framework of terms and conditions.
4.34 Recommendations on SCS remuneration are provided by the Review Body on Senior Salaries (SSRB) in an annual report to the Prime Minister. Further information about its work and copies of the annual reports can be found on SSRB’s website.43
4.35 The Government’s response to the recommendations of the SSRB is communicated to departments by the Cabinet Office, and the remuneration of the DfT’s senior civil servants is determined by the Department’s Pay and Performance Committee in accordance with that central guidance.
43 www.gov.uk/government/organisations/review-body-on-senior-salaries
Performance management4.36 Performance against Cabinet Office determined core objectives, and relative to SCS peers, determines allocation to a performance group, to which non- consolidated variable pay is linked. There are three performance groups:
» top – top 25% of performers;
» achieving – next 65% of performers;
» low – bottom 10% of performers.
4.37 To be allocated to the top performance group, an individual must deliver to the highest standards in all objective categories.
4.38 The annual value of non-consolidated performance pay and base pay is set within the limits set by the Government’s response to the recommendations of the Review Body on Senior Salaries.
4.39 Performance group determines the eligibility point for non-consolidated performance pay determination. For 2016-17, only the top 25% of performers received an award.
4.40 In 2016-17, base pay increases were available for members of the SCS who were in the ‘top’ and ‘achieving’ performance groups in line with SCS Pay Policy determined by the Cabinet Office.
Annual Report and Accounts 2016-1774
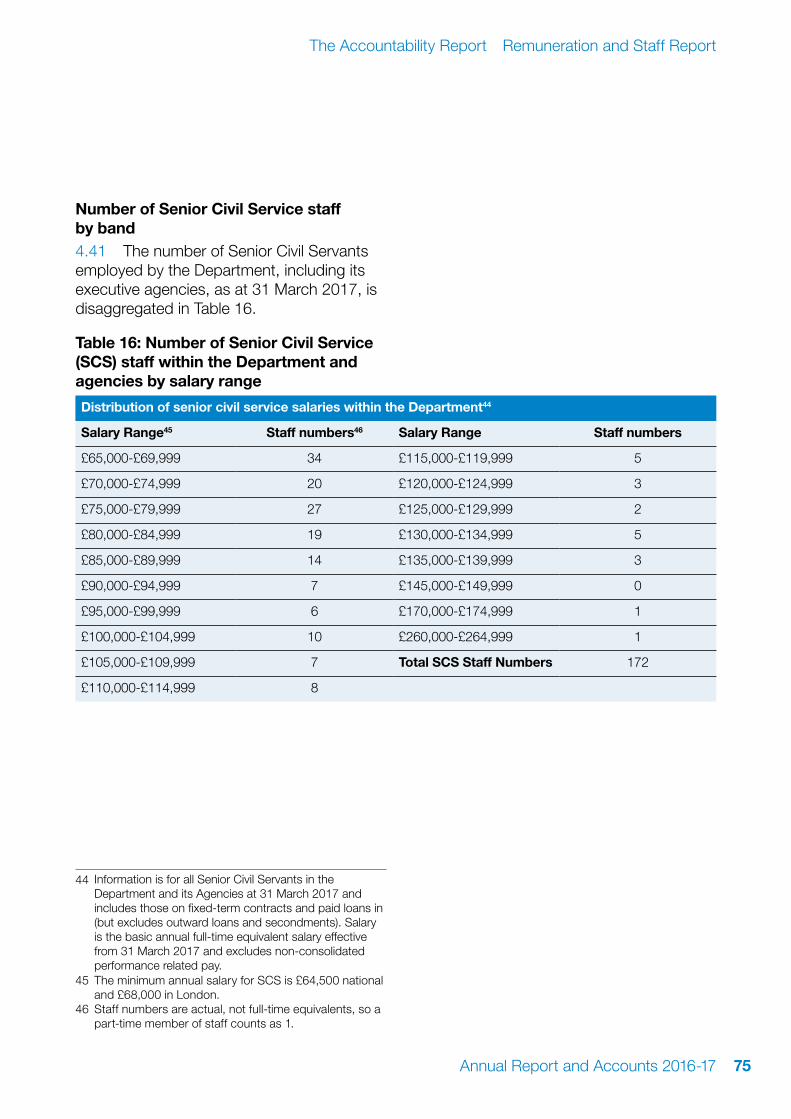
Number of Senior Civil Service staff by band4.41 The number of Senior Civil Servants employed by the Department, including its executive agencies, as at 31 March 2017, is disaggregated in Table 16.
Table 16: Number of Senior Civil Service (SCS) staff within the Department and agencies by salary range
Distribution of senior civil service salaries within the Department44
Salary Range45 Staff numbers46 Salary Range Staff numbers
£65,000-£69,999 34 £115,000-£119,999 5
£70,000-£74,999 20 £120,000-£124,999 3
£75,000-£79,999 27 £125,000-£129,999 2
£80,000-£84,999 19 £130,000-£134,999 5
£85,000-£89,999 14 £135,000-£139,999 3
£90,000-£94,999 7 £145,000-£149,999 0
£95,000-£99,999 6 £170,000-£174,999 1
£100,000-£104,999 10 £260,000-£264,999 1
£105,000-£109,999 7 Total SCS Staff Numbers 172
£110,000-£114,999 8
44 Information is for all Senior Civil Servants in the Department and its Agencies at 31 March 2017 and includes those on fixed-term contracts and paid loans in (but excludes outward loans and secondments). Salary is the basic annual full-time equivalent salary effective from 31 March 2017 and excludes non-consolidated performance related pay.
45 The minimum annual salary for SCS is £64,500 national and £68,000 in London.
46 Staff numbers are actual, not full-time equivalents, so a part-time member of staff counts as 1.
Annual Report and Accounts 2016-17 75
The Accountability Report Remuneration and Staff Report

Pay and Performance Committee4.42 This Committee comprises the Department for Transport’s Permanent Secretary (as Chairperson), all Directors General and the Group HR Director.
4.43 For the year to 31 March 2017, its members were:
Philip Rutnam Permanent Secretary, Department for Transport
Lucy Chadwick Director General, International, Security and Environment
David Prout Director General, High Speed 2
Jonathan Moor Director General, Resources & Strategy
Bernadette Kelly Director General, Rail
Patricia Hayes Director General, Roads, Devolution & Motoring
Rachael Etebar Group HR Director
4.44 The Committee’s remit includes making pay decisions for directors and deputy directors. The Permanent Secretary decides on pay for Directors General.
Service contracts4.45 The Constitutional Reform and Governance Act 2010 requires Civil Service appointments to be made on merit on the basis of fair and open competition. The Recruitment Principles published by the Civil Service Commission specify the circumstances when appointments may be made otherwise.
4.46 Unless otherwise stated below, the officials covered by this report hold appointments which are open-ended. Early termination, other than for misconduct, would result in the individual receiving compensation as set out in the Civil Service Compensation Scheme.
4.47 Further information about the work of the Civil Service Commission can be found at www.civilservicecommission.org.uk
Remuneration (including salary) and pension entitlements (audited)4.48 The following sections provide details of the remuneration and pension interests of DfT ministers and executive board members of the Department.
Annual Report and Accounts 2016-1776

Table 17: Ministers’ remuneration4748
Ministers 2016-17 2015-16
Salary (£)
Benefits in Kind
(to nearest £100)
Pension benefits
(to nearest £1000)
Total benefits
(to nearest £1000)
Salary (£)
Benefits in Kind
(to nearest £100)
Pension benefits47
(to nearest £1000)
Total benefits
(to nearest £1000)
Rt Hon Chris Grayling MP Secretary of State (from 14 July 2016)
45,003 - 13,000 58,000 - - - -
Full-year equivalent 67,505
Rt Hon Patrick McLoughlin MP Secretary of State (until 13 July 2016)
19,235 - 8,000 27,000 67,505 - 62,000 130,000
Full-year equivalent 67,505
Baroness Susan Kramer Minister of State (until 8 May 2015)
- - - - 8,271 - 3,000 11,000
Full-year equivalent 78,891
Robert Goodwill MP48 Minister of State (until 14 July 2016)
10,560 - 2,000 13,000 25,277 - 11,000 36,000
Full-year equivalent 31,680 31,680
Rt Hon John Hayes MP Minister of State (from 15 July 2014 to 11 May 2015)
- - - - 3,577 1,000 5,000
Full-year equivalent 31,680
Rt Hon John Hayes MP Minister of State (from15 July 2016)
21,120 - 6,000 27,000 - - -
Full-year equivalent 31,680
Claire Perry MP Parliamentary Under Secretary of State (until 15 July 2016)
6,496 - 2,000 8,000 22,375 - 8,000 30,000
Full-year equivalent 22,375
47 The value of pension benefits accrued during the year is calculated as (the real increase in pension multiplied by 20) less (the contributions made by the individual). The real increase excludes increases due to inflation or any increase or decrease due to a transfer of pension rights.
48 Robert Goodwill MP was appointed as a Minister of State in December 2015, having previously served as a Parliamentary Under Secretary of State. For this reason his 2015-16 ministerial salary is lower than his full-year equivalent salary for that year.
Annual Report and Accounts 2016-17 77
The Accountability Report Remuneration and Staff Report

Ministers 2016-17 2015-16
Salary (£)
Benefits in Kind
(to nearest £100)
Pension benefits
(to nearest £1000)
Total benefits
(to nearest £1000)
Salary (£)
Benefits in Kind
(to nearest £100)
Pension benefits47
(to nearest £1000)
Total benefits
(to nearest £1000)
Paul Maynard MPParliamentary Under Secretary of State (from 15 July 2016)
15,879 - 4,000 20,000 - - - -
Full-year equivalent 22,375
Lord Ahmad of Wimbledon Parliamentary Under Secretary of State (from 12 May 2015)
72,470 - 18,000 90,000 64,288 - 21,000 85,000
Full-year equivalent 72,470
Andrew Jones MP Parliamentary Under Secretary of State (from 12 May 2015)
22,375 - 6,000 28,000 19,849 - 5,000 25,000
Full-year equivalent 22,375
Annual Report and Accounts 2016-1778
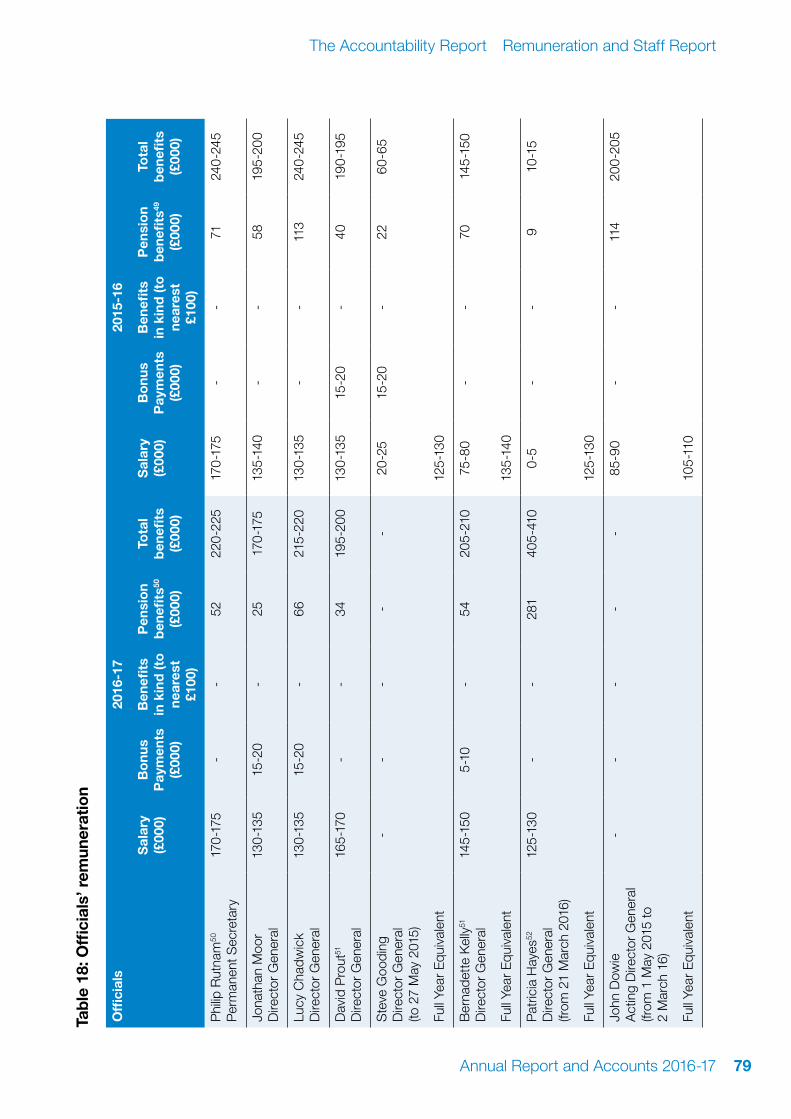
Tab
le 1
8: O
ffici
als’
rem
uner
atio
n
Offi
cial
s20
16-1
720
15-1
6
Sal
ary
(£00
0)B
onu
s P
aym
ents
(£
000)
Ben
efits
in
kin
d (t
o
near
est
£100
)
Pen
sio
n b
enefi
ts50
(£00
0)
Tota
l b
enefi
ts
(£00
0)
Sal
ary
(£00
0)B
onu
s P
aym
ents
(£
000)
Ben
efits
in
kin
d (t
o
near
est
£100
)
Pen
sio
n b
enefi
ts49
(£
000)
Tota
l b
enefi
ts
(£00
0)
Phi
lip R
utna
m50
P
erm
anen
t Sec
reta
ry17
0-17
5-
-52
220-
225
170-
175
--
7124
0-24
5
Jona
than
Moo
r D
irect
or G
ener
al13
0-13
515
-20
-25
170-
175
135-
140
--
5819
5-20
0
Lucy
Cha
dwic
k D
irect
or G
ener
al13
0-13
515
-20
-66
215-
220
130-
135
--
113
240-
245
Dav
id P
rout
51
Dire
ctor
Gen
eral
165-
170
--
3419
5-20
013
0-13
515
-20
-40
190-
195
Ste
ve G
oodi
ng
Dire
ctor
Gen
eral
(to
27
May
201
5)
--
--
-20
-25
15-2
0-
2260
-65
Full
Year
Equ
ival
ent
125-
130
Ber
nade
tte
Kel
ly51
D
irect
or G
ener
al14
5-15
05-
10-
5420
5-21
075
-80
--
7014
5-15
0
Full
Year
Equ
ival
ent
135-
140
Pat
ricia
Hay
es52
D
irect
or G
ener
al
(from
21
Mar
ch 2
016)
125-
130
--
281
405-
410
0-5
--
910
-15
Full
Year
Equ
ival
ent
125-
130
John
Dow
ie
Act
ing
Dire
ctor
Gen
eral
(fr
om 1
May
201
5 to
2
Mar
ch 1
6)
--
--
-85
-90
--
114
200-
205
Full
Year
Equ
ival
ent
105-
110
Annual Report and Accounts 2016-17 79
The Accountability Report Remuneration and Staff Report
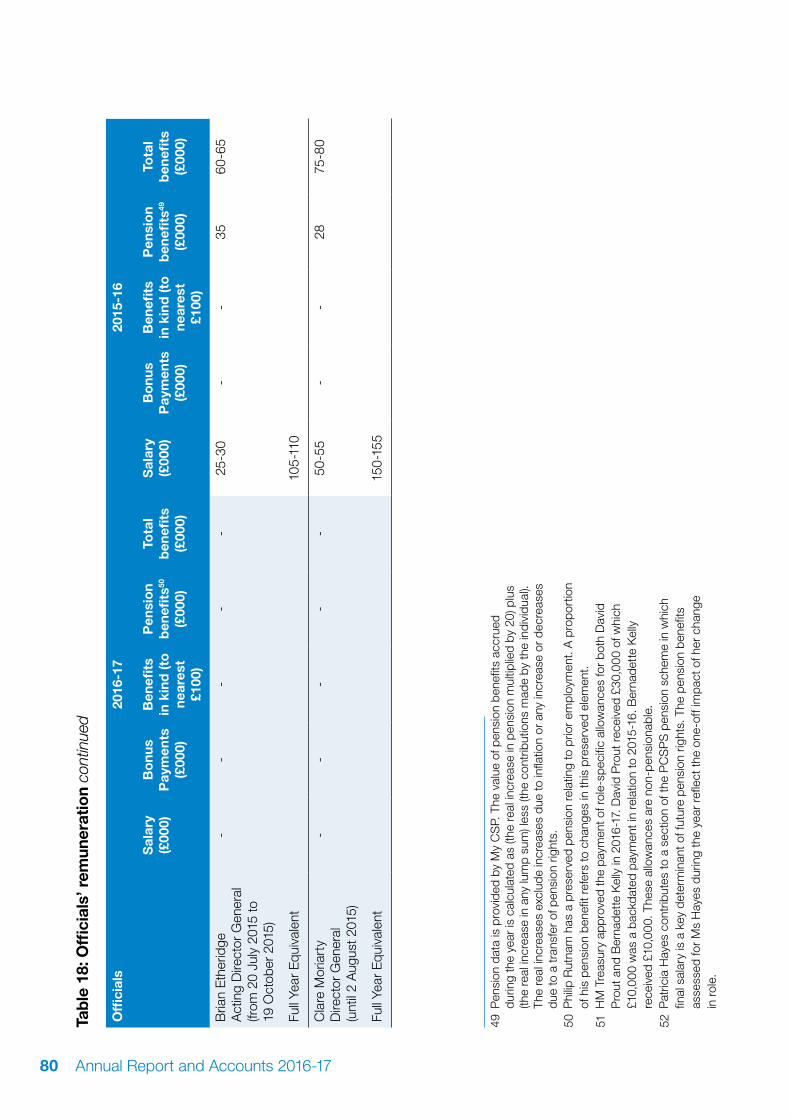
Tab
le 1
8: O
ffici
als’
rem
uner
atio
n co
ntin
ued
Offi
cial
s20
16-1
720
15-1
6
Sal
ary
(£00
0)B
onu
s P
aym
ents
(£
000)
Ben
efits
in
kin
d (t
o
near
est
£100
)
Pen
sio
n b
enefi
ts50
(£00
0)
Tota
l b
enefi
ts
(£00
0)
Sal
ary
(£00
0)B
onu
s P
aym
ents
(£
000)
Ben
efits
in
kin
d (t
o
near
est
£100
)
Pen
sio
n b
enefi
ts49
(£
000)
Tota
l b
enefi
ts
(£00
0)
Bria
n Et
herid
ge
Act
ing
Dire
ctor
Gen
eral
(fr
om 2
0 Ju
ly 2
015
to
19 O
ctob
er 2
015)
--
--
-25
-30
--
3560
-65
Full
Year
Equ
ival
ent
105-
110
Cla
re M
oria
rty
Dire
ctor
Gen
eral
(u
ntil
2 A
ugus
t 201
5)
--
--
-50
-55
--
2875
-80
Full
Year
Equ
ival
ent
150-
155
49 P
ensi
on d
ata
is p
rovi
ded
by M
y C
SP.
The
val
ue o
f pen
sion
ben
efits
acc
rued
du
ring
the
year
is c
alcu
late
d as
(the
rea
l inc
reas
e in
pen
sion
mul
tiplie
d by
20)
plu
s (th
e re
al in
crea
se in
any
lum
p su
m) l
ess
(the
cont
ribut
ions
mad
e by
the
indi
vidu
al).
The
real
incr
ease
s ex
clud
e in
crea
ses
due
to in
flatio
n or
any
incr
ease
or
decr
ease
s du
e to
a tr
ansf
er o
f pen
sion
rig
hts.
50 P
hilip
Rut
nam
has
a p
rese
rved
pen
sion
rel
atin
g to
prio
r em
ploy
men
t. A
pro
port
ion
of h
is p
ensi
on b
enef
it re
fers
to c
hang
es in
this
pre
serv
ed e
lem
ent.
51 H
M T
reas
ury
appr
oved
the
paym
ent o
f rol
e-sp
ecifi
c al
low
ance
s fo
r bo
th D
avid
P
rout
and
Ber
nade
tte
Kel
ly in
201
6-17
. Dav
id P
rout
rec
eive
d £3
0,00
0 of
whi
ch
£10,
000
was
a b
ackd
ated
pay
men
t in
rela
tion
to 2
015-
16. B
erna
dett
e K
elly
re
ceiv
ed £
10,0
00. T
hese
allo
wan
ces
are
non-
pens
iona
ble.
52 P
atric
ia H
ayes
con
trib
utes
to a
sec
tion
of th
e P
CS
PS
pen
sion
sch
eme
in w
hich
fin
al s
alar
y is
a k
ey d
eter
min
ant o
f fut
ure
pens
ion
right
s. T
he p
ensi
on b
enef
its
asse
ssed
for
Ms
Hay
es d
urin
g th
e ye
ar r
efle
ct th
e on
e-of
f im
pact
of h
er c
hang
e in
rol
e.
Annual Report and Accounts 2016-1780

Salary4.49 ‘Salary’ includes gross salary; overtime; reserved rights to London weighting or London allowances; recruitment and retention allowances; private office allowances and any other allowance to the extent that it is subject to UK taxation. This report is based on accrued payments made by the Department and thus recorded in these accounts. In respect of Ministers in the House of Commons, departments bear only the cost of the additional Ministerial remuneration; the salary for their services as an MP (£74,000 from 8 May 2015, £74,962 from 1 April 2016) and various allowances to which they are entitled are borne centrally. However, the arrangement for Ministers in the House of Lords is different in that they do not receive a salary but rather an additional remuneration, which cannot be quantified separately from their Ministerial salaries. This total remuneration, as well as the allowances to which they are entitled, is paid by the Department and is therefore shown in full in the figures above.
Benefits in kind4.50 The monetary value of benefits in kind covers any benefits provided by the Department and treated by HM Revenue and Customs as a taxable emolument. There were no benefits in kind reported in 2016-17 for ministers or executive board members.
Bonuses4.51 Bonuses are based on performance levels attained and are made as part of the appraisal process. Bonuses are paid in arrears and relate to the performance in the prior year in which they become payable to the individual. The bonuses reported in 2016-17 relate to performance in 2015-16 and the comparative bonuses reported for 2015-16 relate to the performance in 2014-15.
Ministerial Pensions4.52 Pension benefits for Ministers are provided by the Parliamentary Contributory Pension Fund (PCPF). The scheme is made under statute and the rules are set out in the Ministers’ etc. Pension Scheme 2015.53
4.53 Those Ministers who are Members of Parliament may also accrue an MP’s pension under the PCPF (details of which are not included in this report). A new MP’s pension scheme was introduced from May 2015, although members who were aged 55 or older on 1st April 2013 have transitional protection to remain in the previous final salary pension scheme.
4.54 Benefits for Ministers are payable from State Pension age under the 2015 scheme. Pensions are re-valued annually in line with Pensions Increase legislation both before and after retirement. The contribution rate from May 2015 is 11.1% and the accrual rate is 1.775% of pensionable earnings.
4.55 The figure shown for pension value includes the total pension payable to the member under both the pre- and post-2015 Ministerial pension schemes.
53 http://qna.files.parliament.uk/ws-attachments/170890/original/PCPF%20MINISTERIAL%20SCHEME%20FINAL%20RULES.doc
Annual Report and Accounts 2016-17 81
The Accountability Report Remuneration and Staff Report

Table 19: Pension benefits (Ministers)
Ministers Accrued pension at
age 65 as at 31/3/2017
Real increase in pension at
age 65
CETV at 31/03/2017
CETV at 31/03/2016
Real increase in
CETV funded by taxpayer
£000 £000 £000 £000 £000
Rt Hon Chris Grayling MP Secretary of State (from 14 July 2016)
5-10 0-2.5 146 - 7
Rt Hon Patrick McLoughlin MP Secretary of State (until 13 July 2016)
20-25 0-2.5 491 480 7
Robert Goodwill MP Minister of State (until 14 July 2016)
2.5-5 0-2.5 63 60 2
Rt Hon John Hayes MP Minister of State (from 15 July 2016)
5-10 0-2.5 106 - 4
Claire Perry MP Parliamentary Under Secretary of State (from 15 July 2014 to 14 July 2016)
0-2.5 0-2.5 23 21 1
Paul Maynard MP Parliamentary Under Secretary of State (from 15 July 2016)
0-2.5 0-2.5 3 - 1
Lord Ahmad of Wimbledon Parliamentary Under Secretary of State
5-10 0-2.5 68 52 7
Andrew Jones MP Parliamentary Under Secretary of State (from 12 May 2015)
0-2.5 0-2.5 10 4 3
Cash equivalent transfer values4.56 A cash equivalent transfer value (CETV) is the actuarially assessed capitalised value of the pension scheme benefits accrued by a member at a particular point in time. The benefits valued are the member’s accrued benefits and any contingent spouse’s pension payable from the scheme. A CETV is a payment made by a pension scheme or arrangement to secure pension benefits in another pension scheme or arrangement when the member leaves a scheme and chooses to transfer the pension
benefits they have accrued in their former scheme. The pension figures shown relate to the benefits that the individual has accrued as a consequence of their total Ministerial service, not just their current appointment as a Minister. CETVs are calculated in accordance with The Occupational Pension Schemes (Transfer Values) (Amendment) Regulations 2008 and do not take account of any actual or potential reduction to benefits resulting from Lifetime Allowance Tax which may be due when pension benefits are taken.
Annual Report and Accounts 2016-1782

Real increase in the value of the CETV4.57 This reflects the increase in CETV that is funded by the Exchequer. It does not include the increase in accrued pension due to inflation, contributions paid by the Minister (including the value of any benefits transferred from another pension scheme or arrangement) and uses common market valuation factors for the start and end of the period.
Table 20: Pension benefits (officials)
Officials Accrued pension at
Pension age as at
31/3/2017 and related lump
sum
Real increase in pension and related lump sum at pension age
CETV at 31/3/2017
CETV at 31/3/2016
Real increase in CETV
£000 £000 £000 £000 £000
Philip Rutnam Permanent Secretary
65-70 plus lump sum
of 140-145
2.5-5 1209 1133 21
Jonathan Moor54 Director General
60-65 0-2.5 1019 956 19
Lucy Chadwick Director General
50-55 2.5-5 823 740 32
David Prout Director General
15-20 0-2.5 306 259 28
Bernadette Kelly Director General (from 14 September 2015)
50-55 plus lump sum
of 150-155
2.5-5 plus lump sum
of 7.5-10
987 898 44
Patricia Hayes55 Director General (from 21 March 2016)
40-45 plus lump sum
of 115-120
12.5-15 plus lump sum
of 30-32.5
772 538 206
54 Jonathan Moor’s pension benefits are shown gross, before the application of a pension sharing order.
55 Patricia Hayes contributes to a section of the PCSPS pension scheme in which final salary is a key determinant of future pension rights. The pension benefits assessed for Ms Hayes during the year reflect the one-off impact of her change in role.
Annual Report and Accounts 2016-17 83
The Accountability Report Remuneration and Staff Report

Civil Service Pensions4.58 Pension benefits are provided through the Civil Service pension arrangements. From 1 April 2015 a new pension scheme for civil servants was introduced – the Civil Servants and Others Pension Scheme or alpha, which provides benefits on a career average basis with a normal pension age equal to the member’s State Pension Age (or 65 if higher). From that date all newly appointed civil servants and the majority of those already in service joined alpha. Prior to that date, civil servants participated in the Principal Civil Service Pension Scheme (PCSPS). The PCSPS has four sections: 3 providing benefits on a final salary basis (classic, premium or classic plus) with a normal pension age of 60; and one providing benefits on a whole career basis (nuvos) with a normal pension age of 65.
4.59 These statutory arrangements are unfunded with the cost of benefits met by monies voted by Parliament each year. Pensions payable under classic, premium, classic plus, nuvos and alpha are increased annually in line with Pensions Increase legislation. Existing members of the PCSPS who were within 10 years of their normal pension age on 1 April 2012 remained in the PCSPS after 1 April 2015. Those who were between 10 years and 13 years and 5 months from their normal pension age on 1 April 2012 will switch into alpha sometime between 1 June 2015 and 1 February 2022. All members who switch to alpha have their PCSPS benefits ‘banked’, with those with earlier benefits in one of the final salary sections of the PCSPS having those benefits based on their final salary when they leave alpha. (The pension figures quoted for officials show pension earned in PCSPS or alpha – as appropriate. Where the official
has benefits in both the PCSPS and alpha the figure quoted is the combined value of their benefits in the two schemes.) Members joining from October 2002 may opt for either the appropriate defined benefit arrangement or a ‘money purchase’ stakeholder pension with an employer contribution (partnership pension account).
4.60 Employee contributions are salary- related and range between 3% and 8.05% of pensionable earnings for members of classic (and members of alpha who were members of classic immediately before joining alpha) and between 4.6% and 8.05% for members of premium, classic plus, nuvos and all other members of alpha. Benefits in classic accrue at the rate of 1/80th of final pensionable earnings for each year of service. In addition, a lump sum equivalent to three years initial pension is payable on retirement.
4.61 For premium, benefits accrue at the rate of 1/60th of final pensionable earnings for each year of service. Unlike classic, there is no automatic lump sum. classic plus is essentially a hybrid with benefits for service before 1 October 2002 calculated broadly as per classic and benefits for service from October 2002 worked out as in premium. In nuvos a member builds up a pension based on his pensionable earnings during their period of scheme membership. At the end of the scheme year (31 March) the member’s earned pension account is credited with 2.3% of their pensionable earnings in that scheme year and the accrued pension is uprated in line with Pensions Increase legislation. Benefits in alpha build up in a similar way to nuvos, except that the accrual rate in 2.32%. In all cases members may opt to give up (commute) pension for a lump sum up to the limits set by the Finance Act 2004.
Annual Report and Accounts 2016-1784

4.62 The partnership pension account is a stakeholder pension arrangement. The employer makes a basic contribution of between 8% and 14.75% (depending on the age of the member) into a stakeholder pension product chosen by the employee from a panel of providers. The employee does not have to contribute, but where they do make contributions, the employer will match these up to a limit of 3% of pensionable salary (in addition to the employer’s basic contribution). Employers also contribute a further 0.5% of pensionable salary to cover the cost of centrally-provided risk benefit cover (death in service and ill health retirement).
4.63 The accrued pension quoted is the pension the member is entitled to receive when they reach pension age, or immediately on ceasing to be an active member of the scheme if they are already at or over pension age. Pension age is 60 for members of classic, premium and classic plus, 65 for members of nuvos, and the higher of 65 or State Pension Age for members of alpha. (The pension figures quoted for officials show pension earned in PCSPS or alpha – as appropriate. Where the official has benefits in both the PCSPS and alpha the figure quoted is the combined value of their benefits in the two schemes, but note that part of that pension may be payable from different ages.)
4.64 Further details about the Civil Service pension arrangements can be found at the website www.civilservicepensionscheme.org.uk
Cash equivalent transfer values4.65 A Cash Equivalent Transfer Value (CETV) is the actuarially assessed capitalised value of the pension scheme benefits accrued by a member at a particular point in time. The benefits valued are the member’s accrued benefits and any contingent
spouse’s pension payable from the scheme. A CETV is a payment made by a pension scheme or arrangement to secure pension benefits in another pension scheme or arrangement when the member leaves a scheme and chooses to transfer the benefits accrued in their former scheme. The pension figures shown relate to the benefits that the individual has accrued as a consequence of their total membership of the pension scheme, not just their service in a senior capacity to which disclosure applies.
4.66 The figures include the value of any pension benefit in another scheme or arrangement which the member has transferred to the Civil Service pension arrangements. They also include any additional pension benefit accrued to the member as a result of their buying additional pension benefits at their own cost. CETVs are worked out in accordance with The Occupational Pension Schemes (Transfer Values) (Amendment) Regulations 2008 and do not take account of any actual or potential reduction to benefits resulting from Lifetime Allowance Tax which may be due when pension benefits are taken.
Real increase in the value of the CETV4.67 This reflects the increase in CETV that is funded by the employer. It does not include the increase in accrued pension due to inflation, contributions paid by the employee (including the value of any benefits transferred from another pension scheme or arrangement) and uses common market valuation factors for the start and end of the period.
Compensation for loss of office4.68 One minister left Government on 15 July 2016. They received a compensation payment of £5,594.
Annual Report and Accounts 2016-17 85
The Accountability Report Remuneration and Staff Report

Pay multiplesThe following section is subject to audit.
4.69 Reporting bodies are required to disclose the relationship between the remuneration of the highest-paid executive board member in their organisation and the median remuneration of the organisation’s workforce. The banded remuneration of the highest paid executive board member in the Department in the financial year 2016-17 was £170,000-175,000 (2015-16: £170,000-175,000). This was 6.9 times (2015-16, 7.1) the median remuneration of the workforce, which was £24,876 (2015-16, £24,299).
4.70 The ratio is calculated by taking the mid-point of the banded remuneration of the highest paid executive board member, and calculating the ratio between this and the median remuneration of the Department’s staff. This ratio is based on the full-time equivalent staff of the Department at the end of March on an annualised basis. This calculation includes DfTc, DVLA, MCA and VCA. DVSA is not included as it is outside the consolidation boundary.
4.71 In 2016-17 one employee (2015-16, one employee) received remuneration in excess of the highest paid executive board member. Remuneration ranged from £16,153 to £260,000 (2015-16, £16,866 to £260,000). Total remuneration includes salary, non-consolidated performance-related pay and benefits in kind. It does not include severance payments, employer pension contributions and the cash equivalent transfer value of pensions.
Non-Executive Board Members4.72 Each of the Non-Executive Board Members (NEBMs), Ed Smith, Mary Reilly, Richard Brown, Tony Poulter and Dame Colette Bowe, is entitled to claim annual fees, currently £15,000 per year, and reasonable expenses (including travel and subsistence in line with the Department’s policy on such expenses).
4.73 Ed Smith, as the Lead NEBM, receives an additional £5,000 in recognition of his role. Mary Reilly, as Chair of the Department’s Group Audit and Risk Assurance Committee (GARAC), receives an additional £5,000 per annum in recognition of this role.
4.74 Non-Executive Board Members are appointed on fixed terms. Their fees for 2016-17 are set out in Table 21.
4.75 In addition, the membership of the Group Audit and Risk Committee includes David Hughes and Bridget Rosewell, the Chair of the Audit Committees for Highways England and Network Rail respectively who receive a fee for attending and preparing for meetings. Amarjit Atkar and Niamh McBreen as Civil Service employees do not receive a fee.
Annual Report and Accounts 2016-1786

Table 21: Non-Executive Board Member’s fees
Non-executive Board members 2016-17 (£000)
2015-16 (£000)
Ed Smith (appointment period to end 31 December 2017) 20-25 20-25
Mary Reilly (appointment period to end 30 September 2017) 20-25 20-25
Richard Brown (appointment period to end 30 September 2017) 15-20 15-20
Dame Colette Bowe (appointment ended 28 February 2017) 10-15 15-20
Tony Poulter (appointment started 19 September 2016, appointment period to end 18 September 2019)
5-10 -
John Kirkland (appointment ended March 2016) - 10-15
Group Audit and Risk Assurance Committee
David Hughes (appointment period to end 31 August 2018) 0-5 0-5
Bridget Rosewell (appointment period to end 26 March 2018) 0-5 0-5
Amarjit Atkar (appointment started September 2016, appointment period to end 31 August 2017)
0 -
Niamh McBreen (appointment started September 2016, appointment ended 23 May 2017)
0 -
Staff costs and numbers (Departmental Group including delivery bodies)The following section is subject to audit. Table 22: Staff costs
2016-17 2015-16
Permanently employed
staff
Other Staff
Ministers Special advisers
Total Total56
£m £m £m £m £m
Wages and salaries 2,508.0 109.3 0.2 0.1 2,617.6 2,399.6
Social security costs 274.9 1.5 - - 276.4 220.0
Other pension costs 221.0 2.3 - - 223.3 246.0
Sub Total 3,003.9 113.1 0.2 0.1 3,117.3 2,865.6
Less recoveries in respect of outward secondments
(1.1) - - - (1.1) (0.7)
Less recoveries in respect of capitalised staff
(1,026.8) (53.3) - - (1,080.1) (903.3)
Total staff costs 1,976.0 59.8 0.2 0.1 2,036.1 1,961.6
56 Staff costs for 2015-16 have been restated by £766 million to reflect the reclassification of Network Rail’s staff costs which now exclude capitalised costs (see Note 21 to the financial statements).
Annual Report and Accounts 2016-17 87
The Accountability Report Remuneration and Staff Report
Pension arrangements4.76 Employees of entities included in these accounts benefit from a range of pension scheme arrangements. Some are members of employee-specific defined benefit schemes, set out in note 20 to the accounts. Others may be members of the Principal Civil Service Pension Scheme (PCSPS), or of defined contribution arrangements. The key schemes and associated costs for the Departmental group are disclosed below.
4.77 The PCSPS is an unfunded multi- employer defined benefit scheme but the Department for Transport is unable to identify its share of the underlying liabilities. A full actuarial valuation was carried out as at 31 March 2012. Details can be found in the resource accounts of the Cabinet Office: Civil Superannuation (www.civilservicepensionscheme.org.uk).
4.78 For 2016-17, employers’ contributions of £90.5m were payable to the PCSPS (2015-16 £80.7m) at one of four rates in the range 20.0% to 24.5% (2015-16: 20.0% to 24.5%) of pensionable pay, based on salary bands. The scheme’s Actuary reviews employer contributions every four years following a full scheme valuation. The contribution rates are set to meet the cost of the benefits accruing during 2016-17 to be paid when the member retires and not the benefits paid during this period to existing pensioners.
4.79 Employees can opt to open a partnership pension account (a stakeholder pension with an employer contribution). Employers’ contributions of £873,259 (2015-16: £691,292) were paid to one or more of a panel of three appointed stakeholder pension providers. Employer contributions are age-related and range from 8% to 14.75% of pensionable pay.
4.80 Employers also match employee contributions up to 3% of pensionable pay. In addition, employer contributions of £30,143, 0.5% (2015-16: £23,986, 0.5%) of pensionable pay, were payable to the PCSPS to cover the cost of the future provision of lump sum benefits on death in service and ill health retirement of these employees.
4.81 Contributions prepaid to partnership pension providers were £NIL (2015-16: £NIL).
4.82 Contributions due to partnership pension providers at the reporting date were £NIL (2015-16: £40,435).
4.83 There were 18 early retirements as a result of ill-health (2015-16: 3).
4.84 Network Rail has two defined benefit pension schemes (RPS & CARE). The Network Rail group pays contributions of 14.04% to 30th June 2016 and 13.2% thereafter of section pay for members with a right to retire unreduced at 60 and 9.30% for other members. For 2016-17 the current service cost was £191m (2015-16: £195m).
Annual Report and Accounts 2016-1788

Average number of persons employedThe following section is subject to audit.
4.85 The average number of whole-time equivalent persons employed during the year is set out in Table 23.
Table 23: Staff numbers
Average Number of staff
Permanently employed
staff
Others Ministers Special advisers
2016-17 Total
2015-16 Total
Average number of persons employed
56,387 2,072 5 2 58,466 56,489
Of which:
Core Department 2,092 99 5 2 2,198 2,018
Agencies57 6,477 214 - - 6,691 6,554
Other designated bodies
47,818 1,759 - - 49,577 47,917
4.86 On 1 April 2004 Network Rail57 introduced a defined contribution pension scheme, the Network Rail Defined Contribution Pension Scheme (NRDCPS). This is an auto-enrollment scheme for all new employees of Network Rail, except those who have the legal right to join the Railway Pension Scheme (RPS), in compliance with regulations made under the Pensions Act 2008. Any employee who wishes to transfer from the Network Rail Section of the RPS to the NRDCPS is entitled to do so. For 2016-17 employers’ contributions of £18m were payable into this scheme (2015-16: £15m).
57 Excluding DVSA which is outside of the accounting boundary.
4.87 On 1 April 2015 Highways England introduced a defined contribution personal pension plan. The Highways England pension plan is administered by a third party. Highways England matches employee contributions to personal pensions plans on a 2:1 basis up to a maximum of 10% gross salary. The default contributions are 5% (employee) and 10% (employer). For 2016-17, employers’ contributions of £3.5m (2015-16 £0.6m) were paid into the scheme.
Annual Report and Accounts 2016-17 89
The Accountability Report Remuneration and Staff Report

4.88 On 1 July 2016 Highways England introduced, following the transfer in of a small number of staff on local government pension terms, The Federated Pension Plan (FPP) – a multi-employer defined benefit scheme Pension Plan administered by a third party provider. Employers’ contributions of £0.1m were payable to the FPP at one of two rates in the range 41.0% to 41.5% of pensionable earnings. The contribution rates are set to meet the cost of the benefits accruing during 2016-17 to be paid when the member retires and not the benefits paid during this period to existing pensioners. Employees’ contributions range from 6.0% to 6.5%.
4.89 These figures include those working in the Department as well as in agencies and other bodies included within the consolidated departmental account.
Staff composition (gender)4.90 The financial reporting manual (FReM) requires departments to disclose the number of persons of each sex who were employees of the entity. The Department publishes this information annually on gov.uk.58
Table 24: Number of persons of each sex who were employees of the entity as at 31 March 2016
Men Women
Number of persons of each sex who were directors of the entity Permanent Secretary and Directors General
3 3
Number of persons of each sex who were senior managers of the entity Members of the Senior Civil Service (excluding above)
99 60
Number of persons of each sex who were employees of the entity Employees in (i) DfTc and (ii) DfT including agencies58
i) 1,350
ii) 4,523
i) 798
ii) 5,022
58 Excluding DVSA which is outside of the accounting boundary.
Annual Report and Accounts 2016-1790

Recruitment practice4.91 The Department and its executive agencies have control systems requiring recruitment to be approved by Departmental HR Directors and controlled from a single point across DfT. The number of posts agreed for external recruitment during 2016-17 was 1335.
4.92 In 2016-17 there were 120 exceptions to the general recruitment principles in relation to fair and open competition. These were spread among the agencies and the central department in a manner consistent with recruitment volume. Temporary appointments up to two years remain the most common use of exception accounting for more than half of the total (67). This year, there has been an increase in the use of exception 5 for reappointment of Civil Servants, which has been used effectively to flexibly manage operational needs for Fixed Term Appointments of administrative staff at the Driver and Vehicle Licensing Agency and also to reappoint Driving Examiners at the Driver and Vehicle Standards Agency.
Annual Report and Accounts 2016-17 91
The Accountability Report Remuneration and Staff Report

Expenditure on consultancy, temporary and off-payroll staff4.93 During the year 2016-17 the Department and its delivery bodies employed a number of consultancy and temporary staff. Expenditure on consultancy and temporary staff in 2016-17 is shown in Table 25.
Table 25: Expenditure on consultancy and temporary staff
Organisation Consultancy59
(£m)Temporary Staff (£m)
Total(£m)
DfTc 49.59 11.42 61.01
Driver & Vehicle Licensing Agency 0.26 3.01 3.27
Driver & Vehicle Standards Agency 0.22 7.92 8.14
Maritime & Coastguard Agency - 0.78 0.78
Vehicle Certification - 0.13 0.13
British Transport Police 0.29 0.05 0.34
Directly Operated Railways - - -
Transport Focus - 0.27 0.27
Northern Lighthouse Board - 0.29 0.29
Trinity House Lighthouse Service - 0.19 0.19
HS2 Ltd - 32.40 32.40
Network Rail 25.70 97.30 123.00
Highways England 2.20 26.49 28.69
Department Total 78.26 180.25 258.51
59 Consultancy here is the provision of objective advice relating to strategy, structure, management or operations of an organisation, in pursuit of its purposes and objectives. Such advice will be provided outside the ‘business-as-usual’ environment when in-house skills are not available and will be time-limited. Consultancy may include the identification of options with recommendations, or assistance with (but not the delivery of) the implementation of solutions.
Annual Report and Accounts 2016-1792

Off-payroll appointees4.94 As part of the Review of Tax Arrangements of Public Sector Appointees published by the Chief Secretary to the Treasury on 23 May 2012, departments have been asked to report on their off-payroll engagements and related tax arrangements for the periods and scope outlined by HM Treasury. This data is shown in tables 26 to 28.
Table 26: Off-payroll engagements as of 31 March 2017, for more than £220 per day and that last for longer than six months
DfT
c
BT
P
DV
SA
DV
LA
HE
HS
2 Lt
d
MC
A
NR
VC
A
Tota
l
Number of existing engagements as at 31 March 2017
28 4 13 25 75 285 5 1,109 0 1,544
Of which:
No. that have existed for less than one year at time of reporting
28 4 13 25 41 89 4 768 0 972
No. that have existed for between one and two years at time of reporting
0 0 0 0 30 124 0 244 0 398
No. that have existed for between two and three years at time of reporting
0 0 0 0 2 65 0 71 0 138
No. that have existed for between three and four years at time of reporting
0 0 0 0 0 6 0 13 0 19
No. that have existed for four or more years at time of reporting
1 0 0 0 2 1 1 13 0 18
4.95 The Department confirms that all existing off-payroll engagements, outlined above, have at some point been subject to a risk based assessment as to whether assurance is required that the individual is paying the right amount of tax and, where necessary, that further evidence has been sought.
4.96 In addition to the above, during March 2017 the Department undertook an exercise to assure that all off-payroll engagements for DfTc and its Executive Agencies were assessed using HMRC’s IR35 tool which would have deemed whether the role was in or out of scope of the new intermediary legislation.
Annual Report and Accounts 2016-17 93
The Accountability Report Remuneration and Staff Report

Table 27: New off-payroll engagements, or those that reached six months in duration, between 1 April 2015 and 31 March 2017, for more than £220 per day and that last for longer than six months
DfT
c
BT
P
DV
SA
DV
LA
HE
HS
2 Lt
d
MC
A
NR
VC
A
Tota
l
Number of new engagements, or those that reached six months in duration, between 1 April 2016 and 31 March 2017
64 38 42 25 145 310 9 243 0 876
No. of the above which include contractual clauses giving the Department the right to request assurance in relation to income tax and National Insurance obligations
64 38 42 25 145 310 9 243 0 876
No. for whom assurance has been requested 64 38 42 25 145 310 9 0 0 633
Of which:
No. for whom assurance has been received 61 33 42 25 123 310 9 0 0 603
No. for whom assurance has not been received
3 5 0 0 22 0 0 0 0 30
No. of those in the line above, who have now left the Department
3 5 0 0 17 0 0 0 0 25
No. that have been terminated as a result of assurance not being received
0 0 0 0 0 0 0 0 0 0
Remaining cases (in the final stages of review) 0 0 0 0 5 0 0 0 0 5
4.97 DfTc: Majority of off-payroll engagements are through the Contingent Labour One (CL1) framework which ensures all new engagements have the appropriate contractual clauses. Assurance was requested and received from all contractors, apart from 3 who had left before assurance was obtained. DfTc has a process in place to ensure that all roles, where off-payroll engagements are deemed necessary, are assessed using HMRC’s online IR35 tool to determine whether the intermediaries’ legislation applies.
4.98 BTP: Work is being done to ensure all new engagements are assessed against the new intermediaries’ legislation and have the appropriate contractual clauses. Assurance was requested and received from all contractors, apart from 5 who had left before assurance was obtained. BTP has ensured its contractors provide the required assurance to DfT as necessary.
Annual Report and Accounts 2016-1794

4.99 DVSA: Majority of off-payroll engagements are through the CL1 framework which ensures all new engagements have the appropriate contractual clauses. Assurance was requested and received from all contractors.
4.100 DVLA: Majority of off-payroll engagements are through the CL1 framework which ensures all new engagements have the appropriate contractual clauses. Assurance was requested and received from all contractors. The Department is working closely with DVLA to ensure all new engagements are assessed against the new intermediaries’ legislation and have the appropriate contractual clauses.
4.101 HE: Work is being done to ensure all new engagements are assessed against the new intermediaries’ legislation and have the appropriate contractual clauses. Assurance was requested and received from all contractors, apart from 22 of which 17 had left before assurance was obtained. The remaining five cases are in the final stages of review which HE is considering.
4.102 HS2 Ltd: Assurance was requested and received from all contractors. HS2 Ltd has a process in place to assess all off-payroll engagements against the scope of IR35 rules. The Department is working closely with HS2 Ltd to ensure all new engagements are assessed against the new intermediaries’ legislation and have the appropriate contractual clauses.
4.103 MCA: Assurance was requested and received from all contractors. The Department is working closely with MCA to ensure all new engagements are assessed against the new intermediaries’ legislation and have the appropriate contractual clauses.
4.104 Network Rail (NR): Require confirmation of tax compliance as a part of any contract engaged through its sourcing partners and have the right to request any further assurance as required. This was designed to minimise the operational risk of losing critical workers on key projects whilst simultaneously ensuring all workers fulfil their tax obligations. NR has a process in place to determine the tax status of all off-payroll engagements and against the new intermediaries’ legislation.
Annual Report and Accounts 2016-17 95
The Accountability Report Remuneration and Staff Report

Table 28: Off-payroll engagements of board members, and/or senior officials with significant financial responsibility, between 1 April 2016 and 31 March 2017
DfT
c
BT
P
DO
R
DV
SA
DV
LA
HE
HS
2
MC
A
NLB
NR
TF
TH
LS
VC
A
Tota
l
Number of off-payroll engagements of Board members, and/or senior officials with significant financial responsibility, during the financial year.
- 1 - 1 - - 1 - - - - - - 3
Number of individuals that have been deemed ’Board members and/or senior officials with significant financial responsibility’, during the financial year. This figure should include both off-payroll and on-payroll engagements.
31 13 - 13 1 11 13 11 4 31 11 4 3 146
4.105 Details of the exceptional circumstances that led to the above off-payroll engagements and the length of time each of these engagements lasted:
4.106 BTP: From 1 February 2016 to 1 August 2016 – the post holder provided professional and strategic financial advice to the force and to the Chief Officer’s Group, who left the organisation in June 2016. BTP are looking to recruit a permanent post holder to fill the current temporary position as soon as possible. Accounting Officer approval was received for the temporary engagement.
4.107 DVSA: From 7 April 2014 to 31 August 2016 – the post holder was engaged due to the retirement of the Chief Executive, resignation of the Finance & Corporate Services Director, delay in the recruitment process for the Finance and Operations Directors and no suitable internal candidate being identified. Following the appointment of the new Chief Executive in April the recruitment process was resumed. Accounting Officer approval was sought for this engagement.
4.108 HS2 Ltd: March 2015 to March 2017. The decision to make the appointment of this role was approved by the Accounting Officer at the time. The initial engagement lasted for 6 months, which was subsequently extended due to evolving requirements in the organisational change remit.
Annual Report and Accounts 2016-1796

Exit packagesTable 29: Reporting of Civil Service and other compensation schemes – exit packages 60, 61
The following section is subject to auditComparative data (restated) is shown (in brackets) for previous year
Core Department & Agencies Departmental Group
Exit package cost band
Number of compulsory
redundancies
Number of other
departures agreed
Total number of exit
packages by cost band
Number of compulsory
redundancies
Number of other
departures agreed
Total number of exit
packages by cost band
2016-17
2015-16
2016-17
2015-16
2016-17
2015-16
2016-17
2015-16
2016-17
2015-16
2016-17
2015-16
<£10,000 - - 15 1 15 1 48 30 26 15 74 45
£10,000–£25,000
- - 57 42 57 42 56 74 74 88 130 162
£25,000–£50,000
1 - 67 51 68 51 64 60 92 117 156 117
£50,000–£100,000
- - 48 49 48 49 12 24 82 75 94 99
£100,000–£150,000
- - 2 1 2 1 8 5 5 6 13 11
£150,000–£200,000
- - - - - - 2 - 4 2 6 2
>£200,000 - - - - - - 1 - 2 1 3 1
Total number of exit packages
1 - 189 144 190 144 191 193 285 304 476 497
2016-17 Total cost /£
28,512 6,278,762 6,307,274 5,608,216 11,402,886 17,011,102
2015-16 Total cost /£
- 5,848,495 5,848,495 5,772,809 12,214,192 17,987,001
60 Redundancy and other departure costs have been paid in accordance with the provisions of the Civil Service Compensation Scheme, a statutory scheme made under the Superannuation Act 1972 (with the exception of Network Rail, which is not governed by Cabinet Office controls and runs separate exit schemes). Exit costs are accounted for in full in the year of departure. Where the Department has agreed early retirements, the additional costs are met by the Department and not by the Civil Service Pension Scheme. Ill-health retirement costs are met by the pension scheme and are not included in the table.
61 During the financial year 2016-17, 57 payments were made which were not covered by the Civil Service Compensation Scheme. These totalled £1,476,604 (2015-16: 7 payments valued at £147,748). Transport Focus and HS2 Ltd did not receive retrospective HMT approval for their 39 exit packages disclosed above. Having taken legal advice, and following consultation between these bodies, the Department and HMT, these bodies have concluded that contractual commitments made in the year obligate the payment of remaining amounts on the terms agreed, but the terms themselves remain unapproved by the Department and HM Treasury. Commitments made at HS2 Ltd on unapproved terms, including those described here as paid, totalled £2.76m for the year – an enhancement of £1.76m on the statutory levels approved by the Department. Further details on this matter are available in the Report of the Comptroller and Auditor General within the published accounts of HS2 Ltd.
Annual Report and Accounts 2016-17 97
The Accountability Report Remuneration and Staff Report
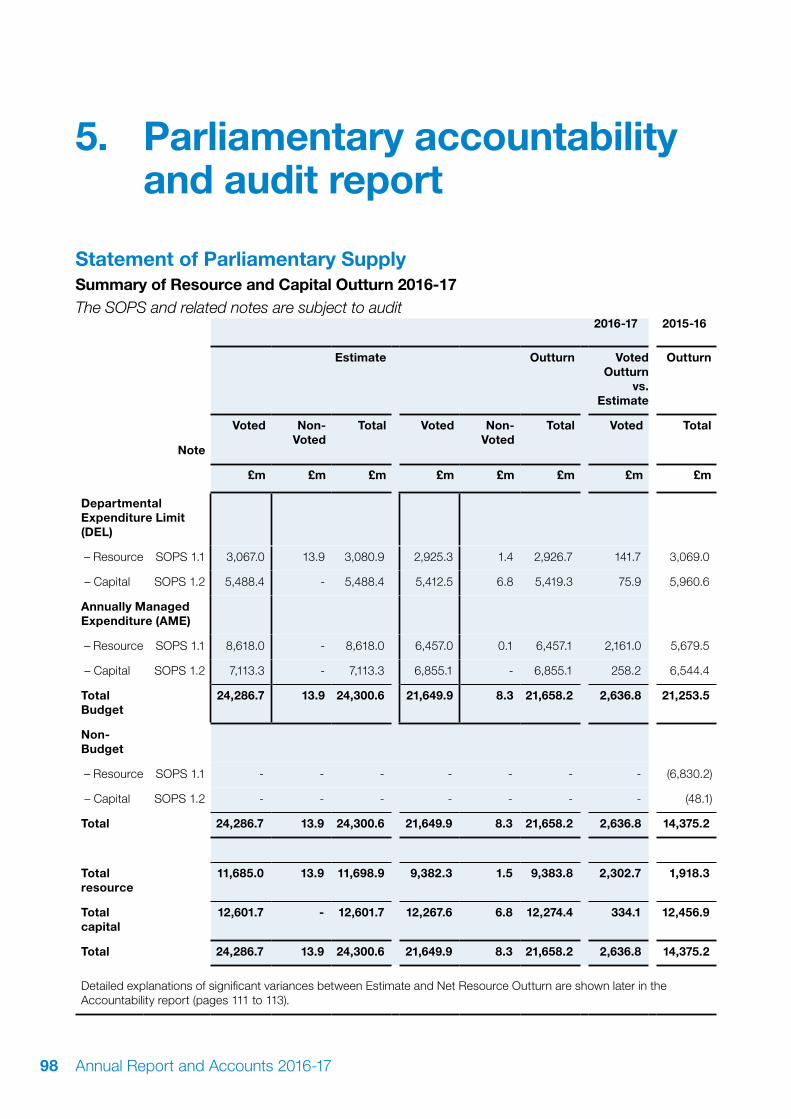
5. Parliamentary accountability and audit report
Statement of Parliamentary SupplySummary of Resource and Capital Outturn 2016-17The SOPS and related notes are subject to audit
2016-17 2015-16
Estimate Outturn Voted Outturn
vs. Estimate
Outturn
Voted Non-Voted
Total Voted Non-Voted
Total Voted Total
Note
£m £m £m £m £m £m £m £m
Departmental Expenditure Limit (DEL)
– Resource SOPS 1.1 3,067.0 13.9 3,080.9 2,925.3 1.4 2,926.7 141.7 3,069.0
– Capital SOPS 1.2 5,488.4 - 5,488.4 5,412.5 6.8 5,419.3 75.9 5,960.6
Annually Managed Expenditure (AME)
– Resource SOPS 1.1 8,618.0 - 8,618.0 6,457.0 0.1 6,457.1 2,161.0 5,679.5
– Capital SOPS 1.2 7,113.3 - 7,113.3 6,855.1 - 6,855.1 258.2 6,544.4
Total Budget
24,286.7 13.9 24,300.6 21,649.9 8.3 21,658.2 2,636.8 21,253.5
Non-Budget
– Resource SOPS 1.1 - - - - - - - (6,830.2)
– Capital SOPS 1.2 - - - - - - - (48.1)
Total 24,286.7 13.9 24,300.6 21,649.9 8.3 21,658.2 2,636.8 14,375.2
Total resource
11,685.0 13.9 11,698.9 9,382.3 1.5 9,383.8 2,302.7 1,918.3
Total capital
12,601.7 - 12,601.7 12,267.6 6.8 12,274.4 334.1 12,456.9
Total 24,286.7 13.9 24,300.6 21,649.9 8.3 21,658.2 2,636.8 14,375.2
Detailed explanations of significant variances between Estimate and Net Resource Outturn are shown later in the Accountability report (pages 111 to 113).
Annual Report and Accounts 2016-1798

Net Cash Requirement 2016-17
£m 2016-17 2015-16
Note Estimate Outturn Outturn vs.
Estimate
Outturn
Net Cash Requirement SOPS 3 18,560.3 17,127.6 1,432.7 19,038.9
Administration Costs 2016-17 (Net)
£m 2016-17 2015-16
Estimate Outturn Outturn vs.
Estimate
Outturn
264.9 258.8 6.1 266.9
Figures in the areas outlined in bold are voted totals subject to Parliamentary control. In addition, although not a separate voted limit, any breach of the Administration budget will also result in an excess vote.
The SOPS notes on pages 100 to 108 form part of these accounts.
Annual Report and Accounts 2016-17 99
The Accountability Report Parliamentary accountability and audit report

SO
PS
1. N
et o
uttu
rnS
OP
S 1
.1 A
naly
sis
of n
et r
eso
urce
out
turn
by
sect
ion
2016
-17
2015
-16
Ou
ttu
rnE
stim
ate
Ou
ttu
rn
vs.
Est
imat
e
Ou
ttu
rn v
s.
Est
imat
e ad
just
ed
for
vire
men
ts
Ou
ttu
rn
Ad
min
istr
atio
nP
rog
ram
me
Gro
ssIn
com
eN
etG
ross
Inco
me
Net
Net
To
tal
Net
To
tal
Net
To
tal
Net
To
tal
Net
To
tal
£m£m
£m£m
£m£m
£m£m
£m£m
£m
Sp
end
ing
in D
epar
tmen
tal E
xpen
dit
ure
L
imit
(DE
L)
Vo
ted
:
A
Tolle
d cr
ossi
ngs
-
-
-
42.
3 (1
37.3
) (9
5.0)
(9
5.0)
(1
01.2
) (6
.2)
-
(101
.2)
B
Loca
l aut
horit
y tr
ansp
ort
-
-
-
335
.0
- 3
35.0
3
35.0
3
36.1
1
.1
1.1
3
43.3
C
Hig
hway
s E
ngla
nd
48.
0 -
4
8.0
2,1
57.7
-
2,1
57.7
2
,205
.7
2,2
72.5
6
6.8
22.
0 1
,998
.7
D
Fund
ing
of A
LBs
(net
) 3
.3
-
3.3
1
00.6
-
100
.6
103
.9
158
.0
54.
1 4
4.1
66.
5
E
Oth
er r
ailw
ays
-
-
-
425
.9
(301
.3)
124
.6
124
.6
118
.9
(5.7
) -
2
21.3
F S
usta
inab
le tr
avel
-
-
-
9
1.5
- 9
1.5
91.
5 8
3.6
(7.9
) -
1
59.7
G
Bus
sub
sidi
es &
con
cess
iona
ry fa
res
-
-
-
248
.2
- 2
48.2
2
48.2
2
53.4
5
.2
5.2
2
61.0
H
GLA
tran
spor
t gra
nts
-
-
-
474
.4
- 4
74.4
4
74.4
4
74.4
-
-
5
91.4
I C
ross
rail
-
-
-
2.2
(0
.9)
1.3
1
.3
1.6
0
.3
0.9
2
8.7
J A
viat
ion,
mar
itim
e, s
ecur
ity a
nd s
afet
y -
-
-
1
06.0
(5
0.7)
5
5.3
55.
3 6
5.5
10.
2 1
0.2
65.
8
K
Mar
itim
e &
Coa
stgu
ard
Age
ncy
7.8
(0
.6)
7.2
3
20.9
(1
2.4)
3
08.5
3
15.7
3
21.9
6
.2
6.2
2
84.5
L M
otor
ing
agen
cies
-
-
-
4
90.3
(3
85.8
) 1
04.5
1
04.5
1
24.6
2
0.1
20.
1 1
30.7
M
Sci
ence
, res
earc
h an
d su
ppor
t fun
ctio
ns
-
-
-
18.
2 (0
.6)
17.
6 1
7.6
18.
3 0
.7
0.7
5
3.8
N
Cen
tral
adm
inis
trat
ion
201
.8
(8.1
) 1
93.7
4
5.1
(46.
8)
(1.7
) 1
92.0
1
88.8
(3
.2)
1.5
1
77.8
O
Sup
port
for
Pas
seng
er R
ail S
ervi
ces
-
-
-
376
.5
(1,6
65.9
) (1
,289
.4)
(1,2
89.4
) (1
,319
.2)
(29.
8)
-
(1,2
45.4
)
P
Hig
h S
peed
Tw
o -
-
-
2
6.3
-
26.
3 2
6.3
34.
7 8
.4
8.4
1
5.6
Q
Tra
nspo
rt D
evel
opm
ent F
und
-
-
-
1
3.7
-
13.
7 1
3.7
35.
0 2
1.3
21.
3 -
Annual Report and Accounts 2016-17100

SO
PS
1.1
Ana
lysi
s o
f net
res
our
ce o
uttu
rn b
y se
ctio
n –
(con
tinue
d)
2016
-17
2015
-16
Ou
ttu
rnE
stim
ate
Ou
ttu
rn
vs.
Est
imat
e
Ou
ttu
rn v
s.
Est
imat
e ad
just
ed
for
vire
men
ts
Ou
ttu
rn
Ad
min
istr
atio
nP
rog
ram
me
Gro
ssIn
com
eN
etG
ross
Inco
me
Net
Net
To
tal
Net
To
tal
Net
To
tal
Net
To
tal
Net
To
tal
£m£m
£m£m
£m£m
£m£m
£m£m
£m
Tota
l Sp
end
ing
in V
ote
d R
eso
urc
e D
EL
260
.9
(8.7
) 2
52.2
5
,274
.8
(2,6
01.7
) 2
,673
.1
2,9
25.3
3
,067
.0
141
.7
141
.7
3,0
52.2
No
n-v
ote
d
Avi
atio
n, m
ariti
me,
sec
urity
and
saf
ety
-
-
-
-
-
-
-
-
-
-
-
RFu
ndin
g of
Oth
er A
LBs
(Net
) 6
.6
-
6.6
(5
.2)
-
(5.2
) 1
.4
13.
9 1
2.5
12.
5 1
6.8
Tota
l Sp
end
ing
in D
EL
267
.5
(8.7
) 2
58.8
5,
269.
6(2
,601
.7)
2,6
67.9
2
,926
.7
3,0
80.9
15
4.2
154
.2
3,0
69.0
Det
aile
d ex
plan
atio
ns o
f sig
nific
ant v
aria
nces
bet
wee
n E
stim
ate
and
Net
Res
ourc
e O
uttu
rn a
re s
how
n la
ter
in th
e A
ccou
ntab
ility
repo
rt (p
ages
111
to 1
13).
Annual Report and Accounts 2016-17 101
The Accountability Report Parliamentary accountability and audit report

SO
PS
1.1
Ana
lysi
s o
f net
Res
our
ce O
uttu
rn b
y se
ctio
n –
(con
tinue
d)
2016
-17
2015
-16
Ou
ttu
rnE
stim
ate
Ou
ttu
rn
vs.
Est
imat
e
Ou
ttu
rn v
s.
Est
imat
e ad
just
ed
for
vire
men
ts
Ou
ttu
rn
Ad
min
istr
atio
nP
rog
ram
me
Gro
ssIn
com
eN
etG
ross
Inco
me
Net
Net
To
tal
Net
To
tal
Net
To
tal
Net
To
tal
Net
To
tal
£m£m
£m£m
£m£m
£m£m
£m£m
£m
Sp
end
ing
in A
nn
ual
ly M
anag
ed
Exp
end
itu
re (A
ME
)
Vo
ted
S
Hig
hway
s E
ngla
nd
-
-
-
(0.2
) -
(0
.2)
(0.2
) 5
.0
5.2
5
.2
2.7
T N
etw
ork
Rai
l -
-
-
6
,079
.5
-
6,07
9.5
6,07
9.5
8,2
50.4
2
,170
.9
2,0
40.3
5
,387
.3
U
Fund
ing
of o
ther
ALB
s (N
et)
-
-
-
53.
2 -
5
3.2
53.
2 5
8.3
5.1
5
.1
56.
5
V
Oth
er r
ailw
ays
-
-
-
314
.9(0
.2)
314
.7
314
.7
185
.3
(129
.4)
-
251
.2
W
Avi
atio
n, m
ariti
me,
sec
urity
and
saf
ety
-
-
-
(3.3
) -
(3
.3)
(3.3
) 1
.6
4.9
4
.9
(3.8
)
X M
ariti
me
& C
oast
guar
d A
genc
y -
-
-
(0
.1)
-
(0.1
) (0
.1)
0.9
1
.0
1.0
(2
.1)
Y
Mot
orin
g A
genc
ies
-
-
-
(2.3
) -
(2
.3)
(2.3
) (3
.5)
(1.2
) -
(4
.8)
Z C
entr
al a
dmin
istr
atio
n -
-
-
1
5.5
-
15.
5 1
5.5
120
.1
104
.6
104
.6
(7.3
)
Tota
l Sp
end
ing
in V
ote
d R
eso
urc
e A
ME
-
-
-
6,4
57.2
(0
.2)
6,4
57.0
6
,457
.0
8,6
18.0
2
,161
.0
2,1
61.0
5
,679
.7
No
n-V
ote
d
AB
Fund
ing
of o
ther
ALB
s (N
et)
- -
- 0
.1
-
0.1
0
.1
-
(0.1
) (0
.1)
(0.2
)
Tota
l Sp
end
ing
in R
eso
urc
e A
ME
- -
- 6
,457
.3
(0.2
) 6
,457
.1
6,4
57.1
8
,618
.0
2,1
60.9
2
,160
.9
5,6
79.5
Tota
l sp
end
ing
in D
EL
& A
ME
(B
ud
get
) 2
67.5
(8
.7)
258
.8
11,
726.
9 (2
,601
.9)
9,1
25.0
9
,383
.8
11,
698.
9 2
,315
.1
2,3
15.1
8
,748
.5
Annual Report and Accounts 2016-17102

SO
PS
1.1
Ana
lysi
s o
f net
Res
our
ce O
uttu
rn b
y se
ctio
n –
(con
tinue
d)
2016
-17
2015
-16
Ou
ttu
rnE
stim
ate
Ou
ttu
rn
vs.
Est
imat
e
Ou
ttu
rn v
s.
Est
imat
e ad
just
ed
for
vire
men
ts
Ou
ttu
rn
Ad
min
istr
atio
nP
rog
ram
me
Gro
ssIn
com
eN
etG
ross
Inco
me
Net
Net
To
tal
Net
To
tal
Net
To
tal
Net
To
tal
Net
To
tal
£m£m
£m£m
£m£m
£m£m
£m£m
£m
No
n-b
ud
get
Vo
ted
Prio
r pe
riod
adju
stm
ents
- -
- -
- -
- -
-
- (6
,830
.2)
Tota
l No
n-B
ud
get
sp
end
ing
-
- -
- -
- -
--
-(6
,830
.2)
Res
ou
rce
Ou
ttu
rn 2
67.5
(8
.7)
258
.8
11,
726.
9 (2
,601
.9)
9,1
25.0
9
,383
.8
11,
698.
9 2
,315
.1
2,3
15.1
1
,918
.3
Det
aile
d ex
plan
atio
ns o
f sig
nific
ant v
aria
nces
bet
wee
n E
stim
ate
and
Net
Res
ourc
e O
uttu
rn a
re s
how
n la
ter
in th
e A
ccou
ntab
ility
repo
rt (p
ages
111
to 1
13).
Annual Report and Accounts 2016-17 103
The Accountability Report Parliamentary accountability and audit report

SOPS 1.2 Analysis of net capital outturn by section
2016-17 2015-16
Outturn Estimate Outturn vs.
Estimate
Outturn vs. Estimate adjusted
for virements
Outturn
Gross Income Net Net Net Net Net
£m £m £m £m £m £m £m
Spending in Departmental Expenditure Limit (DEL)
Voted:
A Tolled crossings 1.0 1.0 1.0 - - (286.1)
B Local authority transport 1,550.8 - 1,550.8 1,523.0 (27.8) - 1,754.3
C Highways England 2,020.7 - 2,020.7 2,031.2 10.5 10.5 1,931.0
D Funding of ALBs (net) 407.1 - 407.1 396.6 (10.5) - 333.0
E Other railways 72.7 - 72.7 95.2 22.5 - 65.5
F Sustainable travel 239.7 (27.2) 212.5 214.2 1.7 1.7 295.3
G Bus subsidies & concessionary fares
7.1 - 7.1 6.6 (0.5) - 28.8
H GLA transport grants 944.0 - 944.0 944.0 - - 925.0
I Crossrail - (200.0) (200.0) (200.0) - - 800.0
J Aviation, maritime, security and safety
20.0 (1.5) 18.5 20.0 1.5 1.5 7.2
K Maritime and Coastguard Agency 12.7 - 12.7 13.1 0.4 0.4 10.2
L Motoring agencies 8.5 (14.4) (5.9) (4.6) 1.3 1.3 (15.0)
M Science, research and support functions
30.3 (0.4) 29.9 30.2 0.3 0.3 0.2
N Central administration 0.2 - 0.2 8.3 8.1 8.1 3.2
O Support for Passenger Rail Services
0.5 - 0.5 - (0.5) - -
P High Speed Two 340.7 - 340.7 409.6 68.9 52.1 102.5
Total spending in voted Capital DEL
5,656.0 (243.5) 5,412.5 5,488.4 75.9 75.9 5,955.1
Non-voted expenditure
R Funding of other ALBs (Net) 6.9 (0.1) 6.8 - (6.8) (6.8) 5.5
Total Spending in Capital DEL 5,662.9 (243.6) 5,419.3 5,488.4 69.1 69.1 5,960.6
Detailed explanations of significant variances between Estimate and Net Resource Outturn are shown later in the Accountability Report (pages 111 to 113).
Annual Report and Accounts 2016-17104

SOPS 1.2 Analysis of net capital outturn by section
2016-17 2015-16
Outturn Estimate Outturn vs.
Estimate
Outturn vs. Estimate adjusted
for virements
Outturn
Gross Income Net Net Net Net Net
£m £m £m £m £m £m £m
Spending in Annually Managed Expenditure (AME)
Voted expenditure:
S Highways England 30.2 - 30.2 38.3 8.1 8.1 (23.8)
T Network Rail 6,761.9 - 6,761.9 6,713.8 (48.1) - 6,600.5
W Aviation, maritime, security and safety
(20.0) - (20.0) (20.0) - - (20.0)
Z Central administration - - - - - - (7.3)
AA High Speed Two 83.0 - 83.0 381.2 298.2 250.1 (5.0)
Non-voted expenditure: -
AB Funding of ALB’s - - - - - - -
Total Spending in Capital AME 6,855.1 - 6,855.1 7,113.3 258.2 258.2 6,544.4
Total spending in DEL & AME (Budget)
12,518.0 (243.6) 12,274.4 12,601.7 327.3 327.3 12,505.0
Non-Budget spending
Voted expenditure
AD Prior period adjustments - - - - - - (48.1)
Capital Outturn 12,518.0 (243.6) 12,274.4 12,601.7 327.3 327.3 12,456.9
Detailed explanations of significant variances between Estimate and Net Resource Outturn are shown later in the Accountability Report (pages 111 to 113).
Annual Report and Accounts 2016-17 105
The Accountability Report Parliamentary accountability and audit report

SOPS 2. Reconciliation of outturn to net operating expenditure
2016-17 £m
2015-16 £m
Total resource outturn in Statement of Parliamentary Supply Note Outturn Outturn
Budget SOPS 1.1 9,383.8 8,748.5
Non-Budget SOPS 1.1 - (6,830.2)
9,383.8 1,918.3
Add: Capital grants (net) 4,5 2,613.7 3,871.2
Research 4 18.1 -
EU Grants 4 26.8 -
Prior year adjustments - 6,830.2
2,658.6 10,701.4
Capital income (32.9) -
Non-Budget accounting adjustments (38.5) 31.5
Less: Non-supply income (CFERs) SOPS 4 (205.2) (533.2)
(276.6) (501.7)
Net Operating Expenditure in Consolidated Statement of Comprehensive Net Expenditure
11,765.8 12,118.0
Annual Report and Accounts 2016-17106

SOPS 3. Reconciliation of Net Outturn to Net Cash Requirement for 2016-17
Estimate Net Outturn
Net Outturn
vs. Estimate
Note £m £m £m
Resource outturn SOPS 1.1 11,698.9 9,383.8 2,315.1
Capital outturn SOPS 1.2 12,601.7 12,274.4 327.3
Accruals to cash adjustments:
Adjustments to remove non-cash items:
Depreciation (132.6) (126.4) (6.2)
New provisions and adjustments to previous provisions (125.1) (270.9) 145.8
Supported capital expenditure (revenue) - 1.1 (1.1)
Other non-cash items: 54.0 40.7 13.3
Adjustments for arm’s length bodies:
Remove voted resource and capital (19,924.3) (18,364.3) (1,560.0)
Add cash grant-in-aid and loans* 7,790.2 13,600.8 (5,810.6)
Adjustments to reflect movements in working balances:
Increase/(decrease) in stock - (147.2) 147.2
Less reclassification of stock to Property Plant and Equipment
- 159.5 (159.5)
Increase/(decrease) in debtors - (40.2) 40.2
(Increase)/decrease in creditors 6,539.9 558.2 5,981.7
Use of provisions 71.5 58.1 13.4
(5,726.4) (4,530.6) (1,195.8)
Removal of non-voted budget items:
Other adjustments (13.9) - (13.9)
Net Cash Requirement 18,560.3 17,127.6 1,432.7
*DfT included loan advances in the supplementary estimate for 2016-17 as movements in working balances, and specifically creditors. In 2016-17 loan advances of £7,500m were made for Core and Agency, see note 9.1.1 for further details.
Annual Report and Accounts 2016-17 107
The Accountability Report Parliamentary accountability and audit report

SOPS 4. Income payable to the Consolidated FundSOPS 4.1 Analysis of income payable to the Consolidated Fund
In addition to income retained by the Department, the following income is payable to the Consolidated Fund (cash receipts being shown in italics)
Outturn 2016-17 Outturn 2015-16
£m £m £m £m
Income Receipts Income Receipts
Operating income outside the ambit of the Estimate – Resource 205.2 205.2 533.2 533.2
Operating income outside the ambit of the Estimate – Capital 20.0 20.0 20.6 20.6
225.2 225.2 553.8 553.8
Interest on loan to GLF payable to the Consolidated Fund - - - -
Non-budget amounts collectable on behalf of the Consolidated Fund
- - - -
Total income payable to the Consolidated Fund 225.2 225.2 553.8 553.8
TThe Income above includes fees of £201.5m relating to the sale of cherished registration marks by DVLA and £3.3m in loan interest payments made to the Department from the General Lighthouse Fund.
The level of income payable to the Consolidated Fund is significantly reduced on 2015-16 levels since that year included an exceptional item in the dividend of £366m from LCR following the sale of LCR’s interest in land at Kings Cross.
SOPS 4.2 Consolidated Fund incomeThe Consolidated Fund income shown in SOPS 4.1 above does not include any amounts collected by the Department where it was acting as agent for the Consolidated Fund rather than as principal. The amounts collected as agent for the Consolidated Fund (which are otherwise excluded from these financial statements) were:
2016-17 2015-16
£m £m
Licence fees, penalties and fines 53.0 51.9
Costs of collection – where deductible (5.4) (10.1)
Amount payable to the Consolidated Fund 47.6 41.8
Balance held at the start of the year 5.1 4.0
Payments into the Consolidated Fund (47.5) (40.7)
Balance held on trust at the end of the year 5.2 5.1
Vehicle Excise Duty is not collected by the Department but paid directly into the Consolidated Fund. Further details are given in the Trust Statement within the DVLA Accounts.
Annual Report and Accounts 2016-17108

Long term expenditure trendsFigure 10: Capital investment versus resource expenditure
0.02.0
6.0
10.0
14.012.0
8.0
4.0
16.018.0
£bn
2011-12 2012-13 2013-14SR10 – Outturn
2014-15 2015-16SR13 –Outturn
2016-17 2017-18 2018-19SR15 – Plans
2019-20
Total Capital Total Resource (cash) Trend
SR15 –Outturn
Capital and resource data used in the graph includes DEL and AME
5.1 The Government has agreed to provide the biggest investment in transport infrastructure in generations, which shows an increase in capital investment against the projected reduction in resource (excl. non-cash costs) expenditure across the Spending Review 2015 (SR15) period. SR15 is the budget settlement agreed with HM Treasury for future years up to 2019-20.
5.2 Over the SR15 period the Department will continue to reduce its operating costs, whilst improving the efficiency and effectiveness of our services, through working together with other government departments to deliver transformational changes, developing digital solutions and integrating them on cross-government platforms.
5.3 In addition to the funding received in SR15, the Department received further funding in the Autumn Statement 2016, which will support the local strategic road network to help relieve congestion and deliver important updates whilst also supporting the Department’s investment in developing innovative and important technologies. These will reduce our emissions footprint and improve air quality, and will help maintain the global lead in new transport technology to secure highly skilled and well paid jobs.
Annual Report and Accounts 2016-17 109
The Accountability Report Parliamentary accountability and audit report

Figure 11: Key areas of capital investment
0.01.0
3.0
5.0
7.06.0
4.0
2.0
8.0
£bn
2011-12 2012-13 2013-14SR10 – Outturn
2014-15 2015-16SR13 –Outturn
2016-17 2017-18 2018-19SR15 – Plans
2019-20
Highways England* Network Rail HS2
SR15 –Outturn
*Highways Agency until 2014-15
5.4 The capital investment being made over the SR15 period by the Department covers the Network Rail (NR) investment programme, the construction of High Speed 2 (HS2) and the continued delivery of the Roads Investment Strategy by Highways England, while driving forward a number of capital projects across the country, such as improvements to transport in the Northern Powerhouse. This investment will support a more productive Britain, deliver a new and highly efficient infrastructure and will create opportunities for people across Britain.
5.5 Network Rail – was fully consolidated within the Department’s Accounts from 2015-16. In 2017/18, NR will deliver its Great Britain-wide programme of operations, maintenance, renewals and enhancements within ‘Control Period 5’ (CP5), which runs from 1 April 2014 to 31 March 2019. The outputs NR is required to deliver across CP5 were set by the regulator, the Office of Rail and Road, in its 2013
Final Determination. The graph shows an increase in costs in its first year (2015-16) of consolidation. As the investment programme matures, the profile of costs across the CP5 period may need to be adjusted. The figures prior to 2015-16 in figure 11, do not show NR’s actual capital spend but the capital grant provided by the Department.
5.6 Network Rail Investment Programme is the biggest programme of railway modernisation since the Victorian era, with the aim of long term transformation of the railway network.
5.7 High Speed 2 – the Department will deliver HS2 from London to Birmingham by 2026, and to Leeds and Manchester by 2033. The programme is anticipated to support up to 25,000 jobs and up to 2,000 apprenticeships, giving young people an opportunity to gain valuable skills and experience.
Annual Report and Accounts 2016-17110

5.8 The Phase 1 Hybrid bill received Royal Assent in February 2017 which provided clear authority for the construction of Phase 1 of the High Speed Line. This is reflected in figure 11, which shows an increase in expenditure as the Department moves into the construction phase of the programme. Royal Assent for Phase 1 also allows limited elements of preparation and related expenditure in relation to Phase 2 activity.
5.9 Highways England – sees an increase in capital investment over the SR15 period, shown in graph 2. 2017-18 will deliver the third year of the Road Investment Strategy; a multi-year investment plan that will be used to improve the network and create better roads for users. Through modernisation, improving capacity and performance and by ensuring the efficient use of resources.
Financial performance 2016-17 Outturn versus EstimateThe Net Voted Resource DEL Outturn reported in the Statement of Parliamentary Supply was £2,925.3m, which is £141.7m (4.6%) below the Estimate of £3,067m.
Of this, Net Outturn on the Departmental Administration Limit was £258.8m and is £6.1m (2.3%) below the total Estimate of £264.9m.
The Net Voted Capital DEL Outturn Reported in the Statement of Parliamentary Supply was £5,412.5m, which is £75.9m (1.38%) above the Estimate of £5,488.4m.
The material components of the net underspend by Estimate lines are explained below.
Departmental Expenditure Limit (DEL)Section B: Local Authority Transport – Capital DEL overspend £27.8mThe £27.8m overspend against budget is due to higher payments than originally planned to Local Authorities in order to assist them with their ongoing pothole repair and maintenance programmes. The pothole fund is an ongoing commitment over the current spending review period to 2020-21.
Section C: Highways England – Capital DEL underspend £10.5mHighways England delivered their capital programme for 2016-17 in line with the specifications of the Roads Investment Strategy. The variance to the Supplementary Estimate of less than 0.5% reflects minor underspends from across the programme.
Annual Report and Accounts 2016-17 111
The Accountability Report Parliamentary accountability and audit report

Section C: Highways England – Resource DEL underspend £66.8mHighways England’s main variance in their resource budget relates to a 2% underspend on depreciation. HE reviews data on road conditions and forecasts its depreciation charge on a quarterly basis. A prudent forecast was adopted for the Supplementary Estimate and ultimately the final charge was within the budget tolerance.
Section D: Funding of ALBs – Resource DEL underspend £54.1mDelays caused on contracts for Phase 2B and associated legal issues resulted in £51m underspend on HS2 Ltd. The remaining balance of this estimate line represents the net surplus/deficit of the Department’s Arm’s Length Bodies and the variance is an aggregate of smaller variances across a number of bodies.
Section D: Funding of ALBs – Capital DEL overspend £10.5mThe variance on this estimate line represents the net surplus/deficit of the Department’s Arm’s-Length Bodies and is an aggregate of smaller variances across a number of bodies.
Section E: Other Railways – Capital DEL underspend £22.5mThe underspend is predominantly due to delays to depot enabling works as part of the Intercity Express Programme. Works at Swansea have been delayed until 2017-18 as a result of later than anticipated planning permissions and access.
Section J: Aviation, Maritime, Security & Safety – Resource DEL underspend £10.2mThe underspend relates to lower than anticipated Aviation costs on regional airport connectivity, CAA Section 16 advice costs
and aviation security costs in relation to inbound threats. There were also delays in undertaking some of the scheduled work on the IMO building. In addition, the remedial work in relation to the Stansted security landing site was also delayed as the land was contaminated. The above underspends were offset mainly by an overspend on Trust Ports, as there was no budget allocated when the Main Estimate was agreed.
Section L: Motoring Agencies – Resource DEL underspend £20.1mThis underspend mainly relates to the DVLA who out-performed their budget due to greater than forecast demand for first vehicle registrations and lower than forecast IT costs following the in-sourcing of their IT function.
Section O: Support For Passenger Rail Services – Resource DEL shortage of income by £29.8mA decline in the growth rate of passenger fares revenue was more pronounced than forecast which was reflected in lower net income on Govia Thameslink Railways (GTR) where the Department is on revenue risk. GTR additionally experienced periods of industrial action throughout the year. There were also higher revenue support payments to South West Trains.
Section Q: Transport Development Funding – Resource DEL underspend £21.3mThe variance against this estimate line represents an agreed budget transfer from 2016-17 as part of the Autumn Statement commitment to spend £300m on transport infrastructure activities to the end of the spending review period.
Annual Report and Accounts 2016-17112
Section R: Funding of other ALBs – non-voted – underspend of £12.5m The variance on this estimate line represents the net surplus/deficit of the Department’s Arm’s Length Bodies and is an aggregate of small variances.
Section P: High Speed Two – Capital DEL underspend £68.9mThe main reason for this capital variance on High Speed Two relates to the Department assuming a certain number of properties would reach exchange during 2016-17. These are complex property purchases and negotiations are subject to delays.
Annually Managed Expenditure (AME)Section T: Network Rail – Resource AME underspend £2,170.9mThe main underspend derives largely from the following areas:
» £1017m less than anticipated loss on revaluation of derivatives. Derivative valuations are entirely market driven and accordingly NR has no power to manage where they will land. Provision in the Estimate was required to guard against potential highly volatile movements in this area. This cover was ultimately not required.
» £800m underspend on Depreciation; arising from the completion of their DRC exercise (Depreciated Replacement Cost) in-year.
» £89m more income as a result of a number of other smaller activities including accelerated property sales.
Section V: Other Railways – Resource AME overspend £129.4mThe overspend is predominantly due to the Department recognising guarantees to promote investment in railway assets. Under the Railways Act 1993, the Secretary of the State has the power to issue guarantees to promote investment in railway assets.
Section T: Network Rail – Capital AME overspend £48.1mThe variance relates to Network Rail in relation to its Supplementary Estimate budget and deferrals into the final two years of Control Period 5.
Section AA: High Speed Two – Capital AME underspend £298.2mSupplementary estimate provision was secured to give the opportunity to progress compulsory purchase programme, but this was not required before the year end.
Section Z: Central Administration – Resource AME underspend £104.6mThe majority of this underspend relates to the Department providing for £100m AME cover for possible expenses arising from changes in the valuation of the Department’s obligations in respect of Railway Pension assets. The charge for 2016-17 only required £4.8m of this cover.
Annual Report and Accounts 2016-17 113
The Accountability Report Parliamentary accountability and audit report

Reconciliation of resource expenditure between Estimates, Accounts and Budgets
2016-17 2015-16
£m £m
Net Resource Outturn (Estimates) 9,383.8 1,918.3
Adjustments to remove non-budget elements:
Prior Year Adjustment to budget - 6,830.2
Total Resource Budget Outturn 9,383.8 8,748.5
Of which:
Departmental Expenditure Limits (DEL) 2,926.7 3,069.0
Annually Managed Expenditure (AME) 6,457.1 5,679.5
Adjustments include:
Capital grants (net) 2,613.7 3,871.2
Research 18.1 -
EU Grants 26.8 -
Non-supply income (CFERs) (205.2) (533.2)
Adjustments to remove non-budget elements: (71.4) 31.5
Prior Year Adjustment to SOCNE - -
Net Operating Cost (Accounts) 11,765.8 12,118.0
Annual Report and Accounts 2016-17114

Parliamentary accountability disclosuresLosses and special payments
The following sections are subject to audit.
Losses statement
2016-17 2015-16
Core Department &
Agencies
Departmental Group
Core Department &
Agencies
Departmental Group1
Total number of cases 11,443 12,754 6,540 7,828
Total amount (£000) 3,414 50,380 40,640 46,704
Managing Public Money requires a statement showing losses and special payments by value and by type to be shown where they exceed £300,000 in total and those that, individually, exceed £300,000. Losses may relate to cash and store losses, bookkeeping losses, losses arising from a failure to make adequate charge for the use of public property or services, fruitless payments and claims abandoned as well as frauds. Special payments may relate to extra-contractual, extra-statutory and ex-gratia payments and compensation.
The 2016-17 losses include £35,200,000 in relation to 2015-16 Dartford Crossing charges (2015-16: £39,800,000 in relation to 2014-15). Of this, £26,400,000 relates to the impairment of road user charges and penalty charge notices which became irrecoverable, and £8,800,000 relates to penalty charge notices that have not been issued as a result of issues encountered in the implementation of enforcement systems attaching to the newly opened Dart Charge free flow charging scheme. These issues are detailed further in the accounts of the Dartford-Thurrock river crossing charging scheme for 2015-16, and have now been addressed. Other impairments occur for a number of reasons including vehicle keeper details not being available, poor images, mis-read number plates, system errors and illegal activity/evasion (eg. cloned vehicles).
Annual Report and Accounts 2016-17 115
The Accountability Report Parliamentary accountability and audit report

The losses disclosed above for 2016-17 include the following, which require separate disclosure:
Bulk LossesHighways England869 cases valued at £6,314,474 (2015-16: 826 cases valued at £6,201,000) for damage to the road network where the culprit could not be identified or otherwise pursued for costs.
£933,133 (2015-16: £1,044,629) was lost due to unrecovered payments from road users whose vehicles have been removed, stored or disposed under the national vehicle recovery contract arrangements. Recovery of such debts is improbable and not considered value for money to pursue.
Network Rail£1,567,088 for non-fraudulent loss of stores. The National Supply Chain department within the Network Rail Route Services Directorate is undergoing an assessment and change to improve the way physical stock is held and processed. As a result, there is a significant volume of non-fraudulent losses of stock, due to better cataloguing of returns and improved asset management. No single loss within this category was in excess of £300,000.
£689,026 (2015-16: £443,690) refund charges on unused or surplus rail and air travel, external meeting rooms, training courses and events booking. No single loss incurred was in excess of £300,000.
£1,125,929 (2015-16: 115 cases valued at £461,313) for claims abandoned for payments owed to Network Rail by third parties. 154 claims were waived or abandoned. No single item was in excess of £300,000.
DfTcA loss of £311,902.42 was recorded by the core department during 2016-17 in relation to the operation of the Bus Service Operators’ Grant (BSOG). The BSOG scheme allows payments to be made in advance to bus operators and on this occasion the companies which received payments in advance subsequently went into liquidation before satisfying the terms of their funding. Attempts were made to recover funds but concluded that there was no prospect of recovery. There was no individual BSOG loss over £300,000.
Single event lossesHighways EnglandA payment of £604,449 was made for damages to the road and drainage system on the A1 Blyth junction roundabout following a traffic accident in August 2009. Legal proceedings resulted in a partial and final settlement of the claim.
DfTc£2,500,000 was paid in relation to extended the Supertram programme. This payment reflected reduced revenue income due to the delay to the start of service from the original target start date of March 2016 to a date anticipated to be in early autumn 2018.
Annual Report and Accounts 2016-17116

Special Payments
2016-17 2015-16
Core Department &
Agencies
Departmental Group
Core Department &
Agencies
Departmental Group1
Total number of cases 1,417 1,501 1,347 1,362
Total amount (£000) 12,539 15,313 20,061 20,284
1 Losses and Special Payments in 2015-16 have been restated for Network Rail to include the number of cases (3 losses and 7 special payments) and also reduce the value of special payments which was overstated by £3m.
The following payments require separate disclosure:
Highways England£550,000 for a personal injury claim settlement following an incident on the A11/A505 in October 2009.
DfTcA total of £12,300,000 (2015-16:£15,000,000) was paid to settle industrial disease and injury claims from former British Rail employees. There was no individual payment in excess of £300,000.
High Speed Two54 severance payments were agreed where the total amounts incurred are over the limits allowed in HS2’s framework. The total value of those payments in excess of statutory entitlement was £1,219,772 of which, the maximum payment was £233,058, the minimum £2,652 and the median £15,848.
Further details are provided in the HS2 Limited accounts, available separately, and in the Report of the Comptroller and Auditor General included therein.
Annual Report and Accounts 2016-17 117
The Accountability Report Parliamentary accountability and audit report

Fees and charges informationThis section is subject to audit.
2016-17 205-16
Income Full Cost Surplus/ (Deficit)
Income Full Cost Surplus/ (Deficit)
£m £m £m £m £m £m
Highways England
Road damage claims 5.8 5.9 (0.1) 10.3 12.2 (1.9)
Road contract income (S278 Schemes)
56.5 56.5 - 12.4 12.4 -
Rental income 3.6 3.1 0.5 4.2 2.7 1.5
MCA
Marine surveys 4.9 4.6 0.3 4.7 4.4 0.3
Registration of ships 0.9 0.7 0.2 1.0 0.7 0.3
Seafarers’ examination and certification
2.8 2.6 0.2 2.3 2.1 0.2
Wider market initiatives and EU twinning projects
0.6 0.4 0.2 0.4 0.3 0.1
Vehicle Certification Agency
Product certification 20.4 18.7 1.7 18.4 17.5 0.9
Management system certification 2.0 1.6 0.4 2.1 1.7 0.4
DVLA
Fees * 433.3 402.9 30.4 423.5 394.5 29.0
DVLA personalised registrations * 114.6 114.4 0.2 102.6 102.5 0.1
Additional funding from use of facilities
0.6 0.4 0.2 0.4 0.3 0.1
646.0 611.8 34.2 582.3 551.3 31.0
* Full cost numbers include fees and charges paid into the Consolidated Fund.
The information provided above is for fees and charges purposes and is not for IFRS 8 (Operating Segment Reporting) purposes.
Additional information regarding these fees and charges (including the financial objective and performance against financial objective) can be found in the published accounts for each of the individual agencies or arms length bodies.
Information is also available for DVSA and published in its accounts, but not summarised here since DVSA is outside the accounting boundary.
Annual Report and Accounts 2016-17118

Remote contingent liabilitiesThis section is subject to audit.
In addition to contingent liabilities reported within the meaning of IAS37, the Department also reports liabilities for which the likelihood of a transfer of economic benefit in settlement is too remote to meet the definition of contingent liability.
The Department has the following contingent liabilities for which the risk of crystalisation is considered remote. Amounts disclosed reflect the highest reasonable estimate of the possible liability. These are summarised by the nature and purpose of the contingent liability.
31 March
2017
31 March
2016
Quantifiable contingent liabilities £m £m*
Railways Act 1993, Transport Act 2000: Contingent liabilities arise from signing of new, replacement and extended passenger rail franchises agreements, and other agreements to encourage railways investment.
2,777 3,638
CTRL Act 1996. Under the HS1 Concession Agreement, the Secretary of State is liable to pay a compensation for a termination due to a non-default event.
2,423 2,307
Indemnities have been issued to non-executive members of the Departmental board, and to civil servants appointed to represent the Department on the boards of other organisations.
1 1
Under the HS1 Concession agreement the Secretary of State may be liable for a number of quantifiable (disclosed) and unquantifiable payments, including capital expenditure, increase in operating costs and loss of revenue. This would be in the event of legal changes, either in the UK or Europe (‘Change in Circumstances’) or a change directed by another part of the Government (‘Government Change’).
100 100
In 2013 the Secretary of State agreed to quantifiable (disclosed) and unquantifiable assurances, warranties, indemnities and potential losses under the Thameslink Rolling Stock contracts with Siemens, Network Rail and Cross London Trains.
2,747 2,866
In 2012 the Secretary of State agreed to quantifiable (disclosed) and unquantifiable assurances, warranties, indemnities and potential losses under the Inter City Express Rolling Stock contracts with Agility Consortium and Network Rail.
12 417
In view of the fact that government departments generally self-insure, a guarantee has been given to the International Maritime Organization that should the building be partially or completely destroyed, the Department would be obliged to reconstruct the building, or suspend or reduce the rent for a period of three years and fund alternative accommodation. This contingent liability has also been reported to Parliament in accordance with Managing Public Money.
91 66
Guarantees were given by the Strategic Rail Authority (and previously by the Director of Passenger Rail Franchising), and novated to the Department, in relation to new, replacement and extended passenger rail franchise agreements.
165 256
Annual Report and Accounts 2016-17 119
The Accountability Report Parliamentary accountability and audit report

31 March
2017
31 March
2016
Quantifiable contingent liabilities £m £m*
Indemnities issued to businesses at rail privatisation and transferred from BRBR on abolition.
691 991
The SoS may order a formal investigation into any marine accident, or may order the re-hearing of a formal investigation if new and important evidence has been discovered or if there are grounds for suspecting that a miscarriage of justice may have occurred.**
20 20
Letters of comfort have been issued, providing an indemnity in relation to legal action taken against the judge, counsel, solicitors and secretariat to the Thames Safety Inquiry and the Victim Identification Inquiry, which reported in 2000 and 2001 respectively, following major transport disasters.
6 6
The Department has a statutory liability under the Channel Tunnel Act 1987 that if, after termination of the Channel Tunnel concession, it appears to the Secretary of State that the operation of the Tunnel will not be resumed in the near future, he shall take the necessary steps to ensure that the land is left in a suitable condition in accordance with the scheme.
100 100
Other contingent liabilities, including legal claims. 52 55
* Remote Contingent Liabilities for 2015-16 for the HS1 concession agreement for non-default termination have been restated to to reflect the correct figures. ** This contingent liability was incorrectly labelled as ‘International Oil Pollution Compensation Fund Building in the 2015/16 Annual Report & Accounts.
Unquantifiable contingent liabilities
» The Department has historical obligations under agreements entered into by the Director of Passenger Rail Franchising (novated to the Strategic Rail Authority and then to the Department), prior to the privatisation of each of the three rolling-stock companies.
» The Department is party to a NATO agreement relating to indemnification of civil aircraft in respect of their use on NATO tasks in times of crisis and war.
» Marine and Aviation Insurance Act 1952, s1: Government war risk reinsurance for British shipowners insuring their vessels with the British Mutual War Risks Associations (Clubs). Under the current agreement with Clubs, the Government provides 95% reinsurance for Queen’s Enemy Risks (QER). A contingent liability arises from the continuous QER cover for the hull and machinery value of British flag vessels entered with the Clubs.
Bernadette Kelly 17 July 2017
Permanent Secretary and Accounting Officer Department for Transport Great Minster House 33 Horseferry Road London SW1P 4DRAnnual Report and Accounts 2016-17120

The certificate and report of the Comptroller and Auditor General to the House of CommonsI certify that I have audited the financial statements of the Department for Transport and of its Departmental Group for the year ended 31 March 2017 under the Government Resources and Accounts Act 2000. The Department consists of the core Department and its agencies. The Departmental Group consists of the Department and the bodies designated for inclusion under the Government Resources and Accounts Act 2000 (Estimates and Accounts) Order 2016. The financial statements comprise: the Department’s and Departmental Group’s Statements of Comprehensive Net Expenditure, Financial Position, Cash Flows, Changes in Taxpayers’ Equity; and the related notes. These financial statements have been prepared under the accounting policies set out within them. I have also audited the Statement of Parliamentary Supply and the related notes, and the information in the Remuneration and Staff Report and the Parliamentary Accountability disclosures that is described in those reports and disclosures as having been audited.
Respective responsibilities of the Accounting Officer and auditorAs explained more fully in the Statement of Accounting Officer’s Responsibilities, the Accounting Officer is responsible for the preparation of the financial statements and for being satisfied that they give a true and fair view. My responsibility is to audit, certify and report on the financial statements in accordance with the Government Resources and Accounts Act 2000. I conducted my audit in accordance with International Standards on Auditing (UK and Ireland). Those standards require me and my staff to comply with the Auditing Practices Board’s Ethical Standards for Auditors.
Scope of the audit of the financial statementsAn audit involves obtaining evidence about the amounts and disclosures in the financial statements sufficient to give reasonable assurance that the financial statements are free from material misstatement, whether caused by fraud or error. This includes an assessment of: whether the accounting policies are appropriate to the Department’s and the Departmental Group’s circumstances and have been consistently applied and adequately disclosed; the reasonableness of significant accounting estimates made by the Accounting Officer; and the overall presentation of the financial statements. In addition I read all the financial and non-financial information in the Annual Report to identify material inconsistencies with the audited financial statements and to identify any information that is apparently materially incorrect based on, or materially inconsistent with, the knowledge acquired by me in the course of performing the audit. If I become aware of any apparent material misstatements or inconsistencies I consider the implications for my certificate.
I am required to obtain evidence sufficient to give reasonable assurance that the Statement of Parliamentary Supply properly presents the outturn against voted Parliamentary control totals and that those totals have not been exceeded. The voted Parliamentary control totals are Departmental Expenditure Limits (Resource and Capital), Annually Managed Expenditure (Resource and Capital), Non-Budget (Resource) and Net Cash Requirement. I am also required to obtain evidence sufficient to give reasonable assurance that the expenditure and income recorded in the financial statements have been applied to the purposes intended by Parliament and the financial transactions recorded in the financial statements conform to the authorities which govern them.
Annual Report and Accounts 2016-17 121
The Accountability Report Parliamentary accountability and audit report
Opinion on regularityIn my opinion, in all material respects:
» the Statement of Parliamentary Supply properly presents the outturn against voted Parliamentary control totals for the year ended 31 March 2017 and shows that those totals have not been exceeded; and
» the expenditure and income recorded in the financial statements have been applied to the purposes intended by Parliament and the financial transactions recorded in the financial statements conform to the authorities which govern them.
Opinion on financial statements In my opinion:
» the financial statements give a true and fair view of the state of the Department’s and the Departmental Group’s affairs as at 31 March 2017 and of the Department’s net operating cost and Departmental Group’s net operating cost for the year then ended; and
» the financial statements have been properly prepared in accordance with the Government Resources and Accounts Act 2000 and HM Treasury directions issued thereunder.
Opinion on other mattersIn my opinion:
» the parts of the Remuneration and Staff Report and the Parliamentary Accountability disclosures to be audited have been properly prepared in accordance with HM Treasury directions made under the Government Resources and Accounts Act 2000; and
» the information given in the Performance Report and Accountability Report for the financial year for which the financial statements are prepared is consistent with the financial statements.
Matters on which I report by exceptionI have nothing to report in respect of the following matters which I report to you if, in my opinion:
» adequate accounting records have not been kept or returns adequate for my audit have not been received from branches not visited by my staff; or
» the financial statements and the parts of the Remuneration and Staff Report and the Parliamentary Accountability disclosures to be audited are not in agreement with the accounting records and returns; or
» I have not received all of the information and explanations I require for my audit; or
» the Governance Statement does not reflect compliance with HM Treasury’s guidance.
Report I have no observations to make on these financial statements.
Sir Amyas C E Morse 18 July 2017Comptroller and Auditor General
National Audit Office157-197 Buckingham Palace RoadVictoriaLondonSW1W 9SP
Annual Report and Accounts 2016-17122

Financial Statements

6. Financial Statements
Group Statement of Comprehensive Net Expenditurefor the period ended 31 March 2017
2016-17 2015-16 (Reclassified)*
Note Core Department & Agencies
Departmental Group
Core Department &
Agencies
Departmental Group
£m £m £m £m
Income from sale of goods and services 5 (123.6) (1,265.0) (133.7) (1,244.3)
Other operating income 5 (3,168.1) (4,868.6) (2,879.2) (4,536.0)
Total Operating Income (3,291.7) (6,133.6) (3,012.9) (5,780.3)
Staff costs 3 398.5 2,036.2 372.6 1,961.6
Purchase of goods and services 4 1,355.5 4,264.3 1,371.3 4,215.5
Depreciation and impairment charges 4 126.8 6,068.2 136.9 5,593.4
Provision expense 4 152.6 178.8 76.5 106.3
Other operating expenditure 4 11,731.5 4,415.3 12,833.9 5,498.1
Total Operating Expenditure 13,764.9 16,962.8 14,791.2 17,374.9
Net Operating Expenditure 10,473.2 10,829.2 11,778.3 11,594.6
Share of loss/(profits) of associate 5,10 (27.2) (27.2) 6.2 6.2
Finance income 5 (506.0) (99.0) (603.4) (388.3)
Finance expense 4 202.9 1,062.8 197.8 905.5
Net expenditure for the year 10,142.9 11,765.8 11,378.9 12,118.0
Other Comprehensive Net Expenditure
Items that will not be reclassified to net operating costs:
Net (gain)/loss on:
revaluation of property, plant & equipment 6 (309.4) (12,403.6) 52.3 1,912.2
revaluation of intangibles 7 (0.3) (38.7) - -
revaluation of investments 9 (5.6) (99.2) 191.4 127.0
Cash flow hedge – effective portion of fair value change 9 - (14.0) - 8.3
Cash flow hedge – reclassified to profit or loss 9 - (25.8) - (25.8)
Share of associate’s other comprehensive net expenditure 10 142.7 142.7 (135.7) (135.7)
Transfer of Net Assets to Highways England - - 107,953.0 -
Deferred tax movement 15 - (344.9) - (123.1)
Receipt of grant - - - (206.5)
Actuarial (gain)/loss on pension schemes 20 372.3 1,406.3 (298.8) (593.3)
Total comprehensive net expenditure for the year
10,342.6 388.6 119,141.1 13,081.4
The notes on pages 135 to 228 form part of these accounts.* Net expenditure have been reclassified – details can be found in Note 21 outlining the notes affected. Annual Report and Accounts 2016-17124

Group Statement of Financial Positionas at 31 March 2017
2016-17 2015-16
Note Core Department &
Agencies
Departmental Group
Core Department &
Agencies
Departmental Group
£m £m £m £m
Non-current assets:
Property, plant and equipment 6 7,025.4 414,978.2 6,203.1 398,909.4
Investment properties 6.8 - 1,232.3 - 1,109.3
Intangible assets 7 37.1 155.2 52.1 131.1
Financial assets 9 20,796.3 1,948.8 14,729.3 1,663.3
Investment in associates 10 223.6 223.6 350.8 350.8
Trade and other receivables 12 3,862.8 46.3 4,007.2 109.4
Inventories 11 4.2 4.2 3.8 3.8
Total non-current assets 31,949.4 418,588.6 25,346.3 402,277.1
Assets classified as held for sale 6.7 1.1 17.5 1.1 10.2
Inventories 11 246.2 476.8 393.8 634.6
Financial assets 9 - 238.3 - 308.7
Trade and other receivables 12 757.3 2,048.7 495.3 1,793.5
Cash and cash equivalents 13 (156.7) 686.9 109.5 1,180.8
Total current assets 847.9 3,468.2 999.7 3,927.8
Total assets 32,797.3 422,056.8 26,346.0 406,204.9
Current liabilities
Financial liabilities 9 - (1.0) - (9.5)
Trade and other payables 14 (723.2) (7,424.4) (898.3) (7,362.6)
Provisions 16 (209.5) (328.0) (72.7) (185.4)
Total current liabilities (932.7) (7,753.4) (971.0) (7,557.5)
Total assets less net current liabilities
31,864.6 414,303.4 25,375.0 398,647.4
Annual Report and Accounts 2016-17 125
Financial Statements

Group Statement of Financial Position (continued)as at 31 March 2017
2016-17 2015-16
Note Core Department &
Agencies
Departmental Group
Core Department &
Agencies
Departmental Group
£m £m £m £m
Non-current liabilities
Provisions 16 (529.5) (621.4) (453.5) (548.7)
Other payables 14 (5,387.2) (33,042.4) (5,505.9) (35,060.3)
Financial liabilities 9 (4,141.7) (1,528.5) (4,297.9) (1,399.2)
Deferred tax liabilities 15 - (2,381.4) - (2,807.6)
Total non-current liabilities (10,058.4) (37,573.7) (10,257.3) (39,815.8)
Assets less liabilities excluding pension liability
21,806.2 376,729.7 15,117.7 358,831.6
Pension liability 20 (1,647.7) (4,734.4) (1,240.0) (3,151.4)
Assets less liabilities 20,158.5 371,995.3 13,877.7 355,680.2
Taxpayers’ equity and other reserves:
General fund 17,789.7 66,417.1 11,565.3 62,750.1
Revaluation reserve 1,999.2 304,778.6 1,948.4 292,247.7
Available-for-sale reserve 369.6 809.6 364.0 710.4
Hedging reserve - (10.0) - (28.0)
Total equity 20,158.5 371,995.3 13,877.7 355,680.2
The notes on pages 135 to 228 part of these accounts
Bernadette Kelly Accounting Officer
Department for Transport Great Minster House, 33 Horseferry Road, London SW1P 4DR 17 July 2017
Annual Report and Accounts 2016-17126

Group Statement of Cash Flowsfor the year ended 31 March 2017
2016-17 2015-16
Note Core Department &
Agencies
Departmental Group
Core Department &
Agencies
Departmental Group
£m £m £m £m
Cash flows from operating activities
Net operating cost (10,142.9) (11,765.8) (11,378.9) (12,118.0)
Adjustments for non-cash transactions other than pension schemes 4,5 225.7 6,339.8 205.6 5,620.6
Adjustments for non-cash transactions related to pension schemes 4,5 35.4 84.7 42.7 227.9
(Increase)/decrease in inventories 11 147.4 157.4 (34.0) (72.1)
less movement in inventory relating to items not passing through the Statement of Comprehensive Net Expenditure (0.2) (0.2) - -
(Increase)/decrease in trade and other receivables 12 (117.6) (192.1) 27.1 342.9
less movements in receivables relating to items not passing through the Statement of Comprehensive Net Expenditure 157.8 301.9 92.6 1,115.6
Increase/(decrease) in trade and other payables 14 (293.8) (1,956.1) (2,515.0) (2,928.4)
less movements in payables relating to items not passing through the Statement of Comprehensive Net Expenditure (264.4) (370.0) 2,449.1 (1,001.0)
(Increase)/Decrease in derivative assets 9.2 - (139.6) - (192.3)
Increase/(Decrease) in derivative liabilities 9.2 - 120.8 - 365.7
less movements in derivatives not passing through the SoCNE & OCE - 25.6 - (173.4)
Use of provisions 16 (58.1) (111.7) (73.8) (143.6)
Non-cash movement in classification of provision - 5.1 - 20.7
Adjustment for capital and interest element of PFI payments 2.3 72.6 2.0 71.9
Net cash outflow from operating activities (10,308.4) (7,427.6) (11,182.6) (8,863.5)
Annual Report and Accounts 2016-17 127
Financial Statements

Group Statement of Cash Flows (continued)for the year ended 31 March 2017
2016-17 2015-16
Note Core Department &
Agencies
Departmental Group
Core Department &
Agencies
Departmental Group
£m £m £m £m
Cash flows from investing activities
Purchase of property, plant and equipment – additions 6 (616.8) (9,870.9) (57.9) (9,571.0)
Adjustments for movement in capital accruals relating to additions 1.2 5.0 0.6 2.4
Purchase of intangible assets – cash additions 7 (9.6) (13.5) (19.5) (27.9)
Purchase of intangible assets – non-cash additions 0.1 0.1 0.8 0.8
Proceeds of disposal of property, plant and equipment 0.5 4.2 0.8 1.1
Purchase of Investment Properties - (18.4) - -
Equity injections to Joint Venture partnerships - (2.4) - -
Proceeds of disposal of assets held for sale - 5.0 - 88.8
Proceeds of disposal of investments - 64.6 - 6.2
Capital element of lands provision 105.4 170.7 - 23.0
Loans to other bodies 9.1 (6,100.0) - (7,500.0) -
Repayments from other bodies 27.3 27.3 337.3 337.3
Repayments of National Fund Loans 1.1 1.1 1.1 1.1
Net cash outflow from investing activities (6,590.8) (9,627.2) (7,236.8) (9,138.2)
Cash flows from financing activities
From the Consolidated Fund (Supply) – current year 16,854.5 16,854.5 19,012.7 19,012.7
Capital grant funding - - - 262.8
Repayments of loans from the National Loans Fund (1.1) (1.1) 1.1 1.1
Capital element of payments in respect of finance leases - (1.8) - (1.6)
Cost of servicing of finance: interest element of PFI payments (2.3) (72.6) (2.0) (71.9)
Net financing 16,851.1 16,779.0 19,011.8 19,203.1
Annual Report and Accounts 2016-17128

Group Statement of Cash Flows (continued)for the year ended 31 March 2017
2016-17 2015-16
Note Core Department &
Agencies
Departmental Group
Core Department &
Agencies
Departmental Group
£m £m £m £m
Net increase in cash and cash equivalents in the period before adjustment for receipts and payments to the Consolidated Fund
(48.1) (275.8) 592.4 1,201.4
Payments of amounts due to the Consolidated Fund (218.1) (218.1) (586.1) (586.1)
Net increase/(decrease) in cash and cash equivalents in the period after adjustment for receipts and payments to the Consolidated Fund (266.2) (493.9) 6.3 615.3
Cash and cash equivalents at the beginning of the period
109.5 1,180.8 103.2 565.5
Cash and cash equivalents at the end of the period
(156.7) 686.9 109.5 1,180.8
The notes on pages 135 to 228 form part of these accounts
Annual Report and Accounts 2016-17 129
Financial Statements

Group Statement of Changes in Taxpayers’ EquityNote General
FundRevaluation
ReserveHedging Reserve
Available-for-Sale Reserve
Total Reserves
£m £m £m £m £m
Balance at 31 March 2015 55,429.8 294,069.9 (45.2) 837.2 350,291.7
Net loss on revaluation of property, plant and equipment
- (1,912.2) - - (1,912.2)
Change in fair value of derivatives 9 - - (8.3) - (8.3)
Reclassified to SoCNE - - 25.5 - 25.5
Net loss on revaluation of investments
9 - - - (127.0) (127.0)
Receipt of grant 206.5 - - - 206.5
Release of reserves to the Consolidated Statement of Comprehensive Net Expenditure
(0.2) 0.2 - - -
Non-cash charges – auditor’s remuneration
4 0.6 - - - 0.6
Non-cash charges – DfT(c) notional charges
4 0.2 - - - 0.2
Transfers between reserves 30.1 (30.3) - 0.2 -
Net expenditure for the year (12,118.0) - - - (12,118.0)
Reversionary interest on M6 toll road 10.5 - - - 10.5
Deferred tax movements 15 123.1 - - - 123.1
Adjustment to non-current assets (0.8) 131.0 - - 130.2
Actuarial gain recognised in pension scheme
19 593.3 - - - 593.3
Impairments through Revaluation Reserve
- (10.9) - - (10.9)
Share of non-operating income of associate
10 135.7 - - - 135.7
Other movements (202.0) - - - (202.0)
Balance as adjusted by income and expense for 2015-16
44,208.8 292,247.7 (28.0) 710.4 337,138.9
Annual Report and Accounts 2016-17130

Group Statement of Changes in Taxpayers’ Equity (continued)Note General
FundRevaluation
ReserveHedging Reserve
Available-for-Sale Reserve
Total Reserves
£m £m £m £m £m
Net Parliamentary Funding – drawn down
19,012.7 - - - 19,012.7
Net Parliamentary Funding – deemed
117.1 - - - 117.1
CFERS from prior year 56.3 - - - 56.3
Supply (payable)/receivable adjustment
(91.0) - - - (91.0)
CFERs payable to the Consolidated Fund
(553.8) - - - (553.8)
Balance at 31 March 2016 62,750.1 292,247.7 (28.0) 710.4 355,680.2
Trunking/Detrunking (2.5) - - - (2.5)
Net gain on revaluation of property, plant and equipment
- 12,403.6 - - 12,403.6
Net gain on revaluation of intangible assets
- 38.7 - - 38.7
Change in fair value of derivatives 9 - - 14.0 - 14.0
Reclassified to SoCNE - - 25.8 - 25.8
Net gain on revaluation of investments
9,4 - - - 99.2 99.2
Non-cash charges – auditor’s remuneration
4 0.6 - - - 0.6
Transfers between reserves 486.5 (468.5) (18.0) - -
Net expenditure for the year (11,765.8) - - - (11,765.8)
Reversionary interest on M6 toll road 14.2 - - - 14.2
Deferred tax movements 15 (211.6) 556.5 - - 344.9
Adjustment to non-current assets 3.0 0.6 - - 3.6
Actuarial loss recognised in pension scheme
20 (1,406.3) - - - (1,406.3)
Share of non-operating expenditure of associate
10 (142.7) - - - (142.7)
Other movements (211.0) - (3.8) - (214.8)
Balance as adjusted by income and expense for 2016-17
49,514.5 304,778.6 (10.0) 809.6 355,092.7
Annual Report and Accounts 2016-17 131
Financial Statements

Group Statement of Changes in Taxpayers’ Equity (continued)Note General
FundRevaluation
ReserveHedging Reserve
Available-for-Sale Reserve
Total Reserves
£m £m £m £m £m
Net Parliamentary Funding – drawn down
16,854.5 - - - 16,854.5
Net Parliamentary Funding – deemed 91.0 - - - 91.0
CFERs from prior year - - - - -
Contingencies Fund - - - - -
Supply (payable)/receivable adjustment 182.3 - - - 182.3
CFERs payable to the Consolidated Fund (225.2) - - - (225.2)
Balance at 31 March 2017 66,417.1 304,778.6 (10.0) 809.6 371,995.3
The notes on pages 135 to 228 form part of these accountsThe General Fund serves as the chief operating fund. The General Fund is used to account for all financial resources except those required to be accounted for in another fund.
Annual Report and Accounts 2016-17132
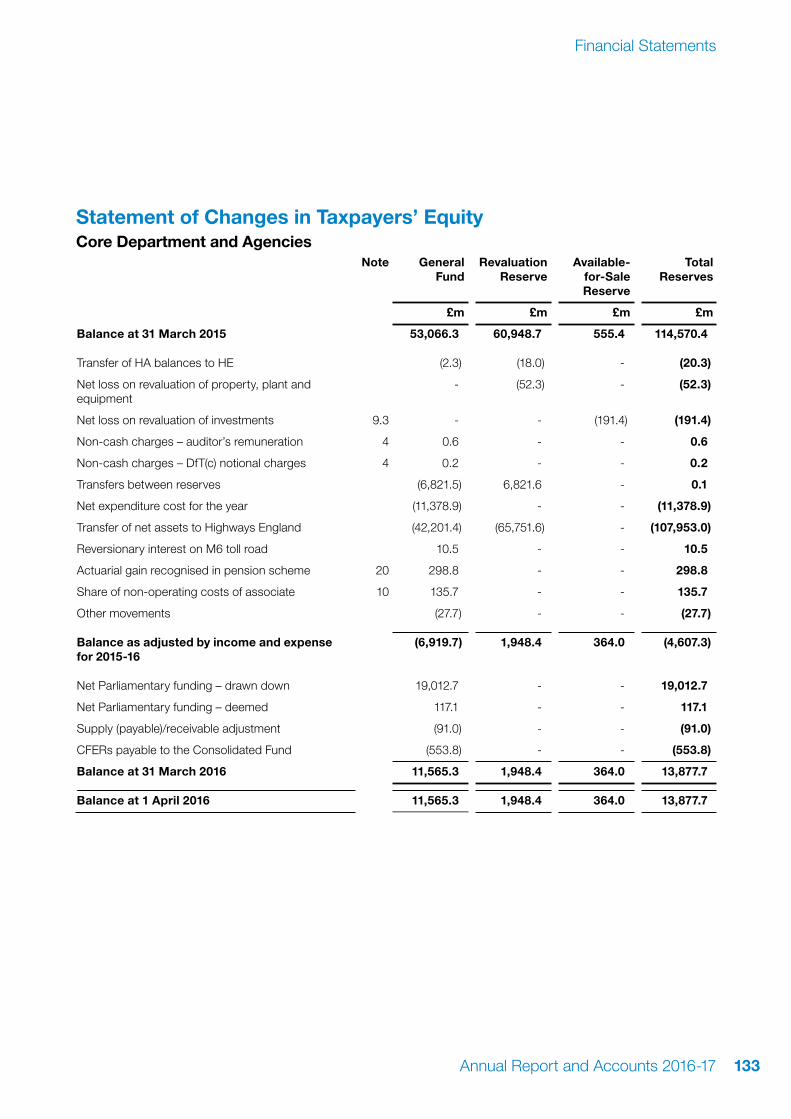
Statement of Changes in Taxpayers’ EquityCore Department and Agencies
Note General Fund
Revaluation Reserve
Available-for-Sale Reserve
Total Reserves
£m £m £m £m
Balance at 31 March 2015 53,066.3 60,948.7 555.4 114,570.4
Transfer of HA balances to HE (2.3) (18.0) - (20.3)
Net loss on revaluation of property, plant and equipment
- (52.3) - (52.3)
Net loss on revaluation of investments 9.3 - - (191.4) (191.4)
Non-cash charges – auditor’s remuneration 4 0.6 - - 0.6
Non-cash charges – DfT(c) notional charges 4 0.2 - - 0.2
Transfers between reserves (6,821.5) 6,821.6 - 0.1
Net expenditure cost for the year (11,378.9) - - (11,378.9)
Transfer of net assets to Highways England (42,201.4) (65,751.6) - (107,953.0)
Reversionary interest on M6 toll road 10.5 - - 10.5
Actuarial gain recognised in pension scheme 20 298.8 - - 298.8
Share of non-operating costs of associate 10 135.7 - - 135.7
Other movements (27.7) - - (27.7)
Balance as adjusted by income and expense for 2015-16
(6,919.7) 1,948.4 364.0 (4,607.3)
Net Parliamentary funding – drawn down 19,012.7 - - 19,012.7
Net Parliamentary funding – deemed 117.1 - - 117.1
Supply (payable)/receivable adjustment (91.0) - - (91.0)
CFERs payable to the Consolidated Fund (553.8) - - (553.8)
Balance at 31 March 2016 11,565.3 1,948.4 364.0 13,877.7
Balance at 1 April 2016 11,565.3 1,948.4 364.0 13,877.7
Annual Report and Accounts 2016-17 133
Financial Statements

Statement of Changes in Taxpayers’ Equity (continued)Core Department and Agencies
Note General Fund
Revaluation Reserve
Available-for-Sale Reserve
Total Reserves
£m £m £m £m
Net gain on revaluation of property, plant and equipment
- 309.4 - 309.4
Net gain on revaluation of intangible assets - 0.3 - 0.3
Net gain on revaluation of investments 9.3 - - 5.6 5.6
Non-cash charges – auditor’s remuneration 4 0.6 - - 0.6
Transfers between reserves 259.4 (259.4) - -
Net expenditure cost for the year (10,142.9) - - (10,142.9)
Reversionary interest on M6 toll road 14.2 - - 14.2
Adjustment to non-current assets (0.1) 0.5 - 0.4
Actuarial loss recognised in pension scheme 20 (372.3) - - (372.3)
Share of non-operating costs of associate 10 (142.7) - - (142.7)
Other movements (294.4) - - (294.4)
Balance as adjusted by income and expense for 2016-17
887.1 1,999.2 369.6 3,255.9
Net Parliamentary funding – drawn down 16,854.5 - - 16,854.5
Net Parliamentary funding – deemed 91.0 - - 91.0
Supply (payable)/receivable adjustment 182.3 - - 182.3
CFERs payable to the Consolidated Fund (225.2) - - (225.2)
Balance at 31 March 2017 17,789.7 1,999.2 369.6 20,158.5
The notes on pages 135 to 228 form part of these accountsThe General Fund serves as the chief operating fund. The General Fund is used to account for all financial resources except those required to be accounted for in another fund.
Annual Report and Accounts 2016-17134

Statement of Changes in Taxpayers’ Equity (continued)Core Department and Agencies
Note General Fund
Revaluation Reserve
Available-for-Sale Reserve
Total Reserves
£m £m £m £m
Net gain on revaluation of property, plant and equipment
- 309.4 - 309.4
Net gain on revaluation of intangible assets - 0.3 - 0.3
Net gain on revaluation of investments 9.3 - - 5.6 5.6
Non-cash charges – auditor’s remuneration 4 0.6 - - 0.6
Transfers between reserves 259.4 (259.4) - -
Net expenditure cost for the year (10,142.9) - - (10,142.9)
Reversionary interest on M6 toll road 14.2 - - 14.2
Adjustment to non-current assets (0.1) 0.5 - 0.4
Actuarial loss recognised in pension scheme 20 (372.3) - - (372.3)
Share of non-operating costs of associate 10 (142.7) - - (142.7)
Other movements (294.4) - - (294.4)
Balance as adjusted by income and expense for 2016-17
887.1 1,999.2 369.6 3,255.9
Net Parliamentary funding – drawn down 16,854.5 - - 16,854.5
Net Parliamentary funding – deemed 91.0 - - 91.0
Supply (payable)/receivable adjustment 182.3 - - 182.3
CFERs payable to the Consolidated Fund (225.2) - - (225.2)
Balance at 31 March 2017 17,789.7 1,999.2 369.6 20,158.5
The notes on pages 135 to 228 form part of these accountsThe General Fund serves as the chief operating fund. The General Fund is used to account for all financial resources except those required to be accounted for in another fund.
Notes to the Financial StatementsNotes to the financial statements provide additional information required by statute and accounting standards to explain a particular feature of the financial statements. The notes which follow will also provide explanations and additional disclosure to assist readers’ understanding and interpretation of the financial statements.
1. Statement of Significant Accounting Policies
1.1 Basis of preparationThese financial statements have been prepared in accordance with the 2016-17 Government Financial Reporting Manual (FReM) issued by HM Treasury. The accounting policies contained in the FReM apply International Financial Reporting Standards (IFRS) as adapted or interpreted for the public sector context.
Where the FReM permits a choice of accounting policy, the accounting policy which is judged to be most appropriate to the particular circumstances of the Department for Transport Group for the purpose of giving a true and fair view has been selected. The particular policies adopted by the Group are described below. They have been applied consistently in dealing with items that are considered material to the accounts.
In addition to the primary statements prepared under IFRS, the FReM requires the Department to prepare a Statement of Parliamentary Supply and supporting notes analysing the net resource outturn and capital outturn against control totals voted by Parliament through the Estimate. These are included within the Parliamentary Accountability section of this document.
1.2 Accounting conventionThese accounts have been prepared under the historical cost convention modified by the revaluation of certain categories of non-current assets and financial instruments.
1.3 Basis of consolidationThese accounts comprise a consolidation of the Department (the core Department) and those entities which fall within the Departmental boundary as defined in the FReM and make up the ‘Departmental Group’ (the Group). Where two columns are included these are the core Department plus Agencies and the Group. Accounting policies are harmonised and all material intra-group transactions are eliminated on consolidation.
Transfer by Absorption accounting is applied to all transfers of functions (and entities), including those with local government, with public corporations and within a departmental group. Under Transfer by Absorption accounting, the values of assets and liabilities are not adjusted to fair value, and there is no recognition of goodwill.
A list of all those entities within the Departmental boundary is contained in Note 19.
Annual Report and Accounts 2016-17 135
Financial Statements

1.4 Investments in associates and joint arrangementsWhere the Group has significant influence or joint control over an investee and the investee is classified as private sector, the investee is accounted for in accordance with IAS 28.
The Group recognises its share of the investee’s profits, losses and other comprehensive income or expenditure in its Statement of Comprehensive Net Expenditure. The investment in the investee is recognised initially at cost and subsequently adjusted for the Group’s share of profits or losses and other comprehensive income made by the investee. Distributions received from the investee reduce the carrying value of the investment.
1.5 Adoption of new and revised standardsNo new accounting standards became effective for the first time in 2016-17.
A number of new standards, amendments to standards and interpretations are not yet effective for the year ended 31 March 2017, and have not been applied in these financial statements. The following new standards may affect future Resource Accounts if they are adopted by the FReM, after further consultation:
IFRS 9 addresses classification, measurement and impairment of financial assets. It should be included in the 2018-19 FReM. It is thought that IFRS 9 will result in terminology changes.
IFRS 15 covers the recognition of revenues from contracts with customers. It should be included in the 2018-19 FReM. It is not thought that this will materially affect the timing of recognition or amounts recognised.
IFRS 16 provides a single lessee accounting model, requiring lessees to recognise assets and liabilities for all leases unless the lease term is 12 months or less, or the underlying asset has a low value. The probable impact is that there will be earlier recognition of expenditure in relation to leases (amortisation and interest). The IFRS should become effective in the private sector for accounting periods commencing on or after 1 January 2019. Subject to EU adoption, it should be included in the 2019-20 FReM.
IFRS 17 requires a discounted cash flow approach to accounting for insurance contracts. Subject to EU adoption, it is expected to come into effect for accounting periods commencing on or after 1 January 2021 and should be included in the 2021-22 FReM. The Department currently has no contracts which meet the definition of insurance contracts, and is not proposing to treat its financial guarantee contracts as insurance contracts rather than financial instruments.
IFRSs 9 and 15 have been adopted by the EU to date. The full impact will not be known until the FReM adopts or adapts these standards.
The Group does not consider that any other new or revised standard or interpretation will have a material impact.
1.6 Prior period adjustmentsItems are retrospectively restated either in accordance with IAS 8 where there has been a change in accounting policy, to correct a material prior year error, to reflect transfers of functions between Departmental groups or to reflect retrospective changes in classification that the Office of National Statistics has announced. There were no prior period adjustments this year.
Annual Report and Accounts 2016-17136

1.7 Property, plant and equipmentProperty, plant and equipment is described in Note 6.
RecognitionAssets are recognised initially at cost, which comprises purchase price or construction cost, any costs directly attributable to bringing the asset into the location and condition necessary for it to be capable of operating in the manner intended by the Group.
Capitalisation of additions to networked assets starts when capital projects begin; they are treated as separate assets during construction and transferred to networked assets on completion.
ValuationThe valuation approach used for specific assets depends on their function and value.
Networked assets (principally the Strategic Rail Network and Railway Network) are valued at Depreciated Replacement Cost (DRC). This is arrived at by first determining a gross replacement cost for the network in line with RICS guidelines; this includes the assumption of a modern equivalent asset, instantaenous build on a greenfield site, and a network identical in function, scale and connectivity. A full valuation takes place at least every five years, with input indices applied to a standard price list in interim periods. To arrive at the final DRC valuation, an adjustment to the gross replacement value is made to reflect management’s best estimate of the condition of the network.
Capital works to networked assets are recognised at cost. However, in order to achieve consistency with the overall depreciated replacement cost basis of
accounting, the carrying value of any asset under construction for these networks at the year end is adjusted to depreciated replacement cost. This typically results in a write-down, arising from the specific costing assumptions required for depreciated replacement cost valuations.
Other assets under construction, including the costs of HS2, are recognised at cost until such time as the assets’ future operating model becomes sufficiently clear to adopt an alternative basis.
Non-networked assets are valued either at fair value or depreciated replacement cost through regular valuation or through the application of indicies and estimated asset lives. The valuation approach used for specific assets depends on their function and value.
Where assets are revalued through the use of indices, gross book values and accumulated depreciation balances are adjusted, and upwards movements recognised in other comprehensive net expenditure and accumulated in equity under the heading of revaluation surplus. Downwards movements are analysed to determine whether they were caused by a clear consumption of economic benefits. Downwards movements that are caused by a clear consumption of economic benefits, or which reduce the value of the asset below its historic cost, are recognised as a part of the net operating expenditure, with the reduction then transferred from the General Fund to reduce the amount accumulated in equity under the revaluation surplus. Other downwards movements are recognised under other comprehensive net expenditure.
Annual Report and Accounts 2016-17 137
Financial Statements

DepreciationNo depreciation is provided on freehold land. Depreciation on networked assets is calculated as the cost of maintenance, adjusted for observed changes in the condition of the asset, except where the asset or a definable component has a determinable useful economic life. All other assets are depreciated at rates calculated to write off the assets over their expected economic useful lives on a straight-line basis. Asset lives vary from 60 years (for some freehold assets) or more in special cases to three years (for some IT assets). Where material, lives are reviewed annually to reflect the latest engineering trends. Note 6 provides further information on the asset lives used to depreciate components of the major networked assets.
1.8 Impairment of non-current assetsThe Group annually tests for impairment of all assets, including any in the course of construction. The test for impairment is by comparing the assets’ carrying value with their recoverable amount, being the higher of the value in use and the fair value less costs of disposal. Where appropriate impairment losses are charged to the relevant revaluation reserve.
1.9 Assets held for saleThese assets are available for immediate sale in their present condition and are being actively marketed for sale. They are valued at the lower of their carrying amount and fair value (market value) less material selling costs. Depreciation is not applied.
1.10 Intangible assetsIntangible assets are capitalised if it is probable that the expected future benefits attributable to them will flow to the Group and if their cost can be measured reliably.
Intangibles are subsequently valued using the revaluation model, as described in IAS 38. Any increases in value are recognised in other comprehensive net expenditure. Any decreases due to changes in market prices are taken initially through other comprehensive net expenditure to the extent of any credit balance existing in the revaluation surplus in respect of that asset and otherwise to net operating expenditure. If an intangible asset cannot be revalued, because there is no active market for assets of that type, these intangible assets are expressed at their current value through the application of Modified Historical Cost Accounting, as a proxy for fair value less any accumulated amortisation or impairment losses.
Intangible assets are amortised over their useful lives, which are typically between two to fifteen years, on a straight-line basis. The estimated useful life and amortisation method are reviewed at the end of each annual reporting period.
1.11 Investment propertiesIAS 40 requires that properties are classified as investment properties where they are held for the purpose of capital appreciation or to earn rentals or both. Investment properties are valued at fair value with changes recognised in net operating expenditure for the period in which they arise.
1.12 Investments and financial instrumentsPublic dividend capital is recognised at historical cost, adjusted for impairment where necessary. Other financial instruments are recognised initially at fair value adjusted for transaction costs (except for assets and liabilities held at fair value through profit or loss (net operating expenditure)). Thereafter, such
Annual Report and Accounts 2016-17138

instruments are classified in accordance with IAS 39 and measured as described below.
1.12.1 Assets and liabilities held at fair value through profit or loss (net operating expenditure)These are any financial assets or liabilities that meet any of the IAS 39 conditions to be measured at fair value with fair value changes in profit or loss (net operating expenditure). The group has financial assets and liabilities that meet two of those conditions. These are a) “held for trading” including derivatives; b) by designation, usually to prevent an accounting mismatch; for example, where an intended hedging arrangement has not proved sufficiently effective to justify hedge accounting, the intended hedged item may be designated to be held at fair value through profit or loss.
1.12.2 Loans and receivablesThis classification is required for non-derivative financial assets with fixed or determinable payments that are not quoted in an active market, that are not held for trading and that the entity does not plan to sell. Loans and receivables are held at amortised cost, using the effective interest method to discount future cash flows. Impairments are recognised in accordance with the ‘incurred loss’ method, reflecting events that occurred between the initial recognition of the asset and the end of the current reporting period that have an impact on future cash flows.
1.12.3 Available-for-sale financial assetsAfter initial recognition, available-for-sale financial assets are measured at fair value, with gains or losses recognised within other comprehensive net expenditure, except for impairment losses and for available-for-sale debt instruments, foreign exchange gains
or losses and any changes in fair value arising from revised estimates of future cash flows, which are recognised in net operating expenditure. This classification is required for non-derivative financial assets that are not classified to any of the preceding categories. It includes investments in other public sector entities.
1.12.4 Other financial liabilitiesThese are financial liabilities other than those classified as held at fair value through profit or loss (net operating expenditure). They are valued initially at fair value and thereafter at amortised cost using the effective interest rate. The effective interest rate is the rate that exactly discounts the future cash flows back to the initial fair value.
1.12.5 Derecognition of financial instrumentsFinancial assets are derecognised when the Department’s rights to receive cash flows expire or have been transferred, provided that the transfer transaction also transfers substantially all of the risks and rewards of ownership and control of the financial asset.
1.12.6 Derivative financial instrumentsThe Group acquired derivative financial instruments to manage certain exposures to fluctuations in foreign currency exchange rates and interest rates. The Group does not hold or issue derivative instruments for speculative purposes. The use of derivatives is governed by the Group’s policies. Such derivative financial instruments are initially recognised at fair value on the date on which a derivative contract is entered into and are subsequently re-measured at fair value. The resulting gain or loss is recognised in net operating expenditure immediately unless the derivative is designated and effective as a hedging instrument, in which event
Annual Report and Accounts 2016-17 139
Financial Statements

the timing of the recognition in profit or loss (net operating expenditure) depends on the nature of the hedge relationship. The Group designates certain derivatives as either hedges of the fair value of recognised assets or liabilities or firm commitments (fair value hedges), hedges of highly probable forecast transactions or hedges of the foreign currency risk of firm commitments (cash flow hedges).
Derivatives not designated into an effective hedge relationship are classified as “held for trading”.
1.12.7 Hedge accountingHedging is applied to a number of instruments held by Network Rail. These were entered into as a result of Network Rail’s funding and financing arrangements prior to its reclassification into the public sector. Further information on Network Rail’s financial risk management strategy is included in the company’s own financial statements. In order to qualify for hedge accounting, at inception of the transaction the Group formally designates and documents the hedging relationship, which includes the Group’s risk management objective and strategy for undertaking the hedge, identification of the hedging instrument, the hedged item, the nature of the risk being hedged and how the Group will assess the hedging instrument’s effectiveness. In addition, an instrument is only designated as a hedge when it is expected to be highly effective in offsetting changes in fair value or cash flows attributable to the hedged risk as designated and documented and where effectiveness is capable of reliable measurement.
Fair value hedgesChanges in the fair value of derivatives that are designated and qualify as fair value
hedges are recorded in the income statement, together with any changes in the fair value of the hedged item that is attributed to the hedged risk. The change in the fair value of the hedging instrument and the change in the hedged item attributable to the hedged risk are recognised within “other gains and losses” in the Statement of Comprehensive Net Expenditure.
Cash flow hedgesChanges in the fair value of derivative financial instruments that are designated and effective as hedges of future cash flows are recognised in other comprehensive net expenditure and the ineffective portion is recognised immediately within “other gains and losses” in net expenditure.
Cash flow hedge accounting is discontinued when the hedging instrument expires, is sold, terminated, exercised or no longer meets the criteria for hedge accounting. Where the hedging instrument no longer meets the criteria for hedge accounting, the cumulative gain or loss on the hedging instrument that remains is recognised directly in equity from the period when the hedge was effective remains in equity until the forecast transaction occurs.
Where cash flow hedge accounting is discontinued because the forecast transaction is no longer expected to occur, the cumulative gain or loss on the hedging instrument that remains recognised directly in equity from the period where the hedge was effective is recognised in net expenditure.
1.13 InventoriesThese are valued at cost, or replacement cost, if materially different. Where excess or obsolete inventory holdings have been
Annual Report and Accounts 2016-17140

identified, the carrying value is reduced to the estimated net realisable value. Work in progress is valued at the lower of cost, including appropriate overheads, and net realisable value.
Properties close to the proposed route of the high speed rail link acquired under the discretionary purchase schemes are valued at cost. Long-term inventory holdings for special structures (such as tunnels and bridges), are valued at estimated replacement cost. Work in progress is valued at the lower of cost and net realisable value.
1.14 Cash and cash equivalentsCash and cash equivalents comprise bank balances held, commercial paper and money market deposit investments at varying rates. The carrying amount of these assets approximates to their fair value.
1.15 Revenue recognitionOperating income is stated net of VAT, measured at the fair value of the consideration received or receivable and is recognised on the following basis:
» income from the sale of goods is recognised on transfer of the risks and rewards of ownership in those goods;
» income from the performance of services is recognised on the degree of performance;
» interest income is recognised using the effective interest method;
» dividends receivable are recognised when the Group becomes entitled to them;
» income from permitting others to use the Group’s assets is recognised on an
accruals basis in accordance with the terms of the contract; and
» income received for the use of continuing rights under rail franchise agreements are recognised as revenue as the rights are used.
1.16 Pensions and other employee benefitsPast and present employees of the Department and its agencies are generally covered by the provisions of the Principal Civil Service Pension Scheme (PCSPS), which is described in Note 23. The PCSPS is an unfunded multi-employer defined benefit scheme.
The Department recognises the expected cost of these elements on a systematic and rational basis over the period during which it benefits from employees’ services by payment to the PCSPS of amounts calculated on an accruals basis. Liability for payment of future benefits is a charge on the PCSPS.
Pension benefits to ministers are provided by the Parliamentary Contributory Pension Fund (PCPF). Further details are provided in the Remuneration Report.
Other defined benefit plansPast and present employees of other consolidated entities may be members of defined benefit arrangements, which provide benefits based on pensionable pay. Defined benefit arrangements may be funded (meaning that the scheme is a separate entity, which receives contributions and invests them to fund pension payments) or unfunded (meaning that there is no separate scheme and the employer remains directly liable to fund pension payments). On retirement, members of the schemes are paid their
Annual Report and Accounts 2016-17 141
Financial Statements
pensions from a fund which is kept separate from the Group. The Group makes cash contributions to the funds in advance of members’ retirement.
Every three years the Group’s schemes are subject to a full actuarial funding valuation using the projected unit method. Separate valuations are prepared for accounting purposes on an IAS 19 basis as at the balance sheet date. Pension scheme assets are measured using current market bid values. Pension scheme defined benefit obligations are measured using the projected unit credit method and discounted at the current rate of return on a high quality corporate bond of equivalent term and currency to the defined benefit obligation. The difference between the value of the pension scheme assets and pension scheme liabilities is a surplus or a deficit. A pension scheme surplus is recognised to the extent that it is recoverable and a pension scheme deficit is recognised in full.
Changes in the surplus or deficit are categorised between: (a) service cost (including current service cost, past service cost, as well as gains and losses on curtailments and settlements); (b) net interest expense or income; and (c) re-measurement.
The Group presents the first two components in profit or loss (net expenditure). Past service cost is recognised in the period of a plan amendment. Curtailment gains and losses are accounted for as past service costs. Net interest is calculated by applying the discount rate at the beginning of the period to the net defined benefit obligation or asset.
Re-measurements, comprising actuarial gains and losses and the return on plan assets (excluding interest), are reflected immediately
in the balance sheet with a charge or credit recognised in other comprehensive net expenditure in the period in which they occur. They are not reclassified to net operating expenditure.
Defined contribution plansSome employees are members of defined contribution plans. A defined contribution plan is a post-employment benefit plan under which the employer pays fixed contributions into a separate entity and will have no legal or constructive obligation to pay further amounts. Obligations for contributions to defined contribution pension plans are recognised as an employee benefit expense in net operating expenditure in the periods during which services are rendered by employees.
Early RetirementThe Department is required to pay, as termination benefits, the additional cost of benefits, beyond the normal PCSPS benefits, in respect of employees who retire early, unless the retirements are on approved medical grounds. The Department provides for the full cost of benefits (including pensions payable up to the normal retirement age and lump sums) when it becomes demonstrably committed to providing those benefits.
Short-term employee benefitsThe Department accrues for short-term employee benefits (which fall due within twelve months of the period in which they are earned).
1.17 LeasesLeases are classified as finance leases if the risks and rewards of ownership are transferred to the lessee. Finance leases are capitalised at the commencement of
Annual Report and Accounts 2016-17142

the lease term at the fair value of the leased item or, if lower, at the present value of the minimum lease payments. Finance charges are allocated to each period so as to achieve a constant rate of interest on the remaining balance of the liability and are charged directly against income. Capitalised leased assets are depreciated over the shorter of the estimated useful life of the asset or the lease term.
Other leases are classified as operating leases. Operating lease payments are recognised as an expense in net operating expenditure on a straight-line basis over the lease term.
1.18 Service concessionsUnder a service concession, a Government entity contracts with a private sector entity to develop, finance, operate and maintain infrastructure, to deliver services directly or indirectly to the public, but controls or regulates those services and controls any significant residual interest in the infrastructure.
The Group recognises the infrastructure associated with service concessions as an asset. The asset is accounted for in a manner consistent with other similar assets. Where the operator has a right to receive consideration from the Group, for example, in the form of unitary charges, the Group recognises the related liability. Interest on the liability and expenditure on services provided under the service concession are recognised in net operating expenditure as they accrue. Unitary charges are apportioned between three elements: an element to pay for services; an element to pay interest on the liability and an element to repay the initial liability. Where the operator has a right to charge the public, the Group recognises a
deferred income balance initially at the same value as the asset, which is amortised to net operating expenditure over the life of the arrangement.
Where, at the end of the concession, all or part of the property constructed by the operator reverts to the Group for a specified value, the difference between the expected fair value of the residual asset on reversion at the start of the contract and any agreed payment on reversion is built up over the life of the contract to ensure proper allocation of payments between the cost of services under the contract and acquisition of the residual interest. Capitalisation of residual interest is disclosed within Non-Current Assets under Assets under Construction.
1.19 Grants payableGrants payable are recognised in the period in which the underlying event or activity giving entitlement to the grant occurs. Where the conditions of a grant require a specified form of verification from a grant recipient to provide assurance on compliance with grant terms and conditions, any subsequent adjustments are recognised in the next accounting period. Grant payments are outside the scope of VAT and are therefore made on a gross basis.
1.20 TaxationThe tax expense comprises current tax and deferred tax. The current tax liability is calculated using the tax rates that have been enacted or substantively enacted by the balance sheet date.
Deferred tax is recognised in respect of temporary differences between the carrying amounts of assets and liabilities for financial reporting purposes and the amounts used for taxation purposes where these will result in
Annual Report and Accounts 2016-17 143
Financial Statements

either adverse or favourable tax effects on the realisation of assets or settlement of liabilities.
Deferred tax is measured at the tax rates that are expected to be applied to temporary differences when they reverse, based on the laws that have been enacted or substantively enacted by the reporting date. Deferred tax assets are recognised on all deductible temporary differences to the extent that it is probable that there will be taxable profits available against which the temporary timing differences can be utilised. Deferred tax liabilities are recognised for all taxable temporary differences. The valuation of the railway network to depreciated replacement cost is not considered to represent a taxable temporary difference, because it does not reflect conditions which are expected to result.
Deferred tax is charged or credited in the income statement except when it relates to items charged or credited directly to equity. In this case the deferred tax is also accounted for within equity.
1.21 ProvisionsThe Group makes provisions for liabilities and charges where, at the balance sheet date, a legal or constructive obligation exists for a future liability in respect of a past event and where the amount of the obligation can be estimated reliably. Provisions are discounted where the effect is material.
1.22 Contingent liabilities and assetsThe Group discloses as contingent liabilities potential future obligations arising from past obligating events, where the existence of such obligations remains uncertain pending the outcome of future events outside of the Group’s control, unless their likelihood
is considered to be remote. Guarantees, indemnities and undertakings are treated as contingent liabilities.
The Group discloses as contingent assets potential future rights that arise from past events to receive economic benefits where it is probable that there will be an inflow of economic benefits.
1.23 Value Added TaxIrrecoverable VAT is charged to the relevant expenditure category or, if appropriate, included in the capitalised purchase cost of non-current assets. Income and expenditure is otherwise shown net of VAT.
1.24 Rail franchise agreementsUnder rail franchise agreements, each Train Operating Company either pays a franchise premium or receives a subsidy in each franchise year.
Rail franchise agreements include mechanisms to adjust the level of premium/subsidy to reflect performance and agreed events. Adjusting costs or revenues are recognised as they are incurred or earned. Adjusting transactions are not considered to be separately identifiable components; consequently, all adjusting transactions in respect of premium-generating franchises are accounted for as adjustments to income and all adjusting transactions in respect of subsidy-paying franchises are accounted for as adjustments to programme costs. Each Train Operating Company’s resultant net subsidy/premium amount is recognised gross for Group reporting purposes. Franchise subsidies and premia are outside the scope of VAT.
Annual Report and Accounts 2016-17144

1.25 Significant estimation techniquesIn valuing available-for-sale financial assets, for which there is no active market, the Department uses estimation techniques which reflect, so far as practicable, those that would be used by market participants, making maximum use of market data. The initial contribution is deemed to be the fair value as at that date, thereafter, that valuation is benchmarked against forecast discounted cash flows, changes in the share prices of entities in comparable sectors, and changes in the values of the entity’s asset base, to determine whether any changes in valuations are required.
In accounting for arrangements containing a lease and for service concessions, the apportionment of lease rentals between capital, interest and service elements of PFI contracts requires an estimate of the interest rate implicit in the contract.
In accounting for employee benefits, determining the value of post-termination benefits depends on judgements made as to the longevity of recipients and on their entitlements to post-retirement benefits, which is determined by their length of service. For those pension schemes to which IAS 19 applies, the values of scheme liabilities are determined by actuarial estimates regarding the longevity of current and deferred pensioners and long-term rates of inflation.
In calculating present values, the calculation of nominal discount rates and of future repayments of index-linked obligations, requires the estimation of future changes in the Retail Price Index (RPI) or the Consumer Price Index (CPI).
Where material, the cost of untaken staff leave has been estimated and accrued by individual entities and consolidated.
1.26 Critical judgements and key sources of estimation uncertainty1.26.1 Valuation of Networked AssetsBoth the road network and the railway network are valued on a depreciated replacement cost basis. The depreciated replacement cost basis reflects the cost of constructing a modern equivalent asset, adjusted to reflect the current condition of the asset. Judgement is required to determine the nature of a modern equivalent asset and the asset’s current condition. Estimates are required to adjust recent cost data to current costs, and to extrapolate sample data to the population level. Costing methods and assumptions are based on expert advice. Further details are provided in notes 6.2 to 6.4.
1.26.2 Classification of legal claims as contingent liabilities or provisions and then as current and non-current provisionsThe Group occasionally faces legal claims and challenges, which may result in the possible outflow of economic benefits. The treatment of these as contingent liabilities or provisions, their valuation, and presentation as current or non-current is based on legal advice.
1.26.3 Useful lives of property, plant and equipment and valuation of provisions for dilapidationsWhen determining the economic useful life of an asset installed within a property, the Group reflects its intention to remain in that property. Provisions for dilapidations are based on professional valuations of the cost of restoration, discounted back to the intended vacation date.
Annual Report and Accounts 2016-17 145
Financial Statements

1.26.4 Valuation of provisionsThe Group has recognised as provisions the amounts required to settle its obligations to those who have taken voluntary early retirement. The determination of these amounts is affected by estimates of the life expectancy of retirees.
The Group has assumed from British Railways Board (Residuary) Limited obligations to compensate former employees of British Rail for industrial diseases contracted during that employment. The valuation of the outstanding liability is performed by independent actuaries, based on assumptions about the incidence and impact of these diseases.
1.26.5 Valuation of defined benefit pension schemesIn valuing the liabilities of defined benefit pension schemes, the Group consults actuaries who provide valuations based on estimates of demographic factors, such as life expectancy. The actuaries also provide advice on the assumptions underlying the investment assets, such as future rates of return. Note 20 contains a sensitivity analysis which indicates the approximate effects on the actuarial liability of changes to the main actuarial assumptions.
1.26.6 Valuation of long-term financial obligationsThe Group has long-term obligations to external lenders, which are linked to RPI. The valuation of those obligations may reflect forecast RPI data where this is not available at the year-end.
1.26.7 Value of financial guarantee to Network Rail and of the fee receivable from Network RailThe core Department has determined the fair value of the financial guarantee to Network Rail (the Financial Indemnity Mechanism) shown in Note 9.2.2 from an estimation of the value of the guarantee to Network Rail, being the reduction in interest costs arising from the existence of a Government guarantee, obtained by comparing guaranteed and unguaranteed debt instruments. This estimation was prepared by independent experts (Cambridge Economic Policy Associates) for the ORR (Office of Rail and Road). This reflects the ORR’s current policy that Network Rail should pay for the benefit they receive from the guarantee.
Annual Report and Accounts 2016-17146

2. Statement of Operating Costs by Operating SegmentThe Department reports to the Board in accordance with its organisational structure and this is reflected in the segmental analysis. There are five director general organisational groups, outlined below, as well as a non-group. The groups and associated delivery bodies are described in more detail in the Directors report.
Rail Group: The key activities of this group are franchise management, major rail projects and Network Rail. It leads policy and strategic management across the rail industry. Network Rail is partly grant funded by the Department.
Resources and Strategy Group: This supports the activities of the other groups. It leads on finance, human resources, procurement, property and analytical matters and is funded through supply. It includes some central functions outside the group for this analysis.
International, Security and Environmental Group: This contains a mix of activity including transport security, transport energy/environment, accident investigation, aviation and maritime, including the Maritime and Coastguard Agency. The group is funded by Supply and leads on policy and strategy in these areas.
Roads, Devolution and Motoring Group: This contains driving and roads related activities. It includes all of the Driver and Vehicle Agencies, however, DVSA is not included in the group financial statements. The group also includes Highways England and leads on roads policy and strategy. This group is funded through supply and fees.
High Speed Rail Group: This contains High Speed 2 and the HS2 programme, including leading on policy and strategy. It is funded through Supply.
Annual Report and Accounts 2016-17 147
Financial Statements

2016
-17
Rai
l Gro
up
Res
ou
rces
&
Str
ateg
yIn
tern
atio
nal
S
ecu
rity
&
Env
iro
nm
ent
Ro
ads,
D
evo
luti
on
& M
oto
rin
g
Hig
h S
pee
d
Two
Tota
l
£m£m
£m£m
£m£m
Gro
ss e
xpen
ditu
re
10,
201.
7 3
46.6
7
89.3
6
,548
.0
140
.1
18,
025.
7
Inco
me
(4,9
79.7
) (1
67.2
) (1
93.4
) (7
93.2
) (0
.2)
(6,1
33.7
)
Net
Exp
end
itu
re 5
,222
.0
179
.4
595
.9
5,7
54.8
1
39.9
1
1,89
2.0
Sha
re o
f (lo
ss)/p
rofit
s of
ass
ocia
tes
(27.
2)
Div
iden
d re
ceiv
able
(3
0.6)
Inte
rest
rece
ivab
le(6
8.4)
Net
Op
erat
ing
Co
sts
per
Sta
tem
ent
of
Co
mp
reh
ensi
ve N
et E
xpen
dit
ure
11,
765.
8
2015
-16
(Rec
lass
ified
)
Rai
l Gro
up
Res
ou
rces
&
Str
ateg
yIn
tern
atio
nal
S
ecu
rity
&
Env
iro
nm
ent
Ro
ads,
D
evo
luti
on
&
Mo
tori
ng
Hig
h S
pee
d
Two
Tota
l
£m£m
£m£m
£m£m
Gro
ss e
xpen
ditu
re
10,
049.
5 1
75.5
7
97.1
7
,240
.1
70.
0 1
8,33
2.2
Inco
me
(4,7
47.2
)(3
2.8)
(149
.0)
(903
.7)
-
(5,8
32.7
)
Net
Exp
end
itu
re 5
,302
.3
142
.7
648
.1
6,3
36.4
7
0.0
12,
499.
5
Sha
re o
f pro
fits
of a
ssoc
iate
s 6
.2
Div
iden
d re
ceiv
able
(3
70.7
)
Inte
rest
rece
ivab
le(1
7.0)
Net
Op
erat
ing
Co
sts
per
Sta
tem
ent
of
Co
mp
reh
ensi
ve N
et E
xpen
dit
ure
12,
118.
0
Annual Report and Accounts 2016-17148

2016
-17
Rai
l Gro
up
Res
ou
rces
&
Str
ateg
yIn
tern
atio
nal
S
ecu
rity
&
Env
iro
nm
ent
Ro
ads,
D
evo
luti
on
& M
oto
rin
g
Hig
h S
pee
d
Two
Tota
l
£m£m
£m£m
£m£m
Gro
ss e
xpen
ditu
re
10,
201.
7 3
46.6
7
89.3
6
,548
.0
140
.1
18,
025.
7
Inco
me
(4,9
79.7
) (1
67.2
) (1
93.4
) (7
93.2
) (0
.2)
(6,1
33.7
)
Net
Exp
end
itu
re 5
,222
.0
179
.4
595
.9
5,7
54.8
1
39.9
1
1,89
2.0
Sha
re o
f (lo
ss)/p
rofit
s of
ass
ocia
tes
(27.
2)
Div
iden
d re
ceiv
able
(3
0.6)
Inte
rest
rece
ivab
le(6
8.4)
Net
Op
erat
ing
Co
sts
per
Sta
tem
ent
of
Co
mp
reh
ensi
ve N
et E
xpen
dit
ure
11,
765.
8
2015
-16
(Rec
lass
ified
)
Rai
l Gro
up
Res
ou
rces
&
Str
ateg
yIn
tern
atio
nal
S
ecu
rity
&
Env
iro
nm
ent
Ro
ads,
D
evo
luti
on
&
Mo
tori
ng
Hig
h S
pee
d
Two
Tota
l
£m£m
£m£m
£m£m
Gro
ss e
xpen
ditu
re
10,
049.
5 1
75.5
7
97.1
7
,240
.1
70.
0 1
8,33
2.2
Inco
me
(4,7
47.2
)(3
2.8)
(149
.0)
(903
.7)
-
(5,8
32.7
)
Net
Exp
end
itu
re 5
,302
.3
142
.7
648
.1
6,3
36.4
7
0.0
12,
499.
5
Sha
re o
f pro
fits
of a
ssoc
iate
s 6
.2
Div
iden
d re
ceiv
able
(3
70.7
)
Inte
rest
rece
ivab
le(1
7.0)
Net
Op
erat
ing
Co
sts
per
Sta
tem
ent
of
Co
mp
reh
ensi
ve N
et E
xpen
dit
ure
12,
118.
0
3. Staff Costs
Staff costs comprise:
2016-17 2015-16
(reclassified)*
Type
Permanently employed
staff Other Staff MinistersSpecial
advisers Total Total
£m £m £m £m £m £m
Wages and salaries 2,508.0 109.3 0.2 0.1 2,617.6 2,399.6
Social security costs 274.9 1.5 - - 276.4 220.0
Other pension costs 221.0 2.3 - - 223.3 246.0
Sub total 3,003.9 113.1 0.2 0.1 3,117.3 2,865.6
Less recoveries in respect of outward secondments (1.1) - - - (1.1) (0.7)
Less: recoveries in respect of capitalised staff costs (1,026.8) (53.3) - - (1,080.1) (903.3)
Total range 1,976.0 59.8 0.2 0.1 2,036.1 1,961.6
Further details of staff costs are disclosed in the Accountability report.
* Details of the reclassification can be found in note 21.
Annual Report and Accounts 2016-17 149
Financial Statements

4. Expenditure2016-17 2015-16
(reclassified)*
Note Core Department & Agencies
Departmental Group
Core Department & Agencies
Departmental Group
£m £m £m £m
Cash items
Interest charges 202.9 1,062.8 197.8 905.4
Other operating expenditure
Capital grants 2,811.9 2,813.7 3,871.2 3,871.2
Current grants 1,056.4 1,055.7 1,289.6 1,289.6
Grant in Aid 7,528.1 - 7,334.5 -
EU capital grants 27.2 26.8 - -
Subsidies 224.8 224.8 255.9 255.9
Eurocontrol payments 47.6 47.6 40.1 40.1
Purchase of goods and services
Rentals under operating leases 9.0 65.7 9.7 65.4
PFI interest charges 18.8 142.0 18.7 146.3
Research and development expenditure
18.2 18.1 17.2 17.9
Support for passenger rail services 374.2 374.2 374.3 374.3
Road network current maintenance - 466.5 - 546.1
Rail network maintenance - 801.1 - 968.5
PFI service charges - 277.3 - 230.1
Search & rescue helicopters 191.9 191.9 163.2 163.2
Information & communications technology
113.5 273.0 154.5 304.7
Consultancy 50.2 78.8 63.8 93.8
Professional services 20.0 207.9 15.6 139.8
Accommodation 39.6 398.4 40.0 357.2
Publicity & legal 7.1 12.7 9.7 18.1
Support services 69.7 214.4 76.5 120.0
Travel and subsistence 12.7 66.8 11.1 62.3
Auditors' remuneration and expenses - 1.9 - 0.7
Eurotunnel payments 242.9 242.9 252.0 252.0
Other costs 187.1 430.1 164.4 354.5
Sub total – cash 13,253.8 9,495.1 14,359.8 10,577.2
Annual Report and Accounts 2016-17150

2016-17 2015-16 (reclassified)*
Note Core Department & Agencies
Departmental Group
Core Department & Agencies
Departmental Group
£m £m £m £m
Non-cash items
Depreciation and impairment charges
Depreciation 6 102.2 6,164.0 101.7 5,630.1
Amortisation 7 24.2 30.6 34.8 38.8
Impairment of fixed assets and assets held for sale
- 3.8 1.1 29.4
Impairment of share capital - - - -
Downward revaluation of fixed assets 0.4 (130.2) (0.7) (104.9)
Other operating expenditure
Corporation tax (refund)/charge - (76.6) - (304.7)
Net ineffectiveness arising from cash flow hedge accounting
- - - 31.3
Fair value losses/(gains) on fair value hedges
- (164.3) - (156.3)
Fair value loss on carrying value of fair value hedged debt
- 171.0 - 158.8
Net decrease in fair value of non-hedge accounted debt
- 27.4 - 15.2
Loss/(gain) on derivatives not hedge accounted
- 137.3 - 264.9
Write down in value of assets - - - 1.4
Loss/(profit) on disposal of fixed assets 0.1 12.5 (0.3) (5.1)
Loss/(profit) on disposal of share capital
- (37.3) - (77.1)
Pension scheme costs 35.4 176.7 42.7 112.7
Core Department notional charges - - 0.2 0.2
Capital grant in kind (Eurostar International Ltd)
- - - -
Purchase of goods and services
Auditors' remuneration and expenses 0.6 0.6 0.6 0.6
Provision expense
Provisions (released)/provided in year 16 144.9 160.0 76.7 100.1
Unwinding of discount on provisions 16 7.6 7.6 (0.2) (0.2)
Provision for bad/doubtful debts 0.1 11.2 - 6.4
Sub total – non-cash 315.5 6,494.3 256.6 5,741.6
Statement of Comprehensive Net Expenditure
13,569.3 15,989.4 14,616.4 16,318.8
Annual Report and Accounts 2016-17 151
Financial Statements

4.1 Expenditure analysis 2016-17 2015-16
(reclassified)*
Core Department & Agencies
Departmental Group
Core Department & Agencies
Departmental Group
£m £m £m £m
Purchase of goods and services 1,355.5 4,264.3 1,371.3 4,215.5
Depreciation and impairment charges 126.8 6,068.2 136.9 5,593.4
Provision expense 152.6 178.8 76.5 106.3
Other operating expenditure 11,731.5 4,415.3 12,833.9 5,498.1
Finance expense 202.9 1,062.8 197.8 905.5
Total expenditure 13,569.3 15,989.4 14,616.4 16,318.8
* Details of the reclassification can be found in note 21. ** There is a difference in the depreciation costs between Note 4 and Note 6 (SOCNE and SOFP) which is a result of HS2 capitalising part of their depreciation and amortisation costs against Railway Asset Under Construction.
Annual Report and Accounts 2016-17152

5. Income2016-17 2015-16
(reclassified)*
Note Core Department & Agencies
Departmental Group
Core Department & Agencies
Departmental Group
£m £m £m £m
Cash Items
Sale of goods and services
Rental income 1.1 713.6 0.1 659.2
Dartford road crossing user charges 122.5 122.5 133.6 133.6
Franchised track access income - 372.4 - 390.6
Freight income - 56.5 - 60.9
Other income
Transport for Scotland – SLA Receipt - 463.6 - 691.2
Fees & charges to other government departments
318.1 20.9 338.0 13.4
Fees & charges to external customers 598.2 1,352.0 573.0 1,273.7
EU income 27.2 27.4 - 0.5
Claims for damages to road network - 5.8 - 10.3
Income from Train Operating Companies
1,663.8 1,866.1 1,619.8 1,819.3
Grant income received - 158.6 - -
Capital grant income received 200.0 200.0 - -
Eurocontrol Receipts 47.8 47.8 40.1 40.1
Eurotunnel Recharge 241.4 241.4 241.0 241.0
Other income 17.2 430.6 12.9 392.1
Sub Total – Cash Items 3,237.3 6,079.2 2,958.5 5,725.9
Non cash items
Share of (loss)/profits of associates 10 15.5 15.5 (46.1) (46.1)
Amortisation of deferred income 54.4 54.4 54.4 54.4
Annual Report and Accounts 2016-17 153
Financial Statements

2016-17 2015-16 (reclassified)*
Note Core Department & Agencies
Departmental Group
Core Department & Agencies
Departmental Group
£m £m £m £m
Sub Total – Non cash items 69.9 69.9 8.3 8.3
Operating Income 3,307.2 6,149.1 2,966.8 5,734.2
Share of (loss)/profits of associates 10 11.7 11.7 39.9 39.9
Dividends arising from Joint Venture Sales
- - 366.6 366.6
Dividends receivable 30.5 30.6 3.0 4.1
Interest receivable 475.5 68.4 233.8 17.6
Statement of Comprehensive Net Expenditure
3,824.9 6,259.8 3,610.1 6,162.4
5.1 Income analysis2016-17 2015-16
(reclassified)*
Core Department & Agencies
Departmental Group
Core Department & Agencies
Departmental Group
£m £m £m £m
Sale of goods & services 123.6 1,265.0 133.7 1,244.3
Other income 3,168.1 4,868.6 2,879.2 4,536.0
Finance income 506.0 99.0 603.4 388.3
Share of (loss)/profits of associates (comprises of cash settled and non-cash elements above)
27.2 27.2 (6.2) (6.2)
Total income 3,824.9 6,259.8 3,610.1 6,162.4
* Details of the reclassification can be found in note 21.
Annual Report and Accounts 2016-17154

6. P
rop
erty
, Pla
nt a
nd E
qui
pm
ent
Gro
up
20
16-1
7
Infr
astr
uctu
re a
sset
sA
UC
Land
, bui
ldin
gs
& o
ther
Rai
l Net
wo
rkS
trat
egic
R
oad
N
etw
ork
HS
1 In
fras
truc
ture
A
sset
Ass
ets
und
er
Co
nstr
uctio
nLa
nd a
nd
bui
ldin
gs
Oth
er a
sset
sTo
tal
£m£m
£m£m
£m£m
£m
Co
st o
r va
luat
ion
At 1
Apr
il 20
16
414
,988
.2
124
,070
.8
3,5
46.0
4
,553
.8
1,0
23.8
4
74.8
5
48,6
57.4
Det
runk
ings
-
(2
.6)
-
-
-
-
(2.6
)
Add
ition
s -
6
34.5
-
9
,215
.3
3.3
1
7.8
9,8
70.9
Writ
e-do
wn
of c
apita
l add
ition
s
-
-
-
(2,6
81.8
) -
-
(2
,681
.8)
Dis
posa
ls
-
(22.
2)
-
-
(4.5
) (3
7.5)
(6
4.2)
Impa
irmen
ts
-
-
-
-
(2.2
) (0
.7)
(2.9
)
Tra
nsfe
rs
2,8
39.9
5
22.6
-
(3
,399
.9)
20.
0 1
4.0
(3.4
)
Rec
lass
ifica
tions
-
2
.8
-
(4.3
)35
.423
.056
.9
Rev
alua
tions
1
1,83
0.0
4,0
12.1
-
(3
.5)
(2.2
) 7
.3
15,
843.
7
CTR
L La
nd In
crea
se
-
-
-
-
-
At
31 M
arch
201
7 4
29,6
58.1
1
29,2
18.0
3
,546
.0
7,6
79.6
1
,073
.6
498
.7
571
,674
.0
Annual Report and Accounts 2016-17 155
Financial Statements

6. P
rop
erty
, Pla
nt a
nd E
qui
pm
ent (
cont
inue
d)
Gro
up
20
16-1
7
Infr
astr
uctu
re a
sset
sA
UC
Land
, bui
ldin
gs
& o
ther
Rai
l Net
wo
rkS
trat
egic
R
oad
N
etw
ork
HS
1 In
fras
truc
ture
A
sset
Ass
ets
und
er
Co
nstr
uctio
nLa
nd a
nd
bui
ldin
gs
Oth
er a
sset
sTo
tal
£m£m
£m£m
£m£m
£m
Dep
reci
atio
n
At 1
Apr
il 20
16 1
34,9
16.2
14,
040.
6 3
07.1
-
218
.6 2
65.5
149
,748
.0
Cha
rged
in y
ear
4,8
56.7
1,1
95.4
46.
1 -
2
5.3
44.
4 6
,167
.9
Dis
posa
ls
-
(5.3
) -
-
(3
.1)
(36.
7)
(45.
1)
Impa
irmen
ts
-
-
-
-
-
(0.1
) (0
.1)
Rec
lass
ifica
tions
-
0
.1
-
-
44.8
20.
2 65
.1
Rev
alua
tions
9
79.0
(2
02.8
) -
-
(2
1.6)
5
.4
1,0
18.4
At
31 M
arch
201
7 1
40,7
51.9
1
5,02
8.0
353
.2
-
264
.0
298
.7
156
,695
.8
Car
ryin
g a
mo
unt
at 3
1 M
arch
201
7 2
88,9
06.2
1
14,1
90.0
3
,192
.8
7,6
79.6
8
09.6
2
00.0
4
14,9
78.2
Car
ryin
g a
mo
unt
at 3
1 M
arch
201
6 2
80,0
72.0
1
10,0
30.2
3
,238
.9
4,5
53.8
8
05.2
2
09.3
3
98,9
09.4
Ass
et fi
nanc
ing
:
Ow
ned
288
,906
.2
111
,684
.9
3,1
92.8
7
,679
.6
780
.9
169
.4
412
,413
.8
Fina
nce
leas
ed
-
-
-
-
1.4
2
8.8
30.
2
On-
bala
nce
shee
t (S
oFP
) PFI
and
oth
er
serv
ice
conc
essi
on a
rran
gem
ent
-
2,5
05.1
-
-
2
7.3
1.8
2
,534
.2
Car
ryin
g a
mo
unt
at 3
1 M
arch
201
7 2
88,9
06.2
1
14,1
90.0
3
,192
.8
7,6
79.6
8
09.6
2
00.0
4
14,9
78.2
Of t
he t
ota
l:
Dep
artm
ent
-
2,49
0.8
3,1
92.8
96
8.0
213
.1
13.
9 6,
878.
6
Age
ncie
s -
-
-
4
.2
104
.1
38.
5 1
46.8
Oth
er d
esig
nate
d bo
dies
2
88,9
06.2
11
1,69
9.2
-
6,70
7.4
492
.4
147
.6
407,
952.
8
Car
ryin
g a
mo
unt
at 3
1 M
arch
201
7 2
88,9
06.2
1
14,1
90.0
3
,192
.8
7,6
79.6
8
09.6
2
00.0
4
14,9
78.2
Annual Report and Accounts 2016-17156

6. P
rop
erty
, Pla
nt a
nd E
qui
pm
ent (
cont
inue
d)
Gro
up
2
016-
17
Infr
astr
uctu
re a
sset
sA
UC
Land
, bui
ldin
gs
& o
ther
Rai
l Net
wo
rkS
trat
egic
R
oad
N
etw
ork
HS
1 In
fras
truc
ture
A
sset
Ass
ets
unde
r C
onst
ruct
ion
Land
and
b
uild
ing
sO
ther
as
sets
Tota
l
£m
£
m
£m
£
m
£m £
m
£m
Co
st o
r va
luat
ion
At 1
Apr
il 20
15
408
,416
.4
126
,394
.1
3,5
46.0
3
,105
.2
996
.0
470
.3
542
,928
.0
Ope
ning
bal
ance
adj
ustm
ents
-
-
-
4
.5
(2.7
) (1
.5)
0.3
Add
ition
s
-
576
.6
-
8,3
94.7
1
7.3
4.6
8
,993
.2
Writ
e-do
wn
of c
apita
l add
ition
s
-
-
-
(855
.2)
-
-
(855
.2)
Dis
posa
ls
-
-
-
-
(10.
9)
(5.1
) (1
6.0)
Impa
irmen
ts
-
(25.
4)
-
-
(22.
1)
(15.
4)
(62.
9)
Tra
nsfe
r 3
,682
.2
244
.1
-
(3,9
49.6
) 7
.7
17.
3 1
.7
Rec
lass
ifica
tions
-
-
-
(5
.1)
(5.5
) 1
7.0
6.4
Rev
alua
tions
2
,889
.6
(3,1
18.6
) -
(2
,140
.7)
44.
0 (1
2.4)
(2
,338
.1)
CTR
L La
nd In
crea
se
-
-
-
-
-
At
31 M
arch
201
6 4
14,9
88.2
1
24,0
70.8
3
,546
.0
4,5
53.8
1
,023
.8
474
.8
548
,657
.4
Annual Report and Accounts 2016-17 157
Financial Statements

6. P
rop
erty
, Pla
nt a
nd E
qui
pm
ent (
cont
inue
d)
Gro
up
2
016-
17
Infr
astr
uctu
re a
sset
sA
UC
Land
, bui
ldin
gs
& o
ther
Rai
l Net
wo
rkS
trat
egic
R
oad
N
etw
ork
HS
1 In
fras
truc
ture
A
sset
Ass
ets
unde
r C
onst
ruct
ion
Land
and
b
uild
ing
sO
ther
as
sets
Tota
l
£m
£
m
£m
£
m
£m £
m
£m
Dep
reci
atio
n
At 1
Apr
il 20
15
130
,320
.9
14,
504.
7 2
61.0
-
2
08.5
2
41.0
1
45,5
36.1
Ope
ning
bal
ance
adj
ustm
ents
-
-
-
-
(0
.2)
(0.4
) (0
.6)
Cha
rged
in y
ear
4,5
95.3
9
29.2
4
6.1
-
23.
0 3
6.5
5,6
30.1
Dis
posa
ls
-
-
-
-
(7.9
) (3
.8)
(11.
7)
Impa
irmen
ts
-
(4.3
) -
-
(8
.7)
(4.1
) (1
7.1)
Rev
alua
tions
-
(1
,389
.0)
-
-
3.9
(3
.7)
(1,3
88.8
)
At
31 M
arch
201
6 1
34,9
16.2
1
4,04
0.6
307
.1
-
218
.6
265
.5
149
,748
.0
Car
ryin
g a
mo
unt
at 3
1 M
arch
201
6 2
80,0
72.0
1
10,0
30.2
3
,238
.9
4,5
53.8
8
05.2
2
09.3
3
98,9
09.4
Car
ryin
g a
mo
unt
at 3
1 M
arch
201
5 2
78,0
95.5
1
11,8
89.4
3
,285
.0
3,1
05.2
7
87.5
2
29.3
3
97,3
91.9
Annual Report and Accounts 2016-17158

6. P
rop
erty
, Pla
nt a
nd E
qui
pm
ent (
cont
inue
d)
Gro
up
2
016-
17
Infr
astr
uctu
re a
sset
sA
UC
Land
, bui
ldin
gs
& o
ther
Rai
l Net
wo
rk
Str
ateg
ic
Ro
ad
Net
wo
rk
HS
1 In
fras
truc
ture
A
sset
Ass
ets
unde
r C
onst
ruct
ion
Land
and
b
uild
ing
sO
ther
as
sets
Tota
l
£m
£
m
£m
£
m
£m £
m
£m
Ass
et fi
nanc
ing
:
Ow
ned
280
,072
.0
107
,573
.6
3,2
38.9
4
,553
.8
778
.1
172
.2
396
,388
.6
Fina
nce
leas
ed
-
-
-
-
1.9
3
3.8
35.
7
On-
bala
nce
shee
t (S
oFP
) PFI
and
oth
er
serv
ice
conc
essi
on a
rran
gem
ent
-
2,4
56.6
-
-
2
5.2
3.3
2
,485
.1
Con
trac
ts
-
-
-
-
-
-
-
Car
ryin
g a
mo
unt
at 3
1 M
arch
201
6 2
80,0
72.0
1
10,0
30.2
3
,238
.9
4,5
53.8
8
05.2
2
09.3
3
98,9
09.4
Of t
he t
ota
l:
Dep
artm
ent
-
2,2
02.4
3
,238
.9
387
.9
215
.3
11.
2 6
,055
.7
Age
ncie
s -
-
-
2
.9
107
.6
36.
9 1
47.4
Oth
er d
esig
nate
d bo
dies
2
80,0
72.0
1
07,8
27.8
-
4
,163
.0
482
.3
161
.2
392
,706
.3
Car
ryin
g a
mo
unt
at 3
1 M
arch
201
6 2
80,0
72.0
1
10,0
30.2
3
,238
.9
4,5
53.8
8
05.2
2
09.3
3
98,9
09.4
Annual Report and Accounts 2016-17 159
Financial Statements

6.1 Asset ClassesProperty, plant and equipment is categorised into Infrastructure assets,Assets under construction, Land and Buildings and Other assets.
Infrastructure Assets These are Networked Assets, which are integrated networks servicing a significant geographical area. They comprise the Railway Network and the Strategic Road Network and the HS1 concession. These assets usually display some or all of the following characteristics:
» They are part of a system or network;
» They are specialised in nature and do not have alternative uses;
» They are immovable; and
» They may be subject to constraints on disposal.
The Strategic Road Network (SRN) consists of the motorways and all-purpose trunk roads (APTRs) in England, which form a single integrated network. The SRN constitutes carriageways, including earthworks, tunnelling and road pavements, roadside communications, bridges and other structures, and land and buildings within the highway’s perimeter. Capitalisation is applied on a grouped basis where the elements in substance form a single asset and for land, road construction schemes and road and structures renewals in Highways England. Expenditure on road construction schemes in the course of design or construction is capitalised when it is reasonably certain the scheme will go ahead. On completion, the scheme will be transferred to the main networked asset category and valued at depreciated replacement cost.
The Railway Network consists of the infrasturcture supporting the operation of Great Britain’s national rail services and
is valued at depreciated replacement cost. The Railway Network consists of track, earthworks, signalling, power, plant, telecommunications, bridges, fencing, coastal defences, station and operational property and land. It includes only those assets which are controlled by Network Rail; others such as HS1, London Underground, other separately owned metropolitan systems, and heritage railway lines are excluded.
Assets under Construction (AUC)New infrastructure projects in the course of design or construction are added to AUC at cost. For networked assets all additions are re-measured at standard replacement cost and any value changes are taken through the revaluation reserve.
On completion project costs are transferred out of AUC and into the networked asset at standard replacement cost. (which will be different to actual cost).
Land and BuildingsIn the prior year each of land, buildings and dwellings had been disclosed as separate asset classes. These have now been grouped into a single class of assets. This is appropriate disclosure due to their similar nature and the relative materiality of this class of assets, following the inclusion of the rail network in the accounts of the Department. This category includes:
» Land and buildings outside the network’s perimeter (including those recognised by other Group members);
» Lighthouses and vessels recognised by the General Lighthouse Authorities;
» Non-operational buildings; and
» All residential properties owned by the Group which are not part of an existing scheme under construction are reported as dwellings and valued at open market value.
Annual Report and Accounts 2016-17160

Other AssetsIn the prior year each of plant and machinery, furniture and fittings, transport equipment and information technology had been disclosed as separate asset classes. These have now been grouped into a single class of assets. This is appropriate disclosure due to their similar nature and the relative materiality of this class of assets, following the inclusion of the rail network in the accounts of the Department.
The most material groups within other assets are Plant and Machinery and Fixtures and Fittings, and Information Technology.
6.2 Rail Network The rail network was valued, as at 31 December 2015, by Network Rail and Turner and Townsend (professional valuers) using data provided by Network Rail. An indexation factor has been used to update the values to 31st March 2017, and to determine the values in prior years. RPI was used to index all components other than land in 2016-17. These components were indexed by 3.1%. In 2016-17, land was indexed using CPIH, at a rate of 2.3%. The key components of this valuation, associated remaining asset lives and depreciation charges are shown in the table below:
2016-17 2015-16
Type
Depreciated Replacement
CostRemaining
LifeDepreciation
ChargeDepreciation
Charge
£m Years * £m £m
Structures 42,890.2 64 709.3 691.2
Earthworks 66,572.4 99 674.6 642.1
Telecoms 2,715.9 14 195.4 189.5
Operational property 15,233.9 27 572.9 554.8
Electrification and plant 34,963.3 33 1,092.3 946.5
Track 24,064.4 22 1,087.7 1,063.1
Signals 6,554.9 13 524.4 508.1
Land 95,911.1 - - -
Total 288,906.1 4,856.7 4,595.3
* Remaining life of asset has been updated to reflect better information.
In 2015-16, a simple average of sub-components making up each asset class was shown in this note. These lives have been updated to reflect a weighted average by the Depreciated Replacement Cost value of each sub-component.
Annual Report and Accounts 2016-17 161
Financial Statements

6.3 Rail Network
Network Rail’s own accounts value the railway network at fair value using an income approach, this value differs significantly from the depreciated replacement cost of the railway network included in these accounts. Network Rail measures the income flows that arise to the holder of the network licence from owning the railway network. Whilst this is appropriate for Network Rail’s own accounts such an approach does not take into account the significant economic benefits to Great Britain over and above the returns received by the holder of the network licence for running the rail infrastructure. It would also be difficult to reliably estimate wider economic benefits for valuation purposes.
Government accounting rules requires that networked assets are valued on a consistent basis using depreciated replacement cost (DRC). This valuation method provides a consistent platform to measure the consumption of economic resources in government accounts. The value is considerably higher than in Network Rail’s accounts. One key difference is that the valuation includes the cost of replacing earthworks, long life structures, and buying operational land. These elements comprise much of the network value for DRC purposes. These costs were in the large part incurred more than 100 years ago. It follows that the future commercial returns, as captured in Network Rail’s income approach, are not related to the depreciated replacement cost of these components of the railway network.
Critical judgementsThe integrated railway network is used to deliver the operation, maintenance and renewal of the national rail infrastructure. The network contains a variety of assets and technologies that reflect the evolution of the railway. Consequently there are numerous instances where there are multiple assets and systems employed to deliver
the same function in different parts of the network. It is anticipated that the modern equivalent network will, wherever possible, implement standardised assets, systems and technologies. These standard designs will only be deviated from if, following review by a qualified engineer, the standard design is deemed impossible. The bespoke modern equivalent approach adopted aggregates repeatable component assets used and is described as the building block approach. In order to deliver the same functionality it is critical to provide the same services in the same geographic area and therefore, the modern equivalent network is deemed to contain the same quantity of track and termini as is in the current network.
Cost data is derived from sources including: final costs of recently completed projects; contractor’s Framework Rates; Project Cost plans; first principle estimating techniques; and actual cost data from other UK contracts. Indirect construction costs have been taken from benchmarking ranges policy documentation; the principles and ranges have been reviewed and endorsed by ORR. Estimated costs are adjusted to reflect a risk allowance which reflects the maturity of the project, and contingencies for costs that vary from project to project. The risk allowance used in this valuation assumes a high initial understanding of the scope of the project and is set at 22%. Costs have been benchmarked against actual costs of recent projects where possible; however, this is less feasible for components which are routinely maintained rather than fully replaced. The cost data has been indexed to a base date of 31 March 2016, using the techniques used for the current estimation of projects.
Annual Report and Accounts 2016-17162

The valuation includes some key estimates and assumptions, as below:
» The estimate of asset lives. This is a critical judgement based on the available data including that used for Network Rail’s whole life costing assessments. However in some cases, particularly components that are rarely replaced such as structures and earthworks, particularly careful judgement is required. The sensitivity analysis below sets out the change in valuation of a possible movement in asset lives of 10%.
» Land compensation. The land valuation includes an assessment of compensation costs on purchasing land for railway purposes. Because Network Rail rarely purchase large parcels of land this estimate is based on experience from outside the rail industry.
» Green field assumption. DRC assumes that assets are built on a green field. In some cases comparative costs can only be found that include building assets in a live operational environment, which is more expensive than a green field. An assessment has been made of the difference in costs and this is also subject to a sensitivity analysis.
» Costing risk factor. After allowing for known costs in constructing assets there are also unknown and localised costs that are captured using a risk factor. This assumption is subject to a sensitivity analysis based on the range of potential adjustments.
Sensitivity analysisScenario 1 – Shows the impact of increasing or decreasing the remaining asset lives of the component elements of the modern equivalent railway network by 10%.
Scenario 2 – Shows the impact if the Land Compensation adjustment (normally 65%) were to increase or decrease by 10%. Effectively assuming a compensation adjustment of 75% and 55%.
Scenario 3 – Shows the impact if the adjustment for working in a ‘green-field’ rather than operational environment (normally 32%) were to increase or decrease by 10%, showing the impact of an adjustment at 42% and 22%.
Scenario 4 – Shows the impact of an adjustment to the risk factor applied to the overall DRC valuations, currently 22%, by a increase or decrease of 10%, effectively showing risk factors of 32% and 12% applied.
Annual Report and Accounts 2016-17 163
Financial Statements
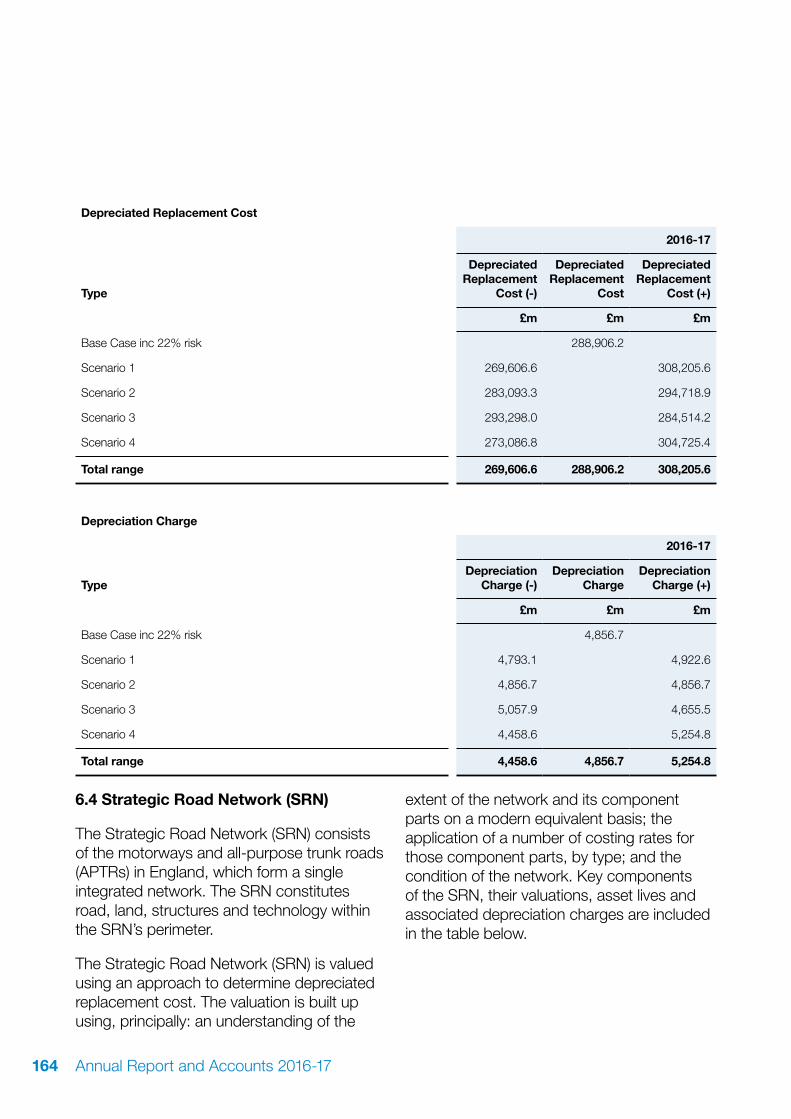
Depreciated Replacement Cost
2016-17
Type
Depreciated Replacement
Cost (-)
Depreciated Replacement
Cost
Depreciated Replacement
Cost (+)
£m £m £m
Base Case inc 22% risk 288,906.2
Scenario 1 269,606.6 308,205.6
Scenario 2 283,093.3 294,718.9
Scenario 3 293,298.0 284,514.2
Scenario 4 273,086.8 304,725.4
Total range 269,606.6 288,906.2 308,205.6
Depreciation Charge
2016-17
TypeDepreciation
Charge (-)Depreciation
ChargeDepreciation
Charge (+)
£m £m £m
Base Case inc 22% risk 4,856.7
Scenario 1 4,793.1 4,922.6
Scenario 2 4,856.7 4,856.7
Scenario 3 5,057.9 4,655.5
Scenario 4 4,458.6 5,254.8
Total range 4,458.6 4,856.7 5,254.8
6.4 Strategic Road Network (SRN)
The Strategic Road Network (SRN) consists of the motorways and all-purpose trunk roads (APTRs) in England, which form a single integrated network. The SRN constitutes road, land, structures and technology within the SRN’s perimeter.
The Strategic Road Network (SRN) is valued using an approach to determine depreciated replacement cost. The valuation is built up using, principally: an understanding of the
extent of the network and its component parts on a modern equivalent basis; the application of a number of costing rates for those component parts, by type; and the condition of the network. Key components of the SRN, their valuations, asset lives and associated depreciation charges are included in the table below.
Annual Report and Accounts 2016-17164

2016-17 2015-16
Depreciated Replacement
Cost
Asset Life Depreciation Charge
Depreciation Charge
£m Years £m £m
Roads* 68,077.2 n/a 162.8 (57.2)
Renewals capitalised - n/a 620.2 421.7
Structures 29,457.6 20-120 244.0 441.9
Technology 1,615.4 15-50 136.3 122.8
Land 12,549.0 n/a - -
Total 111,699.2 1,163.3 929.2
* Rather than using a fixed asset life, road pavement is initially depreciated on the basis of the renewals capitalised in year. This is on the basis that since the company aims to keep the network in a steady state, renewals provide a fair initial proxy for degradation levels. To arrive at a final depreciation charge, this initial entry is adjusted to reflect the condition of the road pavement based on the most recent empirical measurements (see below). This adjustment results in a further charge or credit to depreciation. The adjustment in 2016-17 led to a charge of £162.8m, reflecting a slight worsening in the measured condition of the road network.To note that the table above will not reconcile with the figures disclosed for the Strategic Road Network in Note 6 Property, Plant and Equipment. The figures in 6.4 relate to the SRN assets held by Highways England only, and exclude the Severn River Crossing (2016-17; Depreciated Replacement Cost of £2,490.8m and Depreciation Charge of £32.1m) which remains under the control of the Secretrary of State and is held by the Department for Transport (core department).
Critical judgements and sensitivityThe most significant areas involving a higher degree of judgement or complexity are described below:
DepreciationRoad condition analysis determining the depreciation charge for roads – this is determined by surveys carried out across all lanes of the SRN that measure, at 10 metre intervals, the level of rutting (depressions/grooves in the road surface caused by wear or deformation over time). Rutting measures only the ‘black top’ of the road surface. The rutting level is used to determine when a road surface requires maintenance intervention, and has therefore determined that this provides a fair approximation for the overall condition of the road surface. Highways
England currently estimate that the level of rutting that is acceptable before intervention is 15.5mm. At this level it is considered there is no further service potential in the road surface and this then triggers the renewals programme.
Rutting data is used to generate the depreciation charge which is the rutting percentage multiplied by the depreciable element of the road. The depreciable element of roads has been calculated as 17.55% of the total road valuation, based on the proportion of cost related to the elements regularly renewed. The balance of the valuation relates to elements (including sublayers) with useful lives long enough, subject to regular renewal of the top layer, as to require no depreciation charge.
Annual Report and Accounts 2016-17 165
Financial Statements

Any change in the acceptable level of rutting of 15.5mm will impact the SRN valuation. An increase or decrease of 1mm would result in the valuation increasing by £144.9m and reducing by £144.9m respectively as at 31 March 2017.
Costing rates – costings used to inform the valuation of the road and structures elements of the SRN are based on schemes constructed by Highways England (and, formerly, the Highways Agency) over the past 5 years. In some areas, due to the balance of construction projects completed over this year, there may be a limited number of suitable construction schemes providing a direct costing comparator. Costing rates are initially based on actual scheme data, but makes adjustments to its extrapolation based on reasonable construction assumptions, such as when and how to extrapolate from small schemes to large ones, in order to ensure that each population of SRN elements is valued in a way that represents its overall composition. Where necessary, the work of professional cost estimators are used in determining rates.
Between full valuation years, a number of construction related indices are applied to the costing rates for various elements of the SRN. Highways England choose the indices which in its view are most relevant to the replacement costs for the SRN’s component parts, and the extrapolation of data to ascertain an estimated standard cost valuation.
Structures (e.g. bridges) are subject to a depreciation charge based on an asset valuation model reflecting both the impact of deterioration over time, and periodic renewal. Highways England keep information on the condition of its structures under regular review to assess whether an adjustment is required for depreciation.
Impairment of Assets Under Construction (AUC) The write down of AUC has been charged against the revaluation reserve to the extent there is a reserve. This accounting treatment adopts the interpretation of IAS 36, Impairment of Assets, by making no distinction between asset ‘constructed’ and asset ‘under construction’. In compliance with IAS 36 and the Companies Act 2006, Highways England treat its constructed and under construction SRN projects as one asset for the purpose of revaluation.
Useful economic life (UEL) – assumptions are made about the period of time during which various elements of the SRN will provide service potential. Estimates are made of the UEL of structures, roads and technology equipment, which are based on historic trends and expert knowledge.
6.5 Capital additions and Assets under Construction (Networked Assets)The amount presented under the heading of assets under construction comprises the following main elements:
» Enhancements to and renewals of the railway network (2016-17 additions: £4,856.7m, 2015-16 additions: £6,683.7m);
» Enhancements to the strategic road network (2016-17 additions: £1,484.8m, 2015-16 additions: £1,720.4m);
» Other assets under construction, such as properties acquired for the HS2 project which are located on the route of the proposed network, and other smaller projects (2016-17 additions: £587.3m, 2015-16 additions: £45.9m).
Renewals of the strategic road network are recorded against the strategic road network asset. They are treated differently from renewals
Annual Report and Accounts 2016-17166

of the railway network, because Network Rail’s classification of works as renewals or enhancements is determined by its regulatory framework. This means that its investment in renewals of the actual network is not a good proxy for how much would be spent renewing a hypothetical network built to modern standards.
Assets under construction related to networked assets are recognised initially at cost, then written down to the depreciated replacement cost at the end of each year and on completion. Depreciated replacement cost is typically lower than actual cost. This is because the depreciated replacement cost methodology makes a number of simplifying assumptions; in particular, the methodology assumes that assets are constructed on a greenfield site whereas most assets under construction are additions to existing networks. This writedown is recognised in other comprehensive net
expenditure and taken to the revaluation reserve for networked assets.
6.6 High Speed 1 AssetThis is the value of the service concession on the HS1 rail link from the Kent coast to St. Pancras in London. There are two parts to this valuation:
» £1,686m based on the impaired value of the asset in the accounts of London and Continental Railways Limited as at 31 December 2009. This is the value in use as calculated from the net present value of future cash flows; and
» £1,860m reflecting the November 2010 transaction, which is a best estimate of the concession income the Department will receive in 2040 or beyond.
6.7 Assets held for sale Core Department & Agencies
Departmental Group
£m £m
Cost or valuation
At 1 April 2016 1.1 10.2
Reclassifications - 10.8
Disposals - (2.7)
Impairments - (0.8)
At 31 March 2017 1.1 17.5
Cost or valuation
At 1 April 2015 14.8 14.8
Reclassifications (13.7) (0.4)
Disposals - (3.0)
Impairments - (1.2)
At 31 March 2016 1.1 10.2
Annual Report and Accounts 2016-17 167
Financial Statements

6.8 Investment propertiesDepartmental
Group
£m
Fair value
1 April 2016 1,109.3
Additions (enhancements) 18.4
Disposals (27.2)
Revaluations 131.8
31 March 2017 1,232.3
1 April 2015 982.4
Additions (enhancements) 19.4
Disposals (6.2)
Revaluations 113.7
31 March 2016 1,109.3
The fair value of investment properties at 31 March 2017 is deemed to be market value. External valuers, Jones Lang LaSalle have valued investment properties, by separating one-off properties (17 valued individually) from the remainder of the portfolio (valued under the Beacon method, using rental yields across 13 homogeneous classes).
The properties are leased out under operating leases, these are tenant repairing and maintenance obligations are limited to common areas and vacant property units.
No investment properties are held in the Core Department or its Executive Agencies.
6.9 Re-measurements of PPE recognised in other comprehensive expenditureThe write-down of capital additions for the SRN and national rail networks to a level consistent with Depreciated Replacement Cost forms part of the overall revaluation movement which passes through other comprehensive expenditure. A reconciliation of the movements in note 6 to the net revaluation of PPE shown in the Group SOCTE and CSoCNE is shown below.
Departmental Group
£m
Write-down of capital additions (2,681.8)
Revaluation (cost) 15,843.7
Revaluation (depreciation) (760.0)
Impairments recognised against revaluation surplus 1.7
12,403.6
Annual Report and Accounts 2016-17168

7. Intangible Assets
Group2016-17
Software Licences
Development Expenditure
Assets under Construction
Total
£m £m £m £m
Cost or valuation
At 1 April 2016 71.5 423.7 5.0 500.2
In-year balances adjustment (5.4) 5.4 (0.5) (0.5)
Additions 3.5 2.6 7.6 13.7
Transfers 8.3 0.8 (5.9) 3.2
Disposals (12.2) (13.9) - (26.1)
Impairments - - - -
Revaluations 0.5 38.5 - 39.0
Reclassifications - 0.4 (0.4) -
At 31 March 2017 66.2 457.5 5.8 529.5
Amortisation
At 1 April 2016 43.5 325.6 - 369.1
In-year balances adjustment (3.0) 3.0 - -
Charged in year 10.9 19.9 - 30.8
Impairments - - - -
Transfers - - - -
Disposals (12.0) (13.8) - (25.8)
Revaluations 0.2 - - 0.2
Reclassifications - - - -
At 31 March 2017 39.6 334.7 - 374.3
Carrying amount at 31 March 2017 26.6 122.8 5.8 155.2
Carrying amount at 31 March 2016 28.0 98.1 5.0 131.1
Asset financing:
Owned 26.6 122.8 5.8 155.2
Carrying amount at 31 March 2017 26.6 122.8 5.8 155.2
Of the total:
Core Department 3.0 - - 3.0
Agencies 9.7 18.8 5.6 34.1
Other designated bodies 13.9 104.1 0.2 118.1
Carrying amount at 31 March 2017 26.6 122.8 5.8 155.2
Annual Report and Accounts 2016-17 169
Financial Statements

Group2015-16
Software Licences
Development Expenditure
Assets under Construction
Total
£m £m £m £m
Cost or valuation
At 1 April 2015 51.6 411.5 10.2 473.3
Prior year adjustment 0.4 - - 0.4
Additions 5.3 0.1 22.5 27.9
Transfers 13.0 12.4 (25.4) -
Disposals (0.2) - - (0.2)
Impairments (0.9) (0.3) - (1.2)
Reclassifications 2.3 - (2.3) -
At 31 March 2016 71.5 423.7 5.0 500.2
Amortisation
At 1 April 2015 37.0 293.7 - 330.7
Prior year adjustment 0.2 - - 0.2
Charged in year 6.8 32.0 - 38.8
Impairments (0.3) (0.1) - (0.4)
Transfers - - - -
Disposals (0.2) - - (0.2)
At 31 March 2016 43.5 325.6 - 369.1
Carrying amount at 31 March 2016 28.0 98.1 5.0 131.1
Carrying amount at 31 March 2015 14.6 117.8 10.2 142.6
Asset financing:
Owned 28.0 98.1 5.0 131.1
Finance leased - - - -
Carrying amount at 31 March 2016 28.0 98.1 5.0 131.1
Of the total:
Core Department 3.6 - - 3.6
Agencies 16.0 30.8 1.7 48.5
Other designated bodies 8.4 67.3 3.3 79.0
Annual Report and Accounts 2016-17170
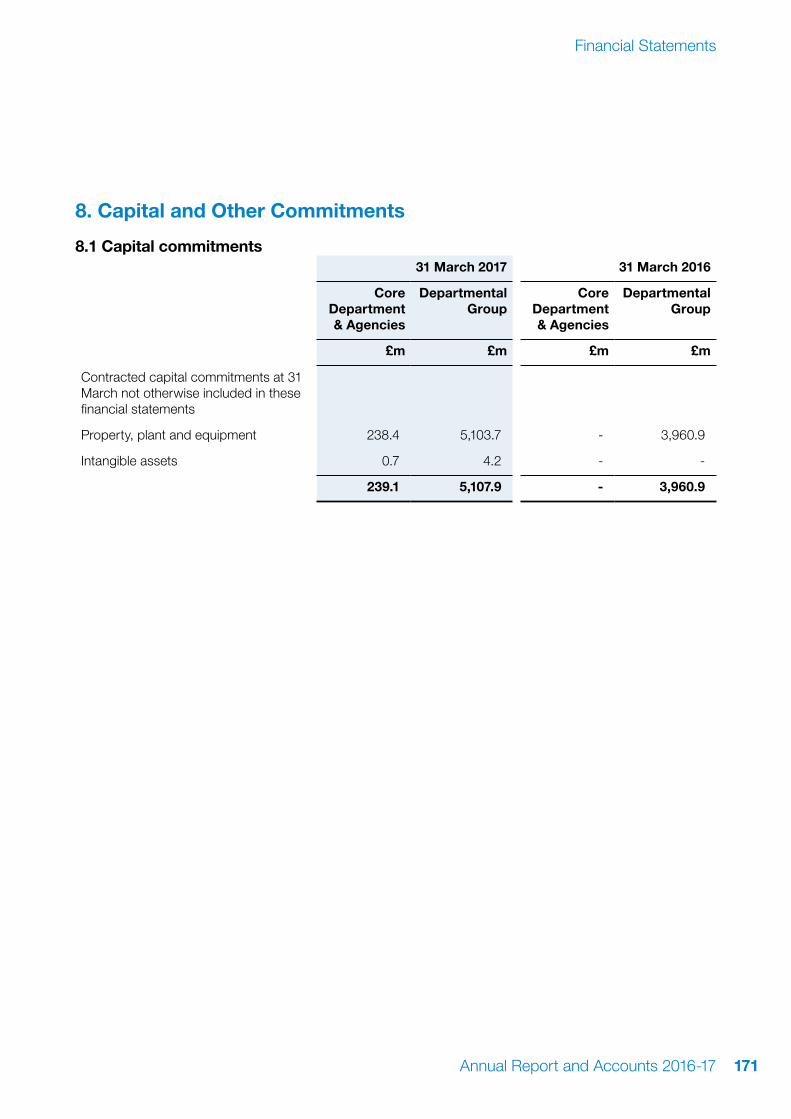
8. Capital and Other Commitments
8.1 Capital commitments31 March 2017 31 March 2016
Core Department & Agencies
Departmental Group
Core Department & Agencies
Departmental Group
£m £m £m £m
Contracted capital commitments at 31 March not otherwise included in these financial statements
Property, plant and equipment 238.4 5,103.7 - 3,960.9
Intangible assets 0.7 4.2 - -
239.1 5,107.9 - 3,960.9
Annual Report and Accounts 2016-17 171
Financial Statements

8.2 Commitments under leases8.2.1 Operating leases
31 March 2017 31 March 2016
Core Department & Agencies
Departmental Group
Core Department & Agencies
Departmental Group
£m £m £m £m
Obligations under operating leases for the following periods comprise:
Land
Not later than one year - 0.2 - -
Later than one year and not later than five years
- 0.5 - -
Later than five years - 2.0 - 0.2
Total future lease payments - 2.7 - 0.2
Buildings
Not later than one year 2.5 62.1 7.5 83.5
Later than one year and not later than five years
34.7 198.3 16.7 244.2
Later than five years 51.8 238.8 40.4 351.0
Total future lease payments 89.0 499.2 64.6 678.7
Other:
Not later than one year 55.2 57.3 55.7 57.2
Later than one year and not later than five years
227.4 234.0 228.5 235.4
Later than five years 155.0 158.9 211.9 217.3
Total future lease payments 437.6 450.2 496.1 509.9
Annual Report and Accounts 2016-17172

8.2.2 Finance leasesTotal future minimum lease payments under finance leases are given in the table below for each of the following periods.
31 March 2017 31 March 2016
Core Department & Agencies
Departmental Group
Core Department & Agencies
Departmental Group
£m £m £m £m
Obligations under finance leases for the following periods comprise:
Buildings
Not later than one year 0.2 0.2 0.2 0.2
Later than one year and not later than five years
0.4 0.4 0.6 0.6
Later than five years - - - -
0.6 0.6 0.8 0.8
Less interest element (0.1) (0.1) (0.1) (0.1)
Present value of obligations 0.5 0.5 0.7 0.7
Other:
Not later than one year - 3.9 3.1 7.1
Later than one year and not later than five years
- 15.4 - 16.0
Later than five years - 2.5 - 6.2
- 21.8 3.1 29.3
Less interest element - (2.1) - (3.2)
Present value of obligations - 19.7 3.1 26.1
Annual Report and Accounts 2016-17 173
Financial Statements

8.3 Commitments under PFI and other service concession arrangements8.3.1 On-balance sheet (Statement of Financial Position)Highways England has entered into on balance sheet PFI contracts for the design, build, finance and operation of sections of the network. The substance of these contracts under IFRIC12 is that the Department has a finance lease, with the asset being recognised as a non-current asset.The most significant of these is the M25 London Orbital Motorway contract. The contract commenced on 13 September 2009 and is for a period of 30 years. The contractor is required to operate, maintain, renew, reconstruct, repair and reinstate the road facilities within the designated area. The liability as at 31 March 2017 was £2.2bn, which includes an interest element of £1.3bn. The future service charge relating to the M25 PFI is £6.0bn.
On 4 April 2005, DVLA entered into a 20-year service concession agreement with Telereal Trillium (formerly Land Securities Trillium). This agreement falls within the scope of IFRIC 12 Service Concession Arrangements and has been set up to provide the following property outsourcing solutions including buildings management, maintenance and services. Revenue expenditure is recorded as a service charge in the Statement of Comprehensive net Expenditure.
For both contracts above, a PFI liability has been created to reflect the work capitalised. This liability is reduced over the life of the contract as payments are made. In accordance with FReM requirements, the interest element of the unitary charge relating to the assets capitalised has been calculated using the actuarial method.
Annual Report and Accounts 2016-17174

8.3.2 Departmental GroupImputed finance lease obligations under on balance sheet PFI contracts comprise:
2016-17 2015-16
£m £m
Rentals due:
Not later than one year 201.1 204.6
Later than one year and not later than five years 764.6 778.5
Later than five years 2,238.6 2,448.9
3,204.3 3,432.0
Less interest element (1,580.2) (1,712.6)
1,624.1 1,719.4
The capital element under on balance sheet PFI contracts comprises:
2016-17 2015-16
£m £m
Not later than one year 81.6 80.1
Later than one year and not later than five years 335.7 328.9
Later than five years 1,206.8 1,310.4
1,624.1 1,719.4
The interest element under on balance sheet PFI contracts comprises:
2016-17 2015-16
£m £m
Not later than one year 119.5 124.5
Later than one year and not later than five years 428.9 449.6
Later than five years 1,031.9 1,138.5
1,580.2 1,712.6
The finance lease obligations under on balance sheet PFI contracts are held by Highways England and DVLA.
Annual Report and Accounts 2016-17 175
Financial Statements

8.3.3 Charge to the Statement of Comprehensive Net Expenditure and future commitmentsThe future total service element payments which the Department is committed to for
each of the following periods are given in the table below, analysed according to the period in which the commitment expires.
31 March 2017 31 March 2016
Core Department & Agencies
Departmental Group
Core Department & Agencies
Departmental Group
£m £m £m £m
Not later than one year 19.6 360.3 18.3 345.6
Later than one year and not later than five years
85.2 1,457.8 79.6 1,446.0
Later than five years 70.6 6,550.6 89.5 6,834.8
175.4 8,368.7 187.4 8,626.4
8.4 Other financial commitmentsNetwork Rail (Core Department & Agencies only)In accordance with a Deed of Grant entered into in December 2013, the Department is committed to making direct payments of £17,661m to Network Rail spread over the financial years 2014-15 to 2018-19. This sum is expressed in 2012-13 prices. As at 31 March 2017 the commitment expressed in 2016-17 prices stood at £7,813m. Actual sums payable under the Deed of Grant are subject to indexation with reference to the RPI. Any direct payments to Network Rail beyond this period will be contracted following a review of Network Rail’s income requirement which will be conducted by the
Office of Rail and Road in due course. The (undiscounted) numbers shown below include the commitments for the financial years 2017-18 to 2018-19. In comparison with the prior year, the value for later than one year is lower as there are now one, rather than two, years of outstanding commitments in this category.
Annual Report and Accounts 2016-17176

Train Operating CompaniesIn addition, as at 31 March 2017, the Department had 15 contracts with TOCs for the provision of rail services.
These contracts are not leases or PFI contracts and are only cancellable prior to their expiry or break date in certain circumstances, normally following an event of default under an individual contract.
The figures below include the contract payments committed by the Department under the suite of franchise agreements which it has entered into. The actual amounts payable under each franchise contract are subject to variation in accordance with the terms of the individual contracts which take account of a number of factors including changes to assumed passenger revenues and variations to Network Rail’s income requirements as determined by the Office of Rail and Road (ORR).
31 March 2017 31 March 2016
Core Department & Agencies
Departmental Group
Core Department & Agencies
Departmental Group
£m £m £m £m
Not later than one year 4,463.2 408.9 4,324.7 448.4
Later than one year and not later than five years
4,974.4 1,215.4 8,928.1 1,134.0
Later than five years 395.3 395.4 357.8 357.8
9,832.9 2,019.7 13,610.6 1,940.2
The amounts in the table below do not attempt to forecast any commitments by the Department for the provision of rail services beyond the expiry of the current suite of contracts with the rail industry. They do not include amounts payable by TOCs to the Department which are expected to be as set out in the base contracts.
The Department also expects a significant level of inflows arising from TOC contracts, whereby a premium is due to the Deparmtent. These expected inflows are not included in the table of commitments. The annual impact of subsidies and premia built into TOC contracts is shown respectively in the Core & Agencies numbers in:
» note 4 (“support for passenger rail services”); and
» note 5 (“income from Train Operating Companies”).
The Group total excludes the financial commitments from the core Department to Network Rail, which are intragroup.
Annual Report and Accounts 2016-17 177
Financial Statements

9. Financial Instruments
Analysis by category 2016-17 2015-16
Note Core Department & Agencies
Departmental Group
Core Department & Agencies
Departmental Group
£m £m £m £m
Non-current financial assets
Loans and receivables 9.1.1 & 9.1.1.2
20,381.9 342.6 14,320.5 368.2
Available-for-sale financial assets 9.1.2 381.9 709.2 376.3 608.1
Public dividend capital 9.1.3 32.5 32.5 32.5 32.5
Financial assets held at fair value through profit and loss
9.1.4 - 864.4 - 654.5
20,796.3 1,948.8 14,729.3 1,663.3
Current financial assets
Financial assets held at fair value through profit and loss
9.1.4 - 238.3 - 308.7
Current financial liabilities
Financial liabilities held at fair value through profit and loss
9.2.1 - (1.0) - (9.5)
Non-current financial liabilities
Financial liabilities held at fair value through profit and loss
9.2.1 - (1,528.5) - (1,399.2)
Other financial liabilities 9.2.2 (4,141.7) - (4,297.9) -
16,654.6 657.6 10,431.4 563.3
Annual Report and Accounts 2016-17178

9.1 Financial Assets
9.1.1 LoansDVSA GLF Humber
BridgeOther Loans
Departmental Group Total
£m £m £m £m £m
Balance at 1 April 2015 47.8 190.0 171.8 2.6 412.2
Reclassification of Midland Expressway Ltd (MEL) & Severn River Crossing PLC (SRC) loans
- - - 291.5 291.5
Repayment (30.7) (20.0) (171.8) (114.9) (337.4)
Balance at 31 March 2016 17.1 170.0 - 179.2 366.3
Balance at 1 April 2016 17.1 170.0 - 179.2 366.3
Reclassification of M6 toll loan - - - 5.1 5.1
Advances - - - - -
Repayment (9.1) (20.0) - (0.5) (29.6)
Balance at 31 March 2017 8.0 150.0 - 183.8 341.8
Departmental Group Total
Other Intra Group Loans
Loans to Network
Rail
Core Department &
Agencies Total
£m £m £m £m
Balance at 1 April 2015 412.2 2.3 6,450.0 6,864.5
Prior year adjustment - - - -
Advances - - 7,500.0 7,500.0
Reclassification of Midland Expressway Ltd (MEL) & Severn River Crossing PLC (SRC) loans
291.5 - - 291.5
Repayment (337.4) - - (337.4)
Balance at 31 March 2016 366.3 2.3 13,950.0 14,318.6
Balance at 1 April 2016 366.3 2.3 13,950.0 14,318.6
Reclassification of M6 toll loan 5.1 - - 5.1
Advances - - 6,100.0 6,100.0
Write Off - - (13.0) (13.0)
Repayment (29.6) - - (29.6)
Balance at 31 March 2017 341.8 2.3 20,037.0 20,381.1
Annual Report and Accounts 2016-17 179
Financial Statements

9.1.1.2 National Loans Fund Civil Aviation
Authority £m
Balance at 1 April 2015 3.0 Advances - Repayments -
3.0 Loans payable within one year transferred to receivables (1.1) Balance at 31 March 2016 1.9
Balance at 1 April 2016 1.9 Advances - Repayments -
1.9Loans payable within one year transferred to receivables (1.1) Balance at 31 March 2017 0.8
9.1.2 Available-for-sale financial assetsThe Departmental group holds available-for-sale financial assets (typically equity shares) where this represents the best return for the taxpayer, typically for projects which will generate volatile returns during their early phases.
LCR Ltd Direct Subsidiaries
Core Department & Agencies
Total
Network Rail
Insurance Ltd
Interests in jointly
controlled entities
Departmental Group Total
£m £m £m £m £m £mBalance at 1 April 2015 555.4 12.3 567.7 239.3 42.5 849.5 Additions - - - - 1.7 1.7 Disposals - - - - - - Revaluations (191.4) - (191.4) - - (191.4) Impairments - - - (50.6) (1.7) (52.3) Profit/(loss) share - - - - 0.6 0.6 Balance at 31 March 2016 364.0 12.3 376.3 188.7 43.1 608.1
Balance at 1 April 2016 364.0 12.3 376.3 188.7 43.1 608.1 Additions - - - - 2.4 2.4 Disposals - - - - - - Revaluations 5.6 - 5.6 93.3 (0.2) 98.7 Impairments - - - - - - Profit/(loss) share - - - - - - Balance at 31 March 2017 369.6 12.3 381.9 282.0 45.3 709.2
Annual Report and Accounts 2016-17180

9.1.3 Public Dividend CapitalDVSA
£m
Balance at 31 March 2016 32.5
Balance at 31 March 2017 32.5
9.1.4 Financial assets held at fair value through statement of comprehensive net expenditure (SOCNE)Network Rail purchases derivatives in order to manage the risks inherent in its external borrowings.
2016-17 Departmental Group
2015-16 Departmental Group
Fair Value Notional amounts
Fair Value Notional amounts
£m £m £m £m
Derivative financial instrument assets
Cash flow hedges
Cross-currency swaps to hedge debt issued under the debt issuance programme
152.5 128.2 217.0 331.0
Fair value hedges
Cross-currency swaps to hedge debt issued under the debt issuance programme
671.2 2,512.6 505.2 4,198.0
Non-hedge accounted derivatives
Cross-currency swaps to hedge debt issued under the debt issuance programme
120.0 198.0 93.0 198.0
Interest rate swaps 157.2 9,145.0 141.0 7,521.0
Forward foreign exchange contracts 1.9 42.6 7.0 109.0
1,102.8 12,026.4 963.2 12,357.0
Included in non-current assets 864.5 9,028.2 654.5 9,910.0
Included in current assets 238.3 2,998.2 308.7 2,447.0
1,102.8 12,026.4 963.2 12,357.0
Annual Report and Accounts 2016-17 181
Financial Statements

9.2 Financial Liabilities9.2.1 Financial liabilities held at fair value through the SOCNENetwork Rail purchases derivatives in order to manage the risks inherent in its external borrowings.
2016-17 Departmental Group
2015-16 Departmental Group
Fair Value Notional amounts
Fair Value Notional amounts
£m £m £m £m
Derivative financial instrument assets
Cash flow hedges
Interest rate swaps (26.0) 130.0 (39.0) 333.0
Forward starting interest rate swaps (827.0) 9,241.0
Non-hedge accounted derivatives
Interest rate swaps to hedge debt issued under the Debt Issuance Programme
(1,500.8) 17,796.0 (540.7) 7,476.0
Forward foreign exchange contracts (2.7) 46.0 (2.0) 44.0
(1,529.5) 17,972.0 (1,408.7) 17,094.0
Included in non-current liabilities (1,528.5) 17,940.0 (1,399.2) 16,872.0
Included in current liabilities (1.0) 32.0 (9.5) 222.0
(1,529.5) 17,972.0 (1,408.7) 17,094.0
Annual Report and Accounts 2016-17182

9.2.2 Other financial liabilitiesFinancial Guarantees (Core Department and Agencies) Network Rail
£m
Balance at 1 April 2016 (4,297.9)
Charged in year 16.7
Unwinding discount (159.3)
Amortised to income 298.8
Balance at 31 March 2017 (4,141.7)
Balance at 1 April 2015 (3,776.0)
Charged in year (681.7)
Unwinding discount (165.9)
Amortised to income 325.7
Balance at 31 March 2016 (4,297.9)
The Department has given an indemnity to Network Rail’s debt holders, with a total outstanding debt as at 31 March 2017 of £26,104m (2016: £27,678m). The indemnity expires in 2052, and is recognised as a financial guarantee contract in accordance with IAS 39. The indemnity reduces the cost of borrowing for Network Rail and the Department is paid a fee by Network Rail for the equivalent benefit of reduced interest charges on its commercial debt. The discounted value of it over the 36 year period is calculated to be as shown in the table above. There is a corresponding asset, shown in note 12 to reflect the value of the financial indemnity fee due to the Department from Network Rail.
The asset and liability are valued identically since the charge to Network Rail reflects the additional risk premium avoided by NR, which would also be a reasonable basis of determining the fair value of the guarantee given by the Department. No asset or liability appears for the group since at this level the obligations attaching to Network Rail’s portfolio of borrowings is recognised in full.
9.3 Valuation methodologies and techniques9.3.1 Financial assetsThe following available-for-sale financial assets; LCR Ltd and Network Rail Insurance Limited are held at fair value, have been measured using valuation techniques, because the instruments are not regularly traded on an active market.
Annual Report and Accounts 2016-17 183
Financial Statements

9.3.1.1 London & Continental Railways Limited (LCR Ltd)LCR Ltd is recognised at fair value as at 31 March 2016 and 31 March 2017. The valuation is based on three (previously four) components: property development around King’s Cross (through its associate, King’s Cross Central Limited Partnership) until January 2016; investment properties; cash and working capital; and property development around Stratford (through its joint venture, Stratford City Business District Ltd).
The valuation was performed by selecting, for each component, the valuation techniques that a knowledgeable investor would use. For the most part, these reflect surveyors’ valuations of properties. In performing these valuations, surveyors make estimates and assumptions around rental yields, voids, occupancy rates and rent-free periods. Changes in these assumptions could increase or decrease the reported valuations. It is considered that all properties and developments are currently being held or developed for their highest and best use. Given the valuation approach, we consider that the resulting valuation is level 3 in the IFRS 13 hierarchy.
The valuation identified the following changes of value, which have been recognised through the available-for-sale reserve:
Between 31 March 2015 and 31 March 2016: (£191,400,000)
Between 31 March 2016 and 31 March 2017: £5,600,000
The reduction in value between 31 March 2015 and 31 March 2016 of £191.4m was mainly driven by the disposal of LCR Ltd’s interests in King’s Cross Central Limited Partnership for consideration of £371m. After deducting for
transaction costs, £366m was returned to the Department as a cash dividend.
The increase in value between 31 March 2016 and 31 March 2017 of £5.6m reflects valuation gains on the investment properties and profits generated by Stratford City Business District Ltd, which are largely offset by reductions in LCR Ltd’s working capital.
9.3.1.2 Network Rail Insurance Limited (NRI)Network Rail Insurance Limited is recognised at fair value as at 31 March 2016 and 31 March 2017. The valuation reflects its role as a provider of insurance cover for Network Rail and its subsidiaries and associates. Management aim to operate the company at a break-even level over the longer term, but results can fluctuate materially from year to year.
The valuation was performed by KPMG in 2015 using the Adjusted Book Value (ABV) approach as at 31 March 2016 and 31 March 2017, updated for changes in net assets between 1 April 2016 and 31 March 2017. This is an accepted valuation technique for insurance companies. The net assets of Network Rail Insurance Limited have increased due to profitable trading in the year and the book values of assets and liabilities are therefore adjusted to fair values. This includes adjustments to reserves for claims reported and for claims incurred but not reported to the mid-point of the range of reasonable estimates.
The valuation identified the following changes of value, which have been recognised either through the available-for-sale reserve or the Statement of Net Expenditure as appropriate:
Between 31 March 2015 and 31 March 2016: (£50,600,000)
Between 31 March 2016 and 31 March 2017: £93,300,000
Annual Report and Accounts 2016-17184

9.3.1.2.1 Investments in property companiesNetwork Rail’s joint venture investments in the Station Office Network, West Hampstead Square, and Solum were valued at an aggregated amount of £45.3m at 31 March 2017 (£43.1m at 31 March 2016), and updated for changes in net assets between 1 April 2016 and 31 March 2017. This resulted in a downwards revaluation of £0.2m in 2016-17 that has been recognised in the available-for-sale reserve. During the financial year Network Rail invested a further £1.9m into the Solum joint venture and also invested £0.5m into Blocwork; a new joint venture.
9.3.1.3 Summary of fair value measurements recognised in the balance sheetsThe following table provides an analysis of instruments that are measured subsequent to initial recognition at fair value, grouped into Levels 1 to 3 based on the degree to which the fair value is observable:
2016-17
Level 1 Level 2 Level 3 Total
£m £m £m £m
Available-for-sale financial assets - - 709.2 709.2
Derivative financial assets* - 1,102.8 - 1,102.8
Derivative financial liabilities* - (1,529.5) - (1,529.5)
Borrowings held at fair value (304.0) - - (304.0)
2015-16
Level 1 Level 2 Level 3 Total
£m £m £m £m
Available-for-sale financial assets - - 608.1 608.1
Derivative financial assets* - 963.2 - 963.2
Derivative financial liabilities* - (1,408.7) - (1,408.7)
Borrowings held at fair value (776.0) - - (776.0)
*The fair value of derivatives is estimated by discounting the future contractual cash flows using appropriate yield curves based on quoted market rates as at the current financial year end.
» Level 1 fair value measurements are those derived from quoted prices (unadjusted) in active markets for identical assets or liabilities.
» Level 2 fair value measurements are those derived from inputs other than quoted prices included within Level 1 that are observable for the asset or liability, either directly (i.e. as prices) or indirectly (i.e. derived from prices).
» Level 3 fair value measurements are those derived from valuation techniques that include inputs for the asset or liability that are not based on observable market data (unobservable inputs).
Annual Report and Accounts 2016-17 185
Financial Statements

9.3.1.4 Summary of fair value measurements of financial instruments recognised at amortised cost in the balance sheet
2016-17
Level 1 Level 2 Level 3 Total Carrying Value
£m £m £m £m
Loans and receivables* - 2,100.0 - 2,100.0 2,100.0
Borrowings held at amortised cost
(34,886.0) (6,970.0) - (41,856.0) (34,173.0)
2015-16
Level 1 Level 2 Level 3 Total Carrying Value
£m £m £m £m
Loans and receivables* - 2,727.0 - 2,727.0 2,727.0
Borrowings held at amortised cost
(34,529.0) (8,074.0) - (42,603.0) (33,554.0)
*The Department considers that, for short-term trade and other payables and receivables, the carrying value is a satisfactory approximation to fair value.
9.4 Off-balance sheet arrangementsThe Companies Act requires disclosure of the risks associated with off-balance sheet arrangements. The Department considers that its most significant off-balance sheet arrangements relate to entities 100% owned by the Department or other group members, which are not consolidated in these accounts. The reasons for non-consolidation are that these entities are classified either as public corporations or as corporations belonging to the rest-of-the world sector. The figures below for LCR Ltd and Network Rail Insurance Ltd are book values and will not agree to fair value figures included in other notes to these accounts.
Annual Report and Accounts 2016-17186

9.4.1 Entity majority-owned by the Department – LCR LtdIf LCR Ltd was consolidated as a wholly-owned subsidiary, its activities and financial impacts would be reflected more pervasively through these accounts. To enable readers to assess the potential impacts, the following information is provided.
2016-17 2015-16
£m £m
Associates and joint venture
Stratford City 34.5 25.2
34.5 25.2
Investment properties 160.4 134.4
Property, plant and equipment 0.1 0.2
Current assets 224.8 240.3
Current liabilities (24.2) (19.8)
Non-current liabilities (43.4) (28.2)
Net assets 352.2 352.1
Revenue 23.8 31.3
Cost of sales - (4.3)
Gross profit 23.8 27.0
Administrative expenses (24.2) (20.9)
Gain on revaluation of investment properties 19.4 20.4
Other operating income 9.5 102.6
Exceptional operating charge: increase of provisions (14.8)
Operating profit 13.7 129.1
Net finance income 0.7
Share of gains of associates and joint venture 8.8 83.1
Profit before tax 23.2 212.2
Taxation 1.8 (3.2)
Profit for the year 25.0 209.0
Other comprehensive income
Share of associate's cash flow hedge 0.1 (1.1)
Total comprehensive income 25.1 207.9
Annual Report and Accounts 2016-17 187
Financial Statements

9.4.2 Entities majority-owned by Network RailNetwork Rail is the ultimate parent company of Network Rail Insurance Limited, which is not consolidated in these resource accounts. This is included in the available-for-sale financial assets disclosure. Network Rail has joint control over several entities, including the Station Office Network and West Hampstead Square. which are also presented in the available-for-sale financial assets disclosure.
2016-17 2015-16
£m £m
Network Rail Insurance Limited
Cash and cash equivalents 364.5 1.1
Other financial assets - 356.4
Receivables from insurance contracts 20.1 36.0
Total assets 384.6 393.5
Trade and other payables (7.5) (1.0)
Liabilities from insurance contracts (166.3) (239.9)
Total liabilities (173.8) (240.9)
Net assets 210.8 152.6
Premium revenue 58.7 33.3
Insurance claims - (84.4)
Administration expenses (0.3) (1.2)
Other income 0.3 1.7
Net gain/(loss) before tax 58.7 (50.6)
The Station Office Network and West Hampstead New Square
Network Rail’s investment in these entities does not give rise to material financial risk to the group.
Network Rail and its subsidiaries participate in cross-guarantees of certain credit facilities, as described in note 17.
Annual Report and Accounts 2016-17188
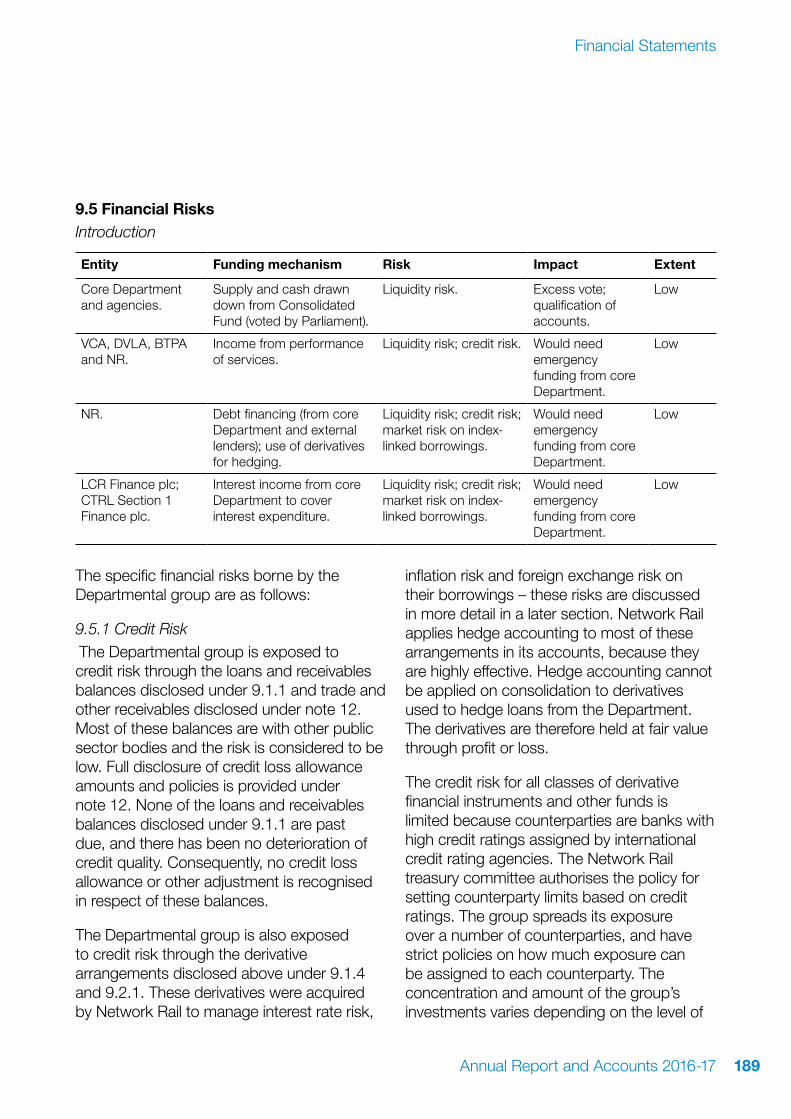
9.5 Financial RisksIntroduction
Entity Funding mechanism Risk Impact Extent
Core Department and agencies.
Supply and cash drawn down from Consolidated Fund (voted by Parliament).
Liquidity risk. Excess vote; qualification of accounts.
Low
VCA, DVLA, BTPA and NR.
Income from performance of services.
Liquidity risk; credit risk. Would need emergency funding from core Department.
Low
NR. Debt financing (from core Department and external lenders); use of derivatives for hedging.
Liquidity risk; credit risk; market risk on index-linked borrowings.
Would need emergency funding from core Department.
Low
LCR Finance plc; CTRL Section 1 Finance plc.
Interest income from core Department to cover interest expenditure.
Liquidity risk; credit risk; market risk on index-linked borrowings.
Would need emergency funding from core Department.
Low
The specific financial risks borne by the Departmental group are as follows:
9.5.1 Credit Risk The Departmental group is exposed to credit risk through the loans and receivables balances disclosed under 9.1.1 and trade and other receivables disclosed under note 12. Most of these balances are with other public sector bodies and the risk is considered to be low. Full disclosure of credit loss allowance amounts and policies is provided under note 12. None of the loans and receivables balances disclosed under 9.1.1 are past due, and there has been no deterioration of credit quality. Consequently, no credit loss allowance or other adjustment is recognised in respect of these balances.
The Departmental group is also exposed to credit risk through the derivative arrangements disclosed above under 9.1.4 and 9.2.1. These derivatives were acquired by Network Rail to manage interest rate risk,
inflation risk and foreign exchange risk on their borrowings – these risks are discussed in more detail in a later section. Network Rail applies hedge accounting to most of these arrangements in its accounts, because they are highly effective. Hedge accounting cannot be applied on consolidation to derivatives used to hedge loans from the Department. The derivatives are therefore held at fair value through profit or loss.
The credit risk for all classes of derivative financial instruments and other funds is limited because counterparties are banks with high credit ratings assigned by international credit rating agencies. The Network Rail treasury committee authorises the policy for setting counterparty limits based on credit ratings. The group spreads its exposure over a number of counterparties, and have strict policies on how much exposure can be assigned to each counterparty. The concentration and amount of the group’s investments varies depending on the level of
Annual Report and Accounts 2016-17 189
Financial Statements

surplus liquidity the group chooses to hold at any point in time. However, because of the strict criteria governing counterparty suitability the risk is mitigated. The treasury committee also authorises the investment and borrowing instruments that can be used.
Where derivatives are purchased to hedge debt, but the resulting hedge is not highly effective, it is possible to achieve a degree of offset by designating the debt as fair value through profit or loss (FVTPL). For FVTPL debt, there has been no change in carrying value as a result of changes in the group’s credit risk. The losses/gains in the income statement arising from the remeasurement of FVTPL debt items of £45.8m (2016: £15.2m loss) are all attributable to changes in market risk
The credit risk with regard to all classes of derivative financial instruments entered into before 1 January 2013 is limited because Network Rail has arrangements in place which limit each bank to a threshold (based on credit ratings), which if breached requires the bank to post collateral in cash or eligible securities. The members of the banking group are required to post collateral on positive mark to market swaps above the threshold. In December 2012 the group entered into new collateral agreements in respect of derivative trades entered into after 1 January 2013. Under the terms of the new agreements Network Rail posts collateral on adverse net derivative positions with its counterparties. The new agreements do not contain a provision for thresholds; as such Network Rail or its counterparties are required to post collateral for the full fair value of net out of the money positions. At 31 March 2017 the fair value of collateral held was £258.7m (2016: £329.8m). The group is the beneficial owner of this collateral. The group is free to invest or
otherwise utilise the collateral at its discretion, subject to acting within the authority sanctioned by the treasury committee. The balance of collateral posted by the group at 31 March 2017 was £625m (2016: £819m).
9.5.2 Liquidity RiskThe Department is exposed to liquidity risk through its trade and other payables balances, borrowings, and requirements to place collateral under derivative arrangements. As described above, the Department can draw down cash from the Consolidated Fund so its liquidity risk is low. However, requirements for cash that diverge significantly from forecast are penalised.
Liquidity risk within the Network Rail group is managed on a standalone basis for historical reasons to ensure that the price is allocated in accordance with ORR expectations.The ultimate responsibility for liquidity risk management rests with Network Rail’s board of directors. The policy manual ratified by their treasury committee includes an appropriate liquidity risk management framework covering Network Rail’s short, medium and long-term funding and liquidity management requirements. Their treasury committee is subject to regular internal audits. Their treasury committee provides sufficient liquidity to meet the Network Rail group’s needs, while reducing financial risks and prudently maximising interest receivable and minimising credit risk on surplus cash. Network Rail manages liquidity risk by maintaining sufficient cash and facilities to cover at least one year’s working capital requirement by continuously monitoring forecast and actual cash flows. Included in the payables note is a description of additional undrawn facilities that the Network Rail group has at its disposal to further reduce liquidity risk.
Annual Report and Accounts 2016-17190

As noted above, Network Rail is required to post collateral on adverse net derivative positions at the full fair value of net out of the money positions. This may expose the Department to uncertainty in its cash requirements.
The following table details the Network Rail group’s remaining contractual maturity for its financial liabilities. The table has been drawn up on the undiscounted cash flows of financial liabilities based on the earliest date on which Network Rail can be required to pay and, therefore, differs from both the carrying value and the fair value. The table includes both interest and principal cash flows.
2016-17
Within one year
1-2 years
2-5 years
5+ years Total
Group £m £m £m £m £m
Non-derivative financial liabilities
Bank loans and overdrafts (17.0) - (10.0) (527.0) (554.0)
Bonds issued under the NR Debt Issuance Programme
– Sterling denominated bonds (971.0) (214.0) (1,595.0) (5,149.0) (7,929.0)
– Sterling denominated index-linked bonds (155.0) (155.0) (464.0) (20,612.0) (21,386.0)
– Foreign currency denominated bonds (1,055.0) (2,237.0) (535.0) (979.0) (4,806.0)
Bonds issued by LCR Finance plc and CTRL Section 1 Finance plc
– Sterling denominated bonds (232.5) (231.1) (618.3) (5,587.5) (6,669.4)
– Sterling denominated index-linked bonds (17.3) (17.8) (56.0) (1,975.0) (2,066.1)
Trade and other payables (2,174.8) (304.2) - - (2,479.0)
Derivative financial liabilities
Net settled derivative contracts (160.0) (280.0) (916.0) (409.0) (1,765.0)
Gross settled derivative contracts – receipts 1,040.0 2,225.0 495.0 73.0 3,833.0
Gross settled derivative contracts – payments (794.0) (1,764.0) (276.0) (61.0) (2,895.0)
Total (4,536.6) (2,978.1) (3,975.3) (35,226.5) (46,716.5)
Annual Report and Accounts 2016-17 191
Financial Statements

2015-16
Within one year
1-2 years
2-5 years
5+ years Total
Group £m £m £m £m £m
Non-derivative financial liabilities
Bank loans and overdrafts (10.0) (20.0) (11.0) (545.0) (586.0)
Bonds issued under the NR Debt Issuance Programme
– Sterling denominated bonds (709.0) (954.0) (1,589.0) (4,873.0) (8,125.0)
– Sterling denominated index-linked bonds (241.0) (248.0) (790.0) (39,485.0) (40,764.0)
– Foreign currency denominated bonds (2,253.0) (912.0) (1,970.0) (482.0) (5,617.0)
Bonds issued by LCR Finance plc and CTRL Section 1 Finance plc
– Sterling denominated bonds (233.8) (232.5) (689.5) (5,747.4) (6,903.2)
– Sterling denominated index-linked bonds (16.9) (17.2) (54.3) (1,980.0) (2,068.4)
Trade and other payables (2,735.0) (1,630.0) (4,365.0)
Derivative financial liabilities
Net settled derivative contracts (90.0) (152.0) (493.0) (249.0) (984.0)
Gross settled derivative contracts – receipts 2,252.0 909.0 1,970.0 482.0 5,613.0
Gross settled derivative contracts – payments (1,921.0) (797.0) (1,769.0) (337.0) (4,824.0)
Total (5,957.7) (4,053.7) (5,395.8) (53,216.4) (68,623.6)
Annual Report and Accounts 2016-17192

9.5.3 Market Risk9.5.3.1 Foreign exchange riskThe only material exposure to foreign exchange risk comes from Network Rail, through its investing, financing and operating activities. Foreign exchange risk is managed by the use of forward exchange contracts and currency swaps to limit the effects of movements in exchange rates on foreign currency denominated liabilities.
As this risk arises from arrangements with external counter-parties, the position remains hedged on consolidation. It is estimated that a general increase of 10 percentage points in the value of any currency against sterling would have no material effect on the group’s profit before tax or equity due to all currency positions being 100 per cent hedged so no sensitivity analysis is produced.
9.5.3.2 Interest rate and inflation riskThe Network Rail group is exposed to changes in interest rates as funds are borrowed at both fixed and floating interest rates. The hedging strategy approved by the treasury committee defines the appropriate mix between fixed and floating borrowings. Cross-currency and interest rate swap contracts are used to manage the fixed/floating ratio. On consolidation, debt obtained from the Department is de-recognised. Changes in the fair value of the hedging derivatives are recognised as expenditure or income.
Network Rail have arranged or swapped debt with a carrying value of £21,373m (2016: £38,222m) into fixed interest rates. They have arranged or swapped other borrowings into floating rates, thus exposing the group to cash flow interest rate risk.
The Network Rail group has forward starting interest rate swaps with a notional value of £5,696m which hedge the interest rate on forecast borrowings in CP5. The weighted average rate on these swaps is 3.3% per cent. The fair value movement on these swaps during the year was £190m.
The Network Rail group has certain debt issuances which are index-linked and so are exposed to movements in inflation rates. The group does not enter into any derivative arrangements to hedge its exposure to inflation in relation to its index-linked debt, but rather to mitigate the effects of inflation on the group’s retail price index-linked revenue streams.
The Department also has exposure to inflation risk through its wholly owned subsidiary, CTRL Section 1 Finance plc, which has one tranche of asset-backed notes which are also index-linked. As the company’s liabilities are offset by an index-linked receivable from the core Department, this risk is transferred to the core Department. The core Department has identified that mitigation of the inflation risk through derivatives does not represent value for money. It manages the risk of an Excess Vote through prudent budgeting and regular monitoring of its exposure.
Sensitivity analysisThis sensitivity analysis has been determined based on the exposure to interest rates and inflation for both derivative and non-derivative financial instruments at the balance sheet date. A one per cent increase or decrease represents management’s assessment of the reasonably possible changes in average interest rates and inflation.
Annual Report and Accounts 2016-17 193
Financial Statements

2016-17
Impact on the income statement
Impact on equity
£m £m
1% increase in the interest rate (726) (159)
1% increase in the GBP RPI on index linked bonds (189) (7)
2015-16
Impact on the income statement
Impact on equity
£m £m
1% increase in the interest rate (1,188) (366)
1% increase in the GBP RPI on index linked bonds (178) (7)
A one per cent decrease in the above rates would have an equal and opposite effect.
Interest rate sensitivities have been calculated by comparing the average rates of the derivative financial instruments to the market rate for similar instruments.
The impact of a change in GBP RPI has been calculated by applying a change of one per cent to the RPI at the balance sheet date to the carrying value of the index linked bonds issued by both Network Rail and CTRL Section 1 Finance plc.
For Network Rail, it is considered that the above analysis is unrepresentative of the risks inherent in issuing index-linked debt. Franchised track access and grant income constitute £5,874m (2016: £5,742m) of revenue which is far in excess of an index-linked interest expense of £239m (2016: £239m). Currently, these sources of income are contractually index-linked and, whilst there is no absolute contractual guarantee for
future regulatory control periods that this will continue, the group is highly confident that this will continue to be the case. Therefore, the natural hedge that exists between finance costs and revenue mitigates the risk of RPI movements.
9.5.3.3 Other market riskThe Departmental group has material investments in entities involved in the property sector. As discussed under section 9.3.1.1, the valuations of these investments are based on expert valuations of their property assets. Sensitivity analyses of the related assumptions are presented in that section. The values of the investments in those entities will be influenced at least in part by changes in the performance of the UK property market. The Department mitigates any associated risks by ensuring that any new projects initiated by those entities are subject to rigorous appraisal before funds are committed.
Annual Report and Accounts 2016-17194

9.5.3.4 Offsetting financial assets and liabilitiesa) Financial assetsThe following financial assets are subject to offsetting, enforceable master netting arrangements and similar agreements.
2016-17
Related amounts not set off in the balance sheet
Gross amounts of recognised
financial assets
Gross amounts of recognised
financial liabilities set off in
the balance sheet
Net amount of financial
assets presented
in the balance
sheet
Financial instruments
Cash collateral received
Net amount
£m £m £m £m £m £m
Derivative financial assets 1,103.1 - 1,103.1 (868.3) (9.1) 225.7
2015-16
Related amounts not set off in the balance sheet
Gross amounts of recognised
financial assets
Gross amounts of recognised
financial liabilities set off in
the balance sheet
Net amount of financial
assets presented
in the balance
sheet
Financial instruments
Cash collateral received
Net amount
£m £m £m £m £m £m
Derivative financial assets 963.0 - 963.0 (693.0) (257.0) 13.0
Annual Report and Accounts 2016-17 195
Financial Statements

b) Financial liabilitiesThe following financial liabilities are subject to offsetting, enforceable master netting arrangements and similar agreements.
2016-17
Related amounts not set off in the balance sheet
Gross amounts of recognised
financial liabilities
Gross amounts of recognised
financial liabilities set off in
the balance sheet
Net amount of financial
liabilities presented
in the balance
sheet
Financial instruments
Cash collateral received
Net amount
£m £m £m £m £m £m
Derivative financial liabilities
(1,529.8) - (1,529.8) 868.3 375.1 (286.4)
2015-16
Related amounts not set off in the balance sheet
Gross amounts of recognised
financial liabilities
Gross amounts of recognised
financial liabilities set off in
the balance sheet
Net amount of financial
liabilities presented
in the balance
sheet
Financial instruments
Cash collateral received
Net amount
£m £m £m £m £m £m
Derivative financial liabilities
(1,408.0) - (1,408.0) 693.0 715.0 -
Cash flow hedgesContractual payments on derivatives designated as cash flow hedges impact the income statement and will all have matured by 2027.
BorrowingsDetails of the group’s undrawn committed facilities and types of debt instrument used can be found in the payables note 14.
Annual Report and Accounts 2016-17196

10. Investment in Associate
10.1 HoldingsThe Department holds investments in a material associate, as below.
Proportion of voting rights controlled by group
2016-17 2015-16
Name Principal Activity £m £m
NATS Holdings Ltd Air traffic control 48.90% 48.90%
NATS Holdings Ltd
£m
Balance at 1 April 2016 350.8
Share of profits/(loss) 27.2
Share of other comprehensive net income/(expenditure) (142.7)
Share of other movements (11.7)
Balance at 31 March 2017 223.6
Balance at 1 April 2015 261.2
Share of profits/(loss) (6.2)
Share of other comprehensive net income/(expenditure) 135.7
Share of other movements (39.9)
Balance at 31 March 2016 350.8
Annual Report and Accounts 2016-17 197
Financial Statements

10.2 Financial results of associate
NATS Holdings Ltd 2016-17 2015-16
£m £m
Balance at 31 March 2016
Current assets 462.8 539.3
Non current assets 1,241.2 1,287.1
Current liabilities (225.7) (362.3)
Non current liabilities (1,020.8) (746.7)
Net assets 457.5 717.4
Revenue 919.3 896.0
Profit for the year 103.8 52.4
Other comprehensive income/(expenditure) for the year (236.1) 208.0
Total comprehensive income/(expenditure) for the year (132.3) 260.4
Dividends paid during the year (24.0) (81.7)
10.3 Share of Net Assets (Investment value)
2016-17 2015-16
£m £m
Carrying amount of the Department’s interests in NATS Holdings Ltd (48.9% of Net Assets)
223.6 350.8
All figures contained in this note are based on management accounts for the month of February, and will not reconcile to the published accounts for NATS Holdings Ltd.
Annual Report and Accounts 2016-17198

11. Inventories
31 March 2017 31 March 2016
Core Department & Agencies
Departmental Group
Core Department & Agencies
Departmental Group
£m £m £m £m
Current assets
Properties acquired under the HS2 blight exceptional hardship and related schemes
246.2 246.2 393.2 393.2
Raw materials, consumables & work-in-progress
- 230.6 0.6 241.4
246.2 476.8 393.8 634.6
Non-current assets
Raw materials, consumables & work-in-progress
4.2 4.2 3.8 3.8
4.2 4.2 3.8 3.8
Annual Report and Accounts 2016-17 199
Financial Statements

12. Trade Receivables and Other Assets
31 March 2017 31 March 2016
Core Department & Agencies
Departmental Group
Core Department & Agencies
Departmental Group
£m £m £m £m
Amounts falling due within one year:
Trade receivables 15.2 316.5 54.2 464.3
Deposits and advances 1.0 10.2 0.8 13.5
VAT receivables 5.5 266.6 3.1 254.8
Other receivables 105.5 235.0 22.8 47.2
Collateral placed with banking counterparties
- 625.0 - 819.0
Financial indemnity fee 280.4 - 299.0 -
Prepayments and accrued income 166.2 411.9 114.3 193.6
Current part of NLF loan 1.2 1.2 1.1 1.1
Amounts due in respect of Consolidated Fund Extra Receipts
- - - -
Amounts due from the Consolidated Fund in respect of supply not drawn down at year end
182.3 182.3 - -
Total current 757.3 2,048.7 495.3 1,793.5
31 March 2017 31 March 2016
Core Department & Agencies
Departmental Group
Core Department & Agencies
Departmental Group
£m £m £m £m
Amounts falling due after more than one year:
Deposits and advances - - - -
Amounts due in respect of Consolidated Fund Extra Receipts
- - - -
Other receivables 1.4 36.1 8.3 99.6
Financial indemnity fee 3,861.4 - 3,998.9 -
Finance leases - - - -
Prepayments and accrued income - 10.2 - 9.8
Total non-current 3,862.8 46.3 4,007.2 109.4
Total current and non-current 4,620.1 2,095.0 4,502.5 1,902.9
Annual Report and Accounts 2016-17200

13. Cash and Cash Equivalents
31 March 2017 31 March 2016
Core Department & Agencies
Departmental Group
Core Department & Agencies
Departmental Group
£m £m £m £m
Balance at 1 April 109.5 1,180.8 103.2 565.5
Net change in cash and cash equivalent balances
(266.2) (493.9) 6.3 615.3
Balance at 31 March 2017 (156.7) 686.9 109.5 1,180.8
The following balances at 31 March 2017 were held at:
Government Banking Service (162.5) (122.3) 104.4 163.4
Commercial banks and cash in hand 5.8 809.2 5.1 1,017.4
Balance at 31 March 2017 (156.7) 686.9 109.5 1,180.8
Annual Report and Accounts 2016-17 201
Financial Statements

14. Trade Payables and Other Liabilities
31 March 2017 31 March 2016 (reclassified)*
Core Department & Agencies
Departmental Group
Core Department & Agencies
Departmental Group
£m £m £m £m
Amounts falling due within one year:
VAT, other taxation and social security 6.4 68.6 5.0 57.7
Pension - 2.9 - 2.7
Trade payables 49.6 704.7 62.8 757.5
Other payables 26.0 1,470.1 38.3 349.8
Accruals and deferred income** 503.7 2,934.8 569.2 2,866.6
Current part of finance leases 0.2 5.8 3.3 7.3
Current part of imputed finance lease element of Public Finance Initiative (PFI) contracts and other service concession arrangements
4.0 81.6 4.7 80.1
Obligations in respect of Channel Tunnel Rail Link debt
106.5 117.1 104.4 116.2
Obligations in respect of Network Rail debt***
- 1,753.3 - 2,684.3
Collateral received from banking counterparties
- 258.7 - 329.8
Current part of National Loan Fund (NLF) loans
1.2 1.2 1.1 1.1
Amounts issued from the Consolidated Fund for supply but not spent at year end
- - 91.0 91.0
Consolidated Fund Extra Receipts due to the Consolidated Fund (Received)
25.6 25.6 18.5 18.5
Total current 723.3 7,424.4 898.3 7,362.6
Annual Report and Accounts 2016-17202

31 March 2017 31 March 2016 (reclassified)*
Core Department & Agencies
Departmental Group
Core Department & Agencies
Departmental Group
£m £m £m £m
Amounts falling due after more than one year:
Other payables 61.8 304.2 65.2 1,564.5
Deferred income** 1,262.4 1,353.0 1,316.8 1,091.6
Finance leases - - 0.5 21.5
Non current part of imputed finance lease element of Public Finance Initiative (PFI) contracts and other service concession arrangements
22.8 1,566.6 28.1 1,639.1
Obligations in respect of Channel Tunnel Rail Link debt
4,039.4 4,044.2 4,093.4 4,097.0
Obligations in respect of Network Rail debt***
- 25,306.1 - 26,185.8
European Investment Bank loan - 467.5 - 458.9
NLF loans 0.8 0.8 1.9 1.9
Consolidated Fund Extra Receipts due to the Consolidated Fund
- - - -
Total non-current 5,387.2 33,042.4 5,505.9 35,060.3
Total current and non-current 6,110.4 40,466.8 6,404.2 42,422.9
*Details of the reclassification can be found in note 21.**Deferred income in relation to HS1 is amortised at the rate of £54,387,000 annually.***Detailed information is available in the published accounts of Network Rail Limited (note 18).
Annual Report and Accounts 2016-17 203
Financial Statements

15. Deferred Taxation
31 March 2017 31 March 2016
£m £m
Opening balance 2,807.6 3,225.7
Adjustments in respect of prior years (77.1) 4.8
Operating (gain)/loss (4.2) (299.8)
Other comprehensive income (344.9) (123.1)
Total 2,381.4 2,807.6
Certain deferred tax assets and liabilities have been offset. The following is the analysis of the gross deferred tax balances.
31 March 2017 31 March 2016
£m £m
Deferred tax – liabilities 2,460.6 3,077.6
Deferred tax – assets (79.2) (270.0)
Total 2,381.4 2,807.6
Deferred tax relates principally to the activities of the Network Rail Group. The majority of the Departmental Group’s activity outside Network Rail is classified as non-business and has no tax implications. In accordance with IAS 12, no deferred tax asset is recognised in respect of accumulated tax losses, since future taxable profits available for the utilisation of those losses are not anticipated. The small deferred tax assets above relate to timing differences only.
The liability balance relates principally to the taxable temporary difference arising as a result of accelerated capital allowances affecting the tax base outpacing accounting depreciation.
No adjustment is made in respect of the revaluation of the rail network in these accounts to Depreciated Replacement Cost, since the Department believes that the valuation of the railway network in Network Rail’s statutory accounts (on which the deferred tax workings are based) provides the best basis for assessing temporary differences which will result in effects on the future assessment of tax should the relevant assets be realised.
None of the above relates to the Departmental core and Agencies.
Annual Report and Accounts 2016-17204

16. Provisions for Liabilities and Charges
31 March 2017 31 March 2016
Core Department & Agencies
Departmental Group
Core Department & Agencies
Departmental Group
£m £m £m £m
Balance at 1 April 2016 526.2 734.1 638.2 695.5
Provided in the year 286.0 399.4 113.9 181.8
Provisions not required written back (22.7) (85.1) (7.9) (29.2)
Provisions utilised in the year (58.1) (111.7) (73.8) (143.6)
Unwinding of discounts 7.6 7.6 8.9 8.9
Provisions transferred to Highways England
- - (153.1) -
Reclassification - 5.1 - 20.7
Balance at 31 March 2017 739.0 949.4 526.2 734.1
Of which
Amounts falling due within one year: 209.5 328.0 72.7 185.4
Amounts falling due after more than one year:
529.5 621.4 453.5 548.7
Total current and non-current 739.0 949.4 526.2 734.1
Annual Report and Accounts 2016-17 205
Financial Statements

Analysis of expected timing of discounted flows
31 March 2017 31 March 2016
Core Department & Agencies
Departmental Group
Core Department & Agencies
Departmental Group
£m £m £m £m
Not later than one year 209.5 328.0 72.7 185.4
Later than one year and not later than five years
201.6 316.0 180.4 274.1
Later than five years 327.9 305.4 273.1 274.6
Balance at 31 March 2017 739.0 949.4 526.2 734.1
16.1.1 Departmental Group
Industrial disease
claims
Obligations for railway
asset investment
National Freight
Company Pension
Highways scheme
costs
HS2 Land &
Property
Others Total
£m £m £m £m £m £m £m
Balance at 1 April 2016 303.1 - 62.9 122.3 103.1 142.7 734.1
Provided in the year 8.9 134.0 7.9 90.9 115.5 42.2 399.4
Provisions not required written back
(22.1) - - (25.0) - (38.0) (85.1)
Provisions utilised in the year
(12.3) - (7.2) (35.7) (32.5) (24.0) (111.7)
Unwinding of discounts 7.1 - - - - 0.5 7.6
Reclassification - - - - - 5.1 5.1
Balance at 31 March 2017
284.7 134.0 63.6 152.5 186.1 128.5 949.4
Annual Report and Accounts 2016-17206

16.1.2 Core Department and Agencies
Industrial disease
claims
Obligations for railway
asset investment
National Freight
Company Pension
Highways scheme
costs
HS2 Land &
Property
Others Total
£m £m £m £m £m £m £m
Balance at 1 April 2016 303.1 - 62.9 - 103.1 57.1 526.2
Provided in the year 8.9 134.0 7.9 - 115.5 19.7 286.0
Provisions not required written back
(22.1) - - - - (0.6) (22.7)
Provisions utilised in the year
(12.3) - (7.2) - (32.5) (6.1) (58.1)
Unwinding of discounts 7.1 - - - - 0.5 7.6
Reclassification - - - - - - -
Balance at 31 March 2017
284.7 134.0 63.6 - 186.1 70.6 739.0
16.1.3 Analysis of expected timing of discounted flows – Departmental Group
Industrial disease
claims
Obligations for railway
asset investment
National Freight
Company Pension
Highways scheme
costs
HS2 Land &
Property
Others Total
£m £m £m £m £m £m £m
Not later than one year 9.2 41.0 5.2 49.1 148.0 75.5 328.0
Later than one year and not later than five years
20.6 93.0 21.8 103.4 38.1 39.1 316.0
Later than five years 254.9 - 36.6 - - 13.9 305.4
Balance at 31 March 2017
284.7 134.0 63.6 152.5 186.1 128.5 949.4
Annual Report and Accounts 2016-17 207
Financial Statements

16.2 Provisions for Liabilities and Charges16.2.1 Industrial disease claimsThe British Railways Board was a major employer for some 50 years (with up to three-quarters of a million employees at one time). On privatisation, it retained responsibility in the great majority of cases for industrial injuries and employment and environment-related claims resulting from its activities during that period. In some instances claims do not arise until many years after the relevant employment ceases (e.g. medical conditions may not develop until much later). As the industry was reorganised these responsibilities and liabilities were retained by a government owned company (British Rail Residuary Board Ltd – BRBR). On the abolition of BRBR (29 September 2013) liability for these claims passed over to the Department for Transport.
As at 31 March 2017, 547 (2016: 756) disease and injury claims were still outstanding, including 99 (2016:97) mesothelioma claims, 50 (2016: 50) asbestosis claims, 6 (2016: 5) pleural plaque claims, 3 (2016: 15) vibration white finger claims, and 359 (2016: 559) industrial deafness claims. During the year some £12.3m (2016: £15m) was paid out in settlement of such claims. The value of the provision for employee related claims as at 31 March 2017 was £284.7m (2016: £303.1m). As a result of a decrease in the cost of claims and changes in assumptions of the future employee claims model, the provision has been reduced at the year end. This has resulted in a £5.7m benefit to the SoCNE.
16.2.2 Guarantees for railway assessmentGuarantees to promote investment in railway assets (31 March 2017: £134m; 31 March 2016: nil). Under the Railways Act 1993, the Secretary of the State has the power to issue guarantees to promote investment in railway assets. The provision is expected to be utilised during the next 3 financial years.
16.2.3 National Freight Company PensionThis provision includes two elements as below:
» National Freight Company plc (NFC) pension trustee (31 March 2017 – £63.6m; 31 March 2016 – £62.9m) – reimbursement to NFC pension trustees in respect of payments covering unfunded pension service with NFC before 1 April 1975 (Part III, Transport Act 1980); and
» NFC travel concession (31 March 2017 – £11.5m; 31 March 2016 – £11.5m) – reimbursements to NFC and its subsidiaries for providing travel concession to staff previously employed by the road transport division of British Rail (s21, Transport Act 1978 and Schedule 6 to the Transport Act 1980).
Annual Report and Accounts 2016-17208

16.2.4 Highways SchemesLand and property acquisitionLand and property acquisition provisions relate principally to the estimated cost of planning blight, discretionary and compulsory acquisition of property and compensation for property owners arising from physical construction of a road scheme. It may take several years from the announcement of a scheme to completion of the road and final settlement of all liabilities.
Bridge strengtheningThe provision is predominately for work required to strengthen the Chelmer Viaduct and River Bridge to comply with legal minimum requirements, as established by European Community legislation and authoritative statements by Ministers in Parliament. The provisions that have been recorded represent the directors’ best estimate of the expenditure required to settle the obligation, often with the benefit of technical advice.
16.2.5 HS2 Land & PropertyLand and property acquisition provisions relate principally to Blighted property – HS2.
(31 March 2017 £186.1m; 31 March 2016 £103.1m).
In a small number of cases, the Department has provided advance notice of possession to individuals and businesses along the line of route. The aim of this advance notice is to reduce stakeholder uncertainty, and to manage the costs associated with acquisition. In these cases, the Department has provided for its best estimate of the costs obligated by these notices (for example, in relation to required relocations) which do not include the acquisition of the property, which will only be confirmed through a subsequent legal notice.
16.2.6 OtherThis heading covers a range of smaller provisions, including:
» “The onerous lease on the arches beneath Waterloo domestic station.(31 March 2017: £30m; 31 March 2016: £29.1m). The lease expires in July 2052. The provision is reported in Core and Agency only as Network Rail is the lessor and the Department for Transport the lessee.
» Early Departure Costs under the pre-2010 Civil Service Compensation Scheme. (31 March 2017: £0.9m; 31 March 2016: £3m). The Department and its Agencies meet the additional costs of benefits beyond the normal Principal Civil Service Pension Scheme (PCSPS) benefits in respect of employees who retired early by paying the required amounts annually to the PCSPS over the period between early departure and normal retirement date.
» Pension liabilities for early retirees, which relates to former staff who left Highways England’s employment before the formal retirement age of 60. The Agency is responsible for making payments to the pension plan until their retirement age.
Annual Report and Accounts 2016-17 209
Financial Statements

17. Contingent Liabilities
As a government department, the Department for Transport discloses contingent liabilities under requirements that are broader than those applicable to commercial entities. In accordance with IAS 37, it discloses contingent liabilities for which the risk of crystallisation is greater than remote but not probable. Where these can be quantified they are disclosed under 17.1 below, where they cannot be quantified with any degree of accuracy, they are disclosed under 17.2 below.
17.1 Quantifiable contingent liabilities disclosed under IAS 37The Department has the following contingent liabilities for which the risk of crystallisation is considered greater than remote but is not thought probable. Amounts disclosed reflect the highest reasonable estimate of the possible liability. These are summarised by the nature and purpose of the contingent liability:
31 March 2017 31 March 2016
£m £m
Indemnities in respect of Crossrail funding and delivery
To support delivery of the Crossrail project, the Department has provided indemnities and assurances to parties carrying risks that they would be unable to bear.
5,639 4,589
Guarantees to promote investment in railway assets
Under the Railways Act 1993, the Transport Act 2000 and the Channel Tunnel Rail Link Act 1996, the Secretary of State has provided guarantees to promote investment in the rail sector.
333 574
Legal claims
From time to time, the Department experiences legal claims and challenges which it defends vigorously.
458 389
Highways England represent a key component of the legal claims for the Department as the process of their main obligations are as follows. The process of constructing and maintaining the strategic network may bring Highways England into disagreement with parties affected by this work. This can result in counter-claims, which are aggregated under the following sub-headings:
Possible obligations in relation to land and property acquisition. 403 279
Carriageway pavements defects. 3 3
Third-party claims. 7 9
Annual Report and Accounts 2016-17210

31 March 2017 31 March 2016
£m £m
Network Rail
Guarantees issued by Network Rail to financial institutions in respect of its own activities and the activities of businesses it wholly or partially owns.
90 91
Indemnities in respect of Thameslink funding and delivery
To support delivery of the Thameslink project, the Department has provided indemnities to parties carrying risks that they would be unable to bear.
40 56
HS2
As set out in note 17.2, the Department issued a safeguarding order, in July 2013, for the proposed route of HS2. Under the Town and County Planning Act 1990, this creates an obligation on the Department to purchase properties which have been blighted, as defined in the Act. Not all property owners are eligible, and some applications have been refused. Applicants may appeal to the Lands Tribunal. The amount relates to the estimated costs should the Tribunal conclude that the property is blighted; any properties purchased would be recognised as assets.
2 4
HS2 Ltd
An indemnity against any detriment caused to Affinity Water’s business due to impact from HS2 upon water resources from which they extract water.
77 31
A statutory risk of VAT not being reclaimed from HMRC pending a review of HS2’s registration criteria.
138 -
HS1
Under the HS1 concession agreement, the Secretary of State may be liable for payments, including capital expenditure, increase in operating costs and loss of revenue. This would be in the event of legal changes, either in the UK or Europe (‘Change in Circumstances’) or a change directed by another part of the Government (‘Government Change’).
20 20
Mersey Gateway
Commitment by the Department to fund any shortfall of toll revenue from the Mersey Gateway Bridge to meet Halton Council’s financial obligations under the Demand Management Participation Agreement.
1,546 1,546
Annual Report and Accounts 2016-17 211
Financial Statements

The Department has responsibility for a number of legacy pension schemes formerly part of the British Railways Board. The Department is required to fund the employer’s share of any deficits arising on these schemes and thus they are recognised on the Department’s balance sheet.
17.2 Unquantifiable contingent liabilitiesThe following guarantees, indemnities, statutory obligations and letters of comfort cannot be quantified with any degree of accuracy:
» In 2013 the Secretary of State agreed to quantifiable (disclosed in Note 17.1) and unquantifiable assurances, warranties, indemnities and potential losses under the Thameslink Rolling Stock contracts.
» Safeguarding Directions are in place for Crossrail 2. Property owners within the safeguarded area may be eligible to serve a Blight Notice asking the Secretary of State to buy their property and there is a contingent liability associated with this as a consequence of the existence of statutory blight.
» The Department issued a safeguarding order, in July 2013, for the proposed route of HS2. This creates an obligation on the Department to purchase properties which have been blighted. A provision has been recognised for the cost of properties the Department has accepted as blighted, and where the purchase price has been substantially agreed. Any remaining liability is classed as a contingent liability.
Annual Report and Accounts 2016-17212

18. Related-party transactions
The Department for Transport is a parent of the executive agencies listed at Note 19 and a sponsor of the non departmental public bodies and other central government organisations listed there.
These bodies are regarded as related parties with which the Department has had various material transactions during the year.
In addition, the Department for Transport has had various material transactions with other government departments and other central government bodies. Most transactions have been with the Greater London Authority, TfL and Her Majesty’s Treasury.
The Department for Transport undertook the following transactions with these respective bodies.
Transactions between the Department for Transport and HS2 Ltd
2016-17 2015-16
£m £m
Grant in Aid paid to HS2 Ltd 445.0 322.0 Amounts received by HS2 Ltd (32.4) (12.7)Other amounts paid to HS2 Ltd 6.5 3.1
Transactions between the Department for Transport and Network Rail
2016-17 2015-16
£m £m
Loan advances made to Network Rail 6,087.0 7,500.0 Grant in Aid paid to Network Rail 4,072.0 3,457.0 Interest on loan advances paid from Network Rail (412.7) (216.3) Income received from Network Rail in respect of the Financial Indemnity fee (298.8) (325.7)
The Department for Transport had the following balances outstanding at year end with these respective bodies;
Balances held by the Department for Transport for HS2 Ltd
2016-17 2015-16
£m £m
Income receivable balance from HS2 22.0 15.3
Balances held by the Department for Transport for Network Rail
2016-17 2015-16
£m £m
Loan receivable balance from Network Rail 20,037.0 13,950.0 Value of the Departmental Indemnity given to Network Rail debt holders (4,141.7) (4,297.9)
During the year, no minister, board member, key manager or other related party has undertaken any material transactions with the Department for Transport during the year other than those reported.
Richard Brown serves as a Non-Executive Director at the Department for Transport and both Network Rail and High Speed 2 Ltd, which are wholly owned and controlled by the Secretary of State and are within the accounting boundary. They are both included in the list in Note 19. Mr Brown’s remuneration as a Non-Executive Director at Network Rail and High Speed 2 Ltd is disclosed in those accounts. There were no other material transactions between Mr Brown and either body in the current or prior years.
Annual Report and Accounts 2016-17 213
Financial Statements

19. Entities within and outside the departmental boundary
19.1 Within the Departmental Accounting boundaryThe following entities were within the Departmental boundary during 2015-16 and are reported as part of the Department’s accounts:
19.1.1 Reported within the core Department’s own accounts
Advisory Non Departmental Public Bodies
Disabled Persons’ Transport Advisory Committee
19.1.2 Consolidated within the accounts of the Department
Executive Agencies (Supply financed agencies)
Maritime and Coastguard Agency*
Driver and Vehicle Licensing Agency*
Vehicle Certification Agency*
Arm’s Length Bodies (Executive Non Departmental Public Bodies)
British Transport Police Authority*
Directly Operated Railways Limited*
High Speed Two (HS2) Limited*
The Commissioners of Northern Lighthouses*
Trinity House Lighthouse Service*
Transport Focus*
Arms Length Bodies (Other than Non Departmental Public Bodies)
Network Rail Group (Network Rail Limited and its UK subsidiaries)*Highways England Company Limited*CTRL Section 1 Finance plc*LCR Finance plc*The Commissioners of Irish Lights*Air Safety Support International Limited*Air Travel Trust Fund*
*These entities are reported within the accounts of the Department and also produce their own separate accounts.
Annual Report and Accounts 2016-17214

19.2 Not reported within the Departmental Accounting boundaryLondon and Continental Railways Limited and Network Rail Insurance Limited are reported in these accounts as financial assets at fair value (Note 9). NATS holdings Limited is reported in these accounts as an associate at fair value (Note 10) The remaining entities, listed below, are not reported as part of the Department’s accounts:
Financial information for the following entities can be obtained from their separately published annual reports and accounts:
Public Corporations
Civil Aviation Authority
Dover Harbour Board
ITSO Limited
ITSO Services Limited
Milford Haven Port Authority
Poole Harbour Commissioners
Port of London Authority
Port of Tyne Authority
Shoreham Port Authority
Blyth Harbour Commissioners
Harwich Haven Commissioners
London and Continental Railways Limited
Trading Funds
Driving and Vehicle Standards Agency
Other Entities
Crossrail Complaints Commissioner
Marine and Aviation Insurance (War Risks) Fund
General Lighthouse Fund
Network Rail Insurance Limited (Guernsey)
NATS Holdings Limited
Annual Report and Accounts 2016-17 215
Financial Statements

20. Pension Schemes
This note provides disclosures on the Departmental group’s obligations in respect of the defined benefit pension arrangements for which it is the designated employer. The Departmental group also provides defined contribution retirement benefit schemes, and these are described in the Annual Report.
Departmental GroupThe Secretary of State for Transport fulfils the role of the ‘designated employer’ for the defined benefit schemes listed below:
Key data
The Department applies IAS 19 to all these schemes. In accordance with IAS 19, the share of any deficits or recoverable surplus in the pension funds is recognised in the Statement of Financial Position. Interim valuations have been carried out as at 31 March 2015.
Scheme Open/closed Basis Accrual Rate Normal retirement age
Funded/unfunded
NR (RPS) (includes RPS 60 and RPS 65) more detail can be obtained from the accounts of Network Rail Limited.
Open to employees with five years’ service (RPS 60 closed to new joiners from 1 July 2012.
Shared cost (employer's share: 60%) final salary-based (subject to capping); linked to CPI.
1/60 (RPS 60 and RPS 65) average final pensionable salary minus 150% final basic state pension (RPS 60) or 75% final basic state pension.
Either 60 (for RPS 60) or 65 (for RPS 65) (reflected in contribution rate).
Funded
NR (CARE) more detail can be obtained from the accounts of Network Rail Limited.
Open to all employees.
Shared cost (employer’s share: 60%) career average revalued earnings, linked to RPI upto 31 March 2016 and CPI thereafter.
1/60 average pensionable salary.
65 Funded
1994 Section (RPS). Closed to new members and accruals: members are those who were pensioners and preserved pensioners of BR at the time of privatisation.
Final salary-based, linked to CPI.
Not applicable, as scheme is closed to new accruals.
60 Funded
Annual Report and Accounts 2016-17216

Scheme Open/closed Basis Accrual Rate Normal retirement age
Funded/unfunded
BTP Force Superannuation Fund (BTPFSF) (including BTPSF (new)) more detail can be obtained from the accounts of the British Transport Police.
Closed to new members except BTPSF (new) open to new members.
Shared cost (employer’s share 60% or 66% (for the new scheme)) final salary-based, linked to CPI.
(1/45 minus 1/30 state pension); 1/70 (for BTPSF (new)).
55 Funded
BTP Section of the Railways Pension Scheme (RPS) more detail can be obtained from the accounts of the British Transport Police.
Open to new members.
Shared cost (employer’s share: 60%), final-salary based, linked to CPI.
1/60 final salary. 60 Funded
British Railways Superannuation Fund (BRSF).
Closed to new members and accruals.
Not applicable, as scheme is closed to new accruals.
60 Funded
BR Shared Cost Section (RPS).
Open to eligible members.
Shared cost (employer’s share: 60%), final-salary based, linked to CPI.
1/60 final salary 60 Funded
BR (1974) Pension Fund.
Closed to new members and accruals.
Supplementary to other RPS schemes.
Not applicable, as scheme is closed to new accruals.
60 Largely unfunded
Annual Report and Accounts 2016-17 217
Financial Statements

The deficit comprises the following balances:
Departmental Group
2016-17 2015-16
Scheme: £m £m
NR (RPS and CARE) (2,311.0) (1,420.0)
1994 Section* (1,562.4) (1,183.4)
BR Shared Cost Section* (54.8) (29.1)
British Railways Superannuation Fund (BRSF)* (25.5) (22.6)
BR (1974) Pension Fund* (5.0) (4.9)
BTP Force Superannuation Fund (BTPFSF) (639.8) (430.2)
BTP Section of the Railways Pension Scheme (RPS) (135.9) (61.2)
Total deficit at the end of the period (4,734.4) (3,151.4)
*Core Department & Agencies (1,647.7) (1,240.0)
Annual Report and Accounts 2016-17218

Reconciliation of net pension (liability)/asset
Core Department & Agencies
Departmental Group
Deficit Asset Liabilities Deficit
£m £m £m £m
At 1 April 2015 (1,496.1) 7,578.6 (11,209.9) (3,631.3)
Current and past service cost including members’ share
(1.8) - (263.2) (263.2)
Interest on pension deficit (43.4) 234.6 (347.5) (112.9)
Administration expenses - (6.8) - (6.8)
Return on plan assets greater than the discount rate
(3.6) 84.2 - 84.2
Section amendment - - 123.0 123.0
Actuarial gain arising from changes in financial assumption
127.9 - 292.2 292.2
Actuarial gains and losses on defined benefit obligation due to demographic assumptions
13.7 - 26.8 26.8
Actuarial gain arising from experience adjustments
160.8 - 190.1 190.1
Regular contributions by employer 1.3 103.5 - 103.5
Contributions by employees 0.5 57.9 (16.0) 41.9
Benefits paid 0.7 (538.2) 539.3 1.1
At 1 April 2016 (1,240.0) 7,513.8 (10,665.2) (3,151.4)
Annual Report and Accounts 2016-17 219
Financial Statements

Core Department & Agencies
Departmental Group
Deficit Asset Liabilities Deficit
£m £m £m £m
Current service cost including members’ share
(1.9) - (247.6) (247.6)
Past service costs - - 42.0 42.0
Interest on pension deficit (38.3) 243.0 (343.6) (100.6)
Administration expenses - (7.6) - (7.6)
Return on plan assets greater than the discount rate
396.0 941.0 - 941.0
Actuarial gains/(losses) arising from changes in financial assumption
(646.6) - (1,932.0) (1,932.0)
Actuarial gains/(losses) on defined benefit obligation due to demographic assumptions
- - (496.4) (496.4)
Actuarial gains/(losses) arising from experience adjustments
(121.7) - 81.1 81.1
Regular contributions by employer 4.8 95.7 - 95.7
Contributions by employees - 57.4 (16.0) 41.4
Benefits paid - (531.9) 531.9 -
At 31 March 2017 (1,647.7) 8,311.4 (13,045.8) (4,734.4)
Annual Report and Accounts 2016-17220

Analysis of scheme assets
Core Department & Agencies
Departmental Group
2016-17 2015-16 2016-17 2015-16
£m £m £m £m
Cash and cash equivalents 303.6 306.2 142.1 112.8
Equity instruments and funds 2,521.8 2,401.8 6,468.2 5,798.2
Debt instruments – Government 152.0 144.4 724.4 686.3
Debt instruments – non-Government - - 155.4 139.2
Property - - 114.5 118.3
Other 196.1 196.0 706.8 659.0
Fair value of plan assets 3,173.5 3,048.4 8,311.4 7,513.8
Present value of funded obligations (4,821.2) (4,288.4) (13,045.0) (10,665.2)
Net liability (1,647.7) (1,240.0) (4,734.4) (3,151.4)
The amounts recognised in the operating costs statements are as follows:
Core Department & Agencies
Departmental Group
2016-17 2015-16 2016-17 2015-16
£m £m £m £m
Current service cost 1.9 1.8 247.6 263.2
Past service cost - - (42.0) -
Section amendment - - - (123.0)
Net interest expense/(income) 38.3 43.4 100.6 112.9
Administrative costs and taxes - - 7.4 (6.8)
Contributions by employees - (0.5) (41.4) (41.9)
Total 40.2 44.7 272.4 204.4
Of which:
Employer contributions included in Note 3 ‘other pension costs’
4.8 - 95.7 -
Pension scheme costs per Note 4 35.4 - 176.7 -
Annual Report and Accounts 2016-17 221
Financial Statements

The amounts recognised in other comprehensive expenditure are as follows:
Core Department & Agencies
Departmental Group
2016-17 2015-16 2016-17 2015-16
£m £m £m £m
Return on plan assets greater than the discount rate
396.0 (3.6) 941.0 84.2
Actuarial gain/(loss) arising from changes in assumptions
(646.6) 141.6 (2,428.4) 319.0
Actuarial gain arising from experience adjustments
(121.7) 160.8 81.1 190.1
Total gain/(loss) (372.3) 298.8 (1,406.3) 593.3
Principal actuarial assumptions at the balance sheet date (expressed as weighted average):
NR (RPS) NR (CARE) 1994 Section BTP Force Superannuation
Fund (BTPFSF)
Discount rate 2.5% (2016: 3.4%)
2.5% (2016: 3.4%)
2.2% (2016: 3.1%)
2.5% (2016: 3.6%)
Future pension increases 2.2% (2016: 1.9%)
3.2% (2016: 2.9%)
2.05% (2016: 1.6%)
2.3% (2016: 2.1%)
Future prices increase (CPI unless otherwise stated)
2.2% (2016: 1.9%)
2.2% (2016: 1.9%)
2.05% (2016: 1.6%)
2.3% (2016: 2.1%)
Rate of increase in salaries 3.2% (2016: 3.4%)
3.2% (2016: 3.4%)
3.8% (2016: (3.35%))
3.3% (2016: 3.1%)
Annual Report and Accounts 2016-17222

31 M
arch
201
731
Mar
ch 2
016
NR
(RP
S
and
CA
RE
)19
94 S
ecti
on
BT
P F
orc
e S
up
eran
nu
atio
n Fu
nd
(BT
PFS
F)*
NR
(RP
S
and
CA
RE
)**
1994
Sec
tio
nB
TP
Fo
rce
Su
per
ann
uat
ion
Fun
d
(BT
PFS
F)*
**
Dis
coun
t rat
e
25 b
asis
poi
nts
+(2
97.0
) (1
30.0
) (9
6.3)
(2
15.4
) (1
10.0
) (7
8.8)
– 3
14.4
1
30.0
1
04.3
2
27.4
1
10.0
8
4.6
Mor
talit
y
1 ye
ar+
193
.8
170
.0
59.
4 1
48.9
1
50.0
3
6.2
–(1
87.8
) (1
70.0
) (5
9.4)
(1
44.6
) (1
50.0
) (3
6.2)
Ear
ning
s in
crea
se
25 b
asis
poi
nts
+ 1
17.0
N
/A
-
88.
2 N
/A
-
–(1
13.4
) N
/A
-
(85.
8)
N/A
-
Pric
e in
flatio
n (C
PI m
easu
re;
appr
opria
te a
djus
tmen
t mad
e fo
r N
R (C
AR
E) R
PI)
25 b
asis
poi
nts
+ 3
13.2
1
30.0
9
8.9
229
.2
110
.0
85.
3
–(2
97.6
) (1
30.0
) (9
1.8)
(2
18.4
) (1
10.0
) (7
9.9)
* Th
e B
TP S
uper
annu
atio
n Fu
nd s
ensi
tivity
ana
lysi
s fig
ures
for e
arni
ngs
incr
ease
are
sta
ted
as N
IL d
ue to
imm
ater
ialit
y.**
The
Net
wor
k R
ail C
AR
E an
d R
PS
ass
umpt
ions
hav
e be
en re
stat
ed to
refle
ct th
eir 6
0% s
hare
of t
he s
chem
es.
***
The
BTP
Sup
eran
nuat
ion
Fund
sen
sitiv
ity a
naly
sis
figur
es h
ave
been
rest
ated
to s
how
the
mov
emen
t in
com
paris
ion
to th
e 20
16 b
ase
year
net
liab
ility.
Annual Report and Accounts 2016-17 223
Financial Statements

It is considered that none of the other schemes expose the Department to risk of material changes in balances and transactions arising from factors surrounding the actuarial assumptions and their sensitivities. As a result, this data is not provided for those schemes.
Risk analysisDefined benefit scheme liabilities expose the Departmental group to material financial uncertainty, arising from factors such as changes in life expectancy and in the amount of pensions payable. Some scheme investments, such as equities, should offer long-term growth in excess of inflation, but can be more volatile in the shorter term than government bonds.
The cost of financing defined benefit pension deficits is borne by a number of parties. For shared cost schemes, such as the RPS shared cost sections, any increase in contributions will be met in part by the employees, and this element of the deficit is not recorded as a liability on the balance sheet. In the case of the employer’s contributions to both the NR and BTP schemes, any deficits will be met by increased contributions by all the employer participants of the schemes.
Potential obligation to Merchant Navy Officers’ Pension As described in the staff costs disclosures, the General Lighthouse Authorities (GLAs) are Participating Employers of the Merchant Navy Officers Pension Fund (MNOPF) which is a defined benefit scheme providing benefits based on final pensionable salary.
While few GLA employees participate in the scheme, the GLAs could be liable to contribute towards historic deficits along with all employers who have ever participated in the fund.
The MNOPF publishes full actuarial valuations on a tri-annual basis, the last being as at 31 March 2015, when the MNOPF had a gross deficit of £329m and £320m of deficit contributions due from employers. An interim update as at 31 March 2016 amended these figures to a gross deficit of £266m and £275m deficit contributions due from employers, implying a net surplus of £9m. Allowing for the closure of the fund to new members on 31 March 2016 and for fund assets to exceed the average discount rate by 0.1%, the MNOPF trustees determined that no additional contributions would be required in order to eliminate the deficit over the period to 30 September 2025. The trustees will review the need for additional deficit contributions as part of the 31 March 2018 valuation, but currently consider that no liability will arise at that time.
The MNOPF closed to new members on 31 March 2016.
Annual Report and Accounts 2016-17224

21. 2015-16 Reclassifications
(a) Network RailThe Department has changed the accounting treatment for Network Rail’s staff costs which are attributed to the construction of their capital infrastructure asset. Prior to 2016-17, Network Rail’s staff costs were shown gross and the amount relating to capitalised expenditure was netted off against a separate expenditure line (network maintenance). From 2016-17, these costs have been reclassified in the Department’s accounts to enable consistency with other parts of the DfT Group and staff costs are now stated net of capitalised costs.
Expenditure/Income line Published Reclassification As restated
£m £m £m
Note 2
Staff costs 2,727.9 (766.3) 1,961.6
Note 4
Interest Charges 483.0 422.5 905.5
PFI Interest Charges 617.7 (471.4) 146.3
Rail Network Maintenance 205.8 762.7 968.5
Information & communications technology 318.6 (13.9) 304.7
Accomodation 376.2 (19.0) 357.2
Auditors' remuneration and expenses - Cash 0.9 (0.2) 0.7
Other Costs 370.4 (15.9) 354.5
Loss/(profit) on disposal of fixed assets (82.2) 77.1 (5.1)
Loss/(profit) on disposal of share capital - (77.1) (77.1)
Pension Scheme Costs 63.0 49.7 112.7
Note 5
Other Income (443.9) 51.8 (392.1)
Total 4,637.3 - 4,637.4
Figures for 2015-16 have been restated to reflect this reclassification of costs. The effect is to reduce the previously disclosed figure for staff costs by £766 million (Note 3), and to increase network maintenance (Note 4) by £766 million.
Other expenditure incurred by Network Rail has also been reclassified within the Group Statement of Comprehensive Net Expenditure. Figures for 2015-16 have been correspondingly restated, in order to better reflect the nature of Network Rail’s spend more accurately in the Group consolidation. Details of movements are set out in the table below:
Annual Report and Accounts 2016-17 225
Financial Statements

Current payables and liabilities held by Network Rail have also been reclassified within the Statement of Financial Position. Figures for 2015-16 have been correspondingly restated, in order to better reflect the nature of Network Rail’s liabilities more accurately in the Group consolidation. Details of movements are set out in the table below:
Trade Payables and Other Liabilities Published Reclassification As restated
£m £m £m
Note 14
Amounts falling due within one year:
Other payables 19.8 330.0 349.8
Collateral received from banking counterparties 330.0 (0.2) 329.8
Cash collateral 329.8 (329.8) -
Total 679.6 - 679.6
Where financial statements include a retrospective reclassification, IAS1 requires the presentation of an additional Statement of Financial Position, as at the beginning of the preceding period, reflecting the impact of the change. This is, however, only required when the reclassification has a material impact on the information in the Statement of Financial Position at the beginning of the preceding period. In this instance, the reclassification of costs has no material impact on the Statement of Financial Position, so this additional statement has not been provided.
Annual Report and Accounts 2016-17226

(b) Dividend received from London & Continental RailwaysThe Department’s accounts for 2015-16 reported dividend income of £366.6 million received from London & Continental Railways (LCR) Ltd, relating to the proceeds generated from the disposal of the LCR Group’s interest in King’s Cross Central LLP, held via two subsidiaries. The cash proceeds had been received by LCR Ltd on behalf of the subsidiaries, and passed on to DfT as a dividend. LCR Ltd recorded the receipt as dividends from the subsidiaries, although the subsidiaries did not formally declare dividends to LCR Ltd until January 2017. As a result, LCR Ltd’s revenues for 2015-16 and equity as at 31 March 2016 were over-stated.
Once this was corrected, it became clear that the payment of the dividend to the Department left LCR Ltd’s distributable profits in deficit to the sum of £124.5 million. LCR have restated their accounts to correct the error, and to treat £124.5 million of the dividend as a prepayment. The Department considers that the presentation of the entire £366.6 million in its accounts as dividend income in 2015-16 does not represent a prior year error, because at the time of the issue of the financial statements, the Department was unaware that the dividend had not been properly declared, as this information was unavailable. In accordance with IAS 8, the Department has therefore not restated its accounts in this respect. LCR Ltd’s position has been fully regularised in 2016-17.
Annual Report and Accounts 2016-17 227
Financial Statements

22. Events after the reporting period
22.1 Non-adjusting Post-Balance Sheet EventsThe General Election held on 8 June 2017 resulted in the return of the previous Government. At the time of signing these accounts, the Department is unaware of any changes to commitments since the General Election which will have a material impact on the financial statements.
22.2 Authorised for issueThese Financial Statements are laid before the House of Parliament by HM Treasury. International Accounting Standard (IAS) 10 requires the Department to disclose the date on which the accounts are authorised for issue. This is the date that the Comptroller and Auditor General signs the audit certificate.
Annual Report and Accounts 2016-17228

Annexes
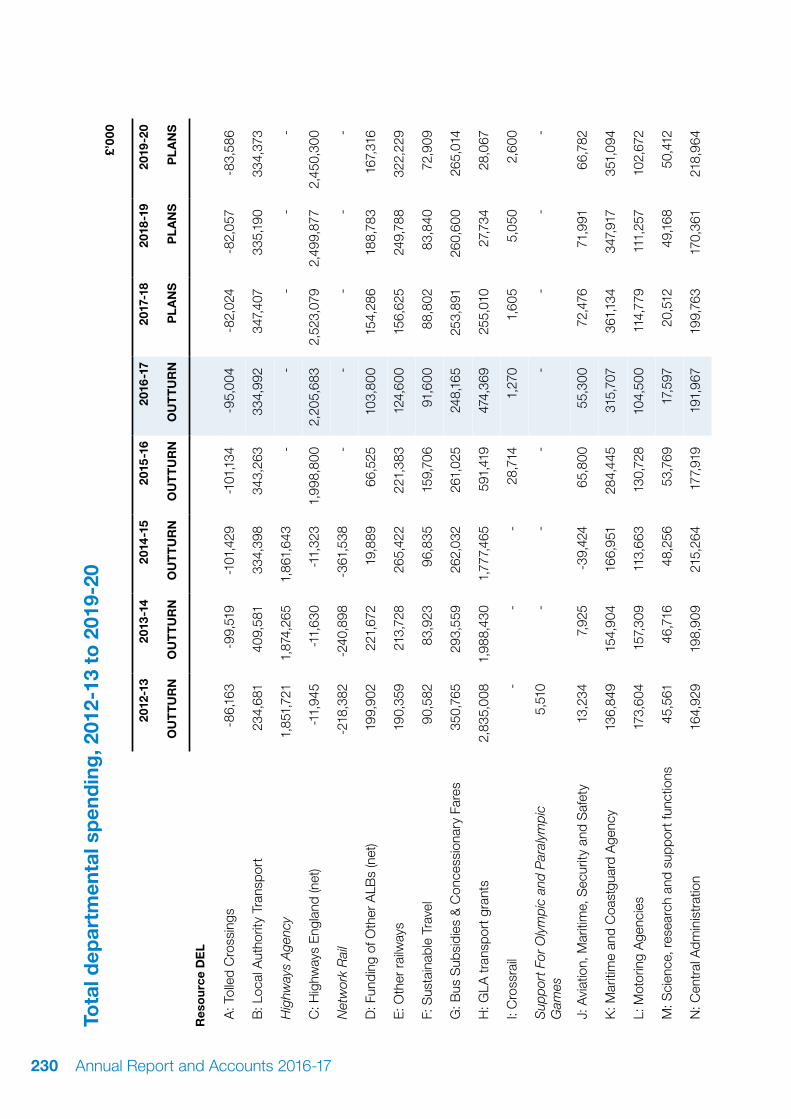
Tota
l dep
artm
enta
l sp
end
ing
, 201
2-13
to
201
9-20
£’00
0
2012
-13
2013
-14
2014
-15
2015
-16
2016
-17
2017
-18
2018
-19
2019
-20
O
UT
TU
RN
OU
TT
UR
NO
UT
TU
RN
OU
TT
UR
NO
UT
TU
RN
PL
AN
SP
LA
NS
PL
AN
S
Res
ou
rce
DE
L
A: T
olle
d C
ross
ings
-86,
163
-99,
519
-101
,429
-101
,134
-95,
004
-82,
024
-82,
057
-83,
586
B: L
ocal
Aut
horit
y Tr
ansp
ort
234,
681
409,
581
334,
398
343,
263
334,
992
347,
407
335,
190
334,
373
Hig
hway
s A
genc
y1,
851,
721
1,87
4,26
51,
861,
643
--
--
-
C: H
ighw
ays
Eng
land
(net
)-1
1,94
5-1
1,63
0-1
1,32
31,
998,
800
2,20
5,68
32,
523,
079
2,49
9,87
72,
450,
300
Net
wor
k R
ail
-218
,382
-240
,898
-361
,538
--
--
-
D: F
undi
ng o
f Oth
er A
LBs
(net
)19
9,90
222
1,67
219
,889
66,5
2510
3,80
015
4,28
618
8,78
316
7,31
6
E: O
ther
rai
lway
s19
0,35
921
3,72
826
5,42
222
1,38
312
4,60
015
6,62
524
9,78
832
2,22
9
F: S
usta
inab
le T
rave
l90
,582
83,9
2396
,835
159,
706
91,6
0088
,802
83,8
4072
,909
G: B
us S
ubsi
dies
& C
once
ssio
nary
Far
es35
0,76
529
3,55
926
2,03
226
1,02
524
8,16
525
3,89
126
0,60
026
5,01
4
H: G
LA tr
ansp
ort g
rant
s2,
835,
008
1,98
8,43
01,
777,
465
591,
419
474,
369
255,
010
27,7
3428
,067
I: C
ross
rail
--
-28
,714
1,27
01,
605
5,05
02,
600
Sup
port
For
Oly
mpi
c an
d P
aral
ympi
c G
ames
5,51
0-
--
--
--
J: A
viat
ion,
Mar
itim
e, S
ecur
ity a
nd S
afet
y13
,234
7,92
5-3
9,42
465
,800
55,3
0072
,476
71,9
9166
,782
K: M
ariti
me
and
Coa
stgu
ard
Age
ncy
136,
849
154,
904
166,
951
284,
445
315,
707
361,
134
347,
917
351,
094
L: M
otor
ing
Age
ncie
s17
3,60
415
7,30
911
3,66
313
0,72
810
4,50
011
4,77
911
1,25
710
2,67
2
M: S
cien
ce, r
esea
rch
and
supp
ort f
unct
ions
45,5
6146
,716
48,2
5653
,769
17,5
9720
,512
49,1
6850
,412
N: C
entr
al A
dmin
istr
atio
n16
4,92
919
8,90
921
5,26
417
7,91
919
1,96
719
9,76
317
0,36
121
8,96
4
Annual Report and Accounts 2016-17230

Tota
l dep
artm
enta
l sp
end
ing
, 201
2-13
to
201
9-20
(con
tinue
d)£’
000
2012
-13
2013
-14
2014
-15
2015
-16
2016
-17
2017
-18
2018
-19
2019
-20
O
UT
TU
RN
OU
TT
UR
NO
UT
TU
RN
OU
TT
UR
NO
UT
TU
RN
PL
AN
SP
LA
NS
PL
AN
S
Dep
artm
enta
l Una
lloca
ted
Pro
visi
on-
--
--
41,4
67-
O: S
uppo
rt fo
r P
asse
nger
Rai
l Ser
vice
s-7
88,4
76-6
15,9
29-1
,209
,529
-1,2
45,3
33-1
,289
,400
-1,0
12,5
19-8
12,7
81-1
,165
,523
P: H
igh
Spe
ed T
wo
3,57
07,
952
13,5
5615
,647
26,3
2432
,961
109,
368
71,9
53
Q: T
rans
port
Dev
elop
men
t Fun
d-
--
-13
,700
47,0
0096
,000
59,0
00
R: F
undi
ng o
f Oth
er A
LBs
(net
)-
10,6
137,
770
16,7
461,
444
13,2
2512
,272
12,2
89
Tota
l Res
ou
rce
DE
L5,
191,
309
4,70
1,51
03,
459,
901
3,06
9,42
02,
926,
615
3,58
9,47
93,
724,
358
3,32
6,86
5
Of w
hich
:
Sta
ff co
sts
597,
036
667,
854
610,
566
585,
969
697,
780
887,
911
698,
771
702,
869
Pur
chas
e of
goo
ds a
nd s
ervi
ces
1,85
3,58
41,
959,
917
1,74
7,22
82,
061,
722
1,97
7,80
02,
120,
853
2,16
0,99
82,
111,
938
Inco
me
from
sal
es o
f goo
ds a
nd s
ervi
ces
-955
,756
-960
,610
-692
,598
-330
,299
-328
,937
-343
,075
-366
,494
-376
,981
Cur
rent
gra
nts
to lo
cal g
over
nmen
t (ne
t)3,
515,
034
2,84
7,01
02,
455,
915
1,35
6,28
81,
019,
904
808,
425
782,
819
760,
749
Cur
rent
gra
nts
to p
erso
ns a
nd n
on-p
rofit
bo
dies
(net
)41
,437
39,9
9232
,259
36,2
4832
,630
22,6
4049
,403
51,5
06
Cur
rent
gra
nts
abro
ad (n
et)
3,26
83,
590
5,30
43,
063
2,94
9-4
8,40
54,
772
4,86
8
Sub
sidi
es to
priv
ate
sect
or c
ompa
nies
756,
403
763,
519
562,
384
504,
997
594,
953
632,
764
875,
519
875,
153
Sub
sidi
es to
pub
lic c
orpo
ratio
ns18
,141
11,2
1427
,555
-1,0
58-1
7018
,230
18,1
3418
,545
Net
pub
lic s
ervi
ce p
ensi
ons2
8,87
29,
353
7,62
49,
153
5,00
622
,297
24,1
7924
,456
Ren
tals
6,88
633
,914
9,93
38,
610
7,03
81,
015
7,92
44,
166
Dep
reci
atio
n196
7,72
01,
006,
805
991,
768
1,11
4,64
91,
342,
307
1,62
1,38
11,
634,
198
1,63
4,19
8
Annual Report and Accounts 2016-17 231
Financial Statements

Tota
l dep
artm
enta
l sp
end
ing
, 201
2-13
to
201
9-20
(con
tinue
d)£’
000
2012
-13
2013
-14
2014
-15
2015
-16
2016
-17
2017
-18
2018
-19
2019
-20
O
UT
TU
RN
OU
TT
UR
NO
UT
TU
RN
OU
TT
UR
NO
UT
TU
RN
PL
AN
SP
LA
NS
PL
AN
S
Cha
nge
in p
ensi
on s
chem
e lia
bilit
ies
--8
,990
63,4
7523
923
823
6-
-
Unw
indi
ng o
f the
dis
coun
t rat
e on
pen
sion
sc
hem
e lia
bilit
ies
--
--
290
241
241
Oth
er re
sour
ce-1
,621
,316
-1,6
72,0
58-2
,361
,512
-2,2
80,1
61-2
,424
,883
-2,1
96,5
50-2
,166
,106
-2,4
84,8
43
Una
lloca
ted
fund
s –
reso
urce
--
--
-41
,467
--
Res
ou
rce
AM
E
Tolle
d C
ross
ings
--
--
--
--
Hig
hway
s A
genc
y39
0,78
4-5
,461
,615
9,51
6-
--
--
S: H
ighw
ays
Eng
land
(net
)-
--
2,72
1-2
006,
000
6,00
06,
000
Net
wor
k R
ail
--
-22,
681
--
--
-
T: N
etw
ork
Rai
l (ne
t)-
--
5,38
7,30
96,
079,
500
8,30
1,57
56,
804,
729
8,23
7,85
8
U: F
undi
ng o
f Oth
er A
LBs
(net
)-3
,894
-30
180
56,4
8153
,200
80,2
9082
,090
82,0
90
V: O
ther
Rai
lway
s20
6,57
126
9,35
719
3,38
325
1,27
831
4,70
018
9,28
627
6,64
227
3,84
6
GLA
tran
spor
t gra
nts
84-8
-10
--
--
-
W: A
viat
ion,
Mar
itim
e, S
ecur
ity a
nd S
afet
y-
--2
,030
-3,7
57-3
,350
-20,
000
20,0
0020
,000
X: M
ariti
me
and
Coa
stgu
ard
Age
ncy
533
-2,1
68-3
90-2
,077
-94
1,00
01,
000
1,00
0
Y: M
otor
ing
Age
ncie
s3,
148
-26,
110
-5,9
65-4
,792
-2,2
96-2
,194
-2,4
51-2
,451
Z: C
entr
al A
dmin
istr
atio
n-6
,921
14,3
12-1
6,62
9-7
,260
15,5
0010
6,26
4-3
,282
-1
AB
: Fun
ding
of O
ther
ALB
s (n
et)
--1
,140
-418
,975
-236
--1
,364
-150
-150
Annual Report and Accounts 2016-17232

Tota
l dep
artm
enta
l sp
end
ing
, 201
2-13
to
201
9-20
(con
tinue
d)£’
000
2012
-13
2013
-14
2014
-15
2015
-16
2016
-17
2017
-18
2018
-19
2019
-20
O
UT
TU
RN
OU
TT
UR
NO
UT
TU
RN
OU
TT
UR
NO
UT
TU
RN
PL
AN
SP
LA
NS
PL
AN
S
Sup
port
for
Pas
seng
er R
ail S
ervi
ces
--
--
--
--
Tota
l Res
ou
rce
AM
E59
0,30
5-5
,207
,402
-263
,601
5,67
9,66
86,
457,
100
8,66
0,85
77,
184,
578
8,61
8,19
2
Of w
hich
:
Sta
ff co
sts
--
-322
1,24
2,34
91,
226,
107
1,37
7,05
21,
169,
072
1,27
8,18
3
Pur
chas
e of
goo
ds a
nd s
ervi
ces
72-7
,108
-1,9
191,
565,
692
1,81
7,88
62,
170,
115
2,02
8,03
92,
119,
057
Cur
rent
gra
nts
to lo
cal g
over
nmen
t (ne
t)-
--
-445
,365
-463
,590
-425
,444
-398
,581
-482
,000
Ren
tals
--
--2
71,8
59-2
92,3
68-2
96,3
29-3
32,0
25-2
23,7
83
Dep
reci
atio
n131
0,46
3-5
,454
,084
3,27
54,
595,
335
4,67
7,38
96,
201,
388
7,18
6,03
77,
442,
487
Take
up
of p
rovi
sion
s6,
404
88,3
24-4
2,29
42,
011
198,
227
102,
550
118,
820
118,
820
Rel
ease
of p
rovi
sion
-29,
340
-44,
096
-42,
656
-40,
719
-65,
820
-29,
461
-48,
330
-45,
326
Cha
nge
in p
ensi
on s
chem
e lia
bilit
ies
--
23,1
7258
,858
94,5
4918
3,19
018
2,59
018
2,59
0
Unw
indi
ng o
f the
dis
coun
t rat
e on
pen
sion
sc
hem
e lia
bilit
ies
--
--
44,9
9950
,000
650,
425
690,
350
Oth
er re
sour
ce30
2,70
620
9,56
2-2
02,8
57-1
,026
,634
-780
,419
-672
,204
-3,3
71,4
69-2
,462
,186
Tota
l Res
ou
rce
Bu
dg
et5,
781,
614
-505
,892
3,19
6,30
08,
749,
089
9,38
3,71
512
,250
,336
10,9
08,9
3611
,945
,057
Of w
hich
:
Dep
reci
atio
n11,
278,
183
-4,4
47,2
7999
5,04
35,
709,
984
6,01
9,69
67,
822,
769
8,82
0,23
59,
076,
685
Cap
ital
DE
L
A: T
olle
d C
ross
ings
-2,0
13-4
,533
-4,2
20-2
86,1
2796
875
0-
-
B: L
ocal
Aut
horit
y Tr
ansp
ort
1,34
9,71
51,
744,
410
1,96
2,25
71,
754,
268
1,55
0,79
31,
807,
559
1,82
2,28
01,
663,
926
Annual Report and Accounts 2016-17 233
Financial Statements

Tota
l dep
artm
enta
l sp
end
ing
, 201
2-13
to
201
9-20
(con
tinue
d)£’
000
2012
-13
2013
-14
2014
-15
2015
-16
2016
-17
2017
-18
2018
-19
2019
-20
O
UT
TU
RN
OU
TT
UR
NO
UT
TU
RN
OU
TT
UR
NO
UT
TU
RN
PL
AN
SP
LA
NS
PL
AN
S
Hig
hway
s A
genc
y96
7,88
21,
342,
347
1,85
9,54
1-
--
--
C: H
ighw
ays
Eng
land
(net
)11
,945
11,6
3011
,323
1,93
1,00
92,
020,
728
2,14
8,35
12,
601,
693
3,07
9,48
3
Net
wor
k R
ail
3,69
6,00
83,
408,
514
3,86
2,41
1-
--
--
D: F
undi
ng o
f Oth
er A
LBs
(net
)18
,907
13,9
3914
5,29
533
2,95
940
7,10
065
9,58
21,
627,
000
3,74
6,00
0
E: O
ther
rai
lway
s54
,587
147,
718
22,6
0265
,549
72,7
0015
0,97
620
,000
20,0
00
F: S
usta
inab
le T
rave
l20
4,90
328
3,46
027
4,76
329
5,24
121
2,45
511
0,50
042
,291
41,5
35
G: B
us S
ubsi
dies
& C
once
ssio
nary
Far
es-1
,047
15,1
103,
901
28,8
457,
134
11,6
29-
-
H: G
LA tr
ansp
ort g
rant
s35
2,00
030
1,00
030
,000
925,
000
943,
997
-97
6,00
099
3,00
0
I: C
ross
rail
1,20
5,00
01,
122,
776
1,08
2,20
079
9,97
4-2
00,0
00-
-95,
000
-25,
000
J: A
viat
ion,
Mar
itim
e, S
ecur
ity a
nd S
afet
y17
,145
23,8
6916
,160
7,19
018
,500
19,1
8313
,756
12,8
01
K: M
ariti
me
and
Coa
stgu
ard
Age
ncy
8,87
924
,049
7,90
210
,184
12,7
0914
,100
11,7
5012
,750
L: M
otor
ing
Age
ncie
s3,
927
-12,
705
-18,
979
-14,
946
-5,9
05-5
,926
991
9,53
1
M: S
cien
ce, r
esea
rch
and
supp
ort f
unct
ions
3,66
57,
563
3,22
619
929
,883
30,2
993,
816
3,88
1
N: C
entr
al A
dmin
istr
atio
n1,
446
3,39
21,
362
3,15
823
612
,554
615
795
O: S
uppo
rt fo
r P
asse
nger
Rai
l Ser
vice
s-
--
-45
1-
--
P: H
igh
Spe
ed T
wo
22,8
9010
6,82
618
0,88
310
2,53
634
0,70
01,
067,
543
1,24
0,00
01,
047,
000
Q: T
rans
port
Dev
elop
men
t Fun
d-
--
--
8,00
0-
-
R: F
undi
ng o
f Oth
er A
LBs
(net
)-
6,10
85,
653
5,55
66,
800
--
-
Annual Report and Accounts 2016-17234
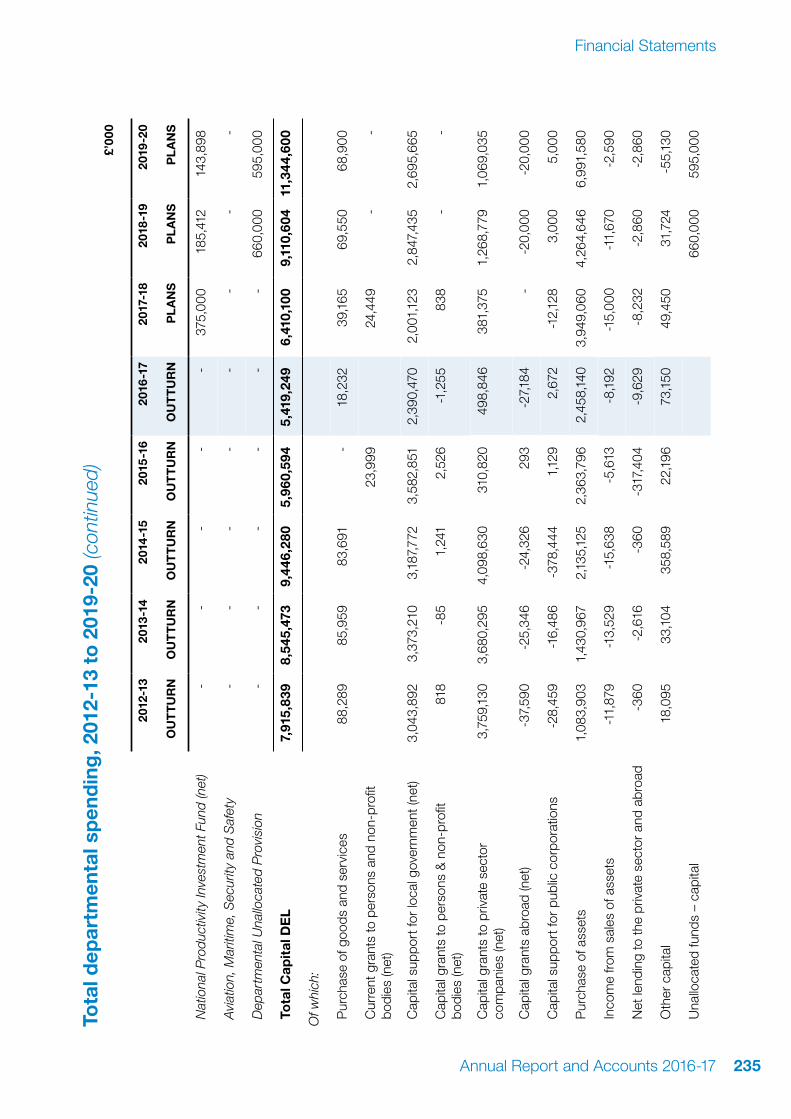
Tota
l dep
artm
enta
l sp
end
ing
, 201
2-13
to
201
9-20
(con
tinue
d)£’
000
2012
-13
2013
-14
2014
-15
2015
-16
2016
-17
2017
-18
2018
-19
2019
-20
O
UT
TU
RN
OU
TT
UR
NO
UT
TU
RN
OU
TT
UR
NO
UT
TU
RN
PL
AN
SP
LA
NS
PL
AN
S
Nat
iona
l Pro
duct
ivity
Inve
stm
ent F
und
(net
)-
--
--
375,
000
185,
412
143,
898
Avi
atio
n, M
ariti
me,
Sec
urity
and
Saf
ety
--
--
--
--
Dep
artm
enta
l Una
lloca
ted
Pro
visi
on-
--
--
-66
0,00
059
5,00
0
Tota
l Cap
ital
DE
L7,
915,
839
8,54
5,47
39,
446,
280
5,96
0,59
45,
419,
249
6,41
0,10
09,
110,
604
11,3
44,6
00
Of w
hich
:
Pur
chas
e of
goo
ds a
nd s
ervi
ces
88,2
8985
,959
83,6
91-
18,2
3239
,165
69,5
5068
,900
Cur
rent
gra
nts
to p
erso
ns a
nd n
on-p
rofit
bo
dies
(net
)23
,999
24,4
49-
-
Cap
ital s
uppo
rt fo
r lo
cal g
over
nmen
t (ne
t)3,
043,
892
3,37
3,21
03,
187,
772
3,58
2,85
12,
390,
470
2,00
1,12
32,
847,
435
2,69
5,66
5
Cap
ital g
rant
s to
per
sons
& n
on-p
rofit
bo
dies
(net
)81
8-8
51,
241
2,52
6-1
,255
838
--
Cap
ital g
rant
s to
priv
ate
sect
or
com
pani
es (n
et)
3,75
9,13
03,
680,
295
4,09
8,63
031
0,82
049
8,84
638
1,37
51,
268,
779
1,06
9,03
5
Cap
ital g
rant
s ab
road
(net
)-3
7,59
0-2
5,34
6-2
4,32
629
3-2
7,18
4-
-20,
000
-20,
000
Cap
ital s
uppo
rt fo
r pu
blic
cor
pora
tions
-28,
459
-16,
486
-378
,444
1,12
92,
672
-12,
128
3,00
05,
000
Pur
chas
e of
ass
ets
1,08
3,90
31,
430,
967
2,13
5,12
52,
363,
796
2,45
8,14
03,
949,
060
4,26
4,64
66,
991,
580
Inco
me
from
sal
es o
f ass
ets
-11,
879
-13,
529
-15,
638
-5,6
13-8
,192
-15,
000
-11,
670
-2,5
90
Net
lend
ing
to th
e pr
ivat
e se
ctor
and
abr
oad
-360
-2,6
16-3
60-3
17,4
04-9
,629
-8,2
32-2
,860
-2,8
60
Oth
er c
apita
l18
,095
33,1
0435
8,58
922
,196
73,1
5049
,450
31,7
24-5
5,13
0
Una
lloca
ted
fund
s –
capi
tal
660,
000
595,
000
Annual Report and Accounts 2016-17 235
Financial Statements
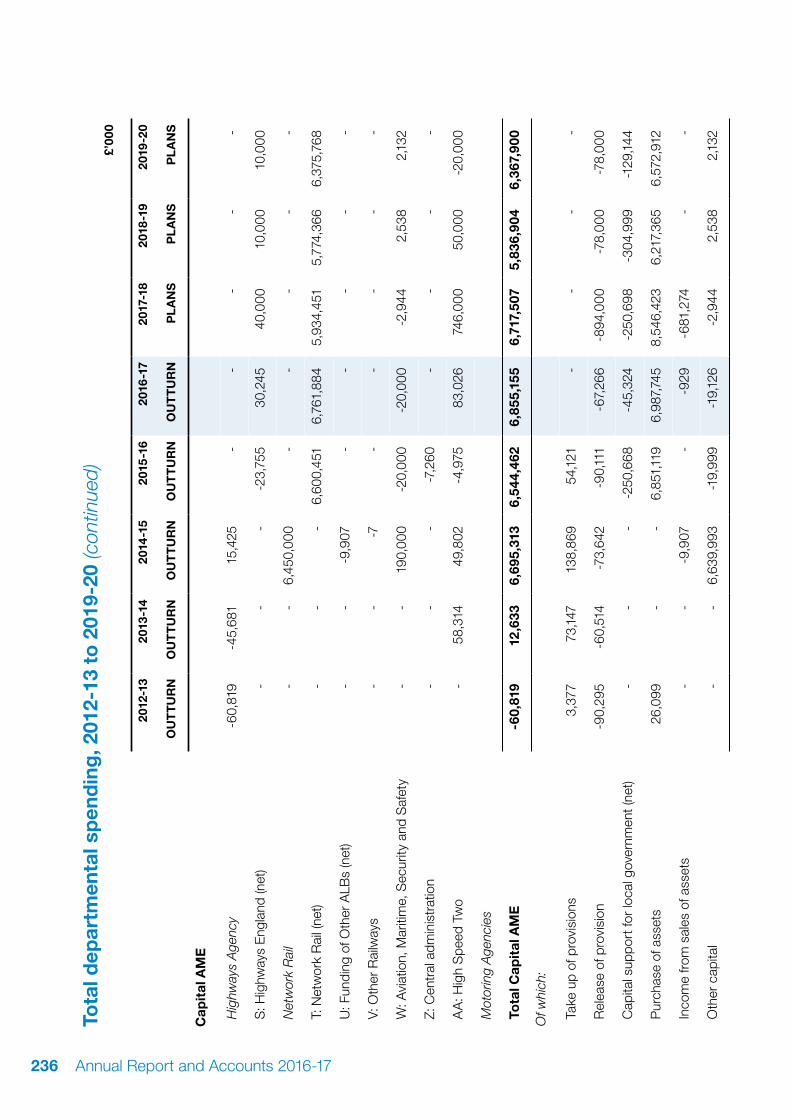
Tota
l dep
artm
enta
l sp
end
ing
, 201
2-13
to
201
9-20
(con
tinue
d)£’
000
2012
-13
2013
-14
2014
-15
2015
-16
2016
-17
2017
-18
2018
-19
2019
-20
O
UT
TU
RN
OU
TT
UR
NO
UT
TU
RN
OU
TT
UR
NO
UT
TU
RN
PL
AN
SP
LA
NS
PL
AN
S
Cap
ital
AM
E
Hig
hway
s A
genc
y-6
0,81
9-4
5,68
115
,425
--
--
-
S: H
ighw
ays
Eng
land
(net
)-
--
-23,
755
30,2
4540
,000
10,0
0010
,000
Net
wor
k R
ail
--
6,45
0,00
0-
--
--
T: N
etw
ork
Rai
l (ne
t)-
--
6,60
0,45
16,
761,
884
5,93
4,45
15,
774,
366
6,37
5,76
8
U: F
undi
ng o
f Oth
er A
LBs
(net
)-
--9
,907
--
--
-
V: O
ther
Rai
lway
s-
--7
--
--
-
W: A
viat
ion,
Mar
itim
e, S
ecur
ity a
nd S
afet
y-
-19
0,00
0-2
0,00
0-2
0,00
0-2
,944
2,53
82,
132
Z: C
entr
al a
dmin
istr
atio
n-
--
-7,2
60-
--
-
AA
: Hig
h S
peed
Tw
o-
58,3
1449
,802
-4,9
7583
,026
746,
000
50,0
00-2
0,00
0
Mot
orin
g A
genc
ies
Tota
l Cap
ital
AM
E-6
0,81
912
,633
6,69
5,31
36,
544,
462
6,85
5,15
56,
717,
507
5,83
6,90
46,
367,
900
Of w
hich
:
Take
up
of p
rovi
sion
s3,
377
73,1
4713
8,86
954
,121
--
--
Rel
ease
of p
rovi
sion
-90,
295
-60,
514
-73,
642
-90,
111
-67,
266
-894
,000
-78,
000
-78,
000
Cap
ital s
uppo
rt fo
r lo
cal g
over
nmen
t (ne
t)-
--
-250
,668
-45,
324
-250
,698
-304
,999
-129
,144
Pur
chas
e of
ass
ets
26,0
99-
-6,
851,
119
6,98
7,74
58,
546,
423
6,21
7,36
56,
572,
912
Inco
me
from
sal
es o
f ass
ets
--
-9,9
07-
-929
-681
,274
--
Oth
er c
apita
l-
-6,
639,
993
-19,
999
-19,
126
-2,9
442,
538
2,13
2
Annual Report and Accounts 2016-17236

Tota
l dep
artm
enta
l sp
end
ing
, 201
2-13
to
201
9-20
(con
tinue
d)£’
000
2012
-13
2013
-14
2014
-15
2015
-16
2016
-17
2017
-18
2018
-19
2019
-20
O
UT
TU
RN
OU
TT
UR
NO
UT
TU
RN
OU
TT
UR
NO
UT
TU
RN
PL
AN
SP
LA
NS
PL
AN
S
Tota
l Cap
ital
Bu
dg
et7,
855,
020
8,55
8,10
616
,141
,593
12,5
05,0
5512
,274
,404
13,1
27,6
0714
,947
,508
17,7
12,5
00
To
tal d
epar
tmen
tal s
pen
din
g3
12,3
58,4
5112
,499
,493
18,3
42,8
5015
,544
,160
15,6
38,4
2317
,555
,174
17,0
36,2
0920
,580
,872
Of w
hich
:
Tota
l DEL
12,1
39,4
2812
,240
,178
11,9
14,4
137,
915,
365
7,00
3,55
78,
378,
198
11,2
00,7
6413
,037
,267
Tota
l AM
E21
9,02
325
9,31
56,
428,
437
7,62
8,79
58,
634,
866
9,17
6,97
65,
835,
445
7,54
3,60
5
1 In
clud
es im
pairm
ents
.2
Pen
sion
sch
emes
rep
ort u
nder
FR
S 1
7 ac
coun
ting
requ
irem
ents
. The
se fi
gure
s th
eref
ore
incl
ude
cash
pay
men
ts m
ade
and
cont
ribut
ions
rec
eive
d, a
s w
ell a
s ce
rtai
n no
n-ca
sh it
ems.
3 To
tal d
epar
tmen
tal s
pend
ing
is th
e su
m o
f the
res
ourc
e bu
dget
and
the
capi
tal b
udge
t les
s de
prec
iatio
n. S
imila
rly, t
otal
DE
L is
the
sum
of t
he r
esou
rce
budg
et D
EL
and
capi
tal b
udge
t DE
L le
ss d
epre
ciat
ion
in D
EL,
and
tota
l AM
E is
the
sum
of r
esou
rce
budg
et A
ME
and
cap
ital b
udge
t AM
E le
ss d
epre
ciat
ion
in A
ME.
4 Fi
gure
s fo
r 20
12-1
3 to
201
4-15
(DE
L) in
clud
e P
rior
Year
Adj
ustm
ents
to r
eflec
t cor
rect
ed tr
eatm
ent o
f loa
ns a
nd r
epay
men
ts fo
r M
6 an
d S
ever
n cr
ossi
ng.
5 Fi
gure
s fo
r 20
15-1
6 ha
ve b
een
com
plet
ed in
line
with
con
solid
ated
bud
getin
g gu
idan
ce 2
015-
16 (i
nclu
ding
Res
earc
h an
d D
evel
opm
ent).
6 Fi
gure
s fo
r 201
1-12
to 2
014-
15 a
nd 2
016
to 2
019-
20 (D
EL) i
nclu
de n
ew tr
eatm
ent f
or R
esea
rch
and
Dev
elop
men
t exp
endi
ture
as
per S
pend
ing
Rev
iew
201
5.7
Figu
res
for
2013
-14
and
2014
-15
(AM
E) i
nclu
de P
rior
Year
Adj
ustm
ents
to r
eflec
t cor
rect
ed tr
eatm
ent o
f im
pairm
ents
.8
Cor
e ta
bles
do
not i
nclu
de V
oted
Non
-bud
get i
tem
s su
ch a
s pr
ior
perio
d ad
just
men
ts.
Annual Report and Accounts 2016-17 237
Financial Statements

Ad
min
istr
atio
n b
udg
et, 2
012-
13 t
o 2
019-
20£’
000
2012
-13
2013
-14
2014
-15
2015
-16
2016
-17
2017
-18
2018
-19
2019
-20
O
UT
TU
RN
OU
TT
UR
NO
UT
TU
RN
OU
TT
UR
NO
UT
TU
RN
PL
AN
SP
LA
NS
PL
AN
S
Res
ou
rce
DE
L
Hig
hway
s A
genc
y63
,643
63,2
4368
,855
--
--
-
C: H
ighw
ays
Eng
land
(net
)-
--
55,9
5547
,983
48,6
9748
,698
48,6
98
D: F
undi
ng o
f Oth
er A
LBs
(net
)11
,622
11,2
7111
,069
3,62
73,
300
4,91
88,
961
9,37
7
K: M
ariti
me
and
Coa
stgu
ard
Age
ncy
8,48
67,
937
7,50
46,
711
7,20
78,
000
8,11
48,
214
L: M
otor
ing
Age
ncie
s1,
213
--
--
--
-
N: C
entr
al A
dmin
istr
atio
n15
7,96
715
1,27
317
6,96
819
7,58
419
3,67
119
9,75
319
2,34
218
8,59
3
S: F
undi
ng o
f Oth
er A
LBs
(net
)-
6,35
96,
980
3,20
86,
653
6,63
26,
885
7,11
8
Tota
l ad
min
istr
atio
n b
ud
get
242,
931
240,
083
271,
376
267,
085
258,
814
268,
000
265,
000
262,
000
Of w
hich
:
Sta
ff co
sts
140,
221
142,
132
142,
474
140,
914
151,
653
170,
321
162,
502
160,
625
Pur
chas
e of
goo
ds a
nd s
ervi
ces
92,4
5598
,255
125,
689
118,
990
103,
511
93,6
9470
,260
77,1
84
Inco
me
from
sal
es o
f goo
ds a
nd s
ervi
ces
-17,
251
-12,
655
-16,
411
-8,6
56-9
,701
-7,9
20-7
,226
-7,2
83
Sub
sidi
es to
priv
ate
sect
or c
ompa
nies
--
--2
0-
--
-
Sub
sidi
es to
pub
lic c
orpo
ratio
ns-
-3,
532
--
--
-
Ren
tals
9,63
57,
897
7,74
66,
971
7,11
77,
396
5,68
449
4
Dep
reci
atio
n8,
653
5,36
64,
377
4,97
54,
109
7,00
07,
000
7,00
0
Cha
nge
in p
ensi
on s
chem
e lia
bilit
ies
--1
,207
--
--
--
Oth
er re
sour
ce9,
218
295
3,96
93,
911
2,12
5-2
,491
26,7
8023
,980
Annual Report and Accounts 2016-17238
