annual report and accounts 2016 bringing people together · do at national express. ... helping...
TRANSCRIPT

Bringing people togetherAnnual Report and Accounts 2016

Unless otherwise stated, all operating profit, margin and EPS data refer to normalised results, which can be found on the face of the Group Income Statement in the first column. Normalised profit is defined as being the IFRS result excluding intangible asset amortisation and tax relief thereon. The Board believes that the normalised result gives a better indication of the underlying performance of the Group, by adding back this non-cash item, and it also allows better comparison of divisional performance which have different levels of intangible amortisation.
In addition, unless otherwise stated, all pre-tax results and margin data refer to the Group’s continuing operations. Further details of discontinued operations can be found in note 11 to the Financial Statements.
Constant currency basis compares the current year’s results with the prior year’s results translated at the current year’s exchange rates. The Board believes that this gives a better comparison of the underlying performance of the Group .
All definitions of alternative performance measures used throughout the Annual Report are included on page 214.
Our purpose
Our customers are at the heart of what we do at National Express. Whether they are fare paying passengers, transport authorities or school boards, the mission is the same: to relentlessly meet their expectations.
As a leading international transport company, we provide a crucial service by conveniently connecting people to jobs, education, shopping and leisure in an environmentally responsible way, through value fares.i See how we deliver on our purpose overleaf
Visit our Group website to read our latest news, access investor information and find out more about how we operate.
www.nationalexpressgroup.com

Delivering on our purpose
As we always make clear, our Vision and Values are focused on meeting the needs of our customers. Our Vision is to earn their lifetime loyalty. For our existing customers this means consistently delivering the services that they want at competitive prices they can afford. For new customers it means demonstrating to them that we will provide the service they want in a convenient way while offering good value for money.
We transported 921 million passengers in 2016
ENSURING CHILDREN GET TO SCHOOL ON TIMEA punctual bus service means children get behind their desks for the start of lessons
HELPING TOURISTS EXPLORE A NEW CITYBy bringing tourists to new destinations by rail or coach, or via our sightseeing services we help them discover new places
GETTING PEOPLE TO WORK EVERY DAYMany thousands of commuters use our buses and trains to get to and from their place of work

LETTING SOMEONE ELSE DO THE DRIVING ON A NIGHT OUTCustomers can enjoy a great night out with friends, safe in the knowledge that we will get them home later
HELPING FAMILIES GET TOGETHER ON CHRISTMAS DAYOur coaches run when other services are closed for Christmas, helping people to get together for the festive period
Spain and Morocco
North America
UK Bus
UK Coach Rail

2,103.7
1,753.8
1,715.8
2015
2016
2014
11.9
11.7
10.7
2015
2016
2014
12.28
11.33
10.30
2015
2016
2014
138.6
111.0
164.8
2015
2016
2014
10.4
10.9
10.4
2015
2016
2014
219.0
191.8
177.7
2015
2016
2014
Contents and highlights
Financial highlights
Group revenue (£m)
£2,103.7m
Dividend per share (p)
12.28p
Operating margin (%)
10.4%
ROCE (%)
11.9%
Free cash flow (£m)
£138.6m
Operating profit (£m)
£219.0m
Summary of results 2016
Normalised basis IFRS basis
2016 £m
2015 £m
2016 £m
2015 £m
Revenue 2,103.7 1,753.8 2,103.7 1,753.8
Operating profit 219.0 191.8 185.2 166.1
Profit before tax 170.1 148.4 136.3 122.7
Profit for the year 142.3 121.6 120.0 109.1
Basic earnings per share (pence) 27.3 23.4 23.0 20.9
Net debt 878.0 745.5 878.0 745.5
• Group revenue increased by 10.6% to £2.10 billion on a constant currency basis; up 20.0% on a reported basis (2015: £1.75bn)
• Group normalised operating profit up 4.8% to £219.0 million on a constant currency basis (2015: £191.8m)
• Group normalised profit before tax rose by 14.6% to £170.1 million (2015: £148.4m)
• Statutory Group profit after tax grew by 10.0% to £120.0 million (2015: £109.1m) with no exceptional items in either 2016 or 2015
• Year on year normalised EPS growth of 16.7% to 27.3 pence (2015: 23.4p)
• Net debt increased by £133 million to £878 million, reflecting £116 million spent on acquisitions and growth capital expenditure and the retranslation of debt
• Group ROCE increased to 11.9% (2015: 11.7%)
• Free cash flow of £138.6 million, £27.6 million ahead of last year (2015: £111.0m)
• Full year proposed dividend of 12.28 pence, up 8.4% year on year (2015: 11.33p)
Strategic Report1 Financial highlights2 National Express Group
at a glance4 Chairman’s letter 5 Investment case6 Group Chief Executive’s review14 The trends shaping our business16 Our business model and strategy 18 Our strategy at a glance 22 Resources, relationships
and responsibilities32 Key performance indicators 34 Risk and risk management 36 Principal risks and uncertainties 38 Group Finance Director’s review46 Spain and Morocco 49 North America52 UK Bus54 UK Coach56 Rail
Corporate Governance 58 Chairman’s introduction
to governance60 Leadership64 Board of Directors66 Effectiveness72 Nomination Committee Report75 Accountability76 Audit Committee Report82 Safety & Environment
Committee Report84 Relations with shareholders86 Directors’ Remuneration Report90 Annual Report on Remuneration106 Directors’ Remuneration Policy114 Directors’ Report119 Directors’ responsibilities statement
Financial Statements121 Independent Auditor’s Report130 Group Income Statement131 Group Statement of
Comprehensive Income 132 Group Balance Sheet133 Group Statement of Changes in Equity134 Group Statement of Cash Flows135 Notes to the Consolidated Accounts200 Company Balance Sheet201 Company Statement of Changes in Equity 202 Notes to the Company Accounts
Additional Information212 Shareholder Information213 Dividends and Financial Calendar214 Definitions and Supporting Information216 Five Year Summary217 Corporate Information
1Annual Report and Accounts 2016 / National Express Group PLC

Group revenue by end market
Operating profit by end market
Spain and Morocco 28%North America 42%UK Bus 14%UK Coach 13%Rail 3%
Spain and Morocco 36%North America 35%UK Bus 15%UK Coach 14%Rail –%
42%
28%
3%
13%
14%
National Express Group at a glance
The Group operates in the UK, Continental Europe, North Africa, North America and the Middle East and at the end of the year we employed over 45,000 people and operated over 29,000 vehicles. Passengers made a record 921 million journeys on our services in 2016. The National Express name first appeared on UK coaches in 1972, and the Company was listed on the London Stock Exchange in 1992.
A global transport portfolio with a growing customer base
Strategic Report
2 National Express Group PLC / Annual Report and Accounts 2016

Spain and Morocco: Bus and Coach
• ALSA
ALSA is the leading company in the Spanish road passenger transport sector, and was acquired by National Express in 2005.
With over 100 years’ experience, it operates long-distance, regional and urban bus and coach services across Spain and in Morocco.
Apart from its bus and coach services, the business also operates service areas and other transport-related businesses, such as fuel distribution.
Revenue
£597.3m2015: £502.2m
Operating profit
£84.7m2015: £71.5m
i Read more p46
North America: Bus
• Durham School Services
• Stock Transportation • Petermann • National Express Transit
Our business in North America has two areas of activity: student transportation and transit services.
We operate in 34 US states and four Canadian provinces.
The student transportation business operates through medium-term contracts awarded by local school boards to provide safe and reliable transport for students, and is the second largest private operator in North America.
Our transit business operates a number of transit and paratransit services across the USA.
Revenue
£877.2m2015: £683.2m
Operating profit
£84.0m2015: £66.8m
i Read more p49
UK: Bus
• National Express West Midlands
• National Express Coventry
• Xplore Dundee • Midland Metro
National Express is the market leader in the UK’s largest urban bus market outside of London. Services are operated from nine garages across the West Midlands.
We also run urban bus services in the cities of Coventry and Dundee.
In addition, we operate the Midland Metro light rail service between Birmingham and Wolverhampton.
Revenue
£286.8m2015: £286.4m
Operating profit
£35.5m2015: £37.5m
i Read more p52
UK: Coach
• National Express • Eurolines • The Kings Ferry• Clarkes of London
National Express is the largest operator of scheduled coach services in the UK. The business operates high frequency services linking more than 900 destinations across the country. We are the UK partner in the Eurolines network, which serves 450 destinations across Europe.
The Kings Ferry and Clarkes of London are also part of the UK Coach business and are both long-established providers of private hire and commuter coach travel services in London and the south of England.
Revenue
£282.8m2015: £281.2m
Operating profit
£33.3m2015: £32.3m
i Read more p54
Rail
• National Express Rail Germany
We operate the Rhine-Münster Express and the Rhine-Wupper-Bahn contracted rail services in Germany, and we have been awarded two further contracts to operate Rhine-Ruhr Express services, the first starting in June 2019 and the second in December 2020.
Until February 2017, we operated the c2c franchise, which serves London and South Essex. We completed the disposal of c2c to Trenitalia on 10th February 2017. The c2c franchise is shown within discontinued operations in the Financial Statements for 2016.
Revenue*
£61.3m2015: £2.4m
Operating profit*
£(1.5)m2015: £(0.1)m
*German rail onlyi Read more p56
3Annual Report and Accounts 2016 / National Express Group PLC

Dear fellow Shareholder
Chattanooga tragedyThe tragedy in Chattanooga, Tennessee in November shocked and saddened us all. The thoughts of everyone at National Express remain with the families and friends of those six children who so tragically lost their lives at such a young age, and the others who were injured.
The Executives’ response was swift and comprehensive. Dean Finch was in Chattanooga within 20 hours of hearing of the accident, and met by senior members of the North American division’s management team. He provided a detailed report to the Board within 48 hours, and this and the ongoing response has been discussed extensively at both the Safety & Environment Committee and the full Board. The Board is satisfied with the speed and depth of management’s response and we will learn any necessary lessons and implement any appropriate changes that the ongoing investigations identify.
Business performanceWhile this tragic accident will live long in our memory, I am pleased that in 2016 the Group’s performance has again been very strong. With revenue, profit and free cash flow all growing again, I believe we are seeing the benefits of the consistent delivery of and rigorous focus on our strategy.
It is very encouraging that we continue to combine both organic growth with secure significant acquisitions that deliver strong returns. I believe we have developed a particular strength across the Group in identifying new acquisition targets and integrating them to deliver excellent services and efficiencies, especially through synergies.
We have also recently completed the sale of c2c to Trenitalia. The Board considered this sale very carefully and judged both the offer from Trenitalia and the new investment opportunities
presented by the income it would generate as representing the best value for shareholders.
DividendIt is because of the continued strength of our performance, especially with free cash flow again beating our target, and our positive outlook, that the Board has recommended a 10% increase in the final dividend, bringing the full year dividend to 12.28 pence. Subject to approval by shareholders, this will be paid on 19 May 2017 to shareholders on the register on 28 April 2017.
BoardMatthew Ashley will be moving to become the President and Chief Executive officer of our North American division, following David Duke’s long-planned retirement. I am delighted that we are able to draw on existing senior management and enhance Matthew’s experience within National Express. Equally, it is very pleasing that David has agreed to remain as a senior counsel to Matthew, retaining his experience and nationwide connections in an advisory capacity. Matthew will move to North America after the AGM in May, and take over fully from David in September. Matthew will remain a member of the PLC Board.
I am pleased to welcome Chris Davies, who will replace Matthew as Group Finance Director. Chris will join National Express in early May and join the Board after the 2017 AGM. Chris joins us from Inchcape plc, where he has been Group Financial Controller and Treasurer since 2013, and brings significant international financial experience.
I look forward to continuing to work with Matthew and welcome Chris to National Express. I should also like to again thank David Duke – and also our Managing Director, Rail, Andrew Chivers, who retired at the end of 2016 after 16 years with us – for their significant contributions to National Express and wish them all the best for the future.
Sir John Armitt CBEChairman 23 February 2017
Governance highlights
• Strong governance is a foundation stone for a healthy corporate culture of values, attitudes and behaviours demonstrated by a company, not only within its operations but also in its relations with its stakeholders and the wider community and environment affected by a company’s conduct
• The way we live and breathe our culture can be seen by how our Values are becoming increasingly embedded across our businesses and how they underpin our business model and strategy of delivering long-term shareholder value
i Read more p58
A clear, constant strategy
Chairman’s letter
Sir John Armitt CBEChairman
Strategic Report
4 National Express Group PLC / Annual Report and Accounts 2016

Spain and MoroccoOperating profit by end market
36% North America 35% UK Bus 15% UK Coach 14% Rail –%
Bus 23% School Bus/Transit 42% Coach 32% Rail 3%
Modal split by revenue
1. A best in class public transport operator*Spain & Morocco North America UK Bus UK Coach Rail Group
Operating margin 14.2% 9.6% 12.4% 11.8% N/A 10.4%
Best in class NX NX 14% NX 3-5% NX
* By margin.
2. A sound strategy in place with four strategic pillarsDelivering operational excellence• Best in class Group margin of 10.4%• Revenue growth of 10.6% at constant currency• £6.8 billion of long-term contracted or concessionary revenues• Sustainable long-term earnings generating £120 million of
free cash flow a year• Awarded the British Safety Council Sword of Honour and
five-star ratings in all of our UK businesses
Deployment of technology• Highly sophisticated, real-time revenue management
systems rolled out in our UK and Spanish coach businesses, helping to drive revenue, profit and incremental demand
• Mobile ticketing in UK Bus, contactless payment on Midland Metro and being enabled in UK Bus in 2017, providing customers with more payment options and helping to reduce journey times
• Launching of new mobile websites and apps, providing enhanced information for our customers and driving more sales online
• UK Coach launched VUER – the UK’s first coach ‘infotainment’ system providing free news and entertainment content for our customers
• Lytx DriveCam fully installed in UK Coach and being rolled out in our UK Bus, ALSA and North American business
Growing our business through acquisitions• Strong free cash flow generation funding growth through
acquisitions • 11 bolt-on acquisitions in the year, including:
– eight in North America in the school bus and transit markets – two in ALSA: a regional bus operator providing first time entry into Ibiza and a transport operator in Switzerland in the lucrative ski and alpine tourist market – one in UK Coach, expanding our private hire and commuter operations
Growing through diversification into complementary markets• Submitted a bid to operate the Casablanca Tramway• Submitted a bid to operate bus services in Singapore• Exploring opportunities in other new markets
A well balanced portfolio
4. Stable long-term finance in place and commitment to investment grade rating
Strong debt maturity profile
0
100
200
300
400
500
600
(RCF) Drawn£m
412
78
400
225
1133416116
Bond
2017 2018 2019 2020 2021 2022 2023
Gearing ratios 2016 2015 Covenant
Net debt/EBITDA 2.5x 2.5x < 3.5xNet interest cover 7.0x 6.6x > 3.5xRatings Grade OutlookMoody’s Baa3 StableFitch BBB- Stable
5. Dividend policy: minimum cover of 2x Group earnings
2016 2015
Basic EPS 27.3 23.4Dividend 12.28 11.33
A sound investment case
Investment case
5Annual Report and Accounts 2016 / National Express Group PLC

Tragic accident in Chattanooga, TennesseeThe tragic accident in Chattanooga, Tennessee on 21 November 2016, when six children lost their lives and others were seriously injured in a crash on one of our school buses, has left six families grieving and a community in shock. It has had a profound impact on us all at National Express and we are deeply sorry that such a horrific accident should happen to children aboard one of our vehicles.
The North American management team, working closely with the local school board and community groups, swiftly offered appropriate support to the families affected. We have also offered our full co-operation to the investigations being led by the regulatory authorities that always follow an accident such as this. Without prejudicing the outcomes of these investigations we have accelerated programmes that were previously being piloted in our North American division as part of our long-standing determination to deliver industry-leading safety performance: an industry first, Lytx DriveCam, will be installed on our North American vehicles by the end of 2019; and a cloud-based portal recording communication between us and school administrators will be available for every location before the end of 2017.
None of us at National Express will ever forget the terrible accident and tragic impact on the friends and families of those children who lost their lives or were injured. But it only reinforces – if any reinforcement was ever needed – why safety will remain my priority as Chief Executive, as I have consistently made clear in previous statements and at our Annual General Meetings. While we have of course pledged to learn any necessary lessons from the investigations, I have also commissioned our independent safety consultant, Arthur D Little, to identify best practice in driver recruitment, training and assessment and review our procedures in all divisions to identify what further progress we can make to be consistently industry-leading. It will report back by the middle of the year.
A strategy fit for the future
Group Chief Executive’s review
Our strategy
i Read more p19i Read more p18
1. Delivering operational excellenceWe aim to lead the market in delivering excellence, which will raise standards and also drive revenue growth, margin progression and cash generation.
2. Deployment of technologyInvesting in technology to raise customer and safety standards and drive efficiencies throughout our business, generating sales, margin and cash.
Dean FinchGroup Chief Executive
Strategic Report
6 National Express Group PLC / Annual Report and Accounts 2016

IntroductionFinancially, National Express delivered strong growth in 2016, with revenue, profit and cash all growing significantly. Indeed, National Express delivered a record statutory profit of £120 million – itself a doubling in the last two years – has grown earnings per share by nearly 17% and increased return on capital employed by 20 basis points to 11.9%. This strong performance, coupled with the removal of our c2c franchise commitments, means we are both raising our guidance for future free cash flow to £120 million and proposing a 10% increase in the final dividend.
We believe our diversified international businesses and clear strategy have provided us with strong momentum and will continue to deliver growth in 2017 and 2018. We enter 2017 with some positive tailwinds that, combined with proactive management action, are both providing confidence for the future and helping us mitigate our identified challenges. Firstly, after last year’s highly successful bond placement we have the benefit of reduced interest costs of £9 million every year. In 2017, we will also see lower fuel costs of around £6 million, and in 2018 these savings will grow to around £20 million. Secondly, our recent acquisitions are all performing well, have all been earnings accretive within the first 12 months and will continue to generate growth in 2017 and beyond. Our acquisitions made in North America during 2015, for example, continue to deliver returns of around 15-20%. Indeed, combined with our continued focus on rigorous cash flow management and operational excellence, and the receipts from the sale of c2c, we have an expanding portfolio of opportunities for further growth and expansion that we are confident will underpin growth not just in 2017 and 2018, but also beyond.
Our strategy therefore remains: • A focus on operational excellence, including tight cost
control, rigorous cash flow management and the disciplined allocation of capital to maximise returns.
• Investment in technology to drive customer-focused innovation and excellence, improved safety performance and greater cost efficiency.
i Read more p20 i Read more p21
3. Growing our business through acquisitions
We continue to look to grow our unique portfolio of international bus, coach and rail businesses through selective bolt-on acquisitions.
4. Diversification into complementary markets
We continue to look at opportunities to diversify into new markets that are complementary to our existing businesses and are fast growing, urbanising and seeing liberalisation.
• Growth through targeted acquisitions, primarily bolt-on opportunities in North America and strategic targets in Spain, and prudent expansion into new international markets.
Before expanding on these areas in more detail, I would like to turn to each of our divisions to pick out their highlights and how they are equipped to prosper in the future.
Divisional highlightsNorth AmericaNorth America has had another strong year financially, with revenue growing by 14.3% and profit by 11.9%, both in constant currency. Despite a slight decline caused by the growing transit business, our margins remain industry-leading at 9.6% (2015: 9.8%). Since 2009 North American profits have increased by 188%. This performance reflects our success in tight cost control and organic growth, as well as the benefits of our acquisition strategy. In the last bid season we achieved a price increase of 7.0% on contracts up for renewal, translating into a 3.7% average price increase across the whole portfolio. The early signs this bid season suggest there are similar price increases coming through, which will help offset the continuing pressure on driver wages. We also added more buses, net, through new or expanded existing contracts against those lost through regretted contract exit and enjoyed our best ever school start-up, including proactive driver recruitment in what remains a tight labour market.
Our 2015 acquisitions made returns of around 15-20% in 2016. In 2016, we made a further eight acquisitions and we have a strong pipeline of further opportunities identified. The North America school bus market remains highly fragmented with around 1,000 operators. We are currently the only active major buyer in the market and have built a strong team who have made 20 acquisitions over the last five years, adding $450 million of annual revenue. We believe there continues to be plenty of scope for further expansion through the acquisition of operators near our existing sites where our service excellence and synergies offer the opportunity for significant returns and growth.
7Annual Report and Accounts 2016 / National Express Group PLC

Moroccan business has now grown both revenue and passengers by over 70% since 2012, and we have recently submitted a bid to operate the Casablanca Tramway. We have complemented our Ibiza regional bus and Herranz acquisitions with another in Switzerland. This Swiss acquisition is in the potentially lucrative ski tourism market and is based in Geneva, where ALSA has existing coach operations, providing immediate synergy benefits and the opportunity to utilise spare coaches to meet demand. This acquisition also provides a platform for potential further expansion in complementary markets. We have added another new contract to our Imserso success in 2015, with a ten year concession to operate services at Granada Airport. As in North America, with the additional proceeds provided by the sale of c2c, we will also target, in a disciplined manner, further acquisitions.
RailWe completed the sale of our c2c franchise to Trenitalia on 10 February 2017, receiving £108 million through a consideration of £72.6 million, and the settlement of £35 million of inter-company loans. National Express is very proud of its record on c2c, turning it into consistently the best performing railway in the UK. We hand over c2c with a record number of passengers; holding both the period and annual punctuality records; securing its highest customer satisfaction scores for three years; and leading the industry on customer service standards, such as with automatic delay repay.
The current UK rail market is, however, one that we believe is not as attractive as our other growth opportunities. By securing the proceeds from c2c’s sale and using them to pay down debt while assessing where to best invest in our fastest growing markets, I firmly believe we have a real opportunity to generate significant shareholder value. Further, despite significant organic growth on c2c, the commitments to substantial investment in fleet and property and a growing premium were emerging as a risk. The slowdown in UK rail passenger growth is likely to present significant challenges to many operators with very high premium obligations. By moving swiftly and firmly, we have both removed this risk and replaced it with the opportunity for further targeted investment.
We still remain fully committed to German rail. In our first full year of operation on the Rhine-Münster Express (‘RME’), we carried over 20 million passengers and delivered an improved operational performance compared with our predecessor. We have begun the mobilisation for the first of our Rhine-Ruhr Express (RRX) contracts in June 2019. Now that we have an established operational base in Germany we are consolidating our presence, securing cost benefits. We will submit further German rail bids this year and also see it as an emerging opportunity for entry into other, complementary markets nearby. As our decision to inform the local Bavarian authority that due to delay in its award we were not able to proceed with the Nuremberg S-Bahn contract demonstrates, we maintain a disciplined approach to bidding. While not ruling out further UK rail bids our immediate focus will be in these markets.
Group Chief Executive’s review continued
Our operations team in Khourigba – the newest city in Morocco to be served by ALSA
These are good businesses in markets we already know well. Following the successful sale of c2c, the Group now has the opportunity to allocate more capital to our North American acquisition strategy. We will, however, continue to do this in a disciplined manner and seek similar returns to those already achieved.
Spain and MoroccoOur Spanish and Moroccan division, ALSA, has again carried a record number of passengers and continues to deliver an industry-leading margin of 14.2% (2015: 14.2%). When coupled with the success of our more sophisticated active real-time revenue management system (‘RMS’), the continued strong growth in Morocco and the benefit of recent acquisitions such as Herranz and new contracts such as ‘Imserso’, this all drove revenue up by 5.7% and grew profit by 5.3%, both in constant currency.
These results also demonstrate that we are entering the concession renewal process in Spain performing well. ALSA has industry-leading credentials and has been pioneering initiatives, such as RMS, which have improved our ability to compete and protect our existing concessions. These credentials are even more important as the terms of retendering competitions have been recently altered to emphasise service quality and competitive yet sensible pricing that reduces the opportunity for speculative very low-cost bids. We have, so far, won both concessions we operate that have come up for renewal. Indeed, their strong performance post renewal, with good margins, means we are increasingly confident about our prospects. Even under a worst-case scenario, there will be no impact in 2017 and only up to a €3 million reduction in profit in 2018 on those contracts retendered in the next 12 months.
This potential profit impact must also be considered in its context, however. Firstly, it is important to note that in 2018 we expect a year on year fuel cost saving of over €11 million in ALSA alone. Secondly, we are actively growing other parts of the ALSA division and diversifying our operations. Our
Strategic Report
8 National Express Group PLC / Annual Report and Accounts 2016

UK CoachUK Coach has again grown in 2016, delivering a revenue increase of 0.6%, profit up over 3% and an industry-leading margin of 11.8% (2015: 11.5%). 2016 saw UK Coach further establish itself as the fair-priced alternative to rail, with high profile successes. We carried around an additional 25,000 customers on affected routes during the strikes on Southern Rail and achieved record-breaking days over the Christmas period where we both carried our highest ever number of passengers in a day and had two days where we took over £1 million in revenue.
Underpinning this success has been National Express Coach’s determination to be at the forefront of new technology adoption within the sector. Our recently installed more sophisticated active real-time RMS has, for example, helped us respond quickly and in a more targeted manner to competition. Following a successful first quarter, quarters two and three were much more challenging. Through action taken on targeted routes during the third quarter, we were able to reduce our prices to generate sufficient passenger growth that delivered an overall increase in both revenue and seat utilisation rates by the end of the year. This trend has continued into 2017, with improved seat utilisation rates. This action has helped increase revenue in our core coach business by 1.9% and passenger numbers by around 2% despite the UK Bus and Coach sector experiencing challenging market conditions and provides us with confidence for the future as we compete with both rail and other operators.
We have also augmented this organic growth in our core network with strategic expansion through acquisition in our Kings Ferry operation. Our acquisition of Clarkes of London, in December 2016, provides the opportunity to deliver expanded commuter services into London while securing synergies with our existing operations and expand into the in-bound tourism market in which Clarkes has a substantial presence.
UK BusAcross the country the UK Bus industry is experiencing a particularly challenging period. The combination of urban congestion and changing travel patterns is affecting revenue and profit. Across the year the bus division increased commercial revenue by 2%, but this was offset by the expected decline in concessionary income, to deliver overall revenue growth of only 0.1%. Normalised operating profit declined by 5.3%, with margins down to 12.4% (2015: 13.1%).
Within this overall picture, there have been some success stories. Our Platinum services – combining state-of-the-art vehicles with bus priority measures installed by the local authority – have grown patronage by nearly 4% on their routes. Solihull Council’s investment in bus prioritisation on Lode Lane has, for example, made our 17,000 morning peak commuters’ journeys eight minutes faster and helped drive 5% growth on the services using this route. We are also working through our industry-leading Bus Alliance to rapidly establish and implement
a West Midlands-wide congestion action plan that draws on examples such as this and targets the key pinch points impacting the most significant number of passengers, thereby providing the greatest opportunity for overall improvement.
We are implementing a plan to boost passenger numbers, drawing on the early positive evidence from recent targeted fare reductions. We have extended these reductions to deeply discounted tickets in Sandwell and Dudley, supported by significant marketing activity, to encourage more trips among existing users and attract non-users as part of a granular approach to pricing that better reflects the local markets we are serving. If the pilot is successful we will roll this new approach out across the business.
We are complementing this new pricing with investment in technology such as the roll-out of new ticket machines this year to provide the largest network of contactless payment in public transport outside of London. This will simplify ticket purchasing and provide the opportunity to reassure customers through fare capping guarantees. Our tram services have pioneered this technology and already nearly 20% of on-board tickets are contactless purchases. We are also reviewing costs, including opportunities for further timetable efficiencies. And shortly we will roll out a new combined app which will bring together journey planning, real-time information, and m-ticketing in one place.
So while there are industry-wide concerns, we are actively pursuing a plan to address the particular challenges and capitalise on our unique opportunities in the West Midlands and Dundee.
Solihull Council’s investment in bus prioritisation at Lode Lane made the journey of our local commuters eight minutes faster and helped drive 25% growth on service using the route
9Annual Report and Accounts 2016 / National Express Group PLC

Group Chief Executive’s review continued
annual survey; UK Bus has been named Bus Operator of the Year at the National Transport Awards; c2c again has one of the highest customer satisfaction scores for reliability and punctuality in London and South East franchises in the National Rail Passenger Survey; in North America School Bus over 90% of customers say they would recommend us on the basis of our service, safety and value for the fifth consecutive year; and ALSA has won the prestigious 2016 IZO award for ‘Best Customer Experience in Transport’.
We have sought external recognition of our approach to excellence and are very pleased with the progress we have made in the last year. UK Coach has secured five-star European Foundation for Quality Management (‘EFQM’) ratings, to join c2c on the top mark. UK Bus and ALSA – currently holding a four-star rating – are working hard to join them shortly. In North America we won a Bronze Illinois Performance Excellence Recognition Program (‘ILPEx’) award for the second year in a row, increasing our score by 50% in the process. 2016 again saw us secure a record number of external awards across the Group.
We have also secured some very important safety awards in the year. All of our UK businesses secured both five-star scores and a Sword of Honour from the British Safety Council. This is a significant achievement and one I am particularly pleased with. We also won a prestigious Prince Michael International Road Safety Award for our Driving Out Harm programme, especially as it has applied to our Moroccan operations.
But there is always more that we can do. To ensure we are always striving for excellence and greater efficiency I launched the ‘Delivering Excellence’ team in late 2016 to identify examples of best practice both within and outside our Group and apply them to our companies. This team is led by a senior member of the Group Executive but drawn from talented individuals within our businesses, to also develop the skills and experience of future managers and leaders. The team’s first project is an assessment of our driver training, recruitment and workforce planning, to learn from the best and deliver improvements where necessary to embed excellence.
This recognition for excellence has helped unlock new contracts and our continued focus on it has helped drive organic growth across our business. We have seen further contract wins in the year. Highlights include: a ten-year contract to operate services to Granada Airport; a six-year contract to operate sight-seeing services in Marrakech; a joint contract between UK Bus and Coach to operate staff bussing to Amazon sites; a contract to provide the coaching services to UEFA officials for the 2017 Champions League Final; and, as well as the new school bus contracts secured in North America during the bidding season, our recent Ecolane acquisition secured new contracts and we had another successful year in Transit with annualised revenues growing by 60% to around $200 million, driven by three new contracts wins and bolt-on acquisitions, while maintaining a 100% customer retention rate.
In our first full year of operation on the Rhine Münster Express we carried over 20 million passengers
BahrainOur bus services in Bahrain continue to grow, with nearly 12 million passengers carried in 2016 – an increase of 85.7%. The GO Card smartcard was successfully introduced in 2016 and will be rolled out across the whole network in 2017. We continue to have positive discussions with the local Bahraini authority about the service and the opportunity for future expansion. Our successful introduction to the Bahraini market has also provided an important credential in our recent bid for a bus contract in Singapore.
Across the Group as a whole these results show the success of our existing strategy and why we believe it will continue to generate growing returns for our shareholders. I will now move on to describe the benefits of our strategy in more detail.
StrategyOperational excellenceFor a number of years I have consistently made the case that our success as a business is dependent upon us securing and maintaining a reputation for operational excellence. For our existing customers this means consistently delivering safe services that they want at competitive prices they can afford. For new customers it means demonstrating to them that our services will provide to them the service they want in a convenient way while offering good value for money. Both require a focus on cost efficiency to ensure we are delivering the best possible value fares. In 2016, we delivered a further £17 million of cost savings, a total of £131 million in savings in five years.
The Group carried a record 921 million passengers in 2016, with both c2c and ALSA setting new records for the second year running. We continue to deliver industry-leading customer service. UK Coach is again the most trusted ground transportation brand in the UK Institute of Customer Service’s
Strategic Report
10 National Express Group PLC / Annual Report and Accounts 2016

Our underlying business saw passenger numbers increase by 2.7% – with value fares helping generate growth – and 6.3% when acquisitions are included. Our ability to offer value fares is contingent on our excellence and our focus on cost efficiency. Our choice is stark: we either pass cost efficiency on to a growing number of passengers or cost inefficiency on to fewer passengers. That is why I am delighted with the example of UK Coach reacting so swiftly to challenging market conditions with lower fares to increase passenger numbers sufficiently to generate an overall revenue increase, as well as its record-breaking Christmas. On our Platinum bus routes in the West Midlands, we saw passenger numbers increase by nearly 4% in 2016. In c2c in 2016, new products recently introduced saw significant growth: online advance sales increased by 71% and Senior Rover sales increased by 50%. We have also focused on improving our Spanish marketing with, for example, 2016’s Christmas Campaign delivering a 12% increase in revenue driven by an 11% increase in passengers.
When combined with the rigorous management of cash flow and a focus on returns, we see the benefits to shareholder value. 2016 again saw us beat our free cash flow target, with £139 million achieved against £111 million last year. Our return on capital employed also increased by 20 basis points to 11.9%. As already set out above, it is because of our determination to invest further in our fastest growing markets with the highest returns that we have sold c2c. And it is because of the liabilities we have removed with c2c’s sale and the confidence we have that our operational excellence will continue to deliver that we have increased our free cash flow target to £120 million.
Investment in technologyAs I signalled last year, this has been a strategic focus of the Group. If we are to continue to deliver operational excellence, attract new customers and compete effectively we need to continue to embrace the opportunities presented by new technology. I see technology as particularly crucial to three areas.
First, delivering excellence to our customers, where 2016 saw us make significant strides. c2c pioneered automatic delay repay for smartcard season ticket holders which has now set a new standard that the Department for Transport wants replicated in other franchises. c2c was also the first franchise to launch flexi-season tickets and has an industry-leading take-up of smartcard season tickets at 43% of season ticket users. As well as demonstrating our commitment to innovation, we can take the learnings from these products’ development and implementation into our other divisions despite c2c’s sale.
UK Coach has pioneered targeted digital marketing and has further enhanced its approach this year through more personalised and real-time marketing drawing on, for example, a customer’s location, their last travel destination and dynamic data such as weather forecasts and ours and competitors’ pricing. UK Coach is also developing its capability to target
The Midland Metro began running to Grand Central in May 2016 – the first time trams have run along the streets of Birmingham in over 60 years
social media messages and promotions for specific locations and events and will shortly be trialling location-specific SMS messaging in London. Both UK Bus and UK Coach are developing apps that bring together journey planning, real time information and m-ticketing, making sales easier to existing customers and removing barriers to potential new users.
UK Coach has also advanced the on-board experience with the roll-out of the VUER free entertainment system that allows passengers to access television programmes and magazines on their phones or tablets. The aim is to have this installed on all routes by the Summer of 2017 and has already seen higher customer satisfaction scores for those who have accessed the system. Following its success we are piloting VUER on some of our Platinum bus routes in the West Midlands, with a view to a wider roll-out if it is a success.
As well as using new technology to make it easier for current and new customers to pay for our services, we are using it to communicate with them in more sophisticated ways. We have grown our CRM databases, allowing targeted communication with customers: UK Coach, from a very strong position, by 13%; 23% in ALSA; significant growth in UK Bus; and, over 15% in c2c. We have also grown the amount of revenue we receive from digital sources significantly. From a very strong position, UK Coach has grown further, with two percent growth in digital revenue. Both UK Bus and c2c have doubled their digital revenue in the year and ALSA secured a 36% year on year increase in revenue from email marketing and 40 year on year growth in revenue from mobile and apps, in 2016.
11Annual Report and Accounts 2016 / National Express Group PLC

Group Chief Executive’s review continued
In North America we have introduced an app that helps parents track their child’s bus, providing both reassurance and practical help in meeting their son or daughter at the end of their trip. We also acquired Ecolane, a company providing sophisticated route scheduling technology. As well as a growth market – the business has added new contracts since joining National Express – this technology provides the opportunity to improve the efficiency of our operations across the Group as a whole, not just North America.
In Spain, we have launched the pioneering ‘ALSAcab’ ‘carpooling’ service that provides a door-to-door ‘first or final mile’ option after completing their longer journey on our buses or coaches. This is an interesting new avenue for us and one that we are again looking to learn Group-wide lessons from.
Across the Group we have a number of initiatives that are market-leading, setting new customer service standards and attracting new customers and revenue. In an increasingly competitive market – including from new entrants using technology in increasingly sophisticated ways – this is ever more important.
Second, technology is being used to help us improve our safety performance. Lytx DriveCam in particular is proving an invaluable tool to help improve driving performance and reduce the cost of accidents. The leading technology of its type on the market, its power lies both in the data analytics it generates and the videos it allows to be reviewed. It is therefore an important management tool that allows tailored and targeted training. It also provides evidence to deal with any claims made against our drivers in an accident. We have fully installed the technology within UK Coach last year (with the recently acquired Clarkes vehicles to be fitted this year), and have begun its roll-out across UK Bus, ALSA and North America. As well as proving popular with staff, the emerging evidence demonstrates that it is a cost saving measure with UK Coach’s pilot in one of our depots showing a 10% reduction in collision rate and annualised insurance costs coming down around 30%. Our early North American pilots have also demonstrated similar results.
Third, technology will also allow us to operate more efficiently. The benefits of our more sophisticated RMS are particularly relevant here. I have referred to UK Coach’s figures above; in ALSA, as well as increasing revenue for the corridors under RMS by 0.8%, seat occupancy was also boosted by 1.1%. Our acquisition of Ecolane will also allow us to continue to seek more efficiencies across the Group in scheduling and routing.
Acquisitions and new opportunitiesI have already explained above the importance and opportunity presented by new acquisitions. Our recent acquisitions have proven very successful. I believe that we have developed a real strength in identifying new acquisition targets, whether bolt-on to our existing operations or providing strategic new market entries. While remaining disciplined we believe we have a very strong pipeline of further opportunity, which when combined
with our strong cash flow and the proceeds from c2c’s sale, presents a significant opportunity for further value creation in the coming years.
North America has been, and will continue to be, the main focus of our activity. With sensible price increases apparent last year – and early signs they are continuing this year – a highly fragmented market with around 1,000 operators and a lack of competitors looking to acquire, we believe this remains a very attractive option. We have consistently delivered strong returns, with the average return of our 20 acquisitions over the last 5 years around 15-20%.
ALSA has also secured important acquisitions in the last year. In addition to our Ibiza regional bus and Herranz acquisitions we bought AlpyBus based in Geneva, Switzerland in December. This provides us with an entry in to both the ski tourism market as well as a base for possible further moves in to complementary markets nearby. The returns made by the Ibiza and Herranz acquisitions are above 20% and our ALSA team is currently exploring further opportunities that offer similar strategic and financial returns.
We will also continue to monitor the market for opportunities such as UK Coach’s acquisition of Clarkes of London. This acquisition provided the opportunity to expand our existing Kings Ferry commuter services into London in an efficient way as Clarkes serves a complementary local market that provides the scope for operational and management synergies. Importantly, it has also provided a strong entry in to the in-bound tourism market in which Clarkes has a substantial presence. We believe this is a growth market that complements Kings Ferry’s particular strengths.
We will also continue to look to grow our recent new market entries in Bahrain and Germany. We continue to have productive discussions with the local Bahraini authorities about the future shape of the network. We will also submit new contracts in Germany this year. In both, we are looking to complementary markets, as demonstrated by our recent bid submitted for a Singapore bus contract, where we are due to hear in the coming months whether we have been successful. We also continue to pursue other capital-light opportunities and, for example, submitted a bid for the Casablanca Tramway in December and are preparing for other bids in the coming months
Board changesIn January 2017 we announced that Matthew Ashley will become President and Chief Executive Officer for our North American business later this year, following David Duke’s decision to retire. Matthew has done an excellent job as Group Finance Director over the last two and a half years and taking on such a senior operational position is an excellent career development opportunity for him. I wish Matthew and his family, who will be moving to the US with him, all the best for their time there. Matthew will remain a member of the PLC Board.
Strategic Report
12 National Express Group PLC / Annual Report and Accounts 2016

Chris Davies will replace Matthew as Group Finance Director and join the PLC Board after the May AGM. Chris joins us after holding senior finance positions at Inchcape plc and Diageo plc and I look forward to working with him, and continuing to work with Matthew, in the coming years.
OutlookDuring 2017 we expect to continue to make good progress across the Group. We will continue with our strategy, with a focus on operational excellence driving a strong cash flow and returns and growing shareholder value. We will further enhance our service and customer offering through the investment in industry-leading technology, which we will also use to drive further safety improvements and cost efficiencies. And our focus on attracting the best and developing those with the highest potential will continue as we learn from fresh insight and spread best practice.
We have entered 2017 with good tailwinds, including the annualised saving of around £9 million secured through our recent bond refinancing and the full year benefit of the 11 acquisitions made in 2016. Coupled with the expected savings from fuel of around £6 million in 2017 and around £20 million in 2018, we will see significant reductions in our cost base in the coming years. We will remain focused on cash generation and have increased our annual target to £120 million, reflecting both the c2c liabilities removed with its sale and our confidence in our future performance.
We will continue to look for acquisitions. With the additional resources provided by the sale of c2c we will continue to be disciplined and only acquire opportunities that meet our strict returns criteria: our 2015 acquisitions are delivering returns of around 15-20%. This also applies to our other businesses, especially ALSA, where we believe there are other opportunities for acquisitions that provide either the opportunity for operational synergies or targeted strategic expansion. We will also continue to target capital-light new contract opportunities, using our existing operations as both credentials and bases for complementary market expansion.
In Spain, we enter the concession renewal process with a market-leading company that is winning customer awards and setting the standard on sophisticated value pricing through its upgraded RMS. While we expect there to be an impact on margin at renewal, the impact will not be felt until 2018. Even if we lost every contract we operate that is likely to come up for renewal this year the impact on ALSA’s operating profit will be between €0-3 million in 2018. This needs to be considered against a saving of around €11 million in ALSA’s fuel costs alone in 2018, compared to 2016 prices.
The acquisition of Clarkes of London provides an opportunity to expand our commuter services in a complementary local market to that served by The Kings Ferry
UK Coach will continue its drive to be the fair-priced alternative to rail, with active real-time RMS and on-board entertainment delivering value fares that are complemented by targeted digital marketing and sales to drive growth. UK Bus will continue to execute its plan to drive passenger growth through pricing initiatives, technology enhancements and cost reductions.
Safety will remain the Group’s priority and we continue to target improvements in our performance. With investment in the industry-leading Lytx DriveCam technology and initiatives to improve further enhance driver recruitment, training and assessment – including through the new Delivering Excellence team’s first projects – we are determined to be widely seen as the industry’s safest operator.
Our uniquely diversified portfolio of international businesses and consistent delivery of our strategy has provided consistent growth in recent years and gives us confidence for our future prospects. While remaining disciplined we believe we have a very strong pipeline of targeted acquisitions and new market entries, which when combined with our strong cash flow and the proceeds from c2c’s sale – as well as the continued focus on delivering excellence for our customers to drive organic growth – presents a significant opportunity for further value creation in the coming years.
Dean FinchGroup Chief Executive 23 February 2017
13Annual Report and Accounts 2016 / National Express Group PLC

Economic environment
The propensity to travel is generally affected by levels of economic activity, as represented by GDP growth. Although levels of transportation and mobility remain relatively stable through the economic cycle, periods of GDP growth generate additional volume demand and pricing benefit.
Deregulation, liberalisation and outsourcing
Our markets are created when state provision of public transport is transferred to the private sector. There are different models for this, with examples ranging from the deregulated markets of our UK Bus and UK Coach divisions, through the concessions and franchises of Spain, Morocco and Rail, to the School Bus and Transit contracts of North America.
This is supported by a trend towards market liberalisation, such as European Union directives focused on opening up rail networks. Cost saving is increasingly a factor too, through recognition of the superior efficiency of privately operated services.
Urbanisation and demographic changes
Our services benefit from increasing urbanisation around the world, in particular driving demand for bus operations. Existing towns and cities are expanding, in addition to the creation of new centres of population. In 2014, 54% of the world’s population lived in urban centres and this is projected to grow to 66% by 2050, whilst 73% of the population in Europe and 82% of the population In North America already live in urban centres. These trends are driving the requirement for additional transportation services, both within and between locations, so our UK Bus, UK Coach and Rail operations are increasingly in demand. In addition, population growth in the UK, Europe and North America will drive further demand for public transport services.
OpportunityNorth America is showing relatively stable growth, whilst the Spanish economy appears to be strengthening, with demand for public transport likely to improve as the economy grows and employment levels rise.
OpportunityThe current size of the European public transport market is estimated to be approximately €150 billion*. Liberalisation of the German and Spanish rail markets present opportunities for growth. (* OECD data.)
OpportunityUK population growth is forecast to grow by 7% over the next decade driving the need for further public transport services, whilst the combination of an ageing and increasingly social and ethnically diverse population will drive the need for new products and services to meet changing customer needs.
Capitalising on opportunities
The trends shaping our business
Here we give an overview on how the megatrends are shaping demand for travel and public transport and the opportunities ahead.
Average GDP growth
-0.5
0.0
0.5
1.0
1.5
2.0
2.5
3.0
3.5
4.0
UK Spain US Germany Morocco Bahrain
%
2010-15 average 2016-18 average
Global urban population growth is propelled by the growth of cities of all sizes
0
1,000
2,000
3,000
4,000
5,000
6,000
201620152014
Popu
latio
n (m
illion
s)
Cities of 500,000 to 1 million
Medium-sized cities of 1 to 5 million
Urban areas smaller than 500,00
Megacities of 10 million or more
Large cities of 5 to 10 million
Source: IMF Source: United Nations – World Urbanisation Prospects 2014
Strategic Report
14 National Express Group PLC / Annual Report and Accounts 2016

Modal shift
Modal shift is the move by individuals from one form of transport to another. For National Express, the relevant move is from the private car to bus, coach and rail travel. The biggest reason for this is an increase in the cost of motoring, such as higher fuel prices and cost of insurance, and the increasing use of mobile devices, such as tablets and smartphones, while travelling, although other factors such as environmental concerns and congestion can also be important.
Geopolitical and demographic changes in the Middle East are increasing demand for affordable, safe public transport in the region.
Environment and congestion
Environmental concerns continue to have an influence on customer behaviour. Bus, coach and rail services are significantly more environmentally friendly forms of transport than the private car or air travel, reducing both the level of carbon emissions per person travelling and travel congestion. Society as a whole and individuals are becoming increasingly concerned about the effect of emissions on the environment and are explicitly choosing public transport as an alternative.
Technology
Technology and innovation are playing their part, with travel apps providing real-time information as well as customised targeted offers helping to generate incremental demand for journeys on public transport. Digital platforms are increasingly providing customers with end to end journey planning and ticketing tools are delivering greater convenience for passengers, with innovations such as contactless payment and Automatic Delay Repayment.
OpportunityNew low-price entrants into the market over the last few years, such as Uber and BlaBlaCar, are resulting in fewer licences and lower car ownership amongst millennials, with demand for public transport and coaches likely to increase over time.
OpportunityImproved access to city centre locations, such as priority bus lanes, for environmentally friendly transport and lower congestion.
OpportunityThe proliferation of real-time travel information and mobile devices improves the customer experience making public transport increasingly more attractive compared with the car, whilst the introduction of smartcards and contactless payment not only provides greater convenience for customers but help to build stronger customer relationships.
Average speed during peak travel times on urban roads (in England in year to June 2016)
Smartphone usage in the UK
0
10
20
30
40
50
60
70
80
%
2015 2016 20172014201320122011
18.6
Source: Statista 2016Source: DfT
15Annual Report and Accounts 2016 / National Express Group PLC

We serve our customers
Community Government
With operational excellence
People Safety
Excellence
To create profit and cash
Generating shareholder value
Creating jobs
Funding investmentDriving growth
Delivering long-term shareholder value with the right business model and strategy
Our business model and strategy
At National Express we believe our business model should start with our customers. By serving our customers with operational excellence, we are able to create profit and cash, thereby generating shareholder value. The cash we generate is used to fund investment in the business, which drives further growth enabling us to better serve our customers and also to create new and skilled jobs. Allied to this, our core values of excellence, safety, customers, people and community inform us as to how we should operate.
5 4
1
2
3
Strategic Report
16 National Express Group PLC / Annual Report and Accounts 2016

1. We serve our customersAt National Express we believe our business model should start with our customers. By serving our customers with operational excellence, we are able to create profit and cash, thereby generating shareholder value. The cash we generate is used to fund investment in the business, which drives further growth enabling us to better serve our customers and also to create new and skilled jobs.
Allied to this, our core values of excellence, safety, customers, people and community guide us as to how we operate.
Transporting a record 921 million passengers in 2016By understanding and meeting the needs of our customers in our local markets, we strive to deliver high levels of customer satisfaction and encourage more passengers to use our services.
2. With operational excellenceNot only do our customers require high performing transport services, but they also need high levels of safety. At National Express, safety is our highest priority in whatever we do across the business and is a key tenet of our core values. Operational excellence also helps to drive sustainable growth for the Group through building customer loyalty and winning new business in
our existing markets, and opening up new markets such as the German rail market and the urban bus market in Bahrain. The quality of our employees, is integral to the provision of high safety and operational standards with continual training and focus on excellence at the core of our operations.
3. To create profit and cash, generating shareholder valueProfit and cashUltimately, delivering operational excellence through good customer service drives revenue and profit growth across the Group and generates cash which can then be re-invested into each of our businesses to drive further improvements for our customers and also fund new business opportunities, driving higher returns for our shareholders.
Shareholder valueThrough our robust and sustainable business model we aim to deliver shareholder value through higher returns with growth in dividends supported by growth in earnings and strong cash flows.
Creating jobsThrough our strong and sustainable cash flows, we are able to fund further growth in our businesses, which in turn creates new and skilled jobs, helping the local communities in which we serve and providing good career prospects for our employees.
Our strategy: how our business model and strategy work togetherOur VisionOur Vision is to earn the lifetime loyalty of our customers by consistently delivering frequent, high performing public transport services which offer excellent value.
Our ValuesOur five values continue to underpin the Vision and help us to prioritise what we focus on:
Excellence Safety Customers People Community
4. Funding investmentOur strong cash flow generation enables us to fund investment across the business with the provision of new fleet, technologies and services, driving improvements for our customers and encouraging further growth in passenger demand.
5. Driving growthWe also use our strong cash generation to invest in new business opportunities, which drives further growth in our core markets as well as developing our position in our new markets, such as Germany and the Middle East.
Our four strategic prioritiesAs our business evolves, we constantly review our strategic priorities to ensure that they remain appropriate as drivers for long-term and sustainable growth and adhere to our five core Values, aiming to deliver for all our stakeholders. At the heart of this is our constant focus on operational excellence, driving innovation and raising standards throughout our businesses.
1. Delivering operational excellenceWe aim to lead the market in delivering excellence, which will raise standards and also drive revenue growth, margin progression and cash generation.
2. Deployment of technologyInvesting in technology to raise customer and safety standards and drive efficiencies throughout our business, generating sales, margin and cash.
3. Growing our business through acquisitionsWe continue to look to grow our unique portfolio of international bus, coach and rail businesses through selective bolt-on acquisitions.
4. Diversification into complementary marketsWe continue to look at opportunities to diversify into new markets that are complementary to our existing businesses and are fast growing, urbanising and seeing liberalisation.
17Annual Report and Accounts 2016 / National Express Group PLC

Driving our business forward
Our strategy at a glance
Delivering operational excellence
Delivering Excellence best practice programme
Newly launched, the Delivering Excellence programme looks to take the best practice learnings both from within the business and across the industry, and embed and apply these practices throughout in order to deliver excellence, helping to raise standards and drive efficiencies and returns. The Delivering Excellence team focuses on specific projects to drive improvement and is currently working on driver training, driver recruitment and workforce planning.
Driving revenue growth and margin progression in our core divisions by delivering excellent customer service
Performance• Our UK Bus business named Bus Operator of the Year
at the National Transport Awards• A record year for passenger numbers, carrying over
921 million passengers in the year• All three of our UK businesses awarded the prestigious
British Safety Council Sword of Honour• Over 90% customer satisfaction in North America
with a 97% retention rate in School Bus• UK Coach awarded an EFQM* five-star rating
The future• Targeting further passenger growth in UK Coach,
UK Bus and ALSA through our digital initiatives• Growing customer relationships through partnering with
third parties to provide extra services such as last mile journey options
• North America: continue to leverage customer reputation to win new business
• Leveraging rail credentials in RME in Germany to win further franchises
• Delivering Excellence programme to embed best practices across the Group and raise standards further
• Continue to draw on our international reputation for excellence to expand in new markets
Measuring our progressMetric: Revenue growth (%)
0
5
10
15
20
UK CoachUK BusNorth AmericaSpain & Morocco2015 2016 2015 2016 2015 2016 2015 2016
Metric: Revenue growth (%)KPI definition Revenue growth year on year on a constant currency basis
Comment Strong revenue growth driven by particularly strong performances in our overseas businesses, through both organic growth and acquisitions
Risks• Delivery of service standards• Managing disruption to services• Concession and contract renewal• Managing stakeholder relationships eg.
to improve transport infrastructure
* European Foundation for Quality Management – recognises operational excellence and awards ratings to businesses based on a number of criteria, including quality of leadership and strategic direction together with development and improvement of people, partnerships and processes in order to deliver value-adding products and services to their customers
Strategic Report
18 National Express Group PLC / Annual Report and Accounts 2016

Deployment of technology
Utilising technology to raise customer and safety standards and drive efficiencies in our business
Performance• Continued investment in new mobile websites and ticketing
apps driving higher online transactions, conversion rates and lowering costs – eg. 40% growth in mobile transactions in ALSA and a 3% increase in the conversion rate for UK Coach
• Fully installed our real-time revenue management system in our Spanish and UK Coach businesses
• Lytx DriveCam technology fully implemented in UK Coach, and being installed in UK Bus, ALSA and North America; already delivering a reduction in the number of collisions and associated costs
• UK Bus launched mobile ticketing, providing more convenient methods of payment for our customers
• New complimentary ‘infotainment’ system, VUER, launched on our UK coaches, providing enhanced services for our customers
The future• New RMS systems in Spain and UK Coach to drive
growth in revenue, profit and incremental demand in 2017 and beyond
• Contactless payment in UK Bus in 2017• Further roll-out of Lytx DriveCam across our
businesses, including our North America School Bus and Transit businesses
• Further enhancements to websites and apps
Measuring our progressPercentage of sales transacted through digital channels
Metric: Proportion of sales online (%)KPI definition Percentage of sales transacted through digital channels
Comment Significant growth in the proportion of sales through online channels in ALSA, up 15% in 2016 and now representing 37% of sales in Spain and Morocco
Risks• Implementation risk with the introduction of new
IT programmes and systems
Extra services for customersIn 2016, National Express was the first UK coach company to launch an innovative digital ‘infotainment’ news and entertainment system on our UK coach network – VUER – offering films, TV and magazines to our on-board customers accessed through WiFi on their tablets and smartphones.
The service also provides tracking capability which enables passengers to keep friends and family updated with their journey progress and likely arrival times.
Spain and Morocco
37.1%UK Coach
65.6%
19Annual Report and Accounts 2016 / National Express Group PLC

Our strategy at a glance continued
Driving our business forward
Growing our business through acquisitions
We continue to look to grow our unique portfolio of international bus, coach and rail businesses through selective bolt-on acquisitions
Performance• Acquired 11 bolt-on acquisitions in the year:
– Eight in North America, including five school bus businesses (two of which include transit operations), two shuttle, private hire and paratransit businesses and Ecolane, a planning and software provider – Two in ALSA: a regional bus business in Ibiza providing entry into a new regional market and a Swiss public and private transfer operator in the ski and alpine tourist market – Acquisition of a private hire coach company in the UK
• Successful integration of acquisitions, delivering ROIC of at least 15%
• Newly acquired paratransit planning and scheduling software provider, Ecolane, already securing new contract wins and opening up new market opportunities
The future• Further selective bolt-on acquisitions especially in North
America and Spain where we can extend our offering into new regional markets or build further scale in existing markets/locations
Measuring our progressMetric: ROIC on acquisitionsKPI definition Percentage return on invested capital
The acquisitions made in 2015 have delivered ROIC of between 15% and 20%
Comment We maintain a disciplined approach to investing and target a ROIC above our cost of capital, typically targeting returns of 15% or above
Risks• Winning new business on attractive economic terms• Integration risk• Losing key personnel post acquisition• Appropriately skilled management team to identify
acquisition opportunities
Opening up new market opportunities
In 2016, National Express acquired Ecolane, a planning and scheduling software provider in the paratransit market, which provides us with a market-leading bespoke technology platform for our businesses and strengthens our credentials in this market. Already we are seeing significant new contract wins and we also see the potential for this technology to be rolled out to other parts of our business, creating efficiencies and helping to reduce costs.
Strategic Report
20 National Express Group PLC / Annual Report and Accounts 2016

Diversification into complementary markets
We continue to look at opportunities to diversify into new markets that are complementary to our existing businesses and are fast growing, urbanising and seeing liberalisation
Performance• First full year of German rail operations, with RME
delivering punctuality and operational improvements versus the previous operator
• Submitted a bid to operate the Casablanca Tramway• Submitted a bid to operate urban buses in Singapore• Entered the ski and alpine tourist market in Switzerland,
a new geography and market for us
The future• Building on our strong credentials through our focus on
delivery of operational excellence: – Looking at other markets in Europe and Asia across a number of travel modes – Seeing other opportunities for expansion in the Middle and Far East, building on our presence in Bahrain – Building on our rail credentials in Germany to enter new markets which are liberalising – Further bid wins in German Rail, with around 30 franchise competitions up for tender in the next three years
Comment Over an extended period, we are targeting entry into at least one new market each year, subject to our disciplined approach to capital returns, although the timing of new market opportunities is likely to fluctuate from year to year
Risks• Winning new business on attractive economic terms• Not building sufficient scale in new markets• Managing operational and safety risks whilst establishing
operations in new markets• Appropriately skilled management team to develop and
deliver new opportunities
Entry into Swiss ski market with AlpyBus
We have entered the ski and alpine tourist market with the strategic acquisition of AlpyBus, a transport company providing door to door services to tourists on both a public or shared transport and private transfer basis.
Currently AlpyBus provides services between Geneva and the main ski resorts of Chamonix, Verbier and Morzine. AlpyBus is a well-known brand in the local market and is the market leader in Chamonix.
We see significant opportunities to expand the service offering to other ski resorts in the region, and also to extend the services into the summer season with the summer alpine tourist market, including both the hiking and mountain bike tourist markets as well as the general summer tourist market.
21Annual Report and Accounts 2016 / National Express Group PLC

Resources, relationships and responsibilities
Our Vision and Values continue to underpin the way we run our business. Our aim is to be recognised internationally as a market leader and our Values provide focus in achieving this.
During 2016 we continued to make progress in delivering against our five Values – Excellence, Safety, Customers, People and Community
ExcellenceWe constantly strive to be excellent in all that we do
SafetyWe only do what is safe and stop any unsafe behaviour
CustomersWe place them at the heart of our business and relentlessly meet their expectations
PeopleWe develop the talents, reward the exceptional performance and respect the rights of all our employees
CommunityWe are active in the communities we serve to generate economic, social and environmental value
ExcellenceOur success as a business is dependent upon us securing and maintaining a reputation for operational excellence.
For existing customers this means consistently delivering the services they want at competitive prices they can afford. For new customers it means demonstrating to them that we will provide the service they want in a convenient way while offering good value for money.
A measure of our success is through external accreditation. During the year, UK Coach joined c2c in achieving a five-star EFQM rating. UK Bus and ALSA each hold a four-star EFQM rating and will be looking to achieve a higher score when they are next assessed in 2017. North America continues to hold a Bronze Award from the Illinois Performance Excellence Center, increasing the score by 50% in their 2016 assessment.
Alongside our excellence accreditations, we were pleased to win another record number of industry awards during the year, reflecting the exceptional achievements of our employees and the best practice they deliver. In particular, National Express West Midlands was judged Bus Operator of the Year in the National Transport Awards, The Kings Ferry won UK Coach Operator of the Year at the UK Coach Awards and ALSA was awarded the best customer experience for transport in Spain.
In December the Group Chief Executive, Dean Finch, launched a new initiative to champion operational across the business. The Delivering Excellence programme will review the way businesses in the Group carry out similar operational functions to seek best practice, learn from any external examples and then develop a Global Operating Standard for that activity. This programme will both look to further embed excellence across the business and draw on talented individuals across the Group to develop the skills and experience of future managers.
Focused on our Vision; driven by our Values
Strategic Report
22 National Express Group PLC / Annual Report and Accounts 2016

SafetySafety will always be the highest priority for our business. Overall responsibility for safety sits with Dean Finch, Group Chief Executive, and our Divisional Managing Directors who set out annual plans and priorities for improved performance.
We have commented on the tragic incident in Chattanooga in the Chairman’s, the Group Chief Executive’s and the North America reviews of the year. These make clear our profound sorrow that such an accident should happen on one of our buses, that we have pledged our full support to the ongoing investigations and identified the actions we are already taking. We will learn any necessary lessons and implement any appropriate changes that the ongoing investigations identify.
Arthur D Little continues to act as our external safety adviser. Each year they undertake a review of our safety performance and systems and we have again included a summary written by them on the next page.
We use the Fatalities and Weighted Injuries (‘FWI’) as our key safety indicator. In 2016, as a result of the Chattanooga incident we scored 17.823, compared with 12.242 in 2015. Excluding Chattanooga, the FWI was 11.323, in a year when we carried more passengers and ran more services (see Figure 1 right). Figure 2 also illustrates our FWI alongside our significant increase in mileage as our business has grown, demonstrating we have consistently delivered significant reductions on this measure as well.
Three months after the tragic accident in Chattanooga, the regulatory authorities have not identified any faults in our maintenance systems, or the background screening, training or management of our driver.
The underlying reduction in FWI reflects the investment we have made in systems and training to reduce accidents. For example, Lytx DriveCam is now installed across the UK Coach fleet, and is being rolled out across UK Bus, ALSA and North America. This provides video evidence of how drivers are performing and it helps us to monitor individual driving behaviours and provide tailored training.
Our safety achievements have continued to be recognised by external bodies during 2016. We were pleased to be honoured with a Prince Michael International Road Safety Award which recognised our Driving Out Harm programme. The award was in the Safer Road Users category, particularly focusing on our work to reduce accidents in Morocco.
Another highlight was the award of the British Safety Council Sword of Honour to all three of our UK businesses: Bus, Coach and Rail – alongside them all achieving five-star ratings.
The members of each of our Divisional Boards and Group Executive continue to make safety tours, providing both assurance and the visible confirmation of the importance of safety in the Group. During 2016, 774 safety tours were made (2015: 653). We publish this figure annually as a demonstration of our commitment to safety.
Figure 1: Safety – Fatalities and Weighted Injuries (‘FWI’)
0
5
10
15
20
2016 2016(including
Chattanooga)
20152014
Figure 2: Million miles (mm) vs FWI trend
500
530
560
590
620
650
680
0.00
0.01
0.02
0.03
0.04
0.05
0.06
Million miles FWI/MM FWI/MM (Including Chattanooga)
Above: In December, our Driving Out Harm safety programme was recognised at the Prince Michael International Road Safety AwardsLeft: UK Coach was successful in achieving a five-star EFQM rating following its assessment in 2016
23Annual Report and Accounts 2016 / National Express Group PLC

Resources, relationships and responsibilities continued
Right: Nearly 100 Platinum buses have joined our fleet during the year. These provide extra legroom and free wifiFar right: We have launched ALSAcab, a new door-to-door car-pooling service, in Madrid, which provides a shared transfer to their homes
Independent Safety Performance ReviewArthur D Little has been engaged as an independent safety consultant at National Express since 2010, including helping to create and launch the Driving Out Harm safety programme. Since the programme was developed we have conducted six annual reviews of each divisions’ safety progress and performance. We report our findings to the PLC Board and make recommendations for improvements. We have visited a wide range of operational locations in all businesses. We draw on our experience of a range of client organisations worldwide and consider Driving Out Harm to be an excellent safety programme with very strong leadership from the Chief Executive, and highly effective safety governance from the Executive and PLC Board.
Our 2016 safety review has reached the following overall conclusions:• Taken in isolation, responsible harm was higher than
in previous years, which has otherwise trended downwards year on year since 2011. The increase was due to a serious accident in North America – setting this aside, total responsible harm was 10% lower than in 2015 and 60% lower than in 2011 when Driving Out Harm was initiated
• Reported collisions in 2016 are flat but the vast majority are very minor and average severity is decreasing – further supporting our view that the continuing focus on Driving Out Harm is delivering clear ongoing Group-wide improvements in safety management
• New businesses have made good progress in safety and, by leveraging the approaches and standards within Driving Out Harm, are demonstrating standards above those which are typical in-country. This is a consistent finding from our visits and reviews
• There is a very clear Group-led focus on further strengthening the primary area of risk – safe driving: – ‘World Class Driver’ was launched at the end of 2015. 2016 has seen strong buy-in to this programme from the divisions with specific improvements already evident, and clear direction for further improvements over the next three years – Where installed, smart camera (Lytx DriveCam) systems are being very effectively used to strengthen driver standards. Plans to roll these out extensively are now in place, which will bring a further step change in safety.
• Aside from driving, there have been continued reductions in lost time injuries across the Group
• The Group has set clear priorities for further improvement, based on learning from accidents, and strong ongoing review. These priorities include accelerating smart camera fitment and developing standardised approaches to driver evaluations and monitoring. In particular: – The roll-out of DriveCam is a significant opportunity to enhance driver performance, through performance monitoring and targeted training. However, it also requires enhanced management capabilities to maximise the opportunity – Greater consistency in implementing World Class Driver will also help achieve the Group’s goals
Marcus BeardAssociate Director, Arthur D Little
“During 2016, we continued to deliver new customer initiatives which enhance passengers’ experience of travelling with us.”
Strategic Report
24 National Express Group PLC / Annual Report and Accounts 2016

CustomersCustomers lie at the heart of our business, and maintaining their loyalty is key to our success. During 2016, we continued to deliver new customer initiatives which enhance passengers’ experience of travelling with us.
The launch of the VUER app in UK Coach provides customers with a varied package of entertainment and information delivered to their own phone or tablet. VUER is the first ‘infotainment’ system for coach passengers in the UK, and is being rolled out across the fleet. It is proving popular, with customer satisfaction scores for those coach passengers who have used VUER 5% higher than those who have not.
In UK Bus, we introduced nearly 100 new Platinum buses, extending them to Black Country routes. Platinums are more fuel efficient than conventional buses, and provide more legroom for passengers who can make use of free WiFi and USB charging points.
ALSAcab is a new ‘carpooling’ door-to-door service launched in Madrid, which enables customers to book a shared car transfer as part of their journey. ALSAcab allows customers to make use of ALSA long-distance services with the convenience of a shared car transfer from coach station to home.
PeopleEvery division conducts an annual employee survey, except in ALSA where they hold one every two years. These confidential surveys are run by independent companies: VaLUENTiS in the UK; TNS Employee Insights in North America; and ALCOR in ALSA. The results of these provide a measure of employee engagement and influence how we make National Express a better place to work.
The following table shows our employee engagement scores over the last four years. We continue to record high scores across the Group. For the third year running, UK Coach has registered the highest score for the bus and coach industry in the VaLUENTiS database at 732. UK Bus achieved it highest ever engagement score of 692, ahead of the bus and coach industry average of 672. North America, using a comparable methodology, scored 805 and Bahrain, which completed its first survey, scored 789.
These survey results, the commitment to invest in our staff and the innovations we are bringing to this area demonstrate the seriousness with which we take our People Value to ‘develop the talents, reward the exceptional performance and respect the rights’ of our employees.
During the year, we launched Auto Delay Repay in c2c, the first UK rail operator to automatically compensate passengers for delays, and Flexi-Season tickets – another industry first which benefits part time workers.
Our focus on providing excellent customer service continues to be recognised externally. For the fourth year running, UK Coach has been ranked as the most trusted ground transportation brand by the UK’s Institute of Customer Service. In Spain, ALSA won an award for the Best Customer Experience Initiative Involving Employees in the Asociación para el Desarrollo de la Experiencia de Cliente Awards (Association for the Development of Customer Service). Our introduction of contactless ticketing on the Midland Metro led to the Best Customer Initiative at the Global Light Rail Awards.
25Annual Report and Accounts 2016 / National Express Group PLC

Our commitment to our peopleWe have a number of policies in place to protect the rights of our employees. Our Workplace Rights Policy and Human Rights Policy have been in place for a number of years and are published on our website. We investigate and take appropriate action to deal with any alleged breaches of these policies. Wherever our employees choose to be represented by unions, we actively seek to maintain relationships based on mutual respect and transparency.
We recognise the importance of the provisions of the Modern Slavery Act, which came into effect in 2015. The Group has a zero tolerance approach to modern slavery and human trafficking and remains committed to strengthening its practices to uphold that approach. To reflect our commitment to acting ethically and with integrity, and to implementing and enforcing effective systems and controls to ensure slavery and human trafficking is not taking place in our business or supply chains, we have developed a number of initiatives in 2016, including the development of a new Modern Slavery Policy. We will be publishing a signed copy of the Group’s first Modern Slavery Statement on our website during the year. This statement will set out all steps taken by the Group in this financial year to ensure that there is no slavery or human trafficking in our business or supply chains. We will review the effectiveness of the steps we have taken each year and report on this in subsequent statements.
Our Master Driver programme has continued to champion best practice in driving, with 4,800 drivers either qualified to Master or Advanced Driver standard across Spain, Morocco and the UK. Master Driver provides a framework to measure the performance of drivers and identify those with an impeccable safety record and outstanding driving skills.
Our innovative Health Bus in UK Bus continues to support the wellbeing of our employees, and was recognised with a Nursing in the Community award at the UK Nursing Times Awards – the leading awards for the nursing profession. Similar health checks have been introduced in other areas of the Group.
Employee, senior management and Director numbers by gender at end of 2016
Male Female
Directors 7 2
Senior managers 65 16
All employees 26,114 18,887
Employee engagement score*
0
200
400
600
800
1,000
NorthAmerica
UKBus
UKCoach
UKRail
* Maximum score is 1,000. Spain conducts employee satisfaction surveys biannually and so is excluded.
Employee engagement survey I would recommend my company as a good place to work
0
20
40
60
80
100
NorthAmerica
UKBus
UKCoach
UKRail
%
Resources, relationships and responsibilities continued
Our Master Driver programme is championing best practice in driving skills across the Group
Strategic Report
26 National Express Group PLC / Annual Report and Accounts 2016

CommunityWe are rooted in the heart of the communities we serve. Aside from providing vital transport services, we have a duty to be a good neighbour and manage our impacts on the environment.
In every place we operate, we maintain links with local stakeholders to engage them on relevant matters. For example, we seek to engage local councillors and community groups when planning changes to services. This engagement helps create a more receptive environment for change. We assess the strength of these relationships through holding annual stakeholder surveys.
Our community engagement activities across the Group continue to focus particularly on supporting young people.
The National Express Foundation, in its fifth year, continues to support young people through educational bursaries and grants to community groups. Following an increase in funding from the Group, the Foundation was able to support an even greater number of young people in 2016. By the end of last year over 11,000 young people had benefited from grants totalling £535,000 since the launch in 2012.
As part of its Youth Promise, UK Coach encourages its employees to spend a day volunteering for one of our partner charities. Uptake has been encouraging with 146 people – nearly 10% of the workforce – giving their time in 2016. Youth Promise partners The Prince’s Trust, Whizz-Kidz and Scouts have now been joined by the Girl Guides. Like Scouts, this partnership provides Guiding groups with 25% discount on coach travel.
In UK Bus, our garages continued their partnerships with a local charity of their choice. This provides a focus for local fundraising activity, raising just over £10,000 between them in 2016.
Our UK Employee Charity Panel, which supports employees who carry out fundraising or volunteer for community groups, made 56 awards during the year.
ALSA has launched a programme to encourage the integration of people with disabilities through training, inclusion and employment. Called ‘What are you capable of?’, it aims to help disabled people to fully develop their professional competences and demonstrate their abilities. ALSA directly employs the individuals through agreements with organisations that work with disabled people. During 2016, 11 courses have been delivered to 93 students, of which 46 went on to be employed by the Company.
In North America, our School Bus operations reach across 34 US states and four Canadian provinces. They are a highly visible part of the community and our employees give up their time to help local causes. This includes Stuff the Bus initiatives and offering transport for Special Olympics events. We also donate redundant buses to support local projects, such as the Huntsville City Schools Summer Feeding programme in Alabama, which provides free meals to children during the summer holidays.
Across the Group, we made charitable donations totalling £562,125 (2015: £530,431).
Bus donations such as this one in Huntsville, Alabama, make a huge difference to the local community
27Annual Report and Accounts 2016 / National Express Group PLC

EnvironmentManaging our environmental impactsWe are committed to working in partnership with our stakeholders and partners to mitigate the impact of climate change.
At National Express we recognise we have an important role in enabling and delivering climate change strategies, both in terms of vehicles and sites.
Although we have a global fleet of around 29,000 vehicles, we continue to significantly reduce our carbon emissions through a combination of cultural commitment to improvement, capital investment and research into pioneering fuel efficiency technologies.
Across seven countries we have a series of carbon intensity reduction programmes linked to energy and water use in our buildings and the broader supply chain to help mitigate our static emissions.
In 2016, our success in curbing our own emissions was demonstrated with external recognition in the areas of voluntary carbon and water reporting, climate change leadership and environmental excellence.
We are determined to continually improve the extent and accuracy of our data and reporting. We have identified remaining data issues in this report but are pleased to continue to perform well in external rankings such as the Carbon Disclosure Project and the Carbon Saver Standard.
Environmental Performance – KPIs targets 2014-2017In 2016, we made significant progress towards achieving our environmental performance targets to reduce fuel/traction energy, site-based energy, waste, water and total carbon emissions per million passenger kilometres (‘pass.km’) from our business activities.
The data has been restated to reflect improved coverage of data across the UK Coach business with additional data included from 2013 onwards, which serves as the baseline year for our data.
KPIs: 2014-2017 Metric2013
(baseline) 2014 2015 2016
Percentage change
2013-2016
Year on year % change
2015-2016
Fuel/traction energy: 3% reduction in energy use (fuel and electricity)
MWh / million passenger km
80.74 82.70 76.09 73.85 -8.53% -2.94%
Site: energy 20% reduction in consumption tCO2e 40,049 42,016 43,050 42,464 6.03% -1.36%
Waste: 80% reduction in non-hazardous waste to landfill
metric tonnes 5,750 5,357 5,648 7.449 29.55% 31.89%
Water: 10% reduction in consumption m3 n/a 1,008,363 978,922 514.821 -48.94% -47.41%
Total carbon emissions: 4% reduction in carbon emissions per pass.km
tCO2e per million
passenger km
23.69 24.11 22.55 22.01 -7.08% -2.40%
Summary for 2016• The increase in site energy emissions is principally as a result of an increase in reported electricity consumption in North America• The increased volume of waste to landfill is as a result of improved reporting. UK Coach supplied data for the first time in 2015
and improved the scope and completeness of reporting further in 2016• Significant improvement in water consumption reporting. In 2015, approximately 85% of water data was estimated. This has
reduced to 18% estimated in 2016. (The baseline is calculated from 2014) • Passenger kilometre (‘pass.km’) figures have increased by 16.2% between 2013 and 2016 whereas total emissions have increased by
just 8% over the same period resulting in the reported improvements in carbon efficiency. As the business grows this metric is likely to see year on year fluctuations within a longer-term trend for improved efficiency
Note:
As data quality continues to improve as a result of improved visibility, we have restated our absolute emissions and associated KPIs across the full reporting period, including 2013, 2014 and 2015.
The principal changes relate to improved data quality for UK Coach, particularly around the emissions associated with the division’s contract arrangements.
Resources, relationships and responsibilities continued
Strategic Report
28 National Express Group PLC / Annual Report and Accounts 2016

Greenhouse gas (‘GHG’) emissions reporting 2016UK GHG emissions 2002 vs 2016 (tCO2e)
2016201520142013201220112010200920082006200520032002 2007
0
400,000
800,000
1,200,000
2004
Carbon emissions 2016 saw a 7% increase in total CO2e emissions for the Group to 904,656 tonnes CO2e from 846,496 tonnes CO2e in 2015. This increase in emissions was driven by new business opportunities in Germany, our first full year of operation in Bahrain and organic business growth in both North America and ALSA’s Moroccan market. These changes saw a jump in the Group’s passenger kilometres from 37 billion in 2015 to 41 billion in 2016, a year on year increase of 9.5%. That this growth in passenger numbers has been achieved with only a 7% increase in carbon emission over the same period is due to investment in new fleet, driver training and on site energy savings initiatives.
The largest category to see an increase is in ‘leased vehicles and business travel’, from 641 tonnes CO2e in 2015 to 1,254 tonnes CO2e in 2016. This has been attributed to an increase in air travel due to the growing international footprint of the Group.
As a result of substantial business growth in ALSA and North America, an increase in carbon emissions can be seen, with our UK Coach division reporting a 4% year on year increase due to the inclusion of partner operators for the first time.
2016 marks the first year for comparative reporting for our bus operations in Bahrain.
As a Group we have invested heavily in improving the data collection and reporting to improve accuracy. The outcome of this approach in particular can be seen in four areas: leased vehicles and business travel; our bus operations in Bahrain; UK Coach; and, our School Bus and Transit operations in North America.
A positive carbon emission reduction trend can be seen in the UK Bus and Rail divisions with both showing year on year reductions as a result of continued investment in new fleet. For instance, UK Bus has invested £8 million in 100 new Euro 6 Platinum buses. Built in Britain, these Platinum buses are lighter, more fuel efficient and, with their Euro 6 engines (all Low Carbon Emissions certified), are cited as amongst the cleanest in the world.
National Express GHG emissions 2013–2016 by division
National Express2013
(tCO2e)2014
(tCO2e)2015
(tCO2e)2016
(tCO2e)
Percentage change
(2015/2016)
Spain and Morocco 303,351 296,214 311,985 303,537 -2.71%
UK Bus (inc. Midland Metro) 143,485 142,312 138,822 138,449 -0.27%
UK Coach 110,317 109,225 106,203 110,799 4.33%
UK Rail 42,816 44,755 43,408 44,341 2.15%
North America 237,314 236,979 232,576 258,183 11.01%
Bahrain – – 12,862 21,698 68.70%
German Rail – – – 26,395 n/a
Leased vehicles and business travel 611 441 641 1,254 95.33%
Group total 837,894 830,273* 846,496 904,656 6.87%
* Includes water-related emissions of 347 tCO2e reported for the first time in 2014 and subsequently included in divisional figures.
29Annual Report and Accounts 2016 / National Express Group PLC

National Express GHG 2013 – 2016 by division (all scores)(tCO2e)
2016 2015 2014 2013
Spain/Morocco
UK Bus
(inc. Midland Metro)
350,000
300,000
250,000
200,000
150,000
50,000
0
100,000
UK Coach
UK Rail
NorthAmerica
Leasedvehicles
& businesstravel
Bahrain GermanRail
National Express Group Total Emissions 2013 – 2016
2015 20162013
(tCO2e)
2014
1,000,000
800,000
600,000
200,000
400,000
0
Greenhouse Gas Emissions Reporting for 2016 (tCO2e)
UK Rail (c2c)
Coach (owned & third party) Spain/Morocco
Bahrain
Leased vehicles and business travel (UK)
Bus (inc. Metro) North America
German Rail
Driving environmental excellenceOne of our key goals to achieve Excellence in our environmental performance is to ensure external standards are maintained.
In 2016, this goal was achieved through the enhancement and extension of our existing ISO/BS energy and environmental accreditations. Significant achievements were made by ALSA, with international certifications renewed in the EU eco-management and audit scheme (‘EMAS’). This is a premium management instrument to evaluate, report and improve environmental performance. We also maintained the ISO 14064 standard, a GHG emissions integrated programme aimed at measuring, quantifying and reducing greenhouse gas emissions, along with both ISO 14001:2004 and 50001:2011 management standards.
Our operations in the US saw successes in the NSTA (National School Transportation Association) Green Fleet Certification programme. This is an environmental stewardship award recognising school bus operators for their efforts to reduce their fleet emissions by over 90%, and accelerate the adoption of newer engine and emission reduction technologies.
Endorsed by the USA Environmental Protection Agency’s Clean School Bus USA programme, Platinum and Gold certification levels were awarded to Durham School Services in Ottumwa, Iowa and Indianapolis, Indiana, and to Stock Transportation in Halifax, Nova Scotia.
Carbon Saver Standard performanceDuring the year all our UK divisions achieved the Carbon Saver Gold Standard for the third time. We achieved an increase of 15% in our performance score two years ago. This achievement is testament to our seven-year programme of reducing carbon emissions through a continued commitment in driving sustainability, cutting our energy costs and adopting carbon emissions reduction measures in both fleet and site operations.
Water disclosureIn 2016, we were awarded a performance band level B from the Global Water Disclosure Program. This was the first time the Group has reported to the Water Disclosure Progam, and is the only public transport company in CDP’s Industrial category. This programme requires us to identify our water risks and opportunities, providing greater transparency.
Measurement and transparencyIn 2016, we made a significant improvement in data collection and target setting, with all divisions adopting a Group-wide web-based sustainability reporting system for our GHG accounting system.
Resources, relationships and responsibilities continued
Strategic Report
30 National Express Group PLC / Annual Report and Accounts 2016

We use the resulting data to guide our energy and fuel reduction activities. These are centered on:
• behaviour change by drivers, resulting in improved miles per gallon figures
• investment in Solar photovoltaics and smart metering technologies at our site locations
• investment in new low carbon fleet, including hydrogen fuel-based vehicles, and retrofitting of new technologies to existing fleet to improve efficiency
We continue to re-define our environment reporting processes across the Group, providing greater visibility and ownership. These have helped attain a number of environmental awards, and in achieving Carbon Reporting (CDP) and Commitment to Climate Change via Science Based Targets.
In 2016, for the third year running, we improved our ranking in the global Carbon Disclosure Project (CDP). We achieved a Climate Change Performance Band level B, an improvement on last year (level C). This achievement signals we are a company that continues to embed climate change into our corporate business strategy.
Commitment to climate Change Action via Science Based TargetsIn 2015, we made two business-focused Climate Change Action Commitments – the only listed public transport company globally to do so:
1. Reporting climate change-related information in our mainstream reports
2. Adoption of science – based emissions reduction targets
We continue to adopt Group-wide emissions targets in line with climate science and we can now better plan our longer-term goals 2030 to 2050; our intensity (eg tCO2e per million passenger km) and absolute target metrics. Completing a heat map which will acknowledge all of our Scope 3 emissions (supply chain) our targets will then be verified in accordance with the Science Based Targets initiative’s Call to Action criteria by April 2017.
Fleet technologies We continue to implement pioneering fleet technologies across our business, sharing innovative low carbon solutions to improve efficiencies and achieve sustainable performance.
We are working with Birmingham City Council on a project to deploy 20 hydrogen buses in 2018, and have secured funding for low emissions projects including electric buses.
In addition, we have secured £2.2 million of government funding towards a programme to upgrade 210 buses with emissions traps, which upgrade older buses to Euro 6 standards.
Global GHG emissions data for calendar year 2016
2014 Tonnes of CO2e
2015 Tonnes of CO2e
2016 Tonnes of CO2e
Global GHG emissions data for calendar year 2016 emissions from:
Combustion of fuel and operation of facilities (GHG Protocol Scope 1) 754,859 771,922 799,929
Electricity, heat, steam and cooling purchased for own use (GHG Protocol Scope 2) 67,186 66,317 95,107
Other upstream emissions (GHG Protocol Scope 3) 8,228 8,257 9,620
Total 830,273 846,496 904,656
Intensity metrics 2014 2015 2016
Percentage (2016 vs 2014 for
KPIs from 2014)
(tonnes CO2e / £ million revenue) 445 428 430 -3.37%
Group totals (million pass.km) 37,450 37,540 41,107 9.77%
total tCO2e per million pass.km 22.46 22.55 22.01 -2.00%
GHG emissions reporting methodologyNational Express has reported on all of the emission sources required under the Companies Act 2006 (Strategic Report and Directors’ Reports) Regulations 2013. These sources fall within our consolidated financial statements. We do not have responsibility for any emission sources that are not included in our consolidated statements.
The method we have used to calculate GHG emissions is the GHG Protocol Corporate Accounting and Reporting Standard (revised edition), together with the latest emission factors from recognised public sources including, but not limited to, Defra, the International Energy Agency, the US Energy Information Administration, the US Environmental Protection Agency and the Intergovernmental Panel on Climate Change. In applying the GHG Protocol Corporate
Accounting and Reporting Standard (revised edition) we have calculated emissions associated with electricity consumption solely using the location-based Scope 2 calculation method.
We have used a materiality threshold of 5% and have accounted for all material sources of GHG emissions.
We are committed to ensuring that our GHG accounting system, results and accompanying reports remain robust; they continue to enhance our Group-level year on year emission performance; and are in compliance with the mandatory requirement of the Carbon Reporting Framework (the Greenhouse Gas Emissions (Directors’ Reports) Regulations 2013), for GHG emissions to be included in the Annual Group Financial Director’s report.
31Annual Report and Accounts 2016 / National Express Group PLC

Operating profit2016: £219.0m
Free cash flow2016: £138.6m
Return on capital employed2016: 11.9%
Safety – Fatalities and Weighted Injuries (FWI)2016: 11.32
Passenger journeys2016: 921m
Employee engagement score*
0
50
100
150
200
250
201620152014
£m
0
40
80
120
160
200
201620152014
£m
0
2
4
6
8
10
12
201620152014
%
0
5
10
15
20
2016 2016(including
Chattanooga)
20152014
0
200
400
600
800
1000
201620152014
m
Relevance to strategy Relevance to strategy
Key measure of the performance of the business. Strong cash generation provides the funding for future growth and returns for shareholders.
Key measure of the performance of the business and demonstrating how efficiently the Group is deploying its capital resources.
Safety is of paramount importance to a public transport operator.
A key driver for growing our business. A key measure of how we are meeting our People Value and provide the right working environment for our employees to develop.
KPI definition KPI definition
Group normalised operating profit from continuing operations.
Free cash flow is the cash flow equivalent of normalised profit after tax.
Return on capital employed (‘ROCE’) is normalised operating profit, divided by net assets excluding net debt and derivative financial instruments. For the purposes of this calculation, net assets are translated using average exchange rates.
Safety incidents for which the Group is responsible are based on an adapted Fatalities and Weighted Injuries Index used in the UK rail industry.
Passenger numbers as measured by the aggregate of passenger journeys across our five operating divisions.
Our numbers for North America are estimated as our School Bus services are non-ticketed.
Our employee satisfaction surveys are conducted by VaLUENTiS, a company which is widely used as an employee survey provider in the UK transport industry. The survey delivers an employee engagement score for each individual division, with our score for North America being partially estimated from data provided by TNS, which conducts the employee surveys in North America.
Performance Performance
• Further progress in Group operating profit, driven by strong performances in our overseas businesses
• Growth being delivered both organically and through bolt-on acquisitions
• Normalised operating profit up 4.8% in constant currency, and up 14.2% on a reported basis, benefiting from significant foreign exchange tailwinds
• Operating cash flow of £201 million, up 22% reflecting growth in EBITDA and even after a significant increase in maintenance capital expenditure
• Generated £139 million of free cash, £28 million higher than last year
• Increasing our target for free cash flow to £120 million per annum
• Strong returns generated by our recent acquisitions in North America, with acquisitions made in 2015 generating ROCE of between 15% and 20%
• Invested £135 million of net maintenance capital, predominantly in growing our fleet in our existing operations
• Invested £27 million in growth capital expenditure to support growth in Morocco and Rail, revenue management systems in our UK and Spanish Coach operations and contactless ticketing in UK Bus
• In 2016 as a result of the Chattanooga incident we scored 17.823, compared with 12.242 in 2015
• Excluding Chattanooga, the FWI was 11.323, in a year when we carried more passengers and ran more services
• The underlying reduction in FWI reflects the investment we have made in systems and training to reduce accidents
• A record number of passengers carried in 2016, with 921 million passenger travelling on our services
• Strong performance in Spain and Morocco, with a record 307 million passengers carried, up 5% in Spain and 6% in Morocco
• Strong performance in c2c, with 6.7% growth in passengers reflecting the launch of a new timetable
• 20 million passengers in our first year in German rail
• For the third year running our UK Coach division has recorded the highest score for all UK bus/coach operators at 732
• UK Bus has achieved its highest score to date at 692, 20 points ahead of the UK bus/coach industry average of 672
• In North America, which uses a comparable but different methodology to the UK, the engagement score was up 20 points to 805
• The survey was conducted in Bahrain for the first year, achieving a score of 789
Why we measure Why we measure
We are focused on driving growth in operating profit in order to drive higher and sustainable returns for our investors.
A key output of the Group’s strategy is to maximise the cash generation across all our operating divisions. We view cash generation as a key driver for creating shareholder value.
Our core bus and coach operations are strong cash generators, complemented by our capital-light model for rail.
We are focused on improving return on the capital we invest, in order to drive better returns for investors.
We maintain a disciplined approach to capital investment, and continue to invest in those areas in which we can deliver the best returns.
Safety is at the heart of our Vision and Values and is our priority for both our customers and employees.
High safety standards also help to drive sustainable growth through customer loyalty and new business wins.
Passenger journeys are reflective of underlying demand for travel. National Express is targeting increased passenger ridership as a longer-term driver of sustainable value.
We run employee surveys to measure the engagement of our people. Every year we use the results to influence how we make National Express a great place to work.
Remuneration linkage Remuneration linkage
The normalised Group operating profit metric is a bonus KPI within the Executive Directors’ annual bonus structure.
The free cash flow metric supplements the normalised profit and strategic/personal metrics for the Executive Directors’ annual bonus.
ROCE is one of the performance conditions for the National Express Long-Term Incentive Plan 2015 (‘2015 LTIP’).
Improvement in FWI is a key Safety deliverable forming part of the non-financial targets within the Executive Directors’ annual bonus structure.
Non-financial targets within the Executive Directors’ annual bonus structure include customers and excellence, with passenger journeys forming an operational performance metric.
Maintaining a high employee engagement score is a talent deliverable forming part of the non-financial targets within the Executive Directors’ annual bonus structure.
Financial
Key performance indicators
Measuring our progress
Strategic Report
32 National Express Group PLC / Annual Report and Accounts 2016

Operating profit2016: £219.0m
Free cash flow2016: £138.6m
Return on capital employed2016: 11.9%
Safety – Fatalities and Weighted Injuries (FWI)2016: 11.32
Passenger journeys2016: 921m
Employee engagement score*
0
50
100
150
200
250
201620152014
£m
0
40
80
120
160
200
201620152014
£m
0
2
4
6
8
10
12
201620152014
%
0
5
10
15
20
2016 2016(including
Chattanooga)
20152014
0
200
400
600
800
1000
201620152014
m
Relevance to strategy Relevance to strategy
Key measure of the performance of the business. Strong cash generation provides the funding for future growth and returns for shareholders.
Key measure of the performance of the business and demonstrating how efficiently the Group is deploying its capital resources.
Safety is of paramount importance to a public transport operator.
A key driver for growing our business. A key measure of how we are meeting our People Value and provide the right working environment for our employees to develop.
KPI definition KPI definition
Group normalised operating profit from continuing operations.
Free cash flow is the cash flow equivalent of normalised profit after tax.
Return on capital employed (‘ROCE’) is normalised operating profit, divided by net assets excluding net debt and derivative financial instruments. For the purposes of this calculation, net assets are translated using average exchange rates.
Safety incidents for which the Group is responsible are based on an adapted Fatalities and Weighted Injuries Index used in the UK rail industry.
Passenger numbers as measured by the aggregate of passenger journeys across our five operating divisions.
Our numbers for North America are estimated as our School Bus services are non-ticketed.
Our employee satisfaction surveys are conducted by VaLUENTiS, a company which is widely used as an employee survey provider in the UK transport industry. The survey delivers an employee engagement score for each individual division, with our score for North America being partially estimated from data provided by TNS, which conducts the employee surveys in North America.
Performance Performance
• Further progress in Group operating profit, driven by strong performances in our overseas businesses
• Growth being delivered both organically and through bolt-on acquisitions
• Normalised operating profit up 4.8% in constant currency, and up 14.2% on a reported basis, benefiting from significant foreign exchange tailwinds
• Operating cash flow of £201 million, up 22% reflecting growth in EBITDA and even after a significant increase in maintenance capital expenditure
• Generated £139 million of free cash, £28 million higher than last year
• Increasing our target for free cash flow to £120 million per annum
• Strong returns generated by our recent acquisitions in North America, with acquisitions made in 2015 generating ROCE of between 15% and 20%
• Invested £135 million of net maintenance capital, predominantly in growing our fleet in our existing operations
• Invested £27 million in growth capital expenditure to support growth in Morocco and Rail, revenue management systems in our UK and Spanish Coach operations and contactless ticketing in UK Bus
• In 2016 as a result of the Chattanooga incident we scored 17.823, compared with 12.242 in 2015
• Excluding Chattanooga, the FWI was 11.323, in a year when we carried more passengers and ran more services
• The underlying reduction in FWI reflects the investment we have made in systems and training to reduce accidents
• A record number of passengers carried in 2016, with 921 million passenger travelling on our services
• Strong performance in Spain and Morocco, with a record 307 million passengers carried, up 5% in Spain and 6% in Morocco
• Strong performance in c2c, with 6.7% growth in passengers reflecting the launch of a new timetable
• 20 million passengers in our first year in German rail
• For the third year running our UK Coach division has recorded the highest score for all UK bus/coach operators at 732
• UK Bus has achieved its highest score to date at 692, 20 points ahead of the UK bus/coach industry average of 672
• In North America, which uses a comparable but different methodology to the UK, the engagement score was up 20 points to 805
• The survey was conducted in Bahrain for the first year, achieving a score of 789
Why we measure Why we measure
We are focused on driving growth in operating profit in order to drive higher and sustainable returns for our investors.
A key output of the Group’s strategy is to maximise the cash generation across all our operating divisions. We view cash generation as a key driver for creating shareholder value.
Our core bus and coach operations are strong cash generators, complemented by our capital-light model for rail.
We are focused on improving return on the capital we invest, in order to drive better returns for investors.
We maintain a disciplined approach to capital investment, and continue to invest in those areas in which we can deliver the best returns.
Safety is at the heart of our Vision and Values and is our priority for both our customers and employees.
High safety standards also help to drive sustainable growth through customer loyalty and new business wins.
Passenger journeys are reflective of underlying demand for travel. National Express is targeting increased passenger ridership as a longer-term driver of sustainable value.
We run employee surveys to measure the engagement of our people. Every year we use the results to influence how we make National Express a great place to work.
Remuneration linkage Remuneration linkage
The normalised Group operating profit metric is a bonus KPI within the Executive Directors’ annual bonus structure.
The free cash flow metric supplements the normalised profit and strategic/personal metrics for the Executive Directors’ annual bonus.
ROCE is one of the performance conditions for the National Express Long-Term Incentive Plan 2015 (‘2015 LTIP’).
Improvement in FWI is a key Safety deliverable forming part of the non-financial targets within the Executive Directors’ annual bonus structure.
Non-financial targets within the Executive Directors’ annual bonus structure include customers and excellence, with passenger journeys forming an operational performance metric.
Maintaining a high employee engagement score is a talent deliverable forming part of the non-financial targets within the Executive Directors’ annual bonus structure.
Non-financial
0
200
400
600
800
1000
NorthAmerica
UKBus
UKCoach
UKRail
2014 2015 2016
33Annual Report and Accounts 2016 / National Express Group PLC

Risk and risk management
The Group is exposed to a variety of risks that can adversely affect business and financial performance, or potentially damage our reputation. The Board recognises however that creating shareholder returns is the reward for accepting a level of risk. The effective management of risk is therefore critical in supporting the delivery of the Group’s strategic objectives.
Risk management frameworkThe Group has a well-established governance structure with appropriate internal control and risk management systems. Our approach is centred on the accepted ‘three lines of defence’ model, with ultimate oversight from the Board:
Defence Responsibility Actions
Oversight Board • Sets strategic objectives• Determines overall risk culture and appetite• Establishes organisational structure with defined lines
of responsibility, delegated authorities and clear operating processes
• Ultimate oversight of internal control and risk management systems
Third line Group Audit • Provides reasonable assurance that systems of risk management, internal control and governance are effective
Second line Group Executive Committee Group functions including Risk
• Support Divisions with ‘first line’ responsibilities• Coordinate and report on Group-level risks• Build risk capability and understanding
First line Divisional Executive Committees Divisional management
• Identify, assess and report key risks• Regularly review and update divisional risk registers• Assign risk ‘owners’• Implement risk mitigation plans
Many risk controls are embedded and evidenced in the Group’s day-to-day management activities, including:
• detailed KPI tracking in monthly divisional Executive reports• well-established bid evaluation controls• robust due diligence on acquisitions
Prioritising and reporting risksEach division regularly reviews and updates a detailed ‘risk register’, in which risks are identified and assessed in terms of both the probability of the risk occurring, and its potential impact. Risk is assessed on a ‘gross’ and ‘net’ basis, taking into account known and proposed mitigating actions.
Group-level risks are assessed as:• macro risks which affect the majority of, or all, divisions: or• individual divisional risks where the materiality of the risk is considered of Group significance
In 2016, a ‘risk radar’ was developed to supplement the Group risk register, and the radar and register are reported to the Group Executive, Audit Committee and Board, twice per annum. The radar categorises risks as strategic, financial, operational or hazard.
The risk radar now also specifically includes consideration of ‘emerging’ and developing risks. In 2016, examples of such risks included the potential impact of Brexit, the ongoing development of cyber risk understanding, and evolving customer expectations in a digital environment.
Committed to managing risk effectively
Strategic Report
34 National Express Group PLC / Annual Report and Accounts 2016

Summary risk radar
Risks are shown on a ‘net’ basis after mitigations. The closer to the centre of the radar the greater the perceived risk.
Unchanged risk Increased risk
Decreased risk New risk
Financial risks Strategic risks
Hazard risks Operational risks
High Medium Low
Fuel cost
Customer expectations/digital
Pension scheme
Competition
IT/cyber risk
Safety/litigation/claims
HR/labour relations
Political/regulatory
Economic environment inc. Brexit
Foreign exchange
Credit risk
Terrorism
Loss of key site/natural catastrophe/weather
35Annual Report and Accounts 2016 / National Express Group PLC

Principal risks and uncertainties
Looking forward, the Group will focus on the following key areas of risk:
Potential impact Management/mitigation
Economic conditions, including Brexit implications
Declining economic conditions potentially impact demand for the Group’s services in some divisions; improving economic conditions may impact the Group’s ability to recruit drivers and other staff, or cause inflationary pressure on costs.
The terms on which Brexit is negotiated (specifically in relation to the means by which any limitation on free movement/immigration is traded off against access to the single market) may affect the Group’s ability to bid competitively within the EU.
Geographical diversification; marketing strategy – services, fleet, CRM; innovation (including digital); close monitoring of revenue trends and implementation of revenue management systems; robust bid modelling; lobbying of Governments and local authorities on the importance of public transport. The Group continues to monitor the position regarding Brexit.
Political/geo-political/regulatory landscape
The political and regulatory landscape within which the Group operates is constantly changing. Changes to government policy, funding regimes or the legal and regulatory framework may result in structural market changes or impact the Group’s operations in terms of reduced profitability, increased costs and/or a reduction in operational flexibility or efficiency.
Constant monitoring of political landscape; effective stakeholder management; lobbying and communication; geographical diversification; strategic partnerships and alliances; operational excellence and cost efficiencies; lobbying of Governments and local authorities on the importance of public transport.
Increasing Competition
The Group’s divisions are facing increasing competition in various ways; price competition, inter-modal (eg coach vs rail), and more recently emerging threats such as Uber or other new market entrants.
Focus on excellence of service delivery, marketing and customer proposition; shared best practice across divisions; continue to drive cost efficiencies.
Terrorism
The Group can be either directly impacted by a terrorist event, or indirectly, through softening demand from the travelling public.
Close liaison with government agencies and industry partners; major incident/emergency plans; business continuity plans; insurance coverage.
Safety, litigation and claims
A major safety-related incident (eg bus or rail accident) could impact the Group both financially and reputationally. The Group self-insures a proportion of certain risks such as workers’ compensation and auto liability, and higher than planned claims or cash settlements could adversely affect profit and cash outflow. The Group’s operations are also subject to potential litigation from other sources such as environmental legislation or wage and hour matters in the US.
Strong safety culture driven from the Group Chief Executive and divisional leadership; continued success and evolution of Driving Out Harm programme; investment in technology such as Lytx DriveCam; World Class Driver programme; Group Safety Committee; divisional safety management systems; insurance coverage; experienced claims management and legal teams across the Group supported by external legal advice where appropriate.
HR and labour relations
Ineffective succession planning could lead to leadership voids at divisional or Group level.
Lack of available talent/leadership skills can inhibit growth. Shortages in drivers and other key staff can disrupt operations. Increased unionisation and/or poor labour relations presents increased risk of strike or operational disruption; inflation of wage and benefit costs; and possible reputational damage.
Employee engagement and retention programmes – surveys, communication and education programmes, training for managers and supervisors, reward and recognition programmes; management of stakeholder and union relationships; advice of specialist outside counsel.
Strategic Report
36 National Express Group PLC / Annual Report and Accounts 2016

Potential impact Management/mitigation
Changing customer expectations in a digital environment
Customers increasingly expect to be able to buy tickets and manage their travel plans through a variety of digital platforms, including the internet, tablets and smartphones. Failure to develop applications and digital channels that are reliable, meet these increasing customer expectations and improve business operational processes could affect profitability, customer satisfaction and the business’ ability to capitalise on valuable customer data to enable commercial initiatives.
Failure to develop adequate digital sales channels could lead to others (intermediaries) driving the agenda, eroding margins and preventing the capture of valuable customer data.
Appointment of Chief Digital Officer; comprehensive digital strategies being developed in divisions; divisional ‘digital scorecards’ reviewed by monthly Executive meetings to monitor the effectiveness of various digital channels.
IT and cyber risks
A major IT failure could disrupt operations and lead to loss of revenues, especially in the Coach businesses. The Group recognises a wide range of cyber threats, including loss of data, social engineering, hacking and extortion.
Comprehensive back-up procedures and disaster recovery plans; dedicated Cyber Risk Security Committee; external expert testing carried out for cyber risk and recommendations implemented.
Credit risk
As contractual operations, the North American and Spanish urban businesses are exposed to the risk that customers are either late or unable to pay sums owed to the Group.
Receivables in each business are closely monitored, based on robust and thorough documentation; provisions are then made where appropriate on a prudent basis for a certain level of non-collection. Additional contractual terms for interest accrual and repayment of outstanding balances have been agreed with overdue debtors where necessary.
Hazard risk to key site (eg fire); natural catastrophe; extreme weather
Asset loss/damage; revenue/profit loss due to business interruption; loss of competitive position in the market.
Geographical diversification; emergency plans; continuity and asset replacement plans; insurance coverage.
Foreign Exchange
The Group’s exposure to overseas earnings through its Spanish and North American operations creates a risk that movement in exchange rates may adversely impact translation of profit and cash flows together with Group gearing. In 2016, this resulted in a benefit to the Group as opposed to a risk.
The Group uses currency debt and currency swaps to reduce the impact and mitigate the risk. In addition, management has flexibility to adjust Group capital allocation.
Fuel cost
Fuel represents a significant cost to the Group and unplanned increases in fuel price potentially impact profitability.
Hedging strategy – 100% of fuel is hedged for 2017.
Pension costs
Market conditions and/or deficit may lead to increase in service costs and/or increased deficit recovery payments.
Defined benefit schemes closed to new entrants; potential transfer of UK Bus Dundee scheme to Council; specialist external advice.
37Annual Report and Accounts 2016 / National Express Group PLC
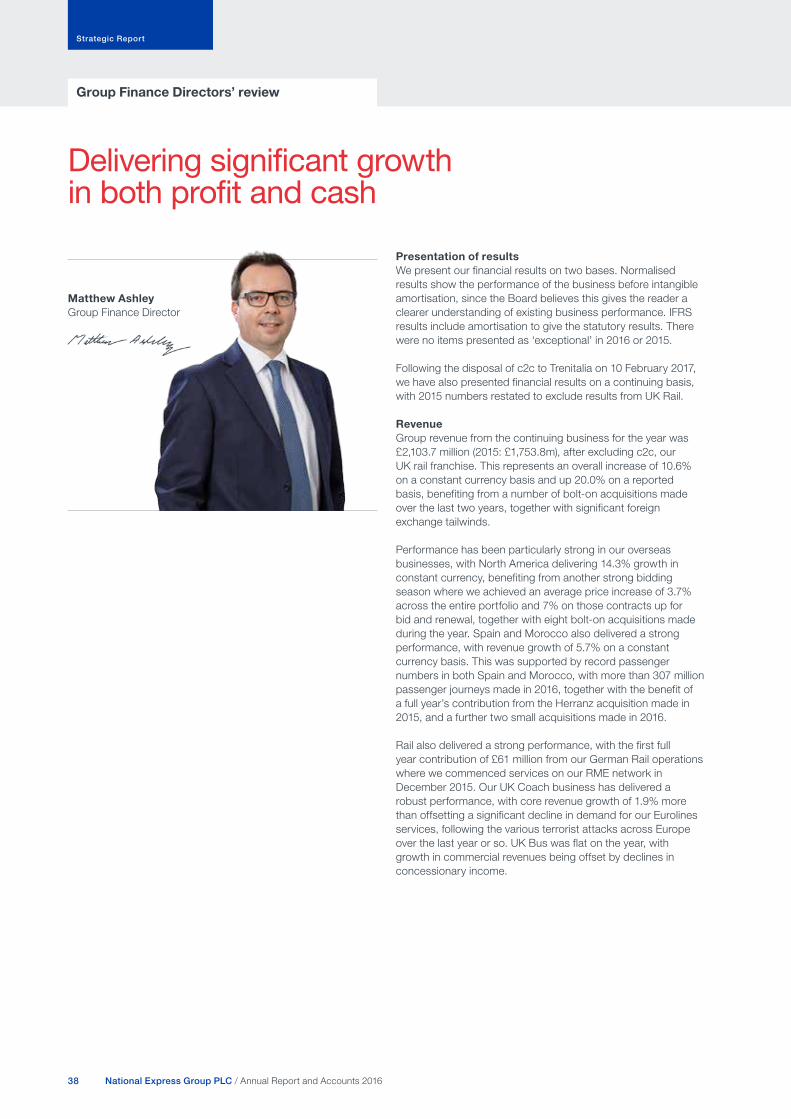
Group Finance Directors’ review
Delivering significant growth in both profit and cash
Presentation of resultsWe present our financial results on two bases. Normalised results show the performance of the business before intangible amortisation, since the Board believes this gives the reader a clearer understanding of existing business performance. IFRS results include amortisation to give the statutory results. There were no items presented as ‘exceptional’ in 2016 or 2015.
Following the disposal of c2c to Trenitalia on 10 February 2017, we have also presented financial results on a continuing basis, with 2015 numbers restated to exclude results from UK Rail.
RevenueGroup revenue from the continuing business for the year was £2,103.7 million (2015: £1,753.8m), after excluding c2c, our UK rail franchise. This represents an overall increase of 10.6% on a constant currency basis and up 20.0% on a reported basis, benefiting from a number of bolt-on acquisitions made over the last two years, together with significant foreign exchange tailwinds.
Performance has been particularly strong in our overseas businesses, with North America delivering 14.3% growth in constant currency, benefiting from another strong bidding season where we achieved an average price increase of 3.7% across the entire portfolio and 7% on those contracts up for bid and renewal, together with eight bolt-on acquisitions made during the year. Spain and Morocco also delivered a strong performance, with revenue growth of 5.7% on a constant currency basis. This was supported by record passenger numbers in both Spain and Morocco, with more than 307 million passenger journeys made in 2016, together with the benefit of a full year’s contribution from the Herranz acquisition made in 2015, and a further two small acquisitions made in 2016.
Rail also delivered a strong performance, with the first full year contribution of £61 million from our German Rail operations where we commenced services on our RME network in December 2015. Our UK Coach business has delivered a robust performance, with core revenue growth of 1.9% more than offsetting a significant decline in demand for our Eurolines services, following the various terrorist attacks across Europe over the last year or so. UK Bus was flat on the year, with growth in commercial revenues being offset by declines in concessionary income.
Matthew AshleyGroup Finance Director
Strategic Report
38 National Express Group PLC / Annual Report and Accounts 2016
Normalised profitGroup normalised operating profit for continuing operations increased by 4.8% to £219.0 million on a constant currency basis; up 14.2% on a reported basis (2015: £191.8m). Growth of £10 million from our existing businesses, together with an £18 million contribution from the 11 acquisitions made in 2016 and the full year benefit of acquisitions completed in 2015, more than offset net cost inflation of £13 million. We also saw a £6 million benefit from lower fuel prices as a direct result of our hedging policy, with further significant fuel cost savings to come in 2017 and 2018. The £10 million increase, year on year,
Revenue bridge for the continuing operations £mPercentage
change
2015 full year revenue 1,754
Currency translation 148
2015 full year revenue at constant currency 1,902
Organic growth 48 2.5%
Acquisitions 93 4.9%
German Rail 59 3.1%
Weather 2 0.1%
2016 full year revenue 2,104 10.6%
Profit bridge for the continuing operations £mPercentage
change
2015 normalised full year operating profit 192
Currency 17
Operating profit at constant currency 209
Growth 10
Acquisitions 18
Bid and acquisition related costs (5)
Cost inflation (30)
Cost efficiency 17
Fuel price benefit 6
Insurance cost in North America (7)
Weather 1
2016 normalised full year operating profit 219 4.8%
in operating profit on a constant currency basis is also after an increase in bid and acquisition-related costs of £5 million. Our new Group Director of Insurance and Risk has reviewed all historical claims and as a consequence of this review of our growing business together with providing in full for the insurance deductibles for the Chattanooga accident, resulted in costs rising by £7 million.
Group operating profit margin declined by 55 basis points to 10.4%, reflecting a larger contribution from our North American business together with the small loss in our German Rail business and a decline in profit in our UK Bus business.
39Annual Report and Accounts 2016 / National Express Group PLC

Group Finance Directors’ review continued
efficiencies. Reported operating profit increased by 18.5%, reflecting the significant weakening in Sterling.
UK Coach also delivered growth in profits, with operating profit up 3.1%, reflecting growth in new routes together with cost efficiencies. Our UK Bus operations had a challenging year with operating profit down £2.0 million, primarily caused by the £3 million reduction in concessionary income.
Our German Rail operations delivered a small operating loss of £1.5 million in its first full year of operations and we are targeting to make a small profit in 2017.
number of one-off items, with the main ones being the release of tax provisions and recognition of losses. Details of the tax reconciliation are in note 10(c).
Looking forward, and depending on profit mix, new business opportunities and the future tax environment, including new restrictions on tax deductions for interest expense in the UK, we expect the normalised effective tax rate to increase from 2017 and to likely settle around the mid 20’s percentage range in the longer term. However, further out, rates may reduce if the new US administration reduces the US federal corporate income tax rate as is widely expected. We would expect the cash tax rate to be less than 15% for the next two years as we utilise brought forward tax losses, mainly in the US, during this period.
Normalised profit after tax for the year was £138.4 million (2015: £120.2m), with a basic EPS of 27.3 pence (2015: 23.4p), an increase of 16.7%. An increase of 10% in the final dividend to 8.41 pence has been proposed, reflecting our long-term dividend policy of ensuring that full year dividends are covered around two times by Group earnings.
Segmental profit performanceOur overseas businesses were the strongest performers, with North America profit increasing by 11.9% on a constant currency basis and up 25.7% on a reported basis, benefiting from the significant weakening of Sterling against world currencies post the EU referendum result.
Acquisitions made in 2015 and 2016 have delivered strong growth, with those acquisitions made in 2015 achieving ROIC of between 15% and 20%. In Spain and Morocco, operating profit increased by 5.3% on a constant currency basis, driven by a combination of organic growth, acquisitions and cost
Income from associates was £1.1 million (2015: £1.8m) and is predominantly earnings from Bahrain.
Net finance costs increased to £50.0 million (2015: £45.2m), reflecting interest costs of £3.2 million on the bridging facilities ahead of the repayment of the £350 million bond in January 2017 together with a slightly higher level of average debt.
Including the results from UK Rail, normalised operating profit rose by 15.7% to £223.9 million (2015: £193.5m) and normalised profit before tax increased by 16.6% to £175.0 million (2015: £150.1m).
Excluding UK Rail, on a continuing basis normalised profit before tax was £170.1 million (2015: £148.4m), an increase of 14.6%.
The normalised tax charge from continuing operations was £31.7 million (2015: £28.2m), a normalised effective tax rate of 18.6% (2015: 19.0%). The tax charge for 2016 included a
Segmental operating profit from continuing operations
2016 Local
currency
2015 Local
currency2016
£m2015
£m
Spain and Morocco 103.7 98.5 84.7 71.5
North America 113.9 101.8* 84.0 66.8
UK Bus 35.5 37.5
UK Coach 33.3 32.3
German Rail (1.8) (0.1) (1.5) (0.1)
Central functions (17.0) (16.2)
Group 219.0 191.8
* Operating profit at constant currency, adjusting for Canadian Dollar to US Dollar foreign exchange rate movement in the year.
Strategic Report
40 National Express Group PLC / Annual Report and Accounts 2016

recent acquisitions in North America and Spain. Profit for the year, after amortisation, was a record high of £120.0 million (2015: £109.1m), up 10%. Basic EPS, after amortisation, was 23.0 pence (2015: 20.9p), an increase of 10.0%.
Exceptional itemsThere were no exceptional items in the period or the prior year.
IFRS resultsIntangible amortisation increased to £33.8 million (2015: £25.7m), reflecting the weakening of Sterling together with
Summary income statement
2016 Total
£mUK Rail
£m
2016 Cont’
£m
2015* Cont’
£m
Revenue 2,279.2 175.5 2,103.7 1,753.8
Operating costs (2,055.3) (170.6) (1,884.7) (1,562.0)
Normalised operating profit 223.9 4.9 219.0 191.8
Share of results from associates 1.1 – 1.1 1.8
Net finance costs (50.0) – (50.0) (45.2)
Normalised profit before tax 175.0 4.9 170.1 148.4
Tax (32.7) (1.0) (31.7) (28.2)
Normalised profit after tax 142.3 3.9 138.4 120.2
* 2015 results restated to exclude the results from UK Rail.
IFRS profit2016
£m2015
£m
Normalised profit before tax 170.1 148.4
Intangible amortisation (33.8) (25.7)
Profit before tax 136.3 122.7
Tax charge (20.2) (15.0)
Profit for the year from continuing operations 116.1 107.7
Profit after tax for UK Rail – discontinued operations 3.9 1.4
Total profit for the year 120.0 109.1
41Annual Report and Accounts 2016 / National Express Group PLC

Group Finance Directors’ review continued
The Group generated cash flow of £132.7 million (2015: £98.5m), up £34.2 million on last year, which was available for growth capital projects, bolt-on acquisitions and dividends. The majority of the £27.0 million growth capital investment has been in growing our fleet on new services such as in Morocco, investment in revenue management systems for our coach services in the UK and Spain, investment in new contactless ticketing machines in UK Bus and investment to support our growth in Rail, both in the UK and Germany.
We have continued our strategy of making selective bolt-on acquisitions where the returns and strategic fit meet our strict criteria. During the year we invested in 11 acquisitions, eight of which were in our North America School Bus and Transit operations, in line with our stated strategy to exploit new growth opportunities in this market. We have also acquired two small businesses in ALSA, one for a regional bus contract in Ibiza and one for a private transfer operator in Switzerland. Our UK Coach business has also made a small bolt-on acquisition of a private hire business. Total net consideration was £122 million for the acquisitions, with a total of £88.8 million being paid in 2016 including £24 million of deferred consideration for acquisitions made in 2015.
Return on capital employed is a key factor in our incremental investment decisions and we are pleased with the progress we have made with the Group’s return on capital increasing by 20 basis points to 11.9%.
Net funds flow for the period was an outflow of £132.5 million (2015: £81.2m), with year-end net debt of £878.0 million (2015: £745.5m) reflecting two main factors: investment in acquisitions of £88.8 million during the period and the significant net outflow of £90.5 million, virtually all on the retranslation of foreign currency debt balances and the maturity of some foreign exchange contracts, caused by the significant weakening of Sterling against both the US Dollar and the Euro as commented above.
The Group maintains gearing discipline by matching the currency denomination of its debt to the currency in which EBITDA is earned. Simply put, gains from foreign exchange on EBITDA offset increases in debt due to movements in foreign exchange. As such, gearing at the end of the period was 2.5 times EBITDA, within the Group’s target range of 2.0-2.5 times.
represents 110% of the depreciation charge and was £23 million higher than in 2015. The majority of the maintenance capital investment has been in fleet replacement in the UK, Spain and North America.
This has resulted in £138.6 million of free cash flow being generated over the year (2015: £111.0m), an increase of £27.6 million on the prior year. This free cash flow was well ahead of our £100 million target and in light of our positive momentum, including the disposal of c2c and the discharge of the capital commitments therein, we are now increasing our target delivery to £120 million of free cash flow per annum, which we see as a sustainable level of cash generation going forward.
Cash managementCash generation is the result of delivering operational excellence and represents a key driver of shareholder value. Our strong and sustainable cash flows allow us to retain a disciplined focus on ROCE while supporting a capital investment programme that maintains fleet age at acceptable levels. Our current target is to invest around 1.1 to 1.2 times depreciation.
In 2016, the Group delivered operating cash flow of £201.3 million (2015: £164.9m), up 22.1%, reflecting the significant increase in EBITDA, up by £46.5 million to £344.6 million (2015: £298.1m). The increase in operating cash flow of £36.4 million is also after an increased level of maintenance capital expenditure, net of disposals, of £134.7 million. This
Free cash flow2016
£m2015
£m
Continuing normalised operating profit 219.0 191.8
UK Rail operating profit 4.9 1.7
Total normalised operating profit 223.9 193.5
Depreciation and other non-cash items 120.7 104.6
EBITDA 344.6 298.1
Net maintenance capital expenditure (134.7) (111.7)
Working capital (increase)/decrease (3.1) (11.8)
Pension contributions above normal charge (5.5) (9.7)
Operating cash flow 201.3 164.9
Receipts from associates and minorities (1.5) 0.7
Net interest paid (47.6) (43.4)
Tax paid (13.6) (11.2)
Free cash flow 138.6 111.0
UK Rail franchise exit outflow (1.0) (2.5)
Exceptional cash expenditure (4.9) (10.0)
Cash flow available for growth and dividends 132.7 98.5
Strategic Report
42 National Express Group PLC / Annual Report and Accounts 2016

DividendThe second half of 2016 saw a significant weakening of Sterling against world currencies with markets forecasting a broad range of future movements. In light of this volatility, our long-term dividend policy remains to pay a dividend covered two times by Group earnings. We propose a 10% increase in the final dividend giving an 8.4% increase in the full year dividend to 12.28 pence, which is 2.2 times covered.
Treasury managementThe Group maintains a prudent approach to its financing and is committed to an investment grade credit rating. The Board’s policy targets a level of debt that allows for disciplined investment and ample headroom on its covenants, with net debt to EBITDA at a ratio of 2.0x to 2.5x in the medium term. Both Moody’s and Fitch have reaffirmed their investment grade ratings in 2016.
The Group’s key debt ratios as at 31 December 2016 and 2015 were gearing of 2.5 times and a bank covenant that should not exceed 3.5 times. The interest cover ratio was EBITDA 7.0 times interest as at 31 December 2016 (2015: 6.6x) comfortably exceeding the bank covenant of not less than 3.5 times.
The Group has a strong funding platform that underpins the delivery of its strategy. Core funding is provided from non-bank sources, to provide improved certainty and maturity of funding.
During the year, the Group has been cognisant of market volatility and sought to actively manage liquidity and interest rate risk prior to the refinancing of the Group’s £350 million bond maturing in January 2017.
In January 2016, the Group entered into new bank facilities totalling £450 million, comprising a £350 million bridge-to-bond facility, together with a £100 million general corporate purposes facility. This bridging facility gave the Group significant flexibility, enabling the Group to choose the optimum moment to refinance taking into account the prevailing low interest rate environment, without incurring punitive refinancing charges.
Following the EU referendum result and prior to the US election, gilt rates were at historical lows. In September 2016, the Group entered into additional unsecured committed revolving credit facilities totalling £96 million. These new facilities are on the same terms as the Group’s £416 million bank facility and mature in November 2021. In November 2016, the Group issued a £400 million seven-year Sterling bond with a coupon of 2.5%. The proceeds were used to refinance the Group’s £350 million bond which matured in January 2017 and for general corporate purposes. Both facilities provide the Group with an appropriate level of liquidity and funding headroom together with ensuring significant interest savings going forwards.
Excluding the £350 million bond which was repaid in January 2017, the Group had £838 million of funding at the year end. This funding is primarily from two Sterling denominated bonds comprised of a £400 million bond maturing in 2023 and a £225 million bond maturing in 2020, a private placement of €78 million maturing in 2021 and £159 million of finance leases. The residual debt balance is funded from the Group’s £512 million revolving credit facilities, with a margin of 0.6% over LIBOR and maturing in 2021. At 31 December 2016, the Group had £830 million in cash and undrawn facilities available, which included £350 million used to repay the expiring £350 million bond in January 2017.
At 31 December 2016, the Group had foreign currency debt and swaps held as net investment hedges. These help mitigate volatility in foreign currency profit translation with corresponding movements in the Sterling value of debt. These corresponded to 2.1 times EBITDA earned in the US, held in US Dollars, and 2.4 times EBITDA earned in Spain and Germany, held in Euros. The Group hedges its exposure to interest rate movements to maintain a balance between fixed and floating interest rates on borrowings. It has therefore entered into a series of swaps that have the effect of converting fixed rate debt to floating rate debt. The net effect of these transactions was that, at 31 December 2016, the proportion of Group net debt at floating rates was 24% (2015: 34%).
Net funds flow2016
£m2015
£m
Cash flow available for growth and dividends 132.7 98.5
Net growth capital expenditure (27.0) (36.4)
Acquisitions and disposals (88.8) (69.4)
Dividends (58.9) (54.4)
Other, predominantly foreign exchange (90.5) (19.5)
Net funds flow (132.5) (81.2)
43Annual Report and Accounts 2016 / National Express Group PLC

Group tax policyWe are committed to creating shareholder value through our four strategic goals: a focus on operational excellence; investment in technology; growth through targeted acquisitions; and an active focus on talent. The Group tax strategy supports these goals.
We pursue a cautious approach to our tax affairs which are aligned to business transactions and economic activity. Our approach to tax can be evidenced by the lack of outstanding tax audits as detailed in the Annual Report and Accounts. There are no outstanding tax audits in any of our main three markets of the UK, Spain and the US.
In order to gain as much certainty as possible, tax matters are largely discussed in ‘real time’ with the tax authorities in the markets in which we operate. For example, the proposed disposal of our UK rail business, which was announced in January 2017, was communicated to HMRC at that time rather than when the tax return is submitted in December 2018. We have a constructive and good working relationship with the various tax authorities. However, due to the complexity of tax legislation, the Group and tax authorities may sometimes have differing opinions. The Group manages risk and accrues for areas of tax uncertainty in line with accounting standards requirements, where appropriate. The Group Tax Department reports on a regular basis on the Group’s tax matters, with the Board and the Audit Committee apprised of any significant tax matters.
PensionsThe Group’s principal defined benefit pension schemes are all in the UK. The combined deficit under IAS 19 at 31 December 2016 for the continuing operations was £88.2 million (31 December 2015: deficit of £12.6m). The two principal plans are the UK Group scheme, which closed to new accrual in 2011, and the West Midlands Bus scheme, which remains open to accrual for existing active members only. We are currently in negotiations with the trustees of each of these schemes with respect to future deficit payments and anticipate that the overall level of contribution will remain at around £10 million per annum.
The IAS 19 valuations for the principal schemes at 31 December 2016 were as follows:
• UK Bus (under the WM scheme and the Tayside Transport Superannuation Fund): £128.5 million deficit (2015: £60.4m deficit)
• UK Group scheme: £44.5 million surplus (2015: £34.9m surplus)
The net pension surplus for c2c’s participation in the Railways Pension Scheme has been transferred following the disposal of the rail franchise to Trenitalia.
Fuel costsThe Group consumes approximately 225 million litres of fuel each year for which it is at risk (ie there is no direct fuel escalator in the contract or concession price) all of which relates to the non-Rail divisions. Fuel costs from non-Rail divisions represented a total cost (including delivery and taxes) to the Group in 2016 of £168 million (approximately 8% of related revenue), at an average fuel component cost of 45.4 pence per litre. The Group has adopted a forward fuel buying policy in order to secure a degree of certainty in its planning. This policy is to hedge fully a minimum of 15 months’ addressable consumption against movements in price of the underlying commodity, together with at least 50% of the next nine months’ consumption in the contract businesses. Currently, the Group is 100% fixed for 2017 at an average price of 42.6 pence/litre (excluding delivery and tax), 89% fixed for 2018 at an average price of 33 pence, 50% fixed for 2019 at 33 pence and 10% fixed for 2020 at 33 pence. We anticipate fuel savings of around £6 million in 2017 and around £20 million in 2018, assuming the balance of the fuel hedging for 2018 is transacted around the current spot price for fuel.
Where businesses have freedom to price services, this hedge provides sufficient protection to recover fuel price increases through the fare basket. In contract businesses, where price escalation may be restricted by a formula independent of fuel costs, extended cover, up to the life of the contract, may be taken, subject to availability and liquidity in the hedging market. The latter is rarely available beyond three years from the trade date.
Sale of c2c to TrenitaliaThis transaction completed on 10 February 2017 and will be accounted for in the Financial Statements for the year ending 31 December 2017. The consideration received was £72.6 million and a further £35 million was received to settle intercompany loans. This transaction, including anticipated costs of right sizing the UK business post UK rail, has resulted in a small profit on disposal.
Finally, I would like to say how much I have enjoyed my time as Group Finance Director and that I am looking forward to my new role within the Group as President and Chief Executive Officer of North America. I would like to welcome Chris Davies to the Group and wish him well in his new role.
Matthew Ashley Group Finance Director 23 February 2017
Group Finance Directors’ review continued
Strategic Report
44 National Express Group PLC / Annual Report and Accounts 2016

Going concernThe Group’s business activities, together with the factors likely to affect its future development, performance and position are set out in the Strategic Report. The financial position of the Group, its cash flows, liquidity position and borrowing facilities are described in the Group Chief Executive’s review on pages 6 to 13 and the Group Finance Director’s review on pages 38 to 44. In addition, note 2 to the Financial Statements includes the Group’s objectives, policies and processes for managing its capital; its financial risk management objectives; details of its financial instruments and hedging activities; and its exposure to credit risk and liquidity risk.
The Group has a formalised process of budgeting, reporting and review, which provides information to the Directors which is used to ensure the adequacy of resources available for the Group to meet its business objectives.
The Directors confirm that they have a reasonable expectation that the Company and the Group have adequate resources to continue in operational existence for the foreseeable future. In reaching this opinion, the Directors reviewed assumptions about current trading performance, together with information from the annual budget process, which sets out the Group’s plan for 2017, and the strategic planning process which determines the Group’s trajectory for 2018 to 2019. Accordingly the Directors continue to adopt the going concern basis of accounting in preparing the annual Financial Statements.
Viability statementIn accordance with provision C2.2 of the UK Corporate Governance Code 2014, the Board has assessed the viability of the Group over a three-year period to December 2019. This takes into account the Group’s current position and the potential impact of the principal risks and uncertainties outlined on pages 34 to 37 of the Strategic Report.
The Board has determined that a three-year period is an appropriate period over which to provide its viability statement, as this is the period reviewed by the Board as part of the annual strategic planning process. In making this statement, the Board carried out a robust assessment of the principal risks and uncertainties facing the Group, including those that would threaten the business model, future performance, solvency and liquidity. Sensitivity analysis is applied to the cash flows to model the potential effects should principal risks actually occur; and consideration is given to the availability and likely effectiveness of mitigating actions that could be taken to avoid or reduce the impact or occurrence of the identified risk.
Based on this assessment, the Board confirms that it has a reasonable expectation that the Group will be able to continue in operation and meet its liabilities as they fall due up to 31 December 2019.
45Annual Report and Accounts 2016 / National Express Group PLC

Business review: Spain and Morocco
Strong growth in both Spain and Morocco with record passenger numbers
Market overviewALSA holds the market-leading position in the regulated and highly segmented bus and intercity coach market in Spain and also operates in four cities in Morocco. Three levels of government regulation apply in Spain: national (long-distance coach), regional (regional coach) and city (urban bus). Each concession is exclusive to the operator, based on compliance with the public service obligation. Inter-city competition comes from state-backed rail and low-cost airlines. Bus and coach concessions are awarded through competitive public tender, typically every ten years.
Market size
€3.7bnConcessions
171• 171 concessions: 125 intercity coach concessions,
30 urban bus contracts, 16 others• Concessional renewal process at early stage• New contract wins in Spain• Revenue management generating passenger and
revenue growth in Spain• Continuing urbanisation of the Moroccan economy
with rapid migration to the major cities• Further bolt-on acquisition opportunities
Year ended 31 December2016
m2015
m
Revenue £597.3 £502.2
Normalised operating profit £84.7 £71.5
Revenue €731.2 €691.8
Normalised operating profit €103.7 €98.5
Operating margin 14.2% 14.2%
Overview of 2016ALSA has set another record for passengers carried in the year, with strong growth in both Spain and Morocco, helping to drive increases in revenue, profit and margin in the division. Total divisional revenue grew by 5.7% to €731.2 million (2015: €691.8m) and normalised operating profit rose 5.3% to €103.7 million (2015: €98.5m), both in constant currency.
In Spain, revenues rose by 5.7% driven by increased passenger journeys together with the full year contribution from the acquisition of Herranz, the benefit of a new contract to operate transport services for holidaymakers (Imserso) and a small acquisition of a regional bus business in Ibiza. Towards the end of the year, we also started to see the benefits of the newly implemented real-time active revenue management system (‘RMS’), contributing 1% revenue growth for the year as a whole. In Morocco we have seen another year of good growth, with revenues up 5.4%, driven by an increase of 6% in passenger journeys, supported by further expansion of services in Tangier and the first full year of operations in Khouribga. Operating margin was maintained at 14.2%, still industry-leading for a Spanish bus and coach operator.
We have successfully renewed two small national franchises ahead of the new concession retendering process which was introduced towards the end of 2016. We believe we are increasingly well placed in the renewal process and do not expect any impact to be felt in 2017 and only minimally in 2018. We also won a new ten-year contract to operate services at Granada Airport.
With the significant weakening of Sterling against the Euro during 2016, reported revenues increased by 18.9% to £597.3 million (2015: £502.2m) and operating profit increased by 18.5% to £84.7 million (2015: £71.5m).
Francisco IglesiasChief Executive, ALSA
Strategic Report
46 National Express Group PLC / Annual Report and Accounts 2016

€m
2015 normalised operating profit 99
Growth 3
Acquisitions 4
Other cost inflation (10)
Cost efficiencies 5
Fuel 3
2016 normalised operating profit 104
Cash and returnsIn 2016, ALSA delivered another strong performance, generating operating cash of €110 million with operating cash conversion of 106%. We have invested in a higher level of capital expenditure year on year, with growth capital expenditure focused predominantly on new fleet to support the continuing expansion of our operations in Morocco and the implementation of the new, more sophisticated RMS.
Delivering operational excellenceALSA is widely recognised as an industry-leading operator for which it has consistently received awards. In 2016, this included the Best Customer Experience seal for passenger transport, ranking ahead of all other ground transport and air operators in Spain. We have also seen a 3% improvement in our customer satisfaction score and this has helped drive a record year of over 307 million passenger journeys made on our services in Spain and Morocco.
Over the last few years we have made great progress in improving safety standards in our operations in Morocco and in 2016 we were delighted to have received the prestigious Prince Michael International Road Safety Award, which recognises achievements and innovations in road safety management.
We have also delivered further improvements in maintenance standards resulting in a 6% reduction in breakdowns following a 20% reduction in 2015. We continue to reduce fuel consumption through an ongoing programme of consumption improvement measures, including fuel efficient driver training.
ALSA currently holds a four-star European Foundation for Quality Management (‘EFQM’) rating, and is working hard to secure a five-star rating shortly.
Deployment of technologyWe are increasingly looking at how we utilise technology in order to raise customer and safety standards, drive efficiencies and generate sales, margin and cash.
As part of our ongoing focus on improving safety standards, we will install DriveCam technology in Spain within three years. Evidence from our pilots shows this technology helps to reduce the number of collisions and insurance costs. During 2016 a strong emphasis on driver assessment and training helped to deliver a 10% reduction in the number of preventable accidents.
In the past year we have implemented a more sophisticated RMS, which operates on over 200 flows. This more sophisticated system significantly enhances our capability to actively manage pricing on a real-time basis and provides a competitive edge against the likes of RENFE and also in future bidding of contracts. In 2016, RMS increased revenue on these corridors by 0.8% and boosted seat occupancy by 1.1%. With the system now fully implemented, this should further drive revenue, profit and incremental demand.
Leveraging UK Coach’s leadership, we have made significant progress in 2016 in increasing our digital capabilities in areas such as customised e-marketing, and the development of new apps offering improved functionality together with personalised journey planners, content and offers. Shorter loading times and more convenient and faster methods of payment are resulting in higher conversion rates. At the same time this is helping to secure reduced costs of sale: in 2016 we drove a further increase in the proportion of sales through our digital channels and ticketing machines, with nearly 40% of transactions now conducted this way. We have seen particularly strong growth in sales transacted through mobile channels, with the launch of the new app driving growth of 40%.
47Annual Report and Accounts 2016 / National Express Group PLC

Business review: Spain and Morocco continued
Creating new opportunitiesThe acquisition of Herranz in 2015 has made a strong contribution to growth and profits during 2016. We have made further bolt-on acquisitions in 2016, with the purchase of a regional bus operator in Ibiza, gaining entry into a new market and increasing our exposure to the tourist market. At the end of the year we also acquired AlpyBus, in Switzerland, serving the lucrative ski and alpine tourist markets. Both acquisitions are expected to be accretive within the first 12 months after transaction and we will consider further bolt-on acquisitions where they meet our strict financial criteria.
We continue to see strong growth prospects in Morocco. Since 2012 we have grown both passengers and revenues by over 70% in Morocco. In 2016, we have extended our services in Tangier and saw the first full year of operations in Khouribga. We also won a six-year contract to operate sightseeing services in Marrakech. As well as continuing to grow our existing operations, we see further growth opportunities with the addition of services in new cities, and have recently submitted a bid to operate the Casablanca Tramway, with the contract commencing in December 2017.
Our continuing focus is to ensure we are well placed for the concession renewal process which we expect to pick up pace towards the end of 2017. However, not only have we won both concessions that have so far come up for renewal where we were the incumbent operator, we have also delivered strong margins post-retendering as our fare reductions generated significant passenger growth.
The terms of retendering competitions have recently been altered to emphasise service quality and competitive yet sensible pricing that reduces the opportunity for speculative, very low-cost bids and plays to our strengths. We believe that our focus on operational excellence and understanding of price elasticities through our upgraded RMS – which will get more sophisticated as it gathers more data and analytical capabilities – gives us unrivalled knowledge of the market and places us at a competitive advantage as concession renewal gathers pace later this year. Further, the geographic clustering of the contracts gives us a further advantage as we are able to secure further synergies and cost savings.
We therefore enter 2017 with confidence in our ability to secure good results from the renewal process. We do not expect any real impact on revenues or profits until 2019, and even then our recent success and the changes to the terms of the retendering competition means we are increasingly optimistic we will deliver a strong result then. With no impact this year, we now expect the worst case scenario for 2018 operating profit to be a reduction of up to €3 million from those contracts up for renewal. While we have always expected there to be pressure on margins on the renewal of contracts, the results of our recent retendering suggests there is the opportunity to maintain good margins through significant passenger growth. Nonetheless, we maintain our programmes to mitigate any impact through, for example: fuel savings; further cost efficiencies; the benefits from a more sophisticated revenue management system in Spain; targeted acquisitions; and additional opportunities for growth in Morocco. We are also looking at other opportunities in new markets in Europe where we can achieve attractive returns.
Strategic Report
48 National Express Group PLC / Annual Report and Accounts 2016

Strong bid season and high returns from acquisitions
Market overviewNational Express is the second largest player in the North American school market with a 13% share of the outsourced school bus market. 33% of the market is outsourced with recent increases in outsource conversion being driven by pressure on public funding. This trend is likely to continue as school district budgets remain constrained. Typically customers are local school boards where local relationships are key and service delivery is very important. National Express also operates in the North American public transit market, 32% of which is outsourced and where there is an increasing demand for accessible public transportation services, for fixed route, paratransit and employee shuttle services.
Market size
$24bnOperates
22,800school buses
• Bolt-on acquisition opportunities in School Bus and Transit• New business growth from winning contracts in school
bidding season and through new transit contracts
David DukeChief Executive, National Express Corporation
Year ended 31 December2016
m2015
m
Revenue £877.2 £683.2
Operating profit £84.0 £66.8
Revenue US$1,189.0 US$1,040.6*
Operating profit US$113.9 US$101.8*
Operating margin 9.6% 9.8%
* Revenue and operating profit at constant currency, adjusting for Canadian Dollar to US Dollar foreign exchange rate movement in the year.
Tragic accident in ChattanoogaThe tragic accident in Chattanooga, Tennessee, has taken six children far too soon, has injured others, and left families and friends grieving. We are profoundly sorry that such an accident should happen on one of our school buses.
We sought to move quickly, but respectfully, to offer appropriate support to the families and local community. We have – and will continue to – provide any assistance to the ongoing investigations. While we have accelerated existing pilot programmes – the installation of Lytx DriveCam and a cloud-based communications portal with customers – we will also learn any lessons identified and implement appropriate changes.
Overview of 2016Our North American business has delivered strong growth in revenue and operating profit. On a constant currency basis* revenue grew by 14.3% with operating profit increasing by 11.9% to $113.9 million (2015: $101.8m). Since 2009, our North American division has grown profit by 188%.
We continued to focus on driving profitable growth and improving the quality of our portfolio, through acquisitions, winning new business that generates attractive returns and exiting those contracts that fall below our minimum return criteria (an ‘up or out’ strategy). We have had another successful bidding season, achieving price increases of 7% on those contracts up for renewal and an average price increase across the entire portfolio of 3.7%. This has offset increased costs from ongoing driver wage pressure and regulatory requirements such as Obamacare. These trends of increasing prices and wage pressure have continued into the current bid season. We continue to maintain a relentless focus on costs and the streamlining of operations with the benefits of the ‘up or out’ strategy helping to offset pressure on drivers’ wages.
Business review: North America
49Annual Report and Accounts 2016 / National Express Group PLC

Business review: North America continued
Insurance costs have increased following a thorough review of our open claims by our new Group Director of Insurance and Risk and as a result of providing the full deductible for the claims associated with the accident at Chattanooga.
During the period we have seen a strong contribution from the acquisitions we have made in the past two years. We are very pleased with the level of returns we are achieving, with the acquisitions made in 2015 achieving around 15-20% return on capital. We also generated operating cash flow of $133 million in North America which was nearly twice the cash consideration paid in year for our bolt-on acquisitions.
$m
2015 normalised operating profit 102
Exchange movement (CAD to USD) 0
2015 normalised operating profit at constant currency* 102
Net impact of revenue growth 9
Fuel cost 2
Cost inflation (16)
Cost efficiencies 10
Insurance costs (9)
Weather 1
Acquisitions 19
Acquisition costs expensed (4)
2016 normalised operating profit* 114
Cash and returnsOperating cash flow represented a conversion of 117% of operating profit with $133 million of operating cash delivered in the year. This represents a significant increase from 2015 and primarily reflects an inflow from working capital.
Delivering operational excellenceOur North American operation already delivers best in class margins. Traditionally, the school bus industry is a capital-intensive, low-cash generation business. In the past year we have continued to focus on increasing the return on capital across our portfolio of more than 500 contracts. Where we are not able to obtain financial returns above our minimum criteria, we have exited the contract – in the 2016/17 school year bid season we relinquished nine such contracts amounting to 550 buses. We continue to cascade buses where they meet the appropriate age criteria, thereby increasing fleet utilisation.
We have added a further 590 buses from new contract wins in 2016 in both School Bus and Transit operations. We had another successful year in Transit, growing annualised revenues by 60% to around $200 million with three new contracts wins and through bolt-on acquisitions, while maintaining a 100% customer retention rate.
In line with our strategy to increase investment in new growth opportunities in North America, we have made eight small bolt-on acquisitions, with four of those made in the final quarter of the year. Over the period we have added a net 1,030 buses, with the new business wins and acquisitions more than offsetting the contracts we regretted losing or chose to exit.
Change in school bus numbers – 2016 bid seasonNumber of buses
Regretted losses (670)
Exited per ‘up or out’ strategy (550)
Acquisitions 1,560
Conversion and share shift 590
Organic growth 100
Change in buses operated for 2016/17 school year 1,030
Our relationship-based approach continues to deliver superior service standards, with over 90% of our customers willing to recommend us on the basis of quality of service, safety and value. It is also securing an industry-leading contract retention rate of 97% for the last bidding season, excluding those contracts which we chose to exit.
We were delighted that our commitment to excellence and our pursuit of continuous improvement has been recognised for the second consecutive year with a Bronze Award from the Illinois Performance Excellence Recognition Programme, increasing our score by 50%. This is a North American equivalent to EFQM.
Strategic Report
50 National Express Group PLC / Annual Report and Accounts 2016

Deployment of technologyWe are increasingly looking at how we utilise technology in order to raise customer and safety standards, drive efficiencies and generate sales, margin and cash.
We remain committed to raising safety standards and are rolling out Lytx DriveCam technology across our locations, with the aim of having this technology installed on our vehicles by the end of 2019. DriveCam enables us to monitor individual driving behaviours and provide tailored training to each of our drivers. This should not only result in fewer collisions but also help to reduce insurance and associated costs of claims.
We have also been trialling a cloud-based complaints management portal, enabling our customers to communicate with us more quickly and efficiently, and we are aiming to have this available in all our locations by the end of 2017.
Following a successful trial in 2015 and in response to positive customer feedback, we have continued to roll out the ‘Where’s My Bus’ app, which provides parents with real-time tracking information.
Creating new opportunitiesWe have been highlighting, for some time now, the attractive growth opportunities available in the North American school bus and transit markets and have significantly increased our level of investment in both of these markets over the last two years. The school bus market remains highly fragmented with over 1,000 private school bus businesses in the US and we continue to believe that there is real opportunity in this market. We also see the transit market as a strong business development opportunity and building on another successful year in 2016.
During 2016, in line with this growth strategy, we invested in eight small bolt-on acquisitions that are either close to our existing business and where we can therefore drive synergies and operational improvements, or provide strategic entry to new markets. The acquisitions were five school bus businesses (two of which included transit operations) and two shuttle, private hire and paratransit businesses. These acquisitions have helped us create new hubs in strategic locations, such as New York, where we now have a presence in the coach, charter, school bus and paratransit market. We also made the strategic acquisition of Ecolane, a planning and scheduling software business in the paratransit market, which provides us with a market-leading bespoke technology platform. Ecolane strengthens our credentials in this attractive market, providing the potential to grow revenues through new third party contracts. With 14 new contracts won in the period since acquisition, it has also increased its success rate in tenders and the Ecolane employees are already discussing with ALSA how their technology could drive efficiencies. This is something we are also looking to apply in other divisions.
In total these acquisitions added 1,560 buses, 1,110 of which were school bus and 450 were transit vehicles. All are expected to be accretive within the first 12 months and have delivered returns between 15% and 20%, demonstrating our discipline and focus on returns. We have developed a real strength in identifying, completing and securing synergy benefits from, acquisitions. We have an active pipeline of further opportunities both in School Bus and Transit and, while remaining disciplined and focused on our strict returns criteria, believe there continues to be significant opportunity for growth and excellent shareholder value in this market.
We will again approach the upcoming bid season in a disciplined manner, including addressing the ongoing wage pressure the industry is experiencing. We will also continue to seek further capital-light opportunities through conversions and further improve the quality of the existing portfolio.
51Annual Report and Accounts 2016 / National Express Group PLC

Business review: UK Bus
Resilient performance in a challenging market
Market overviewThe largest five operators represent around 70% of the UK deregulated bus market, with the remainder of the market made up of a large number of private operators. Active competition comes from national and local bus operators, as well as private car and rail. In the short term the market has been impacted by economic pressures from austerity and local unemployment, but in the longer term, economic regeneration and environmentally driven public transport present growth opportunities over the car.
Market size
£4.8bn(UK excluding London)
Operates
1,670buses, focused in the West Midlands and Dundee markets
• Increase passenger volumes through investment in vehicles, technology and people and through delivering high quality services
• Low barriers to entry – flexibility and scale of operations is key• Devolved local transport budgets and services to regional
combined authorities may present opportunities to enter new regional markets
Peter CoatesManaging Director, UK Bus
Year ended 31 December2016
£m2015
£m
Revenue 286.8 286.4
Operating profit 35.5 37.5
Operating margin 12.4% 13.1%
Overview of 2016Along with the rest of the industry, we have experienced challenging market conditions during the year with congestion and changing travel patterns affecting revenue and profit. Commercial revenue growth of 2% has been offset by the, as anticipated, reduction in concessionary revenues, with the result that total revenue growth for our UK Bus division was just 0.1%.
Growth %
Like-for-like commercial revenue 1
Mileage 1
Underlying commercial revenue 2
Concession and other revenue (4)
Total revenue 0
Normalised operating profit fell by 5.3% to £35.5 million (2015: £37.5m), reflecting weak revenue growth combined with cost inflation. The operating margin has declined by 70 basis points to 12.4% (2015: 13.1%). While we did see a small benefit from lower fuel costs in the year, we expect to see larger benefits in 2017 and 2018 as a result of fuel hedging activity over the past 18 months or so.
£m
2015 normalised operating profit 38
Net impact from revenue growth (1)
Fuel cost 2
Other cost inflation (5)
Cost efficiencies 2
2016 normalised operating profit 36
Cash and returnsOur UK Bus business generates an excellent return on capital, delivering good asset utilisation and profitable returns on investment. We continued to invest in our new Platinum buses in 2016, where we see significantly higher growth in passenger volumes. This capital investment combined with a working capital outflow, in part due to the lower income from concessionary revenues, has resulted in a lower level of operating cash of £8 million.
We will continue to maintain our disciplined approach to investment, targeting areas which will deliver the greatest returns.
Strategic Report
52 National Express Group PLC / Annual Report and Accounts 2016

Delivering operational excellenceOur continued focus on delivering operational excellence and superior service standards has been recognised with prestigious industry awards, including the pre-eminent National Transport Award for Bus Operator of the Year. In 2016, we also achieved a 4% increase in the willingness of customers to recommend our services in the Transport Focus survey. Our introduction of contactless payment on the Midland Metro tram also received the award for Best Customer Initiative at the Global Light Rail Awards.
We also continued our strong track record of improving safety, for both customers and employees, resulting in a lower number of injuries and assaults, with for example a reduction of 27% in responsible Lost Time Injuries during the year. This also results in a reduced cost of claims. We were delighted to be presented with the prestigious British Safety Council Sword of Honour as well as achieving its five-star rating.
UK Bus has maintained a four-star rating from the European Foundation for Quality Management in its second assessment.
As part of the West Midlands Bus Alliance, we continue to work in partnership with Transport for West Midlands (formerly known as Centro) to improve the customer experience by addressing industry-wide challenges in a targeted way – for example, through the introduction of bus prioritisation measures at key pinch points to speed up journey times, in conjunction with associated investment in our state-of-the-art Platinum buses. We continue to see significantly higher levels of passenger growth on those routes where we offer such ‘express’ services. We are also seeing high levels of customer satisfaction on these Platinum routes, with scores well over 90%. Finally, UK Bus was the first privately-owned public transport company to introduce the Living Wage Foundation Living Wage for all staff.
Deployment of technologyWe are increasingly looking to utilise technology to raise customer and safety standards, drive efficiencies and generate sales, margin and cash.
We remain committed to raising safety standards and are rolling out Lytx DriveCam technology to 50% of our fleet by the middle of 2017. This technology enables us to monitor individual driving behaviours and provide tailored training to each driver; over 90% of our drivers who have received subsequent coaching improve their driving behaviours. Our initial pilots have shown this is not only leading to a lower number of incidents but also helping to reduce insurance costs.
We continue to look for more convenient ways for our customers to pay, and have successfully introduced contactless payment for the Midland Metro tram system in 2016 (it already accounts for 20% of on-board transactions). Drawing on this, contactless payment is being rolled out to our buses this year. We have continued to see strong take-up of smart ticketing options,
with growth of over 400% during the year and which now represent around 20% of journeys – the Swift smartcard is now twice as large as the next biggest smartcard outside of London. We have also launched a mobile ticket app, offering yet another innovative and convenient solution for our customers. These ticketing options also help to speed up journey times as well as reduce our sales distribution costs.
We are also refocusing a greater proportion of our marketing effort to digital channels, with campaigns such as our ‘Get more out of Christmas’ campaign, helping us to provide value fares and drive incremental demand, while reducing costs and improving returns.
Creating new opportunitiesFollowing the early positive evidence from recent targeted fare reductions we are implementing a plan to boost passenger numbers. We have extended these reductions to deeply discounted tickets in Sandwell and Dudley, supported by significant marketing activity, to encourage more trips among existing users and attract non-users as part of a granular approach to pricing that better reflects the local markets we are serving. If the pilot is successful we will roll this new approach out across the business.
We are complementing this new pricing with continued investment in technology such as the roll-out of new ticket machines this year to provide the largest network of contactless payment in public transport outside of London. This will simplify ticket purchasing and provide the opportunity to reassure customers through fare capping guarantees. Our tram services have pioneered this technology and already nearly 20% of on-board tickets are contactless purchases. We are also reviewing costs, including opportunities for further timetable efficiencies.
We also believe there is more scope for sales and marketing through our app and other digital sources. Our initial app and enhanced web presence has proven popular with customers, generating increased sales and encouraging signs of additional demand: 39% of app users say its launch is making them use the bus more often. We will shortly roll out a new combined app to bring together journey planning, real-time information and m-ticketing in one place. Following the successful launch of VUER, a free ‘infotainment’ system on services in the UK Coach business, we are also trialling it on our Platinum services, to enhance the on-board experience and drive passenger growth.
We continue to look for opportunities to grow outside of our core bus business and have secured a number of new contracts in 2016, including the provision of corporate transport services for Amazon to their distribution centres around the UK. The extension, in May 2016, of the Midland Metro tram service to the recently refurbished Birmingham New Street Station and new Grand Central shopping complex has helped drive record growth in passenger journeys of 29% in the year and we expect to see further strong growth this year.
53Annual Report and Accounts 2016 / National Express Group PLC
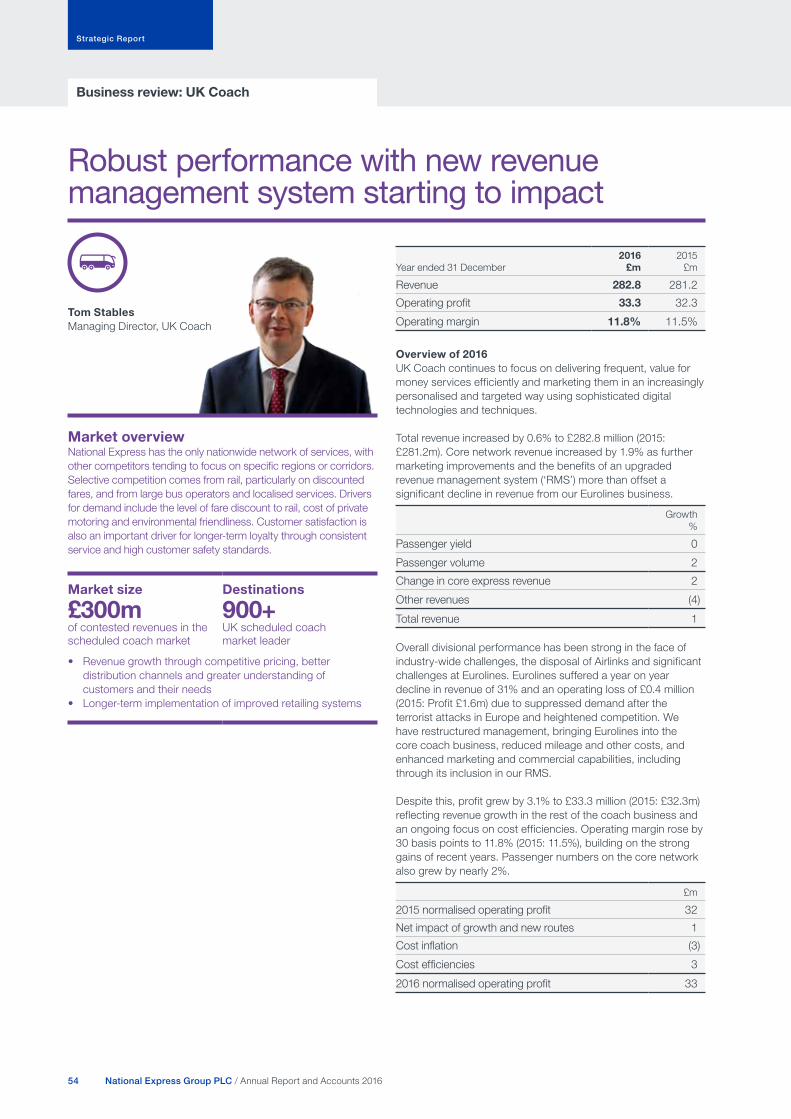
Business review: UK Coach
Robust performance with new revenue management system starting to impact
Market overviewNational Express has the only nationwide network of services, with other competitors tending to focus on specific regions or corridors. Selective competition comes from rail, particularly on discounted fares, and from large bus operators and localised services. Drivers for demand include the level of fare discount to rail, cost of private motoring and environmental friendliness. Customer satisfaction is also an important driver for longer-term loyalty through consistent service and high customer safety standards.
Market size
£300mof contested revenues in the scheduled coach market
Destinations
900+UK scheduled coach market leader
• Revenue growth through competitive pricing, better distribution channels and greater understanding of customers and their needs
• Longer-term implementation of improved retailing systems
Tom StablesManaging Director, UK Coach
Year ended 31 December2016
£m2015
£m
Revenue 282.8 281.2
Operating profit 33.3 32.3
Operating margin 11.8% 11.5%
Overview of 2016UK Coach continues to focus on delivering frequent, value for money services efficiently and marketing them in an increasingly personalised and targeted way using sophisticated digital technologies and techniques.
Total revenue increased by 0.6% to £282.8 million (2015: £281.2m). Core network revenue increased by 1.9% as further marketing improvements and the benefits of an upgraded revenue management system (‘RMS’) more than offset a significant decline in revenue from our Eurolines business.
Growth %
Passenger yield 0
Passenger volume 2
Change in core express revenue 2
Other revenues (4)
Total revenue 1
Overall divisional performance has been strong in the face of industry-wide challenges, the disposal of Airlinks and significant challenges at Eurolines. Eurolines suffered a year on year decline in revenue of 31% and an operating loss of £0.4 million (2015: Profit £1.6m) due to suppressed demand after the terrorist attacks in Europe and heightened competition. We have restructured management, bringing Eurolines into the core coach business, reduced mileage and other costs, and enhanced marketing and commercial capabilities, including through its inclusion in our RMS.
Despite this, profit grew by 3.1% to £33.3 million (2015: £32.3m) reflecting revenue growth in the rest of the coach business and an ongoing focus on cost efficiencies. Operating margin rose by 30 basis points to 11.8% (2015: 11.5%), building on the strong gains of recent years. Passenger numbers on the core network also grew by nearly 2%.
£m
2015 normalised operating profit 32
Net impact of growth and new routes 1
Cost inflation (3)
Cost efficiencies 3
2016 normalised operating profit 33
Strategic Report
54 National Express Group PLC / Annual Report and Accounts 2016

Cash and returnsThe UK Coach business model has a particularly strong return on capital and cash generation, outsourcing the majority of fleet provision and services to its partner operators in a capital-light model. In 2016, we delivered another strong performance, generating operating cash of £36 million with cash conversion of 109% of operating profit.
Delivering operational excellenceWith further investment in customer service, including new apps with enhanced journey planners, easier payment and free on-board entertainment systems, we are pleased to have recorded a 3% improvement in our customer satisfaction score and a 2% increase in customers likely to recommend our services, to 88%. We have delivered a 1% improvement in punctuality on our services and have again been rated number one in the Institute of Customer Services’ Customer Service Index for ground transportation.
Our relentless focus on safety has delivered a significant improvement in our Fatalities and Weighted Injuries Index score for the year and has been recognised with another five-star rating from the British Safety Council, with an improved score of 98.5%. We are also delighted to have been awarded the prestigious British Safety Council Sword of Honour for the second consecutive year.
Awarded a four-star rating by the European Foundation for Quality Management in its first assessment in 2014, we are delighted UK Coach achieved a five-star rating in 2016, demonstrating our commitment to achieving excellent operational standards.
Deployment of technology We have been determined to be at the forefront of new technology adoption to enhance our offer to customers, ability to compete and improve safety performance and secure cost efficiencies.
An example of our investment in customer service leadership is the launch of VUER, an innovative, free digital ‘infotainment’ news and entertainment system. This service is resulting in a 5% increase in customer satisfaction for those passengers who have used the system, helping to drive customer loyalty and incremental demand.
Technology has an important role to play in raising safety standards. We have rolled out the Lytx DriveCam technology across the whole of our network during 2016 (with the recently acquired Clarkes following this year). This technology enables us to improve driving performance and tailor training through the analytics and videos generated. Our initial pilot in one depot showed a 10% reduction in the collision rate and annualised repair costs reduced by around 30%.
In the past year we have implemented active real-time RMS across the whole of the network. This upgraded system
significantly enhances our capability to actively manage pricing, helping to drive revenue, profit and incremental demand. We have already seen the benefits, with targeted reductions in price driving passenger increases and overall revenue growth in the fourth quarter. With full installation complete in December, the immediate benefit was an increase in revenue of 1% during the month and improved seat utilisation rates. The benefits should grow through the year as the system gains increasingly sophisticated data and analytical capabilities.
We have also made further improvements to our digital platforms in the past year, such as the launch of a new and improved mobile website, app, journey planner and PayPal payment system, helping us to engage with our customers in a more personalised way while also increasing revenue.
Creating new opportunitiesAttractive pricing, coupled with the upgraded RMS, will continue to grow volume, improve load factors and drive profitability. We have also grown our CRM database by 13% in the year from an already strong position, and we will continue to exploit our enhanced capabilities here in 2017, developing further tailored and customised offers for our customers.
We continue to look for new contract opportunities and have secured a three-year contract, in conjunction with UK Bus, to provide corporate transport services for Amazon to distribution centres around the UK, and a contract to provide transport services to UEFA for the 2017 Champions League Final. We also look to increase our sales distribution through the development of existing relationships and the creation of new partnership arrangements, and in 2016 have secured new partnership agreements with Expedia, UCAS and Groupon, and expanded our existing partnerships with Ryanair, thetrainline.com and RBS. We plan to launch a trial in 2017 to provide ‘end to end’ journey services, working in partnership with taxi and private hire car firms.
As well as reviewing our network efficiency, we also look to add new routes where we see growth opportunities. First introduced in 2013, our Christmas Day services are helping secure significant growth over the festive period: we broke our record for the number of passengers carried in a day and had two days where we took over £1 million in revenue. In 2016, we also launched new services serving passengers between London and Stansted, further strengthening our position in the airport market where we continue to see strong growth.
In December we acquired Clarkes, a private hire coach company based in Kent. This acquisition of a well-known coach brand has two principal benefits. Firstly, by expanding our presence in the Kent commuter markets in an efficient way, enabling the sharing of spare fleet and management synergies. Secondly, it provides efficiency opportunities for our core coach operations, through attractively placed depots and access to an expanded driver pool in London.
55Annual Report and Accounts 2016 / National Express Group PLC

Business review: Rail
Good progress in Germany and strategic disposal of c2c
Market overviewThe UK rail market is a regulated market and is broadly dispersed between UK private train operators and overseas state-backed market participants. Recent awards of franchises have seen some aggressive bidding activity by train operators which has resulted in the UK rail market looking less attractive in the short term. At the same time the number of state-backed operators participating in the UK market has increased. In February 2017 we disposed of our c2c franchise to Trenitalia and now have no rail operations in the UK.
Meanwhile the German rail market is liberalising and offering good growth opportunities, with over 30 contracts coming up for bid in the next three years. The German rail market is also the largest in Europe, worth €19 billion, and within that the regional and urban market is worth around €9 billion. Contracts are awarded by regional Passenger Transport Authorities.
German rail contracts are typically much smaller in size than in the UK with a lower risk profile and generally lower capital requirements.
Market size
€9bncurrently accessible German regional and urban market
• Our first two German rail contracts commenced operations in December 2015 for 15 years with two more commencing in June 2019 and December 2020 for 14 years and 13 years respectively
• Growth through further bid wins in Germany• Liberalisation of Spanish rail market a future opportunity
Year ended 31 December2016
m2015
m
German Rail
Revenue from continuing business £61.3 £2.4
Operating loss £(1.5) £(0.1)
Revenue from continuing business €75.0 €3.3
Operating loss €(1.8) €(0.1)
Operating margin (2.4)% (0.3)%
c2c
Revenue from c2c £175.5 £166.0
Operating profit £4.9 £1.7
Operating margin 2.8% 1.0%
Overview of 2016On 10 February 2017, we announced the completed sale of the c2c franchise to Trenitalia, receiving £108 million through a consideration of £72.6 million and the settlement of £35 million of inter-company loans.
2016 itself saw c2c outperforming other UK rail franchises many of which are experiencing notable slowdowns in passenger growth. Last year was also the first full year of our Rhine-Münster Express (‘RME’) contracts in Germany.
Revenue from the continuing RME business rose to €75.0 million, with a small operating loss of €1.8 million. We are engaged in discussions with the local transport authorities in Germany to clarify certain aspects of our subsidy revenue entitlement. We have taken a prudent approach: our revenue policy is to only recognise revenue where these discussions are suitably advanced and where amounts are considered highly probable. We are still targeting a small profit in 2017.
c2c delivered an operating profit of nearly £5 million, giving the rail division’s combined profit of £3.4 million.
Cash and returnsIn 2016, our Rail division saw an outflow of £18.6 million of operating cash, reflecting: the build-up of our German rail operations; the bid costs for the East Anglia franchise; and capital investment in c2c.
Delivering operational excellenceOur relentless focus on safety delivered an improvement of over 60% in the Fatalities and Weighted Injuries Index score for the year for c2c. These high standards were recognised with a five-star rating from the British Safety Council and we were also delighted to be awarded its prestigious Sword of Honour. In September 2016 the German Rail Authority (EBA) conducted its first safety compliance audit, passing us with no material findings.
Tom StablesManaging Director, Rail
Strategic Report
56 National Express Group PLC / Annual Report and Accounts 2016

Our 2016 Strategic Report, from page 1 to page 57, has been reviewed and approved by the Board of Directors on 23 February 2017.
Dean FinchGroup Chief Executive 23 February 2017
c2c’s strong performance in the year demonstrates that our focus on operational excellence again helped it outperform similar franchises. Driven by a combination of December 2015’s new timetable, enhanced marketing and fare offers, and supported by the subsequent arrival of 24 additional carriages at the end of 2016, c2c saw passenger growth of 6.7%, well ahead of the industry.
We have taken our expertise and approach developed at c2c and applied it to our German operations. In a successful first year of RME services, we carried over 20 million passengers, more than achieved its punctuality targets and delivered operational improvements compared to the previous operator. The mobilisation of our second German rail franchise, the Rhine-Ruhr Express (‘RRX’), is under way, drawing on our experience with the mobilisation of RME and providing the opportunity for cost efficiency given the complementary locations.
Deployment of technologyc2c has pioneered technological innovation, such as the industry-leading Automatic Delay Repay compensation scheme for smartcard customers and a flexible season ticket aimed at part time commuters. We have also led the industry with over 40% of season ticket holders using smartcards. We drove revenue growth through sophisticated marketing and the success of new fares and products such as online advance sales increasing by over 70% and Senior Rover sales rising by 50%.
We are taking the lessons from c2c and applying them to Germany where this customer-focused approach is less apparent. There are currently two priority areas. Firstly, enhanced marketing helping to drive sales, including online and digital. Secondly, we are developing enhanced live customer information across our various digital channels, including use of social media.
Drawing on our emerging Group strength we have also made further improvements to our digital platforms in the past year, with faster connections and improved search and navigation enhancing the customer experience and driving higher conversion rates. The launch of our new mobile app, c2c Live, with journey planners, live travel information, special offers and additional services such as payment for station car parking, enabled engagement with customers in a more personalised way, driving customer loyalty and incremental demand. The improvements to our digital platforms have driven an increase of 88% in online transactions over the past year, with a doubling of revenue now transacted through these channels, delivering both revenue and cost benefits.
Creating new opportunitiesThe sale of c2c has both removed significant potential liabilities from the Group and provided resources to invest in our fastest growing markets. The UK rail market is undergoing a downturn, with passenger growth in London and the South East train
operating companies of only 0.3% in 2016. While c2c was significantly outperforming this, we were concerned that the remaining obligations of over £30 million of capital expenditure and lease payments for over £100 million of new trains to generate sufficient revenue to repay around £900 million of franchise premiums were looking increasingly challenging. With recent franchises won on anticipated double digit compound annual revenue growth and average costs of around £5-10 million per bid, we felt this was also an increasingly unattractive market.
The sale of c2c presented the opportunity to remove these potential liabilities in an increasingly unattractive market and generate £108 million of cash – through a consideration of £72.6 million and the settling of £35 million of inter-company loans – to invest in our fastest growing markets that are generating returns of between 15% and 20% on recent acquisitions. We believe this approach is much more likely to generate shareholder value in the coming years.
We remain fully committed to German rail and believe there is further opportunity in this market. Our second German rail contract, RRX, will see the first of its operations commence in June 2019, with the second starting in December 2020. Both contracts run through to 2033. We are planning to submit a number of German rail bids in 2017. We continue to view the German rail market as attractive, with franchises being smaller and lower risk than in the UK, and with many franchises requiring relatively low levels of capital investment. With at least 30 contracts coming to market in the next three years, we see a strong pipeline of opportunities and we will continue to be selective in our bidding approach in order to drive the best returns. Our presence in Germany also provides the opportunity to enter other, complementary, markets nearby.
We will continue to bid in a disciplined manner. Our decision in October 2016 to inform the local Bavarian authority that due to delay in its award we were not able to proceed with the Nuremberg S-Bahn contract demonstrates that we maintain a disciplined approach to bidding. While not ruling out further UK rail bids, our immediate focus will be in these markets.
57Annual Report and Accounts 2016 / National Express Group PLC

Dear fellow Shareholder
In this section of the Annual Report, we describe governance at National Express, the principal activities of the Board and its Committees and how we have complied with the principles of the September 2014 edition of the UK Corporate Governance Code (the ‘Code’) which applied to the Company for the whole of the financial year ended 31 December 2016.
CultureThe Board believes that effective governance is essential to protecting shareholder value and the sustainable growth of the Group. Strong governance is also a foundation stone for a healthy corporate culture of values, attitudes and behaviours demonstrated by a company, not only within its operations, but also in its relations with its stakeholders and the wider community and environment which are affected by the Company’s conduct. As a Board, we recognise that the correct tone needs to be set from the top with the Directors leading by example to ensure that good standards of behaviour permeate throughout all levels of the National Express Group. The way we live and breathe our culture can be seen by the way in which our Values are becoming increasingly embedded across all our businesses and how they underpin our business model and strategy of delivering long-term shareholder value.
i Read more p22
LeadershipThe role and effectiveness of the Board is essential to a successfully run company and the way in which we operate is set out on the following pages. We have a strong cast of Directors with a broad range of sector and function experience across different geographies and in the key areas of transport and digital technology – a balance that results in effective collective decision making. As announced in January, after two and a half successful years as Group Finance Director and as part of his career development with the Group, Matthew Ashley will be moving to become President and Chief Executive Officer for North America. Matthew will take up this operational role from 1 September 2017 and will remain on the Board as an Executive Director. To fill the Group Finance Director role as a result of this move, I am delighted that Chris Davies will be joining the Board as an Executive Director following our AGM on 10 May 2017. Chris brings significant international and strategic experience that will benefit the Company as we continue our growth strategy.
i Read more p60
EffectivenessNational Express continues to evolve and expand geographically through pursuing business opportunities in new markets and through its programme of bolt-on acquisitions in North America as described in the Strategic Report. The Board recognises that managing such growth effectively requires clear oversight by an effective Board. This year’s evaluation of the effectiveness of the Board and its Committees identified the main areas for continued focus and development for the year ahead being a review of the Executive pipeline and succession planning, greater diversity on the Board and bringing more external viewpoints to the Board.
i Read more p66
AccountabilityThe Board recognises its responsibility to present a fair, balanced and understandable assessment of the Group’s position and prospects in this Annual Report, to assess the principal risks of the Group, to ensure that effective systems of risk management and internal control are in place and to provide a statement as to the Group’s long-term viability. The actions that we have taken during the year to comply with these requirements can be found in this section of the Annual Report.
i Read more p75
Chairman’s Introduction to Corporate Governance
Sir John Armitt CBEChairman
Corporate Governance Report
Corporate Governance
58 National Express Group PLC / Annual Report and Accounts 2016

Relations with shareholdersThe Board recognises and values the importance of maintaining healthy and open communications with our shareholders to ensure mutual understanding of the Group’s strategy, objectives, governance and performance. The Board receives regular investor reports which detail the feedback from investor meetings. This helps inform Board discussion on the views of investors and analysts on strategy.
i Read more p84
RemunerationWe were pleased to have received 98.30% of votes in favour of our Remuneration Report at the 2016 AGM. Whilst our current remuneration policy will continue for its final year during 2017, one of the Remuneration Committee’s principal areas of focus for this year will be to review the existing policy and engage with shareholders to consider the changes required to ensure that our remuneration framework continues to support and drive the delivery of our strategic vision. The resulting revised policy will be put forward for approval at the 2018 AGM.
i Read more p86
Annual General MeetingThis year, our Annual General Meeting will be held at 2.00pm on Wednesday, 10 May 2017, once again in Hall 9 at the International Convention Centre, Broad Street, Birmingham B1 2EA. I would encourage you to attend and meet me and the Board.
Sir John Armitt CBEChairman 23 February 2017
“ We recognise that the correct tone needs to be set from top with the Directors leading by example to ensure that good standards of behaviour permeate throughout all levels of the National Express Group.”
Compliance with the UK Corporate Governance Code The Governance Report set out below, together with the Directors’ Remuneration Report, is designed to provide shareholders with a summary of the Group’s governance policies and practices and an explanation of how the Company has applied the main principles of the UK Corporate Governance Code (the ‘Code’) that was published in 2014 by the Financial Reporting Council and which applied to the Company for the whole of the financial year ended 31 December 2016. The Directors believe that the Company has complied with the provisions set out in the Code during 2016 as described below. A copy of the Code is available at www.frc.org.uk.
59Annual Report and Accounts 2016 / National Express Group PLC

Key matters reserved for Board approvalGroup strategy and risk management• Formulation and approval of long-term objectives• Approval of changes to capital structure• Approval of major changes to management and
control structures• Approval of extension of activities into new businesses
or geographical areas
Financial and internal controls• Oversight of risk management and internal control framework• Approval of Financial Statements and results announcements• Approval of Shareholder communications, circulars and
notices of meeting• Approval of the auditor’s remuneration and
recommendations for their appointment/removal• Recommendation and declaration of dividends• Monitoring the Group’s businesses against plan and budget• Approval of major capital expenditure projects• Approval of material contracts
Board membership and Committees• Appointment of Directors• Approval of remuneration of the Non-Executive Directors • Setting of Board Committees’ terms of reference• Approval of new share incentive plans
Corporate governance• Undertaking formal performance reviews of the Board,
Committees and individual Directors• Determining the independence of Directors• Receiving reports from the Company’s major shareholders
Policies• Review and approval of Group policies, for example:
– health and safety – anti-corruption and bribery – risk management strategy – environment – charitable and political donations – workplace rights – human rights
The Role of the BoardThe Board provides leadership of the Group and direction for management. It is collectively responsible and accountable to the Company’s shareholders for the long-term success of the Group and for ensuring the appropriate management and operation of the Group in pursuit of its objectives. The Board is responsible for setting the Group’s strategy, values and standards and ensuring that the necessary controls and resources are in place to deliver these.
Corporate governance frameworkThe Board discharges its responsibilities for the leadership and control of the Group by:
• providing strategic direction and support in a manner which maximises opportunities to develop the business’ profitability, whilst at the same time assessing and managing associated risks;
Corporate Governance Report continued
Leadership
Corporate Governance
60 National Express Group PLC / Annual Report and Accounts 2016

• engaging at Board meetings with, and challenging, the Group Chief Executive, Group Finance Director and other members of the Senior Management Group, as appropriate, on the financial and operating performance of the Group and external issues material to the Group’s prospects; and
• ensuring that the financial, management and other resources required to meet its objectives are in place.
To help discharge its responsibilities, the Board has a formal schedule of matters specifically reserved for its decision, which forms the core of the Board’s agenda. The Board has also delegated certain aspects of its responsibilities to the following principal Committees: the Audit Committee, the Remuneration Committee, the Nomination Committee and the Safety & Environment Committee. More details on each of these Committees can be found in this report.
Remuneration Committee
Reviews and recommends to the Board the Executive
Remuneration Policy and determines the
remuneration packages of the Executive Directors
and members of the Senior Management Group.
i Read more p86
Nomination CommitteeReviews and recommends to the Board the structure,
size and composition of the Board and its
Committees. It also has oversight for succession
planning of the Board and senior management.
i Read more p72
Audit CommitteeReviews and is responsible for oversight of the Group’s
financial and reporting processes; the integrity of the Financial Statements; the external and internal
audit processes; and the systems of internal
control and risk management.
i Read more p76
Safety & Environment Committee
Reviews and challenges constructively the structure,
content and operation of the safety management
arrangements put in place by members of the
Executive management. It also reviews and monitors the Group’s environmental performance and targets.
i Read more p82
Reporting framework
Group BoardProvides leadership of the Group and direction for management. It is collectively responsible
and accountable to the Company’s shareholders for the long-term success of the Group and for
ensuring the appropriate management and operation of the Group in pursuit of its objectives.
It sets strategy, values and standards and ensures that the necessary controls are in
place to deliver these.
Group Executive CommitteeUnder the leadership of the Group Chief Executive, this Committee comprises the
Executive Directors, the Managing Directors of each of the businesses and functional heads.
It meets on a monthly basis and is tasked with considering and approving operational
business matters.
In addition, the UK and Middle East, Spanish and North American Executive groups meet on a monthly basis and matters dealt with
at these meetings are reported to the Group Executive Committee.
61Annual Report and Accounts 2016 / National Express Group PLC

If a Director is unable to attend a Board or Committee meeting, he or she still receives all the papers and materials for discussion at the meeting. He or she will review them and then advise the Board Chairman or Committee Chairman of their views and comments on the matters to be discussed so that they can be conveyed to others at the meeting. For unavoidable reasons, Chris Muntwyler was unable to attend the July Board and Audit Committee meetings.
Only members of the Board are entitled to attend Board meetings, with the Company Secretary in attendance to formally record each meeting. This is also the case in respect of Committee members and meetings. The Executive Directors and representatives of management, together with the Company’s advisers, are also invited to attend Committee meetings as required. Directors have the right to raise any concerns they may have about the running of the Company, or a proposed course of action which cannot be resolved, and have them recorded in the relevant meeting minutes and may also provide a written statement to the Chairman for circulation to the Board, setting out such concerns. During the year the Chairman met on several occasions with the Non-Executives without the Executive Directors present to allow informal discussions on a variety of issues.
Principal Committees of the BoardThe main Committees established by the Board are the Audit Committee, the Remuneration Committee, the Nomination Committee and the Safety & Environment Committee. Each Committee operates within defined terms of reference, the full versions of which can be found on the Company’s website,
www.nationalexpressgroup.com. Each Committee reports its proceedings to the Board through the submission of reports and minutes as appropriate. A Disclosure Committee of the Board is also established with its membership comprising the Chairman, Group Chief Executive and Group Finance Director. This Committee meets as required to deal with the control of price sensitive information within the Group and to ensure that timely announcements are made in accordance with the Company’s obligations under the Market Abuse Regulation and the Financial Conduct Authority’s Listing Rules and Disclosure Guidance and Transparency Rules. Its terms of reference are also available on the Company’s website, www.nationalexpressgroup.com.
All Board Committees are authorised to obtain legal or other professional advice as necessary, to secure the attendance of external advisers at their meetings and to seek information required from any employee of the Group in order to perform their duties.
Reports of each of the principal Committees are provided on pages 72 to 113, and include information on each Committee’s membership, duties and activities throughout the year.
Setting the Board agendaThe Chairman and the Company Secretary are responsible for ensuring that the Directors receive accurate, timely and clear information on all relevant matters so that they are properly briefed in advance of meetings, and that the information is of sufficient quality to assist Directors in making informed contributions and decisions.
Board meetingsThe Board and its Committees have regular scheduled meetings and hold additional meetings as and when required. Directors are expected, where possible, to attend all Board meetings, relevant Committee meetings, the AGM and any General meetings. The Board met seven times during 2016: five meetings were held in the UK, one in Germany and one in Canada. A separate strategy meeting was also held following on from the September Board meeting. Each Director attended as follows:
Number of Board meetings
Number of Board meetingsThe Board
of DirectorsAudit
CommitteeNominationCommittee
Remuneration Committee
Safety & Environment
Committee
Total meetings in 2016 7 3 3 3 3
Executive Directors
Dean Finch, Group Chief Executive 7 – – – –
Matthew Ashley , Group Finance Director 7 – – – –
Non-Executive Directors
Sir John Armitt, Chairman 7 – 3 – 3
Joaquín Ayuso 7 – 3 – 3
Jorge Cosmen 7 – 3 – 3
Matthew Crummack 7 – – 3 3
Jane Kingston 7 – 1(1) 3 3
Mike McKeon 7 3 – – 3
Chris Muntwyler 6 2 3 – 3
Lee Sander 7 3 3 3 3
Dr Ashley Steel 7 3 – – 3
Company Secretary, Joy Baldry, also acts as Secretary to the Board Committees.
Eligible meetings are shown in brackets.
Corporate Governance Report continued
Corporate Governance
62 National Express Group PLC / Annual Report and Accounts 2016

The Board regularly and rigorously reviews and benchmarks operational and functional performance. At each meeting the Board receives a report from the Group Chief Executive on operational performance, and from the Group Finance Director on the financial performance of the Group as a whole and each of the Group’s businesses individually. Other regular reports for the Board’s consideration at its meetings include capital expenditure requests, key project reviews, summary activities of the Board Committees and human capital, legal, governance and investor
relations reports. Presentations from either a business Managing Director or a functional head are also given at each meeting.
The core activities of the Board and its Committees are documented and planned on an annual basis and a list of matters arising from each meeting is maintained and followed up at subsequent meetings. The main items of business addressed by the Board during the year are shown below.
Strategy, operational and funding• Reviewed the Group Strategy for 2017-2019 with
external viewpoints being provided
• In depth review of Chattanooga tragedy and consideration of
any lessons that can be learned
• Consideration and approval of sale of c2c to Trenitalia
• Reviewed, approved and received regular updates on
bid opportunities and progress
• Reviewed and approved bolt-on acquisitions in North America
and received updates on their performance and integration
one year post acquisition
• Received presentations on digital marketing initiatives
• Received presentations on leveraging technology
to address safety issues and enhance operational performance
• Received presentations from each of the Group’s divisions
providing opportunities for the Board to engage with members
of the Senior Management Group
• Reviewed and approved capital expenditure requests
• Reviewed and approved the £1 billion Euro Medium Term
Note Programme to provide a flexible means of issuing bonds
in various currencies and maturities
Financial performance• Considered the financial performance
of the business and approved the
budget and key performance targets
• Reviewed the half year and
annual results and approved
the Annual Report
Internal controls and risk management• Reviewed the Group’s risk
register and reviewed and
validated the effectiveness of
the Group’s internal control
and risk management systems
• Assessed significant and emerging
risks and quantified the potential
impact on business objectives, and
reviewed the effectiveness of the
mitigating actions in place
Leadership and people• Reviewed the composition of
the Board and its Committees,
including consideration of diversity
in its widest sense
• Reviewed succession planning
for senior roles and new initiatives
for the identification and
development of talent within
the Group to deliver strategy
• Reviewed the Delivering Excellence
initiative – a new Group-wide
programme to support
and improve operational
performance and efficiency
Governance, stakeholders and shareholders• Reviewed the Group’s Values and
the extent to which they continued
to underpin the Group’s Vision
• Reviewed regular safety updates
together with the structure,
content and operation of the
safety management arrangements
in place and the initiatives to
enhance the Group’s safety profile
• Reviewed and monitored
the Group’s environmental
performance and targets
• Reviewed developments in
corporate governance and
received regular updates
• Reviewed regular feedback from
investors and other stakeholders
• Discussed the outcome of
the Board evaluation and
effectiveness review and agreed
improvement opportunities
• Reviewed the impact of the Market
Abuse Regulation, adopted a revised
Share Dealing Code and updated
procedures to ensure compliance
Board activity
throughout 2016
63Annual Report and Accounts 2016 / National Express Group PLC

1. Sir John Armitt CBE (71)ChairmanDate appointed to Board: January 2013 and as Chairman on 1 February 2013Tenure on Board: 4 yearsIndependent: Independent upon appointmentCommittee memberships: Nomination (Chairman), Safety & EnvironmentRelevant skills and experience:Sir John Armitt is currently Deputy Chairman of Berkeley Group Holdings PLC, Chairman of the City & Guilds Group and Deputy Chairman of the National Infrastructure Commission. Sir John is also an independent Non-Executive Director of Expo 2020. He was President of the Institution of Civil Engineers from 2015 to 2016 and a member of the Board of Transport for London from 2012 to 2016. Sir John was Chairman of the Olympic Delivery Authority from 2007 to 2014 and Chairman of the Engineering and Physical Science Research Council from 2007 to 2012. From 2001 to 2007 he was Chief Executive of Network Rail and its predecessor, Railtrack. In 1997 he was appointed as Chief Executive of Costain Group PLC, a position he held until 2001. Before this, Sir John was Chief Executive of Union Railways, the company responsible for the development of the high speed Channel Tunnel Rail Link. This followed a 27-year career at John Laing PLC.
Sir John was awarded the CBE in 1996 for his contribution to the rail industry and received a knighthood in 2012 for services to engineering and construction.
2. Lee Sander (60)Senior Independent DirectorDate appointed to Board: June 2011Tenure on Board: 5 years, 6 monthsIndependent: YesCommittee memberships: Audit, Remuneration, Nomination and Safety & Environment
Relevant skills and experience: Elliot ‘Lee’ Sander is the former Chief Executive Officer of the Metropolitan Transportation Authority of New York and the former Commissioner of the New York City Department of Transportation. He is the Chairman Emeritus of the Regional Plan Association, an NGO that has played a guiding role in the planning of the New York Metropolitan area. Lee was Group Chief Executive for Global Transportation at AECOM, a global architecture and engineering firm. He served as President of The HAKS Group Inc and The I. Grace Company, which also specialised in architecture, engineering, and construction in the public and private sectors. In addition, Lee founded the Rudin Center for Transportation Policy and Management at New York University. Lee is also currently Vice Chairman of the Greater Jamaica Development Corporation and Senior External Adviser to McKinsey & Company.
3. Jorge Cosmen (48)Deputy ChairmanDate appointed to Board: December 2005Tenure on Board: 11 yearsIndependent: NoCommittee membership: Nomination, Safety & EnvironmentRelevant skills and experience: Jorge Cosmen was appointed to the Board at the time of the ALSA transaction. He was appointed Deputy Company Chairman in October 2008. He was Corporate Manager for the ALSA Group from 1995, becoming Chairman in 1999. Between 1986 and 1995, he worked in sales, distribution and banking. He is a Business Administration graduate and has an International MBA from the Instituto de Empresa in Madrid. He is a Non-Executive Director of Bankia, as well as of other private companies.
4. Dean Finch (50)Group Chief ExecutiveDate appointed to Board: February 2010Tenure on Board: 6 years, 11 monthsIndependent: NoCommittee membership: NoneRelevant skills and experience: Prior to joining National Express, Dean Finch was Group Chief Executive of Tube Lines from May 2009. Before that he worked for over ten years in senior roles within FirstGroup PLC. He joined FirstGroup in 1999 having qualified as a Chartered Accountant with KPMG, where he worked for 12 years specialising in Corporate Transaction Support Services, including working for the Office of Passenger Rail Franchising on the privatisation of train operating companies.
At FirstGroup, he was Managing Director of the Rail Division from 2000 to 2004 and then was appointed to the main board as Group Commercial Director in 2004, before being made Group Finance Director. With the completion of the Laidlaw acquisition, he became Chief Operating Officer in North America before returning to the UK as Group Chief Operating Officer. Dean currently has no external directorships, having relinquished his role as Non-Executive Director of the Royal Free London NHS Foundation Trust in May 2016.
5. Matthew Ashley (43)Group Finance DirectorDate appointed to Board: January 2015Tenure on Board: 2 yearsIndependent: NoCommittee membership: NoneRelevant skills and experience: Matt Ashley joined National Express as Group Financial Controller in 2010 from Deloitte where he was a Director specialising in transport and infrastructure and the auditing of listed companies, having previously qualified as a Chartered Accountant in 1998. He was then promoted to the role of Finance Director of the UK Bus division in 2013 before becoming interim Group Finance Director in October 2014. Matt has no external directorships.
Board of Directors
Corporate Governance Report continued
1. 2. 3. 4. 5. 6.
7. 8. 9. 10. 11.
Corporate Governance
64 National Express Group PLC / Annual Report and Accounts 2016

6. Mike McKeon (60)Non-Executive DirectorDate appointed to Board: July 2015Tenure on Board: 1 year, 5 monthsIndependent: YesCommittee membership: Audit (Chairman), Safety & EnvironmentRelevant skills and experience: Mike McKeon was Group Finance Director of Severn Trent plc from 2005 until his retirement from the board in 2015. Prior to that, between 2000 and 2005, he was Group Finance Director of Novar plc. He has held various senior roles, both in the UK and internationally, at Rolls-Royce plc, CarnaudMetalbox, Elf Atochem and PricewaterhouseCoopers. Until 31 January 2017, Mike was also Senior Independent Director and Chairman of the Audit Committee at investment trust, The Merchants Trust PLC. He is a Chartered Accountant.
7. Jane Kingston (59)Non-Executive DirectorDate appointed to the Board: February 2014Tenure on Board: 2 years, 11 monthsIndependent: YesCommittee membership: Remuneration (Chair), Nomination, Safety & EnvironmentRelevant skills and experience: Jane Kingston served as Group Human Resources Director for Compass Group PLC from 2006 until her retirement in 2016. Prior to this, she served as Group Human Resources Director for BPB PLC from 2002 until its acquisition by Saint Gobain SA in 2006. Jane’s earlier career in HR has spanned a variety of sectors, including engineering and building materials with Enodis PLC and Blue Circle PLC (now Lafarge SA) and garment and textiles with Coats Viyella PLC, as well as the British car industry. She has significant international experience, having had responsibility for the people agenda in most parts of the world at some point during her career. Jane is currently Non-Executive Director, and Chair of the Remuneration Committee, of Spirax-Sarco Engineering plc.
8. Chris Muntwyler (64)Non-Executive DirectorDate appointed to Board: May 2011Tenure on Board: 5 years, 7 monthsIndependent: YesCommittee membership: Audit, Nomination, Safety & Environment (Chair)Relevant skills and experience: Chris Muntwyler is President and CEO of the Swiss Management Consulting company Conlogic Ltd. He is also Non-Executive Director of Panalpina World Transport (Holding) Ltd (Switzerland) and the Austrian Post Ltd (Austria). During his 27 years at Swissair he held top executive positions in Switzerland, Sweden and North America. In 1999 he joined DHL Express serving as Managing Director of Switzerland, Germany and Central Europe and from 2005 to 2008 as CEO of DHL Express (UK) Ltd based in London.
9. Joaquín Ayuso (61)Non-Executive DirectorDate appointed to Board: June 2011Tenure on Board: 5 years, 6 monthsIndependent: Yes Committee membership: Nomination, Safety & EnvironmentRelevant skills and experience: Joaquín Ayuso is Board Vice Chairman for Ferrovial, the €10 billion Spanish transport infrastructure and services group that employs over 100,000 people worldwide. He has been with Ferrovial since 1981 and was appointed CEO in 2002, and held that position until October 2009. During this period, Ferrovial expanded internationally with business interests in the UK, US, Canada, Latin America and Europe. He is also currently a Non-Executive Director of Bankia, Chairman of the Board of Autopista del Sol SA, Non-Executive Director of Hispania Activos Inmobiliarios SA and Senior Advisor to AT Kearney in Spain and Portugal.
10. Matthew Crummack (46)Non-Executive DirectorDate appointed to Board: May 2015Tenure on Board: 1 year, 7 monthsIndependent: YesCommittee memberships: Remuneration, Safety & Environment
Relevant skills and experience: Matthew Crummack is currently Chief Executive Officer of Gocompare.com Group plc, a financial services price comparison website which is listed on the London Stock Exchange. Previously, Matthew served as CEO of lastminute.com, the online travel and leisure retailer, from 2011 until March 2015 when the business was acquired by Bravofly Rumbo Group (subsequently renamed lastminute.com Group). He served as Deputy CEO and Chief Integration Officer until December 2015, following which he served as a member of its Strategic Advisory Committee.
In addition, Matthew was formerly a Senior Vice President of Lodging at Expedia in Europe and the US, has previously worked for Nestlé UK, and spent eight years at Procter & Gamble in a variety of roles. He is also a Director of his own UK-based company, Interventus Limited.
11. Dr Ashley Steel (57)Non-Executive Director Date appointed to Board: January 2016Tenure on Board: 1 yearIndependent: YesCommittee memberships: Audit, Safety & EnvironmentRelevant skills and experience:Dr Ashley Steel is a former Vice Chairman at KPMG and was Global Chair for its transport, leisure and logistics practice until her retirement from the firm in September 2014. Ashley has significant international experience and has advised numerous FTSE/Fortune 500 boards. Her other sector experience includes professional services, technology, media, business services and healthcare.
Ashley is currently a Non-Executive Director of the Civil Aviation Authority and previously served on the International Business Advisory Board at British Airways. She is also an independent Non-Executive Director to global law firm, Ince & Co. She is also a founding member on the Global Advisory Board for Out Leadership, a New York- based business helping chairmen and CEOs of finance and law firms become LGBT aware. Ashley has a PhD in Management from Henley Business School.
Committee membership
Chairman Member
* Dean Finch and Matthew Ashley, as Executive Directors, may attend Board Committee meetings at the invitation of the respective Committee Chairman. No Director attends any discussion or participates in any decision concerning their own remuneration.
DirectorAudit
CommitteeNomination Committee
Remuneration Committee
Safety & Environment
Committee
Sir John Armitt CBEJorge CosmenLee SanderJoaquín AyusoMatthew CrummackJane KingstonMike McKeonChris MuntwylerDr Ashley SteelDean Finch*Matthew Ashley*
65Annual Report and Accounts 2016 / National Express Group PLC

Composition of the BoardWe seek to build an effective and complementary Board which comprises the correct balance of individuals whose capabilities are appropriate for the scale, complexity and strategic positioning of our business. The Board consists of an appropriate balance of Executive and Non-Executive Directors who collectively bring a strong and in-depth mix of business skills and experience and considerable knowledge to assist with Board decisions. The process for Board appointments is led by the Nomination Committee and is described on page 72.
A list of the individual Directors, their biographies and Committee memberships as at the date of this report are set out on pages 64 and 65.
The Chairman and the Group Chief ExecutiveThe roles of the Chairman and Group Chief Executive are held separately and the division of responsibilities between these roles is clearly established as shown below. The Chairman is responsible for leading the Board and ensuring its effectiveness. The Group Chief Executive is responsible for running the business of the Group and implementation of the strategy and policies adopted by the Board.
Chairman’s responsibilities
• Chairing and managing the business of the Board• Together with the Group Chief Executive, leading the Board in developing the strategy of the business and
ensuring its effective implementation by the executive management team• Ensuring effective dialogue with investors concerning mutual understanding of objectives• In conjunction with the Nomination Committee, taking responsibility for the composition and replenishment
of the Board• Periodically reviewing with the Board its working practices and performance• Ensuring there is an effective contribution from the Non-Executive Directors and a constructive relationship
between Executive and Non-Executive Directors
The Chairman’s other significant commitments are detailed in his biography on page 64.
Group Chief Executive’s responsibilities
• Communicating a shared purpose and the culture, vision and values of the Group• The development and implementation of management strategy• The day-to-day management of the Group• Managing the executive management team• Fostering relationships with key stakeholders• Leading the Group Executive Committee• In conjunction with the Group Finance Director, communicating the Group’s financial performance to
investors and analysts• Liaising with the Chairman to ensure effective dialogue with investors and stakeholders
Non-Executive DirectorsThe Non-Executive Directors collectively represent a robust element of the Board and each brings with them his or her own expertise gained in a variety of business sectors. They constructively challenge and scrutinise the performance of management and help develop proposals on strategy as well as ensuring high standards of financial probity and corporate governance. The terms and conditions of appointment of the Non-Executive Directors are available for inspection at each AGM, on the Company’s website and at its registered office during normal business hours. The Non-Executive Directors disclose to the Board their other significant commitments. The procedure adopted by the Company in relation to Directors’ conflicts of interest is detailed on page 115.
Senior Independent DirectorLee Sander is currently the Senior Independent Director. As well as being available to shareholders whose concerns have not been resolved through normal channels or when such channels would be inappropriate, the Senior Independent Director provides a sounding board for the Chairman and serves as an intermediary for the other Directors, where necessary.
Executive DirectorsThe Executive Directors are responsible for the day-to-day management of the Group’s busineses, implementation of its strategy, policies and budgets and its financial performance. Executive management meetings comprise the Executive Directors and senior management from the divisions and are held regularly to discuss current issues. The Group Finance Director supports the Group Chief Executive in developing and implementing strategy in relation to the financial and operational performance of the Group.
Corporate Governance Report continued
Effectiveness
Corporate Governance
66 National Express Group PLC / Annual Report and Accounts 2016

Company SecretaryThe Board has access to the advice and services of the Company Secretary, Joy Baldry, who is a fellow of the Institute of Chartered Secretaries and Administrators. The Company Secretary supports the Chairman in the delivery of the corporate governance framework and is responsible for advising the Board, through the Chairman, on all governance matters, including the planning of agendas for the annual cycle of Board and Committee meetings so that all key issues are considered at the appropriate times. Every effort is made to ensure that information reported to the Board is of high quality in terms of accuracy, quality, appropriateness, comprehensiveness and currency. Directors are able to seek clarification or amplification from management where necessary. The Company Secretary also facilitates the induction process and assists with professional development for Directors as required. The Company Secretary acts as Secretary to the Board and each of its Committees. The appointment or removal of the Company Secretary is a matter for the Board as a whole. As well as the support of the Company Secretary, there is a procedure in place for any Director to take independent professional advice where considered necessary.
IndependenceThe Board considers all of the Non-Executive Directors to be independent other than Jorge Cosmen. Sir John Armitt was considered to be independent prior to his appointment as Chairman.
Jorge Cosmen is not considered to be independent by the Board due to his close links with the ALSA business and significant interests in the shares of the Company which are held through European Express Enterprises Ltd. Despite his non-independence, the Board feels that it benefits greatly from Jorge Cosmen’s extensive local market knowledge and experience.
Non-Executive Directors do not participate in any of the Company’s share option or bonus schemes and their service is non-pensionable.
Time commitment It is in the Board’s interest to ensure that all Directors have sufficient time to commit to their responsibilities as Directors. The Chairman monitors the extent of Directors’ other interests to ensure that the effectiveness of the individual and the Board is not being compromised.
In respect of the appointment of new Non-Executive Directors to the Board, candidates are made aware of the time commitment expected of them which is reflected in their individual letters of appointment with the Company. The Board considers that all the Directors are currently able to devote sufficient time and attention to their duties and responsibilities to the Company.
As part of their continuing development, and recognising the significant benefits to be derived to both the Company and the individual, Executive Directors are permitted to accept one external non-executive directorship with a non-competing company provided they first obtain Board approval. Until 31 May 2016, Dean Finch held an external directorship of the Royal Free London NHS Foundation Trust. Matthew Ashley does not currently hold any external directorships.
Induction of new DirectorsThe Chairman ensures that new Directors receive a tailored and comprehensive induction programme to introduce them. On appointment, Directors are offered training as appropriate and are thereafter encouraged to keep abreast of matters affecting their duties as a Director and to attend training courses relevant to their role.
An induction process is in place for new Directors, the aim of which is to:
• build an understanding of the nature of the Group, its businesses and the markets in which it operates;
• establish a link with the Group’s employees; and• build an understanding of the Group’s main relationships
including stakeholders and customers.
The following information is provided as part of the induction and ongoing training and development of Board Directors.
On appointment • Governance information in relation to the Group, including
the terms of reference of the Board and its Committees• Guidance for Directors of British public companies generally,
including under the law, the Code and the rules of the UK Listing Authority
• Board minutes covering the previous year• Information on key Group policies
Following appointment • Business briefing meetings with the Chairman, the Group
Chief Executive and the Group Finance Director• Meeting with the Company Secretary to discuss the Group
structure, the Company’s constitution and Board procedures and terms of reference of the Board and its Committees
• Meetings with senior management in the business divisions• Meeting with the Director of Safety for an overview of the
Group’s health and safety policy and safety record• Meeting with the Group’s auditor and remuneration consultants
67Annual Report and Accounts 2016 / National Express Group PLC

Corporate Governance Report continued
Non-Executive Director engagement
As part of our annual Board calendar planning process, at least two Board meetings per year are held at locations where we have a local presence. In 2016, Board meetings were held in Cologne, Germany and Toronto, Canada. Such meetings provide an important opportunity for the Board to visit our operations first-hand and to engage both formally and informally with local management and front-line staff.
From Cologne, the Non-Executive Directors undertook a return trip to Wuppertal on the RB48 regional stopping service forming part of the Rhine-Münster Express line which our German Rail division launched in December 2015. The Directors were impressed with the quality and safety features of our new National Express liveried trains. They also took the opportunity to engage directly with the train staff to understand local operational issues and challenges.
Ashley Steel’s induction process
In January 2016, Dr Ashley Steel joined our Board as an independent Non-Executive Director, bringing with her knowledge across a range of sectors, particularly in transport. Ashley’s induction programme included visits to a number of our national offices and operational locations, including Bahrain, North America and Morocco. Here are her first-hand impressions:
“Being able to see the operations in action really brings home how Driving Out Harm is far more than just words. Seeing our extensive safety checks being carried out day in, day out, brought home how important we take the safety of the people we carry.
“In Bahrain, I was able to witness first-hand what it means to take an existing city bus network and, in a short timeframe, reinvent it from the bottom up. This included recruiting and training over 700 new drivers from abroad. I was deeply impressed with what the National Express international team had achieved. The operation stands out as a model for other cities and countries to mirror.”
Non-Executive Directors Lee Sander and Matthew Crummack in conversation with staff on the RB48
Corporate Governance
68 National Express Group PLC / Annual Report and Accounts 2016

Similarly, in Toronto, where we have both a School Bus operation serving schools in the Greater Toronto Area and a Transit business, the Board took the opportunity to visit several Customer Service Centres where Directors spent time talking with drivers, maintenance technicians and local management to gain a flavour of their local business.
Also during the year, several of our Non-Executive Directors took individual trips to our ALSA, UK Bus and Bahrain Bus businesses in order to deepen their knowledge of the Group’s operations. Attendance by Non-Executive Directors at our Group Values Awards held in London each year and at our NX Network events for our graduate intake is also much appreciated by our employees and provides an excellent opportunity for a mutual exchange of views. In particular, for our pool of high potential talent, such engagement can be a source of inspiration. Colleagues from management also regularly attend and present at Board meetings, enabling Non-Executive Directors to meet senior management across the businesses and to understand the challenges they face.
Overall, getting out and about in the business and engaging with colleagues outside the confines of the Board room has given our Non-Executive Directors a useful cultural insight into how our business operates which, in turn, informs effective Board discussions.
Our Non-Executive Directors take a trip on the RB48 regional stopping service from Cologne station
Lee Sander, Senior Independent Director, visits a Stock Customer Service Centre which serves the Greater Toronto Area
“ Being able to see the operations in action really brings home how Driving Out Harm is far more than just words.”
Independent Non-Executive Director Mike McKeon addresses graduate members of the NX Network
69Annual Report and Accounts 2016 / National Express Group PLC

Year 1– ExternalEvaluation by independent consultants
Year 2– InternalEvaluation focused on Year 1 issues raised and any specific new issues arising (questionnaire based)
Year 3– InternalProgress review generally (questionnaire based) with follow-up interviews with the Chairman
Board’s, Committees’, and Chairman’s performance evaluationsAn evaluation of the effectiveness of the Board and its Committees is conducted annually in accordance with the following cycle:
Board and Committee review cycle
Progress against 2015 internal board evaluation recommendations
Area for focus during 2016 Progress made
Gender diversity Female representation on the Board currently stands at 18% following the appointment of Dr Ashley Steel as an additional Non-Executive Director in January 2016. The Board will take every opportunity, when available, to increase the gender diversity of the Board further.
Executive pipeline, succession planning and talent
As part of the Group’s Vision, a talent strategy with a step plan and timetable for deliverables is in place to meet future business demands and increase internationalisation. The talent assessment, development and succession planning processes already in place in each division have been enhanced to give better cross divisional view and support development of high potentials.
More external viewpoints to be heard
Further opportunities have been created for external presentations to be made to the Board on relevant topics. This will remain an area of focus going into 2017.
Educational/development opportunities for Directors to be provided
Non-Executive Directors continue to be provided with the opportunity to visit our operations across the Group. Greater focus on key areas of relevant education and development for Directors will continue to be addressed during 2017.
Corporate Governance Report continued
Corporate Governance
70 National Express Group PLC / Annual Report and Accounts 2016

2016 internal Board evaluationThis year was the third in the Group’s three-year performance evaluation cycle. The overall aim was to focus on those areas identified for development resulting from last year’s internal Board evaluation through assessing current performance, progress made and opportunities for improvement. These were captured by completion of surveys for the Board and each Committee comprising a number of open questions on the workings and effectiveness of the Board and its Committees. The outcome of the internal evaluation was fed back to the Board at its meeting in November and a series of actions agreed. Lee Sander, the Senior Independent Director, led the evaluation of the Chairman with participation by both Non-Executive and Executive Directors.
The Board concluded that, overall, the outcome of the 2016 internal Board evaluation was very positive in respect of the Board’s, Committees’ and Chairman’s performance. It was agreed that the workings of the Board and its Committees remained effective and they continued to operate to a high level. The key strengths and the principal areas identified for further development and focus in 2017 are set out below. The outcomes arising from this year’s internal evaluation process will be further reported in next year’s Annual Report.
The review of the performance of the Chairman, led by the Senior Independent Director, concluded that the Chairman continued to operate to a high level, having a good understanding of the varying interests of shareholders and representing a strong and credible external face for the Company.
Key strengths Principal areas of focus for 2017
It was felt that, overall, the Board is well balanced and works well together. There is a broad range of experience and diversity across different geographies and in key business priority areas such as transport and digital – therefore, good breadth as well as depth.
More external viewpoints to be heard.
Directors were in agreement that Board meetings are conducted in an open manner that invites active and direct participation.
More educational/development opportunities for Directors to be provided.
Overall, there was agreement that the quality of the materials provided by management to Board meetings is very good. Once again, the strategy papers were singled out as being excellent.
Audit Committee meetings to be extended by 30 minutes to allow for greater in-depth discussion on certain topics.
There is good leadership on the Safety & Environment, Audit and Remuneration Committees.
The Nomination Committee to continue to keep under review the leadership needs of the Company, giving full consideration to succession planning for Directors and other senior Executives.
There is very good engagement by the Senior Independent Director, who takes his responsibilities seriously and engages appropriately and frequently.
Continued focus on cyber security issues and initiatives
Re-election of DirectorsIn accordance with the Company’s Articles of Association, and the Code, all Directors of the Company will offer themselves for either election or re-election at this year’s AGM. Non-Executive Directors are appointed for specific terms, subject to re-election. Non-Executive Directors will only be put forward for re-election if, following performance evaluation, the Board believes the Director’s performance continues to be effective and demonstrates commitment to the role.
71Annual Report and Accounts 2016 / National Express Group PLC

How the Nomination Committee spent its time in 2016
Re-election of Directors
11% New Board appointments 33% Succession planning 23% Board diversity 11% Committee governance 22%
Dear fellow Shareholder
I am pleased to present the Nomination Committee report for 2016. This report provides a summary of the Committee’s activities during the year. I will be available to answer any questions about the Committee and its activities at the AGM on 10 May 2017.
MembershipThe membership of the Committee during the year ended 31 December 2016 is set out below. Three meetings were held during the year with attendance by members shown on page 62.
Sir John Armitt CBE (Chairman) Lee Sander Jorge Cosmen Joaquín Ayuso Chris Muntyler Jane Kingston (appointed 26 July 2016)
The Company Secretary acts as Secretary to the Committee and attends all meetings. At the invitation of the Committee Chairman, any other Director, the Group Human Resources Director and external advisers may attend meetings of the Committee.
Full minutes are kept by the Secretary of the matters considered and decisions taken by the Committee.
Role and responsibilitiesThe primary role of the Nomination Committee is to ensure that the Board is appropriately structured and has in place the correct balance of individuals to discharge its duties effectively, and to lead the process by which new Board members are appointed. It also advises the Board on succession planning for Directors.
The Committee’s terms of reference are reviewed annually and are available on the Company’s website, www.nationalexpressgroup.com.
The Committee’s main duties and responsibilities in advising the Board are summarised below:
• Responsibility for identifying and nominating, for the approval of the Board, candidates to fill Board vacancies as and when they arise
• Giving full consideration to succession planning, and keeping under review the leadership needs of the organisation, both Executive and Non-Executive
• Reviewing the time required from and spent by a Non-Executive Director in fulfilling his or her duties
• Preparing a description of the role and requirements for any particular appointment based on its evaluation of the Board as a whole
Nomination Committee Report
Sir John Armitt CBEChairman
Corporate Governance Report continued
Corporate Governance
72 National Express Group PLC / Annual Report and Accounts 2016

Board experience
100%
91% Finance: 1 female, 9 male
Operational: 2 female, 9 male
100% International: 2 female, 9 male
82% Transport: 1 female, 8 male
91% Public board: 1 female, 9 male
82% Government/regulatory: 1 female, 8 male
73% Remuneration: 1 female, 7 male
9% Digital marketing: 1 male
18% Information technology: 2 male
Board composition
82%
18% Executive: 2 male
Non-Executive: 2 female, 7 male
73% Male: 8 male
18% Female: 2 female
Activities during 2016A summary of the Committee’s principal activities in 2016 is as follows:
Review of Board CompositionAt its February meeting, the Committee undertook a review of the composition of the Board and its Committees to ensure continued effectiveness. The Committee evaluated the balance of skills, knowledge, experience, diversity and independence of Directors to ensure that, as the Group continues to evolve, the Board is able to deliver the Group’s strategy whilst fulfilling its duties to shareholders and to the wider stakeholder community.
Members of the Board have many years of experience gained through their senior management roles within various companies across the world. The table opposite indicates certain of the areas of particular expertise of Board members. Directors’ biographies can be found on pages 64 and 65.
AdvisersDuring the year, the Committee worked with search consultants, Odgers Berndtson (‘Odgers’), to identify candidates for the role of Group Finance Director to replace Matthew Ashley, who will be moving to become President and Chief Executive Officer of our North America division from September. Odgers does not have any other connections with the Company.
Board tenure
0-2 years
1 female, 2 male2-4 years 1 female, 1 male4-6 years 4 male6-9 years 1 male
9+ years 1 male
73Annual Report and Accounts 2016 / National Express Group PLC

Tenure and independence The independence of Non-Executive Directors and the re-election of Directors and their suitability to continue in office were reviewed at the Committee’s February meeting. With the exception of Jorge Cosmen and Sir John Armitt, Chairman, who was independent upon appointment, all other Non-Executive Directors are considered to be independent. Jorge Cosmen is not considered to be independent due to his close links with the ALSA business and the significant interests in the shares of the Company, held through European Express Enterprises Ltd. Despite his non-independence, the Board feels that it benefits greatly from his extensive local market knowledge and experience. When assessing independence, the Committee was mindful of the Code requirement that any term beyond six years for a Non-Executive Director should be subject to particularly rigorous review. As at 31 December 2016, no independent Non-Executive Director had reached his or her six-year term. Lee Sander, Chris Muntwyler and Joaquín Ayuso will each reach their six-year term during 2017 and their respective independence will be subject to review during the course of the year. In addition to the Code requirement, the Committee also considered any circumstances and disclosable relationships and potential conflicts that would influence Non-Executive Directors’ judgement and affect their independence. The Committee is satisfied that, throughout the year, other than as disclosed in respect of Jorge Cosmen, Non-Executive Directors remained independent.
Succession planningThe Board as a whole, through the leadership of the Nomination Committee, recognises its role in ensuring that a strong pipeline of future senior management has been identified from which future Board appointments can be made. Equally important, talent needs to be recognised and nurtured at executive and management levels. Resulting from the 2016 Board strategy review, talent assessment, development and succession processes across the Group have been enhanced to give better cross divisional view and support of high potential talent. The Committee, as part of its more proactive role and revised enhanced duties (which were determined this year at its July meeting), continued to provide leadership and oversight in this key area during the year.
Appointment of new Group Finance DirectorThe Committee oversaw the process for the search for a new Group Finance Director to replace Matthew Ashley, who will be taking up the role of President and Chief Executive Officer for National Express North America from September 2017. The Company engaged Odgers, which is a signatory to the Executive Search Voluntary Code of Conduct, to assist the Committee in the search. From the long list of potential candidates produced by Odgers, a shortlist was identified to meet face to face with the Chairman, Group Chief Executive, Audit Committee Chairman and certain other Non-Executive Directors. The Committee subsequently discussed the results of these interviews and recommended to the Board that Chris Davies be appointed as Group Finance Director. Following this recommendation, the Board appointed Chris as Group Finance Director and he will take up this role on 10 May 2017.
Non-Executive Director induction During 2016, the Chairman oversaw Dr Ashley Steel’s induction. This took to the form of a full and tailored induction programme which included site visits, meetings with senior management and briefings from the Company Secretary and the Company’s advisers. The Committee also reviewed the continued education and development process for existing Non-Executive Directors. Various informative and valuable site visits were undertaken across our businesses by the Senior Independent Director and Chairs of the Safety & Environment, Audit and Remuneration Committees.
DiversityThe Board takes the view that an increasing diversity at Board level is acknowledged as an essential element in maintaining a competitive advantage. A truly diverse Board will include and make good use of differences in the skills, regional and industry knowledge/experience, background, race, gender, independence and other qualities of Directors. These differences will be considered in determining the optimum composition of the Board and will continue to be balanced appropriately. All Board appointments are made on merit, in the context of the skills and experience that the Board as a whole requires in order to maintain and enhance its effectiveness.
Female representation on the Board is currently 18% and we are mindful of the recommendations of the ‘Women on Board’ Davies Review, published in October 2015 and the voluntary target of 33% for female Board representation to be achieved over the next five years. The Board will take every opportunity, when available, to increase the gender diversity of our Board further.
Committee evaluationAs part of the 2016 internal Board performance evaluation, it was confirmed that the Committee was overall effective and efficient in its operation and leadership. Areas identified for improvement concerned the continued focus to keep under review the Company’s leadership needs, giving full consideration to succession planning for Directors and senior executives. Details of the Board and Committee performance evaluation process are provided within the main Corporate Governance Report on pages 70 and 71.
Sir John Armitt CBEChairman 23 February 2017
Corporate Governance Report continued
Corporate Governance
74 National Express Group PLC / Annual Report and Accounts 2016

Internal control statementThe Board’s responsibilitiesThe Board has overall responsibility for the Group’s system of internal control and for reviewing its effectiveness. The Board maintains full control and direction over appropriate strategic, financial, operational and compliance issues and has put in place an organisational structure with formally defined lines of responsibility, delegated authorities and clear operating processes. The systems that the Board has established are designed to safeguard both the shareholders’ investment and the assets of the Group, and are described as follows:
Key elements of the control frameworkFinancial reporting process – Management and specialists within the Finance Department are responsible for ensuring the appropriate maintenance of financial records and processes to ensure that all information is relevant, reliable and in accordance with the applicable laws and regulations, and distributed both internally and externally in a timely manner. A review of the consolidation and financial statements is completed by management to ensure that the financial position and results of the Group are appropriately reflected. All financial information published by the Group is subject to the approval of the Audit Committee and Disclosure Committee, where appropriate.
Performance management – The performance of each division and operating company against its plan is closely monitored by a formal monthly reporting process and by the attendance of the relevant Executive Directors at monthly divisional Executive meetings.
Annual fitness check process – Group internal audit undertakes an annual review at each operating company to assess the integrity of the Balance Sheet and to check the effective operation of key financial reporting and information systems controls. The results of the reviews are presented to both divisional and Group finance with any required actions agreed with the relevant divisional Finance Director.
Strategic and financial planning – An annual budgeting and strategic planning process has been established whereby each division and constituent operating company assesses its competitive position and goals, taking account of the strategic risks faced. This strategy is translated into a financial plan with clear milestones and performance indicators.
Capital investment – A clear process is in place for the approval of capital expenditure, which includes detailed appraisal of the benefits of the proposed investment and any associated key risks. Material capital expenditure requires Board approval.
Health and safety – Health and safety standards and benchmarks have been established in all of our businesses and the performance of operating companies in meeting these standards is closely monitored.
Risk management reporting process – Each division and operating company evaluates its internal control environment and key risks, and the results are reviewed at management level and passed to the Audit Committee before being presented to the Board. This process is reviewed on a regular basis to ensure the validity and relevance of the key risks included in reports. The review covers strategic, financial, compliance and risk management controls. These procedures are mandated and designed to manage the risk in order to ensure that the operations achieve their business objectives.
Internal audit – The internal control system is independently monitored and supported by a Group internal audit function. The Group internal audit function reports to management and the Audit Committee on the Group’s financial and operational controls, and monitors and reviews the extent to which its recommendations have been implemented.
Board-level reporting on internal control During the year the Audit Committee reviews regular reports from the Group internal audit function, the external auditor and Group Executive management on matters relating to internal control, financial reporting and risk management. The Audit Committee provides the Board with an independent assessment of the Group’s financial position, accounting affairs and control systems. In addition, the Board receives regular reports on how specific risks that are assessed as material to the Group are being managed.
Review of internal control effectivenessThe system of internal control and risk management, described above, has been in place for the year under review and up to the date of approval of this Annual Report and Accounts. Such a system is designed to manage, rather than to eliminate, the risks inherent in achieving the Group’s business objectives, and can therefore provide only reasonable and not absolute assurance against material misstatement or loss. The effectiveness of this system has been regularly reviewed by the Directors in line with the Guidance on Audit Committees, published by the Financial Reporting Council in April 2016. Where significant control failings or weaknesses have been identified, appropriate corrective action has been taken.
Going concern and longer-term viabilityThe Directors’ going concern and longer-term viability statements, as required to be made under the Code for the year ended 31 December 2016, are set out on page 45 of the Group Finance Director’s review.
Accountability
75Annual Report and Accounts 2016 / National Express Group PLC

How the Audit Committee spent its time in 2016
Financial statements and external audit
46% Risk management and internal controls 7% Internal audit 19% IT risk strategy/cyber security 13% Tax/treasury 7% Committee governance 8%
Dear fellow Shareholder
As Chairman of the Audit Committee, I am pleased to introduce this report which sets out how the Audit Committee (the ‘Committee’) has discharged its responsibilities during the year.
Following the changes in the Committee’s composition last year, we have enjoyed a stable membership throughout the period to address the subjects on our agenda. We were pleased to welcome Stephen Griggs from Deloitte as our new statutory auditor and would like to thank Nigel Mercer for his work in that role over the previous five years.
The Committee continues to play a key oversight role for the Board and its focus remains on assuring the maintenance, integrity and quality of our financial reporting and controls. We do this in conjunction with management, internal and external audit and by addressing any subjects that are of interest to the Committee. We continually seek to challenge ourselves to ensure our work addresses the key areas of significance to the Group.
Over the year, we addressed several new subjects as well as reviewing more established areas through a different lens. We met a number of senior managers who were leading these matters. The new Group Risk Director presented his updated assessment of Group risk to the July Committee with a fresh set of eyes. He brings new insights from his experience of risk management in other parts of the transport industry, especially in the area of insurance management in North America, and we look forward to working with him over the coming years. During the year, we deepened our attention on cyber security, which had been identified as a risk in 2015. We received an assessment carried out by external consultants of our current position along with a management prepared detailed programme of work to address any gaps over the coming months and year. This will be an ongoing area of review by the Committee overseen by management’s Cyber Security Committee, chaired by the Group Finance Director and led by the Group Chief Information Officer. The impact of Brexit on the Group’s operations was also introduced into the Group Risk process and the Committee will look to support the whole Board in assessing the implications of this evolving subject which is covered in more detail on page 36.
We were pleased to see the new Head of Group Internal Audit presenting a modified and insightful approach into how he plans the annual audit programme which will provide a better linkage of identified risk, prior audit outcomes and other external factors into the programme. We approved the new approach and look forward to seeing the benefits of this going forward.
During the year, with the support of the Group Tax Director and Group Finance Director, we took a first look at how we will address the new requirement to publish a UK Tax Strategy by December 2017.
Audit Committee Report
Mike McKeonAudit Committee Chair
Corporate Governance Report continued
Corporate Governance
76 National Express Group PLC / Annual Report and Accounts 2016

As always, we look at future evolving trends and what publications and recommendations are being made by the UK Financial Reporting Council (‘FRC’). The new lease accounting standard (IFRS 16), to be introduced from 1 January 2019, was reviewed and it is clear that this will demand a lot of work from our financial management teams to prepare for this. A further action for management and the Committee in 2017 will be to address how we make the presentation of the annual accounts under this new standard accessible to readers; while this has the potential to change considerably how the accounts will look, the underlying economic substance will be unchanged.
The FRC’s publications and views were reviewed by the Committee over the year and this Annual Report and Accounts incorporates changes where applicable. We also noted the likely changes for 2017 and will work on these during the course of this next year.
Finally, we have, as laid out in the detail below and elsewhere, addressed and challenged the key accounting and other judgements presented by management throughout the year and in the preparation of the Annual Report and Accounts. As a consequence, and as supported by the continued high standard of reporting by management, both I and the Committee believe this allows us to conclude that we have discharged our duties and responsibilities effectively. On behalf of the Committee I thank them for their consideration and application during the year. I commend my review and this report to your attention.
MembershipThe membership of the Committee during the year ended 31 December 2016 is set out below. All members are independent Non-Executive Directors. Attendance at meetings held during the year is shown on page 62.
Mike McKeon (Chairman) Lee Sander Chris Muntwyler Dr Ashley Steel
The Company Secretary acts as Secretary to the Committee and attends all meetings as does the Head of Group Internal Audit, who reports to the Committee on internal audit activities. In addition, the Board Chairman, Group Chief Executive, Group Finance Director, Group Financial Controller and representatives from our external auditor along with other Group managers attend by invitation.
Qualifications of Audit Committee membersAs a Chartered Accountant and former Group Finance Director of Severn Trent plc (2005 to 2015), I am considered by the Board to meet the requirements of the Code that at least one Committee member has recent and relevant financial experience. To address the new Code provision C3.1 that the Audit Committee, as a
whole, is required to have competence relative to the sector in which the company operates, all other members are considered to bring specific depth of industry experience to the Committee. Their biographies can be found on pages 64 and 65.
Role and responsibilitiesThe primary role of the Committee is to assist the Board in fulfilling its oversight responsibilities with regard to financial reporting, risk management and internal control procedures, and the work of its internal audit function and external auditor. The Committee’s terms of reference are reviewed annually and are available on the Company’s website, www.nationalexpressgroup.com.
The Committee’s main duties and responsibilities in advising the Board include the following:
• Reviewing the half year and annual financial statements including accounting policies, key accounting and auditing issues, significant financial judgements and the financial control environment
• Overseeing the process for selecting the external auditor, assessing the continuing independence of the external auditor and approving the audit fee
• Responsibility for ensuring that provision of non-audit services does not impair the external auditor’s independence or objectivity
• Liaising with the external auditor on matters relating to the nature and scope of the audit and any issues or concerns arising from the audit process
• reviewing the effectiveness of the Company’s internal control and risk management systems, including fraud prevention and operation of the Company’s whistleblowing policy
• supervising the planning of activities under the internal audit programme and reviewing the major findings identified from internal audit investigations
MeetingsThree Committee meetings were held in 2016. Outside of the meeting process, the Committee Chairman has regular contact with the Executive Directors, other Committee members and the internal and external auditors on a variety of topics. The Committee itself meets with both the Head of Group Internal Audit and the external auditor at least once a year without the Executive Directors being present.
Full minutes are kept by the Secretary of the matters considered and decisions taken by the Committee.
As Committee Chairman, I am available to meet investors to ensure that shareholder interests are properly protected in relation to matters pertaining to the Committee’s remit.
77Annual Report and Accounts 2016 / National Express Group PLC

Audit Committee activity
The key areas of Committee activity covered during the year, and through to the date of this report, included the planning, monitoring, reviewing and approval of the following:
Financial reporting• Quality and appropriateness of the half year and annual
Financial Statements (including accounting policies, key areas of financial judgement and associated reports from the external auditor regarding its audit findings); after review we concluded they were acceptable and recommended their approval to the Board as a whole
• Assessment and management of significant risks for the Group for the 2016 financial year
• The information, underlying assumptions and stress test analysis presented in support of the going concern statement. Full details of the process and outcomes from the Committee’s work can be found on page 45
• Consistency and appropriateness of the financial control environment – we concluded this was acceptable throughout the year
• The extent to which the Annual Report is fair, balanced and understandable – we concluded this was the case
Viability statement• The Committee considered the Group’s future viability and
considered the following points before recommending to the Board the statement on viability included on page 45: – An assessment of the prospects of the Group, taking into account the Group’s current position, opportunities, strategic plans and risk appetite – The future period over which it is appropriate for the Group to assess its viability – Identification of risks which have the potential to affect the Group’s strategic plans over the lookout period, including those principal risks and uncertainties described in the Strategic Report and others which could impact the Board’s assessment of the Group’s viability – Quantification of the risks identified in the context of the Group’s internal control framework and of potential mitigating actions, and the ability of the Group to withstand severe but plausible downside scenarios – Any qualifications necessary to inform or support the reader’s understanding of the viability statement
External audit• The Committee, where appropriate, engaged on the
following matters supported by the Deloitte external audit team led for the first time by Stephen Griggs: – Scope of the 2016 external audit plan and fees – Consideration of the conclusions of the external auditor on key risks and areas of judgement. – Review of the effectiveness of the external audit process and assessment of the performance, continued independence and recommendation to the Board of the re-appointment of the external auditor – External audit tendering policy – Level of fees paid to the external auditor for non-audit services – Revision to the policy on engaging the external auditor to supply non-audit services, updated to reflect the FRC’s Revised Ethical Standard 2016 and other related
corporate governance guidance on the prohibition of tax work by a company’s external auditor
Risk management and internal control• The Committee welcomed the new Group Risk Manager
and with his support and the support of other senior Group managers, reviewed the following matters: – Scope of the internal control and risk management programme – Adequacy and effectiveness of the Group’s internal control and risk management systems – Twice-yearly detailed review of the Group’s risk register, including significant and emerging risks – Review of the Group’s IT risk strategy and disaster recovery plan – Twice-yearly review of the Group’s Cyber Security Committee’s programme to assess, prioritise and monitor significant cyber security threats facing the Group and to monitor progress on plans for their management and mitigation. The Chairman of the Cyber Security Committee formally reports to the Audit Committee, both periodically and upon request – Review of reports on fraud and whistleblowing
Internal audit• The Head of Group Internal Audit engaged with the
Committee on the following matters: – Scope of the internal audit plans for 2016 and 2017 – The results of internal audit reviews and the progress made against agreed management actions – The results of internal audit compliance testing of financial controls (Annual Fitness Checks) within the subsidiaries – Effectiveness of the Group’s internal audit function including feedback from divisional Managing Directors – Review of annual independence compliance statement
Tax and treasury• As part of the Committee’s annual processes we
addressed the following matters: – Review of the Group’s treasury policy, including consideration of the key treasury risks facing the Group (foreign currency, interest rate, fuel price and counterparty risk) and the approach taken on their management – Review of the annual update of the Group’s tax affairs – Preliminary review of the Group’s Tax Strategy required to be published on the Company’s website in 2017
Other matters considered included:• Review of corporate governance and legal and
regulatory compliance;• Review of the annual rolling agenda of items for
consideration by the Committee to ensure that all matters are covered in accordance with the terms of reference and in the correct order;
• Review, update and recommendation to the Board for approval of the Committee’s terms of reference;
• Internal review of the effectiveness of the Committee, concluding that it continued to operate effectively; and
• Review and approval of the Committee’s report for inclusion in this Annual Report.
Corporate Governance Report continued
Corporate Governance
78 National Express Group PLC / Annual Report and Accounts 2016

Fair, balanced and understandableAt the request of the Board, the Committee undertook a formal review of the Annual Report process in terms of preparation, quality of content, key themes and messages, consistency of information and presentation. From the information and assurance provided by management and the review conducted by the external auditor, the Committee was able to confirm to the Board that the 2016 Annual Report, taken as a whole, is fair, balanced and understandable and provides the necessary information for shareholders to assess National Express’ performance, business model and strategy.
Risk management and internal controlsThe Board as a whole, including the Committee members, considers the nature and extent of National Express’ risk management framework and the risk profile that is acceptable to achieve the Company’s strategic objectives. As a result, it is considered that the Board has fulfilled its obligations under the Code.
The Committee continues to be responsible for reviewing and monitoring the adequacy, design and effectiveness of the Group’s ongoing systems of internal control and risk management. In that regard, the Committee received reports from management and the Head of Group Internal Audit as well from the external auditor.
Financial reporting and significant financial judgements for 2016
Goodwill impairmentAs it is required to do annually, the Committee considered whether the carrying value of goodwill and intangible assets held by the Group should be impaired. The judgements largely related to the assumptions applied in calculating the value in use of the Spanish Coach and Bus and the North American School Bus businesses. When testing for impairment, the key considerations were the underlying cash flows (which were taken from the Board approved Group three year plan), the discount rates and the future growth rates. The Committee received a detailed report on the outcome of the impairment reviews performed by management and took into account the views of the external auditor emanating from their review. The Committee concluded that the goodwill and intangible assets of the Spanish Coach and Bus and the North American School Bus businesses were not impaired and it approved the disclosures included in the 2016 Financial Statements.
Insurance and other claimsWith the support of the new Group Risk Director, who looked at this area from a fresh perspective, the Committee considered the adequacy of the provisions associated with insurance and other claims risks particularly in North America. The assessment focused on the advice received from a third party actuary in connection with the Group’s exposure to auto and general liability and workers’ compensation insurance claims. Consideration was also given to the most likely outcome, and associated financial effect, of other claims and exposures facing the Group. The Committee received a report from management on North American insurance and other claims and considered the views of the external auditor. The Committee concluded that the insurance and other claims provision is fairly stated.
PensionsThe Committee considered the key assumptions underpinning the Group’s defined benefit pension obligations. Management use third party advisers to produce reports which were considered by the Committee, together with the views of the external auditor on the appropriateness of market and employee benefit assumptions. Following consideration, the Committee concluded that the pension assumptions were reasonable and the net pension liability fairly stated.
TaxationThe Committee considered the adequacy and sufficiency of the disclosure of the Group’s tax affairs in the Annual Report and the appropriateness of the accounting treatments adopted to reflect the Group’s tax charge, assets and provisions in accordance with International Financial Reporting Standards. Tax legislation across the markets in which the Group operates is complex, and sometimes management and the relevant tax authorities differ in the interpretation and application of tax law, which can lead to uncertainties in the estimation of provisions and recognition of deferred tax balances. On complex issues, management may seek external tax advice to ascertain whether provisions should be made. Where tax exposures can be quantified and meet the criteria for recognition, best estimates are made and provisions recognised. These estimates are based on the judgement of senior management in the light of the facts and available information, and are reviewed by the Committee. The Committee also reviewed reports from the external auditor as to the appropriateness of the judgements made by management. The Committee is satisfied that the treatment and disclosure of the Group’s tax affairs in the Consolidated and Company Financial Statements are appropriate and sufficient.
Fuel hedge accountingThe Committee considered the accounting for the Group’s financial derivatives and the associated tests for hedge accounting. The Committee received reports from management and the external auditor on the fair value of the Group’s financial derivatives and support for the tests for hedge effectiveness, particularly on the Group’s fuel derivatives following continued changes in market value. Following consideration, the Committee is satisfied that the policies relating to financial derivatives are appropriate and that they are fairly stated.
Sale of Essex Thameside franchiseThe Committee considered the accounting and disclosure requirements regarding the sale of the National Express Essex Thameside ’c2c’ franchise to Trenitalia. The Committee considered management’s approach and, having taken input from the external auditor, agreed that it was appropriate.
79Annual Report and Accounts 2016 / National Express Group PLC

Corporate Governance Report continued
Further details of the internal controls are set out on page 75. A summary of the Company’s risk management framework and an overview of its principal risks are detailed on pages 34 to 37.
Internal auditThe Committee has oversight responsibilities for the internal audit function which is led by the Head of Group Internal Audit.
The purpose of the internal audit function is to provide an independent, objective assessment of the effectiveness of internal controls, risk management and governance processes throughout the Group. The function adds value by:
• contributing to the continuous improvement of internal control and related processes, including identifying and sharing good practice across the Group;
• addressing the safeguarding of assets, compliance with applicable laws and regulations and achievement of management’s operational objectives;
• promoting business processes that deliver effective internal control at reasonable cost; and
• providing alignment with the Group’s risk management process.
An Internal Audit Charter sets out the responsibilities of both the internal audit function in terms of its focus, programme of activity, scope of investigations and reporting lines and management in terms of it providing support and co-operation at all levels of the business.
During 2016, a carefully targeted internal audit plan was agreed and undertaken on certain of the Group’s operations, systems and support functions with subsequent reports, including management responses and recommended actions plans, considered by the Audit Committee in February, July and November. The Committee also reviewed and agreed a modified and insightful approach by the Head of Group Internal Audit to the planning of their interventions in 2017.
Internal auditor effectivenessThe Committee is required by the Code and its own terms of reference to monitor and review the effectiveness of the Group’s internal audit function. The Committee fulfils this requirement principally through the review of the annual internal audit programme and allocated internal audit resource, consideration of the major findings identified from completed internal audit work and feedback from executive management. To supplement this approach, feedback on the effectiveness of the internal audit function was also sought through post-audit questionnaires and feedback from management across all our divisions. The questionnaire scored the internal audit team against a set of criteria and captured any specific comments or observations that management wished to make. Overall, for 2016 the Committee concluded that the Group’s internal audit function continued to be effective in the role it undertakes, with areas scoring relatively highly being around audit planning and the completion of audit fieldwork. Areas identified for further focus were timeliness of reporting, in respect of both issue of draft reports and agreement of appropriate management responses. Internal audit will also be looking to add more value through increased focus on sharing good practices across the Group businesses.
Anti-bribery policyA Group anti-bribery policy has been established and issued to all Group companies and is also available on the Company’s website, www.nationalexpressgroup.com. The policy prohibits any inducement which results in a personal gain or advantage to the recipient or any person or body associated with them, and which is intended to influence them to take action which may not be solely in the interests of the Group or of the person or body employing them or which they represent. The prevention, detection and reporting of bribery is the responsibility of all employees throughout the Group. Employees can report confidentially any suspicion of bribery via an externally facilitated whistleblower helpline. During the year, a refresh and reminder programme on the Group’s anti-bribery policy, comprising an e-training module, was implemented.
Whistleblowing policy‘Whistleblowing’ policies are in place in each of the Group’s businesses and are also available on the Company’s website, www.nationalexpressgroup.com. The Board supports the highest standards of corporate governance and ethical practices within all its operations and continues to review its policies on an ongoing basis. The Board has endorsed a set of principles which establish the framework for how its businesses operate. Key to these is working in an open and honest manner. The Group is committed to the highest standards of quality, honesty, openness and accountability. Employees are encouraged to raise genuine concerns under the policy by either contacting their line manager or telephoning a dedicated external helpline. Any concerns raised are investigated carefully and thoroughly to assess what action, if any, should be taken and confidential records are maintained.
External auditThe external auditor is engaged to express an opinion on the Company’s Financial Statements. The audit includes the review and testing of the systems of internal financial control and the data contained in the Financial Statements to the extent necessary to express an audit opinion on the truth and fairness of the Financial Statements.
External audit lead partnerThe current external audit engagement partner is Stephen Griggs, Head of Audit and Risk Advisory for Deloitte in the UK. Stephen took up his duties from 1 January 2016 following the mandatory rotation of Nigel Mercer after his five years of engagement.
External audit tendering policyThe Committee confirms its compliance for the financial year ending 31 December 2016 with the provisions of the Statutory Audit Services for Large Companies Market Investigation (Mandatory Use of Competitive Tender Processes and Audit Committee Responsibilities) Order 2014. The Company last put its external audit contract out to tender in 2011, following which Deloitte LLP replaced Ernst & Young LLP and was appointed as the Group’s auditor. The Committee regularly considers the marketplace, benchmarking the current level of audit services that the Company receives along with the fees it pays and the value being delivered. The Committee recognises that audit tenders and transitions to new auditors require significant resource. Under current regulations, the Company will be required to retender the audit no later than in respect of the year ending 31 December
Corporate Governance
80 National Express Group PLC / Annual Report and Accounts 2016

2021. The Committee will assess the quality of the external audit annually and, on the basis that the quality of service remains high and the audit fee represents good value to shareholders, will tender the audit no later than for the year ending 31 December 2021.
Assessment of the effectiveness and independence of the external auditor and external audit processThe Committee assesses and reviews on a regular basis the independence and effectiveness of the external auditor. As part of its determination the Audit Committee reviewed the scope, materiality threshold and fees for the external audit plan and received and considered the external auditor’s assessment of the significant risks affecting the Group (as detailed above). The Committee also considered a report by the external auditor on the firm’s independence, which is required in order to carry out its professional duties and responsibilities as auditors.
Additionally, the effectiveness of the 2016 external audit process was formally assessed by the Committee to meet the expectations set out in provision C3.2 of the Code. This was carried out through the use of a survey and analysis approach taking into account the views and opinions of the Group Finance team and divisional Finance Directors. In so doing, the Committee’s review and qualitative assessment focused on feedback and insights, process and communication, handling of issues and quality of the team. The Committee is satisfied that the external audit process continues to be effective and provides an appropriate independent challenge to the Group’s senior management.
Having completed its assessment of both the external audit process and the external auditor for the financial period under review, the Committee is satisfied that the auditor has performed satisfactorily in 2016, that the audit process implemented was effective and that the external auditor remains independent. Based on Deloitte’s work during the year, the Committee concluded that it was satisfied with its performance and we were happy to recommend to the Board that Deloitte LLP be put forward to for re-appointment at the 2017 AGM.
Non-audit servicesDuring the year, taking into account the Financial Reporting Council’s Revised Ethical Standard 2016, Guidance on Audit Committees and the revised 2016 UK Corporate Governance Code, the Committee approved a revised policy on the provision of non-audit services by its external auditor for the following types of service:
• Services that are considered to have ‘general pre-approval’ by the Audit Committee, by virtue of the approval of the policy
• Services that require ‘specific pre-approval’, on a case by case basis, before any work can commence
• Services that are prohibited
The services that have general pre-approval are assistance with the preparation of statutory accounts during the audit process, audit-related services, including reports that are required by law or regulation to be prepared by the external auditor, reviews of interim financial reports, regulatory returns and reports to support government grants, work on financial information or controls that are authorised by those charged with governance and where the work is integrated with the external audit and carried out under the same terms and conditions.
Non-audit services requiring specific Committee approval are those which could threaten the overriding principles of integrity, independence and objectivity because of their size and nature, or because of the nature of their terms and conditions (such as contingent fee arrangements). In the event that the required conditions are met, as detailed in the policy, the Committee will consider carefully whether it is in the Group’s interest to purchase the services from the external auditor and whether relevant safeguards put into place by the auditor are likely to be effective in practice. The approval of the Committee is sought, prior to the following types of assignment being undertaken:
• Due diligence work on possible acquisitions• Assistance with reviewing IT systems, except as part of the
external audit• Valuation services, including valuations performed in connection
with actuarial services or litigations support services
In addition to the approvals required in the policy and in accordance with the Ethical Standards, with effect from the Group’s audit for the year ended 31 December 2020, a cap of non-audit services will be set at 70% of the average of the audit fees for the preceding three-year period. The Committee will monitor all non-audit fees and ensure that in any given year non-audit services are less than 70% of the audit fee for that year.
Whilst the Revised Ethical Standard permits certain tax-related services, it is the view of the Group and the Committee that it is in the Group’s best interest that these services should not be performed by the external auditor and therefore these services are effectively on the prohibited list.
The split between audit and non-audit fees for the year ended 31 December 2016 appears in note 6 to the consolidated accounts.
FRC’s Corporate Reporting ReviewIt is confirmed that the Company’s Annual Report has not been reviewed by the FRC’s Corporate Reporting Review team.
Committee performance evaluationAs part of the 2016 internal Board performance evaluation as described earlier in this governance report on page 71, the Committee assessed its own effectiveness. Committee members agreed that, overall, the Committee’s performance had been effective during the year. An area for focus for the 2017 financial year would be to extend each Committee meeting by up to 30 minutes to allow for deeper discussion on certain topics.
Mike McKeonAudit Committee Chair 23 February 2017
81Annual Report and Accounts 2016 / National Express Group PLC

How the Safety & Environment Committee spent its time in 2016
External audit of corporate governance of safety
9%
Driving out Harm annual review Safety performance review
9%
Environment review 18%
Review of safety-related technology 16%17%28%
2%1%
Review of Chattanooga incident Health and wellbeing Committee governance
Dear Shareholder
We were deeply saddened by the Chattanooga accident in the North American School Bus business, the details of which have been covered earlier in this Annual Report. The Safety & Environment Committee (the ‘Committee’) was reassured by the Group Chief Executive’s prompt and engaged action taken to lead the Company’s review into the causes of, and the complexity of issues arising from, this tragic accident. The Committee is encouraged by the steps being taken and fully support Dean Finch and his management team in this matter. National Express will, of course, continue to assist in any reviews into the incident and is determined to learn any necessary lessons from this tragic accident.
Safety continues to be our highest priority across the Group with overall responsibility lying with the Group Chief Executive and our Divisional Managing Directors, who set out annual plans and priorities for improved performance. The management of the Group’s environmental impact on the communities it serves forms a key component of our Community Value. The Committee, comprised solely of Non-Executive Directors, plays a fundamental role in the oversight of safety and environmental issues and initiatives by reviewing and challenging the structure, content and operation of the safety management arrangements which have been put in place by the executive management and monitoring environmental performance and targets.
The Committee was pleased to see the extent to which management has leveraged technology during the year in support of our World Class Driver training initiative, which forms part of our strategy. All new vehicles joining the National Express network of coaches are now fitted with Lytx DriveCam, an incident alert system provided by an on-board camera. Over the next year, a programme will be rolled out to fit around half of our UK buses with this new technology, with plans in place to bring all school buses into the programme over the next three years. Under this system, incidents are triggered by different events, such as harsh braking, swerving or collisions. Footage is then sent directly to the operator for review immediately after an event has happened, allowing the operator to coach the driver on the relevant behaviours displayed, using the footage to talk through the event. The Committee recognises the value added by management’s investment in these new systems which will help us continue to improve driving standards and manage our safety programme more proactively.
The Committee continues to be supported in its safety oversight role by independent safety consultant Arthur D Little which, on an annual basis, undertakes an audit of corporate governance in line with our Global Standard: Safety Audit and Management Check. Their audit examines the role and effectiveness of the Committee, the Group-level monitoring of safety performance, the effectiveness of the safety management review and the safety management arrangements in place across all Group companies. As Committee Chairman, I am pleased to report that the
Safety & Environment Committee Report
Chris Muntwyler Safety & Environment Committee Chair
Corporate Governance Report continued
Corporate Governance
82 National Express Group PLC / Annual Report and Accounts 2016

conclusion Arthur D Little reached in respect of the year under review was that the Board and the Committee continued to provide effective safety governance: the Committee has respect for, and continuing confidence in, the strong leadership shown by the Group Chief Executive, who is supported by a highly regarded Group Safety Director.
The Committee was also pleased to learn of several safety awards received by the Group during 2016. All three UK businesses, Coach, Bus and c2c, received the British Safety Council Sword of Honour, which recognises commitments to excellent health and safety management standards. Our achievements through our Driving Out Harm programme have also been recognised by the Prince Michael International Road Safety Awards, which reward outstanding achievements and innovation that improve road safety. Singled out for notable mention relating to this award was our ALSA business in Morocco where incidents have fallen by 85% in the five years since these standards were introduced. It is heartening to know that our safety measures and arrangements are externally recognised and validated.
With respect to the management of the Company’s environmental responsibilities, I am pleased to report that, for 2016, the Group continued to have zero prosecutions, enforcement notices or violations and is fully compliant with all new environmental legislation introduced in 2015. As part of the Group’s climate change strategy, we are committed to working in partnership with our stakeholders to mitigate the impacts of climate change. The Committee has been pleased to see management’s approach to constantly striving to reduce our emissions through the use of innovative fuel efficiency technologies, carbon reduction programmes (linked to energy and water use in buildings) and the broader supply chain to address our static emissions. Investment has continued during the year in carbon efficient fleet and energy saving initiatives across the Group with enhanced employee engagement on environmental actions plans.
MembershipThe membership of the Committee during the year ended 31 December 2016 is set out below. All members are Non-Executive Directors. Three meetings were held during the year with attendance by members shown on page 62.
Chris Muntwyler (Chairman) Jorge Cosmen Joaquín Ayuso Matthew Crummack Dr Ashley Steel Sir John Armitt CBE Lee Sander Jane Kingston Mike McKeon
The Company Secretary acts as Secretary to the Committee and attends all meetings. In addition, the Group Chief Executive, Group Finance Director, Group Safety Director, Group Property & Environment Director and representatives from our external safety adviser, Arthur D Little, attend by invitation.
Full minutes are kept by the Secretary of the matters considered and decisions taken by the Committee.
The Committee’s terms of reference are reviewed annually and are available on the Company’s website, www.nationalexpressgroup.com.
Role and responsibilitiesThe Committee’s key responsibilities are summarised below:
• Responsibility for reviewing and challenging constructively the structure, content and operation of the safety management arrangements put in place by members of the executive management
• Reporting to the Board on its observations on the safety management arrangements in place, and reviewing and making recommendations to the Board on any specific safety management issues relating to the Company or any subsidiary company
• Reviewing and monitoring the Company’s environmental performance and targets
Committee activityThe key areas of Committee activity during the year, and through to the date of this report, included the following:
• Adopted a new benchmarking approach to focus on risk management at Group and divisional level
• Approved updated KPIs to provide greater analytical insight over the next five years
• Reviewed the focus on water consumption and treatment as the business continues to expand into new territories
• Oversaw the introduction of a more tailored cost/benefit analysis carried out on environmental initiatives and actions being delivered across the Group
• Reviewed the impact of the continued investment in vehicle safety systems and on-board supporting technology to reduce the risk of accidents
• Reviewed the safety-related benefits arising from the implementation of the World Class Driver programme
• Reviewed the health and wellbeing activities being implemented across the Group
The Company’s detailed mandatory report on greenhouse gas emissions in all of its businesses during 2016 can be found on pages 28 to 31.
Committee EffectivenessFeedback from the annual performance evaluation of the Board and its Committees, which was conducted internally this year as described earlier in this report, confirmed that the Committee continued to be effective in fulfilling its duties with no particular areas of concern identified for development.
ConclusionThe safety of our employees and customers is of critical importance to the Board, as is the responsible management of our environmental obligations. I would like to thank Dean Finch and his team for the leadership they show in these areas and, in particular, their personal engagement with safety matters across the Group over the course of the past 12 months.
Chris Muntwyler Safety & Environment Committee Chair 23 February 2017
83Annual Report and Accounts 2016 / National Express Group PLC

Corporate Governance Report continued
Relations with Shareholders
Highlights• Roadshows following financial results• Meetings between Chairman, Non-Executive Directors
and shareholders• Meetings with shareholders on remuneration and
sustainability issues• Investor conferences participation• Annual General Meeting
The Board recognises the importance of maintaining good communications with the Company’s shareholders to ensure mutual understanding of the Group’s strategy, objectives, governance and performance.
During the year shareholders are kept informed of the progress of the Group through regular corporate communications: the Preliminary Results Announcement, the Annual Report and Accounts, the Half Year Results Announcement, the Notice of Annual General Meeting, Interim Management Statements and press releases regarding any other significant developments, as well as the dissemination of regulated information. Such communications are made available to the London Stock Exchange and are simultaneously available on the Company’s website, www.nationalexpressgroup.com.
The Company’s website houses a wide range of information about the Group, including the Annual Report and Accounts, press releases, share price data and links to subsidiary company websites.
From time to time the Company invites research analysts and institutional investors to presentations and site visits that are designed to provide more understanding of the strengths and capabilities of its business operations and strategy.
Shareholders can receive documentation such as the Annual Report and Accounts electronically and are also able to cast their votes by proxy electronically. The Company also has an electronic proxy appointment service for CREST members.
Investor relations programme in 2016February2015 Full Year results presentation (London)
MarchFull Year results roadshow (London and Edinburgh)
AprilMeetings with shareholders ahead of the AGM
MayQ1 Interim Management Statement Conference call with analysts and investors Annual General Meeting (Birmingham)
July 2016 Half Year results presentation (London)
SeptemberInvestor conferences (London)
October Q3 Interim Management Statement Conference call with analysts and investors £400 million bond placing with roadshow for bondholders
Institutional shareholdersThe Board is committed to maintaining an open dialogue with shareholders and recognises the importance of that relationship in the governance process. A focused and proactive investor relations programme is in place. The Chairman, Group Chief Executive and Group Finance Director have held a number of meetings with existing and prospective institutional shareholders during the year and given presentations following the full year and half year results. They have also met and given presentations to research analysts and stockbrokers’ sales teams. The Company’s appointed brokers and investor relations advisers in turn have provided regular confidential feedback to the Company on the views of the major institutions.
The Chairman, Senior Independent Director and other Non-Executive Directors are also given the opportunity to meet institutional shareholders and are available by contact through the normal channels.
The Board is provided with regular updates on the views and issues raised by the Company’s investors. During the year the Board received external presentations from advisers on shareholder and market perception of the Group’s performance and strategy. Formal written responses are given to correspondence received from shareholders, as well as bilateral engagement through the Group Chief Executive, Group Finance Director and the Company’s investor relations function.
Corporate Governance
84 National Express Group PLC / Annual Report and Accounts 2016

Analyst coverageThe Company is aware of 16 analysts who have published equity research notes covering National Express Group PLC during 2016. The names and contact numbers of those firms which currently follow us are shown on our website.
Private shareholdersWe welcome contact from our private shareholders and are pleased to answer their queries. We encourage our shareholders to make use of our website to access Company reports, notices of meeting and general shareholder and dividend information. The website also provides a direct link to Shareview (www.shareview.co.uk), which enables shareholders to view and manage their shareholder account online.
Annual General MeetingNotice of the Annual General Meeting and related papers are sent to shareholders at least 20 working days before the meeting. Last year’s Annual General Meeting included a presentation by the Group Chief Executive on the progress of the business and an opportunity for shareholders to ask questions. All of our Directors were available to answer questions formally during the meeting and many circulated and talked to shareholders informally afterwards.
Voting on the resolutions was conducted by poll. Some 84% of the shares in issue were voted and all the resolutions were passed. The results were published on the Group’s website shortly after the meeting.
We look forward to welcoming shareholders to our 2017 Annual General Meeting and updating them on the progress of the business this year.
Geographical breakdown as at 31 December
0
20
40
60
80
Rest of worldNorth AmericaEuropeUK
% o
f sha
reho
lder
s
2015 2016
66.0 64.7
2015 2016
23.7 21.9
2015 2016
6.4 8.63.9 4.8
2015 2016
Analysis of ordinary shareholdings at 20 February 2017Number
of accounts
Percentage of total number
of accounts Number
of shares
Percentageof ordinary
capital
By size of holding
1-500 5,404 47.43 744,163 0.14
501-1,000 1,364 11.97 1,066,606 0.21
1,001-5,000 3,079 27.02 7,259,723 1.42
5,001-50,000 1,286 11.29 15,591,530 3.05
50,001-1,000,000 195 1.71 55,536,584 10.85
Over 1,000,000 66 0.58 431,540,042 84.33
11,394 100.00% 511,738,648 100.00%
By investor type
Individuals 10,655 93.52 21,339,738 4.17
Institutional investors 439 3.85 399,246,719 78.02
Other corporate investors 300 2.63 91,152,191 17.81
11,394 100.00% 511,738,648 100.00%
85Annual Report and Accounts 2016 / National Express Group PLC

Directors’ Remuneration Report
At a glance
IntroductionIn this section, we summarise the purpose of our Remuneration Policy and its linkage to our corporate strategic objectives, and we highlight the performance and remuneration outcomes for the 2016 financial year. More detail can be found in the Annual Report on Remuneration.
Our principles of remunerationThe Remuneration Policy is based on the following broad principles set by the Committee to:
• provide a competitive remuneration package to attract and retain quality individuals;
• align remuneration to drive the overall objectives of the business;
• align the interests of management with the interests of shareholders; and
• provide the foundation for overall reward and remuneration beyond the specific roles falling within the direct remit of the Remuneration Committee.
In implementing its policy, the Committee gives full consideration to the principles set out in the Code with regard to Directors’ remuneration and due regard is given to the guidance issued by investor protection bodies and institutional investors more generally.
Remuneration policy is reviewed on an ongoing basis against the Committee’s broad principles and in the light of emerging best practice in corporate governance.
This Directors’ Remuneration Report has been prepared in accordance with Schedule 8 to the Large and Medium-sized Companies and Groups (Accounts and Reports) (Amendment) Regulations 2013 (the ‘Regulations’) and the provisions of the 2014 UK Corporate Governance Code (the ‘Code’).
The report consists of the following sections:
p86‘At a glance’ section providing a summary overview
p88The Annual Statement by the Chair of the Remuneration Committee
p90The Annual Report on Remuneration, which sets out payments made to the Directors and details the link between Company performance and remuneration for the 2016 financial year
p106The current Remuneration Policy report, which sets out the Company’s Remuneration Policy for Directors and the key factors that were taken into account in setting the policy. This policy is currently in operation, having been approved at the 2015 AGM. It is intended that the policy will apply until the conclusion of the 2018 AGM; the Annual Report on Remuneration will be subject to an advisory vote at the AGM.
Directors’ Remuneration Report
Corporate Governance
86 National Express Group PLC / Annual Report and Accounts 2016

Link to strategyOur focus is to deliver sustainable growth and profitability and we seek to achieve this through the following strategic initiatives:Strategic initiatives Measurement through the incentives
Revenue growth Short term through the profit targets in the annual bonus plan and longer term through EPS growth targeted by the Long-Term Incentive Plan (‘LTIP’).
Cost efficiency and better margins Targeted through ROCE metric under the Performance Shares and indirectly through relative TSR condition attached to Performance Shares.
Operational excellence – safety, customers, people, community
Measured by non-financial metrics in the annual bonus plan.
Superior cash and returns Measured by free cash flow metric in the annual bonus plan, and ROCE and TSR conditions attached to the Performance Shares.
Creating new business opportunities Measured by non-financial metrics in the annual bonus plan.
How we have performed in 2016Bonus KPIs Threshold Target Maximum Actual
Normalised PBT (£m) £146.7m £163.0m1 £179.3m £175.0m2
Free cash flow (£m) £104.3m £115.9m3 £127.5m £138.6m
1 The original normalised profit target set was £152 million. This adjusted upwards to £163 million for exchange rate gains, bond costs and acquisitions.2 Includes contribution from UK Rail.3 The original free cash flow target set was £103.5 million. This was adjusted upwards to £115.9 million for exchange rate gains.
Single total figure of remuneration for Executive Directors for 2016
£’000Base
salaryTaxablebenefits1
Performance- related bonus
Value of LTIP
vested2
Pension- related
benefits3
2016Total
2015Total4
Group Chief Executive – Dean Finch 589 29 984 2,050 206 3,858 3,661
Group Finance Director – Matthew Ashley 325 17 431 533 81 1,387 1,390
1 Taxable benefits comprise a cash alternative to a fully expensed car (£20,000 for Dean Finch and £11,520 for Matthew Ashley), health insurance and death in service and life assurance cover.
2 The value of 2016 LTIP vested is based upon the average share price for the last quarter of 2016 (356.65 pence). The 2015 comparison total takes into account the actual LTIP payout made in 2016.
3 In addition, Dean Finch has an entitlement under an unfunded pension arrangement as described on page 111. From 5 June 2016, benefits under this arrangement ceased to accrue.
4 Matthew Ashley’s base salary for 2015 is pro-rated to reflect that he was appointed as a Director on 28 January 2015.
87Annual Report and Accounts 2016 / National Express Group PLC

Annual Statement by the Chairman of the Remuneration Committee
Directors’ Remuneration Report continued
How the Remuneration Committee spent its time in 2016
Executive Directors’ remuneration 20% Senior Management Group remuneration
LTIP
15%
Bonus rewards 10%
Chairman’s fee 25%
5%5%
20% Other employee share schemes Remuneration Report and governance
Dear fellow Shareholder
On behalf of the Board, I am pleased to present the Remuneration Report for 2016 which provides details of the remuneration earned by the Directors in the 2016 financial year.
Executive remuneration – major decisions made in 2016 As you can see from these highlights, 2016 was another very successful year for the Group, (the best since the Company’s incorporation) in which the share price increased by 6.3% and a 10% increase in the final dividend is being proposed.
As described in Chris Muntwyler’s Safety section, and elsewhere in the Annual Report, the Board has spent a considerable amount of time reviewing the tragic accident in Chattanooga and any lessons that can be learned. As the Chairman has said in his statement, we will implement any appropriate changes that the ongoing investigations identify. But the Remuneration Committee (the ‘Committee’) is also very aware of the progress that the business has made under the current leadership. Since the introduction of Driving Out Harm seven years ago, the Group’s measure of harm (‘FWI’) has more than halved. Arthur D Little’s annual review of our safety performance commented on the strength of our safety systems stating:
“We conclude that continuing and strong focus on Driving Out Harm is delivering further group-wide improvement in safety management. Whilst the Group has continued to grow, and despite mobilisation challenges, the newest businesses (German Rail, Bahrain) have made good progress in safety and are demonstrating standards above those typical in-country. World Class Driver is providing an effective framework for engaging divisions with improvements to safe driving.”
There is a longer statement by Arthur D Little on page 24. Three months after the tragic accident in Chattanooga, the regulatory authorities have not identified any faults in our maintenance systems or the background screening, training or management of our driver.
In addition, all three UK divisions have now been presented with the British Safety Council Sword of Honour. Complementing their five-star ratings, our road safety achievements have also been recognised with a Prince Michael International Road Safety Award.
In the light of the tragic event in Chattanooga, the Committee and Executive Directors unanimously agreed that it would not be appropriate to award the safety element of the bonuses this year. However, given the initial findings from Chattanooga, coupled with the significant, independently audited, progress in safety in recent years, the Remuneration Committee concluded
Jane KingstonChair of the Remuneration Committee
Company highlights for the 2016 financial yearThe following financial results were achieved in 2016:
• Group revenue of £2.10 billion, a 10.6% increase on 2015 on a constant currency basis;
• Normalised Group Profit Before Tax of £175.0m, which includes the contribution from UK Rail, and is a 16.6% increase from the prior year;
• Statutory Profit for the year from continuing operations and UK Rail of £120m which is 10% higher than 2015 and double the profit earned in 2014
• Free cash flow was £138.6m.
Corporate Governance
88 National Express Group PLC / Annual Report and Accounts 2016

the other financial and non-financial objectives should still be eligible for bonuses in the light of their personal performance and their leadership in achieving an excellent set of corporate results. Bonuses equal to 167% of salary for the Group Chief Executive and 132.7% for the Group Finance Director were therefore determined by the Committee for the year. In accordance with the Remuneration Policy, a portion of their bonus has been deferred into shares. This reinforces the alignment of their interests with those of shareholders and assists in ensuring a strong link between pay and the value delivered to shareholders. Further details relating to these bonus payments are set out on page 93. No discretion was used by the Committee in determining these bonuses.
The three-year performance period for the LTIP award granted in 2014 concluded on 31 December 2016. The Executive Directors will receive 98.7% of the award when it vests in April 2017. The Committee believes that the vesting of the award demonstrates the strong performance of the Group over the past three years.
The performance period for the Group Chief Executive’s five-year award granted in 2012 also concluded on 31 December 2016. The award was based on a 50/50 split between EPS and TSR. As it was determined that only the EPS performance condition had been met, 50% of the award is due to vest in August 2017.
Effective from 1 January 2017, the Committee determined that the Group Chief Executive’s salary be increased by 4.4% to £615,000. In reaching this decision, the Committee took into account the Group Chief Executive’s strong personal performance in his role, delivering:• Strong delivery on operational metrics;• Significant shareholder value in the last 12 months; and• A good outlook for the Group for 2017 under the strategy
for growth and the increased international focus.
This increase is also in line with those of other high performing individuals across the workforce. Whilst the Group’s general base pay increase in 2016 across the Group was 2%, when allowing for other factors such as progression increases within a grade structure, promotional increases and market adjustments, the UK employees within the Group have seen a 4% increase in base pay over the previous 12 months.
As an internal hire, Matthew Ashley was appointed to the role of Group Finance Director in January 2015 on a base salary of £300,000 with a commitment to review subject to performance in order to align with the market. Following successful completion of his first year in the role, his salary had increased to £325,000 from January 2016. After another excellent year of personal delivery during 2016 and in recognition of his strong performance in the role, the Committee determined that it was appropriate that the second step of the salary progression be implemented and that Matthew’s salary be increased by 7.7% to £350,000 effective from 1 January 2017.
As part of his career path plan, Matthew will be relocating later in 2017 to take responsibility as President and Chief Executive Officer for National Express in North America. The Committee determined that Matthew will be assigned to North America on his current terms and conditions. He will remain an Executive Director on the main Board. As a result of Matthew’s move, Chris Davies has been appointed externally as Group Finance Director to replace Matthew when he relocates. Chris’s base salary will be £350,000 and other elements of his package are aligned with those of the current Group Finance Director and have been set in accordance with our Remuneration Policy (see details on page 110).
Wider pay environmentI am very encouraged by management’s commitment to invest in our staff at all levels. As announced last year, the Group is committed to ensure that all UK divisions secure Living Wage accreditation by the end of 2017 with UK Bus having become the first to implement this from January 2016. We have also committed that, across the Group in any country in which we operate, we will always pay at least 10% above the national minimum wage.
The full list of issues considered by the Committee during the year is summarised on page 90 of the Annual Report on Remuneration.
Looking forward – Remuneration PolicyNo changes to the Remuneration Policy will be proposed at the 2017 AGM. However, one of the Committee’s principal areas of focus for 2017 will be to review the existing policy and to consider the changes required to ensure that our remuneration framework continues to support and drive the delivery of our strategic vision. The Committee, under my leadership, will work with our remuneration advisers and will engage with shareholders to ensure that their views are reflected in the revised policy which will be put to shareholders for approval at the 2018 AGM.
On behalf of the Board, I would like to thank shareholders for their continued support. I am always happy to hear from the Company’s shareholders and you can contact me via the Company Secretary if you have any questions on this Report or more generally in relation to the Company’s remuneration framework. I will be available to answer any questions at the AGM on 10 May 2017.
Jane KingstonChair of the Remuneration Committee 23 February 2017
89Annual Report and Accounts 2016 / National Express Group PLC

Annual Report on Remuneration
The relevant sections of this report have been audited, as required by the Regulations.
Remuneration Committee composition and terms of referenceThe membership of the Remuneration Committee (the ‘Committee’) during the year ended 31 December 2016 is set out below. All members are independent Non-Executive Directors. Attendance at meetings held during the year is shown on page 62.
Jane Kingston (Chair) Lee Sander Matthew Crummack
Role and responsibilitiesThe key responsibilities of the Committee are to:• determine the fees of the Chairman;• determine the remuneration and conditions of employment (including any termination arrangements) of the Executive Directors;• review the remuneration and conditions of employment of the Senior Management Group; and• select and appoint any remuneration consultants who advise the Committee.
The full terms of reference of the Committee are available on the Company’s website, www.nationalexpressgroup.com.
Meetings The Committee met three times during the year.
Directors’ Remuneration Report continued
Remuneration Committee activityThe key areas of Committee activity during the year were as follows:
• Reviewed salary levels for the Executive Directors and Senior Management Group• Approved annual bonus payments to the Executive Directors and Senior Management Group having duly considered the
overall strong financial performance of the Company• Reviewed the Chairman’s fee • Considered and approved 2016 award levels under the current LTIP.• Tested performance conditions for awards made under the previous (2005) LTIP granted in 2012 and 2014• Set targets for the Group’s 2016 bonus scheme• Reviewed and approved the remuneration arrangements (including relocation expenses) for Matthew Ashley ahead of
his secondment to North America to take up the role of President and CEO of the North America division• Approved the remuneration arrangements for the incoming Group Finance Director, Chris Davies• Reviewed the fees paid to the remuneration advisers• Review of corporate governance and legal and regulatory compliance with regard to Directors’ remuneration• Reviewed and updated the Committee’s terms of reference• Undertook an internal review of the effectiveness of the Committee, concluding that it continued to operate effectively• Reviewed and approved the Committee’s report for inclusion in the 2016 Annual Report
The Committee is authorised by the Board to seek any information that it requires from any employee of the Group.
The Committee members and management attendees did not participate in any discussions directly relating to their own remuneration or performance during the year.
Corporate Governance
90 National Express Group PLC / Annual Report and Accounts 2016

Advisers to the CommitteeMaterial advice or services were provided to the Committee during the year by:
PricewaterhouseCoopers LLP (‘PwC’) – independent remuneration consultants; Dean Finch – Group Chief Executive Matthew Ashley – Group Finance Director Mike Goddard – Group Human Resources Director Joy Baldry – Company Secretary
The Group Chief Executive attends meetings of the Committee to make recommendations relating to the performance and remuneration of the Senior Management Group. The Group Human Resources Director guided the Committee on reward matters relating to the Executive Directors and the Senior Management Group and the broader Group Human Resources strategy and policy. The Company Secretary acts as Secretary to the Committee.
During 2016, PwC provided advice to the management of the Group on various matters, including pensions, international taxation and business consulting. From time to time, the Company submits the remuneration consultant function to tender.
PwC is a member of the Remuneration Consultants Group and the voluntary code of conduct of that body is designed to ensure objective and independent advice is given to remuneration committees.
The Committee is satisfied that advice received was appropriate, objective and independent.
Adviser Fees in relation to remuneration advice (£’000)
PwC £781
1 The fee comprises a fixed fee element for standard work and an agreed additional amount for adhoc work undertaken during the year.
Single total figure of remunerationExecutive DirectorsThe table below sets out the single total figure of remuneration and breakdown for each Executive Director in post during the 2016 financial year. Comparative figures for 2015 have also been provided.
2016 2015
£’000Base
salaryTaxablebenefits1
Performance- related bonus
Value of LTIP
vested2
Pension- related
benefits3 TotalBase
salary4
Taxable benefits1
Performance- related bonus
Value of LTIP
vested2
Pension related benefit3 Total
Dean Finch 589 29 984 2,050 206 3,858 561 27 1,077 1,800 196 3,661
Matthew Ashley 325 17 431 533 81 1,387 276 126 413 506 69 1,390
1 Taxable benefits comprise a cash alternative to a fully expensed car (£20,000 for Dean Finch and £11,520 for Matthew Ashley), health insurance and death in service and life assurance cover.
2 The value of 2016 LTIP vested is based upon the average share price for the last quarter of 2016 (356.65 pence). The value of the LTIP vested for 2015 has been restated to reflect actual payout.
3 In addition, Dean Finch has an entitlement under an unfunded pension arrangement as described on page 111. From 5 June 2016, benefits under this arrangement ceased to accrue.
4 Matthew Ashley’s base salary for 2015 is pro-rated to reflect that he was appointed as a Director on 28 January 2015.
91Annual Report and Accounts 2016 / National Express Group PLC

Base salaryEffective from 1 January 2016, the Committee determined that the salary for the Group Chief Executive would be increased to £589,000. The Committee agreed that this increase was warranted in order to maintain the market competitiveness of his salary when compared against direct peers and companies of similar size. In the previous five years, Dean Finch had only received one increase (2% in 2014) over a period during which corporate performance had been strong.
Mathew Ashley was appointed to the role of Group Finance Director on 28 January 2015. His base salary upon appointment was set at £300,000. As Matthew had made a significant contribution to the business in his first year and performed strongly against the objectives set for him and during a period of strong corporate performance, the Committee determined that it would be appropriate to increase his salary to £325,000 which became effective from 1 January 2016. This increase positions Matthew’s base pay between the lower quartile and median against a comparator group of similarly sized businesses and still allows for future salary progression as he completes his development.
Performance-related bonusA summary of the 2016 performance-related bonus scheme is summarised below.
The maximum potential bonus payable for 2016 to the Group Chief Executive was 200% of salary and, in respect of the Group Finance Director, 150% of salary.• For the Group Chief Executive, 25% of the bonus earned up to 125% of salary, 50% of the bonus earned from 125% to 150%
and 75% of the bonus earned from 150% to 200% of salary was to be deferred• For the Group Finance Director, 25% of the bonus earned up to 125% of salary and 50% of the bonus earned from 125% to
150% of salary was to be deferred
The amounts deferred under the bonus plan in 2016 are deferred into shares awarded under the Executive Deferred Bonus Plan (‘EDBP’) for one year. Receipt of the deferred shares is subject to continued service and good leaver provisions under the EDBP. The 2016 bonus also includes provisions that require the deferred shares to be forfeited or repaid should it be necessary for the Company to restate materially its 2016 results within a two-year period following the deferred bonus being awarded. The proportion of the bonus that would be subject to these provisions would depend on the extent to which the original bonus payment turned out to be false following the publication of corrected results.
The Committee has reviewed the performance against the conditions attached to the performance-related bonus and, in addition, made an assessment of the performance of the Group as a whole during 2016.
The Committee has full discretion in the payment of annual bonuses. For any financial element to be payable, the Group must have achieved a threshold level of normalised profit target for the year. In addition, it is a pre-condition to the award of any bonus that the Committee has determined that there has been an improvement in safety processes, procedures and outcomes during the year before any bonus is paid.
In respect of the targets applying to the annual bonus for 2016 for the Group Chief Executive and Group Finance Director, a maximum of 150% and 112.5% respectively of salary was payable based on achievement against a sliding scale of challenging financial targets. A maximum of 50% of salary for the Group Chief Executive and 37.5% for the Group Finance Director was payable based on non-financial targets that encompassed customer, operational excellence and people objectives.
The targets set in relation to non-financial performance are key strategic Group objectives that are tailored to the responsibilities of each individual Executive Director and, in aggregate, are considered to be similarly challenging to the range of financial targets set.
Directors’ Remuneration Report continued
Corporate Governance
92 National Express Group PLC / Annual Report and Accounts 2016

The table below summarises the performance conditions attaching to the 2016 awards and the actual performance and bonus value achieved.
Bonus structure for 2016Group Chief Executive
percentage of base salary
Group Finance Director percentage of
base salary Details
Maximum bonus potential 200% 150% Proportion of bonus subject to mandatory deferral into Company
shares for one year from award
Bonus potential at 90% of budgeted normalised PBT
0% 0% Awarded on achieving threshold level
On-target bonus potential at 100% of budgeted normalised PBT
50% 37.5% Awarded on achieving budget
Stretch bonus for 110% of budgeted normalised PBT
100% 75% Awarded on achieving a stretch target of 110% of normalised PBT
Bonus potential at 90% of budgeted free cash flow
0% 0% Awarded on achieving threshold level
On-target bonus potential at 100% of budgeted free cash flow
25% 18.75% Awarded on achieving budget
Stretch bonus potential at 110% of budgeted free cash flow
50% 37.5% Awarded on achieving a stretch target of 110% of budgeted free cash flow
Non-financial targets (underpinned by achievement of 90% of budgeted normalised PBT)
50% 37.5% Awarded on meeting key strategic Group objectives tailored to each
Executive Director’s responsibilities
A summary of performance during 2016, the targets set and the extent to which the targets were met is set out in the following tables.
Summary of bonuses paid
Performance condition Weighting
Threshold performance
required
On-target performance
required
Maximum Performance
requiredActual
performance
Bonus value achievable for meeting threshold and maximum performance (percentage of salary)
Actual bonus value achieved
(percentage of salary)
Dean FinchMatthew Ashley Dean Finch
Matthew Ashley
Normalised profit 50% £146.7m £163.0m1 £179.3m £175.0m2 0%-100% 0%-75% 87% 65.2%
Free cash flow 25% £104.3m £115.9m3 £127.5m £138.6m 0%-50% 0%-37.5% 50% 37.5%
Non-financial targets
25% 0%-50% 0%-37.5% 30% 30%
Total awarded 167% of salary
132.7% of salary
£983,630 £431,438
Of which deferred in shares
56.5% of salary
35.1% of salary
£332,785 £114,157
Of which paid in cash
110.5% of salary
97.6% of salary
£650,845 £317,281
1 The original normalised profit target set was £152 million. This was adjusted upwards to £163 million for exchange rate gains, bond costs and acquisitions.2 Includes contribution from UK Rail.3 The original free cash flow target was £103.5 million. This was adjusted upwards to £115.9 million for exchange rate gains.
93Annual Report and Accounts 2016 / National Express Group PLC

Summary of non-financial conditions for 2016Dean FinchObjective Performance
Safety• Deliver a year on year improvement in the Fatalities and
Weighted Injuries Index (‘FWI’) for like-for-like operations• Roll out the World Class Driver programme in all divisions• Achieve a successful Arthur D Little audit• Secure a year on year reduction in claim incidents
and the cost of claims on like-for-like business
• Overall safety (measured by the FWI) worsened to 17.823 in 2016 from 12.242 in 2015. Excluding Chattanooga, the FWI improved by 7.5% to 11.323
• All divisions have started to deliver their five-year World Class Driver programme
• The 2016 safety audit, conducted by Arthur D Little, concluded that corporate governance of safety continues to be strong and effective overall
• Good progress has been made in the reduction of claims and claim costs across all the divisions
Note: despite the significant progress made against safety objectives, no bonus was awarded for the Safety objective in the light of the Chattanooga accident.
Business development• Secure a rail win (UK or overseas)• Secure a new win in the International Division
(Middle East or new market)• Deliver high level of concession renewals in
existing markets• Roll out a revenue management system in Spain and
UK Coach• Deliver projected returns from North American and
Spanish acquisitions
• In Germany a rail win was secured in the Nuremburg franchise. However, given the legal challenges by the incumbent operator, the decision was taken not to contest
• International bid and new business activity has focused on a significant bid in Singapore and the acquisition of AlpyBus, based in Switzerland
• In addition to the concession renewals, the Group made 11 significant acquisitions and one disposal which supports its future growth agenda. The disposal of c2c was a strategically important development in reducing future risk and releasing capital
• ALSA and UK Coach fully rolled out a revenue management system resulting in improvements in revenue, profits and occupancy
• The acquisitions made in Spain and North America during the year made signifcant contributions to operating profit
Customer• Develop digital strategy to achieve a leap in
customer service• Deliver initiatives to improve punctuality and
customer satisfaction• Improve operational excellence• Successfully launch new start-ups/acquisitions
• Digital initiatives in UK Bus, ALSA and the Bahrain bus business have resulted in improving sales, loyalty and customer satisfaction.
• ALSA won the prestigious Best Customer Experience Award (BCX award) in Spain. UK Coach was again rated the best surface based operator by the UK Customer Satisfaction Index
• Under the CEO’s leadership, the Group-wide Delivering Excellence initiative was launched to identify and share best practice across the divisions
• Acquisitions in ALSA, North America and UK Coach are operating well and contributing to profits. The Bahrain bus operation exceeded all its KPIs during 2016
Talent development • Enhance management bench strength and improve
succession planning• Develop and enhance the Group’s graduate and
apprenticeship programme• Produce an independent report on our People
Values and develop a strategy for improvement• Build employee pride and maintain high
engagement scores
• Detailed succession plans are in place with good progress made on filling strategic openings and providing development opportunities. A new strategy is in place for the development of high potential employees
• A thorough review of the graduate programme was undertaken during 2016 with the significant enhancements starting to deliver. Apprenticeship programmes continue to be successfully run in all UK divisions
• An independent report concluded that National Express was delivering its ambitious People agenda with data gathered and staff interviewed evidencing a positive picture against the high bar set for People Values
• Employee pride has been enhanced through the divisional and Group Values Awards, commitment to ensuring all UK divisions secure Living Wage accreditation by the end of 2017 and sponsoring of employees to gain external awards and recognition. Employee survey results indicated an increase in employee engagement in all the main operational businesses
Directors’ Remuneration Report continued
Corporate Governance
94 National Express Group PLC / Annual Report and Accounts 2016

Matthew AshleyObjective Performance
Safety• Deliver a year on year improvement in the FWI for
like-for-like operations• Achieve a successful Arthur D Little audit
• Overall safety (measured by the FWI) worsened to 17.823 from 12.242 in 2015. Excluding Chattanooga, the FWI improved by 7.5% to 11.323
• The 2016 safety audit, conducted by Arthur D Little, concluded that corporate governance of safety continues to be strong and effective overall
Note: despite the significant progress made against safety objectives, no bonus was awarded for the Safety objective in the light of the Chattanooga accident.
Business development• Allocate growth capital to the divisions to achieve bolt-
on acquisition opportunities that are value enhancing• Support the bid for the Singapore bus tender, ensuring
that our competitive bid demonstrates the operational excellence and innovation that we can deliver
• There were 11 acquisitions made during the period with a ROCE of 15-20%
• The CFO was closely involved with the Singapore bid with his knowledge of areas where the Group could add competitive advantage having strengthened the bid
Operational• Successfully execute the refinancing of the £350 million
bond expiring in January 2017, achieving significant cost savings and minimising leakage of value through fees and costs of carry
• Lead the Group’s Cyber Security Committee to identify areas of weakness and implement improvements to close identified gaps
• Work with the Chief Digital Officer to develop digital scorecard and facilitate divisional benchmarking
• Deliver investor relations plan to promote the business to existing and potential investors
• The Group raised over £1 billion in 2016. Following the Brexit vote, with gilt rates at an all-time low and before the US presidential election, a £400 million seven-year sterling bond was raised for a coupon of 2.5% with £3.2 million costs of carry
• Under the CFO’s leadership, the Group’s Cyber Security Committee developed a strategy to manage the Group’s security risk profile. A detailed road map is in place to deliver this with significant objectives having already been achieved
• Significant progress has been made digitally through the introduction of digital scorecards, modification of mobile websites and apps to achieve growth in these channels across our coach businesses and the launch of ‘GO Card’ smartcards in our Bahrain bus business
• The success of the comprehensive investor relations programme in 2016 is demonstrated by the strong performance of the share price, the overwhelming support in favour of our AGM resolutions and the positive reaction to the calls made to key investors concerning the c2c disposal
Talent development • Develop and enhance our graduate and
apprenticeship programme• Build employee pride and maintain high
engagement scores
• A thorough review of the graduate programme was undertaken during 2016 with the significant enhancements starting to deliver. Apprenticeship programmes continue to be run in all UK divisions
• Employee pride has been enhanced though the divisional and Group Values Awards, commitment to ensuring all UK divisions secure Living Wage accreditation by the end of 2017 and sponsoring of employees to gain external awards and recognition. Employee survey results indicated an increase in employee engagement in all the main operational businesses
Based on the above assessment against the objectives set, the Committee determined that, for the non-financial elements of their respective bonuses, the performance of Dean Finch warranted 30% payout of a maximum of 50% of salary and Matthew Ashley warranted 30% payout of a maximum of 37.5%. Despite the significant progress made against safety objectives, no bonus was awarded for the overall Safety objective in the light of the Chattanooga accident.
95Annual Report and Accounts 2016 / National Express Group PLC

LTIP awardsPerformance Share Awards and Matching Share Awards granted under the LTIP in 2012 and 2014 are scheduled to vest in 2017. The performance period relating to these Awards ended on 31 December 2016. Details of the performance conditions and the extent to which they have been satisfied are set out below:
2012 Performance Shares (Five-year Award for Dean Finch)
Performance condition Weighting
Threshold performance
required (30% vesting)
Maximum performance
required (100% vesting)
Actual performance
Percentage vesting
TSR1 50% Median of comparator
group
Upper quintile of comparator
group
Below median 0%
EPS2 50% 2016 EPS of 25p
2016 EPS of 28p
29.1p 100%
Total 100% 50%
2014 Performance and Matching Shares
Performance condition Weighting
Threshold performance
required (30% vesting)
Maximum performance
required (100% vesting)
Actual performance
Percentage vesting
TSR 25% Median of FTSE 250
comparator group
Upper quintile of comparator group
Between median and
upper quintile
94.8%
TSR 25% Median of Bespoke Index
comparator group
Equal to or above the
Bespoke Index + 10% pa
Greater than the
Bespoke Index + 10% pa
100%
EPS2 50% 2016 EPS of 21.3p
2016 EPS of 23.9p
29.1p 100%
Total 100% 98.7%
1 TSR was measured against a bespoke comparator group of transport companies taken predominantly from the FTSE Industrial Transportation and FTSE Travel & Leisure sectors.
2 The Committee considered and agreed changes to the performance conditions for outstanding Awards made under the previous 2005 LTIP whereby the growth in EPS for outstanding Awards under this Plan would be based on a consistent accounting basis to exclude actual bid costs incurred. This adjustment serves to ensure that the EPS element of the LTIP continues to incentivise and reward delivery of normalised EPS growth now that bid costs, with effect from 1 January 2015, are treated as a normalised expense which has the impact of reducing normalised EPS in 2015 and subsequent years.
Vesting of AwardsIn 2012, under a Five-year Award, Dean Finch was awarded 261,407 Performance Shares. As 50% of the performance conditions were met, a total of 130,703 shares are due to vest on 3 August 2017. In 2014, Dean Finch was awarded 204,520 Performance Shares and 245,424 Matching Shares. Therefore, as 98.7% of the performance conditions have been met, a total of 444,094 shares are due to vest on 9 April 2017.
In 2014, Matthew Ashley was awarded 68,793 Performance Shares and 82,548 Matching Shares and therefore, as 98.7% of the performance conditions have been met, a total of 149,372 shares are due to vest on 9 April 2017.
Pension entitlements and cash allowancesUnder the terms of their service agreements, Executive Directors are not entitled to become members of one of the Group pension schemes.
The Group Chief Executive receives a 35% salary supplement in lieu of pension contributions.
Benefits under the Group Chief Executive’s unfunded pension arrangement ceased to accrue with effect from 5 June 2016.
The Group Finance Director receives a 25% salary supplement in lieu of pension contributions.
Directors’ Remuneration Report continued
Corporate Governance
96 National Express Group PLC / Annual Report and Accounts 2016

Long-term incentives awarded in 2016The tables below set out the details of any long-term incentive award granted in the 2016 financial year where vesting will be determined according to the achievement of performance conditions that will be tested in future reporting periods.
Dean Finch
Grant date Award type
Basis on which
award made
Face value of award1
£,000
Percentage of award vesting
at threshold performance
(ROCE:0%)
Performance period
end datePerformance
conditions
06.04.16 LTIP – Nil cost options
200% of salary 1,178 30% 31.12.18 TSR, EPS and ROCE
equally weighted
Matthew Ashley
Grant date Award type
Basis on which
award made
Face value of award1
£,000
Percentage of award vesting
at threshold performance
(ROCE:0%)
Performance period
end datePerformance
conditions
06.04.16 LTIP – Nil cost options
150% of salary 487 30% 31.12.18 TSR, EPS and ROCE
equally weighted
1 The face value in the tables above has been calculated by multiplying the maximum number of shares that could vest by the share price used to calculate the number of shares granted. The relevant share price was 343.8p on 5 April 2016, the day preceding the date of grant.
Performance conditions for LTIP Awards made in 2016
Performance level
Part A – EPS condition
(1/3 of the award)
Part B – ROCE condition
(1/3 of the award)
Part C – TSR condition vs FTSE 250
comparator Group rank over 3 years to 31 December 2018
(1/6 of the award)
Part D – TSR condition vs Index1
over 3 years to 31 December 2018
(1/6 of the award)Vesting percentage
of the award
Below threshold Less than 25.6p Below 9% Below median Below Index 0%
Threshold 25.6p 9% Median Equal to Index 30% (with exception of
ROCE for which threshold is 0%)
Target 27.1p 10% Straight line between median
and upper quintile
Straight line between Index
and Index + 10%
50% (for EPS and ROCE only)
Maximum 29.5p or above 12% or above Upper quintile Equal or above Index + 10% pa
100%
1 Index comprising the total returns of three comparator companies.
Straight-line vesting will occur between intermediate points.
97Annual Report and Accounts 2016 / National Express Group PLC

Indicative percentage of LTIP awards vesting based on performance to 31 December 2016The table below sets out the percentage of each extant award that would have vested if the performance conditions had been tested at 31 December 2016 (without making any allowance for pro rata reduction for any period of time that is less than the length of the performance period).
EPS ROCE TSR measure 1 TSR measure 2
Award Weighting Vesting Weighting Vesting Details Weighting Vesting Details Weighting Vesting
Total (max
100%)
2013 Chief Executive’s Five-Year Award
50% 100% – – Bespokecomparator
group
50% 97.6% n/a – – 98.8%
2014 Chief Executive’s Five-Year Award
50% 100% – – FTSE 250 25% 94.8% Bespoke Index
25% 100.0% 98.7%
2015 – Performance Shares
33.3% 100% 33.3% 98% FTSE 250 16.7% 100.0% Bespoke Index
16.7% 100.0% 99.3%
2016 – Performance Shares
33.3% 91.7% 33.3% 98% FTSE 250 16.7% 88.6% Bespoke Index
16.7% 100.0% 94.7%
The National Express Group Executive Deferred Bonus Plan (EDBP)Deferred bonuses awarded in 2016 (based on performance to 31 December 2015) will vest on 15 March 2017 as set out in the table below.
During year
As at 1 January
2016 Granted Vested Lapsed
At 31 December
2016
Market price at date of vesting
Date of grant
Date of vesting
Dean Finch 2015 76,643 – 76,643 – 0 330.0p 18.03.15 18.03.16
2016 – 129,550 – – 129,550 15.03.16 15.03.17
Matthew Ashley 2015 – – – – – – – –
2016 – 40,278 – – 40,278 15.03.16 15.03.17
The market price per share on the date of award was calculated on the basis of the average market price share in the five days preceding the date of the grant.
Deferred shares will be required to be forfeited or repaid should it be necessary to restate materially the Company’s 2015 and 2016 results within a two-year period following the award of the bonus. The proportion of the bonus subject to these provisions would depend on the extent to which the original bonus turned out to be false following the publication of corrected results.
Directors’ Remuneration Report continued
Corporate Governance
98 National Express Group PLC / Annual Report and Accounts 2016

Non-Executive DirectorsThe table below sets out the single total figure of remuneration and breakdown for each Non-Executive Director serving during 2016. The table includes only those columns in respect of elements of remuneration received by Non-Executive Directors.
2016 fees £’000
2015 fees £’000 Notes
Sir John Armitt CBE 230 225
Jorge Cosmen 49 47
Joaquín Ayuso 49 47
Matthew Crummack 49 32 Appointed on 6 May 2015
Jane Kingston 59 54
Mike McKeon 59 28 Appointed on 6 July 2015
Chris Muntwyler 59 59
Lee Sander 54 52
Dr Ashley Steel 49 – Appointed on 1 January 2016
In addition to the above, a travel allowance of £4,000 is payable to each of Joaquín Ayuso, Chris Muntwyler and Lee Sander for attendance at each Board meeting held outside the continent in which the Non-Executive Director is resident. For the financial year ended 31 December 2016, the payments were as follows: Joaquín Ayuso: £4,000; Chris Muntwyler: £4,000; and Lee Sander: £28,000. For the financial year ended 31 December 2015, the payments were as follows: Joaquín Ayuso: £4,000; Chris Muntwyler: £4,000; and Lee Sander: £21,000.
With effect from 1 January 2016, it was agreed that the Non-Executive base fee would increase by 4.26% to £49,000 and the Chairman’s fee would increase by 2.2% to £230,000.
With effect from 1 January 2016, it was determined that fees for Non-Executive Directors based overseas should be converted to their home currencies at a fixed rate. The agreed rates are USD1.52851:£1, EUR1.37747:£1 and CHF1.46997:£1.
Payments to past Directors There were no payments made to past Directors during the year ended 31 December 2016.
Payments for loss of office There were no loss of office payments made during the year to any person who has served as a Director of the Group.
Statement of Directors’ shareholdings Directors’ shareholdings – Executive Directors’ interests and share ownership guidelinesIn order to align the interests of the Directors more closely with the shareholders, the Remuneration Committee has determined that the Executive Directors are encouraged to build up a shareholding over a five-year period from 2015 as set out in the share ownership guidelines as described on page 108 of the Remuneration Policy. The requirement for the Group Chief Executive is the equivalent of 200% of salary and, for the Group Finance Director, the requirement is the equivalent of 150% of salary.
The beneficial and non-beneficial interests of the Executive Directors in office and their connected persons as at 31 December 2016 and the details of long-term incentive interests are shown below.
Shares held directly Other shares held
Executive Directors
Shareholding requirement
(% salary)
Current shareholding
as at 31 December
2016 (% salary)1
Beneficially owned
EDBP interests not subject to performance
conditions
LTIP interests subject to
performance conditions
Dean Finch 200% 160% 137,598 129,550 1,872,788
Matthew Ashley 150% 140% 87,891 40,278 436,040
1 The share price of 353.7 pence (as at 31 December 2016) has been taken for the purpose of calculating the current shareholding as a percentage of salary.
Please see the appendix on page 105 for more information on outstanding LTIP awards.
99Annual Report and Accounts 2016 / National Express Group PLC

Directors’ shareholdings – Non-Executive Director interestsNon-Executive Directors are not subject to a shareholding requirement. Details of their interests in shares and those of their persons closely associated as at 31 December 2016, all of which are held outright with no attaching performance conditions, are shown below:
At 31 December 2016
Sir John Armitt CBE 6,000
Joaquín Ayuso 0
Jorge Cosmen1 69,237,515
Chris Muntwyler 0
Lee Sander 0
Jane Kingston 2,100
Matthew Crummack 0
Mike McKeon 5,000
Dr Ashley Steel 9,528
1 Jorge Cosmen’s holding includes shares held by European Express Enterprises Ltd which are shown on page 116 in the list of major shareholdings in the Company.
The Register of Directors’ interests maintained by the Company contains full details of the Directors’ holdings of shares and options over shares in the Company. The closing price of the Company’s ordinary shares at 31 December 2016 was 353.7 pence (2015: 332.8 pence) and the range during the year ended 31 December 2016 was 275.6 pence to 376.5 pence.
Changes since year endThere have been no changes in the shareholdings of the Directors between 31 December 2016 and the date of signing of this Annual Report.
History of CEO’s pay The table below sets out the total remuneration delivered to the Chief Executive over the last eight years, valued using the methodology applied to the single total figure of remuneration.
Year 2009 2010 2011 2012 2013 2014 2015 2016
Chief Executive R Bowker1 D Finch D Finch D Finch D Finch D Finch D Finch D Finch
Total remuneration (£’000) 465 1,356 1,454 1,701 1,553 1,562 3,661 3,858
Annual bonus payment (percentage maximum opportunity) 0% 100% 100% 100% 95% 93% 96% 83.5%
LTIP vesting level achieved2 (percentage maximum opportunity) n/a n/a n/a 32.5% 0% 0% 73.4% 80.8%
1 R Bowker resigned as Chief Executive on 10 July 2009.2 The incumbent Chief Executive during each of 2010 and 2011 did not have entitlement to any LTIP awards with attaching performance conditions
whose final year of performance ended during that year.
Directors’ Remuneration Report continued
Corporate Governance
100 National Express Group PLC / Annual Report and Accounts 2016

Comparison of overall performance The first graph below shows a comparison of National Express Group PLC’s eight-year total cumulative shareholder return against that achieved by the FTSE 250 Index. This index has been selected because the Company is a constituent of this index and the Committee, therefore, feels that this is the most appropriate index with which to represent the Company’s relative performance.
The second graph below shows a comparison of National Express Group PLC’s cumulative shareholder return and annual return since the commencement of the turnaround of the business from 31 December 2009 (and subsequent recruitment of the current CEO in February 2010) and also over the last four years against that achieved by the FTSE 250 Index.
The Group achieved a very strong performance in 2016 with revenue, profits and free cash flow up significantly from 2015, beating the budgeted profit before tax by 7.4%. This excellent result, underpinned by a strong and sustainable free cash flow, merited an increase in the full year dividend of 8.4%.
The Group carried a record 921 million passengers (2015: 867 million), with the first full year of German rail operations carrying 20 million passengers. There was strong growth in North America with revenue and operating profit up 14.3% and 11.9% on a constant currency basis. Spain grew revenue by 5.7% and profits by 5.3%. There was a good performance from UK Coach and resilient results from UK Bus in challenging market conditions. The Group completed 11 acquisitions in the year: eight in North America adding 1,100 school buses and 450 transit vehicles; two in ALSA, adding a regional bus business in Ibiza and a private hire business in Switzerland (linking with our existing Eurolines business) and a commuter and tourist coach business in the UK.
Altogether, this industry leading financial performance led to a strong share price performance that outperformed both our peer group and the FTSE 250 for the second year running.
31/12/2008 31/12/2009 31/12/2010 31/12/2011 31/12/2012
National Express Group – Cumulative return
31/12/2013 31/12/2014 31/12/2015 31/12/2016
260
240
220
200
180
160
140
120
100
80
60
40
20
0
-20
-40
Shareholder returns – eight-year historyFTSE 250 – Cumulative return
National Express Group – Annual return
FTSE 250 – Annual return
31/12/2009 31/12/2010 31/12/2011 31/12/2012 31/12/2013 31/12/2014 31/12/2015 31/12/2016
140
120
100
80
60
40
20
0
-20
Shareholder returns – seven-year history FTSE 250 – Cumulative return (since 31 Dec 2009)National Express Group – Cumulative return (since 31 Dec 2009)National Express Group – Cumulative return (last four years)FTSE 250 – Cumulative return (last four years)
National Express Group – Annual return
FTSE 250 – Annual return
101Annual Report and Accounts 2016 / National Express Group PLC

The context of pay in the National Express GroupThe following table sets out the change in certain elements of the remuneration paid to the Group Chief Executive from 2015 to 2016 compared with the average percentage change for the UK employee population.
The Group Chief Executive’s remuneration, disclosed in the table below, has been calculated to take into account base salary, taxable benefits and annual bonus (including any amount deferred) on the basis used for determining the single figure. The UK employee remuneration is based on the base salary, taxable benefits and annual bonus of those UK employees who received taxable benefits and bonuses. The Group uses the UK workforce as an appropriate comparator group for the average employee as this avoids complicated exchange rate adjustments that would have to be used if we included employees in the Group’s overseas operations in the calculation.
Average percentage increase/ decrease from 2015 to 2016
Base salary
Taxable benefits
Performance-related bonus
Group Chief Executive 4.9% 7.4% (8.6)%
UK employee remuneration 2.1% 11.7% 11.3%
Relative importance of the spend on payThe table below sets out the total spend on pay in the 2016 financial year and 2015 financial year compared with distributions to shareholders:
2016 (£m)
2015 (£m)
Percentage increase
from 2015 to 2016
Overall Group spend on pay including Directors 1,020.7 842.51 21.1%
Profit distributed by way of dividend 58.8 54.4 8.0%
1 Restated to exclude UK Rail as a discontinuing operation.
Statement of voting at the 2015 and 2016 AGMs on remunerationAt the AGM held on 11 May 2016, votes cast by proxy and at the meeting in respect of the Directors’ Remuneration Report were as follows:
For Against
Resolution text Number of votes
Percentage of proxy
votes castNumber of votes
Percentage of proxy
votes castTotal
votes cast
Percentage of issued
share capital voted1
Votes withheld2
To approve the Annual Report on Remuneration
424,626,401 98.30 7,361,131 1.70 431,987,532 84.42 151,376
At the AGM held on 6 May 2015, which was the date of approval of the most recent Remuneration Policy, the votes cast by proxy and at the meeting were as follows:
For Against
Resolution text Number of votes
Percentage of proxy
votes castNumber of votes
Percentage of proxy
votes cast Total votes cast
Percentage of issued
share capital voted1
Votes withheld2
To approve the Directors’ Remuneration Policy report
408,174,050 98.91 4,491,155 1.09 412,665,205 80.64 16,293,308
1 The total voting rights in the Company as at the dates of both meetings were 511,738,648 ordinary shares of 5 pence each, each carrying one vote on a poll. 2 A vote withheld is not a vote in law and is not counted in the calculation of votes for or against the resolutions.
Statement of implementation of remuneration policy in 2017Executive Directors’ base salariesThe Committee determined that the salary for the Group Chief Executive would be increased by 4.4% to £615,000 with effect from 1 January 2017. In reaching this conclusion, the Committee recognised the Group Chief Executive’s strong personal performance in his role which had delivered:• significant shareholder value over the course of 2016;• a good outlook for the Group for 2017 under the strategy for growth; and• strong delivery on operational metrics.
In addition, the Committee took into account that, when compared with direct competitors, the Group Chief Executive’s overall remuneration package is more highly geared with outcome driven through stronger annual and long-term incentives which drive
Directors’ Remuneration Report continued
Corporate Governance
102 National Express Group PLC / Annual Report and Accounts 2016

greater shareholder value. Also, the Committee is mindful that, whilst the Group’s general awarded pay increase in 2016 across the Group was 2%, when allowing for other factors such as progression increases within a grade structure, promotional increases and market adjustments, UK employees had seen a 4% increase in base pay over the previous 12 months.
The Committee determined that the salary for Matthew Ashley would be increased by 7.7% to £350,000 with effect from 1 January 2017. After another excellent year of personal delivery during 2016 and in recognition of his strong performance in the role, the Committee determined that it was appropriate that the second step of Matthew’s salary towards the market rate for this role, (as disclosed in the 2015 Remuneration Report), be implemented. In accordance with the Remuneration Policy, Matthew Ashley will be provided with relocation expenses to cover his secondment as President and CEO of the North America division. The details of Matthew Ashley’s international assignment package will be disclosed in next year’s Remuneration Report.
Chris Davies has been appointed to the role of Group Finance Director and will take up his appointment after the conclusion of the Company’s AGM on 10 May 2017. His base salary was set at £350,000 for 2017.
Pension entitlements and cash allowancesThe Group Chief Executive will receive a 35% salary supplement and the other Executive Directors will receive a 25% salary supplement in lieu of pension contributions. Benefits under the Group Chief Executive’s unfunded pension arrangement ceased to accrue from 5 June 2016.
Performance-related bonusThe annual bonus for the 2017 financial year will operate on the same basis as the arrangements in place during 2016.
The structure of the annual bonus for 2017 will be:• a maximum bonus of 200% of salary for the Group Chief Executive and of 150% of salary for the other Executive Directors;• the proportion of the bonus linked to non-financial measures will be 25% based on operational excellence, safety standards
and other strategic objectives;• the remaining 75% of the bonus will be based on achievement of financial targets, namely profit before tax and free cash flow; and• a proportion of bonus earned will be deferred in shares for one year. For 2017, 25% of the bonus earned up to 125% of salary,
50% of the bonus earned from 125% to 150% of salary and, for the Group CEO, 75% of bonus earned above 150% of salary will be deferred.
When setting the bonus target for 2017, the Committee has taken into account:• stock market consensus for 2017 profit;• the Directors’ continuing commitment to record bid costs as normalised operating expenses;• the increased pricing pressure from RENFE in Spain;• the national reduction in regional bus journeys made in the UK and the increased competition from Uber; and• the national reduction in regional train journeys made in the UK and the consequential increased price competition to UK Coach.
Targets will be set on a basis consistent with accounting measures, ie without reference to exceptionals.
The Committee will set calibrated targets for the bonus measures and intends to disclose actual performance against these targets in next year’s Directors’ Remuneration Report. As a matter of commercial sensitivity, the Committee has decided not to disclose performance targets in advance.
Long-term incentivesLong-term incentive awards granted in the 2017 financial year will be granted in accordance with the policy detailed in the Remuneration Policy section of this report. Awards will be made worth 200% of salary for the Group Chief Executive and 150% of salary for the other Executive Directors.
The performance measures, their weightings and targets for the 2017 awards will be as follows:
Metric Weighting
Threshold (EPS, TSR: 30% vesting
ROCE: 0% vesting)Target
(50% vesting)Maximum
(100% vesting)
2019 financial year EPS 1/3 29.8 pence 31.6 pence 34.4 pence
Average ROCE financial years 2017-2019 1/3 9% 10% 12%
Relative TSR vs FTSE 250 1/6 Median – Upper quintile
Relative TSR vs Bespoke Index* 1/6 Equal to Index – Index + 10% pa
* Notional index comprising Go-Ahead Group, First Group and Stagecoach Group.
For TSR measures, straight-line vesting will occur between threshold and maximum levels of performance. For EPS and ROCE measures, straight-line vesting will occur between threshold and target, and target and maximum levels of performance.
Performance will be measured over a three-year period and awards will be subject to a two-year holding period post vesting.
103Annual Report and Accounts 2016 / National Express Group PLC

Illustrations of application of Remuneration Policy for Executive DirectorsThe chart below illustrates the remuneration that would be paid to each of the Executive Directors under three different performance scenarios: (i) Minimum; (ii) On-target; and (iii) Maximum:
3,500
Remuneration (£’000)
26%100%
£860k
£1,844
£3,320k
£455k
£875k
£1,505k
33%
20%
47%52% 30%
37%
37%
100%
30%18% 35%
35%
Minimum On-target
Dean Finch
Maximum Minimum On-target
Matthew Ashley
Maximum
3,000
2,500
2,000
1,500
1,000
500
0
Fixed Annual variable PSP variable
The elements of remuneration have been categorised into three components: (i) Fixed; (ii) Annual variable; and (iii) Multiple reporting period, which are set out in the future policy table below. Element Descriptions
Fixed Total amount of salary, pension and benefits
Annual variable Performance-related bonus (including deferred element)
Multiple reporting variable Long-Term Incentive Plan
Assumptions used in determining the level of payout under given scenarios are as follows:• Salaries are as at 1 January 2017 for both Dean Finch and Matthew Ashley. Illustrations have not been provided for Chris Davies,
given that he is expected to join the Board part-way through the year• Benefits are those paid to both Dean Finch and Matthew Ashley in 2016• Performance Share Awards are granted at the maximum level permitted under the policy• Minimum performance scenario assumes fixed pay only and no variable payments• On-target performance scenario assumes performance in line with the Company’s expectations, resulting in 30% of maximum
vesting in respect of long-term incentive awards and 50% of maximum payout, assuming 50% achievement of personal objectives, in respect of the annual bonus. Whilst the bonus scheme has targets for threshold, on-target and maximum, the LTIP only has targets for threshold and maximum for some metrics. The value shown above in the on-target scenario includes the values for on-target bonus and threshold LTIP performance
• Maximum performance scenario assumes outstanding level of performance, ie maximum bonus and full vesting of long-term incentives
• Share price appreciation is not allowed for.
Non-Executive Directors’ fees With effect from 1 January 2017, it was agreed that the Chairman’s fee would be increased by 4.3% to £240,000 in recognition of the significant contribution and unique attributes that Sir John Armitt brings to the Board and to bring his fee to a more competitive level. The Non-Executive base fee would be increased by 5% to £51,500 and the Senior Independent Director’s fee would be increased by 5% to £7,500 in order to ensure that these fees reflect the role and responsibility and the market rate for these positions. The fees for the Chairman and Non-Executive Directors with effect from 1 January 2017 are therefore as follows:
Role Fees (£)
Chairman 240,000
Non-Executive Director 51,500
Senior Independent Director 7,500
Chairman of Board Committee 10,000
In addition, a travel allowance £4,000 is payable to Joaquín Ayuso, Chris Muntwyler and Lee Sander for attendance at Board meetings held outside the continent in which the Non-Executive Director is resident.
Directors’ Remuneration Report continued
Corporate Governance
104 National Express Group PLC / Annual Report and Accounts 2016

AppendixLTIP Awards to Executive Directors
LTIP Share Awards
At 1 January
2016 Granted Exercised Expired
At 31 December
2016
Market price on date of award
Market price at date of
exerciseDate of award
Date from which
exercisableExpiry
date
Dean Finch
Performance Shares 280,898 – 206,038 74,860 – 199.9p 343.8p 10.04.13 10.04.16 10.10.16
Matching Shares 337,076 – 247,245 89,831 – 199.9p 343.8p 10.04.13 10.04.16 10.10.16
Performance Shares 204,520 – – – 204,520 279.5p – 09.04.14 09.04.17 09.10.17
Matching Shares 245,424 – – – 245,424 279.5p – 09.04.14 09.04.17 09.10.17
Performance Shares 356,303 – – 356,303 315.4p – 11.06.15 05.03.18 05.03.20
Performance Shares – 342,641 – – 342,641 349.3p – 06.04.16 06.04.19 06.04.21
Five-Year Award 261,407 – – – 261,407 211.7p – 03.08.12 03.08.17 03.08.18
Five-Year Award 257,973 – – – 257,973 210.0p – 23.05.13 23.05.18 23.05.19
Five-Year Award 204,520 – – – 204,520 279.5p – 09.04.14 09.04.19 09.04.20
LTIP Share Awards
At 1 January
2016 Granted Exercised Expired
At 31 December
2016
Market price on date of award
Market price at date of
exerciseDate of award
Date from which
exercisableExpiry
date
Matthew Ashley
Performance Shares 94,484 – 69,304 25,180 – 199.9p 343.8p 10.04.13 10.04.16 10.10.16
Matching Shares 108,000 – 79,218 28,782 – 199.9p 343.8p 10.04.13 10.04.16 10.10.16
Performance Shares 68,793 – – – 68,793 279.5p – 09.04.14 09.04.17 09.10.17
Matching Shares 82,548 – – – 82,548 279.5p – 09.04.14 09.04.17 09.10.17
Performance Shares 142,902 – – – 142,902 315.4p – 11.06.15 05.03.18 05.03.20
Performance Shares – 141,797 – – 141,797 349.3p – 06.04.16 06.04.19 06.04.21
By order of the Board
Jane KingstonRemuneration Committee Chair 23 February 2017
105Annual Report and Accounts 2016 / National Express Group PLC

Directors’ Remuneration Policy
Remuneration structure The table below sets out the key elements of the Company’s Remuneration Policy for the Executive Directors which was approved at the 2015 AGM and will remain in force for another year until the conclusion of the 2018 AGM. The policy balances the desire to align remuneration to the long-term success of the business and shareholders whilst also enabling the Company to effectively recruit and motivate key individuals.
Shareholder consultationThe Committee is committed to an ongoing dialogue with shareholders and seeks shareholder views when any significant changes are being made to remuneration arrangements. In particular, the Committee consulted with a number of major shareholders in the formulation of the current Remuneration Policy to understand their views and to inform the Committee’s approach. The Committee believes that the feedback received has been crucial in the development of the structure which is in place.
Remuneration policy table for Executive Directors
ElementHow element supports business strategy Operation Maximum potential value Performance conditions and assessment
Base salary To provide a competitive level of salary as the main component of fixed remuneration. Enables the Group to recruit and retain Executive Directors of the calibre required to fulfil the role and is key to developing and implementing business strategy without paying more than is necessary to do so.
The salary of individual Executive Directors is paid monthly in cash and is normally reviewed annually.
In determining base salaries, the Committee considers:
• pay levels at companies of a similar size and complexity in the FTSE 250;• external market conditions;• general performance of the Company;• pay and conditions elsewhere in the Group; and• individual performance, skills, experience in post and potential.
When considering pay increases the Committee will use comparator groups that will be based on groups of transport/leisure and general sector companies of a similar size. The Committee retains discretion to amend the comparator groups as necessary in order to remain relevant.
Any changes to the comparator group will be disclosed in the part of the report setting out the operation of the policy for the future year.
The Committee’s policy is to set base salary at an appropriate level taking into account the factors outlined in this table.
The maximum annual salary increase will not normally exceed the average increase which applies across the wider workforce. However, larger increases may be awarded in certain circumstances including but not limited to:
• increase in scope of responsibilities of the role;• to apply salary progression for a newly appointed
Director; and• where a Director’s salary has fallen significantly
below market position.
In these circumstances, subsequent increases may be staged over a number of years until the target positioning (and desired performance) is reached.
In such circumstances, the increase will not exceed RPI + 10%.
The Company will set out in the section headed ‘Statement of implementation of Remuneration Policy’ in the following financial year the salaries for that year for each of the Executive Directors (see page 102).
Not applicable.
Pension- related benefits
To provide competitive benefits in line with market practice and provide funds to allow Executives to save for retirement. Pension benefits are a fixed element of remuneration.
Executive Directors are provided a cash allowance in lieu of a pension provision in line with market practice.
The Group CEO receives a cash supplement in lieu of pension at 35% of salary.
The Group FD receives a pension contribution or a cash supplement in lieu of pension at 25% of salary.
Only basic salary counts for the purpose of the allowance.
The Committee’s policy is that the maximum cash allowance payable in lieu of a pension will be 35%.
Not applicable.
Benefits To provide competitive benefits as part of fixed remuneration in line with market practice to enable the Group to recruit and retain talent.
Executive Directors receive family private healthcare, death in service and life assurance cover (4x base salary), long-term sickness and disability insurance, a cash alternative to a fully expensed car, free travel on the Company’s services and professional membership subscriptions.
The Committee has discretion to provide additional benefits or remove benefits in order to remain competitive or to meet the needs of the business, for example to provide relocation expenses, including financial tax and legal advice if applicable. Any change to benefit provision will be detailed on an annual basis.
The cost to the Company of providing the benefits may vary from year to year in accordance with market conditions and will, therefore, determine the maximum amount that would be paid in the form of benefits during the policy period.
Not applicable.
Directors’ Remuneration Report continued
Corporate Governance
106 National Express Group PLC / Annual Report and Accounts 2016

Remuneration policy table for Executive Directors
ElementHow element supports business strategy Operation Maximum potential value Performance conditions and assessment
Base salary To provide a competitive level of salary as the main component of fixed remuneration. Enables the Group to recruit and retain Executive Directors of the calibre required to fulfil the role and is key to developing and implementing business strategy without paying more than is necessary to do so.
The salary of individual Executive Directors is paid monthly in cash and is normally reviewed annually.
In determining base salaries, the Committee considers:
• pay levels at companies of a similar size and complexity in the FTSE 250;• external market conditions;• general performance of the Company;• pay and conditions elsewhere in the Group; and• individual performance, skills, experience in post and potential.
When considering pay increases the Committee will use comparator groups that will be based on groups of transport/leisure and general sector companies of a similar size. The Committee retains discretion to amend the comparator groups as necessary in order to remain relevant.
Any changes to the comparator group will be disclosed in the part of the report setting out the operation of the policy for the future year.
The Committee’s policy is to set base salary at an appropriate level taking into account the factors outlined in this table.
The maximum annual salary increase will not normally exceed the average increase which applies across the wider workforce. However, larger increases may be awarded in certain circumstances including but not limited to:
• increase in scope of responsibilities of the role;• to apply salary progression for a newly appointed
Director; and• where a Director’s salary has fallen significantly
below market position.
In these circumstances, subsequent increases may be staged over a number of years until the target positioning (and desired performance) is reached.
In such circumstances, the increase will not exceed RPI + 10%.
The Company will set out in the section headed ‘Statement of implementation of Remuneration Policy’ in the following financial year the salaries for that year for each of the Executive Directors (see page 102).
Not applicable.
Pension- related benefits
To provide competitive benefits in line with market practice and provide funds to allow Executives to save for retirement. Pension benefits are a fixed element of remuneration.
Executive Directors are provided a cash allowance in lieu of a pension provision in line with market practice.
The Group CEO receives a cash supplement in lieu of pension at 35% of salary.
The Group FD receives a pension contribution or a cash supplement in lieu of pension at 25% of salary.
Only basic salary counts for the purpose of the allowance.
The Committee’s policy is that the maximum cash allowance payable in lieu of a pension will be 35%.
Not applicable.
Benefits To provide competitive benefits as part of fixed remuneration in line with market practice to enable the Group to recruit and retain talent.
Executive Directors receive family private healthcare, death in service and life assurance cover (4x base salary), long-term sickness and disability insurance, a cash alternative to a fully expensed car, free travel on the Company’s services and professional membership subscriptions.
The Committee has discretion to provide additional benefits or remove benefits in order to remain competitive or to meet the needs of the business, for example to provide relocation expenses, including financial tax and legal advice if applicable. Any change to benefit provision will be detailed on an annual basis.
The cost to the Company of providing the benefits may vary from year to year in accordance with market conditions and will, therefore, determine the maximum amount that would be paid in the form of benefits during the policy period.
Not applicable.
In addition to the components described below, it is the policy of the Company to honour any commitments made to a Director before this policy took effect or before he/she became a Director. Such commitments include the Group Chief Executive’s unfunded pension arrangement, which ceased to accrue from 5 June 2016, and his Five-Year Award, both of which are described in the Annual Report on Remuneration.
107Annual Report and Accounts 2016 / National Express Group PLC

ElementHow element supports business strategy Operation Maximum potential value Performance conditions and assessment
Performance- related bonus
To incentivise delivery of performance objectives which are directly linked to the financial and strategic priorities of the business.
A portion of bonus is deferred into shares, assisting retention of Executive Directors and aligning their financial interests with those of shareholders.
Bonus payments are based on the achievement of specified corporate (financial and non-financial) objectives over a one-year performance period.
A proportion of the bonus payments is subject to mandatory deferral into shares for one year from award as follows:
• 25% of the bonus earned up to 125% of salary• 50% of the bonus earned from 125% to 150% of salary• 75% of the bonus earned above 150% of salary (applicable to Group
CEO only)
Dividends or dividend equivalents (which may assume notional re-investment) are paid on these shares.
The Remuneration Committee retains the discretion to standardise the percentage of the bonus deferred into shares if this is deemed appropriate in the future. Unless the Committee determines otherwise, the market price per share on the date of the award will be calculated on the basis of the average market price share in the five days preceding the date of the grant.
Bonus payments are paid following year end and are not pensionable.
Only the Executive Directors currently participate in the Company’s bonus deferral arrangements. Other employees may be invited to participate in future years at the Committee’s discretion.
Achievement of each element of the bonus is assessed independently.
Provisions exist that require the deferred shares to be forfeited or repaid should it be necessary for the Company to restate materially the financial results upon which the bonus was awarded within a two-year period following the deferred bonus being awarded. The proportion of the bonus that would be subject to this provision would depend on the extent to which the original bonus payment turned out to be false following the publication of corrected results.
Maximum 200% of base salary. The targets for the bonus in respect of 2017 are as follows:
• 75% bonus is subject to normalised profit and free cash flow targets• 25% is subject to non-financial targets
The Committee retains discretion in exceptional circumstances to amend the weightings of the financial and non-financial elements of the bonus from year to year and for each Executive as appropriate.
The targets attached to the financial condition will typically relate to profit and/or cash generation, are set on an annual basis and are intended to be achievable at threshold and stretching at maximum. The numerical values of the target will not be disclosed in advance as the Committee considers this information commercially sensitive. Actual targets, performance achieved and awards will be published at the end of the performance period in order that shareholders can fully assess the basis for any payouts under the annual bonus.
The non-financial targets will be set annually based on strategic objectives for the year. The non-financial targets include safety, customer, operational excellence and people objectives and will be determined by the Committee on an annual basis. The proportion of the bonus determined by performance against non-financial targets will only become payable when the Company achieves a threshold level of normalised profit.
It is a pre-condition to the award of any bonus that the Remuneration Committee has determined that there has been an improvement in safety processes, procedures and outcomes during the year in the relevant business unit before any bonus is paid.
For further details on the measures and targets which applied to bonuses in 2016, please see page 93.
The annual bonus contains malus and clawback provisions.
Long-Term Incentive Plan – Performance Shares
To drive performance, aid retention and align the interests of Executive Directors with shareholders.
The performance conditions are aligned with the long-term performance of the business, thereby driving participants to achieve outcomes that realise shareholder value.
Performance Share Awards (in the form of conditional awards, nil cost options or forfeitable shares) are granted annually and vesting is dependent on the achievement of performance conditions measured over a three-year period.
An additional two-year holding period has been introduced to increase alignment with shareholders. Dividend equivalents can be paid on these shares.
Awards are reviewed annually to ensure that grant levels, performance criteria and other features remain appropriate to the Company’s current circumstances.
Malus and clawback provisions are attached to awards made under the LTIP which apply over a two-year period post vesting.
The Group CEO is eligible to receive a conditional award of Performance Shares up to an equivalent of 200% of salary per annum.
The Group FD is eligible to receive a conditional award of Performance Shares up to an equivalent of 150% of base salary per annum.
Awards will be subject to stretching performance targets over a period of three years.
The Committee may change the balance of the measures, or use different measures for subsequent awards, as appropriate. No material change will be made to the type of performance conditions without prior shareholder consultation.
For 2017, the awards will be based equally as follows:
• 1/3 earnings per share (‘EPS’)• 1/3 return on capital employed (‘ROCE’)• 1/3 total shareholder return (split between 50% FTSE 250
comparator group and 50% competitors (‘TSR’).
Achievement of threshold performance in respect of the EPS and TSR targets results in 30% vesting for each part of the Award. Achievement of threshold performance in respect of the ROCE target results in 0% vesting.
There is no ability to retest any of the performance conditions.
The Committee retains discretion under the rules of the LTIP to amend existing performance conditions to take account of any events that may arise which would mean in its opinion, if such adjustments were not made, the performance condition would not constitute a fair measure of the Company’s performance over the period.
Shareholding requirement
Executive Directors are encouraged to build up a shareholding over a five-year period which commenced from 2015. The requirement for the Group CEO is equivalent to 200% of salary and for the Group FD the requirement is 150% of base salary. Adherence to these guidelines is a condition of continued participation in the equity incentive arrangements. This policy ensures that the interests of Executive Directors and those of shareholders are closely aligned.
Directors’ Remuneration Report continued
Corporate Governance
108 National Express Group PLC / Annual Report and Accounts 2016

ElementHow element supports business strategy Operation Maximum potential value Performance conditions and assessment
Performance- related bonus
To incentivise delivery of performance objectives which are directly linked to the financial and strategic priorities of the business.
A portion of bonus is deferred into shares, assisting retention of Executive Directors and aligning their financial interests with those of shareholders.
Bonus payments are based on the achievement of specified corporate (financial and non-financial) objectives over a one-year performance period.
A proportion of the bonus payments is subject to mandatory deferral into shares for one year from award as follows:
• 25% of the bonus earned up to 125% of salary• 50% of the bonus earned from 125% to 150% of salary• 75% of the bonus earned above 150% of salary (applicable to Group
CEO only)
Dividends or dividend equivalents (which may assume notional re-investment) are paid on these shares.
The Remuneration Committee retains the discretion to standardise the percentage of the bonus deferred into shares if this is deemed appropriate in the future. Unless the Committee determines otherwise, the market price per share on the date of the award will be calculated on the basis of the average market price share in the five days preceding the date of the grant.
Bonus payments are paid following year end and are not pensionable.
Only the Executive Directors currently participate in the Company’s bonus deferral arrangements. Other employees may be invited to participate in future years at the Committee’s discretion.
Achievement of each element of the bonus is assessed independently.
Provisions exist that require the deferred shares to be forfeited or repaid should it be necessary for the Company to restate materially the financial results upon which the bonus was awarded within a two-year period following the deferred bonus being awarded. The proportion of the bonus that would be subject to this provision would depend on the extent to which the original bonus payment turned out to be false following the publication of corrected results.
Maximum 200% of base salary. The targets for the bonus in respect of 2017 are as follows:
• 75% bonus is subject to normalised profit and free cash flow targets• 25% is subject to non-financial targets
The Committee retains discretion in exceptional circumstances to amend the weightings of the financial and non-financial elements of the bonus from year to year and for each Executive as appropriate.
The targets attached to the financial condition will typically relate to profit and/or cash generation, are set on an annual basis and are intended to be achievable at threshold and stretching at maximum. The numerical values of the target will not be disclosed in advance as the Committee considers this information commercially sensitive. Actual targets, performance achieved and awards will be published at the end of the performance period in order that shareholders can fully assess the basis for any payouts under the annual bonus.
The non-financial targets will be set annually based on strategic objectives for the year. The non-financial targets include safety, customer, operational excellence and people objectives and will be determined by the Committee on an annual basis. The proportion of the bonus determined by performance against non-financial targets will only become payable when the Company achieves a threshold level of normalised profit.
It is a pre-condition to the award of any bonus that the Remuneration Committee has determined that there has been an improvement in safety processes, procedures and outcomes during the year in the relevant business unit before any bonus is paid.
For further details on the measures and targets which applied to bonuses in 2016, please see page 93.
The annual bonus contains malus and clawback provisions.
Long-Term Incentive Plan – Performance Shares
To drive performance, aid retention and align the interests of Executive Directors with shareholders.
The performance conditions are aligned with the long-term performance of the business, thereby driving participants to achieve outcomes that realise shareholder value.
Performance Share Awards (in the form of conditional awards, nil cost options or forfeitable shares) are granted annually and vesting is dependent on the achievement of performance conditions measured over a three-year period.
An additional two-year holding period has been introduced to increase alignment with shareholders. Dividend equivalents can be paid on these shares.
Awards are reviewed annually to ensure that grant levels, performance criteria and other features remain appropriate to the Company’s current circumstances.
Malus and clawback provisions are attached to awards made under the LTIP which apply over a two-year period post vesting.
The Group CEO is eligible to receive a conditional award of Performance Shares up to an equivalent of 200% of salary per annum.
The Group FD is eligible to receive a conditional award of Performance Shares up to an equivalent of 150% of base salary per annum.
Awards will be subject to stretching performance targets over a period of three years.
The Committee may change the balance of the measures, or use different measures for subsequent awards, as appropriate. No material change will be made to the type of performance conditions without prior shareholder consultation.
For 2017, the awards will be based equally as follows:
• 1/3 earnings per share (‘EPS’)• 1/3 return on capital employed (‘ROCE’)• 1/3 total shareholder return (split between 50% FTSE 250
comparator group and 50% competitors (‘TSR’).
Achievement of threshold performance in respect of the EPS and TSR targets results in 30% vesting for each part of the Award. Achievement of threshold performance in respect of the ROCE target results in 0% vesting.
There is no ability to retest any of the performance conditions.
The Committee retains discretion under the rules of the LTIP to amend existing performance conditions to take account of any events that may arise which would mean in its opinion, if such adjustments were not made, the performance condition would not constitute a fair measure of the Company’s performance over the period.
Shareholding requirement
Executive Directors are encouraged to build up a shareholding over a five-year period which commenced from 2015. The requirement for the Group CEO is equivalent to 200% of salary and for the Group FD the requirement is 150% of base salary. Adherence to these guidelines is a condition of continued participation in the equity incentive arrangements. This policy ensures that the interests of Executive Directors and those of shareholders are closely aligned.
109Annual Report and Accounts 2016 / National Express Group PLC

LTIP – performance conditions for the National Express Group PLC 2015 Long-Term Incentive Plan (‘2015 LTIP’)EPS, TSR and ROCE were chosen for the 2015 LTIP as appropriate measures of the Group’s long term performance. The table below summarises the rationale for the inclusion of these measures in the 2015 LTIP.
Measure Rationale for performance measure
EPS • Important growth measure considered within the Company and a driver of shareholder value• Provides a transparent and accessible method of gauging the financial performance of the Company• Ensures the annual profit performance targeted by the annual bonus plan flows through to long-term sustainable
EPS growth • The Company calculates performance against this measure by reference to the earnings per share figures
reported in the Company’s audited accounts
TSR • Improves Shareholder alignment• Consistent with the Company’s objective of providing superior long-term returns to shareholders
ROCE • Added to the 2015 LTIP • Demonstrates how efficiently the Company is operating with the resources available.
If the Committee changes the performance conditions within the life of the Remuneration Policy, it will inform shareholders of the changes made and the reason for making any change.
On a change of control, Performance Shares will vest, except to the extent they are exchanged for awards over shares in the acquiring company. Vesting will be subject to any performance conditions and will normally be reduced to reflect early vesting, unless the Remuneration Committee determines that a reduction in the number of vested shares is considered inappropriate. The number or class of shares under award may be adjusted on a rights issue, variation of capital, demerger or similar transaction.
Comparison with approach to remuneration across the GroupNational Express Group operates internationally and accordingly, the remuneration policy for employees generally reflects the legislative and labour market requirements in each separate jurisdiction. The Group will always meet or exceed national minimum standards for terms and conditions of employment in each of our business areas, offering pay, terms and conditions that are appropriate to each labour market in which we operate. Base pay is set at a level that allows us to recruit and retain staff in each relevant labour market and performance-related pay arrangements are based on the achievement of business unit and individual goals, objectively assessed. Other than for a small number of senior Executives in each business unit, long-term incentive plans are only applicable at Executive Director level.
Approach to recruitment remuneration of Executive DirectorsIn the event that the Company recruits a new Executive Director (either from within the organisation or externally), when determining appropriate remuneration arrangements, the Committee will take into consideration all relevant factors (including but not limited to quantum, the type of remuneration being offered and the jurisdiction the candidate was recruited from) to ensure that arrangements are in the best interests of both the Company and its shareholders without paying more than is necessary to recruit an Executive of the required calibre.
The Committee’s policy is for all Executive Directors to have rolling service contracts with a notice period of 12 months, unless on an exceptional basis to complete an external recruitment successfully, when a longer initial period reducing to 12 months may be used.
The Committee would generally seek to align the remuneration of any new Executive Director following the same principles as for the current Executive Directors (set out in the table above).
Directors’ Remuneration Report continued
Elements of remuneration applying under the previous policy applicable for 2016
Element How element supports business strategy Operation Maximum potential value Performance conditions and assessment
Long-Term Incentive Plan – Matching Shares
To drive performance, aid retention and align the interests of Executive Directors with shareholders.
Participants only receive Matching Shares subject to investing into the business and therefore this mechanism adds an element of buy-in to the remuneration.
The performance conditions are aligned with the long-term performance of the business, thereby driving participants to achieve outcomes that realise shareholder value.
Executive Directors are eligible to receive Matching Shares that are based on a personal investment in National Express Group PLC shares funded either through using an annual bonus award to purchase shares or through the pledging of shares held not already allocated to the LTIP. Matching awards are made on the basis of up to four Matching Shares being awarded (based on the value of the investment) for each National Express share pledged or purchased.
Reviewed annually to ensure that grant levels, performance criteria and other features remain appropriate to the Company’s current circumstances, and to ensure that there are no features of the plans that could inadvertently motivate irresponsible behaviour.
The maximum value of investment in any year is 30% of base salary.
Half of any award will be subject to EPS growth. The remaining half will be subject to the relative shareholder return (‘TSR’) of the Company measured against an appropriate group of companies.
Achievement of threshold performance results in 30% vesting for each part of the award.
There is no ability to retest either performance condition.
The Committee retains discretion under the rules of the LTIP to amend existing performance conditions to take account of any events that may arise which would mean, in its opinion, if such adjustments were not made, the performance condition would not constitute a fair measure of the Company’s EPS or TSR growth over the period.
Corporate Governance
110 National Express Group PLC / Annual Report and Accounts 2016

Elements of remuneration applying under the previous policy applicable for 2016
Element How element supports business strategy Operation Maximum potential value Performance conditions and assessment
Long-Term Incentive Plan – Matching Shares
To drive performance, aid retention and align the interests of Executive Directors with shareholders.
Participants only receive Matching Shares subject to investing into the business and therefore this mechanism adds an element of buy-in to the remuneration.
The performance conditions are aligned with the long-term performance of the business, thereby driving participants to achieve outcomes that realise shareholder value.
Executive Directors are eligible to receive Matching Shares that are based on a personal investment in National Express Group PLC shares funded either through using an annual bonus award to purchase shares or through the pledging of shares held not already allocated to the LTIP. Matching awards are made on the basis of up to four Matching Shares being awarded (based on the value of the investment) for each National Express share pledged or purchased.
Reviewed annually to ensure that grant levels, performance criteria and other features remain appropriate to the Company’s current circumstances, and to ensure that there are no features of the plans that could inadvertently motivate irresponsible behaviour.
The maximum value of investment in any year is 30% of base salary.
Half of any award will be subject to EPS growth. The remaining half will be subject to the relative shareholder return (‘TSR’) of the Company measured against an appropriate group of companies.
Achievement of threshold performance results in 30% vesting for each part of the award.
There is no ability to retest either performance condition.
The Committee retains discretion under the rules of the LTIP to amend existing performance conditions to take account of any events that may arise which would mean, in its opinion, if such adjustments were not made, the performance condition would not constitute a fair measure of the Company’s EPS or TSR growth over the period.
The elements that would be considered by the Company for inclusion in the remuneration package for a new Director are:• salary and benefits including defined contribution pension participation or a salary supplement in lieu of pension provision;• participation in the performance-related bonus pro-rated for the year of recruitment to reflect the proportion of the year for
which the new recruit was in post (maximum of 200% of salary). If the commencement date is after 1 September in the year, no award would normally be made for that year;
• participation in the LTIP. The Performance Shares granted will be in line with the grant levels for that grade. In the case of the appointment of a new Group Chief Executive, this grant would be a maximum of 200% and for any other position a grant of 150% would be made. The grant may be pro-rated depending on the time of appointment through the year; and
• costs relating to but not limited to relocation; London allowance; legal, financial, tax and visa advice; and pre-employment medical checks.
The Committee may make awards on appointing an Executive Director to ‘buy out’ remuneration arrangements forfeited on leaving a previous employer. The Committee would take into account both market practice and any relevant commercial factors in considering whether any enhanced and/or one-off annual incentive or long-term incentive award was necessary. Awards made by way of compensation for forfeited awards would be made on a comparable basis, taking account of performance achieved (or likely to be achieved), the proportion of the performance period remaining and the form of the award. Compensation could be in cash or shares.
In the event of recruitment or retention (other than buy-out awards as described above), the Committee may also grant awards to a new or existing Executive Director under Listing Rule 9.4.2 up to an equivalent of 200% of salary per annum. The Remuneration Committee does not currently intend to exercise this discretion to grant total awards in excess of 200% of salary and is committed to fully disclose the nature and reasons for any such discretion used in future.
Executive Directors The contract dates and notice periods for the Executive Directors are shown in the table below.
Executive Directors’ service contracts and notice periodsDirector Contract date Notice period from the Company Notice period from the Director
Dean Finch 16 December 2009 12 months 6 months
Matthew Ashley 16 July 2015 12 months 6 months
The service contract of Dean Finch, which is a rolling contract, contains a provision, exercisable at the option of the Company, to pay an amount on termination of employment equal to one year’s salary, salary supplement in lieu of pension and car allowance. The Director will not be obliged to mitigate his loss in relation to any payment in lieu of notice. The Company will use the payment in lieu of notice provisions when the speed, certainty and protection of restrictive covenants afforded by such clauses are thought to be in the best interests of the Company and the circumstances surrounding the departure of the Director justify their use.
The service contracts for the current Executive Directors are available to view on request from the Company Secretary.
The Committee continuously reviews its policies on Executive remuneration and severance in the best interests of shareholders. Guidance on best practice expectations is taken into account prior to agreeing Directors’ contractual provisions.
The Group Chief Executive is entitled, under an unfunded pension arrangement, to a pension based on the value of notional contributions of 25% of his salary, plus a 5% per annum notional return. The benefits under the unfunded pension arrangement ceased to accrue with effect from 5 June 2016. The pension normally becomes payable, at the earliest, on 1 April 2022. All or part of it may be paid as a lump sum.
Executive Directors are also provided with Directors’ and Officers’ insurance and are indemnified by the Company against certain liabilities incurred in the course of their duties, including the costs of defending actions against them.
111Annual Report and Accounts 2016 / National Express Group PLC

Executive Directors’ external appointmentsUnder the terms of their service agreements, Board approval is required before any external appointment may be accepted by an Executive Director. The Executive Director is permitted to retain any fees paid for such services.
Details of the fee received by the Group Chief Executive in 2016 are shown below. Dean Finch resigned from this Non-executive directorship with effect from 31 May 2016.
Director Fee External appointment
Dean Finch £6,240 Royal Free London NHS Foundation Trust
Executive Directors’ termination paymentsThe Company may at its discretion pay in lieu of notice. Payment in lieu of notice could potentially include up to 12 months’ base salary, benefits and pension (which may be payable in instalments and subject to mitigation).
The table below sets out the treatment of other elements of remuneration that would normally apply for Executive Directors whose service with National Express terminates:
Reason for terminationSalary and contractual benefits
Performance-related bonus awards
Unvested Deferred Bonus awards
Unvested Long-Term Incentive Plan awards Other
Retirement, disability, redundancy, death, sale of part of Company that employs participant, or any other reason that the Remuneration Committee decides.
Payment equal to the aggregate of the basic salary and the value of any contractual benefits for the notice period including any accrued but untaken holiday.
Bonus awarded (subject to satisfaction of performance targets) for the relevant financial year.
Award vests on the date of cessation of employment.
Awards vest on the date of cessation of employment, unless the Remuneration Committee determines it should vest at normal vesting date.
The amount of award vesting will be subject to the satisfaction of performance conditions as at the date the award is deemed to vest.
Awards will normally be reduced time pro rata to reflect time elapsed between grant and cessation of employment.
Fees for outplacement and legal advice may be paid.
Other reasons Paid to date of termination, including any accrued but untaken holiday pay.
No award for year of termination1.
Award lapses on cessation of employment.
Awards lapse in full on leaving employment.
1 Pursuant to Dean Finch’s service contract dated 16 December 2009, if his contract is terminated for reasons other than for an event of default by the Executive (such as gross misconduct), he is entitled, subject to the applicable performance conditions, to a pro rata bonus calculated up to the termination date from the commencement of the relevant bonus year in which termination takes place.
Subject to the circumstances surrounding the termination, the Committee in its discretion may treat the individual as an approved leaver (ie under the first section in the table above). The Committee will consider factors such as personal performance and conduct, overall Company performance and the specific circumstances of the Executive’s departure, including but not restricted to whether the Executive is leaving by mutual agreement with the Company.
In addition, the Committee will consider the above circumstances in considering whether awards in respect of approved leavers should be pro-rated to reflect the service completed.
The Committee reserves the right to make additional exit payments where such payments are made in good faith:• in discharge of an existing legal obligation (or by way of damages for breach of such an obligation); or• by way of settlement or compromise of any claim arising in connection with the termination of a Director’s office or employment.
Directors’ Remuneration Report continued
Corporate Governance
112 National Express Group PLC / Annual Report and Accounts 2016

Remuneration policy for Non-Executive DirectorsNon-Executive Directors’ appointmentsThe Non-Executive Directors do not have service contracts with the Company and do not participate in the Group’s pension scheme, annual bonus scheme or long-term incentive schemes. Non-Executive Directors have letters of appointment and are appointed for an initial three-year term. Non-Executive Directors are typically expected to serve for two three-year terms, although their appointment can be terminated either by them or the Company on one month’s written notice. It is open to the Company to invite a Non-Executive Director to serve for a further period after the expiry of two three-year terms. The letters of appointment for the current Non-Executive Directors can be found on the Company’s website, www.nationalexpressgroup.com.
Non-Executive Directors are also provided with Directors’ and Officers’ insurance and are indemnified by the Company against certain liabilities incurred in the course of their duties, including the costs of defending actions against them.
In accordance with the requirements of the Code, all Directors are required to stand for election or re-election by shareholders each year. The original appointment dates of the Chairman and Non-Executive Directors are shown in the table below. The remuneration of any new Non-Executive Director will be determined following the same principles as for the current Non-Executive Directors.
Non-Executive Directors’ appointment datesDirector Date of appointment Notice period by either Company or Director
Sir John Armitt CBE 1 January 2013 3 months
Joaquín Ayuso 1 June 2011 1 month
Jorge Cosmen 1 December 2005 0 months
Chris Muntwyler 11 May 2011 1 month
Lee Sander 1 June 2011 1 month
Jane Kingston 26 February 2014 1 month
Matthew Crummack 6 May 2015 1 month
Mike McKeon 3 July 2015 1 month
Dr Ashley Steel 1 January 2016 1 month
Remuneration Policy for the Non-Executive Directors Element Purpose Operation Maximum potential value
Non- Executive fees
To attract and retain persons of a suitable calibre for a group of this size and to pay fees which are reflective of responsibilities, competitive with peer companies without paying more than is necessary.
The fees of the Non-Executive Directors are set by the Board as a whole and those of the Chairman are set by the Remuneration Committee. The fees are reviewed at appropriate intervals (normally once every year). The review takes account of fees paid for similar positions in the market, the time commitment required from the Director (estimated to be 60 days per year for the Chairman and 20 days per year for the other Non-Executive Directors) and any additional responsibilities undertaken, such as acting as Chairman to one of the Board Committees or fulfilling the role of Senior Independent Director.
Non-Executive Directors are not eligible to receive pension entitlements or bonuses and may not participate in long-term incentive arrangements.
A travel allowance may be paid to Non-Executive Directors for attendance at Board meetings held outside the continent in which the Non-Executive Director is resident.
The Committee’s policy is to set base fees at an appropriate level taking into account the factors outlined in this table.
Statement of conditions elsewhere in the GroupThe Group operates across a number of countries and accordingly sets terms and conditions for employees which reflect the different legislative and labour market conditions that operate in each of our jurisdictions. We set Global People Standards to provide a framework for recognition and rewards internationally. We will always meet or exceed national minimum standards for terms and conditions of employment in each of our business areas. Pay arrangements in our businesses also reflect local performance with personal increases based on achievement, individually assessed. National Express believes in the value of continuous improvement, both for the individual and for the Company. The Company did not consult with employees in drawing up the Directors’ Remuneration Policy.
When determining the remuneration of Executive Directors, the Remuneration Committee takes into account business unit performance, including both financial performance and safety improvements in the year. Because of the wide variety in labour market conditions and in exchange rate movements, pay rates locally are not normally considered when considering Executive Director base pay reviews.
The Remuneration Committee reviews and notes the salaries of the Senior Management Group. LTIP awards are cascaded down below Executive Director level to the Senior Management Group, aligning the senior team to deliver value for the Group.
113Annual Report and Accounts 2016 / National Express Group PLC

Directors’ Report
Directors’ Report
This Directors’ Report and the Strategic Report collectively comprise the ‘management report’ for the purposes of Disclosure and Transparency Rule 4.1.5R.
Additional disclosuresOther information that is relevant to this report, and which is incorporated by reference, including information required in accordance with the UK Companies Act 2006 and Listing Rule 9.8.4R, can be located as follows:
Information Page No
Likely future developments in the business 13
Going concern and viability statement 45
Governance 58-84
Financial instruments 175-179
Risks 34-37
Related market transactions 190
Greenhouse gas emissions 28-31
Long-term incentive schemes 149
Waiver of dividends 179
Strategic ReportThe Company is required by the Companies Act 2006 to include a strategic report in this document. The information that fulfils the requirements of the Strategic Report can be found on pages 1 to 57, which are incorporated in this report by reference.
Company statusThe Company (company number: 2590560) was incorporated under the Companies Act 1985 as a limited company on 11 March 1991 and re-registered as a public company on 20 October 1992 as National Express Group PLC. The Company is listed on the London Stock Exchange’s main market for listed securities (LON:NEX) and is a constituent member of the FTSE 250 Index.
DisclaimerThis Annual Report and Accounts is intended to focus on matters which are relevant to the interests of shareholders of the Company. The purpose of this Annual Report and Accounts is to assist shareholders in assessing the strategies adopted and performance delivered by the Company and the potential for those strategies to succeed. It should not be relied on by any other party or for any other purpose.
Forward looking statements are made in good faith, based on a number of assumptions concerning future events and information available to Directors at the time of their approval of this report. These forward looking statements should be treated with caution due to the inherent uncertainties underlying any such forward looking information. The user of this Annual Report and Accounts should not rely unduly on these forward looking statements, which are not a guarantee of performance and which are subject to a number of uncertainties and other facts, many of which are outside the Company’s control and could cause actual events to differ materially from those in these statements. No guarantee can be given of future results, levels of activity, performance or achievements.
Branches outside the UKThe Company has branches in Spain.
Results and dividendsThe profit on ordinary activities before tax from continuing operations for the year ended 31 December 2016 was £136.3m (2015: £122.7m) and a profit attributable to equity shareholders of £117.2m (2015: £107.0m) was transferred to reserves.
The Directors recommend a final dividend for the year of 8.41p per ordinary share (2015: 7.645p) which, together with the interim dividend of 3.87p per ordinary share (2015: 3.685p), paid on 23 September 2016, gives a total dividend for the year of 12.28p per share (2015: 11.33p). Subject to shareholder approval, the final dividend will be paid on 19 May 2017 to ordinary shareholders on the register of members at the close of business on 28 April 2017.
DirectorsThe Directors of the Company as at the date of the approval of this Annual Report are listed on pages 64 and 65, together with their biographical details and identification of the Board Committees on which they serve.
Corporate Governance
114 National Express Group PLC / Annual Report and Accounts 2016

With effect from 1 January 2016, Dr Ashley Steel became a Non-Executive Director of the Company. Subsequent to the financial year end, the Board appointed Chris Davies as Group Finance Director. His appointment will take effect from the conclusion of the AGM on 10 May 2017. Chris Davies replaces Matthew Ashley who, after two and half successful years in this role, will be moving to become President and Chief Executive Officer for National Express North America from September 2017. Matthew will remain as an Execuive Director.
Powers of the DirectorsSubject to its Articles of Association and relevant statutory law and to any direction that may be given by the Company in general meeting by special resolution, the business of the Company shall be managed by the Directors, who may exercise all powers of the Company which are not required to be exercised by the Company in general meeting.
Appointment and replacement of DirectorsThe rules for the appointment and replacement of Directors of the Company are set out in the Articles of Association, the UK Corporate Governance Code (the ‘Code’), the Companies Act 2006 and related legislation. In accordance with the Code, all the Directors will retire at the 2017 AGM and offer themselves for re-election. The Board is satisfied that each of those Directors standing for re-election is qualified by virtue of their skills, experience and contribution to the Board.
Directors’ conflicts of interestThe Board has a procedure in place to deal with a situation where a Director has a conflict of interest, as required by the Companies Act 2006. As part of this process, the members of the Board prepare a list of other positions held and all other conflict situations that may need authorising either in relation to the Director concerned or his or her connected persons. The Board considers each Director’s situation and decides whether to approve any conflict situations, taking into consideration what is in the best interests of the Company and whether the Director’s ability to act in accordance with his or her wider duties is affected. Each Director is required to notify the Company Secretary of any potential or actual conflict situations that will need authorising by the Board. Authorisations given by the Board are reviewed annually.
Directors’ and Officers’ liability insuranceThe Company recognises the potential personal liabilities that the Directors are subject to by agreeing to act as a Board member and believes that it is both fair and reasonable to protect them from innocent error or omission. The Company therefore maintains Directors’ and Officers’ liability insurance in respect of legal action that might be brought against its Directors which operates in certain circumstances. This does not extend to cover the Directors where it is proved they acted fraudulently or dishonestly. Pursuant to the Company’s Articles of Association, the Company has indemnified its Directors and Officers in accordance with the provisions of Section 233 of the Companies Act 2006. A copy of the Articles of Association is available for inspection at the Company’s registered office.
Directors’ interests in contractsExcept as stated in note 36 to the consolidated accounts on page 190, no contract existed during the year in relation to the Company’s business in which any Director was materially interested.
Directors’ interests in sharesThe Board of Directors’ interests in shares in the Company are detailed on pages 99 and 100.
Directors’ share optionsDetails of Directors’ share options are provided in the Directors’ Remuneration Report on page 105.
Directors’ indemnitiesThe Company has entered into deeds of indemnity with each of its Directors, which are qualifying indemnity provisions for the purpose of the Companies Act 2006 and remain in force at the date of this report.
Accountability and auditStatements of the respective responsibilities of the Directors and auditors are set out on pages 119 to 129.
Post Balance Sheet eventsOn 11 January 2017, the Company announced that it had reached an agreement in principle for Trenitalia, the passenger rail transportation company which is part of FS Italiane Group, to acquire the c2c franchise. Completion of the acquisition, which was conditional upon final consent from the Department for Transport, took place on 10 February 2017. The total consideration for the franchise was £72.6 million resulting in a small profit for the Group.
Employment policiesThe Group strives to meet its business objectives by motivating and encouraging its employees to be responsive to the needs of its customers and continually improve operational performance. The Group is committed to providing equality of opportunity to employees and potential employees. This applies to recruitment, training, career development and promotion for all employees, regardless of physical ability, gender, sexual orientation, religion, age or ethnic origin. All businesses in the Group report diversity data.
Full and fair consideration is given to applications for employment received from disabled persons, according to their skills and capabilities. The services of any existing employee disabled during their period of employment are retained wherever possible.
115Annual Report and Accounts 2016 / National Express Group PLC

Employee involvementThe Group encourages employee involvement in its affairs. Subsidiary companies produce a range of internal newsletters and circulars which keep employees abreast of developments. Senior management within the Group meet regularly to review strategic developments and management conferences are held at Group and business levels to bring our senior managers together to share ideas and develop policy. Members of the Senior Management Group are also visible within the businesses and undertake a range of visits where they meet face to face with employees to gather feedback on safety and other issues. Dialogue takes place regularly with trade unions and other employee representatives on a wide range of issues.
Employee views are also sought through regular employee satisfaction questionnaires, both within business units and across the Group. Following such surveys, results are shared with employees and action plans are put in place to deal with issues arising. The Group encourages innovation from all levels of employees and has a structured programme to encourage suggestions and to recognise employees through awards. The Group also has a well-developed succession planning process in place and succession plans are reviewed by the Board annually. As a key part of this process, the Company focuses on emerging talent to ensure the Group has the right people being developed to meet our future business needs. Talent management remains an important priority for the Group.
Information regarding the Company’s safeguarding of human rights forms part of the People section on pages 25 to 26 and on the Company’s website, www.nationalexpressgroup.com.
Environmental policyInformation on the Group’s environmental initiatives, including the mandatory reporting disclosure on greenhouse gas emissions, can be found in the Strategic Report on pages 28 to 31 and on the Company’s website, www.nationalexpressgroup.com.
Political contributionsIt is the Group’s policy not to make political donations and accordingly none were made in the year. However, the Company did attend party political conferences during the year for which total expenditure was £14,000 (2015: £13,000).
Major shareholdingsAs at 20 February 2017, the Company had been notified under the Disclosure and Transparency Rules (DTR 5) of the following interests in its shares which represent 3% or more of the voting rights in the Company:
Ordinary shares
Percentage of share
capital*Nature of
holding
European Express Enterprises Ltd 66,481,891 12.9 Direct
Newton Investment Management Ltd 51,180,109 10.0 Direct
Prudential PLC 50,987,079 9.9 Direct
Standard Life Investments (Holdings) Ltd 26,616,766 5.0 Indirect
* The holdings for European Express Enterprises Ltd are included in Jorge Cosmen’s holdings which are shown in the Directors’ Remuneration Report on page 100.
Share capital and rights attaching to the Company’s sharesUnder the Company’s Articles of Association, any share in the Company may be issued with such rights or restrictions, whether in regard to dividend, voting, return of capital or otherwise as the Company may from time to time by ordinary resolution determine (or, in the absence of any such determination, as the Directors may determine).
The Company has one class of ordinary shares with a nominal value of 5 pence. At the date of this Annual Report, the issued share capital consisted of 511,738,648 ordinary shares of 5 pence each.
At a general meeting of the Company every member has one vote on a show of hands and on a poll one vote for each share held. The Notice of AGM will specify deadlines for exercising voting rights either by proxy or by being present in person in relation to resolutions to be passed at a general meeting. Details of the authorised and issued share capital of the Company and details of shares issued during the year can be found in note 32 to the consolidated accounts on page 179.
Directors’ Report continued
Corporate Governance
116 National Express Group PLC / Annual Report and Accounts 2016

No shareholder is, unless the Board decides otherwise, entitled to attend or vote either personally or by proxy at a general meeting or to exercise any other right conferred by being a shareholder if he or she or any person with an interest in his or her shares has been sent a notice under Section 793 of the Companies Act 2006 (which confers upon public companies the power to require information with respect to interests in their voting shares) and he or she or any interested person failed to supply the Company with the information requested within 14 days after delivery of that notice. The Board may also decide that no dividend is payable in respect of those default shares and that no transfer of any default shares shall be registered. These restrictions end seven days after receipt by the Company of a notice of an approved transfer of the shares or all the information required by the relevant Section 793 notice, whichever is earlier.
The Directors may refuse to register any transfer of any share which is not a fully paid share, although such discretion may not be exercised in a way which the Financial Conduct Authority regards as preventing dealings in shares of that class from taking place on an open or proper basis. The Directors may likewise refuse any transfer of a share in favour of more than four persons jointly.
The Company is not aware of any other restrictions on the transfer of ordinary shares in the Company other than:
• certain restrictions that may from time to time be imposed by laws and regulations (for example, insider trading laws); and
• pursuant to the Listing Rules of the Financial Conduct Authority whereby certain employees of the Company require approval of the Company to deal in the Company’s shares.
The Company is not aware of any agreements between shareholders that may result in restrictions on the transfer of securities or voting rights.
Resolutions will be proposed at the 2017 AGM to authorise the Directors to exercise all powers to allot shares, or grant rights for, or to convert any security into, shares, and approve a limited disapplication of statutory pre-emption rights. Details are set out in the Notice of AGM accompanying this document.
The Company was granted authority at the AGM in 2016 to purchase its own shares up to an aggregate value of 10% of the issued nominal capital. The authority was not used during the year. The authority is renewed annually and approval will be sought at the AGM in 2017 for its renewal. Further details are set out in the Notice of AGM accompanying this document.
Share schemesFirst Names (Jersey) Limited is Trustee of the National Express Group Employee Benefit Trust. As at 20 February 2017 it held 2,260,292 shares (0.44% of the issued share capital) of the Company for employee share schemes. Further details of the Company’s employee share schemes can be found in note 7 to the consolidated accounts on pages 148 to 151 and are incorporated by reference into this report. The Trustee may vote the shares held by the Trust at its discretion.
The current Investment Association (‘IA’) guidance on dilution limits provides that the overall dilution under all share plans operated by a company should not exceed 10% over a ten-year period in relation to the Company’s share capital, with a further limitation of 5% in any ten-year period on executive plans. National Express share plans operate within IA recommended guidelines on dilution limits.
Articles of AssociationAny amendments to the Company’s Articles of Association may be made in accordance with the provisions of the Companies Act 2006.
Annual General MeetingThe AGM will be held at 2.00pm on 10 May 2017 in Hall 9 at the International Convention Centre, Broad Street, Birmingham B1 2EA. At the Meeting, special resolutions will be proposed to authorise the Directors to issue shares without applying statutory pre-emption rights, to authorise the Company to make market purchases of its own shares and to authorise the calling of general meetings (other than Annual General Meetings) on 14 clear days’ notice.
Full details are provided in the Notice of AGM. If you would like to register any question you may have in advance of the AGM you can do so at [email protected] or you can write to the Company Secretary at National Express Group PLC, National Express House, Birmingham Coach Station, Mill Lane, Digbeth, Birmingham B5 6DD.
117Annual Report and Accounts 2016 / National Express Group PLC

Material contracts and change of control agreementsThere are a number of agreements that take effect, alter or terminate upon a change of control of the Company following a takeover bid. Save as disclosed below, none of these are considered significant.
Under the terms of the Company’s revolving credit facilities upon a change of control, the Company would have five days to enter into negotiations with the lenders to alter the terms. Following ten days of negotiations, if no agreement has been reached, outstanding balances may become repayable.
Under the terms of the £1 billion Euro Medium Term Note Programme (as updated on 3 October 2016) under which the Company issued Medium Term Notes (‘MTNs’) to various institutions on 13 January 2010, 15 June 2010 and 11 November 2016, there is a change of control put option such that, upon a change of control event, any holder of any MTN may require the Company to redeem or purchase that MTN.
The Company entered into a private placement Note Purchase Agreement on 30 July 2012 relating to the issue by the Company of €78,500,000 4.55% Senior Notes due 16 August 2021. Under the terms of the Agreement the Company is required to offer to Note holders to repay to them the entire unpaid principal amount and interest thereon upon a change of control.
The National Express Group PLC Long-Term Incentive Plan 2015 (the ‘Plan’) contains provisions as a result of which options and awards may vest and become exercisable on a change of control of the Company in accordance with the rules of the Plan.
The Group’s UK Bus business operates the Midland Metro tram service and the UK Bus operating subsidiary is party to a contract with Transport for West Midlands (‘TfWM’ and formerly known as Centro) governing certain aspects of such operation. The contract with TfWm contains an event of default on a change in control of the UK operating subsidiary (which would be triggered on a change in control of the Company) if such change in control is not approved by TfWM.
The Group’s UK Coach business operates a number of coach and bus services from or at certain UK airports and the UK Coach operating subsidiary is also contracted to provide passenger transport services for certain other third parties. A number of these contracts contain rights for the counterparties to terminate them on a change of control of the relevant subsidiary company party to such contracts (certain of which would be triggered by a change in control of the Company).
While no one of these contracts is considered significant in the context of the Group’s business as a whole, the impact on the Group if all such contracts were terminated could be significant.
Directors’ and employees’ service contractsThere are no agreements between the Company and its Directors or employees providing for compensation for loss of office or employment (whether through resignation, purported redundancy or otherwise) that occurs because of a takeover bid.
AuditorResolutions to re-appoint Deloitte LLP as auditor of the Company and to authorise the Directors to determine their remuneration will be proposed at the 2017 AGM.
Disclosure of information to auditorThe Directors confirm that, so far as they are aware, there is no relevant audit information of which the Company’s auditor is unaware and that each Director has taken all the steps that they ought to have taken as a Director in order to make themselves aware of any relevant audit information and to establish that the Company’s auditor is aware of that information. This confirmation is given and should be interpreted in accordance with the provisions of Section 418 of the Companies Act 2006.
By order of the Board
Joy BaldryCompany Secretary 23 February 2017
Directors’ Report continued
Corporate Governance
118 National Express Group PLC / Annual Report and Accounts 2016

Directors’ Responsibilities Statement
Directors’ responsibilities Statement
The Directors are responsible for preparing the Annual Report and the Financial Statements in accordance with applicable law and regulations.
Company law requires the Directors to prepare such Financial Statements for each financial year. Under that law the Directors are required to prepare the Group Financial Statements in accordance with International Financial Reporting Standards (‘IFRSs’) as adopted by the European Union and Article 4 of the IAS Regulation and have also chosen to prepare the parent Company Financial Statements in accordance with Financial Reporting Standard 101 Reduced Disclosure Framework. Under company law the Directors must not approve the Financial Statements unless they are satisfied that they give a true and fair view of the state of affairs of the Company and of the profit or loss of the Company for that period.
In preparing the parent Company Financial Statements, the Directors are required to:
• select suitable accounting policies and then apply them consistently;
• make judgments and accounting estimates that are reasonable and prudent;
• state whether Financial Reporting Standard 101 Reduced Disclosure Framework has been followed, subject to any material departures disclosed and explained in the Financial Statements; and
• prepare the Financial Statements on the going concern basis unless it is inappropriate to presume that the Company will continue in business.
In preparing the Group Financial Statements, International Accounting Standard 1 requires that Directors:
• properly select and apply accounting policies;• present information, including accounting policies, in a
manner that provides relevant, reliable, comparable and understandable information;
• provide additional disclosures when compliance with the specific requirements in IFRSs are insufficient to enable users to understand the impact of particular transactions, other events and conditions on the entity’s financial position and financial performance; and
• make an assessment of the Company’s ability to continue as a going concern.
The Directors are responsible for keeping adequate accounting records that are sufficient to show and explain the Company’s transactions and disclose with reasonable accuracy at any time the financial position of the Company and enable them to ensure that the Financial Statements comply with the Companies Act 2006. They are also responsible for safeguarding the assets of the Company and hence for taking reasonable steps for the prevention and detection of fraud and other irregularities.
The Directors are responsible for the maintenance and integrity of the corporate and financial information included on the Company’s website. Legislation in the United Kingdom governing the preparation and dissemination of financial statements may differ from legislation in other jurisdictions.
We confirm that to the best of our knowledge:
• the Financial Statements, prepared in accordance with the relevant financial reporting framework, give a true and fair view of the assets, liabilities, financial position and profit or loss of the Company and the undertakings included in the consolidation taken as a whole;
• the Strategic Report includes a fair review of the development and performance of the business and the position of the Company and the undertakings included in the consolidation taken as a whole, together with a description of the principal risks and uncertainties that they face; and
• the Annual Report and Financial Statements, taken as a whole, are fair, balanced and understandable and provide the information necessary for shareholders to assess the Company’s position, performance, business model and strategy.
This responsibility statement was approved by the Board of Directors on 23 February 2017.
By order of the Board
Dean FinchGroup Chief Executive 23 February 2017
Matthew AshleyGroup Finance Director 23 February 2017
119Annual Report and Accounts 2016 / National Express Group PLC

Financial Statements121 Independent Auditor’s Report130 Group Income Statement131 Group Statement of
Comprehensive Income 132 Group Balance Sheet133 Group Statement of Changes in Equity134 Group Statement of Cash Flows135 Notes to the Consolidated Accounts200 Company Balance Sheet201 Company Statement of Changes in Equity202 Notes to the Company Accounts
Financial Statements
NATIONAL EXPRESS GROUP PLC / ANNUAL REPORT AND ACCOUNTS 2016120120 National Express Group PLC / Annual Report and Accounts 2016
Contents to the Financial Statements

Opinion on Financial Statements of National Express Group PLC
In our opinion:• the Financial Statements give a true and fair view of the state of the Group’s and of the parent Company’s affairs as at
31 December 2016 and of the Group’s and the parent Company’s profit for the year then ended;• the Group Financial Statements have been properly prepared in accordance with International Financial Reporting Standards
(IFRSs) as adopted by the European Union;• the parent Company Financial Statements have been properly prepared in accordance with United Kingdom Generally Accepted
Accounting Practice, including FRS 101 “Reduced Disclosure Framework”; and• the Financial Statements have been prepared in accordance with the requirements of the Companies Act 2006 and, as regards
the Group Financial Statements, Article 4 of the IAS Regulation.
The Financial Statements that we have audited comprise:• the Group Income Statement;• the Group Statement of Comprehensive Income;• the Group and parent Company Balance Sheets;• the Group Cash Flow Statement;• the Group and parent Company Statements of Changes in Equity; • the related notes 1 to 39 for the Group Financial Statements; and• the related notes 1 to 19 for the parent Company Financial Statements.
The financial reporting framework that has been applied in the preparation of the Group Financial Statements is applicable law and IFRSs as adopted by the European Union. The financial reporting framework that has been applied in the preparation of the parent Company Financial Statements is applicable law and United Kingdom Accounting Standards (United Kingdom Generally Accepted Accounting Practice), including FRS 101 “Reduced Disclosure Framework”.
Summary of our audit approach
Key risks The key risks that we identified in the current year were:
• Goodwill and fixed asset impairment;• North American insurance and other claims provisions;• Pensions accounting; and• Fuel hedge accounting.
Materiality The materiality that we used in the current year was £8.9 million which was determined on the basis of normalised profit before tax, including the impact of the UK Rail division which was reported as a discontinued operation in the current year due to the post year-end sale of NXET. Materiality represents 5.1% of this profit metric.
Scoping • Full scope audit work was completed on a divisional sub-consolidation basis for Rail, UK Bus, UK Coach, North America, and Spain and Morocco.
• Specified audit procedures have been performed over certain revenue and cost balances within the Bahrain joint venture.
• Full scope audit procedures have been performed on the parent Company Financial Statements. • All other parts of the Group have been subject to analytical review procedures.• The five operating divisions and the Group head office function contributed 100% (2015: 100%) of
Group revenue and Group operating profit and 99% (2015: 99%) of Group net assets
Significant changes in our approach
We have not reported on ‘tax provisions’ as a key audit risk in the current year. This is a result of the level of associated risk having reduced significantly following the closure of a number of ongoing tax enquiries.
ANNUAL REPORT AND ACCOUNTS 2016 / NATIONAL EXPRESS GROUP PLC 121121Annual Report and Accounts 2016 / National Express Group PLC
Independent auditor’s report to the members of National Express Group PLC

Going concern and the directors’ assessment of the principal risks that would threaten the solvency or liquidity of the GroupAs required by the Listing Rules we have reviewed the directors’ statement regarding the appropriateness of the going concern basis of accounting contained within note 2 to the Financial Statements and the directors’ statement on the longer-term viability of the Group contained within the Group Finance Director’s Review on page 45.
We are required to state whether we have anything material to add or draw attention to in relation to:
• the Directors’ confirmation on page 34 that they have carried out a robust assessment of the principal risks facing the Group, including those that would threaten its business model, future performance, solvency or liquidity;
• the disclosures on pages 36-37 that describe those risks and explain how they are being managed or mitigated;
• the Directors’ statement in note 2 to the Financial Statements about whether they considered it appropriate to adopt the going concern basis of accounting in preparing them and their identification of any material uncertainties to the Group’s ability to continue to do so over a period of at least twelve months from the date of approval of the Financial Statements; and
• the Directors’ explanation on page 45 as to how they have assessed the prospects of the Group, over what period they have done so and why they consider that period to be appropriate, and their statement as to whether they have a reasonable expectation that the Group will be able to continue in operation and meet its liabilities as they fall due over the period of their assessment, including any related disclosures drawing attention to any necessary qualifications or assumptions.
We confirm that we have nothing material to add or draw attention to in respect of these matters.
We agreed with the Directors’ adoption of the going concern basis of accounting and we did not identify any such material uncertainties. However, because not all future events or conditions can be predicted, this statement is not a guarantee as to the Group’s ability to continue as a going concern.
IndependenceWe are required to comply with the Financial Reporting Council’s Ethical Standards for Auditors and confirm that we are independent of the Group and we have fulfilled our other ethical responsibilities in accordance with those standards.
We confirm that we are independent of the Group and we have fulfilled our other ethical responsibilities in accordance with those standards. We also confirm we have not provided any of the prohibited non-audit services referred to in those standards.
Financial Statements
NATIONAL EXPRESS GROUP PLC / ANNUAL REPORT AND ACCOUNTS 2016122122 National Express Group PLC / Annual Report and Accounts 2016
Independent auditor’s report to the members of National Express Group PLC continued

Our assessment of risks of material misstatementThe assessed risks of material misstatement described below are those that had the greatest effect on our audit strategy, the allocation of resources in the audit and directing the efforts of the engagement team.
Risk descriptionHow the scope of our audit responded to the risk Key observations
Goodwill and other non-current asset impairmentTotal goodwill, intangible assets and property, plant and equipment at 31 December 2016 were £2,532.2 million. The most significant balances relate to the Spain and Morocco division (£1,127.9 million) and the North America division (£1,163.0 million).
There is a risk surrounding the recoverability of these balances, as assessed annually by management as part of their goodwill impairment review using discounted cash flows on a value in use basis.
The key judgements in assessing goodwill and other non-current assets for impairment are the discount rate and the perpetual growth rate used. The value in use models are highly sensitive to changes in these rates, both of which must reflect a long-term view of underlying growth in each respective economy.
We note that estimating a value in use is inherently judgemental, and a range of assumptions can reasonably be applied in determining an appropriate discount rate and perpetual growth rate to use.
The Audit Committee Report on page 79 refers to goodwill and fixed asset impairment as a key judgement considered by the Audit Committee.
Note 2 to the Financial Statements sets out the Group’s accounting policy for testing goodwill for impairment. The basis for the impairment reviews is outlined in note 14 to the Financial Statements, including details of the pre-tax discount rate and terminal growth rate used. Note 14 to the Financial Statements also includes details of the extent to which the goodwill and fixed asset impairment test is sensitive to changes in the key inputs.
Our procedures for challenging management’s methodology and assumptions focussed on the Group’s interests in Spain (and Morocco) and North America and included:
• assessing the appropriateness of any changes to assumptions since the prior period;
• validating the integrity of the impairment models through testing of the mechanical accuracy and verifying the application of the input assumptions;
• understanding the underlying process used to determine the risk adjusted cash flow projections;
• challenging the cash flow forecasts with reference to historical forecasts, actual performance and independent evidence to support any significant expected future changes to the business;
• working with our valuation specialists to benchmark the discount rates and perpetuity growth rates applied to external macro-economic and market data. This involved consideration of the impact of territory-specific risk-adjustments to the discount rate and perpetuity growth rates versus the risk adjustments made to the underlying cash flows; and
• assessing the appropriateness of the disclosures included in the Financial Statements including the sensitivity analysis provided.
We determined that there is currently sufficient headroom for both the Spain and Morocco division and the North America division such that we concur with management that no impairment is required.
Whilst we note that both businesses are reliant on the long-term economic performance of their respective territories, we conclude that the assumptions applied in the impairment models, when taken in aggregate, are within our acceptable range.
ANNUAL REPORT AND ACCOUNTS 2016 / NATIONAL EXPRESS GROUP PLC 123123Annual Report and Accounts 2016 / National Express Group PLC

Risk descriptionHow the scope of our audit responded to the risk Key observations
North American insurance and other claims provisionsOf the total Group claims provision of £113.6 million at 31 December 2016, £105.4 million relates to the North America division. This reflects historical claims being managed by the Group, as well as provision for new claims identified in the year, including amounts arising through acquisition in the year that have required separate fair value consideration.
Estimation of insurance and other claims provisions, including those arising on acquisition, is highly judgemental and is based on assessment of the expected settlement of known claims together with an estimate of settlements that will be made in respect of incidents incurred but not reported at the balance sheet date.
The measurement of the self-insured claims provision in North America uses a combination of actuarial assumptions around loss development and management judgement to ensure that the Group is appropriately provided.
Given the level of complexity and judgement involved in making these estimations there is a risk the eventual outcome is materially different from that estimated and provided for.
The Audit Committee Report on page 79 refers to North American insurance and other claims provisions as a key judgement considered by the Audit Committee. This area has also been highlighted as a key accounting estimate and judgement in note 2 to the Financial Statements.
Details of the Group claims provision are given in note 26 to the Financial Statements.
We used our actuarial specialists to challenge the assumptions inherent in the valuation produced by the Group’s Actuary in North America for the high volume lower value claims, such as the loss development factors and ultimate expected losses, and to re-perform the actuarial calculation to develop a valuation range.
For the individually large claims not subject to actuarial review, we discussed the nature of each claim with the US General Counsel and those responsible for claims handling and tested a sample of items to independent evidence to assess the expected range of possible outcomes. This included testing the fair value of provisions recognised on acquisitions during the year.
We compared the overall level of provision recorded to the range determined by management and the Group’s Actuary, to conclude whether the level of provision was appropriate. This involved consideration of the audit evidence supporting the range as well as the independent assessment of the range for higher volume lower value claims produced by our actuarial specialists.
As part of our detailed audit work testing the various aspects of the provision, including new amounts recognised at fair value on acquisition and the income statement charge for the year, we did not identify any material exceptions.
When considering the overall balance sheet provision in light of the wide range of the potential outcomes, and having taken into account the results of our audit work, we consider that the provision for North American insurance and other claims falls within our acceptable range.
Financial Statements
NATIONAL EXPRESS GROUP PLC / ANNUAL REPORT AND ACCOUNTS 2016124124 National Express Group PLC / Annual Report and Accounts 2016
Independent auditor’s report to the members of National Express Group PLC continued

Risk descriptionHow the scope of our audit responded to the risk Key observations
Pensions accountingThe Group’s overall net pension liability across all schemes (including that held within National Express Essex Thameside (“NXET”) as shown separately within the group of assets available for sale) is £50.5 million at 31 December 2016.
The measurement of the Group’s gross defined benefit obligation (including that held within NXET) of £848.1 million under IAS 19 Employee Benefits requires management to make judgements on assumptions including price inflation, discount rates, pension increase, mortality rates and earnings growth. A change in any one of these assumptions could have a material impact on the determination of the gross defined benefit obligation.
The triennial funding valuation for the Group’s principal UK Bus scheme is in the process of being finalised for the year to 31 December 2016. The triennial funding valuation of the principal Group scheme has been completed for the year to 31 December 2016.
The recognition of scheme surpluses requires judgement around the application of IFRIC 14 The Limit on a Defined Benefit Asset, Minimum Funding Requirements and their Interaction. Total accounting surpluses recognised by the Group at 31 December 2016 total £82.2 million, including an amount of £37.7 million for NXET.
The Audit Committee Report on page 79 refers to pensions accounting as a key judgement considered by the Audit Committee. This area has also been highlighted as a key accounting estimate and judgement in note 2 to the Financial Statements.
Details of the Group’s pension obligations are outlined in note 34 to the Financial Statements. The surplus recognised on the NXET scheme is disclosed separate in note 11 as this scheme was part of a business treated as ‘held for sale’ at year-end.
We challenged the actuarial assumptions used to calculate the gross defined benefit obligation and our actuarial specialists performed a critical assessment of the key assumptions with reference to comparable market data.
We also tested a sample of the data used in the actuarial valuation, as well as assessing the basis on which pension surpluses were recognised. The latter involved agreeing related terms to the deeds of the relevant Group pension scheme and considering the impact of rail franchise adjustments on the NXET scheme.
From the audit work completed we are satisfied that the methodology and assumptions applied in relation to determining the pension valuation, when taken in aggregate, fall within an acceptable range.
Fuel hedge accountingThe Group’s non-rail divisions consume approximately 225 million litres of fuel each year for which it is at risk of price changes. It is the Group’s policy to hedge fuel price fluctuations in order to provide short to medium term cost certainty.
At 31 December 2016 the Group held fuel derivatives with an overall net fair value of £13.1 million, comprising liabilities of £25.3 million offset by assets of £12.2 million.
Accounting for fuel commodity contracts is an inherently complex area and the existence of a number of factors, such as basis risk, means judgement is applied in testing the accounting hedges for effectiveness.
The Audit Committee Report on page 79 refers to fuel hedge accounting as a key judgement considered by the Audit Committee. The Group’s accounting policy for fuel hedges is outlined in note 2 to the Financial Statements. Note 31 to the Financial Statements outlines details of the fair value of the fuel hedge derivatives at year-end.
We have worked with our treasury accounting specialists to:
• challenge the valuations of a sample of forward fuel hedge contracts by calculating independent fair values;
• review the hedge documentation with reference to the requirements of IAS 39 and best practice;
• completed independent effectiveness testing for a sample of hedges; and
• challenged the Group’s assessment of the highly probable assumptions in respect of the forecast transactions.
Our independent testing of the fair value of the fuel hedge derivatives did not identify any material valuation differences and in aggregate the fair value of the fuel hedge derivatives, which are provided to the company by the relevant financial institution counterparties, were deemed to be appropriate.
The results of our audit work assessing the Group’s application of hedge accounting identified no material deviation from the requirements of IAS 39 Financial Instruments: Recognition and Measurement.
ANNUAL REPORT AND ACCOUNTS 2016 / NATIONAL EXPRESS GROUP PLC 125125Annual Report and Accounts 2016 / National Express Group PLC

These matters were addressed in the context of our audit of the Financial Statements as a whole, and in forming our opinion thereon, and we do not provide a separate opinion on these matters.
Our application of materialityWe define materiality as the magnitude of misstatement in the Financial Statements that makes it probable that the economic decisions of a reasonably knowledgeable person would be changed or influenced. We use materiality both in planning the scope of our audit work and in evaluating the results of our work.
Based on our professional judgement, we determined materiality for the Financial Statements as a whole as follows:
Group materiality £8.9 million (2015: £8.0 million)
Basis for determining materiality
5.1% (2015: 5.3%) of normalised profit before tax, including the impact of the UK Rail division which was reported as a discontinued operation in the current year due to the post year-end sale of NXET.
Normalised profit before tax is disclosed on the face of the Group Income Statement where it is reconciled to statutory profit before tax. Note 11 to the Financial Statements outlines profit before tax of £4.9 million for discontinued operations.
Rationale for the benchmark applied
Normalised profit is one of the key metrics used both externally and internally as excluding exceptional items, although there are none in 2016, which are volatile, as well as amortisation costs, facilitates a better understanding of the underlying trading performance.
The results of NXET were included to reflect the basis on which the Group’s consensus normalised profit before tax had been set for 2016.
This materiality level equates to less than 1% of equity.
We agreed with the Audit Committee that we would report to the Committee all audit differences in excess of £300,000 (2015: £160,000), as well as differences below that threshold that, in our view, warranted reporting on qualitative grounds. We also report to the Audit Committee on disclosure matters that we identified when assessing the overall presentation of the Financial Statements.
Financial Statements
NATIONAL EXPRESS GROUP PLC / ANNUAL REPORT AND ACCOUNTS 2016126126 National Express Group PLC / Annual Report and Accounts 2016
Independent auditor’s report to the members of National Express Group PLC continued

An overview of the scope of our auditOur Group audit was scoped by obtaining an understanding of the Group and its environment, including Group-wide controls, and assessing the risks of material misstatement at the Group level. Based on that assessment, as in the prior year, we focused our Group audit scope primarily on the audit work at the five operating divisions and the Group head office function. Each operating division produces its own sub-consolidation and was subject to an audit that was scoped relevant to its component materiality level, which was between £3.2 million and £5.2 million for both the current and prior year. This audit work was principally performed by Deloitte Touche Tohmatsu Limited member firms, with a number of non Deloitte component auditors reporting to Deloitte Spain for the Spain and Morocco divisional audit. The Group head office work was performed to a component materiality level of £6.4 million, consistent with the prior year.
The five operating divisions and the Group head office function contributed 100% (2015: 100%) of Group revenue and Group operating profit and 99% (2015: 99%) of Group net assets.
Group-level analytical review procedures were performed over the amounts held in the Bahrain joint venture, along with specified audit procedures over certain revenue, cost and balance sheet items performed at our request by non Deloitte component auditors in Bahrain to a component materiality of £2.0 million.
At the parent entity level we also tested the consolidation process.
The Group audit team continued to follow a programme of planned visits that has been designed so that the Senior Statutory Auditor and/or a senior member of the audit team visits each of the five primary divisions where the Group audit scope was focused at least once a year in addition to the work performed at the Group head office. In relation to the current year audit the Senior Statutory Auditor and/or a senior member of the audit team visited Spain, North America, Germany and Bahrain at least once.
Outside of the planned visits regular discussions were held with the component audit teams throughout the year to direct and supervise the planning and execution of their audit work.
Opinion on other matters prescribed by the Companies Act 2006In our opinion, based on the work undertaken in the course of the audit:
• the part of the Directors’ Remuneration Report to be audited has been properly prepared in accordance with the Companies Act 2006;
• the information given in the Strategic Report and the Directors’ Report for the financial year for which the Financial Statements are prepared is consistent with the Financial Statements; and
• the Strategic Report and the Directors’ Report have been prepared in accordance with applicable legal requirements.
In the light of the knowledge and understanding of the company and its environment obtained in the course of the audit, we have not identified any material misstatements in the Strategic Report and the Directors’ Report.
ANNUAL REPORT AND ACCOUNTS 2016 / NATIONAL EXPRESS GROUP PLC 127127Annual Report and Accounts 2016 / National Express Group PLC

Matters on which we are required to report by exception
Adequacy of explanations received and accounting recordsUnder the Companies Act 2006 we are required to report to you if, in our opinion:
• we have not received all the information and explanations we require for our audit; or• adequate accounting records have not been kept by the parent Company, or returns adequate for
our audit have not been received from branches not visited by us; or• the parent Company Financial Statements are not in agreement with the accounting records and returns.
We have nothing to report in respect of these matters.
Directors’ remunerationUnder the Companies Act 2006 we are also required to report if in our opinion certain disclosures of Directors’ remuneration have not been made or the part of the Directors’ Remuneration Report to be audited is not in agreement with the accounting records and returns.
We have nothing to report arising from these matters.
Corporate Governance StatementUnder the Listing Rules we are also required to review part of the Corporate Governance Statement relating to the Company’s compliance with certain provisions of the UK Corporate Governance Code.
We have nothing to report arising from our review.
Our duty to read other information in the Annual ReportUnder International Standards on Auditing (UK and Ireland), we are required to report to you if, in our opinion, information in the Annual Report is:
• materially inconsistent with the information in the audited Financial Statements; or• apparently materially incorrect based on, or materially inconsistent with, our knowledge of the Group
acquired in the course of performing our audit; or• otherwise misleading.
In particular, we are required to consider whether we have identified any inconsistencies between our knowledge acquired during the audit and the Directors’ statement that they consider the Annual Report is fair, balanced and understandable and whether the Annual Report appropriately discloses those matters that we communicated to the Audit Committee which we consider should have been disclosed.
We confirm that we have not identified any such inconsistencies or misleading statements.
Financial Statements
NATIONAL EXPRESS GROUP PLC / ANNUAL REPORT AND ACCOUNTS 2016128128 National Express Group PLC / Annual Report and Accounts 2016
Independent auditor’s report to the members of National Express Group PLC continued

Respective responsibilities of directors and auditorAs explained more fully in the Directors’ Responsibilities Statement, the Directors are responsible for the preparation of the Financial Statements and for being satisfied that they give a true and fair view. Our responsibility is to audit and express an opinion on the Financial Statements in accordance with applicable law and International Standards on Auditing (UK and Ireland). We also comply with International Standard on Quality Control 1 (UK and Ireland). Our audit methodology and tools aim to ensure that our quality control procedures are effective, understood and applied. Our quality controls and systems include our dedicated professional standards review team and independent partner reviews.
This report is made solely to the Company’s members, as a body, in accordance with Chapter 3 of Part 16 of the Companies Act 2006. Our audit work has been undertaken so that we might state to the Company’s members those matters we are required to state to them in an auditor’s report and for no other purpose. To the fullest extent permitted by law, we do not accept or assume responsibility to anyone other than the Company and the Company’s members as a body, for our audit work, for this report, or for the opinions we have formed.
Scope of the audit of the Financial StatementsAn audit involves obtaining evidence about the amounts and disclosures in the Financial Statements sufficient to give reasonable assurance that the Financial Statements are free from material misstatement, whether caused by fraud or error. This includes an assessment of: whether the accounting policies are appropriate to the Group’s and the parent Company’s circumstances and have been consistently applied and adequately disclosed; the reasonableness of significant accounting estimates made by the Directors; and the overall presentation of the Financial Statements. In addition, we read all the financial and non-financial information in the Annual Report to identify material inconsistencies with the audited Financial Statements and to identify any information that is apparently materially incorrect based on, or materially inconsistent with, the knowledge acquired by us in the course of performing the audit. If we become aware of any apparent material misstatements or inconsistencies we consider the implications for our report.
Stephen Griggs (Senior statutory auditor)for and on behalf of Deloitte LLP Chartered Accountants and Statutory Auditor London 23 February 2017
ANNUAL REPORT AND ACCOUNTS 2016 / NATIONAL EXPRESS GROUP PLC 129129Annual Report and Accounts 2016 / National Express Group PLC

130 NATIONAL EXPRESS GROUP PLC / ANNUAL REPORT AND ACCOUNTS 2016
Financial statements
Group Income Statement For the year ended 31 December 2016
Note
Total before intangible
amortisation 2016
£m
Intangible amortisation
2016 £m
Total 2016
£m
Total before intangible
amortisation (restated)
2015 £m
Intangible amortisation
2015 £m
Total
(restated) 2015
£m
Continuing operations
Revenue 3,5 2,103.7 – 2,103.7 1,753.8 – 1,753.8
Operating costs before intangible amortisation (1,884.7) – (1,884.7) (1,562.0) – (1,562.0)
Intangible amortisation 5,14 – (33.8) (33.8) – (25.7) (25.7)
Total operating costs 6 (1,884.7) (33.8) (1,918.5) (1,562.0) (25.7) (1,587.7)
Group operating profit 5 219.0 (33.8) 185.2 191.8 (25.7) 166.1
Share of results from associates and joint ventures 18 1.1 – 1.1 1.8 – 1.8
Finance income 3,9 7.5 – 7.5 5.9 – 5.9
Finance costs 9 (57.5) – (57.5) (51.1) – (51.1)
Profit before tax 170.1 (33.8) 136.3 148.4 (25.7) 122.7
Tax charge 10 (31.7) 11.5 (20.2) (28.2) 13.2 (15.0)
Profit after tax for the year from continuing operations 138.4 (22.3) 116.1 120.2 (12.5) 107.7
Profit for the year from discontinued operations 11 3.9 – 3.9 1.4 – 1.4
Profit for the year 142.3 (22.3) 120.0 121.6 (12.5) 109.1
Profit attributable to equity shareholders 139.5 (22.3) 117.2 119.5 (12.5) 107.0
Profit attributable to non-controlling interests 2.8 – 2.8 2.1 – 2.1
142.3 (22.3) 120.0 121.6 (12.5) 109.1
Earnings per share:
– basic earnings per share 13 23.0p 20.9p
– diluted earnings per share 13 22.8p 20.9p
Normalised earnings per share:
– basic earnings per share 13 27.3p 23.4p
– diluted earnings per share 13 27.2p 23.3p
Earnings per share from continuing operations:
– basic earnings per share 13 22.2p 20.7p
– diluted earnings per share 13 22.1p 20.6p
Financial Statements
NATIONAL EXPRESS GROUP PLC / ANNUAL REPORT AND ACCOUNTS 2016130130 National Express Group PLC / Annual Report and Accounts 2016
Group Income Statement For the year ended 31 December 2016

ANNUAL REPORT AND ACCOUNTS 2016 / NATIONAL EXPRESS GROUP PLC 131
Group Statement of Comprehensive Income For the year ended 31 December 2016
Note
2016 £m
2015 £m
Profit for the year 120.0 109.1
Items that will not be reclassified subsequently to profit or loss:
Actuarial losses on defined benefit pension plans 34 (45.6) (9.4)
Deferred tax on actuarial losses 8.0 1.4
(37.6) (8.0)
Items that may be reclassified subsequently to profit or loss:
Exchange differences on retranslation of foreign operations (net of hedging) 189.6 (31.0)
Exchange differences on retranslation of non-controlling interests 2.5 (0.6)
Gain/(loss) on cash flow hedges 38.8 (52.5)
Less: reclassification adjustments for gains or losses included in profit 43.7 36.1
Tax on exchange differences 14.3 (1.1)
Deferred tax on cash flow hedges (12.2) 1.2
276.7 (47.9)
Total comprehensive income for the year 359.1 53.2
Total comprehensive income attributable to:
Equity shareholders 353.8 51.7
Non-controlling interests 5.3 1.5
359.1 53.2
ANNUAL REPORT AND ACCOUNTS 2016 / NATIONAL EXPRESS GROUP PLC 131131Annual Report and Accounts 2016 / National Express Group PLC
Group Statement of Comprehensive Income For the year ended 31 December 2016

132 NATIONAL EXPRESS GROUP PLC / ANNUAL REPORT AND ACCOUNTS 2016
Financial statements
Note
2016 £m
2015 £m
Non-current assets Intangible assets 14 1,548.6 1,230.7 Property, plant and equipment 15 983.6 801.1 Available-for-sale investments 17 7.8 6.5 Derivative financial instruments 17 31.1 22.2 Deferred tax assets 27 48.3 31.1 Investments accounted for using the equity method 18 13.7 10.6 Trade and other receivables 20 18.2 4.0 Defined benefit pension assets 34 44.5 49.7 2,695.8 2,155.9 Current assets Inventories 21 25.0 22.5 Trade and other receivables 22 302.7 241.9 Derivative financial instruments 17 13.0 2.4 Current tax assets 2.3 1.4 Cash and cash equivalents 23 318.1 60.4 Assets classified as held for sale 11 78.0 – 739.1 328.6 Total assets 3,434.9 2,484.5 Non-current liabilities Borrowings 28 (816.7) (752.3) Derivative financial instruments 28 (4.2) (39.6) Deferred tax liability 27 (82.9) (53.8) Other non-current liabilities 25 (21.2) (16.0) Defined benefit pension liabilities 34 (132.7) (62.3) Provisions 26 (57.2) (32.1)
(1,114.9) (956.1) Current liabilities Trade and other payables 24 (600.7) (499.5) Borrowings 28 (443.8) (99.1) Derivative financial instruments 28 (26.0) (46.0) Current tax liabilities (6.7) (16.1) Provisions 26 (57.2) (36.6)
Liabilities directly associated with assets classified as held for sale 11 (60.1) –
(1,194.5) (697.3)
Total liabilities (2,309.4) (1,653.4) Net assets 1,125.5 831.1
Shareholders’ equity Called-up share capital 32 25.6 25.6 Share premium account 532.7 532.7 Capital redemption reserve 0.2 0.2 Own shares (7.8) (7.8) Other reserves 33 194.1 (80.1) Retained earnings 362.0 345.6 Total shareholders’ equity 1,106.8 816.2 Non-controlling interests in equity 18.7 14.9 Total equity 1,125.5 831.1
D Finch Group Chief Executive
23 February 2017
M Ashley Group Finance Director
Group Balance Sheet At 31 December 2016
Financial Statements
Group Balance Sheet At 31 December 2016
132 National Express Group PLC / Annual Report and Accounts 2016

ANNUAL REPORT AND ACCOUNTS 2016 / NATIONAL EXPRESS GROUP PLC 133
Group Statement of Changes in Equity For the year ended 31 December 2016
Share
capital £m
Share premium account
£m
Capital redemption
reserve £m
Own shares
(note 32) £m
Other reserves (note 33)
£m
Retained earnings
£m Total
£m
Non-controlling
interests £m
Total equity
£m
At 1 January 2016 25.6 532.7 0.2 (7.8) (80.1) 345.6 816.2 14.9 831.1
Shares purchased – – – (7.7) – – (7.7) – (7.7)
Own shares released to satisfy employee share schemes – – – 7.7 – (7.7) – – –
Total comprehensive income – – – – 274.2 79.6 353.8 5.3 359.1
Share-based payments – – – – – 4.1 4.1 – 4.1
Tax on share-based payments – – – – – (0.7) (0.7) – (0.7)
Dividends – – – – – (58.9) (58.9) – (58.9)
Dividends paid to non-controlling interests – – – – – – – (0.9) (0.9)
Payments for equity in non-controlling interests – – – – – – – (0.6) (0.6)
At 31 December 2016 25.6 532.7 0.2 (7.8) 194.1 362.0 1,106.8 18.7 1,125.5
Share capital
£m
Share premium account
£m
Capital redemption
reserve £m
Own shares
(note 32) £m
Other reserves (note 33)
£m
Retained earnings
£m Total
£m
Non-controlling
interests £m
Total equity
£m
At 1 January 2015 25.6 532.7 0.2 (1.5) (32.8) 299.3 823.5 12.7 836.2
Shares purchased – – – (8.5) – – (8.5) – (8.5)
Own shares released to satisfy employee share schemes – – – 2.2 – (2.2) – – –
Total comprehensive income – – – – (47.3) 99.0 51.7 1.5 53.2
Share-based payments – – – – – 3.2 3.2 – 3.2
Tax on share-based payments – – – – – 0.7 0.7 – 0.7
Dividends – – – – – (54.4) (54.4) – (54.4)
Dividends paid to non-controlling interests – – – – – – – (0.1) (0.1)
Contribution from non-controlling interest – – – – – – – 0.8 0.8
At 31 December 2015 25.6 532.7 0.2 (7.8) (80.1) 345.6 816.2 14.9 831.1
ANNUAL REPORT AND ACCOUNTS 2016 / NATIONAL EXPRESS GROUP PLC 133133Annual Report and Accounts 2016 / National Express Group PLC
Group Statement of Changes in Equity For the year ended 31 December 2016

134 NATIONAL EXPRESS GROUP PLC / ANNUAL REPORT AND ACCOUNTS 2016
Financial statements
Group Statement of Cash Flows For the year ended 31 December 2016
Note
2016 £m
2015 £m
Cash generated from operations 37 330.2 264.1
Tax paid (13.6) (11.2)
Net cash flow from operating activities 316.6 252.9
Cash flows from investing activities
Payments to acquire businesses, net of cash acquired 19(a) (58.9) (62.3)
Deferred consideration for businesses acquired and disposed 19(a) (24.4) (0.2)
Proceeds from the disposal of business, net of cash disposed 0.9 –
Purchase of property, plant and equipment (130.3) (107.5)
Proceeds from disposal of property, plant and equipment 14.4 10.2
Payments to acquire intangible assets (6.3) (16.4)
Payments to acquire investments (0.2) (3.5)
Interest received 7.1 5.6
Net cash flow from investing activities (197.7) (174.1)
Cash flows from financing activities
Purchase of own shares (7.7) (8.5)
Interest paid (62.9) (46.7)
Finance lease principal payments (37.9) (25.8)
Increase in borrowings 404.4 45.9
Repayment of borrowings (50.3) (1.6)
Payments for the maturity of foreign currency contracts (46.3) (11.1)
Dividends paid to non-controlling interests (0.9) (0.1)
Payments for equity in non-controlling interests (0.6) –
Contribution from non-controlling interest – 0.8
Dividends paid to shareholders of the Company (58.9) (54.4)
Net cash flow from financing activities 138.9 (101.5)
Increase/(decrease) in cash and cash equivalents 257.8 (22.7)
Opening cash and cash equivalents 60.4 83.7
Increase/(decrease) in cash and cash equivalents 257.8 (22.7)
Foreign exchange 6.2 (0.6)
Closing cash and cash equivalents 324.4 60.4
Cash and cash equivalents in continuing operations 23 318.1 60.4
Cash and cash equivalents classified in assets held for sale 11 6.3 –
Closing cash and cash equivalents 324.4 60.4
Financial Statements
NATIONAL EXPRESS GROUP PLC / ANNUAL REPORT AND ACCOUNTS 2016134134 National Express Group PLC / Annual Report and Accounts 2016
Group Statement of Cash Flows For the year ended 31 December 2016

ANNUAL REPORT AND ACCOUNTS 2016 / NATIONAL EXPRESS GROUP PLC 135
Notes to the Consolidated Accounts For the year ended 31 December 2016
1 Corporate information The Consolidated Financial Statements of National Express Group PLC and its subsidiaries (the ‘Group’) for the year ended 31 December 2016 were authorised for issue in accordance with a resolution of the Directors on 23 February 2017. National Express Group PLC is a public limited company incorporated in England and Wales whose shares are publicly traded on the London Stock Exchange.
The principal activities of the Group are described in the Strategic Report that accompanies these Financial Statements.
2 Accounting policies Statement of compliance These Financial Statements have been prepared in accordance with International Financial Reporting Standards (‘IFRS’) and interpretations of the International Financial Reporting Interpretations Committee (‘IFRIC’) as adopted by the European Union (‘EU’), and with those parts of the Companies Act 2006 applicable to companies reporting under IFRS.
Basis of preparation These Financial Statements have been prepared on the going concern basis (see Group Finance Director’s Review on page 45) under the historical cost convention, except for the recognition of derivative financial instruments and available-for-sale investments.
Prior year figures in the Group Income Statement and related notes have been restated to present separately the amounts relating to operations classified as discontinued in the current year. For details see note 11.
These Financial Statements are presented in pounds Sterling and all values are rounded to the nearest one hundred thousand pounds (£0.1m) except where otherwise indicated.
A summary of the Group’s accounting policies applied in preparing these Financial Statements for the year ended 31 December 2016 is set out below.
Critical accounting judgements and key sources of estimation uncertainty The preparation of Financial Statements in conformity with generally accepted accounting principles requires the use of estimates and assumptions that affect the reported amounts of assets and liabilities at the date of the Financial Statements and the reported amounts of revenues and expenses during the reporting period. Although these estimates are based on management’s best knowledge, actual results may ultimately differ from those estimates.
The estimates and underlying assumptions are reviewed on an ongoing basis. Revisions to accounting estimates are recognised in the period in which the estimate is revised if the revision affects only that period, or in the period of revision and future periods if the revision affects both current and future periods.
i) Critical accounting judgements
Pensions and other post-retirement benefits Determining the amount of the Group’s retirement benefit obligations and the net costs of providing such benefits requires judgements to be made concerning long-term interest rates, inflation, salary and pension increases, investment returns and longevity of current and future pensioners. Changes in these judgements could significantly impact the amount of the obligations or the cost of providing such benefits.
The Group makes assumptions concerning these matters with the assistance of advice from independent qualified actuaries. Details of the assumptions made are set out in note 34 to these Financial Statements.
ii) Key sources of estimation uncertainty
Goodwill impairment Determining whether goodwill is impaired requires an estimation of the value in use of the cash-generating units to which goodwill has been allocated. The value in use calculation requires the Group to make assumptions about perpetual growth rates, estimate the future cash flows expected to arise from the cash-generating unit and determine a suitable discount rate in order to calculate present value. This is materially relevant to the carrying value of goodwill in the Group’s Spain and Morocco and North America divisions. Details of the assumptions used and key sensitivities are set out in note 14 to these Financial Statements.
Insurance and other claims The estimation of the claims provision is based on an assessment of the expected settlement on known claims together with an estimate of settlements that will be made in respect of incidents occurring prior to the Balance Sheet date but for which claims have not been reported to the Group. The Group makes assumptions concerning these judgemental matters with the assistance of advice from independent qualified actuaries. Insurance provisions are disclosed in note 26 to these Financial Statements.
ANNUAL REPORT AND ACCOUNTS 2016 / NATIONAL EXPRESS GROUP PLC 135135Annual Report and Accounts 2016 / National Express Group PLC
Notes to the Consolidated Accounts For the year ended 31 December 2016

136 NATIONAL EXPRESS GROUP PLC / ANNUAL REPORT AND ACCOUNTS 2016
Financial statements
2 Accounting policies continued Basis of consolidation These Consolidated Financial Statements comprise the Financial Statements of National Express Group PLC and all its subsidiaries drawn up to 31 December each year. Adjustments are made to bring any dissimilar accounting policies that may exist into line with the Group’s accounting policies.
On acquisition of a business, the purchase method of accounting is adopted, and the Group Income Statement includes the results of subsidiaries and businesses purchased during the year from the date control is assumed. The purchase consideration is allocated to assets and liabilities on the basis of fair value at the date of acquisition. On the sale of a business, the Group Income Statement includes the results of that business to the date of disposal.
Intra-Group transactions, balances and unrealised gains and losses on transactions between Group companies are eliminated.
Non-controlling interests represent the portion of comprehensive income and equity in subsidiaries that is not attributable to the parent Company shareholders and is presented separately from parent shareholders’ equity in the Consolidated Balance Sheet.
Changes in accounting policies and the adoption of new and revised standards The accounting policies adopted are consistent with those of the previous financial year, except as noted below relating to German Rail revenue recognition, and there have been no changes in accounting standards during the year that have had a material effect on the Group.
Interests in joint ventures The Group has a number of contractual arrangements with other parties to share control of other entities which represent joint ventures. The Group recognises its interest in the entities’ assets and liabilities using the equity method of accounting. The Group Balance Sheet includes the appropriate share of these joint ventures’ net assets or liabilities and the Income Statement includes the appropriate share of their results after tax.
Financial statements of joint ventures are prepared for the same reporting period as the Group. Adjustments are made in the Group’s Financial Statements to eliminate the Group’s share of unrealised gains and losses on transactions between the Group and its joint ventures. The Group ceases to use the equity method from the date it no longer has joint control over the entity.
Interests in associates Companies, other than subsidiaries and joint ventures, in which the Group has an investment representing not less than 20% of the voting rights and over which it exerts significant influence are treated as associates. The Consolidated Financial Statements include the appropriate share of these associates’ results and net assets based on their latest financial statements under the equity method of accounting.
Income Statement presentation The Group Income Statement has been presented in a columnar format to enable users of the Financial Statements to view the normalised results of the Group. Normalised results are defined as the statutory results excluding intangible asset amortisation and tax relief thereon. The Board believes that the normalised result gives a better indication of the underlying performance of the Group.
Revenue recognition Rendering of services Revenue comprises income from road passenger transport, train passenger services and related activities in the UK, North America, Morocco and Europe. Where relevant, amounts are shown net of rebates and sales tax.
Revenue is recognised by reference to the stage of completion of the customer’s travel or services provided under contractual arrangements as a proportion of total services to be provided.
Rail revenue in the UK includes amounts attributed to the train operating companies (‘TOCs’), based principally on agreed models of route usage by Railway Settlement Plan Limited (which administers the income allocation system within the UK rail industry), in respect of passenger receipts. In addition, net franchise agreement receipts from the Department for Transport Rail Division (‘DfT Rail’) and local Passenger Transport Executives are treated as revenue. Net franchise agreement payments to DfT Rail are recognised in operating costs.
Financial Statements
NATIONAL EXPRESS GROUP PLC / ANNUAL REPORT AND ACCOUNTS 2016136136 National Express Group PLC / Annual Report and Accounts 2016
Notes to the Consolidated Accounts continued For the year ended 31 December 2016

ANNUAL REPORT AND ACCOUNTS 2016 / NATIONAL EXPRESS GROUP PLC 137
Notes to the Consolidated Accounts continued For the year ended 31 December 2016
2 Accounting policies continued UK Coach revenue comprises amounts receivable generated from ticket sales. UK Bus and Spain and Morocco revenue comprises amounts receivable generated from ticket sales and revenue generated from services provided on behalf of local transport authorities, which is recognised as the services are provided.
For all the divisions noted above, the relevant share of season ticket or travelcard income is deferred within liabilities and released to the Income Statement over the life of the relevant season ticket or travelcard. North America revenue from school boards and similar contracts is recognised as the services are provided.
On 13 December 2015 the Group commenced operations in German Rail and as a result we have amended our existing revenue recognition policy for this new business. Rail revenue in Germany comprises passenger revenues and subsidy income receivable from the Public Transport Authorities. Passenger revenue, which is allocated between the various transport providers in each region by the tariff authority responsible for that region, is recognised based on passenger counts, tariff authority estimates and historical trends. Subsidy income is recognised over the life of each franchise based on contractual entitlements including, where appropriate, indexation and other adjustments made or expected to be made to the subsidy entitlement. In accordance with IAS 20, the subsidy income recognised in each period reflects a systematic allocation of the total contractual subsidy entitlement, based on the expected profile of the underlying cost base which the subsidy is intended to compensate. Following our first year of operations in Germany we are working with the local transport authorities on clarifying certain aspects of subsidy revenue entitlement. Our revenue policy is to only recognise revenue where these discussions are suitably advanced and where amounts are considered probable.
Rental income Rental income is accounted for on a straight-line basis over the lease term.
Finance income Finance income is recognised using the effective interest method.
Government grants Government grants are recognised in the Income Statement on a systematic basis over the periods in which the Group recognises as expenses the related costs for which the grants are intended to compensate. Specifically, government grants relating to property, plant and equipment are included in liabilities as deferred income and are credited to the Income Statement over the expected useful economic life of the assets concerned.
Segmental reporting Each of the Group’s reportable segments provides services that are subject to risks and returns that are different from those of the other segments. Due to the nature of the Group’s operations the distinct business segments align directly with geographical segments which are operating in separate economic environments.
The Group’s continuing segments comprise: UK Bus; UK Coach; German Rail; North America (operates school bus and transit services); Spain and Morocco (operates bus and coach services); and Central functions. These segments are described in more detail in the Business review accompanying these Financial Statements.
Leases Leases of property, plant and equipment where substantially all the risks and rewards of ownership of the asset have passed to the Group are capitalised in the Balance Sheet as property, plant and equipment. Finance leases are capitalised at the lower of the fair value of the leased property and the present value of the minimum lease payments. The capital element of future obligations under hire purchase contracts and finance leases is included as a liability in the Balance Sheet. The interest element of rental obligations is charged to the Income Statement over the period of the lease and represents a constant proportion of the balance of capital repayments outstanding. Property, plant and equipment acquired under finance leases are depreciated over the shorter of the useful life of the asset or the lease term.
Leases of property, plant and equipment where a significant portion of the risks and rewards of ownership are retained by the lessor are classified as operating leases. Rentals paid under operating leases are charged to the Income Statement on a straight-line basis over the term of the lease. Incentives received under operating leases and initial direct costs in negotiating the lease are amortised to the Income Statement on a straight-line basis over the term of the lease.
All material arrangements and transactions entered into by the Group are reviewed to check whether they contain elements that meet the accounting definition of a lease, although they may not follow the legal form of a lease.
Borrowing costs Borrowing costs are recognised as an expense when incurred except where they are directly attributable to the acquisition, construction or production of a qualifying asset, in which case they are capitalised as part of the cost of that asset.
ANNUAL REPORT AND ACCOUNTS 2016 / NATIONAL EXPRESS GROUP PLC 137137Annual Report and Accounts 2016 / National Express Group PLC

138 NATIONAL EXPRESS GROUP PLC / ANNUAL REPORT AND ACCOUNTS 2016
Financial statements
2 Accounting policies continued Current tax and deferred tax Current tax is provided on taxable profits earned according to the local tax rates applicable where the profits are earned. Income taxes are recognised in the Income Statement unless they relate to an item accounted for in Other Comprehensive Income or Equity, in which case the tax is recognised directly in Other Comprehensive Income or Equity. The tax rates and tax laws used to compute the current tax are those that are enacted or substantively enacted by the Balance Sheet date.
Deferred tax is provided in full in respect of all material temporary differences at the Balance Sheet date between the tax bases of assets and liabilities and their carrying amounts for financial reporting purposes, apart from the following exceptions:
• where the temporary difference arises from the initial recognition of goodwill; • where an asset or liability is recognised in a transaction that is not a business combination and that at the time of the transaction
affects neither accounting nor taxable profit or loss; and • in respect of investment in subsidiaries, associates and joint ventures where the Group is able to control the reversal of the
temporary difference and it is probable that the temporary difference will not reverse in the foreseeable future.
Deferred tax is measured on a non-discounted basis at tax rates that are expected to apply in the periods in which the temporary differences reverse based on tax rates and laws enacted or substantively enacted at the Balance Sheet date.
Deferred tax assets are recognised to the extent that it is considered more likely than not that future taxable profits will be available against which the underlying temporary differences can be deducted. Their carrying amount is reviewed at each Balance Sheet date on the same basis.
Deferred tax assets and liabilities are offset when they relate to income taxes levied by the same taxation authority and when the Group intends to settle its current tax assets and liabilities on a net basis.
Non-current assets held for sale and discontinued operations Non-current assets (or disposal groups) are classified as assets held for sale when their carrying amount is to be recovered principally through a sale transaction and a sale is considered highly probable. They are stated at the lower of carrying amount and fair value less costs to sell.
A discontinued operation is a component of the Group that has been disposed of, or is classified as held for sale and either represents a separate major line of business or geographical area; is part of a plan to dispose of a separate major line of business or geographical area; or was an acquired subsidiary intended for resale.
Discontinued operations are excluded from the results of continuing operations and presented as a single amount after tax. Comparatives are also re-presented to reclassify the operation as discontinued.
Intangible assets Intangible assets acquired separately that meet the recognition criteria of IAS 38 Intangible Assets are capitalised at cost and when acquired in a business combination are capitalised at fair value at the date of acquisition. Following initial recognition, finite life assets are amortised on a straight-line basis and indefinite life assets are not amortised. The amortisation expense is taken to the Income Statement through operating costs.
Finite life intangible assets have a residual value of £nil and are amortised over their estimated useful lives as follows:
Intangible assets with indefinite lives are tested annually for impairment. The useful lives of finite life intangible assets are examined on an annual basis and adjustments, where applicable, are made on a prospective basis. Finite life assets are reviewed for impairment where indicators of impairment exist.
The Group’s only indefinite life intangible asset is goodwill.
Software Computer software that is not integral to an item of property, plant and equipment is recognised separately as an intangible asset and is carried at cost less accumulated amortisation and accumulated impairment losses. Costs include software licences, consulting costs attributable to the development, design and implementation of the computer software and internal costs directly attributable to the development, design and implementation of the computer software. Costs in respect of training are expensed as incurred. Amortisation is calculated using the straight-line method so as to charge the cost of the computer software to the Income Statement over its estimated useful life (three to seven years).
The carrying value of intangibles is reviewed for impairment if events or changes in circumstances indicate that the carrying value may not be recoverable.
Customer contracts – over the life of the contract (between 1 and 33 years)
Contract mobilisation costs – over the life of the franchise (15 years)
Financial Statements
NATIONAL EXPRESS GROUP PLC / ANNUAL REPORT AND ACCOUNTS 2016138138 National Express Group PLC / Annual Report and Accounts 2016
Notes to the Consolidated Accounts continued For the year ended 31 December 2016

ANNUAL REPORT AND ACCOUNTS 2016 / NATIONAL EXPRESS GROUP PLC 139
Notes to the Consolidated Accounts continued For the year ended 31 December 2016
2 Accounting policies continued Goodwill Goodwill on acquisition is initially measured at cost being the excess of the cost of the business combination over the Group’s interest in the net fair value of the identifiable assets, liabilities and contingent liabilities. Following initial recognition, goodwill is stated at historical cost less any accumulated impairment. If an acquisition gives rise to an excess of the acquirer’s interest in the net fair value of the acquiree’s identifiable assets, liabilities and contingent liabilities over cost (previously referred to as negative goodwill), this is credited immediately to the Income Statement.
In accordance with IFRS 3, goodwill is not amortised. All goodwill is subject to an annual test of impairment and an impairment charge recognised as required.
Fair value accounting adjustments are made in respect of acquisitions. Fair value adjustments based on provisional estimates are amended within one year of the acquisition if required, with a corresponding adjustment to goodwill, in order to refine adjustments to reflect further evidence gained post acquisition.
On disposal of a cash generating unit, the attributable amount of goodwill is included in the determination of the profit or loss on disposal.
Property, plant and equipment All property, plant and equipment is stated at historical cost less accumulated depreciation and accumulated impairment losses.
Land and buildings comprise mainly vehicle depots and garages, and offices. Freehold land is not depreciated. Other property, plant and equipment are depreciated on a straight-line basis over their estimated useful lives as follows:
Useful lives and residual values are reviewed annually and adjustments, where applicable, are made on a prospective basis. Repairs and maintenance are charged to the Income Statement during the financial period in which they are incurred.
An item of property, plant and equipment is derecognised upon disposal or when no future economic benefits are expected to arise from the continued use of the asset. Any gain or loss arising on the derecognition of the asset is included in the Income Statement in the period of derecognition.
Impairment of non-financial assets All non-current assets are reviewed for impairment whenever events or changes in circumstances indicate that the carrying amount may not be recoverable, except for indefinite life intangible assets and goodwill which are reviewed annually. An impairment loss is recognised for the amount by which the carrying amount of the asset exceeds its recoverable amount which is the higher of an asset’s fair value less costs to sell and its value in use. For the purposes of assessing impairment, assets are grouped at the lowest level for which there are separately identifiable cash inflows.
In assessing value in use, the estimated risk adjusted future cash flows are discounted to their present value using a pre-tax discount rate that reflects current market assessments of the time value of money. Impairment losses are recognised in the Income Statement in expense categories consistent with the function of the impaired asset.
Except for goodwill impairments, a review is made at each reporting date of any previous impairment losses to assess whether they no longer exist or may have decreased. If such indication exists, the asset’s recoverable amount is estimated and any previously recognised impairment loss is reversed only if there has been a change in the estimates used to assess the recoverable amount since the last impairment loss was recognised. If that is the case the carrying amount of the asset is increased, subject to a limit of the asset’s net book value had no previous impairment loss been recognised. Such reversal is recognised in the Income Statement. Future depreciation or amortisation is then adjusted to allocate the asset’s revised carrying amount over its remaining useful economic life. Impairments to goodwill cannot be reversed.
Freehold buildings – 30 to 50 years
Long leasehold property improvements
– 15 to 40 years
Public service vehicles – 8 to 16 years
Plant and equipment, fixtures and fittings
– 3 to 15 years
ANNUAL REPORT AND ACCOUNTS 2016 / NATIONAL EXPRESS GROUP PLC 139139Annual Report and Accounts 2016 / National Express Group PLC

140 NATIONAL EXPRESS GROUP PLC / ANNUAL REPORT AND ACCOUNTS 2016
Financial statements
2 Accounting policies continued Financial instruments The Group determines the classification of its financial instruments at initial recognition. The Group classifies its financial assets in the following categories: at fair value through profit or loss; loans and receivables; and available-for-sale. The classification depends on the purpose for which the financial assets were acquired.
Financial assets at fair value through profit or loss Financial assets at fair value through profit or loss are financial assets held for trading. A financial asset is classified in this category if acquired principally for the purpose of selling in the short term. Derivatives are also categorised as held for trading unless they are designated as hedges. Assets in this category are classified as current assets.
Financial assets at fair value through profit or loss are initially recognised at fair value, and transaction costs are expensed in the Income Statement. Gains or losses arising from changes in the fair value of the ‘financial assets at fair value through profit or loss’ category are presented in the Income Statement within finance costs in the period in which they arise.
Loans and receivables Loans and receivables are non-derivative financial assets with fixed or determinable payments that are not quoted in an active market. They are included in current assets, except for maturities greater than 12 months after the Balance Sheet date which are classified as non-current assets. The Group’s loans and receivables comprise ‘trade and other receivables’ and ‘cash and cash equivalents’ in the Balance Sheet.
Available-for-sale financial assets Available-for-sale financial assets are non-derivatives that are either designated in this category or not classified in any of the other categories. They are included in non-current assets unless management intends to dispose of the investment within 12 months of the Balance Sheet date.
The Group’s investments in entities that are not subsidiaries, associates or joint ventures are classified as available-for-sale financial assets. After initial recognition these assets are measured at fair value with gains or losses being recognised as a separate component of equity until the investment is derecognised or the investment is determined to be impaired, at which time the previously reported cumulative gain or loss is included in the Income Statement. Where there is no active market for the Group’s investments, fair value is determined using valuation techniques including recent commercial transactions and discounted cash flow analyses. In the absence of any other reliable external information, assets are carried at cost or amortised cost as appropriate.
The Group assesses at each Balance Sheet date whether there is objective evidence that a financial asset or a group of financial assets is impaired. In the case of equity securities classified as available for sale, a significant or prolonged decline in the fair value of the security below its cost is considered as an indicator that the securities are impaired. If any such evidence exists for available-for-sale financial assets, the cumulative loss – measured as the difference between the acquisition cost and the current fair value, less any impairment loss on that financial asset previously recognised in profit or loss – is removed from equity and recognised in the Income Statement. Impairment losses recognised in the Income Statement on equity instruments are not reversed through the Income Statement.
Financial liabilities When a financial liability is recognised initially, the Group measures it at its fair value. Financial liabilities include trade payables, accruals, other payables, borrowings and derivative financial instruments. In the case of a financial liability not at fair value through profit or loss, an adjustment is made for transaction costs that are directly attributable to the issue of the financial liability. Subsequent measurement depends on its classification as follows:
Financial liabilities at fair value through profit or loss Financial liabilities classified as held for trading and derivative liabilities that are not designated as effective hedging instruments are classified as financial liabilities at fair value through profit or loss. These liabilities are carried on the Balance Sheet at fair value with gains or losses being recognised in the Income Statement.
Other All other financial liabilities not classified as fair value through profit or loss are measured at amortised cost using the effective interest method.
Financial Statements
NATIONAL EXPRESS GROUP PLC / ANNUAL REPORT AND ACCOUNTS 2016140140 National Express Group PLC / Annual Report and Accounts 2016
Notes to the Consolidated Accounts continued For the year ended 31 December 2016

ANNUAL REPORT AND ACCOUNTS 2016 / NATIONAL EXPRESS GROUP PLC 141
Notes to the Consolidated Accounts continued For the year ended 31 December 2016
2 Accounting policies continued Derivative financial instruments The Group uses derivative financial instruments such as fuel derivatives, interest rate derivatives, foreign currency forward exchange contracts and cross currency swaps to hedge its risks associated with fuel price, interest rate fluctuations and foreign currency. Such derivative financial instruments are initially recognised at fair value and subsequently remeasured to fair value for the reported Balance Sheet. The fair value of the derivatives is calculated by reference to market exchange rates, interest rates and fuel prices at the period end.
The Group’s fuel derivatives are designated as cash flow hedges. The gain or loss on the hedging instrument that is determined to be an effective hedge is recognised in equity, with any material ineffective portion recognised in the Income Statement. The gains or losses deferred in equity in this way are recycled through the Income Statement in the same period in which the hedged underlying transaction or firm commitment is recognised in the Income Statement.
The Group’s interest rate derivatives are designated as fair value hedges. The gain or loss on the hedging instrument is recognised immediately in the Income Statement. The carrying amount of the hedged item is adjusted through the Income Statement for the gain or loss on the hedged item attributable to the hedged risk, in this case movements in the risk free interest rate.
Foreign currency derivatives and cross currency swaps are used to hedge the Group’s net investment in foreign currency denominated operations and to the extent they are designated and effective as net investment hedges are matched in equity against foreign exchange exposure in the related assets and liabilities. Gains and losses accumulated in equity are included in the Income Statement when the foreign operation is partially disposed of or sold.
The Group also uses foreign currency forward contracts to hedge certain transactional exposures. These contracts are not hedge accounted and all gains and losses are taken directly to the Income Statement.
For derivatives that do not qualify for hedge accounting, gains or losses are taken directly to the Income Statement in the period.
Hedge accounting is discontinued when the hedging instrument expires, is sold, terminated, exercised, or no longer qualifies for hedge accounting.
Inventories Inventories are valued at the lower of cost and net realisable value on a first in-first out basis, after making due allowance for obsolete or slow moving items.
Contract mobilisation costs Costs associated with securing new rail franchises and other significant non-rail contracts are expensed as incurred up to the point when a bid is awarded. From this point in time, appropriate costs are recognised as an asset and are expensed to the Income Statement over the life of the contract. Costs associated with the commencement of all other new contracts are expensed as incurred.
Trade and other receivables Trade and other receivables are recognised and carried at original invoice amount less an allowance for any uncollectable amounts. Doubtful debts are provided for when collection of the full amount is no longer probable, whilst bad debts are written off when identified.
Cash and cash equivalents Cash and cash equivalents as defined for the Statement of Cash Flows comprise cash in hand, cash held at bank with immediate access, other short-term investments and bank deposits with maturities of three months or less from the date of inception, and bank overdrafts. In the Consolidated Balance Sheet, cash includes cash and cash equivalents excluding bank overdrafts. Bank overdrafts that have no legal right of set-off against cash and cash equivalents are included within borrowings in current liabilities.
Trade and other payables Trade payables are recognised initially at fair value and subsequently measured at amortised cost using the effective interest method.
Interest-bearing borrowings All loans and borrowings are initially recognised at cost being the net fair value of the consideration received plus transaction costs that are directly attributable to the issue of the financial asset or liability. After initial recognition, interest-bearing loans and borrowings are subsequently measured at amortised cost using the effective interest method.
ANNUAL REPORT AND ACCOUNTS 2016 / NATIONAL EXPRESS GROUP PLC 141141Annual Report and Accounts 2016 / National Express Group PLC

142 NATIONAL EXPRESS GROUP PLC / ANNUAL REPORT AND ACCOUNTS 2016
Financial statements
2 Accounting policies continued Insurance The Group’s policy is to self-insure high frequency claims within the businesses. To provide protection above these types of losses, the Group purchases insurance cover from a selection of proven and financially strong insurers. The insurance provision is based on estimated exposures at the year end principally for claims arising in the UK and North America prior to the year end date, subject to the overall deductible within the Group’s insurance arrangements. The majority of provisions will be utilised within five years, and the provisions have been discounted to take account of the expected timing of future cash settlements.
Pensions and other post-employment benefits The Group has a number of pension schemes, both of a defined benefit and defined contribution nature. Full details are provided in note 34.
The Balance Sheet position in respect of defined benefit schemes comprises the net of the present value of the relevant defined benefit obligation at the Balance Sheet date and the fair value of plan assets. Recognition of a net asset is limited so that it does not exceed the economic benefits available in the form of refunds from the scheme or reductions in future contributions to the scheme. The trustees complete a full actuarial valuation triennially, separately for each plan, but the obligation is updated annually for financial reporting purposes by independent actuaries, using the projected unit credit method. The present value of the obligation is determined by the estimated future cash outflows discounted using interest rates of high quality corporate bonds which have terms to maturity equivalent to the terms of the related liability.
The current service cost and gains and losses on settlements and curtailments are recognised in staff pension costs within operating costs in the Income Statement. Past service costs are included in operating costs where the benefits have vested, otherwise they are amortised on a straight-line basis over the vesting period. Net interest is calculated by applying a discount rate to the net defined benefit liability or asset and is recognised within finance costs. Actuarial gains and losses arising from experience adjustments and changes in actuarial assumptions are charged or credited to Other Comprehensive Income in the period in which they arise.
Our UK TOCs participate in the Railways Pension Scheme (‘RPS’), a defined benefit scheme which covers the whole of the UK rail industry. This is partitioned into sections and the Group is responsible for the funding of these sections whilst it operates the relevant franchise. In contrast to the pension schemes operated by most businesses, the RPS is a shared cost scheme, which means that costs are formally shared 60% by the employer and 40% by the employee. A liability is recognised in line with other defined benefit schemes in the Group, although this is offset by a franchise adjustment so that the net liability represents the deficit that the Group expects to fund during the franchise term.
The charges in respect of defined contribution schemes are recognised when they are due. The Group has no legal or constructive obligation to pay further contributions into a defined contribution scheme if the fund has insufficient assets to pay all employees benefits relating to employee service in the current and prior periods.
Share-based payment The Group awards equity-settled share-based payments to certain employees, under which the Group receives services from employees as consideration for equity instruments (options) of the Group. The fair value of the employee services received in exchange for the grant of the options is recognised as an expense. The total amount to be expensed is determined by reference to the fair value of the options granted, excluding the impact of any non-market service and performance vesting conditions (for example profitability, sales growth targets and remaining an employee of the entity over a specified time period). Non-market vesting conditions are included in assumptions about the number of options that are expected to vest. The total amount expensed is recognised over the vesting period, which is the period over which all of the specified vesting conditions are to be satisfied. At each Balance Sheet date, the entity revises its estimates of the number of options that are expected to vest based on the non-market vesting conditions. It recognises the impact of the revision to original estimates, if any, in the Income Statement, with a corresponding adjustment to equity.
Provisions Provisions are recognised when the Group has a present legal or constructive obligation as a result of past events, it is probable that an outflow of resources will be required to settle the obligation, and a reliable estimate of the amount can be made. Provisions are measured at the Directors’ best estimate of the expenditure required to settle the obligation at the Balance Sheet date, and are discounted to present value where the effect is material using a pre-tax discount rate. The amortisation of the discount is recognised as a finance cost.
Contingent liabilities are obligations that arise from past events that are dependent on future events. They are disclosed in the notes to the Financial Statements where the expected future outflow is not probable.
Financial Statements
NATIONAL EXPRESS GROUP PLC / ANNUAL REPORT AND ACCOUNTS 2016142142 National Express Group PLC / Annual Report and Accounts 2016
Notes to the Consolidated Accounts continued For the year ended 31 December 2016

ANNUAL REPORT AND ACCOUNTS 2016 / NATIONAL EXPRESS GROUP PLC 143
Notes to the Consolidated Accounts continued For the year ended 31 December 2016
2 Accounting policies continued Share capital, share premium and dividends Where either the Company or employee share trusts purchase the Company’s equity share capital, the consideration paid, including any transaction costs, is deducted from total shareholders’ equity as own shares until they are cancelled or re-issued. Any consideration subsequently received on sale or re-issue is included in shareholders’ equity.
Dividend distributions to the Company’s shareholders are recognised as a liability in the Group’s Financial Statements on the date when dividends are approved by the Company’s shareholders. Interim dividends are recognised in the period they are paid.
Foreign currencies The trading results of foreign currency denominated subsidiaries, joint ventures and associates are translated into Sterling, the presentation currency of the Group and functional currency of the parent, using average rates of exchange for the year as a reasonable approximation to actual exchange rates at the dates of transactions.
The balance sheets of foreign currency denominated subsidiaries, joint ventures and associates are translated into Sterling at the rates of exchange ruling at the year end and exchange differences arising are taken directly to the translation reserve in equity. On disposal of a foreign currency denominated subsidiary, the deferred cumulative amount recognised in the translation reserve (since 1 January 2004 under the transitional rules of IFRS 1) relating to that entity is recognised in the Income Statement. All other translation differences are taken to the Income Statement, with the exception of differences on foreign currency borrowings and forward foreign currency contracts which are used to provide a hedge against the Group net investments in foreign enterprises. These are taken directly to equity until the disposal of the net investment, at which time they are recognised in the Income Statement.
New standards and interpretations not applied At the date of authorisation of these Financial Statements, the Group has not applied the following Standards that have been issued but are not yet effective and, for IFRS 15 and IFRS 16, have not yet been adopted by the EU:
IFRS 9 Financial Instruments – effective for periods beginning on or after 1 January 2018. The standard deals with the classification, recognition and measurement of financial assets and liabilities.
IFRS 15 Revenue from Contracts with Customers – effective for periods beginning on or after 1 January 2017. The standard establishes the principles for reporting the nature, amount, timing and uncertainty of revenue and cash flows arising from contracts with customers.
IFRS 16 Leases – effective for periods beginning on or after 1 January 2019. The standard sets out the principles for the recognition, measurement, presentation and disclosure of leases.
The Directors have assessed the following: IFRS 9 may impact both the measurement and disclosures of the Group’s financial instruments. IFRS 15 will not have a significant impact on future financial statements. IFRS 16 is expected to result in a material increase to both the assets and liabilities of the Group and may also impact the timing of recognition of operating and finance costs.
A full assessment of the impact of these new standards is in progress. Beyond the information above, it is not practicable to provide a reasonable estimate of their effect until the review has been completed.
In addition to the above, there have been a number of revisions to existing standards issued that are also not yet effective. These revisions are not likely to have a significant impact on future financial statements.
3 Revenue
2016 £m
(restated) 2015 £m
Rendering of services 2,096.2 1,752.6
Government grants 6.1 –
Rental income 1.4 1.2
Revenue 2,103.7 1,753.8
Finance income 7.5 5.9
Total revenue from continuing operations 2,111.2 1,759.7
ANNUAL REPORT AND ACCOUNTS 2016 / NATIONAL EXPRESS GROUP PLC 143143Annual Report and Accounts 2016 / National Express Group PLC

144 NATIONAL EXPRESS GROUP PLC / ANNUAL REPORT AND ACCOUNTS 2016
Financial statements
4 Exchange rates The most significant exchange rates to UK Sterling for the Group are as follows:
If the results for the year to 31 December 2015 had been retranslated at the average exchange rates for the year to 31 December 2016, North America would have achieved normalised operating profit of £75.1m on revenue of £767.7m, compared with normalised operating profit of £66.8m on revenue of £683.2m as reported, and Spain and Morocco would have achieved a normalised operating profit of £80.5m on revenue of £565.1m, compared with normalised operating profit of £71.5m on revenue of £502.2m as reported.
5 Segmental analysis The operating businesses are organised and managed separately according to the nature of the public transport services they provide. The geographical markets they operate in match the nature of public transport services provided. Commentary on the segments is included in the Strategic Report.
The results of the UK Rail division have been excluded from the segmental analysis below as it has been classified as a discontinued operation.
Revenue is analysed by reportable segment as follows:
Inter-segment sales in UK Bus represent the provision of coach services on a small number of routes to UK Coach and internal commission on ticket sales. Inter-segment sales in UK Coach represent rail replacement services provided to Rail. Inter-segment trading is undertaken on standard arm’s length commercial terms. Due to the nature of the Group’s businesses, the origin and destination of revenue is the same. No single external customer amounts to 10% or more of the total revenue.
2016
Closing rate 2016
Average rate 2015
Closing rate 2015
Average rate
US Dollar 1.23 1.36 1.47 1.53
Canadian Dollar 1.66 1.80 2.04 1.95
Euro 1.17 1.22 1.36 1.38
External revenue
2016 £m
Inter- segment
sales 2016
£m
Segment revenue
2016 £m
External revenue
(restated) 2015
£m
Inter- segment
sales 2015 £m
Segment revenue
(restated) 2015
£m
UK Bus 285.4 1.4 286.8 285.1 1.3 286.4
UK Coach 282.5 0.3 282.8 280.9 0.3 281.2
German Rail 61.3 – 61.3 2.4 – 2.4
Spain and Morocco 597.3 – 597.3 502.2 – 502.2
North America 877.2 – 877.2 683.2 – 683.2
Inter-segment sales elimination – (1.7) (1.7) – (1.6) (1.6)
Total revenue 2,103.7 – 2,103.7 1,753.8 – 1,753.8
Financial Statements
NATIONAL EXPRESS GROUP PLC / ANNUAL REPORT AND ACCOUNTS 2016144144 National Express Group PLC / Annual Report and Accounts 2016
Notes to the Consolidated Accounts continued For the year ended 31 December 2016

ANNUAL REPORT AND ACCOUNTS 2016 / NATIONAL EXPRESS GROUP PLC 145
5 Segmental analysis continued Operating profit is analysed by reportable segment as follows:
Depreciation is analysed by reportable segment as follows:
Normalised operating
profit 2016
£m
Intangible amortisation
2016 £m
Segment result 2016
£m
Normalised operating profit
(restated) 2015
£m
Intangible amortisation
2015 £m
Segment result
(restated) 2015
£m
UK Bus 35.5 – 35.5 37.5 – 37.5
UK Coach 33.3 (0.4) 32.9 32.3 (0.5) 31.8
German Rail (1.5) (0.8) (2.3) (0.1) – (0.1)
Spain and Morocco 84.7 (9.5) 75.2 71.5 (9.9) 61.6
North America 84.0 (23.0) 61.0 66.8 (15.2) 51.6
Central functions (17.0) (0.1) (17.1) (16.2) (0.1) (16.3)
Operating profit from continuing operations 219.0 (33.8) 185.2 191.8 (25.7) 166.1
Share of results from associates and joint ventures 1.1 1.8
Net finance costs (50.0) (45.2)
Profit before tax 136.3 122.7
Tax charge (20.2) (15.0)
Profit after tax for the year from continuing operations 116.1 107.7
Profit for the year from discontinued operations 3.9 1.4
Profit for the year 120.0 109.1
2016
£m
(restated) 2015
£m
UK Bus 17.1 15.7
UK Coach 2.9 3.7
German Rail 0.1 –
Spain and Morocco 35.7 31.4
North America 65.9 52.2
Central functions 0.8 0.7
Total 122.5 103.7
ANNUAL REPORT AND ACCOUNTS 2016 / NATIONAL EXPRESS GROUP PLC 145145Annual Report and Accounts 2016 / National Express Group PLC

146 NATIONAL EXPRESS GROUP PLC / ANNUAL REPORT AND ACCOUNTS 2016
Financial statements
Notes to the Consolidated Accounts continued For the year ended 31 December 2016
5 Segmental analysis continued Assets, liabilities and capital expenditure are analysed by reportable segment as follows:
1 Non-current assets only include intangible assets, property, plant and equipment. 2 The net capital expenditure, after allowing for finance lease additions, disposal of fixed assets and payments to acquire intangibles, was £161.7m (2015: £148.1m). 3 In 2016, this comprises only German Rail.
Capital expenditure comprises property, plant and equipment additions as disclosed above and in note 15. In 2016, software intangible assets of £3.9m (2015: £6.2m) were acquired as disclosed in note 14.
Unallocated assets and liabilities comprise the following items:
Assets 2016
£m
Of which non-
current assets1
2016 £m
Liabilities 2016
£m
Capital2
expenditure 2016
£m
Assets 2015
£m
Of which non-current
assets1
2015 £m
Liabilities 2015
£m
Capital2
expenditure 2015
£m
UK Bus 191.1 174.9 (210.1) 31.8 177.3 158.9 (157.5) 30.0
UK Coach 63.4 38.5 (53.3) 7.3 58.3 35.1 (47.8) 3.9
Rail3 42.1 14.2 (8.4) 0.2 53.7 19.7 (50.3) 8.5
Spain and Morocco 1,246.4 1,127.9 (243.4) 48.7 1,052.0 951.2 (210.9) 27.4
North America 1,328.5 1,163.0 (472.4) 32.8 972.6 859.3 (265.9) 36.1
Central functions 85.3 13.7 (61.3) 0.8 59.9 7.6 (55.3) 1.6
Unallocated 421.1 – (1,221.4) – 124.8 – (879.8) –
Intercompany elimination (21.0) – 21.0 – (14.1) – 14.1 –
3,356.9 2,532.2 (2,249.3) 121.6 2,484.5 2,031.8 (1,653.4) 107.5
Assets and liabilities held for sale (note 11) 78.0 – (60.1) 8.7 – – – –
Total 3,434.9 2,532.2 (2,309.4) 130.3 2,484.5 2,031.8 (1,653,4) 107.5
Unallocated assets
2016 £m
Unallocated liabilities
2016 £m
Unallocated assets 2015
£m
Unallocated liabilities
2015 £m
Cash and cash equivalents 318.1 – 60.4 –
Other debt receivables 0.5 – 0.8 –
Current tax 2.3 (6.7) 1.4 (16.1)
Available-for-sale investments 7.8 – 6.5 –
Derivative financial assets/(liabilities) 44.1 (30.2) 24.6 (85.6)
Borrowings, excluding finance leases – (1,101.0) – (723.8)
Dividends payable – (0.6) – (0.5)
Deferred tax 48.3 (82.9) 31.1 (53.8)
Total 421.1 (1,221.4) 124.8 (879.8)
Financial Statements
NATIONAL EXPRESS GROUP PLC / ANNUAL REPORT AND ACCOUNTS 2016146146 National Express Group PLC / Annual Report and Accounts 2016
Notes to the Consolidated Accounts continued For the year ended 31 December 2016

ANNUAL REPORT AND ACCOUNTS 2016 / NATIONAL EXPRESS GROUP PLC 147
6 Operating costs
An analysis of fees paid to the Group’s auditor is provided below:
2016
£m
(restated) 2015
£m
Cost of inventories recognised in expense 72.1 59.7
Staff costs 1,020.7 842.5
Depreciation – Owned assets 101.4 85.8
– Leased assets 21.0 17.9
Amortisation of fixed asset grants (0.5) (0.6)
Operating lease charges Rolling stock: non-capital element 11.7 0.5
Public service vehicles 11.9 10.5
Other 11.4 9.5
– Plant and equipment 35.0 20.5
– Land and buildings 23.9 19.4
Foreign exchange differences (0.1) (0.1)
Other charges 611.2 516.9
Operating costs before intangible asset amortisation 1,884.7 1,562.0
Intangible asset amortisation 33.8 25.7
Total operating costs 1,918.5 1,587.7
2016
£m 2015
£m
Fees payable to the Company’s auditor for the audit of the consolidated and parent Company accounts 0.3 0.3
Fees payable to the Company’s auditor and its associates for other services:
The audit of the Company’s subsidiaries 0.8 0.7
Other services 0.2 0.2
1.3 1.2
ANNUAL REPORT AND ACCOUNTS 2016 / NATIONAL EXPRESS GROUP PLC 147147Annual Report and Accounts 2016 / National Express Group PLC

148 NATIONAL EXPRESS GROUP PLC / ANNUAL REPORT AND ACCOUNTS 2016
Financial statements
7 Employee benefit costs (a) Staff costs
The average number of employees, including Executive Directors, during the year was as follows:
Included in the above costs are the following costs related to the Group’s key management personnel who comprise the Directors of the parent Company:
(b) Share schemes Details of options or awards outstanding as at 31 December 2016 under the Group’s share schemes are as follows:
2016
£m
(restated) 2015
£m
Wages and salaries 887.5 729.8
Social security costs 122.0 101.7
Pension costs (note 34) 7.4 8.2
Share-based payment (note 8) 3.8 2.8
1,020.7 842.5
2016 2015
Managerial and administrative 4,237 4,078
Operational 40,740 38,544
44,977 42,622
2016
£m 2015
£m
Basic salaries 0.9 0.8
Benefits 0.3 0.4
Performance-related bonuses 1.4 0.9
Share-based payment 1.5 1.2
4.1 3.3
Number of share options
2016
Number of share options
2015
Exercise
price Future exercise
periods
Long-Term Incentive Plan 7,444,991 8,539,637 nil 2017-2020
Deferred Annual Share Bonus Plan – 117,510 nil –
WMT Long Service Option Scheme 215,367 266,592 129p-599p 2017-2026
Executive Deferred Bonus Plan 169,828 76,643 nil 2017
7,830,186 9,000,382
Financial Statements
NATIONAL EXPRESS GROUP PLC / ANNUAL REPORT AND ACCOUNTS 2016148148 National Express Group PLC / Annual Report and Accounts 2016
Notes to the Consolidated Accounts continued For the year ended 31 December 2016

ANNUAL REPORT AND ACCOUNTS 2016 / NATIONAL EXPRESS GROUP PLC 149
7 Employee benefit costs continued (b) Share schemes continued (i) Long-Term Incentive Plan (‘LTIP’) The LTIP was introduced in 2005 on the recommendation of the Remuneration Committee to replace the annual award under the Executive Share Option Plan to Executive Directors and to certain senior employees. Under the LTIP, a Performance Award to acquire a specified number of free shares may be made to the employee or Director. In addition, a Matching Award may be made, as described in (ii) below. Performance conditions are attached to the vesting of Performance and Matching Awards based on the achievement of target growth in earnings per share (‘EPS’), return on capital employed (‘ROCE’) and the relative total shareholder return (‘TSR’) of the Company against a comparator group of companies. If the performance conditions are met, Performance and Matching Awards vest on the third anniversary of the grant date and remain exercisable for a period of up to six months following the vesting date. There are no cash settlement alternatives at present.
Since 2011, HMRC approved share option plans were added as an appendix to the LTIP (‘Approved Plan’). A participant can only hold an option under the Approved Plan over shares with a market value of up to £30,000 at the grant date. Options under the Approved Plan are granted in tandem with the usual options under the LTIP. The options are structured such that on exercise, the proportion of the gain in respect of the first £30,000 worth of shares (as measured at the date of grant) will be delivered under the Approved Plan and the LTIP option shall be scaled back to deliver the remaining gross gain that would have been delivered had the option been granted alone. The excess shares under the LTIP will be forfeited such that both awards will never become fully vested.
From 2012 to 2014, a supplementary five-year long-term incentive award was granted to the Chief Executive subject to targets linked to the Group’s five-year plan. This comprised a Performance Award (with no matching element). If performance conditions are met, the Performance Award will vest on the fifth anniversary of the grant date and remain exercisable for a period of up to 12 months following the vesting date. There are no cash settlement alternatives at present.
(ii) Deferred Annual Share Bonus Plan The Deferred Annual Share Bonus Plan is a discretionary scheme which forms part of the bonus arrangements for certain senior employees. Under the scheme, part of any bonus may be received in cash whilst the remainder is used to make an award of nil cost options which vest three years after the award date. There are no cash settlement alternatives at present.
(iii) West Midlands Travel Ltd (‘WMT’) Long Service Option Scheme The WMT Long Service Option Scheme utilises a fixed amount of shares set aside for this purpose following the acquisition of WMT in 1995 and is open to all WMT employees who have been in service for more than 25 years. The options are exercisable between three and ten years following the grant date. There are no cash settlement alternatives.
(iv) TWM Share Incentive Plan (the ‘SIP’) The TWM SIP exists for the benefit of WMT employees. At the end of the year, 1,079 (2015: 1,079) National Express Group PLC shares were held for the benefit of the Trustee. Dividends on shares held in the SIP forfeited shares account are waived. There are no cash settlement alternatives.
(v) Executive Deferred Bonus Plan As detailed in the Directors’ Remuneration Report, the Committee considered it appropriate for bonuses awarded in respect of the calendar year to be deferred for a period of one year and that these would vest, subject to the terms of the award and the relevant Director’s continuing employment. The deferred forfeitable ordinary shares are awarded under the terms of the National Express Group Executive Deferred Bonus Plan which was adopted by the Board of the Company on 10 March 2009.
The principal terms of awards under the Executive Deferred Bonus Plan are summarised below:
• Awards under the Plan may be cash awards, conditional awards or forfeitable shares awards • Awards normally vest one year from the date of grant, subject to the relevant Director’s continued employment with
the Company • The Committee may decide that participants shall be entitled to receive a benefit determined by reference to the value of the
dividends that would have been paid on the vested shares in respect of dividend record dates occurring during the period between the grant date and the date of vesting
• The awards will normally lapse on cessation of employment save in certain compassionate ‘good leaver’ circumstances (eg death or disability)
In the event of a variation of the share capital of the Company, the Committee may make such adjustments to the awards as it considers appropriate.
ANNUAL REPORT AND ACCOUNTS 2016 / NATIONAL EXPRESS GROUP PLC 149149Annual Report and Accounts 2016 / National Express Group PLC

150 NATIONAL EXPRESS GROUP PLC / ANNUAL REPORT AND ACCOUNTS 2016
Financial statements
Notes to the Consolidated Accounts continued For the year ended 31 December 2016
8 Share-based payments The charge in respect of share-based payment transactions included in the Group’s Income Statement for the year is as follows:
During the year ended 31 December 2016, the Group had five share-based payment arrangements, which are described in note 7(b).
For the following disclosure, share options with a nil exercise price have been disclosed separately to avoid distorting the weighted average exercise prices. The number of share options in existence during the year was as follows:
2016
£m
(restated) 2015
£m
Expense arising from share and share option plans – continuing operations 3.8 2.8
2016 2015
Number of share options
Weighted average exercise
price p
Number of share options
Weighted average exercise
price p
Options without a nil exercise price:
At 1 January 266,592 359 258,525 379
Granted during the year 24,462 329 71,773 295
Forfeited during the year (8,537) 299 (11,867) 333
Exercised during the year (7,119) 253 (14,363) 173
Expired during the year (60,031) 497 (37,476) 458
Outstanding at 31 December 215,367 323 266,592 359
Exercisable at 31 December 97,957 352 152,408 413
Options with a nil exercise price:
At 1 January 8,733,790 nil 11,036,521 nil
Granted during the year 2,244,630 nil 2,338,019 nil
Forfeited during the year (185,626) nil (1,646,181) nil
Exercised during the year (2,415,519) nil (809,666) nil
Expired during the year (762,456) nil (2,184,903) nil
Outstanding at 31 December 7,614,819 nil 8,733,790 nil
Exercisable at 31 December – nil 117,510 nil
Total outstanding at 31 December 7,830,186 9,000,382
Total exercisable at 31 December 97,957 269,918
Financial Statements
NATIONAL EXPRESS GROUP PLC / ANNUAL REPORT AND ACCOUNTS 2016150150 National Express Group PLC / Annual Report and Accounts 2016
Notes to the Consolidated Accounts continued For the year ended 31 December 2016
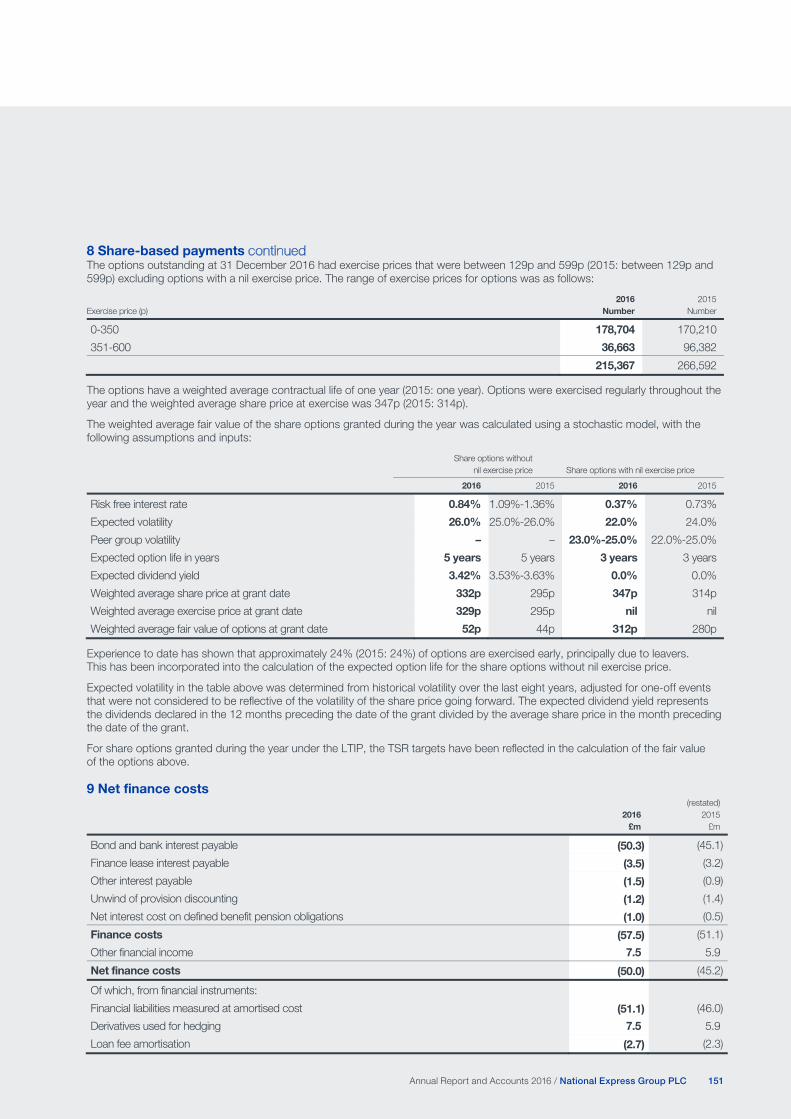
ANNUAL REPORT AND ACCOUNTS 2016 / NATIONAL EXPRESS GROUP PLC 151
8 Share-based payments continued The options outstanding at 31 December 2016 had exercise prices that were between 129p and 599p (2015: between 129p and 599p) excluding options with a nil exercise price. The range of exercise prices for options was as follows:
The options have a weighted average contractual life of one year (2015: one year). Options were exercised regularly throughout the year and the weighted average share price at exercise was 347p (2015: 314p).
The weighted average fair value of the share options granted during the year was calculated using a stochastic model, with the following assumptions and inputs:
Experience to date has shown that approximately 24% (2015: 24%) of options are exercised early, principally due to leavers. This has been incorporated into the calculation of the expected option life for the share options without nil exercise price.
Expected volatility in the table above was determined from historical volatility over the last eight years, adjusted for one-off events that were not considered to be reflective of the volatility of the share price going forward. The expected dividend yield represents the dividends declared in the 12 months preceding the date of the grant divided by the average share price in the month preceding the date of the grant.
For share options granted during the year under the LTIP, the TSR targets have been reflected in the calculation of the fair value of the options above.
9 Net finance costs
Exercise price (p) 2016
Number 2015
Number
0-350 178,704 170,210
351-600 36,663 96,382
215,367 266,592
Share options without
nil exercise price Share options with nil exercise price
2016 2015 2016 2015
Risk free interest rate 0.84% 1.09%-1.36% 0.37% 0.73%
Expected volatility 26.0% 25.0%-26.0% 22.0% 24.0%
Peer group volatility – – 23.0%-25.0% 22.0%-25.0%
Expected option life in years 5 years 5 years 3 years 3 years
Expected dividend yield 3.42% 3.53%-3.63% 0.0% 0.0%
Weighted average share price at grant date 332p 295p 347p 314p
Weighted average exercise price at grant date 329p 295p nil nil
Weighted average fair value of options at grant date 52p 44p 312p 280p
2016 £m
(restated) 2015
£m
Bond and bank interest payable (50.3) (45.1)
Finance lease interest payable (3.5) (3.2)
Other interest payable (1.5) (0.9)
Unwind of provision discounting (1.2) (1.4)
Net interest cost on defined benefit pension obligations (1.0) (0.5)
Finance costs (57.5) (51.1)
Other financial income 7.5 5.9
Net finance costs (50.0) (45.2)
Of which, from financial instruments:
Financial liabilities measured at amortised cost (51.1) (46.0)
Derivatives used for hedging 7.5 5.9
Loan fee amortisation (2.7) (2.3)
ANNUAL REPORT AND ACCOUNTS 2016 / NATIONAL EXPRESS GROUP PLC 151151Annual Report and Accounts 2016 / National Express Group PLC

152 NATIONAL EXPRESS GROUP PLC / ANNUAL REPORT AND ACCOUNTS 2016
Financial statements
Notes to the Consolidated Accounts continued For the year ended 31 December 2016
10 Taxation (a) Analysis of taxation charge in the year
The prior year adjustments within current taxation relate primarily to the release of tax provisions of £7.3m (2015: £7.5m).
(b) Tax on items recognised in Other Comprehensive Income or Equity
2016 £m
2015 £m
Current taxation:
Charge on exchange movements offset in reserves – (0.3)
– (0.3)
Deferred taxation:
Deferred tax credit on actuarial losses 8.0 1.4
Deferred tax (charge)/credit on cash flow hedges (12.2) 1.2
Deferred tax credit/(charge) on foreign exchange differences 14.3 (0.8)
Deferred tax (charge)/credit on share-based payments (0.7) 0.7
9.4 2.5
2016 £m
2015
£m
Current taxation:
UK corporation tax 0.5 1.7
Overseas taxation 9.9 13.3
Current income tax charge 10.4 15.0
Adjustments with respect to prior years – UK and overseas (6.9) (8.5)
Total current income tax charge 3.5 6.5
Deferred taxation (note 27):
Origination and reversal of temporary differences – continuing operations 19.6 9.2
Adjustments with respect to prior years – UK and overseas (1.9) (0.4)
Deferred tax charge 17.7 8.8
Total tax charge for the Group 21.2 15.3
Less: amounts relating to discontinued items (1.0) (0.3)
Total tax charge for the continuing Group 20.2 15.0
The tax charge for the continuing Group is disclosed as follows:
Tax charge on profit before intangible asset amortisation 31.7 28.2
Tax credit on intangible asset amortisation (11.5) (13.2)
20.2 15.0
Financial Statements
NATIONAL EXPRESS GROUP PLC / ANNUAL REPORT AND ACCOUNTS 2016152152 National Express Group PLC / Annual Report and Accounts 2016
Notes to the Consolidated Accounts continued For the year ended 31 December 2016

ANNUAL REPORT AND ACCOUNTS 2016 / NATIONAL EXPRESS GROUP PLC 153
10 Taxation continued (c) Reconciliation of the total tax charge
Included within the tax reconciliation are a number of non-recurring items, the main ones being the recognition of UK losses (within the adjustments to prior years) and the release of tax provisions. Items expected to recur in the tax reconciliation for 2017 include the difference in rates between the UK and our overseas markets, tax incentives on re-investment credits and the merger of our Spanish businesses, and the effect of the debt financing of our overseas subsidiaries.
(d) Tax provisions At 31 December 2015, the Group held tax provisions of £12.7m to cover tax uncertainties across our various markets. During 2016, a tax audit into our Moroccan business was initiated for the periods 2012 to 2015. The matters which have been disputed relate to services provided by our Spanish business, use of losses carried forward and the tax deductibility of repairs. It is expected that this tax audit will conclude in 2017 and if a tax payment is made to settle the periods then it is expected to be immaterial. No other significant tax audits have been initiated across our businesses in the UK, Spain, Germany, the US or Canada in 2016. All UK corporation tax returns up to 2014 have been submitted and agreed by HMRC except for one outstanding matter. As a consequence of relatively few outstanding tax issues being contested by tax authorities and the closure of further tax returns as various statutes have closed, it was decided that £7.3m of the tax provisions are no longer required to cover tax uncertainties and £7.3m was credited to the tax line. The balance of £5.4m of tax provisions represents a number of tax uncertainties such as the deductibility of interest expense in some of our markets and the Moroccan tax audits. Based on the experience of the Group Tax department and after discussions of the various tax uncertainties with our tax advisers, the tax provision of £5.4m represents management’s best estimate of the tax uncertainties of which we are aware. The provision for the Group’s tax uncertainties of £5.4m is included in current tax liabilities.
(e) Temporary differences associated with Group investments No deferred tax (2015: £nil) is recognised on the unremitted earnings of subsidiaries, associates and joint ventures, as the Group has determined that these undistributed profits will not be distributed in the near future. As a result of changes to tax legislation in 2009, overseas dividends received on or after 1 July 2009 are generally exempt from UK corporation tax, but may be subject to withholding tax. There are no temporary differences (2015: £nil) associated with investments in subsidiaries, associates and joint ventures, for which a deferred tax liability has not been recognised but for which a tax liability may arise.
(f) Unrecognised tax losses Deferred income tax assets are recognised for tax loss carry-forwards to the extent that the realisation of the related tax benefit against future taxable profits is probable. Based on current forecasts, it is estimated that the losses recognised for deferred tax purposes will be utilised within three to four years. UK and overseas deferred tax assets that the Group has not recognised in the Financial Statements relates to gross losses of £16.5m (2015: £38.2m), which arise in tax jurisdictions where the Group does not expect to generate sufficient suitable future taxable profits. The majority of the unrecognised losses relates to UK entities where it is uncertain when, or if, the losses will be utilised. In addition, there are capital losses of £nil (2015: £2.2m) relating to the US business that have not been recognised.
2016
£m 2015
£m
Profit before income tax – continuing Group 136.3 122.7
Notional charge at UK corporation tax rate of 20.00% (2015: 20.25%) 27.2 24.9 Recurring items: Non-deductible goodwill impairment 0.2 – Non-deductible intangible amortisation 1.3 0.6 Effect of overseas tax rates 9.2 8.8 Tax incentives (4.2) (5.6) Overseas financing deductions (6.2) (5.8) Non-recurring items: Adjustments to prior years within current and deferred tax (excluding movements in tax provisions) (1.7) 2.2 Release of tax provisions (7.3) (8.6) Effect of reduction in tax rates (note 10(h)) 1.2 0.1 Non-deductible expenditure 1.1 1.0 Non-taxable income (0.5) (2.3) Utilisation of a deferred tax asset for previously unrecognised tax losses (0.1) (0.3)
Total tax charge reported in the Income Statement (note 10(a)) (20.2) 15.0
ANNUAL REPORT AND ACCOUNTS 2016 / NATIONAL EXPRESS GROUP PLC 153153Annual Report and Accounts 2016 / National Express Group PLC

154 NATIONAL EXPRESS GROUP PLC / ANNUAL REPORT AND ACCOUNTS 2016
Financial statements
Notes to the Consolidated Accounts continued For the year ended 31 December 2016
10 Taxation continued (g) Deferred tax included in the Income Statement
Details on the Balance Sheet position of deferred tax are included in note 27.
(h) Factors that may affect future tax charges During the period, the Finance Act 2016 was passed with a UK corporation tax rate of 17% from 1 April 2020.
At the Balance Sheet date, the 17% rate (2015: rates 19% and 18%) was substantively enacted. The change in rate has resulted in a tax charge of £1.2m to the Income Statement.
11 Discontinued operations and assets and liabilities held for sale On 10 February 2017, the Group disposed of the National Express Essex Thameside ‘c2c’ franchise to Trenitalia. Following initial partnership discussions during 2016, Trenitalia made an offer to the Group to acquire the franchise. After a period of negotiation it was formally announced in early January 2017 that an in principle agreement had been reached. On 10 February, the Department for Transport granted final consent for the transaction to complete and Trenitalia commenced operation of the c2c franchise from that date.
The assets and liabilities of the franchise have been classified as held for sale in the Balance Sheet and comprise the following:
Following the negotiations and decision in the year to dispose of the Group’s only remaining UK rail franchise, the UK Rail operating segment has been recognised as a discontinued operation. The results of the operation included in the profit and loss for the year are set out below. The comparative profit and loss from the operation has been re-presented as discontinued.
2016
£m 2015
£m
Accelerated capital allowances 28.2 (15.2)
Other short-term temporary differences 0.9 28.4
Utilisation of losses (11.4) (4.4)
Deferred tax charge 17.7 8.8
2016
£m
Property, plant and equipment 19.3
Defined benefit pension asset 37.7
Trade and other receivables 14.7
Cash and cash equivalents 6.3
Total assets held for sale 78.0
Trade and other payables (52.2)
Current tax liability (0.9)
Deferred tax liability (6.9)
Provisions (0.1)
Total liabilities held for sale (60.1)
Net assets 17.9
2016
£m 2015
£m
Revenue 175.5 166.0
Operating costs (170.6) (164.3)
Profit before tax 4.9 1.7
Attributable income tax expense (1.0) (0.3)
Profit for the year from discontinued operations 3.9 1.4
Financial Statements
NATIONAL EXPRESS GROUP PLC / ANNUAL REPORT AND ACCOUNTS 2016154154 National Express Group PLC / Annual Report and Accounts 2016
Notes to the Consolidated Accounts continued For the year ended 31 December 2016

ANNUAL REPORT AND ACCOUNTS 2016 / NATIONAL EXPRESS GROUP PLC 155
11 Discontinued operations and assets and liabilities held for sale continued The net cash flows incurred by the discontinued operation during the year are as follows. These cash flows are included within the Group Statement of Cash Flows:
12 Dividends paid and proposed
13 Earnings per share
Basic EPS is calculated by dividing the earnings attributable to equity shareholders of £117.2m (2015: £107.0m) by the weighted average number of ordinary shares in issue during the year, excluding those held by the Group’s Employee Benefit Trust (note 32) which are treated as cancelled.
Basic EPS for continuing operations is calculated by dividing the earnings from the continuing Group attributable to equity shareholders of £113.3m (2015: £105.6m). Basic and diluted EPS in the year for discontinued operations was 0.8p (2015: 0.3p).
For diluted EPS, the weighted average number of ordinary shares in issue during the year is adjusted to include the weighted average number of ordinary shares that would be issued on the conversion of all the dilutive potential ordinary shares into ordinary shares.
The reconciliation of basic and diluted weighted average number of ordinary shares is as follows:
2016
£m 2015
£m
Cash (outflow)/inflow from operating activities (1.5) 1.5
Cash outflow from investing activities (6.7) (6.7)
Cash inflow from financing activities 0.8 0.1
Net cash outflow (7.4) (5.1)
2016
£m 2015
£m
Declared and paid during the year
Ordinary final dividend for 2015 paid of 7.645p per share (2014: 6.95p) 39.1 35.5
Ordinary interim dividend for 2016 of 3.87p per share (2015: 3.685p) 19.8 18.9
58.9 54.4
Proposed for approval (not recognised as a liability at 31 December)
Ordinary final dividend for 2016 of 8.41p per share (2015: 7.645p per share) 43.0 39.1
2016 2015
Basic earnings per share 23.0p 20.9p
Normalised basic earnings per share 27.3p 23.4p
Basic earnings per share from continuing operations 22.2p 20.7p
Diluted earnings per share 22.8p 20.9p
Normalised diluted earnings per share 27.2p 23.3p
Diluted earnings per share from continuing operations 22.1p 20.6p
2016 2015
Basic weighted average shares 510,255,410 510,954,717
Adjustment for dilutive potential ordinary shares 2,859,856 2,399,159
Diluted weighted average shares 513,115,266 513,353,876
ANNUAL REPORT AND ACCOUNTS 2016 / NATIONAL EXPRESS GROUP PLC 155155Annual Report and Accounts 2016 / National Express Group PLC

156 NATIONAL EXPRESS GROUP PLC / ANNUAL REPORT AND ACCOUNTS 2016
Financial statements
Notes to the Consolidated Accounts continued For the year ended 31 December 2016
13 Earnings per share continued The normalised basic and normalised diluted earnings per share have been calculated in addition to the basic and diluted earnings per share required by IAS 33 since, in the opinion of the Directors, they reflect the underlying performance of the business’ operations more appropriately.
The reconciliation of the earnings and earnings per share to their normalised equivalent is as follows:
14 Intangible assets
2016 2015
£m Basic EPS
p Diluted EPS
p £m Basic EPS
p Diluted EPS
p
Profit attributable to equity shareholders 117.2 23.0 22.8 107.0 20.9 20.9
Intangible amortisation 33.8 6.6 6.6 25.7 5.0 5.0
Tax relief on the above (11.5) (2.3) (2.2) (13.2) (2.5) (2.6)
Normalised profit from continuing operations and attributable to equity shareholders 139.5 27.3 27.2 119.5 23.4 23.3
Customer contracts
£m Software
£m
Contract mobilisation
costs £m
Total finite life assets
£m Goodwill
£m Total
£m
Cost:
At 1 January 2016 555.2 54.7 9.9 619.8 1,099.1 1,718.9
Acquisitions 53.1 3.7 – 56.8 65.0 121.8
Additions 0.3 3.9 4.6 8.8 – 8.8
Disposals – (0.3) – (0.3) (0.4) (0.7)
Foreign exchange 100.1 9.7 1.8 111.6 185.7 297.3
At 31 December 2016 708.7 71.7 16.3 796.7 1,349.4 2,146.1
Amortisation and impairment:
At 1 January 2016 373.5 34.7 – 408.2 80.0 488.2
Charge for year 25.0 8.0 0.8 33.8 – 33.8
Disposals – (0.3) – (0.3) (0.4) (0.7)
Foreign exchange 64.2 7.1 – 71.3 4.9 76.2
At 31 December 2016 462.7 49.5 0.8 513.0 84.5 597.5
Net book value:
At 31 December 2016 246.0 22.2 15.5 283.7 1,264.9 1,548.6
At 1 January 2016 181.7 20.0 9.9 211.6 1,019.1 1,230.7
Financial Statements
NATIONAL EXPRESS GROUP PLC / ANNUAL REPORT AND ACCOUNTS 2016156156 National Express Group PLC / Annual Report and Accounts 2016
Notes to the Consolidated Accounts continued For the year ended 31 December 2016

ANNUAL REPORT AND ACCOUNTS 2016 / NATIONAL EXPRESS GROUP PLC 157
14 Intangible assets continued
Goodwill has been allocated to individual cash-generating units for annual impairment testing on the basis of the Group’s business operations. The carrying value by cash-generating unit is as follows:
Customer contracts
£m Software
£m
Contract mobilisation
costs £m
Total finite life assets
£m Goodwill
£m Total
£m
Cost:
At 1 January 2015 513.1 47.0 1.6 561.7 1,095.2 1,656.9
Acquisitions 57.1 – – 57.1 31.6 88.7
Additions 1.6 6.2 8.3 16.1 – 16.1
Disposals (1.4) – – (1.4) – (1.4)
Reclassifications – 0.4 – 0.4 – 0.4
Foreign exchange (15.2) 1.1 – (14.1) (27.7) (41.8)
At 31 December 2015 555.2 54.7 9.9 619.8 1,099.1 1,718.9
Amortisation and impairment:
At 1 January 2015 365.2 32.4 – 397.6 81.9 479.5
Charge for year 21.2 4.5 – 25.7 – 25.7
Disposals (1.4) – – (1.4) – (1.4)
Reclassifications 3.0 (3.0) – – – –
Foreign exchange (14.5) 0.8 – (13.7) (1.9) (15.6)
At 31 December 2015 373.5 34.7 – 408.2 80.0 488.2
Net book value:
At 31 December 2015 181.7 20.0 9.9 211.6 1,019.1 1,230.7
At 1 January 2015 147.9 14.6 1.6 164.1 1,013.3 1,177.4
2016
£m 2015
£m
UK Coach 8.1 13.2
North America 515.3 371.3
Spain and Morocco 741.5 634.6
1,264.9 1,019.1
ANNUAL REPORT AND ACCOUNTS 2016 / NATIONAL EXPRESS GROUP PLC 157157Annual Report and Accounts 2016 / National Express Group PLC

158 NATIONAL EXPRESS GROUP PLC / ANNUAL REPORT AND ACCOUNTS 2016
Financial statements
Notes to the Consolidated Accounts continued For the year ended 31 December 2016
14 Intangible assets continued The calculation of value in use for each group of cash-generating units is most sensitive to the assumptions over discount rates and the growth rate used to extrapolate cash flows beyond the three-year period of the management plan.
The key assumptions used for the cash-generating units are as follows:
The growth rates used to extrapolate cash flow projections are derived from financial budgets and forecasts approved by senior management covering a three-year period. The assumptions in these budgets and forecasts, which include growth rates and operating margins, are based on historical experience and detailed budget plans as well as management’s assessment of current market and economic conditions. Growth has then been extrapolated forward from the end of the forecasts.
The pre-tax discount rates applied are calculated from a uniform discount rate derived from the Group’s weighted average cost of capital (‘WACC’), which forms the basis for all internal investment analysis. The Group regularly commissions professional advisors to assess the WACC.
The value in use of the North America division exceeds its carrying amount by £252.2m (2015: £455.1m). Sensitivity analysis has been completed on each key assumption in isolation, and this indicates that the value in use of the division will be equal to its carrying amount following an increase in the pre-tax discount rate of 260 basis points (2015: 290 basis points) or a reduction in the growth rates used to extrapolate cash flows beyond the three-year period of the management plan of 150 basis points (2015: 340 basis points).
The value in use of the Spain and Morocco division exceeds its carrying amount by £262.0m (2015: £121.9m). Sensitivity analysis has been completed on each key assumption in isolation, and this indicates that the value in use of the division will be equal to its carrying amount following an increase in the pre-tax discount rate of 140 basis points (2015: 80 basis points) or a reduction in growth rates used to extrapolate cash flows beyond the three-year period of the management plan of 160 basis points (2015: 80 basis points).
For both Spain and Morocco and North America the asset base is more than offset by future profit projections.
It is believed that any reasonably possible movement on key assumptions will not lead to an impairment of goodwill allocated to UK Coach.
Sensitivities to other assumptions In North America, a reduction in operating profit margin of 160 basis points (2015: 320 basis points) will result in the value in use of the division being equal to its carrying amount. In Spain and Morocco, a reduction in operating profit margin of 250 basis points (2015: 140 basis points) will also result in the value in use of the division being equal to its carrying amount.
The Directors consider the assumptions used to be consistent with the historical performance of each cash-generating unit and to be realistically achievable in light of economic and industry measures and forecasts.
Pre-tax discount rate applied to
cash flow projections
Growth rate used to extrapolate cash flows
beyond three-year period of management plan
2016 2015 2016 2015
UK Coach 8.2% 8.2% 2.6% 2.2%
North America 8.1% 8.1% 3.8% 2.8%
Spain and Morocco 8.2% 8.2% 2.6% 2.2%
Financial Statements
NATIONAL EXPRESS GROUP PLC / ANNUAL REPORT AND ACCOUNTS 2016158158 National Express Group PLC / Annual Report and Accounts 2016
Notes to the Consolidated Accounts continued For the year ended 31 December 2016

ANNUAL REPORT AND ACCOUNTS 2016 / NATIONAL EXPRESS GROUP PLC 159
15 Property, plant and equipment
Freehold land and buildings
£m
Long leasehold property
improvements £m
Public service vehicles
£m
Plant and equipment,
fixtures and fittings
£m Total
£m
Cost:
At 1 January 2016 95.6 6.4 1,388.3 186.5 1,676.8
Acquisitions – – 27.1 0.4 27.5
Additions 1.6 2.3 155.0 31.1 190.0
Disposals (0.6) (0.2) (20.0) (2.2) (23.0)
Reclassifications 0.2 – – (0.2) –
Foreign exchange 10.1 1.6 208.6 13.0 233.3
Assets reclassified as held for sale – – – (20.2) (20.2)
At 31 December 2016 106.9 10.1 1,759.0 208.4 2,084.4
Depreciation:
At 1 January 2016 19.5 4.3 708.8 143.1 875.7
Charge for the year 2.5 0.8 108.2 11.5 123.0
Disposals (0.3) (0.2) (12.0) (2.2) (14.7)
Foreign exchange 1.3 1.2 104.8 10.4 117.7
Assets reclassified as held for sale – – – (0.9) (0.9)
At 31 December 2016 23.0 6.1 909.8 161.9 1,100.8
Net book value:
At 31 December 2016 83.9 4.0 849.2 46.5 983.6
At 1 January 2016 76.1 2.1 679.5 43.4 801.1
ANNUAL REPORT AND ACCOUNTS 2016 / NATIONAL EXPRESS GROUP PLC 159159Annual Report and Accounts 2016 / National Express Group PLC

160 NATIONAL EXPRESS GROUP PLC / ANNUAL REPORT AND ACCOUNTS 2016
Financial statements
Notes to the Consolidated Accounts continued For the year ended 31 December 2016
15 Property, plant and equipment continued
Property, plant and equipment held under finance lease agreements are analysed as follows:
Assets held under finance lease agreements are pledged as security for the related finance lease and hire purchase liabilities.
Freehold land and buildings
£m
Long leasehold property
improvements £m
Public service vehicles
£m
Plant and equipment,
fixtures and fittings
£m Total
£m
Cost:
At 1 January 2015 96.7 5.1 1,247.9 168.9 1,518.6
Acquisitions 0.4 – 18.5 0.1 19.0
Additions 2.9 0.9 138.6 21.2 163.6
Disposals (1.2) – (20.2) (1.5) (22.9)
Reclassifications (0.1) – – (0.3) (0.4)
Foreign exchange (3.1) 0.4 3.5 (1.9) (1.1)
At 31 December 2015 95.6 6.4 1,388.3 186.5 1,676.8
Depreciation:
At 1 January 2015 18.1 3.4 631.8 135.4 788.7
Charge for the year 2.4 0.7 90.9 10.3 104.3
Disposals (0.7) – (15.2) (1.1) (17.0)
Reclassifications – (0.1) – 0.1 –
Foreign exchange (0.3) 0.3 1.3 (1.6) (0.3)
At 31 December 2015 19.5 4.3 708.8 143.1 875.7
Net book value:
At 31 December 2015 76.1 2.1 679.5 43.4 801.1
At 1 January 2015 78.6 1.7 616.1 33.5 729.9
2016
£m 2015
£m
Public service vehicles – cost 306.1 225.0
– depreciation (120.1) (84.4)
Total net book value 186.0 140.6
Financial Statements
NATIONAL EXPRESS GROUP PLC / ANNUAL REPORT AND ACCOUNTS 2016160160 National Express Group PLC / Annual Report and Accounts 2016
Notes to the Consolidated Accounts continued For the year ended 31 December 2016

ANNUAL REPORT AND ACCOUNTS 2016 / NATIONAL EXPRESS GROUP PLC 161
16 Subsidiaries The companies listed below include all those which principally affect the results and net assets of the Group. A full list of subsidiaries, joint ventures and associates is disclosed in note 39, along with the addresses of their registered offices. The principal country of operation in respect of the companies below is the country in which they are incorporated.
National Express Group PLC is the beneficial owner of all the equity share capital, either itself or through subsidiaries, of the companies.
The Group’s train passenger services in the UK are operated through franchises awarded by DfT Rail, as delegated by the UK Government.
Incorporated in England and Wales
National Express Limited Administration and marketing of express coach services in Great Britain
Eurolines (UK) Limited Administration and marketing of express coach services to Europe
The Kings Ferry Limited Operation of coach services
West Midlands Travel Limited Operation of bus services
Incorporated in Scotland
Tayside Public Transport Co Limited (trading as Travel Dundee) Operation of bus services
Incorporated in the US
Durham School Services LP Operation of school bus services
Petermann Ltd Operation of school bus services
National Express Transit Corporation Operation of transit bus services
National Express Transit Services Corporation Operation of transit bus services
Incorporated in Canada
Stock Transportation Limited Operation of school bus services
Incorporated in Spain
NEX Continental Holdings SL* Holding company for operating companies
Tury Express SA* Holding company for operating companies
General Tecnica Industrial SLU* Holding company for operating companies
Incorporated in Morocco
Groupe Alsa Transport SA Operation of bus services
Transport de Voyageurs en Autocar Maroc SA Alsa Tanger SA
Operation of bus services Operation of bus services
Alsa City Agadir SA Operation of bus services
* The main holding companies of the ALSA Group.
The Group has no material non-controlling interests that require separate disclosure.
Incorporated in Germany
National Express Rail GmbH Operation of train passenger services
ANNUAL REPORT AND ACCOUNTS 2016 / NATIONAL EXPRESS GROUP PLC 161161Annual Report and Accounts 2016 / National Express Group PLC

162 NATIONAL EXPRESS GROUP PLC / ANNUAL REPORT AND ACCOUNTS 2016
Financial statements
Notes to the Consolidated Accounts continued For the year ended 31 December 2016
17 Derivative financial assets and available-for-sale investments
Further information on the Group’s use of derivatives is included in note 31.
Available-for-sale investments
The principal available-for-sale investments are as follows:
2016
£m 2015
£m
Available-for-sale investments – Unlisted ordinary shares 7.8 6.5
Derivative financial instruments – Fuel derivatives 8.6 –
Derivative financial instruments – Interest rate derivatives 14.3 22.2
Derivative financial instruments – Cross currency swaps 8.2 –
Derivative financial instruments included in non-current assets 31.1 22.2
Derivative financial instruments – Fuel derivatives 3.6 –
Derivative financial instruments – Interest rate derivatives 8.4 –
Derivative financial instruments – Foreign exchange derivatives 1.0 2.4
Derivative financial instruments included in current assets 13.0 2.4
2016 £m
2015 £m
Cost or valuation and net book value:
At 1 January 6.5 6.8
Additions in the year 0.2 –
Foreign exchange 1.1 (0.3)
At 31 December 7.8 6.5
Name Country of registration Class of share
2016 Proportion
held %
2015 Proportion
held %
Metros Ligeros de Madrid, S.A. (MLM) Spain Ordinary shares 15 15
Various investments within ALSA and Continental Auto Spain Ordinary shares 1-16 1-16
Financial Statements
NATIONAL EXPRESS GROUP PLC / ANNUAL REPORT AND ACCOUNTS 2016162162 National Express Group PLC / Annual Report and Accounts 2016
Notes to the Consolidated Accounts continued For the year ended 31 December 2016

ANNUAL REPORT AND ACCOUNTS 2016 / NATIONAL EXPRESS GROUP PLC 163
18 Investments accounted for using the equity method Investments accounted for using the equity method are as follows:
The Group’s share of post-tax results from associates and joint ventures accounted for using the equity method is as follows:
(a) Investments in joint ventures The Group’s interests in joint ventures are as follows:
The financial information of Ibero-Eurosur S.L. and Bahrain Public Transport Company W.L.L. is summarised below:
The contract to provide transportation services in Bahrain is a service concession arrangement under the definition set out in IFRIC 12. Included within revenue during 2016 in the table above is £0.8m (2015: £20.8m) in relation to construction revenue which reflects the successful mobilisation of the contract during 2015.
A reconciliation of the above summarised information to the carrying amount in the consolidated Financial Statements is as follows:
Ibero-Eurosur S.L Bahrain Public Transport
Company W.L.L.
2016
£m 2015
£m 2016
£m 2015
£m
Net assets of the joint venture 17.4 13.2 16.6 11.0
Proportion of interest belonging to joint venture partners (13.9) (10.4) (8.3) (5.5)
Group share of net assets 3.5 2.8 8.3 5.5
2016
£m 2015
£m
Joint ventures 11.8 8.3
Associates 1.9 2.3
Total investments accounted for under the equity method 13.7 10.6
2016
£m 2015
£m
Share of joint ventures’ profit 1.8 2.0
Share of associates’ loss (0.7) (0.2)
Total share of results from associates and joint ventures 1.1 1.8
Name Country of registration Activity Proportion held %
Ibero-Eurosur S.L. Spain Holding company of Deutsche Touring 20
Bahrain Public Transport Company W.L.L. Kingdom of Bahrain Operation of bus services 50
Ibero-Eurosur S.L. Bahrain Public Transport
Company W.L.L.
Share of the joint ventures’ balance sheets and results 2016
£m 2015
£m
2016 £m
2015
£m
Non-current assets 3.7 3.3 19.8 18.5
Current assets – 0.1 7.4 5.6
Share of gross assets 3.7 3.4 27.2 24.1
Non-current liabilities (0.2) (0.3) (13.4) (16.0)
Current liabilities – (0.3) (5.5) (2.6)
Share of gross liabilities (0.2) (0.6) (18.9) (18.6)
Net assets 3.5 2.8 8.3 5.5
Revenue 0.5 0.2 5.9 24.2
Operating profit 0.4 0.2 0.5 1.3
Profit for the year and total comprehensive income 0.4 0.2 1.4 1.8
Dividends received from the joint ventures during the year – – – –
ANNUAL REPORT AND ACCOUNTS 2016 / NATIONAL EXPRESS GROUP PLC 163163Annual Report and Accounts 2016 / National Express Group PLC

164 NATIONAL EXPRESS GROUP PLC / ANNUAL REPORT AND ACCOUNTS 2016
Financial statements
Notes to the Consolidated Accounts continued For the year ended 31 December 2016
18 Investments accounted for using the equity method continued (b) Investments in associates The Group’s interests in associates are as follows:
Spain and Morocco’s associates are generally involved in the operation of coach and bus services, management of bus stations and similar operations.
The aggregate amounts related to associates (of which none are individually material) are summarised below:
The carrying amount of the investment in associates matches the Group’s share of the net assets.
19 Business combinations (a) Acquisitions During the year the North America division acquired 100% of the share capital of seven businesses in the US and one business in Finland, none of which are material individually:
• Safeway Training and Transportation Services, Inc. (March 2016) – school bus transportation services in New Hampshire • White Plains Bus Company (comprising White Plains Bus Co., Inc. and Suburban Paratransit Services, Inc.) (March 2016) –
school bus and paratransit transportation services in New York • Ecolane Finland Oy and Ecolane USA Inc (May 2016) – a transit software developer • Robertson Transit, Inc. (September 2016) – school bus transportation services in New Hampshire • Diamond Transportation Services, Inc. (October 2016) – paratransit transportation services in Virginia and Washington D.C. • Transit Express (comprising Transit Express, Inc., Transit Express Services, Inc., Meda-Care Vans of Waukesha, Inc. and
Caravans Leasing Vehicles LLC) (November 2016) – paratransit, shuttle and charter transportation services in Wisconsin • New Dawn Transit LLC (December 2016) – school bus and charter transportation services in New York • Trinity Transportation Group (comprising Trinity, Inc., Trinity Cars, Inc., Trinity Coach LLC, Trinity Management Services Co. LLC,
Trinity Student Delivery LLC and JNC Leasing, Inc.) (December 2016) – school bus, coach and other ground transportation services in Michigan and Ohio
In aggregate, the provisional fair values of the assets and liabilities acquired in North America were as follows:
Name Country of registration Proportion held %
Spain and Morocco associates Spain 20-50
2016
£m 2015
£m
Share of operating loss (0.7) (0.2)
Share of loss for the year and total comprehensive income and expenditure (0.7) (0.2)
Group share of net assets 1.9 2.3
£m
Intangible assets 53.0
Property, plant and equipment 17.8
Trade and other receivables 14.9
Cash and cash equivalents 8.0
Trade and other payables (19.4)
Provisions (17.6)
Deferred tax liabilities 0.1
Net assets acquired 56.8
Goodwill 56.5
Total consideration 113.3
Represented by:
Cash consideration 52.9
Payments for cash acquired in the businesses 8.0
Deferred consideration 52.4
113.3
Financial Statements
NATIONAL EXPRESS GROUP PLC / ANNUAL REPORT AND ACCOUNTS 2016164164 National Express Group PLC / Annual Report and Accounts 2016
Notes to the Consolidated Accounts continued For the year ended 31 December 2016

ANNUAL REPORT AND ACCOUNTS 2016 / NATIONAL EXPRESS GROUP PLC 165
19 Business combinations continued (a) Acquisitions continued Trade and other receivables had a fair value and a gross contractual value of £14.9m. The best estimate at acquisition date of the contractual cash flows not to be collected was £nil.
Goodwill of £56.5m arising from the acquisitions consists of certain intangible benefits that cannot be separately identified and measured due to their nature. This includes control over the acquired businesses and increased scale in our North American operations, along with synergy benefits expected to be achieved.
Included in the consideration shown above is contingent consideration of £8.6m, relating to three acquisitions. For two of the acquisitions the Group is required to pay consideration upon meeting agreed revenue levels over a period of one year. For the third agreement, the Group is required to pay consideration based upon meeting an agreed EBITDA level over three years. The maximum payment under these arrangements is dependent on meeting the respective revenue and EBITDA levels, and the minimum payment is £nil. Based on projections, management expects the discounted value of payments to be the maximum amount of £8.6m.
Acquisition-related costs included within the Group’s operating profit for the year amounted to £0.4m.
The acquired businesses contributed £49.1m of revenue and £12.9m to the Group’s profit for the periods between the dates of acquisition and the Balance Sheet date. Had the acquisitions been completed on the first day of the financial year, the Group’s continuing revenue for the period would have been £2,160.9m and the Group’s continuing operating profit would have been £189.7m.
Deferred consideration of £6.1m (2015: £0.2m) was paid in the year relating to acquisitions in North America in earlier years.
Total cash outflow in the year from acquisitions in the North America division was £59.0m, comprising consideration of £60.9m and deferred consideration of £6.1m, less cash acquired in the businesses of £8.0m.
In June 2016, the Spain and Morocco division acquired Voramar el Gaucho, a business that operates transport and charter services in Ibiza, Spain. The total provisional fair value of net assets acquired in this business was £1.3m. Total consideration was £3.6m, resulting in provisional goodwill of £2.3m. Cash in the acquired business was £0.8m, therefore the net cash outflow for the period relating to this acquisition was £2.8m.
In December 2016, the Spain and Morocco division acquired AlpyBus S.a.r.l., a business that operates charter services in Switzerland. The total provisional fair value of net liabilities acquired in this business was £0.2m. Total consideration was £3.1m, resulting in provisional goodwill of £3.3m. Cash in the acquired business was £0.5m, therefore the net cash outflow for the period relating to this acquisition was £2.6m.
Deferred consideration of £18.3m (2015: £nil) was paid in the year relating to the acquisition of the Madrid-El Escorial franchise in December 2015.
Total cash outflow in the year from acquisitions in the Spain and Morocco division was £23.7m, comprising consideration of £6.7m and deferred consideration of £18.3m, less cash acquired in the businesses of £1.3m.
In December 2016, the UK Coach division acquired E Clarke & Son (Coaches) Limited, ‘Clarkes of London’, a business that operates coach services in the UK. The total provisional fair value of net assets acquired in this business was £3.0m. Total consideration was £5.1m, of which £4.5m is deferred, resulting in provisional goodwill of £2.1m. The net cash outflow for the period relating to this acquisition was £0.6m.
In 2015, the Group acquired five transport businesses in North America and the Madrid–El Escorial franchise in Spain. The fair value of net assets for the North America acquisitions were adjusted in 2016, resulting in additional goodwill of £0.8m. There were no fair value adjustments in 2016 for the Madrid–El Escorial franchise.
(b) Disposals In March 2016 the Group disposed of a small business in the UK Coach division for consideration of £2.0m. Cash in the business was £0.8m and deferred consideration was £0.3m therefore the net cash inflow in the year was £0.9m. There was no material profit or loss arising on the disposal.
There were no material business disposals during 2015.
ANNUAL REPORT AND ACCOUNTS 2016 / NATIONAL EXPRESS GROUP PLC 165165Annual Report and Accounts 2016 / National Express Group PLC

166 NATIONAL EXPRESS GROUP PLC / ANNUAL REPORT AND ACCOUNTS 2016
Financial statements
Notes to the Consolidated Accounts continued For the year ended 31 December 2016
20 Non-current assets – trade and other receivables
21 Inventories
The movement on the provision for slow moving and obsolete inventory is immaterial.
22 Current assets – trade and other receivables
An analysis of the provision for impairment of receivables is provided below:
Amounts included within trade receivables which are past due at the reporting date are shown in note 30. The Directors believe that based on the ongoing contractual relationships with predominantly government bodies these amounts will be collected.
The directors consider that the carrying amount of trade and other receivables is approximately equal to their fair value.
23 Cash and cash equivalents
Cash at bank and in hand earns interest at floating rates based on daily bank deposit rates. Short-term deposits are made for varying periods of between one day and three months depending on the immediate cash requirements of the Group and earn interest at the agreed short-term floating deposit rate. The fair value of cash and cash equivalents is equal to the carrying value.
2016
£m 2015
£m
Prepayments 1.5 1.8
Other receivables 16.7 2.2
18.2 4.0
2016
£m 2015
£m
Raw materials and consumables 25.0 22.5
2016
£m 2015
£m
Trade receivables 181.8 143.1
Less: provision for impairment of receivables (12.9) (10.8)
Trade receivables – net 168.9 132.3
Amounts due from associates and joint ventures (note 36) 1.2 1.1
Amounts due from other related parties (note 36) 0.6 0.6
Other receivables 86.0 56.0
Prepayments 27.1 35.0
Accrued income 18.9 16.9
302.7 241.9
2016
£m 2015
£m
At 1 January (10.8) (11.2)
Charged to the Income Statement (1.3) (1.1)
Utilised in the year 0.9 0.9
Exchange difference (1.7) 0.6
At 31 December (12.9) (10.8)
2016
£m 2015
£m
Cash at bank and in hand 66.0 59.2
Overnight deposits 3.5 0.7
Other short-term deposits 248.6 0.5
Cash and cash equivalents 318.1 60.4
Financial Statements
NATIONAL EXPRESS GROUP PLC / ANNUAL REPORT AND ACCOUNTS 2016166166 National Express Group PLC / Annual Report and Accounts 2016
Notes to the Consolidated Accounts continued For the year ended 31 December 2016

ANNUAL REPORT AND ACCOUNTS 2016 / NATIONAL EXPRESS GROUP PLC 167
24 Current liabilities – trade and other payables
Trade payables are non-interest bearing and are normally settled on 30-day terms and other payables are non-interest bearing and have an average term of two months. Included within other payables are deferred fixed asset grants from government or other public bodies of £0.4m (2015: £0.4m).
Other payables includes £46.7m (2015: £23.0m) of deferred consideration for businesses acquired in the year (note 19).
25 Other non-current liabilities
Other liabilities includes £10.2m (2015: £9.2m) of deferred consideration for businesses acquired in the year (note 19).
26 Provisions
1 The claims provision arises from estimated exposures at the year end for auto and general liability, workers’ compensation and environmental claims, the majority
of which will be utilised in the next five years. It comprises provisions for claims arising in the UK and North America. 2 Other includes amounts provided for restructuring activities. These provisions are expected to be utilised within one year.
When the effect is material, the provisions are discounted to their net present value.
2016
£m 2015
£m
Trade payables 196.9 182.3
Amounts owed to associates and joint ventures (note 36) 1.7 0.8
Amounts owed to other related parties (note 36) 0.8 0.5
Other tax and social security payable 24.8 28.8
Accruals and deferred income 137.5 119.3
Other payables 239.0 167.8
600.7 499.5
2016
£m 2015
£m
Deferred fixed asset grants 3.3 3.5
Other liabilities 17.9 12.5
21.2 16.0
Claims provision1
£m Other2
£m Total
£m
At 1 January 2016 60.9 7.8 68.7
Charged to the Income Statement 57.0 – 57.0
Utilised in the year (34.8) (7.6) (42.4)
Unwinding of discount 1.2 – 1.2
Acquired in business combinations 17.6 – 17.6
Exchange difference 11.7 0.7 12.4
Reclassification to liabilities directly associated with assets held for sale – (0.1) (0.1)
At 31 December 2016 113.6 0.8 114.4
Current 31 December 2016 56.4 0.8 57.2
Non-current 31 December 2016 57.2 – 57.2
113.6 0.8 114.4
Current 31 December 2015 31.8 4.8 36.6
Non-current 31 December 2015 29.1 3.0 32.1
60.9 7.8 68.7
ANNUAL REPORT AND ACCOUNTS 2016 / NATIONAL EXPRESS GROUP PLC 167167Annual Report and Accounts 2016 / National Express Group PLC

168 NATIONAL EXPRESS GROUP PLC / ANNUAL REPORT AND ACCOUNTS 2016
Financial statements
Notes to the Consolidated Accounts continued For the year ended 31 December 2016
27 Deferred tax
Based on current capital investment plans, the Group expects to be able to claim capital allowances in excess of depreciation in future years at a similar level to the current year.
Deferred tax assets 2016
£m 2015
£m
Accelerated tax depreciation (0.7) 1.7
Losses carried forward 27.7 8.6
Other short-term temporary differences 21.3 20.8
Total 48.3 31.1
Deferred tax assets and liabilities within the same jurisdiction have been offset.
The UK and German businesses are included in deferred tax assets of £48.3m and the Spanish, US and Canadian businesses are included in deferred tax liabilities of £82.9m.
The deferred tax assets relating to losses carried forward are £92.1m (2015: £50.6m). This comprises £27.7m within deferred tax assets and £64.4m within deferred tax liabilities.
2016
£m 2015
£m
Net deferred tax liability at 1 January (22.7) (36.1)
Charge to Income Statement (17.7) (8.8)
Credit to Other Comprehensive Income or Equity 9.4 2.5
Exchange differences (10.7) –
Acquired in business combinations 0.2 19.7
Less: amounts reclassified as held for sale 6.9 –
Net deferred tax liability at 31 December (34.6) (22.7)
Deferred tax liabilities 2016
£m 2015
£m
Accelerated tax depreciation (213.5) (144.0)
Losses carried forward 64.4 42.0
Other short-term temporary differences 66.2 48.2
Total (82.9) (53.8)
Financial Statements
NATIONAL EXPRESS GROUP PLC / ANNUAL REPORT AND ACCOUNTS 2016168168 National Express Group PLC / Annual Report and Accounts 2016
Notes to the Consolidated Accounts continued For the year ended 31 December 2016

ANNUAL REPORT AND ACCOUNTS 2016 / NATIONAL EXPRESS GROUP PLC 169
28 Borrowings and derivative financial liabilities
An analysis of interest-bearing loans and borrowings is provided in note 29. Further information on derivative financial instruments is provided in note 31.
2016
£m 2015
£m
Non-current
Bank loans 9.2 6.9
Bonds 631.8 583.5
Finance lease obligations 103.5 99.7
Other debt payable 72.2 62.2
Non-current borrowings 816.7 752.3
Fuel derivatives 4.2 39.6
Non-current derivative financial instruments 4.2 39.6
Non-current borrowings and derivative financial liabilities 820.9 791.9
Current
Bank loans 4.1 38.4
Bonds 351.4 –
Bonds – accrued interest 30.8 29.3
Finance lease obligations 56.0 27.9
Other debt payable 1.5 3.5
Current borrowings 443.8 99.1
Fuel derivatives 21.1 44.2
Foreign exchange derivatives 4.9 1.8
Current derivative financial instruments 26.0 46.0
Current borrowings and derivative financial liabilities 469.8 145.1
ANNUAL REPORT AND ACCOUNTS 2016 / NATIONAL EXPRESS GROUP PLC 169169Annual Report and Accounts 2016 / National Express Group PLC

170 NATIONAL EXPRESS GROUP PLC / ANNUAL REPORT AND ACCOUNTS 2016
Financial statements
Notes to the Consolidated Accounts continued For the year ended 31 December 2016
29 Interest-bearing borrowings The effective interest rates on loans and borrowings at the Balance Sheet date were as follows:
* This date is the ultimate maturity date of the syndicated credit facility.
In September 2016, the Group entered into additional unsecured committed revolving credit facilities totalling £96m. The facilities are on the same terms as the Group’s existing £416m bank facility and both mature in November 2021. At 31 December 2016, there was €nil (2015: €50m) drawn down on the facilities, with £2.6m of capitalised deal fees remaining.
In November 2016, the Group issued a £400m seven-year Sterling bond with a coupon of 2.5%. The proceeds were used to repay the £350m Sterling bond that matured in January 2017, with the remainder to be used for general corporate purposes. A £350m bridge facility and £100m facility were taken out last year to provide the Group with an appropriate level of liquidity prior to refinancing the bond and these were cancelled following the issuance of the new £400m bond.
Under the terms of the £1bn Euro Medium Term Note (‘EMTN’) programme, there is a change in control put option such that, upon a change of control event, any note holder may require the Company to redeem or purchase that MTN.
Details of the Group’s interest rate risk management strategy and associated interest rate derivatives are included in notes 30 and 31.
The Group is subject to a number of financial covenants in relation to its syndicated credit facilities which, if contravened, could result in its borrowings under those facilities becoming immediately repayable. These covenants specify maximum net debt to EBITDA and minimum EBITDA to net interest payable.
2016
£m Maturity Effective
interest rate 2015
£m Maturity Effective
interest rate
Seven-year Sterling bond 351.4 January 2017 6.54% 352.3 January 2017 6.54%
Ten-year Sterling bond 232.9 June 2020 6.85% 231.2 June 2020 6.85%
Seven-year Sterling bond 398.9 November 2023 2.54% – – –
Bonds 983.2 583.5
Accrued interest – bonds 30.8 29.3
European bank loans – – – 34.0 November
2020* LIBOR +
0.60%
European bank loans 5.6 2017-2020 2.92% 8.6 2016-2020 4.45%
European bank loans 6.2 2017-2019 EURIBOR +
1.05% 2.1 2016-2018 EURIBOR +
1.26%
US bank loans – – – 0.6 2016 1.40%
Other short-term loans 1.5
Bank loans 13.3 45.3
US Dollar finance leases at fixed rate 144.3 various 2.25% 108.4 2016-2021 2.13%
European finance leases at fixed rate 7.4 2017-2024 2.80% 6.1 2016-2023 3.02%
European finance leases at floating rate 4.6 2017-2022
EURIBOR + 1.61% 6.6 2016-2022
EURIBOR + 1.90%
Sterling finance leases at fixed rate 3.2 2017-2019 4.08% 6.5 2016-2018 4.76%
Finance leases 159.5 127.6
Euro Private Placement 71.9 August 2021 4.55% 61.8 August 2021 4.55%
Accrued interest – Private Placement 1.3 1.1
Euro loans 0.5 2017-2026 2.8 2016-2026
Other debt payable 73.7 65.7
Total 1,260.5 851.4
Financial Statements
NATIONAL EXPRESS GROUP PLC / ANNUAL REPORT AND ACCOUNTS 2016170170 National Express Group PLC / Annual Report and Accounts 2016
Notes to the Consolidated Accounts continued For the year ended 31 December 2016

ANNUAL REPORT AND ACCOUNTS 2016 / NATIONAL EXPRESS GROUP PLC 171
29 Interest-bearing borrowings continued The following table sets out the carrying amount, by maturity, of the Group’s interest-bearing borrowings and deposits:
As at 31 December 2016 < 1 year
£m 1-2 years
£m 2-3 years
£m 3-4 years
£m 4-5 years
£m > 5 years
£m Total
£m
Fixed rate
Bank loans (1.4) (3.2) (0.8) (0.1) – (0.1) (5.6)
Bonds (351.4) – – (232.9) – (398.9) (983.2)
Finance leases (54.0) (35.5) (26.7) (12.2) (10.6) (15.9) (154.9)
Other debt payable (1.5) – (0.3) – (71.9) – (73.7)
Floating rate
Cash assets 318.1 – – – – – 318.1
Bank loans (2.7) (0.4) (4.6) – – – (7.7)
Finance leases (2.0) (1.0) (0.8) (0.3) (0.3) (0.2) (4.6)
30 Financial risk management objectives and policies Financial risk factors and management The Group’s multinational operations and debt levels expose it to a variety of financial risks, of which the most material are market risks relating to fuel prices, foreign currency exchange rates, interest rates and the availability of funding at reasonable margins. The Group has in place a risk management programme that seeks to manage the impact of these risks on the financial performance of the Group by using financial instruments including borrowings, committed facilities and forward foreign exchange, fuel and interest rate derivatives.
The Board of Directors has delegated the responsibility for implementing the financial risk management policies laid down by the Board to the Group Finance Director and the Group Treasurer. The policies are implemented by the Group Treasury department with regular reporting to the Group Finance Director and the Audit Committee on its activities.
As at 31 December 2015 < 1 year
£m 1-2 years
£m 2-3 years
£m 3-4 years
£m 4-5 years
£m > 5 years
£m Total
£m
Fixed rate
Bank loans (1.9) (1.9) (3.5) (1.3) (0.2) – (8.8)
Bonds – (352.3) – – (231.2) – (583.5)
Finance leases (25.9) (40.4) (24.9) (17.2) (5.2) (7.5) (121.1)
Other debt payable (3.5) (0.1) (0.3) – – (61.8) (65.7)
Floating rate
Cash assets 60.4 – – – – – 60.4
Bank loans (36.5) – – – – – (36.5)
Finance leases (2.0) (1.6) (1.0) (0.8) (0.4) (0.7) (6.5)
ANNUAL REPORT AND ACCOUNTS 2016 / NATIONAL EXPRESS GROUP PLC 171171Annual Report and Accounts 2016 / National Express Group PLC

172 NATIONAL EXPRESS GROUP PLC / ANNUAL REPORT AND ACCOUNTS 2016
Financial statements
Notes to the Consolidated Accounts continued For the year ended 31 December 2016
30 Financial risk management objectives and policies continued Foreign currency The Group has major foreign operations in the US, Canada and Spain and as a result is exposed to the movements in foreign currency exchange rates on the translation of these foreign currency denominated net assets and earnings. These movements can have a significant impact on the Group’s reported results. The Group seeks to manage this foreign currency exchange movement risk by aligning its foreign currency denominated liabilities with the EBIT generated in each currency, such that some protection is afforded to the net debt: EBITDA covenant within the Group’s core borrowing facility. This is achieved by a combination of foreign currency borrowings and finance leases, and entering into derivative financial instruments such as cross currency interest rate swaps and foreign exchange swaps. At the year end, the Group had outstanding foreign exchange derivatives of €41.9m, USD236.4m, CAD52.2m and CZK15.7m, outstanding cross currency interest rate swaps of €222.7m and finance leases of USD178.0m and €14.1m.
Foreign exchange and cross currency interest rate swaps are derivative financial instruments designated as net investment hedges of foreign currency assets. The effective portion of the gain or loss on the hedge is recognised in the Group Statement of Comprehensive Income and recycled to the Income Statement at the same time as the underlying hedged net assets affect the Income Statement. Any material ineffectiveness is taken to the Income Statement.
The table below demonstrates the sensitivity of the Group’s financial instruments to a reasonably possible change in foreign exchange rates, with all other variables held constant. This would affect the Group’s profit before tax and translation reserve. The effect on the translation reserve represents the movement in the translated value of the foreign currency denominated loans and change in fair value of cross currency swap contracts. These movements would be offset by an opposite movement in the translated value of the Group’s overseas net investments. It is estimated that a 10% change in the corresponding exchange rates would result in an exchange gain or loss in the translation reserve of £9.1m.
Interest rate risk The Group is exposed to movements in interest rates on both interest-bearing assets and liabilities. It is the Group’s policy to maintain an appropriate balance between fixed and floating interest rates on borrowings in order to provide a level of certainty to interest expense in the short term and to reduce the year on year impact of interest rate fluctuations over the medium term. To achieve the desired fixed/floating ratio, the Group has entered into a series of interest rate swaps that have the effect of converting fixed rate debt to floating rate debt. The net effect of these transactions was that as at 31 December 2016 the proportion of the Group’s gross debt at floating rates was 24% (2015: 34%).
The table below demonstrates the sensitivity of the Group’s financial instruments to a reasonably possible change in interest rates, with all other variables held constant, on the Group’s profit before tax and on the Group’s hedging reserve.
The sensitivity analysis covers all floating rate financial instruments, including the interest rate swaps. If the interest rates applicable to floating rate instruments denominated in Sterling were increased by 100bps, it is estimated that the Group’s profit before taxation would increase by approximately £0.7m. If the interest rates applicable to floating rate instruments denominated in US Dollar were increased by 50bps, it is estimated that the Group’s profit before taxation would increase by £0.1m. If the interest rates applicable to floating rate instruments denominated in Euro were increased by 75bps, it is estimated that the Group’s profit before taxation would reduce by £0.5m. The analysis assumes that the amount and mix of floating rate debt, including finance leases, remains unchanged from that in place at 31 December 2016.
2016 2015
As at 31 December
Strengthening/ (weakening) in currency
Effect on profit
before tax £m
Effect on translation
reserve £m
Effect on profit
before tax £m
Effect on translation
reserve £m
US Dollar 10% – 7.0 0.1 3.0
Euro 10% – (0.7) – 7.6
Canadian Dollar 10% – 2.8 – 0.2
US Dollar (10)% – (7.0) (0.1) (3.0)
Euro (10)% – 0.7 – (7.6)
Canadian Dollar (10)% – (2.8) – (0.2)
Financial Statements
NATIONAL EXPRESS GROUP PLC / ANNUAL REPORT AND ACCOUNTS 2016172172 National Express Group PLC / Annual Report and Accounts 2016
Notes to the Consolidated Accounts continued For the year ended 31 December 2016

ANNUAL REPORT AND ACCOUNTS 2016 / NATIONAL EXPRESS GROUP PLC 173
30 Financial risk management objectives and policies continued Interest rate risk continued
Commodity prices The Group is exposed to movements in commodity prices as a result of its fuel usage. It is the Group’s policy to hedge this exposure in order to provide a level of certainty as to its cost in the short term and to reduce the year on year impact of price fluctuations over the medium term. This is achieved by entering into fuel derivatives. At 31 December 2016, the Group had hedged approximately 100% of its 2017 expected usage, 89% of its expected usage in 2018, 50% of its expected usage in 2019 and 10% of its expected usage in 2020 (see the Group Finance Director’s review for further details).
The table below demonstrates the effect of a reasonably possible variation in fuel prices, with all other variables held constant, on the fair value of the Group’s financial instruments and accordingly on the Group’s profit before tax and on the Group’s hedging reserve.
The sensitivity analysis includes all fuel derivatives. The effect on the hedging reserve arises through movements on the fair value of the Group’s fuel derivatives. For these derivative contracts the sensitivity of the net fair value to an immediate 20% increase or decrease in all prices would have been £40.7m at 31 December 2016. The figure does not include any corresponding economic advantage or disadvantage that would arise from the natural business exposure which would be expected to offset the gain or loss on the derivatives.
Credit risk The maximum credit risk exposure of the Group is the gross carrying value of each of its financial assets. This risk is mitigated by a number of factors. Many of the Group’s principal customers, suppliers and financial institutions with which it conducts business are public (or quasi-public) bodies, both national (DfT Rail and Network Rail in the UK) and local (school boards in North America, municipal authorities in Spain and Morocco, Transport for London and Centro in the UK, and regional authorities in Germany). The Group does not consider these counterparties to pose a significant credit risk. Outside of this, the Group does not consider it has significant concentrations of credit risk. The Group has implemented policies that require appropriate credit checks on potential customers before sales commence.
The only elements of the Group’s financial assets which are not impaired but are past due are certain trade receivable items. An ageing of the assets which are past due is included in the following table. In terms of trade receivables that are neither impaired nor past due, there are no indications as at the year end reporting date that the debtors will not meet their payment obligations (see Risk and risk management section for details of how management manages this process).
2016 2015
As at 31 December
Increase/ (decrease)
in basis points
Effect on profit
before tax £m
Effect on hedging reserve
£m
Effect on profit
before tax £m
Effect on hedging reserve
£m
Sterling 100 0.7 – (1.8) –
US Dollar 50 0.1 – 0.1 –
Euro 75 (0.5) – (0.3) –
Sterling (100) (0.7) – 1.8 –
US Dollar (50) (0.1) – (0.1) –
Euro (75) 0.5 – 0.3 –
2016 2015
As at 31 December
Increase/ (decrease)
in price
Effect on profit
before tax £m
Effect on hedging reserve
£m
Effect on profit
before tax £m
Effect on hedging reserve
£m
Sterling denominated ULSD 20% – 15.3 – 7.9
US Dollar denominated heating oil/diesel 20% – 7.8 – 5.4
US Dollar denominated gasoline 20% – 2.9 – –
Euro denominated ULSD 20% – 14.7 – 8.8
Sterling denominated ULSD (20)% – (15.3) – (7.9)
US Dollar denominated heating oil/diesel (20)% – (7.8) – (5.4)
US Dollar denominated gasoline (20)% – (2.9) – –
Euro denominated ULSD (20)% – (14.7) – (8.8)
ANNUAL REPORT AND ACCOUNTS 2016 / NATIONAL EXPRESS GROUP PLC 173173Annual Report and Accounts 2016 / National Express Group PLC

174 NATIONAL EXPRESS GROUP PLC / ANNUAL REPORT AND ACCOUNTS 2016
Financial statements
Notes to the Consolidated Accounts continued For the year ended 31 December 2016
30 Financial risk management objectives and policies continued Credit risk continued
Liquidity risk The Group’s liquidity risk is centrally managed by the Group Treasury department with operating units forecasting their cash requirements. The Group actively maintains a mixture of medium and long-term committed facilities designed to ensure the Group has sufficient available funds to meet current and forecast funding requirements. In managing liquidity risk, the Group has access to a range of funding sources through the banking and capital markets. In September 2016, the Group entered into additional unsecured committed revolving credit facilities totalling £96m. The facilities are on the same terms as the Group’s existing £416m unsecured committed revolving bank facility and both mature in November 2021. At 31 December 2016, there was €nil (2015: €50m) drawn down on the facilities.
In November 2016, the Group issued a £400m seven-year Sterling bond with a coupon of 2.5%. The proceeds were used to repay the £350m Sterling bond that matured in January 2017, with the remainder to be used for general corporate purposes. A £350m bridge facility and £100m facility were taken out last year to provide the Group with an appropriate level of liquidity prior to refinancing the bond and these were cancelled following the issuance of the new £400m bond.
The table below summarises the maturity profile of the Group’s financial liabilities at 31 December 2016 based on the contractual undiscounted cash flows including interest cash flows. As such, the amounts in this table will not agree to the carrying amounts disclosed in the Balance Sheet or other notes. The table includes cash flows associated with derivative hedging instruments. Their amounts reflect the maturity profile of the fair value liability where the instrument will be settled net, and the gross settlement amount where the pay leg of a derivative will be settled separately to the receive leg.
Year ended 31 December 2016 On demand
£m < 1 year
£m 1-5 years
£m > 5 years
£m Total
£m
Bank loans – 4.3 9.2 0.1 13.6 Bonds – 396.8 309.7 420.0 1,126.5 Finance lease obligations – 59.2 91.7 17.2 168.1 Other debt payable – 3.5 79.4 0.1 83.0 Trade and other payables – 600.3 17.9 – 618.2 1,064.1 507.9 437.4 2,009.4 Foreign exchange derivatives – 3.9 – – 3.9 Interest rate derivatives – (8.4) (14.2) – (22.6)
Cross currency interest rate swaps – (2.1) (8.4) (4.2) (14.7)
Fuel derivatives – 18.2 (5.9) – 12.3
– 11.6 (28.5) (4.2) (21.1)
Year ended 31 December 2015 On demand
£m < 1 year
£m 1-5 years
£m > 5 years
£m Total
£m
Bank loans – 38.4 6.9 – 45.3 Bonds – 36.8 656.5 – 693.3 Finance lease obligations – 32.1 116.7 10.8 159.6 Other debt payable – 5.0 11.0 64.4 80.4 Trade and other payables – 499.1 12.5 – 511.6 – 611.4 803.6 75.2 1,490.2 Foreign exchange derivatives – (0.6) – – (0.6) Interest rate derivatives – (5.7) (16.6) (0.4) (22.7) Fuel derivatives – 41.7 40.7 – 82.4 – 35.4 24.1 (0.4) 59.1
Carrying amount
£m
Of which: neither impaired
nor past due £m
Of which: not impaired and past due in the following periods
Less than 30 days
£m
Between 30 and 60 days
£m
Between 61 and 90 days
£m Over 90 days
£m
Trade receivables at 31 December 2016
168.9 113.8 23.7 7.8 5.2 18.4
Trade receivables at 31 December 2015 132.3 91.9 15.4 7.7 4.1 13.2
Financial Statements
NATIONAL EXPRESS GROUP PLC / ANNUAL REPORT AND ACCOUNTS 2016174174 National Express Group PLC / Annual Report and Accounts 2016
Notes to the Consolidated Accounts continued For the year ended 31 December 2016

ANNUAL REPORT AND ACCOUNTS 2016 / NATIONAL EXPRESS GROUP PLC 175
30 Financial risk management objectives and policies continued Capital risk management The Group seeks to adopt efficient financing structures that enable it to use its Balance Sheet strength to achieve the Group’s objectives without putting shareholder value at risk. The Group’s capital structure comprises its equity (refer to the Group Statement of Changes in Equity) and its net debt (refer to note 37).
The increase in the Group’s net debt from £745.5m to £878.0m (excluding accrued interest) is explained in the Group Finance Director’s review. Information about the financial covenants in relation to the Group’s borrowing facilities is included in note 29.
31 Financial instruments (including cash, trade receivables and payables) Fair values The table overleaf illustrates the fair values of all financial assets and liabilities held by the Group at 31 December 2016.
Loans and receivables are non-derivative financial assets with fixed or determinable payments that are not quoted in an active market. They are measured at amortised cost using the effective interest rate method and the carrying value in all cases approximates to the fair value.
Available-for-sale investments are non-derivative assets that are either designated as available for sale, or are not classified as loans and receivables or held to maturity investments. The Group’s available-for-sale investments have no active market, and in the absence of any other reliable external information are carried at cost or amortised cost which approximates to the fair value.
The fair value of derivatives is either determined by the third party financial institution with which the Group holds the instrument, in line with the market value of similar financial instruments, or by use of valuation techniques using market data. Derivatives, other than those designated as effective hedging instruments, are classified as fair value through profit or loss and are carried on the Balance Sheet at their fair value with gains or losses recognised in the Income Statement. Derivatives designated as hedging instruments in an effective hedge are carried on the Balance Sheet at their fair value. For cash flow hedges and hedges of net investments in foreign operations, the effective portion of the gain or loss on the hedging instrument is recognised directly in Other Comprehensive Income, while the ineffective portion is recognised in the Income Statement. Amounts taken to Other Comprehensive Income are transferred to the Income Statement when the hedged transaction affects profit or loss or when the foreign operation is sold or partially disposed. For fair value hedges, all gains or losses are recognised in the Income Statement.
Derivatives are the only instrument which the Group holds at fair value. The fair value measurement of these instruments is categorised within Level 2 (ie the fair values are derived based on observable market inputs). The Group has no financial instruments with fair values that are determined by reference to significant unobservable inputs, ie those that would be classified as Level 3 in the fair value hierarchy, other than the deferred contingent consideration disclosed in note 19. There have not been any transfers of assets or liabilities between levels of the fair value hierarchy and there are no non-recurring fair value movements.
The Group’s bonds are held at a hybrid amortised cost with a fair value adjustment. After initial recognition at fair value, the bonds are measured at amortised cost using the effective interest rate method. A portion of the bonds is designated as the hedged item in an effective fair value hedging relationship. As such, the carrying value of this portion is adjusted for changes in fair value attributable to the risk being hedged. This net carrying value will differ to the fair value depending on movements in the Group’s credit risk, movements in interest rates on the un-hedged portion and unamortised fees.
All other liabilities, including finance leases, bank loans, trade and other payables and other debt payable, are held at amortised cost. After initial fair value recognition, these instruments are measured at amortised cost using the effective interest rate method. The carrying value of these liabilities approximates to the fair value.
ANNUAL REPORT AND ACCOUNTS 2016 / NATIONAL EXPRESS GROUP PLC 175175Annual Report and Accounts 2016 / National Express Group PLC

176 NATIONAL EXPRESS GROUP PLC / ANNUAL REPORT AND ACCOUNTS 2016
Financial statements
Notes to the Consolidated Accounts continued For the year ended 31 December 2016
31 Financial instruments (including cash, trade receivables and payables) continued Fair values continued
Other receivables and other payables are to be settled in cash in the currency they are held in.
In accordance with IAS 39 Financial Instruments: Recognition and Measurement, the Group has reviewed all contracts for embedded derivatives that are required to be separately accounted for. No embedded derivatives have been identified.
Classification of financial instruments As at 31 December 2016
Loans and receivables
£m
Available- for-sale assets
£m
Derivatives used for hedging
£m
Liabilities measured at
amortised cost £m
At fair value through
profit or loss £m
Total £m
Assets Investments – 7.8 – – – 7.8 Fuel derivatives – – 12.2 – – 12.2 Interest rate derivatives – – 22.7 – – 22.7 Cross currency swaps – – 8.2 – – 8.2 Foreign exchange derivatives – – 1.0 – – 1.0 Cash and cash equivalents 318.1 – – – – 318.1 Trade and other receivables 273.4 – – – – 273.4 591.5 7.8 44.1 – – 643.4
Liabilities Bank loans – – – (13.2) – (13.2) Bonds including accrued interest – – – (1,014.0) – (1,014.0) Finance lease obligations – – – (159.5) – (159.5) Other debt payable – – – (73.8) – (73.8) Fuel derivatives – – (25.3) – – (25.3) Foreign exchange derivatives – – (4.9) – – (4.9) Trade and other payables – – – (618.2) – (618.2) – – (30.2) (1,878.7) – (1,908.9)
Classification of financial instruments As at 31 December 2015
Loans and receivables
£m
Available- for-sale assets
£m
Derivatives used for hedging
£m
Liabilities measured at
amortised cost £m
At fair value through
profit or loss £m
Total £m
Assets
Investments – 6.5 – – – 6.5
Interest rate derivatives – – 22.2 – – 22.2
Foreign exchange derivatives – – 2.4 – – 2.4
Cash and cash equivalents 60.4 – – – – 60.4
Trade and other receivables 192.2 – – – – 192.2
252.6 6.5 24.6 – – 283.7
Liabilities
Bank loans – – – (45.3) – (45.3)
Bonds including accrued interest – – – (612.8) – (612.8)
Finance lease obligations – – – (127.6) – (127.6)
Other debt payable – – – (65.7) – (65.7)
Fuel derivatives – – (83.8) – – (83.8)
Foreign exchange derivatives – – (1.8) – – (1.8)
Trade and other payables – – – (511.6) – (511.6)
– – (85.6) (1,363.0) – (1,448.6)
Financial Statements
NATIONAL EXPRESS GROUP PLC / ANNUAL REPORT AND ACCOUNTS 2016176176 National Express Group PLC / Annual Report and Accounts 2016
Notes to the Consolidated Accounts continued For the year ended 31 December 2016

ANNUAL REPORT AND ACCOUNTS 2016 / NATIONAL EXPRESS GROUP PLC 177
31 Financial instruments (including cash, trade receivables and payables) continued Fair values continued The Group assesses at each year end reporting date whether a financial asset or group of financial assets is impaired. In the financial year 2016 there was no objective evidence that would have necessitated the impairment of loans and receivables or available-for-sale assets except the provision for impairment of receivables (see note 22).
Hedging activities The Group uses derivative financial instruments to manage exposures to market risk, such as movements in foreign exchange rates, fuel prices and interest rates. Such derivative financial instruments are initially recognised at fair value and are subsequently remeasured at fair value. In line with IAS 39 the Group classifies hedges as (a) fair value hedges used to hedge exposure to changes in the fair value of a recognised asset or liability, (b) cash flow hedges used to hedge exposure to variability in cash flows associated with a recognised asset or liability or a highly probable forecast transaction, and (c) hedges of a net investment in a foreign operation.
In 2016, the Group applied cash flow hedge accounting for hedging floating fuel price risks in highly probable forecast purchase transactions and for hedging net investments in US Dollar and Euro foreign operations. The Group applied fair value hedge accounting for the fair value interest rate risk on £200m of the Group’s fixed rate bonds and €78.5m Private Placement.
The movement on derivative financial instruments is detailed below:
The movement on the hedging reserve is detailed below:
Fuel swaps
£m
Interest rate swaps
£m
Cross currency
swaps £m
Foreign exchange
forward contracts
£m Total
£m
Net asset/(liability) at 1 January 2016 (83.8) 22.2 – 0.6 (61.0)
Transfers to the Income Statement on cash flow hedges 43.7 – – – 43.7
Cash settlements – – – 46.3 46.3
Revaluation through Income Statement – 0.5 – – 0.5
Revaluation through Other Comprehensive Income 27.0 – – – 27.0
Exchange differences – – 8.2 (50.8) (42.6)
Net asset/(liability) at 31 December 2016 (13.1) 22.7 8.2 (3.9) 13.9
Fuel swaps
£m
Interest rate swaps
£m
Foreign exchange
forward contracts
£m Total
£m
Net asset/(liability) at 1 January 2015 (71.3) 26.5 0.9 (43.9)
Transfers to the Income Statement on cash flow hedges 38.6 – – 38.6
Cash settlements – – 8.6 8.6
Revaluation through Income Statement – (4.3) – (4.3)
Revaluation through Other Comprehensive Income (51.1) – – (51.1)
Exchange differences – – (8.9) (8.9)
Net asset/(liability) at 31 December 2015 (83.8) 22.2 0.6 (61.0)
2016
£m 2015
£m
At 1 January (67.5) (52.3)
Transferred to Income Statement 43.7 36.1
Revaluation through Other Comprehensive Income 27.0 (51.1)
Exchange differences 11.8 (1.4)
Tax on revaluation (12.2) 1.2
At 31 December 2.8 (67.5)
ANNUAL REPORT AND ACCOUNTS 2016 / NATIONAL EXPRESS GROUP PLC 177177Annual Report and Accounts 2016 / National Express Group PLC

178 NATIONAL EXPRESS GROUP PLC / ANNUAL REPORT AND ACCOUNTS 2016
Financial statements
Notes to the Consolidated Accounts continued For the year ended 31 December 2016
31 Financial instruments (including cash, trade receivables and payables) continued Hedge of net investments in foreign entities The Group uses foreign currency borrowings and derivative financial instruments to hedge the net investment in material foreign currency net assets of the Group which are used to reduce the exposure to foreign exchange rate movements. At 31 December 2016, the Group had designated €41.9m of synthetic debt in the form of foreign exchange derivatives, €222.7m in cross currency interest rate swaps and €78.5m Private Placement as net investment hedges of the net assets of its Spanish subsidiaries. Similarly, USD236.4m and CAD52.2m of synthetic debt in the form of foreign exchange derivatives were designated as a hedge of the net assets of the Group’s North America subsidiaries. No ineffectiveness was recognised in relation to these hedges.
Fuel derivatives The Group has a number of fuel derivatives in place to hedge the different types of fuel used in each division. Fuel swaps are used to match the timing, type of fuel and currency in which the domestic physical fuel is purchased as closely as possible, with hedges currently in place from 2017 through to 2020.
During the year £27.0m of fair value gains (2015: £51.1m losses) have been transferred to the hedging reserve due to movements in market fuel prices. A fair value loss of £43.7m (2015: £38.6m loss) has been transferred from the hedging reserve to the Income Statement following settlement of fuel trades, of which £31.7m was recognised in the hedging reserve at 1 January 2016 and the remainder was generated during the year due to the movement in market fuel prices. In addition, a gain of £nil was recognised in the Income Statement in relation to hedge ineffectiveness (2015: £2.5m).
Fuel derivatives can be analysed as follows:
Interest rate swaps at fair value through profit or loss In July 2010, the Group entered into four £50m denominated interest rate swaps on a total of £200m of the Group’s Sterling bonds. These interest rate swaps all pay floating interest (LIBOR + a margin) semi-annually, receive fixed interest annually with maturities matching the Group’s Sterling bonds (two swaps with total notional value of £100m mature in January 2017, two swaps with notional value of £100m mature in June 2020) and are designated as a fair value hedge of the interest rate risk on £200m of these bonds. These swaps are measured at fair value through profit or loss, with any gains or losses being taken immediately to the Income Statement to offset any fair value gains or losses due to changes in the risk free interest rate on the swapped portion of the bonds. As at 31 December 2016, a total fair value loss of £0.9m was recognised in the Income Statement in relation to these swaps. This is offset by a fair value gain of £0.7m on the underlying hedged item, in this case changes in fair value on the £200m of the Group’s bonds due to changes in the risk free interest rate.
In September 2012, the Group entered into two €39.25m denominated interest rate swaps equal in value to the Euro Private Placement. These interest rate swaps all pay floating interest (EURIBOR + a margin) semi-annually, receive fixed interest annually with maturities matching the Euro Private Placement and are designated as a fair value hedge of the interest rate risk on the Private Placement. These swaps are measured at fair value through profit and loss, with any gains or losses being taken immediately to the Income Statement to offset any fair value gains or losses due to changes in the risk free rate on the Euro Private Placement. As at 31 December 2016, a total fair value gain of £1.0m was recognised in the Income Statement in relation to these swaps. This is offset by a fair value loss of £1.0m on the underlying hedged item, in this case changes in fair value of the Euro Private Placement due to changes in the risk free interest rate.
31 December 2016
Fair value £m
31 December 2015
Fair value £m
31 December 2016
Volume million litres
31 December 2015
Volume million litres
Hedge fuel derivatives
Sterling denominated – UK Bus and UK Coach (2.2) (18.0) 80.8 80.0
Euro denominated – Spain and Morocco (7.7) (13.1) 82.3 88.0
US Dollar denominated – North America (7.6) (13.1) 53.2 50.7
Fuel derivatives included in current assets/(liabilities) (17.5) (44.2) 216.3 218.7
Sterling denominated – UK Bus and UK Coach 0.8 (13.0) 117.7 89.0
Euro denominated – Spain and Morocco 2.2 (16.1) 123.6 111.2
US Dollar denominated – North America 1.4 (10.5) 90.2 60.9
Fuel derivatives included in non-current assets/(liabilities) 4.4 (39.6) 331.5 261.1
Total hedge fuel derivatives (13.1) (83.8) 547.8 479.8
Financial Statements
NATIONAL EXPRESS GROUP PLC / ANNUAL REPORT AND ACCOUNTS 2016178178 National Express Group PLC / Annual Report and Accounts 2016
Notes to the Consolidated Accounts continued For the year ended 31 December 2016

ANNUAL REPORT AND ACCOUNTS 2016 / NATIONAL EXPRESS GROUP PLC 179
32 Called-up share capital
The total number of share options exercised in the year by employees of the Group was 2,422,638 (2015: 824,029) of which 1,981,675 (2015: 797,801) exercises were satisfied by transferring shares from the National Express Employee Benefit Trust. The remaining exercises were settled via a direct purchase of shares from the open market.
Own shares Own shares comprises 2,260,292 (2015: 2,495,467) ordinary shares in the Company that have been purchased by the trustees of the National Express Employee Benefit Trust (the ‘Trust’). During the year, the Trust purchased 1,746,500 (2015: 2,740,000) shares and 1,981,675 (2015: 797,801) shares were used to satisfy options granted under a number of the Company’s share schemes. Nil (2015: nil) shares were sold during the year to the open market.
The market value of the shares held by the Trust at 31 December 2016 was £8.0m (2015: £8.3m). The dividends payable on 2,090,464 of these shares have been waived (2015: 2,418,824).
33 Other reserves
Merger reserve
£m
Hedging reserve
£m
Translation reserve
£m Total
£m
At 1 January 2016 15.4 (67.5) (28.0) (80.1)
Hedge movements, net of tax – 70.3 – 70.3
Exchange differences, net of tax – – 203.9 203.9
At 31 December 2016 15.4 2.8 175.9 194.1
The nature and purpose of the other reserves are as follows:
• The merger reserve includes the premium on shares issued to satisfy the purchase of Prism Rail PLC in 2000 • The hedging reserve records the movements on designated hedging items, offset by any movements recognised in equity
on underlying hedged items • The translation reserve records exchange differences arising from the translation of the accounts of foreign currency denominated
subsidiaries offset by the movements on loans and derivatives used to hedge the net investment in foreign subsidiaries
2016
£m 2015
£m
At 31 December:
Authorised:
800,000,000 (2015: 800,000,000) ordinary shares of 5p each 40.0 40.0
Issued called-up and fully paid:
511,738,648 (2015: 511,738,648) ordinary shares of 5p each 25.6 25.6
Merger reserve
£m
Hedging reserve
£m
Translation reserve
£m Total
£m
At 1 January 2015 15.4 (52.3) 4.1 (32.8)
Hedge movements, net of tax – (15.2) – (15.2)
Exchange differences, net of tax – – (32.1) (32.1)
At 31 December 2015 15.4 (67.5) (28.0) (80.1)
ANNUAL REPORT AND ACCOUNTS 2016 / NATIONAL EXPRESS GROUP PLC 179179Annual Report and Accounts 2016 / National Express Group PLC

180 NATIONAL EXPRESS GROUP PLC / ANNUAL REPORT AND ACCOUNTS 2016
Financial statements
Notes to the Consolidated Accounts continued For the year ended 31 December 2016
34 Pensions and other post-employment benefits (a) Summary of pension benefits and assumptions The UK Bus division and National Express Group PLC (the ‘Company’) operate defined benefit schemes. The Company defined benefit scheme also includes certain employees of the UK Coach division. In addition, a defined contribution scheme operates for staff in the UK Bus and UK Coach divisions and the Company.
The majority of employees of the UK Rail companies are members of the appropriate shared cost section of the Railways Pension Scheme (‘RPS’), a funded defined benefit scheme. For 2016, the scheme relating to NXET Trains Limited has been recognised within assets held for sale (note 11). The Group retains the defined benefit scheme for National Express Services Limited and recognises it as a continuing asset.
The assets of the above defined benefit schemes are held separately from those of the Group and contributions to the schemes are determined by independent professionally qualified actuaries.
Subsidiaries in North America contribute to a number of defined contribution plans. The Group also provides certain additional unfunded post-employment benefits to employees in North America and Spain, which are disclosed in section (c) in the ‘Other’ category.
In 2011, UK Bus agreed a £5.5m annual deficit repayment plan with the trustees of the West Midlands Integrated Transport Authority Pension Fund, which continues until March 2017. A new agreement is currently being finalised and is expected to result in a revised repayment plan of approximately £8.0m per annum. This will fund a £104m scheme funding deficit over 14 years. The plan remains open to accrual for existing members only.
The total pension cost charged to operating profit in the year for the continuing Group was £7.4m (2015: £8.2m), of which £3.7m (2015: £3.9m) relates to the defined contribution schemes.
The defined benefit pension (liability)/asset included in the Balance Sheet is as follows:
2016
£m 2015
£m
UK Rail – 14.8
Company 44.5 34.9
Pension assets 44.5 49.7
UK Bus (128.5) (60.4)
UK Rail (1.5) –
Other (2.7) (1.9)
Pension liabilities (132.7) (62.3)
Total (88.2) (12.6)
Financial Statements
NATIONAL EXPRESS GROUP PLC / ANNUAL REPORT AND ACCOUNTS 2016180180 National Express Group PLC / Annual Report and Accounts 2016
Notes to the Consolidated Accounts continued For the year ended 31 December 2016

ANNUAL REPORT AND ACCOUNTS 2016 / NATIONAL EXPRESS GROUP PLC 181
34 Pensions and other post-employment benefits continued (a) Summary of pension benefits and assumptions continued Key risks relating to the Group’s defined benefit pension schemes are as follows:
Investment risk The present value of scheme liabilities are calculated using a discount rate set with reference to corporate bond yields; if the return on scheme assets is below this yield, it will create a deficit. The UK Bus and Rail schemes hold a significant proportion of return-seeking assets (equities and diversified growth funds) which, though expected to outperform corporate bonds in the long term, create volatility and risk in the short term. The Company scheme, which holds a net surplus position and is closed to future accrual, primarily holds bonds.
Interest risk A decrease in bond interest rates will increase scheme liabilities but this will be partially offset by an increase in the returns on the scheme assets.
Inflation risk A significant proportion of the schemes’ obligations are linked to inflation, and higher inflation will lead to higher liabilities. The Group has some inflation linking in its revenue streams, which helps to offset this risk. In addition, the UK Bus schemes hold a small proportion of index-linked bonds which will help to protect against this risk and the Company scheme holds a liability driven investment portfolio which seeks to hedge against inflation.
Longevity risk The majority of the schemes’ obligations are to provide benefits for the life of the member, so increases in life expectancy will result in an increase in the liabilities. The Company scheme is closed to future accrual, thereby reducing exposure to increases in longevity risk. The UK Bus schemes include a buy-in policy covering part of the pensioner members’ liabilities, which partly helps to mitigate longevity risk
Legislative risk Future legislative changes are uncertain. In the past these have led to both increases in obligations, for example reduced investment return through the ability to reclaim Advance Corporation Tax, and decreases in obligations, for example through the ability to use CPI inflation instead of RPI to set pension increase rates. The Company scheme is closed to future accrual, thereby reducing exposure to legislative change. For the remaining schemes the Group receives professional advice on the impact of legislative changes.
ANNUAL REPORT AND ACCOUNTS 2016 / NATIONAL EXPRESS GROUP PLC 181181Annual Report and Accounts 2016 / National Express Group PLC

182 NATIONAL EXPRESS GROUP PLC / ANNUAL REPORT AND ACCOUNTS 2016
Financial statements
34 Pensions and other post-employment benefits continued (a) Summary of pension benefits and assumptions continued The valuations conducted for financial reporting purposes are based on the triennial actuarial valuations. A summary of the latest triennial actuarial valuations, and assumptions made, is as follows:
* Amounts included in the Income Statement, Other Comprehensive Income and the Balance Sheet are calculated using the projected unit method.
The most recent triennial valuations are then updated by independent professionally qualified actuaries for financial reporting purposes, in accordance with IAS 19. The main actuarial assumptions underlying the IAS 19 valuations are:
UK Bus UK Rail Company
Date of actuarial valuation
Tayside 31 March
2014
Travel West Midlands 31 March
2013 31 December
2013 5 April 2016
Actuarial method used Attained age* Attained age* Projected unit Projected unit Rate of investment returns per annum 3.4%-5.9% 3.5%-5.5% 5.0%-7.3% 0%-2.1% Increase in earnings per annum 4.6% 2.6% 4.2% –% Scheme assets taken at market value £54.2m £448.9m £82.4m £114.8m Funding level 100% 84% 84%-100% 97%
2016 2015
UK Bus UK Rail Company UK Bus UK Rail Company
Rate of increase in salaries 2.5% 2.9% 2.5% 2.5% 2.6% 2.5% Rate of increase of pensions 2.4% 2.4% 3.3% 2.1% 2.1% 3.1% Discount rate 2.7% 2.7% 2.7% 3.9% 3.9% 3.9% Inflation assumption (RPI) 3.4% 3.4% 3.4% 3.1% 3.1% 3.1% Inflation assumption (CPI) 2.4% 2.4% 2.4% 2.1% 2.1% 2.1% Post-retirement mortality in years: Current pensioners at 65 – male 21.4 23.0 21.3 24.4 Current pensioners at 65 – male, pension under £10,300 pa or pensionable pay under £35,000 pa 21.2 21.0 Current pensioners at 65 – male – others 23.6 23.4 Current pensioners at 65 – female 24.2 25.8 24.1 26.9 Current pensioners at 65 – female, pension under £3,700 pa or pensionable pay under £35,000 pa 23.0 22.8 Current pensioners at 65 – female – others 24.8 24.6 Future pensioners at 65 – male 22.8 24.9 22.7 26.2 Future pensioners at 65 – male, pension under £10,300 pa or pensionable pay under £35,000 pa 23.6 23.3 Future pensioners at 65 – male – others 25.9 25.7 Future pensioners at 65 – female 25.7 27.5 25.6 28.9 Future pensioners at 65 – female, pension under £3,700 pa or pensionable pay under £35,000 pa 25.4 25.2 Future pensioners at 65 – female – others 27.2 27.0
Financial Statements
NATIONAL EXPRESS GROUP PLC / ANNUAL REPORT AND ACCOUNTS 2016182182 National Express Group PLC / Annual Report and Accounts 2016
Notes to the Consolidated Accounts continued For the year ended 31 December 2016

ANNUAL REPORT AND ACCOUNTS 2016 / NATIONAL EXPRESS GROUP PLC 183
Notes to the Consolidated Accounts continued For the year ended 31 December 2016
34 Pensions and other post-employment benefits continued (a) Summary of pension benefits and assumptions continued The demographic assumptions reflect those adopted in the most recent triennial actuarial valuation. For the UK Rail scheme, mortality assumptions have been set by reference to the recent experience of the scheme. Mortality is assumed to improve in the future in line with the ‘core projection’ model published by the actuarial profession’s Continuous Mortality Investigation, incorporating a long-term improvement rate of 1.5% pa.
The Directors regard the assumption around the discount rate to be the key assumption in the IAS 19 valuation, and the following table provides an approximate sensitivity analysis of the impact of a 0.1% change in the discount rate assumption:
Scheme assets are stated at their market values at the respective Balance Sheet dates. The expected rate of return on scheme assets is determined based on market returns on each category of scheme assets.
(b) Accounting for the Railways Pension Scheme The majority of employees of the UK Rail companies are members of the appropriate section of the RPS, a funded defined benefit scheme. The RPS is a shared cost scheme, which means that costs are formally shared 60% by the employer and 40% by the employee. To date, the Group has experienced 12 changes of rail franchise ownership where the current owner has funded the scheme during the franchise term and the pension deficit at franchise exit has transferred to the new owner, without cash settlement. By entering into the franchise contract, the TOC becomes the designated employer for the term of the contract and under the rules of the RPS must fund its share of the pension liability in accordance with the schedule of contributions agreed with the scheme trustees and actuaries.
In determining the appropriate accounting policy for the RPS to ensure that the Group’s accounts present fairly its financial position, financial performance and cash flows, management has consulted with TOC industry peers and has concluded that the Group’s constructive obligations should be accounted for in accordance with IAS 19. This accounting policy, which in all other respects is consistent with that set out in this note for the Group’s other defined benefit schemes, means that the Group’s accounts reflect that element of the deficits anticipated to be settled by the Group during the franchise term and will prevent gains arising on transfer of the existing RPS deficits to a new owner at franchise exit.
In calculating the Group’s constructive obligations in respect of the RPS, the Group has calculated the total pension deficits in each of the RPS sections in accordance with IAS 19 and the assumptions set out above. These deficits are reduced by a ‘franchise adjustment’ which is that portion of the deficit projected to exist at the end of the franchise and which the Group will not be required to fund. The franchise adjustment, which has been calculated by the Group’s actuaries, is offset against the present value of the RPS liabilities so as to fairly present the financial performance, position and cash flows of the Group’s obligations.
The franchise adjustment (which all related to National Express Essex Thameside) increased from £35.6m at 31 December 2015 to £80.6m at 31 December 2016. The principal reason for the movement was changes in financial assumptions and their impact on actuarial movements in the year. In the prior year, the franchise adjustment increased from £30.8m at 31 December 2014 to £35.6m at 31 December 2015. The principal reasons for the movement were increased interest and administrative expenses, partly offset by a reduction in actuarial movements.
UK Bus
£m Company
£m
Defined benefit pension (liability)/asset at 31 December 2016 (128.5) 44.5
Effect of a 0.1% increase in the discount rate 10.4 2.0
Current service cost for the year ended 31 December 2016 (3.5) –
Effect of a 0.1% increase in the discount rate 0.1 –
ANNUAL REPORT AND ACCOUNTS 2016 / NATIONAL EXPRESS GROUP PLC 183183Annual Report and Accounts 2016 / National Express Group PLC

184 NATIONAL EXPRESS GROUP PLC / ANNUAL REPORT AND ACCOUNTS 2016
Financial statements
34 Pensions and other post-employment benefits continued (c) Financial results for pension benefits For the continuing Group, the amounts charged to the Group Income Statement and Group Statement of Comprehensive Income for the years ended 31 December 2016 and 2015 are set out in the following tables:
Group Income Statement
UK Bus 2016
£m
Company 2016
£m
Other 2016
£m
Total 2016
£m
Amounts (charged)/credited:
Current service cost (3.2) – (0.3) (3.5)
Net interest (expense)/income (2.2) 1.3 (0.1) (1.0)
Total continuing (charge)/credit to Income Statement (5.4) 1.3 (0.4) (4.5)
During the year £0.2m (2015: £0.4m) of administrative expenses were incurred.
The net interest expense together with the interest on franchise adjustment has been included within Finance Costs (see note 9).
Group Statement of Comprehensive Income
UK Bus 2016 £m
UK Rail* 2016
£m
Company 2016
£m
Total 2016
£m
Actuarial (loss)/gain during the period from obligations (132.4) 10.0 (19.8) (142.2)
Expected return on plan assets greater/less than discount rate 57.8 7.7 28.1 93.6
Change in asset ceiling 3.0 – – 3.0
Net actuarial (losses)/gains (71.6) 17.7 8.3 (45.6)
*includes movements in the NXET Trains Limited Section of the RPS
Group Income Statement
UK Bus 2015
£m
Company 2015
£m
Other 2015
£m
Total (restated)
2015 £m
Amounts (charged)/credited:
Current service cost (3.6) – (0.3) (3.9)
Net interest (expense)/income (1.7) 1.2 – (0.5)
Total (charge)/credit to Income Statement (5.3) 1.2 (0.3) (4.4)
Group Statement of Comprehensive Income
UK Bus 2015 £m
UK Rail* 2015
£m
Company 2015
£m
Total 2015
£m
Actuarial gain during the period from obligations 9.7 3.8 1.3 14.8
Expected return on plan assets greater/less than discount rate (7.9) 1.1 (2.2) (9.0)
Change in asset ceiling (15.2) – – (15.2)
Net actuarial (losses)/gains (13.4) 4.9 (0.9) (9.4)
*includes movements in the NXET Trains Limited Section of the RPS
Financial Statements
NATIONAL EXPRESS GROUP PLC / ANNUAL REPORT AND ACCOUNTS 2016184184 National Express Group PLC / Annual Report and Accounts 2016
Notes to the Consolidated Accounts continued For the year ended 31 December 2016

ANNUAL REPORT AND ACCOUNTS 2016 / NATIONAL EXPRESS GROUP PLC 185
Notes to the Consolidated Accounts continued For the year ended 31 December 2016
34 Pensions and other post-employment benefits continued (c) Financial results for pension benefits continued The amounts recognised in the Balance Sheet at 31 December are:
As at 31 December 2016
UK Bus 2016 £m
UK Rail 2016
£m
Company 2016
£m
Other 2016
£m
Total 2016
£m
Equities 131.8 1.8 – – 133.6 Bonds 76.5 0.7 153.1 – 230.3 Property 4.9 – – – 4.9 Insurance policy 243.9 – – – 243.9 Diversified growth fund 81.1 – – – 81.1 Other 4.2 0.1 (18.9) – (14.6) Fair value of scheme assets 542.4 2.6 134.2 – 679.2 Present value of liabilities and defined benefit obligation (658.1) (4.1) (89.7) (2.7) (754.6) Asset ceiling (12.8) – – – (12.8) Defined benefit pension (deficit)/surplus (128.5) (1.5) 44.5 (2.7) (88.2)
As at 31 December 2015
UK Bus 2015 £m
UK Rail 2015
£m
Company 2015
£m
Other 2015
£m
Total 2015
£m
Equities 107.6 88.3 – – 195.9 Bonds 70.4 0.7 124.9 – 196.0 Property 4.8 – – – 4.8 Insurance policy 228.0 – – – 228.0 Diversified growth fund 75.0 – – – 75.0 Other (1.6) 0.7 (19.8) – (20.7) Fair value of scheme assets 484.2 89.7 105.1 – 679.0 Present value of scheme liabilities (529.4) (124.1) (70.2) (1.9) (725.6) Franchise adjustment – 35.6 – – 35.6 Defined benefit obligation (529.4) (88.5) (70.2) (1.9) (690.0) Asset ceiling (15.2) – – – (15.2) Members’ share of deficit – 13.6 – – 13.6 Defined benefit pension (deficit)/surplus (60.4) 14.8 34.9 (1.9) (12.6)
The movement in the present value of the defined benefit obligation in the year is as stated below. For UK Rail, the RPS is a shared cost scheme, which means that costs are formally shared 60% by the employer and 40% by the employee.
The Group’s defined benefit obligation comprises £751.9m (2015: £688.1m including the members’ share of the deficit) arising from plans that are wholly or partly funded and £2.7m (2015: £1.9m) from unfunded plans.
UK Bus
£m UK Rail
£m Company
£m Other
£m Total
£m
Defined benefit obligation at 1 January 2016 (529.4) (88.5) (70.2) (1.9) (690.0) Current service cost (3.2) (2.9) – (0.3) (6.4)
Past service credit – 4.9 – – 4.9 Benefits paid 27.8 2.8 2.9 – 33.5 Contributions by employees (1.0) (1.5) – – (2.5) Finance charge (19.9) (2.9) (2.6) – (25.4)
Interest on franchise adjustment – 1.4 – – 1.4
Members’ share of movement on liabilities – (20.9) – – (20.9) Actuarial (loss)/gain from changes in financial assumptions (133.7) 20.4 (23.8) – (137.1)
Actuarial gain arising from changes in demographics – – 4.3 – 4.3 Actuarial gain/(loss) arising from experience adjustments 1.3 (10.4) (0.3) – (9.4)
Movements arising from foreign exchange – – – (0.5) (0.5) Transferred to liabilities associated with assets held for sale – 93.5 – – 93.5 Defined benefit obligation at 31 December 2016 (658.1) (4.1) (89.7) (2.7) (754.6)
ANNUAL REPORT AND ACCOUNTS 2016 / NATIONAL EXPRESS GROUP PLC 185185Annual Report and Accounts 2016 / National Express Group PLC

186 NATIONAL EXPRESS GROUP PLC / ANNUAL REPORT AND ACCOUNTS 2016
Financial statements
34 Pensions and other post-employment benefits continued (c) Financial results for pension benefits continued
The movement in the fair value of scheme assets is as follows:
UK Bus
£m UK Rail
£m Company
£m Total
£m
Fair value of scheme assets at 1 January 2016 484.2 89.7 105.1 679.0
Expected return on plan assets 18.3 2.1 3.9 24.3
Expected return on plan assets greater/less than discount rate 57.8 7.7 28.1 93.6
Cash contributions – employer 9.1 2.3 – 11.4
Administrative expenses (0.2) (1.1) – (1.3)
Cash contributions – employee 1.0 1.5 – 2.5
Benefits paid (27.8) (2.8) (2.9) (33.5)
Members’ share of return on assets – 5.8 – 5.8
Transferred to assets held for sale – (102.6) – (102.6)
Fair value of scheme assets at 31 December 2016 542.4 2.6 134.2 679.2
UK Bus
£m UK Rail
£m Company
£m Total
£m
Fair value of scheme assets at 1 January 2015 493.4 84.4 101.8 679.6
Expected return on plan assets 17.4 1.8 3.7 22.9
Expected return on plan assets greater/less than discount rate (7.9) 1.1 (2.2) (9.0)
Cash contributions – employer 9.1 2.6 4.2 15.9
Administrative expenses (0.2) (0.2) (0.2) (0.6)
Cash contributions – employee 1.1 1.6 – 2.7
Benefits paid (28.7) (3.1) (2.2) (34.0)
Members’ share of return on assets – 1.5 – 1.5
Fair value of scheme assets at 31 December 2015 484.2 89.7 105.1 679.0
UK Bus
£m UK Rail
£m Company
£m Other
£m Total
£m
Defined benefit obligation at 1 January 2015 (544.0) (87.7) (71.2) (1.9) (704.8)
Current service cost (3.6) (2.9) – (0.3) (6.8)
Benefits paid 28.7 3.1 2.2 0.3 34.3
Contributions by employees (1.1) (1.6) – – (2.7)
Finance charge (19.1) (2.5) (2.5) – (24.1)
Interest on franchise adjustment – 1.1 – – 1.1
Members’ share of movement on liabilities – (1.8) – – (1.8)
Actuarial gain/(loss) from changes in financial assumptions 6.3 (0.4) 1.3 – 7.2
Actuarial gain arising from changes in demographics 0.2 – – – 0.2
Actuarial gain arising from experience adjustments 3.2 4.2 – – 7.4
Defined benefit obligation at 31 December 2015 (529.4) (88.5) (70.2) (1.9) (690.0)
Financial Statements
NATIONAL EXPRESS GROUP PLC / ANNUAL REPORT AND ACCOUNTS 2016186186 National Express Group PLC / Annual Report and Accounts 2016
Notes to the Consolidated Accounts continued For the year ended 31 December 2016

ANNUAL REPORT AND ACCOUNTS 2016 / NATIONAL EXPRESS GROUP PLC 187
Notes to the Consolidated Accounts continued For the year ended 31 December 2016
34 Pensions and other post-employment benefits continued (c) Financial results for pension benefits continued The Group expects to contribute £10.6m to its defined benefit pension plans in 2017.
The cumulative amount of actuarial gains and losses recognised in the Statement of Comprehensive Income since 1 January 2004 is a £114.2m loss (2015: £68.6m loss). The Directors are unable to determine how much of the pension scheme deficit recognised on transition to IFRSs and taken directly to equity of £51.9m is attributable to actuarial gains and losses since inception of those pension schemes. Consequently the Directors are unable to determine the amount of actuarial gains and losses that would have been recognised in the Statement of Comprehensive Income before 1 January 2004.
History of experience gains and losses: 2016
£m 2015
£m 2014 £m
2013 £m
2012 £m
UK Bus
Fair value of scheme assets 542.4 484.2 493.4 456.4 448.0
Present value of defined benefit obligation (658.1) (529.4) (544.0) (497.2) (480.9)
Asset ceiling (12.8) (15.2) – – –
Deficit in the scheme (128.5) (60.4) (50.6) (40.8) (32.9)
Experience adjustments arising on liabilities 1.3 3.2 (4.5) (2.9) 5.0
Experience adjustments arising on assets 57.8 (7.9) 32.7 1.4 8.6
UK Rail
Fair value of scheme assets 2.6 89.7 84.4 75.0 67.1
Present value of defined benefit obligation (4.1) (88.5) (87.7) (85.8) (81.2)
Members’ share of deficit – 13.6 13.3 10.4 12.3
Surplus/(deficit) in the scheme (1.5) 14.8 10.0 (0.4) (1.8)
Experience adjustments arising on liabilities 0.1 4.2 3.5 (0.1) 2.7
Experience adjustments arising on assets 0.3 1.1 3.1 2.0 8.0
Company
Fair value of scheme assets 134.2 105.1 101.8 74.6 73.1
Present value of defined benefit obligation (89.7) (70.2) (71.2) (62.0) (56.5)
Surplus in the scheme 44.5 34.9 30.6 12.6 16.6
Experience adjustments arising on liabilities (0.3) – – (3.8) –
Experience adjustments arising on assets 28.1 (2.2) 22.6 (2.8) 0.5
Other
Fair value of scheme assets – – – – –
Present value of defined benefit obligation (2.7) (1.9) (1.9) (1.5) (1.2)
Deficit in the scheme (2.7) (1.9) (1.9) (1.5) (1.2)
Experience adjustments arising on liabilities – – – – –
ANNUAL REPORT AND ACCOUNTS 2016 / NATIONAL EXPRESS GROUP PLC 187187Annual Report and Accounts 2016 / National Express Group PLC

188 NATIONAL EXPRESS GROUP PLC / ANNUAL REPORT AND ACCOUNTS 2016
Financial statements
35 Commitments and contingencies Operating lease commitments The Group’s total operating lease commitments are as follows:
Rail lease commitments Rail division companies have contracts with various bodies for access to the railway infrastructure (tracks, stations and depots). They also have contracts under which rolling stock is leased. The table below reflects the commitments up to the current franchise end dates (or the end of the current contract) unless an extension or new franchise agreement has been signed. The commitments are based on charges advised by the rail regulators or on separate leasing agreements with other counterparties. Commitments for future minimum rental payments under these contracts are shown below:
Fixed track access agreements have an average remaining life of 13.0 years (2015: 14.0 years) and other land and buildings have an average duration of 12.6 years (2015: 14.0 years). Rolling stock agreements have an average life of 11.3 years (2015: 11.7 years) and other plant and equipment 12.8 years (2015: 14.0 years).
Included in the above commitments is £369.9m relating to the National Express Essex Thameside franchise that was disposed of in February 2017 (see note 11). This comprised £82.4m of land and buildings commitments, and £287.5m of plant and equipment commitments.
2016
£m 2015
£m
Future minimum rentals payable under non-cancellable operating leases:
Within one year: Land and buildings 25.3 20.8
Plant and equipment 59.2 50.5
84.5 71.3
After one year but not more than five years: Land and buildings 65.9 54.3
Plant and equipment 224.5 191.0
290.4 245.3
More than five years: Land and buildings 81.8 84.6
Plant and equipment 484.0 475.2
565.8 559.8
940.7 876.4
Land and buildings Plant and equipment
Rail division commitments 2016
£m 2015
£m 2016
£m 2015
£m
Future minimum rentals payable under non-cancellable operating leases:
Within one year: Fixed track access 4.7 4.0 – –
Rolling stock – – 40.6 34.5
Other 1.7 1.6 – –
6.4 5.6 40.6 34.5
After one year but not more than five years: Fixed track access 18.7 15.8 – –
Rolling stock – – 190.6 153.3
Other 6.9 6.5 0.1 0.1
25.6 22.3 190.7 153.4
Over five years: Fixed track access 37.5 35.6 – –
Rolling stock – – 481.2 474.0
Other 13.3 14.6 0.2 0.2
50.8 50.2 481.4 474.2
82.8 78.1 712.7 662.1
Financial Statements
NATIONAL EXPRESS GROUP PLC / ANNUAL REPORT AND ACCOUNTS 2016188188 National Express Group PLC / Annual Report and Accounts 2016
Notes to the Consolidated Accounts continued For the year ended 31 December 2016

ANNUAL REPORT AND ACCOUNTS 2016 / NATIONAL EXPRESS GROUP PLC 189
Notes to the Consolidated Accounts continued For the year ended 31 December 2016
35 Commitments and contingencies continued Other lease commitments Outside of the Rail division the Group has entered into operating leases on certain properties, public service vehicles and various items of plant and equipment. Commitments for future minimum rental payments under non-cancellable operating leases are shown below:
The average remaining life of operating lease commitments in the other divisions is 4.8 years (2015: 5.3 years) for land and buildings, 3.2 years (2015: 3.4 years) for public service vehicles and 2.3 years (2015: 3.2 years) for other plant and equipment.
Operating lease agreements where the Group is the lessor The Group receives rent on properties as follows:
The leases have an average unexpired duration of 8.0 years (2015: 6.4 years). All the above relate to agreements with the National Express Essex Thameside franchise.
Finance lease commitments The Group has finance leases for public service vehicles and various items of plant and equipment. These leases have terms of renewal but no purchase options and escalation clauses. Renewals are at the option of the specific entity that holds the lease.
Capital commitments
The Group is committed to vehicle purchases and various land and buildings improvements. The commitments include £7.9m of orders placed by the National Express Essex Thameside franchise.
Land and buildings Public service vehicles Other
Other divisions’ commitments 2016
£m 2015
£m 2016
£m 2015
£m 2016
£m 2015
£m
Within one year 18.9 15.2 16.4 14.3 2.2 1.7
After one year but not more than five years 40.3 32.0 31.1 33.9 2.7 3.7
More than five years 31.0 34.4 2.6 1.0 – –
90.2 81.6 50.1 49.2 4.9 5.4
2016
£m 2015
£m
Future minimum rentals receivable under non-cancellable operating leases:
Within one year 0.1 0.1
After one year but not more than five years 3.2 2.8
Over five years 4.0 2.8
7.3 5.7
2016 2015
Minimum payments
£m
Present value of payments
£m
Minimum payments
£m
Present value of payments
£m
Within one year 59.5 55.9 30.9 27.9
After one year but not more than five years 93.1 87.6 95.5 91.5
More than five years 16.4 16.0 8.4 8.2
Total minimum lease payments 169.0 159.5 134.8 127.6
Less future financing charges (9.5) – (7.2) –
Present value of minimum lease payments 159.5 159.5 127.6 127.6
2016
£m 2015
£m
Contracted 55.0 53.0
ANNUAL REPORT AND ACCOUNTS 2016 / NATIONAL EXPRESS GROUP PLC 189189Annual Report and Accounts 2016 / National Express Group PLC

190 NATIONAL EXPRESS GROUP PLC / ANNUAL REPORT AND ACCOUNTS 2016
Financial statements
35 Commitments and contingencies continued Contingent liabilities Guarantees The Group has guaranteed credit facilities totalling £36.1m (2015: £36.4m) of certain joint ventures.
Bonds and letters of credit In the ordinary course of business, the Group is required to issue counter-indemnities in support of its operations. As at 31 December 2016, there were Rail performance bonds of £64.1m (2015: £63.3m) and Rail season ticket bonds of £22.5m (2015: £21.9m). The Group has other performance bonds which include performance bonds in respect of businesses in the US of £159.5m (2015: £95.8m) and in Spain of £41.4m (2015: £66.1m). There are also bonds of £6.5m relating to operations in the Middle East (2015: £8.1m). Letters of credit have been issued to support insurance retentions of £91.5m (2015: £66.1m).
Tax Tax authorities in the markets in which we operate (UK, Spain, Germany, the US, Canada and Morocco) carry out tax audits from time to time. As was detailed in note 10(d) Tax provisions, the current ongoing tax audits relate to our Moroccan business where we expect an outcome with any tax payment made to be immaterial to the tax charge.
The Directors are satisfied that, based on current knowledge, adequate tax provisions are held to cover any tax uncertainties. The Group has tax provisions at 31 December 2016 of £5.4m (2015: £12.7m). There are no material contingent liabilities relating to tax.
36 Related party transactions
A number of Spanish companies have leased properties from companies related to the Cosmen family. Jorge Cosmen is a Non-Executive Director of the Group and was appointed as Deputy Chairman in October 2008. These leases were in place before the Group’s acquisition of ALSA and are for appropriate market rates.
The details of the post-employment benefit plans operated for the benefit of employees of the Group are disclosed in note 34.
Compensation of key management personnel of the Group
Amount of transactions Amounts due from related parties Amounts due to related parties
2016
£m 2015
£m 2016 £m
2015 £m
2016 £m
2015 £m
Joint ventures
Spain joint venture – – – 0.2 – –
Associates
Spain associates 2.5 1.6 1.2 0.9 (1.7) (0.8)
Trade investments
Spain trade investments 4.8 3.8 0.2 0.3 (0.7) (0.4)
Property transactions
North America – 0.8 – – – –
Spain 3.9 3.1 0.4 0.3 (0.1) (0.1)
Total other related parties 8.7 7.7 0.6 0.6 (0.8) (0.5)
Total 11.2 9.3 1.8 1.7 (2.5) (1.3)
2016
£m 2015
£m
Total compensation paid to key management personnel (note 7) 4.1 3.3
Financial Statements
NATIONAL EXPRESS GROUP PLC / ANNUAL REPORT AND ACCOUNTS 2016190190 National Express Group PLC / Annual Report and Accounts 2016
Notes to the Consolidated Accounts continued For the year ended 31 December 2016

ANNUAL REPORT AND ACCOUNTS 2016 / NATIONAL EXPRESS GROUP PLC 191
Notes to the Consolidated Accounts continued For the year ended 31 December 2016
37 Cash flow statement The net cash inflows from operating activities include outflows of £4.9m (2015: £10.0m) from continuing operations which are related to exceptional costs incurred in 2014.
(a) Reconciliation of Group profit before tax to cash generated from operations
(b) Analysis of changes in net debt
* Excludes accrued interest on long-term borrowings.
Total operations 2016
£m 2015
£m
Net cash inflow from operating activities
Profit before tax 141.2 124.4
Net finance costs 50.0 45.2
Share of post-tax results under the equity method (1.1) (1.8)
Depreciation of property, plant and equipment 123.0 104.3
Intangible asset amortisation 33.8 25.7
Amortisation of fixed asset grants (0.5) (0.6)
Profit on disposal of property, plant and equipment (5.9) (2.3)
Share-based payments 4.1 3.2
Decrease/(increase) in inventories 1.1 (0.7)
Increase in receivables (42.5) (32.7)
Increase in payables 23.6 34.8
Increase/(decrease) in provisions 3.4 (35.4)
Cash generated from operations 330.2 264.1
At 1 January
2016 £m
Cash flow £m
Acquisitions £m
Exchange differences
£m
Other movements
£m
At 31 December
2016 £m
Cash 59.2 (2.2) 9.1 6.2 – 72.3 Overnight deposits 0.7 2.8 – – – 3.5 Other short-term deposits 0.5 248.1 – – – 248.6 Cash and cash equivalents 60.4 248.7 9.1 6.2 – 324.4 Other debt receivables 0.8 (0.4) – 0.1 – 0.5 Borrowings: Bank and other loans (45.3) 42.8 (0.2) (9.2) (1.2) (13.1) Bonds (583.5) (398.9) – – (0.8) (983.2) Cross currency swaps – – – – 11.1 11.1 Fair value of hedging derivatives 14.3 – – – 0.1 14.4 Finance lease obligations (127.6) 37.9 (6.0) (24.3) (39.7) (159.7) Other debt payable (64.6) 2.4 – (9.2) (1.0) (72.4) Total borrowings (806.7) (315.8) (6.2) (42.7) (31.5) (1,202.9) Net debt* (745.5) (67.5) 2.9 (36.4) (31.5) (878.0)
ANNUAL REPORT AND ACCOUNTS 2016 / NATIONAL EXPRESS GROUP PLC 191191Annual Report and Accounts 2016 / National Express Group PLC

192 NATIONAL EXPRESS GROUP PLC / ANNUAL REPORT AND ACCOUNTS 2016
Financial statements
37 Cash flow statement continued (b) Analysis of changes in net debt continued Short-term deposits included within liquid resources relate to term deposits repayable within three months.
Borrowings include non-current interest-bearing borrowings of £816.7m (2015: £752.3m) as disclosed in note 28.
Other non-cash movements in net debt include finance lease additions of £39.7m (2015: £34.3m) and a £2.7m reduction from the amortisation of loan and bond arrangement fees (2015: £2.0m). A £0.1m increase to the fair value of the hedging derivatives is offset by opposite movements in the fair value of the related hedged borrowings. This comprises a £0.7m fair value increase in bonds and a £1.0m fair value decrease in other debt payable. In addition, non-cash movements include a fair value foreign exchange gain of £11.1m arising from cross currency swaps.
* Excludes accrued interest on long-term borrowings.
(c) Reconciliation of net cash flow to movement in net debt
38 Post Balance Sheet events On 13 January 2017, the Group repaid the £350m 2017 Sterling bond that is disclosed within current borrowings (note 29).
On 10 February 2017, the Group disposed of the National Express Essex Thameside ‘c2c’ franchise to Trenitalia. Details are provided in note 11.
The transaction will be accounted for in the Financial Statements for the year ending 31 December 2017. The consideration received was £72.6m and a further £35.0m was received to settle intercompany loans. This transaction, including anticipated costs of right sizing the UK business post UK Rail, has resulted in a small profit on disposal.
At 1 January
2015 £m
Cash flow £m
Acquisitions £m
Exchange differences
£m
Other movements
£m
At 31 December
2015 £m
Cash 36.3 20.1 3.4 (0.6) – 59.2
Overnight deposits 6.9 (6.2) – – – 0.7
Other short-term deposits 40.5 (40.0) – – – 0.5
Cash and cash equivalents 83.7 (26.1) 3.4 (0.6) – 60.4
Other debt receivables 0.8 – – – – 0.8
Borrowings:
Bank and other loans (5.2) (42.3) – 2.8 (0.6) (45.3)
Bonds (585.3) – – – 1.8 (583.5)
Fair value of hedging derivatives 18.6 – – – (4.3) 14.3
Finance lease obligations (110.5) 25.8 (3.4) (5.2) (34.3) (127.6)
Other debt payable (66.4) (2.0) – 3.1 0.7 (64.6)
Total borrowings (748.8) (18.5) (3.4) 0.7 (36.7) (806.7)
Net debt* (664.3) (44.6) – 0.1 (36.7) (745.5)
2016
£m 2015
£m
Increase/(decrease) in cash and cash equivalents in the year 257.8 (26.1)
Cash outflow from movement in other debt receivables (0.4) –
Cash outflow from movement in debt and finance leases (322.0) (18.5)
Change in net debt resulting from cash flows (64.6) (44.6)
Change in net debt resulting from non-cash movements (67.9) (36.6)
Movement in net debt in the year (132.5) (81.2)
Opening net debt (745.5) (664.3)
Net debt (878.0) (745.5)
Financial Statements
NATIONAL EXPRESS GROUP PLC / ANNUAL REPORT AND ACCOUNTS 2016192192 National Express Group PLC / Annual Report and Accounts 2016
Notes to the Consolidated Accounts continued For the year ended 31 December 2016

ANNUAL REPORT AND ACCOUNTS 2016 / NATIONAL EXPRESS GROUP PLC 193
Notes to the Consolidated Accounts continued For the year ended 31 December 2016
39 Subsidiary undertakings
A full list of subsidiaries, joint ventures and companies in which National Express Group has a controlling interest as at 31 December 2016 is shown below, along with the country of incorporation and the effective percentage of equity owned.
Name and country of incorporation % equity
interest
United Kingdom
Airlinks The Airport Coach Company Limited, National
Express House, Mill Lane, Digbeth, Birmingham, B5 6DD 100
Altram LRT Limited, National Express House, Mill Lane,
Digbeth, Birmingham, B5 6DD 100
c2c Rail Limited, National Express House, Mill Lane,
Digbeth, Birmingham, B5 6DD 100
Central Trains Limited, National Express House, Mill Lane,
Digbeth, Birmingham, B5 6DD 100
E Clarke & Son (Coaches) Limited, National Express
House, Mill Lane, Digbeth, Birmingham, B5 6DD 100
Eurolines (UK) Limited, National Express House,
Mill Lane, Digbeth, Birmingham, B5 6DD 100
Helium Miracle 236 Limited, National Express House,
Mill Lane, Digbeth, Birmingham, B5 6DD 100
Inter-Capital and Regional Rail Limited, National Express
House, Mill Lane, Digbeth, Birmingham, B5 6DD 40
London Eastern Railway Limited, National Express
House, Mill Lane, Digbeth, Birmingham, B5 6DD 100
Maintrain Limited, National Express House, Mill Lane,
Digbeth, Birmingham, B5 6DD 100
Midland Main Line Limited, National Express House,
Mill Lane, Digbeth, Birmingham, B5 6DD 100
National Express East Anglia Trains Limited, National
Express House, Mill Lane, Digbeth, Birmingham, B5 6DD 100
National Express European Holdings Limited (05652775)*, National Express House, Mill Lane,
Digbeth, Birmingham, B5 6DD 100
National Express Finance Company Limited, National
Express House, Mill Lane, Digbeth, Birmingham, B5 6DD 100
National Express Group Holdings Limited (04339932)*, National Express House, Mill Lane, Digbeth,
Birmingham, B5 6DD 100
National Express Holdings Limited (02156473)*, National
Express House, Mill Lane, Digbeth, Birmingham, B5 6DD 100
National Express Intermediate Holdings Limited, National
Express House, Mill Lane, Digbeth, Birmingham, B5 6DD 100
National Express Limited, National Express House,
Mill Lane, Digbeth, Birmingham, B5 6DD 100
National Express Manchester Metrolink Limited, 51 Bordesley Green, Birmingham, B9 4BZ 100
Name and country of incorporation % equity
interest
United Kingdom continued
National Express North America Holdings Limited (07855182)*, National Express House, Mill Lane, Digbeth,
Birmingham, B5 6DD 100
National Express Operations (Stansted) Limited, Heathrow Coach Centre, Sipson Road, West Drayton,
Middlesex, UB7 0HN 100
National Express Operations Limited, Heathrow Coach Centre, Sipson Road, West Drayton,
Middlesex, UB7 0HN 100
National Express Petermann UK Limited (07855188)*, National Express House, Mill Lane, Digbeth,
Birmingham, B5 6DD 100
National Express Rail Replacement Limited, National
Express House, Mill Lane, Digbeth, Birmingham, B5 6DD 100
National Express Services Limited, National Express
House, Mill Lane, Digbeth, Birmingham, B5 6DD 100
National Express Spanish Holdings Limited, National
Express House, Mill Lane, Digbeth, Birmingham, B5 6DD 100
National Express Trains Limited, National Express House,
Mill Lane, Digbeth, Birmingham, B5 6DD 100
National Express Transport Holdings Limited (04338163)*, National Express House, Mill Lane,
Digbeth, Birmingham, B5 6DD 100
National Express UK Limited, National Express House,
Mill Lane, Digbeth, Birmingham, B5 6DD 100
NE Canada Limited (08596333)*, National Express
House, Mill Lane, Digbeth, Birmingham, B5 6DD 100
NE Durham UK Limited (08270480)*, National Express
House, Mill Lane, Digbeth, Birmingham, B5 6DD 100
NE Europe Finance Limited (07876047)*, National
Express House, Mill Lane, Digbeth, Birmingham, B5 6DD 100
NE No.1 Ltd, National Express House, Mill Lane,
Digbeth, Birmingham, B5 6DD 100
NE No.2 Ltd, National Express House, Mill Lane,
Digbeth, Birmingham, B5 6DD 100
NE Trains South Limited, National Express House,
Mill Lane, Digbeth, Birmingham, B5 6DD 100
NX Bahrain Bus Company Plc, National Express House,
Mill Lane, Digbeth, Birmingham, B5 6DD 100
NX Crossrail Limited, National Express House, Mill Lane,
Digbeth, Birmingham, B5 6DD 100
NX Services Limited, National Express House, Mill Lane,
Digbeth, Birmingham, B5 6DD 100
ANNUAL REPORT AND ACCOUNTS 2016 / NATIONAL EXPRESS GROUP PLC 193193Annual Report and Accounts 2016 / National Express Group PLC

194 NATIONAL EXPRESS GROUP PLC / ANNUAL REPORT AND ACCOUNTS 2016
Financial statements
39 Subsidiary undertakings continued
Name and country of incorporation % equity
interest
United Kingdom continued
NXEA Trains Limited, National Express House, Mill Lane,
Digbeth, Birmingham, B5 6DD 100
NXEC Trains Limited, National Express House, Mill Lane,
Digbeth, Birmingham, B5 6DD 100
NXSR Trains Limited, National Express House, Mill Lane,
Digbeth, Birmingham, B5 6DD 100
PTI Website Limited, 50 Eastbourne Terrace, Paddington,
London, W2 6LG 20
Scotrail Railways Limited, National Express House,
Mill Lane, Digbeth, Birmingham, B5 6DD 100
Silverlink Train Services Limited, National Express House,
Mill Lane, Digbeth, Birmingham, B5 6DD 100
Speedlink Airport Services Limited, National Express
House, Mill Lane, Digbeth, Birmingham, B5 6DD 100
Taybus Holdings Limited, 44/48 East Dock Street,
Dundee, DD1 3JS 100
Tayside Public Transport Co. Limited, 44/48 East Dock Street, Dundee, DD1 3JS 100
The Kings Ferry Limited, National Express House,
Mill Lane, Digbeth, Birmingham, B5 6DD 100
Travel Birmingham Limited, 51 Bordesley Green,
Birmingham, B9 4BZ 100
Travel Coventry Limited, 51 Bordesley Green,
Birmingham, B9 4BZ 100
Travel Dundee Limited, 44/48 East Dock Street,
Dundee, DD1 3JS 100
Travel Merryhill Limited, 51 Bordesley Green,
Birmingham, B9 4BZ 100
Travel West Midlands Limited, 51 Bordesley Green,
Birmingham, B9 4BZ 100
Travel WM Limited, 51 Bordesley Green,
Birmingham, B9 4BZ 100
Travel Yourbus Limited, 51 Bordesley Green,
Birmingham, B9 4BZ 100
West Anglia Great Northern Railway Limited, National
Express House, Mill Lane, Digbeth, Birmingham, B5 6DD 100
West Midlands Transport Information Services Limited, Unit 8 − Pendeford Place, pendeford Business Park,
Wobaston Road, Wolverhampton, WV9 5HD 48
West Midlands Travel Limited, 51 Bordesley Green,
Birmingham, B9 4BZ 100
Name and country of incorporation % equity
interest
United Kingdom continued
WM Card Systems Limited, 51 Bordesley Green,
Birmingham, B9 4BZ 100
WM Property Holdings Limited, 51 Bordesley Green,
Birmingham, B9 4BZ 100
WM Travel Limited, 51 Bordesley Green,
Birmingham, B9 4BZ 100
WM Ventures Limited, 51 Bordesley Green,
Birmingham, B9 4BZ 100
Bahrain
Bahrain Public Transport Company W.L.L., Garage 1087,
Road 4025, Isa Town 840, Southern Governorate,
Kingdom of Bahrain 50
Finland
Ecolane Finland Oy, Metsanneidonkuja 4, Espoo, 02130 100
Germany
Deutsche Touring GmbH, Frankfurter Straße 10-14,
65760, Eschborn 17
National Express Germany GmbH, Trakehner Strasse
7-9, 60487 Frankfurt am Main, Germany 100
National Express Holding GmbH, Vogelsanger Weg 38,
40470 Düsseldorf, Germany 100
National Express Rail GmbH, Maximinenstrasse 6,
50668 Cologne, Germany 100
National Express Südwest GmbH, Vogelsanger Weg
38, 40470 Düsseldorf, Germany 100
Czech Republic
National Express Cz s.r.o., Seifertova 327/85,
130 00 Praha, Zizkov, Czech Republic 100
Netherlands
National Express Holdings LLC BV, Dr Willem Dreesweg 2, 1st Fl. South Wing,
1185 VB Amstelveen, The Netherlands 100
Texan Partner BV, Dr Willem Dreesweg 2, 1st Fl.
South Wing, 1185 VB Amstelveen, The Netherlands 100
Andorra
Estació d'Autobusos d'Andorra, Av. de Tarragona, 42,
AD500 Andorra la Vella 100
Transports Dels Pirineus, Av. de Tarragona, 42,
AD500 Andorra la Vella 100
France
Iberolines, 41 Boulevard Poniatowski, 75012, Paris 46
Financial Statements
NATIONAL EXPRESS GROUP PLC / ANNUAL REPORT AND ACCOUNTS 2016194194 National Express Group PLC / Annual Report and Accounts 2016
Notes to the Consolidated Accounts continued For the year ended 31 December 2016

ANNUAL REPORT AND ACCOUNTS 2016 / NATIONAL EXPRESS GROUP PLC 195
Name and country of incorporation % equity
interest
Morocco
Alsa City Agadir S.A., 153, Quartier Industriel Sidi
Ghanem, Marrakech 100
Alsa City Sightseeing Maroc, Ahwaz, Ferme Ahzib
Achayech Ferkat Ain Dada, Askedjour, Jamaat Et Kiadat
Saada, Marrakech 100
Alsa City Tour S.A.R.L., Ahwaz, Ferme Ahzib Achayech
Ferkat Ain Dada, Askedjour, Jamaat Et Kiadat Saada,
Marrakech 95
Alsa Education a la Sécurité Routière S.A.R.L., Ahwaz,
Ferme Ahzib Achayech Ferkat Ain Dada, Askedjour,
Jamaat Et Kiadat Saada, Marrakech 98
Alsa Khouribga S.A., No 22 Rue Meknes Hay Haboub,
Khouribga 100
Alsa Tanger S.A., 37 Rue Omar Ibn Khettab, Inmeuble
Maspalomas 2, Tanger 100
Centre de Formation Techn. Profes. Transport S.A.R.L., Ahwaz, Ferme Ahzib Achayech Ferkat Ain Dada,
Askedjour, Jamaat Et Kiadat Saada, Marrakech 99
Groupe Alsa Transport S.A., Rue Tehran, s/n,
Quartier Industriel, Agadir (MR-80000) 100
Immeubles,Vehicules Accesoires Maroc S.A.R.L., 153,
Quartier Industriel Sidi Ghanem, Marrakech 80
Interprovincial Maroc S.A.R.L., Ahwaz,
Ferme Ahzib Achayech Ferkat Ain Dada, Askedjour,
Jamaat Et Kiadat Saada, Marrakech 100
Transport de Voyageurs en Autocar Maroc S.A., 153,
Quartier Industriel Sidi Ghanem, Marrakech 100
Portugal
Alsa Metropolitano do Porto, Lda, Avenida das Forças
Armadas, N 125, 12 Lisboa 100
Tiac Viagens e Turismo Lda, Rua de Pedro Numes,
39, Lisboa 100
Slovakia
Efc Spol s.r.o., Tehelná 23 83103, Bratislava –
Nové Mesto 80
Spain
Alianza Bus, S.L.U., C/ Alcalá, 478, Madrid (28027) 100
Almeria–Murcia Bus, S.L.,
Avda Juan Pablo II, 33, Granada 100
Alsa Atlántica, S.L.U., C/ Miguel Fleta, 4, Madrid (28037) 100
Alsa Ferrocarril, S.A.U., C/ Miguel Fleta, 4, Madrid
(28037) 100
Alsa Granada Airport S.L., Avda Juan Pablo II, 33,
Granada 100
Alsa Grupo Intercontinental, S.L.U., C/ Miguel Fleta, 4,
Madrid (28037) 100
Name and country of incorporation % equity
interest
Spain continued
Alsa Grupo, S.L.U., C/ Miguel Fleta, 4, Madrid (28037) 98
Alsa Internacional, S.L.U., C/ Miguel Fleta, 4, Madrid
(28037) 100
Alsa Internacional, S.L.U. y Otros U.T.E., C/ Alcalá, 478,
Madrid (28027) 100
Alsa Metropolitana, S.A.U., C/ Alcalá, 478,
Madrid (28027) 100
Alsa Rail, S.L.U., C/ Miguel Fleta, 4, Madrid (28037) 100
Andreo, S.A.U., P. Venta Alegre, C/Mercurio, Huércal
Almeriá (Almeriá) (04230) 100
Aplic. y Sist. Integrales Para el Transporte, S.A., Pol. San Mateo, Ctra Coll D’ En Rabassa,
Palma de Mallorca (07002) 100
Aragonesa de Estacion de Autobuses, S.A., Urbanización
Plaza de Roma, F-1, Zaragoza 23
Autedia, S.A., Avda De Ingeniero Gutierrez Segura 2,
Baza (Granada) (18800) 100
Autobuses Urbanos de Bilbao, S.A., C/ Tellaetxebidea 3, Bilbao 75
Autobuses Urbanos de León, S.A.U., Pol. Ind. Vilecha
Oeste, León (24192) 100
Autocares Castilla–León, S.A.U., Estación de Autobuses,
Av Ingeniero Saenz de Miera, León (24009) 100
Autocares Discrecionales del Norte, S.L.U., Alameda de
Urquijo, n o 85, 1o -Dcha., Bilbao- Vizaya (48013) 100
Automóviles Luarca, S.A.U., Magnus Blikstad 2,
Gijón (33207) 100
Autos Pelayo, S.A.U., C/ Miguel Fleta, 4, Madrid (28037) 100
Buses de Palencia, S.L., C/ Campaneros, 4, 1o Dcha,
Palencia (34003) 100
Busturialdea Lea Artibai Bus, S.A., Centro de Transportes
de Vizcaya, Barrio el Juncal, Naves 3 y 4 (Valle de
Trápaga-Trapagrán), Vizcaya (48510) 62
Cetralsa Formación, S.L.U., C/ Miguel Fleta, 4, Madrid
(28037) 100
Cía. del Tranvía Eléctrico de Aviles, S.A., Avda Conde de Guadalhorce 123, Aviles (33400) 87
Compañia Navarra de Autobuses, S.A., C/ Yanguas y
Miranda, 2 (Estación de Autouses), Pamplona 50
Compostelana, S.A.U., Plaza San Cayetano,
s/n. Estación Autobuses Taq. 10,
Santiago de Compostela (La Coruña) 100
Concesionario Estación Autobuses Logroño, S.A., Avda de España, 1, Logroño- La Rioja 21
Continental-Comercial 21, S.L.U., Avda América 9-A,
intercambiador de Autbouses, Madrid (28002) 100
ANNUAL REPORT AND ACCOUNTS 2016 / NATIONAL EXPRESS GROUP PLC 195195Annual Report and Accounts 2016 / National Express Group PLC

196 NATIONAL EXPRESS GROUP PLC / ANNUAL REPORT AND ACCOUNTS 2016
Financial statements
Notes to the Consolidated Accounts continued For the year ended 31 December 2016
39 Subsidiary undertakings continued
Name and country of incorporation % equity
interest
Spain continued
Dainco, S.A., Avda Filiberto Villalobos, nº 71, Salamanca 50
Ebrobus, S.L.U., C/ Miguel Fleta, 4, Madrid (28037) 100
Estación Autobuses de Cartagena, S.A., Avda Trovero
Marín. Nº 3,(Estación Autobuses), Cartagena (30202) 54
Estación Autobuses de Ponferrada, S.A., Ctra de Asturias, Ponferrada 49
Estación Central de Autobuses de Zaragoza, S.A., Avda de Navarra, 80 (Estación Central de Autobuses),
Zaragoza (50011) 19
Estación de Autobuses de Siero, S.L., C/ Ramón y Cajal,
Pola de Siero 50
Estación de Autobuses Aguilar de Campoo, S.L., Avda de Ronda 52 Bis, Aguilar de Campoo (Palencia) 67
Estación de Autobuses Chamartin, S.A., Pº de la Castellana, 216, Madrid 49
Estación de Autobuses de Aranda de Duero, S.L., Avda Valladolid, Aranda de Duero (Burgos) 43
Estación de Autobuses de Astorga, S.L., Avda Las Murallas, nº 52, Astorga-León (24700) 79
Estación de Autobuses de Aviles S.L., C/ Los Telares
(Estación de Autobuses) Aviles (33400) 100
Estación de Autobuses de Benavente, S.L., Avda Primo de Rivera, Benaventa 23
Estación de Autobuses de León, S.A., Estación de
Autobuses, Avda Ingeniero Saenz de Miera, León (24009) 89
Estación de Autobuses de Plasencia, S.A., C/ Tornavacas, 2, Plasencia 52
Estación de Autobuses de Ribadeo, S.L., Avda Rosalía de Castro, Ribadeo 50
Estación de Autobuses de Vitoria, S.L., C/ Los Herran,
50 (Estación de Autobuses), Alava (Vitoria) 32
Estación de Lineas Regulares, S.L., Plaza de las
Estacones, Santander (Cantabria) 46
Estaciónes Terminales de Autobuses, S.A., Avda
Menéndez Pidal, nº 13 (Estacción de Autobuses),
Valencia (46009) 79
Euska Alsa, S.L.U., Alameda de Urquijo, n o 85, 1o -Dcha.,
Bilbao- Vizaya (48013) 100
Ezkerraldea-Meatzaldea Bus, S.A., Centro de
Transportes de Vizcaya, Barrio el Juncal, Naves 3 y 4
(Valle de Trápaga-Trapagrán), Vizcaya (48510) 65
G.S. Carretera, Plaza de la Constitución,
Estación de Autobuses, 2a Planta, Oficina 26, Lugo 25
General Técnica Industrial, S.L.U., C/ Miguel Fleta, 4,
Madrid (28037) 100
Gorbea Representaciones, S.L., Alameda de Urquijo,
n o 85, 1o -Dcha., Bilbao- Vizaya (48013) 100
Name and country of incorporation % equity
interest
Spain continued
Grupo Enatcar, S.A., C/ Alcalá, 478, Madrid (28027) 100
Ibero-Euro Sur, S.L., C/ Alcalá, 478, Madrid (28027) 20
Iber Rutas, S.A.U., C/ Miguel Fleta, 4, Madrid (28037) 100
Inforcyl, S.A.U., C/ Miguel Fleta, 4, Madrid (28037) 100
Informática, Comunicaciones y Logística, S.L.U., Alameda de Urquijo, no 85, 1o -Dcha., Bilbao- Vizaya (48013) 100
Intercambiadores Europeos, S.L., C/ Miguel Fleta, 4, Madrid (28037) 95
Internacional de Autocares, S.A., C/ Alcalá, 478, Madrid (28027) 93
International Business Limousines, S.A.U., Pol. Ind. Las Fronteras. C/Limite,Torrejón de Ardoz (Madrid) 100
Interurbana de Autocares, S.A.U., C/ Miguel Fleta, 4, Madrid (28037) 100
Irubus, S.A.U., C/ Alcalá, 478, Madrid (28027) 100
Jimenez Lopera, S.A.U., Pol. Ind. Las Fronteras. C/ Limite, Torrejón de Ardoz (Madrid) 100
Julia Travel S.A., Automoviles Luarca S.A.U., Transportes Bacoma S.A.U. U.T.E., C/ Puerto Used, 20, Madrid 50
Julia Travel y Automoviles Luarca Sa Ute, Avda Sancho El Sabio, 31, Donostia 50
La Tafallesa, S.A.U., C/ Yanguas y Miranda, 2 (Estación de Autouses), Pamplona 50
La Unión Alavesa, S.L., C/ Los Herran, 50 (Estación de Autobuses), Alava (Vitoria) 50
La Unión de Benisa, S.A., C/ Comunicaciones, 10 (P. de Babel), Alicante (03008) 98
Lineas Europeas de Autobuses, S.A., C/Guillem de Castro, 77, Valencia 43
Los Abades de la Gineta, S.L.U., C/ Alcalá, 478, Madrid (28027) 100
Movelia Tecnologias, S.L., C/ Santa Leonor, 65 –Avalón Parque Empresarial, Edificio A, Madrid 78
Mundaka Consultoria, S.L.U., Alameda de Urquijo, no 85, 1o -Dcha., Bilbao- Vizaya (48013) 100
Natur-Bus, S.L., Avda Menéndez Pidal, nº 13 (Estacción de Autobuses), Valencia (46009) 100
NEX Continental Holdings, S.L., C/ Miguel Fleta, 4, Madrid (28037) 100
NX Middle East, S.L.U., C/ Inglaterra, 20-22, Palencia (34004) 100
Proyectos Unificados, S.A.U., C/ Miguel Fleta, 4, Madrid (28037) 100
Rapid Aeroport, S.A.U., C/ Ali Bei, 80 (Estación de Autobuses), Barcelona (08013) 100
Representaciones Mecánica, S.A.U., Alameda de Urquijo, n o 85, 1o -Dcha., Bilbao- Vizaya (48013) 100
Rutas a Cataluña, S.A., C/ Musico Gustavo Freire, 1 -1° Dcha, Lugo (27001) 28
Financial Statements
NATIONAL EXPRESS GROUP PLC / ANNUAL REPORT AND ACCOUNTS 2016196196 National Express Group PLC / Annual Report and Accounts 2016
Notes to the Consolidated Accounts continued For the year ended 31 December 2016

ANNUAL REPORT AND ACCOUNTS 2016 / NATIONAL EXPRESS GROUP PLC 197
Name and country of incorporation % equity
interest
Spain continued
Rutas del Cantábrico, S.L., Alameda de Urquijo, no 85, 1o -Dcha., Bilbao- Vizaya (48013) 95
Semarvi, C/ Miguel Fleta, 4, Madrid (28037) 34
Serviareas 2000, S.L.U., C/ Miguel Fleta, 4, Madrid (28037) 100
Servicios Auxiliares del Transporte C.B., C/Mendez Álvaro (Estación de Autobuses), Madrid 100
Servicios del Principado, S.A.U., C/ Miguel Fleta, 4, Madrid (28037) 100
Servicios Empresariales Especiales, S.L.U., Alameda de Urquijo, no 85, 1o -Dcha., Bilbao- Vizaya (48013) 100
Servicios Generales de Automoción, S.A.U., Alameda de Urquijo, no 85, 1o -Dcha., Bilbao- Vizaya (48013) 100
Setra Ventas y Servicios, S.A.U., Pol. Ind. Las Fronteras. C/ Limite, Torrejón de Ardoz (Madrid) 100
Sociedad Anónima Unipersonal Alsina Graells de A.T., C/ Ali Bei, 80 (Estación de Autobuses), Barcelona (08013) 100
Técnicas en Vehículos Automóviles, S.L.U., C/ Alcalá, 478, Madrid (28027) 100
Terminal de Autobuses de Garellano, S.L., Alameda de Mazarredo, 21, Bilbao 41
Tibus, S.A., C/ Ali Bei, 80 (Estación de Autobuses), Barcelona (08013) 100
Toledo City Tour, S.L., Ctra. Madrid-Toledo, Km 63.700, Olias del Rey (Toledo) 50
Transporte Colectivos, S.A.U., Gran Vía de D. Ingacio de Haro, 81, Bilbao 100
Transportes Accesibles Peninsulares, S.L., C/Pepe Cosmen, (Estación de Autobuses), Oviedo (33001) 100
Transportes Adaptados Andaluces, S.A.U., Plaza Coca Piñera, s/n (Estación de Autobuses), Jaén 100
Transportes Adaptados Regionales, S.L.U., Estación de Autobuses, Av Ingeniero Saenz de Miera, León (24009) 100
Transportes Adaptados Cántabros, S.A., Avda Candina,
35-37, Santander (39011) 98
Transportes Bacoma, S.A.U., C/ Ali Bei, 80 (Estación de
Autobuses), Barcelona (08013) 100
Transportes de Viajeros de Aragón, S.A., Avda de Navarra, 80 (Estación Central de Autobuses),
Zaragoza (50011) 59
Name and country of incorporation % equity
interest
Spain continued
Transportes Solera, S.A.U., C/ Pescaderia, 48,
Alcalá de Henares (Madrid) 100
Transportes Terrestres Cantabros, S.A., Avda Candina,
35-37, Santander (39011) 93
Transportes Unidos de Asturias, S.L., Pol. Ind. Espírtiu
Santo, Oviedo (33010) 100
Transportes Unidos, S.L.U., C/ Miguel Fleta, 4,
Madrid (28037) 100
Transportes Urbanos de Cantabria, S.L.U., Avda Candina, 35-37, Santander (39011) 100
Transportes Urbanos de Cartagena, S.A., Paraje de la Asomada, Cartagena (Murcia) 97
Tranvía de Velez, S.A.U., Avda Juan Carlos I, s/n.
Ronda del Ingeniero, Vélez Málaga (Málaga) 100
Tury Express, S.A., Alameda de Urquijo, n o 85, 1o -Dcha.,
Bilbao- Vizaya (48013) 100
Ute Catamaranes Bahia Cadiz, Avda José León de
Carranza, nº 20, Cádiz 23
Ute Ea Cordoba, Glorieta de las Tres Culturas, Córdoba 50
Ute Extremadura, C/ Alcalá, 478, Madrid (28027) 100
Ute Guadalajara, C/ Miguel Fleta, 4, Madrid (28037) 100
Ute Mundiplan, C/ Ruiz Perelló, 15, Madrid 17
Ute Murcia City Tour, Magnus Blikstad 2, Gijón (33207) 50
Ute Ea Alicante, Muelle de Poniente, Alicante 50
Viajes Por Carretera, S.A.U., Alameda de Urquijo,
n o 85, 1o -Dcha., Bilbao- Vizaya (48013) 100
Voramar el Gaucho S.L.U., S’ Hort den Serral (San Agustín)
San Josep de sa Talaia, Illes Balears 100
Zamorana de Transportes, S.A.U., Ctra Zamora-
Salamanca Km 3,5. Pol. Ind., Morales del Vino (Zamora) 100
Switzerland
AlpyBus S.a.r.l., 8 Chemin de Morglas, 1214, Genève 100
Eggmann Frey, Rue du Mont Blanc 14, 1201, Genève 100
Linien Abfertigung GmbH, Rue du Mont Blanc 14,
1201, Genève 80
ANNUAL REPORT AND ACCOUNTS 2016 / NATIONAL EXPRESS GROUP PLC 197197Annual Report and Accounts 2016 / National Express Group PLC

198 NATIONAL EXPRESS GROUP PLC / ANNUAL REPORT AND ACCOUNTS 2016
Financial statements
39 Subsidiary undertakings continued
Name and country of incorporation % equity
interest
US
"The Provider" Enterprises, Inc., 9 Capitol Street,
Concord, NH 03301 100
Beck Bus Transportation Corp., 208 S. LaSalle Street,
Chicago, County of Cook, IL 60604 100
Beck Bus Transportation III, LLC, 208 S. LaSalle Street,
Chicago, County of Cook, IL 60604 100
Beck Bus Transportation IV, LLC, 208 S. LaSalle Street,
Chicago, County of Cook, IL 60604 100
Beck Bus Transportation, LLC, 208 S. LaSalle Street,
Chicago, County of Cook, IL 60604 100
Bus Co., Inc., 208 S. LaSalle Street, Chicago,
County of Cook, IL 60604 100
Caravan Leasing Vehicles LLC, 1660 N. Prospect Ave.,
#2606, Milwaukee, WI 53202 100
Carrier Management Corporation, Lenzner Bldg Ridge
Road, Sewickley, PA 15143 100
Community Transportation, Inc., Lenzner Bldg Ridge Road,
Sewickley, PA 15143 100
Diamond Transportation Services, Inc., 4701 Cox Road,
Glen Allen, County of Henrico, VA 23060 100
Durham D&M LLC, 1209 Orange Street, Corporation Trust
Center, New Castle County, Wilmington, DE 19801-1120 100
Durham Holding I, LLC, 1209 Orange Street,
Corporation Trust Center, New Castle County,
Wilmington, DE 19801-1120 100
Durham Holding II, LLC, 1209 Orange Street,
Corporation Trust Center, New Castle County,
Wilmington, DE 19801-1120 100
Durham School Services, L.P., 1209 Orange Street,
Corporation Trust Center, New Castle County,
Wilmington, DE 19801-1120 100
Ecolane USA, Inc., 1209 Orange Street, Corporation Trust
Center, New Castle County, Wilmington, DE 19801-1120 100
Greensburg Yellow Cab Co., 3893 Ash Dr.,
Alison Park, PA 15101 100
Name and country of incorporation % equity
interest
US continued
JNC Leasing, Inc., 4624 13th St., Wyandotte, MI 48192 100
Meda-Care Vans of Waukesha, Inc., 424 W. Cherry St.,
Milwaukee, WI 53212 100
MF Petermann Investment Corporation, 1209 Orange
Street, Corporation Trust Center, New Castle County,
Wilmington, DE 19801-1120 100
MV Student Transportation, Inc., 40 West Lawrence,
Suite A, Helena, Montana 59601 100
National Express Acquisition Corporation, 1209 Orange Street, Corporation Trust Center,
New Castle County, Wilmington, DE 19801-1120 100
National Express Durham Holding Corporation, 1209 Orange Street, Corporation Trust Center,
New Castle County, Wilmington, DE 19801-1120 100
National Express LLC, 1209 Orange Street,
Corporation Trust Center, New Castle County,
Wilmington, DE 19801-1120 100
National Express Transit Corporation, 1209 Orange
Street, Corporation Trust Center, New Castle County,
Wilmington, DE 19801-1120 100
National Express Transit Services Corporation, 1209 Orange Street, Corporation Trust Center,
New Castle County, Wilmington, DE 19801-1120 100
New Dawn Transit LLC, 111 Eighth Avenue, New York,
New York, 10011 100
Petermann Acquisition Co., LLC, 1209 Orange Street,
Corporation Trust Center, New Castle County,
Wilmington, DE 19801-1120 100
Petermann Acquisition Corporation, 1209 Orange Street, Corporation Trust Center,
New Castle County, Wilmington, DE 19801-1120 100
Petermann Holding Co., LLC, 1209 Orange Street,
Corporation Trust Center, New Castle County,
Wilmington, DE 19801-1120 100
Petermann Ltd.,1300 East Ninth Street,
County of Cuyahoga, OH 44114 100
Financial Statements
NATIONAL EXPRESS GROUP PLC / ANNUAL REPORT AND ACCOUNTS 2016198198 National Express Group PLC / Annual Report and Accounts 2016
Notes to the Consolidated Accounts continued For the year ended 31 December 2016

ANNUAL REPORT AND ACCOUNTS 2016 / NATIONAL EXPRESS GROUP PLC 199
Name and country of incorporation % equity
interest
US continued
Petermann Northeast, LLC, 1300 East Ninth Street,
County of Cuyahoga, OH 44114 100
Petermann Northwest, LLC, 1209 Orange Street,
Corporation Trust Center, New Castle County,
Wilmington, DE 19801-1120 100
Petermann Partners, Inc., 1209 Orange Street,
Corporation Trust Center, New Castle County,
Wilmington, DE 19801-1120 100
Petermann Southwest, LLC, 1209 Orange Street,
Corporation Trust Center, New Castle County,
Wilmington, DE 19801-1120 100
Petermann STS, LLC, 1209 Orange Street,
Corporation Trust Center, New Castle County,
Wilmington, DE 19801-1120 100
Petermann STSA, LLC, 1209 Orange Street,
Corporation Trust Center, New Castle County,
Wilmington, DE 19801-1120 100
PM2 Co. LLC, 1209 Orange Street,
Corporation Trust Center, New Castle County,
Wilmington, DE 19801-1120 100
Rainbow Management Service, Inc., 111 Eighth Avenue,
New York, New York, 10011 100
Safeway Training and Transportation Services, Inc., 9 Capitol Street, Concord, NH 03301 100
Septran, Inc., 150 West Market Street, Suite 800,
Indianapolis, IN 46204 100
Smith Bus Service, Inc., 351 West Camden Street,
Baltimore, MD 21201 100
Suburban Paratransit Services, Inc., 111 Eighth Avenue,
New York, New York, 10011 100
* These subsidiaries are exempt from the requirements of the UK Companies Act
2006 relating to the audit of individual accounts by virtue of S479A of the Act.
Outstanding liabilities of the exempt companies at the Balance Sheet date are
guaranteed pursuant to Sections 479A-C of the Act.
Name and country of incorporation % equity
interest
US continued
Trans Express, Inc., 111 Eighth Avenue, New York,
New York, 10011 100
Transit Express, Inc., 424 W. Cherry St., Milwaukee,
WI 53212 100
Transit Express Services, Inc., 1525 N. Fourth St.,
Milwaukee, WI 53212 100
Trinity, Inc., 4624 13th St., Wyandotte, MI 48192 100
Trinity Cars, Inc., 4624 13th St., Wyandotte, MI 48192 100
Trinity Coach LLC, 4624 13th St., Wyandotte, MI 48192 100
Trinity Management Services Co. LLC, 4624 13th St., Wyandotte, MI 48192 100
Trinity Student Delivery LLC, 4624 13th St.,
Wyandotte, MI 48192 100
TWB Transport, LLC, 208 S. LaSalle Street, Chicago,
County of Cook, IL 60604 100
White Plains Bus Co., Inc., 111 Eighth Avenue,
New York, New York, 10011 100
Whitetail Bid Co., LLC, 1209 Orange Street,
Corporation Trust Center, New Castle County,
Wilmington, DE 19801-1120 100
Canada
National Express Canada (Holdings) Ltd., 155 University
Avenue, Suite 700, Toronto, Ontario, Canada, M5H 3B7 100
National Express Canada Transit Ltd., 155 University
Avenue, Suite 700, Toronto, Ontario, Canada, M5H 3B7 100
Stock Transportation Ltd., 155 University Avenue,
Suite 700, Toronto, Ontario, Canada, M5H 3B7 100
ANNUAL REPORT AND ACCOUNTS 2016 / NATIONAL EXPRESS GROUP PLC 199199Annual Report and Accounts 2016 / National Express Group PLC

200 NATIONAL EXPRESS GROUP PLC / ANNUAL REPORT AND ACCOUNTS 2016
Financial statements
Company Balance Sheet At 31 December 2016
The Company reported a profit for the financial year ended 31 December 2016 of £52.0m (2015: £53.1m loss).
Company Number 2590560
Note 2016
£m
2015
£m
Fixed assets
Intangible assets 4 – 0.1
Tangible assets 5 0.1 0.2
Investments in subsidiaries 6 1,738.3 1,740.4
Derivative financial instruments 7 22.5 22.2
Deferred tax assets 13 15.8 3.4
Defined benefit pension asset 16 44.5 34.9
1,821.2 1,801.2
Current assets
Debtors 8 96.7 61.3
Derivative financial instruments 7 9.4 2.4
Cash at bank and in hand 9 263.0 0.1
369.1 63.8
Creditors: amounts falling due within one year 10 (578.1) (309.3)
Derivative financial instruments 7 (4.9) (1.8)
Provisions for liabilities and charges 12 (2.6) (2.6)
Net current liabilities (216.5) (249.9)
Total assets less current liabilities 1,604.7 1,551.3
Creditors: amounts falling due after more than one year 11 (703.7) (645.3)
Deferred tax liability 13 (7.6) (6.3)
Net assets 893.4 899.7
Shareholders’ equity
Called-up share capital 15 25.6 25.6
Share premium account 532.7 532.7
Capital redemption reserve 0.2 0.2
Own shares (7.8) (7.8)
Profit and loss account 342.7 349.0
Shareholders’ equity 893.4 899.7
D Finch Group Chief Executive
23 February 2017
M Ashley Group Finance Director
Financial Statements
NATIONAL EXPRESS GROUP PLC / ANNUAL REPORT AND ACCOUNTS 2016200200 National Express Group PLC / Annual Report and Accounts 2016
Company Balance Sheet At 31 December 2016

ANNUAL REPORT AND ACCOUNTS 2016 / NATIONAL EXPRESS GROUP PLC 201
Company Statement of Changes in Equity For the year ended 31 December 2016
The Company’s profit and loss account includes £303.5m (2015: £318.3m) that is available for distribution. Cumulative gains on the Company’s defined benefit pension scheme, which is currently in a net surplus position, are deemed to be not distributable. In addition, own shares have been purchased out of distributable profits and therefore reduce the reserves available for distribution. The share premium and capital redemption reserves are not distributable.
Details of dividends paid, declared and proposed during the year are given in note 12 to the consolidated accounts.
Share capital
£m
Share premium
£m
Capital redemption
reserve £m
Own shares
(note 15) £m
Profit and loss account
£m
Total
£m
At 1 January 2016 25.6 532.7 0.2 (7.8) 349.0 899.7
Shares purchased – – – (7.7) – (7.7)
Own shares released to satisfy employee share schemes – – – 7.7 (7.7) –
Share-based payments – – – – 1.1 1.1
Actuarial gain, net of tax – – – – 7.2 7.2
Profit for the year – – – – 52.0 52.0
Dividends – – – – (58.9) (58.9)
At 31 December 2016 25.6 532.7 0.2 (7.8) 342.7 893.4
Share capital
£m
Share premium
£m
Capital redemption
reserve £m
Own shares
(note 15) £m
Profit and loss account
£m
Total
£m
At 1 January 2015 25.6 532.7 0.2 (1.5) 457.3 1,014.3
Shares purchased – – – (8.5) – (8.5)
Own shares released to satisfy employee share schemes – – – 2.2 (2.2) –
Share-based payments – – – – 1.6 1.6
Actuarial loss, net of tax – – – – (0.2) (0.2)
Loss for the year – – – – (53.1) (53.1)
Dividends – – – – (54.4) (54.4)
At 31 December 2015 25.6 532.7 0.2 (7.8) 349.0 899.7
ANNUAL REPORT AND ACCOUNTS 2016 / NATIONAL EXPRESS GROUP PLC 201201Annual Report and Accounts 2016 / National Express Group PLC
Company Statement of Changes in Equity For the year ended 31 December 2016

202 NATIONAL EXPRESS GROUP PLC / ANNUAL REPORT AND ACCOUNTS 2016
Financial statements
Notes to the Company Accounts For the year ended 31 December 2016
1 Accounting policies Basis of preparation The separate accounts of the parent Company are presented as required by the Companies Act 2006. The accounts have been prepared on the going concern basis and under the historical cost convention, except for the recognition of derivative financial instruments and available-for-sale investments detailed below, and in accordance with applicable accounting standards in the United Kingdom.
In applying these policies, management is required to make estimates and assumptions that affect the reported amounts of assets and liabilities and disclosure of contingent assets and liabilities at the date of the accounts and the reported amounts of revenue and expenses during the reporting period. Actual results could differ from those estimates.
The Company meets the definition of a qualifying entity under FRS 100 (Financial Reporting Standard 100) issued by the Financial Reporting Council. Accordingly, these financial statements have been prepared in accordance with FRS 101 (Financial Reporting Standard 101) ‘Reduced Disclosure Framework’ as issued by the Financial Reporting Council.
The Company has taken advantage of the disclosure exemptions available under FRS 101 in relation to share-based payments, financial instruments, capital management, presentation of comparative information in respect of certain assets, presentation of a cash flow statement, standards not yet effective, impairment of assets and related party transactions. Where required, equivalent disclosures are included within the consolidated accounts.
No profit and loss account is presented by the Company as permitted by Section 408 of the Companies Act 2006. The profit attributable to the Company is disclosed in the footnote to the Company’s balance sheet.
Leases Leases of tangible fixed assets where substantially all the risks and rewards of ownership of the asset have passed to the Company are classified as finance leases and the assets are capitalised in the Balance Sheet as plant and equipment. Finance leases are capitalised at the present value of the minimum lease payments. The capital element of future obligations under hire purchase contracts and finance leases is included as a liability in the Balance Sheet. The interest element of rental obligations is charged to the profit and loss account over the period of the lease and represents a constant proportion of the balance of capital repayments outstanding. Assets acquired under finance leases are depreciated over the shorter of the useful life of the asset and the lease term.
Leases of assets where a significant portion of the risks and rewards of ownership are retained by the lessor are classified as operating leases. Rentals paid under operating leases are charged to the profit and loss account on a straight-line basis over the term of the lease. Incentives received under operating leases and initial direct costs in negotiating the lease are amortised to the profit and loss account on a straight-line basis over the term of the lease, or to the first review if shorter.
Tangible fixed assets Tangible fixed assets are stated at historical cost less accumulated depreciation and any impairment. Tangible fixed assets are depreciated on a straight-line basis over their estimated useful lives as follows:
The carrying value of fixed assets is reviewed for impairment if events or changes in circumstances indicate that the current carrying value may not be recoverable, and are written down immediately to their recoverable amount. Repairs and maintenance are charged to the profit and loss account during the financial period in which they are incurred.
Software Computer software that is not integral to an item of property, plant and equipment is recognised separately as an intangible asset and is carried at cost less accumulated amortisation and accumulated impairment losses. Costs include software licences, consulting costs attributable to the development, design and implementation of the computer software and internal costs directly attributable to the development, design and implementation of the computer software. Costs in respect of training are expensed as incurred. Amortisation is calculated using the straight-line method so as to charge the cost of the computer software to the Income Statement over its estimated useful life (three to seven years).
The carrying value of intangibles is reviewed for impairment if events or changes in circumstances indicate that the carrying value may not be recoverable.
Plant and equipment – 3 to 5 years
Financial Statements
NATIONAL EXPRESS GROUP PLC / ANNUAL REPORT AND ACCOUNTS 2016202202 National Express Group PLC / Annual Report and Accounts 2016
Notes to the Company Accounts For the year ended 31 December 2016

ANNUAL REPORT AND ACCOUNTS 2016 / NATIONAL EXPRESS GROUP PLC 203
1 Accounting policies continued Investments in subsidiaries Investments are held at historical cost less any provision for impairment.
Interest-bearing loans and borrowings Loans and borrowings are initially recognised at the fair value of the consideration received, net of issue costs. After initial recognition, interest-bearing loans and borrowings are subsequently measured at amortised cost using the effective interest method.
Hedge accounting is adopted where derivatives such as fixed to floating interest rate swaps are held as fair value hedges against fixed interest rate borrowings. Under fair value hedge accounting, fixed interest rate borrowings are revalued at each Balance Sheet date by the change in fair value attributable to the interest rate being hedged.
Provisions Provisions are recognised when the Company has a present legal or constructive obligation as a result of past events, it is probable that an outflow of resources will be required to settle the obligation, and a reliable estimate of the amount can be made. Where the Company expects a provision to be reimbursed the reimbursement is recognised as a separate asset but only when reimbursement is virtually certain.
Pensions The Company participates in both the National Express Group Staff Pension Fund (a defined benefit scheme) and a defined contribution scheme.
For the defined benefit scheme, the Balance Sheet position comprises the net of the present value of the relevant defined benefit obligation at the Balance Sheet date and the fair value of plan assets. The trustees complete a full actuarial valuation triennially but the obligation is updated annually for financial reporting purposes by independent actuaries, using the projected unit credit method. The present value of the obligation is determined by the estimated future cash outflows discounted using interest rates of high quality corporate bonds which have terms to maturity equivalent to the terms of the related liability.
The current service cost and gains and losses on settlements and curtailments are recognised as operating costs. Past service costs are included in operating costs where the benefits have vested, otherwise they are amortised on a straight-line basis over the vesting period. Net interest is calculated by applying a discount rate to the net defined benefit liability or asset and is recognised within finance costs. Actuarial gains and losses arising from experience adjustments and changes in actuarial assumptions are charged or credited to the profit and loss reserve in the period in which they arise.
For the defined contribution scheme, the amount charged to the profit and loss is the contributions payable in the year. Differences between contributions payable in the year and contributions actually paid are shown as either accruals or prepayments in the Balance Sheet.
Share-based payment The Company awards equity-settled share-based payments to certain employees. Equity-settled share-based payments are measured at fair value at the date of grant by an external valuer using a stochastic model. Non-market-based performance-related vesting conditions are not taken into account when estimating the fair value; instead those non-market conditions are taken into account in calculating the current best estimate of the number of shares that will eventually vest and at each Balance Sheet date before vesting. The cumulative expense is calculated based on that estimate. Market-based performance conditions are taken into account when determining the fair value and at each Balance Sheet date before vesting, the cumulative expense is calculated irrespective of whether or not the market conditions are satisfied, provided that all other performance conditions are met.
Foreign currencies Foreign currency assets and liabilities are translated into Sterling at the rates of exchange ruling at the year end. Foreign currency transactions arising during the year are translated into Sterling at the rate of exchange ruling on the date of the transaction. Any exchange differences so arising are dealt with through the profit and loss account.
ANNUAL REPORT AND ACCOUNTS 2016 / NATIONAL EXPRESS GROUP PLC 203203Annual Report and Accounts 2016 / National Express Group PLC

204 NATIONAL EXPRESS GROUP PLC / ANNUAL REPORT AND ACCOUNTS 2016
Financial statements
Notes to the Company Accounts continued For the year ended 31 December 2016
1 Accounting policies continued Deferred tax Deferred tax is provided in full in respect of all material temporary differences at the Balance Sheet date between the tax bases of assets and liabilities and their carrying amounts for financial reporting purposes, apart from where the Company is able to control the reversal of the temporary difference and it is probable that the temporary difference will not reverse in the foreseeable future.
Deferred tax is measured on a non-discounted basis at tax rates that are expected to apply in the periods in which the temporary differences reverse based on tax rates and laws enacted or substantively enacted at the Balance Sheet date.
Deferred tax assets are recognised to the extent that it is considered more likely than not that future taxable profits will be available against which the underlying temporary differences can be deducted. Their carrying amount is reviewed at each Balance Sheet date on the same basis.
Derivative financial instruments The Company uses derivative financial instruments such as interest rate derivatives, foreign currency forward exchange contracts and cross currency swaps to hedge its risks associated with interest rate fluctuations and foreign currency. Such derivative financial instruments are initially recognised at fair value and subsequently remeasured to fair value for the reported Balance Sheet. The fair value of the derivatives is calculated by reference to market exchange rates, interest rates and fuel prices at the period end.
The Company’s interest rate derivatives are designated as fair value hedges. The gain or loss on the hedging instrument is recognised immediately in the Income Statement. The carrying amount of the hedged item is adjusted through the Income Statement for the gain or loss on the hedged item attributable to the hedged risk, in this case movements in the risk free interest rate. Hedge accounting is discontinued when the hedging instrument expires, is sold, terminated, exercised, or no longer qualifies for hedge accounting.
Foreign currency derivatives and cross currency swaps are used to hedge the Group’s net investment in foreign currency denominated operations. For the Company, gains and losses are recognised immediately in the Income Statement. For the Group, to the extent that the derivatives are designated and effective as net investment hedges, they are transferred to equity on consolidation to match against foreign exchange exposure in the related assets and liabilities.
The Company also uses foreign currency forward contracts to hedge certain transactional exposures. Gains and losses on these derivatives are recognised immediately in the Income Statement.
2 Exchange rates The most significant exchange rates to UK Sterling for the Company are as follows:
3 Directors’ emoluments Detailed information concerning Directors’ emoluments, shareholdings and options is shown in the Directors’ Remuneration Report.
2016 2015
Closing rate Average rate Closing rate Average rate
US Dollar 1.23 1.36 1.47 1.53
Canadian Dollar 1.66 1.80 2.04 1.95
Euro 1.17 1.22 1.36 1.38
Financial Statements
NATIONAL EXPRESS GROUP PLC / ANNUAL REPORT AND ACCOUNTS 2016204204 National Express Group PLC / Annual Report and Accounts 2016
Notes to the Company Accounts continued For the year ended 31 December 2016

ANNUAL REPORT AND ACCOUNTS 2016 / NATIONAL EXPRESS GROUP PLC 205
4 Intangible assets
5 Tangible assets
6 Investments in subsidiaries
The information provided below is given for the Company’s principal subsidiaries. A full list of subsidiaries and investments can be found in note 39 to the consolidated accounts. The principal country of operation in respect of the companies below is the country in which they are incorporated and all holdings are 100% held directly by the Company:
Incorporated in England and Wales
National Express Intermediate Holdings Limited Holding company for all Group operating companies except Rail
National Express Trains Limited Holding company for Rail operating companies
National Express Finance Company Limited Finance company for Group fuel derivative arrangements
Software
£m
Cost:
At 1 January and 31 December 2016 0.4
Amortisation:
At 1 January 2016 0.3
Charge in the year 0.1
At 31 December 2016 0.4
Net book value:
At 31 December 2016 –
At 31 December 2015 0.1
Plant and equipment
£m
Cost:
At 1 January and 31 December 2016 0.3
Depreciation:
At 1 January 2016 0.1
Charge in the year 0.1
At 31 December 2016 0.2
Net book value:
At 31 December 2016 0.1
At 31 December 2015 0.2
£m
Cost or valuation:
At 1 January 2016 2,692.5
Disposals (2.1)
At 31 December 2016 2,690.4
Provisions:
At 1 January and 31 December 2016 952.1
Net carrying amount:
At 31 December 2016 1,738.3
At 31 December 2015 1,740.4
ANNUAL REPORT AND ACCOUNTS 2016 / NATIONAL EXPRESS GROUP PLC 205205Annual Report and Accounts 2016 / National Express Group PLC

206 NATIONAL EXPRESS GROUP PLC / ANNUAL REPORT AND ACCOUNTS 2016
Financial statements
Notes to the Company Accounts continued For the year ended 31 December 2016
7 Derivative financial instruments
Full details of the Group’s financial risk management objectives and policies can be found in note 30 to the consolidated accounts. As the holding company for the Group, the Company faces similar risks over foreign currency and interest rate movements.
8 Debtors
9 Cash at bank and in hand
Cash at bank and in hand earns interest at floating rates based on daily bank deposit rates. Short-term deposits are made for varying periods of between one day and three months depending on the immediate cash requirements of the Company, and earn interest at the respective short-term deposit rates. The fair value of cash equals the carrying value.
2016
£m 2015
£m
Interest rate derivatives 14.3 22.2
Cross currency swaps 8.2 –
Derivative financial assets due over one year 22.5 22.2
Interest rate derivatives 8.4 –
Foreign exchange forward contracts 1.0 2.4
Derivative financial assets due under one year 9.4 2.4
Foreign exchange forward contracts (4.9) (1.8)
Derivative financial liabilities due under one year (4.9) (1.8)
2016
£m 2015
£m
Amounts falling due within one year: Amounts owed by subsidiary undertakings 77.1 48.8
Corporation tax recoverable 10.5 5.7
Other debtors 3.6 2.2
Prepayments 5.5 4.6
96.7 61.3
2016
£m 2015
£m
Cash at bank 16.0 0.1
Short-term deposits 247.0 –
263.0 0.1
Financial Statements
NATIONAL EXPRESS GROUP PLC / ANNUAL REPORT AND ACCOUNTS 2016206206 National Express Group PLC / Annual Report and Accounts 2016
Notes to the Company Accounts continued For the year ended 31 December 2016

ANNUAL REPORT AND ACCOUNTS 2016 / NATIONAL EXPRESS GROUP PLC 207
10 Creditors: amounts falling due within one year
Trade creditors are non-interest bearing and are normally settled on 30-day terms and other creditors are non-interest bearing and have an average term of six months.
11 Creditors: amounts falling due after more than one year
12 Provisions for liabilities and charges
13 Deferred tax Deferred tax included in the Balance Sheet is as follows:
The major components of the provision for deferred taxation are as follows:
2016
£m 2015
£m
Bank overdraft – 34.3
Bank loans 1.4 34.0
Bonds 351.4 –
Trade creditors 4.8 4.6
Amounts owed to subsidiary undertakings 158.1 187.9
Accruals and deferred income 30.3 18.1
Bonds – accrued interest 30.8 29.3
Other debt payable 1.3 1.1
578.1 309.3
2016
£m 2015
£m
Bonds 631.8 583.5
Other debt payable 71.9 61.8
703.7 645.3
Claims provision
£m
At 1 January and 31 December 2016 2.6
2016
£m 2015
£m
Deferred tax assets 15.8 3.4
Deferred tax liability (7.6) (6.3)
Net deferred tax asset/(liability) 8.2 (2.9)
2016
£m 2015
£m
Accelerated capital allowances 0.2 0.2
Other timing differences – –
Losses carried forward 15.6 3.2
Defined benefit pension (7.6) (6.3)
Net deferred tax asset/(liability) 8.2 (2.9)
ANNUAL REPORT AND ACCOUNTS 2016 / NATIONAL EXPRESS GROUP PLC 207207Annual Report and Accounts 2016 / National Express Group PLC

208 NATIONAL EXPRESS GROUP PLC / ANNUAL REPORT AND ACCOUNTS 2016
Financial statements
Notes to the Company Accounts continued For the year ended 31 December 2016
13 Deferred tax continued A reconciliation of the deferred tax balances is as follows:
Timing differences associated with Group investments No deferred tax (2015: £nil) is recognised on the unremitted earnings of subsidiaries and associates, as no dividends have been accrued as receivable, and no binding agreement to distribute the past earnings in future has been entered into by the subsidiaries.
Unrecognised tax losses Deferred income tax assets are recognised for tax loss carry-forwards to the extent that the realisation of the related tax benefit against future taxable profits is probable. Deferred tax assets that the Company has not recognised in the accounts amount to £nil (2015: £3.9m).
14 Interest-bearing loans and borrowings The effective interest rates at the Balance Sheet date were as follows:
* This date is the ultimate maturity date of the syndicated credit facility.
Details of the Company’s interest rate management strategy and interest rate swaps are included in notes 30 and 31 to the consolidated accounts.
Deferred tax assets
£m
Deferred tax liability
£m
Deferred tax at 1 January 2016 3.4 (6.3)
Charge to income statement 12.4 (0.2)
Charge to other comprehensive income – (1.1)
Deferred tax at 31 December 2016 15.8 (7.6)
2016
£m Maturity
Effective
interest rate 2015
£m Maturity
Effective
interest rate
Current
Bank overdraft – 34.3
Seven-year Sterling bond 351.4 January 2017 6.54% – – –
European bank loans – – – 34.0 November
2020* LIBOR +
0.60%
Other short-term loans 1.4 –
Accrued interest 32.1 30.4
Total current 384.9 98.7
Non-current
Ten-year Sterling bond 232.9 June 2020 6.85% 231.2 January 2020 6.85%
Seven-year Sterling bond 398.9 November 2023 2.54% 352.3 January 2017 6.54%
Bonds 631.8 583.5
Euro Private Placement 71.9 August 2021 4.55% 61.8 August 2021 4.55%
Other debt payable 71.9 61.8
Total non-current 703.7 645.3
Financial Statements
NATIONAL EXPRESS GROUP PLC / ANNUAL REPORT AND ACCOUNTS 2016208208 National Express Group PLC / Annual Report and Accounts 2016
Notes to the Company Accounts continued For the year ended 31 December 2016

ANNUAL REPORT AND ACCOUNTS 2016 / NATIONAL EXPRESS GROUP PLC 209
15 Called-up share capital
The total number of share options exercised in the year by employees of the Group was 2,422,638 (2015: 824,029) of which 1,981,675 (2015: 797,801) exercises were satisfied by transferring shares from the National Express Employee Benefit Trust. The remaining exercises were settled via a direct purchase of shares from the open market.
Own shares Own shares comprises 2,260,292 (2015: 2,495,467) ordinary shares in the Company that have been purchased by the trustees of the National Express Employee Benefit Trust (the ‘Trust’). During the year, the Trust purchased 1,746,500 (2015: 2,740,000) shares and 1,981,675 (2015: 797,801) shares were used to satisfy options granted under a number of the Company’s share schemes. Nil (2015: nil) shares were sold during the year to the open market.
The market value of the shares held by the Trust at 31 December 2016 was £8.0m (2015: £8.3m). The dividends payable on 2,090,464 of these shares have been waived (2015: 2,418,824).
16 Retirement benefits The Company participates in both the National Express Group Staff Pension Fund (a defined benefit scheme) and a defined contribution scheme.
Defined benefit scheme The defined benefit scheme is now closed to all future accrual.
The assets of the scheme are held separately from those of the Company.
The valuation as at 31 December 2016 is based on the results of the 5 April 2016 actuarial valuation, which has been updated by independent professionally qualified actuaries to take account of the requirements of IAS 19. The assumptions used by the actuary are the best estimates chosen from a range of possible actuarial assumptions which, due to the timescale covered, may not necessarily be borne out in practice. Details of the latest actuarial valuation are included in note 34 to the consolidated accounts.
The relevant assumptions used are as follows:
2016
£m 2015 £m
At 31 December:
Authorised:
800,000,000 (2015: 800,000,000) ordinary shares of 5p each 40.0 40.0
Issued called-up and fully paid:
511,738,648 (2015: 511,738,648) ordinary shares of 5p each 25.6 25.6
2016
£m 2015
£m
Rate of increase in salaries 2.5% 2.5%
Rate of increase of pensions 3.3% 3.1%
Discount rate 2.7% 3.9%
Inflation assumption (RPI) 3.4% 3.1%
Inflation assumption (CPI) 2.4% 2.1%
Post-retirement mortality in years:
Current pensioners at 65 – male 23.0 24.4
Current pensioners at 65 – female 25.8 26.9
Future pensioners at 65 – male 24.9 26.2
Future pensioners at 65 – female 27.5 28.9
ANNUAL REPORT AND ACCOUNTS 2016 / NATIONAL EXPRESS GROUP PLC 209209Annual Report and Accounts 2016 / National Express Group PLC

210 NATIONAL EXPRESS GROUP PLC / ANNUAL REPORT AND ACCOUNTS 2016
Financial statements
Notes to the Company Accounts continued For the year ended 31 December 2016
16 Retirement benefits continued Defined benefit scheme continued The amounts charged to the Income Statement and comprehensive income for the years ended 31 December 2016 and 2015 are set out in the following tables:
During the year £nil (2015: £0.2m) of administrative expenses were incurred.
The amounts recognised in the Balance Sheet at 31 December are:
The movement in the present value of the defined benefit obligation in the year is as stated below:
Income Statement 2016
£m 2015
£m
Net interest income 1.3 1.2
Total credit to the Income Statement 1.3 1.2
Comprehensive income 2016
£m 2015
£m
Actuarial (loss)/gain during the period from obligations (19.8) 1.3
Expected return on plan assets greater/less than discount rate 28.1 (2.2)
Net actuarial gain/(loss) 8.3 (0.9)
2016
£m 2015
£m
Bonds 153.1 124.9
Other (18.9) (19.8)
Fair value of scheme assets 134.2 105.1
Present value of scheme liabilities and defined benefit obligation (89.7) (70.2)
Defined benefit pension surplus 44.5 34.9
2016
£m 2015
£m
Defined benefit obligation at 1 January (70.2) (71.2)
Benefits paid 2.9 2.2
Finance charge (2.6) (2.5)
Actuarial loss arising from changes in financial assumptions (23.8) 1.3
Actuarial gain arising from changes in demographics 4.3 –
Actuarial loss arising from experience adjustments (0.3) –
Defined benefit obligation at 31 December (89.7) (70.2)
Financial Statements
NATIONAL EXPRESS GROUP PLC / ANNUAL REPORT AND ACCOUNTS 2016210210 National Express Group PLC / Annual Report and Accounts 2016
Notes to the Company Accounts continued For the year ended 31 December 2016

ANNUAL REPORT AND ACCOUNTS 2016 / NATIONAL EXPRESS GROUP PLC 211
16 Retirement benefits continued Defined benefit scheme continued The movement in the fair value of scheme assets is as follows:
17 Share-based payment During the year ended 31 December 2016, the Company had a number of share-based payment arrangements, which are described in note 7(b) to the consolidated accounts.
The options have a weighted average contractual life of one year (2015: one year). Options were exercised throughout the year and the weighted average share price at exercise was 346p (2015: 313p).
18 Commitments and contingencies Operating lease commitments The Company had total commitments under non-cancellable operating leases as set out below:
Contingent liabilities Guarantees The Company has guaranteed credit facilities totalling £232m (2015: £195m) of certain subsidiaries. The Company has also guaranteed certain liabilities of a number of its subsidiaries under Section 479C of the Companies Act 2006. These subsidiaries are highlighted in the full subsidiaries listing in note 39 to the consolidated accounts.
Bonds and letters of credit In the ordinary course of business, the Company is required to issue counter-indemnities in support of its operations. Letters of credit have been issued to support insurance retentions of £91.5m (2015: £66.1m).
19 Post Balance Sheet events On 13 January 2017, the Group repaid the £350m 2017 Sterling bond that is disclosed within current borrowings (note 14).
2016
£m 2015
£m
Fair value of scheme assets at 1 January 105.1 101.8
Expected return on plan assets 3.9 3.7
Expected return on plan assets greater/less than discount rate 28.1 (2.2)
Cash contributions – employer – 4.2
Administrative expenses – (0.2)
Benefits paid (2.9) (2.2)
Fair value of scheme assets at 31 December 134.2 105.1
History of experience gains and losses: 2016
£m 2015
£m 2014 £m
2013 £m
2012 £m
Fair value of scheme assets 134.2 105.1 101.8 74.6 73.1
Present value of defined benefit obligation (89.7) (70.2) (71.2) (62.0) (56.5)
Surplus in the scheme 44.5 34.9 30.6 12.6 16.6
Experience adjustments arising on liabilities (0.3) – – (3.8) –
Experience adjustments arising on assets 28.1 (2.2) 22.6 (2.8) 0.5
Land and buildings
2016
£m 2015
£m
Operating leases which expire:
Within two to five years 0.1 0.1
ANNUAL REPORT AND ACCOUNTS 2016 / NATIONAL EXPRESS GROUP PLC 211211Annual Report and Accounts 2016 / National Express Group PLC

Shareholder Information
Registrars’ detailsAll matters relating to the administration of shareholdings in National Express Group PLC, such as the loss of a share certificate, dividend payments or a change of address, should be directed to our Registrars, Equiniti Limited, Aspect House, Spencer Road, Lancing, West Sussex BN99 6DA; shareholder helpline number 0371 384 2152* or +44 121 415 7047 from overseas or Textel (for the hard of hearing) on 0371 384 2255. If you are registered for online shareholder communications you can contact the Registrars via www.shareview.co.uk.
Shareholder electronic communicationsNational Express encourages shareholders to use our online communications service. By registering for electronic communications, this provides a faster way to receive information and helps us to reduce print, paper and postage costs.
Log on to www.shareview.co.uk if you would like to:• register your e-mail so that you are able to access future
shareholder information, including the Annual Report and Accounts electronically
• check the balance of your shareholding• set up a dividend mandate online• change your registered postal address or your dividend
mandate details• submit your vote online prior to a general meeting
To sign up for the first time you should click on ‘Register’ and follow the simple instructions – you will need your shareholder reference number from your share certificate or dividend voucher or any other correspondence sent to you by Equiniti Limited.
If you have any queries, contact our Registrars, Equiniti Limited, on the shareholder helpline number 0371 384 2152* or +44 121 415 7047 from overseas or Textel (for the hard of hearing) on 0371 384 2255.
Dividends paid direct to your bank accountHaving dividends paid direct to your bank account has the following advantages:• avoids the risk of cheques being lost and incurring a
replacement fee• saves you time in presenting the cheque for payment• the dividend is credited to your account on the payment date
Consolidated Tax VouchersThe Company now issues a Consolidated Tax Voucher (CTV) once a year to all shareholders save for corporate and institutional shareholders. A CTV is included with this 2017 AGM mailing and will contain the tax and payment information for dividends paid during the tax year 2015/16.
To set up a new dividend mandate please log on to shareview.co.uk or contact our Registrars, Equiniti Limited, on the shareholder helpline number 0371 384 2152* or +44 121 415 7047 from overseas or Textel (for the hard of hearing) on 0371 384 2255.
Share dealing serviceA telephone and internet share dealing service, which provides a simple way to buy and sell shares, is available through our Registrars, Equiniti. For further information log on to shareview.co.uk/dealing or telephone 0345 603 7037 or +44 121 415 7560 from overseas.
Company websiteThe Company website at www.nationalexpressgroup.com has information about the Group, including press releases, share price data and copies of the half-year results and Annual Report and Accounts as well as corporate responsibility reporting. The Company no longer publishes the half-year results in hard copy. These will continue to be available via the website.
ShareGiftShareGift is an independent charity share donation scheme administered by the Orr Mackintosh Foundation (registered charity number 1052686). Those shareholders who hold only a small number of shares, the value of which makes it uneconomic to sell them, can donate the shares to ShareGift who will sell them and donate the proceeds to a wide range of charities. Further information about ShareGift can be obtained from its website at sharegift.org and a ShareGift transfer form can be downloaded from www.nationalexpressgroup.com.
Unclaimed Assets RegisterThe Company participates in the Unclaimed Assets Register (UAR) which provides a search facility for shareholdings and other financial assets that may have been forgotten. For further information contact UAR by email at [email protected], Tel: 0844 481 8180 or visit www.uar.co.uk.
Unsolicited mailWe are legally obliged to make our register of members available, subject to a proper purpose test, to the public. As a consequence of this some shareholders might receive unsolicited mail. Shareholders wishing to limit the amount of such mail should write to the Mailing Preference Service, FREEPOST 29 LON20771, London W1E 0ZT. Shareholders can also register online at www.mpsonline.org.uk or request an application form by calling from within the UK: 0845 703 4599 or by email to [email protected].
Additional Information
212 National Express Group PLC / Annual Report and Accounts 2016

Warning about share fraudShare fraud includes scams where investors are called out of the blue and offered shares that often turn out to be worthless or non-existent, or an inflated price for shares they own. These calls come from fraudsters operating in ‘boiler rooms’ that are mostly based abroad.
While high profits are promised, those who buy or sell shares in this way usually lose their money.
The Financial Conduct Authority (FCA) and Prudential Regulatory Authority (PRA), which replaced the Financial Services Authority on 1 April 2013, have found most share fraud victims are experienced investors who lose an average of £20,000, with around £200m lost in the UK each year.
How to avoid share fraudIf you are offered unsolicited investment advice, discounted shares, a premium price for shares you own, or free company or research reports, you should take these steps before handing over any money:
1. Get the name of the person and organisation contacting you.2. Check the FCA Register at www.fca.org.uk/register to ensure
they are authorised.3. Use the details on the FCA Register to contact the firm.4. Call the FCA Consumer Helpline on 0800 111 6768
(freephone) or +44 20 7066 1000 from overseas if there are no contact details on the Register or you are told they are out of date.
5. Search the FCA’s list of unauthorised firms and individuals to avoid doing business with.
6. REMEMBER: if it sounds too good to be true, it probably is!
If you use an unauthorised firm to buy or sell shares or other investments, you will not have access to the Financial Ombudsman Service or Financial Services Compensation Scheme (FSCS) if things go wrong.
Report a scamIf you are approached by fraudsters, please tell the FCA using the share fraud reporting form at www.fca.org.uk/scams, where you can find out more about investment scams, or call the FCA Consumer Helpline on 0800 111 6768.
If you have already paid money to share fraudsters you should contact ActionFraud on 0300 123 2040.
*Lines are open 8:30 am to 5.30 pm, UK time Monday to Friday excluding English public holidays.
Dividends and Financial Calendar
Final dividend ex-dividend date 27 April 2017
Final dividend record date 28 April 2017
Annual General Meeting 10 May 2017
Final dividend payment date 19 May 2017
Half Year Results announced 27 July 2017
Interim dividend ex-dividend date 31 August 2017
Interim dividend record date 1 September 2017
Interim dividend payment date 22 September 2017
213Annual Report and Accounts 2016 / National Express Group PLC

Definitions and Supporting Information
AGM Annual General Meeting
Bps Basis points
BSOG Bus Service Operators Grant
CDP Carbon Disclosure Project
Code The UK Corporate Governance Code published by the Financial Reporting Council in September 2014
The Company National Express Group PLC
CPI Consumer Price Index
CRM Customer Relationship Management
CTV Consolidated Tax Voucher
DfT Department for Transport
DTRs Disclosure and Transparency Rules
EBIT Earnings Before Interest and Tax
EBITDA Earnings Before Interest and Tax plus Depreciation and Amortisation. It is calculated by taking normalised operating profit and adding back depreciation, fixed asset grant amortisation, normalised profit on disposal of non-current assets and share-based payments
EFQM European Foundation for Quality Management
EPS Earnings per share – the profit for the year attributable to shareholders, divided by the weighted average number of shares in issue, excluding those held by the Employee Benefit Trust which are treated as cancelled
EU European Union
EURIBOR Euro Interbank Offered Rate
Free cash flow is the cash flow equivalent of normalised profit after tax
FWI Fatalities and Weighted Injuries index
GDP Gross Domestic Product – used to determine the economic performance of a whole country or region
Gearing ratio the ratio of net debt to EBITDA over the last 12 months, including any pre-acquisition EBITDA generated in that 12-month period by businesses acquired by the Group during that period. For the purposes of this calculation, net debt is translated using average exchange rates
GHG Greenhouse Gas
The Group The Company and its subsidiaries
HMRC Her Majesty’s Revenue and Customs
IAS International Accounting Standards
IFRIC International Financial Reporting Interpretations Committee
IFRS International Financial Reporting Standards
KPI Key Performance Indicator
LIBOR London Interbank Offered Rate
LTIP Long-Term Incentive Plan
MAA Moving Annual Average
Additional Information
214 National Express Group PLC / Annual Report and Accounts 2016

Net capital expenditure The increase in net debt arising on the purchase of property, plant and equipment and intangible assets less proceeds from disposals of property, plant and equipment. It excludes capital expenditure arising from UK rail franchise entry and exits and discontinued operations, which are included in these headings. Growth capital expenditure reflects investment in new or nascent parts of the business that drive enhanced profit growth
Net debt is defined as cash and cash equivalents (cash overnight deposits, other short-term deposits) and other debt receivables, offset by borrowings (loan notes, bank loans and finance lease obligations) and other debt payable (excluding accrued interest)
Net interest expense is finance costs less finance income
Normalised earnings per share Earnings per share, excluding intangible asset amortisation and tax relief thereon
Normalised operating profit Statutory operating profit excluding intangible asset amortisation. The Board believes that the normalised result gives a better indication of the underlying performance of the Group, by adding back this non-cash item, and it also allows better comparison of divisional performance which have different levels of intangible amortisation
Normalised result The statutory result excluding intangible asset amortisation and tax relief thereon
Operating cash flow Operating cash flow is the cash flow equivalent of normalised operating profit. A reconciliation is set out in the table within the Group Finance Director’s review.
Operating margin is normalised profit divided by revenue, expressed as a percentage
ORR Office of Rail and Road
PPM Public Performance Measure – used by the rail industry to measure punctuality
RCF Revolving credit facility
Return on assets (ROA) is normalised operating profit divided by net assets excluding net debt, derivative financial instruments and intangible assets. For the purposes of this calculation, net assets are translated using average exchange rates
Return on capital employed (ROCE)
is normalised operating profit divided by net assets excluding net debt and derivative financial instruments. For the purposes of this calculation, net assets are translated using average exchange rates
Return on invested capital (ROIC)
is normalised operating profit divided by invested capital. For acquisitions, invested capital is total consideration for the acquired business
RME Rhine-Münster Express
RMS Revenue Management System
RPI Retail Prices Index
RPS Railways Pension Scheme
RRX Rhine-Ruhr Express
SPAD Signal Passed at Danger
TOC Train Operating Company
TSR Total Shareholder Return – the growth in value of a shareholding over a specified period assuming that dividends are re-invested to purchase additional shares
TUPE Transfer of Undertakings (Protection of Employment)
ULSD Ultra low sulphur diesel
Underlying revenue compares the current year with the prior year on a consistent basis, after adjusting for the impact of currency
In UK Bus, commercial revenue is that from fare-paying customers and excludes concessions and contracted services. In UK Coach, core express revenue is that from the scheduled National Express network.
Safety Incidents measure those for which the Group is responsible and is based on the Fatalities and Weighted Injuries index used in the UK rail industry.
215Annual Report and Accounts 2016 / National Express Group PLC

Five Year Summary
2016(restated)
2015(restated)
2014(restated)
2013(restated)
2012
Group normalised
Revenue 2,103.7 1,753.8 1,715.8 1,748.3 1,636.1
Normalised operating profit 219.0 191.8 177.7 167.4 164.6
Return on capital 11.9% 11.7% 10.7% 10.8% 11.1%
Basic EPS 27.3 23.4 18.9 19.2 22.3
IFRS
Revenue 2,103.7 1,753.8 1,715.8 1,748.3 1,636.1
Operating profit 185.2 172.7 124.9 117.4 108.6
PBT 136.3 129.3 77.2 63.9 60.8
Basic EPS 23.0 20.9 11.6 11.1 11.8
Dividends per share 12.2 11.3 10.3 10.0 9.8
Net (debt)/funds
Cash 324.4 60.4 83.7 40.9 72.8
Other debt receivable 0.5 0.8 0.8 1.0 1.0
Bonds (983.2) (583.5) (585.3) (579.5) (590.0)
Bank loans (13.1) (45.3) (5.2) (19.3) (114.6)
FV of derivatives 25.5 14.3 18.6 9.2 23.4
Finance lease (159.7) (127.6) (110.5) (132.9) (154.7)
Other debt payable (72.4) (64.6) (66.4) (65.5) (66.1)
Net debt (878.0) (745.5) (664.3) (746.1) (828.2)
Gearing ratio 2.50 2.45 2.25 2.50 2.50
Additional Information
216 National Express Group PLC / Annual Report and Accounts 2016

Corporate Information
Secretary and registered office Joy BaldryNational Express Group PLC National Express House Birmingham Coach Station Mill Lane Birmingham B5 6DD Tel: +44 (0)8450 130130 www.nationalexpressgroup.com
Registered number2590560
AuditorDeloitte LLPFour Brindleyplace Birmingham B1 2HZ
RegistrarsEquiniti LimitedAspect House Spencer Road Lancing West Sussex BN99 6DA Shareholder helpline: 0371 384 2152* or +44 121 415 7047 from overseas.
* Lines are open 8.30am to 5.30pm UK time, Monday to Friday excluding English public holidays.
Principal bankerHSBC Bank plc8 Canada Square London E14 5HQ
Corporate solicitorsAshurst LLPBroadwalk House 5 Appold Street London EC2A 2HA
Financial advisorsBank of America Merrill Lynch2 King Edward Street London EC1A 1HQ
StockbrokersBank of America Merrill Lynch2 King Edward Street London EC1A 1HQ
HSBC Bank plc8 Canada Square London E14 5HA
Cautionary statementThis Annual Report and Accounts is intended to focus on matters which are relevant to the interests of shareholders of the Company. The purpose of this Annual Report and Accounts is to assist shareholders in assessing the strategies adopted and performance delivered by the Company and the potential for those strategies to succeed. It should not be relied on by any other party or for any other purpose.
Forward looking statements are made in good faith, based on a number of assumptions concerning future events and information available to Directors at the time of their approval of this report. These forward looking statements should be treated with caution due to the inherent uncertainties underlying any such forward looking information. The user of this Annual Report and Accounts should not rely unduly on these forward looking statements, which are not a guarantee of performance and which are subject to a number of uncertainties and other facts, many of which are outside the Company’s control and could cause actual events to differ materially from those in these statements. No guarantee can be given of future results, levels of activity, performance or achievements.
This Annual Report and Accounts is printed on Revive 100% Silk and Revive 100% Offset, which are made using 100% recycled fibre certified by the FSC®.
Printed by Park Communications who are certified to ISO 14001, the standard for environmental management.
If you have finished reading this report and no longer wish to retain it, please dispose of it in your recycled paper waste.
Thank you.
Consultancy, design and production www.luminous.co.uk
Photography by Janie Airey
Print managed by urbanprintsupport.co.uk

National Express Group PLCNational Express HouseMill LaneDigbethBirmingham B5 6DDTel: +44 (0) 8450 130130www.nationalexpressgroup.com