annual report & accounts year ended 30 june 2020
TRANSCRIPT

TRIS
TEL P
LC A
NNUA
L RE
PORT
& A
CCOU
NTS
YEAR
END
ED 3
0 JU
NE 2
020
Tristel plc Annual Report & Accounts
Operational Highlights
Financial Highlights
Strategic ReportChairman’s StatementChief Executive’s ReportFinancial Review
Company Information
Directors’ Biographies
Directors’ Remuneration Report
Corporate Governance Report
Directors’ Report
Independent Auditor’s Report
Consolidated Income Statement
Consolidated Statement of Comprehensive Income
Consolidated Statement of Financial Position
Company Statement of Financial Position
Consolidated Statement of Changes in Equity
Company Statement of Changes in Equity
Consolidated Statement of Cash Flows
Company Statement of Cash Flows
Notes to the Financial Statements
Contents
2
4
68
14
20
21
24
28
34
37
41
42
42 – 43
44
45
46
47 – 48
49
50
1

Operational Highlights of 2020
WE HAVE BEEN ABLE TO NAVIGATE OUR WAY THROUGH THE EARLY COVID-19 CRISIS BY MITIGATING THE FALL IN DEMAND FOR OUR PRIMARY PRODUCT PORTFOLIO BY A RAPID INCREASE IN SUPPLY OF HOSPITAL SURFACE DISINFECTION PRODUCTS.
OUR STRATEGIC EMPHASIS ON ENVIRONMENTAL SURFACE DISINFECTION CHIMES WELL WITH THE LIKELY AFTERMATH AND LEGACY OF COVID-19.
WE HAVE DEVELOPED A DISTINCTLY DIFFERENT BRAND FOR OUR HOSPITAL ENVIRONMENTAL SURFACE PRODUCTS. THE BRAND NAME IS CACHE.
During the year:
2
TRIS
TEL P
LC A
NNUA
L RE
PORT
& A
CCOU
NTS
YEAR
END
ED 3
0 JU
NE 2
020

THE COMPETITIVE ADVANTAGE THAT WE HOLD IS THAT WE ARE THE ONLY COMPANY WORLDWIDE USING CHLORINE DIOXIDE TO DISINFECT MEDICAL INSTRUMENTS.
WE NOW HAVE 14 SUBSIDIARIES SELLING DIRECTLY INTO THE HOSPITAL MARKETPLACE.
THE PROPORTION OF OUR REVENUE GENERATED IN OVERSEAS MARKETS CONTINUED TO INCREASE. STAND-OUT PERFORMANCES WERE DELIVERED BY FRANCE WHERE SALES TRIPLED TO REACH £1.8M, AND CHINA WHERE SALES MORE THAN DOUBLED.
3

Tristel plc is a manufacturer of infection prevention and contamination control products. Its lead technology is a proprietary chlorine dioxide formulation incorporated in high-performance disinfectants used principally in hospitals on medical devices and environmental surfaces.
MEDICAL DEVICE DECONTAMINATION IN HOSPITALSDelivered via the Tristel brand
ENVIRONMENTAL SURFACE DISINFECTION IN HOSPITALSDelivered via the Cache brand
ANIMAL HEALTHCARE AND CONTAMINATION CONTROLMostly delivered via the Anistel and Crystel brands
REVENUE2020
PROFIT BEFORE TAX* 2020
BASIC EARNINGS PER SHARE2020
+21%+27%
*BEFORE SHARE-BASED PAYMENTS
+12%ORDINARY DIVIDENDS PER SHARE 2020
Financial Highlights of 2020
REVENUE2019 2020
*PROFIT BEFORE
TAX
BASIC EARNINGS
PER SHARE
ORDINARY DIVIDENDS PER SHARE
26.2M 5.6M 9.14P5.54P
+25%
31.7M 7.1M 11.38P 6.18P
2019 2020 2019 2020 2019 2020
4
TRIS
TEL P
LC A
NNUA
L RE
PORT
& A
CCOU
NTS
YEAR
END
ED 3
0 JU
NE 2
020

Medical device decontamination in hospitals
Contamination control in critical environments
Infection prevention in animal healthcare
Environmental surface disinfection in hospitals
5

The Group continued to develop strongly during the year to 30 June 2020. Sales grew to £31.7m from £26.2m in 2019, an increase of 21%. The proportion of our revenue generated in overseas markets continued to increase and reached 60% in the year (2019: 55%). Overseas sales grew by 32% whilst UK sales grew by 7%. This difference in the pace of growth, across our various markets, reflects the higher market penetration in the United Kingdom than so far achieved in overseas markets.
In last year’s Annual Report, we described our future direction as a Group that will continue to concentrate on our proprietary chlorine dioxide technology, broadening its application to the cleaning and disinfection of environmental surfaces in hospitals, alongside our core activity which is the use of our chemistry for the high-level disinfection of medical devices.
The final four months of our financial year were impacted significantly by COVID-19. During this period, we experienced two powerful countervailing forces: 1) a decline in the use of our medical device decontamination products as hospitals worldwide postponed all but the most critical patient appointments to free up resources to deal with COVID-19 related cases; and 2) a surge in purchasing and use of our hospital environmental surface disinfection products. The decision to develop a broad surface disinfection product range for hospitals and our preparations to launch it during the 2021 financial year, which were well under way when COVID-19 was declared a pandemic, enabled us to balance the decline in revenues in the core part of business with an increase in revenues in our new initiative.
During the March to June period, when the impact of COVID-19 was at its greatest, global sales were £11.8m compared to £9.1m in the same period last financial year, an increase of 30%. Medical device decontamination product sales accounted for 74% of global sales in this period, whilst sales of hospital surface disinfection products accounted for 15%. Tristel estimates that COVID-19 resulted in a reduction of £0.5m in medical device decontamination product sales and an increase in sales of hospital surface disinfection products of £2m above the underlying trend.
As can be seen, Tristel was able to navigate its way through the early COVID-19 crisis by mitigating the fall in demand for its primary product portfolio by a rapid increase in supply of its hospital surface disinfection products. The Group has invested heavily over the past three years to create a product portfolio for hospital surface disinfection and has given the portfolio a different brand name, the Cache collection. Whilst anchored upon Tristel’s proprietary chlorine dioxide chemistry, Cache incorporates other cleaning and disinfection chemistries widely used in hospitals. The key theme of the Cache proposition is a powerful environmental and ecological message. In the run up to March, the Group had been building its inventory of Cache product components in preparation for a full-scale launch towards the end of this year. Tristel was thereby able to take advantage of unprecedented buying by hospitals of all types of disinfectant products in several geographical markets where the Group had already obtained necessary regulatory approvals. These markets were principally the United Kingdom, Belgium, the Netherlands, France, Hong Kong, and China. The COVID-19 experience has validated the Cache proposition and accelerated the rate of customer acquisition beyond the Company’s pre-pandemic business plan.
COVID-19 has provided an extreme stress test of the Group’s manufacturing capability and supply chain management, and it has performed very well in both regards. The Group was able to meet all demand for products, particularly its surface disinfectant products, at a time when many suppliers to hospital systems worldwide were unable to satisfy the sudden surge in demand.
Strategic Report Chairman’s Statement
Chairman’s Statement
6
TRIS
TEL P
LC A
NNUA
L RE
PORT
& A
CCOU
NTS
YEAR
END
ED 3
0 JU
NE 2
020

The Group’s subsidiaries in the UK, Belgium, the Netherlands, France, Germany, Switzerland, Italy, Russia, Hong Kong, China, Australia and New Zealand all achieved record sales levels. Stand-out performances were delivered by France where sales tripled to reach £1.8m, and China where sales more than doubled to nearly £0.5m. Tristel Malaysia was incorporated in February 2020 and started operation on 1 July 2020 with a team of three who had previously worked for Tristel’s distributor in the country.
Pre-tax profit before share-based payments (referred to as adjusted) was £7.1m compared to £5.6m last year, an increase of 27%; the unadjusted pre-tax profit of £6.6m compared to £4.7m last year, an increase of 40%. Our adjusted pre-tax profit margin, which is a key measure of our performance, was 22% (2019: 21%). The unadjusted pre-tax profit margin increased to 21% from 18% in 2019 (see note 4). Adjusted earnings per share (EPS), was 12.35 pence, up from 11.08 pence last year (see note 22). Basic EPS was 11.38 pence, a 25% increase from last year, after a share-based payment charge of £0.435m (2019: £0.852m). This charge is a non-cash item.
The Group has continued to be highly cash generative and on 30 June 2020 the cash balance was £6.2m (2019: £4.2m). During the year, the Group spent £0.6m to acquire 80% of Tristel Italia Srl from its local management. In line with the Company’s ordinary dividend policy, the Board is recommending that the final dividend is 3.84 pence (2019: 3.50 pence), an increase of 10%. Including the interim dividend of 2.34 pence (2019: 2.04 pence), and the proposed final dividend, the total dividend for the year will be 6.18 pence (2019: 5.54 pence), an increase of 12%.
We continued to invest for future growth. During the year we spent £0.4m on product development and testing (2019: £0.4m) and £0.1m on intellectual property protection (2019: £0.2m). Both these expenditures are held in intangible assets. We invested £0.5m (2019: £0.7m) in regulatory and product enhancement programmes where we have recognised this cost as an expense. Included in this cost is an amount of £0.08m (2019: £0.5m) relating to our initiative to enter the United States market which commenced in 2014. The cumulative investment in this regulatory project and in the establishment of a commercial structure within the country has been £1.78m.
Whilst no revenues have yet been generated from the United States, significant progress has been made to build a commercial platform from which to enter the market. During the year we continued to generate data required for a submission which we intend to make to the Food and Drug Administration (FDA) to obtain pre-market approval for our foam-based Duo product as a high-level disinfectant for medical devices. We have already received approvals from the Environmental Protection Agency (EPA) for Duo. We have entered into a partnership with Parker Laboratories based in New Jersey by which we have put in place manufacturing capability and a national distribution network. We do not yet have employees in the United States but have established a subsidiary.
I succeeded Paul Barnes as Chairman at last December’s Annual General Meeting. To further develop our Board of Directors we appointed Isabel Napper as an independent Non-Executive Director in May and I expect us to further develop the diversity, experience and abilities of our Board this year.
My first six months as Chairman have been marked by an unprecedented event – the worldwide viral pandemic COVID-19. I believe that the Group has successfully navigated its way through a turbulent final four months of the year in which hospitals worldwide have had to deal with patients of this infectious disease.
We will undoubtedly live through the current year with COVID-19 still present and affecting our business. I am greatly encouraged that our business model has proven to be resilient to these powerful external forces and believe that our strategic focus will sustain our continued progress.
Dr Bruno Holthof Chairman 16 October 2020
7

OverviewGroup revenue was up 21%, adjusted pre-tax profit was up 27% (pre-tax profit up 40%) and adjusted EPS was up 11% (basic EPS up 25%). We ended the year with cash of £6.2m. The Group is debt-free.
In October 2019, we set a new financial plan for the three years to 30 June 2022. The three key financial targets of the plan were: i) sales growth in the range of 10% to 15% per annum as an annual average over the three years; ii) the achievement in each year of an EBITDA margin (excluding share-based payment charges) of at least 25%, (both targets became Key Performance Indicators (KPIs) of the Group); and iii) to increase profit before tax (excluding share-based payments) year-on-year, independently of the other two KPIs.
The above KPIs were exceeded and PBT before share-based payments increased by 27%.
For the past nine years we have presented our business activities by segmenting them into three brand portfolios addressing three markets. These are infection prevention in hospitals under the brand name Tristel; infection prevention in animal healthcare under the brand name Anistel, and contamination control in critical environments under the brand name Crystel. This year, we break from this tradition and report upon three different revenue segments being: a) medical device decontamination in hospitals; b) environmental surface disinfection in hospitals; and c) other revenues. The latter derive from our animal healthcare product range and contamination control product range and a miscellaneous group of other applications and users of our products. During the year, revenues by portfolio brand were £29.3 (2019: £24.2m) for Tristel, £1.0m (2019: £0.8m) for Anistel, and £1.4m (2019: £1.2m) for Crystel.
The new segmental reporting reflects our strategic direction which is to focus on our proprietary chlorine dioxide technology, broadening its application to the cleaning and disinfection of environmental surfaces in hospitals, alongside our core activity which is the use of our chemistry for the high-level disinfection of medical devices. We have developed a distinctly different brand for our hospital environmental surface products. The brand name is Cache. There are Tristel branded surface disinfection products that will migrate over during the current financial year to the Cache brand. Our strategic intention is to develop the Tristel and Cache brands and product portfolios with a significant degree of independence from each other, but both being anchored upon our chlorine dioxide technology platform and using the same sales force in all countries.
During the year, the revenue split across the three segments was:
Strategic Report Chief Executive’s Report
Chief Executive’s Report
Segment Brand
Year ended 30 June 2019
£m
Year ended 30 June 2020
£m
Medical device decontamination in hospitals Tristel 20.80 23.50
Environmental surface disinfection in hospitals Cache 2.60 4.90
Other – non-core Crystel, Anistel and miscellaneous 2.80 3.30
Group 26.20 31.70
Our strategic emphasis on environmental surface disinfection chimes well with the likely aftermath and legacy of COVID-19 which will be that hospitals worldwide will enhance their cleaning and disinfection practices. The rapid increase in surface disinfection product sales during the last four months of the year supported our thesis that achieving a better balance between our two key revenue contributors will produce a more resilient business model.
8
TRIS
TEL P
LC A
NNUA
L RE
PORT
& A
CCOU
NTS
YEAR
END
ED 3
0 JU
NE 2
020

The proportion of our revenue generated in overseas markets continued to increase and reached 60% in the year (2019: 55%). This is a well-established trend and we expect it to continue. Our overseas rate of sales growth has been consistently higher than the UK rate of sales growth and we expect this to continue. During the year overseas sales grew by 32% whilst UK sales grew by 7%. The history over the past five years is shown in the table below.
We are heavily exposed to the global healthcare system and in the current social and economic environment, dominated by a global pandemic, our geographical diversity is a strategic strength. We have seen countries emerge from lockdown and their health systems resume out-patient and elective procedures at differing times. We can expect countries to re-enter lockdown in an unsynchronised way too.
In July, we acquired 80% of the share capital of Tristel Italia Srl, bringing this company under our complete ownership and control. We now have 14 subsidiaries selling directly into the hospital marketplace in the United Kingdom, Belgium, the Netherlands, France, Italy, Germany, Switzerland, Poland, Russia, Hong Kong, China, Malaysia, Australia, and New Zealand. We have subsidiaries in the United States, Japan, India and Ireland which are not yet active in terms of selling.
All active subsidiaries achieved record sales levels during the year. Stand-out performances were delivered by France where sales tripled to reach £1.8m, and China where sales more than doubled to nearly £0.5m. Tristel Malaysia was incorporated in February 2020 and started operation on 1 July 2020 with a team of three who had previously worked for Tristel’s distributor in the country.
At 30 June 2020, the Group-wide average headcount was 164 (2019: 142). Of these employees, 106 are located in the United Kingdom (2019: 92); 33 are located in Europe (2019: 32); and 25 are located in the Asia and Pacific region (2019: 19). All manufacturing takes place in the United Kingdom, apart from the sub-contracted manufacture in New Zealand of components for the Stella medical device reprocessing system and their assembly by our operation in Tauranga, North Island.
Our business: What our marketplace looks likeOur entire business is focussed on preventing the transmission of microbes from one object or person to another. We pursue this purpose because microbes can be a source of infection to humans and animals. They can cause illness or death and place a heavy cost on individuals and society. We achieve our purpose by applying a very powerful disinfectant – chlorine dioxide – to the target environmental surface or medical instrument. We are unique worldwide in using chlorine dioxide as a high-performance disinfectant. We are also one of a very few companies worldwide that can legitimately claim to be exclusively an infection prevention business.
Year ended 30 June 2016
Year ended 30 June 2017
Year ended 30 June 2018
Year ended 30 June 2019
Year ended 30 June 2020
Revenue split %United Kingdom 61% 53% 49% 45% 40%
Overseas 39% 47% 51% 55% 60%
Annual revenue growth %United Kingdom 5% 3% 2% 9% 7%
Overseas 22% 43% 19% 26% 32%
9

Our mission is most relevant to hospitals where the risks of infection to individuals are highest.
A hospital is a vast, multi-faceted organisation. We are not only unique in providing chlorine dioxide as a high-performance disinfectant within hospitals, but we are also unique in our focus upon specific clinical departments within them. We target clinical departments that carry out diagnostic procedures with small heat-sensitive medical instruments. These include: the nasendoscope used in Ear, Nose and Throat departments; the laryngoscope blade used in emergency medicine; tonometers used in ophthalmology, and ultrasound probes used in both women and men’s health. In these departments, we are the only simple to implement, affordable, high-performance disinfection method available. Consequently, in geographical markets in which we have been present for some time, we hold a truly significant market share.
Infection prevention is a basic requirement for the safe and effective provision of healthcare. This is true in all hospitals in all countries. Our primary focus is on the acute hospital, but the trend is for medical device procedures to take place outside of the hospital, and the pool of opportunity for the sale of our products can be expected to expand substantially over the long term.
The cleaning and disinfection of environmental surfaces in hospitals is ubiquitous. We expect the legacy of COVID-19 to be that hospitals will be more rigorous in their selection of the best performing and most scientifically validated disinfectant products, which will benefit our Company, and that the frequency of cleaning and disinfection practice will increase. The two influences will result in greater expenditure by hospitals on environmental disinfection. We believe that macro trends impacting our Cache initiative are generally positive.
How we service our marketOver 98% of our revenues are of repeat consumable products that perform a vital function in hospitals. Their use is for the most part non-discretionary. Our products are typically small packaged goods, requiring no after sales service, other than comprehensive training. Capital sales, service and maintenance do not feature, therefore, in a significant way in our revenue model.
We sell our products directly to end-users in those markets in which we have established a subsidiary, and through distributors in markets where we have no corporate presence.
Strategic Report Chief Executive’s Report continued
REVENUE GROWTH FROM 2008 – 2020 (£M)
08–09 09–10 10–11 11–12 12–13 13–14 14–15 15–16 16–17 17–18
6.88.8 9.3
10.9 10.5
13.515.4
17.1
20.322.2
18–19
26.2
19–20
31.7
10
TRIS
TEL P
LC A
NNUA
L RE
PORT
& A
CCOU
NTS
YEAR
END
ED 3
0 JU
NE 2
020

OUR REVENUES – BY SALES CHANNELYear ended
30 June 2020 £m
Year ended 30 June 2019
£mYear-on-year
change Percentage
change
Hospital medical device decontamination:UK and Europe direct 16.77 14.12 2.65 19%
APAC region direct 4.61 4.14 0.47 11%
Worldwide distributors 2.12 2.51 (0.39) (16)%
23.50 20.77 2.73
Hospital environmental surface disinfection:UK and Europe direct 3.89 2.28 1.61 71%
APAC region direct 0.23 0.12 0.11 92%
Worldwide distributors 0.76 0.21 0.55 262%
4.88 2.61 2.27
Other revenues – direct and worldwide distributors 3.30 2.79 0.51 18%
Group 31.68 26.17 5.51 21%
£31.68MILLION
DIVISION OF TOTAL REVENUE BY SALES CHANNEL 2019 – 2020
HOSPITAL MEDICAL DEVICE DECONTAMINATION
HOSPITAL ENVIRONMENTAL SURFACE DECONTAMINATION
OTHER
OUR REVENUES – BY TECHNOLOGYThe majority of our sales are of chlorine dioxide (CI02) based products; but we do formulate, manufacture and sell products utilising other disinfectant chemistries. These include quaternary ammonium compounds, peracetic acid and alcohol. In 2020, £4.4m of our sales were of non-chlorine dioxide chemistries representing 14% of the total (2019: £3.7m representing 14%). As our chlorine dioxide product sales increase at a faster pace than non-chlorine dioxide product sales, and as we continue to find ways to persuade customers to switch to chlorine dioxide as a superior disinfection technology, we expect this percentage to continue to reduce in significance.
11

Strategic Report Chief Executive’s Report continued
Our strategic assets We consider the assets that enable the Group to achieve its strategic goals to be:
• Our chlorine dioxide chemistry, about which there are three critically important elements:
1. The formulation is proprietary. 2. We remain the only company using chlorine dioxide for the decontamination of medical instruments in the world, which gives us a genuine point of difference from all other infection prevention companies. 3. The length of time that we have enjoyed this position has allowed us to collate a significant body of knowledge, including published scientific data, the testimony of almost two decades of safe use, a significant global footprint of regulatory approvals and a library of proven compatibility with hundreds of medical instruments, all of which would take a newcomer significant time and cost to match.
• Intellectual property protection – at 30 June 2020, we held 265 patents granted in 37 countries providing legal protection for our products.
• Our people – who hold an unrivalled body of knowledge relating both to infection prevention and to chlorine dioxide, allowing us to quickly and efficiently create and bring to market innovative and market ready products.
OUR PROPRIETARY CHLORINE DIOXIDE CHEMISTRYThe competitive advantage that we hold is that we are the only company worldwide using chlorine dioxide to disinfect medical instruments.
With this same chemistry, we have also established a bridgehead in hospital surface disinfection, the veterinary market, and the contamination control market.
The focus of our research and development is our chlorine dioxide technology, searching for continuous improvements in increased microbial efficacy, a reduction in hazards, and greater efficiency in manufacture. In parallel, we invest heavily in the creation of packaging and delivery forms that enhance and simplify the user experience.
Our regulatory programme succeeded in attaining 25 approvals for 20 products in eight countries during the year.
OUR INTELLECTUAL PROPERTY PROTECTION In its broadest sense, our intellectual property relates to:
1. Patents, trademarks and registered designs. 2. The scientific validation of our chemistry and our products that has entered the public domain via 29 peer-reviewed and published papers. 3. 19 guidelines have been published by professional clinical bodies, infection prevention bodies, and national healthcare institutions that reference the use of chlorine dioxide in a format that is recognisable as Tristel. 4. The certification by medical device manufacturers that our chemistry is compatible with their products. We enjoy official compatibility with the instrumentation of 55 medical device manufacturers, with respect to 1,845 of their individual models.
OUR PEOPLEAt Tristel the basic qualities we seek in our staff are integrity, inquisitiveness and humility. In our management team, we also look for excellent decision making and execution ability and a ‘know no boundaries’ approach. We believe that these qualities can make the highest possible performance achievable. We view our colleagues as a key strategic asset of the business.
12
TRIS
TEL P
LC A
NNUA
L RE
PORT
& A
CCOU
NTS
YEAR
END
ED 3
0 JU
NE 2
020
Delivering on our key strategic financial goalOur key strategic financial goal is to deliver long term sustainable growth. The two key performance measures that we target are:
• Consistent revenue growth – during the past five years, revenue has grown from £17.1m to £31.7m – an increase of 85%. The compound annual growth rate in revenue since the Group went public in 2005 has been 17%. During the year we set a new three-year target to grow revenues in the range of 10% to 15% on average each year to 30 June 2022. We surpassed the target in the year.
• Maintaining the profitability of the Group – the new three-year target is to achieve a minimum EBITDA margin (before share-based payments) of 25%. During the year the adjusted EBITDA margin was 31%.
• A third goal is to increase profit before tax (before share-based payments) each year.
The corollary to achieving these targets is that we have been highly cash generative given the operational cash requirements of the business. The Board’s policy with respect to dividends is that if it considers that there are no earnings enhancing opportunities to invest excess cash, a special dividend for shareholders will be considered along with other distribution options.
The Board’s pursuit of these financial objectives is grounded in the belief that consistent and sustainable increases in earnings and dividends will, over time, result in share price growth.
Progress in North AmericaIn 2014, we explained to our shareholders that we had embarked upon a United States regulatory approvals programme. To date we have focussed upon our chlorine dioxide foam-based product Duo.
We have received approval for Duo from the EPA as an intermediate level disinfectant.
We are preparing a submission to the FDA for Duo as a high-level disinfectant. The intended use patterns will be for intra-cavity ultrasound probes, nasendoscopes, and lastly certain ophthalmic devices. If successful, this will position us in three of the clinical areas in which we are most successful in other geographical markets.
We have appointed Parker Laboratories as our contract manufacturer for supply to each of these targeted clinical areas. We have granted Parker marketing rights for Duo’s use in ultrasound where they are the market leader in the United States for ultrasound conductive gels. In the ultrasound segment, the contractual arrangement is royalty-based.
FocusWe have set objectives which are visible to everyone inside the Group, and we make them equally visible to all other stakeholders.
We look forward to meeting these objectives and continuing the progress of the Group. We look to the future with confidence as Tristel continues to grow and expand its geographical reach.
Paul Swinney Chief Executive Officer 16 October 2020
13

Strategic Report Financial Review
Financial Review
Fair review of the businessRevenue increased by 21% in the year, following UK sales growth of 7% and overseas sales growth of 32%. Overseas sales were 60% of the total compared to 55% last year.
The impact of COVID-19 upon the year is estimated at a net increase in sales of £1.5m, derived from an increase in sales of hospital surface disinfectants and a reduction in sales of hospital medical device disinfectants. Further details are provided within the principal risks and uncertainties section of this report, on page 18.
Another contribution to sales growth came from a full year of sales from the three Western European subsidiaries acquired in November 2018, compared to seven months in the prior year. Sales within this geographical area grew from £2.1m in 2019 to £4.6m in 2020.
In July 2019 the Group acquired its former Italian associate, in which a 20% stake was increased to 100%. The Group’s share of sales within Italy increased from £0.1m to £0.6m as a consequence. The acquisition allows the Company to invest in a faster pace of growth in Italy than otherwise would have been the case, whilst bringing in-house the distributor margin.
Administrative costs increased by 14%, impacted by the Italian acquisition and a full year of Western Europe overheads compared to a seven month contribution in the prior year. The Company continued its investment in the United States regulatory programme, spending £0.08m during the year. COVID-19 curtailed overseas travel which has both impacted the progress of the US programme and reduced the Group’s travel costs. This cost saving has been offset by the additional production cost necessary to meet the increased product demand and the necessary investment in IT and safety measures.
Share-based payments The non-cash IFRS2 charge (share-based payment charge) for the year was £0.4m (2019: £0.9m). The 2019 charge related to the share option scheme approved at the Company’s 2017 AGM, which is two thirds vested. Details of the scheme can be found on page 83.
Profit before tax and share-based paymentsProfit before tax and share-based payments of £7.1m increased by 27% from £5.6m in 2019. (Unadjusted profit before tax increased by 40% to £6.6m from £4.7m in 2019). Adjusted pre-tax profit margin was 22% (2019: 21%). (Unadjusted pre-tax profit margin was 21% (2019: 18%.)
Earnings before interest, tax, depreciation and amortisationReported EBITDA increased by 49% in the year to £9.4m (2019: £6.3m). EBITDA adjusted for share-based payments and the effect of transition to IFRS 16 was £8.9m, an increase of 25% on the comparable number (2019: £7.1m). The calculation of EBITDA is detailed in note 4.
14
TRIS
TEL P
LC A
NNUA
L RE
PORT
& A
CCOU
NTS
YEAR
END
ED 3
0 JU
NE 2
020

Relating to year ended 30 June
Adjusted EPS pence
Interim dividend pence
Final dividend pence
Special dividend pence
Total dividend pence
Ordinary dividend cover ratio
2020 12.35 2.34 3.84 None 6.18 2x
2019 11.08 2.04 3.50 None 5.54 2x
2018 9.16 1.60 2.98 None 4.58 2x
The relationship between ordinary dividends and adjusted EPS can also be expressed as a cover ratio which the Board has set at 2 times, and it expects the current policy to continue for the medium term. However, subject to any adverse movement in earnings, financial strength, cash resources and the assessment of future trading, the Board retains the option to allow a temporary fall in the cover ratio to maintain the dividend.
Dividend announcements, approvals and payments are typically expected to follow a set schedule:
Dividend Status and date announced Approval Approximate payment date
Ordinary interim Declared February The Board February March following the announcement
Ordinary final Recommended October AGM by shareholders December December
Earnings and dividendsThe Company’s policy is to pay out half of adjusted EPS to shareholders in the form of an ordinary dividend each year. When declaring dividends, the Board considers the Group’s cash resources and the adequacy of its distributable reserves.
The conditions that the Board applies to special dividends are that cash reserves should exceed, after payment of the dividend, the minimum operational and investment needs of the business and that the special dividend can be made from available distributable reserves. The Board believes this approach provides a flexible mechanism for managing the maintenance and expansion of the Group’s asset base whilst providing a reasonable return to shareholders.
Over the last three years, the Group’s total dividends (excluding special dividends) and adjusted EPS have both increased at an average growth rate of 35%.
Cash flowDuring the year, net cash flow from operating activities increased to £6.989m. The components of the movement are:
£000’sYear ended
30 June 2020Year ended
30 June 2019 Movement
Profit before share-based payments and tax 7,074 5,549 1,525
Depreciation and amortisation 2,491 1,470 1,024
Impairment charges and loss on disposal of intangible assets 67 79 (12)
Income from associate – 45 (45)
Loss on disposal of plant, property and equipment 54 21 33
Gain on fair value of investment (111) (98) (13)
Unrealised loss on foreign exchange 8 72 (67)
Finance costs (1) (1) –
Working capital movements (1,453) (780) (673)
Taxation (1,140) (871) (269)
Net cash flow from operating activities 6,989 5,486 1,503
The key contributors to the year-on-year cash-flow movement were the increase in operating profit before share-based payments of £1.5m and working capital movements predominantly due to increased stock holding of £1.6m.
15

Strategic Report Financial Review continued
Financial key performance indicatorsThe Board considers the primary financial key performance indicators to be:
Measurement Why this is importantFinancial key performance
indicator for 2019-20
TOTAL REVENUE GROWTH
Change in the current year revenue compared with the previous year.
To meet the strategic objective of delivering long term sustainable growth in EPS, consistent revenue growth must be achieved.
21% (2018-19: 18%)
NON-UK REVENUE AS A PERCENTAGE OF TOTAL REVENUE
The ratio of non-UK revenue to total revenue.
Within the UK, revenue growth rates are slowing as a result of high market penetration. To achieve consistent overall revenue growth, sales from overseas will need to become a higher percentage of total revenue.
60% (2018-19: 55%)
GROSS PROFIT MARGIN
The ratio of gross profit to revenue.
Gross margin is a primary indicator of business performance and market competitiveness. A movement in gross margin generally reflects a change in the product mix, market pricing, or both.
80% (2018-19: 79%)
ADJUSTED PRE-TAX PROFIT GROWTH
The year-on-year increase in profit before tax, adjusted for share-based payments.
The Group’s primary financial objective is to deliver sustainable long-term growth in the value of our shareholders’ investment in the Group. The primary driver of this will be sustainable profits growth.
27% (2018-19: 19%)
ADJUSTED PBT MARGIN
The ratio of pre-tax profit, adjusted for share-based payments, to revenue.
A movement in PBT margin indicates changes in profitability.
22% (2018-19: 21%)
ADJUSTED EARNINGS PER SHARE (EPS)
Profit after tax, adjusted for share-based payments, divided by the weighted average number of shares in issue during the period.
Adjusted EPS and adjusted EPS growth are widely used measures of company performance. Adjusted EPS forms the basis of the Group’s current dividend policy and adjusted EPS growth will translate directly into dividend growth.
12.35 PENCE (2018-19: 11.08 pence)
RETURN ON CAPITAL EMPLOYED
The ratio of EBIT to the sum of total assets less current liabilities.
Return on capital employed (ROCE) is a good baseline measure of a company’s performance. It is especially useful when comparing similar types of businesses.
19%* (2018-19: 23%)
*Return on capital employed for 2019 was calculated prior to the adoption of IFRS 16. For June 2020, if calculated on a like-for-like basis, return on capital employed is 24%.
In addition to financial KPIs, the Board measures and monitors various non-financial KPIs, including the maintenance of the Group’s quality system and certification required for the design, manufacture and sale of medical devices. The Group is frequently audited by its Notified Body, BSI. The level of success of these audits is measured by the number of major non-conformances. The Notified Body tests all areas of the Group’s quality system including customer service, customer satisfaction and product quality assurance. During the year, the Group underwent four audits of the Quality Managements System and a number of desktop reviews. No major non-conformances were reported. The Company is compliant to the new versions of the following standards, ISO13485:2016, ISO9001:2015 and MDSAP. Health and safety KPIs are measurable values used by the Board to determine and track any accidents, incidents and near misses occurring within the Group’s activities. These KPIs help to determine how well the Health and Safety team is performing and how compliant the workforce is to the safety operating procedures in place.
16
TRIS
TEL P
LC A
NNUA
L RE
PORT
& A
CCOU
NTS
YEAR
END
ED 3
0 JU
NE 2
020

Going concernThe Group’s business activities, together with the factors likely to affect its future development, performance and competitive position are set out in this Strategic Report. The future development of the Group is viewed to be via execution of its strategic plan. Economic conditions can create a degree of uncertainty over the level of demand for the Group’s products. However, the Board considers there to be no material uncertainties within the business. The Board compiles budget and cash-flow forecasts, which are stress tested for potential future influences and events. The Board believes that the Company is well placed to manage its business risks successfully despite the current uncertain economic outlook.
After making enquiries, the Directors have a reasonable expectation that the Group has adequate resources to continue its operational existence for the foreseeable future. Accordingly, the Board has continued to adopt the going concern basis in preparing the annual report and financial statements.
The key business risks are considered, documented and acted upon by the senior management team and Board of Directors regularly. The key areas considered are set out below:
OPERATIONS RISKThe Group’s ability to continue to manufacture and supply its products in a timely manner is a prerequisite to maintaining its sales growth rate, gross margin and profitability. This area of risk is kept under constant review, including identifying multiple routes of supply for key materials and services related to the production of the Group’s products. A disaster recovery plan is in place and reviewed regularly. The plan sets out the steps required to swiftly relocate people, systems and production to ensure continuity of supply.
REGULATORY AND LEGAL APPROVAL RISKThe ability to continue to market the Group’s products is inextricably linked to the Group’s ability to achieve and maintain regulatory and legal approvals in those countries where the Group has a presence.
The challenges in maintaining worldwide legal and regulatory compliance in respect of financial, environmental, quality and health and safety requirements are significant. The Executive Board members, supported by senior managers and specialist advisors, take responsibility for maintaining legal compliance. Through a risk management process the implications of new regulations and legislation are assessed and the necessary changes and mitigation are implemented.
BREXIT RISKThe Group sells into the European Union and given the UK’s departure from the EU it has closely considered the potential outcomes, at the time of and after exit. The key risk has been highlighted as continuity of supply, which is principally linked to the Group’s ability to maintain cross border supply of goods. Close collaboration and communication between the UK manufacturing arm of the business and its in-house and third-party EU distribution channels is in place to ensure that inventory levels will provide a buffer to potential supply chain delays.
COVID-19 RISKThe emergence of COVID-19 represents both an opportunity and a risk to the Group. Hospital infection prevention products, such as the Group’s surface disinfectants, naturally occupy a central position in the healthcare sector’s armoury against the virus. This is demonstrated by the increased demand for surface disinfection products during the year, whereby sales increased from £2.61m to £4.88m. There is a level of uncertainty around the future sales levels of surface disinfection products; the Board expects the spike in demand seen during the initial stages of the pandemic to temper, but not reverse. Increased hospital cleaning and disinfection routines are considered by the Board to be a likely legacy of the pandemic.
17

Strategic Report Financial Review continued
In contrast, hospital diagnostic medical procedures which create the demand for the Group’s medical device disinfectants fell during the pandemic as hospital outpatient departments closed. The Board has estimated that an additional £2m of surface disinfectant sales were made and £0.5m of medical device disinfectants sales were lost as a result of COVID-19. The Board expects the medical device disinfectant custom base to remain in-tact and sales to recover, however, the timing of this bounce-back is dependent upon hospital medical procedures returning to pre-COVID-19 numbers.
The key risk to the business is that medical device sales do not return at a pace which allows the Group’s sales to continue at their existing growth trajectory. To mitigate this risk the Group has accelerated the launch of its surface disinfection range, the Cache collection.
Other risks associated with COVID-19, not associated with a variation to normal sales activity, include:
• Supply chain: National lockdowns and industry closures could slow the inward supply of product components and raw materials to the Group’s manufacturing facility. This risk has been mitigated as far as feasible via an increase in inventory holding of both components and finished goods. Critical component holding has been increased to up to six months of inventory, and key finished product items have been increased to up to four months of inventory. The Group is collaborating very closely with its top-tier suppliers to ensure that variations in component and product demand can be affected and reacted to at short notice. To date there have been minimal issues with supply.
• Health and safety: If a virus outbreak were to occur amongst the Group’s personnel, the business could be negatively impacted through the absence of key staff. The Group operates a strict physical distancing and hygiene protocol, including: handwashing, workstation and high touch area clean-downs, one-way people flow, homeworking rotas, provision of personal protective equipment and people / workstation distancing. All overseas business travel has been curtailed and private overseas travel is monitored. Only staff presenting a negative COVID-19 test may re-attend work after returning from overseas travel.
A backfill plan has been documented in case key personnel are absent for an extended period of time – stipulating how all essential functions can continue.
• Financial: A portion of the Group’s customer base includes smaller or private businesses which may be negatively impacted by the economic downturn and increase the Group’s customer receivables risk. To help mitigate the risk the Group has increased its credit screening.
All discretionary expenditures and significant cash outflows are subject to an additional review to ensure that the cash out-flow planning can be varied if necessary.
• IT: The increased level of communication through mobile applications increases the risk of data loss or business interruption due to possible insecure network connections. To mitigate this risk communications and information technology infrastructures have been upgraded to ensure they are able to support remote working, user awareness of cyber-attacks has been increased, and device management including anti-virus and firewall protection has been enhanced. In addition, the frequency and adequacy of data backup practices has been increased and cloud-based technology implemented to facilitate seamless remote working.
18
TRIS
TEL P
LC A
NNUA
L RE
PORT
& A
CCOU
NTS
YEAR
END
ED 3
0 JU
NE 2
020
EXTERNAL RISKSThe Group’s performance is also subject to external macroeconomic conditions and changes in factors such as inflation or public spending.
FINANCIAL RISKSThe Group’s activities expose it to financial risks including credit risk, cash-flow risk and exchange-rate risk:
Credit and liquidity risksThe Group’s principal financial assets are cash and receivables. Credit risk is primarily attributable to its trade receivables, which are diversified across a large number of low value customer accounts. In addition, operations in new markets may have a higher than average risk of political or economic instability, and may carry increased credit risk. In each case the risk to the Group is its ability to collect its debts.
Credit risk on liquid funds is limited because the counterparties are banks with high credit ratings assigned by international credit rating agencies. The credit risk on trade and other receivables is managed by agreeing appropriate payment terms with customers, obtaining credit agency ratings of all potential customers; by requiring wherever possible payment for goods in advance or upon delivery; and by closely monitoring customer balances due, to ensure they do not become overdue. In addition, careful consideration is given to operations in new markets before the Group enters that market.
The Group policy is to maintain a strong capital base to enhance investor, creditor and market confidence. Surplus funds are placed on time deposits, with cash balances available for immediate withdrawal if required. The Group has significant cash reserves at the date of signing, no external debt and no covenants.
Cash-flow riskThe Group’s cash balances are monitored daily to ensure sufficient funds are held to meet the business needs without the requirement for further financing. To aid with the control of funds, cash-flow forecasts are reviewed regularly to allow the required allocation of funds across the Group to be visible and avoid any shortfalls. To further reduce risk, Group entities hold only the cash required for their operational activities. Excess funds are held in the UK.
Exchange-rate riskGroup exposure to exchange-rate risk includes the measurement of overseas operations at the relevant exchange rate and changes in trade payables and receivables as a result of exchange-rate movements. Daily exchange-rate movements are monitored and any losses or gains incurred are taken to the income statement and reported in the Group’s internal management information. Before agreeing any overseas transactions, consideration is given to utilising financial instruments such as hedging and forward purchase contracts.
The Strategic Report which incorporates the Chairman’s Statement, Chief Executive’s Report and Financial Review, was approved by the Board and signed on its behalf by:
Elizabeth Dixon Finance Director 16 October 2020
19

Company Information
Directors BLM HolthofPC SwinneyEA DixonBVM LeemansPM BarnesDWE OrrTAJ JenkinsIJS Napper
Company Secretary EA Dixon
Registered office Unit 1B Lynx Business ParkFordham RoadSnailwellNewmarketCambridgeshireCB8 7NY
Auditors KPMG LLPChartered Accountants – Registered AuditorsBotanic House98-100 Hills RoadCambridgeCambridgeshireCB2 1AR
Solicitors Field Fisher Waterhouse LLPRiverbank House2 Swan LaneLondonEC4R 3TT
Patent Attorney Dummett Copp LLP25 The SquareMartlesham HeathIpswichSuffolkIP5 3SL
20
TRIS
TEL P
LC A
NNUA
L RE
PORT
& A
CCOU
NTS
YEAR
END
ED 3
0 JU
NE 2
020

Directors’ Biographies
Bruno Holthof Independent Non-Executive Chairman
Appointed 2019 Member of Remuneration and Nomination Committees
Bruno Holthof is the Chief Executive Officer of Oxford University Hospitals (OUH). Before OUH, he was CEO of the Antwerp Hospital Network from January 2004 until September 2015. Bruno Holthof is also a member of the Board of Financière de Tubize, and a reference shareholder of UCB, a global biopharma company.
Before becoming a CEO, he was a partner at McKinsey & Company. During this period, he served a wide range of healthcare clients in Europe and the United States and gained significant expertise in the areas of strategy, organisation and operations. He holds an MBA from the Harvard Business School and an MD/PhD from the University of Leuven. Bruno brings the following skills to the Board:
• An in-depth knowledge of healthcare systems in different markets
• Operational understanding of healthcare services
• Expertise in strategic, organisational and operational change in large organisations
• More than ten years of Board experience in publicly listed companies
Paul Swinney Chief Executive
Appointed 1993 Member of Nomination Committee
Paul Swinney started his career with Brown, Shipley & Co in 1980. He worked for the European banking operations of Norwest Bank Minneapolis and Maryland National Bank, before joining OSI Finance, a specialist in shipping finance, in 1987. In 1993 he co-founded the business that was to become Tristel plc. He has been Chief Executive and a shareholder since inception and brings the following skills to Tristel’s Board:
• Engaging and persuasive
• Able to quickly make assured decisions
• Reflective and adaptable
• Energetic, considerate and no-nonsense
Elizabeth Dixon Finance Director
Appointed 2010
Liz Dixon trained with BDO before moving into industry with the Holiday Property Bond Group, as UK Finance Manager. Having joined Tristel in 2007 as Chief Group Accountant, she was appointed to the Board of Tristel Solutions Ltd in August 2009, and became Tristel plc’s Finance Director in June 2010. Liz brings the following skills to Tristel’s Board:
• Good business awareness and decision-making ability
• Excellent people skills
• A logical, analytical and enquiring mind
• Risk aware without being risk averse
Bart Leemans Executive Director
Appointed 2018
Bart Leemans founded the Ecomed Group in 2005 and was CEO from that date until its acquisition by Tristel in November 2018. Before establishing Ecomed, Bart founded various e-commerce businesses, including Eccent NV which he successfully exited via a trade sale.
Bart holds a Master of Engineering Science degree at KU Leuven, and is a Vlerick Business School Alumnus. He commenced his career in the IT industry where he worked both within start-up companies and established players, including IBM Global Services. Bart brings the following skills to Tristel’s Board:
• A history of building successful sales-focused organisations
• A grounding in innovative technology businesses
• Entrepreneurial spirit and drive
• An ability to inspire and to deliver profitable growth
21

Paul Barnes Non-Executive Chairman
Appointed 2010, retiring from the Board at the Company’s December 2020 AGM Chairman of Nomination Committee and Member of Audit and Remuneration committees
Paul Barnes trained and qualified in accountancy practice where he experienced assignments ranging from plc audits to mergers and acquisitions. He has served as Finance Director for a number of publicly listed companies in various sectors on several stock exchanges. Having joined Tristel in 2004 as Finance Director, he transitioned to a Non-Executive role in June 2010 and founded Amersham Investment Management, an FCA regulated Investment Management Firm. Subsequently he also became a Member of the Chartered Institute for Securities and Investment. Paul brings the following skills to Tristel’s Board:
• An ability to analyse, question and test business proposals with an eye both for detail and the wider strategic picture
• An articulate and ‘down to earth’ communicator
• A keen understanding of the challenges involved in managing business risks
• A sound grasp of finance and principled guardianship of investors’ interests
David Orr Non-Executive Director
Appointed 2015 Member of Remuneration, Audit and Nomination Committees
David Orr joined Tristel’s Board in October 2015 and, since 2016, David has been Chairman of Tristel’s Remuneration Committee.
David has extensive experience of operational management at Board level in a manufacturing environment. David has been the Group Managing Director and majority shareholder of Fencor Packaging Group, a privately-owned manufacturer of corrugated packaging, since 1999. He previously served as Non-Executive Director and Chairman of Pendragon Presentation Packaging and has also served as a Non-Executive Director of CorrBoard UK, a manufacturer of corrugated board. His early commercial career included working in the Corporate Finance Department of Robert Fleming & Co.
He read modern languages at Trinity College, Dublin and subsequently spent five years as an Army Officer. David holds a MBA from INSEAD. In April 2018 David completed Cranfield School of Management’s Non-Executive Directors’ Seminar.
David’s experience of running an entrepreneurial manufacturing business brings the following skills to Tristel’s Board:
• Leadership experience and an in-depth understanding of managing people and inspiring a team
• Knowledge of operational issues and constraints
• A practical and highly experienced approach to risk management
• Direct experience of acquiring and integrating businesses
• A focus on integrity and fairness
Tom Jenkins Senior Independent Non-Executive Director
Appointed 2017 Chairman of Audit Committee and Member of Remuneration and Nomination Committees
Tom qualified as a chartered accountant with Arthur Anderson in 1998 and has 16 years’ experience supporting ambitious growing businesses. He worked in corporate finance at Dresdner Kleinwort Benson and Bear Stearns before moving into broking, where for six years he was a Board member and head of equity capital markets at finnCap. In 2015, he joined BGF to set up their quoted investment team. Tom brings the following skills to the Tristel Board:
• Audit, transaction, advisory and investment experience
• An understanding of the challenges of growing a small, entrepreneurial business, having done this twice as a Director of a Broking firm, and having advised over 150 small companies
• Wide ranging capital markets experience including being a conduit for managing shareholders interests for small companies, and then as an institutional investor in quoted companies
Directors’ Biographies continued
22
TRIS
TEL P
LC A
NNUA
L RE
PORT
& A
CCOU
NTS
YEAR
END
ED 3
0 JU
NE 2
020

Isabel Napper Independent Non-Executive Director
Appointed 2020 Chairman of Remuneration Committee and Member of Audit and Nomination Committees
Isabel Napper qualified as a lawyer in 1984 and was a partner at major law firm, Mills & Reeve plc, specialising in intellectual property law. She has advised a variety of global businesses on their IP related commercial issues particularly in the healthcare and technology sectors. Isabel’s first non-executive role was in 2005 and since then she has continued to work with high growth businesses both private and public. Isabel brings the following skills to Tristel’s Board:
• In-depth experience of AIM remuneration committees and issues relating to executive incentives
• Understanding and knowledge of the legal concerns surrounding innovative high growth tech businesses
• Ability to assimilate commercial issues and distil down to what matters
• A people person keen to encourage diversity of opportunity for all employees
• Enthusiasm for all things digital particularly in marketing
23

Directors’ Remuneration Report
Introduction
Committee membersIsabel Napper, Chairman (appointed 29th May 2020)David Orr (Chairman, until 29th May 2020)Paul BarnesBruno HolthofTom Jenkins
Committee responsibilitiesThe Committee meets at least once a year and is responsible for:
• Reviewing the performance of the Executive Directors;
• Agreeing remuneration structures and quantum, including bonus awards and share awards; and
• Determining the basis of Executive Director service agreements, having due regard to the interests of the shareholders.
No individual participates in decisions concerning their own remuneration.
Remuneration policyThis report sets out the Group’s remuneration policy for the Directors and explains how this policy was applied during the financial year to 30 June 2020.
Remuneration of Executive DirectorsThe remuneration policy has been designed to ensure that Executive Directors receive appropriate incentive and reward given their performance, responsibility and experience. In assessing this, the Remuneration Committee aims to ensure the policy aligns the interests of the Executive Directors with those of shareholders and also links to the future strategy of the business.
The Group’s remuneration policy for Executive Directors seeks to:
• Consider each individual’s experience and the nature and complexity of their work in order to set a competitive base salary that attracts and retains individuals of the highest quality, whilst avoiding remunerating more than is necessary.
• Align base salary to the median level for comparable AIM companies, with an upper limit for the Executive Directors of 3% of the prevailing year’s Group gross profit.
• Link remuneration packages to the Group’s long-term performance through bonus schemes and share plans.
• Set performance measures which are simple to understand, easy to measure and clear.
• Set an appropriate balance between fixed and variable pay.
• Provide post-retirement benefits through payment into private pension arrangements and/or salary supplements.
• Award share options linked to Group performance.
Executive Directors’ remuneration packages are considered annually by the Remuneration Committee in line with the above policy and comprise a number of elements:
Base salaryThe base salary is reviewed by the Remuneration Committee each June. In that process, the Committee takes account of the profitability and ongoing strategy of the Group and the individual’s contribution. Consideration is also given to the need to retain and motivate individuals, with reference made to information on salary levels in comparable organisations. To assist in this the Remuneration Committee looks at external salary surveys and undertakes its own research.
Annual performance incentiveExecutive Directors’ performance is considered by the Remuneration Committee, as part of the annual remuneration review, to ensure that there is a strong link between performance and reward.
Executive Directors are eligible to receive, at the Committee’s discretion, an annual bonus capped at 100% of base salary. The bonus is based upon corporate performance targets and measures which the Committee believes align with the long-term interests of shareholders. Stretching and transparent performance targets are put in place with a view to linking clearly the motivation of individuals to the value drivers of the business. The current Executive Directors’ bonus scheme pays out upon the achievement of pre-tax profit in excess of the Company’s budget.
24
TRIS
TEL P
LC A
NNUA
L RE
PORT
& A
CCOU
NTS
YEAR
END
ED 3
0 JU
NE 2
020

Pensions and other benefitsThe Group does not operate a pension scheme; instead individuals receive contributions of up to 15% of salary to their private pension arrangements and/or, where pension contributions are not appropriate, a salary supplement. Other benefits provided are a car allowance, life assurance and private medical insurance.
Share awardsExecutive Directors may, at the discretion of the Remuneration Committee, be granted share option awards. The Remuneration Committee is currently reviewing new long-term incentive provisions in the light of developments in best practice. The Committee intends to consult major shareholders and shareholder representatives about those provisions and to put the revised plan to shareholder vote at the next AGM.
Remuneration of Non-Executive DirectorsThe remuneration of the Non-Executive Directors is determined by the Board, based on a review of current practices in comparable companies. The Non-Executive Directors do not receive any pension payments and do not participate in any incentive schemes. In the light of best practice, it is not intended to grant any share options to the Non-Executive Directors in the future.
Wider employee considerationsAlthough it is not the Committee’s responsibility to set the remuneration arrangements across the Group, it is kept informed of these. In many instances, it is possible for members of staff to qualify for a bonus which largely follows the same structure and applies the same performance targets as for Executive Directors. The Board’s view is that Executive Directors, management and staff should be targeted with achieving the same strategic goals and should benefit accordingly. In addition, the Group encourages share ownership amongst all staff therefore permanent staff, no matter their pay scale or job, are awarded share option grants at set intervals which accumulate to 40,000 share options after 10 completed years of employment. The Executive Management also has the discretion to award market priced options after 10 years of employment up to a maximum value of 100% of salary.
Shareholder engagementThe Committee seeks and takes into consideration the views of shareholders on remuneration on an ongoing basis and they are invited to make contact directly with the Chairman of the Remuneration Committee at any time should they wish to do so.
Remuneration Committee adviceIn undertaking its responsibilities, the Committee seeks independent external advice as necessary.
Annual remuneration statementOn behalf of the Board, I am pleased to present our Remuneration Report for 2020. The Directors received the following remuneration during the year to 30 June 2020:
Name of Director
Salary and fees
£’000Bonus £’000
Taxable benefits
£’000
Gain on exercise of
share options £’000
2020 Total (excl.
pension) £’000
2020 Retirement
provision £’000
2020 Total fixed
remuneration £’000
2020 Total variable remuneration
£’000
2019 Total (excl.
pension) £’000
2019 Retirement
provision £’000
ExecutivePaul Swinney 250 76 51 – 377 38 339 76 1,607 35
Elizabeth Dixon 185 56 32 677 950 28 245 733 237 27
Bart Leemans 180 54 – – 234 27 207 54 153 –
Non-ExecutivePaul Barnes 42 – – – 42 – 42 – 43 –
David Orr 35 – – – 35 – 35 – 35 –
Tom Jenkins 35 – – – 35 – 35 – 35 –
Bruno Holthof 53 – – – 53 – 53 – 14 –
Isabel Napper 3 – – – 3 – 3 – – –
Aggregate emoluments 783 186 83 677 1,729 93 959 863 2,124 62
25

Base salaryAs stated elsewhere in this Report, during the year, revenue increased by 21% and profit before tax and share-based payments increased by 27%. Cash at the year end was £6.2m. However, this was of course also the year when COVID-19 appeared and caused global issues. Recognising this, the Executive Directors unanimously volunteered not to accept any increase in salary and salary benefits for the financial year ending 2021.
A number of the key management personnel are paid through personal management entities, where this is the case we have provided a breakdown of the total compensation paid to these entities, for the work of the key management personnel in question, as if we were paying the key management personnel directly.
Annual performance incentiveBased on performance in the year ended 30 June 2020, annual bonuses equating to 30% of salary were awarded to the Executive Directors. This compared to bonus awards of 24% of salary for the prior year and reflects the Group’s improved performance over the year to 30 June 2020. Again, in recognition of COVID-19, the Executive Directors forewent £147,000 of the bonus payments due to them under their bonus scheme.
Pensions and other benefitsTaxable benefits comprised of a car allowance, life assurance and private medical insurance.
Share option awardsDuring March 2020 Elizabeth Dixon exercised 157,523 share option awards granted on 7 January 2016.
Non-Executive DirectorsDr Bruno Holthof joined the Board in February 2019 and replaced Paul Barnes as Chairman at the 2019 AGM.
Isabel Napper joined the Board in May 2020.
Directors’ share optionsAggregate emoluments disclosed above include the amount charged to the income statement in accordance with IFRS 2 in respect of the fair value of options granted or held by the Directors to acquire ordinary shares in the Company. Details of options held by the Directors are as follows:
Original grant
Unexercised options at
1 July 2019
Options granted in
the year
Options exercised
in the year
Options lapsed or cancelled
in the year
Total options unexercised at
30 June 2020Exercise
priceEarliest date
of exerciseDate of expiry
ExecutivePaul Swinney 500,000 500,000 – – 500,000 – 65.00p On change of control 12/10/2019
414,179 153,764 – – – 153,764 1.00p 07/01/2016 07/01/2021
500,000 500,000 – – – 500,000 1.00p 08/04/2018 30/06/2021
Elizabeth Dixon 87,500 87,500 – – 87,500 – 65.00p On change of control 03/03/2024
222,388 222,388 – 157,523 – 64,865 1.00p 07/01/2016 07/01/2021
400,000 400,000 – – – 400,000 1.00p 08/04/2018 30/06/2021
Non-ExecutivePaul Barnes 87,500 87,500 – – 87,500 – 65.00p On change of control 12/10/2019
45,000 45,000 – – – 45,000 1.00p 08/04/2018 30/06/2021
David Orr 45,000 45,000 – – – 45,000 1.00p 08/04/2018 30/06/2021
Total number of Board share options 2,301,567 2,041,152 – 157,523 675,000 1,208,629
Share options held by the Directors are subject to vesting conditions as detailed in the specific instances above.
Directors’ Remuneration Report continued
26
TRIS
TEL P
LC A
NNUA
L RE
PORT
& A
CCOU
NTS
YEAR
END
ED 3
0 JU
NE 2
020

Directors’ shareholdingsThe interests of the Directors in the shares of the Company at 30 June 2020 and 30 June 2019 were:
The market price of the Company’s shares as at 30 June 2020 was 425p. The range during the year was 264p to 525p. (Source – London Stock Exchange).
Isabel Napper Remuneration Committee Chairman 16 October 2020
Ordinary 1p shares 30 June 2020 30 June 2019
ExecutivePaul Swinney 476,429 476,429
Elizabeth Dixon 45,000 45,000
Bart Leemans 954,627 949,627
Non-ExecutivePaul Barnes 351,095 366,095
David Orr 28,191 28,191
27

Corporate Governance Report
Chairman’s Corporate Governance ReportThis Corporate Governance Report has been written with the Quoted Companies Alliance (‘QCA’) Corporate Governance Code in mind. As Chairman of the Board of Directors, corporate governance is my responsibility.
By following the QCA code, my Board colleagues and I seek to ensure that the Company operates efficiently and effectively and communicates well, to promote confidence and trust in the Company’s Board and Management. The Board aims to balance the interests and expectations of the Company’s many shareholders and stakeholders by observing a transparent set of rules, practices, and processes. I believe that by adhering to this clear set of guidelines which clarify authority and responsibility, requiring constant measurement and review, the Company is best placed to manage risk and achieve a high level of performance, both of which are pre-requisites to the Company’s long-term success.
Corporate Governance Review The London Stock Exchange’s AIM Rule 26 requires all AIM quoted companies to give details of the corporate governance code that they have decided to apply, to explain how they comply with their chosen code, and, if they depart from the chosen code, to explain where and why. In the Board’s view, there are two obvious choices of code: the FRC’S UK Corporate Governance Code and the QCA’s Corporate Governance Code (the ‘QCA Code’). The latter has been drafted with SMEs in mind and we have chosen to apply it.
Each year the Board carries out a review of the requirements of the QCA Code and AIM Rule 26, with respect to both its governance arrangements and practices, and its reporting. The key changes that have resulted from this review are:
• An update to this Corporate Governance Report.
• Consideration by the Nominations Committee of the desired make-up of the Board of Directors, the members of each committee to the Board and the level of independence held, resulting in Board changes.
• A review and update to the Executive Management succession plan.
• An update to the Group Risk Assessment with particular focus upon COVID-19.
Corporate Governance CodeThe QCA Code is based upon the principle that companies need to deliver growth in long-term shareholder value. This requires an efficient, effective and dynamic management framework and should be accompanied by good communication which helps to promote confidence and trust. The QCA Code takes key elements of good governance and applies them in a manner which is workable for the different needs of growing companies. It is constructed around 10 broad principles and a set of disclosures. Companies are asked to provide an explanation of how they are meeting the principles through the prescribed disclosures. Where a company departs from the principles the Board is asked to provide a well-reasoned explanation for doing so. The following section of this Corporate Governance Report seeks to provide this:
Principle 1 – Establish a strategy and business model which creates long-term value for shareholdersThe Board reviews and re-sets the Company’s strategic goals annually. In September 2020 the primary goals were set as:
• To maximise the Company’s value to all shareholders.
• To establish Tristel’s digital high-level disinfectants as the gold standard for non-lumened medical devices.
• To establish Cache as the global market leader in sporicidal surface disinfection.
Secondary objectives, goals and ‘game-changing plays’ form part of the strategic plan and make an essential contribution to how the Company will deliver medium to long-term growth.
The Company has a clear strategic plan set by the Board, including financial performance targets, an approach to risk, and a vision of the values necessary and appropriate to achieve the plan. Via internal reporting and interaction between the Board, Management and employees, there is company-wide understanding of how shareholder value will be derived from these principles.
The business strategy, financial targets and key risks are clearly stated within various sections of the Annual Report to ensure that Shareholders can see how the Board intends to deliver long-term shareholder value.
Principle 2 – Seek to understand and meet shareholder needs and expectationsThe Chief Executive and Finance Director are the key shareholder liaison contacts alongside the Company’s public relations advisors.
The Board actively engages with both institutional and private shareholders on at least four occasions each year, each in a forum which allows Management and the Board to hear investors’ views and answer their questions face-to-face. The Company’s NOMAD and public relations advisor provide written investor feedback after all investor presentations and meetings which are shared with the Board. Via communication with the Company’s NOMAD and analyst, together with
28
TRIS
TEL P
LC A
NNUA
L RE
PORT
& A
CCOU
NTS
YEAR
END
ED 3
0 JU
NE 2
020

Regulatory News Service announcements and the Company’s Annual Report, the Board gauges investor sentiment, sets expectations and communicates the Company’s intentions. The Board sees all write ups on the Company by the financial press, monitors popular online bulletin boards and has a series of online facilities in place that provide a conduit between the Company and its shareholders.
The Board feels that the Company has achieved a very high level of shareholder engagement and continues to seek ways to enhance this.
Principle 3 – Take into account wider stakeholder and social responsibilities and their implications for long-term successManagement’s close day-to-day connection with employees combined with periodic engagement surveys, all-staff meetings, education sessions and social events ensure good relations with and between employees. These activities allow employees to share their views on ways in which the Company can improve products, processes and outcomes as well as the working environment for its employees. The Board’s assessment is that the Company’s culture is positive, engaged and energetic, which is reflected in the achievement of its strategic goals.
An appropriate and positive relationship with suppliers and customers is a pre-requisite to the successful operation of the Company and exists in all areas of the business. The Company seeks to find innovative solutions to issues presented by customers which not only strengthens its good relations with those customers but provides immediate feedback allowing the Company to continually re-evaluate its strategic positioning and product offering. Product design and development, which has been vital to the Company’s success and continues to be a key day-to-day function, is driven by the close understanding between Management and end users of the Company’s products.
The management team works closely with regulators, key opinion leaders and authors of clinical guidelines in all countries, seeking counsel and working in cohort when appropriate. Effective connections and relationships are a key element of the ‘protective moat’ referred to within the Company’s strategic plan. Post market surveillance and effective complaints handling are a pre-requisite of the Company’s quality accreditation.
As part of its day-to-day operation and via new product development, the Group has a clear focus upon reducing its environmental footprint.
The Group connects with the local community of its office locations, building relationships and giving support where appropriate.
Principle 4 – Embed effective risk management, considering both opportunities and threats, throughout the organisationBusiness opportunities, wins, losses and threats are documented by the management team monthly and shared with the Board. Risks and their mitigating factors are also reported, with high-risk situations immediately acted upon. Health and safety risk assessments are a high priority given the nature of the business as a chemical manufacturer and are completed on a continual basis. Operational risks and uncertainties are discussed daily within the business in departmental meetings. A disaster recovery plan is in place and scenario planning events take place periodically, normally annually. Financial risks are considered by the Board at each Board meeting.
The 2020 COVID-19 pandemic presented both an opportunity and a risk to the business which the Group monitors continually. To protect staff, physical distancing, one-way people flow, home working, additional PPE, curtailment of external visitors and enhanced hygiene routines have been implemented within all of the Company’s premises. A risk assessment has been completed and circulated to staff, and employee representatives have been appointed to act as liaison points between Management and staff in case required.
The opportunity derived from the COVID-19 outbreak relates to the increased potential for environmental hygiene products, sold into hospitals and beyond. This opportunity is being addressed via the Company’s Cache range of surface disinfectants. The Board is provided with global sales information on a daily basis, allowing it to respond in fast-moving situations such as the current pandemic.
The Board gains assurance that the risk management and related control systems are effective through internal review and assessment, which is part of its continuous improvement strategy.
Principle 5 – Maintain the Board as a well-functioning, balanced team led by the ChairIn addition to daily access to sales numbers, the Board receives detailed information and reporting from every geographical and functional part of the business, direct from the responsible individuals, each month. The information, which is always provided in a timely manner, is high quality and comprehensive, ensuring that the Board is well informed and has the tools to facilitate proper assessment of matters which require its insight and decision making.
The Board believes that there is an appropriate balance between Executive and Non-Executive Directors on the Board. Tom Jenkins is the Senior Independent Non-Executive Director. Isabel Napper, who joined the Board on 29 May 2020, is the second Independent Non-Executive Director, and Bruno Holthof, Non-Executive Chairman of the Board is also independent. David Orr is not considered to be independent by virtue of his directorship and shareholding in Manor packaging, a supplier of
29

Corporate Governance continued
cardboard to the Company; neither is Paul Barnes considered independent due to his shareholding in Tristel. However, both individuals bring great entrepreneurial and analytical attributes to the Board, adding viewpoints and competencies that further enrich it.
At present the Board does not comply with the QCA Code’s requirement that at least half of Directors of the Board should be independent Non-Executive Directors, and as such when Paul Barnes steps down in December 2020 the Board will seek recruitment of a new Independent Non-Executive Director.
The Executive team consists of Tristel’s Chief Executive Paul Swinney and Finance Director Liz Dixon, who are married, and Bart Leemans who joined the Board in November 2018 as an Executive Director, alongside his role managing the Group’s French and Belgian operations. All Directors are encouraged to foster an attitude of independence of character and judgement. The relevant experience, skills and personal qualities that each Director brings to the Board are detailed within the Directors Biographies, published within the Remuneration Report. Each Director keeps their skillset up to date by reading relevant publications and attending external training and personal development courses and workshops.
Each Non-Executive Director is expected to give at least 16 days per annum to the Company’s business.
Principle 6 – Ensure that the Directors collectively have all appropriate skills, capabilities and experienceThe Board consists of individuals with backgrounds and experience in publicly and privately-owned commerce, finance, legal and manufacturing organisations. Collectively, the Board’s members have a wide range of experience, personal qualities and capabilities.
The Board contains three Executive Directors, two male and one female, and five Non-Executive Directors, one female and four male. In all new appointments the Board aims to appoint candidates who bring new and diverse attributes to its complexion.
In accordance with the QCA Code Non-Executive Directors are only eligible to serve for up to nine years. At each Annual General Meeting all other Directors are, at the discretion of the Nominations Committee, put forward for re-election. Paul Barnes has served as a Non-Executive Director for 10 years, prior to which he was an Executive Director and as such will retire from the Board at the 2020 AGM.
Principle 7 – Evaluate Board performance based on clear and relevant objectives, seeking continuous improvementThe performance and effectiveness of the Board, its committees and individual Directors is reviewed by the Chairman and the Board on an ongoing basis. Training is available should a Director request it, or if the Chairman feels it is necessary.
The performance of the Board is measured by the Chairman with reference to the Company’s achievement of its strategic goals. During the year the Company met all of its financial objectives and reacted positively to the challenges it was presented with, and as such it is felt that the Board performed well.
Over the course of the past three years the Board has grown from five to eight members. This is considered necessary as the Company has increased in size and complexity and a larger Board allows a deeper mix of backgrounds, views and capabilities, whilst still small enough to be dynamic and effective.
The Board continually assesses the candidacy of Tristel staff with respect to succession planning for Executive Management and has in place a short-term plan to be instigated in the event of the loss or incapacity of the key roles of CEO or Finance Director. A long-term succession plan will be formulated over the next 12 months.
Principle 8 – Promote a corporate culture that is based on ethical values and behaviourThe Board promotes a corporate culture that is based on sound ethical values and behaviour through their own actions and words, and ensures that these are apparent and understood in every part of the business. They are embodied in three words which describe the core values of the Company:
• No-nonsense
• Considerate
• Energetic
These values are applied consistently to employee personal development and training programmes.
By adhering to these values, the Board believes that the Company will maintain a healthy corporate culture, focusing upon what is important, whilst taking a balanced approach to achieving its goals. Infection prevention is a vital yet complex area of healthcare, and healthcare providers can be reluctant to put their trust in new products and change. The Board feels that if an honest and straightforward approach is taken, whilst supporting customers through the process of adopting new products, the Company can best achieve its goals.
The flat structure of the Company means that the Board can assess the state of the Company’s culture easily, which it currently considers to be strong, positive and spirited, despite the uncertainties affecting the entire world and felt by us all.
30
TRIS
TEL P
LC A
NNUA
L RE
PORT
& A
CCOU
NTS
YEAR
END
ED 3
0 JU
NE 2
020

Eligible to attend Attended
Bruno Holthof 8 8
Paul Swinney 7 7
Elizabeth Dixon 7 7
Bart Leemans 7 7
Paul Barnes 10 10
David Orr 9 9
Tom Jenkins 10 10
Isabel Napper 2 2
Principle 9 – Maintain governance structures and processes that are fit for purpose and support good decision-making by the BoardGiven that one of the Company’s core values is ‘no-nonsense’, the Board seeks to strike a balance between maintaining adequate governance without imposing structures that slow or weaken decision making and progress. The Company’s governance structures are fluid and have by necessity adapted over time, hand-in-hand with the changes to the business.
The Board’s members are well informed, have access to all parts of the business and are appropriately equipped through their own skills, experience and personality to make good, and where appropriate fast, business decisions.
Principle 10 – Communicate how the Company is governed and is performing by maintaining dialogue with shareholders and other relevant stakeholdersThis Corporate Governance Report is included within the Company’s annual report and the Corporate Governance section of the Tristel website. It is reviewed and updated regularly. In addition the Board regularly enters into dialogue with shareholders who have an interest in matters of governance, diversity and ethics in order that shareholders views can be properly voiced and brought to bear within the business.
Board of DirectorsThe Company is controlled by the Board of Directors, which comprises three Executives, one of whom is the Chief Executive Officer, and four Non-Executive Directors. The role of the Chief Executive Officer and Chairman are separate. The Executive Directors are full time employees of the Company; the Non-Executive Directors are part-time employees who are required to give at least 16 days per annum to their role.
All Directors can take independent advice to assist them in their duties if necessary.
The Board is responsible to shareholders for the proper management of the Company and meets formally at least six times a year to set the overall direction and strategy of the Company, to review operating and financial performance and to consider and advise on senior management appointments. The Board also monitors and approves financial policy and budgets, including capital expenditure. All key decisions are subject to Board approval.
The Company Secretary is responsible for ensuring that Board procedures are followed and that all applicable rules and regulations are complied with. Liz Dixon, who is also the Group Finance Director, performs the role of Company Secretary, providing an internal advisory role to the Board. The QCA’s guidelines state that the role of Company Secretary should not be held by an Executive Director, and as such the Company does not comply with this requirement. It is the Board’s view that the size and complexity of the business does not necessitate a separate role of Company Secretary. Liz Dixon is supported and guided in this role by the Company’s legal advisors.
Board and Committee attendanceThe Board met seven times during the 2019-20 financial year and its committees met a further three times in accordance with their terms of reference. The attendance of the Directors at these meetings is detailed below. On the occasions when a Director is unable to attend a meeting, any comments he has arising from the information pack circulated prior to the meeting are provided to the Chairman.
Committees of the BoardRemuneration CommitteeThe Remuneration Committee operates under terms of reference which are reviewed annually, meeting at least once per year, and comprises all Non-Executive Directors under the Chairmanship of Isabel Napper INED. It reviews, inter alia, the performance of the Executive Directors and sets the scale and structure of their remuneration and basis of their service agreements, having due regard to the interests of the shareholders. The Remuneration Committee also determines the allocation of share options to Executive Directors. No Director has a service agreement exceeding one year. One of the policies of the Remuneration Committee is that no individual participates on discussions or decisions concerning his/her own remuneration. The Directors’ Remuneration Report is set out in the Annual Report where the work carried out during the past year is detailed.
31
Corporate Governance continued
Audit CommitteeThe Audit Committee operates under terms of reference which are reviewed annually and comprises all Non-Executive Directors except the Chairman of the Board in line with QCA guidelines, under the Chairmanship of Tom Jenkins. It meets at least twice a year and, amongst other duties, overviews the monitoring of the Company’s risk profile, internal controls, accounting policies and financial reporting, and provides a forum through which the external auditors report. It meets at least once a year with the external auditors without Executive Management present.
The Company does not comply with the QCA’s requirement to publish a separate Audit Committee Report as it believes that the information provided within this Corporate Governance Report gives shareholders adequate information on the Committee’s activities.
During the 2019-20 year the Audit Committee met on two occasions to:
• Discuss findings and hear recommendations arising from the annual audit.
• Discuss with the Company’s external auditors matters such as compliance with accounting standards.
• Monitor the external auditor’s compliance with relevant ethical and professional guidance on the rotation of audit partners, the level of fees paid by the Company and other related requirements.
• Approve the appointment of KPMG, as the Company’s external auditors, including their terms of engagement and fees.
The Committee reported formally to the Board on proceedings after each meeting.
Nominations CommitteeThe Nominations Committee operates under terms of reference which are reviewed annually and comprises all Non-Executive Directors and the CEO, under the Chairmanship of Paul Barnes.
The Committee considers the performance and effectiveness of the Board and its Directors; whether Directors retiring by rotation should be put forward for re-election at the Annual General Meeting; to consider succession planning for Directors and other senior executives; and to identify and nominate for the approval of the Board candidates to fill Board vacancies as and when they arise.
The Board does not engage external consultants to evaluate the effectiveness of the Board, instead it carries out an ongoing review of the Board’s collective performance and that of the individual Directors, based upon the following criteria:
• Strategy design, debate and decision making.
• Leadership style and technique.
• Goal setting, assignment of roles, responsibilities and resources.
• Monitoring, risk management and oversight.
The performance of the Board and its individual Directors is also viewed in the context of the Company’s achievement of its strategic goals. During the 2019-20 year these were:
1. To meet analysts’ profit before tax forecast for 2019-20 of £6.5m, which has been achieved.
2. To increase sales by between 10% and 15% per annum on average over the three years to 30 June 2022, which the Group is on track to achieve.
3. To increase the Company’s value to shareholders – market capitalisation increased by £65m, from £128m to £193m during the 2019-20 year. This goal has been achieved.
4. To replicate the market penetration achieved in targeted clinical areas in the UK in all overseas markets. Whilst this is difficult to measure, the Company has achieved overseas sales growth of 32% which is clear evidence that good progress is being made towards this goal.
As a consequence, the Board has concluded that it has performed effectively during the 2019-20 financial year.
Directors are subject to election by shareholders at the first opportunity after their appointment. In addition, all Board members retire at each Annual General Meeting, and at their own request alongside the recommendation of the Nominations Committee, are put forward for re-election. All Directors were recommended for re-election at the 2019 AGM. In line with QCA guidelines Paul Barnes who has been a Non-Executive Director for 10 years will not offer himself for re-election at the forthcoming AGM.
32
TRIS
TEL P
LC A
NNUA
L RE
PORT
& A
CCOU
NTS
YEAR
END
ED 3
0 JU
NE 2
020

Relations with shareholdersThe Board considers effective communication with shareholders to be very important and encourages regular dialogue with both institutional and private investors. The Board responds promptly to communications received verbally or in writing. Directors regularly attend meetings with both private and institutional shareholders throughout the year. Shareholders are given at least 21 days’ notice of the Annual General Meeting held in December and are invited to attend a Shareholder Open Day held in July each year. At all shareholder meetings shareholders are given the opportunity to discuss the development and performance of the Company with Management and the Group’s senior team.
The Company’s website www.tristel.com and Twitter feed @TristelGlobal, contain details of its products, promotional activities, investor relations events, share price details and Regulatory News Service (RNS) announcements.
Maintenance of a sound system of internal controlThe Directors have overall responsibility for ensuring that the Company maintains a system of internal control to provide them with reasonable assurance that the assets of the Company are safeguarded, and that shareholders’ investments are protected. The system includes internal controls appropriate for the Company’s size, and covers financial, operational, compliance (including health and safety) and risk management areas. There are limitations in any system of internal control, which can provide reasonable but not total assurance with respect to the preparation of financial information, the safeguarding of assets and the possibility of misstatement or loss.
The Board continually considers its policies regarding internal control, risk management and business reporting with respect to the major areas of the business and methods used to monitor and control them. In addition to financial risk, the reviews cover operational, commercial, regulatory and health and safety risks. The Board has concluded that an internal audit function is not justified at this juncture. However, this decision is continually reviewed as the operations of the Company develop.
The key procedures designed to provide an effective system of internal controls that are operating up to the date of sign-off of this report are set out below.
Control environmentThere is an organisational structure with clearly defined lines of responsibility and delegation of accountability and authority.
Risk managementThe Group employs Directors and senior personnel with the appropriate knowledge and experience for a business engaged in activities in its field of operations, and undertakes regular risk assessments and reviews of its activities.
Financial informationThe Company prepares detailed budget and working capital projections, which are approved annually by the Board and are maintained and updated regularly throughout the year. Detailed management accounts and cash flows are prepared monthly, as is a written commentary giving a comparison to budgets and prior years, identifying and explaining any significant variances.
Management of liquid resourcesThe Board is risk averse when investing any surplus cash funds. It considers that a minimum cash balance of £4 million is appropriate – providing adequate protection against unexpected events – for the current size of the business and seeks to adhere to this wherever possible and practicable. Cash exceeding this level, which cannot be used for earnings enhancing investment purposes, may be returned to shareholders in the form of a special divided.
Bruno Holthof Non-Executive Chairman 16 October 2020
33

Directors’ Report
The Directors present their report and the consolidated financial statements for the year ended 30 June 2020.
Results and dividendsThere was a profit for the year after taxation amounting to £5.100m (2019: £4.031m).
A final dividend of £1.562m (3.50p per share) was paid during the year in respect of the year ended 30 June 2019. (2018: £1.303m (2.98p per share)).
An interim dividend of £1.059m (2.34p per share) was paid during the year in respect of the year ended 30 June 2020 (2019: £0.907m, 2.04p per share); The Directors recommend a final dividend of 3.84p per share (2019: 3.50p per share). If approved, the total distribution of dividends for the year ended 30 June 2020 will be £2.796m (2019: £2.467m).
A review of the Group’s performance for the year ended 30 June 2020 is contained in the Chairman’s Statement on pages 6 to 7 and the Chief Executive’s Report on pages 8 to 13.
Directors’ of the CompanyThe Directors, who held office during the year, were as follows:
BLM HolthofPC SwinneyEA DixonBVM LeemansPM BarnesDWE OrrTAJ JenkinsIJS Napper (appointed 29 May 2020)
The Group provides Directors and Officers indemnity insurance for the benefit of the Directors of the Group. For the year to 30 June 2020 the policy cost £8,700 (2019: £8,300).
Details of Directors’ interests in the share capital of the Company are disclosed in the Directors’ Remuneration Report set out on pages 26 to 27.
Corporate governanceTristel plc is committed to maintaining high standards of corporate governance and has applied strong and appropriate policies, given the size of the Group, its current stage of development and the constitution of the Board. Further details are provided in the Corporate Governance Report on pages 28 to 33.
Political donationsNeither the Company nor any of its subsidiaries made any political donations or incurred any political expenditure during the year.
Substantial shareholdingsExcept for the Directors’ interests in the shares of the Company, as given in the Directors’ Remuneration Report on page 26, the Directors are aware of the following who were interested in 3% or more of the Company’s equity at 30 June 2020:
No. of shares % of issued share capital
Charles Stanley Stockbrokers 4,460,083 9.84%
Investec Wealth & Investment 3,841,329 8.84%
Aviva Investors 3,041,065 6.71%
Hargreaves Lansdown Stockbrokers (EO) 3,009,887 6.64%
Unicorn Asset Management 2,935,829 6.48%
Montanaro Investment Managers 2,213,835 4.89%
Amarti Global Investors 1,844,046 4.07%
Interactive Investor 1,759,003 3.88%
Francisco Soler 1,540,961 3.40%
Barclays Smart Investor 1,464,847 3.23%
34
TRIS
TEL P
LC A
NNUA
L RE
PORT
& A
CCOU
NTS
YEAR
END
ED 3
0 JU
NE 2
020

Principal risks and uncertaintiesReference to this topic can be found within the Strategic Report on pages 6 to 19.
Reference to the Groups primary research and development advancements can be found within the Chief Executive’s Report on pages 8 to 13.
Statement of Directors’ ResponsibilitiesThe Directors are responsible for preparing the Annual Report and the Group and parent company financial statements in accordance with applicable law and regulations.
Company law requires the Directors to prepare Group and parent company financial statements for each financial year. Under the AIM Rules of the London Stock Exchange they are required to prepare the Group financial statements in accordance with International Financial Reporting Standards as adopted by the EU (IFRSs as adopted by the EU) and applicable law and they have elected to prepare the parent company financial statements on the same basis.
Under company law the Directors must not approve the financial statements unless they are satisfied that they give a true and fair view of the state of affairs of the Group and parent company and of their profit or loss for that period. In preparing each of the Group and parent company financial statements, the Directors are required to:
• Select suitable accounting policies and then apply them consistently.
• Make judgements and estimates that are reasonable, relevant and reliable.
• State whether they have been prepared in accordance with IFRSs as adopted by the EU.
• Assess the Group and parent company’s ability to continue as a going concern, disclosing, as applicable, matters related to going concern.
• Use the going concern basis of accounting unless they either intend to liquidate the Group or the parent company or to cease operations, or have no realistic alternative but to do so.
The Directors are responsible for keeping adequate accounting records that are sufficient to show and explain the parent company’s transactions and disclose with reasonable accuracy at any time the financial position of the parent company and enable them to ensure that its financial statements comply with the Companies Act 2006. They are responsible for such internal control as they determine is necessary to enable the preparation of financial statements that are free from material misstatement, whether due to fraud or error, and have general responsibility for taking such steps as are reasonably open to them to safeguard the assets of the Group and to prevent and detect fraud and other irregularities.
Under applicable law and regulations, the Directors are also responsible for preparing a Strategic Report and a Directors’ Report that complies with that law and those regulations.
The Directors are responsible for the maintenance and integrity of the corporate and financial information included on the Company’s website. Legislation in the UK governing the preparation and dissemination of financial statements may differ from legislation in other jurisdictions.
Disclosure of information to the auditorThe Directors confirm that:
• So far as each Director is aware, there is no relevant audit information of which the Company’s auditor is unaware.
• The Directors have taken all the steps that they ought to have taken as Directors in order to make themselves aware of any relevant audit information and to establish that the Company’s auditor is aware of that information.
Reappointment of auditorsKPMG LLP is the Company’s auditor having been appointed for the first year on the 10 May 2019. In accordance with section 485 of the Companies Act 2006, a resolution for the re-appointment of KPMG LLP as auditors of the Company is to be proposed at the forthcoming Annual General Meeting.
Approved by the Board on 16 October 2020 and signed on its behalf by:
Elizabeth Dixon Finance Director 16 October 2020
35

Tristel plc
REPORT AND ACCOUNTSFINANCIAL STATEMENTSYEAR ENDED30 JUNE 2020
TRIS
TEL P
LC A
NNUA
L RE
PORT
& A
CCOU
NTS
YEAR
END
ED 3
0 JU
NE 2
020
36

37
Independent Auditor’s Report to the members of Tristel plc
1. Opinion
We have audited the financial statements of Tristel plc (‘the Company’) for the year ended 30 June 2020 which comprise of the Consolidated Income Statement, Consolidated Statement of Comprehensive Income, Consolidated Statement of Financial Position, Company Statement of Financial Position, Consolidated Statement of Changes in Equity, Company Statement of changes in Equity, Consolidated Statement of Cash Flows and Company Statement of Cash Flows, and the related notes, including the accounting policies in note 1.
In our opinion:
• the financial statements give a true and fair view of the state of the Group’s and of the parent company’s affairs as at 30 June 2020 and of the Group’s profit for the year then ended;
• the Group financial statements have been properly prepared in accordance with International Financial Reporting Standards as adopted by the European Union (IFRSs as adopted by the EU);
• the parent company financial statements have been properly prepared in accordance with IFRSs as adopted by the EU and as applied in accordance with the provisions of the Companies Act 2006; and
• the financial statements have been prepared in accordance with the requirements of the Companies Act 2006.
Basis for opinionWe conducted our audit in accordance with International Standards on Auditing (UK) (‘ISAs (UK)’) and applicable law. Our responsibilities are described below. We have fulfilled our ethical responsibilities under, and are independent of the Group in accordance with, UK ethical requirements including the FRC Ethical Standard as applied to listed entities. We believe that the audit evidence we have obtained is a sufficient and appropriate basis for our opinion.
2. Key audit matters: our assessment of risks of material misstatement
Key audit matters are those matters that, in our professional judgment, were of most significance in the audit of the financial statements and include the most significant assessed risks of material misstatement (whether or not due to fraud) identified by us, including those which had the greatest effect on: the overall audit strategy; the allocation of resources in the audit; and directing the efforts of the engagement team. These matters were addressed in the context of our audit of the financial statements as a whole, and in forming our opinion thereon, and we do not provide a separate opinion on these matters. In arriving at our audit opinion above, the key audit matters, in decreasing order of audit significance, were as follows:
a. Revenue recognition – cut off (£31.678 million; 2019: £26.169 million)Refer to page 6 (Strategic Report), page 51 (accounting policy) and page 59 (financial disclosures).
THE RISK: EXISTENCE OF SALES AT YEAR ENDWe consider the risk in relation to revenue recognition to relate specifically to recognition around the year-end.
Revenue is the most material balance in the financial statements and there is a risk that revenue may be misstated due to share option incentives issued to key management, which vest if certain EBITDA targets are satisfied and increased shareholder pressure to maintain EPS and ensure dividends can continue to be distributed.
OUR RESPONSEOur procedures included:
Tests of detailWe selected a sample of sales invoices either side of year-end to assess whether revenue has been recognised in the correct financial period, by agreeing the date, amount, description and quantity to relevant documentation, such as delivery notes or other third party acknowledgement of receipt.
We selected a sample of credit notes raised after the year-end to assess whether revenue has been recognised in the correct financial period, by agreeing the date, amount, quantity and description to relevant documentation, such as sales invoices, credit note approvals or other third party documents.

TRIS
TEL P
LC A
NNUA
L RE
PORT
& A
CCOU
NTS
YEAR
END
ED 3
0 JU
NE 2
020
38
Independent Auditor’s Report to the members of Tristel plc continued
b. Recoverability of investments with regard to investments in the Ecomed Group and Tristel Italy (parent company key audit matter) (£7.323 million; 2019: £6.440 million)Refer to page 54 (accounting policy) and page 76 (financial disclosures).
THE RISK: LOW RISK, HIGH VALUEThe carrying amount of the parent company’s investments in Italy and Ecomed represents 36% (2019: 35%) of the Company’s total assets. Their recoverability is not at a high risk of significant misstatement or subject to significant judgement. However, due to their materiality in the context of the parent company financial statements, this is considered to be the area that had the greatest effect on our overall parent company audit.
OUR RESPONSEOur procedures included:
Tests of detailComparing the carrying amount of a sample of the highest value investments, representing 58% (2019: 57%) of the total investment balance with the relevant subsidiaries’ financial statements to identify whether their net assets, being an approximation of their minimum recoverable amount, were in excess of their carrying amount and assessing whether those subsidiaries have historically been profit-making.
Assessing subsidiary auditsAssessing the work performed by the subsidiary audit teams on all of those subsidiaries and considering the results of that work, on those subsidiaries’ profits and net assets.
Our resultsWe found the group’s assessment of the recoverability of the investment in subsidiaries to be acceptable (2019: acceptable).
We continue to perform procedures over the recoverability of Goodwill and Investments related to Ecomed and the impact of uncertainties due to the UK existing the European Union. However, following the significant headroom in Ecomed, and the fact that Brexit does not have a significant impact on Tristel plc we have not assessed this as one of the most significant risks in our current year audit and, therefore, it is not separately identified in our report this year.
The valuation of acquired intangibles was audited in the year of acquisition and therefore was not separately identified in the report this year.
3. Our application of materiality and an overview of the scope of our audit
Materiality for the group financial statements as a whole was set at £299,000 (2019: £282,500), determined with reference to a benchmark of profit before tax from continuing operations of which it represents 4.50% (2019: 6.0%).
Materiality for the parent company financial statements as a whole was set at £146,000 (2019: £135,000), which was determined with reference to a benchmark of company total assets, of which it represents 0.7% (2019: 0.7%) of the Benchmark.
We agreed to report to the Audit Committee any corrected or uncorrected identified misstatements exceeding £14,900 (2019: £14,100), in addition to other identified misstatements that warranted reporting on qualitative grounds.
Of the Group’s 15 (2019: 15) components, we subjected six (2019: 5) components to full scope audits for Group purposes.
For the remaining components, we performed analysis, at an aggregated group level, to re-examine our assessment that there were no significant risks of material misstatement with these components.
The Group team instructed the component auditor as to the significant areas to be covered, including the relevant risks detailed above and the information to be reported back. The Group team approved the component materialities, which ranged from £79,900 to £212,800 (2019: £135k to £212k), having regard to the mix of size and risk profile of the Group across the components.
The work on four of the 15 components was performed by component auditors and the remaining, including the audit of the parent company, was performed by the Group team.
In relation to these four components video and telephone conference meetings were held with these component auditors to assess the audit risk and strategy. At these meetings, the findings reported to the Group team were discussed in more detail, and any further work required by the Group team was then performed by the component auditor.

39
4. We have nothing to report on going concern
The Directors have prepared the financial statements on the going concern basis as they do not intend to liquidate the Company or the Group or to cease their operations, and as they have concluded that the Company’s and the Group’s financial position means that this is realistic. They have also concluded that there are no material uncertainties that could have cast significant doubt over their ability to continue as a going concern for at least a year from the date of approval of the financial statements (‘the going concern period’).
Our responsibility is to conclude on the appropriateness of the Directors’ conclusions and, had there been a material uncertainty related to going concern, to make reference to that in this audit report. However, as we cannot predict all future events or conditions and as subsequent events may result in outcomes that are inconsistent with judgements that were reasonable at the time they were made, the absence of reference to a material uncertainty in this auditor’s report is not a guarantee that the Group or the Company will continue in operation.
In our evaluation of the Directors’ conclusions, we considered the inherent risks to the Group’s and Company’s business model, including the impact of Brexit, and analysed how those risks might affect the Group’s and Company’s financial resources or ability to continue operations over the going concern period. We evaluated those risks and concluded that they were not significant enough to require us to perform additional audit procedures.
Based on this work, we are required to report to you if we have concluded that the use of the going concern basis of accounting is inappropriate or there is an undisclosed material uncertainty that may cast significant doubt over the use of that basis for a period of at least a year from the date of approval of the financial statements.
We have nothing to report in these respects, and we did not identify going concern as a key audit matter.
5. We have nothing to report on the other information in the Annual Report
The Directors are responsible for the other information presented in the Annual Report together with the financial statements. Our opinion on the financial statements does not cover the other information and, accordingly, we do not express an audit opinion or, except as explicitly stated below, any form of assurance conclusion thereon.
Our responsibility is to read the other information and, in doing so, consider whether, based on our financial statements audit work, the information therein is materially misstated or inconsistent with the financial statements or our audit knowledge. Based solely on that work we have not identified material misstatements in the other information.
Strategic report and Directors’ reportBased solely on our work on the other information:
• we have not identified material misstatements in the strategic report and the Directors’ report;
• in our opinion the information given in those reports for the financial year is consistent with the financial statements; and
• in our opinion those reports have been prepared in accordance with the Companies Act 2006.
6. We have nothing to report on the other matters on which we are required to report by exception
Under the Companies Act 2006, we are required to report to you if, in our opinion:
• adequate accounting records have not been kept by the parent company, or returns adequate for our audit have not been received from branches not visited by us; or
• the parent company financial statements are not in agreement with the accounting records and returns; or
• certain disclosures of Directors’ remuneration specified by law are not made; or
• we have not received all the information and explanations we require for our audit.
We have nothing to report in these respects.

TRIS
TEL P
LC A
NNUA
L RE
PORT
& A
CCOU
NTS
YEAR
END
ED 3
0 JU
NE 2
020
40
7. Respective responsibilities
Directors’ responsibilitiesAs explained more fully in their statement set out on page 35, the Directors are responsible for: the preparation of the financial statements including being satisfied that they give a true and fair view; such internal control as they determine is necessary to enable the preparation of financial statements that are free from material misstatement, whether due to fraud or error; assessing the Group and parent company’s ability to continue as a going concern, disclosing, as applicable, matters related to going concern; and using the going concern basis of accounting unless they either intend to liquidate the Group or the parent company or to cease operations, or have no realistic alternative but to do so.
Auditor’s responsibilitiesOur objectives are to obtain reasonable assurance about whether the financial statements as a whole are free from material misstatement, whether due to fraud or error, and to issue our opinion in an auditor’s report. Reasonable assurance is a high level of assurance, but does not guarantee that an audit conducted in accordance with ISAs (UK) will always detect a material misstatement when it exists. Misstatements can arise from fraud or error and are considered material if, individually or in aggregate, they could reasonably be expected to influence the economic decisions of users taken on the basis of the financial statements.
A fuller description of our responsibilities is provided on the FRC’s website at www.frc.org.uk/auditorsresponsibilities.
8. The purpose of our audit work and to whom we owe our responsibilities
This report is made solely to the Company’s members, as a body, in accordance with Chapter 3 of Part 16 of the Companies Act 2006. Our audit work has been undertaken so that we might state to the Company’s members those matters we are required to state to them in an auditor’s report and for no other purpose. To the fullest extent permitted by law, we do not accept or assume responsibility to anyone other than the Company and the Company’s members, as a body, for our audit work, for this report, or for the opinions we have formed.
Mark Prince Senior Statutory Auditor FOR AND ON BEHALF OF KPMG LLP, STATUTORY AUDITOR Chartered Accountants, Botanic House, 100 Hills Road, Cambridge CB2 1AR 16 October 2020
Independent Auditor’s Report to the members of Tristel plc continued

41
THE NOTES ON PAGES 50 TO 86 FORM AN INTEGRAL PART OF THESE FINANCIAL STATEMENTS
Consolidated Income Statement for the year ended 30 June 2020
NOTE2020
£’0002019
£’000
Revenue 31,678 26,169
Cost of sales (6,431) (5,504)
Gross profit 25,247 20,665
Share-based payments (435) (852)
Depreciation, amortisation and impairments (2,558) (1,537)
Administrative expenses, excluding share-based payments, depreciation, amortisation and impairment (15,449) (13,579)
Operating profit 4 6,805 4,697
Finance income 1 5
Finance costs (167) (1)
Net finance (cost)/income 5 (166) 4
Share of profit of equity accounted investees – 45
Profit before tax 6,639 4,746
Income tax expense 9 (1,539) (715)
Profit for the year 5,100 4,031
Profit attributable to: Owners of the Company 5,100 4,031
Earnings per share from total and continuing operations attributable to equity holders of the parent 2020 2019
Basic – pence 22 11.38 9.14
Diluted – pence 22 10.88 8.86
The above results were derived from continuing operations. Earnings before interest, tax, depreciation and amortisation for the year ended 30 June 2020 were £9,363,000 (2019 £6,279,000). (Note 4.)
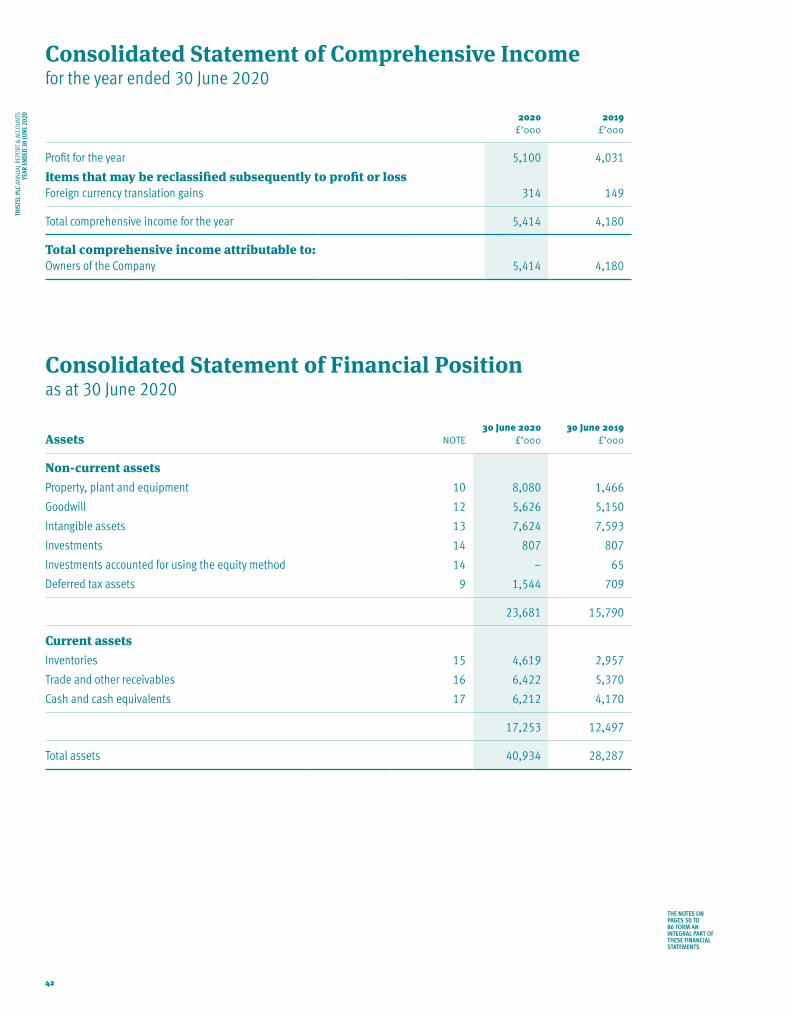
TRIS
TEL P
LC A
NNUA
L RE
PORT
& A
CCOU
NTS
YEAR
END
ED 3
0 JU
NE 2
020
42
THE NOTES ON PAGES 50 TO 86 FORM AN INTEGRAL PART OF THESE FINANCIAL STATEMENTS
Consolidated Statement of Comprehensive Income for the year ended 30 June 2020
2020£’000
2019£’000
Profit for the year 5,100 4,031
Items that may be reclassified subsequently to profit or lossForeign currency translation gains 314 149
Total comprehensive income for the year 5,414 4,180
Total comprehensive income attributable to: Owners of the Company 5,414 4,180
Consolidated Statement of Financial Positionas at 30 June 2020
Assets NOTE30 June 2020
£’00030 June 2019
£’000
Non-current assetsProperty, plant and equipment 10 8,080 1,466
Goodwill 12 5,626 5,150
Intangible assets 13 7,624 7,593
Investments 14 807 807
Investments accounted for using the equity method 14 – 65
Deferred tax assets 9 1,544 709
23,681 15,790
Current assetsInventories 15 4,619 2,957
Trade and other receivables 16 6,422 5,370
Cash and cash equivalents 17 6,212 4,170
17,253 12,497
Total assets 40,934 28,287

43
THE NOTES ON PAGES 50 TO 86 FORM AN INTEGRAL PART OF THESE FINANCIAL STATEMENTS
Consolidated Statement of Financial Position as at 30 June 2020 (continued)
Equity and liabilities NOTE30 June 2020
£’00030 June 2019
£’000
EquityShare capital 18 453 446
Share premium 12,634 11,427
Foreign currency translation reserve 397 83
Merger reserve 2,205 2,205
Retained earnings 12,767 9,191
Equity attributable to owners of the Company 28,456 23,352
Non-controlling interests 7 7
Total equity 28,463 23,359
Non-current liabilitiesOther non-current financial liabilities 11 5,185 –
Deferred tax liabilities 9 615 550
5,800 550
Current liabilitiesTrade and other payables 20 4,672 3,539
Income tax liability 9 1,182 839
Other current financial liabilities 11 817 –
6,671 4,378
Total liabilities 12,471 4,928
Total equity and liabilities 40,934 28,287
Approved by the Board on 16 October 2020 and signed on its behalf by: Elizabeth Dixon Finance Director. Registration number: 04728199

TRIS
TEL P
LC A
NNUA
L RE
PORT
& A
CCOU
NTS
YEAR
END
ED 3
0 JU
NE 2
020
44
THE NOTES ON PAGES 50 TO 86 FORM AN INTEGRAL PART OF THESE FINANCIAL STATEMENTS
Company Statement of Financial Position as at 30 June 2020
Assets NOTE30 June 2020
£’00030 June 2019
£’000
Non-current assetsIntangible assets 13 2,993 3,262
Investments in subsidiaries, joint ventures and associates 14 12,644 11,324
15,637 14,586
Current assetsTrade and other receivables 16 4,193 3,046
Income tax asset 6 6
Cash and cash equivalents 17 598 727
4,797 3,779
Total assets 20,434 18,365
Equity and liabilities
EquityShare capital 18 453 446
Share premium 12,634 11,427
Foreign currency translation reserve 63 54
Merger reserve 1,727 1,727
Retained earnings 5,238 4,633
Total equity 20,115 18,287
Non-current liabilitiesDeferred tax liabilities 9 9 9
Current liabilitiesTrade and other payables 20 311 69
Total liabilities 320 78
Total equity and liabilities 20,435 18,365
The parent company’s profit for the financial year was £2.791m (2019: £2.002m) which includes a dividend of £3.759m (2019: £2.793m) received from its subsidiary companies.
Approved by the Board on 16 October 2020 and signed on its behalf by: Elizabeth Dixon Finance Director. Registration number: 04728199

45
THE NOTES ON PAGES 50 TO 86 FORM AN INTEGRAL PART OF THESE FINANCIAL STATEMENTS
Consolidated Statement of Changes in Equity for the year ended 30 June 2020
Share capital
£’000
Share premium
£’000
Foreign currency
translation£’000
Merger reserve
£’000
Retained earnings
£’000Total
£’000
Non- controlling
interests£’000
Total equity£’000
At 1 July 2019 446 11,427 83 2,205 9,191 23,352 7 23,359
Change in accounting policy (see note 26) – – – – (242) (242) – (242)
At 1 July 2019 (As restated) 446 11,427 83 2,205 8,949 23,110 7 23,117
Profit for the year – – – – 5,100 5,100 – 5,100
Exchange difference on translation of foreign operations – – 314 – – 314 – 314
Total comprehensive income – – 314 – 5,100 5,414 – 5,414
Dividends – – – – (2,621) (2,621) – (2,621)
New share capital subscribed 7 1,207 – – – 1,214 – 1,214
Deferred tax through equity – – – – 904 904 – 904
Share-based payment transactions – – – – 435 435 – 435
At 30 June 2020 453 12,634 397 2,205 12,767 28,456 7 28,463
At 1 July 2018 432 11,058 (66) 478 6,518 18,420 7 18,427
Profit for the year – – – – 4,031 4,031 – 4,031
Exchange difference on translation of foreign operations – – 149 – – 149 – 149
Total comprehensive income – – 149 – 4,031 4,180 – 4,180
Dividends – – – – (2,210) (2,210) – (2,210)
New share capital subscribed 14 369 – 1,727 – 2,110 – 2,110
Share-based payment transactions – – – – 852 852 – 852
At 30 June 2019 446 11,427 83 2,205 9,191 23,352 7 23,359

TRIS
TEL P
LC A
NNUA
L RE
PORT
& A
CCOU
NTS
YEAR
END
ED 3
0 JU
NE 2
020
46
THE NOTES ON PAGES 50 TO 86 FORM AN INTEGRAL PART OF THESE FINANCIAL STATEMENTS
Company Statement of Changes in Equity for the year ended 30 June 2020
Share capital
£’000
Share premium
£’000
Foreign currency
translation£’000
Merger reserve
£’000
Retained earnings
£’000Total
£’000
At 1 July 2019 446 11,427 54 1,727 4,633 18,287
Profit for the year – – – – 2,791 2,791
Exchange difference – – 9 – – 9
Total comprehensive income – – 9 – 2,791 2,800
Dividends paid – – – – (2,621) (2,621)
New share capital subscribed 7 1,207 – – – 1,214
Share-based payment transactions – – – – 435 435
At 30 June 2020 453 12,634 63 1,727 5,238 20,115
At 1 July 2018 432 11,058 – – 3,989 15,479
Profit for the year – – – – 2,002 2,002
Share-based payments – – 54 – – 54
Total comprehensive income – – 54 – 2,002 2,056
Dividends paid – – – – (2,210) (2,210)
New share capital subscribed 14 369 – 1,727 – 2,110
Share-based payment transactions – – – – 852 852
At 30 June 2019 446 11,427 54 1,727 4,633 18,287

47
THE NOTES ON PAGES 50 TO 86 FORM AN INTEGRAL PART OF THESE FINANCIAL STATEMENTS
Consolidated Statement of Cash Flows for the year ended 30 June 2020
NOTE2020
£’0002019
£’000
Cash flows from operating activitiesProfit before tax 6,639 4,746
Adjustments to cash flows from non-cash itemsDepreciation of leased assets 10 692 –
Depreciation of plant, property and equipment 10 598 584
Amortisation of intangible assets 13 1,201 886
Impairment of intangible assets 12 67 67
Share-based payments – IFRS 2 435 852
Gain on fair value of investment MobileODT – (98)
Gain on fair value of investment Tristel Italia (111) –
Loss on disposal of property, plant and equipment 54 21
Lease interest 11 165 –
Unrealised loss in foreign exchange 8 72
Loss on disposal of intangible asset – 12
Finance income (1) (5)
9,747 7,137
Working capital adjustmentsIncrease in inventories 15 (1,655) (415)
Increase in trade and other receivables 16 (805) (414)
Increase in trade and other payables 20 1,007 49
Lease interest paid 11 (165) –
Corporation tax paid (1,140) (871)
Net cash flow from operating activities 6,989 5,486
Cash flows from investing activitiesInterest received 1 5
Purchase of intangible assets 13 (610) (669)
Purchase of investment in Italia/Ecomed 12 (595) (4,706)
Purchase of investment in MobileODT – (120)
Purchase of property plant and equipment 10 (1,770) (678)
Net cash used in investing activities (2,974) (6,168)
Cash flows from financing activitiesPayment of lease liabilities (614) –
Share issues 1,214 383
Dividends paid 21 (2,621) (2,210)
Net cash used in financing activities (2,021) (1,827)
Net (decrease)/increase in cash and cash equivalents 1,994 (2,509)
Cash and cash equivalents at the beginning of the year 4,170 6,661
Exchange differences on cash and cash equivalents 48 18
Cash and cash equivalents at the end of the year 17 6,212 4,170
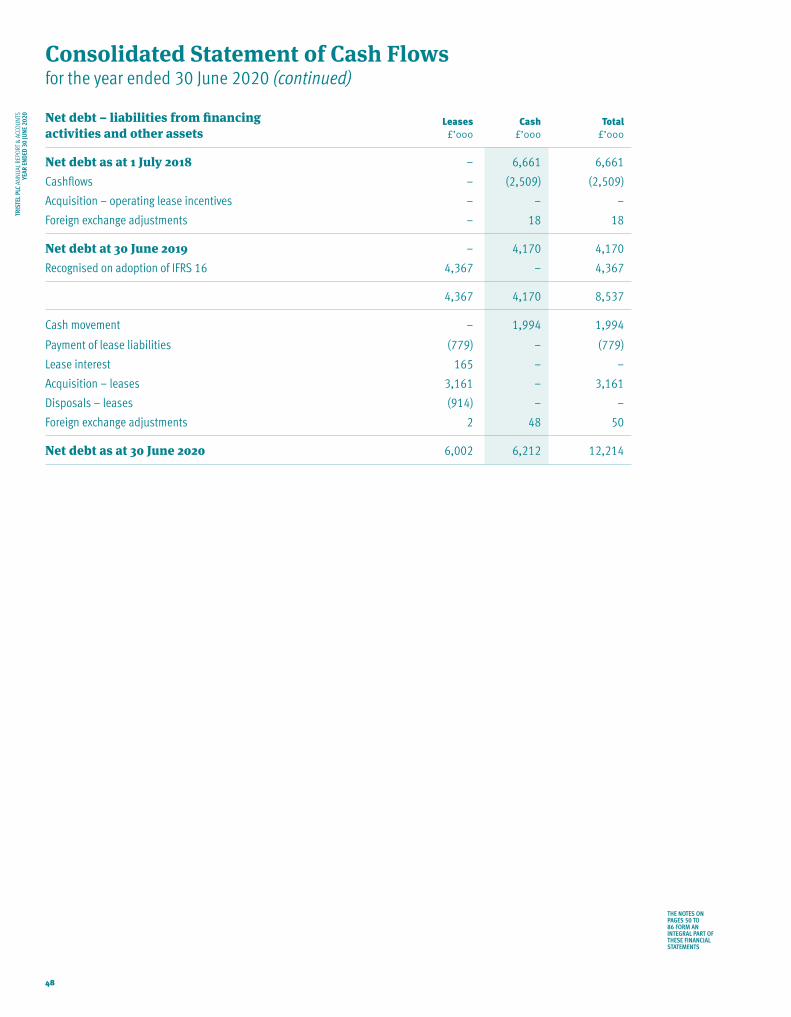
TRIS
TEL P
LC A
NNUA
L RE
PORT
& A
CCOU
NTS
YEAR
END
ED 3
0 JU
NE 2
020
48
THE NOTES ON PAGES 50 TO 86 FORM AN INTEGRAL PART OF THESE FINANCIAL STATEMENTS
Consolidated Statement of Cash Flows for the year ended 30 June 2020 (continued)
Net debt – liabilities from financing activities and other assets
Leases£’000
Cash£’000
Total£’000
Net debt as at 1 July 2018 – 6,661 6,661
Cashflows – (2,509) (2,509)
Acquisition – operating lease incentives – – –
Foreign exchange adjustments – 18 18
Net debt at 30 June 2019 – 4,170 4,170
Recognised on adoption of IFRS 16 4,367 – 4,367
4,367 4,170 8,537
Cash movement – 1,994 1,994
Payment of lease liabilities (779) – (779)
Lease interest 165 – –
Acquisition – leases 3,161 – 3,161
Disposals – leases (914) – –
Foreign exchange adjustments 2 48 50
Net debt as at 30 June 2020 6,002 6,212 12,214

49
THE NOTES ON PAGES 50 TO 86 FORM AN INTEGRAL PART OF THESE FINANCIAL STATEMENTS
Company Statement of Cash Flows for the year ended 30 June 2020
NOTE2020
£’0002019
£’000
Cash flows from operating activitiesProfit before tax 2,791 2,002
Adjustments to cash flows from non-cash itemsAmortisation of intangible asset 13 402 258
Gain on fair value of investment (111) (98)
Unrealised loss/(gain) on foreign exchange 8 (73)
Finance income – (3)
3,090 2,086
Working capital adjustments(Increase)/decrease in trade and other receivables 16 (1,213) 2,726
Increase/(decrease) in trade and other payables 20 129 (42)
Net cash flow from operating activities 2,006 4,770
Cash flows from investing activitiesInterest received – 3
Purchase of intangible assets 13 (133) (182)
Purchase of investments 12 (595) (4,706)
Net cash used in investing activities (728) (4,885)
Cash flows from financing activitiesShare issues 1,214 383
Dividends paid 21 (2,621) (2,210)
Net cash used in financing activities (1,407) (1,827)
Net (decrease) in cash and cash equivalents (129) (1,942)
Cash and cash equivalents at the beginning of the period 727 2,669
Cash and cash equivalents at the end of the period 17 598 727

Notes to the Financial Statements for the year ended 30 June 2020
TRIS
TEL P
LC A
NNUA
L RE
PORT
& A
CCOU
NTS
YEAR
END
ED 3
0 JU
NE 2
020
50
1. Accounting policies
Basis of accountingThese financial statements have been prepared in accordance with International Financial Reporting Standards (IFRS) as adopted by the European Union (EU).
Tristel plc, the Group’s ultimate parent company, is a limited liability company incorporated and domiciled in the United Kingdom.
Basis of consolidationThe Group financial statements consolidate those of the Company and all of its subsidiary undertakings drawn up to 30 June 2020. Subsidiaries are entities over which the Group has rights or is exposed to variable returns from its involvement with the investee and has the power to affect those returns by controlling the financial and operating policies so as to obtain benefits from its activities. The Group obtains and exercises control through voting rights.
Unrealised gains on transactions between the Group and its subsidiaries are eliminated. Unrealised losses are also eliminated unless the transaction provides evidence of an impairment of the asset transferred. Amounts reported in the financial statements of subsidiaries have been adjusted where necessary to ensure consistency with the accounting policies adopted by the Group.
Acquisitions of subsidiaries are dealt with by the acquisition method. The acquisition method involves the recognition at fair value of all identifiable assets and liabilities, including contingent liabilities of the subsidiary, at the acquisition date, regardless of whether or not they were recorded in the financial statements of the subsidiary prior to acquisition. These fair values are also used as the basis for subsequent measurement in accordance with the Group accounting policies. Goodwill is stated after separating out identifiable intangible assets. Goodwill represents the excess of the aggregate of the consideration transferred and the amount of non-controlling interest over the fair value of the Group’s share of the identifiable net assets of the acquired subsidiary at the date of acquisition.
Non-controlling interests, presented as part of equity, represent a proportion of a subsidiary’s profit or loss and net assets that is not held by the Group. The Group attributes total comprehensive income or loss of subsidiaries between the assets of the parent and the non-controlling interests based on their respective ownership interests.
Audit exemptionThe following subsidiaries are exempt from the requirements of the UK Companies Act 2006 relating to the audit of individual accounts by virtue of s479A of the Act:
• Tristel International Limited – Registered number 07874262
• Scorcher Idea Limited – Registered number 04602679
Going concernManagement have considered the trading performance of the Group with underlying trends and expectations, including the potential impact of the COVID-19 Pandemic, this forms the basis of the Group’s current forecasts. The forecasts, including a reasonable worst case scenario in regards to COVID-19, in addition to the resources available to the Group leave management to believe that the Group will continue for the foreseeable future for a period of not less than 12 months from date of approval of accounts.
AssociatesAssociates are those entities over which the Group has significant influence but which are neither subsidiaries nor interests in joint ventures. Investments in associates are recognised initially at cost and the results of the associate are subsequently accounted for using the equity method. Acquired investments in associates are also subject to purchase method accounting. However, any goodwill or fair value adjustment attributable to the share in the associate is included in the amount recognised as investment in associates.
All subsequent changes to the share of interest in the equity of the associate are recognised in the Group’s carrying amount of the investment. Unless otherwise stated changes resulting from the profit or loss generated by the associate are reported in ‘share of profits of associates’ in the consolidated income statement and therefore affect net results of the Group. These changes include subsequent depreciation, amortisation or impairment of the fair value adjustments of assets and liabilities.
Items that have been recognised directly in the associate’s other comprehensive income are recognised in the consolidated other comprehensive income of the Group. However, when the Group’s share of losses in an associate equals or exceeds its interest in the associate, including any unsecured receivables, the Group does not recognise further losses, unless it has incurred obligations or made payments on behalf of the associate. If the associate subsequently reports profits, the investor resumes recognising its share of those profits only after its share of the profits equals the share of losses not recognised.

Notes to the Financial Statements for the year ended 30 June 2020
continued
51
1. Accounting policies continued
Unrealised gains on transactions between the Group and its associates are eliminated to the extent of the Group’s interest in the associates. Unrealised losses are also eliminated unless the transaction provides evidence of an impairment of the asset transferred. Amounts reported in the financial statements of associates have been adjusted where necessary to ensure consistency with the accounting policies adopted by the Group.
Step acquisitionsPrior to control being obtained, the Company accounts for its investment in the equity interests of an acquiree in accordance with the nature of the investment by applying the relevant standard, e.g. IAS 28 Investments in Associates and Joint Ventures (2011), IFRS 11 Joint Arrangements, IAS 39 Financial Instruments: Recognition and Measurement or IFRS 9 Financial Instruments. As part of accounting for the business combination, the Company remeasures any previously held interest at fair value and takes this amount into account in the determination of goodwill as noted above. Any resultant gain or loss is recognised in profit or loss or other comprehensive income as appropriate.
Changes in accounting policyEU adopted IFRSs not yet appliedAs of 30 June 2020, the following Standards and Interpretations are in issue but not yet effective and have not been adopted early by the Group:
• IFRS 3 – Definition of a Business (effective 1 January 2020)
• IAS 1 and 8 – Definition of Material (effective 1 January 2020)
• IFRS 9, IAS 39 and IFRS 7 – Interest rate benchmark reform (effective 1 January 2020)
• IFRS 17 – Insurance contracts (effective 1 January 2021)
• IAS 1 – Classification of liabilities as current or non-current (effective 1 January 2022)
The Directors anticipate that the adoption of IFRS 17 in future periods will have no material effect on the financial statements of the Group.
There are no other standards that are not yet effective and that would be expected to have a material impact on the Group in the current or future reporting periods and on foreseeable future transactions.
With the exception of IFRS 16, none of the standards, interpretations and amendments effective for the first time from 1 July 2019 have had a material effect on the financial statements.
IFRS 16 IFRS 16 – Leases was issued in January 2016 and was adopted by the Group effective 1 July 2019. The standard provides a single lease accounting model, requiring lessees to recognise assets and liabilities for all operating leases unless the term is 12 months or less or the leased asset is of a low value. As at the reporting date, the Group had recognised right of use assets of £3.9m on 1 July 2019 and lease liabilities of £4.4m (after adjustments for prepayments and lease incentives recognised as at 30 June 2019). The modified retrospective transition approach has been applied with the right of use assets being measured as if IFRS 16 had always been applied using the transition discount rate, subsequently an adjustment to equity of £0.2m was recognised as at 1 July 2019. Comparative results have not required restatement.
Further detail is given in notes 10, 11 and 26.
Revenue recognitionIFRS 15 was issued in May 2014 and applies to an annual reporting period beginning on or after 1 January 2018.
IFRS 15 establishes the principles that an entity applies when reporting information about the nature, amount, timing and uncertainty of revenue and cash flows from a contract with a customer. Applying IFRS 15, the Group recognises revenue to depict the transfer of promised goods (performance obligations) to the customer in an amount that reflects the consideration to which the entity expects to be entitled in exchange for those goods. Revenue is therefore recognised as performance obligations to deliver products are satisfied. Performance obligations for the sale of products are dependent on the terms and conditions of sale. The point in time at which revenue is recognised may therefore vary between the point goods are made available for customers to collect, and the point at which they are delivered to the customers.
The Group undertook a detailed impact assessment of the impact of IFRS 15 on its revenues from products. The Group determined in the previous year that the application of IFRS 15 on 1 July 2018 did not have a material effect on the financial statements for the year ended 30 June 2019 and has therefore not restated comparative information.

Notes to the Financial Statements for the year ended 30 June 2020
continued
TRIS
TEL P
LC A
NNUA
L RE
PORT
& A
CCOU
NTS
YEAR
END
ED 3
0 JU
NE 2
020
52
1. Accounting policies continued
Foreign currency transactions and balancesThe consolidated financial statements are presented in GBP, which is also the functional currency of the parent company.
Foreign currency transactions are translated into the functional currency of the respective Group entity, using the exchange rates prevailing at the dates of the transactions (spot exchange rate). Foreign exchange gains and losses resulting from the settlement of such transactions and from the re-measurement of monetary items denominated in a foreign currency at year-end exchange rates are recognised in profit or loss.
In the Group’s financial statements, all assets, liabilities and transactions of Group entities with a functional currency other than GBP are translated into GBP upon consolidation. The functional currencies of the subsidiary entities in the Group have remained unchanged during the reporting period.
On consolidation, assets and liabilities have been translated into GBP at the closing rate at the reporting date. Income and expense items are translated at the average exchange rate. Exchange differences are charged or credited to other comprehensive income and recognised in the foreign currency reserve in equity.
TaxThe tax expense for the year comprises current and deferred tax. Tax is recognised in profit or loss, except that a change attributable to an item of income or expense recognised as other comprehensive income is also recognised directly in other comprehensive income.
The charge for current tax is based on the results for the year as adjusted for items, which are non-assessable or disallowed. It is calculated according to local tax rules, using tax rates enacted or substantively enacted by the balance sheet date.
Deferred tax is provided using the balance sheet liability method, providing for temporary differences between the carrying amounts of assets and liabilities for financial reporting purposes and the amounts used for taxation purposes. A deferred tax asset is recognised only to the extent that it is probable that future taxable profits will be available against which an asset can be utilised. However, deferred tax is not provided on the initial recognition of goodwill, nor on the initial recognition of an asset or liability unless the related transaction is a business combination or affects tax or accounting profit.
Deferred tax on temporary differences associated with shares in subsidiaries and associates is not provided if reversal of these temporary differences can be controlled by the Group and it is probable that reversal will not occur in the foreseeable future. In addition, tax losses available to be carried forward as well as other income tax credits to the Group are assessed for recognition as deferred tax assets.
Changes in deferred tax assets or liabilities are recognised as a component of tax expense in the income statement, except where they relate to items that are charged or credited directly to equity in which case the related deferred tax is also charged or credited directly to equity.
Property, plant and equipmentProperty, plant and equipment are held at cost less accumulated depreciation and impairment losses. Depreciation is provided at the following annual rates in order to write off each asset less the estimated residual value of property, plant and equipment over their estimated useful economic lives as follows:
Improvements to property Straight line over the lease term of 10 years Other property, plant and equipment Straight line over 3 and 5 years Furniture, fittings and equipment Straight line over 4 and 5 years Motor vehicles Straight line over 4 years
The residual value and useful economic life of property, plant and equipment are reviewed annually.
LeasesThe Group has applied IFRS 16 using the modified retrospective approach and therefore the comparative information has not been restated and continues to be reported under IAS 17 and IFRIC 4. The details of accounting policies under IAS 17 and IFRIC 4 are disclosed separately if they are different from those under IFRS 16 and the impact of changes is disclosed in note 26.
Policy applicable from 1 July 2019At inception of a contract, the Group assesses whether a contract is, or contains a lease. A contract is, or contains, a lease if the contract conveys the right to control the use of an identified asset for a period of time in exchange for consideration. To assess whether a contract conveys the right to control the use of an identified asset, the Group assesses whether:
• the contract involves the use of an identified asset – this may be specified explicitly or implicitly, and should be physically distinct or represent substantially all of the capacity of a physically distinct asset. If the supplier has a substantive substitution right, then the asset is not identified;

Notes to the Financial Statements for the year ended 30 June 2020
continued
53
1. Accounting policies continued
• the Group has the right to obtain substantially all of the economic benefits from use of the asset throughout the period of use; and
• the Group has the right to direct the use of the asset. The Group has this right when it has the decision-making rights that are most relevant to changing how and for what purpose the asset is used. In rare cases where the decision about how and for what purpose the asset is used is predetermined, the Group has the right to direct the use of the asset if either:
• the Group has the right to operate the asset; or
• the Group designed the asset in a way that predetermines how and for what purpose it will be used.
This policy is applied to contracts entered into, or changed, on or after 1 July 2019. At inception or on reassessment of a contract that contains a lease component, the Group allocates the consideration in the contract to each lease component on the basis of their relative stand-alone prices . However, for the leases of land and buildings in which it is a lessee, the Group has elected not to separate non-lease components and account for the lease and non-lease components as a single lease component.
Policy applicable before 1 July 2019For contracts entered into before 1 July 2019, the Group determined whether the arrangement was or contained a lease based on the assessment of whether:
• fulfilment of the arrangement was dependent on the use of a specific asset or assets; and
• the arrangement had conveyed a right to use the asset. An arrangement conveyed the right to use the asset if one of the following was met;
• the purchaser had the ability or right to operate the asset while obtaining or controlling more than an insignificant amount of the output;
• the purchaser had the ability or right to control physical access to the asset while obtaining or controlling more than an insignificant amount of the output; or
• facts and circumstances indicated that it was remote that other parties would take more than an insignificant amount of the output, and the price per unit was neither fixed per unit of output nor equal to the current market price per unit of output.
As a LesseeThe Group recognises a right-of-use asset and a lease liability at the lease commencement date. The right-of-use asset is initially measured at cost, which comprises the initial amount of the lease liability adjusted for any lease payments made at or before the commencement date, plus any initial direct costs incurred and an estimate of costs to dismantle and remove the underlying asset or to restore the underlying asset or the site on which it is located, less any lease incentives received.
The right-of-use asset is subsequently depreciated using the straight-line method from the commencement date to the earlier of the end of the useful life of the right-of-use asset or the end of the lease term. The estimated useful lives of right-of-use assets are determined on the same basis as those of property and equipment. In addition, the right-of-use asset is periodically reduced by impairment losses, if any, and adjusted for certain remeasurements of the lease liability.
The lease liability is initially measured at the present value of the lease payments that are not paid at the commencement date, discounted using the interest rate implicit in the lease or, if that rate cannot be readily determined, the Group’s incremental borrowing rate. Generally, the Group uses its incremental borrowing rate as the discount rate.
Lease payments included in the measurement of the lease liability comprise the following:
• fixed payments, including in-substance fixed payments;
• variable lease payments that depend on an index or a rate, initially measured using the index or rate as at the commencement date;
• amounts expected to be payable under a residual value guarantee; and
• the exercise price under a purchase option that the Group is reasonably certain to exercise, lease payments in an optional renewal period if the Group is reasonably certain to exercise an extension option, and penalties for early termination of a lease unless the Group is reasonably certain not to terminate early.
The lease liability is measured at amortised cost using the effective interest method. It is remeasured when there is a change in future lease payments arising from a change in an index or rate, if there is a change in the Group’s estimate of the amount expected to be payable under a residual value guarantee, or if the Group changes its assessment of whether it will exercise a purchase, extension or termination option.

Notes to the Financial Statements for the year ended 30 June 2020
continued
TRIS
TEL P
LC A
NNUA
L RE
PORT
& A
CCOU
NTS
YEAR
END
ED 3
0 JU
NE 2
020
54
1. Accounting policies continued
When the lease liability is remeasured in this way, a corresponding adjustment is made to the carrying amount of the right-of-use asset, or is recorded in profit or loss if the carrying amount of the right-of-use asset has been reduced to zero.
Short-term leases and leases of low-value assetsThe Group has elected not to recognise right-of-use assets and lease liabilities for short-term leases of machinery that have a lease term of 12 months or less and leases of low-value assets, including IT equipment. The Group recognises the lease payments associated with these leases as an expense on a straight-line basis over the lease term.
Under IAS 17In the comparative period, as a lessee the Group classified leases that transfer substantially all of the risks and rewards of ownership as finance leases. When this was the case, the leased assets were measured initially at an amount equal to the lower of their fair value and the present value of the minimum lease payments. Minimum lease payments were the payments over the lease term that the lessee was required to make, excluding any contingent rent.
Subsequently, the assets were accounted for in accordance with the accounting policy applicable to that asset.
Assets held under other leases were classified as operating leases and were not recognised in the Group’s statement of financial position. Payments made under operating leases were recognised in profit or loss on a straight-line basis over the term of the lease. Lease incentives received were recognised as an integral part of the total lease expense, over the term of the lease.
Investments and other financial assetsFor assets measured at fair value, gains and losses will either be recorded in profit or loss or other comprehensive income. For investments in debt instruments, this will depend on the business model in which the investment is held. For investments in equity instruments, this will depend on whether the Company has made an irrevocable election at the time of initial recognition to account for the equity investment at fair value through other comprehensive income.
The company subsequently measures all equity investments at fair value. Where the Company’s management has elected to present fair value gains and losses on equity investments in other comprehensive income, there is no subsequent reclassification of fair value gains and losses to profit or loss. Dividends from such investments continue to be recognised in profit or loss as other income when the Company’s right to receive payments is established.
Changes in the fair value of financial assets at fair value through profit or loss are recognised in other gain/(losses) in the statement of profit or loss as applicable.
Intangible assetsIn determining the amortisation policy of an intangible asset, its estimated useful economic life in terms of years or the number of stock units likely to be sold, is considered. Where a finite useful economic life of the asset can be estimated, amortisation is calculated from the point at which the asset is brought into use, and charged to the income statement over its lifetime. Where it is considered that an intangible asset has an indefinite useful economic life, such as goodwill, no amortisation is charged. Instead, in accordance with IAS 36 the asset is tested annually for impairment, comparing the recoverable amount to the carrying amount. The recoverable amount is calculated by reference to future cash flows expected to be generated by the asset.
Patents, trademarks, licences and proprietary technology Patents, trademarks and licences that are acquired by the Group are stated at cost less accumulated amortisation and impairment losses. Amortisation is charged over the useful life of the asset, on a straight-line basis of between seven and 20 years.
Research and development Research expenditure is written off as incurred. Development expenditure is also written off as incurred, except where the Directors are satisfied, having due regard to the nature and scope of each development project assessed, as to the technical, commercial and financial feasibility of the project. In such cases, the identifiable expenditure of the relevant project is deferred and amortised over the period during which the Group is expected to benefit, as administration costs, as detailed below.
Development costs incurred are capitalised when all the following conditions are satisfied:
• completion of the intangible asset is technically feasible so that it will be available for use or sale;
• the Group intends to complete the intangible asset and use or sell it;
• the Group has the ability to use or sell the intangible asset;
• the intangible asset will generate probable future economic benefits. Among other things, this requires that there is a market for the output from the intangible asset or for the intangible asset itself, or, if it is to be used internally, the asset will be used in generating such benefits;

Notes to the Financial Statements for the year ended 30 June 2020
continued
55
1. Accounting policies continued
• there are adequate technical, financial and other resources to complete the development and to use or sell the intangible asset; and
• the expenditure attributable to the intangible asset during its development can be measured reliably.
Provision is made for any impairment. The amortisation of intangible assets is charged to administrative expenses in the income statement on a straight-line basis of between seven years and 25 years.
Software Software that is acquired from third parties by the Group is stated at cost less accumulated amortisation and impairment losses. Amortisation is charged over the useful life of the asset, deemed to be seven years based on historical trends of software utilisation.
GoodwillGoodwill arising on consolidation represents the excess of the cost of acquisition over the Group’s interest in the fair value of the identifiable assets and liabilities of a subsidiary at the date of acquisition. Goodwill is initially recognised as an asset at cost and is subsequently measured at cost less any accumulated impairment losses. Goodwill which is recognised as an asset is reviewed for impairment at least annually. Any impairment is recognised immediately in profit or loss and is not subsequently reversed.
For the purpose of impairment testing, goodwill is allocated to the cash-generating unit acquired. Cash-generating units to which goodwill has been allocated are tested for impairment annually, or more frequently where there is an indication that the unit may be impaired. If the recoverable amount of the cash-generating unit is less than the carrying amount of the unit, the impairment loss is allocated first to reduce the carrying amount of any goodwill allocated to the unit and then to other assets of the unit pro rata on the basis of the carrying amount of each asset in the unit. An impairment loss recognised for goodwill is not reversed in a subsequent period. The details of these assumptions are set out in note 12.
Cash and cash equivalentsCash and cash equivalents comprise cash held by the Group and short term on demand bank deposits with an original maturity of three months or less. The assets are subject to an insignificant risk of change in value. The carrying amount of these assets approximates to their fair value.
Trade and other receivablesTrade and other receivables are initially recognised at fair value, plus transaction costs. Subsequently they are measured at amortised cost using the effective interest rate method.
InventoriesInventories are valued on a first-in, first-out basis at the lower of cost and net realisable value. Cost includes materials and direct labour. Net realisable value is based on estimated selling price, less further costs expected to be incurred to completion and disposal. Provision is made for obsolete and slow moving and defective items where applicable.
Trade and other payablesTrade and other payables, including loans and other borrowings are initially recognised at fair value, net of direct issue costs. Subsequently they are measured at amortised cost using the effective interest rate method.
Impairment of non-financial assetsAt each balance sheet date, the Group reviews the carrying amount of its property, plant and equipment and intangible assets to determine whether there is any indication that those assets have suffered an impairment loss. If any such indication exists, the recoverable amount of the asset is estimated in order to determine the extent of the impairment loss (if any). Where the asset does not generate cash flows that are independent from other assets, the Group estimates the recoverable amount of the cash-generating unit to which the asset belongs.
Recoverable amount is the higher of fair value less costs to sell and value in use. In assessing value in use, the estimated future cash flows are discounted to their present value using a pre-tax discount rate that reflects current market assessments of the time value of money and the risks specific to the asset for which the estimates of future cash flows have not been adjusted. If the recoverable amount of an asset (or cash-generating unit) is estimated to be less than its carrying amount, the carrying amount of the asset (or cash-generating unit) is reduced to its recoverable amount. With the exception of goodwill, all assets are subsequently reassessed for indications that an impairment loss previously recognised may no longer exist. An impairment charge that has been recognised is reversed if the cash-generating unit’s recoverable amount exceeds its carrying amount.
Notes to the Financial Statements for the year ended 30 June 2020
continued
TRIS
TEL P
LC A
NNUA
L RE
PORT
& A
CCOU
NTS
YEAR
END
ED 3
0 JU
NE 2
020
56
1. Accounting policies continued
EquityEquity comprises the following:
• ‘Share capital’ represents the nominal value of equity shares.
• ‘Share premium’ represents the excess over nominal value of the fair value of consideration received for equity shares, net of expenses of the share issue.
• ‘Merger reserve’ represents merger relief taken in respect of the premium paid on the issue of shares to finance the acquisition of a subsidiary undertaking.
• ‘Retained earnings’ represents all current and prior period profits, losses and share-based payments.
• ‘Foreign exchange reserve’ comprises foreign currency translation of the financial statements of the Group’s foreign entities into GBP.
DividendsFinal dividends are recognised as a liability in the Group’s financial statements in the period in which the dividends are approved by shareholders, while interim dividends are recognised in the period in which the dividends are paid.
Defined contribution pension obligationFor money purchase schemes the amount charged to the income statement in respect of pension costs and other post-retirement benefits is the contributions payable in the year. Differences between contributions payable in the year and the contributions actually paid are shown as either accruals or prepayments in the statement of financial position.
Share-based paymentsIn accordance with IFRS 2, the fair value of equity-settled share-based payments to employees is determined at the date of grant and is expensed on a straight-line basis over the vesting period on the Group’s estimate of shares or options that will eventually vest. In the case of options granted, the fair value is measured by using either the Monte Carlo or Black-Scholes pricing model. Further details are set out in note 24.
Where options are granted over the parent company shares to employees of subsidiary undertakings, the cost of investment in the subsidiary is increased by the fair value of the options granted with a corresponding entry included in equity and assessed for impairment in accordance with IAS 36.
The proceeds received net of any directly attributable transaction costs are credited to share capital (nominal value) and share premium when the options are exercised.
Financial instrumentsInitial recognitionIFRS 9 – Financial Instruments is effective for accounting periods beginning on or after 1 January 2018 and replaces existing accounting standard IAS 39 Financial Instruments: Recognition and Measurement. IFRS 9 addresses the classification, measurement and derecognition of financial assets and financial liabilities and introduces the new rules for hedge accounting, a new impairment model for financial assets and early recognition of expected credit losses. The Group adopted IFRS 9 on 1 July 2018. The Group does not have a material history of credit losses, or is it involved in financial instruments, therefore the application of IFRS 9 has not had a material effect on the financial statements.
Financial assets and financial liabilities comprise all assets and liabilities reflected in the statement of financial position, although excluding property, plant and equipment, investment properties, intangible assets, deferred tax assets, prepayments, deferred tax liabilities and employee benefits plan.
The Group recognises financial assets and financial liabilities in the statement of financial position when, and only when, the Group becomes party to the contractual provisions of the financial instrument.
Financial assets are initially recognised at fair value. Financial liabilities are initially recognised at fair value, representing the proceeds received net of premiums, discounts and transaction costs that are directly attributable to the financial liability.
All regular way purchases and sales of financial assets and financial liabilities classified as fair value through profit or loss (‘FVTPL’) are recognised on the trade date, i.e. the date on which the Group commits to purchase or sell the financial assets or financial liabilities. All regular way purchases and sales of other financial assets and financial liabilities are recognised on the settlement date, i.e. the date on which the asset or liability is received from or delivered to the counterparty. Regular way purchases or sales are purchases or sales of financial assets that require delivery within the time frame generally established by regulation or convention in the market place.
Subsequent to initial measurement, financial assets and financial liabilities are measured at either amortised cost or fair value.

Notes to the Financial Statements for the year ended 30 June 2020
continued
57
1. Accounting policies continued
Classification and measurementFinancial instruments are classified at inception into one of the following categories, which then determine the subsequent measurement methodology:
Financial assets are classified into one of the following three categories:
• financial assets at amortised cost;
• financial assets at fair value through other comprehensive income (FVTOCI); or
• financial assets at fair value through the profit or loss (FVTPL).
Financial liabilities are classified into one of the following two categories:
• financial liabilities at amortised cost; or
• financial liabilities at fair value through the profit or loss (FVTPL).
The classification and the basis for measurement are subject to the Group’s business model for managing the financial assets and the contractual cash-flow characteristics of the financial assets, as detailed below:
Financial assets at amortised costA financial asset is measured at amortised cost if it meets both of the following conditions and is not designated as at FVTPL:
• the assets are held within a business model whose objective is to hold assets in order to collect contractual cash flows; and
• the contractual terms of the financial assets give rise on specified dates to cash flows that are solely payments of principal and interest on the principal amount outstanding.
If either of the above two criteria is not met, the financial assets are classified and measured at fair value through the profit or loss (FVTPL).
If a financial asset meets the amortised cost criteria, the Group may choose to designate the financial asset at FVTPL. Such an election is irrevocable and applicable only if the FVTPL classification significantly reduces a measurement or recognition inconsistency.
Financial assets at fair value through the profit or loss (FVTPL)Financial assets not otherwise classified above are classified and measured as FVTPL.
Financial liabilities at amortised costAll financial liabilities, other than those classified as financial liabilities at FVTPL, are measured at amortised cost using the effective interest-rate method.
Financial liabilities at fair value through the profit or lossFinancial liabilities not measured at amortised cost are classified and measured at FVTPL.
Impairment of financial assetsThe Group recognises loss allowances for expected credit losses (ECL) on financial instruments that are not measured at FVPTL, namely accounts and other receivables.
The Group classifies its financial instruments into stage 1, stage 2 and stage 3, based on the applied impairment methodology, as described below:
Stage 1: for financial instruments where there has not been a significant increase in credit risk since initial recognition and that are not credit-impaired on origination, the Group recognises an allowance based on the 12-month ECL.
Stage 2: for financial instruments where there has been a significant increase in credit risk since initial recognition but they are not credit-impaired, the Group recognises an allowance for the lifetime ECL.
Stage 3: for credit-impaired financial instruments, the Group recognises the lifetime ECL.
The Group measures loss allowances at an amount equal to the lifetime ECL, except for the following, for which they are measured as a 12-month ECL:
• debt securities that are determined to have a low credit risk (equivalent to investment grade rating) at the reporting date; and
• other financial instruments on which the credit risk has not increased significantly since their initial recognition.

Notes to the Financial Statements for the year ended 30 June 2020
continued
TRIS
TEL P
LC A
NNUA
L RE
PORT
& A
CCOU
NTS
YEAR
END
ED 3
0 JU
NE 2
020
58
1. Accounting policies continued
The Group considers a debt security to have low credit risk when their credit risk rating is equivalent to the globally understood definition of ‘investment grade’.
A 12-month ECL is the portion of the lifetime ECL that represents the ECLs that result from default events on a financial instrument that are possible within 12 months from the reporting date.
Provisions for credit-impairment are recognised in the statement of income and are reflected in accumulated provision balances against each relevant financial instruments balance.
2. Critical accounting judgements and key sources of estimation uncertainty
Significant judgments and estimates The preparation of financial statements in conformity with IFRS requires management to make judgments, estimates and assumptions that affect the application of policies and reported amounts of assets and liabilities, income and expenses. The estimates and associated assumptions are based on historical experience and various other factors that are believed to be reasonable under the circumstances, the results of which form the basis of making the judgments about carrying values of assets and liabilities that are not readily apparent from other sources. Actual results may differ from these estimates.
The estimates and underlying assumptions are reviewed on an ongoing basis. Revisions to accounting estimates are recognised in the period in which the estimate is revised if the revision affects only that period, or in the period of the revision and future periods if the revision affects both current and future periods. The Directors consider that the key judgements and sources of estimation made in preparation of the financial statements relate to the following:
Research and development Research expenses are defined as costs incurred with the prospect of gaining new scientific knowledge and technical knowledge and understanding. Development expenses are defined as application of research findings or specialist knowledge for the development of new or substantially improved products or application of the product. Research and development expenses are incurred for in-house development as well as numerous collaborations with third parties.
Research costs are not capitalised. Development costs are capitalised under closely defined conditions and only if there is reasonable certainty of receiving future cash flows in relation to the development. These judgements are based on the information available at each balance sheet date. Economic success of any product development is uncertain at the time of recognition as judgement is required when distinguishing the research and development phases of new product design projects, and determining whether the recognition requirements for capitalisation of the development costs are met. Specific recognition requirements are detailed in note 1.
IFRS 16 – LeasesIFRS 16 requires entities to make certain judgements and estimations, and those that are significant to the Group are disclosed below:
• Determining whether or not a contract contains a lease. On transition, the Group elected to apply the practical expedient to grandfather the assessment of which transaction contained leases (see note 26). The detail of the policy applied post 1 July 2019 is given in note 1.
• Establishing whether or not it is reasonably certain that an extension option will be exercised. When the Group has the option to extend a lease, management uses its judgement to determine whether or not an option would be reasonably certain to be exercised. Management considers all facts and circumstances including their past practice and any cost that will be incurred to change the asset if an option to extend is not taken, to help them determine the lease term. The same consideration is given as to whether or not it is reasonably certain that a termination option will not be exercised.
• Calculating the appropriate discount rate to use. The details of the discount rates applied are given in note 26. Sensitivity analysis has been carried out and a 1% increase in the discount rate applied caused a decrease of £0.311m in the value of the lease liability at the year end and a 1% decrease in the discount rate caused a £0.340m increase in value.
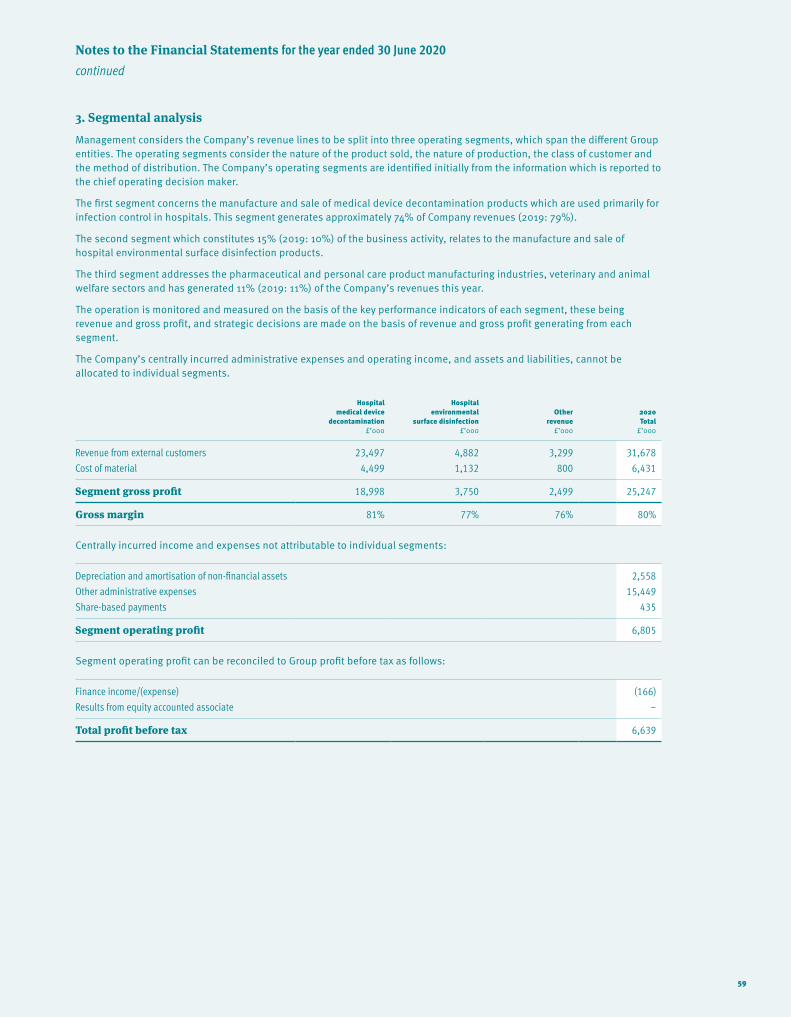
Notes to the Financial Statements for the year ended 30 June 2020
continued
59
3. Segmental analysis
Management considers the Company’s revenue lines to be split into three operating segments, which span the different Group entities. The operating segments consider the nature of the product sold, the nature of production, the class of customer and the method of distribution. The Company’s operating segments are identified initially from the information which is reported to the chief operating decision maker.
The first segment concerns the manufacture and sale of medical device decontamination products which are used primarily for infection control in hospitals. This segment generates approximately 74% of Company revenues (2019: 79%).
The second segment which constitutes 15% (2019: 10%) of the business activity, relates to the manufacture and sale of hospital environmental surface disinfection products.
The third segment addresses the pharmaceutical and personal care product manufacturing industries, veterinary and animal welfare sectors and has generated 11% (2019: 11%) of the Company’s revenues this year.
The operation is monitored and measured on the basis of the key performance indicators of each segment, these being revenue and gross profit, and strategic decisions are made on the basis of revenue and gross profit generating from each segment.
The Company’s centrally incurred administrative expenses and operating income, and assets and liabilities, cannot be allocated to individual segments.
Hospital medical device
decontamination£’000
Hospital environmental
surface disinfection£’000
Other revenue
£’000
2020Total
£’000
Revenue from external customers 23,497 4,882 3,299 31,678
Cost of material 4,499 1,132 800 6,431
Segment gross profit 18,998 3,750 2,499 25,247
Gross margin 81% 77% 76% 80%
Centrally incurred income and expenses not attributable to individual segments:
Depreciation and amortisation of non-financial assets 2,558
Other administrative expenses 15,449
Share-based payments 435
Segment operating profit 6,805
Segment operating profit can be reconciled to Group profit before tax as follows:
Finance income/(expense) (166)
Results from equity accounted associate –
Total profit before tax 6,639

Notes to the Financial Statements for the year ended 30 June 2020
continued
TRIS
TEL P
LC A
NNUA
L RE
PORT
& A
CCOU
NTS
YEAR
END
ED 3
0 JU
NE 2
020
60
3. Segmental analysis continued
Hospital medical device
decontamination£’000
Hospital environmental
surface disinfection£’000
Other revenue
£’000
2019Total
£’000
Revenue from external customers 20,767 2,613 2,789 26,169
Cost of material 4,000 804 700 5,504
Segment gross profit 16,767 1,809 2,089 20,665
Gross margin 81% 69% 75% 79%
Centrally incurred income and expenses not attributable to individual segments:
Depreciation and amortisation of non-financial assets 1,537
Other administrative expenses 13,579
Share-based payments 852
Segment operating profit 4,697
Segment operating profit can be reconciled to Group profit before tax as follows:
Finance income 4
Results from equity accounted associate 45
Total profit before tax 4,746
The Group’s revenues from external customers are divided into the following geographical areas:
Geography
Hospital medical device
decontamination£’000
Hospital environmental
surface disinfection£’000
Other revenue
£’000
2020Total
£’000
UK and Europe direct 16,768 3,891 2,528 23,187
APAC region direct 4,613 231 374 5,218
Worldwide distributors 2,116 760 397 3,273
Total revenues 23,497 4,882 3,299 31,678
Geography
Hospital medical device
decontamination£’000
Hospital environmental
surface disinfection£’000
Other revenue
£’000
2019Total
£’000
UK and Europe direct 14,121 2,283 2,087 18,491
APAC region direct 4,141 122 274 4,537
Worldwide distributors 2,505 208 428 3,141
Total revenues 20,767 2,613 2,789 26,169
Revenues from external customers in the Company’s domicile (United Kingdom), as well as its other major markets (Rest of the World) have been identified on the basis of internal management reporting systems, which are also used for VAT purposes.
Hospital medical device decontamination revenues were derived from a large number of customers, but include £6.487m from a single customer which makes up 22% of this segment’s revenue (2019: £6.595m, being 28%). Other revenues were derived from a number of customers, with the largest customer accountable for £0.160m, which represents 19% of revenue for that segment (2019: £0.139m, 17% from a single customer).
During the year 20.5% of the Group’s total revenues were earned from a single customer (2019: 25.2%).

Notes to the Financial Statements for the year ended 30 June 2020
continued
61
3. Segmental analysis continued
The following table provides further information on the Group’s revenues:
Hospital medical device
decontamination£’000
Hospital environmental
surface disinfection£’000
Other revenue
£’000
2020Total
£’000
Revenue recognised at a point in time 23,451 4,882 3,299 31,632
Revenue recognised over time 46 – – 46
Total revenues 23,497 4,882 3,299 31,678
Hospital medical device
decontamination£’000
Hospital environmental
surface disinfection£’000
Other revenue
£’000
2019Total
£’000
Revenue recognised at a point in time 20,740 2,613 2,789 26,142
Revenue recognised over time 27 – – 27
Total revenues 20,767 2,613 2,789 26,169
The Group’s non-current assets (excluding deferred tax) are divided into the following geographical areas and by segment:
Geography2020
£’0002019
£’000
UK and Europe 16,982 11,259
APAC region 844 871
Worldwide distributors 4,311 2,951
Non-current assets 22,137 15,081
Segment2020
£’0002019
£’000
Hospital medical device decontaminationHospital environmental surface disinfectionOther revenue
14,082 10,959
4,851 2,132
3,204 1,990
22,137 15,081
The Group’s current assets and liabilities are shown, where identifiable, by segment, below:
2020
Hospital medical device
decontamination£’000
Hospital environmental
surface disinfection£’000
Other revenue
£’000Group£’000
Total£’000
Segment assets 13,934 3,366 2,459 (2,506) 17,253
Segment liabilities (5,389) (1,131) (652) 501 (6,671)
2019
Segment assets 10,290 1,367 1,882 (1,042) 12,497
Segment liabilities (3,871) (451) (562) 506 (4,378)

Notes to the Financial Statements for the year ended 30 June 2020
continued
TRIS
TEL P
LC A
NNUA
L RE
PORT
& A
CCOU
NTS
YEAR
END
ED 3
0 JU
NE 2
020
62
4. Operating profit
The profit before tax is stated after charging/(crediting):
2020£’000
2019£’000
Cost of inventories recognised as an expense 6,015 5,329
Depreciation – owned assets 598 584
Depreciation – leased assets 692 –
Loss on disposal of property, plant and equipment 54 21
Patents, licences and proprietary technology amortisation 416 265
Development costs, customer and supplier relationship amortisation 641 547
Computer software and website amortisation 144 74
Impairment of goodwill 67 67
Gain on fair value of investment (111) (98)
Auditor's remuneration 236 159
Foreign exchange loss 36 79
Operating lease rentals – land and buildings – 397
Operating lease rentals – vehicles and equipment – 144
Research costs expensed 458 739
Earnings before interest, tax, depreciation and amortisation are reconciled to profit for the year as follows:
Reconciliation of EBITDA2020
£’0002019
£’000
Earnings before, interest, tax, depreciation and amortisation 9,363 6,279
Depreciation, amortisation and impairments (2,558) (1,537)
Net finance (cost)/income (166) 4
Profit before tax 6,639 4,746
Taxation (1,539) (715)
Profit for the year 5,100 4,031
Reconciliation of adjusted pre-tax profit
Profit before tax 6,639 4,746
Share-based payment 435 852
Adjusted pre-tax profit 7,074 5,598
Revenue for the year 31,678 26,169
Pre-tax profit margin 21% 18%
Adjusted pre-tax profit margin 22% 21%
5. Finance income and costs
Net finance cost/income2020
£’0002019
£’000
Interest income on bank deposits 1 5
Bank interest – (1)
Interest on lease liabilities (167) –
Net finance cost/income (166) 4
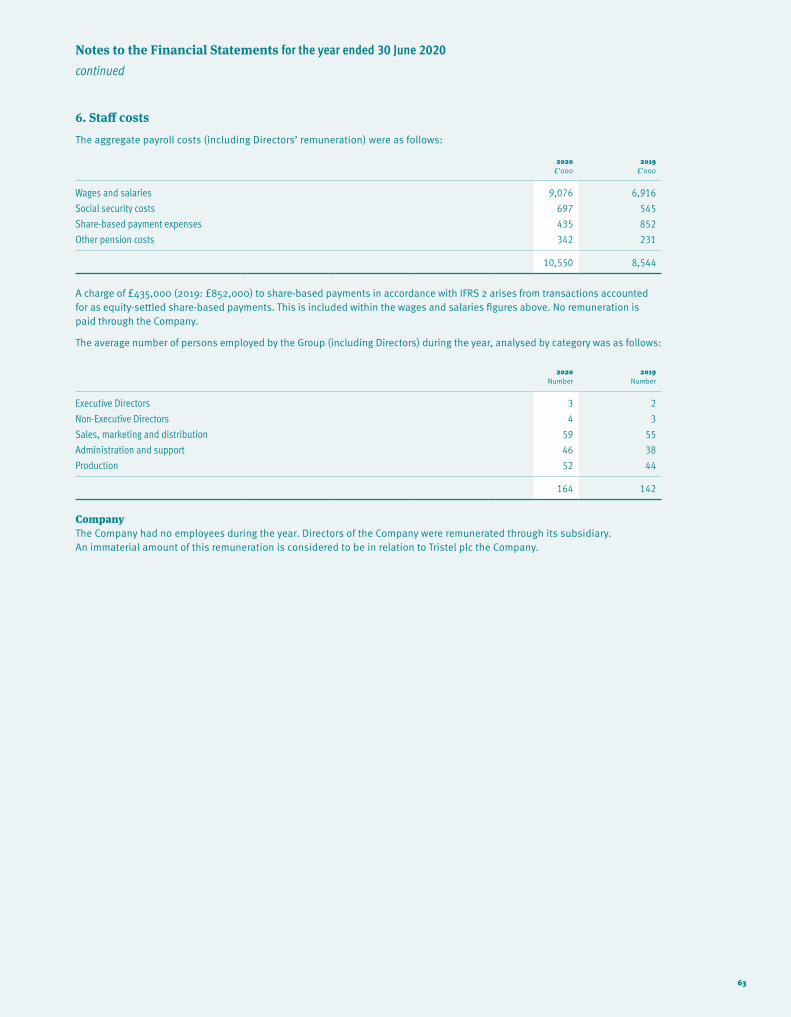
Notes to the Financial Statements for the year ended 30 June 2020
continued
63
6. Staff costs
The aggregate payroll costs (including Directors’ remuneration) were as follows:
2020£’000
2019£’000
Wages and salaries 9,076 6,916
Social security costs 697 545
Share-based payment expenses 435 852
Other pension costs 342 231
10,550 8,544
A charge of £435,000 (2019: £852,000) to share-based payments in accordance with IFRS 2 arises from transactions accounted for as equity-settled share-based payments. This is included within the wages and salaries figures above. No remuneration is paid through the Company.
The average number of persons employed by the Group (including Directors) during the year, analysed by category was as follows:
2020Number
2019Number
Executive Directors 3 2
Non-Executive Directors 4 3
Sales, marketing and distribution 59 55
Administration and support 46 38
Production 52 44
164 142
CompanyThe Company had no employees during the year. Directors of the Company were remunerated through its subsidiary. An immaterial amount of this remuneration is considered to be in relation to Tristel plc the Company.

Notes to the Financial Statements for the year ended 30 June 2020
continued
TRIS
TEL P
LC A
NNUA
L RE
PORT
& A
CCOU
NTS
YEAR
END
ED 3
0 JU
NE 2
020
64
7. Directors’ remuneration
The Directors’ remuneration for the year was as follows:
2020£’000
2019£’000
Remuneration 1,052 824
Contributions paid to money purchase schemes 93 62
Directors' share-based payments 120 615
1,265 1,501
The outstanding share options held by Directors at the year end total 1,208,629 (2019: 2,041,152). See table on page 26 for details.
During the year the number of Directors who were receiving retirement benefits and share incentives was as follows:
2020Number
2019Number
Received or were entitled to receive shares under long-term incentive schemes 4 4
Exercised share options 1 1
Accruing benefits under money purchase pension scheme 3 2
In respect of the highest paid Director:
2020£’000
2019£’000
Remuneration 273 307
Company contributions to money purchase pension schemes 28 35
Gain on exercise of options 677 1,300
978 1,642
During the year the highest paid Director exercised share options.
8. Auditors’ remuneration
2020£’000
2019£’000
Audit of these financial statements 152 134
Audit of the financial statements of subsidiaries of the Company pursuant to legislation 80 21
232 155
Other fees to auditors2020
£’0002019
£’000
Audit-related assurance services: review of half year statements 4 4
Taxation compliance services 35 69
All other assurance services – 22
39 95

Notes to the Financial Statements for the year ended 30 June 2020
continued
65
9. Income tax
Tax charged in the income statement:
2020£’000
2019£’000
Current taxationOverseas tax 1,223 798
UK corporation tax 265 221
UK corporation tax adjustment to prior periods (5) (16)
1,483 1,003
Deferred taxArising from origination and reversal of temporary differences (152) (322)
UK deferred tax adjustment to prior periods 286 (20)
Tax rate effect (78) 54
Tax expense in the income statement 1,539 715
The tax on profit before tax for the year is lower than the standard rate of corporation tax in the UK (2019 – lower than the standard rate of corporation tax in the UK) of 19% (2019 – 19%).
The differences are reconciled below:
2020£’000
2019£’000
Profit before tax 6,639 4,746
Corporation tax at standard rate 1,261 902
Adjustment in respect of prior years 281 (36)
Income not taxable (21) (18)
Expenses not deductible for tax purposes 23 68
(Decrease) from effect of patent box (134) (190)
Increase (decrease) from effect of foreign tax rates 342 225
Tax rate differences (118) (85)
Enhanced relief on qualifying scientific research expenditure (95) (151)
Total tax charge 1,539 715
Current tax liability
2020 Group£’000
2019 Group£’000
2020 Company
£’000
2019 Company
£’000
Corporation tax at 30 June 1,182 839 (6) (6)

Notes to the Financial Statements for the year ended 30 June 2020
continued
TRIS
TEL P
LC A
NNUA
L RE
PORT
& A
CCOU
NTS
YEAR
END
ED 3
0 JU
NE 2
020
66
9. Income tax continued
Deferred tax – Group
2020Asset£’000
Liability£’000
Net deferred tax
£’000
Accelerated tax depreciation – (105) (105)
Acquired in business combinations – (510) (510)
Share-based payment 1,487 – 1,487
IFRS 16 transition 57 – 57
1,544 (615) 929
2019
Accelerated tax depreciation – (97) (97)
Acquired in business combinations – (453) (453)
Share-based payment 709 – 709
709 (550) 159
Deferred tax movements during the current year:
At 1 July 2019
£’000
Recognised in income
£’000
Recognised in equity
£’000
Acquired in business
combinations£’000
At30 June 2020
£’000
Accelerated tax depreciation (97) (8) – – (105)
Recognition of intangibles (453) 78 – (135) (510)
IFRS 16 transition – – 57 – 57
Share-based payment 709 160 618 – 1,487
Share-based payment prior year – (286) 286 – –
Net tax assets/(liabilities) 159 (56) 961 (135) 929
Deferred tax movements during the prior year:
At 1 July 2018
£’000
Recognised in income
£’000
Acquired in business
combinations£’000
At30 June 2019
£’000
Accelerated tax depreciation (128) 31 – (97)
Recognition of intangibles (197) 67 (323) (453)
Share-based payment 519 190 – 709
Net tax assets/(liabilities) 194 288 (323) 159

Notes to the Financial Statements for the year ended 30 June 2020
continued
67
9. Income tax continued
Recognised deferred tax (liability)/assetDeferred tax (liabilities)/assets are attributable to the following:
Fixed asset timing
differences £’000
Deferred tax on acquired intangibles
£’000
Other temporary
differences£’000
Group total
£’000
Company fixed asset timing
differences £’000
Balance at 30 June 2018 (128) (197) 519 194 (9)
Arising on acquisition – (323) – (323) –
Credited to the income statement for the year 31 67 190 288 –
Balance at 30 June 2019 (97) (453) 709 159 (9)
Arising on acquisition – (135) – (135) –
Credited to the income statement for the year (8) 78 160 230 –
Credited to equity for the year – – 675 675 –
Balance at 30 June 2020 (105) (510) 1,544 929 (9)
Other temporary differences include tax relief on research and development spend.
Net deferred tax asset/(liability)Group £’000
Company £’000
Deferred tax liability (615) (9)
Deferred tax asset 1,544 –
Balance at 30 June 2020 929 (9)
Net deferred tax asset/(liability)Group £’000
Company £’000
Deferred tax liability (550) (9)
Deferred tax asset 709 –
Balance at 30 June 2019 159 (9)

Notes to the Financial Statements for the year ended 30 June 2020
continued
TRIS
TEL P
LC A
NNUA
L RE
PORT
& A
CCOU
NTS
YEAR
END
ED 3
0 JU
NE 2
020
68
10. Property, plant and equipment
Group
Improvements to property
£’000
Furniture, fittings and equipment
£’000
Motor vehicles
£’000
Other property, plant and
equipment£’000
Total£’000
Cost or valuationAt 1 July 2018 1,778 140 349 1,919 4,186
Additions 297 8 44 414 763
Acquired through business combinations – – 27 13 40
Disposals – (45) (45) (645) (735)
Foreign exchange movements – – 15 16 31
At 30 June 2019 2,075 103 390 1,717 4,285
At 1 July 2019 2,075 103 390 1,717 4,285
Additions 1,205 192 58 315 1,770
Acquired through business combinations – – – 2 2
Disposals (54) (1) (14) (34) (103)
Foreign exchange movements – – 10 6 16
At 30 June 2020 3,226 294 444 2,006 5,970
DepreciationAt 1 July 2018 1,365 92 160 1,241 2,858
Charge for year 90 24 64 406 584
Eliminated on disposal – (45) (25) (559) (629)
Foreign exchange movements – 1 1 4 6
At 30 June 2019 1,455 72 200 1,092 2,819
At 1 July 2019 1,455 72 200 1,092 2,819
Charge for the year 115 42 61 380 598
Eliminated on disposal (30) – – (17) (47)
Foreign exchange movements – – 7 6 13
At 30 June 2020 1,540 114 268 1,461 3,383
Carrying amountAt 30 June 2020 1,686 180 176 545 2,587
At 30 June 2019 620 31 190 625 1,466
At 1 July 2018 413 48 189 678 1,328
Property, plant and equipment comprise owned and leased assets that do not meet the definition of investment property.

Notes to the Financial Statements for the year ended 30 June 2020
continued
69
10. Property, plant and equipment continued
Right of use assetsThe Group leases many assets including land and buildings, vehicles and plant and machinery. Information about leases for which the Group is a lessee is presented below.
2020Property
£’000Vehicles
£’000
Office equipment
£’000
Total
£’000
Balance at 1 July 3,542 120 276 3,938
Additions 3,161 – – 3,161
Disposals (914) – – (914)
Depreciation (556) (54) (82) (692)
Balance at 30 June 5,233 66 194 5,493
2020 Total
£’000
Property, plant and equipment owed 2,587
Right of use assets, except for investment property 5,493
8,080
CompanyNo property, plant or equipment is held by the Company.
11. Lease liabilities
Maturity analysis – contractual undiscounted cash flows
2020 Total
£’000
Less than one year 1,161
One to five years 2,721
More than five years 4,213
Total undiscounted lease liabilities at 30 June 2020 8,095
Lease liabilities included in the statement of financial position at 30 JuneCurrent 817
Non-current 5,185
6,002
Amounts recognised in profit or loss
2020 Total
£’000
Interest on lease liabilities 165
Expenses relating to short term leases –
Expenses relating to low value assets –
Amounts recognised in the statement of cashflowsTotal cash outflow for leases 779

Notes to the Financial Statements for the year ended 30 June 2020
continued
TRIS
TEL P
LC A
NNUA
L RE
PORT
& A
CCOU
NTS
YEAR
END
ED 3
0 JU
NE 2
020
70
12. Goodwill
Group GoodwillGoodwill in the year relates to the acquisition of Tristel Italia Srl, our Italian distributor (see below). The activity is separately identifiable as the operation of Tristel Italia and forms a single cash-generating unit within Human Healthcare. The aim of the acquisition was to gain full control of the Italian market for Tristel products and to shape the strategy for further development of sales, whilst bringing the distributor margin in house.
Management felt that a direct presence in a significant market, such as Italy would facilitate further growth, both in sales and profit before tax. This was considered during the valuation of the CGU and gave rise to the reported goodwill, shown below.
The balance of the acquired goodwill is in respect of Scorcher Idea Limited, formerly Tristel Technologies Limited, AshMed Pty and Tristel Belgium, Tristel France and Tristel Netherlands.
Goodwill£’000
Cost or valuationAt 1 July 2018 1,244
Acquired through business combinations 4,184
Foreign exchange movements 35
At 30 June 2019 5,463
At 1 July 2019 5,463
Acquired through business combinations 439
Foreign exchange movements 104
At 30 June 2020 6,006
ImpairmentAt 1 July 2018 246
Impairment 67
At 30 June 2019 313
At 1 July 2019 313
Impairment 67
At 30 June 2020 380
Carrying amountAt 30 June 2020 5,626
At 30 June 2019 5,150
The Group tests annually for impairment, or more frequently if there are indications that goodwill might be impaired.
The recoverable amount of all cash-generating units (CGUs) is determined from value in use calculations. Value in use is calculated as the net present value of the projected, risk-adjusted, pre-tax cash flows of the CGU in which the goodwill is contained. The key assumptions for the value in use calculations are those regarding discount rates, growth rates and expected changes to selling prices and direct costs during the period. Management estimates discount rates using the Group’s pre-tax weighted average cost of capital which was calculated at 21%. Management has considered the effects on the weighted average cost of capital of currency, pricing and specific country risk. Growth rates are based upon industry growth forecasts within the CGU, likewise, changes in selling prices and direct costs are based on recent history and expectations of future changes in the market.
The Group prepares cash-flow forecasts over a five year period and derived from the most recent financial budgets approved by management. Cash-flow forecasts for each CGU are considered, and where deemed appropriate, adjusted to reflect risks specific to the CGU. Cashflows beyond this period were extrapolated using a terminal growth rate of 1%, which is prudent when compared to the compound annual growth rate in the global infection control market. Where sensitivity analysis has been carried out, it has been via the reduction of expected revenue growth rate and increase in expected cost growth rate.

Notes to the Financial Statements for the year ended 30 June 2020
continued
71
12. Goodwill continued
Scorcher Idea LimitedOn 30 April 2010 the activities of Scorcher Idea Limited (formerly NTL) were hived over to Tristel Solutions Limited. The relevant revenue lines are now separately identifiable within Human Healthcare and form a single cash-generating unit within the Group’s management reporting. For Scorcher, the rate used to discount the forecast cash flows for goodwill is 21%. With a zero sales growth rate, the net present value of future cashflows exceeds the carrying value of £0.40m by £2.16m. However, based on the expectation that revenue is forecast to decline at a rate of 10% year-on-year, an impairment of £0.1m has been recorded.
AshmedIn August 2016, the Group acquired the trade and assets of AshMed Pty, our Australian distributor’s business for £1.1m including a contribution to legal costs, giving rise to goodwill of £0.465m and a gain on settlement of the distribution agreement of £0.041m. The separate intangibles were recognised in full along with a deferred tax liability arising on the transaction of £0.242m. The total acquisition related costs amount to £0.059m and were included in Administrative expenses in the Consolidated Income Statement for the year ended 30 June 2017. For Ashmed, the key assumptions used to determine the recoverable value of goodwill are those regarding discount rates and growth rates. Management has estimated the discount rate as a market-derived WACC of 21%. Growth rates are based upon industry growth forecasts within the CGU and on recent history and expectations of future changes in the market. The net present value of future cashflows exceeds the carrying value of £1.37m by £5.72m, as such no impairment has been recorded.
Ecomed GroupIn November 2018, the Group acquired Ecomed Services N.V. (Belgium), Ecomed Nederland B.V. (Netherlands) and Ecomed France SARL (France), together the ‘Ecomed Group’, our European distributor’s business. Each entity is considered to be a separate cash-generating unit. The Group was acquired for a total consideration of £6.4m, of which an initial transaction of £3m was paid in cash and £1.4m from the issue of 573,860 ordinary shares (the ‘Consideration Shares’). The Consideration Shares were issued at 242.7 pence per share, the average price during the 30-day period to 15 November 2018. A balancing payment of £0.5m was made in cash in January 2019 following completion.
Additional contingent consideration of £1.6m was paid in February 2019 based upon final audited EBITDA for the calendar year 2018 exceeding €0.84m, and sales growth of at least 15% for the year ending 30 June 2019 being achieved. The contingent consideration was paid in a combination of cash and ordinary shares with the allocation between cash (£1.2m) and 135,915 ordinary shares (£0.4m) decided by the Vendors. There was no change in the fair value of the investment between acquisition and settlement.
The transaction gave rise to total goodwill of £4.1m (Belgium £2.2m, France £1.6m and The Netherlands £0.3m). The separate intangibles were recognised in full along with a deferred tax liability of £0.323m. The total acquisition related costs amount to £0.277m and were included in Administrative expenses in the Consolidated Income Statement for the year ended 30 June 2019.
For Ecomed, the key assumptions used to determine the recoverable value of goodwill are those regarding discount rates and growth rates. Management estimates discount rates using the Group’s pre-tax weighted average cost of capital, adjusted to reflect the impact of the time value of money, tax effects and risks associated with the CGU, which was calculated at 21%. Growth rates are based upon industry growth forecasts within the CGU and on recent history and expectations of future changes in the market. Cashflows over five years were considered and beyond this period cashflows were extrapolated using a terminal growth rate of 1%, which is prudent when compared to the compound annual growth rate in the global infection control market. The net present value of future cashflows for each cash-generating unit exceeds its carrying value (Group total of £6.71m), by £6.28m as such no impairment has been recorded.
Tristel Italia SrlIn July 2019, the Group acquired Tristel Italia Srl, its Italian distributor’s business for a total consideration of £0.708m, of which an initial amount of £0.595m was paid in cash. The remaining payment (the ‘deferred consideration’) is payable in two tranches and is dependant on the sales amounts in financial year 2020 and 2021 exceeding set targets. A payment of £0.036m was made at the end of August 2020 following the successful partial completion of the first tranche.
The transaction gave rise to goodwill of £0.439m. The separate intangibles were recognised in full along with a deferred tax liability of £0.135m. The previous 20% holding was fair valued upon acquisition of the remaining 80% and an increase in the investment of £0.111m was recognised through profit and loss. The total acquisition related costs amount to £0.060m and were included in Administrative expenses in the Consolidated Income Statement for the year ended 30 June 2020.
For Tristel Italia, the key assumptions used to determine the recoverable value of goodwill are those regarding discount rates and growth rates. Management estimates discount rates using the Group’s pre-tax weighted average cost of capital, adjusted to reflect the impact of the time value of money, tax effects and risks associated with the CGU, which was calculated at 21%. Growth rates are based upon industry growth forecasts within the CGU and on recent history and expectations of future changes in the market. Cashflows over five years were considered and beyond this period cashflows were extrapolated using a terminal growth rate of 1%, which is prudent when compared to the compound annual growth rate in the global infection control market. The net present value of future cashflows exceeds the carrying value of £1.07m by £1.91m, as such no impairment has been recorded.
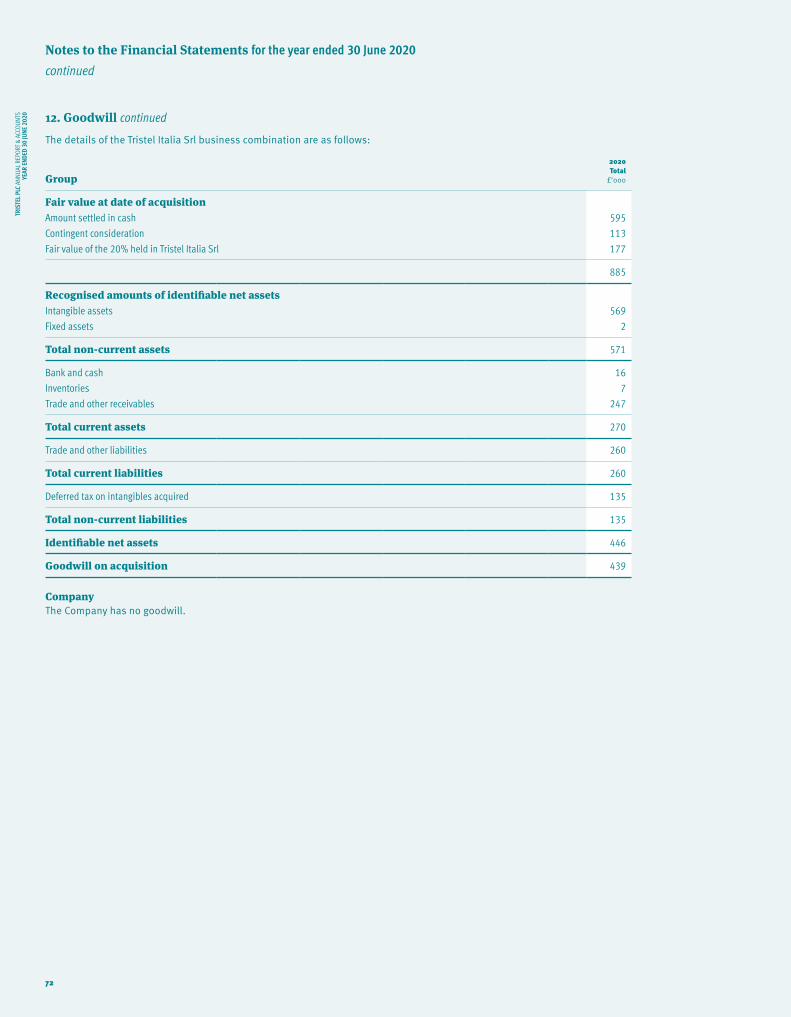
Notes to the Financial Statements for the year ended 30 June 2020
continued
TRIS
TEL P
LC A
NNUA
L RE
PORT
& A
CCOU
NTS
YEAR
END
ED 3
0 JU
NE 2
020
72
12. Goodwill continued
The details of the Tristel Italia Srl business combination are as follows:
Group
2020 Total
£’000
Fair value at date of acquisitionAmount settled in cash 595
Contingent consideration 113
Fair value of the 20% held in Tristel Italia Srl 177
885
Recognised amounts of identifiable net assetsIntangible assets 569
Fixed assets 2
Total non-current assets 571
Bank and cash 16
Inventories 7
Trade and other receivables 247
Total current assets 270
Trade and other liabilities 260
Total current liabilities 260
Deferred tax on intangibles acquired 135
Total non-current liabilities 135
Identifiable net assets 446
Goodwill on acquisition 439
CompanyThe Company has no goodwill.

Notes to the Financial Statements for the year ended 30 June 2020
continued
73
13. Intangible assets
Group
Patents, licences and proprietary
technology£’000
Customer and supplier
relationships£’000
Computer software and
website£’000
Development of marketable
products£’000
Total£’000
Cost or valuationAt 1 July 2018 5,674 983 435 4,626 11,718
Additions 130 – 160 379 669
Acquired through business combinations 63 1,780 – – 1,843
Disposals (12) – – (2) (14)
Foreign exchange movements 1 27 – – 28
At 30 June 2019 5,856 2,790 595 5,003 14,244
At 1 July 2019 5,856 2,790 595 5,003 14,244
Additions 93 – 88 429 610
Acquired through business combinations – 569 – – 569
Foreign exchange movements 3 55 – – 58
At 30 June 2020 5,970 3,414 683 5,432 15,499
AmortisationAt 1 July 2018 2,081 378 126 3,179 5,764
Amortisation charge 265 263 74 284 886
Foreign exchange movements – 1 – – 1
At 30 June 2019 2,346 642 200 3,463 6,651
At 1 July 2019 2,346 642 200 3,463 6,651
Amortisation charge 416 299 144 342 1,201
Foreign exchange movements – 5 – – 5
At 30 June 2020 2,780 946 344 3,805 7,875
Carrying amountAt 30 June 2020 3,190 2,468 339 1,627 7,624
At 30 June 2019 3,510 2,148 395 1,540 7,593
During the year, customer relationships intangible of £0.569m in respect of the Tristel Italia acquisition were capitalised in full within the category of customer and supplier relationships. The intangible was valued using a discount rate of 13% following a benchmark exercise comparing other companies in the same sector and region. The asset is being amortised over a period of 10 years – the estimated remaining useful life.
The Group’s approach to reviewing the carrying value of its intangible assets is consistent with the method applied to goodwill held by the Group (set out within note 12 of these financial statements).
The rate used to discount the forecast cash flows for all CGUs is 17%. Management estimates discount rates using the Group’s post-tax weighted average cost of capital, adjusted to reflect the impact of the time value of money, tax effects and risks associated with each CGU. Where sensitivity analysis has been carried out, it has been via the reduction of expected revenue growth rate and increase in expected cost growth rate.
The Directors believe that there have been no impairment indicators during the year to 30 June 2020.

Notes to the Financial Statements for the year ended 30 June 2020
continued
TRIS
TEL P
LC A
NNUA
L RE
PORT
& A
CCOU
NTS
YEAR
END
ED 3
0 JU
NE 2
020
74
13. Intangible assets continued
Company
Patents, licences and proprietary
technology£’000
Total£’000
CostAt 30 June 2018 5,112 5,112
Additions 182 182
At 30 June 2019 5,294 5,294
Additions 133 133
At 30 June 2020 5,427 5,427
AmortisationAt 30 June 2018 1,774 1,774
Charge for year 258 258
At 30 June 2019 2,032 2,032
Charge for year 402 402
At 30 June 2020 2,434 2,434
Net book value30 June 2020 2,993 2,993
30 June 2019 3,262 3,262
14. Investments
Group2020
£’0002019
£’000
At 1 July 807 589
Investment – 120
Fair value gain – 98
At 30 June 807 807
Further investment of £120,000 was made on 17 July 2018 in MobileODT Ltd.
An increase in the fair value of the investment was recorded for 2019 through profit and loss, there was no significant increase in the carrying value for 2020.
The fair values of investments are based on values paid during a recent funding round, discounted using a current borrowing rate. They are classified as level 3 fair values in the fair value hierarchy due to the use of unobservable inputs as the fair valuation of the investment was based upon prices of the shares issued in the latest round of funding.
Principal activity Registered office
2020 Proportion of
ownership interest
and voting rights held
2019 Proportion of
ownership interest
and voting rights held
MobileODT Ltd Manufacture of intelligent visual diagnostic tools Israel 3% 3%
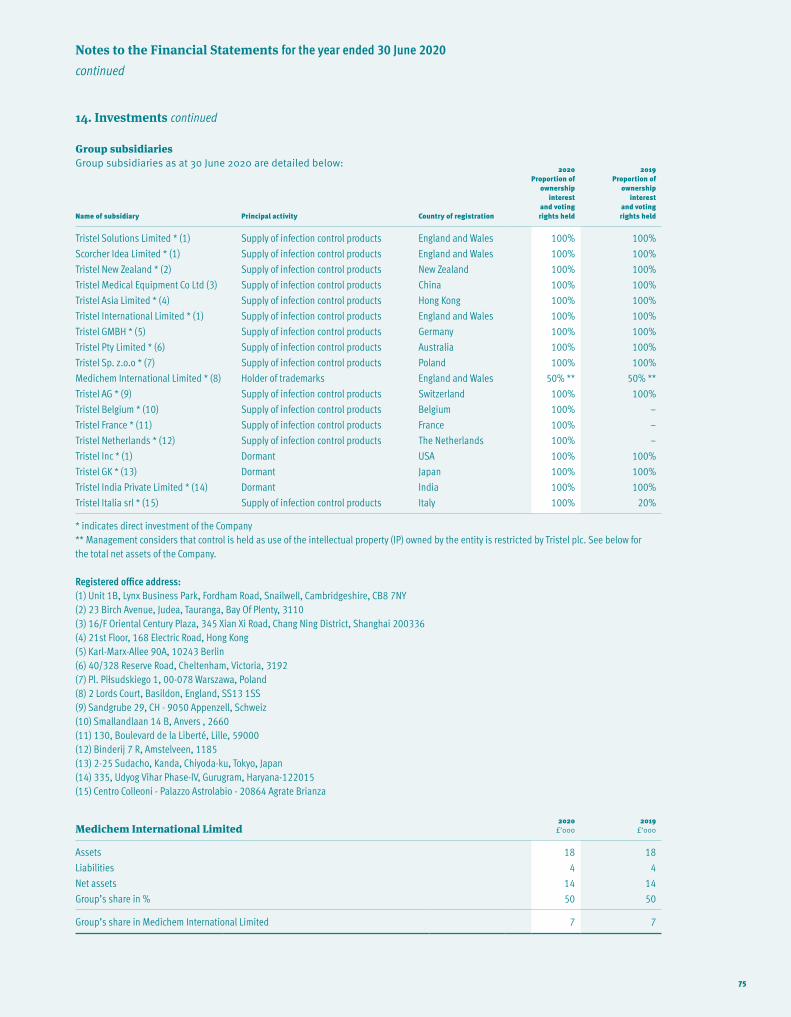
Notes to the Financial Statements for the year ended 30 June 2020
continued
75
14. Investments continued
Group subsidiariesGroup subsidiaries as at 30 June 2020 are detailed below:
Name of subsidiary Principal activity Country of registration
2020 Proportion of
ownership interest
and voting rights held
2019 Proportion of
ownership interest
and voting rights held
Tristel Solutions Limited * (1) Supply of infection control products England and Wales 100% 100%
Scorcher Idea Limited * (1) Supply of infection control products England and Wales 100% 100%
Tristel New Zealand * (2) Supply of infection control products New Zealand 100% 100%
Tristel Medical Equipment Co Ltd (3) Supply of infection control products China 100% 100%
Tristel Asia Limited * (4) Supply of infection control products Hong Kong 100% 100%
Tristel International Limited * (1) Supply of infection control products England and Wales 100% 100%
Tristel GMBH * (5) Supply of infection control products Germany 100% 100%
Tristel Pty Limited * (6) Supply of infection control products Australia 100% 100%
Tristel Sp. z.o.o * (7) Supply of infection control products Poland 100% 100%
Medichem International Limited * (8) Holder of trademarks England and Wales 50% ** 50% **
Tristel AG * (9) Supply of infection control products Switzerland 100% 100%
Tristel Belgium * (10) Supply of infection control products Belgium 100% –
Tristel France * (11) Supply of infection control products France 100% –
Tristel Netherlands * (12) Supply of infection control products The Netherlands 100% –
Tristel Inc * (1) Dormant USA 100% 100%
Tristel GK * (13) Dormant Japan 100% 100%
Tristel India Private Limited * (14) Dormant India 100% 100%
Tristel Italia srl * (15) Supply of infection control products Italy 100% 20%
* indicates direct investment of the Company** Management considers that control is held as use of the intellectual property (IP) owned by the entity is restricted by Tristel plc. See below for the total net assets of the Company.
Registered office address:(1) Unit 1B, Lynx Business Park, Fordham Road, Snailwell, Cambridgeshire, CB8 7NY(2) 23 Birch Avenue, Judea, Tauranga, Bay Of Plenty, 3110(3) 16/F Oriental Century Plaza, 345 Xian Xi Road, Chang Ning District, Shanghai 200336(4) 21st Floor, 168 Electric Road, Hong Kong(5) Karl-Marx-Allee 90A, 10243 Berlin(6) 40/328 Reserve Road, Cheltenham, Victoria, 3192(7) Pl. Piłsudskiego 1, 00-078 Warszawa, Poland(8) 2 Lords Court, Basildon, England, SS13 1SS(9) Sandgrube 29, CH - 9050 Appenzell, Schweiz(10) Smallandlaan 14 B, Anvers , 2660(11) 130, Boulevard de la Liberté, Lille, 59000(12) Binderij 7 R, Amstelveen, 1185(13) 2-25 Sudacho, Kanda, Chiyoda-ku, Tokyo, Japan(14) 335, Udyog Vihar Phase-IV, Gurugram, Haryana-122015(15) Centro Colleoni - Palazzo Astrolabio - 20864 Agrate Brianza
Medichem International Limited2020
£’0002019
£’000
Assets 18 18
Liabilities 4 4
Net assets 14 14
Group’s share in % 50 50
Group’s share in Medichem International Limited 7 7

Notes to the Financial Statements for the year ended 30 June 2020
continued
TRIS
TEL P
LC A
NNUA
L RE
PORT
& A
CCOU
NTS
YEAR
END
ED 3
0 JU
NE 2
020
76
14. Investments continued
Company
Shares in Group undertakings and associate
£’000
Other investments
£’000Total
£’000
CostAt 30 June 2018 3,658 589 4,247
Capital contributions as a result of share-based payments 852 – 852
Fair value gain – 98 98
Investment in MobileODT Ltd – 120 120
Investment in Ecomed 6,440 – 6,440
At 30 June 2019 10,950 807 11,757
Capital contributions as a result of share-based payments 435 – 435
Investment in Tristel Italia srl 885 – 885
At 30 June 2020 12,270 807 13,077
ImpairmentAt 30 June 2018 433 – 433
Movement in the year – – –
At 30 June 2019 433 – 433
Movement in the year – – –
At 30 June 2020 433 – 433
Net book value30 June 2020 11,837 807 12,644
30 June 2019 10,517 807 11,324
The total amount recognised in the Company statement of financial position in relation to options granted over the parent company shares to employees of subsidiaries during the year amounts to a charge of £435,000 (2019: £852,000).
The increase in the cost of investments in the year relates to the full acquisition of Tristel Italia, our Italian distributor, the details of which are given in note 12.
15. Inventories
2020 Group£’000
2019 Group£’000
2020 Company
£’000
2019 Company
£’000
Raw materials and consumables 1,922 1,532 – –
Finished goods 2,697 1,425 – –
4,619 2,957 – –
Included in the above is a stock provision of £6,000 (2019: 99,000) held in respect of both raw materials and finished goods.

Notes to the Financial Statements for the year ended 30 June 2020
continued
77
16. Trade and other receivables
2020 Group£’000
2019Group£’000
2020 Company
£’000
2019 Company
£’000
Trade receivables 4,746 4,163 – –
Provision for impairment of trade receivables (19) (27) – –
Net trade receivables 4,727 4,136 – –
Receivables from related parties – – 4,065 2,918
Prepayments 1,199 923 35 37
Other receivables 496 311 93 91
6,422 5,370 4,193 3,046
The Directors consider that there are no irrecoverable amounts from the sale of goods other than those already identified and included within the impairment allowance. This position has been determined by reference to past default experience.
The trade and other receivables classified as financial instruments are disclosed below. The Company’s exposure to credit and market risks, including maturity analysis, relating to trade and other receivables is disclosed in the financial risk review note.
A reconciliation of the movement in the allowance for impairment provisions for trade receivables is as follows:
Current
2020 Group£’000
2019 Group£’000
2020 Company
£’000
2019 Company
£’000
Impairment provision brought forward (27) (95) – –
Decrease/(increase) in provision 8 68 – –
Impairment provision carried forward (19) (27) – –
The Group applies the IFRS 9 simplified approach to measuring expected credit losses which uses a lifetime expected loss allowance for all trade receivables. To measure the expected credit losses, trade receivables have been grouped based on shared credit risk characteristics and the days past due.
The expected loss rates are based on the payment profiles of sales over a period of 48 months before 30 June 2020 and the corresponding historical credit losses experienced within this period. The historical loss rates are adjusted to reflect current and forwardlooking information on macroeconomic factors affecting the ability of the customers to settle the receivables.
In the animal healthcare sector, the distribution model means that the debt is allocated amongst multiple customers, thereby reducing the credit risk. In the contamination control sector, the credit risk is lessened due to the large number of customers. Credit risk is predominantly within the hospital medical device and environmental surface disinfection segments.
The following table provides information about the exposure to credit risk and ECLs for trade receivables for all customers as at 30 June 2020:
Grade Internal credit ratingWeighted average
loss rate Gross carrying amount
£’000Impairment
loss allowance
Grade: Low risk AAA-A 0% 1,205 –
Grade: Fair risk BBB-B 0% 3,201 –
Grade: Substandard CCC 0% 12 –
Grade: Doubtful CC-C 5.76% 288 17
Grade: Loss D 5.76% 40 2
4,746 19
Loss rates are calculated with reference to the probability of a receivable being written off based on credit risk characteristics such as geographic location.

Notes to the Financial Statements for the year ended 30 June 2020
continued
TRIS
TEL P
LC A
NNUA
L RE
PORT
& A
CCOU
NTS
YEAR
END
ED 3
0 JU
NE 2
020
78
17. Cash and cash equivalents
2020 Group£’000
2019 Group£’000
2020 Company
£’000
2019 Company
£’000
Cash at bank 6,212 4,170 598 727
Cash and cash equivalents comprise cash held by the Group and short-term bank deposits with a maturity of three months or less. The carrying amount of these assets approximates to their fair value.
18. Share capital
Allotted, called up and fully paid shares2020
Number ’0002020
£’0002019
Number ’0002019
£’000
Ordinary of £0.01 each 45,297 452.97 44,563 445.63
Number £’000
30 June 2019 44,563,323 446
Issued during the year 733,210 7
30 June 2020 45,296,533 453
733,210 ordinary shares of 1 pence each, related to the exercise of 733,210 share options issued during the year (2019: 661,415). The weighted average exercise price was 107.56 pence (2019: 81.84p).
19. Pension and other schemes
The Group operates a defined contribution pension scheme. The pension cost charge for the year represents contributions payable by the Group to the scheme and amounted to £342,000 (2019: £231,000), with £32,000 (2019: £40,000) outstanding at the year end.
20. Trade and other payables
2020Group£’000
2019 Group£’000
2020 Company
£’000
2019 Company
£’000
Trade payables 2,198 1,986 72 21
Accruals 1,794 1,089 127 48
Social security and other taxes 237 464 – –
Other payables 443 – 112 –
4,672 3,539 311 69
The Group’s exposure to market and liquidity risks, including maturity analysis, related to trade and other payables is disclosed in the financial risk review note.

Notes to the Financial Statements for the year ended 30 June 2020
continued
79
21. Dividends
Amounts recognised as distributions to equity holders in the year:
Ordinary shares of 1p each2020
£’0002019
£’000
Final dividend for the year ended 30 June 2019 of 3.50p (2018: 2.98p) per share 1,562 1,303
Interim dividend for the year ended 30 June 2020 of 2.34p (2019: 2.04p) per share 1,059 907
2,621 2,210
Proposed final dividend for the year ended 30 June 2020 of 3.84p (2019: 3.50p) per share 1,737 1,560
Company
Dividend received from subsidiaries (3,759) (2,793)
The proposed final dividend is subject to approval by shareholders at the forthcoming Annual General Meeting and has not been included as a liability in the financial statements.
22. Earnings per share
The calculations of earnings per share are based on the following profits and number of shares:
2020£’000
2019£’000
Retained profit for the financial year attributable to equity holders of the parent 5,100 4,031
SharesNumber ’000
SharesNumber ’000
Weighted average number of ordinary shares for the purpose of basic earnings per share 44,831 44,086
Share options 2,033 1,399
46,864 45,485
Earnings per ordinary shareBasic 11.38p 9.14p
Diluted 10.88p 8.86p
A total of 130,000 options of ordinary shares were anti-dilutive at 30 June 2020 (320,000 at 30 June 2019). Contingent options in the prior year would be dilutive but are excluded. The Group also presents an adjusted basic earnings per share figure which excludes the share-based payments charge:
2020£’000
2019£’000
Retained profit for the financial year attributable to equity holders of the parent 5,100 4,031
AdjustmentsShare-based payments 435 852
Net adjustments 435 852
Adjusted earnings 5,535 4,883
Adjusted basic earnings per ordinary share 12.35p 11.08p

Notes to the Financial Statements for the year ended 30 June 2020
continued
TRIS
TEL P
LC A
NNUA
L RE
PORT
& A
CCOU
NTS
YEAR
END
ED 3
0 JU
NE 2
020
80
23. Financial risk management and impairment of financial assets
GroupThe Group’s activities expose it to a number of financial risks including credit risk, cash-flow risk and exchange-rate risk:
Credit risk The Group’s principal financial assets are bank balances and cash, trade and other receivables. The Group’s credit risk is primarily attributable to its trade receivables, which are concentrated in a large number of low value customer accounts. In addition, operations in emerging or new markets may have a higher than average risk of political or economic instability, and may carry increased credit risk. In each case the risk to the Group is the recoverability of the cash flows.
Credit risk on liquid funds is limited because the counterparties are banks with high credit ratings assigned by international credit rating agencies. The credit risk on trade and other receivables is managed by agreeing appropriate payment terms with customers, obtaining credit agency ratings of all potential customers; by requiring wherever possible payment for goods in advance or upon delivery; and by closely monitoring customers balances due, to ensure they do not become overdue. In addition, careful consideration is given to operations in emerging or new markets before the Group enters that market.
Cash-flow risk Group cash balances and expected cash flow are monitored on a daily basis to ensure the Group has sufficient available funds to meet its needs.
Exchange-rate risk Group exposure to exchange-rate risk includes the measurement of overseas operations at the relevant exchange rate and changes in trade payables and receivables as a result of exchange rate movements. Daily exchange rate movements are monitored and any losses or gains incurred are taken to the income statement and reported in the Group’s internal management information. Before agreeing any overseas transactions, consideration is given to utilising financial instruments such as hedging and forward purchase contracts, none of which were in place at the year end.
Exposure to credit The carrying amount of financial assets represents the maximum credit exposure. The maximum exposure to credit risk at the reporting date was:
2020Group
carrying amount
£’000
2019Group
carrying amount
£’000
2020Company carrying amount
£’000
2019Company carrying amount
£’000
Cash and cash equivalents 6,212 4,170 598 727
Trade and other receivables excluding prepayments and VAT 5,130 4,416 4,127 3,009
11,342 8,586 4,725 3,736
The maximum exposure to credit risk for trade and other receivables at the reporting date by geographic region was:
2020Group
carrying amount
£’000
2019Group
carrying amount
£’000
2020Company carrying amount
£’000
2019Company carrying amount
£’000
United Kingdom 3,416 2,500 4,127 3,009
Rest of the World 1,714 1,916 – –
5,130 4,416 4,127 3,009
The Group’s and the Company’s trade and other receivables have been reviewed for indicators of impairment. Doubtful debts of £19,000 (2019: £27,000) have been provided against but no other receivables were considered to be impaired.

Notes to the Financial Statements for the year ended 30 June 2020
continued
81
23. Financial risk management and impairment of financial assets continued
In addition, some of the unimpaired trade and other receivables are past due as at the reporting date. The age of the trade and other receivables past due but not impaired are as follows:
Group2020
£’0002019
£’000
Not past due 2,512 3,157
Past due 0-30 days 1,074 696
Past due 31-120 days 1,544 563
Past due 120 days + – –
5,130 4,416
Liquidity riskThe following are the contractual maturities of financial liabilities, including interest payments and excluding the impact of netting agreements:
Group
Carrying amount
£’000
Contractual cash flows
£’000
6 months or less£’000
6 to 12 months
£’000
More than 12 months
£’000
30 June 2020 Non-derivative financial liabilities Other payables – contingent liability 112 112 – – 112
Trade and other payables (excluding taxes) 4,323 4,323 4,323 – –
4,435 4,435 4,323 – 112
30 June 2019 Non-derivative financial liabilities Trade and other payables (excluding taxes) 3,075 3,075 3,075 – –
3,075 3,075 3,075 – –
Company
Carrying amount
£’000
Contractual cash flows
£’000
6 months or less£’000
6 to 12 months
£’000
More than 12 months
£’000
30 June 2020 Non-derivative financial liabilities Other payables – contingent liability 112 112 – – 112
Trade and other payables (excluding taxes) 199 199 199 – –
311 311 199 – 112
30 June 2019 Non-derivative financial liabilities Trade and other payables (excluding taxes) 69 69 69 – –
69 69 69 – –

Notes to the Financial Statements for the year ended 30 June 2020
continued
TRIS
TEL P
LC A
NNUA
L RE
PORT
& A
CCOU
NTS
YEAR
END
ED 3
0 JU
NE 2
020
82
23. Financial risk management and impairment of financial assets continued
The carrying amounts of the Group’s financial assets and liabilities may also be categorised as follows:
2020Group£’000
2019Group£’000
2020Company
£’000
2019Company
£’000
Non-current assets: assets held at fair value through profit and lossMobile ODT 807 807 807 807
807 807 807 807
2020Group£’000
2019Group£’000
2020Company
£’000
2019Company
£’000
Current assets: loans and receivables at amortised costCash and cash equivalents 6,212 4,170 598 727
Trade and other receivables 5,130 4,416 4,127 3,009
11,342 8,586 4,725 3,736
All of the above relate to the IFRS 9 category ‘loans and receivables’.
2020Group£’000
2019Group£’000
2020Company
£’000
2019Company
£’000
Current liabilitiesContingent liability 112 – 112 –
Trade and other payables 4,323 3,075 199 69
4,435 3,075 311 69
All of the above relate to the IFRS 9 category ‘other financial liabilities’ held at amortised cost.
Liquidity needs are managed by regular review of the timing of expected receivables and the maintenance of cash on deposit.
Currency riskThe Group has an element of currency risk as it buys certain chemicals, parts and equipment from overseas manufacturers, sells finished products into overseas markets and holds foreign currency cash balances. The movement in exchange rates following the UK referendum on EU membership means that the Group will face an element of uncertainty in relation to foreign currency transaction and assets in the near term.
Interest rateThe Group’s financial assets include cash at bank and short-term investments. At 30 June 2020, the average interest rate earned on the temporary closing balances was 0.1% (2019: 0.1%).
Sensitivity analysisThe Group’s sensitivity to interest rates are considered immaterial.
The Group has an exposure to exchange rates, gains and losses are recognised upon the translation of overseas subsidiary profits, foreign currency cash holdings and non-GBP trade. There is a loss of £36k within these financial statements, shown on page 62 within note 4. This balance consists of an £22k profit originating upon the translation of overseas profits and a £58k loss from the revaluation of cash and open trade balances at the year end.
Fair values versus carrying amountsThere is no difference between fair values and carrying amounts of financial assets and liabilities.
Capital risk managementThe Group’s capital management policy is to maintain a strong capital base so as to enhance investor, creditor and market confidence. The Board’s objective is to safeguard the Group’s ability to continue as a going concern, to sustain the future development of the business and to provide returns for shareholders, whilst controlling the cost of capital.
The Group monitors capital on the basis of the carrying amount of equity, less cash as presented on the face of the statement of financial position.

Notes to the Financial Statements for the year ended 30 June 2020
continued
83
23. Financial risk management and impairment of financial assets continued
Capital risk management continuedIn order to maintain or adjust the capital structure the Group may adjust the amount of dividends paid to shareholders, issue new shares or sell assets.
There were no changes in the Group’s approach to capital management during the year. Neither the Company nor any of its subsidiaries are subject to externally imposed capital requirements.
Capital for the period is summarised as follows:
2020Group£’000
2019Group£’000
2020Company
£’000
2019Company
£’000
Total equity 28,463 23,359 20,115 18,287
Cash and cash equivalents (6,212) (4,170) (598) (727)
Capital 22,251 19,189 19,517 17,560
Total equity 28,463 23,359 20,115 18,287
Borrowings 6,002 – – –
Overall financing 34,465 23,359 20,115 18,287
Capital to overall financing ratio 0.6456 0.8215 0.9703 0.9602
24. Share-based payments
During the year ended 30 June 2020 the Group had 101 share-based payment arrangements, under four schemes. Grants in the year are detailed below:
General Employee Scheme General Employee Scheme General Employee Scheme
Grant date 15-Aug-19 16-Oct-19 24-Feb-20
Vesting period ends 15-Aug-19 16-Oct-19 24-Feb-20
Share price at date of grant 264.00p 293.50p 412.45p
Volatility 36.45% 35.46% 35.74%
Option life 10 years 10 years 10 years
Expected dividend yield 1.93% 1.93% 1.93%
Risk free investment rate 0.10% 0.10% 0.10%
Fair value at grant date 0.566p 0.612p 0.867p
Exercise price at date of grant 264.00p 293.50p 412.45p
The Senior Management Scheme is part of the remuneration package of the Executive Directors of the Company’s parent Tristel plc. Options under this scheme will vest if certain conditions defined in the programme are met. Upon vesting, each option allows the holder to purchase one ordinary share at the stated share price.
Senior Management Scheme (1) is part of the remuneration package of the Executive Directors, Non-Executive Directors and Senior Management of the Company’s parent Tristel plc. Options under this scheme will vest if certain conditions defined in the programme are met or vest immediately upon grant. Upon vesting, each option allows the holder to purchase one ordinary share at the stated share price.
Senior Management Scheme (2) is part of the remuneration package of the Executive Directors and Non-Executive Directors of the Company’s parent Tristel plc. Options under this scheme will vest if certain conditions defined in the programme are met or vest immediately upon grant. Upon vesting, each option allows the holder to purchase one ordinary share at the stated share price.
The General Employee Scheme is part of the remuneration package of certain employees of the Company. Options under this scheme will vest immediately upon grant, or will vest in accordance with a set timescale over 36 months. Upon vesting, each option allows the holder to purchase one ordinary share at the stated share price. If the option holder leaves the employment of the Company the option is forfeited.

Notes to the Financial Statements for the year ended 30 June 2020
continued
TRIS
TEL P
LC A
NNUA
L RE
PORT
& A
CCOU
NTS
YEAR
END
ED 3
0 JU
NE 2
020
84
24. Share-based payments continued
The expected volatility is based on historical volatility over the past three years. The expected life is the average expected period to exercise. The risk-free rate of return is the yield on zero-coupon UK government bonds of a term consistent with the assumed option life.
If vesting periods or other vesting conditions apply, the expense is allocated over the vesting period, based on the best available estimate of the number of share options expected to vest. Non-market vesting conditions are included in the assumptions about a number of options that are expected to become exercised. Estimates are subsequently revised, if there is any indication that the number of share options expected to vest differs from previous estimates. Any cumulative adjustment prior to vesting is recognised in the current period. No adjustment is made to any expense recognised in prior periods if share options ultimately exercised are different to that on vesting.
Fair values for the share option schemes have been determined using the Black-Scholes model, except for the Senior Management Schemes (1) and (2), where fair values have been calculated via the Monte Carlo method.
A reconciliation of option movements over the year to 30 June 2020 is shown below:
Senior Management
Scheme
Weighted average
exercise price
Senior Management
Scheme (1)
Weighted average
exercise price
Senior Management
Scheme (2)
Weighted average
exercise price
General Employee
Scheme
Weighted average
exercise price
Outstanding at 30 June 2018 917,500 53.75p 976,635 0.01p 990,000 0.01p 898,950 194.75p
Granted – – – – – – 370,000 254.00p
Exercised (242,500) 53.75p (260,415) 0.01p – – (152,000) 69.95p
Outstanding at 30 June 2019 675,000 53.75p 716,220 0.01p 990,000 0.01p 1,116,950 194.75p
Granted – – – – – – 410,000 330.50p
Exercised – – (219,210) 0.01p – – (475,500) 229.68p
Lapsed (675,000) 53.75p – – – – – –
Outstanding at 30 June 2020 – – 497,010 0.01p 990,000 0.01p 1,051,450 259.50p
Exercisable at 30 June 2019 – – 716,220 0.01p – – 1,116,950 219.63p
Exercisable at 30 June 2020 – – 497,010 0.01p 660,000 0.01p 1,051,450 259.50p
The total charge at 30 June 2020 relating to employee share-based payment plans, in accordance with IFRS 2, was £435,000 (2019: £852,000) all of which related to equity-settled share-based payment transactions.
The range of exercise prices for options outstanding at the end of the period is 1p and 412.45p. The weighted average of the remaining contractual life of options at the end of the period is seven years.

Notes to the Financial Statements for the year ended 30 June 2020
continued
85
25. Related party transactions
All amounts quoted are gross of VAT.
Transactions between the Group and David OrrUnder the terms of supply agreements between the Company and Manor Packaging Limited, a private company incorporated in England and Wales in which Mr David Orr, a Non-Executive Director in the Company, is a Director, monies totalling £567,000 were payable (2019: £495,000). At 30 June 2020, the Group owed Manor Packaging Limited £108,000 (2019: £48,000).
Transactions between the Group and Bart LeemansDuring the year, the Group paid £15,000 for warehouse space owned by Vicella, a management company owned by Bart Leemans, an Executive Director in the Company. At 30 June 2020, the Group owed Vicella £15,000. Bart Leemans was remunerated for his services as Director through Vicella for the amounts as shown in the Directors remuneration report on page 25.
Other transactions with DirectorsDividends were paid to Directors as follows:
2020£
2019£
Paul Swinney 27,823 23,917
Elizabeth Dixon 2,628 2,259
Paul Barnes 21,029 18,378
David Orr 1,646 1,404
Bart Leemans 55,750 35,704
Key management personnelKey management compensation:
2020£’000
2019 £’000
Salaries and other short term employee benefits 1,840 1,549
Post-employment benefits 71 82
Share-based payments 120 615
2,031 2,246
The key management figures given above includes Directors.
26. Changes in accounting policies
LeasesExcept for the changes below, the Group has consistently applied the accounting policies to all periods presented in these consolidated financial statements.
The Group applied IFRS 16 with a date of initial application of 1 July 2019. As a result, the Group has changed its accounting policy for lease contracts as detailed below.
The Group applied IFRS 16 using the modified retrospective approach, under which the cumulative effect of initial application is recognised in retained earnings at 1 July 2019. The details of the changes in accounting policies are disclosed below.
Definition of a leasePreviously, the Group determined at contract inception whether an arrangement is or contains a lease under IFRIC 4. Under IFRS 16, the Group assesses whether a contract is or contains a lease based on the definition of a lease, as explained in note 1.
On transition to IFRS 16, the Group elected to apply the practical expedient to grandfather the assessment of which transactions are leases. It applied IFRS 16 only to contracts that were previously identified as leases. Contracts that were not identified as leases under IAS 17 and IFRIC 4 were not reassessed for whether there is a lease. Therefore, the definition of a lease under IFRS 16 was applied only to contracts entered into or changed on or after 1 July 2019.

Notes to the Financial Statements for the year ended 30 June 2020
continued
TRIS
TEL P
LC A
NNUA
L RE
PORT
& A
CCOU
NTS
YEAR
END
ED 3
0 JU
NE 2
020
86
2020£’000
Operating lease commitment at 1 July 2019 as disclosed in the Group's consolidated financial statements 4,776
Discounted using the incremental borrowing rate at 1 July 2019 (409)
Recognition exemption for:Short-term leases –
Leases of low-value assets –
Lease liabilities recognised at 1 July 2019 4,367
26. Changes in accounting policies continued
As a lesseeAs a lessee, the Group previously classified leases as operating or finance leases based on its assessment of whether the lease transferred significantly all of the risks and rewards incidental to ownership of the underlying asset to the Group. Under IFRS 16, the Group recognises right-of-use assets and lease liabilities for most leases – i.e. these leases are on-balance sheet.
The Group decided to apply recognition exemptions to short-term leases of machinery and leases of IT equipment (see note 1). For leases of other assets, which were classified as operating under IAS 17 the Group recognised right-of-use assets and lease liabilities.
Leases classified as operating leases under IAS 17At transition, lease liabilities were measured at the present value of the remaining lease payments, discounted at the Group’s incremental borrowing rate as at 1 July 2019. Right-of-use assets are measured at either:
• their carrying amount as if IFRS 16 had been applied since the commencement date, discounted using the lessee’s incremental borrowing rate at the date of initial application – the Group applied this approach to its largest property leases; or
• an amount equal to the lease liability, adjusted by the amount of any prepaid or accrued lease payments – the Group applied this approach to all other leases.
The Group used the following practical expedients when applying IFRS 16 to leases previously classified as operating leases under IAS 11:
• Applied a single discount rate to a portfolio of leases with similar characteristics.
• Adjusted the right-of-use assets by the amount of IAS 37 onerous contract provision immediately before the date of initial application, as an alternative to an impairment review.
• Applied the exemption not to recognise right-of-use assets and liabilities for leases with less than 12 months of lease term.
• Excluded initial direct costs from measuring the right-of-use asset at the date of initial application.
• Used hindsight when determining the lease term if the contract contains options to extend or terminate the lease.
Impacts on financial statementsOn transition to IFRS 16, the Group recognised an additional £3.9m of right-of-use assets and £4.4m of lease liabilities, recognising the difference after lease incentives and deferred tax in retained earnings.
When measuring lease liabilities, the Group discounted lease payments using its incremental borrowing rate at 1 January 2019. The weighted-average rate applied is 2%.

TRISTEL PLC LYNX BUSINESS PARK, FORDHAM ROAD,SNAILWELL, CAMBRIDGESHIRE CB8 7NYT: +44 (0)1638 721500 E: [email protected] W: www.tristel.com