annual report - 東武鉄道ポータルサイト 3 our current situation future measures in...
TRANSCRIPT

TOBU RAILWAY CO., LTD.
ANNUAL REPORT2017

ProfileThe Tobu Group consists of TOBU RAILWAY CO., LTD. and its subsidiaries and affiliates. The core business of the parent company founded in 1897 is operating a network of private railway lines that extends across Tokyo, Chiba, Saitama, Tochigi, and Gunma prefectures of the Kanto region.
The main lines, which originate in Asakusa, eastern Tokyo, extend to Saitama, Tochigi, Gunma, and Chiba prefectures, including the trunk lines (the TOBU SKYTREE Line (Isesaki Line), Nikko Line, and the TOBU URBAN PARK Line (Noda Line)) and branch lines. They can be broadly divided into the TOBU SKYTREE Line (the southern portion of the Isesaki Line) and the TOBU URBAN PARK Line (Noda Line), which primarily serve commuters and students, and the Nikko Line and northern portion of the Isesaki Line that primarily serve tourists and businesses.
The Tojo Line mainly carries commuters and students. Development in areas along the line has been proceeding smoothly.
Tobu Railway’s network has a total operating length of 463.3 kilometers. The Company manages 206 stations, and its average daily passenger count is 2.49 million.
Tobu Group companies, which operate in five broad industrial sectors — transportation, leisure, real estate, retail distribution and other — continue to grow in concert with the region. Working in collaboration with Tobu Railway, they offer high-value-added products and services to meet the needs of customers along the railway lines.
Contents
Message from the President ..............................................1
Medium-Term Business Plan 2017–2020 ...........................2
Principal Subsidiaries and Affiliates ....................................4
Review of Operations ........................................................5
Financial Review ................................................................9
Corporate Governance ....................................................10
Risks to which the Company’s Business is Subject ..........12
Five-Year Summary .........................................................13
Consolidated Balance Sheets ..........................................14
Consolidated Statements of Income and Comprehensive Income ...............................................16
Consolidated Statement of Changes in Equity .................17
Consolidated Statements of Cash Flows .........................19
Corporate Directory .........................................................20
Attention regarding forward-looking statements
The reader is advised that this report contains forward-looking
statements, including statements relating to the Company’s
future policies and strategies, and estimates of future business
development. As opposed to statements of historical fact,
these constitute estimates or projections made by the
Company’s management on the basis of facts known to them
as of the time of writing, and actual results may therefore differ
substantially from such statements, due to a wide variety of
possible risk factors. Page 12 contains a list of the principal
categories of risk to which the Company’s business operations
are subject.

1ANNUAL REPORT 2017
Message from the President
In the year under review, the future prospects of the Japanese economy remained uncertain. There were signs of improvement in capital investment and the employment situation, so there was a mild economic recovery, but consumer spending and home construction stalled.
In the midst of these circumstances, the Tobu Group engaged in efforts to ensure sustainable growth into the future, including working to create vitality in tourist areas along the railroad in the Nikko/Kinugawa area and promoting aggressive measures to attract foreign tourists such as opening the Taipei Branch. These efforts were undertaken in accordance with the Tobu Group Medium-Term Business Plan 2014-2016 based on the Tobu Group Policy, which seeks the creation of Tobu railroads that are safe, reliable, dynamic, convenient and attractive to visitors.
As for our consolidated results, revenues from operations were ¥568,887 million (a decrease of 0.9% year on year), operating income was ¥68,335 million (an increase of 6.1% year on year), and net income attributable to owners of the parent company was ¥36,137 million (an increase of
32.5% year on year). Both operating income and recurring income were the highest ever.
As a result, we achieved the numerical targets (operating income of ¥65,000 million, net income attributable to owners of the parent company of ¥32,000 million, a ratio of operating income to sales of at least 10% and an interest-bearing debt/EBITDA multiple of around 7x) of the Medium-Term Business Plan.
Although the economic outlook is still uncertain, we will make every effort to support the further development of regional economies and to improve the comfort and convenience of people’s lives as a corporate group that supports the lives of customers along the railroads, especially via our railway business, which is a part of the social infrastructure.
Yoshizumi Nezu
President and Representative Director
We aim to become a corporate group that merits the trust we receive from our stakeholders.

2 TOBU RAILWAY CO., LTD.
Medium-Term Business Plan 2017-2020
The consolidated numerical targets set forth in the Tobu Group Medium-Term Business Plan 2014-2016 have all been achieved, and in April 2017 we established the Tobu Group Medium-Term Business Plan 2017-2020. Within the long-term management vision, this new medium-term business plan is positioned as Phase 1.
• Promotion of growth investment for the next stage• Planting/cultivation of business seeds anticipating Tokyo Olympics and Paralympics and thereafter• Increased revenue through incorporation of rapidly growing inbound demand• Achieve balance between growth investments, maintenance of financial soundness and enhancement of
shareholder return
Operating incomeJapanese yen
67.5 billion (FY2020)
Profit Attributable to Owners of ParentJapanese yen
38.6 billion (FY2020)
New Medium-Term Business PlanFour years from FY2017 to FY2020
Growth InvestmentSet aside ¥107 billion out of total four-year capital expenditures of ¥320 billion for strategic and growth investment
Operating Cash Flow¥380 billion
Maintenance of Financial StrengthEstablish interest-bearing debt/EBITDA multiple of around 6.5x–7x to ensure long-term reserves
Enhancement of Shareholder ReturnThe dividend for FY2017 will be 7 yen per share, and the basic policy will remain to provide steady dividends while establishing a total return ratio of around 30% for the period average of the Medium-Term Business Plan
StartWest exit of Ikebukuro station redevelopment project
2020 Tokyo Olympics and Paralympics
Medium-Term Business Plan Phase 12017-2020
Medium-Term Business Plan Phase 3
Completion
Previous Medium-Term Business Plan2014-2016
Medium-Term Business Plan Phase 22021-
Long-Term Management Framework

3ANNUAL REPORT 2017
Our Current Situation
Future Measures
In addition to the main railway network and its characteristics summarized in the profile above, Tobu Railway engages in the development businesses outlined in the following paragraph.
In our leasing business, particularly in areas alongside our railway lines, the Group is leasing a large number of sites for such purposes as stores, office buildings, houses, and warehouses. In particular, in TOKYO SKYTREE TOWN with the commercial facility TOKYO SOLAMACHI®, and we lease the office facility TOKYO SKYTREE EAST TOWER®.
In addition, spaces inside our station buildings are leased or utilized for business purposes, and stations and railway cars are used for advertising.
In our subdivision business, we are engaged in the sale and development of homes and land, and the independent and joint construction and sale of condominium units.
In the leisure business, the parent company directly manages the Courtyard® by Marriott® Tokyo Ginza Hotel and the Tobu Hotel Levant Tokyo in the center of Tokyo, and in developing its leisure business, the Company works in close corporation with each of its member companies.
We will aggressively promote investments in sustainable growth and the cultivation of new growth fields and further enhance shareholder return while maintaining financial soundness.
We have played a role in railway development through our railways and other existing businesses via many connections, including town to town, people to towns and mutual through train operations utilizing our railway network as well as the current steam locomotive (SL) comeback operations project we are implementing with the cooperation of various companies. We will continue to change “connect” to “the power to attract” and “earning power” as we aim to bring about regional revitalization and improve railway value by increasing the resident population and expanding the nonresident population.
TOBUGroup
Transportation
Leisure
RealEstate
RetailDistribution
Other
Basic Indicators
Transportation
30.8%
Leisure
25.3%Real Estate
4.4%
Retail Distribution
19.8%
Other
19.7%
Number of Group Companies
91
Group Companies
Transportation
51.9%
Leisure
21.0%
Real Estate
1.4%
Retail Distribution
11.4%
Other
12.9%
Number of Employees
Administration
1.4%
19,514 Total
employees
Transportation
33.9%
Leisure
12.0%Real Estate
*Figures above are before elimination of inter-company transactions.
8.8%
Retail Distribution
30.5%
Other
14.8%
Revenue from Operations
568,887Total
millions of yen

4 TOBU RAILWAY CO., LTD.
Principal Subsidiaries and Affiliates
The Group comprises TOBU RAILWAY CO., LTD., 89 subsidiaries, and 11 affiliates. Their relation to major businesses and segments is as follows.
Transportation (31 firms) Group companies engage in such operations as bus services including long-distance bus services, taxi services, and freight trucking.
Railway business: The Company; Jomo Electric Railway Co., Ltd.1
Bus and taxi business: ASAHI Motor Corporation1; TOBU BUS CO., LTD.1
Freight business: TOBU TRANSPORTATION CO., LTD.1; TOBU DELIVERY CO., LTD.1
25 other firms
Retail distribution (19 firms)There are Tobu department stores in Ikebukuro, Funabashi, Utsunomiya, Ohtawara and Tochigi, and we own TOBU STORE CO., LTD., which operates a chain of supermarkets.
Retail: TOBU DEPARTMENT STORE CO., LTD.1; TOBU UTSUNOMIYA DEPARTMENTSTORE CO., LTD.1; TOBU STORE CO., LTD.2
16 other firms
Other (19 firms)Other businesses include construction, building and facility management, construction materials supply, and heating supply systems.
Construction: TOBU CONSTRUCTION Co., Ltd.1; Tobu Yachida Construction Co., Ltd1
Other businesses: Tobu Building Management Co., Ltd.1; Tobu Energy Support Co., Ltd.1
15 other firms
Real estate (5 firms)We are involved in real estate leasing, real estate brokerage, and the car parking lot and bicycle parking lot businesses.
Real estate leasing: The Company; TOBU Properties Co., Ltd.1
Real estate subdivision: The CompanySKYTREE TOWN: The Company; TOBU
TOWN SOLAMACHI CO., LTD.1
2 other firms
Leisure (29 firms)In addition to the TOKYO SKYTREE®, we operate the Tobu Zoological Park and TOBU WORLD SQUARE. Group companies manage enterprises in such fields as travel, city and resort hotels, inns, skiing facilities, golf courses, sports clubs, ropeways, and sightseeing vessels.
Amusement parks and tourism: Tobu Leisure Planning Co., Ltd.1
Sports: Tobu Kogyo Co., Ltd.1 Travel: TOBU TOP TOURS CO., LTD.1
Hotels: The Company; Tobu Hotel Management Co., LTD.1 Food: Tobu Foods Service Co., Ltd.1
SKYTREE business: TOBU TOWER SKYTREE Co., Ltd.1
22 other firms
TOBU RAILWAY CO., LTD.
Notes:1. Consolidated subsidiary.2. Affiliate according to the equity method. TOBU RAILWAY CO., LTD. is counted multiple times in the above segment breakdown.
5ANNUAL REPORT 2017
Review of Operations
Transportation
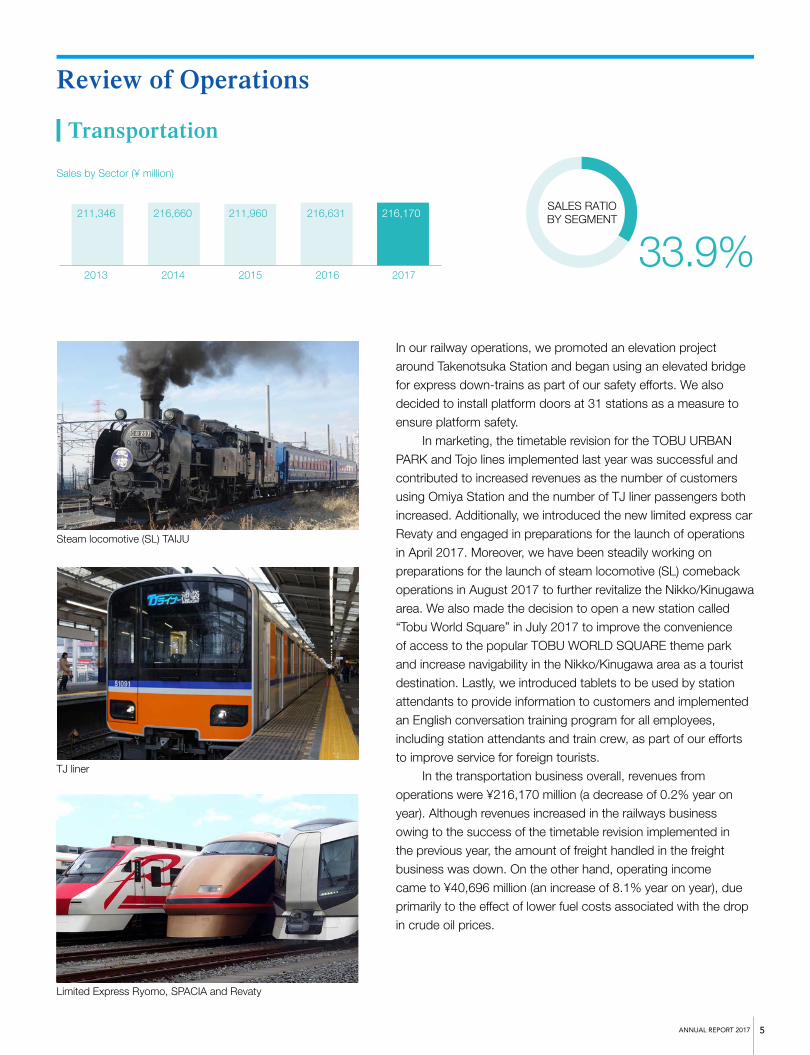
In our railway operations, we promoted an elevation project around Takenotsuka Station and began using an elevated bridge for express down-trains as part of our safety efforts. We also decided to install platform doors at 31 stations as a measure to ensure platform safety.
In marketing, the timetable revision for the TOBU URBAN PARK and Tojo lines implemented last year was successful and contributed to increased revenues as the number of customers using Omiya Station and the number of TJ liner passengers both increased. Additionally, we introduced the new limited express car Revaty and engaged in preparations for the launch of operations in April 2017. Moreover, we have been steadily working on preparations for the launch of steam locomotive (SL) comeback operations in August 2017 to further revitalize the Nikko/Kinugawa area. We also made the decision to open a new station called “Tobu World Square” in July 2017 to improve the convenience of access to the popular TOBU WORLD SQUARE theme park and increase navigability in the Nikko/Kinugawa area as a tourist destination. Lastly, we introduced tablets to be used by station attendants to provide information to customers and implemented an English conversation training program for all employees, including station attendants and train crew, as part of our efforts to improve service for foreign tourists.
In the transportation business overall, revenues from operations were ¥216,170 million (a decrease of 0.2% year on year). Although revenues increased in the railways business owing to the success of the timetable revision implemented in the previous year, the amount of freight handled in the freight business was down. On the other hand, operating income came to ¥40,696 million (an increase of 8.1% year on year), due primarily to the effect of lower fuel costs associated with the drop in crude oil prices.
Steam locomotive (SL) TAIJU
TJ liner
Limited Express Ryomo, SPACIA and Revaty
2013 2014 2015 2016
SALES RATIOBY SEGMENT211,346 216,660 211,960 216,631
2017
216,170
33.9%
Sales by Sector (¥ million)

6 TOBU RAILWAY CO., LTD.
Leisure
In the SKYTREE business, TOBU TOWER SKYTREE Co., Ltd. carried out various collaborative projects to attract a wider range of customers by creating news hooks. With date specific tickets, we offered a TEMBO DECK and TEMBO GALLERIA admission ticket set and introduced a morning discount for admission in the morning hours. Moreover, we finished the renovation work on the TEMBO Shuttle (elevators) that was started last year and developed a system that allows us to operate in stormy weather other than typhoons, and we can now welcome more visitors than before the renovation.
In the hotels business, we made the historic and time-honored KANAYA HOTEL Co., Ltd. a group company to build a new channel for attracting customers. We also made the decision to open THE RITZ-CARLTON, the luxury brand of the leading global hotel chain Marriott International, at the former site of Nikko Lakeside Hotel in the summer of 2020 and promoted efforts to capture the expected further increase in foreign tourists.
In the leisure business overall, revenues from operations were ¥76,792 million (a decrease of 2.8% year on year), while operating income was ¥6,791 million (a decrease of 17.3% year on year). This was due to the impact of elevator renovation work at TOKYO SKYTREE performed in anticipation of medium- to long-term operations, suspending Nikko Lakeside Hotel operations ahead of the opening of THE RITZ-CARLTON and bad weather.
TOKYO SKYTREE illumination
TEMBO GALLERIA
2013 2014 2015 2016
SALES RATIOBY SEGMENT
74,294 75,211 79,612 79,006
2017
76,792
12.0%
Sales by Sector (¥ million)
Review of Operations

7ANNUAL REPORT 2017
Real Estate
In the SKYTREE TOWN business, we worked to attract customers and increase revenues. As part of these efforts, we held various seasonal events at TOKYO SOLAMACHI®, and with our Christmas illuminations, we used projection mapping on TOKYO SKYTREE for the first time. We also brought in a café featuring popular characters like Kirby and Doraemon and opened an ice skating rink.
In the real estate leasing business, we invited a hospital to be the first one to be directly connected to one of our stations as part of our efforts to improve daily life value along railway lines, and it was opened on April 1, 2017. We have also invited day care centers and after school care centers in order to establish an environment convenient for families raising children, and as of April 1, 2017 we have a total of 13 such facilities.
In the real estate subdivision business, we sold condominiums, built-for-sale houses and land in order to raise the value of properties and increase the resident populations along our lines.
In the real estate business overall, revenues from operations were ¥55,828 million (an increase of 2.4% year on year) due primarily to an increase in the number of condominiums sold, and operating income was ¥14,394 million (an increase of 2.8% year on year).
Solaie Shimizu Park
Solamachi Shotengai Shopping District
2013 2014 2015 2016
SALES RATIOBY SEGMENT56,217 63,867 56,808 54,505
2017
55,828
8.7%
Sales by Sector (¥ million)

8 TOBU RAILWAY CO., LTD.
Retail Distribution
Other
In the retail distribution business, we worked to attract customers and secure profits. At the Ikebukuro branch of TOBU DEPARTMENT STORE, we opened the HANA 3 TERRACE event space and created a lively atmosphere where various events are held. At the Utsunomiya branch of TOBU UTSUNOMIYA DEPARTMENT STORE, we implemented the first large-scale renovation project in 21 years and worked to improve the satisfaction of our regular customers and acquire new ones in their 30s and 40s.
In the retail distribution business overall, revenues from operations were ¥194,915 million (a decrease of 2.3% year on year) as a result of sluggishness in consumer spending, but thanks to structural reform at TOBU DEPARTMENT STORE to secure recurring income, operating income was ¥1,897 million (an increase of 379.7% year on year).
In other businesses overall, due in part to an increase in construction completed, revenues from operations were ¥94,507 million (an increase of 3.8% year on year), and operating income was ¥6,196 million (an increase of 18.3% year on year).
TOKYO SKYTREE TOWN ProjectTOKYO SKYTREE TOWN, which has TOKYO SKYTREE at its core, is located in an area which covers approximately 6.4 hectares, adjoins Asakusa, Ueno, Ryogoku and other expansive areas that attract customers, and provides highly convenient transportation including good access to airports and the intersection of four railway networks.
In addition to the TOKYO SKYTREE, TOKYO SKYTREE TOWN is comprised of the TOKYO SOLAMACHI commercial facility, the TOKYO SKYTREE EAST TOWER office facility, and other features designed to create a prosperous urban development in collaboration with the surrounding areas, contributing to the further revitalization of the community.
HANA 3 TERRACE TOBU UTSUNOMIYA DEPARTMENT STORE
2013 2014 2015 2016
SALES RATIOBY SEGMENT209,437 207,809 205,055 199,442
2017
194,915
30.5%
Sales by Sector (¥ million)
Review of Operations

9ANNUAL REPORT 2017
Financial Review
Business Performance
Financial Position
In the railway business, the improvement in the employment situation led to an increase in commuters, and the Tojo Line timetable revision resulted in the launch of TJ Liner up-train operations and an increase in down-trains. In the real estate business, the increase in the number of condominium units sold was a factor for increased revenues, but due to sluggish performance of women’s clothing and high-priced items like jewelry in the department stores business and stagnation in the leisure business caused by bad weather, revenues were down. As a result, revenues from operations were ¥568,887 million (a decrease of 0.9% year on year).
Due primarily to the decrease in the cost of sales resulting from decreased revenues and the decrease in fuel costs associated with the drop in crude oil prices, operating income was ¥68,335 million (an increase of 6.1% year on year).
As for non-operating income, contributions toward small construction decreased, and as for non-operating expenses, interest expenses and financial fees were down. As a result, recurring income came to ¥62,128 million (an increase of 10.9% year on year).
These factors brought net income attributable to owners of the parent company to ¥36,137 million (an increase of 32.5% year on year).
Total assets were ¥1,597,733 million, up ¥5,257 million compared to the end of the previous consolidated fiscal year (an increase of 0.3% year on year). This was a result of increased purchases of property, plant and equipment.
Liabilities came in at ¥1,154,960 million, down ¥26,232 million compared to the end of the previous consolidated fiscal year (a decrease of 2.2% year on year) due primarily to a decrease in interest-bearing debt.
Net assets were ¥442,772 million, up ¥31,489 million compared to the end of the previous consolidated fiscal year (an increase of 7.7% year on year) owing primarily to the recording of net income attributable to owners of the parent company.
0
10,000
20,000
30,000
40,000
50,000
60,000
70,000
2013 2014 2015 2016 2017
* Shareholders’ Equity Ratio equals net assets attributable to shareholders’ as a percentage of total assets.
2013 2014 2015 2016 20170
5
10
15
20
25
30
Operating Income (Millions of yen) Shareholders’ Equity Ratio (%)

10 TOBU RAILWAY CO., LTD.
Corporate Governance
In order to repay the trust placed in Tobu Railway by its shareholders and many other stakeholders, the Company has an obligation to establish a fair and transparent system of corporate governance. Hitherto, internal management control has been carried out by our Board of Directors and Audit & Supervisory Board, but from here onward, we intend to further enhance the performance of this system with respect to the proactive disclosure of corporate information in a timely and appropriate manner. We will work to materialize the level of corporate governance expected of us by society as a whole through the maintenance of high ethical standards of behavior and legal compliance, and by dealing in good faith with all our customers and other business counterparties.
(1) Corporate governance structureThe Company’s Board of Directors consists of 16 directors, of whom two are outside directors. The Board’s responsibilities are to make decisions on issues of importance to the management of the Company, after due consideration and debate, and also to exercise supervisory functions over the execution of day-to-day business operations. In addition, the Board of Managing Directors, comprising directors of the Company with the rank of Managing Director or above and standing audit & supervisory board members, assists the Board of Directors by examining important issues, including those to be placed on the agenda for discussion by the Board of Directors, and by sharing with the Board information on significant matters gleaned from the actual conduct of business operations.
In an effort to ensure the reliability of the internal control system, establish corporate ethics, and ensure that its officers and all its employees are fully aware of compliance, the Company has been promoting compliance management, primarily by setting out specific guidelines for day-to-day activities and developing training systems. It is also seeking to develop a compliance management system on a Group level. The Company has established guidelines and organizations for its contingency management, and is in the process of creating an effective contingency management system. To prepare for the possible materialization of legal risks, the Company has developed a system in which advice can be sought from corporate lawyers through the General Affairs Department’s Legal Center. The Company is resolved to further strengthen its legal functions. To ensure the proper operation of the Tobu Group under the Group companies’ management rules, the Group business division that is specifically responsible for the management of subsidiaries and other companies manages and supports the business execution of subsidiaries and other companies. To further strengthen Group governance, Group management policies are communicated and management information is shared by holding Tobu Group Corporate Meetings and other meeting on a regular basis. In cooperation with its subsidiaries and other companies, the Company has developed a compliance management system for the entire Group. In addition, to raise the levels of fairness and transparency of the Group’s management, the Company conducts regular investor relations events, such as results briefings for analysts and tours of facilities in areas served by our railway stations. It also provides extensive corporate information on its website, and will continue to pursue a policy of openness in communications with investors and the general public in a prompt and appropriate manner.
Basic Corporate Governance Policies
Corporate Governance

11ANNUAL REPORT 2017
Regarding audits conducted by the audit & supervisory board members of the Company, each of the five audit & supervisory board members, of whom three are outside audit & supervisory board members, attends meetings of the Board of Directors. In addition, in accordance with auditing policies, auditing plans and the delegation of auditing operations, which have been drawn up to conform to the stipulations of the Auditing Standards for Audit & Supervisory Board Members, which were drawn up and published by the Audit & Supervisory Board, the audit & supervisory board members attend important meetings and peruse all documentation relevant to important management issues. The audit & supervisory board members also conduct audits of Tobu Group companies focused on specific issues, interview directors and general managers, hold meetings of audit & supervisory board members from all Group companies, attend analyst meetings, and investigate the business performance and financial situation of the parent company and other members of the Group. In these ways, the audit & supervisory board members evaluate the performance of Company directors’ duties, giving due consideration to the principles of risk management. The results of these evaluations are reported at meetings of the audit & supervisory board that are held on a regular basis. Through deliberations in the meetings, audit opinions are developed to ensure the effectiveness of auditing.
With respect to its internal auditing system, the Company has set up the Internal Audit Office under the Administration Department. The Office examines and evaluates the status of the execution of duties from the perspective of their legality and reasonability, and presents information obtained from the examinations and evaluations and advice and proposals for improvement to representative directors and related departments, including the Internal Control Department. In this way, the Company maintains appropriate operational management, and strives to improve its operations and streamline its management.
The accounting audit and auditing of internal control related to financial reports are provided by KPMG AZSA LLC, an audit firm that has signed an audit agreement with the Company as an independent organization.
(2) The Company’s internal control systemTobu Railway has drawn up policies regarding its internal control system which encompass a system for ensuring that the performance of duties by the members of the Board of Directors of the Company, both as a body and as individuals, is in conformity with the law and with the Company’s Articles of Incorporation, as well as a system for ensuring that business practices are appropriate.

12 TOBU RAILWAY CO., LTD.
Risks to which the Company’s Business is Subject
The following is a list of categories of material risk that could significantly impact the business performance and
financial position of the Group, and consequently could have a substantial effect on the decisions of investors.
The forecasts in the text below are based on the assessment of the Tobu Group as of the date of the Ordinary
General Meeting of Shareholders (June 23, 2017).
(1) Changes in the Law In the railway business in Japan, permission to engage in railway operations must be obtained from the Ministry of Land, Infrastructure, Transport and Tourism with respect to each railway line and each category of railway-related business under the Railway Business Law.
Under the Law, the initial setting and subsequent revision of fares by passenger transport operators must not exceed the upper limits approved by the Ministry. The railway operator must apply for permission to the Ministry each time it wishes to revise its fares within the approved upper limits.
Therefore, a change in the legal system and the revision of fares could have an impact on the business performance of the Company.
The business operation of the Company and other Group companies must also be in compliance with a variety of laws and regulations. A change in the relevant laws could, therefore, have a substantial effect on the business performance and/or financial position of the Group.
(2) Adverse demographic trendsIn Japan, the birthrate continues to decline as the population ages, and although it varies in degree according to the region, it is predicted that the population along Tobu railway lines will continue to shrink in association with this social phenomenon.
As the business operations of the Tobu Group are centered around railway operations serving areas within reach of the Group’s railway stations, phenomena such as a declining number of children, an increasing number of elderly people, and a general population decline over the long term could have a substantial effect on the business performance and/or financial position of the Group.
(3) Economic conditionsThe Tobu Group constantly invests in equipment in its business operations, and the funds required for these capital investments are raised principally through the issuing of corporate bonds or by borrowing from financial institutions. Because of these facts, an upward movement in interest rates in the future would increase the Group’s interest payment burden, and this could have a substantial effect on the business performance and/or financial position of the Group.
(4) Management of personal information As part of its various business operations, the Tobu Group accumulates and manages databases containing information on individual customers. The Group takes great care to manage and safeguard this personal data properly in such ways as establishing in-house protection regulations on the acquisition and use of the information, fully enforcing the information management by related parties by developing the management system, and strengthening the development and supervision of confidentiality agreements when outsourcing information processing. However, in the event that, for some reason, such information were to be divulged or stolen, this would have an adverse impact on the trustworthiness of the Group, which could have a substantial effect on the business performance and/ or financial position of the Group.
(5) Natural disasters As a railway service operator, the Tobu Group takes utmost care to ensure the safety of its services in order to win the trust of customers. However, in the event of an accident, a natural disaster, a terrorist attack, an act of war, or any other such external cause beyond the control of the Group, this could have a substantial effect on the business performance and/or financial position of the Group.
Moreover, the occurrence of unseasonable weather or weather that is otherwise exceptional, or an outbreak of an infectious disease, would have a negative impact on the business of tourism and leisure facilities, which would be likely to adversely affect the Group’s leisure operations and related businesses. In this event, there could be a substantial effect on the business performance and/or financial position of the Group.
The above is a list of the principal categories of risk thought to apply to the business operations of the Tobu Group, but it is not intended to be an exhaustive list of all risks.

13ANNUAL REPORT 2017
Five-Year Summary(Years ended March 31, TOBU RAILWAY CO.,LTD. and Subsidiaries)
ConsolidatedMillions of Yen
2013 2014 2015 2016 2017
Revenues from operations ........................................................ ¥ 577,223 ¥ 593,649 ¥ 583,268 ¥ 574,334 ¥ 568,887
Operating income ..................................................................... 52,544 56,013 53,158 64,399 68,335
Profit attributable to owners of parent ...................................... 28,648 31,521 30,653 27,277 36,137
Net assets ................................................................................. 327,739 354,066 394,826 411,282 442,772
Total assets ............................................................................... 1,463,370 1,480,938 1,596,725 1,592,475 1,597,733
Yen
Net income per share — basic ................................................. ¥26.81 ¥29.51 ¥28.7 ¥25.54 ¥33.76
Net income per share — diluted .............................................. 26.73 29.42 28.62 25.47 —
Sales by SectorMillions of Yen
2013 2014 2015 2016 2017
Transportation .......................................................................... ¥ 211,346 ¥ 216,660 ¥ 211,960 ¥ 216,631 ¥ 216,170
Leisure ...................................................................................... 74,294 75,211 79,612 79,006 76,792
Real estate ................................................................................ 56,217 63,867 56,808 54,505 55,828
Retail distribution ..................................................................... 209,437 207,809 205,055 199,442 194,915
Other ........................................................................................ 87,471 96,061 95,635 91,027 94,507
Non-ConsolidatedMillions of Yen
2013 2014 2015 2016 2017
Revenues from operations ........................................................ ¥ 221,847 ¥ 229,453 ¥ 221,825 ¥ 222,617 ¥ 223,761
Operating income ..................................................................... 33,528 34,534 37,430 47,334 50,597
Net income ............................................................................... 17,824 20,188 20,010 22,361 28,771
Net assets ................................................................................. 281,109 297,641 318,699 329,981 355,220
Total assets ............................................................................... 1,367,728 1,375,379 1,477,008 1,472,169 1,487,353
Yen
Dividends per share of common stock ..................................... ¥6 ¥6 ¥6 ¥6 ¥6.5

14 TOBU RAILWAY CO., LTD.
Consolidated Balance SheetMarch 31, 2016 and 2017
Millions of Yen
Assets 2016 2017
Current assets
Cash and deposits ................................................................................................................................... ¥ 32,746 ¥ 34,413
Notes and accounts receivable - trade .................................................................................................... 57,225 57,983
Short-term loans receivable .................................................................................................................... 710 1,306
Securities ................................................................................................................................................ 4 9
Land and buildings for sale in lots ......................................................................................................... 22,484 23,556
Prepaid expenses .................................................................................................................................... 2,009 2,118
Deferred tax assets .................................................................................................................................. 3,524 3,528
Other ....................................................................................................................................................... 29,906 23,383
Allowance for doubtful accounts ............................................................................................................ (252) (281)
Total current assets ................................................................................................................................. 148,359 146,017
Non-current assets
Property, plant and equipment
Buildings and structures, net .............................................................................................................. 562,306 *550,332
Machinery, equipment and vehicles, net............................................................................................. 77,542 79,475
Land .................................................................................................................................................... 618,385 621,526
Construction in progress ..................................................................................................................... 41,168 50,460
Other, net ............................................................................................................................................ 15,448 14,813
Property, plant and equipment, net ..................................................................................................... 1,314,851 1,316,608
Intangible assets
Public facilities charges ...................................................................................................................... 1,900 1,610
Other ................................................................................................................................................... 28,190 25,994
Total intangible assets ......................................................................................................................... 30,091 27,604
Investments and other assets
Investment securities........................................................................................................................... 68,980 75,287
Long-term loans receivable ................................................................................................................ 958 939
Claims provable in bankruptcy, claims provable in rehabilitation and other...................................... 887 875
Net defined benefit asset ..................................................................................................................... 1,971 1,998
Deferred tax assets .............................................................................................................................. 7,458 7,373
Other ................................................................................................................................................... 21,049 23,086
Allowance for doubtful accounts ........................................................................................................ (2,133) (2,058)
Total investments and other assets ...................................................................................................... 99,172 107,502
Total non-current assets .......................................................................................................................... 1,444,116 1,451,715
Total assets ................................................................................................................................................ ¥ 1,592,475 ¥ 1,597,733

15ANNUAL REPORT 2017
Millions of Yen
Liabilities 2016 2017
Current liabilitiesNotes and accounts payable - trade ........................................................................................................ ¥ 42,291 ¥ 40,704Short-term loans payable ........................................................................................................................ 55,435 54,609Current portion of long-term loans payable ........................................................................................... 73,418 69,615Current portion of bonds ........................................................................................................................ 31,000 23,600Accrued expenses ................................................................................................................................... 6,172 5,954Accrued consumption taxes .................................................................................................................... 3,470 2,222Income taxes payable ............................................................................................................................. 8,570 11,015Advances received .................................................................................................................................. 61,409 61,995Provision for bonuses ............................................................................................................................. 2,417 2,600Allowance for collection loss on gift certificates and other items .......................................................... 4,100 4,194Asset retirement obligations ................................................................................................................... 39 66Provision for loss on disaster .................................................................................................................. 139 —Other ....................................................................................................................................................... 81,573 78,266Total current liabilities ............................................................................................................................ 370,039 354,845
Non-current liabilitiesBonds payable ........................................................................................................................................ 127,000 134,400Long-term loans payable ........................................................................................................................ 501,152 486,755Long-term accounts payable to Japan railway construction, transport and technology agency .................. 31,917 27,230Deferred tax liabilities ............................................................................................................................ 11,424 12,482Deferred tax liabilities for land revaluation ............................................................................................ 50,484 50,421Provision for directors' retirement benefits ............................................................................................ 856 771Net defined benefit liability .................................................................................................................... 48,235 48,473Asset retirement obligations ................................................................................................................... 2,830 2,771Other ....................................................................................................................................................... 37,250 36,809Total non-current liabilities .................................................................................................................... 811,153 800,115
Total liabilities ........................................................................................................................................... 1,181,193 1,154,960
Net assets
Shareholders’ equityCapital stock ........................................................................................................................................... 102,135 102,135Capital surplus ........................................................................................................................................ 70,576 70,484Retained earnings ................................................................................................................................... 152,735 180,765Treasury stock ........................................................................................................................................ (2,501) (2,567)Total shareholders’ equity ...................................................................................................................... 322,947 350,818
Accumulated other comprehensive income ...............................................................................................
Valuation difference on available-for-sale securities .............................................................................. 19,216 21,830Revaluation reserve for land ................................................................................................................... 44,992 46,497Foreign currency translation adjustment ................................................................................................ 143 99Remeasurements of defined benefit plans .............................................................................................. 3,890 2,624Total accumulated other comprehensive income .................................................................................... 68,242 71,051
Non-controlling interests ............................................................................................................................ 20,092 20,901Total net assets ........................................................................................................................................... 411,282 442,772
Total liabilities and net assets ...................................................................................................................... ¥ 1,592,475 ¥ 1,597,733

16 TOBU RAILWAY CO., LTD.
Millions of Yen
Consolidated Statement of Income 2016 2017
Revenues from operations ........................................................................................................................... ¥ 574,334 ¥ 568,887Operating expenses
Operating expenses and cost of sales of transportation.............................................................................. 398,257 393,777Selling, general and administrative expenses ............................................................................................. 111,677 106,774Total operating expenses ............................................................................................................................ 509,934 500,552
Operating income (loss) ................................................................................................................................. 64,399 68,335Non-operating income
Interest income ........................................................................................................................................... 50 32Dividend income ........................................................................................................................................ 1,347 1,511Dividends income of insurance .................................................................................................................. 455 468Share of profit of entities accounted for using equity method ................................................................... 89 115Other ........................................................................................................................................................... 2,648 2,411Total non-operating income ....................................................................................................................... 4,591 4,539
Non-operating expensesInterest expenses ........................................................................................................................................ 9,128 7,963Other ........................................................................................................................................................... 3,856 2,783Total non-operating expenses ..................................................................................................................... 12,985 10,746
Ordinary income (loss) .................................................................................................................................. 56,006 62,128Extraordinary income
Contribution for construction ..................................................................................................................... 11,726 5,741Gain on sales of investment securities ....................................................................................................... 42 1,478Other ........................................................................................................................................................... 1,086 1,819Total extraordinary income ........................................................................................................................ 12,854 9,039
Extraordinary lossesLoss on retirement of non-current assets ................................................................................................... 3,143 2,018Loss on reduction of non-current assets ..................................................................................................... 11,771 5,782Impairment loss .......................................................................................................................................... 1,758 4,648Loss on disaster .......................................................................................................................................... 1,155 —Provision for loss on disaster ..................................................................................................................... 139 —Special extra retirement payments ............................................................................................................. 3,110 —Other ........................................................................................................................................................... 1,202 1,901Total extraordinary losses ........................................................................................................................... 22,281 14,351
Income before income taxes .......................................................................................................................... 46,580 56,816Income taxes - current .................................................................................................................................... 17,688 18,486Income taxes - deferred .................................................................................................................................. 295 1,188Total income taxes ......................................................................................................................................... 17,983 19,675Profit (loss) ..................................................................................................................................................... 28,596 37,141Profit (loss) attributable to non-controlling interests ..................................................................................... 1,319 1,004Profit attributable to owners of parent ............................................................................................................ 27,277 36,137
Millions of Yen
Consolidated Statement of Comprehensive Income 2016 2017
Profit (loss) ..................................................................................................................................................... 28,596 37,141Other comprehensive income
Valuation difference on available-for-sale securities ................................................................................. (9,986) 2,594Revaluation reserve for land ....................................................................................................................... 1,918 (52)Foreign currency translation adjustment .................................................................................................... (5) (44)Remeasurements of defined benefit plans, net of tax ................................................................................. 1,049 (1,241)Share of other comprehensive income of entities accounted for using equity method .............................. (99) (9)Total other comprehensive income ............................................................................................................. (7,122) 1,246
Comprehensive income .................................................................................................................................. 21,473 38,387Profit attributable toComprehensive income attributable to owners of parent ........................................................................... 20,159 37,387Comprehensive income attributable to non-controlling interests ............................................................... 1,313 1,000
Consolidated Statements of Income and Comprehensive IncomeYears ended March 31, 2016 and 2017

17ANNUAL REPORT 2017
Consolidated Statement of Changes in EquityPrevious Consolidated Fiscal Year (April 1, 2015 to March 31, 2016)
Millions of Yen
Shareholders’ equity
Capital stock Capital surplusRetained earnings Treasury stock
Total shareholders’
equity
Balance as of April 1, 2015 .......................................... ¥102,135 ¥70,398 ¥131,681 ¥(3,872) ¥300,343Cumulative effects of changes in accounting policies ... (99) (99)
Restated balance ............................................................. 102,135 70,398 131,582 (3,872) 300,244Changes of items during period
Dividends of surplus.................................................... (6,406) (6,406)Profit (loss) attributable to owners of parent ............... 27,277 27,277Purchase of treasury stock ........................................... (117) (117)Disposal of treasury stock ........................................... 163 1,489 1,652Change of scope of consolidation ............................... 9 9Reversal of revaluation reserve for land ...................... 271 271Change in parent company equity associated with transactions with non-controlling shareholders .......... 14 14Net changes of items other than shareholders' equity ...
Total changes of items during period .............................. — 177 21,152 1,371 22,702Balance as of March 31, 2016 ....................................... ¥102,135 ¥70,576 ¥152,735 ¥(2,501) ¥322,947
Accumulated other comprehensive income
Non-controlling
interests
Total net assets Valuation
difference on available-for-sale securities
Valuation difference on available-for-sale securities
Revaluation reserve for
land
Foreign currency
translation adjustment
Remeasurements of defined
benefit plans
Accumulated other
comprehensive income
Balance as of April 1, 2015 ........................................... ¥29,219 ¥43,344 ¥148 ¥2,956 ¥75,669 ¥18,813 ¥394,826Cumulative effects of changes in accounting policies ... — (99)
Restated balance .............................................................. 29,219 43,344 148 2,956 75,669 18,813 394,727Changes of items during period
Dividends of surplus.................................................... (6,406)Profit (loss) attributable to owners of parent ............... 27,277Purchase of treasury stock ........................................... (117)Disposal of treasury stock ........................................... 1,652Change of scope of consolidation ............................... 9Reversal of revaluation reserve for land ...................... 271Change in parent company equity associated with transactions with non-controlling shareholders .......... 14Net changes of items other than shareholders’ equity... (10,002) 1,648 (5) 933 (7,426) 1,279 (6,147)
Total changes of items during period .............................. (10,002) 1,648 (5) 933 (7,426) 1,279 16,555Balance as of March 31, 2016 ....................................... ¥19,216 ¥44,992 ¥143 ¥3,890 ¥68,242 ¥20,092 ¥411,282

18 TOBU RAILWAY CO., LTD.
Consolidated Fiscal Year Under Review (April 1, 2016 to March 31, 2017)
Millions of Yen
Shareholders’ equity
Capital stock Capital surplusRetained earnings Treasury stock
Total shareholders’
equity
Balance as of April 1, 2016 ........................................... ¥102,135 ¥70,576 ¥152,735 ¥(2,501) ¥322,947Cumulative effects of changes in accounting policies ... — —
Restated balance .............................................................. 102,135 70,576 152,735 (2,501) 322,947Changes of items during period
Dividends of surplus.................................................... (6,422) (6,422)Profit (loss) attributable to owners of parent ............... 36,137 36,137Purchase of treasury stock ........................................... (69) (69)Disposal of treasury stock ........................................... 0 3 4Change of scope of consolidation ............................... (125) (125)Reversal of revaluation reserve for land ...................... (1,559) (1,559)Change in parent company equity associated with transactions with non-controlling shareholders .......... (92) (92)Net changes of items other than shareholders' equity ...
Total changes of items during period .............................. — (91) 28,029 (65) 27,871Balance as of March 31, 2017 ....................................... ¥102,135 ¥70,484 ¥180,765 ¥(2,567) ¥350,818
Accumulated other comprehensive income
Non-controlling
interests Total net assets
Valuation difference on available-for-sale securities
Revaluation reserve for
land
Foreign currency
translation adjustment
Remeasurements of defined
benefit plans
Accumulated other
comprehensive income
Balance as of April 1, 2016 ........................................... ¥19,216 ¥44,992 ¥143 ¥3,890 ¥68,242 ¥20,092 ¥411,282Cumulative effects of changes in accounting policies ... — —
Restated balance .............................................................. 19,216 44,992 143 3,890 68,242 20,092 411,282Changes of items during period
Dividends of surplus.................................................... (6,422)Profit (loss) attributable to owners of parent ............... 36,137Purchase of treasury stock ........................................... (69)Disposal of treasury stock ........................................... 4Change of scope of consolidation ............................... (125)Reversal of revaluation reserve for land ...................... (1,559)Change in parent company equity associated with transactions with non-controlling shareholders .......... (92)Net changes of items other than shareholders’ equity... 2,614 1,504 (44) (1,265) 2,809 808 3,617
Total changes of items during period .............................. 2,614 1,504 (44) (1,265) 2,809 808 31,489Balance as of March 31, 2017 ....................................... ¥21,830 ¥46,497 ¥99 ¥2,624 ¥71,051 ¥20,901 ¥442,772

19ANNUAL REPORT 2017
Consolidated Statement of Cash FlowsYears ended March 31, 2016 and 2017
Millions of Yen
2016 2017
Cash flows from operating activitiesIncome (loss) before income taxes and minority interests ......................................................................... ¥ 46,580 ¥ 56,816Depreciation ............................................................................................................................................... 52,912 52,780Impairment loss .......................................................................................................................................... 1,758 4,648Share of (profit) loss of entities accounted for using equity method ......................................................... (89) (115)Increase (decrease) in allowance for doubtful accounts ............................................................................. (188) (46)Increase (decrease) in provision for bonuses ............................................................................................. 181 183Increase (decrease) in provision for loss on disaster .................................................................................. 139 (139)Increase (decrease) in net defined benefit liability ..................................................................................... (1,971) (1,645)Increase (decrease) in provision for retirement benefits and directors' retirement benefits ....................... (284) (59)Increase (decrease) in allowance for collection loss on gift certificates and other items ........................... 253 93Interest and dividend income ..................................................................................................................... (1,397) (1,544)Interest expenses ........................................................................................................................................ 9,128 7,963Proceeds from contribution for construction .............................................................................................. (12,425) (6,006)Loss on retirement of non-current assets ................................................................................................... 2,999 1,824Loss on reduction of non-current assets ..................................................................................................... 11,771 5,782Special extra retirement payments ............................................................................................................. 3,110 —Decrease (increase) in notes and accounts receivable - trade .................................................................... (348) (740)Decrease (increase) in inventories .............................................................................................................. (4,676) 491Increase (decrease) in notes and accounts payable - trade ......................................................................... 551 (1,624)Other ........................................................................................................................................................... 615 (5,090)Subtotal ...................................................................................................................................................... 108,620 113,571Interest and dividend income received ....................................................................................................... 1,408 1,546Interest expenses paid................................................................................................................................. (10,443) (8,059)Special extra retirement payments ............................................................................................................. (133) (2,977)Income taxes (paid) refund ......................................................................................................................... (21,337) (16,609)Cash flows from operating activities .......................................................................................................... 78,114 87,470
Cash flows from investing activitiesNet decrease (increase) in short-term loans receivable .............................................................................. 101 (571)Payments of long-term loans receivable .................................................................................................... (3) (24)Collection of long-term loans receivable ................................................................................................... 8 18Purchase of short-term and long-term investment securities ..................................................................... (1,850) (3,512)Proceeds from sales and redemption of short-term and long-term investment securities .......................... 5,406 1,924Purchase of investments in subsidiaries resulting in change in scope of consolidation ............................. — (318)Payments for sales of investments in subsidiaries resulting in change in scope of consolidation ............. — (310)Purchase of property, plant and equipment and intangible assets .............................................................. (80,217) (66,990)Proceeds from sales of property, plant and equipment and intangible assets ............................................ 501 1,099Proceeds from contribution received for construction ............................................................................... 10,967 12,945Payments for guarantee deposits ................................................................................................................ (128) (218)Proceeds from collection of guarantee deposits ......................................................................................... 1,517 306Other ........................................................................................................................................................... 103 (229)Cash flows from investing activities ........................................................................................................... (63,593) (55,881)
Cash flows from financing activitiesNet increase (decrease) in short-term loans payable .................................................................................. (84,269) 1,191Proceeds from long-term loans payable ..................................................................................................... 146,638 53,513Repayments of long-term loans payable .................................................................................................... (62,814) (72,568)Proceeds from issuance of bonds ............................................................................................................... 25,000 31,000Redemption of convertible bonds ............................................................................................................... (24,820) (31,000)Net decrease (increase) in treasury stock ................................................................................................... (115) (65)Cash dividends paid ................................................................................................................................... (6,412) (6,431)Redemption of accounts payable to Japan railway construction, transport and technology agency ......... (4,793) (4,862)Dividends paid to non-controlling interests ............................................................................................... (7) (7)Other ........................................................................................................................................................... (508) (677)Cash flows from financing activities .......................................................................................................... (12,102) (29,907)
Effect of exchange rate change on cash and cash equivalents ....................................................................... (12) (39)Net increase (decrease) in cash and cash equivalents .................................................................................... 2,406 1,640Cash and cash equivalents at beginning of period ......................................................................................... 30,051 32,477Increase (decrease) in cash and cash equivalents resulting from change of scope of consolidation ............. 19 —Cash and cash equivalents at end of period ................................................................................................... ¥ 32,477 ¥ 34,118

20 TOBU RAILWAY CO., LTD.
Corporate Directory
Board of Directors and the Audit & Supervisory Board (As of July 1, 2017)
President and Representative DirectorYoshizumi Nezu
Vice President and Representative DirectorKenichi Tsunoda
Senior Managing Directors andRepresentative DirectorsOsamu MakinoShinji InomoriHiroaki Miwa
Managing DirectorsAkihiro OjiroYutaka TsuzukiYoshimi YokotaKoichi Sekiguchi
DirectorsYasuyoshi OkumaToshiaki OnoderaHiroya OtsukaTakashi KobiyamaTsutomu YamamotoNoriko YagasakiHirofumi Nomoto
Audit & Supervisory Board MembersNaotaka Nakajima (Standing)Ikuo Toyoda (Standing)Osamu ShodaYuzaburo MogiTakashi Kobayashi
TOBU RAILWAY CO., LTD. Registered Office:1-2 Oshiage 1-chome, Sumida-ku,Tokyo 131-8522, Japanhttp://www.tobu.co.jp/
Head Office:18-12 Oshiage 2-chome, Sumida-ku,Tokyo 131-8522, Japan
Date of Establishment:November 1897
Number of Employees:3,476
Common Stock:¥102,135 million
Number of Shareholders:67,332
Principal Shareholders:
Name
Number of Shares Held(Thousands)
Percentage of Total Shares
in Issue
The Master Trust Bank of Japan, Ltd. (trust account) ............ 57,662 5.38Japan Trustee Services Bank, Ltd. (trust account) ................ 46,324 4.32Fukoku Mutual Life Insurance Company ............................... 26,178 2.44Mizuho Bank, Ltd. ................................................................ 23,266 2.17Japan Trustee Services Bank, Ltd. (trust account 5) ............ 19,634 1.83Nippon Life Insurance Company .......................................... 17,709 1.65The Bank of Tokyo-Mitsubishi UFJ, Ltd. ............................... 17,523 1.63STATE STREET BANK WEST CLIENT- TREATY 505234 ....... 17,282 1.61Japan Trustee Services Bank, Ltd. (trust account 7) ............ 14,448 1.34Japan Trustee Services Bank, Ltd. (trust account 1) ............ 14,445 1.34
Securities Traded:Common StockTokyo Stock Exchange, 1st Section
Transfer Agent and Registrar:Sumitomo Mitsui Trust Bank, Limited4-1, Marunouchi 1-chome, Chiyoda-ku,Tokyo 100-8233, Japan
Annual Meeting of Shareholders:The annual meeting of shareholders is normally held in June.
Investor Information (As of March 31, 2017)

Tobu Railway Lines (major stations only)
TOKYO CHIBA
SAITAMA
GUNMATOCHIGI
TTatebayashiatebayashi
ŌtaŌtaIsesakiIsesaki
Tōbu-dōbutsu-kōenTōbu-dōbutsu-kōen
KurihashiKurihashiKukiKuki
Shin-tochigiShin-tochigi
Tōbu-nikkōTōbu-nikkō
KameidoKameido
DaishimaeDaishimae
FunabashiFunabashi
KashiwaKashiwa
Nagareyama-ōtakanomoriNagareyama-ōtakanomori
Shin-kamagayaShin-kamagaya
KuzūKuzū
AkagiAkagi
Nishi-koizumiNishi-koizumiHigashi-koizumiHigashi-koizumi
Tōbu-utsunomiyaTōbu-utsunomiya
Shin-fujiwaraShin-fujiwaraKinugawa-onsenKinugawa-onsen
Shimo-imaichiShimo-imaichi
IkebukurIkebukurooTOKYO SKYTREETOKYO SKYTREE
WakōshiWakōshi
KawagoeKawagoeSakadoSakado
YYoriiorii
OgoseOgose
KasukabeKasukabeŌmiyaŌmiya
Shin-koshigayaShin-koshigaya
NishiaraiNishiaraiKita-senjuKita-senju
OshiageOshiage
HikifuneHikifune
AsakusaAsakusa
Tōbu Main LineIsesaki Line Sano Line
Nikkō Line Kiryū LineKameido Line Koizumi Line
Daishi Line Utsunomiya Line
Noda Line Kinugawa Line
Tōbu Tōjō LineTōjō Main Line Ogose Line
* The Isesaki Line between Asakusa/Oshiage Station and Tōbu-dōbutsu-kōen Station is nicknamed “TOBU SKYTREE Line”* The Noda Line is nicknamed “TOBU URBAN PARK Line”
TOBU RAILWAY CO., LTD.Head Office:18-12 Oshiage 2-chome, Sumida-ku, Tokyo 131-8522, Japanhttp://www.tobu.co.jp/foreign/en/