annual report 2019 · 2020. 3. 30. · otsuka corporation annual report 2019 1 consolidated...
TRANSCRIPT

ANNUAL REPORT 2019For the fiscal year ended December 31, 2019
Forward-looking StatementsThe forecasts, plans and outlooks concerning future operating results that are described in this Annual Report are judgments believed to be reasonable by the Company’s management, based upon the information available to OTSUKA CORPORATION and member companies of the OTSUKA Group at the time such future projections were created. Various factors that form the basis of these forward-looking statements may differ from the OTSUKA Group’s assumptions, and actual results may differ significantly from those presented here. Such factors include changes in the economic situation in principal markets and in product demand, and changes in various domestic and international regulations, accounting standards and customary business practices.
C O N T E N T SConsolidated Financial Highlights 1
To Our Shareholders and Investors 2
Overview of Consolidated Operations 3
Focusing Efforts on the Accumulated Business 7
OTSUKA CORPORATION —A Partner to Our Customers 10
OTSUKA CORPORATION — Backed by a Diverse Range
of Customers 11
Overview of Key Strategic Businesses (Non-consolidated) 12
OTSUKA CORPORATION’s Web Services (ASP) 13
Outlook for Fiscal 2020 14
Social Contribution and Environmental Protection Activities 16
Corporate Governance 18
Directors and Audit & Supervisory Board Members 32
Business Risks 33
Financial Section 34
Corporate Data 70
Principal Group Companies 70
Stock Information 71
Mission StatementMission
OTSUKA CORPORATION serves a wide range of companies,providing comprehensive support for their business activities bypresenting, within a concrete framework, new businessopportunities and management improvement strategies broughtabout by innovations in information and telecommunicationtechnology. By so doing, we continue to facilitate the growth of ourclient companies and contribute to the development of our countryand the creation of a spiritually enriching society.
Goals• To become a corporate group that is recognized and trusted as
a valuable corporate citizen.• To encourage employee growth and self–realization through the
attainment of personal goals and professional achievement.• To demonstrate harmonious coexistence and growth with nature
and society.• To create business models that consistently keep pace with the
changing times.
Principles• Always thinking from the customer’s perspective and acting
through harmonious team work.• Maintaining the spirit of challenge inherited from our
predecessors, exercising our own critical judgment, and actingon our own initiative.
• Fully complying with all prevailing laws and regulations, andmaintaining high ethical standards.

OTSUKA CORPORATION Annual Report 2019 1
Consolidated Financial Highlights
OTSUKA CORPORATION and Consolidated SubsidiariesYears ended December 31, 2017, 2018 and 2019
Millions ofyen
Thousands ofU.S. dollars %
2017 2018 2019 2019 Change
Net sales ¥691,166 ¥759,871 ¥886,536 $8,092,527 +16.7 System Integration business 408,718 463,293 578,698 5,282,508 +24.9 Service and Support business 282,064 296,577 307,837 2,810,019 +3.8 Other business 383 — — — —Operating profit 44,386 48,058 62,192 567,709 +29.4Ordinary profit 45,460 49,285 63,706 581,527 +29.3Profit before income taxes 45,363 49,100 62,668 572,058 +27.6Profit attributable to owners of parent 31,560 33,601 43,497 397,057 +29.4
Total assets 380,317 406,732 461,812 4,215,536 +13.5Interest-bearing debt 8,873 8,256 8,807 80,394 +6.7Equity 212,897 229,726 259,328 2,367,219 +12.9
Earnings per share (EPS) (Yen and U.S. dollars) 166.46 177.22 229.42 2.09 +29.4Dividend per share of common stock (Yen and U.S. dollars)
70.00 85.00 110.00 1.00 +29.4
Cash flows from operating activities per share (Yen and U.S. dollars)
190.68 203.83 257.18 2.35 +26.2
Operating profit to Net sales ratio (%) 6.42 6.32 7.02 —Profit to Net sales ratio* (%) 4.57 4.42 4.91 —Interest-bearing debt ratio (%) 2.33 2.03 1.91 —Equity ratio (%) 55.98 56.48 56.15 —Return on equity (ROE) (%) 15.67 15.18 17.79 —
Notes:
* Profit stands for Profit attributable to owners of parentEquity = Total net assets - Share subscription rights - Non-controlling interestsFigures for ROE are calculated using average equity.U.S. dollar amounts are computed using the December 31, 2019 exchange rate of ¥109.55 = US$1.Otsuka Auto Service Co., LTD., which was a consolidated subsidiary, was excluded from consolidation from the fiscal year 2018 due to its reduced impact on consolidated business results. Along with this, the Other business segment is not listed from the fiscal year 2018 due to the absence of business results.The Company conducted a 2-for-1 stock split for shares of common stock of the Company with April 1, 2018 as the effective date. Accordingly, the amount of Per Share Data is calculated based on the assumption that the share split was conducted at the beginning of the fiscal year 2017.
Note:
Sums of less than a million yen are rounded down.
■System Integration business■Service and Support business■Other business
2017 2018 20190
100,000
200,000
300,000
400,000
900,000
600,000
700,000
800,000
500,000
■Total assets■Interest-bearing debt
2019201820170
100,000
500,000
200,000
300,000
400,000
10,000
20,000
70,000
40,000
50,000
60,000
30,000
■Operating profit■Ordinary profit■Profit attributable to owners of parent
02017 20192018
Net sales� (Millions of yen)
Total assets,Interest-bearing debt� (Millions of yen)
Operating profit, Ordinary profit, Profit attributable to owners of parent� (Millions of yen)

2 OTSUKA CORPORATION Annual Report 2019
To Our Shareholders and Investors
I am pleased to announce the results for the fiscal year ended
December 31, 2019 and to thank our shareholders and investors for
their loyal support.
During the fiscal year, the Japanese economy continued a
moderate recovery and corporate IT investments trended firmly. The
OTSUKA Group worked to propose added-value solutions in
accordance with customer needs through its regional-led business
management structure.
As a result, net sales increased 16.7% from the previous fiscal
year to ¥886,536 million. At the earnings level, operating profit
increased 29.4% to ¥62,192 million, ordinary profit increased 29.3%
to ¥63,706 million and profit attributable to owners of parent
increased 29.4% to ¥43,497 million. This marked the 10th
consecutive year of increases in sales and profits.
Management has resolved to pay year-end dividends per share of
¥110 in line with our efforts to return profits to shareholders, who
have given us their support. This also marked the 10th consecutive
year of an increase in dividends.
In the coming fiscal year, corporate IT investments are expected
to be firm. Within this environment, we will further strengthen our
solution proposals that resolve issues faced by customers for their
entire office and ensure their satisfaction.
In working to realize our Mission Statement, the OTSUKA Group
will continue to pursue management reforms to ensure the trust of all
stakeholders. Your ongoing support is greatly appreciated as we move
forward with these endeavors.
Yuji Otsuka, President & Chief Executive Officer
March 2020

OTSUKA CORPORATION Annual Report 2019 3
Overview of Consolidated Operations
■ Japanese Economy Continues a Moderate Recovery During the fiscal year under review (January 1, 2019 to December 31, 2019), despite weakness in some areas, the Japanese economy continued a moderate recovery overall amid a pickup in personal consumption and a steadily improving employment situation. Under these economic conditions, a cautious stance toward the future was also seen due to concerns about a slowing Chinese economy resulting from U.S.-China trade issues as well as to worries about the impact of Japan-Korea issues. Nevertheless, with corporate earnings trending briskly at a high level and capital investment and software investment plans increasing, there was high interest in IT by Japanese companies due in part to a boost from such factors as government efforts to promote work style reform, demand for business supporting the adoption of IT and PC replacement demand, and corporate IT investments trended firmly.
■ Proposing Added-Value Solutions Within this environment, in keeping with the fiscal 2019 slogan “Leverage solutions from the perspective of customers and live up to customer trust,” the OTSUKA Group continued to strengthen relationships with customers under its regional-led business management. Under our “For the Entire Office” policy, we combined those products and services we are capable of providing and strived to make added-value solution proposals that meet the needs of our customers. The OTSUKA Group also hosted events and seminars, where we raised the “Office 2020 Problem”* and worked to stimulate IT demand. Additionally, our combined proposals and solution proposals, on which we have especially focused our efforts, are generating results that enabled us to provide a broad range of products and services.
Promote work style reform
IT investments trending firmly
Strengthening relationships with customers through regional-led
business management
Proposing added-value solutions
*�Office�2020�Problem:�This�refers�to�issues�involving�offices�that�will�occur�between�2019�and�2020.�Specifically,�these�issues�include�the�ending�of�production�of�fluorescent�lamps�and�mercury�lamps,�the�enforcement�of�laws�pertaining�to�work�style�reform,�an�increase�in�the�consumption�tax,�the�ending�of�support�for�Windows�7,�responses�to�cyberattacks�in�the�run-up�to�the�Tokyo�Olympics�and�the�formulation�of�company�BCPs�being�promoted�by�the�government.

4 OTSUKA CORPORATION Annual Report 2019
■ Sales and Profits Increase for the 10th Consecutive Year and Sales, Operating Profit, Ordinary Profit and Profit Attributable to Owners of Parent Reach Record-high Levels
As a result of the above measures, net sales increased 16.7% from the previous fiscal year to ¥886,536 million. At the profit level, operating profit rose 29.4% to ¥62,192 million. Ordinary profit increased 29.3% to ¥63,706 million and profit attributable to owners of parent was up 29.4% to ¥43,497 million.
Net cash provided by operating activities amounted to ¥48,762 million, an increase of ¥10,115 million from the previous fiscal year due to an increase in profit before income taxes. Net cash used in investing activities amounted to ¥7,934 million, a decrease of ¥3,162 million from the previous fiscal year due to a decrease in the purchase of investment securities. Net cash used in financing activities increased ¥2,751 million to ¥16,221 million due to an increase in cash dividends paid.
■ Cash Flows (Billions of yen)
(Millions of yen)
FY 2018 FY 2019
Amount AmountChange toLast Year
Net sales 759,871 886,536 +16.7%Operating profit 48,058 62,192 +29.4%Ordinary profit 49,285 63,706 +29.3%Profit* 33,601 43,497 +29.4%
*Profit attributable to owners of parent
■ Cash flows from operating activities ■ Cash flows from investing activities ■ Cash flows from financing activities
FY 2018 FY 2019FY 2017
50
40
30
20
10
0
-20
-10-5.2
-11.5
36.1
-11.0-13.4
38.6
-7.9
-16.2
48.7

OTSUKA CORPORATION Annual Report 2019 5
■ Net Sales Net sales posted double-digit increases in all quarters of the fiscal year and the uptrend in net sales has continued. Net sales in the first quarter (January-March) of 2019 amounted to ¥218,681 million, a 14.4% increase from the previous first quarter. Net sales in the second quarter (April-June) of 2019 amounted to ¥231,472 million, a 16.5% increase from the previous second quarter. Net sales in the third quarter (July-September) of 2019 amounted to ¥216,944 million, a 23.1% increase from the previous third quarter. Net sales in the fourth quarter (October-December) of 2019 amounted to ¥219,437 million, an increase of 13.3% over the previous fourth quarter.
■ Ordinary ProfitOrdinary profit posted double-digit increases in all quarters and has sustained high growth from the fourth quarter (October-December) of the previous year. Ordinary profit in the first quarter (January-March) of 2019 amounted to ¥15,087 million, an increase of 23.4% from the previous first quarter. Ordinary profit in the second quarter (April-June) of 2019 amounted to ¥19,623 million, an increase of 25.4% from the previous second quarter. Ordinary profit in the third quarter (July-September) of 2019 amounted to ¥12,677 million, an increase of 76.9% from the previous third quarter. Ordinary profit in the fourth quarter (October-December) of 2019 amounted to ¥16,318 million, up 14.5% from the previous fourth quarter.
Overview of Results by Quarter
Quarterly Net Sales� (Billions of yen) Quarterly Ordinary Profit� (Millions of yen)
■ FY2017 ■ FY2018 ■ FY2019
1Q 2Q 3Q 4Q
250
150
200
100
50
0
191.2 198.6176.2 193.7218.6 231.4
216.9219.4180.2 177.3
158.9174.6
■ FY2017 ■ FY2018 ■ FY2019
1Q 2Q 3Q 4Q
20,000
15,000
10,000
5,000
0
15,087
12,131
15,255
6,667
11,40412,222
15,645
7,167
14,250
19,623
12,677
16,318

6 OTSUKA CORPORATION Annual Report 2019
Overview of Business Segments
■ System Integration BusinessThe System Integration business provides optimized system services ranging from consulting to system design and development, transport and installation work and network construction. We recorded high growth in unit sales of PCs. Additionally, thanks also to responses to the increase in the consumption tax and system replacement demand, we also achieved smooth growth in sales of packaged software and consigned software. As a result, net sales increased 24.9% from the previous fiscal year to ¥578,698 million.
■ Service and Support BusinessThe Service and Support business provides customers with total service and support for their business operations and installed systems encompassing supplies, hardware and software maintenance, telephone support and outsourcing. We worked to strengthen the competitiveness of our “tanomail” office supply mail-order service business and also responded to the last-minute surge in demand prior to the increase in the consumption tax. The “tayoreru” support service business also recorded a steady growth in sales, which led to a 3.8% increase in net sales from the previous fiscal year to ¥307,837 million.
Note: Otsuka Auto Service Co., LTD., which was a consolidated subsidiary, was
excluded from consolidation from fiscal 2018 due to its reduced impact on
consolidated business results. Along with this, the Other business segment is
not listed from fiscal 2018 due to the absence of business results.
Net Sales by Segments� (Millions of yen)
■ System Integration business■ Service and Support business■ Other business
FY2017 FY2018 FY2019
200,000
400,000
600,000
1,000,000
800,000
0
691,166
383
408,718
282,064
759,871
463,293
296,577
886,536
578,698
307,837

OTSUKA CORPORATION Annual Report 2019 7
Focusing Efforts on the Accumulated Business
OTSUKA CORPORATION places special emphasis on office supply and maintenance agreement services as the “accumulated business” within the Service and Support business. The accumulated business is not easily impacted by fluctuations in the economy and is steadily achieving growth annually. As such, this can be said to be a cumulative or accumulation business. In fiscal 2019 as well, sales in the accumulated business grew steadily, increasing ¥13.0 billion, or 4.7%, to ¥293.0 billion. The accumulated business accounted for 36.5% of net sales (non-consolidated basis) due to high growth in the System Integration business. Since our public listing in 2000, net sales have increased ¥211.5 billion, an approximately 260% increase. OTSUKA CORPORATION will continue to focus on the accumulated business as it works to raise the stability of its operations.
■ Accumulated Business (Non-consolidated)
Figures for 1999 are provided as a reference.
(Billions of yen) (%)
Net sales of supplies and Maintenance agreementsAccumulated business sales share
0
200
50
40
30
20
10
300
100
01999 2000 2001 2002 2003 2004 2005 2006 2007
88.881.5 83.6 89.7
102.0116.6
134.0
151.7
170.8
2008
184.0
2009
187.9
2010
195.5
2011
202.4
2012
212.8
2013
218.7
2014
228.4
2015
240.0
2016
250.6
2017
266.0
2018
280.0
2019
293.0
28.9
25.927.5
30.132.2
34.035.2
37.739.0
42.1
46.845.2 45.5 44.9
41.9 40.942.9 42.9 42.6
40.9
36.5
8 OTSUKA CORPORATION Annual Report 2019
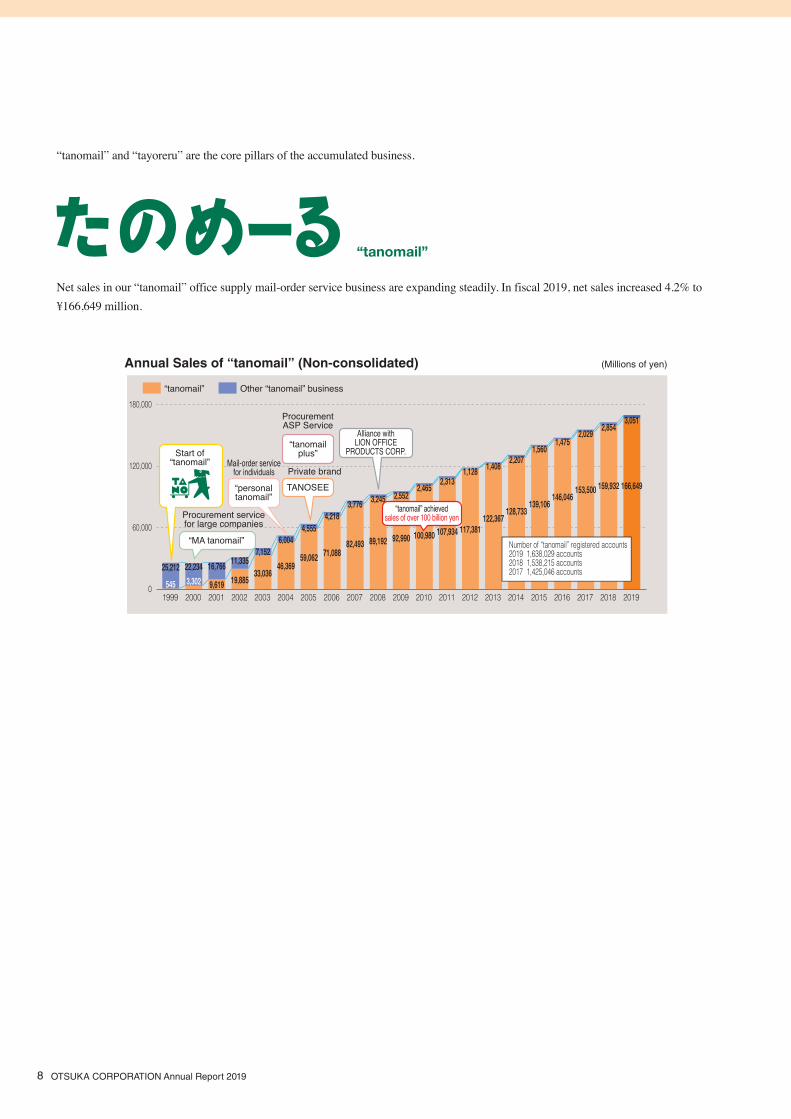
“tanomail” and “tayoreru” are the core pillars of the accumulated business.
Net sales in our “tanomail” office supply mail-order service business are expanding steadily. In fiscal 2019, net sales increased 4.2% to ¥166,649 million.
0
60,000
120,000
180,000
2008200720062005200420032002200120001999 2009 2010 2011 2012 2013 2014 2015 2016 2017 2018 2019
“tanomail” Other “tanomail” business
545 3,30225,212 22,234
9,619
16,76619,885
11,33533,036
7,15246,369
6,004
59,062
4,555
71,088
4,218
82,493
3,776
89,192
3,245
92,990
2,552
100,980
2,465
107,934
2,313
117,381
1,128
122,367
1,408
128,733
2,207
139,106
1,560
146,046
1,475
153,500
2,029
159,932
2,854
166,649
3,051
Start of“tanomail”
“personaltanomail”
Mail-order servicefor individuals
TANOSEE
“tanomail” achievedsales of over 100 billion yen
Private brand
“tanomailplus”
Alliance withLION OFFICE
PRODUCTS CORP.
ProcurementASP Service
Procurement servicefor large companies
“MA tanomail” Number of “tanomail” registered accounts 2019 1,638,029 accounts 2018 1,538,215 accounts 2017 1,425,046 accounts
Annual Sales of “tanomail” (Non-consolidated)� (Millions of yen)
“tanomail”

OTSUKA CORPORATION Annual Report 2019 9
The “tayoreru” support service business supports customers’ IT and business operations. OTSUKA CORPORATION aims to be an indispensable presence in customers’ business infrastructure.
“tayoreru”
“tayoreru”
OTSUKA CORPORATION supports IT and businessoperations of customers through “tayoreru.”
Customers’needs
Cost Reduction
ProductivityImprovement
Concentrate onRegular Business
IT SupportHardware MaintenanceSoftware Maintenance,
etc.
Procurement ASP servicePayroll business
support service, etc.
Business Support
“tayoreru”

10 OTSUKA CORPORATION Annual Report 2019
OTSUKA CORPORATION—A Partner to Our Customers
HR Dept.
Accounting Dept.
Information System Office
Server Room
Internet
Sales Dept.
General Affairs Dept.
President’s Office
OTSUKA CORPORATION offers one-stop solutions and even one-stop support for the entire offices of customers that integrates the various kinds of business equipment, information and telecommunication devices essential to corporate offices. OTSUKA CORPORATION aims to be a partner that grows together with our customers.
OTSUKA CORPORATION Annual Report 2019 11
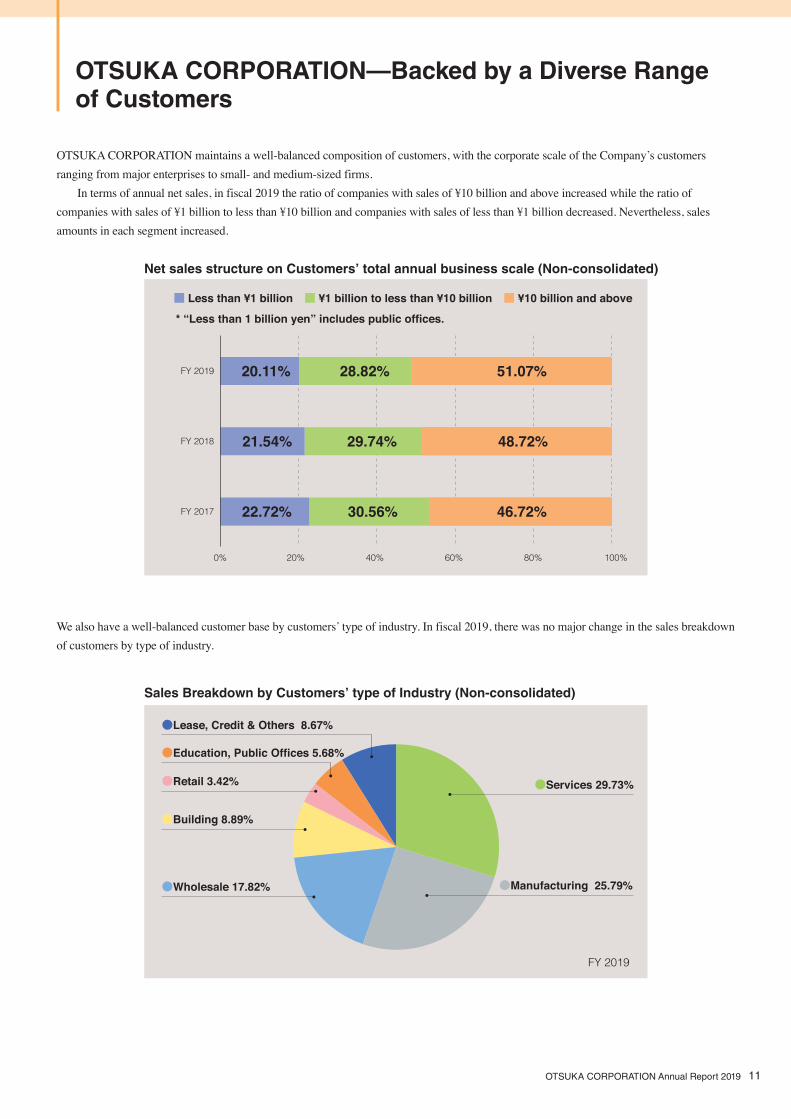
OTSUKA CORPORATION—Backed by a Diverse Range of Customers
OTSUKA CORPORATION maintains a well-balanced composition of customers, with the corporate scale of the Company’s customers ranging from major enterprises to small- and medium-sized firms. In terms of annual net sales, in fiscal 2019 the ratio of companies with sales of ¥10 billion and above increased while the ratio of companies with sales of ¥1 billion to less than ¥10 billion and companies with sales of less than ¥1 billion decreased. Nevertheless, sales amounts in each segment increased.
We also have a well-balanced customer base by customers’ type of industry. In fiscal 2019, there was no major change in the sales breakdown of customers by type of industry.
0% 20% 40% 60% 80% 100%
■ Less than ¥1 billion ■ ¥1 billion to less than ¥10 billion ■ ¥10 billion and above
* “Less than 1 billion yen” includes public offices.
FY 2018
FY 2019
FY 2017 22.72% 30.56% 46.72%
21.54% 29.74% 48.72%
20.11% 28.82% 51.07%
●Building 8.89%
●Retail 3.42% ●Services 29.73%
●Manufacturing 25.79%
FY 2019
●Wholesale 17.82%
●Education, Public Offices 5.68%
●Lease, Credit & Others 8.67%
Net sales structure on Customers’ total annual business scale (Non-consolidated)
Sales Breakdown by Customers’ type of Industry (Non-consolidated)

12 OTSUKA CORPORATION Annual Report 2019
Overview of Key Strategic Businesses(Non-consolidated)
<Amount of Sales>� (Millions of yen)
FY 2017 FY 2018 FY 2019
Amount Amount Change to Last Year Amount Change to Last Year
“tanomail” 153,500 159,932 +4.2% 166,649 +4.2%
SMILE 10,817 11,715 +8.3% 13,241 +13.0%
ODS 55,997 55,715 −0.5% 55,798 +0.1%
OSM 67,514 71,662 +6.1% 77,535 +8.2%
(ODS : Otsuka Document Solutions OSM : Otsuka Security Management)
<Reference: Number of Units Sold>� (Units)
Units Units Change to Last Year Units Change to Last Year
Copiers 43,807 41,046 −6.3% 37,930 −7.6%
(of which color copiers) 41,942 39,825 −5.0% 36,648 −8.0%
Servers 31,232 32,000 +2.5% 32,063 +0.2%
Personal computers 887,640 1,178,899 +32.8% 1,789,884 +51.8%
Client Total 927,835 1,222,643 +31.8% 1,830,498 +49.7%
Personal computers and client computers, which includes personal computers, registered high growth of approximately 50% in the number of units sold. Unit sales of copiers declined.

OTSUKA CORPORATION Annual Report 2019 13
OTSUKA CORPORATION’s Web Services (ASP)
■ Provision of services commenced in 1999. The number of users exceeded 2.62 million in 2019.
OTSUKA CORPORATION has been providing its main Web services since 1999. The number of users has been rising steadily, and in 2019, the number reached 2.62 million.
Number of Users of OTSUKA CORPORATION’s Main Web Services (ASP)
(Thousand people)
2.62 million people used services in 2019
2,000
1,000
01999 2000 2001 2002 2003 2004 2005 2006 2007 2008 2009 2010
1,039903
822722
638560509
384304
20881
4
2011
1,162
2013
1,439
2014
1,645
2015
1,783
2016
1,931
2017
2,110
2018
2,378
2019
2,627
2012
1,260

14 OTSUKA CORPORATION Annual Report 2019
Outlook for Fiscal 2020
■ Corporate IT Investments Expected to Remain Stable
In the future, the Japanese economy is forecast to sustain a moderate recovery in advance of such large-scale events as the Tokyo Olympics. Nevertheless, there is also expected to be some areas of weakness that include worsening business sentiment in manufacturing industries due to concerns about slowing external demand. Under these economic conditions, Japanese companies are maintaining a proactive stance toward capital investment and software investment. At the same time, companies are required to respond to laws concerning work style reform, strengthen their security and utilize such technologies as artificial intelligence (AI), the Internet of Things (IoT) and 5G. As a result, corporate IT investments are forecast to continue to trend firmly.
■ OTSUKA CORPORATION for the Entire Office
Given the above economic conditions and outlook for corporate IT investments, we will support small- and medium-sized enterprises that must respond to work style reform by proposing solutions that realize productivity improvements and cost reductions that exceed the costs of responding to these reforms while grasping market needs. Moreover, with the aim of forging new relationships with customers, we will leverage AI and other technologies to support sales activities, enhance center functions to respond to customers that cannot be covered by sales activities and enhance our Customer Personalized Pages* (Customer My Page) portal site for becoming closer to customers, as well as increase customer contact points and further enhance the efficiency of sales activities. Through these activities, the OTSUKA Group will work to turn one-time customers into lifelong customers, while under our “For the Entire Office” policy we will continue to provide high-added-value proposals that utilize the Group’s wide range of products and services, which is the Group’s strength. Besides these measures, we will continue to strengthen our lineup of office supplies and develop a lineup of maintenance services to bolster the accumulated business and enhance our earnings foundation based on stable and long-term business relationships with customers.
● Work style reforms, especially responses for SMEs and improving productivity
● Realize “Entire Office” by further raising customer satisfaction
● Update the 8.13 million units remaining in the Windows 7 corporate market
● Responses for realizing the Ministry of Education, Culture, Sports, Science and Technology (MEXT) GIGA school concept
● Full-fledged implementation of Otsuka Strategy II
“Leverage solutions from the perspective of customers and live up to customer trust.”
Policies and Measures in 2020
● Domestic economy is stable although there are areas of weakness
● Promotion of work style reforms as well as IT introduction at SMEs for boosting productivity
● Expansion of markets such as AI, IoT and 5G
● Large-scale events such as the Olympics and Paralympics
● Strong demand by companies for IT utilization and energy-saving
Market Environment in 2020
*�Customer�Personalized�Pages:�This�is�a�customer�portal�site�that�provides�numerous�customers�with�convenient�services�to�enable�us�to�get�closer�to�customers�and�help�create�relationships�with�customers�through�the�Web.

OTSUKA CORPORATION Annual Report 2019 15
■ Strategies by SegmentIn the System Integration business, we will respond to work style reform and identify needs for improving productivity and reducing costs. We will also promote comprehensive proposals and combined system proposals that combine products and services as we strengthen our solutions proposals. In the Service and Support business, the OTSUKA Group will upgrade and expand our lineup of products matched to customer needs and enhance our lineup of “TANOSEE” private brand products in “tanomail.” In our “tayoreru” support service business, we will develop services that enable customers to carry out their corporate activities securely and safely along with services that can help compensate for our customers’ shortages of IT personnel.
■ Forecast for Fiscal 2020In fiscal 2020 the Company forecasts a 2.5% decrease in consolidated net sales to ¥864,000 million, a 2.4% increase in operating profit to ¥63,700 million, a 1.4% increase in ordinary profit to ¥64,600 million and a 0.1% increase in profit attributable to owners of parent to ¥43,530 million. By segment, we forecast a 6.1% decrease in net sales to ¥543,550 million in the System Integration business and a 4.1% increase to ¥320,450 million in the Service and Support business. Our results forecast for fiscal 2020 is in accordance with average growth rates. The forecast for consolidated business results is shown above. Nonetheless, the OTSUKA Group will thoroughly implement the previously mentioned policies and activities and aim for increases in net sales, profits and dividends for the 11th consecutive fiscal year.
Forecast for Consolidated Net Sales and Profit� (Millions of yen)
Fiscal 2019 Fiscal 2020 (Forecast)
Amount Amount Change toLast Year
Net sales 886,536 864,000 ー2.5%Operating profit 62,192 63,700 +2.4%Ordinary profit 63,706 64,600 +1.4%Pprofit* 43,497 43,530 +0.1%
*Profit attributable to owners of parent
Forecast for Consolidated Net Sales by Segment� (Millions of yen)
Fiscal 2019 Fiscal 2020 (Forecast)
Amount Amount Change toLast Year
System Integration business 578,698 543,550 ー6.1%Service and Support business 307,837 320,450 +4.1%

16 OTSUKA CORPORATION Annual Report 2019
Social Contribution and Environmental Protection Activities
We undertake social contribution activities and environmental protection activities in aiming “to demonstrate harmonious coexistence and growth with nature and society,” which is one of the goals prescribed in our Mission Statement. Here we introduce noteworthy topics in 2019.
The “OTSUKA CORPORATION Heartful Fund,” an employee-company matching gift program, supports disaster-stricken regions and NPO organizations. In 2019, the fund focused especially on supporting disaster-stricken regions. Specifically, the fund donated ¥3,200,000 through the Japanese Red Cross Society to provide support following Typhoon No. 19 in September 2019. Additionally, we solicited projects that contribute to rebuilding and improving the welfare of disaster-stricken regions and provided a total of ¥2,828,000 to 10 organizations that passed our screening. Looking at a breakdown of these 10 organizations, eight organizations provide support in regions affected by the Great East Japan Earthquake, one group provides support related to the Kumamoto earthquakes and one organization provides support for the West Japan heavy rain disaster.
■ We Supported Disaster-Stricken Regions through the “OTSUKA CORPORATION Heartful Fund”
The�fund�supported�research�on�the�local�specialty�product�“Hoya”�at�Utatsu�junior�high�school�in�Minamisanriku,�Miyagi�Prefecture,�held�by�CREATAS�inc.
The�fund�supported�the�Children’s�Cafeteria�operated�by�the�Dream�Camp�Executive�Committee�in�Kesennuma�City,�Miyagi�Prefecture.

OTSUKA CORPORATION Annual Report 2019 17
■ Environmental Protection Activities through Tree Planting in BrazilAs a program commemorating OTSUKA CORPORATION’s 50th anniversary in 2011, we are planting Tasmanian blue gum trees to be used as a raw material for copy paper in Macapá, Amapa State, Brazil, and have named this program “Tanokun No Mori (TANO-kun Forest).” Tasmanian blue gum trees are fast growing and can be felled in approximately six years. Beginningwiththeuseoftreesfelledfrom2017,wehavecreated“TANO-KunForestαEco-Paper,”anoriginal“tanomail”copypaper. In commemoration of the 20th anniversary of “tanomail,” we donated ¥10 per package to social contribution organizations. We were able to donate a total of ¥415,920 to the Japan Committee for UNICEF, Japanese Red Cross Society and Guide Dog & Service Dog & Hearing Dog Association of Japan.
■ Holding Social Contribution SeminarsAs a seminar for employees, in March we invited Ms. Yoshiko Park, representative director of the Guide Dog & Service Dog & Hearing Dog Association of Japan, to give a lecture based on the theme of “barrier-free heart.” This association is the only organization in Japan that trains and certifies guide dogs, service dogs and hearing dogs. Participants learned about the concept of “barrier-free heart” indicated in the Universal Design 2020 Action Plan.
2011 2017�(Tree�felling�commenced.) TANO-Kun�Forest�αEco-Paper�

18 OTSUKA CORPORATION Annual Report 2019
Corporate Governance
Corporate Governance
1. Basic Stance Regarding Corporate GovernanceBased on a corporate ethic and spirit of compliance spelled out in its Mission Statement, the OTSUKA Group aims to adapt agilely to changes in the environment and augment its competitiveness by ensuring thorough compliance and raising both operational transparency and fairness.
2. Overview of the Corporate Governance System and Reason for Adopting This SystemA. Overview of the Corporate Governance SystemOTSUKA CORPORATION consists of various statutory bodies such as the General Meeting of Shareholders, Directors and Board of Directors, Audit & Supervisory Board Members and Audit & Supervisory Board and Independent Auditor. An Audit & Supervisory Board Members System has therefore been adopted. Additionally, the Company appoints outside directors and outside auditors with the aim of strengthening the monitoring of the execution of duties. With regard to outside directors and outside auditors, the Company selects and appoints individuals with a sufficient level of knowledge and experience regarding laws, financial affairs and accounting. The Board of Directors is chaired by Yuji Otsuka, President & Chief Executive Officer, and consists of 12 persons, including two outside directors, and the Board of Directors meets regularly once a month in principle to discuss and make decisions on critical management issues requiring resolution based on relevant laws and the Articles of Incorporation, and monitors the execution of duties by directors. The introduction of the Executive Officer System aims to separate the functions of business execution and supervision in order to realize more rapid decision-making on operational matters and strengthen the oversight of the Board of Directors. To this end, Executive Officers elected by the Board of Directors are responsible for the execution of business operations while the Board of Directors and Audit & Supervisory Board Members handle the oversight of business execution. There are 33 Executive Officers, including eight with a concurrent post of Director. The Audit & Supervisory Board is chaired by Naoto Minai, Standing Audit & Supervisory Board Member, and is comprised of four auditors (one full-time auditor, three part-time auditors), including three outside auditors. The Audit & Supervisory Board prescribes auditing policies and annual plans, receives reports on important auditing-related matters and carries out discussions. The Audit & Supervisory Board Members attend such important meetings as the Board of Directors meetings to provide appropriate recommendations and advice, monitor that suitable management is being carried out and closely audit the execution of duties by Directors.
Group Management Meetings, chaired by Norihiko Moriya, Managing Director & Operating Officer, and comprising and including four top management of all Group companies (Special Executive Officers), are also held to clarify operational conditions at each company and make progress in achieving profit targets in addition to working to strengthen corporate governance.

OTSUKA CORPORATION Annual Report 2019 19
The structure for corporate management decision-making, business operations and oversight is as follows:
Society, Shareholders, Investors, Customers, Trading Partners, Employees and Other Stakeholders
Audit & Supervisory Board
(Four auditors includingthree outside auditors)
Independent Auditor
Board of Directors(12 Directors of whom two persons serveas an outside director and eight personsserve concurrently as Executive Officers)
President
33 Executive Officers
Office ofAuditors
Legal Counsel
Oversight / Auditing
Timely D
isclosure
Advice and Guidance
Audit ofAccounts
Delegation of Management Authority
Delegation ofManagement Authority
Internal Auditing
Election / Dismissal Election / Dismissal
Election / Dismissal
Election / Dismissal
Election / Dismissal
Delegation ofAuthority
General Meeting ofShareholders
20 OTSUKA CORPORATION Annual Report 2019
B. Reason for Adopting Present Corporate Governance SystemIt has been deemed that a governance system led by outside directors would not be suitable due to a wide range of business domains of the Company and the importance of understanding these domains and being familiar with the IT industry. An Audit & Supervisory Board Members System has therefore been adopted in the manner above. The Company assures transparency of decision-making by strengthening management oversight and audit functions by auditors, including outside auditors, and appoints outside directors with no conflict of interest with general shareholders to strengthen management supervision functions. By doing so, the Company aims to contribute to proper decision-making by the Board of Directors. In this manner, the Company believes that its Corporate Governance system under which Executive Officers handle business execution based on the Board of Directors, including outside directors, and the Audit & Supervisory Board, including outside auditors, functions effectively.
3. Other Matters Concerning Corporate Governance
A. State of Internal Control SystemsAt a meeting of the Board of Directors, the Company has determined the following basic policies for a system for ensuring that the execution of duties by Directors is in compliance with laws and the Articles of Incorporation as well as for a system deemed necessary as prescribed by an ordinance of the Ministry of Justice for ensuring appropriate operations of stock companies and of corporate groups consisting of stock companies and their subsidiaries.
• Basic policies for internal control systemsa) System for ensuring compliance with laws and the Articles of Incorporation in the execution of duties by directors and employees
Directors shall take the lead and set an example in complying with and promoting the Mission Statement as the basis of our compliance structure. Directors and employees shall strive to enhance the compliance system by taking such measures as improving awareness through continuous compliance education, improving business operations through internal audits and properly applying the internal reporting system in working to ensure compliance with laws and the Articles of Incorporation in the execution of their duties.
b) System for storing and managing information concerning the execution of duties by directorsInformation concerning the execution of duties by Directors (paper or electronically recorded) as well as other important information shall be properly stored and managed in accordance with laws and internal regulations.
c) Regulations and other systems concerning management of risk of lossesBased on internal regulations, we shall establish a risk management system, identify, analyze and evaluate any risk that could affect business results, financial condition or other areas and respond appropriately. In the event of unexpected contingencies, we shall set up a task force, collect risk information and devise quick and appropriate countermeasures.
d) System for ensuring the efficient execution of duties by directorsThe Board of Directors shall in principle convene once per month to discuss and decide important matters concerning management and supervise the state of execution of business duties. Also, the Board of Directors shall clarify criteria for convening and bringing up matters for debate at council bodies set up to raise the suitability of decision-making, while specific details shall be stipulated in Duty Authority Regulations and Separation of Duty Regulations and efficiency shall be raised.
e) System for ensuring proper operations of the Group consisting of the Company and its subsidiaries1) System for reporting to the Company matters concerning the execution of duties by Directors of subsidiaries Group Management Meetings are held and these clarify operational conditions at consolidated subsidiaries and progress in
achieving profit plans. The Special Executive Officer System has also been established, with the presidents of consolidated subsidiaries selected to
serve as Special Executive Officers, to promote thorough compliance and strengthen governance at consolidated subsidiaries. When the need arises, the Special Executive Officers shall be asked to report to the Company’s Board of Directors or
OTSUKA CORPORATION Annual Report 2019 21
Representative Directors on the state of the execution of duties.2) Regulations and other systems concerning management of risk of losses at subsidiaries The Board of Directors of consolidated subsidiaries shall identify, analyze and evaluate any risk that could affect business results,
financial condition or other areas and respond appropriately. Information regarding recognized risk by consolidated subsidiaries shall be shared at Group Management Meetings and
efforts shall be made for the early detection and prevention of risk. In the event of unexpected contingencies, we shall set up a task force at the Company, collect risk information, collaborate
with the relevant consolidated subsidiaries and devise quick and appropriate countermeasures.3) System for ensuring the efficient execution of duties by directors of subsidiaries Consolidated subsidiaries shall ensure the autonomy and independence of management and formulate an annual plan in accordance
with the Group’s policies. The targets and responsibilities of each company shall be clarified and efforts shall be made to attain the intended performance targets through the analyses of variances between budget estimates and actual results. Consolidated subsidiaries shall establish Board of Directors regulations and convene meetings of the Board of Directors to deliberate on and resolve important matters concerning management and monitor the state of the execution of duties. Moreover, details on the execution of duties shall be prescribed in the various types of internal company regulations and efficiency shall be raised.
4) System for ensuring compliance with laws and the Articles of Incorporation in the execution of duties by Directors and employees Consolidated subsidiaries shall ensure the proper execution of business operations by the functioning of self-cleansing
mechanisms through the execution of business operations that are in accordance with the Mission Statement. Consolidated subsidiaries shall strive to enhance their compliance systems and ensure the execution of business operations is in compliance with laws and the Articles of Incorporation by taking such measures as raising awareness through continuous compliance education, setting up internal audit offices within each company to improve business operations and properly applying the internal reporting system established by the Company and shared by consolidated subsidiaries.
5) Other systems for ensuring proper operations of the Group consisting of the Company and its subsidiaries The Company’s Office of Auditors shall receive reports on the results of internal audits implemented at each consolidated
subsidiary by internal auditing offices established at each consolidated subsidiary. Additionally, it shall implement regular audits of consolidated subsidiaries as well as audit the state of compliance with laws and regulations and provide necessary guidance.
f) Matters regarding employees assisting Audit & Supervisory Board Members when requested by Audit & Supervisory Board MembersWhen a Audit & Supervisory Board Member makes such a request, an appropriate employee shall be appointed from the Business Administration Headquarters and assigned to a concurrent position as an employee assisting the Audit & Supervisory Board Member.
g) Matters concerning the independence of such employees from Directors as mentioned in the preceding item and matters related to ensuring the effectiveness of instructions from the Audit & Supervisory Board Member to the relevant employeesConcerning the determination of matters related to the delegation of authority over personnel matters to the relevant employee as mentioned in the previous item, the independence of such employees from Directors shall be ensured by obtaining the prior consent of the Audit & Supervisory Board Member. Effectiveness shall be ensured by establishing a structure under which the Audit & Supervisory Board Member provides direct instructions to and receives reports from the relevant employee.
h) System regarding reporting to the Audit & Supervisory Board Members1) System for reporting to Audit & Supervisory Board Members by Directors and employees A system shall be established that enables Audit & Supervisory Board Members to receive reports from Directors and employees on the
state of the execution of duties. At the same time, collaboration and coordination with internal departments carrying out audits shall be strengthened.
2) System that enables directors, Audit & Supervisory Board Members, employees and other employees executing business operations of consolidated subsidiaries, as well as parties receiving reports from these persons, to report to the Audit & Supervisory Board Members
Directors, Audit & Supervisory Board Members, employees and other employees executing business operations of consolidated

22 OTSUKA CORPORATION Annual Report 2019
subsidiaries, as well as parties receiving reports from these persons shall, depending on the importance and urgency of the matters, report to the Audit & Supervisory Board Members about any improprieties regarding the execution of duties by directors or employees of the Company or consolidated subsidiaries, about any actual matters in violation of laws and regulations or the Articles of Incorporation or regarding actual matters that could cause significant damage to the Company.
i) System for ensuring that persons reporting matters described in the previous item are not treated unfavorably as a result of such reportsIn accordance with employment regulations, persons reporting matters to the Audit & Supervisory Board Members shall not be treated unfavorably as a result of such reports.
j) Matters related to the treatment of expenses and liabilities incurred in business execution by Audit & Supervisory Board MembersIn the case Audit & Supervisory Board Members request prepayment of expenses from the Company for their execution of duties, based on Article 388 of the Companies Act, the Company shall upon deliberation with the Compliance Office process these requested expenses except in the case these are determined to be unnecessary for the execution of duties by such Audit & Supervisory Board Members.
k) Other systems for ensuring effective audits by Audit & Supervisory Board MembersRepresentative Directors shall exchange opinions with Audit & Supervisory Board Members on a timely basis. The Company’s Office of Auditors shall maintain close relations with the Audit & Supervisory Board Members and undertake inspections in accordance with the requests of Audit & Supervisory Board Members.
B. Basic thinking on the elimination of antisocial forces and establishment of measuresa) Basic thinking
The Mission Statement and Compliance Regulations stipulate that the Company shall take a firm stance against and maintain no relations with antisocial forces that threaten the order and safety of society.
b) Establishment of measuresThe Company shall express its Action Guidelines against antisocial forces in its Mission Statement and Compliance Manual while designating its Compliance Office, Human Resources and General Affairs Department, and Customer Relationship Office as the department and office responsible for responding to antisocial forces. The Company shall collaborate with legal counsel and external organizations that include police departments and the Metropolitan Police Department Joint Association for the Prevention of Particular Violence. At the same time, employees shall be thoroughly familiarized with the Action Guidelines.
C. State of Establishment of Risk Management StructureOTSUKA CORPORATION has established a Risk Management Committee as the body to promote and control business risk management as part of a risk management system. The Risk Management Committee identifies and assesses all risk related to the Company and investigates respective measures for key risks. The Committee provides direction on the creation of a risk management system to ensure the ongoing and stable maintenance and management of risk in each division and department in its scope. At the same time, efforts are made to enhance crisis management by (1) preparing for such emergencies during ordinary times, (2) taking appropriate steps during a crisis and (3) formulating and managing a business continuity plan.
D. Summary of Details of Contract of Limited LiabilityAs prescribed by Article 427-1 of the Companies Act, the Company, each Director (excluding Executive Directors) and each Audit & Supervisory Board Member conclude a contract that limits liability under Article 423-1 of the Act. The amount limit of the liability based on these contracts shall be the amount prescribed by law.
E. Number of DirectorsThe Company’s Articles of Incorporation stipulate that the number of Company Directors shall be 19 or fewer.
F. Resolutions for Appointment and Dismissal of DirectorThe Company’s Articles of Incorporation stipulate that a resolution for the appointment of a Director requires attendance by shareholders with more than one-third of the voting rights of shareholders capable of exercising such rights at the General Meeting of Shareholders, and is decided by a majority of shareholders. In addition, a resolution for the appointment of a Director shall not be

OTSUKA CORPORATION Annual Report 2019 23
decided by cumulative voting.
G. Requirements for Special Resolution of the General Meeting of ShareholdersThe Company’s Articles of Incorporation stipulate that a special resolution of the General Meeting of Shareholders, pursuant to Article 309, Paragraph 2 of the Companies Act, shall be adopted when it is approved by a vote of two-thirds or more of the voting rights present at a General Meeting of Shareholders, a quorum for which shall be the presence of shareholders of one-third of the aggregate voting rights if the total shareholders are capable of exercising such rights. This aim is to facilitate efficient operation of the General Meeting of Shareholders through the moderation of special resolutions at the General Meeting of Shareholders.
H. Decision-making Body for the Distribution of Retained EarningsThe regular General Meeting of Shareholders shall serve as the decision-making body for the distribution of retained earnings at year-end.
I. Interim DividendPursuant to Paragraph 5, Article 454 of the Companies Act, the Company’s Articles of Incorporation stipulate that based on a resolution of the Board of Directors, the Company can pay interim dividends with the date of record being June 30 of each year. This is in order to allow the flexible return of profits to shareholders.
J. Purchase of Own SharesThe purport of the Company’s Articles of Incorporation stipulates that the Company shall be able to purchase its own shares based on a resolution of the Board of Directors as prescribed under Article 165, Paragraph 2 of the Companies Act. This is aimed at purchasing own shares through market transactions to enable the execution of a flexible capital policy that responds to changes in economic conditions.
Status of Directors and Auditors
1. Status of Outside Directors and AuditorsThe Company has two outside directors and three outside auditors. Although Outside Director Jiro Makino had no involvement in company management in the past other than serving as an outside officer, he has been appointed as an outside director because of his knowledge and experience as a lawyer and long years of involvement in the actual practice of legal affairs. He makes reports to the Tokyo Stock Exchange (TSE) as an independent Director, as provided by the TSE. There are no special interests or otherwise relationship between the Company and Jiro Makino Law Office legal professional corporation, in which outside director Jiro Makino currently has a key position. Tetsuo Saito has been appointed as an outside director because of his long years of experience in participating in the management of numerous companies in multiple industries. He makes reports to the Tokyo Stock Exchange (TSE) as an independent Director, as provided by the TSE. There are no special interests or otherwise relationship between the Company and Work Two Co., Ltd., DD Holdings Co., Ltd., DM SOLUTIONS Co., Ltd., and Career Design Center Co., Ltd., in which Tetsuo Saito currently has key positions. Although Outside Auditor Kazuhiko Nakai had no involvement in company management in the past other than serving as an outside officer, he has been appointed as an outside director because of his knowledge and experience as a certified public accountant and tax accountant and long years of involvement in the actual practice of corporate accounting. He makes reports to the Tokyo Stock Exchange (TSE) as an independent Auditor, as provided by the TSE. Additionally, there are no special interests or otherwise relationship between the Company and Kazuhiko Nakai Tax Accountant Office, Kazuhiko Nakai CPA Office, Nippon Antenna Co., Ltd. and S-Pool, Inc., in which Kazuhiko Nakai concurrently has key positions. Mr. Nakai joined Ernst & Young ShinNihon (currently, Ernst & Young ShinNihon LLC) as a representative employee in 2007 and resigned from the firm in 2010. Although OTSUKA CORPORATION and Ernst & Young ShinNihon LLC have concluded an

24 OTSUKA CORPORATION Annual Report 2019
agreement and OTSUKA CORPORATION receives accounting audits from the firm, there are no special interests or otherwise relationship with the Company and this firm. Although Outside Auditor Etsuo Hada had no involvement in company management in the past other than serving as an outside officer, he has been appointed as an outside auditor because of his knowledge and experience as a Certified Public Accountant (CPA), licensed tax accountant, judicial scrivener and administrative scrivener, as well as his long years of involvement the actual practice of corporate accounting and legal affairs. He makes reports to the TSE as an independent Auditor, as provided by the TSE. Additionally, there are no special interests or otherwise relationship between the Company and Hada CPA and Judicial Scrivener Office and Nikkan Kogyo Shimbun Ltd. in which outside auditor Etsuo Hada currently has key positions. Although Outside Auditor Katsumasa Minagawa had no involvement in company management in the past other than serving as an outside officer, he has been appointed as an outside auditor because of his knowledge and experience as a lawyer as well as his long years of involvement the actual practice of corporate law. He makes reports to the TSE as an independent Auditor, as provided by the TSE. Additionally, there are no special interests or otherwise relationship between the Company and Katsumasa Minagawa Law Office and Ubiquitous AI Corporation in which outside auditor Katsumasa Minagawa currently has key positions. OTSUKA CORPORATION does not stipulate standards and other criteria regarding independence in terms of the selection and appointment of outside directors and outside auditors. However, the Company selects and appoints individuals who are able to ensure independence from the Company by making a decision on an individual basis according to the background and relationship with the Company based on various regulations and other relevant matters concerning independence including regulations of the Tokyo Stock Exchange (TSE). The outside directors and outside auditors each attend Board of Directors meetings to provide insights and impart opinions based on their extensive experience. This strengthens the function of overseeing business execution by the Board of Directors and decision-making by the Board of Directors.
2. Supervision or Auditing by Outside Directors or Outside Corporate Auditors and Mutual Cooperation among Internal Audits, Audit & Supervisory Board Audits and Accounting Audits, and Relationships with Internal Control DepartmentsOutside directors attend the Audit & Supervisory Board as observers, ascertain the status of audit implementation by the Audit & Supervisory Board and exchange information and opinions with Audit & Supervisory Board Members. Outside directors and outside auditors receive a report on the audit plan and the status of audit implementation from the Office of Auditors and exchange opinions at the Audit & Supervisory Board that in principle is held once per month. Besides receiving reports on the establishment and operation of internal controls from the Internal Control Committee at the Board of Directors meetings, the Board of Directors or the Audit & Supervisory Board exchange information and opinions with the Finance and Accounting Dept. and Compliance Office at their discretion to ascertain the current situation and issues of the OTSUKA Group and express opinions from a professional viewpoint as necessary. The outside directors and outside auditors meet on a timely basis with the accounting auditors to confirm auditing plans and the condition of audit implementation and progress on improvements to recommended areas, exchange information confirming the legality of actions taken by Directors and take appropriate steps as required.
Status of Audits
1. Status of Audits by Audit & Supervisory Board MembersThe Audit & Supervisory Board consists of four persons, including three outside auditors (one full-time auditor and three part-time auditors). Among these auditors, outside auditor Kazuhiko Nakai and outside auditor Etsuo Hada hold qualifications as certified public accountants and tax accountants and have considerable knowledge of finance and accounting. The Audit & Supervisory Board is chaired by a full-time auditor in accordance with a resolution. Regarding audits by the Audit & Supervisory Board, the audit policies and annual plan are determined by the Audit & Supervisory Board. Each auditor complies with the Audit & Supervisory Board Audit Standards prescribed by the Audit & Supervisory Board and attends the Board of Directors meetings, and through discussions with management, audit reports from the Office of Auditors and audit reports of auditors of subsidiaries shall strive for communication with Directors, the Office of Auditors and auditors of subsidiaries and work to collect information and enhance the

OTSUKA CORPORATION Annual Report 2019 25
environment for auditing while monitoring and verifying the state of the internal control system. In addition, the full-time auditor attends important meetings, receives reports from Directors on the state of their business duties and investigates the state of business operations and assets at the head office and main business sites. Through these activities, Audit & Supervisory Board Members provide opinions such as advice and recommendations to Directors or employees. The Audit & Supervisory Board exchanges information with the accounting auditor and takes action as necessary. The Compliance Office is in charge of assisting Audit & Supervisory Board Members with their duties. Although the Compliance Office is an organization within the Business Management Division, one employee (concurrent position) assists with duties based on instructions given directly by Audit & Supervisory Board Members to ensure independence.
2. Status of Internal AuditsThe Office of Auditors (13 persons) under the direction of the President has been established to conduct periodic and on-demand internal audits of all operations across the Group and assess the adequacy of policies, plans and procedures, the effectiveness of their implementation and compliance with laws, as well as to offer concrete advice and recommendations for improving operations and raising awareness. The Office of Auditors regularly exchanges opinions with the accounting auditor regarding audit plans, the state of audit implementation and results, and strives for mutual collaboration. Moreover, the Office of Auditors strives for mutual collaboration with Audit & Supervisory Board Members.
3. Accounting Auditsa) Name of Corporate Auditor
Ernst & Young ShinNihon LLCb) Certified public accountants involved in auditing-related operations Seiji Yamamoto, Designated Employee with Limited Liability and Managing Partner Shigeyuki Kano, Designated Employee with Limited Liability and Managing Partner Tomo Ito, Designated Employee with Limited Liability and Managing Partner * Summarized, as all members have less than seven years of continuous auditing experiencec) Composition of staff assisting in auditing-related operations CPAs 10 Other individuals 19d) Corporate Auditor Selection Policy and Reasons
(Corporate auditor selection policy)The Audit & Supervisory Board makes comprehensive considerations that include the independence, expertise and the state of quality control of the corporate auditor as well as the appropriateness and efficiency of auditing activities and on the basis of the establishment of a system that assures the proper execution of duties of the corporate auditor the Board decides on suitability. (Policy on Dismissal or Determining Non-reappointment of Accounting Auditor)If there is determined to be a necessity, such as interference with the execution of the duties of the accounting auditor, the Audit & Supervisory Board will determine details of the proposal for dismissal or non-reappointment of the accounting auditor that is submitted to the General Meeting of Shareholders. If the accounting auditor is deemed to come under any of the items prescribed in Article 340-1 of the Companies Act, the accounting auditor shall be dismissed based on the approval of all Audit & Supervisory Board Members. In this case, the Audit & Supervisory Board Member selected by the Audit & Supervisory Board will report the intent and reason for the dismissal of the accounting auditor at the first General Meeting of Shareholders convened after the dismissal.
e) Evaluation of Accounting Auditors by Audit & Supervisory Board Members and the Audit & Supervisory Board The Audit & Supervisory Board exchanges information with the accounting auditor and receives reports from the accounting auditor on the results of quality control reviews and inspections of the corporate auditors that are external organizations. Audit & Supervisory Board Members and the Audit & Supervisory Board evaluate the accounting auditor based on the evaluation standards prescribed in accordance with the Japan Audit & Supervisory Board Members Association’s “Practical Guidelines for Auditors Concerning Determination of Evaluation Standards for Selection Criteria for Accounting Auditors” and determined this to be suitable.
26 OTSUKA CORPORATION Annual Report 2019
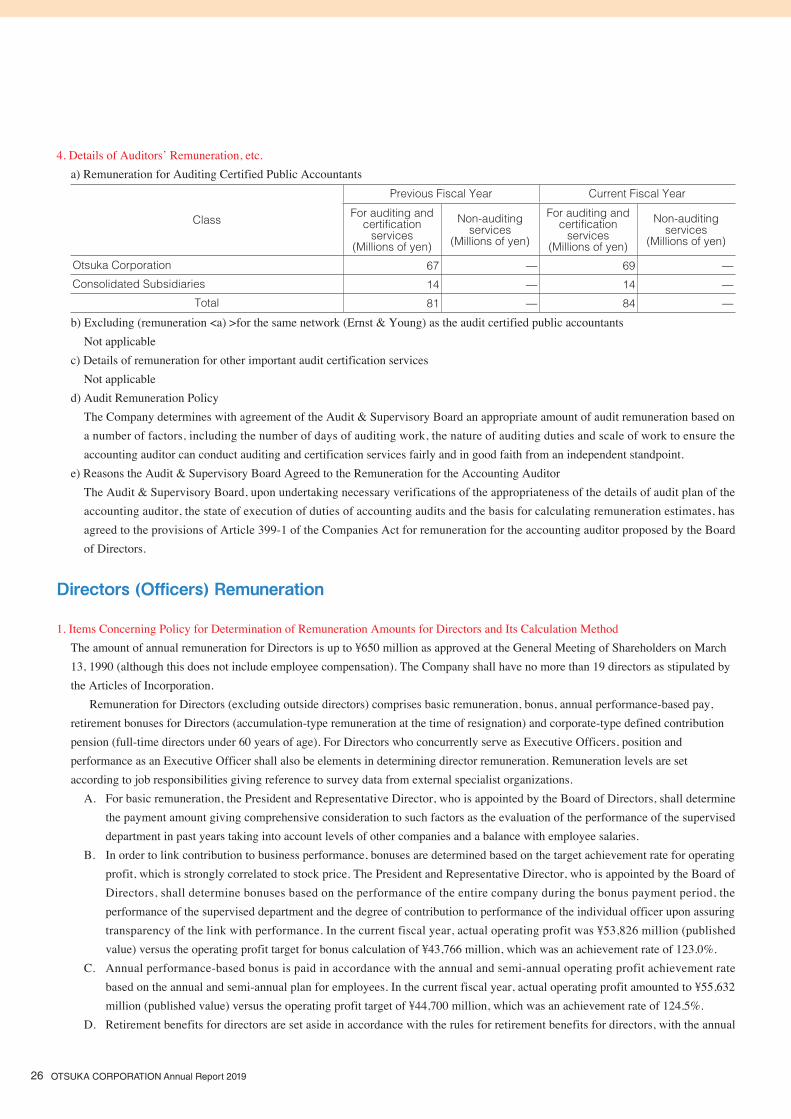
4. Details of Auditors’ Remuneration, etc.a) Remuneration for Auditing Certified Public Accountants
Class
Previous Fiscal Year Current Fiscal Year
For auditing andcertification
services(Millions of yen)
Non-auditing services
(Millions of yen)
For auditing andcertification
services(Millions of yen)
Non-auditing services
(Millions of yen)
Otsuka Corporation 67 — 69 —Consolidated Subsidiaries 14 — 14 —
Total 81 — 84 —
b) Excluding (remuneration <a) >for the same network (Ernst & Young) as the audit certified public accountantsNot applicable
c) Details of remuneration for other important audit certification servicesNot applicable
d) Audit Remuneration PolicyThe Company determines with agreement of the Audit & Supervisory Board an appropriate amount of audit remuneration based on a number of factors, including the number of days of auditing work, the nature of auditing duties and scale of work to ensure the accounting auditor can conduct auditing and certification services fairly and in good faith from an independent standpoint.
e) Reasons the Audit & Supervisory Board Agreed to the Remuneration for the Accounting AuditorThe Audit & Supervisory Board, upon undertaking necessary verifications of the appropriateness of the details of audit plan of the accounting auditor, the state of execution of duties of accounting audits and the basis for calculating remuneration estimates, has agreed to the provisions of Article 399-1 of the Companies Act for remuneration for the accounting auditor proposed by the Board of Directors.
Directors (Officers) Remuneration
1. Items Concerning Policy for Determination of Remuneration Amounts for Directors and Its Calculation Method The amount of annual remuneration for Directors is up to ¥650 million as approved at the General Meeting of Shareholders on March 13, 1990 (although this does not include employee compensation). The Company shall have no more than 19 directors as stipulated by the Articles of Incorporation. Remuneration for Directors (excluding outside directors) comprises basic remuneration, bonus, annual performance-based pay, retirement bonuses for Directors (accumulation-type remuneration at the time of resignation) and corporate-type defined contribution pension (full-time directors under 60 years of age). For Directors who concurrently serve as Executive Officers, position and performance as an Executive Officer shall also be elements in determining director remuneration. Remuneration levels are set according to job responsibilities giving reference to survey data from external specialist organizations.
A. For basic remuneration, the President and Representative Director, who is appointed by the Board of Directors, shall determine the payment amount giving comprehensive consideration to such factors as the evaluation of the performance of the supervised department in past years taking into account levels of other companies and a balance with employee salaries.
B. In order to link contribution to business performance, bonuses are determined based on the target achievement rate for operating profit, which is strongly correlated to stock price. The President and Representative Director, who is appointed by the Board of Directors, shall determine bonuses based on the performance of the entire company during the bonus payment period, the performance of the supervised department and the degree of contribution to performance of the individual officer upon assuring transparency of the link with performance. In the current fiscal year, actual operating profit was ¥53,826 million (published value) versus the operating profit target for bonus calculation of ¥43,766 million, which was an achievement rate of 123.0%.
C. Annual performance-based bonus is paid in accordance with the annual and semi-annual operating profit achievement rate based on the annual and semi-annual plan for employees. In the current fiscal year, actual operating profit amounted to ¥55,632 million (published value) versus the operating profit target of ¥44,700 million, which was an achievement rate of 124.5%.
D. Retirement benefits for directors are set aside in accordance with the rules for retirement benefits for directors, with the annual
OTSUKA CORPORATION Annual Report 2019 27
basic amount being set aside for full-time directors (each position), and the cumulative amount is calculated at retirement and paid upon determination of payment amount at the Board of Directors based on a resolution of the General Meeting of Shareholders. Retirement benefits for the current fiscal year were resolved at the General Meeting of Shareholders held on March 27, 2019.
E. The company-type defined contribution pension for full-time directors who have not reached the age of 60 is contributed to monthly in an amount equal to the maximum amount for employees. There were no eligible persons this fiscal year.
Outside directors shall receive only fixed basic remuneration from the perspective of maintaining independence. Basic remuneration is determined by the President and Representative Director, who is appointed by the Board of Directors, based on the levels of other companies and the remuneration levels of full-time directors of the Company. The amount of annual remuneration for Audit & Supervisory Board Members is up to ¥50 million as approved at the General Meeting of Shareholders on March 30, 2005. The Company shall have no more than four Audit & Supervisory Board Members as stipulated by the Articles of Incorporation. The remuneration of Audit & Supervisory Board Members (excluding Outside Audit & Supervisory Board Members) comprises basic remuneration, officer retirement benefits (accumulation-type remuneration at the time of resignation) and corporate-type defined contribution pension (full-time directors under 60 years of age).
A. Basic remuneration is determined through discussions with Audit & Supervisory Board Members.B. Retirement benefits for Directors are set aside in accordance with the rules for retirement benefits for directors, with the annual
basic amount being set aside for full-time Audit & Supervisory Board Members, and the cumulative amount is calculated at retirement and paid upon determination of payment amount based on a resolution at the General Meeting of Shareholders upon consultation with the Audit & Supervisory Board Members. There were no eligible persons this fiscal year.
C. The company-type defined contribution pension for full-time Audit & Supervisory Board Members who have not reached the age of 60 is contributed to monthly in an amount equal to the maximum amount for employees. There were no eligible persons this fiscal year.
Outside Audit & Supervisory Board members receive only fixed basic remuneration. The paid amount of basic remuneration is determined by consultation with the Audit & Supervisory Board Members.
2. Details of Activities of the Board of Directors in the Process of Determining the Amount of Remuneration for OfficersIn the current fiscal year, at the Board of Directors meeting on March 27, 2019, the Board resolved to entrust the basic remuneration for directors and the amount of retirement benefits for directors to the President and Representative Director and determined the amount of retirement benefits for directors based on a policy for determining the amount of remuneration for officers.
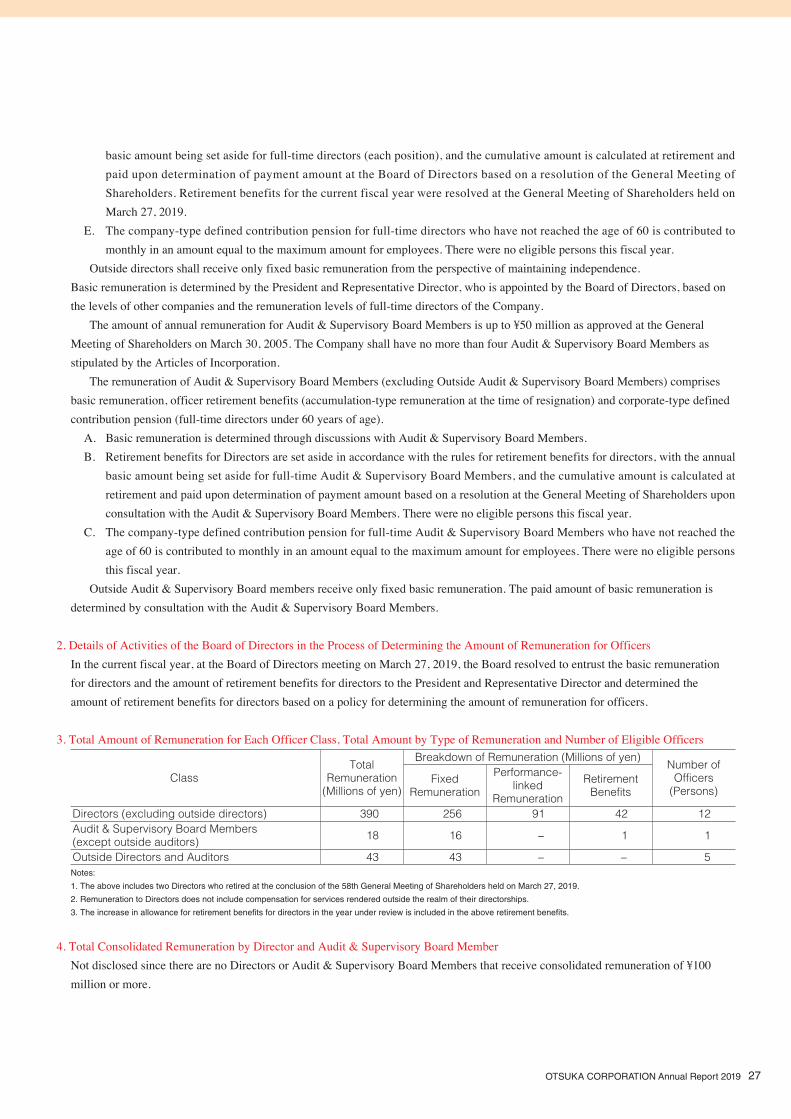
3. Total Amount of Remuneration for Each Officer Class, Total Amount by Type of Remuneration and Number of Eligible Officers
ClassTotal
Remuneration(Millions of yen)
Breakdown of Remuneration (Millions of yen)Number of
Officers(Persons)
Fixed Remuneration
Performance-linked
Remuneration
RetirementBenefits
Directors (excluding outside directors) 390 256 91 42 12Audit & Supervisory Board Members (except outside auditors) 18 16 − 1 1
Outside Directors and Auditors 43 43 − − 5Notes:
1. The above includes two Directors who retired at the conclusion of the 58th General Meeting of Shareholders held on March 27, 2019.
2. Remuneration to Directors does not include compensation for services rendered outside the realm of their directorships.
3. The increase in allowance for retirement benefits for directors in the year under review is included in the above retirement benefits.
4. Total Consolidated Remuneration by Director and Audit & Supervisory Board MemberNot disclosed since there are no Directors or Audit & Supervisory Board Members that receive consolidated remuneration of ¥100 million or more.

28 OTSUKA CORPORATION Annual Report 2019
Principal Stockholdings by the Company
1. Criteria and Concept for Classification of Investment StocksThe Company classifies stocks into investment stocks held for the purpose of pure investment, which are investment stocks held for the purpose of obtaining profits from fluctuations in stock prices and dividends from stocks, and investment stocks held for purposes other than pure investment (policy stocks), which are held for the purpose of strengthening relationships and alliances with partner companies. The Company does not in principle hold investment stocks held for the purpose of pure investment.
2. Stocks Held for Purposes Other than Pure Investmenta) Holding Policy and Method for Verifying the Rationality of Holdings and Details of Verification by the Board of Directors
Regarding the Suitability of Holding Individual StocksEvery year the Board of Directors verifies the returns and risks of policy stocks from a medium- to-long-term perspective and considers the suitability of holding these stocks. As evaluation criteria for determining the suitability of holdings, the Company comprehensively considers such factors as the benefits of alliances, comparison of investment returns and the cost of capital, investment risk and the growth potential of the relevant company. In accordance with the above criteria, as a shareholder, the Company will sell policy stocks that do not result in a medium- to-long-term increase in corporate value upon carrying out sufficient dialogue with its partner company. During this fiscal year, the Company adopted a resolution to proceed with the sale of some stocks, etc., based on verification at the Board of Directors.
b) Criteria for Exercising Voting Rights for Holdings of Policy StocksRegarding the exercise of voting rights of policy stocks, the Company determines advantages and disadvantages of a resolution upon close examination by individual stock to determine whether these contribute to the enhancement of medium-to-long-term corporate value of the relevant company and the Company.
c) Number of issues and balance sheet amount
Number of issuesTotal balance sheet
amount (millions of yen)
Unlisted stocks 22 127Stocks other than unlisted stocks 33 9,611
(Issues for which the number of shares increased this fiscal year)
Number of issues
Total amount of acquisition price for the increase in the number of shares (millions of yen)
Reason for increase in number of shares
Unlisted stocks 1 5New investment for collaborative business development
Stocks other than unlisted stocks 8 23Regular purchases by business partner holding company
(Issues for which the number of shares decreased this fiscal year)
Number of issues
Total amount of sales price for the
decrease in the number of shares (millions of yen)
Unlisted stocks 1 29Stocks other than unlisted stocks 3 36
OTSUKA CORPORATION Annual Report 2019 29
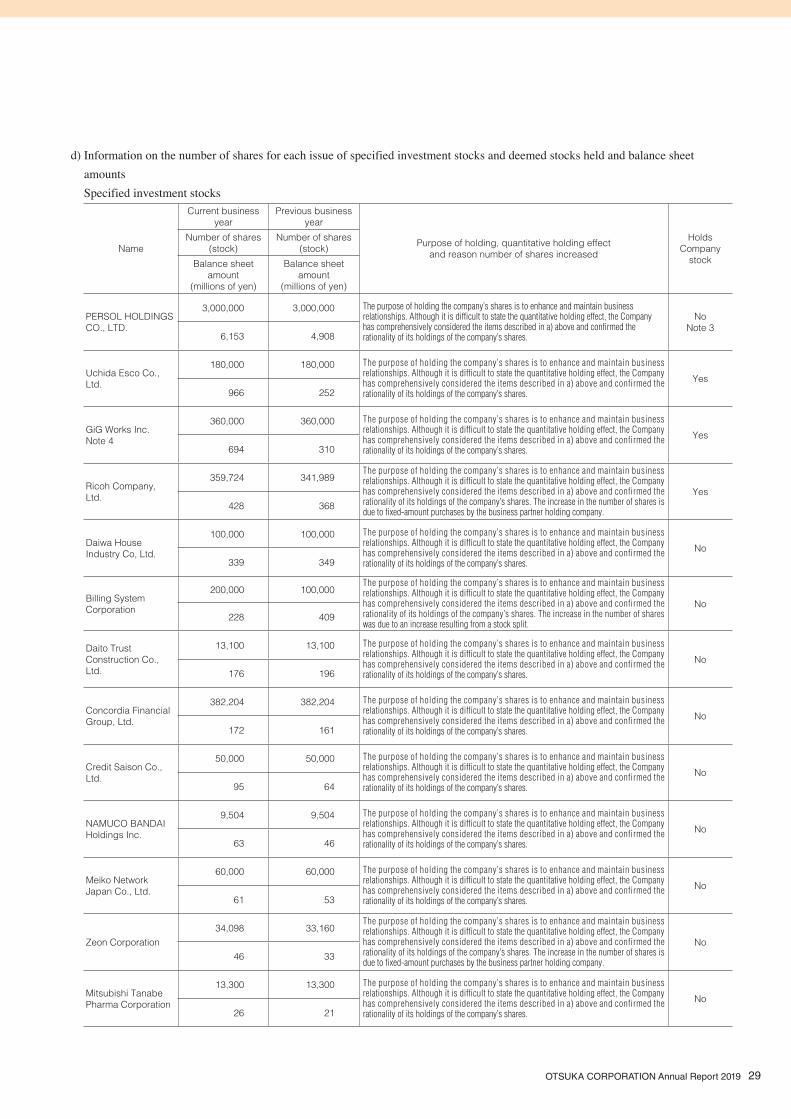
d) Information on the number of shares for each issue of specified investment stocks and deemed stocks held and balance sheet amounts Specified investment stocks
Name
Current business year
Previous business year
Purpose of holding, quantitative holding effect and reason number of shares increased
HoldsCompany
stock
Number of shares (stock)
Number of shares (stock)
Balance sheet amount
(millions of yen)
Balance sheet amount
(millions of yen)
PERSOL HOLDINGS CO., LTD.
3,000,000 3,000,000 The purpose of holding the company’s shares is to enhance and maintain business relationships. Although it is difficult to state the quantitative holding effect, the Company has comprehensively considered the items described in a) above and confirmed the rationality of its holdings of the company’s shares.
NoNote 3
6,153 4,908
Uchida Esco Co., Ltd.
180,000 180,000 The purpose of holding the company’s shares is to enhance and maintain business relationships. Although it is difficult to state the quantitative holding effect, the Company has comprehensively considered the items described in a) above and confirmed the rationality of its holdings of the company’s shares.
Yes966 252
GiG Works Inc.Note 4
360,000 360,000 The purpose of holding the company’s shares is to enhance and maintain business relationships. Although it is difficult to state the quantitative holding effect, the Company has comprehensively considered the items described in a) above and confirmed the rationality of its holdings of the company’s shares.
Yes694 310
Ricoh Company, Ltd.
359,724 341,989The purpose of holding the company’s shares is to enhance and maintain business relationships. Although it is difficult to state the quantitative holding effect, the Company has comprehensively considered the items described in a) above and confirmed the rationality of its holdings of the company’s shares. The increase in the number of shares is due to fixed-amount purchases by the business partner holding company.
Yes428 368
Daiwa House Industry Co, Ltd.
100,000 100,000 The purpose of holding the company’s shares is to enhance and maintain business relationships. Although it is difficult to state the quantitative holding effect, the Company has comprehensively considered the items described in a) above and confirmed the rationality of its holdings of the company’s shares.
No339 349
Billing System Corporation
200,000 100,000The purpose of holding the company’s shares is to enhance and maintain business relationships. Although it is difficult to state the quantitative holding effect, the Company has comprehensively considered the items described in a) above and confirmed the rationality of its holdings of the company’s shares. The increase in the number of shares was due to an increase resulting from a stock split.
No228 409
Daito Trust Construction Co., Ltd.
13,100 13,100 The purpose of holding the company’s shares is to enhance and maintain business relationships. Although it is difficult to state the quantitative holding effect, the Company has comprehensively considered the items described in a) above and confirmed the rationality of its holdings of the company’s shares.
No176 196
Concordia Financial Group, Ltd.
382,204 382,204 The purpose of holding the company’s shares is to enhance and maintain business relationships. Although it is difficult to state the quantitative holding effect, the Company has comprehensively considered the items described in a) above and confirmed the rationality of its holdings of the company’s shares.
No172 161
Credit Saison Co., Ltd.
50,000 50,000 The purpose of holding the company’s shares is to enhance and maintain business relationships. Although it is difficult to state the quantitative holding effect, the Company has comprehensively considered the items described in a) above and confirmed the rationality of its holdings of the company’s shares.
No95 64
NAMUCO BANDAI Holdings Inc.
9,504 9,504 The purpose of holding the company’s shares is to enhance and maintain business relationships. Although it is difficult to state the quantitative holding effect, the Company has comprehensively considered the items described in a) above and confirmed the rationality of its holdings of the company’s shares.
No63 46
Meiko Network Japan Co., Ltd.
60,000 60,000 The purpose of holding the company’s shares is to enhance and maintain business relationships. Although it is difficult to state the quantitative holding effect, the Company has comprehensively considered the items described in a) above and confirmed the rationality of its holdings of the company’s shares.
No61 53
Zeon Corporation34,098 33,160
The purpose of holding the company’s shares is to enhance and maintain business relationships. Although it is difficult to state the quantitative holding effect, the Company has comprehensively considered the items described in a) above and confirmed the rationality of its holdings of the company’s shares. The increase in the number of shares is due to fixed-amount purchases by the business partner holding company.
No46 33
Mitsubishi Tanabe Pharma Corporation
13,300 13,300 The purpose of holding the company’s shares is to enhance and maintain business relationships. Although it is difficult to state the quantitative holding effect, the Company has comprehensively considered the items described in a) above and confirmed the rationality of its holdings of the company’s shares.
No26 21

30 OTSUKA CORPORATION Annual Report 2019
Name
Current business year
Previous business year
Purpose of holding, quantitative holding effect and reason number of shares increased
HoldsCompany
stock
Number of shares (stock)
Number of shares (stock)
Balance sheet amount
(millions of yen)
Balance sheet amount
(millions of yen)
Nippon Kayaku Co., Ltd.
19,231 18,605The purpose of holding the company’s shares is to enhance and maintain business relationships. Although it is difficult to state the quantitative holding effect, the Company has comprehensively considered the items described in a) above and confirmed the rationality of its holdings of the company’s shares. The increase in the number of shares is due to fixed-amount purchases by the business partner holding company.
No26 26
Kyowa Kirin Co., Ltd.Note 5
8,000 8,000 The purpose of holding the company’s shares is to enhance and maintain business relationships. Although it is difficult to state the quantitative holding effect, the Company has comprehensively considered the items described in a) above and confirmed the rationality of its holdings of the company’s shares.
No20 16
HYPER Inc.24,000 24,000 The purpose of holding the company’s shares is to enhance and maintain business
relationships. Although it is difficult to state the quantitative holding effect, the Company has comprehensively considered the items described in a) above and confirmed the rationality of its holdings of the company’s shares.
No17 10
Mitsubishi UFJ Financial Group, Inc.
29,110 29,110 The purpose of holding the company’s shares is to enhance and maintain business relationships. Although it is difficult to state the quantitative holding effect, the Company has comprehensively considered the items described in a) above and confirmed the rationality of its holdings of the company’s shares.
NoNote 6
17 15
Morinaga & Co., Ltd.3,209 3,153
The purpose of holding the company’s shares is to enhance and maintain business relationships. Although it is difficult to state the quantitative holding effect, the Company has comprehensively considered the items described in a) above and confirmed the rationality of its holdings of the company’s shares. The increase in the number of shares is due to fixed-amount purchases by the business partner holding company.
No16 14
Iwabuchi Corporation
2,343 2,213The purpose of holding the company’s shares is to enhance and maintain business relationships. Although it is difficult to state the quantitative holding effect, the Company has comprehensively considered the items described in a) above and confirmed the rationality of its holdings of the company’s shares. The increase in the number of shares is due to fixed-amount purchases by the business partner holding company.
No15 10
Iino Kaiun Kaisha, Ltd.
35,630 33,492The purpose of holding the company’s shares is to enhance and maintain business relationships. Although it is difficult to state the quantitative holding effect, the Company has comprehensively considered the items described in a) above and confirmed the rationality of its holdings of the company’s shares. The increase in the number of shares is due to fixed-amount purchases by the business partner holding company.
No13 13
Dai-ichi Life Holdings, Inc.
4,300 4,300 The purpose of holding the company’s shares is to enhance and maintain business relationships. Although it is difficult to state the quantitative holding effect, the Company has comprehensively considered the items described in a) above and confirmed the rationality of its holdings of the company’s shares.
NoNote 7
7 7
Rengo Co., Ltd.7,600 7,600 The purpose of holding the company’s shares is to enhance and maintain business
relationships. Although it is difficult to state the quantitative holding effect, the Company has comprehensively considered the items described in a) above and confirmed the rationality of its holdings of the company’s shares.
No6 6
Maruzen Co., Ltd.2,000 2,000 The purpose of holding the company’s shares is to enhance and maintain business
relationships. Although it is difficult to state the quantitative holding effect, the Company has comprehensively considered the items described in a) above and confirmed the rationality of its holdings of the company’s shares.
No4 3
Mizuho Financial Group, Inc.
21,520 21,520 The purpose of holding the company’s shares is to enhance and maintain business relationships. Although it is difficult to state the quantitative holding effect, the Company has comprehensively considered the items described in a) above and confirmed the rationality of its holdings of the company’s shares.
NoNote 8
3 3
Canon Marketing Japan Inc.
1,155 1,155 The purpose of holding the company’s shares is to enhance and maintain business relationships. Although it is difficult to state the quantitative holding effect, the Company has comprehensively considered the items described in a) above and confirmed the rationality of its holdings of the company’s shares.
Yes2 2
Tsuchiya Holdings Co., Ltd.
12,627 11,621The purpose of holding the company’s shares is to enhance and maintain business relationships. Although it is difficult to state the quantitative holding effect, the Company has comprehensively considered the items described in a) above and confirmed the rationality of its holdings of the company’s shares. The increase in the number of shares is due to fixed-amount purchases by the business partner holding company.
No2 1
Autobacs Seven Co., Ltd.
1,500 1,500 The purpose of holding the company’s shares is to enhance and maintain business relationships. Although it is difficult to state the quantitative holding effect, the Company has comprehensively considered the items described in a) above and confirmed the rationality of its holdings of the company’s shares.
No2 2

OTSUKA CORPORATION Annual Report 2019 31
Name
Current business year
Previous business year
Purpose of holding, quantitative holding effect and reason number of shares increased
HoldsCompany
stock
Number of shares (stock)
Number of shares (stock)
Balance sheet amount
(millions of yen)
Balance sheet amount
(millions of yen)
LIXIL Group Corporation.
331 331 The purpose of holding the company’s shares is to enhance and maintain business relationships. Although it is difficult to state the quantitative holding effect, the Company has comprehensively considered the items described in a) above and confirmed the rationality of its holdings of the company’s shares.
No0 0
KOIKE SANSO KOGYO Co., LTD.
133 133 The purpose of holding the company’s shares is to enhance and maintain business relationships. Although it is difficult to state the quantitative holding effect, the Company has comprehensively considered the items described in a) above and confirmed the rationality of its holdings of the company’s shares.
No0 0
TOKYO THEATRES COMPANY Inc.
199 155The purpose of holding the company’s shares is to enhance and maintain business relationships. Although it is difficult to state the quantitative holding effect, the Company has comprehensively considered the items described in a) above and confirmed the rationality of its holdings of the company’s shares. The increase in the number of shares is due to fixed-amount purchases by the business partner holding company.
No0 0
Kurimoto, Ltd.100 100 The purpose of holding the company’s shares is to enhance and maintain business
relationships. Although it is difficult to state the quantitative holding effect, the Company has comprehensively considered the items described in a) above and confirmed the rationality of its holdings of the company’s shares.
No0 0
HOSODA CORPORATION
1,200 1,200 The purpose of holding the company’s shares is to enhance and maintain business relationships. Although it is difficult to state the quantitative holding effect, the Company has comprehensively considered the items described in a) above and confirmed the rationality of its holdings of the company’s shares.
No0 0
NIPPON KINZOKU CO., LTD.
100 100 The purpose of holding the company’s shares is to enhance and maintain business relationships. Although it is difficult to state the quantitative holding effect, the Company has comprehensively considered the items described in a) above and confirmed the rationality of its holdings of the company’s shares.
No0 0
The Keiyo Bank, Ltd.– 25,000 The purpose of holding the company’s shares is to enhance and maintain business
relationships. Although it is difficult to state the quantitative holding effect, the Company has comprehensively considered the items described in a) above and sold the company’s shares in the current fiscal year.
No– 17
J ESCOM HOLDINGS, INC.
– 150,000 The purpose of holding the company’s shares is to enhance and maintain business relationships. Although it is difficult to state the quantitative holding effect, the Company has comprehensively considered the items described in a) above and sold the company’s shares in the current fiscal year.
No– 12
Levi Strauss Japan K.K.
– 440 The purpose of holding the company’s shares is to enhance and maintain business relationships. Although it is difficult to state the quantitative holding effect, the Company has comprehensively considered the items described in a) above and sold the company’s shares in the current fiscal year.
No– 0
Notes:
1. All stocks, including stocks with recorded balance sheet amounts of 1/100 or less of their capital amounts, are listed.
2. The - symbol indicates the Company does not hold that stock.
3. Although PERSOL HOLDINGS CO., LTD. does not hold Company shares, its subsidiary, PERSOL TEMPSTAFF CO., LTD., holds Company shares.
4. ThreePro Group Co., Ltd. was renamed GiG Works Inc. on August 1, 2019.
5. Kyowa Hakko Kirin Co., Ltd. was renamed Kyowa Kirin Co., Ltd. on July 1, 2019.
6. Although Mitsubishi UFJ Financial Group, Inc. does not hold Company shares, its subsidiaries MUFG Bank, Ltd., and Mitsubishi UFJ Morgan Stanley Securities Co., Ltd.
hold Company shares.
7. Although Dai-ichi Life Holdings, Inc. does not hold Company shares, its subsidiary, The Dai-ichi Life Insurance Company, Limited, holds Company shares.
8. Although Mizuho Financial Group, Inc. does not hold Company shares, its subsidiaries, Mizuho Bank, Ltd. and Mizuho Securities Co., Ltd., hold Company shares.
Deemed stocksNot applicable
3. Investment Stocks Held for the Purpose of Pure InvestmentNot applicable

32 OTSUKA CORPORATION Annual Report 2019
Directors and Audit & Supervisory Board Members (As of March 27, 2020)
Director & Senior Managing Officer
Mitsuya Hirose
Directors
Yasuhiro WakamatsuJiro MakinoTetsuo Saito
Standing Audit & Supervisory Board Member
Naoto Minai
Audit & Supervisory Board Members
Kazuhiko NakaiEtsuo HadaKatsumasa Minagawa
Managing Director & Operating Officer
Katsuhiro Yano
Managing Director & Senior Operating Officer
Hironobu Saito
Managing Director & Senior Executive Operating Officer
Kazuyuki Katakura
Managing Director & Senior Executive Operating Officer
Toshiyasu Takahashi
Managing Director & Operating Officer
Norihiko Moriya
Managing Director & Executive Operating Officer
Hironobu Tsurumi
Managing Director & Operating Officer
Minoru Sakurai
President & Chief Executive Officer
Yuji Otsuka
OTSUKA CORPORATION Annual Report 2019 33
Business Risks
The most common risks that could potentially impact the Group’s business performance results and financial condition are outlined below. While these are the most common risks, they do not represent all potential risks. The items covered herein are possible future occurrences determined by the OTSUKA Group as of March 27, 2020.
■ Customer-related Risks The OTSUKA Group’s customers range from large enterprises to small firms that span a broad range in terms of company scale and industries. Consequently, its level of dependency on any specific customer is low. However, the Group’s operations could be impacted by convergent changes in IT investment trends by a large number of companies as a result of unexpected changes in the economic environment.
■ Supplier-related Risks The OTSUKA Group is supplied with high-quality products, services and technologies (hereafter called “products”) by numerous suppliers for respective segments in order to optimally resolve the problems of each customer. While working to deepen its relationship with suppliers to ensure stable supply of these “products,” the Group is constantly working to acquire information on newer “products” as well. However, the Group’s operations could be impacted by the inability to supply “products” in the quantity demanded by customers because of insufficient supply of “products” due to issues at supplier sites, as well as by the Group’s inability to obtain substitutes.
■ Information Leakage RisksThe OTSUKA Group possesses an abundance of individual and corporate information pertaining to operations that is handled carefully. The Company received approval to use the Privacy Mark of the Japan Institute for Promotion of Digital Economy and Community, and its Internet Data Center acquired certification for Information Security Management Systems (ISMS). As a concrete measure to manage data, the Company has released an internal and external Personal Information Protection Policy, as well as established regulations on personal information protection, confidentiality and information system security. The Company has its employees take a pledge of confidentiality as well as works to prevent information leakage outside of the Company and raises awareness of information management through its proprietary educational “CP (Compliance Program) License System” and other measures. Moreover, the Company implements even more stringent measures for its information systems. These include respective technical measures used at entrances, internally, and at exits as well as third-party external diagnoses, regular drills against targeted e-mail attacks and establishing the Computer Security Incident Response Team (CSIRT) and the Security Surveillance Committee. Even with these measures, however, the Group’s operations could be impacted by assuming liabilities for damage and loss of trust by society in the unlikely event that personal or corporate information is leaked outside the Group.

34 OTSUKA CORPORATION Annual Report 2019
Financial Section
Three-year Financial Data
OTSUKA CORPORATION and Consolidated SubsidiariesYears ended December 31, 2017, 2018 and 2019 Millions of yen
Thousands ofU.S. dollars
2017 2018 2019 2019
Net sales ¥691,166 ¥759,871 ¥886,536 $8,092,527 System Integration business 408,718 463,293 578,698 5,282,508
Service and Support business 282,064 296,577 307,837 2,810,019
Other business 383 — — —
Operating profit 44,386 48,058 62,192 567,709
Ordinary profit 45,460 49,285 63,706 581,527
Profit before income taxes 45,363 49,100 62,668 572,058
Profit attributable to owners of parent 31,560 33,601 43,497 397,057
Total assets 380,317 406,732 461,812 4,215,536
Interest-bearing debt 8,873 8,256 8,807 80,394
Equity 212,897 229,726 259,328 2,367,219
Earnings per share (EPS) (Yen and U.S. dollars) 166.46 177.22 229.42 2.09
Dividend per share of common stock (Yen and U.S. dollars) 70.00 85.00 110.00 1.00
Cash flows from operating activities per share (Yen and U.S. dollars) 190.68 203.83 257.18 2.35
Operating profit to Net sales ratio (%) 6.42 6.32 7.02 —
Profit to Net sales ratio* (%) 4.57 4.42 4.91 —
Interest-bearing debt ratio (%) 2.33 2.03 1.91 —
Equity ratio (%) 55.98 56.48 56.15 —Return on equity (ROE) (%) 15.67 15.18 17.79 —
Notes:
* Profit stands for Profit attributable to owners of parent
Equity = Total net assets - Share subscription rights - Non-controlling interests
Figures for ROE are calculated using average equity.
U.S. dollar amounts are computed using the December 31, 2019 exchange rate of ¥109.55 = US$1.
Otsuka Auto Service Co., LTD., which was a consolidated subsidiary, was excluded from consolidation from the fiscal year 2018 due to its reduced impact on consolidated business
results. Along with this, the Other business segment is not listed from the fiscal year 2018 due to the absence of business results.
The Company conducted a 2-for-1 stock split for shares of common stock of the Company with April 1, 2018 as the effective date. Accordingly, the amount of Per Share Data is
calculated based on the assumption that the share split was conducted at the beginning of the fiscal year 2017.
Management’s Analysis of Operating Results and Financial Position 35
Consolidated Balance Sheets 38
Consolidated Statements of Income 40
Consolidated Statements of Comprehensive Income 41
Consolidated Statements of Changes in Net Assets 42
Consolidated Statements of Cash Flows 44
Notes to Consolidated Financial Statements 45
Independent Auditor’s Report 69
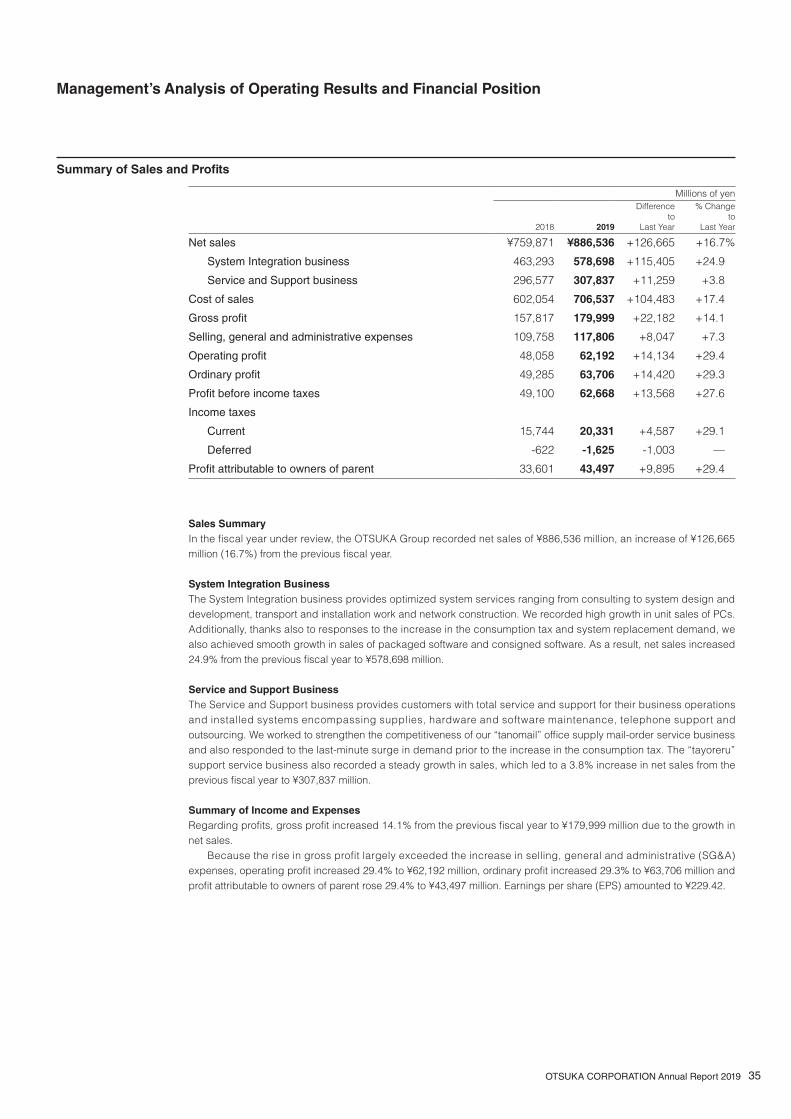
OTSUKA CORPORATION Annual Report 2019 35
Management’s Analysis of Operating Results and Financial Position
Summary of Sales and Profits
Millions of yen
2018 2019
Differenceto
Last Year
% Changeto
Last Year
Net sales ¥759,871 ¥886,536 +126,665 +16.7%
System Integration business 463,293 578,698 +115,405 +24.9
Service and Support business 296,577 307,837 +11,259 +3.8
Cost of sales 602,054 706,537 +104,483 +17.4
Gross profit 157,817 179,999 +22,182 +14.1
Selling, general and administrative expenses 109,758 117,806 +8,047 +7.3
Operating profit 48,058 62,192 +14,134 +29.4
Ordinary profit 49,285 63,706 +14,420 +29.3
Profit before income taxes 49,100 62,668 +13,568 +27.6
Income taxes
Current 15,744 20,331 +4,587 +29.1
Deferred -622 -1,625 -1,003 —
Profit attributable to owners of parent 33,601 43,497 +9,895 +29.4
Sales Summary In the fiscal year under review, the OTSUKA Group recorded net sales of ¥886,536 million, an increase of ¥126,665 million (16.7%) from the previous fiscal year.
System Integration BusinessThe System Integration business provides optimized system services ranging from consulting to system design and development, transport and installation work and network construction. We recorded high growth in unit sales of PCs. Additionally, thanks also to responses to the increase in the consumption tax and system replacement demand, we also achieved smooth growth in sales of packaged software and consigned software. As a result, net sales increased 24.9% from the previous fiscal year to ¥578,698 million.
Service and Support BusinessThe Service and Support business provides customers with total service and support for their business operations and installed systems encompassing supplies, hardware and software maintenance, telephone support and outsourcing. We worked to strengthen the competitiveness of our “tanomail” office supply mail-order service business and also responded to the last-minute surge in demand prior to the increase in the consumption tax. The “tayoreru” support service business also recorded a steady growth in sales, which led to a 3.8% increase in net sales from the previous fiscal year to ¥307,837 million.
Summary of Income and ExpensesRegarding profits, gross profit increased 14.1% from the previous fiscal year to ¥179,999 million due to the growth in net sales. Because the rise in gross profit largely exceeded the increase in selling, general and administrative (SG&A) expenses, operating profit increased 29.4% to ¥62,192 million, ordinary profit increased 29.3% to ¥63,706 million and profit attributable to owners of parent rose 29.4% to ¥43,497 million. Earnings per share (EPS) amounted to ¥229.42.
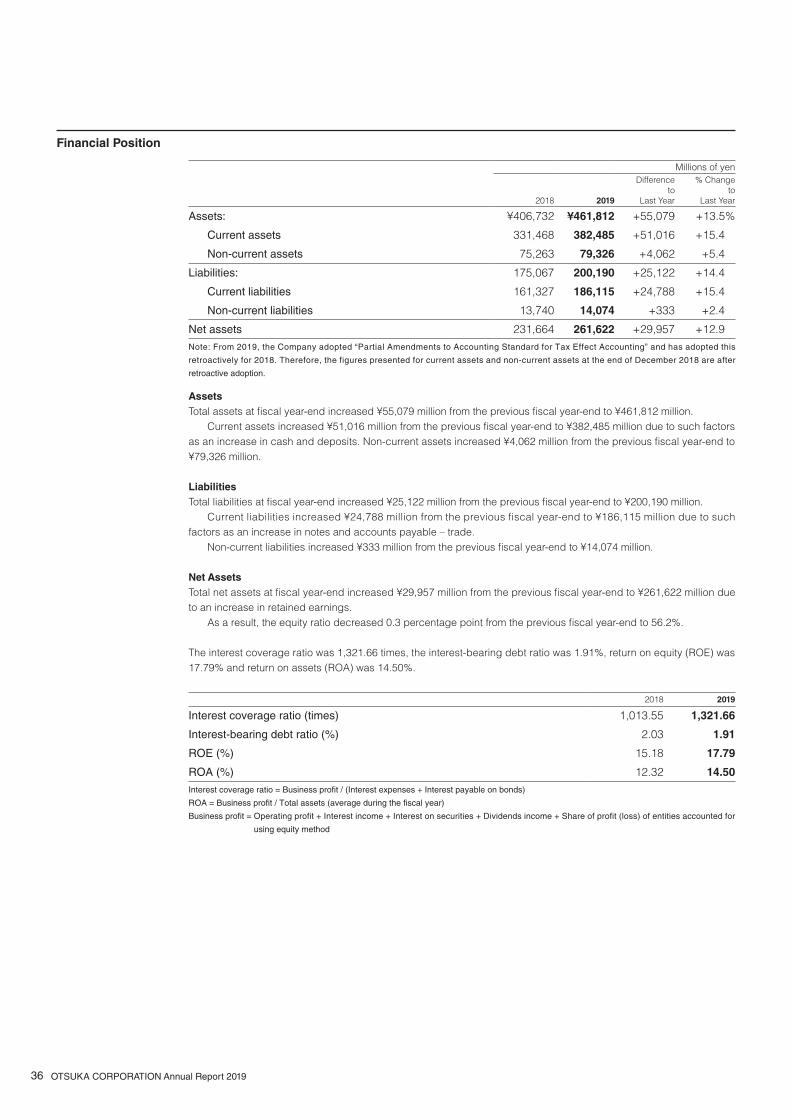
36 OTSUKA CORPORATION Annual Report 2019
Financial Position
Millions of yen
2018 2019
Differenceto
Last Year
% Changeto
Last Year
Assets: ¥406,732 ¥461,812 +55,079 +13.5%
Current assets 331,468 382,485 +51,016 +15.4
Non-current assets 75,263 79,326 +4,062 +5.4
Liabilities: 175,067 200,190 +25,122 +14.4
Current liabilities 161,327 186,115 +24,788 +15.4
Non-current liabilities 13,740 14,074 +333 +2.4
Net assets 231,664 261,622 +29,957 +12.9Note: From 2019, the Company adopted “Partial Amendments to Accounting Standard for Tax Effect Accounting” and has adopted this
retroactively for 2018. Therefore, the figures presented for current assets and non-current assets at the end of December 2018 are after
retroactive adoption.
2018 2019
Interest coverage ratio (times) 1,013.55 1,321.66
Interest-bearing debt ratio (%) 2.03 1.91
ROE (%) 15.18 17.79
ROA (%) 12.32 14.50Interest coverage ratio = Business profit / (Interest expenses + Interest payable on bonds)
ROA = Business profit / Total assets (average during the fiscal year)
Business profit = Operating profit + Interest income + Interest on securities + Dividends income + Share of profit (loss) of entities accounted for
using equity method
AssetsTotal assets at fiscal year-end increased ¥55,079 million from the previous fiscal year-end to ¥461,812 million. Current assets increased ¥51,016 million from the previous fiscal year-end to ¥382,485 million due to such factors as an increase in cash and deposits. Non-current assets increased ¥4,062 million from the previous fiscal year-end to ¥79,326 million.
LiabilitiesTotal liabilities at fiscal year-end increased ¥25,122 million from the previous fiscal year-end to ¥200,190 million. Current liabilities increased ¥24,788 million from the previous fiscal year-end to ¥186,115 million due to such factors as an increase in notes and accounts payable – trade. Non-current liabilities increased ¥333 million from the previous fiscal year-end to ¥14,074 million.
Net AssetsTotal net assets at fiscal year-end increased ¥29,957 million from the previous fiscal year-end to ¥261,622 million due to an increase in retained earnings. As a result, the equity ratio decreased 0.3 percentage point from the previous fiscal year-end to 56.2%.
The interest coverage ratio was 1,321.66 times, the interest-bearing debt ratio was 1.91%, return on equity (ROE) was 17.79% and return on assets (ROA) was 14.50%.
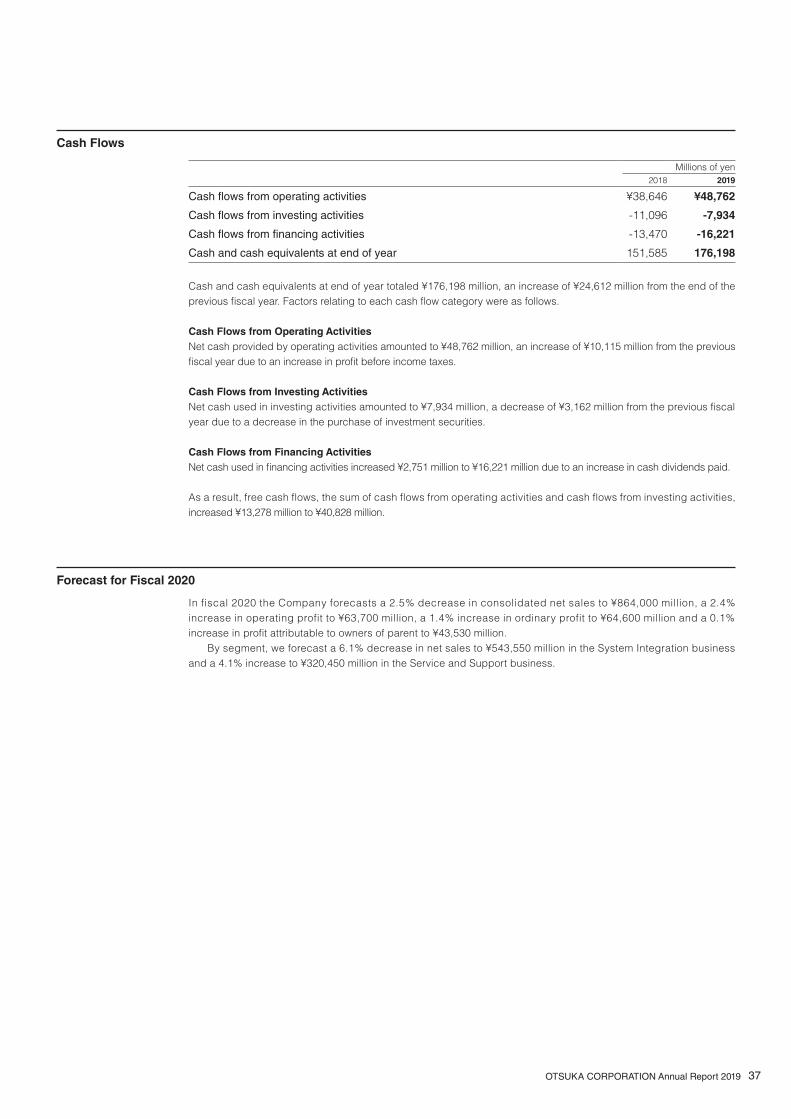
OTSUKA CORPORATION Annual Report 2019 37
Cash Flows
Forecast for Fiscal 2020
Millions of yen2018 2019
Cash flows from operating activities ¥38,646 ¥48,762
Cash flows from investing activities -11,096 -7,934
Cash flows from financing activities -13,470 -16,221
Cash and cash equivalents at end of year 151,585 176,198
Cash and cash equivalents at end of year totaled ¥176,198 million, an increase of ¥24,612 million from the end of the previous fiscal year. Factors relating to each cash flow category were as follows.
Cash Flows from Operating ActivitiesNet cash provided by operating activities amounted to ¥48,762 million, an increase of ¥10,115 million from the previous fiscal year due to an increase in profit before income taxes.
Cash Flows from Investing ActivitiesNet cash used in investing activities amounted to ¥7,934 million, a decrease of ¥3,162 million from the previous fiscal year due to a decrease in the purchase of investment securities.
Cash Flows from Financing ActivitiesNet cash used in financing activities increased ¥2,751 million to ¥16,221 million due to an increase in cash dividends paid.
As a result, free cash flows, the sum of cash flows from operating activities and cash flows from investing activities, increased ¥13,278 million to ¥40,828 million.
In fiscal 2020 the Company forecasts a 2.5% decrease in consolidated net sales to ¥864,000 million, a 2.4% increase in operating profit to ¥63,700 million, a 1.4% increase in ordinary profit to ¥64,600 million and a 0.1% increase in profit attributable to owners of parent to ¥43,530 million. By segment, we forecast a 6.1% decrease in net sales to ¥543,550 million in the System Integration business and a 4.1% increase to ¥320,450 million in the Service and Support business.

Consolidated Balance Sheets
OTSUKA CORPORATION and Consolidated Subsidiaries As of December 31, 2018 and 2019
Millions of yen
Thousands of
U.S. dollars 2018 2019 2019
Assets Current assets Cash and deposits (Note 2) ¥ 150,888 ¥ 175,427 $ 1,601,342 Notes and accounts receivable - trade (Note 4) 132,352 149,574 1,365,356 Merchandise 25,721 32,321 295,037 Work in process 957 1,470 13,420 Raw materials and supplies 828 754 6,888 Other 20,833 23,057 210,477 Allowance for doubtful accounts (113) (120) (1,099) Total current assets 331,468 382,485 3,491,424 Non-current assets
Property, plant and equipment
Buildings and structures 58,138 58,933 537,961 Accumulated depreciation and impairment loss (40,761) (42,183) (385,060) Buildings and structures, net 17,376 16,750 152,901 Land (Note 3) 15,604 15,351 140,135 Other 13,038 12,683 115,780 Accumulated depreciation and impairment loss (9,389) (8,838) (80,677) Other, net 3,649 3,845 35,103 Total property, plant and equipment 36,629 35,947 328,140 Intangible assets Software 13,729 14,452 131,923 Other 59 59 541 Total intangible assets 13,789 14,511 132,465 Investments and other assets
Investment securities (Note 1) 14,609 17,358 158,456 Guarantee deposits 2,424 2,428 22,163 Deferred tax assets 6,144 6,895 62,941 Other 1,854 2,414 22,036 Allowance for doubtful accounts (187) (229) (2,091) Total investments and other assets 24,844 28,867 263,506 Total non-current assets 75,263 79,326 724,112 Total assets ¥ 406,732 ¥ 461,812 $ 4,215,536 The accompanying notes are an integral part of these statements.
38 OTSUKA CORPORATION Annual Report 2019

Millions of yen
Thousands of
U.S. dollars 2018 2019 2019 Liabilities
Current liabilities Notes and accounts payable - trade (Note 2) (Note 4) ¥ 89,322 ¥ 102,006 $ 931,141 Electronically recorded obligations - operating 17,904 19,105 174,403 Short-term loans payable 4,800 4,800 43,815 Income taxes payable 9,326 13,270 121,134 Advances received 14,350 14,742 134,572 Provision for bonuses 3,564 4,014 36,645 Other 22,058 28,176 257,199 Total current liabilities 161,327 186,115 1,698,913 Non-current liabilities Long-term loans payable 1,700 1,700 15,518 Lease obligations 1,058 1,583 14,452 Provision for retirement benefits for directors 690 713 6,517 Retirement benefit liability 9,205 8,999 82,145 Other 1,085 1,077 9,838 Total non-current liabilities 13,740 14,074 128,471 Total liabilities 175,067 200,190 1,827,384 Net assets Shareholders' equity Capital stock 10,374 10,374 94,704 Capital surplus 16,254 16,254 148,377 Retained earnings 209,335 236,544 2,159,235 Treasury shares (139) (139) (1,276) Total shareholders' equity 235,825 263,034 2,401,041 Accumulated other comprehensive income Valuation difference on available-for-sale securities 4,544 6,117 55,844 Deferred gains or losses on hedges (23) 2 18 Revaluation reserve for land (Note 3) (11,650) (11,402) (104,080) Foreign currency translation adjustment 3 7 67 Remeasurements of defined benefit plans 1,027 1,569 14,328 Total accumulated other comprehensive income (6,098) (3,705) (33,821) Non-controlling interests 1,938 2,293 20,932 Total net assets 231,664 261,622 2,388,151 Total liabilities and net assets ¥ 406,732 ¥ 461,812 $ 4,215,536 The accompanying notes are an integral part of these statements.
OTSUKA CORPORATION Annual Report 2019 39
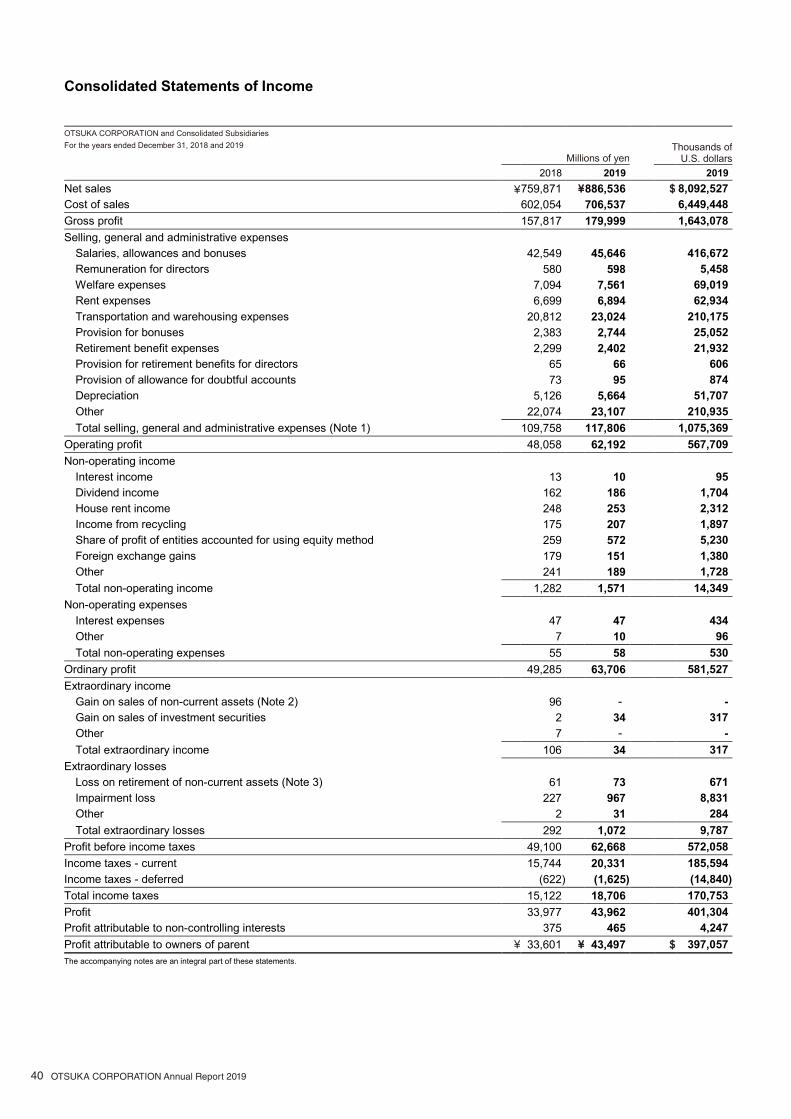
40 OTSUKA CORPORATION Annual Report 2019
Consolidated Statements of Income
OTSUKA CORPORATION and Consolidated Subsidiaries For the years ended December 31, 2018 and 2019
Millions of yen
Thousands of
U.S. dollars 2018 2019 2019 Net sales ¥ 759,871 ¥ 886,536 $ 8,092,527 Cost of sales 602,054 706,537 6,449,448 Gross profit 157,817 179,999 1,643,078 Selling, general and administrative expenses Salaries, allowances and bonuses 42,549 45,646 416,672 Remuneration for directors 580 598 5,458 Welfare expenses 7,094 7,561 69,019 Rent expenses 6,699 6,894 62,934 Transportation and warehousing expenses 20,812 23,024 210,175 Provision for bonuses 2,383 2,744 25,052 Retirement benefit expenses 2,299 2,402 21,932 Provision for retirement benefits for directors 65 66 606 Provision of allowance for doubtful accounts 73 95 874 Depreciation 5,126 5,664 51,707 Other 22,074 23,107 210,935 Total selling, general and administrative expenses (Note 1) 109,758 117,806 1,075,369 Operating profit 48,058 62,192 567,709 Non-operating income Interest income 13 10 95 Dividend income 162 186 1,704 House rent income 248 253 2,312 Income from recycling 175 207 1,897 Share of profit of entities accounted for using equity method 259 572 5,230 Foreign exchange gains 179 151 1,380 Other 241 189 1,728 Total non-operating income 1,282 1,571 14,349 Non-operating expenses Interest expenses 47 47 434 Other 7 10 96 Total non-operating expenses 55 58 530 Ordinary profit 49,285 63,706 581,527 Extraordinary income Gain on sales of non-current assets (Note 2) 96 - - Gain on sales of investment securities 2 34 317 Other 7 - - Total extraordinary income 106 34 317 Extraordinary losses Loss on retirement of non-current assets (Note 3) 61 73 671 Impairment loss 227 967 8,831 Other 2 31 284 Total extraordinary losses 292 1,072 9,787 Profit before income taxes 49,100 62,668 572,058 Income taxes - current 15,744 20,331 185,594 Income taxes - deferred (622) (1,625) (14,840) Total income taxes 15,122 18,706 170,753 Profit 33,977 43,962 401,304 Profit attributable to non-controlling interests 375 465 4,247 Profit attributable to owners of parent ¥ 33,601 ¥ 43,497 $ 397,057 The accompanying notes are an integral part of these statements.

OTSUKA CORPORATION Annual Report 2019 41
Consolidated Statements of Comprehensive Income
OTSUKA CORPORATION and Consolidated Subsidiaries For the years ended December 31, 2018 and 2019
Millions of yen
Thousands of
U.S. dollars 2018 2019 2019 Profit ¥ 33,977 ¥ 43,962 $ 401,304 Other comprehensive income Valuation difference on available-for-sale securities (2,763) 1,565 14,288 Deferred gains or losses on hedges (31) 31 284 Revaluation reserve for land - 76 695 Remeasurements of defined benefit plans, net of tax (263) 556 5,078 Share of other comprehensive income of entities accounted for using equity method (45) (5) (49) Total other comprehensive income (Note 1) (3,103) 2,223 20,297 Comprehensive income ¥ 30,874 ¥ 46,186 $ 421,601 (Breakdown) Comprehensive income attributable to owners of parent ¥ 30,468 ¥ 45,718 $ 417,331 Comprehensive income attributable to non-controlling interests 406 467 4,270 The accompanying notes are an integral part of these statements.

Consolidated Statements of Changes in Net Assets
OTSUKA CORPORATION and Consolidated Subsidiaries Millions of yen For the year ended December 31, 2018 Shareholders' equity
Capital stock
Capital surplus
Retained earnings
Treasury shares
Total shareholders'
equity
Balance as of January 1, 2018 ¥ 10,374 ¥ 16,254 ¥ 189,816 ¥ (137) ¥ 216,308 Dividends of surplus (13,272) (13,272) Profit attributable to owners of parent 33,601 33,601 Reversal of revaluation reserve for land (446) (446) Purchase of treasury shares (2) (2) Change of scope of consolidation (364) (364) Net changes of items other than shareholders' equity Total changes of items during period - - 19,518 (2) 19,516 Balance as of December 31, 2018 ¥ 10,374 ¥ 16,254 ¥ 209,335 ¥ (139) ¥ 235,825
Millions of yen Accumulated other comprehensive income
Valuation difference on
available-for-sale securities
Deferred gains or losses
on hedges
Revaluation reserve for land
Foreign currency
translation adjustment
Remeasurements of defined
benefit plans
Total accumulated other
comprehensive income
Non- controlling
interests Total net
assets
Balance as of January 1, 2018 ¥ 7,348 ¥ 2 ¥ (12,097) ¥ 45 ¥ 1,289 ¥ (3,411) ¥ 1,634 ¥ 214,532 Dividends of surplus (13,272) Profit attributable to owners of parent 33,601 Reversal of revaluation reserve for land (446) Purchase of treasury shares (2) Change of scope of consolidation (364) Net changes of items other than
shareholders' equity (2,804) (25) 446 (41) (261) (2,687) 303 (2,384)
Total changes of items during period (2,804) (25) 446 (41) (261) (2,687) 303 17,132 Balance as of December 31, 2018 ¥ 4,544 ¥ (23) ¥ (11,650) ¥ 3 ¥ 1,027 ¥ (6,098) ¥ 1,938 ¥ 231,664
OTSUKA CORPORATION and Consolidated Subsidiaries Millions of yen For the year ended December 31, 2019 Shareholders' equity
Capital stock
Capital surplus
Retained earnings
Treasury shares
Total shareholders'
equity
Balance as of January 1, 2019 ¥ 10,374 ¥ 16,254 ¥ 209,335 ¥ (139) ¥ 235,825 Dividends of surplus (16,116) (16,116) Profit attributable to owners of parent 43,497 43,497 Reversal of revaluation reserve for land (172) (172) Purchase of treasury shares (0) (0) Net changes of items other than shareholders' equity Total changes of items during period - - 27,208 (0) 27,208 Balance as of December 31, 2019 ¥ 10,374 ¥ 16,254 ¥ 236,544 ¥ (139) ¥ 263,034
Millions of yen Accumulated other comprehensive income
Valuation difference on
available-for-sale securities
Deferred gains or losses
on hedges
Revaluation reserve for land
Foreign currency
translation adjustment
Remeasurements of defined
benefit plans
Total accumulated other
comprehensive income
Non- controlling
interests Total net
assets
Balance as of January 1, 2019 ¥ 4,544 ¥ (23) ¥ (11,650) ¥ 3 ¥ 1,027 ¥ (6,098) ¥ 1,938 ¥ 231,664 Dividends of surplus (16,116) Profit attributable to owners of parent 43,497 Reversal of revaluation reserve for land (172) Purchase of treasury shares (0) Net changes of items other than
shareholders' equity 1,573 25 248 4 542 2,393 355 2,748 Total changes of items during period 1,573 25 248 4 542 2,393 355 29,957 Balance as of December 31, 2019 ¥ 6,117 ¥ 2 ¥ (11,402) ¥ 7 ¥ 1,569 ¥ (3,705) ¥ 2,293 ¥ 261,622
42 OTSUKA CORPORATION Annual Report 2019

OTSUKA CORPORATION and Consolidated Subsidiaries Thousands of U.S. dollars For the year ended December 31, 2019 Shareholders' equity
Capital stock
Capital surplus
Retained earnings
Treasury shares
Total shareholders'
equity
Balance as of January 1, 2019 $ 94,704 $ 148,377 $ 1,910,866 $ (1,274) $ 2,152,673 Dividends of surplus (147,111) (147,111) Profit attributable to owners of parent 397,057 397,057 Reversal of revaluation reserve for land (1,576) (1,576) Purchase of treasury shares (1) (1) Net changes of items other than shareholders' equity Total changes of items during period - - 248,369 (1) 248,367 Balance as of December 31, 2019 $ 94,704 $ 148,377 $ 2,159,235 $ (1,276) $ 2,401,041
Thousands of U.S. dollars Accumulated other comprehensive income
Valuation difference on
available-for-sale securities
Deferred gains or losses
on hedges
Revaluation reserve for land
Foreign currency
translation adjustment
Remeasurements of defined
benefit plans
Total accumulated other
comprehensive income
Non- controlling
interests Total net
assets
Balance as of January 1, 2019 $ 41,483 $ (213) $ (106,352) $ 30 $ 9,379 $ (55,672) $ 17,691 $ 2,114,692 Dividends of surplus (147,111) Profit attributable to owners of parent 397,057 Reversal of revaluation reserve for land (1,576) Purchase of treasury shares (1) Net changes of items other than
shareholders' equity 14,360 231 2,271 37 4,949 21,850 3,241 25,091 Total changes of items during period 14,360 231 2,271 37 4,949 21,850 3,241 273,459 Balance as of December 31, 2019 $ 55,844 $ 18 $ (104,080) $ 67 $ 14,328 $ (33,821) $ 20,932 $ 2,388,151 The accompanying notes are an integral part of these statements.
OTSUKA CORPORATION Annual Report 2019 43

Consolidated Statements of Cash Flows
OTSUKA CORPORATION and Consolidated Subsidiaries For the years ended December 31, 2018 and 2019
Millions of yen
Thousands of
U.S. dollars 2018 2019 2019 Cash flows from operating activities: Profit before income taxes ¥ 49,100 ¥ 62,668 $ 572,058 Depreciation 6,438 7,228 65,983 Impairment loss 227 967 8,831 Increase (decrease) in allowance for doubtful accounts 9 48 442 Interest and dividend income (176) (197) (1,799) Interest expenses 47 47 434 Share of loss (profit) of entities accounted for using equity method (259) (572) (5,230) Loss on retirement of non-current assets 61 73 671 Loss (gain) on sales of non-current assets (94) - - Decrease (increase) in notes and accounts receivable - trade (10,255) (17,263) (157,588) Decrease (increase) in inventories (909) (7,038) (64,251) Increase (decrease) in notes and accounts payable - trade 6,246 13,884 126,745 Other, net 2,540 5,246 47,889 Subtotal 52,976 65,093 594,186 Interest and dividend income received 207 276 2,521 Interest expenses paid (48) (47) (436) Income taxes paid (14,489) (16,559) (151,154) Net cash provided by (used in) operating activities 38,646 48,762 445,116 Cash flows from investing activities: Purchase of property, plant and equipment (2,436) (2,152) (19,649) Proceeds from sales of property, plant and equipment 243 - - Purchase of software (5,864) (5,707) (52,099) Purchase of investment securities (3,065) (43) (396) Proceeds from sales of investment securities 10 65 599 Other, net 13 (96) (878) Net cash provided by (used in) investing activities (11,096) (7,934) (72,425) Cash flows from financing activities: Net increase (decrease) in short-term loans payable (100) - - Cash dividends paid (13,265) (16,109) (147,047) Other, net (105) (112) (1,030) Net cash provided by (used in) financing activities (13,470) (16,221) (148,077) Effect of exchange rate change on cash and cash equivalents (7) 6 55 Net increase (decrease) in cash and cash equivalents 14,071 24,612 224,668 Cash and cash equivalents at beginning of period 137,545 151,585 1,383,714 Decrease in cash and cash equivalents resulting from exclusion of subsidiaries from consolidation (31) - - Cash and cash equivalents at end of period (Note 1) ¥ 151,585 ¥ 176,198 $ 1,608,383 The accompanying notes are an integral part of these statements.
44 OTSUKA CORPORATION Annual Report 2019
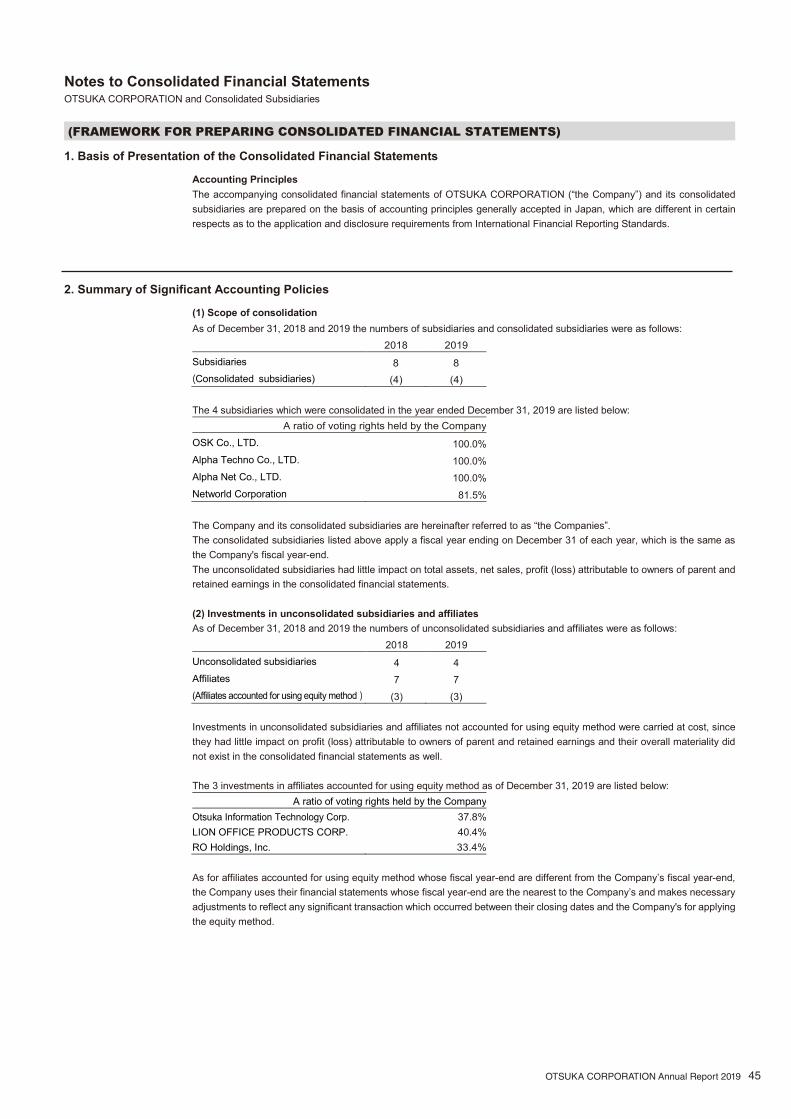
Notes to Consolidated Financial Statements OTSUKA CORPORATION and Consolidated Subsidiaries
(FRAMEWORK FOR PREPARING CONSOLIDATED FINANCIAL STATEMENTS)
1. Basis of Presentation of the Consolidated Financial Statements
Accounting Principles The accompanying consolidated financial statements of OTSUKA CORPORATION (“the Company”) and its consolidated subsidiaries are prepared on the basis of accounting principles generally accepted in Japan, which are different in certain respects as to the application and disclosure requirements from International Financial Reporting Standards.
2. Summary of Significant Accounting Policies
(1) Scope of consolidation As of December 31, 2018 and 2019 the numbers of subsidiaries and consolidated subsidiaries were as follows: 2018 2019 Subsidiaries 8 8 (Consolidated subsidiaries) (4) (4)
The 4 subsidiaries which were consolidated in the year ended December 31, 2019 are listed below:
A ratio of voting rights held by the Company OSK Co., LTD. 100.0% Alpha Techno Co., LTD. 100.0% Alpha Net Co., LTD. 100.0% Networld Corporation 81.5%
The Company and its consolidated subsidiaries are hereinafter referred to as “the Companies”. The consolidated subsidiaries listed above apply a fiscal year ending on December 31 of each year, which is the same as the Company's fiscal year-end. The unconsolidated subsidiaries had little impact on total assets, net sales, profit (loss) attributable to owners of parent and retained earnings in the consolidated financial statements.
(2) Investments in unconsolidated subsidiaries and affiliates As of December 31, 2018 and 2019 the numbers of unconsolidated subsidiaries and affiliates were as follows: 2018 2019 Unconsolidated subsidiaries 4 4 Affiliates 7 7 (Affiliates accounted for using equity method) (3) (3)
Investments in unconsolidated subsidiaries and affiliates not accounted for using equity method were carried at cost, since they had little impact on profit (loss) attributable to owners of parent and retained earnings and their overall materiality did not exist in the consolidated financial statements as well.
The 3 investments in affiliates accounted for using equity method as of December 31, 2019 are listed below:
A ratio of voting rights held by the Company Otsuka Information Technology Corp. 37.8%
LION OFFICE PRODUCTS CORP. 40.4%
RO Holdings, Inc. 33.4%
As for affiliates accounted for using equity method whose fiscal year-end are different from the Company’s fiscal year-end, the Company uses their financial statements whose fiscal year-end are the nearest to the Company’s and makes necessary adjustments to reflect any significant transaction which occurred between their closing dates and the Company's for applying the equity method.
OTSUKA CORPORATION Annual Report 2019 45

(3) Financial instruments (a) Securities Securities held by the Companies are as follows:
・Available-for-sale securities Securities with market quotations are measured at fair value, based on market prices at the balance sheet date. (Unrealized gains/losses from valuation of marketable securities are charged directly to net assets at a net-of-tax amount, while cost of sale is determined by the moving-average method.) Securities without market quotations are stated at cost, determined by the moving-average method. Regarding investments in limited partnerships and similar investments, an amount equivalent to the Company's partnership investment gain or loss under the equity method, with such a gain or loss being based on the latest available financial statements of the corresponding limited partnerships, was recognized in the consolidated statements of income.
(b) Derivatives Derivatives are recognized at fair value.
(4) Inventories Inventories are stated at cost (carrying value of inventories on the balance sheet is stated by writing down based on their decrease in profitability).
Merchandise Primarily, moving-average method Work in process Specific identification method Raw materials and supplies Primarily, moving-average method
(5) Property, plant and equipment (excluding lease assets) Depreciation is calculated using the declining-balance method, at rates based on the estimated useful lives of assets. Buildings (excluding facilities attached to buildings) acquired on or after April 1, 1998, facilities attached to buildings and structures acquired on or after April 1, 2016 are depreciated by the straight-line method.
Estimated useful lives of assets are principally as follows:
Buildings and structures ― 15 to 50 years Other ― 4 to 10 years
Normal repairs and maintenance, including minor renewals and improvements, are charged to the consolidated statements of income as incurred.
(6) Intangible assets (excluding lease assets) Development costs of computer software to be sold are amortized based on the estimated sales revenue with the minimum amortization amount calculated based on a useful life within 3 years. Software developed for internal use is amortized on a straight-line basis over the estimated useful life of the asset, which is 5 years.
(7) Lease assets Depreciation of finance lease assets, which do not transfer ownership of the assets at the end of the lease term, is calculated by the straight-line method over the lease periods, which are deemed as the useful lives, assuming no residual value.
(8) Allowance for doubtful accounts An allowance for doubtful accounts is provided at an amount of potential losses from uncollectable receivables based on the historical rate of losses from bad debts for ordinary receivables, and on the estimated collectability of receivables from companies in financial difficulty.
(9) Provision for bonuses The Companies provide accrued bonuses for employees based on the estimated amounts to be paid in respect of the fiscal year.
46 OTSUKA CORPORATION Annual Report 2019

(10) Provision for retirement benefits for directors The Companies have retirement benefits for directors. Retirement benefits for directors at the balance sheet date are based on an estimate of the amounts to be paid as retirement allowance for services rendered by directors by that date.
(11) Accounting methods for retirement benefits (a)The method to attribute expected benefit to periods of service The retirement benefit obligation for employee is attributed to each period by the benefit formula basis over the estimated years of service of the eligible employees.
(b)The method of recording of actuarial gains and losses and prior service costs Prior service cost is amortized as incurred by the straight-line method over periods (12 years), which are shorter than the average remaining years of service of the employees. Actuarial gain or loss is amortized in the following year in which the gain or loss is recognized primarily by the straight-line method over periods (mainly 12 years), which are shorter than the average remaining years of service of the employees. (12) The revenue and cost recognition basis regarding the make-to-order software Revenues and costs of the make-to-order software contracts of which the percentage of completion can be reliably estimated, are recognized by the percentage-of-completion method. The completed-contract method continues to be applied for contracts of which the percentage of completion cannot be reliably estimated.
(13) Foreign currency translation Receivables and payables denominated in foreign currencies are translated into Japanese yen at the spot exchange rates in effect at the balance sheet date, and the differences arising from the translation are recognized as gains/losses in the consolidated statements of income.
(14) Hedge accounting (a)Hedge accounting method Deferral hedge accounting method. Interest rate swap agreements are not recognized at fair value if the agreements meet the criteria for application of the exceptional treatment for the recognition of derivatives at fair value. (b)Hedging instruments and hedged items 1. Hedging instruments: Forward foreign exchange contracts Hedged items: Forecasted transactions denominated in foreign currencies 2. Hedging instruments: Interest rate swaps Hedged items: Loans payable
(c)Hedge policy The Company and one consolidated subsidiary utilize derivatives based on internal rules for the purpose of hedging its exposure to fluctuations in foreign exchange rates and interest rates. (d)Evaluation of hedging effectiveness The Companies assess its hedging effectiveness by comparing the accumulated changes in fair value of hedging instruments with the accumulated changes in fair value of hedged items. The assessment is omitted, if the substantial terms and conditions concerning hedging instruments and hedged items are same, and the fluctuations are expected to be offset perfectly. In addition, the assessment of the effectiveness is omitted for interest rate swaps that meet the criteria for application of the exceptional treatment for the recognition of derivatives at fair value.
(15) Cash and cash equivalents Cash and cash equivalents in the consolidated statements of cash flows are composed of cash in hand, bank deposits which can be withdrawn on demand and short-term investments with an original maturity of three months or less and which represent a minor risk of fluctuation in value. (16) Accounting for income taxes Income taxes of the Companies consist of corporate income taxes, local inhabitant taxes and enterprise taxes. The Companies have adopted the deferred tax accounting method. Income taxes were determined using the asset and liability approach, whereby deferred tax assets and liabilities were recognized in respect of temporary differences between the tax basis of assets and liabilities and those as reported in the consolidated financial statements.
OTSUKA CORPORATION Annual Report 2019 47

(17) Accounting for the consumption tax The Japanese Consumption Tax Law generally imposes consumption tax on domestic consumption of goods and services (Some goods and services are tax-exempt). The consumption tax withheld upon sale is not included in the amount of “Net sales” in the accompanying consolidated statements of income but recorded as a liability. Consumption tax, which is paid by the Companies on purchases of goods and services, is not included in the amounts of costs/expenses in the consolidated statements of income, but offset consumption tax for the sales by the one for the purchase, and the net balance is included in “Other” in current liabilities in the consolidated balance sheets.
(18) Accounting pronouncement not yet adopted ―Accounting Standard for Revenue Recognition (ASBJ Statement No.29 on March 30, 2018) ―Implementation Guidance on Accounting Standard for Revenue Recognition (ASBJ Guidance No.30 on March 30, 2018)
(a)Overview This is a comprehensive accounting standard for revenue recognition. Specifically, the accounting standard establishes the following five-step model that will apply to revenue from customers: 1. Identify the contract(s) with a customer 2. Identify the performance obligations in the contract 3. Determine the transaction price 4. Allocate the transaction price to the performance obligations in the contract 5. Recognize revenue when (or as) the entity satisfies a performance obligation
(b)Scheduled date of adoption The Companies expect to adopt the accounting standard and implementation guidance from the beginning of the fiscal year ending December 31, 2022.
(c)Impact of the adoption of accounting standard and implementation guidance The Companies are currently evaluating the impact of the adoption of this accounting standard and implementation guidance on the consolidated financial statements.
―Accounting Standard for Fair Value Measurement (ASBJ Statement No. 30 on July 4, 2019) ―Implementation Guidance on Accounting Standard for Fair Value Measurement (ASBJ Guidance No. 31 on July 4,
2019) ―Accounting Standard for Measurement of Inventories (ASBJ Statement No. 9 revised on July 4, 2019) ―Accounting Standard for Financial Instruments (ASBJ Statement No. 10 revised on July 4, 2019)
(a)Overview
In order to enhance comparability of financial statements among domestic and overseas companies, ASBJ developed an "Accounting Standard for Fair Value Measurement" and issued a new standard together with its implementation guidance. The sections which adopted the accounting standard and implementation guidance are as follows: ・Financial Instruments defined by "Accounting Standard for Financial Instruments" ・Measurement method of Inventories held for trading purposes defined by "Accounting Standard for Measurement of Inventories"
(b)Scheduled date of adoption
The Companies expect to adopt the accounting standard and implementation guidance from the beginning of the fiscal year ending December 31, 2022.
(c)Impact of the adoption of accounting standard and implementation guidance
The Companies are currently evaluating the impact of the adoption of this accounting standard and implementation guidance on the consolidated financial statements.
(19) Change in presentation Partial Amendments to Accounting Standard for Tax Effect Accounting The Companies have adopted “Partial Amendments to Accounting Standard for Tax Effect Accounting (ASBJ Statement No.28 on February 16, 2018) (hereinafter, the “Partial Amendments”) from the beginning of the year ended December 31, 2019. As such, deferred tax assets is classified as part of "Investments and other assets" and deferred tax liabilities is classified as part of "Non-current liabilities" respectively. As a result, ¥3,181 million of deferred tax assets previously presented in "Current assets" in consolidated balance sheets as of December 31, 2018 is included within ¥6,144 million of deferred tax assets in "Investments and other assets."
48 OTSUKA CORPORATION Annual Report 2019

(20) Rounding of amounts Amounts of less than a million yen have been omitted.
3. U.S. Dollar Amounts
Amounts in U.S. dollars are included solely for the convenience of readers outside Japan. Amounts of less than a thousand of U.S. dollars have been omitted. The rate of ¥109.55 = US$1, exchange rates on December 31, 2019, has been used in translation. The inclusion of such amounts is not intended to imply that Japanese yen have been or could be readily converted, realized or settled in U.S. dollars at this rate.
(CONSOLIDATED BALANCE SHEETS)
*1. Investment securities
As of December 31, 2018 and 2019, principal items related to unconsolidated subsidiaries and affiliates were as follows:
Millions of yen
Thousands of U.S. dollars
2018 2019 2019
Investment securities (stock) ¥ 6,214 ¥ 6,704 $ 61,197 Investment securities (capital) 217 217 1,982
*2. Pledged Assets As of December 31, 2018 and 2019, pledged assets were as follows:
Millions of yen Thousands of
U.S. dollars
2018 2019 2019
Time deposits ¥ 5 - -
Liabilities corresponding to above assets were as follows:
Millions of yen
Thousands of U.S. dollars
2018 2019 2019
Notes and accounts payable - trade ¥ 5 - -
*3. Land Revaluation Pursuant to the "Act on Revaluation of Land", and "Act on Partial Amendment to the Act on Revaluation of Land", the Company revalued land used for business activities. The amount which is deducted deferred tax liabilities for land revaluation from revaluation difference was recorded as “Revaluation reserve for land”, net assets in the accompanying consolidated balance sheets. Revaluation method provided in article 3-3 of "Act on Revaluation of Land" The Company revalued land using the price of land which is determined based on article 2-4 of "Order for Enforcement of Act on Revaluation on Land" and assessed value of fixed assets provided in article 2-3 for land without price of land after making reasonable adjustments for land shape and so on. The date of Land Revaluation: December 31, 2001 As of December 31, 2018 and 2019, the differences between fair value and carrying value after revaluation were as follows:
Millions of yen
Thousands of U.S. dollars
2018 2019 2019
The differences between fair value and carrying value after revaluation ¥ 73 ¥ 438 $ 3,998
*4. Notes matured at the balance sheet date
December 31, 2018 and 2019 were a bank holiday, and notes matured at the balance sheet date were accounted for as if they were settled on the maturity dates. As of December 31, 2018 and 2019, notes matured at the balance sheet date were as follows:
Millions of yen
Thousands of
U.S. dollars
2018 2019 2019
Notes receivable ¥ 555 ¥ 450 $ 4,107
Notes payable - 0 1
OTSUKA CORPORATION Annual Report 2019 49

(CONSOLIDATED BALANCE SHEETS)
*1. Investment securities
As of December 31, 2018 and 2019, principal items related to unconsolidated subsidiaries and affiliates were as follows:
Millions of yen
Thousands of U.S. dollars
2018 2019 2019
Investment securities (stock) ¥ 6,214 ¥ 6,704 $ 61,197 Investment securities (capital) 217 217 1,982
*2. Pledged Assets As of December 31, 2018 and 2019, pledged assets were as follows:
Millions of yen Thousands of
U.S. dollars
2018 2019 2019
Time deposits ¥ 5 - -
Liabilities corresponding to above assets were as follows:
Millions of yen
Thousands of U.S. dollars
2018 2019 2019
Notes and accounts payable - trade ¥ 5 - -
*3. Land Revaluation Pursuant to the "Act on Revaluation of Land", and "Act on Partial Amendment to the Act on Revaluation of Land", the Company revalued land used for business activities. The amount which is deducted deferred tax liabilities for land revaluation from revaluation difference was recorded as “Revaluation reserve for land”, net assets in the accompanying consolidated balance sheets. Revaluation method provided in article 3-3 of "Act on Revaluation of Land" The Company revalued land using the price of land which is determined based on article 2-4 of "Order for Enforcement of Act on Revaluation on Land" and assessed value of fixed assets provided in article 2-3 for land without price of land after making reasonable adjustments for land shape and so on. The date of Land Revaluation: December 31, 2001 As of December 31, 2018 and 2019, the differences between fair value and carrying value after revaluation were as follows:
Millions of yen
Thousands of U.S. dollars
2018 2019 2019
The differences between fair value and carrying value after revaluation ¥ 73 ¥ 438 $ 3,998
*4. Notes matured at the balance sheet date
December 31, 2018 and 2019 were a bank holiday, and notes matured at the balance sheet date were accounted for as if they were settled on the maturity dates. As of December 31, 2018 and 2019, notes matured at the balance sheet date were as follows:
Millions of yen
Thousands of
U.S. dollars
2018 2019 2019
Notes receivable ¥ 555 ¥ 450 $ 4,107
Notes payable - 0 1
(CONSOLIDATED STATEMENTS OF INCOME)
*1. Research and development expenses
For the years ended December 31, 2018 and 2019, Research and development expenses were as follows:
Millions of yen Thousands of
U.S. dollars
2018 2019 2019
Research and development expenses included in general and
administrative expenses and manufacturing costs ¥ 1,004 ¥ 476 $ 4,345
*2. Gain on sales of non-current assets
For the years ended December 31, 2018 and 2019, Gain on sales of non-current assets were as follows:
Millions of yen Thousands of
U.S. dollars
2018 2019 2019
Buildings and structures ¥ 59 - - Land 37 - - Other property, plant and equipment 0 - - Gain on sales of non-current assets ¥ 96 - -
*3. Loss on retirement of non-current assets
For the years ended December 31, 2018 and 2019, Loss on retirement of non-current assets were as follows:
Millions of yen Thousands of
U.S. dollars
2018 2019 2019
Buildings and structures ¥ 27 ¥ 43 $ 396
Other property, plant and equipment 33 28 262
Software - 1 12
Loss on retirement of non-current assets ¥ 61 ¥ 73 $ 671
50 OTSUKA CORPORATION Annual Report 2019

(CONSOLIDATED STATEMENTS OF INCOME)
*1. Research and development expenses
For the years ended December 31, 2018 and 2019, Research and development expenses were as follows:
Millions of yen Thousands of
U.S. dollars
2018 2019 2019
Research and development expenses included in general and
administrative expenses and manufacturing costs ¥ 1,004 ¥ 476 $ 4,345
*2. Gain on sales of non-current assets
For the years ended December 31, 2018 and 2019, Gain on sales of non-current assets were as follows:
Millions of yen Thousands of
U.S. dollars
2018 2019 2019
Buildings and structures ¥ 59 - - Land 37 - - Other property, plant and equipment 0 - - Gain on sales of non-current assets ¥ 96 - -
*3. Loss on retirement of non-current assets
For the years ended December 31, 2018 and 2019, Loss on retirement of non-current assets were as follows:
Millions of yen Thousands of
U.S. dollars
2018 2019 2019
Buildings and structures ¥ 27 ¥ 43 $ 396
Other property, plant and equipment 33 28 262
Software - 1 12
Loss on retirement of non-current assets ¥ 61 ¥ 73 $ 671
(CONSOLIDATED STATEMENTS OF COMPREHENSIVE INCOME)
*1. Other comprehensive income
For the years ended December 31, 2018 and 2019, reclassification adjustments and tax effects related to other comprehensive income were as follows: Millions of yen
Thousands of U.S. dollars
2018 2019 2019
Valuation difference on available-for-sale securities Amount arising during the year ¥ (3,993) ¥ 2,263 $ 20,665 Reclassification adjustments (2) (7) (70)
Amount before tax effect (3,996) 2,256 20,594 Tax effect 1,232 (690) (6,306) Valuation difference on available-for-sale securities (2,763) 1,565 14,288
Deferred gains or losses on hedges Amount arising during the year (22) 1 15 Reclassification adjustments (23) 43 394
Amount before tax effect (45) 44 409 Tax effect 13 (13) (125) Deferred gains or losses on hedges (31) 31 284
Revaluation reserve for land Amount arising during the year - - - Reclassification adjustments - - -
Amount before tax effect - - - Tax effect - 76 695
Revaluation reserve for land - 76 695 Remeasurements of defined benefit plans
Amount arising during the year (452) 559 5,107 Reclassification adjustments 74 243 2,223
Amount before tax effects (378) 803 7,331 Tax effects 115 (246) (2,252) Remeasurements of defined benefit plans (263) 556 5,078
Share of other comprehensive income of entities accounted for using equity method
Amount arising during the year (47) (6) (62) Reclassification adjustments 1 1 13
Share of other comprehensive income of entities accounted for using equity method
(45) (5) (49)
Total other comprehensive income ¥ (3,103) ¥ 2,223 $ 20,297
OTSUKA CORPORATION Annual Report 2019 51

(CONSOLIDATED STATEMENTS OF CHANGES IN NET ASSETS)
1. Shareholders' Equity
The Companies Act of Japan provides that an amount equal to 10% of distributions from capital surplus (other than capital reserves) and retained earnings (other than retained earnings reserves) should be appropriated to capital reserves and retained earnings reserves. No further appropriations are required when the total amount of capital reserves and retained earnings reserves reach 25% of stated capital. Such distributions can be made at any time by resolution of the shareholders or the Board of Directors if certain conditions are met, but neither capital reserves nor retained earnings reserves are available for distributions.
2. Dividends from surplus, etc.
(1) Number of shares issued
Thousands of shares
2018 2019
Number of shares at the beginning of the fiscal year 95,001 190,002
Increase(*) 95,001 -
Decrease - -
Number of shares as of the end of the fiscal year 190,002 190,002
Type of all shares issued is common stock. * The Company implemented a two-for-one stock split of its common stock with an effective date of April 1, 2018. The shares increase in the number of shares issued arise from the stock split.
(2) Number of treasury shares
Thousands of shares
2018 2019
Number of shares at the beginning of the fiscal year 200 400 Increase (*1) 200 (*2) 0 Decrease - -
Number of shares as of the end of the fiscal year 400 400 Type of all treasury shares is common stock. *1 The 200 thousands of shares increase in the number of treasury shares consists of 200 thousand of shares by the stock split with an effective date of
April 1, 2018 and 0 thousand of shares by purchase of the shares of less than standard unit. *2 The 0 thousand of shares increase in the number of treasury shares is due to purchase of the shares of less than standard unit.
(3) Items related to subscription rights to shares and own stock option None.
(4) Items related to dividends General meeting of shareholders approved resolutions on the amount of dividend payments as follows:
Resolution date Dividends paid Dividend per share
Record date
Effective date
(Millions of yen) (Thousands of
U.S. dollars) (Yen) (U.S. dollars)
2018/03/28 ¥ 13,272 $ 121,151 ¥ 140.00 $ 1.28 2017/12/31 2018/03/29
2019/03/27 ¥ 16,116 $ 147,111 (*) ¥ 85.00 $ 0.78 2018/12/31 2019/03/28
2020/03/27 ¥ 20,856 $ 190,380 (*) ¥ 110.00 $ 1.00 2019/12/31 2020/03/30
Type of all shares issued is common stock. Source of dividends is Retained earnings. * The dividend per share whose record dates are December 31, 2018 and 2019 stated above are calculated in consideration of the stock split with an
effective date of April 1, 2018. The dividend per share whose record dates are December 31, 2018 and 2019 not considering the stock split are
¥170.00 and ¥220.00, respectively.
52 OTSUKA CORPORATION Annual Report 2019
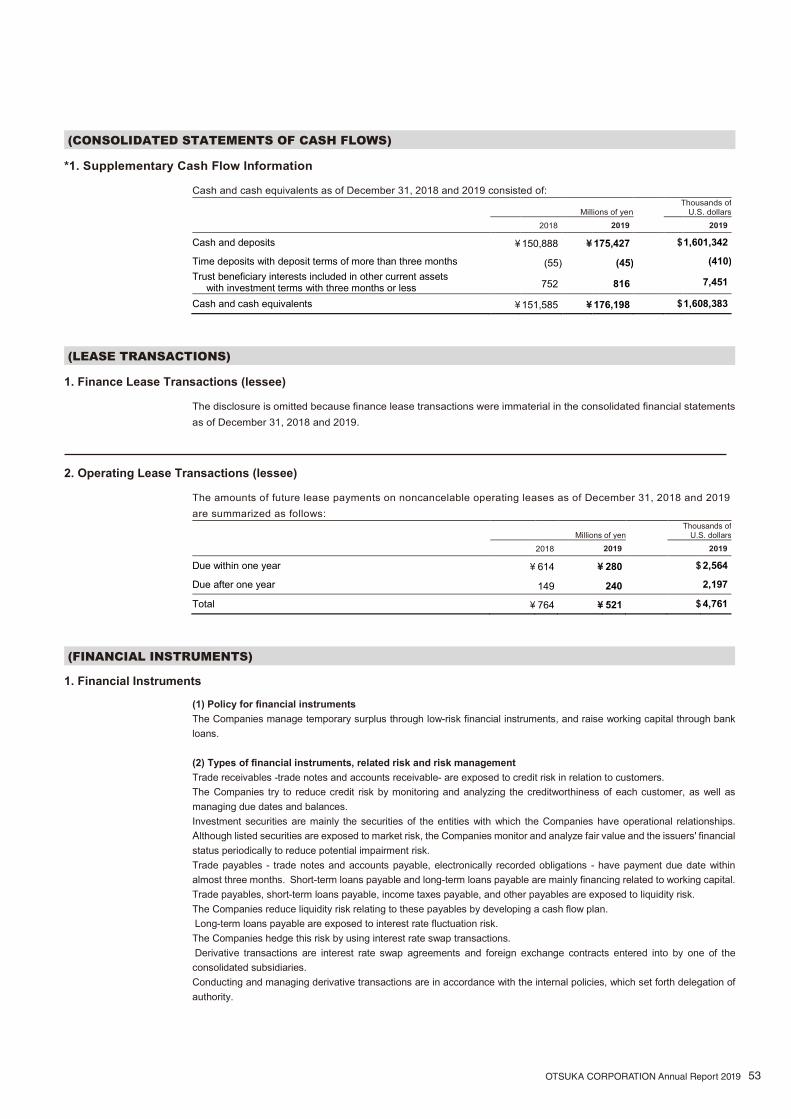
(CONSOLIDATED STATEMENTS OF CASH FLOWS)
*1. Supplementary Cash Flow Information
Cash and cash equivalents as of December 31, 2018 and 2019 consisted of:
Millions of yen Thousands of
U.S. dollars 2018 2019 2019
Cash and deposits ¥ 150,888 ¥ 175,427 $ 1,601,342
Time deposits with deposit terms of more than three months (55) (45) (410) Trust beneficiary interests included in other current assets with investment terms with three months or less 752 816 7,451
Cash and cash equivalents ¥ 151,585 ¥ 176,198 $ 1,608,383
(LEASE TRANSACTIONS)
1. Finance Lease Transactions (lessee)
The disclosure is omitted because finance lease transactions were immaterial in the consolidated financial statements as of December 31, 2018 and 2019.
2. Operating Lease Transactions (lessee)
The amounts of future lease payments on noncancelable operating leases as of December 31, 2018 and 2019 are summarized as follows:
Millions of yen Thousands of
U.S. dollars 2018 2019 2019
Due within one year ¥ 614 ¥ 280 $ 2,564
Due after one year 149 240 2,197
Total ¥ 764 ¥ 521 $ 4,761
(FINANCIAL INSTRUMENTS)
1. Financial Instruments
(1) Policy for financial instruments The Companies manage temporary surplus through low-risk financial instruments, and raise working capital through bank loans.
(2) Types of financial instruments, related risk and risk management Trade receivables -trade notes and accounts receivable- are exposed to credit risk in relation to customers. The Companies try to reduce credit risk by monitoring and analyzing the creditworthiness of each customer, as well as managing due dates and balances. Investment securities are mainly the securities of the entities with which the Companies have operational relationships. Although listed securities are exposed to market risk, the Companies monitor and analyze fair value and the issuers' financial status periodically to reduce potential impairment risk. Trade payables - trade notes and accounts payable, electronically recorded obligations - have payment due date within almost three months. Short-term loans payable and long-term loans payable are mainly financing related to working capital. Trade payables, short-term loans payable, income taxes payable, and other payables are exposed to liquidity risk. The Companies reduce liquidity risk relating to these payables by developing a cash flow plan. Long-term loans payable are exposed to interest rate fluctuation risk. The Companies hedge this risk by using interest rate swap transactions. Derivative transactions are interest rate swap agreements and foreign exchange contracts entered into by one of the consolidated subsidiaries. Conducting and managing derivative transactions are in accordance with the internal policies, which set forth delegation of authority.
OTSUKA CORPORATION Annual Report 2019 53

2. Estimated fair value of financial instruments Carrying value of financial instruments on the consolidated balance sheets as of December 31, 2018 and 2019 and estimated fair value were as follows:
Millions of yen
2018
Carrying
value Fair value Difference
Assets
1) Cash and deposits ¥ 150,888 ¥ 150,888 -
2) Notes and accounts receivable - trade 132,352 132,352 -
3) Investment securities
Other securities 8,021 8,021 -
Investments in affiliates 1,185 1,755 569
Total assets ¥ 292,447 ¥ 293,017 ¥ 569
Liabilities
4) Notes and accounts payable – trade ¥ 89,322 ¥ 89,322 -
5) Electronically recorded obligations - operating 17,904 17,904 -
6) Short-term loans payable 4,800 4,800 -
7) Income taxes payable 9,326 9,326 -
8) Long-term loans payable 1,700 1,702 2
Total liabilities ¥ 123,053 ¥ 123,056 ¥ 2
Derivative transactions (*)
Derivative transactions to which hedge accounting is not applied ¥ (12) ¥ (12) -
Derivative transactions to which hedge accounting is applied (41) (41) -
Total derivative transactions ¥ (53) ¥ (53) - * The value of assets and liabilities arising from derivatives is shown at net value, and with the amount in parentheses representing net liability position.
Millions of yen 2019 Carrying
value Fair value Difference
Assets
1) Cash and deposits ¥ 175,427 ¥ 175,427 -
2) Notes and accounts receivable - trade 149,574 149,574 -
3) Investment securities
Other securities 10,277 10,277 -
Investments in affiliates 1,302 3,078 1,775
Total assets ¥ 336,581 ¥ 338,357 ¥ 1,775
Liabilities 4) Notes and accounts payable – trade ¥ 102,006
¥ 102,006
-
5) Electronically recorded obligations - operating 19,105 19,105 -
6) Short-term loans payable 4,800 4,800 -
7) Income taxes payable 13,270 13,270 -
8) Long-term loans payable 1,700 1,701 1
Total liabilities ¥ 140,882 ¥ 140,884 ¥ 1
Derivative transactions (*)
Derivative transactions to which hedge accounting is not applied ¥ 4 ¥ 4 -
Derivative transactions to which hedge accounting is applied 3 3 -
Total derivative transactions ¥ 8 ¥ 8 - * The value of assets and liabilities arising from derivatives is shown at net value, and with the amount in parentheses representing net liability position.
54 OTSUKA CORPORATION Annual Report 2019
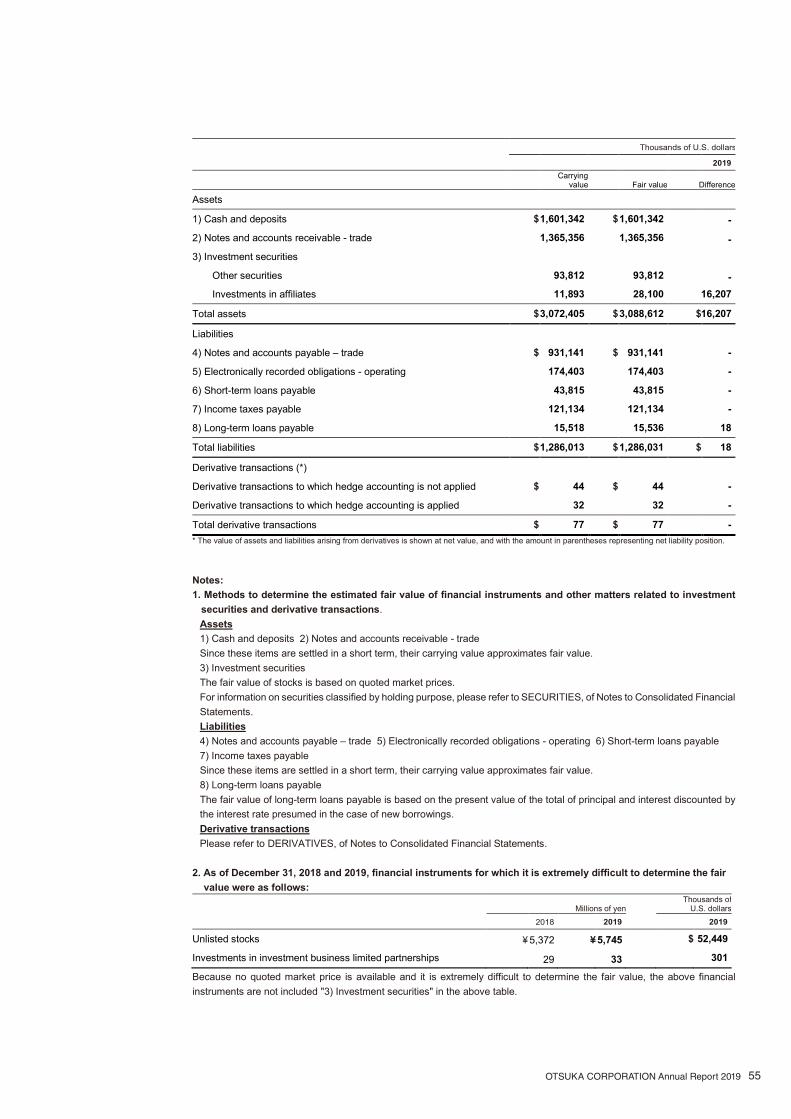
Thousands of U.S. dollars 2019 Carrying
value Fair value Difference
Assets
1) Cash and deposits $ 1,601,342 $ 1,601,342 - 2) Notes and accounts receivable - trade 1,365,356 1,365,356 - 3) Investment securities
Other securities 93,812 93,812 - Investments in affiliates 11,893 28,100 16,207
Total assets $ 3,072,405 $ 3,088,612 $ 16,207
Liabilities 4) Notes and accounts payable – trade $ 931,141 $ 931,141 - 5) Electronically recorded obligations - operating 174,403 174,403 - 6) Short-term loans payable 43,815 43,815 - 7) Income taxes payable 121,134 121,134 - 8) Long-term loans payable 15,518 15,536 18
Total liabilities $ 1,286,013 $ 1,286,031 $ 18
Derivative transactions (*)
Derivative transactions to which hedge accounting is not applied $ 44 $ 44 - Derivative transactions to which hedge accounting is applied 32 32 - Total derivative transactions $ 77 $ 77 - * The value of assets and liabilities arising from derivatives is shown at net value, and with the amount in parentheses representing net liability position.
Notes: 1. Methods to determine the estimated fair value of financial instruments and other matters related to investment
securities and derivative transactions. Assets 1) Cash and deposits 2) Notes and accounts receivable - trade Since these items are settled in a short term, their carrying value approximates fair value. 3) Investment securities The fair value of stocks is based on quoted market prices. For information on securities classified by holding purpose, please refer to SECURITIES, of Notes to Consolidated Financial Statements. Liabilities 4) Notes and accounts payable – trade 5) Electronically recorded obligations - operating 6) Short-term loans payable 7) Income taxes payable Since these items are settled in a short term, their carrying value approximates fair value. 8) Long-term loans payable The fair value of long-term loans payable is based on the present value of the total of principal and interest discounted by the interest rate presumed in the case of new borrowings. Derivative transactions Please refer to DERIVATIVES, of Notes to Consolidated Financial Statements.
2. As of December 31, 2018 and 2019, financial instruments for which it is extremely difficult to determine the fair
value were as follows: Millions of yen
Thousands of U.S. dollars
2018 2019 2019
Unlisted stocks ¥ 5,372 ¥ 5,745 $ 52,449
Investments in investment business limited partnerships 29 33 301
Because no quoted market price is available and it is extremely difficult to determine the fair value, the above financial instruments are not included "3) Investment securities" in the above table.
OTSUKA CORPORATION Annual Report 2019 55

3. Redemption schedule for receivables as of December 31, 2018 and 2019 are as follows: Millions of yen 2018
Due in one year or less
Due after one year through
five years
Due after five years through
ten years Due after ten
years
Cash and deposits ¥ 150,888 - - -
Notes and accounts receivable - trade 132,352 - - -
Total ¥ 283,240 - - - Millions of yen
2019
Due in one year or less
Due after one year through
five years
Due after five years through
ten years Due after ten
years
Cash and deposits ¥ 175,427 - - -
Notes and accounts receivable - trade 149,574 - - -
Total ¥ 325,001 - - - Thousands of U.S. dollars
2019
Due in one year or less
Due after one year through
five years
Due after five years through
ten years Due after ten
years
Cash and deposits $ 1,601,342 - - - Notes and accounts receivable - trade 1,365,356 - - - Total $ 2,966,699 - - -
4. Repayment schedules for long-term loans payable and other interest-bearing debt as of December 31, 2018 and
2019 are as follows: Millions of yen 2018
Due in one year or less
Due after one year through
five years
Due after five years through
ten years Due after ten
years
Short-term loans payable ¥ 4,800 - - -
Long-term loans payable - 1,700 - -
Millions of yen
2019
Due in one
year or less
Due after one year through
five years
Due after five years through
ten years Due after ten
years
Short-term loans payable ¥ 4,800 - - -
Long-term loans payable - 1,700 - -
Thousands of U.S. dollars
2019
Due in one
year or less
Due after one year through
five years
Due after five years through
ten years Due after ten
years
Short-term loans payable $ 43,815 - - - Long-term loans payable - 15,518 - -
56 OTSUKA CORPORATION Annual Report 2019

(SECURITIES) As of December 31, 2018 and 2019, securities were as follows:
(1) Available-for-sale securities with fair value as of December 31, 2018 and 2019 Millions of yen Thousands of U.S. dollars
2018 2019 2019
Carrying value
Aquisition cost
Unrealized gains(loss)
Carrying value
Aquisition cost
Unrealized gains(loss)
Carrying value
Aquisition cost
Unrealized gains(loss)
Securities whose carrying value exceeds their acquisition costs
Stocks ¥ 7,826 ¥ 1,272 ¥ 6,554 ¥ 10,065 ¥ 1,293 ¥ 8,771 $ 91,877 $ 11,806 $ 80,070
Bonds - - - - - - - - -
Other securities 170 102 67 211 107 104 1,934 984 950
¥ 7,997 ¥ 1,375 ¥ 6,622 ¥ 10,277 ¥ 1,401 ¥ 8,875 $ 93,812 $ 12,791 $ 81,021
Securities whose carrying value does not exceed their acquisition costs
Stocks ¥ 24 ¥ 26 ¥ (2) - - - - - -
Bonds - - - - - - - - -
Other securities - - - - - - - - -
¥ 24 ¥ 26 ¥ (2) - - - - - -
Total ¥ 8,021 ¥ 1,402 ¥ 6,619 ¥ 10,277 ¥ 1,401 ¥ 8,875 $ 93,812 $ 12,791 $ 81,021
Note. The followings are not included in the above table because these were no quoted market price available and it is extremely difficult to determine the fair value:
Millions of yen Thousands of U.S. dollars
2018 2019 2019
Carrying value Carrying value Carrying value
Unlisted stocks ¥ 126 ¥ 127 $ 1,162 Investment in limited liability partnerships 29 33
301
(2) Available-for-sale securities sold for the years ended December 31, 2018 and 2019 Millions of yen Thousands of U.S. dollars
2018 2019 2019
Sales proceeds
Aggregate gains
Aggregate losses
Sales proceeds
Aggregate gains
Aggregate losses
Sales proceeds
Aggregate gains
Aggregate losses
Stocks ¥ 2 ¥ 2 - ¥ 65 ¥ 34 - $ 599 $ 317 -
(3) Securities impaired for the years ended December 31, 2018 and 2019 Millions of yen Thousands of U.S. dollars
2018 2019 2019
Impairment losses Impairment losses Impairment losses
Stocks - ¥ 2 $ 21 Note. As for securities whose fair value as of the year-end are on or less than 50% of the acquisition costs or more than 50% but less than 70% and
deemed to be unrecoverable, the impairment losses are recognized.
OTSUKA CORPORATION Annual Report 2019 57

(DERIVATIVES)
As of December 31, 2018 and 2019, derivative transactions were as follows:
(1) Derivative transactions to which hedge accounting is not applied Currency-related transactions (excepting market transactions)
Millions of yen
2018
Contractual value or notional principal amount
Total Over one year Fair value Valuation gain
(loss)
Forward foreign exchange contracts Buy U.S. dollar ¥ 817 - ¥ (12) ¥ (12)
Millions of yen
2019
Contractual value or notional principal amount
Total Over one year Fair value Valuation gain
(loss)
Forward foreign exchange contracts Buy U.S. dollar ¥ 522 - ¥ 4 ¥ 4
Thousands of U.S. dollars
2019
Contractual value or notional principal amount
Total Over one year Fair value Valuation gain
(loss)
Forward foreign exchange contracts Buy U.S. dollar $ 4,771
- $ 44 $ 44
Note. Fair value calculation: Fair value is estimated on the basis of mainly value quoted by counterparty financial institutions.
58 OTSUKA CORPORATION Annual Report 2019

(2) Derivative transactions to which hedge accounting is applied Currency-related transactions
Millions of yen
2018
Contractual value or notional principal amount
Total Over one year Fair value
Forward foreign exchange contracts Forecasted transactions denominated in foreign currencies Buy U.S. dollar ¥ 2,008 - ¥ (41)
Millions of yen
2019
Contractual value or notional principal amount
Total Over one year Fair value
Forward foreign exchange contracts Forecasted transactions denominated in foreign currencies Buy U.S. dollar ¥ 500 - ¥ 3
Thousands of U.S. dollars
2019
Contractual value or notional principal amount
Total Over one year Fair value
Forward foreign exchange contracts Forecasted transactions denominated in foreign currencies Buy U.S. dollar
$ 4,570 - $ 32
Note. Fair value calculation: Fair value is estimated on the basis of mainly value quoted by counterparty financial institutions.
Interest rate-related transactions
Millions of yen
2018
Contractual value or notional principal amount
Total Over one year Fair value
Long-term loans payable Interest-rate swaps Pay/fixed and receive/floating
¥ 1,700 ¥ 1,700 Note
Millions of yen
2019
Contractual value or notional principal amount
Total Over one year Fair value
Long-term loans payable Interest-rate swaps Pay/fixed and receive/floating
¥ 1,700 ¥ 1,700 Note
Thousands of U.S. dollars
2019
Contractual value or notional principal amount
Total Over one year Fair value
Long-term loans payable Interest-rate swaps Pay/fixed and receive/floating
$ 15,518 $ 15,518 Note
Note. The fair value of interest-rate swaps which meet the criteria for application of the exceptional treatment for the recognition of derivatives is included in the fair value of long-term loans payable designated as the hedged item.
OTSUKA CORPORATION Annual Report 2019 59

(RETIREMENT BENEFITS)
(1) Retirement benefit plans The Companies have defined contribution pension plans, agreement type corporate pension plans and lump-sum plans as retirement benefit plans. Of the Companies as of December 31, 2019, 4 have enrolled in defined contribution pension plans, 3 in agreement type corporate pension plans and 5 in lump-sum plans. The Companies that have lump-sum plans calculate net benefit liabilities and retirement benefit expenses using the simplified method which is required the amount to be paid as retirement allowance for services rendered by the fiscal year-end. 1 consolidated subsidiary participates in multi-employer pension plan. Because the plan cannot be reasonably calculated the amount of plan assets attributed to the company's contribution, it is accounted for in the same way as the defined contribution plans. The company may pay premium benefits for employees' retirement.
(2) Defined benefit pension plans (a) Changes in retirement benefit obligations (excluding plans that apply the simplified method)
Millions of yen Thousands of
U.S. dollars 2018 2019 2019
Balance at the beginning of the year ¥ 51,763 ¥ 53,619 $ 489,448
Service costs 2,536 2,553 23,307
Interest costs 105 56 512
Actuarial loss (gain) 474 (546) (4,990)
Retirement benefits paid (1,261) (1,772) (16,180)
Balance as of the end of the year ¥ 53,619 ¥ 53,909 $ 492,096
(b) Changes in plan assets
Millions of yen
Thousands of U.S. dollars
2018 2019 2019
Balance at the beginning of the year ¥ 43,925 ¥ 45,054 $ 411,269
Actuarial loss (gain) 21 12 116
Contribution paid by the employer 2,276 2,189 19,982
Retirement benefits paid (1,168) (1,717) (15,678)
Balance as of the end of the year ¥ 45,054 ¥ 45,538 $ 415,690
(c) Changes in net defined benefit liability of the plans that apply the simplified method
Millions of yen
Thousands of U.S. dollars
2018 2019 2019
Balance at the beginning of the year ¥ 694 ¥ 640 $ 5,850
Retirement benefit expenses 77 83 757
Retirement benefits paid (97) (95) (868)
Deconsolidation of subsidiaries (33) - -
Balance as of the end of the year ¥ 640 ¥ 628 $ 5,739
60 OTSUKA CORPORATION Annual Report 2019

(d) Reconciliation between the funded status of the plans and the amounts recognized as net defined liabilities in the consolidated balance sheets as of the end of the fiscal years
Millions of yen
Thousands of U.S. dollars
2018 2019 2019
Funded retirement benefit obligations ¥ 51,211 ¥ 51,328 $ 468,536
Plan assets (45,054) (45,538) (415,690)
6,157 5,789 52,845
Unfunded retirement benefit obligations 3,048 3,209 29,299
Total net defined benefit liability (asset) 9,205 8,999 82,145
Net defined benefit liability 9,205 8,999 82,145
Total net defined benefit liability and asset ¥ 9,205 ¥ 8,999 $ 82,145
Note: Plans to which simplified methods are applied are included.
(e) Components of retirement benefit expenses
Millions of yen
Thousands of U.S. dollars
2018 2019 2019
Service costs ¥ 2,536 ¥ 2,553 $ 23,307
Interest costs 105 56 512
Amortization of actuarial differences 181 351 3,204
Amortization of prior service costs (107) (107) (981)
Retirement benefit expenses calculated by simplified methods 77 83 757
Additional benefits for employees' retirement 15 12 115
Retirement benefit expenses ¥ 2,809 ¥ 2,948 $ 26,916
(f) Remeasurements of defined benefit plans included in other comprehensive income Components of items (before tax) were as follows:
Millions of yen
Thousands of U.S. dollars
2018 2019 2019
Prior service cost ¥ (107) ¥ (107) $ (981)
Actuarial difference (271) 910 8,312
Total ¥ (378) ¥ 803 $ 7,331
(g) Remeasurements of defined benefit plans included in accumulated other comprehensive income
Components of items (before tax) were as follows:
Millions of yen Thousands of U.S. dollars
2018 2019 2019
Unrecognized prior service costs ¥ (431) ¥ (323) $ (2,953)
Unrecognized actuarial differences (1,048) (1,958) (17,878)
Total ¥ (1,479) ¥ (2,282) $ (20,832)
(h) Items for plan assets 1. Components of the major plan assets The ratios of the major types of assets to the total plan assets were as follows:
2018 2019
Cash and deposits 86% 86%
Life insurance company general accounts 14% 14%
Total 100% 100%
OTSUKA CORPORATION Annual Report 2019 61

2. Method of determining the long-term expected rate of return on plan assets Current and target asset allocations, and historical and expected returns on various categories of plan assets have been considered in determining the long-term expected rate of return on plan assets.
(i) Items related to actuarial assumptions
The major actuarial assumptions
2018 2019
Discount rate 0.1% 0.1%
Long-term expected rate of return on plan assets 0.0% 0.0%
Salary increasing rate 7.5% 7.4% * Salary increasing rate is calculated based on a point based plan.
(3) Defined contribution pension plans Required contributions to defined contribution pension plans of the Companies for the years ended December 31, 2018 and 2019 were ¥805 million and ¥810 million ($7,394 thousand), respectively.
(4) Multi-employer pension plan Required contributions to the multi-employer pension plan which was treated the same as the defined contribution plans for the years ended December 31, 2018 and 2019 were ¥22 million and ¥23 million ($212 thousand), respectively.
(a) The most recent funded status related to multi-employer pension plan
Millions of yen
Thousands of U.S. dollars
March 31, 2018 March 31, 2019 March 31, 2019
Plan assets ¥ 28,441 ¥ 49,969 $ 456,130 Actuarial liability based on pension plan finance calculation and minimum actuarial reserve 27,649 47,438 433,033
Difference ¥ 792 ¥ 2,530 $ 23,097
(b) The contribution ratio of the Companies to the multi-employer pension plan Fiscal year ended December 31, 2018. 1.2% (As of March 31, 2018) Fiscal year ended December 31, 2019. 1.2% (As of March 31, 2019)
(c) Supplementary information: The main factor of the difference shown in above (a)
Millions of yen Thousands of
U.S. dollars 2018 2019 2019
General reserve ¥ 562 ¥ 792 $ 7,230
Surplus 229 1,738 15,866
Total ¥ 792 ¥ 2,530 $ 23,097 The ratio in above (b) have not presented the actual ratio of the Companies.
62 OTSUKA CORPORATION Annual Report 2019

(DEFERRED TAX)
(1) Significant components of the Companies' deferred tax assets and liabilities
Millions of yen Thousands of
U.S. dollars 2018 2019 2019
Deferred tax assets:
Allowance for doubtful accounts ¥ 92 ¥ 107 $ 977
Accrued enterprise taxes 635 858 7,840
Provision for bonuses 1,093 1,231 11,240
Net defined benefit liability 2,822 2,759 25,185
Provision for directors' retirement benefits 212 218 1,996
Impairment losses 853 1,202 10,978
Software development costs 1,331 1,449 13,231
Unrealized profit from non-current assets 300 406 3,709
Other 1,812 2,383 21,759
Subtotal 9,154 10,617 96,918
Less: Valuation allowance (946) (953) (8,708)
Total deferred tax assets 8,208 9,663 88,210
Deferred tax liabilities:
Valuation difference on available-for-sale securities (2,001) (2,692) (24,577)
Other (62) (75) (692)
Total deferred tax liabilities (2,063) (2,768) (25,269)
Net deferred tax assets ¥ 6,144 ¥ 6,895 $ 62,941
(2) A reconciliation of the material differences between the normal effective statutory tax rates and burden ratio of
income taxes after application of tax effect accounting Since the differences between the normal effective statutory tax rates and the burden ratio of income taxes after application of tax effect accounting are less than 5% of the normal effective statutory tax rates, a reconciliation of the differences is omitted.
(ASSET RETIREMENT OBLIGATIONS)
The disclosure is omitted because asset retirement obligations were immaterial in the consolidated financial statements.
(INVESTMENT AND RENTAL PROPERTIES)
The disclosure is omitted because investment and rental properties were immaterial in the consolidated financial statements.
OTSUKA CORPORATION Annual Report 2019 63

(SEGMENT INFORMATION)
【Segment Information】 (1) Overview of reportable segments The reportable segments of the Companies are periodically examined by the Board of Directors for the purpose of deciding the allocation of business resources and evaluating the operating results. The Companies' main businesses are “System Integration”, whose business fields encompass the construction of information systems and their cutover, and “Service and Support”, which has support following the cutover of systems as its business field. Therefore, the Companies are composed of two reportable segments, “System Integration business” and “Service and Support business.” The details of the two segments are as follows. The “System Integration business” provides optimized system services ranging from consulting to system design and development, transport and installation work and network construction. The “Service and Support business” provides customers with services such as distributing supplies, hardware and software maintenance, telephone support and outsourcing to support the installed systems and their business operations, totally. (2) Basis of measurement for reportable segment net sales, segment profit or loss, segment assets and other items The accounting method for the Companies' reported business segments is substantially the same as “FRAMEWORK FOR PREPARING CONSOLIDATED FINANCIAL STATEMENTS”. Also, segment profit or loss is equivalent to operating profit. The prices of inter-segment transactions are determined by price after taking market conditions into account.
(3) Information about reportable segment net sales, segment profit or loss, segment assets and other items
Millions of yen
Reportable segments
2018
System
Integration business
Service and Support
business
Total Adjustment
(Note 1)
Amount recorded in consolidated financial
statements (Note 2)
Net sales Outside customers sales ¥ 463,293 ¥ 296,577 ¥ 759,871 - ¥ 759,871
Inter-segment sales/transfers 124 429 553 (553) -
Total ¥ 463,417 ¥ 297,007 ¥ 760,424 ¥ (553) ¥ 759,871
Segment profit ¥ 41,645 ¥ 14,670 ¥ 56,315 ¥ (8,257) ¥ 48,058
Segment assets ¥ 145,708 ¥ 104,958 ¥ 250,666 ¥ 156,065 ¥ 406,732
Other items
Depreciation (Note 3) ¥ 2,956 ¥ 2,727 ¥ 5,684 ¥ 754 ¥ 6,438 Investments in affiliates accounted
for using equity method 791 4,891 5,682 - 5,682
Increase in property, plant and equipment and intangible assets 3,356 4,188 7,544 755 8,300
64 OTSUKA CORPORATION Annual Report 2019

Millions of yen
Reportable segments
2019
System
Integration business
Service and Support
business
Total Adjustment
(Note 1)
Amount recorded in consolidated financial
statements (Note 2)
Net sales
Outside customers sales ¥ 578,698 ¥ 307,837 ¥ 886,536 - ¥ 886,536
Inter-segment sales/transfers 95 549 644 (644) -
Total ¥ 578,794 ¥ 308,387 ¥ 887,181 ¥ (644) ¥ 886,536
Segment profit ¥ 55,265 ¥ 15,746 ¥ 71,012 ¥ (8,819) ¥ 62,192
Segment assets ¥ 172,739 ¥ 111,205 ¥ 283,944 ¥ 177,867 ¥ 461,812
Other items
Depreciation (Note 3) ¥ 3,452 ¥ 2,870 ¥ 6,322 ¥ 905 ¥ 7,228 Investments in affiliates accounted
for using equity method 908 5,263 6,172 - 6,172
Increase in property, plant and equipment and intangible assets 3,448 4,341 7,790 70 7,860
Thousands of U.S. dollars
Reportable segments
2019
System
Integration business
Service and Support
business
Total Adjustment
(Note 1)
Amount recorded in consolidated financial
statements (Note 2)
Net sales Outside customers sales $ 5,282,508 $ 2,810,019 $ 8,092,527 - $ 8,092,527
Inter-segment sales/transfers 870 5,015 5,885 (5,885) -
Total $ 5,283,378 $ 2,815,034 $ 8,098,412 $ (5,885) $ 8,092,527
Segment profit $ 504,479 $ 143,738 $ 648,218 $ (80,508) $ 567,709
Segment assets $ 1,576,809 $ 1,015,111 $ 2,591,921 $ 1,623,615 $ 4,215,536
Other items
Depreciation (Note 3) $ 31,512 $ 26,202 $ 57,715 $ 8,268 $ 65,983 Investments in affiliates accounted
for using equity method 8,294 48,049 56,344 - 56,344
Increase in property, plant and equipment and intangible assets 31,481 39,627 71,109 639 71,749
Notes 1. Below is a description of main components of adjustment.
Millions of yen Thousands of U.S.
dollars 2018 2019 2019
Segment profit adjustment companywide expenses (not allocated to the reportable segments) consisting mainly of expenses related to administrative operations ¥ (8,270) ¥ (8,821) $ (80,526)
Segment assets adjustment companywide assets (not allocated to the reportable segments) consisting mainly of assets not belonging to the reportable segments (cash on hands and in bank, investments in securities) and assets related to administrative operations ¥ 156,743 ¥ 178,789 $ 1,632,032
Depreciation adjustment depreciation expenses related to companywide assets ¥ 754 ¥ 905 $ 8,268
Increase in property, plant and equipment and intangible assets adjustment increase related to companywide assets 755 70 639
2. The “Segment profit” is reconciled with “Operating profit” in Consolidated Statements of Income. 3. "Depreciation" include relevant amount of Long-term prepaid expenses.
OTSUKA CORPORATION Annual Report 2019 65

【Related Information】 (1) Products and services The disclosure is omitted because similar information is disclosed in segment information for the years ended December 31, 2018 and 2019. (2) Geographical area 1. Net Sales The disclosure is omitted because outside customers sales in Japan constituted more than 90% of total net sales for the years ended December 31, 2018 and 2019. 2. Property, plant and equipment Not applicable because all property, plant and equipment are located in Japan as of December 31, 2018 and 2019. (3) Major customer The disclosure is omitted because there was no outside customer whose net sales amount was 10% or more of net sales in the consolidated statements of income for the years ended December 31, 2018 and 2019. 【Impairment loss on fixed assets by reportable segment】 The disclosure is omitted because impairment loss on fixed assets by reportable segment is immaterial in the consolidated financial statements for the years ended December 31, 2018 and 2019. 【Amortization and unamortized balance of goodwill by reportable segment】 For the years ended December 31, 2018 and 2019, not applicable. 【Gain on negative goodwill by reportable segment】 For the years ended December 31, 2018 and 2019, not applicable. 【Related Party Transactions】 For the years ended December 31, 2018 and 2019, not applicable.
66 OTSUKA CORPORATION Annual Report 2019

(PER SHARE INFORMATION)
Net assets per share as of December 31, 2018 and 2019 and basic earnings per share for the years ended December 31, 2018 and 2019 were summarized as follows: Yen U.S. dollars
2018 2019 2019
Net assets per share ¥ 1,211.63 ¥ 1,367.76 $ 12.49
Basic earnings per share 177.22 229.42 2.09
Notes 1. Diluted earnings per share for the years ended December 31, 2018 and 2019 are omitted, because the Companies have no dilutive shares. 2. The Company implemented a two-for-one stock split of its common stock with an effective date of April 1, 2018.
Accordingly, net assets per share and basic earnings per share stated above are calculated on the assumption that the stock split was implemented at the beginning of the previous year (the year ended December 31, 2018).
3. Basis for calculation of net assets per share as of December 31, 2018 and 2019 were as follows:
Millions of yen Thousands of
U.S. dollars 2018 2019 2019
Numerator:
Net assets ¥ 231,664 ¥ 261,622 $ 2,388,151
Non-controlling interests in consolidated subsidiaries 1,938 2,293 20,932
Net assets attributable to common stock ¥ 229,726 ¥ 259,328 $ 2,367,219
Thousands of shares
Denominator:
Number of shares of common stock outstanding 189,601 189,601
Net assets per share is based upon the number of common stock outstanding (excluding treasury shares) each year end.
4. Basis for calculation of basic earnings per share for the years ended December 31, 2018 and 2019 were as follows:
Millions of yen Thousands of
U.S. dollars 2018 2019 2019
Numerator:
Profit attributable to owners of parent ¥ 33,601 ¥ 43,497 $ 397,057
Amount not attributable to common shareholders - - -
Profit attributable to owners of parent related to common stock ¥ 33,601 ¥ 43,497 $ 397,057
Thousands of shares
Denominator:
Weighted-average number of shares of common stock outstanding 189,601 189,601 Basic earnings per share is based upon the weighted average number of common stock outstanding (excluding treasury shares) during each year.
OTSUKA CORPORATION Annual Report 2019 67

【CONSOLIDATED SUPPLEMENTARY STATEMENTS】
(ANNEXED CONSOLIDATED DETAILED SCHEDULE OF BORROWINGS)
Borrowings as of December 31, 2019 consisted of the following: Millions of yen
2019 Balance at the
beginning of the year Balance as of the
end of the year
Short-term loans payable at the average interest rate of 0.74% ¥ 4,800 ¥ 4,800
Current portion of long-term loans payable - - Current portion of lease obligations 698 724 Long-term loans payable due in 2023 at the average interest rate of 0.66% 1,700 1,700 Lease obligations due in 2021-2024 1,058 1,583
Other interest-bearing debt - -
Total ¥ 8,256 ¥ 8,807
Thousands of U.S. dollars
2019
Balance at the beginning of the year
Balance as of the end of the year
Short-term loans payable at the average interest rate of 0.74% $ 43,815 $ 43,815 Current portion of long-term loans payable - - Current portion of lease obligations 6,374 6,609 Long-term loans payable due in 2023 at the average interest rate of 0.66% 15,518 15,518 Lease obligations due in 2021-2024 9,663 14,452 Other interest-bearing debt - - Total $ 75,371 $ 80,394 Notes 1. The annual average interest rate represents the weighted-average rate applicable to the ending balance.
2. The annual average interest rate is not shown for lease obligations because the amounts in the consolidated balance sheets include the amounts corresponding to interest paid from total lease payment.
3. The contractual maturities of long-term loans payable and lease obligations as of December 31, 2019 were as follows:
Millions of yen
2019
Due after one year through two years
Due after two years through three years
Due after three years through four years
Due after four years through five years
Long-term loans payable - - ¥ 1,700 -
Lease obligations 656 490 332 103
Thousands of U.S. dollars
2019
Due after one year through two years
Due after two years through three years
Due after three years through four years
Due after four years through five years
Long-term loans payable - - $ 15,518 -
Lease obligations 5,997 4,474 3,036 944
68 OTSUKA CORPORATION Annual Report 2019

OTSUKA CORPORATION Annual Report 2019 69
Independent Auditor’s Report
The Board of Directors
OTSUKA CORPORATION
We have audited the accompanying consolidated financial statements of OTSUKA CORPORATION and its
consolidated subsidiaries, which comprise the consolidated balance sheets as at December 31, 2019, and the
consolidated statements of income, comprehensive income, changes in net assets, and cash flows for the year then
ended and notes to consolidated financial statements, all expressed in Japanese yen.
Management’s Responsibility for the Consolidated Financial StatementsManagement is responsible for the preparation and fair presentation of these consolidated financial statements in
accordance with accounting principles generally accepted in Japan, and for designing and operating such internal
control as management determines is necessary to enable the preparation and fair presentation of the consolidated
financial statements that are free from material misstatement, whether due to fraud or error.
Auditor’s ResponsibilityOur responsibility is to express an opinion on these consolidated financial statements based on our audit. We
conducted our audit in accordance with auditing standards generally accepted in Japan. Those standards require that
we plan and perform the audit to obtain reasonable assurance about whether the consolidated financial statements are
free from material misstatement.
An audit involves performing procedures to obtain audit evidence about the amounts and disclosures in the
consolidated financial statements. The procedures selected depend on the auditor’s judgment, including the
assessment of the risks of material misstatement of the consolidated financial statements, whether due to fraud or
error. The purpose of an audit of the consolidated financial statements is not to express an opinion on the effectiveness
of the entity’s internal control, but in making these risk assessments the auditor considers internal controls relevant to
the entity’s preparation and fair presentation of the consolidated financial statements in order to design audit
procedures that are appropriate in the circumstances. An audit also includes evaluating the appropriateness of
accounting policies used and the reasonableness of accounting estimates made by management, as well as
evaluating the overall presentation of the consolidated financial statements.
We believe that the audit evidence we have obtained is sufficient and appropriate to provide a basis for our audit
opinion.
OpinionIn our opinion, the consolidated financial statements referred to above present fairly, in all material respects, the
consolidated financial position of OTSUKA CORPORATION and its consolidated subsidiaries as at December 31,
2019, and their consolidated financial performance and cash flows for the year then ended in conformity with
accounting principles generally accepted in Japan.
Convenience TranslationWe have reviewed the translation of these consolidated financial statements into U.S. dollars, presented for the
convenience of readers, and, in our opinion, the accompanying consolidated financial statements have been properly
translated on the basis described in Note 3.
March 27, 2020
Tokyo, Japan
Independent Auditor’s Report

70 OTSUKA CORPORATION Annual Report 2019
Corporate Data (As of December 31, 2019)
Name OTSUKA CORPORATION
Founded July 17, 1961 (registered as joint-stock company on December 13, 1961)
Capital Stock ¥10,374,851,000
Number of Employees 7,272 (with consolidated subsidiaries: 8,912)
Business System Integration business:Sales of computers, copiers, communication equipment and software,and software development of consigned software, other activities
Service and Support business:Supplies, maintenance and educational support, other activities
Main Banks The Bank of Yokohama, Ltd.MUFG Bank, Ltd.Mizuho Bank, Ltd.
Bases (As of December 31, 2019)
Head Office 2-18-4 Iidabashi, Chiyoda-ku, Tokyo 102-8573TEL 03-3264-7111
Local Area Sales Departments
Chuo Sales Dept. 1 Chuo Sales Dept. 2 Kanagawa Sales Dept.Josai Sales Dept. Tama Sales Dept. Johoku Sales Dept.Northern Kanto Sales Dept. Keiyo Sales Dept. Osaka Northern Sales Dept.Osaka Southern Sales Dept.
Regional Offices Sapporo Branch Sendai Branch Utsunomiya BranchTakasaki Branch Tsukuba Branch Chubu BranchKyoto Branch Kobe Branch Hiroshima Branch Kyushu Branch
Principal Group Companies (As of December 31, 2019)
The OTSUKA Group (OTSUKA CORPORATION and its subsidiaries) consists of 8 subsidiaries, including 4 consolidated
subsidiaries as well as 7 affiliated companies, including 3 affiliates accounted for using equity method that carry out the System
Integration business, Service and Support business. The 4 consolidated subsidiaries are listed below.
Company Name EstablishedCapital
(¥ million)Ratio of
Voting RightsScope of Business
■ System Integration business
OSK Co., LTD. 1984 400 100.0%• Deve lopment and sa le o f packaged so f tware , IT
consulting, and consigned software development
Networld Corporation 1990 585 81.5% • Sales and technical support for network related equipment
■ Service and Support business
Alpha Techno Co., LTD. 1996 50 100.0%• Emergency repair of PCs and peripheral equipment, and
data recovery service
Alpha Net Co., LTD. 1997 400 100.0% • Comprehensive service and support for network systems

OTSUKA CORPORATION Annual Report 2019 71
Stock Information (As of December 31, 2019)
Authorized Common Stock 677,160,000 shares
Issued Common Stock 190,002,120 shares
Number of Shares of Unit Stock 100 shares
Number of Shareholders 6,107
■ Major Shareholders
Name
Investment in OTSUKA CORPORATION
Investment in Major Shareholders by OTSUKA CORPORATION
Number of Shares Held
Equity Ownership (%)
Number of Shares Held
Equity Ownership (%)
Otsuka Sobi Co., Ltd. 58,729,980 30.97 − −
The Master Trust Bank of Japan, Ltd. (Trust Account) 8,667,400 4.57 − −
Japan Trustee Services Bank, Ltd. (Trust Account) 7,785,000 4.10 − −
Yuji Otsuka 5,681,880 2.99 − −
Minoru Otsuka 5,672,940 2.99 − −
Atsushi Otsuka 5,095,700 2.68 − −
OTSUKA CORPORATION Employee Stock-Sharing Plan 5,014,220 2.64 − −
Terue Otsuka 3,873,000 2.04 − −
Japan Trustee Services Bank, Ltd. (Trust Account 9) 3,639,300 1.91 − −
SMBC Nikko Securities Inc. 3,034,900 1.60 − −Notes:
1) Equity Ownership is calculated after deducting treasury stock (400,908 shares).
2) Mr. Minoru Otsuka passed away on September 7, 2019. However, his name is listed in the shareholder register because the change of shareholders in the register had yet to be
completed.
■ Breakdown of Shareholders (Based on total shares)
●Foreign investors 25.7%
●Others 3.5% ●Individuals 19.1%
●Domestic companies 32.4%● Financial institutions 19.1%
●Treaury shares 0.2%

2-18-4 Iidabashi, Chiyoda-ku, Tokyo 102-8573, Tokyo Tel: +81-3-3264-7111
https://www.otsuka-shokai.co.jpOTSUKA CORPORATION WEBSITE