annual report 2018 w.a.g. payment …...this material will provide you with information about past...
TRANSCRIPT

W.A.G. PAYMENT SOLUTIONS, A.S.
2018
ANNUAL REPORT
1

EUROWAG ANNUAL REPORT 2018 | CONTENTEUROWAG ANNUAL REPORT 2018 | CONTENT
CONTENTFOREWORD BY MARTIN VOHÁNKA 3
EW MISSION 5
CORPORATE PROFILE 7
EW HISTORY 9
EW VISION (2020+) 11
COMPANY VALUES 13
BENEFITS 15
PEOPLE. 10 SKILLS OF A SUCCESSFUL EW EMPLOYEE 17
COMPANY ACTIVITIES: BUSINESS ACTIVITIES IN 2018 19 CHARITY AND OBLIGATIONS TO SOCIETY 21
FINANCIAL SECTION 23
INDEPENDENT AUDITOR‘S REPORT 111
1 2

EUROWAG ANNUAL REPORT 2018 | FOREWORD
ARE YOU READY FOR AN EXCITING JOURNEY?
WE AT EUROWAG ARE. TO UNDERSTAND WHERE OUR JOURNEY GOES, LET´S SEE WHAT OUR CEO HAS TO SAY ABOUT COMPANY´S PAST AND FUTURE DRIVEN BY 3 SOCIOECONOMIC MEGATRENDS.
and commodities move, how we build our cities and infrastructure and how we treat our environment. This represents a unique chance to elevate the way we inhabit our planet: to improve the quality of our lives while making the environment sustainable and more respectful towards other species.
Positive, curious, willing and having strong purpose, coupled with experience, deep insight and market ranking – these are the fundaments on which we feel best positioned to successfully tackle the transformational challenges ahead. Now you understand our vision “Excite with the journey ahead”. Yes, we strive to make our people, customers, business partners and broader society positive and confident about the future, while being engaged in the EUROWAG story.
Thank you for your trust and cooperation. Yours Sincerely, Martin Vohánka, Founder & CEO
DEAR BUSINESS PARTNERS AND FRIENDS OF EUROWAG, IT IS MY PLEASURE TO PRESENT THE 2018 ANNUAL REPORT OF EUROWAG, THE FASTEST GROWING INTEGRATED ON-ROAD MOBILITY SERVICE PROVIDER IN EUROPE.
EUROWAG ANNUAL REPORT 2018 | FOREWORD
During the last period we have substantially progressed towards our vision. This material will provide you with information about past actions and results, as well as outline our key initiatives and targets in the coming period.
We observe 3 megatrends in the mobility industry:
• Digitalization, sometimes referred to as Industry 4.0 movement
• Introduction of new Powertrains • Autonomous vehicles
The EUROWAG team is excited about the number of opportunities for value creation arising from such vast changes. Like the invention of the wheel, deployment of animals, steam engines or mass car production, we are again in front of a technological leap in the mobility field with a profound impact on humankind. It does matter how quickly and efficiently people
43

EUROWAG ANNUAL REPORT 2018 | MISSIONEUROWAG ANNUAL REPORT 2018 | MISSION
WE KEEP EUROPEAN
ON-ROAD BUSINESS
IN MOTION THE EUROWAG MISSION IS TO BE
THE KEY PARTNER FOR ON-ROAD MOBILITY SOLUTIONS
THAT HELP CUSTOMERS TO OPERATE IN THE MOST EFFICIENT WAY POSSIBLE.
WE IN EUROWAG PROVIDE OUR CUSTOMERS WITH SMART SOLUTIONS
INTEGRATING A COMPREHENSIVE SET OF PRODUCTS AND SERVICES BASED ON INNOVATIVE AND SIMPLE-TO-USE DI-
GITAL TECHNOLOGIES.
A RELENTLESS SEARCH FOR IMPROVEMENT AND PASSION FOR SUPERB CUSTOMER
EXPERIENCE MAKE EUROWAG AN ATTRACTIVE EMPLOYER, A RELIABLE BUSI-
NESS PARTNER AND A VERY INTERESTING PROSPECT FOR INVESTMENT.
5 6

8
EUROWAG ANNUAL REPORT 2018 | CORPORATE PROFILE
EUROWAG builds integrated solutions for seamless
and all other road mobility related services.
Fuel and Toll payments, Fleet management systems, Tax refunds, Financial services
great aspirations and innovation capabilities.
Successful development of the state-of-the-art EUROWAG proprietary OBU (on-board unit) for European Toll interoperability is the evidence of EUROWAG’s
BUSINESS OBJECTIVES
EUROWAG ANNUAL REPORT 2018 | CORPORATE PROFILE
250 000 On daily bases, EUROWAG serves over
vehiclesoperated by international transport companies
and 90 000 passenger cars.
28% W.A.G. Group, acting under
the EUROWAG corporate brand, is the fastest growing integrated
mobility solution provider in Europe with an outstanding compound
annual growth rate of
over the last decade and sales in 2018 reaching
more than 1,4 bln. EUR.
7 8

EUROWAG ANNUAL REPORT 2018 | HISTORY
Turkish market and kept preparing for expansion into Bulgaria, opened two new Truckparks in Hungary and Slovakia and the third one was obtained via an acquisition of Austrian truck fuel station StarPetrol. On top of those, W.A.G. Group acquired ČESKÁ LOGISTICKÁ a.s., a regional provider of comprehensive services for European Tax refund services.
In 2015, W.A.G. Group celebrated its 20th anniversary. Regional clusters of Middle East, Baltic, Central Europe, Balkan, Alpine and Atlantic were created due to on-going geographical expansion.
The date of 13th January 2016 was a significant milestone in the company’s history since a new shareholder joined the Company. The Company’s founder, with minority shareholders, teamed up with one of the world’s largest private investment firms, TA Associates (www.ta.com), and enabled it to acquire a third of the Company. This move
constituted a partnership with the experience and robust resources to help us realize our long-term strategy of becoming a leading integrated mobility solutions provider in Europe.
2016 was a very important year for other reasons. We departed on a transformation journey in order to pursue goals representing our newly defined company vison of Integrated Mobility Solutions provider. We started to formulate our technological journey and build teams to match our aspiration with adequate competencies. On top, EUROWAG entered six new markets of Estonia, Serbia, Lithuania, Latvia, Portugal, and Spain to capitalize on its recently formed business cluster structure.
At the beginning of 2017, EUROWAG stepped into the field of Fleet management services by acquisitions of companies Hi-Software and Czech market leader Princip.
2020+
1995WAG IS
ESTABLISHEDIntroduction
of Fuel whoselse offering on a niche
market
2000PAYMENTSERVICE
LAUNCHEDLaunching of the
own payment solution through
SMS authorisation
2006TOLL
SERVICELAUNCHEDFirst step towards
becoming a full serivce prowider
by crosselling Toll service
2011VAT
REFUNGIn-house TAX refund service as a second
step towards becoming a Full service provider
2017FLEET
MANAGEMENT
Entering telematicfleet management
market throughAcquisitions
ONE PLATFORMINTEGRATING
MOBILITYSOLUTIONSCreating integrated
digital platformcombining all EW‘s
services and connecting all participants on the mobility market step towards becoming a Full service provider
2007GEOGRAPHICAL
EXPANSION
2008FIRST OFFICE
BOARD
2013NEW TRUCK
PARKS ACROSSEUROPE
2018PAYMENT
INSTITUTION
EUROWAG ANNUAL REPORT 2018 | HISTORY
EUROWAG STORY: FROM
LOCAL FUEL RE-SELLER TO
LEADING ON-ROAD MOBILITY
PROVIDER BRAND W.A.G. Group was established in 1995 as a petroleum product trader reselling fuel from Czech refineries to agricultural holdings, industrial enterprises and roadside petrol stations. Since its products and services met vast demand, W.A.G. Group continued to grow rapidly and in just four years (1999) achieved a nationwide presence and became the first privately owned certified business in the industry (ISO 9001).
In 2000, the W.A.G. Group transformed its legal form to a public limited company W.A.G. minerální paliva, a.s., assuming the original private limited company’s assets and liabilities as of 1st January 2001.
In 2005, the W.A.G. Group portfolio was already dominated by EUROWAG fuel cards, a smart money-saving solution that soon met great success also in Slovakia and Hungary. At this time W.A.G. Group decided to invest its resources in building
EUROWAG branded truck dedicated facilities, so called Truckparks.
At the end of 2006, W.A.G. Group was preparing for the introduction of electronic tolls in the Czech Republic. The international expansion of the fuel acceptance network started a few months later in 2007 with the aim of encompassing all EU member states.
In late 2008, W.A.G. Group opened its first office in Poland, and in just two years in Romania, the fifth market for EUROWAG card sales. From 2009 to 2012, the company developed multiple ancillary services and pursued more robust internal processes and structures.
In 2013, two Truckparks in Poland complemented the EUROWAG network.
2014 was a busy year W.A.G. Group entered the
109

One could define the current digital era as an age of constant change and high volatility. To thrive in this environment learning, readiness to change and innovation are essential ingredients to adopt.
EUROWAG´s vision had been always focused on value creation. Everything we do, we do it with customers and other stakeholders in mind.
We want our customers, business partners, employees and broader society to prosper and be excited with the challenges ahead.
To deliver that, EUROWAG has made a bold move to realize profound and complex digital transformation to release the potential for substantial value creation in this new era.
12
EUROWAG ANNUAL REPORT 2018 | VISION
EXCITE WITH THE JOURNEY AHEAD
EUROWAG ANNUAL REPORT 2018 | VISION
11 12

EUROWAG ANNUAL REPORT 2018 | COMPANY VALUES
14
EUROWAG ANNUAL REPORT 2018 | COMPANY VALUES
COMPANYVALUESOUR VALUES ARE DEEPLY ROOTED IN OUR DNA AND ARE GUIDING PRINCIPLES IN EVERYTHING WE DO IN EUROWAG.
THE
VALU
ES W
E S
TAN
D F
OR INNOVATION
Creativity and a determination to change are the foundations of our competitiveness.
TRUST Our honesty and reliability inspire confidence and boost customer loyalty.
INTEGRITY Ethical values underpin our everyday decision-making.
TEAMWORK We support each other because only a well-functioning team can be successful.
EXCELLENCE We strive relentlessly to be the best we can be.
INDEPENDENCE We value our freedom, which also implies a commitment to act whenever needed.
JOY A good vibe in the workplace is essential for delivering outstanding performance.
RESPONSIBILITY Our actions aim to create a balanced portfolio of positive values for the benefit of the whole of human society.
13 14

16
EUROWAG ANNUAL REPORT 2018 | EMPLOYEE BENEFITS
THAT´S WHY EACH OF THE COMPANY’S VALUES IS EMBODIED IN A RANGE OF EUROWAG EMPLOYEES BENEFITS. • Meal vouchers• Own restaurant by Fresherie (healthy meals
subsidised by the company)• Daily supply of fruit in the workplace• Employee fuel card with advantageous
refuelling prices• Open spaces including relax zones (with PS4,
musical instruments etc.)• Contribution to pension/life insurance• Sick days• 5 weeks holiday• Home-office, flexible hours• Multisport card (financial support of employees
in sport activities)• Sabbatical leaves• Dog friendly offices in the Czech Republic a
Slovak Republic• Referral bonus for bringing new colleagues• BeBetter day and Philantropy&You budget • Mobile phone + notebook• 10 different language courses with native
speakers to choose from• Financial support for employees organized
sports contests (in EUROWAG jerseys)• Sundowner (informal after-work company
networking with food and beverages where people, who wouldn´t normally meet, can get to know each other)
• EUROWAG Active day dedicated to the families of our employees. During the day the family members take part in a game at our headquarters finding out what we exactly do
• Managerial academy (for middle and senior management)
• Other countries relocation support• Unexpected small gifts (like fresh juice on
working desks during hot summer days)• Own theatre ensemble and musical band (all
talents can join)
FINANCIAL SUPPORT
OF EMPLOYEES IN SPORTS ACTIVITIES
BEBETTER DAY FOR
VOLUNTEERING AND
A PERSONAL BUDGET FOR A CHARITY DONATION
OF EMPLOYEE´S CHOICE
SABBATICAL LEAVE
OPPORTUNITIES
EUROWAG ANNUAL REPORT 2018 | EMPLOYEE BENEFITS
IN EUROWAG, WE WANT OUR PEOPLE TO BE GOOD – AND FEEL GOOD
REFERRAL BONUS
FOR BRINGING
NEW COLLEAGUES
EMPLOYEE FUEL CARDS
WITH ADVANTAGEOUS
REFUELING PRICES
DAILY SUPPLY OF FRESH
FRUIT AT THE WORKPLACE
OPEN SPACES, RELAX ZONES
(WITH PS4, TENNIS TABLE, MUSICAL INSTRUMENTS,
ETC.), LOUNGES, CREATIVE
ZONES AND OWN RESTAURANT
IN THE HQ
DOG-FRIENDLY OFFICE AT VYŠEHRAD
15 16

EUROWAG ANNUAL REPORT 2018 | EW PEOPLE
1/ GET THE JOB DONEOur mindset is to look for solutions, not execuses.
2/ LEARN FAST, LEARN CHEAPWe accept not every project will be successful. If we fail, we fail fast and cheap
3/ SUPERB CUSTOMER EXPERIENCEWe differentiate ourselves by focusing on the supreme customer experience and offer something different or special.
4/ DIGITAL FIRSTWe are geeks excited about digital, integrated and simple to use technology.
5/ SOCIAL INTELLIGENCEWe accept different cultures and personalities and benefit from mutual coorpera-
6/ COURAGEWe believe the only constant is change. We are not afraid of new things and we don´t fear uncertainty.
7/ LEAVING COMFORT ZONEThe magic happens outside!
8/ HUMORA good vibe in the workplace is essential for delivering outstanding performance,
9/ TEAMWORKWe communicate openly to each other because only a well and crossfunctioning team can be successful.
10/ CURIOSITYCuriosity is the vitamin of learning. We remain curious, keep learning and improving oourselves.
TOP 10 SKILLS OF SUCCESSFUL EUROWAG EMPLOYEEEW PEOPLE
10 CRUCIAL SKILLS
EUROWAG ANNUAL REPORT 2018 | EW PEOPLE
1817

NEW MARKETS In 2018, EUROWAG launched its presence in Belarus, Ukraine and Russia.
REBRANDINGWe recently reformulated our company vision to-wards FinTech, which resulted in a natural need to share our ambitions and new qualities with the out-side world. We therefore decided to realize comple-te company rebranding during 2018, consisting of company logo and all visual identity elements of the revision. Please enjoy our new beautiful appearance!
ACQUISITIONSSince fleet management systems are vitally important for mastering the operational data of transport companies, they play a key role in the future EUROWAG product ecosystem. We continued acquiring leading companies from this sector by purchasing the Slovak company Aldobec Technologies. Its deep know-how and capabilities immediately started to contribute to integrated products development within W.A.G. Group .
HUMAN RESOURCES People and their cultures represent the core EU-ROWAG asset. We see well-motivated, engaged, at-tentive and diverse workforce as a true indicator of a prospering and functional EUROWAG organization.EUROWAG is a balanced team of professionals in terms of expertise, gender, seniority, and personality. With over 30 nationalities, while maintaining English as a company language across all company levels, we truly are an internationally diverse company and re-lentless generator of innovative ideas and inspiration. Last year, we welcomed 160 new colleagues with extraordinary tech-focus to our organization in which we also managed to introduce a completely new lea-dership team.
QUALITY / RISK MANAGEMENT ISO certification is not just another inevitable formality for W.A.G. Group. We see it as a natural tool for sustainable management of the Company. Prestigious audit team, Lloyd’s Register Quality Assurance, was selected to regularly certify our organization under the 9001 norm.
20
EUROWAG ANNUAL REPORT 2018 | REPORT ON COMPANY ACTIVITIES EUROWAG ANNUAL REPORT 2018 | REPORT ON COMPANY ACTIVITIES
REPORT ON COMPANY ACTIVITIES – BUSINESS ACTIVITIESINTRODUCTION2018 was a year of learning and achievements. We launched many projects and initiatives to build new capabilities, products, or system enablers for deployment of a new EUROWAG digital platform. While being busy building those foundations for
future growth we were successfully growing our market share in established markets and opened new ones. All this has resulted in a strong Net revenues growth of 27 %.
2019
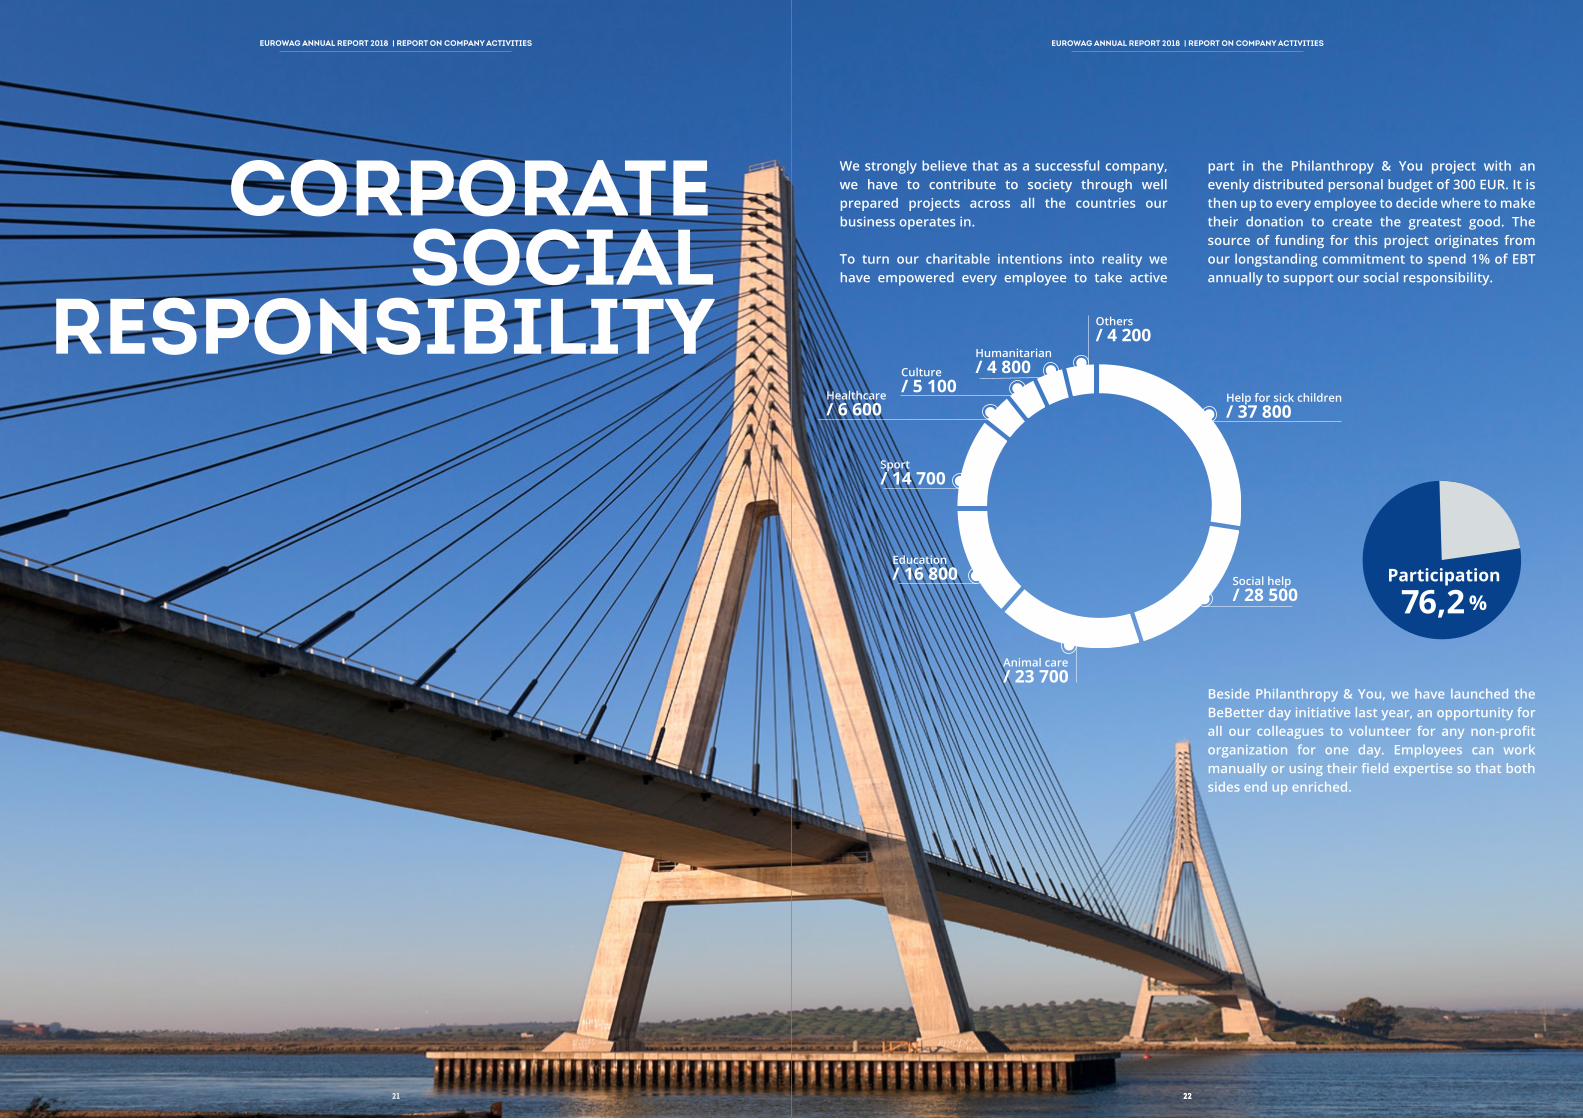
We strongly believe that as a successful company, we have to contribute to society through well prepared projects across all the countries our business operates in.
To turn our charitable intentions into reality we have empowered every employee to take active
part in the Philanthropy & You project with an evenly distributed personal budget of 300 EUR. It is then up to every employee to decide where to make their donation to create the greatest good. The source of funding for this project originates from our longstanding commitment to spend 1% of EBT annually to support our social responsibility.
22
EUROWAG ANNUAL REPORT 2018 | REPORT ON COMPANY ACTIVITIES
Help for sick children/ 37 800
Social help/ 28 500
Animal care/ 23 700
Education/ 16 800
Sport/ 14 700
Healthcare/ 6 600
Culture/ 5 100
Humanitarian/ 4 800
Others/ 4 200
Beside Philanthropy & You, we have launched the BeBetter day initiative last year, an opportunity for all our colleagues to volunteer for any non-profit organization for one day. Employees can work manually or using their field expertise so that both sides end up enriched.
Participation
76,2 %
EUROWAG ANNUAL REPORT 2018 | REPORT ON COMPANY ACTIVITIES
CORPORATE SOCIAL
RESPONSIBILITY
2221

EUROWAG ANNUAL REPORT 2018 | FINANCIAL SECTION
24
EUROWAG ANNUAL REPORT 2018 | FINANCIAL SECTION
W.A.G. PAYMENT SOLUTIONS, A.S.CONSOLIDATED FINANCIAL STATEMENTS FOR THE YEAR ENDED 31 DECEMBER 2018 PREPARED IN ACCORDANCE WITH INTERNATIONAL FINANCIAL REPORTING STANDARDS
23 24

CONSOLIDATED STATEMENT OF FINANCIAL POSITION (EUR ‘000)
Notes 2018 2017ASSETS Non-current assets Intangible assets 21 42,165 34,767Property, plant and equipment 22 28,344 23,538Right-of-use assets 23 9,417 -Financial assets 1,243 396Deferred tax assets 20 1,378 933Other non-current assets 24,27 1,547 1,471 Current assets Inventories 25 4,229 2,585Trade and other receivables 26 165,205 130,112Income tax receivables - -Derivative assets 9,27 24 419Cash and cash equivalents 28 40,805 37,647 Assets held for distribution - - TOTAL ASSETS 294,357 231,868 SHAREHOLDERS‘ EQUITY AND LIABILITIES Stockholders’ equity Share capital 29 4,132 4,120Share premium 29 2,679 2,249Foreign currency translation difference 29 1,359 1,536Reserve fund 29 428 428Cash flow hedge reserve 29 (408) 677Retained earnings 29 42,850 32,338Equity attributable to equity holders of the parent 51,040 41,348Non-controlling interests - -Non-current liabilities Trade and other payables 32 1,187 78Interest-bearing loans and borrowings 30 23,057 25,190Lease payables 21 8,338 -Provisions 31 3 30Other non-current liabilites - -Deferred tax liability 20 350 570Derivative liabilities 9,33 559 20Current liabilities Trade and other payables 32 168,630 136,207Interest-bearing loans and borrowings 30 33,673 22,929Lease payables 21 1,448 -Provisions 31 4,327 3,879Income tax liability 1,256 1,410Derivative liabilities 9,33 489 207
TOTAL EQUITY AND LIABILITIES 294,357 231,868
EUROWAG ANNUAL REPORT 2018 | FINANCIAL SECTION
AS AT 31 DECEMBER
EUROWAG ANNUAL REPORT 2018 | FINANCIAL SECTION
CONSOLIDATED STATEMENT OF COMPREHENSIVE INCOME(EUR ‘000)
Notes 2018 2017CONTINUING OPERATIONS
Sales of goods 10 893,255 701,549Cost of goods sold (847,370) (662,407)Gross profit 45,885 39,142
Rendering of services 10 25,932 20,608Other operating income 11 1,151 942Raw materials and energy consumed 12 (2,304) (1,902)Employee expenses 13 (24,683) (17,458)Depreciation and amortization 16 (7,767) (4,518)Release of impairment of non-current assets 21 - (9)Impairment losses of financial assets (4,042) (835)Other operating expenses 17 (18,785) (18,997)Operating profit 15,387 16,973Finance income 18 2,468 1,355Finance costs 19 (2,639) (1,579)Profit before tax from continuing operations 15,216 16,749Income tax expense 20 (4,329) (3,543)
DISCONTINUED OPERATIONS Profit/(loss) after tax for the year from discontinuedOperations - - PROFIT FOR THE YEAR 10,887 13,206
OTHER COMPREHENSIVE INCOME Other comprehensive income to be reclassified to profit or loss in subsequent periods Change in fair value of cash flow hedge recognized in equity (1,352) 839Exchange differences on translation of foreign operations (177) 1,536Deffered tax related to other comprehensive income 267 (162)
COMPREHENSIVE INCOME FOR THE YEAR 9,625 15,419 Total profit for the financial year attributable to equity holders of the parent 10,887 13,206Total profit for the financial year attributable to non-controlling interests - -Total comprehensive income for the financial year attributable to equity holders of the parent 9,625 15,419Total comprehensive income for the financial year attributable to non-controlling interests - -
FOR THE YEAR ENDED 31 DECEMBER
25 26

CONSOLIDATED STATEMENT OF CASH FLOWS (EUR ‘000)
Notes 2018 2017Cash flows from operating activities Profit before tax for the year 15,216 16,749Non-cash adjustments to reconcile profit before tax to net cash flows: Depreciation and amortization 16 7,767 4,518Gain on disposal of non-current assets 11 (11) (110)Interest income 18 (17) (19)Interest expense 19 781 389Movements in provisions 31 421 2,833Movements in allowances for receivables 26 4,048 838Movements in allowances inventories 25 (36) 38Movements in impairment of non-current assets except for goodwill 21 - -Impairment of goodwill 21 - 9Foreign currency exchange rate differences (128) 1,733Fair value revaluation of derivatives 106 (97)Loss from sold and written-off receivables 17 559 653Other non-cash items 489 (558)Working capital adjustments: Increase in trade and other receivables and prepayments (41,604) (48,112)Increase/decrease in inventories (1,180) 319Increase in trade and other payables 32,579 34,842 Interest received 17 19Interest paid (711) (389)Income tax paid (5,028) (3,992)Net cash flows from operating activities 13,268 9,663 Cash flows from investing activities Proceeds from sale of property, plant and equipment 69 3,381Proceeds from sale of financial instruments - -Purchase of property, plant and equipment (7,155) (11,012)Purchase of intangible assets (8,754) (5,447)Purchase of financial instruments (1,802) (346)Investment in subsidieries, net of cash acquired (678) (33,732)Net cash used in investing activities (18,320) (47,156) Cash flows from financing activities Payment of lease liabilities (1,258) -Proceeds from borrowings 3,156 29,237Repayment of borrowings (4,812) (3,472)Paid our dividend - (5,923)Proceeds from issued share capital 442 1,954Changes in equity - -Net cash used in financing activities (2,472) 21,796 Net increase in cash and cash equivalents (7,524) (15,697)Effect of exchange rate changes on cash and cash equivalents held in foreign currencies 73 71Cash and cash equivalents at beginning of period 27 19,705 35,331
Cash and cash equivalents at end of period 27 12,254 19,705
AS AT 31 DECEMBER
EUROWAG ANNUAL REPORT 2018 | FINANCIAL SECTION EUROWAG ANNUAL REPORT 2018 | FINANCIAL SECTION
CONSOLIDATED STATEMENT OF CHANGES IN SHAREHOLDERS’ EQUITY (EUR ‘000)
Share Share Foreign Reserve Retained Cash flow Total capital premium currency fund earnings hedge equity translation reserve difference
At January 1, 2017 4,063 352 - 399 25,084 - 29,898Issue of share capital 57 1,897 - - - - 1,954Profit for the year - - - - 13,206 - 13,206Other comprehensive income - - 1,536 - - 677 2,213Total comprehensive income - - 1,536 - 7,254 677 9,467Cash dividends - - - - (5,923) - (5,923)Contribution to reserve fund - - - 29 (29) - -At December 31, 2017 4,120 2,249 1,536 428 32,338 677 41,348Issue of share capital 12 430 - - - - 442Profit for the year - - - - 10,887 - 10,887Other comprehensive income - - (177) - - (1,085) (1,262)Total comprehensive income - - (177) - - (1,085) (1,262)First adoption of IFRS 9 - - - - (375) - (375)Cash dividends - - - - - - -Contribution to reserve fund - - - - - - -At December 31, 2018 4,132 2,679 1,359 428 42,850 (408) 51,040
FOR THE YEAR ENDED 31 DECEMBER
27 28

NOTES TO THE CONSOLIDATED FINANCIAL STATEMENTS
EUROWAG ANNUAL REPORT 2018 | FINANCIAL SECTION EUROWAG ANNUAL REPORT 2018 | FINANCIAL SECTION
1. CORPORATE INFORMATION 312. BASIS OF PREPARATION 333. BASIS OF CONSOLIDATION 344. SUMMARY OF SIGNIFICANT ACCOUNTING POLICIES 365. CHANGES IN ACCOUNTING POLICIES AND DISCLOSURES, ADOPTION OF NEW AND REVISED STANDARDS 546. SIGNIFICANT ACCOUNTING JUDGMENTS, ESTIMATES AND ASSUMPTIONS 637. GROUP INFORMATION 648. BUSINESS COMBINATION 669. FAIR VALUE MEASUREMENT 6810. REVENUE 6911. OTHER OPERATING INCOME 7012. RAW MATERIALS AND ENERGY CONSUMED 7113. EMPLOYEE EXPENSES 7114. SHARE-BASED PAYMENTS 7215. RESEARCH AND DEVELOPMENT COSTS 7316. DEPRECIATION AND AMORTIZATION 7417. OTHER OPERATING EXPENSES 7518. FINANCE INCOME 7619. FINANCE COSTS 7620. INCOME TAX 7721. INTANGIBLE ASSETS 7922. PROPERTY, PLANT AND EQUIPMENT 8423. LEASES (GROUP AS A LEASEE) 8524. OTHER NON-CURRENT ASSETS 8725. INVENTORIES 8826. TRADE AND OTHER RECEIVABLES 8827. DERIVATIVE ASSETS 9028. CASH AND CASH EQUIVALENTS 9229. SHAREHOLDERS’ EQUITY 9230. INTEREST BEARING LOANS AND BORROWINGS 9631. PROVISIONS 9932. TRADE AND OTHER LIABILITIES 10033. DERIVATIVE LIABILITIES 10134. FAIR VALUES 10335. FINANCIAL RISK MANAGEMENT 10536. CAPITAL MANAGEMENT 10837. RELATED PARTY DISCLOSURES 10938. SUBSEQUENT EVENTS 109
3029
EUROWAG ANNUAL REPORT 2018 | FINANCIAL SECTION
1. CORPORATE INFORMATION
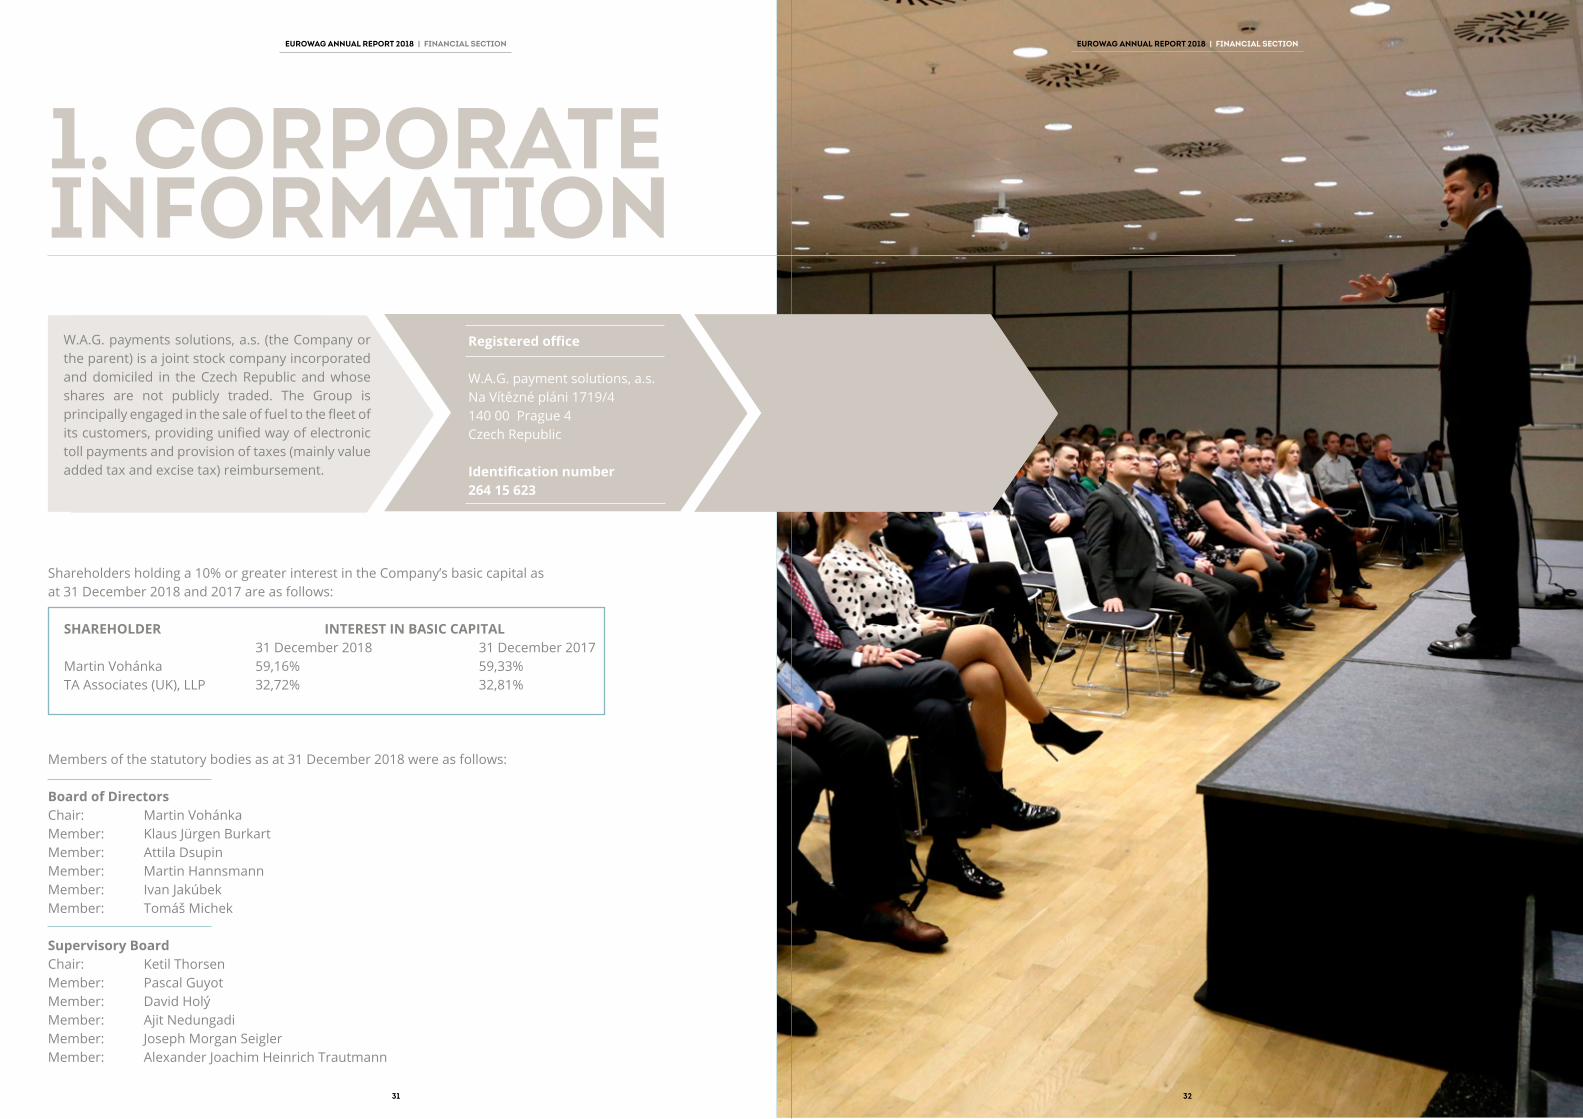
W.A.G. payments solutions, a.s. (the Company or the parent) is a joint stock company incorporated and domiciled in the Czech Republic and whose shares are not publicly traded. The Group is principally engaged in the sale of fuel to the fleet of its customers, providing unified way of electronic toll payments and provision of taxes (mainly value added tax and excise tax) reimbursement.
Shareholders holding a 10% or greater interest in the Company’s basic capital as at 31 December 2018 and 2017 are as follows:
SHAREHOLDER INTEREST IN BASIC CAPITAL 31 December 2018 31 December 2017Martin Vohánka 59,16% 59,33%TA Associates (UK), LLP 32,72% 32,81%
Members of the statutory bodies as at 31 December 2018 were as follows:
Board of DirectorsChair: Martin VohánkaMember: Klaus Jürgen BurkartMember: Attila DsupinMember: Martin HannsmannMember: Ivan JakúbekMember: Tomáš Michek
Supervisory BoardChair: Ketil ThorsenMember: Pascal GuyotMember: David HolýMember: Ajit NedungadiMember: Joseph Morgan SeiglerMember: Alexander Joachim Heinrich Trautmann
Registered office
W.A.G. payment solutions, a.s.Na Vítězné pláni 1719/4140 00 Prague 4Czech Republic
Identification number264 15 623
EUROWAG ANNUAL REPORT 2018 | FINANCIAL SECTION
31 32

3. BASIS OF CONSOLIDATIONThe consolidated financial statements comprise the financial statements of the parent and its subsidiaries. Control is achieved when the Group is exposed, or has rights, to variable returns from its involvement with the investee and has the ability to affect those returns through its power over the investee. Specifically, the Group controls an investee if, and only if, the Group has:
• Power over the investee (i.e., existing rights that give it the current ability to direct the relevant activities of the investee)
• Exposure, or rights, to variable returns from its involvement with the investee
• The ability to use its power over the investee to affect its returns
Generally, there is a presumption that a majority of voting rights result in control. To support this presumption and when the Group has less than a majority of the voting or similar rights of an investee, the Group considers all relevant facts and circumstances in assessing whether it has power over an investee, including:
• The contractual arrangement with the other vote holders of the investee
• Rights arising from other contractual arrangements
• The Group’s voting rights and potential voting rights
The Group re-assesses whether or not it controls an investee if facts and circumstances indicate that there are changes to one or more of the three elements of control. Consolidation of a subsidiary begins when the Group obtains control over the subsidiary and ceases when the Group loses control of the subsidiary. Assets, liabilities, income and expenses of a subsidiary acquired or disposed of during the year are included in the consolidated financial statements from the date the Group gains control until the date the Group ceases to control the subsidiary.
Profit or loss and each component of other comprehensive income (OCI) are attributed to the equity holders of the parent of the Group and to the non-controlling interests, even if this results in the non-controlling interests having a deficit balance. When necessary, adjustments are made to the financial statements of subsidiaries to bring their accounting policies into line with the Group’s accounting policies.
All intra-group assets and liabilities, equity, income, expenses and cash flows relating to transactions between members of the Group are eliminated in full on consolidation.
A change in the ownership interest of a subsidiary, without a loss of control, is accounted for as an equity transaction.
If the Group loses control over a subsidiary, it derecognizes the related assets (including goodwill), liabilities, non-controlling interest and other components of equity while any resultant gain or loss is recognized in profit or loss. Any investment retained is recognized at fair value.
2. BASIS OF PREPARATION
INFORMATION ON INDEPENDENT AUDITOR
EUR ‚000 2018 2017The statutory audit of the financial statements, including the audit of consolidated financial statements 66 43Tax advices 33 104Other non-audit services 335 123
Total 434 270
The consolidated financial statements of W.A.G. payments solutions, a.s. are audited by Ernst & Young Audit, s.r.o.
The consolidated financial statements of the Group have been prepared in accordance with International Financial Reporting Standards as adopted by the European Union (“IFRS”).
The consolidated financial statements have been prepared on a historical cost basis, except for derivative financial instruments that have been measured at fair value. The consolidated financial statements are presented in EUR and all values are rounded to the nearest thousand (EUR’000), except where otherwise indicated.
The accompanying consolidated financial statements were prepared on going concern basis.
The Group‘s fiscal year begins on 1 January and ends on 31 December.
EUROWAG ANNUAL REPORT 2018 | FINANCIAL SECTION EUROWAG ANNUAL REPORT 2018 | FINANCIAL SECTION
33 34

36
4. SUMMARY OF SIGNIFICANT ACCOUNTING
POLICIESTHE ACCOUNTING POLICIES USED
IN PREPARING THE CONSOLIDATED FINANCIAL STATEMENTS ARE SET OUT BELOW. THESE ACCOUNTING
POLICIES HAVE BEEN CONSISTENTLY APPLIED IN ALL MATERIAL RESPECTS
TO ALL PERIODS PRESENTED.
EUROWAG ANNUAL REPORT 2018 | FINANCIAL SECTION EUROWAG ANNUAL REPORT 2018 | FINANCIAL SECTION
35 36

The Group presents assets and liabilities in statement of financial position based on current/non-current classification. An asset is current when it is:
All other assets are classified as non-current.A liability is current when:
The Group classifies all other liabilities as non-current. Deferred tax assets and liabilities are classified as non-current assets and liabilities.
• Expected to be realized or intended to sold or consumed in normal operating cycle • Held primarily for the purpose of trading • Expected to be realized within twelve months after the reporting period • Or cash or cash equivalent unless restricted from being exchanged or used to settle a liability for at least twelve months after the reporting period
4.2 CURRENT VERSUS NON-CURRENT CLASSIFICATION
• It is expected to be settled in normal operating cycle • It is held primarily for the purpose of trading • It is due to be settled within twelve months after the reporting period • Or there is no unconditional right to defer the settlement of the liability for at least twelve months after the reporting period
EUROWAG ANNUAL REPORT 2018 | FINANCIAL SECTION EUROWAG ANNUAL REPORT 2018 | FINANCIAL SECTION
Business combinations are accounted for using the acquisition method. The cost of an acquisition is measured as the aggregate of the consideration transferred, measured at the acquisition date fair value and the amount of any non-controlling interest in the acquiree. For each business combination, the Group elects whether to measure the non-controlling interest in the acquiree at fair value or at the proportionate share of the acquiree’s identifiable net assets. Acquisition-related costs are expensed as incurred and included in administrative expenses.
When the Group acquires a business, it assesses the financial assets and liabilities assumed for appropriate classification and designation in accordance with the contractual terms, economic circumstances and pertinent conditions as at the acquisition date. This includes the separation of embedded derivatives in host contracts by the acquiree.
If the business combination is achieved in stages, the previously held equity interest is remeasured at its acquisition date fair value and any resulting gain or loss is recognized in profit or loss.
Any contingent consideration to be transferred by the acquirer will be recognized at fair value at the acquisition date. Contingent consideration classified as an asset or liability that is a financial instrument and within the scope of IFRS 9 Financial Instruments: Recognition and Measurement, is measured at fair value with changes in fair value recognized either in profit or loss or as a change to OCI. If the contingent consideration is not within the scope of IFRS 9, it is measured in accordance with the appropriate IFRS. Contingent consideration that is classified as equity is not remeasured and subsequent settlement is accounted for within equity.
Goodwill is initially measured at cost, being the excess of the aggregate of the consideration transferred and the amount recognized for non-controlling interests, and any previous interest held, over the net identifiable assets acquired and liabilities assumed. If the fair value of the net assets acquired is in excess of the aggregate consideration transferred, the Group re-assesses whether it has correctly identified all of the assets acquired and all of the liabilities assumed and reviews the procedures used to measure the amounts to be recognized at the acquisition date. If the reassessment still results in an excess of the fair value of net assets acquired over the aggregate consideration transferred, then the gain is recognized in profit or loss. After initial recognition, goodwill is measured at cost less any accumulated impairment losses. For the purpose of impairment testing, goodwill acquired in a business combination is, from the acquisition date, allocated to each of the Group’s cash-generating units that are expected to benefit from the combination, irrespective of whether other assets or liabilities of the acquire are assigned to those units.
Where goodwill has been allocated to a cash-generating unit and part of the operation within that unit is disposed of, the goodwill associated with the disposed operation is included in the carrying amount of the operation when determining the gain or loss on disposal. Goodwill disposed in these circumstances is measured based on the relative values of the disposed operation and the portion of the cash-generating unit retained.
4.1 BUSINESS COMBINATIONS AND GOODWILL
3837

4.4 REVENUE FROM CONTRACTS WITH CUSTOMERRevenues are recognized, when the Group has satisfied a performance obligation and the amount of revenue can be reliably measured. The Group will recognize revenue at an amount that reflects the consideration to which the entity expects to be entitled (after reduction for expected discounts) in exchange for transferring goods or services to a customer (Note 5.2).
SALE OF FUELThe revenue from the sale of fuel is recognized when the significant risks and rewards of ownership of the fuel have passed to the buyer, usually on delivery of the fuel. Revenue from the sale of fuel is measured at the fair value of the consideration received or receivable, net of allowances, trade discounts and volume rebates.
PROVISION OF TAX REFUNDThe revenues from commission fee for the tax refund is recognized over the time as the customer simultaneously receives and consumes the benefits provided by the entity’s performance as the entity performs (85 % of consideration at the moment of requesting a refund and 15 % of consideration at the moment of reimbursed tax receipt).
PROVISION OF CREDITThe revenue from provision of credit in the amount of refund tax for the period of reimbursement is classified within finance income and it is recognized over the average reimbursement period for each country in which the Group operates.
ARRANGING PAYMENTS OF TOLLThe revenues from commission for arranging payments of toll is recognized in the period in which the performance obligation is satisfied and the service is rendered.
TELEMATICSThe revenues from the sale of telematics units, assembly of units and fees for webdispatching are recognized in the period in which the performance obligation is satisfied and the services are rendered.
4.5 TAXESCURRENT INCOME TAXCurrent income tax assets and liabilities for an accounting period are measured at the amount expected to be recovered from or paid to the taxation authorities. The tax rates and tax laws used to compute the amount are those that are enacted or substantively enacted at the reporting date in the countries where the Group operates and generates taxable income.Current income tax relating to items recognized directly in equity is recognized in equity and not in the statement of profit or loss. Management periodically evaluates positions taken in the tax returns with respect to situations in which applicable tax regulations are subject to interpretation and establishes provisions where appropriate
DEFERRED TAXDeferred tax is calculated separately for each company of the Group using the liability method on temporary differences between the tax bases of assets and liabilities and their carrying amounts for financial reporting purposes at the reporting date.
Deferred tax liabilities are recognized for all temporary differences, except:
• When the deferred tax liability arises from the initial recognition of goodwill or of an asset or liability in a transaction that is not a business combination and, at the time of the transaction, affects neither the accounting profit nor taxable profit or loss.
• In respect of taxable temporary differences associated with investments in subsidiaries, associates, when the timing of the reversal of the temporary differences can be controlled and it is probable that the temporary differences will not reverse in the foreseeable future.
Deferred tax assets are recognized for all deductible temporary differences, the carry forwards of unused tax credits and unused tax losses, to the extent that it is probable that taxable profit will be available against which the deductible temporary differences, and the carry forward of unused tax credits and unused tax losses, can be utilized, except:
EUROWAG ANNUAL REPORT 2018 | FINANCIAL SECTION EUROWAG ANNUAL REPORT 2018 | FINANCIAL SECTION
The Group measures financial instruments such as derivatives at fair value at each balance sheet date. Fair value related disclosures for financial instruments and non-financial assets that are measured at fair value or where fair values are disclosed, are summarized in the following notes:
• Disclosures for valuation methods, significant estimates and assumptions (Notes 7, 9, 34)
• Quantitative disclosures of fair value measurement hierarchy (Note 9 and 34)
• Financial instruments carried at fair value (Note 27 and 33)
Fair value is the price that would be received to sell an asset or paid to transfer a liability in an orderly transaction between market participants at the measurement date. The fair value measurement is based on the presumption that the transaction to sell the asset or transfer the liability takes place either:
• In the principal market for the asset or liability
• Or in the absence of a principal market, in the most advantageous market for the asset or liability.
The principal or the most advantageous market must be accessible by the Group.
The fair value of an asset or a liability is measured using the assumptions that market participants would use when pricing the asset or liability, assuming that market participants act in their economic best interest.
A fair value measurement of a non-financial asset takes into account a market participant’s ability to generate economic benefits by using the asset in its highest and best use or by selling it to another market participant that would use the asset in its highest and best use.
The Group uses valuation techniques that are appropriate in the circumstances and for which sufficient data are available to measure fair value, maximizing the use of relevant observable inputs and minimizing the use of unobservable inputs.
All assets and liabilities for which fair value is measured in the financial statements are categorized within the fair value hierarchy, described as follows, based on the lowest level input that is significant to the fair value measurement as a whole:
• Level 1 - Quoted (unadjusted) market prices in active markets for identical assets or liabilities
• Level 2 - Valuation techniques for which the lowest level input that is significant to the fair value measurement is directly or indirectly observable
• Level 3 - Valuation techniques for which the lowest level input that is significant to the fair value measurement is unobservable
For assets and liabilities that are recognized in the financial statements on a recurring basis, the Group determines whether transfers have occurred between levels in the hierarchy by re-assessing categorization (based on the lowest level input that is significant to the fair value measurement as a whole) at the end of each reporting period.
For the purpose of fair value disclosures, the Group has determined classes of assets and liabilities on the basis of the nature, characteristics and risks of the asset or liability and the level of the fair value hierarchy as explained above.
4.3 FAIR VALUE MEASUREMENT
39 40

HI Software Development s.r.o. CZKPrincip a.s. CZKKlub Investorov T&G SK, s.r.o. EURW.A.G. payment solutions EL SP LTD EURW.A.G. payment solutions NO AS NOKW.A.G. mobility solutions Iberia SL EURAldobec technologies, s.r.o. EURWAG Payment Solutions Turkey Ödeme Sistemleri Ticaret Limited Şirketi TRY
Transactions in foreign currencies are initially recorded by the Group entities at their respective functional currency rates prevailing at the date of the transaction.
Monetary assets and liabilities denominated in foreign currencies are translated at the functional currency spot rate of exchange valid at the reporting date.
Differences arising on settlement or translation of monetary items are recognized in profit or loss as finance income and expenses. Non-monetary items that are measured in terms of historical cost in a foreign currency are translated using the exchange rates at the dates of the initial transactions. Non-monetary items measured at fair value in a foreign currency are translated using the exchange rates at the date when the fair value is determined. The gain or loss arising on translation of non-monetary items measured at fair value is treated in line with the recognition of the gain or loss on the change in fair value of the item.
On consolidation, the assets and liabilities of foreign operations are translated into EUR at the exchange rates prevailing at the reporting date and their statements of profit or loss are translated at the average exchange rate for the relevant year. The exchange differences arising on translation for consolidation are recognized in OCI. On disposal of a foreign operation, the component of OCI relating to that particular foreign operation is recognized in profit or loss.
Any goodwill arising on the acquisition of a foreign operation and any fair value adjustments to the carrying amounts of assets and liabilities arising on the acquisition are treated as assets and liabilities of the foreign operation and translated at the spot rate of exchange at the reporting date.
EUROWAG ANNUAL REPORT 2018 | FINANCIAL SECTION EUROWAG ANNUAL REPORT 2018 | FINANCIAL SECTION
4.7 NON-CURRENT ASSETS HELD FOR SALEprincipally through a sale rather than through continuing use. Such non-current assets classified as held for sale are measured at the lower of their carrying amount and fair value less costs to sell. Costs to sell are the incremental costs directly attributable to the sale, excluding the finance costs and income tax expense.
The criteria for held for sale classification is regarded as met only when the sale is highly probable and the asset is available for immediate sale in its present condition. Actions required to complete the sale should indicate that it is unlikely that significant changes to the sale will be made or that the decision to sell will be withdrawn. Management must be committed to the sale expected within one year from the date of the classification.
Property, plant and equipment and intangible assets are not depreciated or amortized once classified as held for sale. Assets and liabilities classified as held for sale are presented separately as current items in the statement of financial position.
4.8 CASH DIVIDEND AND NON-CASH DISTRIBUTION TO EQUITY HOLDERS OF THE PARENTThe Company recognizes a liability to make cash or non-cash distributions to equity holders of the parent when the distribution is authorized and the distribution is no longer at the discretion of the Company. As per the corporate laws of Euroland, a distribution is authorized when it is approved by the shareholders. A corresponding amount is recognized directly in equity.
Non-cash distributions are measured at the fair value of the assets to be distributed with fair value remeasurement recognized directly in equity.
Upon distribution of non-cash assets, any difference between the carrying amount of the liability and the carrying amount of the assets distributed is recognized in the statement of profit or loss.
• When the deferred tax asset relating to the deductible temporary difference arises from the initial recognition of an asset or liability in a transaction that is not a business combination and, at the time of the transaction, affects neither the accounting profit nor taxable profit or loss.
• In respect of deductible temporary differences associated with investments in subsidiaries, associates, deferred tax assets are recognized only to the extent that it is probable that the temporary differences will reverse in the foreseeable future and taxable profit will be available against which the temporary differences can be utilized.
The carrying amount of deferred tax assets is reviewed at each reporting date and reduced to the extent that it is no longer probable that sufficient taxable profit will be available to allow all or part of the deferred tax asset to be utilized. Unrecognized deferred tax assets are reassessed at each reporting date and are recognized to the extent that it has become probable that future taxable profits will allow the deferred tax asset to be recovered.
Deferred tax assets and liabilities are measured at the tax rates that are expected to apply in the year when the asset is realized or the liability is settled, based on tax rates (and tax laws) that have been enacted or substantively enacted at the reporting date.
Deferred tax relating to items recognized outside profit or loss is recognized outside profit or loss. Deferred tax items are recognized in correlation to the underlying transaction either in other comprehensive income or directly in equity.
Deferred tax assets and deferred tax liabilities are offset if a legally enforceable right exists to set off current tax assets against current income tax liabilities and the deferred taxes relate to the same taxable entity and the same taxation authority.
Tax benefits acquired as part of a business combination, but not satisfying the criteria for separate recognition at that date, are recognized subsequently if new information about facts and
circumstances change. The adjustment is either treated as a reduction in goodwill (as long as it does not exceed goodwill) if it was incurred during the measurement period or recognized in profit or loss.
4.6 FOREIGN CURRENCY TRANSACTIONSThe Group’s consolidated financial statements are presented in EUR. The functional currencies of all Group companies are presented in the table below. Each entity in the Group determines its own functional currency, and items included in the financial statements of each entity are measured using that functional currency.
GROUP COMPANY FUNCTIONAL CURRENCY
W.A.G. payment solutions, a.s. CZKW.A.G. Issuing Services, a.s. CZKW.A.G. payment solutions BE BVBA EURW.A.G. payment solutions BG EOOD BGNW.A.G. payment solutions CZ, s.r.o. CZKW.A.G. payment solutions DE GmbH EURW.A.G. payment solutions DK ApS DKKW.A.G. payment solutions EE OÜ EURW.A.G. payment solutions Spain SLU. EURW.A.G. payment solutions FI Oy EURW.A.G. payment solutions FR SARL EURW.A.G. payment solutions HR d.o.o. HRKW.A.G. payment solutions HU, Kft. HUFW.A.G. HU, Kft. HUFW.A.G. payment solutions CH AG CHFW.A.G. payment solutions IE LIMITED EURW.A.G. payment solutions IT S.R.L. UNIPERSONALE EURW.A.G. payment solutions LT, UAB EURW.A.G. payment solutions LU S.à r.l. EURSIA W.A.G. payment solutions LV EURW.A.G. payment solutions NL B.V. EURW.A.G. payment solutions PL, Sp. zoo PLNW.A.G. payment solutions PT Unnipessoal, LDA EURW.A.G. payment solutions UK LIMITED GBPW.A.G. payment solutions AT GmbH EURReamon Tax, a.s. CZKConsorzio Eurowag - S.C. A R.L. EUR
41 42
4.10 PROPERTY, PLANT AND EQUIPMENTProperty, plant and equipment are stated at cost, net of accumulated depreciation and accumulated impairment losses, if any. Cost comprises the aggregate amount paid and the fair value of any other consideration given to acquire the asset and includes costs directly attributable to making the asset capable of operating as intended.
Items of property, plant and equipment with useful lives of more than one year and with a cost not exceeding EUR 400 are directly expensed. When significant parts of property, plant and equipment are required to be replaced at intervals, the Group depreciates them separately based on their specific useful lives. Likewise, when a major inspection is performed, its cost is recognized in the carrying amount of the property, plant and equipment as a replacement if the recognition criteria are satisfied. All other repair and maintenance costs are recognized in profit or loss as incurred.
Depreciation is recorded on a straight-line basis over the estimated useful life of an asset as follows:
Years
Buildings and structures 10-20Machinery and equipment 3-20Vehicles 3-4Fixtures and fittings 5Low-value tangible fixed assets 2
An item of property, plant and equipment and any significant part initially recognized is derecognized upon disposal or when no future economic benefits are expected from its use or disposal. Any gain or loss arising on derecognition of the asset (calculated as the difference between the net disposal proceeds and the carrying amount of the asset) is included in the income statement when the asset is derecognized.
The residual values, useful lives and methods of depreciation of property, plant and equipment are reviewed at each financial year end and adjusted prospectively, if appropriate.
4.11 LEASESIDENTIFICATION OF THE SUBJECT OF A LEASE – LEASE AGREEMENT A lease is a contract, or part a contract, that conveys the right to use an identifiable asset for a period of time in exchange for consideration. At the inception of the contract, the Company assesses whether the contract is a lease or contains a lease. The Company reassesses whether the contract is a lease or contains a lease only when the contractual terms are amended.
The Group assesses whether a contract transfers the right to control the use of an identifiable asset over a period of time based on:
• The Group has the right to obtain a substantial economic benefit from the asset for the period of its use; • The lease is agreed for the lease of a specific asset, and the lessor does not have the right to exchange it or to profit financially from the exchange; • The Group has the right to control the use of an identifiable asset;• The lease is longer than 12 months (short –term lease exemption allowed under IFRS 16)• The value of the new asset exceeds EUR 20,000 (low value exemption allowed under IFRS16);• The agreement is not subject to withdrawal on the part of the lessor or the lessee; or unilateral termination is possible, but withdrawal from the lease carries a not insignificant penalty for the party withdrawing from the lease.
The Company assesses whether the contract contains a lease separately for each potential lease component.
For the application of the IFRS 16 low value exemption, the Group considers a low value of the asset to be a value under EUR 20,000.
The Group does not have any external subleases outside of the Group nor any contract, where the Group would be a lessor.
4.9 INTANGIBLE ASSETSIntangible assets acquired separately are measured on initial recognition at cost. The cost of intangible assets acquired in a business combination is their fair value at the date of acquisition. Following initial recognition, intangible assets are carried at cost less any accumulated amortization and accumulated impairment losses. Internally generated intangibles, excluding capitalized development costs, are not capitalized and the related expenditure is reflected in profit or loss in the period in which the expenditure is incurred.
Items of intangibles with useful lives of more than one year and with a cost not exceeding EUR 400 are directly expensed.
The useful lives of intangible assets are assessed as either finite or indefinite.
Intangible assets with finite lives are amortized over the useful economic life and assessed for impairment whenever there is an indication that the intangible asset may be impaired. The amortization period and the amortization method for an intangible asset with a finite useful life are reviewed at least at the end of each reporting period. Changes in the expected useful life or the expected pattern of consumption of future economic benefits embodied in the asset are considered to modify the amortization period or method, as appropriate, and are treated as changes in accounting estimates. The amortization expense on intangible assets with finite lives is recognized in the statement of profit or loss in the expense category that is consistent with the function of the intangible assets.
Amortization of intangible assets with finite lives is recorded on a straight-line basis over their estimated useful lives as follows:
Years
Low-value intangible fixed assets 2
Intangible assets, except Navision and ZAP software 3
Navision, ZAP software 10
Intangible assets with indefinite useful lives are not amortized, but are tested for impairment annually, either individually or at the cash-generating unit level. The assessment of indefinite life is reviewed annually to determine whether the indefinite life continues to be supportable. If not, the change in useful life from indefinite to finite is made on a prospective basis.
Gains or losses arising from derecognition of an intangible asset are measured as the difference between the net disposal proceeds and the carrying amount of the asset and are recognized in the statement of profit or loss when the asset is derecognized.
RESEARCH AND DEVELOPMENT COSTSResearch costs are expensed as incurred. Development expenditures on an individual project are recognised as an intangible asset when the Group can demonstrate:
• The technical feasibility of completing the intangible asset so that the asset will be available for use or sale• Its intention to complete and its ability and intention to use or sell the asset• How the asset will generate future economic benefits• The availability of resources to complete the asset• The ability to measure reliably the expenditure during development
Following initial recognition of the development expenditure as an asset, the asset is carried at cost less any accumulated amortisation and accumulated impairment losses. Amortisation of the asset begins when development is complete and the asset is available for use. It is amortised over the period of expected future benefit. Amortisation is recorded in cost of sales. During the period of development, the asset is tested for impairment annually.
Development includes the programming relating to internal development of externally purchased software, development of software provided to the group’s customers and development of new telematics products and services which include telematics and toll units.
EUROWAG ANNUAL REPORT 2018 | FINANCIAL SECTION EUROWAG ANNUAL REPORT 2018 | FINANCIAL SECTION
43 44

Expected credit losses, foreign exchange rate differences and interest revenues are recognized in the income statement. On derecognition, losses/gains are recognized in the income statement.
(B) FINANCIAL ASSETS AT FAIR VALUE THROUGH PROFIT OR LOSS
• This category includes the financial assets held with strategy of active trading with financial assets. Contractual cash flow collection is not the primary objective of business model
Expected credit losses are not calculated and recognized. Changes in the fair value and foreign exchange rate differences are recognized in the income statement. Changes in the fair values are included in lines Other financial expenses or Other financial income.
Trade and other receivables that do not contain a significant financing component or for which the Group has applied the practical expedient are measured at the transaction price determined under IFRS 15.
The Group’s financial assets as of 31 December 2018 include cash, trade and other receivables with no significant financing component meeting criteria for classification as AC and derivatives meeting criteria for classification as FVTPL.
TRADE AND OTHER RECEIVABLESTrade and other receivables are carried at original invoice amount less an allowance for impairment of these receivables. As the trade receivables and other receivables are not including significant financing component, the Company applies a simplified approach in calculating expected losses (ECLs). Therefore, the Company does not track changes in credit risk, but instead recognizes a loss allowance based on lifetime ECLs at each reporting date. The Company has established a provision matrix that is based on its territory and historical credit loss experience, adjusted for forward-looking factors specific to the debtors and the economic environment.
Bad debts that are identified by the Company are written off through the income statement. For more information on Trade and other receivables, refer to Note 26.
IMPAIRMENT OF FINANCIAL ASSETSThe Company assesses at each balance sheet date whether financial assets or groups of financial assets are impaired.
The approach to impairment of financial assets under IFRS 9 is based on and expected credit loss model. These impairment model apply to financial assets subsequently measured at amortized cost or financial assets measured at fair value through other comprehensive income..
The Group recognizes either 12-months or lifetime expected credit losses, depending on whether there has been a significant increase in credit risk since initial recognition (or when the commitment or guarantee was entered into).
ASSETS CARRIED AT AMORTIZED COSTSIf there is objective evidence that there has been an increase in the credit risk of a financial instrument measured at amortized cost since initial recognition, the amount of the loss is measured as the difference between the asset’s carrying amount and the present value of estimated future cash flows discounted at the financial asset’s original effective interest rate.
The carrying amount of the asset is reduced either directly or through use of an allowance account. The amount of the loss is recognized in the income statement. As the group financial statements include financial assets representing Trade and other receivables only which are not including significant financing component, the Group applies a simplified approach in calculating expected loss (“ECLs”).
Therefore, the Group Company does not track changes in credit risk, but instead recognizes a loss allowance based on lifetime ECLs at each reporting date. The Group has established a provision matrix that is based on its territory and historical credit loss experience, adjusted for forward-looking factors specific to the debtors and the economic environment.
The carrying amount of the receivable is reduced through use of an allowance account. Impaired debts are derecognized when they are assessed as uncollectible.
LEASE LIABILITYAt the commencement date, a lessee shall measure the lease liability at the present value of the lease payments that are not paid at that date. Lease payments are payments by the lessee to the lessor for the right to use an underlying asset for the duration of the lease. These payments include:
• fixed payments (lowered by any lease incentives);• variable lease payments that are indexed or fixed to a rate;• call option to purchase where there is sufficient certainty that the lessee will make use of the option;• payment of penalties for termination of the lease where the lease period corresponds to the lessee making use of the option to terminate the lease.
The Group reports that the variable payments based on the lease (providing they are not included among the lease payments in the calculation of the lease obligation or are not included into the value of a different asset) in the expenses of the period in question. Interest from the lease obligation is the Group’s financial expense.
RIGHT TO USE AN ASSETThe Group values the right to use an asset on the date the lease commences on the basis of a purchasing agreement. These are based on:
• the value of the lease obligation increased by the lease payment that the Group has paid before the day the lease commences (reduce by lease incentives – discounts); • the initial direct costs of the lease paid by the Group;• the estimated value of the costs for dismantling and removing an identified asset or the reclamation of the site where the asset was located;• an increase by the asset’s modification and renovation costs required in the lease agreement, namely by the creation of a reserve in compliance with IAS 37 Reserves.
4.12 BORROWING COSTSBorrowing costs directly attributable to the acquisition, construction or production of an asset that necessarily takes a substantial period of time to get ready for its intended use or sale are capitalized as part of the cost of the asset. All other borrowing costs are expensed in the period in which they occur. Borrowing costs consist of interest and other costs that an entity incurs in connection with the borrowing of funds.
4.13 FINANCIAL INSTRUMENTS – IFRS 9A financial instrument is any contract that gives rise to a financial asset of one entity and a financial liability or equity instrument of another entity (Note 5.2).
FINANCIAL ASSETSClassification and measurementFinancial assets are classified based on the business model of the Group and characteristic of contractual cash flows. Under IFRS 9, the financial assets are classified into following categories: financial assets subsequently measured at amortized cost (“AC”), financial assets at fair value through profit or loss (“FVTPL”), and financial assets at fair value through other comprehensive income (“FVOCI”).
The Group classifies financial assets into following categories:
(A) FINANCIAL ASSETS SUBSEQUENTLY MEASURED AT AMORTIZED COST – CLASSIFIED IF BOTH OF THE FOLLOWING CONDITIONS ARE MET:
• the financial asset is held within a business model whose objective is to hold financia l assets in order to collect contractual cash flows and• the contractual terms of the financial asset give rise on specified dates to cash flows that are solely payments of principal and interest on the principal amount outstanding (referred as SPPI test).
EUROWAG ANNUAL REPORT 2018 | FINANCIAL SECTION EUROWAG ANNUAL REPORT 2018 | FINANCIAL SECTION
45 46

instruments are initially recognized at fair value on the date on which a derivative contract is entered into and are subsequently remeasured at fair value. Derivatives are carried as financial assets when the fair value is positive and as financial liabilities when the fair value is negative. Any gains or losses arising from changes in the fair value of derivatives are taken directly to profit or loss.
Embedded derivatives are separated from the host contract and accounted for separately if the economic characteristics and risks of the host contract and the embedded derivative are not closely related, a separate instrument with the same terms as the embedded derivative would meet the definition of a derivative, and the combined instrument is not measured at fair value through profit or loss.
The embedded derivatives are separately valued upon inception and at each balance sheet date using an appropriate valuation model, with the changes in fair value recognized in profit or loss.
DERIVATIVE FINANCIAL INSTRUMENTS AND HEDGE ACCOUNTINGThe Group uses derivative financial instruments, such as forward currency contracts, interest rate swaps and forward commodity contracts, to hedge its foreign currency risks, interest rate risks and commodity price risks, respectively. Such derivative financial instruments are initially recognised at fair value on the date on which a derivative contract is entered into and are subsequently remeasured at fair value. Derivatives are carried as financial assets when the fair value is positive and as financial liabilities when the fair value is negative.
The purchase contracts that meet the definition of a derivative under IFRS 9 are recognised in the statement of profit or loss as cost of sales. Commodity contracts that are entered into and continue to be held for the purpose of the receipt or delivery of a non-financial item in accordance with the Group’s expected purchase, sale or usage requirements are held at cost.
Any gains or losses arising from changes in the fair value of derivatives are taken directly to profit or loss, except for the effective portion of cash flow hedges, which is recognised in OCI and later reclassified to profit or loss when the hedge item affects profit or loss.
FOR THE PURPOSE OF HEDGE ACCOUNTING, HEDGES ARE CLASSIFIED AS:
• Fair value hedges when hedging the exposure to changes in the fair value of a recognised asset or liability or an unrecognised firm commitment
• Cash flow hedges when hedging the exposure to variability in cash flows that is either attributable to a particular risk associated with a recognised asset or liability or a highly probable forecast transaction or the foreign currency risk in an unrecognised firm commitment
• Hedges of a net investment in a foreign operation
At the inception of a hedge relationship, the Group formally designates and documents the hedge relationship to which it wishes to apply hedge accounting and the risk management objective and strategy for undertaking the hedge. The documentation includes identification of the hedging instrument, the hedged item or transaction, the nature of the risk being hedged and how the entity will assess the effectiveness of changes in the hedging instrument’s fair value in offsetting the exposure to changes in the hedged item’s fair value or cash flows attributable to the hedged risk. Such hedges are expected to be highly effective in achieving offsetting changes in fair value or cash flows and are assessed on an ongoing basis to determine that they actually have been highly effective throughout the financial reporting periods for which they were designated.
Hedges that meet the strict criteria for hedge accounting are accounted for, as described below:
DERECOGNITIONA financial asset (or, where applicable, a part of a financial asset or part of a group of similar financial assets) is primarily derecognized (i.e., removed from the Group’s consolidated statement of financial position) when:
• The rights to receive cash flows from the asset have expired
• Or the Group has transferred its rights to receive cash flows from the asset or has assumed an obligation to pay the received cash flows in full without material delay to a third party under a ‘pass-through’ arrangement; and either (a) the Group has transferred substantially all the risks and rewards of the asset, or (b) the Group has neither transferred nor retained substantially all the risks and rewards of the asset, but has transferred control of the asset
When the Group has transferred its rights to receive cash flows from an asset or has entered into a passthrough arrangement, it evaluates if, and to what extent, it has retained the risks and rewards of ownership. When it has neither transferred nor retained substantially all of the risks and rewards of the asset, nor transferred control of the asset, the Group continues to recognize the transferred asset to the extent of its continuing involvement. In that case, the Group also recognizes an associated liability. The transferred asset and the associated liability are measured on a basis that reflects the rights and obligations that the Group has retained.
Continuing involvement that takes the form of a guarantee over the transferred asset is measured at the lower of the original carrying amount of the asset and the maximum amount of consideration that the Group could be required to repay.
FINANCIAL LIABILITIESFinancial liabilities are classified into two main categories (a) at amortized cost and (b) at fair value through profit or loss.
All financial liabilities are recognized initially at fair value and, in the case of loans and borrowings and payables, net of directly attributable transaction costs.
The Group’s financial liabilities include trade and other payables, loans and borrowings including bank overdrafts and derivative financial instruments.
LOANS AND BORROWINGS After initial recognition, interest-bearing loans and borrowings are subsequently measured at amortized cost using the effective interest rate (“EIR”) method. Gains and losses are recognized in profit or loss when the liabilities are derecognized as well as through the EIR amortization process.
Amortized cost is calculated by taking into account any discount or premium on acquisition and fees or costs that are an integral part of the EIR. The EIR amortization is included as finance costs in the statement of profit or loss.This category generally applies to interest-bearing loans and borrowings. For more information, refer to Note 30.
TRADE AND OTHER PAYABLESTrade payables are recognized at their nominal value which is deemed to be materially the same as the fair value.
DERECOGNITION A financial liability is derecognized when the obligation under the liability is discharged or cancelled or expires. When an existing financial liability is replaced by another from the same lender on substantially different terms, or the terms of an existing liability are substantially modified, such an exchange or modification is treated as the derecognition of the original liability and the recognition of a new liability. The difference in the respective carrying amounts is recognized in the statement of profit or loss.
DERIVATIVE FINANCIAL INSTRUMENTSThe Group uses derivative financial instruments, such as forward currency contracts, currency swap contracts, currency option contracts and interest rate swaps, to hedge its foreign currency risks and interest rate risks, respectively. Such derivative financial
EUROWAG ANNUAL REPORT 2018 | FINANCIAL SECTION EUROWAG ANNUAL REPORT 2018 | FINANCIAL SECTION
47 48

50
The Group uses forward currency contracts as hedges of its exposure to foreign currency risk in forecast transactions and firm commitments, as well as forward commodity contracts for its exposure to volatility in the commodity prices. The ineffective portion relating to foreign currency contracts is recognised in finance costs and the ineffective portion relating to commodity contracts is recognised in other operating income or expenses.
Amounts recognised as OCI are transferred to profit or loss when the hedged transaction affects profit or loss, such as when the hedged financial income or financial expense is recognised or when a forecast sale occurs.
When the hedged item is the cost of a non-financial asset or non-financial liability, the amounts recognised as OCI are transferred to the initial carrying amount of the non-financial asset or liability.
If the hedging instrument expires or is sold, terminated or exercised without replacement or rollover (as part of the hedging strategy), or if its designation as a hedge is revoked, or when the hedge no longer meets the criteria for hedge accounting, any cumulative gain or loss previously recognised in OCI remains separately in equity until the forecast transaction occurs or the foreign currency firm commitment is met.
If the hedged item is derecognised, the unamortised fair value is recognised immediately in profit or loss.
When an unrecognised firm commitment is designated as a hedged item, the subsequent cumulative change in the fair value of the firm commitment attributable to the hedged risk is recognised as an asset or liability with a corresponding gain or loss recognised in profit or loss.
CASH FLOW HEDGESThe effective portion of the gain or loss on the hedging instrument is recognised in OCI in the cash flow hedge reserve, while any ineffective portion is recognised immediately in the statement of profit or loss.
EUROWAG ANNUAL REPORT 2018 | FINANCIAL SECTION EUROWAG ANNUAL REPORT 2018 | FINANCIAL SECTION
FAIR VALUE HEDGESThe change in the fair value of a hedging instrument is recognised in the statement of profit or loss as a finance cost. The change in the fair value of the hedged item attributable to the risk hedged is recorded as part of the carrying value of the hedged item and is also recognised in the statement of profit or loss as a finance cost.
For fair value hedges relating to items carried at amortised cost, any adjustment to carrying value is amortised through profit or loss over the remaining term of the hedge using the EIR method. EIR amortisation may begin as soon as an adjustment exists and no later than when the hedged item ceases to be adjusted for changes in its fair value attributable to the risk being hedged.
5049

52
The Group bases its impairment calculation on detailed budgets and forecast calculations, which are prepared separately for each of the Group’s CGUs to which the individual assets are allocated. These budgets and forecast calculations generally cover a period of five years. A long-term growth rate is estimated and applied to project future cash flows after the fifth year.
Impairment losses of continuing operations are recognized in the statement of profit or loss in expense categories consistent with the function of the impaired asset.
For assets excluding goodwill, an assessment is made at each reporting date as to whether there is any indication that previously recognized impairment losses may no longer exist or may have decreased. If such indication exists, the Group estimates the asset’s or CGU’s recoverable amount. A previously recognized impairment loss is reversed only if there has been a change in the assumptions used to determine the asset’s recoverable amount since the last impairment loss was recognized. The reversal is limited so that the carrying amount of the asset does not exceed its recoverable amount, nor exceed the
carrying amount that would have been determined, net of depreciation, had no impairment loss been recognized for the asset in prior years. Such reversal is recognized in the income statement.
Intangible assets with indefinite useful lives are tested for impairment annually as at 31 December either individually or at the cash-generating unit level, as appropriate and when circumstances indicate that the carrying value may be impaired. Impairment is determined for goodwill by assessing the recoverable amount of each CGU (or group of CGUs) to which the goodwill relates. When the recoverable amount of the CGU is less than its carrying amount, an impairment loss is recognized. Impairment losses relating to goodwill cannot be reversed in future periods.
EUROWAG ANNUAL REPORT 2018 | FINANCIAL SECTION EUROWAG ANNUAL REPORT 2018 | FINANCIAL SECTION
4.14 INVENTORIES Inventories are valued at the lower of cost and net realizable value.
Costs incurred in bringing each product to its present location and condition are accounted for raw materials and goods as actual cost using the “first in, first out” (FIFO) method (the initial price in the measurement of inventory additions is used as the initial price in the measurement of inventory disposals). Costs of purchased inventory include acquisition-related costs (freight, customs, commission, etc.)
Net realizable value is the estimated selling price in the ordinary course of business, less estimated costs of completion and the estimated costs necessary to make the sale.
4.15 IMPAIRMENTThe Group assesses at each reporting date whether there is an indication that an asset may be impaired. If any indication exists, or when annual impairment testing for an asset is required, the Group estimates the asset’s recoverable amount. An asset’s recoverable amount is the higher of an asset’s or cash-generating unit’s (“CGU”) fair value less costs of disposal and its value in use. The recoverable amount is determined for an individual asset, unless the asset does not generate cash inflows that are largely independent of those from other assets or groups of assets. When the carrying amount of an asset or CGU exceeds its recoverable amount, the asset is considered impaired and is written down to its recoverable amount.
In assessing value in use, the estimated future cash flows are discounted to their present value using a pre-tax discount rate that reflects current market assessments of the time value of money and the risks specific to the asset. In determining fair value less costs of disposal, recent market transactions are taken into account, if available. If no such transactions can be identified, an appropriate valuation model is used. These calculations are corroborated by valuation multiples, quoted share prices for publicly traded companies or other available fair value indicators.
5251
54
5.1 CHANGE OF PRESENTATION CURRENCY
On 1 January 2018, the Group elected to change the presentation currency from CZK to EUR, as the Group believes that the change provides more reliable and more relevant information about the effect of transactions, other events or conditions on the entity´s financial position, financial performance or cash flows in accordance with the standard IAS 8.
The Group applied presentation currency in EUR retrospectively with initial application date as at 1 January 2018 and adjusted the comparative information for the period beginning 1 January 2017.
EUROWAG ANNUAL REPORT 2018 | FINANCIAL SECTION EUROWAG ANNUAL REPORT 2018 | FINANCIAL SECTION
5. CHANGES IN ACCOUNTING POLICIES AND DISCLOSURES, ADOPTION OF NEW AND REVISED STANDARDS
4.16 CASH AND CASH EQUIVALENTSCash and short-term deposits in the statement of financial position comprise cash in hand and cash at banks.
For the purpose of the consolidated statement of cash flows, cash and cash equivalents consist of cash and short-term deposits as defined above, net of outstanding bank overdrafts as they are considered an integral part of the Group’s cash management.
4.17 PROVISIONSProvisions are recognized when the Group has a present obligation (legal or constructive) as a result of a past event, it is probable that an outflow of resources embodying economic benefits will be required to settle the obligation and a reliable estimate can be made of the amount of the obligation. The expense relating to a provision is presented in the statement of profit or loss.
If the effect of the time value of money is material, provisions are discounted using a current pre-tax rate that reflects, when appropriate, the risks specific to the liability. When discounting is used, the increase in the provision due to the passage of time is recognized as a finance cost.
TAX REFUND DAMAGE PROVISIONThe provision is created for purpose of covering the damages. Provision compensate the damage caused by the repayment of the returns, in the background of the tax office for our client. For each country where the company request for tax refund (primarily VAT and excise duty), the average refund time is set, with respect to the client. The provision is made up of all returns that are not closed at balance sheet day and their settlement time exceeded the average time if it is longer than 120 days. For shorter returns than 120 days the provision is not made.
CONTINGENT LIABILITIES RECOGNIZED IN A BUSINESS COMBINATIONA contingent liability recognized in a business combination is initially measured at its fair value. Subsequently, it is measured at the higher of the amount that would be recognized in accordance with the requirements for provisions above or the amount initially recognized less (when appropriate) cumulative amortization recognized in accordance with the requirements for revenue recognition.
5453

56
The adoption of IFRS 9 has following impact on the Group’s financial assets, which were reclassified as follows:
EUR ‚000 Classification IAS 39 IFRS 9 IAS 39 IFRS 9
Cash and cas Loans AC 37,647 37,647equivalents and receivables Derivatives Fair value FVTPL (172) (172)
Derivatives Fair value Fair value 489 489– cash flow hedges Trade and other receivables Loans AC 130,112 129,737 and receivables Total as at 1 January 2018 - - 168,076 167,701
IMPAIRMENT OF FINANCIAL ASSETSThe approach to impairment of financial assets under IFRS 9 based on and expected credit loss model has changed to IAS 39 incurred loss model. The new impairment rules apply to financial assets subsequently measured at amortized cost or financial assets measured at fair value through other comprehensive income.
For trade and other receivables and contractual assets, the simplified approach whereby the lifetime expected credit losses are always recognized.
The Group has changed it’s presentation of impairment losses of financial asset, which are newly presented separately in the line Impairment losses of financial assets in the Consolidated Statement of Comprehensive Income. Due to adoption of IFRS 9, the Group reclassified EUR 835 thousand EUR of impairment of financial assets form line Other operating expenses to line Impairment losses of financial assets in previous period.
The impact on creation of new allowance on receivable due to the application of IFRS 9 is described in table above.
HEDGE ACCOUNTINGIFRS 9 includes new model for hedge accounting. This represents a major overhaul of hedge accounting and puts in place a new model that introduces improvements principally by aligning the accounting more closely with Group’s risk management. There are also improvements to the disclosures about hedge accounting and risk management.
The Group decided to use the option provided by IFRS 9 to continue applying hedge accounting under IAS 39.
Impacts of adoption of IFRS 9 is set out in following table:
EUR ‚000 Note Impact of first adoption of IFRS 9
Retained earnings: Recognition of allowance to Trade receivables 26 375Impact of first adoption as at 1 January 2018 375
The Group has not recorded the deferred tax impact from the change in allowance to trade receivable as at 1 January 2018 due to substantial uncertainty regarding its recoverability“ (consistent with deferred tax assets recognition from the allowance to receivables).
Classification and Measurement of financial assets and financial liabilities
IFRS 9 classifies all financial assets into following categories: financial assets subsequently measured at amortized costs (“AC”) financial assets at fair value through profit or loss (“FVTPL”) and financial assets at fair value through other comprehensive income (“FVOCI”). The IFRS 9 do not classify categories of financial instruments which existed in IAS 39: available-for-sale (“AFS”) and held-to-maturity (“HTM”).
Financial assets are classified based on the business model of the Group for the financial and characteristic of contractual cash flows.
EUROWAG ANNUAL REPORT 2018 | FINANCIAL SECTION EUROWAG ANNUAL REPORT 2018 | FINANCIAL SECTION
5.2 APPLICATION OF NEW IFRS – STANDARDS AND INTERPRETATIONS EFFECTIVE IN THE REPORTING PERIOD
The Group applied IFRS 9, IFRS 15 and IFRS 16 for the first time as at 1 January 2018. The nature and effect of the changes as a result of adoption of these new accounting standards are described below.
Several other amendments and interpretations apply for the first time in the 2018 period, but do not have a significant impact on the consolidated financial statements of the Group.
The accounting policies adopted are consistent with those of the previous financial year, except as follows. In the current reporting period, the Group has adopted amended standards and a new interpretation issued by the IASB and endorsed for use in the European Union, effective for annual periods beginning on or after 1 January 2018.
IFRS 9 – FINANCIAL INSTRUMENTS
Instruments – adopted by the EU on 22 November 2016 (effective for annual periods beginning on or after 1 January 2018). The final version of IFRS 9 Financial Instruments reflects all phases of the financial instruments project and replaces IAS 39 Financial Instruments: Recognition and Measurement and all previous versions of IFRS 9.. The standard introduces new requirements for classification and measurement, impairment, and hedge accounting.
The Group has adopted IFRS 9 retrospectively, with the initial application date of 1 January 2018. The Group used the method allowed by transition paragraphs of IFRS 9, where the effect of the adoption of IFRS 9 has been recorded in the retained earnings as of 1 January 2018 without adjusting the 2017 comparative information.
5655

IFRS 16 – LEASES
– adopted by the EU on 31 October 2017 (effective for annual periods beginning on or after 1 January 2019). IFRS 16 was early adopted by the Group on 1 January 2018.IFRS 16 specifies that a lessee recognises a right-of-use asset and a lease liability. The right-of-use assets is accounted for similarly as other non-financial assets and depreciated as appropriate. The lease liability is initially measured at the present value of the lease payments payable over the lease term, discounted at the rate implicit in the lease if that can be readily determined. If that rate cannot be readily determined, the lessee shall use their incremental borrowing rate.
Lessors classify leases as operating or finance, with IFRS 16’s approach to lessor accounting substantially unchanged from its predecessor, IAS 17. A lease is classified as a finance lease if it transfers substantially all the risks and rewards incidental to ownership of an underlying asset. Otherwise a lease is classified as an operating lease. A lessor recognises finance income over the lease term of a finance lease, based on a pattern reflecting a constant periodic rate of return on the net investment. A lessor recognises operating lease payments as income on a straight-line basis or, if more representative of the pattern in which benefit from use of the underlying asset is diminished, another systematic basis.
ON THE DATE OF APPLICATION, THE GROUP REPORT ON:
• the lease obligation classified earlier as an operational lease in compliance with IAS 17. This obligation is valued using the current discounted value of the remaining lease payments – the incremental borrowing rate valid up to 1 January 2018 is used to calculate the discount;
• the right-to-use asset from the lease classified earlier as an operational lease in compliance with IAS 17 evaluated using the amount equal to the lease obligation, adjusted by the amount of all prepaid or accrued lease payments pertaining to this underlying asset reported in the financial statements immediately before the day of initial application.
The Group has not performed any adjustments pertaining to the leases with underlying assets of low value and leases that terminate within 12 months of the initial application.
In compliance with IFRS 16, the Group accepts exceptions to the application of the standard. The Group will not report on leases in its financial statements in the following cases:
• leases with a duration of 12 months or less without the option of subsequent purchase;
• leases where the relevant asset as new has a low value.
In these cases, the lessee will enter the lease payments under accrued costs according to the expected growth of revenues from these leases or in a linear manner.
Impact of IFRS 16 – Leases to Group´s consolidated financial statements is described and calculated (Note 4 and 23).
ADOPTION OF IFRS 16
On the date of the adoption of IFRS 16 on 1 January 2018, the Group reports on its leases as a lessee retrospectively with a cumulative impact of the initial application. In compliance with paragraph C5 b), of IFRS 16, the Group as the lessee, does not alter the reference information and, instead, reports on cumulative impact of the initial application of the standard as an adjustment of the initial balance of retained earnings on the date of the initial application (1 January 2018).
1/ IDENTIFY THE CONTRACT(S) WITH A CUSTOMER
2/ IDENTIFY THE PERFORMANCE OBLIGATIONS IN THE CONTRACT
3/ DETERMINE THE TRANSACTION PRICE
4/ ALLOCATE THE TRANSACTION PRICE TO THE PERFORMANCE OBLIGATIONS IN THE CONTRACT
5/ RECOGNISE REVENUE WHEN (OR AS) THE ENTITY SATISFIES A PERFORMANCE OBLIGATION
IFRS 15 – REVENUE FROM CONTRACTS WITH CUSTOMERS
– adopted by the EU on 22 September 2016 (effective for annual periods beginning on or after 1 January 2018). IFRS 15 specifies how and when an IFRS reporter will recognise revenue as well as requiring such entities to provide users of financial statements with more informative disclosures. The standard supersedes IAS 18 “Revenue”, IAS 11 “Construction Contracts” and a number of revenue-related interpretations.
The standard outlines the principles an entity must apply to measure and recognise revenue. The core principle is that an entity will recognise revenue at an amount that reflects the consideration to which the entity expects to be entitled in exchange for transferring goods or services to a customer.
THE PRINCIPLES IN IFRS 15 WILL BE APPLIED USING A FIVE-STEP MODEL:
The standard requires entities to exercise judgement, taking into consideration all of the relevant facts and circumstances when applying each step of the model to contracts with their customers. The standard also specifies how to account for the incremental costs of obtaining a contract and the costs directly related to fulfilling a contract. Application guidance is provided in IFRS 15 to assist entities in applying its requirements to certain common arrangements, including licences of intellectual property, warranties, rights of return, principal-versus-agent considerations, options for additional goods or services and breakage.
The Group performed a detailed analysis of identification of performance obligations, their transactions price allocation, revenue recognition. There were no significant impacts identified as well as presentation of revenue/performance obligation has not been impacted in the Group’s financial statements (for more detail see Note 10).
Amendments to
IFRS 15 – REVENUE FROM CONTRACTS WITH CUSTOMERS
– adopted by the EU on 31 October 2017 (effective for annual periods beginning on or after 1 January 2018). The amendments do not change the underlying principles of IFRS 15 but clarify how those principles should be applied.
The amendments clarify how to identify a performance obligation (the promise to transfer a good or a service to a customer) in a contract; how to determine whether a company is a principal (the provider of a good or service) or an agent (responsible for arranging for the good or service to be provided); and how to determine whether the revenue from granting a license should be recognized at a point in time or over time. In addition to the clarifications, the amendments include two additional reliefs to reduce cost and complexity for a company when it first applies the new standard.
These Amendments do not have significant impact on the Group’s financial statements.
EUROWAG ANNUAL REPORT 2018 | FINANCIAL SECTION EUROWAG ANNUAL REPORT 2018 | FINANCIAL SECTION
57 58
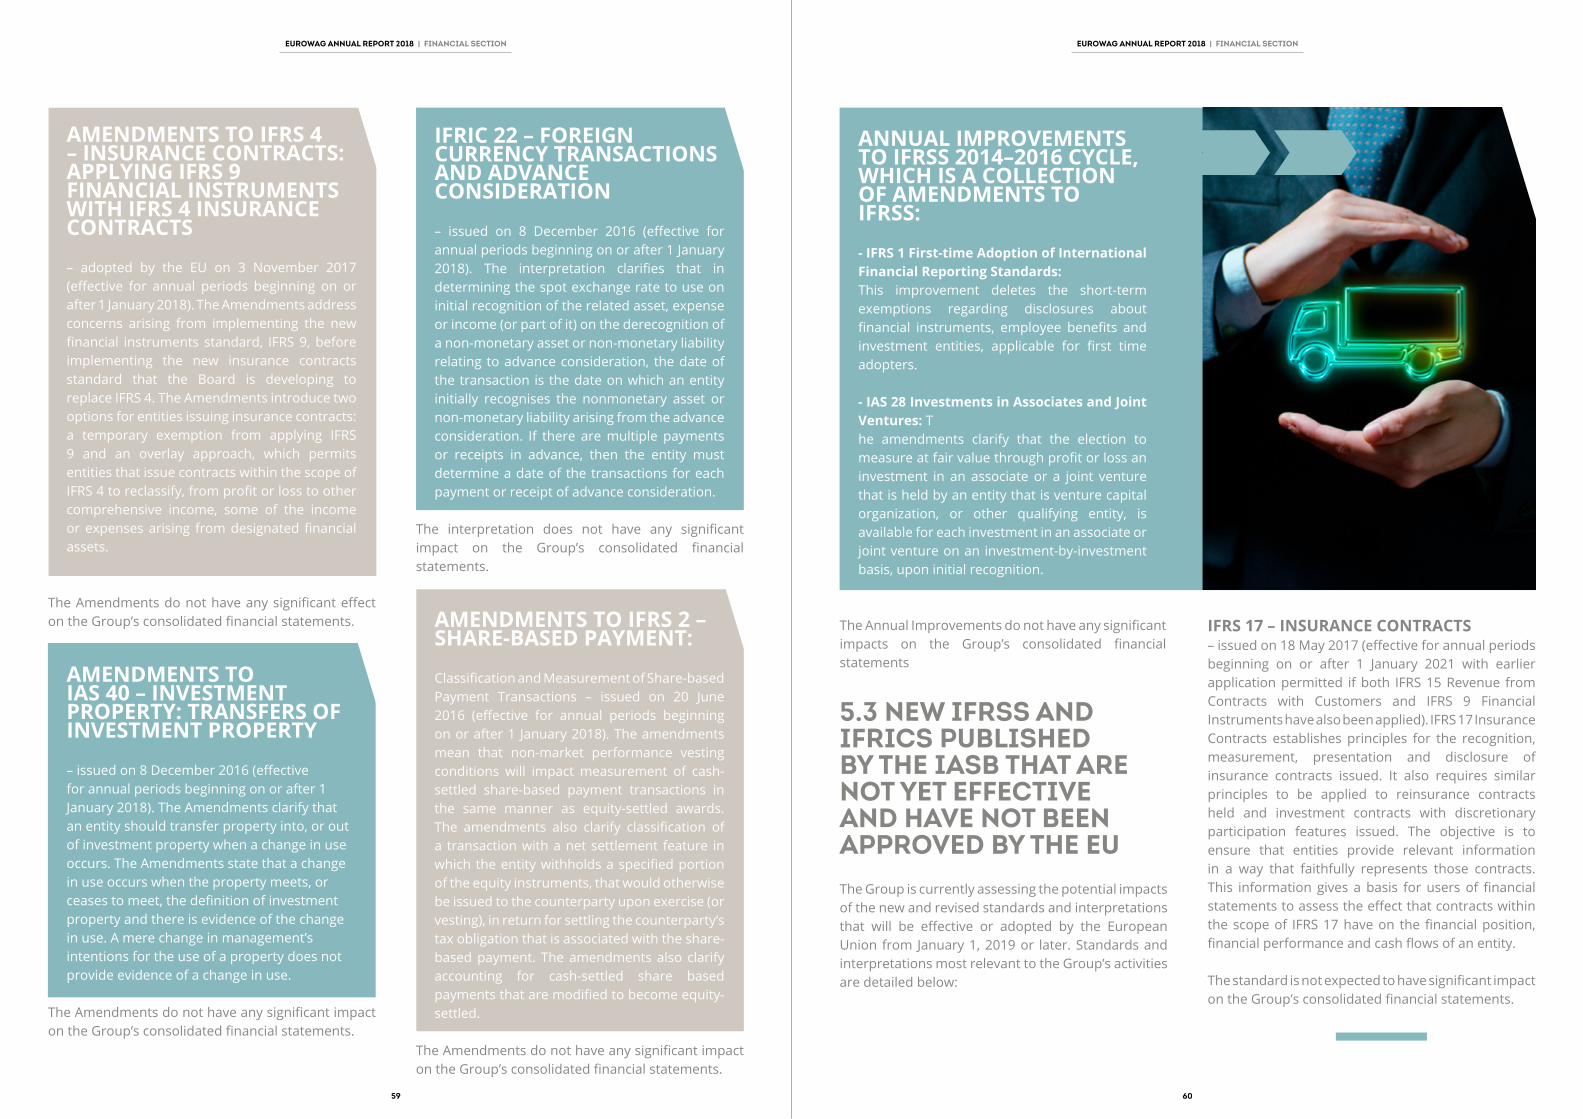
ANNUAL IMPROVEMENTS TO IFRSS 2014–2016 CYCLE, WHICH IS A COLLECTION OF AMENDMENTS TO IFRSS:
- IFRS 1 First-time Adoption of International Financial Reporting Standards: This improvement deletes the short-term exemptions regarding disclosures about financial instruments, employee benefits and investment entities, applicable for first time adopters.
- IAS 28 Investments in Associates and Joint Ventures: The amendments clarify that the election to measure at fair value through profit or loss an investment in an associate or a joint venture that is held by an entity that is venture capital organization, or other qualifying entity, is available for each investment in an associate or joint venture on an investment-by-investment basis, upon initial recognition.
The Annual Improvements do not have any significant impacts on the Group’s consolidated financial statements
IFRS 17 – INSURANCE CONTRACTS – issued on 18 May 2017 (effective for annual periods beginning on or after 1 January 2021 with earlier application permitted if both IFRS 15 Revenue from Contracts with Customers and IFRS 9 Financial Instruments have also been applied). IFRS 17 Insurance Contracts establishes principles for the recognition, measurement, presentation and disclosure of insurance contracts issued. It also requires similar principles to be applied to reinsurance contracts held and investment contracts with discretionary participation features issued. The objective is to ensure that entities provide relevant information in a way that faithfully represents those contracts. This information gives a basis for users of financial statements to assess the effect that contracts within the scope of IFRS 17 have on the financial position, financial performance and cash flows of an entity.
The standard is not expected to have significant impact on the Group’s consolidated financial statements.
5.3 NEW IFRSS AND IFRICS PUBLISHED BY THE IASB THAT ARE NOT YET EFFECTIVE AND HAVE NOT BEEN APPROVED BY THE EUThe Group is currently assessing the potential impacts of the new and revised standards and interpretations that will be effective or adopted by the European Union from January 1, 2019 or later. Standards and interpretations most relevant to the Group’s activities are detailed below:
AMENDMENTS TO IFRS 4 – INSURANCE CONTRACTS: APPLYING IFRS 9 FINANCIAL INSTRUMENTS WITH IFRS 4 INSURANCE CONTRACTS
– adopted by the EU on 3 November 2017 (effective for annual periods beginning on or after 1 January 2018). The Amendments address concerns arising from implementing the new financial instruments standard, IFRS 9, before implementing the new insurance contracts standard that the Board is developing to replace IFRS 4. The Amendments introduce two options for entities issuing insurance contracts: a temporary exemption from applying IFRS 9 and an overlay approach, which permits entities that issue contracts within the scope of IFRS 4 to reclassify, from profit or loss to other comprehensive income, some of the income or expenses arising from designated financial assets.
The Amendments do not have any significant effect on the Group’s consolidated financial statements.
AMENDMENTS TO IAS 40 – INVESTMENT PROPERTY: TRANSFERS OF INVESTMENT PROPERTY – issued on 8 December 2016 (effective for annual periods beginning on or after 1 January 2018). The Amendments clarify that an entity should transfer property into, or out of investment property when a change in use occurs. The Amendments state that a change in use occurs when the property meets, or ceases to meet, the definition of investment property and there is evidence of the change in use. A mere change in management’s intentions for the use of a property does not provide evidence of a change in use.
The Amendments do not have any significant impact on the Group’s consolidated financial statements.
IFRIC 22 – FOREIGN CURRENCY TRANSACTIONS AND ADVANCE CONSIDERATION
– issued on 8 December 2016 (effective for annual periods beginning on or after 1 January 2018). The interpretation clarifies that in determining the spot exchange rate to use on initial recognition of the related asset, expense or income (or part of it) on the derecognition of a non-monetary asset or non-monetary liability relating to advance consideration, the date of the transaction is the date on which an entity initially recognises the nonmonetary asset or non-monetary liability arising from the advance consideration. If there are multiple payments or receipts in advance, then the entity must determine a date of the transactions for each payment or receipt of advance consideration.
The interpretation does not have any significant impact on the Group’s consolidated financial statements.
AMENDMENTS TO IFRS 2 – SHARE-BASED PAYMENT:
Classification and Measurement of Share-based Payment Transactions – issued on 20 June 2016 (effective for annual periods beginning on or after 1 January 2018). The amendments mean that non-market performance vesting conditions will impact measurement of cash-settled share-based payment transactions in the same manner as equity-settled awards. The amendments also clarify classification of a transaction with a net settlement feature in which the entity withholds a specified portion of the equity instruments, that would otherwise be issued to the counterparty upon exercise (or vesting), in return for settling the counterparty‘s tax obligation that is associated with the share-based payment. The amendments also clarify accounting for cash-settled share based payments that are modified to become equity-settled.
The Amendments do not have any significant impact on the Group’s consolidated financial statements.
EUROWAG ANNUAL REPORT 2018 | FINANCIAL SECTION EUROWAG ANNUAL REPORT 2018 | FINANCIAL SECTION
6059

REVISED IFRS CONCEPTUAL FRAMEWORK - issued on 29 March 2018. The Conceptual Framework sets out a comprehensive set of concepts for financial reporting, standard setting, guidance for preparers in developing consistent accounting policies and assistance to others in their efforts to understand and interpret the standards. IASB also issued a separate accompanying document, Amendments to References to the Conceptual Framework in IFRS Standards, which sets out the amendments to affected standards in order to update references to the revised Conceptual Framework. Its objective is to support transition to the revised Conceptual Framework for companies that develop accounting policies using the Conceptual Framework when no IFRS Standard applies to a particular transaction. For preparers who develop accounting policies based on the Conceptual Framework, it is effective for annual periods beginning on or after 1 January 2020.
AMENDMENTS TO IFRS 3: BUSINESS COMBINATIONS: -The IASB issued Amendments in Definition of a Business (Amendments to IFRS 3) aimed at resolving the difficulties that arise when an entity determines whether it has acquired a business or a group of assets. The Amendments are effective for business combinations for which the acquisition date is in the first annual reporting period beginning on or after 1 January 2020 and to asset acquisitions that occur on or after the beginning of that period, with earlier application permitted IASB.
The Amendments are not expected to have any significant impact on the Group’s consolidated financial statements.
THE ANNUAL IMPROVEMENTS TO IFRSS 2015 – 2017 CYCLE, which is a collection of amendments to IFRSs. The amendments are effective for annual periods beginning on or after 1 January 2019 with earlier application permitted.
- IFRS 3 Business Combinations and IFRS 11 Joint Arrangements: The amendments to IFRS 3 clarify that when an entity obtains control of a business that is a joint operation, it remeasures previously held interests in that business. The amendments to IFRS 11 clarify that when an entity obtains joint control of a business that is a joint operation, the entity does not remeasure previously held interests in that business.
- IAS 12 Income Taxes: The amendments clarify that the income tax consequences of payments on financial instruments classified as equity should be recognized according to where the past transactions or events that generated distributable profits has been recognized.
- IAS 23 Borrowing Costs: The amendments clarify paragraph 14 of the standard that, when a qualifying asset is ready for its intended use or sale, and some of the specific borrowing related to that qualifying asset remains outstanding at that point, that borrowing is to be included in the funds that an entity borrows generally.
These Annual Improvements are not expected to have any significant impacts on the Group’s consolidated financial statements.
IFRIC 23 – UNCERTAINTY OVER INCOME TAX TREATMENTS – issued on 7 June 2017 (effective for annual periods beginning on or after 1 January 2019). IFRIC 23 was prepared to clarify the presentation of uncertainties in income taxes and to respond to questions that had arisen in practice as to how uncertainty about the acceptability by a tax authority of a particular tax treatment used by an entity in its income tax filings (‘uncertain tax treatment’) should be reflected in the financial statements. The interpretation is to be applied to the determination of taxable profit (tax loss), tax bases, unused tax losses, unused tax credits and tax rates, when there is uncertainty over income tax treatments under IAS 12 Income Taxes.These new interpretation is not expected to have any significant impact on the Group’s consolidated financial statements.
AMENDMENTS TO IFRS 9 – FINANCIAL INSTRUMENTS: Prepayment Features with Negative Compensation – issued on 12 October 2017 (effective for annual periods beginning on or after 1 January 2019). The Amendment allows financial assets with prepayment features that permit or require a party to a contract either to pay or receive reasonable compensation for the early termination of the contract (so that, from the perspective of the holder of the asset there may be ‘negative compensation’), to be measured at amortized cost or at fair value through other comprehensive income.
These Amendments are not expected to have any significant impact on the Group’s consolidated financial statements.
AMENDMENTS TO IAS 28 – INVESTMENT IN ASSOCIATES AND JOINT VENTURES: Long-term Interests in Associates and Joint Ventures – clarification of the application of IFRS 9 Financial Instruments on long-term interests in associates and joint ventures – issued on 12 October 2017 (effective for annual periods beginning on or after 1 January 2019). The Amendments relate to whether the measurement, in particular impairment requirements, of long term interests in associates and joint ventures that, in substance, form part of the ‘net investment’ in the associate or joint venture should be governed by IFRS 9, IAS 28 or a combination of both. The Amendments clarify that an entity applies IFRS 9 Financial Instruments, before it applies IAS 28, to such long-term interests for which the equity method is not applied. In applying IFRS 9, the entity does not take account of any adjustments to the carrying amount of long- term interests that arise from applying IAS 28.
These Amendments are not expected to have any significant impact on the Group’s consolidated financial statements.
AMENDMENTS TO IAS 19 – EMPLOYEE BENEFITS: Plan Amendment, Curtailment or Settlement - effective for annual periods beginning on or after 1 January 2019 with earlier application permitted. The Amendments require that entities use updated actuarial assumptions to determine the current service cost and the net interest for the period after a plan amendment, curtailment or settlement occurs. In addition, the Amendments clarify the effect of a plan amendment, curtailment or settlement on the requirements regarding the asset ceiling.
The Amendments are not expected to have any significant impact on the Group’s consolidated financial statements.
EUROWAG ANNUAL REPORT 2018 | FINANCIAL SECTION EUROWAG ANNUAL REPORT 2018 | FINANCIAL SECTION
61 62

7. GROUP INFORMATION
The Group has following principal activities:Providing payment solutions for fleets of professional transport and forwarding companies as well as running a network of petrol stations for passenger cars (“Payment solutions, petrol stations”)
Providing payment solutions for fleets of professional transport and forwarding companies (“Payment solutions”) Providing unified way of electronic toll payments on a number of European highways for fleets of professional transport and forwarding companies (“Toll”)
Recovery of VAT refunds and excise duty from EU countries (“Refunds”)
Creating an automated journey book and optimizing traffic with the use of integrated digital maps (“Development software”)
COMBINE ADVANCED SOLUTIONS IN THE FIELD OF ELECTRONICS, SOFTWARE ENGINEERING AND APPLIED MATHEMATICS (“GPS/GPRS”)
The consolidated financial statements of the Group include:
Name Principal activities Registered office Percentage of voting rights 2018 2017W.A.G. payment solutions, a.s. Payment solutions, petrol stations Czech Republic Parent ParentW.A.G. payment solutions SK, s.r.o. Payment solutions, petrol stations Slovakia 100% 100%W.A.G. payment solutions RO, s.r.l. Payment solutions Romania 100% 100%W.A.G. payment solutions PL, Sp. zoo Payment solutions Poland 100% 100%W.A.G. payment solutions HU, Kft. Payment solutions, petrol stations Hungary 100% 100%W.A.G. HU, Kft. Payment solutions Hungary 100% 100%W.A.G. payment solutions AT GmbH Payment solutions, petrol stations Austria 100% 100%Reamon Tax, a.s. Refunds Czech Republic 100% 100%CONSORZIO EUROWAG S.C. A R.L Toll Italy 100% 100%W.A.G. Issuing Services, a.s. Payment solutions Czech Republic 100% 100%W.A.G. payment solutions BE BVBA Payment solutions Belgium 100% 100%W.A.G. payment solutions BG EOOD Payment solutions Bulgaria 100% 100%W.A.G. payment solutions CZ, s.r.o. Payment solutions Czech Republic 100% 100%W.A.G. payment solutions DE GmbH Payment solutions Germany 100% 100%W.A.G. payment solutions DK ApS Payment solutions Denmark 100% 100%W.A.G. payment solutions EE OÜ Payment solutions Estonia 100% 100%W.A.G. payment solutions Spain SLU. Payment solutions Spain 100% 100%W.A.G. payment solutions FI Oy Payment solutions Finland 100% 100%
6. SIGNIFICANT ACCOUNTING JUDGMENTS, ESTIMATES AND ASSUMPTIONS
EUROWAG ANNUAL REPORT 2018 | FINANCIAL SECTION EUROWAG ANNUAL REPORT 2018 | FINANCIAL SECTION
JUDGEMENTSIn the process of applying the Group’s accounting policies, management has made the following judgments, which have the most significant effect on the amounts recognized in the consolidated financial statements:
ESTIMATES AND ASSUMPTIONSThe preparation of financial statements in accordance with IFRS requires the use of estimates and assumptions that affect the reported amount of revenues, expenses, assets and liabilities, and the accompanying disclosures, and the disclosure of contingent liabilities at the date of the financial statements. Uncertainty about these assumptions and estimates could result in outcomes that require a material adjustment to the carrying amount of assets or liabilities affected in future periods.
The key assumptions concerning the future and other key sources of estimation uncertainty at the reporting date, that have a significant risk of causing a material adjustment to the carrying amounts of assets and liabilities within the next financial year, are described below. The Group based its assumptions and estimates on parameters available when the consolidated financial statements were prepared. Existing circumstances and assumptions about future developments, however, may change due to market changes or circumstances arising that are beyond the control of the Group. Such changes are reflected in the assumptions when they occur.
IMPAIRMENT OF NON-FINANCIAL ASSETSImpairment exists when the carrying value of an asset or cash generating unit exceeds its recoverable amount, which is the higher of its fair value less costs of disposal and its value in use. The fair value less costs of disposal calculation is based on available data from binding sales transactions, conducted at arm’s length, for similar assets or observable market prices less incremental costs for disposing of the asset. The value in use calculation is based on a DCF model. The cash flows are derived from the budget for the next five years and do not include restructuring activities that the Group is not yet committed to or significant future investments that will enhance the asset’s performance of the CGU being tested. The recoverable amount is sensitive to the discount rate used for the DCF model as well as the expected future cash-inflows and the growth rate used for extrapolation purposes. These estimates are most relevant to goodwill. The key assumptions used to determine the recoverable amount for the different CGUs are disclosed and further explained in Note 21.
63 64

3
8. BUSINESS COMBINATION
ACQUISITION OF ALDOBEC TECHNOLOGIES, S.R.O.On 15 January 2018 the Group acquired 100% of the voting shares of Aldobec technologies, s.r.o., an unlisted company based in 2006, Slovak Republic. Aldobec technologies, s.r.o. is a leading provider of web services for fleet monitoring, management and optimization in Slovakia, specializing in the road freight segment.The combination had taken place at the beginning of the year, at the date of 1 January 2018.
ASSETS ACQUIRED AND LIABILITIES ASSUMEDThe fair value of the identifiable assets and liabilities as at the date of acquisition were:
EUR ‚000 Fair value recognized on acquisition Aldobec technologies, s.r.o.
Assets Property, plant and equipment (Note 22) 13Intangible assets (Note 21) -Identifiable intangible assets (Note 21) 628Cash and cash equivalents 22Trade receivables 76Inventories 46Acruals 4Total Assets 789 Trade payables 104Interest-bearing loans and borrowings -Provisions 2Deferred tax 132Acruals -Total Liabilities 238Total identifiable net assets at fair value 551
Non-controlling interest measured at fair value / at the proportionate share of its interest in the acquiree’s identifiable net assets -Goodwill arising on acquisition (Note 21) 910Consideration liability (discounted) 761
Purchase price 700
Total consideration 1,461
Purchase price allocation of Aldobec technologies, s.r.o. is final and the consideration was EUR 700 thousand in cash and discounted consideration liability will be EUR 761 thousand.
COMBINE ADVANCED SOLUTIONS IN THE FIELD OF ELECTRONICS, SOFTWARE ENGINEERING AND APPLIED MATHEMATICS (“GPS/GPRS”)
The consolidated financial statements of the Group include:
Name Principal activities Registered office Percentage of voting rights 2018 2017
W.A.G. payment solutions FR SARL Payment solutions France 100% 100%W.A.G. payment solutions HR d.o.o. Payment solutions Croatia 100% 100%W.A.G. payment solutions CH AG Payment solutions Switzerland 100% 100%W.A.G. payment solutions IE LIMITED Payment solutions Ireland 100% 100%W.A.G. payment solutions IT S.R.L. UNIPERSONALE Payment solutions Italy 100% 100%W.A.G. payment solutions LT, UAB Payment solutions Lithuania 100% 100%W.A.G. payment solutions LU S.à r.l. Payment solutions Luxembourg 100% 100%SIA W.A.G. payment solutions LV Payment solutions Latvia 100% 100%W.A.G. payment solutions NL B.V. Payment solutions The Netherlands 100% 100%W.A.G. payment solutions PT Unnipessoal, LDA Payment solutions Portugal 100% 100%W.A.G. payment solutions Sweden AB Payment solutions Sweden 100% 100%W.A.G., plačilne rešitve SI, d.o.o. Payment solutions Slovenia 100% 100%W.A.G. payment solutions UK LIMITED Payment solutions Great Britain 100% 100%HI Software Development s.r.o. Development software Czech Republic 100% 100%Princip a.s. GPS/GPRS Czech Republic 100% 100%Klub Investorov T&G SK, s.r.o. Payment solutions Slovakia 100% 100%W.A.G. payment solutions EL SP LTD Payment solutions Greece 100% 100%W.A.G. payment solutions NO AS Payment solutions Norway 100% 100%WAG Payment Solutions Turkey Ödeme Sistemleri Ticaret Limited Şirketi Payment solutions Turkey 100% 100%W.A.G. mobility solutions Iberia SL Payment solutions Spain 100% -Aldobec technologies, s.r.o. Development software Slovakia 100% -
THE HOLDING COMPANYW.A.G. payment solutions, a.s. is the ultimate parent. It is based in the Czech Republic and is not listed.
EUROWAG ANNUAL REPORT 2018 | FINANCIAL SECTION EUROWAG ANNUAL REPORT 2018 | FINANCIAL SECTION
65 66

ACQQQUISITION OF HI SOFTWARE DEVELOPMENT S.R.O. AND PRINCIP A.S.On 15 February 2017 the Group acquired 100% of the voting shares of HI Software Development s.r.o., an unlisted company based in 2004, Czech Republic for CZK 116,927 thousand. HI Software Development s.r.o. has many years of experience in the development of specialized vehicle monitoring software. Above all, creating an automated journey book and optimizing traffic with the use of integrated digital maps.
ASSETS ACQUIRED AND LIABILITIES ASSUMEDThe fair value of the identifiable assets and liabilities as at the date of acquisition were:
EUR ‚000 Fair value recognized on acquisition – Princip a.s. and Hi Software s.r.o.
Assets Property, plant and equipment (Note 22) 1,208Intangible assets (Note 21) 4Identifiable intangible assets (Note 21) 3,962Cash and cash equivalents 2,837Trade receivables 5,675Inventories 305Acruals 180Total Assets 14,171 Trade payables 617Interest-bearing loans and borrowings 558Provisions 474Deferred tax 753Acruals 133Total Liabilities 2,535
Total identifiable net assets at fair value 11,636
Non-controlling interest measured at fair value / at the proportionate share of its interest in the acquiree’s identifiable net assets -Goodwill arising on acquisition (Note 21) 23,078
Purchase price 34,714
Purchase price allocation of Princip a.s. and Hi Software s.r.o. is final and the consideration was EUR 34,714 thousand in cash. Share consideration and contingent consideration liability were not recognized.
From the date of acquisition, Princip a.s. and Hi software s.r.o. contributed EUR 7,629 thousand of revenue and EUR 2,513 thousand to profit before tax from continuing operations of the Group. If the combination had taken place at the beginning of the year, revenue from continuing operations would have been EUR 8,477 thousand and profit before tax from continuing operations for the Group would have been EUR 2,833 thousand.
EUROWAG ANNUAL REPORT 2018 | FINANCIAL SECTION EUROWAG ANNUAL REPORT 2018 | FINANCIAL SECTION
9. FAIR VALUE MEASUREMENTThe following table provides the fair value measurement hierarchy of the Group’s assets and liabilities.
Fair value measurement hierarchy for assets and liabilities as at 31 December 2018 (EUR ‚000):
Fair value measurement usingEUR ‚000 Date Quoted prices Significant Significant Total
of valuation in active observable unobservable markets inputs inputs
(Level 1) (Level 2) (Level 3) Assets measured at fair value Derivative financial assets Foreign exchange forward contracts 31 December 2018 22 - - 22Foreign exchange option contracts 31 December 2018 - - - -Currency rate swaps 31 December 2018 2 - - 2Interest rate swaps 31 December 2018 - - - -Liabilities measured at fair value Derivative financial liabilities Foreign exchange forward contracts 31 December 2018 768 - - 768Foreign exchange option contracts 31 December 2018 - - - -Currency rate swaps 31 December 2018 19 - - 19Interest rate swaps 31 December 2018 261 - - 261
There have been no transfers between Level 1 and Level 2 during the ended 31 December 2018.
Fair value measurement hierarchy for assets and liabilities as at 31 December 2017 (EUR ‚000):
Fair value measurement usingEUR ‚000 Date Quoted prices Significant Significant Total
of valuation in active observable unobservable markets inputs inputs
(Level 1) (Level 2) (Level 3)Assets measured at fair value Derivative financial assets Foreign exchange forward contracts 31 December 2017 505 - - 505Foreign exchange option contracts 31 December 2017 - - - -Interest rate swaps 31 December 2017 39 - - 39Liabilities measured at fair value Derivative financial liabilities Foreign exchange forward contracts 31 December 2017 33 - - 33Foreign exchange option contracts 31 December 2017 - - - -Interest rate swaps 31 December 2017 194 - - 194
There have been no transfers between Level 1 and Level 2 during the year ended 31 December 2017.
67 68

EUROWAG ANNUAL REPORT 2018 | FINANCIAL SECTION EUROWAG ANNUAL REPORT 2018 | FINANCIAL SECTION
10. REVENUESet out below is the disaggregation of the Group´s revenue from contracts with customers (EUR ‘000):
EUR ‘000 For the year ended 31 December 2018
Fuel Toll Tax refund Telematics Services Total - othersType of goods or service Sale of fuel 891,544 - - - - 891,544Arranging payments of toll - 11,713 - - - 11,713Provision of tax refund - - 4,267 - - 4,267Telematics - - - 2,061 - 2,061Services - others - - - 5,302 4,300 9,602Total revenue from contracts with customers 891,544 11,713 4,267 7,363 4,300 919,187Geographical marketsDomestic 221,091 2,030 258 7,363 3,156 233,898European Union 629,228 9,065 3,673 - 1,126 643,092Others 41,225 618 336 - 18 42,197Total revenue from contracts with customers 891,544 11,713 4,267 7,363 4,300 919,187Timing of revenue recognition Goods transferred at a point in time 891,544 11,713 - - 4,300 907,557Services transferred over time - - 4,267 7,363 - 11,630Total revenue from contracts with customers 891,544 11,713 4,267 7,363 4,300 919,187
EUR ‘000 For the year ended 31 December 2017
Fuel Toll Tax refund Telematics Services Total - othersType of goods or service Sale of fuel 700,043 - - - - 700,043Arranging payments of toll - 9,657 - - - 9,514Provision of tax refund - - 4,206 - - 4,206Telematics - - - 1,726 - 1,726Services - others - - - 4,854 1,671 6,525Total revenue from contracts with customers 700,043 9,657 4,206 6,580 1,671 722,157Geographical markets Domestic 192,637 1,724 214 6,580 1,671 202,826European Union 474,932 7,368 3,575 - - 485,875Others 32,474 565 417 - - 33,456Total revenue from contracts with customers 700,043 9,657 4,206 6,580 1,671 722,157Timing of revenue recognition Goods transferred at a point in time 700,043 9,657 - - 1,671 711,371Services transferred over time - - 4,206 6,580 - 10,786Total revenue from contracts with customers 700,043 9,657 4,206 6,580 1,671 722,157
PERFORMANCE OBLIGATIONSThe performance obligation for sale of fuel is satisfied upon delivery of fuel the customer and payment is generally due within 0-30 days from delivery. The performance obligation for arranging payment of toll, provision of taxrefund and other services is satisfied upon delivery of services the customer and payment is generally due within 0-30 days from delivery. The performance obligation for telematics is satisfied upon delivery of unit and instalation of unit to the Customer and payment is generally within 14-45 days from delivery.
11. OTHER OPERATING INCOMEOther operating income for the year ended 31 December were as follows (EUR ‚000):
EUR ‚000 2018 2017Insurance indemnity income 130 139Received penalties 916 510Gain from sold fixed assets 11 110Other operating income 94 183
Total 1,151 942
69 70

EUROWAG ANNUAL REPORT 2018 | FINANCIAL SECTION EUROWAG ANNUAL REPORT 2018 | FINANCIAL SECTION
12. RAW MATERIALS AND ENERGY CONSUMEDRaw materials and energy consumed for the year ended 31 December were as follows (EUR ‚000):
EUR ‚000 2018 2017Consumed raw materials 2,084 1,743Consumed energy 220 159
Total 2,304 1,902
13. EMPLOYEE EXPENSESEmployee expenses for the year ended 31 December consist of the following (EUR ‚000):
EUR ‘000 2018 2017 Total Of which Total Of which personnel members of personnel members of managerial managerial bodies* bodies*Number of full time employees 591 69 511 61Wages and salaries 19,610 5,019 12,313 4,015Compensation of members of company or cooperation bodies 319 319 395 395Stock based compensation - - - -Social security and health insurance 5,408 1,220 3,639 992Social cost 1,065 54 806 99Option plan (Note 14) 280 280 78 78Other personnel cost (unused vacation) 184 22 227 108Own work capitalized (2,183) - - -Total employee expense 24,683 6,914 17,458 5,687
*Included non-executive Vice-Presidents, Chief Officers, Chief Executive Officer, Executive Directors and Managing Directors.
14. SHARE-BASED PAYMENTS
To fuel support for the Group´s successful development, at the end of the year shareholders decided to provide senior management with option share schemes and shares.
Under the General Management Share Option Plan, the Group, at its discretion, may grant share options of the parent to management, once the management has completed six months of service. Management must remain in service for a period of three years from the date of grant. The fair value of share options granted is estimated at the date of grant on the basis of the income approach to valuation, the essence of which is the generation of profit in the course of business activities.
As of the date of realization, the price for the shares transferred will be equal to the market value of the share, but not more than the sum of the% EBITDA increase in individual years.
The option plan valuation for the year ended 31 December 2018 were follows (EUR ‚000):
EUR ‚000 amountOption plan value in 2020 43Option plan value in 2019 814Discount (equity cost) 14,80%
Total value at the measurement date (for year 2018) 280
The option plan valuation for the year ended 31 December 2017 were follows (EUR ‚000):
EUR ‚000 amountOption plan value in 2019 464Discount (equity cost) 14,80%
Total value at the measurement date (for year 2017) 78
Total value at the measurement date was calculated with forfeited rate established on the basis of management experiences.
Movement during the year
71 72
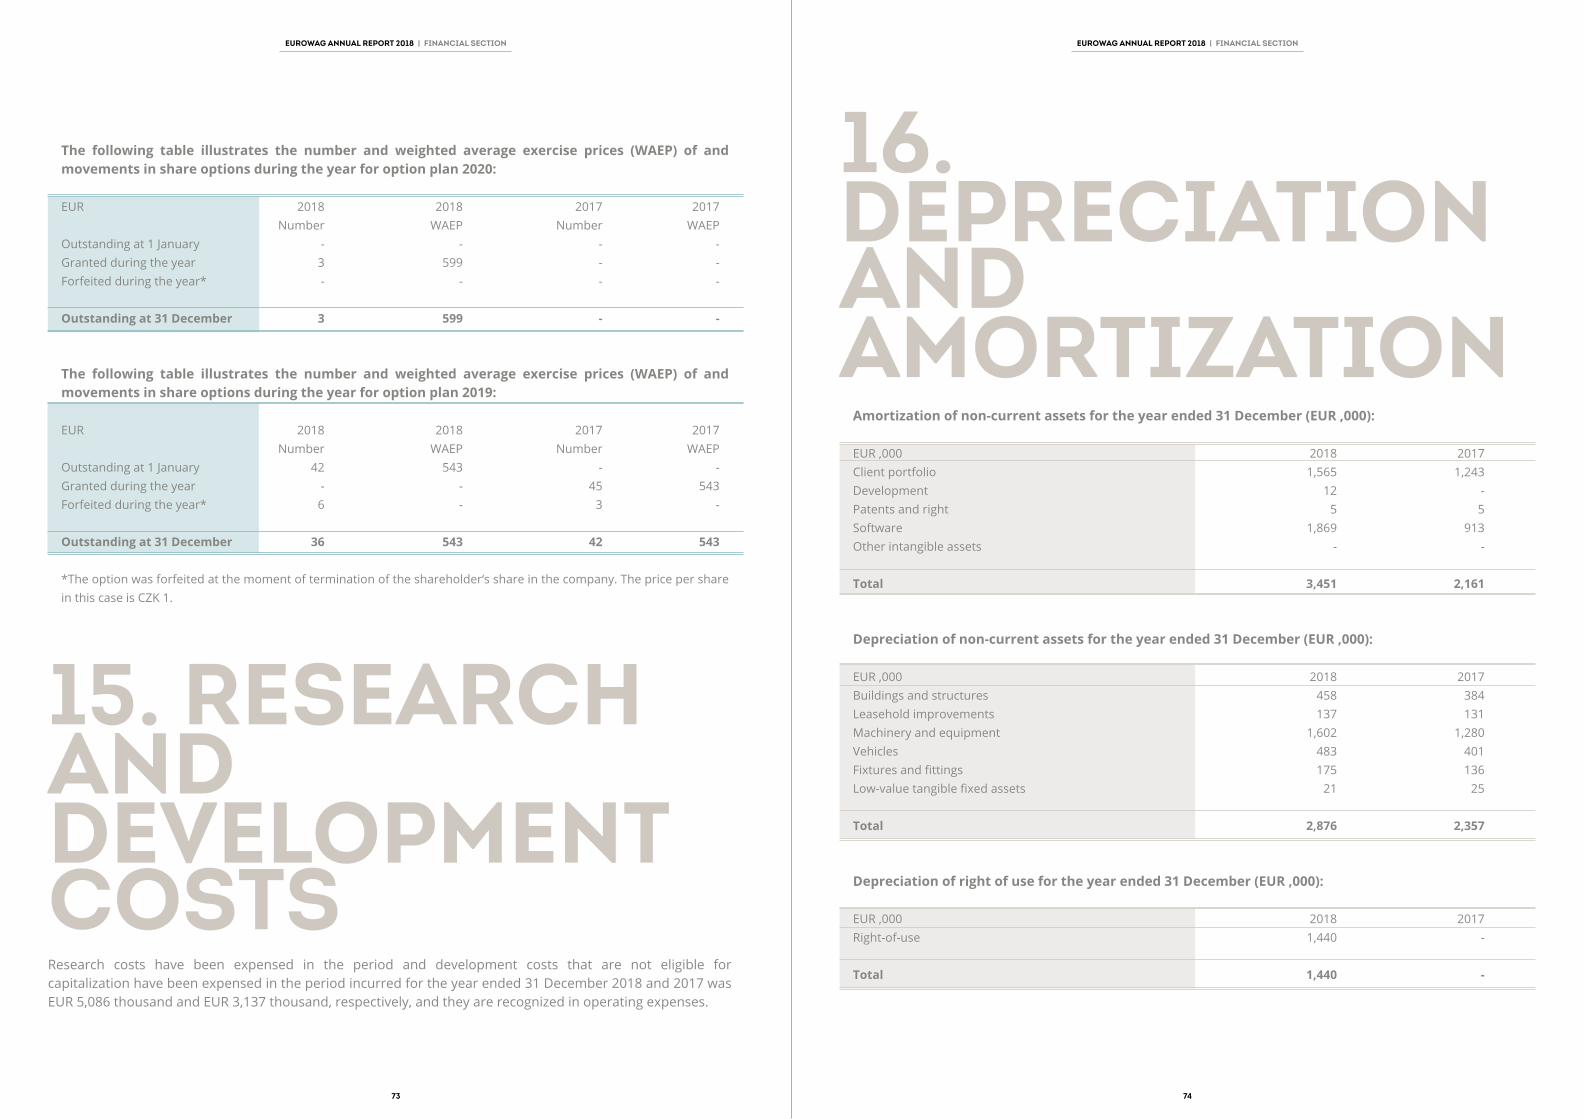
EUROWAG ANNUAL REPORT 2018 | FINANCIAL SECTION EUROWAG ANNUAL REPORT 2018 | FINANCIAL SECTION
The following table illustrates the number and weighted average exercise prices (WAEP) of and movements in share options during the year for option plan 2020: EUR 2018 2018 2017 2017 Number WAEP Number WAEPOutstanding at 1 January - - - -Granted during the year 3 599 - -Forfeited during the year* - - - -
Outstanding at 31 December 3 599 - -
The following table illustrates the number and weighted average exercise prices (WAEP) of and movements in share options during the year for option plan 2019:
EUR 2018 2018 2017 2017 Number WAEP Number WAEPOutstanding at 1 January 42 543 - -Granted during the year - - 45 543Forfeited during the year* 6 - 3 -
Outstanding at 31 December 36 543 42 543
*The option was forfeited at the moment of termination of the shareholder‘s share in the company. The price per share in this case is CZK 1.
15. RESEARCH AND DEVELOPMENT COSTSResearch costs have been expensed in the period and development costs that are not eligible for capitalization have been expensed in the period incurred for the year ended 31 December 2018 and 2017 was EUR 5,086 thousand and EUR 3,137 thousand, respectively, and they are recognized in operating expenses.
16. DEPRECIATION AND AMORTIZATION
Amortization of non-current assets for the year ended 31 December (EUR ‚000):
EUR ‚000 2018 2017Client portfolio 1,565 1,243Development 12 -Patents and right 5 5Software 1,869 913Other intangible assets - -
Total 3,451 2,161
Depreciation of non-current assets for the year ended 31 December (EUR ‚000):
EUR ‚000 2018 2017Buildings and structures 458 384Leasehold improvements 137 131Machinery and equipment 1,602 1,280Vehicles 483 401Fixtures and fittings 175 136Low-value tangible fixed assets 21 25
Total 2,876 2,357
Depreciation of right of use for the year ended 31 December (EUR ‚000):
EUR ‚000 2018 2017Right-of-use 1,440 -
Total 1,440 -
73 74
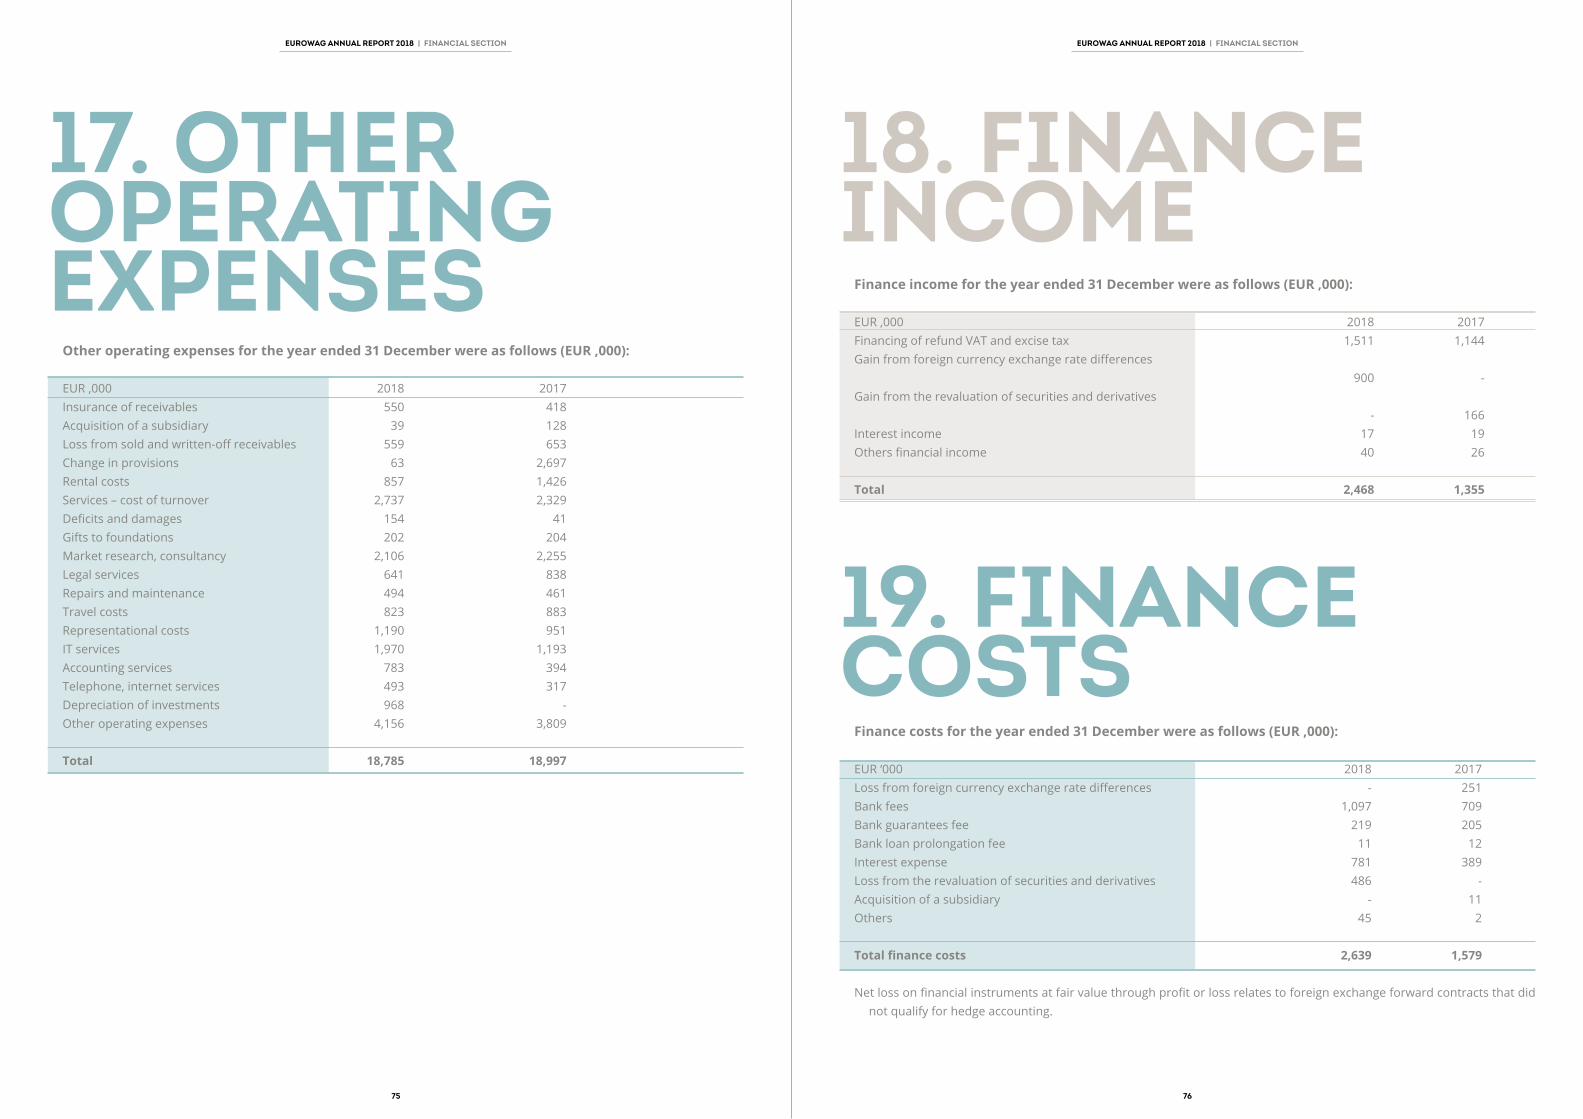
EUROWAG ANNUAL REPORT 2018 | FINANCIAL SECTION EUROWAG ANNUAL REPORT 2018 | FINANCIAL SECTION
17. OTHER OPERATING EXPENSES
Other operating expenses for the year ended 31 December were as follows (EUR ‚000):
EUR ‚000 2018 2017Insurance of receivables 550 418Acquisition of a subsidiary 39 128Loss from sold and written-off receivables 559 653Change in provisions 63 2,697Rental costs 857 1,426Services – cost of turnover 2,737 2,329Deficits and damages 154 41Gifts to foundations 202 204Market research, consultancy 2,106 2,255Legal services 641 838Repairs and maintenance 494 461Travel costs 823 883Representational costs 1,190 951IT services 1,970 1,193Accounting services 783 394Telephone, internet services 493 317Depreciation of investments 968 -Other operating expenses 4,156 3,809
Total 18,785 18,997
18. FINANCE INCOME
Finance income for the year ended 31 December were as follows (EUR ‚000):
EUR ‚000 2018 2017Financing of refund VAT and excise tax 1,511 1,144Gain from foreign currency exchange rate differences 900 -Gain from the revaluation of securities and derivatives - 166Interest income 17 19Others financial income 40 26
Total 2,468 1,355
19. FINANCE COSTS
Finance costs for the year ended 31 December were as follows (EUR ‚000):
EUR ‘000 2018 2017 Loss from foreign currency exchange rate differences - 251Bank fees 1,097 709Bank guarantees fee 219 205Bank loan prolongation fee 11 12Interest expense 781 389Loss from the revaluation of securities and derivatives 486 -Acquisition of a subsidiary - 11Others 45 2
Total finance costs 2,639 1,579
Net loss on financial instruments at fair value through profit or loss relates to foreign exchange forward contracts that did not qualify for hedge accounting.
75 76

EUROWAG ANNUAL REPORT 2018 | FINANCIAL SECTION EUROWAG ANNUAL REPORT 2018 | FINANCIAL SECTION
20. INCOME TAXCorporate income tax for companies in the Czech Republic for the years 2018 and 2017 was in line with the Income Tax Act set at the rate of 19%. The tax rate applicable for 2019 and beyond is 19%.
Structure of the income tax for the year ended 31 December is as follows (EUR ‚000):
EUR ‚000 2018 2017Current income tax charge 3,181 4,313Adjustments in respect of current income tax of previous year676 676 114Deferred tax 472 (884)
Total 4,329 3,543
Reconciliation of tax expense and the accounting profit multiplied by the parent domestic tax rate for 2018 and 2017 (EUR ‚000):
EUR ‚000 2018 2017Accounting profit before income tax from continuing operations 15,216 16,749Profit/(loss) before tax from a discontinued operation - -Accounting profit before income tax 15,216 16,749At Czech Republic’s statutory income tax rate of 19% 2,891 3,182Adjustments in respect of current income tax of previous years 676 114Impact of income tax calculated from turnover by Hungarian companies 263 172Effect of different tax rates in other countries of the Group (576) (458)Change in unrecognized deferred tax assets (45) (125)Non-taxable incomes and expenses 1,120 658At the effective income tax rate of 28,45% (2017: 21,15%) Income tax expense reported in the statement of profit or lossIncome tax attributable to a discontinued operation 4,329 3,543
The Group quantified deferred taxes as at 31 December as follows (EUR ‚000):
2018 2017Deferred tax items Deferred Deferred Deferred Deferred tax tax tax tax liability asset liability assetDifference between net book value of fixed assets for accounting and tax purposes (254) (374) (545) (86)Other temporary differences: 1,711 (55) 1,187 (192)Allowances 724 - 372 -Provisions 854 - 804 -Other 133 (55) 11 (193)
Total 1,457 (429) 642 (279)
Reflected in the statement of financial position for the year ended 31 December as follows:
EUR ‘000 2018 2017Deferred tax assets 1,378 933Deferred tax liabilities (350) (570)
Deferred tax assets, net 1,028 363
Net loss on financial instruments at fair value through profit or loss relates to foreign exchange forward contracts that did not qualify for hedge accounting.
Changes in deferred tax for the year ended 31 December (EUR ‘000):
EUR ‘000 2018 2017 asset / (liability) asset / (liability)As of 1 January 933 (570) 432 (24)Acquisition of a subsidiary - (132) - (797)Charge to profit or loss 720 348 617 244Charge to other comprehensive income (275) 4 (116) 7
As of 31 December 1,378 (350) 933 (570)
The Group offsets tax assets and liabilities if and only if it has a legally enforceable right to set off current tax assets and current tax liabilities and the deferred tax assets and deferred tax liabilities relate to income taxes levied by the same tax authority.
77 78

EUROWAG ANNUAL REPORT 2018 | FINANCIAL SECTION EUROWAG ANNUAL REPORT 2018 | FINANCIAL SECTION
21. INTANGIBLE ASSETS
Cost of intangible assets (EUR ‚000):
EUR ‚000 Client Development Patents Software Other Assets Total portfolio and rights intangible in progress assets1 January 2017 - - 84 4,053 5 1,297 5,439Additions - - - - - 5,200 5,200Transfer - - - 4,896 - -4,896 -Acquisition of a subsidiary 3,962 - 2 2 - - 3,966Assets held for sale - - - - - - -Disposals - - - - - - -Translation differences 231 - 5 387 - 85 70831 December 2017 4,193 - 91 9,338 5 1,686 15,313Additions - - - - - 9,689 9,689Transfer - 39 - 6,617 - (6,656) -Acquisition of a subsidiary 628 - - - - - 628Assets held for sale - - - - - - -Disposals - (9) - (67) - (73) (149)Translation differences (31) - (1) (84) - (21) (137)
31 December 2018 4,790 30 90 15,804 5 4,625 25,344
Accumulated amortization and impairment of intangible assets (EUR ‚000):
EUR ‚000 Client Development Patents Software Other Assets Total portfolio and rights intangible in progress assets1 January 2017 - - (32) (3,727) (5) - (3,764)Amortization (1,243) - (5) (913) - - (2,161)Assets held for sale - - - - - - -Disposals - - - - - - -Impairment - - - - - - -Translation differences (38) - (2) (230) - (270)31 December 2017 (1,281) - (39) (4,870) (5) - (6,195)Amortization (1,565) (12) (5) (1,869) - - (3,451)Assets held for sale - - - - - - -Disposals - 8 - 67 - - 75Impairment - - - - - - -Translation differences (22) - - 40 - - 18
31 December 2018 (2,868) (4) (44) (6,632) (5) - (9,553)
EUR ‚000 Goodwill Client Development Patents Software Other Assets Total portfolio and rights intangible in assets progress Net book valueat 1 January 2017 1,193 - - 52 326 - 1,297 2,868 Net book valueat 31 December 2017 25,649 2,912 - 52 4,468 - 1,686 34,767Net book valueat 31 December 2018 26,374 1,922 26 46 9,172 - 4,625 42,165
Breakdown of goodwill movements is as follows:
EUR ‚000 2018 2017Opening balance as at 1 January 25,649 1,193Newly consolidated companies 910 23,087Goodwill impairment and write-offs charged to income - (9)Translation differences (185) 1,378
Closing balance as at 31 December 26,374 25,649
IMPAIRMENT TESTINGGoodwill acquired through business combinations is allocated to the respective subsidiaries CGUs for impairment testing.
Carrying amount of the goodwill allocated to each of the CGUs (EUR ‚000):
EUR ‚000 31 December 2018 31 December 2017Reamon Tax, a.s. 630 635W.A.G. payment solutions AT GmbH 593 593HI Software Development s.r.o. and Princip a.s. 24,241 24,421Aldobec technologies, s.r.o. 910 -
For the impairment testing, the Group has prepared the valuation using the discounted cash flow model.
79 80

HI SOFTWARE DEVELOPLMENT S.R.O. AND PRINCIP A.S.The carrying amount of CGU, EUR 24,241 thousand as at 31 December 2018, has been determined based on a value in use calculation using cash flow projections from financial budgets approved by senior management covering a five-year period, which shows growth in revenues. The pre-tax discount rate applied to cash flow projections is 9,27% (2017: 9,09%) and cash flows beyond the five-year period are extrapolated using a 2,00% growth rate (2017: 2,00%).
ALDOBEC TECHNOLOGIES, S.R.O.The carrying amount of CGU, EUR 910 thousand as at 31 December 2018, has been determined based on a value in use calculation using cash flow projections from financial budgets approved by senior management covering a five-year period, which shows growth in revenues. The pre-tax discount rate applied to cash flow projections 9,27% and cash flows beyond the five-year period are extrapolated using a 2,00% growth rate.
EUROWAG ANNUAL REPORT 2018 | FINANCIAL SECTION
REAMON TAX, A.S./REFUND OF TAXESThe carrying amount of CGU, EUR 630 thousand as at 31 December 2018, has been determined based on a value in use calculation using cash flow projections from financial budgets approved by senior management covering a five-year period, which shows growth in revenues. The pre-tax discount rate applied to cash flow projections is 9,27% (2017: 9,09%) and cash flows beyond the five-year period are extrapolated using a 2,00% growth rate (2017: 2,00%) that is in line with the Czech National Bank inflation targeting.
W.A.G. PAYMENT SOLUTIONS AT GMBHThe carrying amount of CGU, EUR 593 thousand as at 31 December 2018, has been determined based on a value in use calculation using cash flow projections from financial budgets approved by senior management covering a five-year period, which shows growth in revenues. The pre-tax discount rate applied to cash flow projections is 9,27% (2017: 9,09%) and cash flows beyond the five-year period are extrapolated using a 2,00% growth rate (2017: 2,00%).
KEY ASSUMPTION USED FOR IMPAIRMENT TESTING
Discounted cash flow model and parametric formula are based on the following key assumptions:
• REVENUE GROWTH• DISCOUNT RATE
Revenue growth was determined by the management separately for an each controlled subsidiary and for each segment of revenues. The growth is based on the knowledge of each particular market taking into account the historical development of revenues and estimated macroeconomic developments in individual regions. Estimated revenue growth represents the best possible assumption of the Group’s management considering the future development as at the end of the period.
Discount rate reflects specific risks relating to the industry in which the Group operates. Used discount rate is based on the weighted average cost of capital (WACC) of the Group as presumed by Capital Asset Pricing Model.
8281

EUROWAG ANNUAL REPORT 2018 | FINANCIAL SECTION EUROWAG ANNUAL REPORT 2018 | FINANCIAL SECTION
22. PROPERTY, PLANT AND EQUIPMENT Cost of property, plant and equipment (EUR ‚000):
EUR ‚000 Buildings Plants Leasehold improvements Machinery and equipment Vehicles Furniture and fixtures Other tangibles Tangibles in progress Total1 January 2017 8,975 2,053 729 6,491 1,790 553 99 844 21,534Additions - - - - - - - 10,670 10,670Transfer 1,525 1,942 81 2,822 205 194 10 (6,779) -Acquisition of a subsidiary 988 40 - 33 129 9 - 9 1,208Assets held for sale - - - - - - - - -Disposals (1,199) (40) - (28) (341) (6) (1) (169) (1,784)Translation differences 441 85 45 346 111 38 - 50 1,11631 December 2017 10,730 4,080 855 9,664 1,894 788 108 4,625 32,744Additions - - - - - - - 8,050 8,050Transfer 1,587 2,438 653 3,788 1,232 259 (32) (9,925) -Acquisition of a subsidiary - - - 13 - - - - 13Assets held for sale - - - - - - - - -Disposals (62) - (45) (79) (154) (13) (9) (4) (366)Translation differences (125) (46) (8) (93) (29) (7) (1) (33) (342)
31 December 2018 12,130 6,472 1,455 13,293 2,943 1,027 66 2,713 40,099
Accumulated depreciation and impairment of property, plant and equipment (EUR ‚000):
EUR ‚000 Buildings Plants Leasehold improvements Machinery and equipment Vehicles Furniture and fixtures Other tangibles Tangibles in progress Total1 January 2017 (2,128) - (292) (3,541) (607) (181) (60) - (6,809)Depreciation charge (384) - (131) (1,280) (401) (136) (25) - (2,357)Assets held for sale - - - - - - - - -Disposals 80 - - 22 265 6 1 - 374Impairment - - - - - - - - -Translation differences (120) - (21) (210) (46) (16) (1) - (414)31 December 2017 (2,552) - (444) (5,009) (789) (327) (85) - (9,206)Depreciation charge (458) - (137) (1,602) (483) (175) (21) - (2,876)Assets held for sale - - - - - - - - -Disposals 41 - - 3 122 17 64 - 247Impairment - - - - - - - - -Translation differences 23 - 4 40 8 4 1 - 80
31 December 2018 (2,946) - (577) (6,568) (1,142) (481) (41) - (11,755)
EUR ‚000 Buildings Plants Leasehold improvements Machinery and equipment Vehicles Furniture and fixtures Other tangibles Tangibles in progress TotalNet book value at 1 January 2017 6,847 2,053 437 2,950 1,183 372 39 844 14,725Net book valueat 31 December 2017 8,178 4,080 411 4,655 1,105 461 23 4,625 23,538Net book valueat 31 December 2018 9,184 6,472 878 6,725 1,801 546 25 2,713 28,344
There was not any asset held under finance lease as at 31 December 2018. Land, buildings and gas stations are subject to security of bank loans as at 31 December 2018 in total amount EUR 32,175 thousand (2017: EUR 32,632 thousand).
83 84

EUROWAG ANNUAL REPORT 2018 | FINANCIAL SECTION EUROWAG ANNUAL REPORT 2018 | FINANCIAL SECTION
RIGHT-OF-USE LIABILITIESLiabilities from leases are shown as follows in the balance sheet as at 31 December 2018:
LONG-TERM LEASE LIABILITIES
EUR ‚000 31 December 2018 1 January 2018Long-term lease liabilities 8,338 5,944Short-term lease liabilities 1,448 1,164
Total lease liabilities 9,786 7,108
DISCOUNTED LEASE PAYMENTS TO BE PAIDEUR ‚000 31 December 2018 1 January 2018Within one year 1,448 1,164After one year but not more than five years 5,818 5,067More than five years 2,520 877
Total lease liabilities 9,786 7,108
RECONCILIATION OF LEASE LIABILITIESEUR ´000 Total future leasing installments as at 31 December 2017 8,524Future leasing installments – low-value assets as at 31 December 2017 (178)Future leasing installments – short-term lease as at 31 December 2017 (84)Future leasing installments – assets outside IFRS 16 scope as at 31 December 2017 (202)Effects of discounting as at 31 December 2017 (637)Other (315) Lease liabilities at 1 January 2018 7,108
The lease liabilities were discounted at the borrowing rate as at 1 January 2018. Discount rate was used in range 1,10% – 3,25%.
23. LEASES (GROUP AS A LEASEE)The Group leases several assets including buildings, land and motor vehicles. The average lease term is 5 years. Leases are recognized, measured and presented in line with IFRS 16.
RIGHT-OF-USE ASSETS
EUR ‚000 Right-of-use: Right-of-use: Right-of-use: Right-of-use: Buildings Lands Motor vehicles TotalAs at January 1, 2018 5,987 693 - 6,680Additions 4,549 - 104 4,653Asset retirement obligations - - - -Transfers and reclassifications - - - -Disposals (632) - - (632)FX rates (52) (5) - (57)
As at December 31, 2018 9,852 688 104 10,644
ACCUMULATED DEPRECIATION
EUR ‚000 Right-of-use: Right-of-use: s Right-of-use: Right-of-use: Buildings Land Motor vehicles TotalAs at January 1, 2018 - - - -Charge (1,366) (53) (22) (1,441)Charge from asset retirement obligation - - - -Transfers and reclassifications - - - -Disposals 211 - - 211FX rates 3 - - 3
As at December 31, 2018 (1,152) (53) (22) (1,227)
EUR ‚000 Right-of-use: Right-of-use: Right-of-use: Right-of-use: Buildings Lands Motor vehicles Total Net book value 5,987 693 - 6,680at 1 January 2018 Net book value 8,700 635 82 9,417at 31 December 2018
85 86

EUROWAG ANNUAL REPORT 2018 | FINANCIAL SECTION EUROWAG ANNUAL REPORT 2018 | FINANCIAL SECTION
25. INVENTORIESINVENTORIES (EUR ‘000)
EUR ‚000 31 December 2017 31 December 2017Raw materials (at lower of cost and net realizable value) 721 282Goods (at lower of cost and net realizable value) 3,383 2,286Finished products 125 17
Total 4,229 2,585
During the year ended 31 December 2018 was recognized allowance for inventories in total amount of EUR 2 thousand. During the year ended 31 December 2017 there was recognized allowance for inventories in total amount of EUR 38 thousand.
26. TRADE AND OTHER RECEIVABLES
EUR ‚000 31 December 2018 31 December 2017Trade receivables 135,742 105,478Receivables from tax authorities 4,740 2,932Advances granted 4,930 4,316Unbilled revenue 2,588 1,605Miscellaneous receivables 15,439 14,775Prepaid expenses and accrued income 1,766 1,006
Total 165,205 130,112
Trade receivables are non-interest bearing and are generally payable on terms from 30 to 45 days. Trade and other receivables are non-derivative financial assets carried at amortized cost.
Miscellaneous receivables as at 31 December 2018 and 2017 include mainly receivables from foreign tax authorities and from financing of tax refunds to customers until processing of the application for tax refund by EU tax authorities.
Receivables are subject to security of bank loans as at 31 December 2018 in total amount EUR 79,302 thousand (2017: EUR 52,652 thousand).
LEASES IN THE INCOME STATEMENT
Leases are shown as follows in the income statement for the year 2018:
EUR ‚000 2018Rendering of services Terminated rent 100Materials expense Short-term lease expenses 225Low-value lease expenses 346Variable lease payment expenses 81Other lease expenses (additional costs) 205Depreciation and impairment losses Depreciation of right-of-use assets (1,440)Impairment losses on right-of-use assets -Net finance costs Interest expense on lease liabilities (170)Currency translation gains on lease liabilities 36Currency translation losses on lease liabilities (45)
24. OTHER NON-CURRENT ASSETS
EUR ‚000 31 December 2018 31 December 2017Prepaid expenses and accrued incomes 1,307 1,119Derivative receivable - 125Long-term advances granted 240 227
Total 1,547 1,471
Other non-current assets as at 31 December 2018 and 2017 represent particularly bonuses dependent on project completion, implementation of the acceptance system, licences, software and guarantees, derivative receivable and long-term advances granted.
87 88
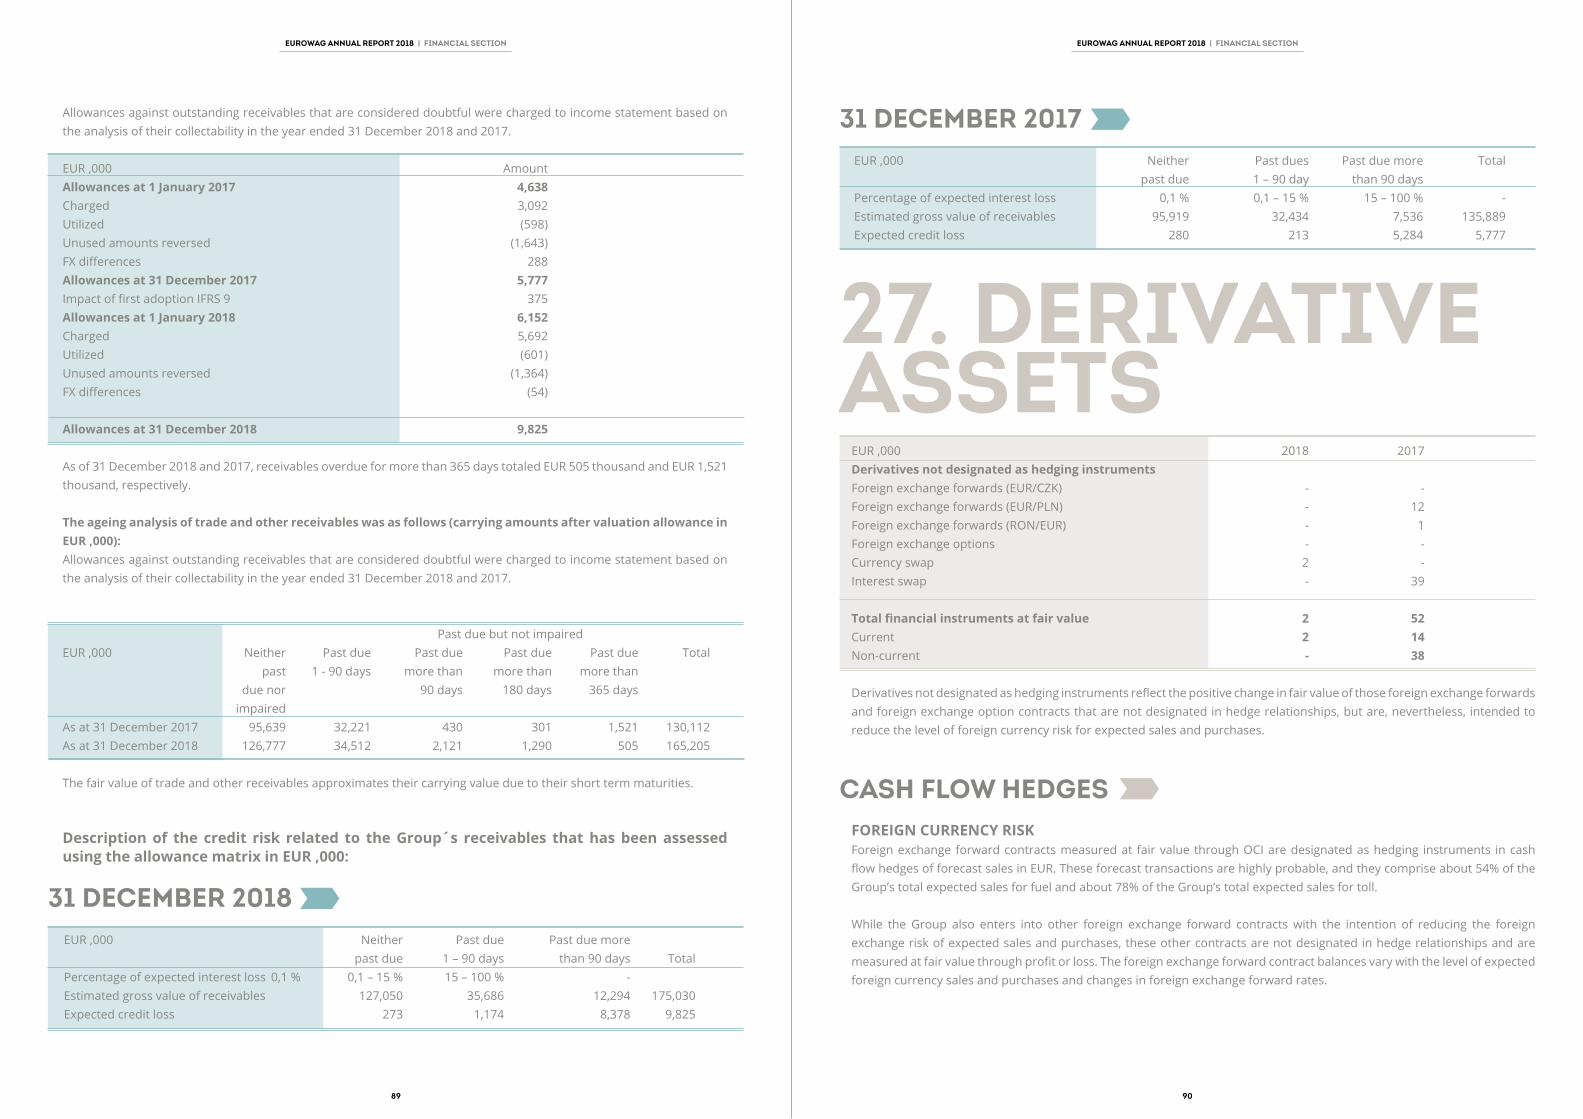
EUROWAG ANNUAL REPORT 2018 | FINANCIAL SECTION EUROWAG ANNUAL REPORT 2018 | FINANCIAL SECTION
31 DECEMBER 2017EUR ‚000 Neither Past dues Past due more Total past due 1 – 90 day than 90 daysPercentage of expected interest loss 0,1 % 0,1 – 15 % 15 – 100 % -Estimated gross value of receivables 95,919 32,434 7,536 135,889Expected credit loss 280 213 5,284 5,777
27. DERIVATIVE ASSETS
EUR ‚000 2018 2017Derivatives not designated as hedging instruments Foreign exchange forwards (EUR/CZK) - -Foreign exchange forwards (EUR/PLN) - 12Foreign exchange forwards (RON/EUR) - 1Foreign exchange options - -Currency swap 2 -Interest swap - 39
Total financial instruments at fair value 2 52Current 2 14Non-current - 38
Derivatives not designated as hedging instruments reflect the positive change in fair value of those foreign exchange forwards and foreign exchange option contracts that are not designated in hedge relationships, but are, nevertheless, intended to reduce the level of foreign currency risk for expected sales and purchases.
CASH FLOW HEDGESFOREIGN CURRENCY RISKForeign exchange forward contracts measured at fair value through OCI are designated as hedging instruments in cash flow hedges of forecast sales in EUR. These forecast transactions are highly probable, and they comprise about 54% of the Group’s total expected sales for fuel and about 78% of the Group’s total expected sales for toll.
While the Group also enters into other foreign exchange forward contracts with the intention of reducing the foreign exchange risk of expected sales and purchases, these other contracts are not designated in hedge relationships and are measured at fair value through profit or loss. The foreign exchange forward contract balances vary with the level of expected foreign currency sales and purchases and changes in foreign exchange forward rates.
Allowances against outstanding receivables that are considered doubtful were charged to income statement based on the analysis of their collectability in the year ended 31 December 2018 and 2017.
EUR ‚000 AmountAllowances at 1 January 2017 4,638Charged 3,092Utilized (598)Unused amounts reversed (1,643)FX differences 288Allowances at 31 December 2017 5,777Impact of first adoption IFRS 9 375Allowances at 1 January 2018 6,152Charged 5,692Utilized (601)Unused amounts reversed (1,364)FX differences (54)
Allowances at 31 December 2018 9,825
As of 31 December 2018 and 2017, receivables overdue for more than 365 days totaled EUR 505 thousand and EUR 1,521 thousand, respectively.
The ageing analysis of trade and other receivables was as follows (carrying amounts after valuation allowance in EUR ‚000):Allowances against outstanding receivables that are considered doubtful were charged to income statement based on the analysis of their collectability in the year ended 31 December 2018 and 2017.
Past due but not impairedEUR ‚000 Neither Past due Past due Past due Past due Total past 1 - 90 days more than more than more than due nor 90 days 180 days 365 days impaired As at 31 December 2017 95,639 32,221 430 301 1,521 130,112As at 31 December 2018 126,777 34,512 2,121 1,290 505 165,205
The fair value of trade and other receivables approximates their carrying value due to their short term maturities.
Description of the credit risk related to the Group´s receivables that has been assessed using the allowance matrix in EUR ‚000:
31 DECEMBER 2018EUR ‚000 Neither Past due Past due more past due 1 – 90 days than 90 days TotalPercentage of expected interest loss 0,1 % 0,1 – 15 % 15 – 100 % -Estimated gross value of receivables 127,050 35,686 12,294 175,030Expected credit loss 273 1,174 8,378 9,825
89 90

EUROWAG ANNUAL REPORT 2018 | FINANCIAL SECTION EUROWAG ANNUAL REPORT 2018 | FINANCIAL SECTION
28. CASH AND CASH EQUIVALENTS
For the purpose of the statement of cash flows, cash and cash equivalents comprise the following (EUR ‚000):
31 December 2018 31 December 2017Cash at banks and on hand 40,805 37,647Short-term deposits - -Cash at banks and short-term depositsattributable to discontinued operations - -Bank overdrafts (28,551) (17,942)Cash and cash equivalents 12,254 19,705
As of 31 December 2018 the Group has bank overdrafts of EUR 9,971 thousand, EUR 7,474 thousand, EUR 265 thousand, EUR 10,005 thousand, and EUR 835 thousand (CZK 21,468 thousand). As of 31 December 2017 the Group has a bank overdraft of EUR 9,986 thousand, EUR 984 thousand and EUR 6,972 thousand (CZK 178,039 thousand).The fair value of cash and cash equivalents approximates their carrying value due to their short term maturities.
29. SHAREHOLDERS’ EQUITY
During the year 2018 and 2017, the Group decided to increase the share capital. The total number of issued shares changed:
2018 2017Priority shares of CZK 50 each - 45Ordinary shares of CZK 1 each 316,137 1,447,204Ordinary shares of CZK 1,000,000 each - 108Ordinary shares of CZK 196,000 each - 1Ordinary shares of CZK 50,000 each - 30Shares with special rights CZK 1 each - 3
EUR ‚000 31 December 2018 31 December 2017Foreign currency forward contracts designed as hedging instruments Fair value 22 492Current 22 405Non-current - 87
The terms of the foreign currency forward contracts match the terms of the expected highly probable forecast transactions. As a result, there is no hedge ineffectiveness to be recognized in the statement of profit or loss. Hedged items are incoming payments in EUR from sale of fuel and toll and procurement of tax refunds from payments placed in foreign countries. Hedged item is not total amount of expenses but only proportional part which is not covered by revenues in EUR. Transaction represents hedging of revenues incurred in EUR which are not covered by expenses paid in EUR.
Total volume of hedged revenues in 2018 and 2017 was following (in EUR):
EUR ‚000 31 December 2018 31 December 2017Revenues from fuel 420,338 313,912Revenues from toll 8,304 7,067Revenues from refund tax 5,629 -
Total 434,271 320,979
In 2018 Company hedge revenues relating to procurement of tax refunds. In 2017 Company did not hedge revenues relating to procurement of tax refunds.
Hedging is planned as 100% effective because the amount of effect from hedging items in EUR will be equal to the amount of revenues in EUR (hedged items).
HEDGING ITEMSIn 2018 and 2017 Company used following hedging instruments with nominal value:
EUR ‚000 31 December 2018 31 December 2017Foreign forwards 1,314 120Foreign options - 426Loans 47 317Total 1,361 863 Hedging effects to statement of profit and loss in 2018 and 2017 were following:
EUR ‚000 31 December 2018 31 December 2017Foreign forwards 191 226Foreign options - 84Reading of FWDs from 2016 - (30) 191 280Loan 5 milion EUR - 114Loan 10 milion EUR 68 161 68 275Total 259 555
91 92

EUROWAG ANNUAL REPORT 2018 | FINANCIAL SECTION EUROWAG ANNUAL REPORT 2018 | FINANCIAL SECTION
SHARE-BASED PAYMENTSThe Group has share portion scheme under which options to subscribe for the Group’s shares have been granted to certain senior executives.
The share-based payments reserve is used to recognize the value of equity-settled share-based payments provided to employees, including key management personnel, as part of their remuneration. Refer to Note 14 for further details of these plans.
CHANGES IN SHAREHOLDERS’ EQUITYUpon the decision of the regular General Meeting of Shareholders held on 14 June 2018 the Group decided to did not divide the profit to the shareholders and keep the all of profit it in the company in the Retained earnings.
EUR ‚000 Number Share Share Reserve Foreign Cash flow Retained of shares capital premium fund currency hedge earnings translation reserve difference At 1 January 2017 139 4,063 352 399 - - 25,084Increase in share capital 1,447,252 57 1,897 - - - -Foreign exchange translation differences - - - - 1,536 677 -Cash dividends - - - - - - (5,923)Contribution to reserve fund - - - 29 - - (29)Net profit - - - - - - 13,206At 31 December 2017 1,447,391 4,120 2,249 428 1,536 677 32,338Increase in share capital 316,137 12 430 - - - -Foreign exchange translation differences - - - - (177) (1,085) -First adoption of IFRS 9 - - - - - - (375)Cash dividends - - - - - - -Contribution to reserve fund - - - - - - -Net profit - - - - - - 10,887
At 31 December 2018 1,763,528 4,132 2,679 428 1,359 (408) 42,850
Priority shares issued and fully paid
shares EUR ‚000At 1 January 2017 - -Issued on 13 February 2017 18 -Issued on 15 February 2017 27 -At 31 December 2017 45 -At 31 December 2018 45 -
Ordinary shares issued and fully paid
shares EUR ‚000At 1 January 2017 139 4,063Issued on 14 September 2017 964,802 37Issued on 14 December 2017 482,402 20At 31 December 2017 1,447,343 4,120Issued on 5 June 2018 316,137 12At 31 December 2018 1,763,480 4,132
Shares with special rights issued and fully paid
shares EUR ‚000At 1 January 2017 - -Issued on 14 December 2017 3 -At 31 December 2017 3 -At 31 December 2018 3 -
During the year, the authorized share capital was increased by EUR 445 thousand by the issue of 316,137 ordinary shares of CZK 1 each.
Share premium
EUR ‚000At 1 January 2017 352Issuance of share capital 1,878At 31 December 2017 2,230Issuance of share capital 433At 31 December 2018 2,663
During the year, the authorized share premium was increased by EUR 433 thousand by the issue of ordinary shares with the right to participate and vote on the general meeting and entitled to dividend,
93 94
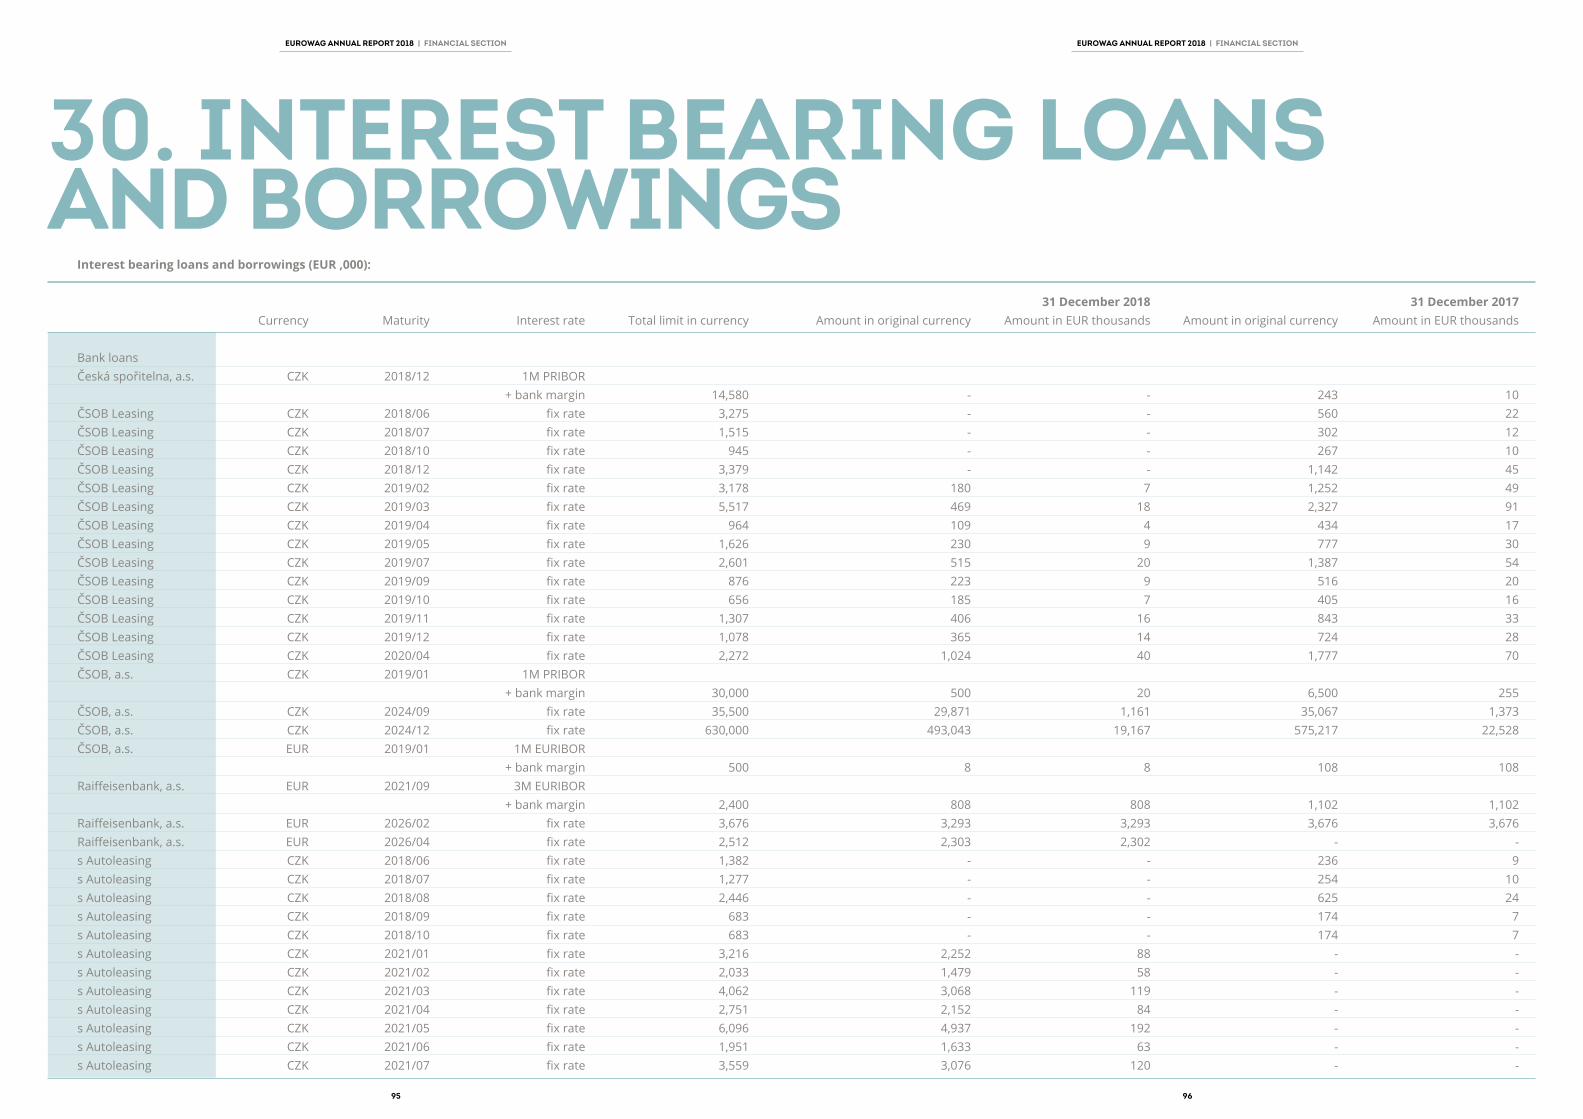
EUROWAG ANNUAL REPORT 2018 | FINANCIAL SECTION EUROWAG ANNUAL REPORT 2018 | FINANCIAL SECTION
30. INTEREST BEARING LOANS AND BORROWINGS
Interest bearing loans and borrowings (EUR ‚000):
31 December 2018 31 December 2017 Currency Maturity Interest rate Total limit in currency Amount in original currency Amount in EUR thousands Amount in original currency Amount in EUR thousands
Bank loans Česká spořitelna, a.s. CZK 2018/12 1M PRIBOR + bank margin 14,580 - - 243 10ČSOB Leasing CZK 2018/06 fix rate 3,275 - - 560 22ČSOB Leasing CZK 2018/07 fix rate 1,515 - - 302 12ČSOB Leasing CZK 2018/10 fix rate 945 - - 267 10ČSOB Leasing CZK 2018/12 fix rate 3,379 - - 1,142 45ČSOB Leasing CZK 2019/02 fix rate 3,178 180 7 1,252 49ČSOB Leasing CZK 2019/03 fix rate 5,517 469 18 2,327 91ČSOB Leasing CZK 2019/04 fix rate 964 109 4 434 17ČSOB Leasing CZK 2019/05 fix rate 1,626 230 9 777 30ČSOB Leasing CZK 2019/07 fix rate 2,601 515 20 1,387 54ČSOB Leasing CZK 2019/09 fix rate 876 223 9 516 20ČSOB Leasing CZK 2019/10 fix rate 656 185 7 405 16ČSOB Leasing CZK 2019/11 fix rate 1,307 406 16 843 33ČSOB Leasing CZK 2019/12 fix rate 1,078 365 14 724 28ČSOB Leasing CZK 2020/04 fix rate 2,272 1,024 40 1,777 70ČSOB, a.s. CZK 2019/01 1M PRIBOR + bank margin 30,000 500 20 6,500 255ČSOB, a.s. CZK 2024/09 fix rate 35,500 29,871 1,161 35,067 1,373ČSOB, a.s. CZK 2024/12 fix rate 630,000 493,043 19,167 575,217 22,528ČSOB, a.s. EUR 2019/01 1M EURIBOR + bank margin 500 8 8 108 108Raiffeisenbank, a.s. EUR 2021/09 3M EURIBOR + bank margin 2,400 808 808 1,102 1,102Raiffeisenbank, a.s. EUR 2026/02 fix rate 3,676 3,293 3,293 3,676 3,676Raiffeisenbank, a.s. EUR 2026/04 fix rate 2,512 2,303 2,302 - -s Autoleasing CZK 2018/06 fix rate 1,382 - - 236 9s Autoleasing CZK 2018/07 fix rate 1,277 - - 254 10s Autoleasing CZK 2018/08 fix rate 2,446 - - 625 24s Autoleasing CZK 2018/09 fix rate 683 - - 174 7s Autoleasing CZK 2018/10 fix rate 683 - - 174 7s Autoleasing CZK 2021/01 fix rate 3,216 2,252 88 - -s Autoleasing CZK 2021/02 fix rate 2,033 1,479 58 - -s Autoleasing CZK 2021/03 fix rate 4,062 3,068 119 - -s Autoleasing CZK 2021/04 fix rate 2,751 2,152 84 - -s Autoleasing CZK 2021/05 fix rate 6,096 4,937 192 - -s Autoleasing CZK 2021/06 fix rate 1,951 1,633 63 - -s Autoleasing CZK 2021/07 fix rate 3,559 3,076 120 - -
95 96

EUROWAG ANNUAL REPORT 2018 | FINANCIAL SECTION EUROWAG ANNUAL REPORT 2018 | FINANCIAL SECTION
The Group does not draw a loan from a non-bank entity. The interest expense relating to bank loans and borrowings for the year ended 31 December 2018 and 2017 was EUR 781 thousand and EUR 389 thousand, respectively.
Interest bearing loans and borrowings are non-derivative financial liabilities carried at amortized cost.As at 31 December 2018, the following pledges have been made to cover the aforementioned loans:
• PLEDGE OF RECEIVABLES (NOTE 26); • PLEDGE OF BANK ACCOUNTS (NOTE 28); • BLANK BILLS OF EXCHANGE ISSUED; • PLEDGE OF REAL ESTATE (NOTE 22); • PLEDGE OF SHARES.
The loan agreements with ČSOB, a.s., Česká spořitelna, a.s., Raiffeisenbank, a.s., Komerční banka, a.s., Všeobecná úverová banka, a.s. and UniCredit bank Czech Rep., a.s. contain covenants that the Group must comply with. As of 31 December 2018 and 31 December 2017 the Group complied with all of these covenants.
The fair value of interest bearing loans and borrowings approximates their carrying value.
Interest bearing loans and borrowings (EUR ‚000):
31 December 2018 31 December 2017 Currency Maturity Interest rate Total limit in currency Amount in original currency Amount in EUR thousands Amount in original currency Amount in EUR thousands
s Autoleasing CZK 2021/10 fix rate 1,952 1,846 72 - -s Autoleasing CZK 2021/12 fix rate 1,422 1,422 55 - -Reiffeisen – Leasing, s.r.o. CZK 2020/04 fix rate 1,341 475 18 812 32ČSOB a.s. Slovensko EUR 2021/12 fix rate 870 407 407 542 542
Overdrafts Komerční banka, a.s. EUR O/N EUR LIBOR + bank margin 9,971 9,971 9,983 9.983Commerzbank EUR O/N EURIBOR + bank margin 7,474 7,474 - -Citi EUR O/N EUR LIBOR + bank margin 265 265 984 984VÚB EUR O/N EURIBOR + bank margin 10,005 10,005 - -ČSOB a.s. CZK O/N EUR LIBOR + bank margin 21,468 835 178,039 6,972
Total EUR - 56,730 - 48,119 Current - 33,673 - 22,929Non-current - 23,057 - 25,190
97 98
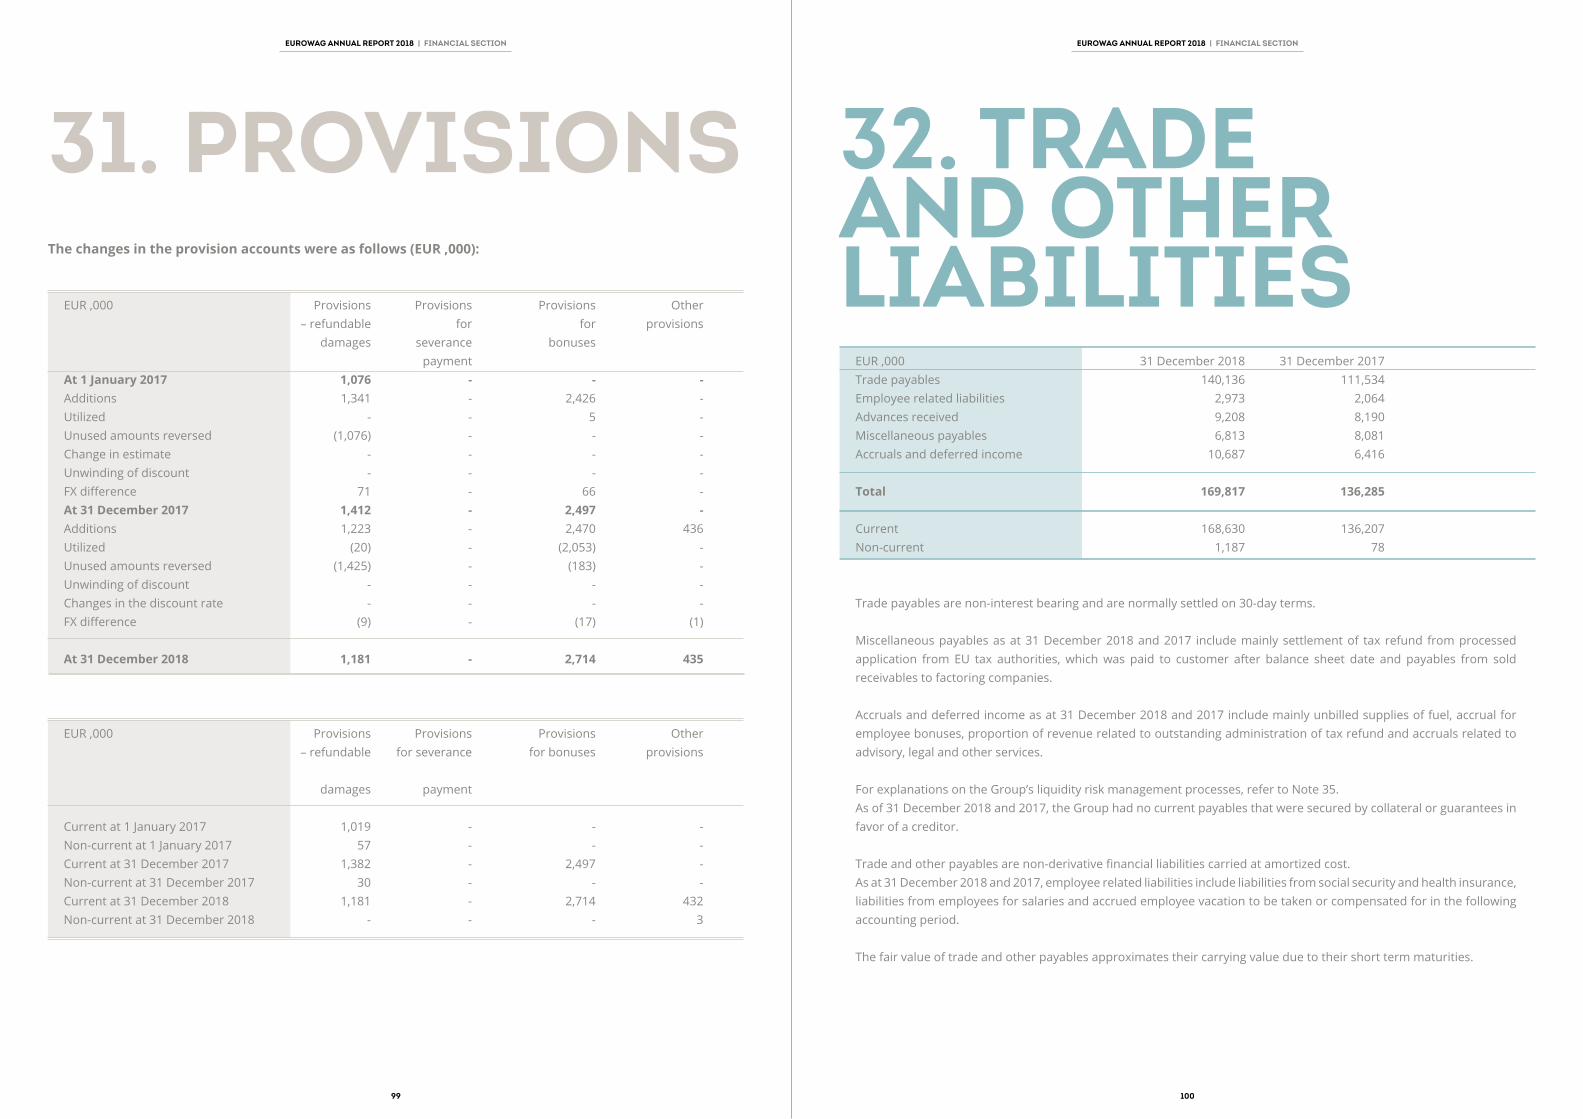
EUROWAG ANNUAL REPORT 2018 | FINANCIAL SECTION EUROWAG ANNUAL REPORT 2018 | FINANCIAL SECTION
32. TRADE AND OTHER LIABILITIES
EUR ‚000 31 December 2018 31 December 2017Trade payables 140,136 111,534Employee related liabilities 2,973 2,064Advances received 9,208 8,190Miscellaneous payables 6,813 8,081Accruals and deferred income 10,687 6,416
Total 169,817 136,285
Current 168,630 136,207Non-current 1,187 78
Trade payables are non-interest bearing and are normally settled on 30-day terms.
Miscellaneous payables as at 31 December 2018 and 2017 include mainly settlement of tax refund from processed application from EU tax authorities, which was paid to customer after balance sheet date and payables from sold receivables to factoring companies.
Accruals and deferred income as at 31 December 2018 and 2017 include mainly unbilled supplies of fuel, accrual for employee bonuses, proportion of revenue related to outstanding administration of tax refund and accruals related to advisory, legal and other services.
For explanations on the Group’s liquidity risk management processes, refer to Note 35.As of 31 December 2018 and 2017, the Group had no current payables that were secured by collateral or guarantees in favor of a creditor.
Trade and other payables are non-derivative financial liabilities carried at amortized cost.As at 31 December 2018 and 2017, employee related liabilities include liabilities from social security and health insurance, liabilities from employees for salaries and accrued employee vacation to be taken or compensated for in the following accounting period.
The fair value of trade and other payables approximates their carrying value due to their short term maturities.
31. PROVISIONSThe changes in the provision accounts were as follows (EUR ‚000):
EUR ‚000 Provisions Provisions Provisions Other – refundable for for provisions damages severance bonuses payment At 1 January 2017 1,076 - - -Additions 1,341 - 2,426 -Utilized - - 5 -Unused amounts reversed (1,076) - - -Change in estimate - - - -Unwinding of discount - - - -FX difference 71 - 66 -At 31 December 2017 1,412 - 2,497 -Additions 1,223 - 2,470 436Utilized (20) - (2,053) -Unused amounts reversed (1,425) - (183) -Unwinding of discount - - - -Changes in the discount rate - - - -FX difference (9) - (17) (1)
At 31 December 2018 1,181 - 2,714 435
EUR ‚000 Provisions Provisions Provisions Other – refundable for severance for bonuses provisions
damages payment
Current at 1 January 2017 1,019 - - -Non-current at 1 January 2017 57 - - -Current at 31 December 2017 1,382 - 2,497 -Non-current at 31 December 2017 30 - - -Current at 31 December 2018 1,181 - 2,714 432Non-current at 31 December 2018 - - - 3
99 100
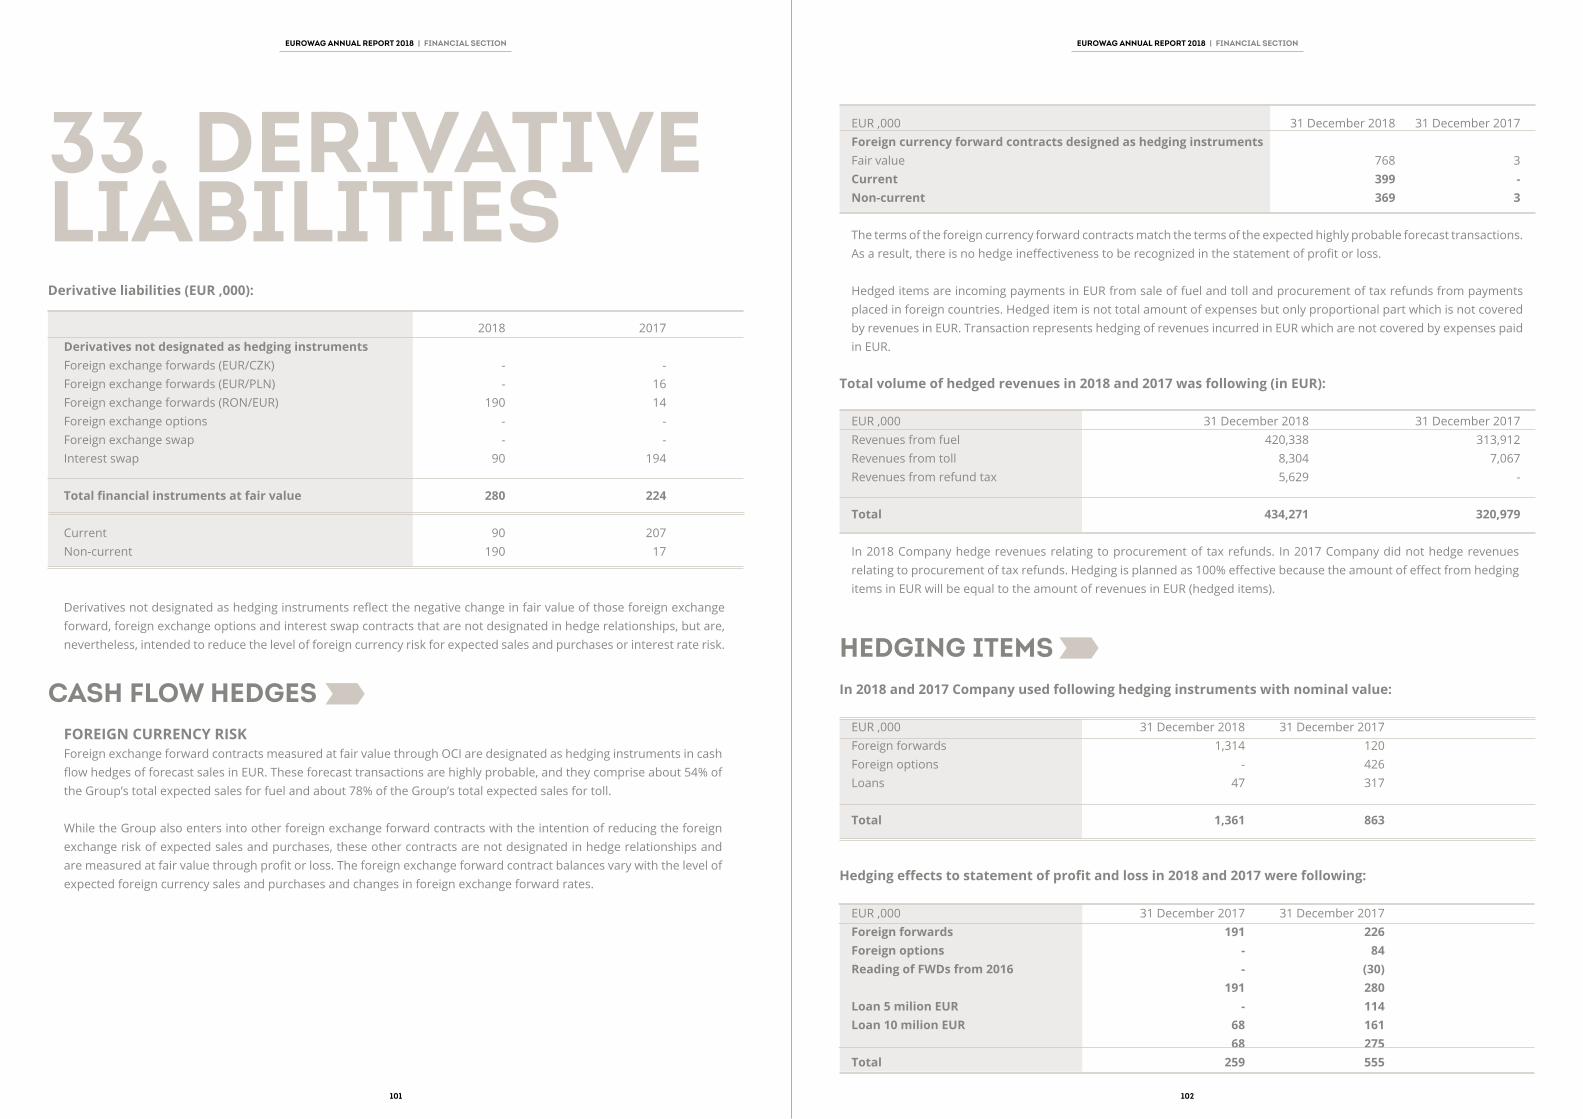
EUROWAG ANNUAL REPORT 2018 | FINANCIAL SECTION EUROWAG ANNUAL REPORT 2018 | FINANCIAL SECTION
EUR ‚000 31 December 2018 31 December 2017Foreign currency forward contracts designed as hedging instruments Fair value 768 3Current 399 -Non-current 369 3
The terms of the foreign currency forward contracts match the terms of the expected highly probable forecast transactions. As a result, there is no hedge ineffectiveness to be recognized in the statement of profit or loss.
Hedged items are incoming payments in EUR from sale of fuel and toll and procurement of tax refunds from payments placed in foreign countries. Hedged item is not total amount of expenses but only proportional part which is not covered by revenues in EUR. Transaction represents hedging of revenues incurred in EUR which are not covered by expenses paid in EUR.
Total volume of hedged revenues in 2018 and 2017 was following (in EUR):
EUR ‚000 31 December 2018 31 December 2017Revenues from fuel 420,338 313,912Revenues from toll 8,304 7,067Revenues from refund tax 5,629 -
Total 434,271 320,979
In 2018 Company hedge revenues relating to procurement of tax refunds. In 2017 Company did not hedge revenues relating to procurement of tax refunds. Hedging is planned as 100% effective because the amount of effect from hedging items in EUR will be equal to the amount of revenues in EUR (hedged items).
HEDGING ITEMSIn 2018 and 2017 Company used following hedging instruments with nominal value:
EUR ‚000 31 December 2018 31 December 2017Foreign forwards 1,314 120Foreign options - 426Loans 47 317
Total 1,361 863
Hedging effects to statement of profit and loss in 2018 and 2017 were following:
EUR ‚000 31 December 2017 31 December 2017Foreign forwards 191 226Foreign options - 84Reading of FWDs from 2016 - (30) 191 280Loan 5 milion EUR - 114Loan 10 milion EUR 68 161 68 275Total 259 555
33. DERIVATIVE LIABILITIESDerivative liabilities (EUR ‚000):
2018 2017Derivatives not designated as hedging instruments Foreign exchange forwards (EUR/CZK) - -Foreign exchange forwards (EUR/PLN) - 16Foreign exchange forwards (RON/EUR) 190 14Foreign exchange options - -Foreign exchange swap - -Interest swap 90 194
Total financial instruments at fair value 280 224
Current 90 207Non-current 190 17
Derivatives not designated as hedging instruments reflect the negative change in fair value of those foreign exchange forward, foreign exchange options and interest swap contracts that are not designated in hedge relationships, but are, nevertheless, intended to reduce the level of foreign currency risk for expected sales and purchases or interest rate risk.
CASH FLOW HEDGESFOREIGN CURRENCY RISKForeign exchange forward contracts measured at fair value through OCI are designated as hedging instruments in cash flow hedges of forecast sales in EUR. These forecast transactions are highly probable, and they comprise about 54% of the Group’s total expected sales for fuel and about 78% of the Group’s total expected sales for toll.
While the Group also enters into other foreign exchange forward contracts with the intention of reducing the foreign exchange risk of expected sales and purchases, these other contracts are not designated in hedge relationships and are measured at fair value through profit or loss. The foreign exchange forward contract balances vary with the level of expected foreign currency sales and purchases and changes in foreign exchange forward rates.
101 102
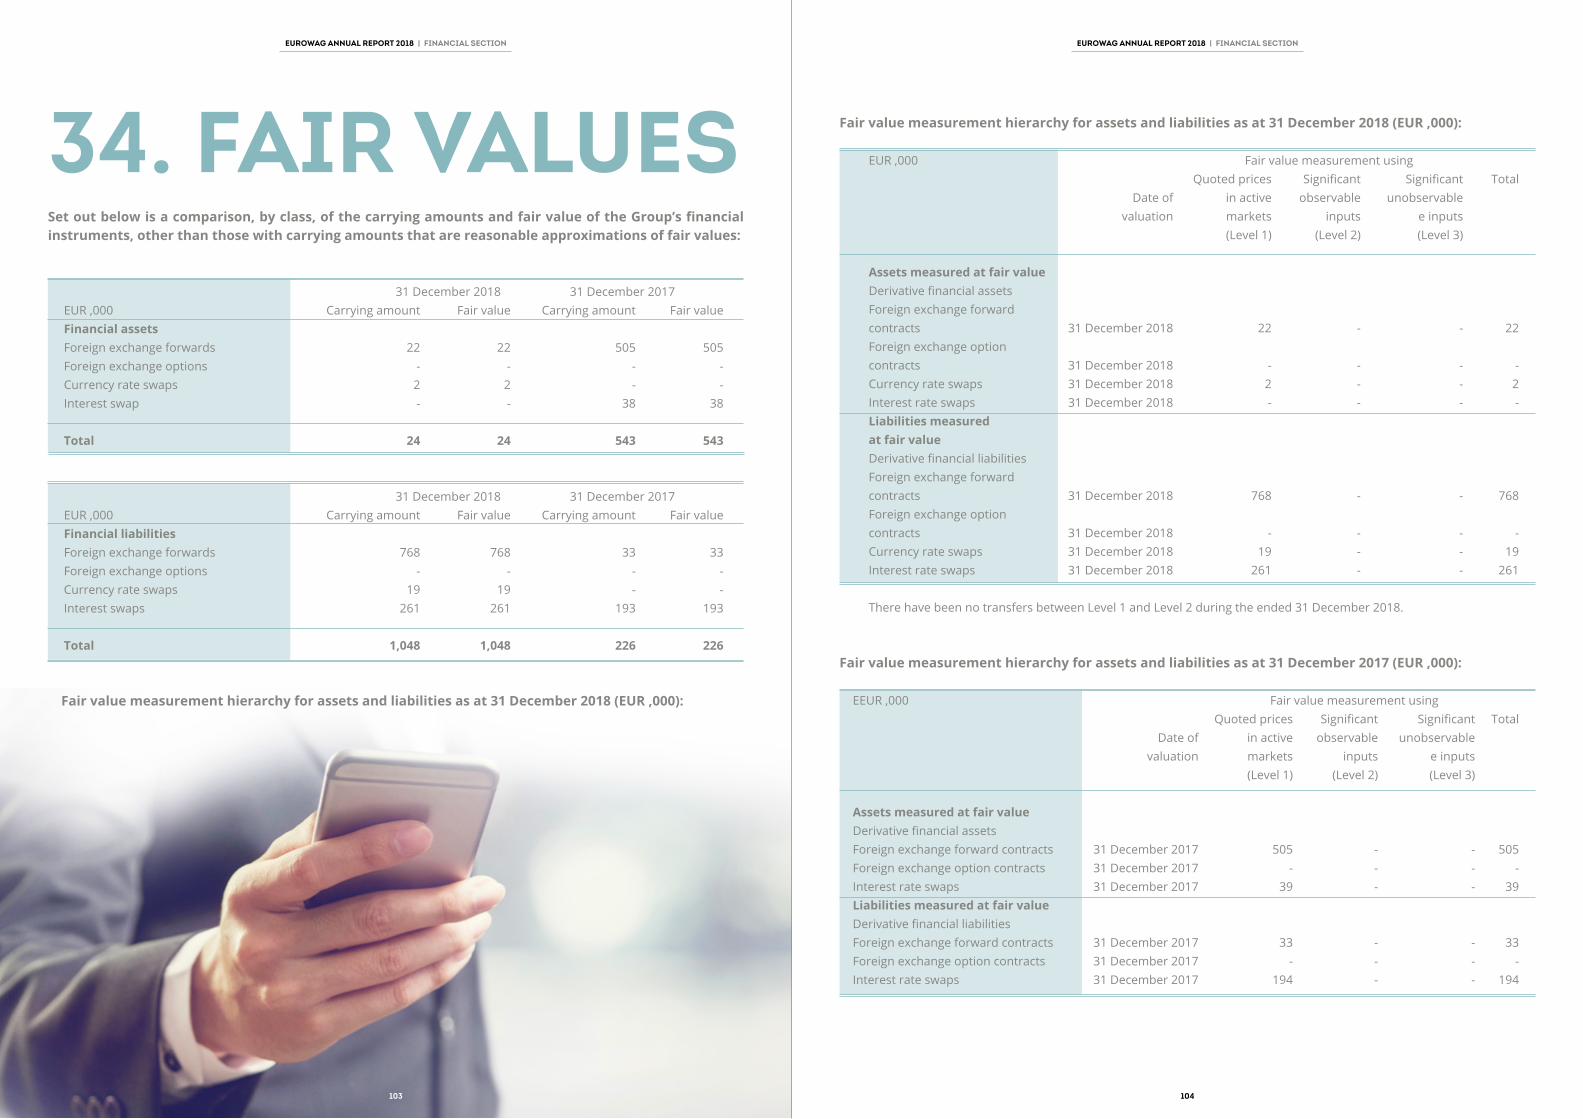
EUROWAG ANNUAL REPORT 2018 | FINANCIAL SECTION EUROWAG ANNUAL REPORT 2018 | FINANCIAL SECTION
Fair value measurement hierarchy for assets and liabilities as at 31 December 2018 (EUR ‚000):
EUR ‚000 Fair value measurement using Quoted prices Significant Significant Total Date of in active observable unobservable valuation markets inputs e inputs (Level 1) (Level 2) (Level 3) Assets measured at fair value Derivative financial assets Foreign exchange forward contracts 31 December 2018 22 - - 22Foreign exchange option contracts 31 December 2018 - - - -Currency rate swaps 31 December 2018 2 - - 2Interest rate swaps 31 December 2018 - - - -Liabilities measured at fair value Derivative financial liabilities Foreign exchange forward contracts 31 December 2018 768 - - 768Foreign exchange option contracts 31 December 2018 - - - -Currency rate swaps 31 December 2018 19 - - 19Interest rate swaps 31 December 2018 261 - - 261
There have been no transfers between Level 1 and Level 2 during the ended 31 December 2018.
Fair value measurement hierarchy for assets and liabilities as at 31 December 2017 (EUR ‚000):
EEUR ‚000 Fair value measurement using Quoted prices Significant Significant Total Date of in active observable unobservable valuation markets inputs e inputs (Level 1) (Level 2) (Level 3)
Assets measured at fair value Derivative financial assets Foreign exchange forward contracts 31 December 2017 505 - - 505Foreign exchange option contracts 31 December 2017 - - - -Interest rate swaps 31 December 2017 39 - - 39Liabilities measured at fair value Derivative financial liabilities Foreign exchange forward contracts 31 December 2017 33 - - 33Foreign exchange option contracts 31 December 2017 - - - -Interest rate swaps 31 December 2017 194 - - 194
34. FAIR VALUESSet out below is a comparison, by class, of the carrying amounts and fair value of the Group’s financial instruments, other than those with carrying amounts that are reasonable approximations of fair values:
31 December 2018 31 December 2017EUR ‚000 Carrying amount Fair value Carrying amount Fair valueFinancial assets Foreign exchange forwards 22 22 505 505Foreign exchange options - - - -Currency rate swaps 2 2 - -Interest swap - - 38 38
Total 24 24 543 543
31 December 2018 31 December 2017
EUR ‚000 Carrying amount Fair value Carrying amount Fair valueFinancial liabilities Foreign exchange forwards 768 768 33 33Foreign exchange options - - - -Currency rate swaps 19 19 - -Interest swaps 261 261 193 193
Total 1,048 1,048 226 226
Fair value measurement hierarchy for assets and liabilities as at 31 December 2018 (EUR ‚000):
104103

EUROWAG ANNUAL REPORT 2018 | FINANCIAL SECTION EUROWAG ANNUAL REPORT 2018 | FINANCIAL SECTION
INTEREST RATE RISKInterest rate risk is the risk that the fair value or future cash flows of a financial instrument will fluctuate because of changes in market interest rates. The Group’s exposure to the risk of changes in market interest rates relates primarily to the Group’s bank loans and borrowings with floating interest rates.
The Group manages its interest rate risk by entering into interest rate swaps, in which it agrees to exchange, at specified intervals, the difference between fixed and variable rate interest amounts calculated by reference to an agreed-upon notional principal amount. At 31 December 2018 and 2017, after taking into account the effect of interest rate swaps, approximately 94% and 93% of the Group’s borrowings are at a fixed rate of interest.
The following table demonstrates the sensitivity to a reasonably possible change in interest rates on that portion of loans and borrowings affected. With all other variables held constant, the Group’s profit before tax is affected through the impact on floating rate borrowings, as follows:
Effect on profit before tax as at 31 December (EUR ‚000):
Base rate % change 2018 20171M PRIBOR +/- 10% 0,24 / (0,24) 0,01 / (0,01)O/N EURIBOR +/- 10% 0,28 / (0,28) -O/N EUR LIBOR +/- 10% 0,44 / (0,44) 0,40 / (0,40)O/N PRIBOR +/- 10% - 0,22 / (0,22)
FOREIGN CURRENCY RISKForeign currency risk is the risk that the fair value or future cash flows of an exposure will fluctuate because of changes in foreign exchange rates. The Group’s exposure to the risk of changes in foreign exchange rates relates primarily to the Group’s operating activities (when revenue or expense is denominated in a foreign currency).
The Group manages its foreign currency risk by using foreign currency forwards, swaps and options.
The Group invoices mainly in EUR and HUF. However, there are transactional currency exposures that arise from sales and purchases also in other currencies, in particular RON, TRY and PLN.
Financial assets and liabilities include cash and cash equivalents, trade and other receivables and interest-bearing loans and borrowings and trade and other payables. All remaining assets and liabilities in foreign currencies are immaterial or not subject to exchange rate exposure (such as property, plant and equipment).
The table below presents the sensitivity of the profit before tax to a hypothetical change in EUR, HUF, PLN, RON, TRY and other currencies and the impact on financial assets and liabilities of the Group. The sensitivity analysis is prepared allounder the assumption that the other variables are constant.
There have been no transfers between Level 1 and Level 2 during the year ended 31 December 2017.The management assessed that the fair values of cash and cash equivalents, trade and other receivables, trade and other payables and interest-bearing loans and borrowings approximates their carrying amounts largely due to the short-term maturities of these instruments.
The fair value of the financial assets and liabilities is included at the amount at which the instrument could be exchanged in a current transaction between willing parties, other than in a forced or liquidation sale.
35. FINANCIAL RISK MANAGEMENT
The Group’s classes of financial instruments correspond with the line items presented in the consolidated statement of financial position.
The Group’s principal financial liabilities, other than derivatives, comprise loans and borrowings, and trade and other payables. The main purpose of these financial liabilities is to finance the Group’s operations. The Group’s principal financial assets include trade and other receivables, and cash and cash equivalents that derive directly from its operations. The Group also enters into derivative transactions.
The Group is exposed to market risk, credit risk and liquidity risk. The management of the Group identifies the financial risks that may have adverse impact on the business objectives and through active risk management reduces these risks to an acceptable level.
MARKET RISKMarket risk is the risk that the fair value of future cash flows of a financial instrument will fluctuate because of changes in market prices. Market risk comprises two types of risk: interest rate risk and currency risk.
The sensitivity analyses in the following sections relate to the position as at 31 December 2018 and 2017.
The sensitivity analyses have been prepared on the basis that the amount of net debt, the ratio of fixed to floating interest rates of the debt and derivatives and the proportion of financial instruments in foreign currencies are all constant.The analyses exclude the impact of movements in market variables on: provisions; and the non-financial assets and liabilities of foreign operations.
The following assumptions have been made in calculating the sensitivity analyses:
• The sensitivity of the relevant statement of profit or loss item is the effect of the assumed changes in respective market risks. This is based on the financial assets and financial liabilities held at 31 December 2018 and 2017.
105 106

EUROWAG ANNUAL REPORT 2018 | FINANCIAL SECTION EUROWAG ANNUAL REPORT 2018 | FINANCIAL SECTION
31 December 2017 On demand Less than 3 to 1 to More than 3 months 12 months 5 years 5 years TotalInterest-bearing loans and borrowings - 19,328 4,092 21,802 4,389 49,611Trade and other payables - 134,738 1,469 78 - 136,285
Total - 154,066 5,561 21,880 4,389 185,896
36. CAPITAL MANAGEMENT
For the purpose of the Group’s capital management, capital includes issued capital and all other equity reserves attributable to the equity holders of the parent. The primary objective of the Group’s capital management is to maximize the shareholder value.
The Group manages its capital structure and makes adjustments in light of changes in economic conditions and the requirements of the financial covenants. To maintain or adjust the capital structure, the Group may adjust the dividend payment to shareholders, return capital to shareholders or issue new shares. The Group monitors capital using the equity/total assets ratio. The Group’s policy is to keep the equity/total assets ratio between 10% and 30%.
EUR ‚000 31 December 2018 31 December 2017Equity 51,040 41,348Total assets 294,357 231,868Equity ratio (Equity/TA) 17,34 % 17,83 %
In order to achieve this overall objective, the Group’s capital management, amongst other things, aims to ensure that it meets financial covenants attached to the interest-bearing loans and borrowings that define capital structure requirements. Breaches in meeting the financial covenants would permit the bank to immediately call loans and borrowings. There have been no breaches in the financial covenants of any interest-bearing loans and borrowing in the current period.
No changes were made in the objectives, policies or processes for managing capital during the years ended 31 December 2018 and 2017.
Effect of the change in exchange rates between CZK and EUR, HUF, PLN, RON, TRY and other currencies on profit before tax as at 31 December (EUR ‚000):
EUR ´000 % change in rate 2018 2017EUR +/- 10% +/- 1,580 +/- 1,040HUF +/- 10% +/- 404 +/- 166PLN +/- 10% +/- 283 +/- 134RON +/- 10% +/- 133 +/- 78TRY +/- 10% +/- 11 +/- 5Others +/- 10% +/- 291 +/- 221
Effect of the change in exchange rates between EUR and HUF, PLN, RON and other currencies on profit before tax as at 31 December (EUR ‚000):
EUR ´000 % change in rate 2018 2017HUF +/- 10% - +/- 45PLN +/- 10% +/- 1 +/- 12RON +/- 10% - +/- 7Others +/- 10% - -
CREDIT RISKCredit risk is the risk that a counterparty will not meet its obligations under a financial instrument or customer contract, leading to a financial loss. The Group is exposed to credit risk from its operating activities (primarily trade receivables and payables).
The outstanding balances of receivables are monitored on a regular basis, and the aim of management is to minimize exposure of credit risk to single counterparty or group of similar counterparties. As of 31 December 2018 and 2017, there is no significant concentration of credit risk as there were no individually significant customers. The Group did not issue any guarantees or credit derivatives.
The ageing of receivables is regularly monitored by Group management.
LIQUIDITY RISKThe Group performs regular monitoring of its liquidity position to keep sufficient financial resources to settle its liabilities and commitments. As at 31 December 2018 and 2017, the Group’s current ratio (current assets divided by current liabilities) was 1.002 and 1.037, respectively.
The table below summarizes the maturity profile of the Group’s financial liabilities based on contractual undiscounted payments (EUR ‚000):
31 December 2018 On demand Less than 3 to 1 to More than 3 months 12 months 5 years 5 years TotalInterest-bearing loans and borrowings - 29,924 4,079 18,773 5,132 57,908Trade and other payables - 167,878 752 1,187 - 169,817
Total - 197,802 4,831 19,960 5,132 227,725
107 108

EUROWAG ANNUAL REPORT 2018 | FINANCIAL SECTION EUROWAG ANNUAL REPORT 2018 | FINANCIAL SECTION
On 1 January 2019, a spin-off by merger took place between HI Software Development s.r.o. as the company being divided on one hand and Princip a.s. as the acquiring company on the other hand. The company being divided has not been dissolved. Instead, an allocated part of assets of HI Software Development s.r.o. has been transferred.
As of the merger on 1 January 2019, HI Software Development, s.r.o. has ceased conducting business and all of its receivables and payables have been transferred to Princip, a.s. which became a legal successor of HI Software Development s.r.o. As a result of this legal succession, Princip, a.s. entered into all contractual relationships and other rights and obligations of HI Software Development, s.r.o. The remaining marginal part of HI Softweare Development, s.ro. will be dissolved and erased from the Commercial Register in the upcoming months.
Prepared on: 13. 6. 2019
Signature of entity’s statutory body:
Person responsible for financial statements:
Person responsible for accounting:
SPIN-OFF BY MERGER OF THE COMPANIES HI SOFTWARE DEVELOPMENT S.R.O. AND PRINCIP A.S.37. RELATED PARTY
DISCLOSURESThe Company provided no loans, credit, security or other benefits in either monetary or in-kind form to persons who are the governing body or to members of governing or other management and supervisory bodies, including former officers and members of those bodies.
Selected employees benefit from the private use of company cars.
38. SUBSEQUENT EVENTSSPANISH GROUP ADS ACQUISITION
At the date 24 January 2019 W.A.G. payment solution, a.s. acquired a majority stake in the Spanish group ADS, a top fuel card operator for CRT in Spain and Portugal which is a next important step that will further fuel our growth, enlarge our pan-Iberian presence and move us closer to the market-leading position in integrated mobility in Europe.
The Group will take control over the 3 branded petrol stations plus multiple bunkering sites as well as a strong portfolio of Portuguese Road Haulage clients representing more than 50% of the market. ADS brand was formed by companies owned by two groups of individuals from Alava region and Salamanca. Alava part‘s history dates back to 2001 while Salamanca‘s part was founded in 1988, both closely cooperated since 2004 and together managed to create a top fuel card brand with line of complimentary services for their road haulage clients. ADS is serving over 4000 customers in Spain and Portugal with significant market share.
SYGIC A.S. ACQUISITIONAt the date 15 April 2019 the Group acquired 70% of the voting shares of Sygic a.s. an unlisted company based in 2004, Slovak Republic. Sygic a.s. is one of the most important and successful mobile application businesses in the world. With 220 employees in 5 locations worldwide including Asia and North America. Company has over 15 years of experience in developing mapping and navigation application, being the number 1 publisher by revenue in Google Play and iOS in the navigation category, with over 200 milions downloads, representing 49% share.
LOAN DRAWDOWN FOR THE SPANISH ACQUISITIONUnder the Bridge Facility Agreement, a drawdown of EUR thousand 47,500 was made on 24 January 2019. It is a term loan with the total limit of EUR thousand 60,000; the funding was provided by Komerční banka, a.s. and Česká spořitelna, a.s. to the entity W.A.G. Mobility Solutions Iberia, S.L.U. The loan drawdown was made for the payment of acquisition of the Spanish ADS Group. The purchase price was paid on 24 January 2019. From the total loan of EUR thousand 60,000, the company made a total drawdown of EUR thousand 47,500. No further drawdown of the remaining available part of the loan will be made.
109 110
EUROWAG ANNUAL REPORT 2018 | INDEPENDENT AUDITOR’S REPORT
TRANSLATION OF A REPORT ORIGINALLY ISSUED IN CZECH - SEE NOTE X TO THE CONSOLIDATED FINANCIAL STATEMENTS.
The Board of Directors is responsible for the preparation and fair presentation of the consolidated financial statements in accordance with International Financial Reporting Standards as adopted by the European Union and for such internal control as the Board of Directors determines is necessary to enable the preparation of consolidated financial statements that are free from material misstatement, whether due to fraud or error.
In preparing the consolidated financial statements, the Board of Directors of W.A.G. payment solutions, a.s., is responsible for assessing the Group’s ability to continue as a going concern, disclosing, as applicable, matters related to going concern and using the going concern basis of accounting unless the Board of Directors of W.A.G. payment solutions, a.s., either intends to liquidate the Group or to cease operations, or has no realistic alternative but to do so.
The Supervisory Board of W.A.G. payment solutions, a.s., is responsible for overseeing the Group’s financial reporting process.
AUDITOR’S RESPONSIBILITIES FOR THE AUDIT OF THE CONSOLIDATED FINANCIAL STATEMENTSOur objectives are to obtain reasonable assurance about whether the consolidated financial statements as a whole are free from material misstatement, whether due to fraud or error, and to issue an auditor’s report that includes our opinion. Reasonable assurance is a high level of assurance, but is not a guarantee that an audit conducted in accordance with above regulations will always detect a material misstatement when it exists. Misstatements can arise from fraud or error and are considered material if, individually or in the aggregate, they could reasonably be expected to influence the economic decisions of users taken on the basis of these consolidated financial statements.
As part of an audit in accordance with the above law or regulation, we exercise professional judgment and maintain professional skepticism throughout the audit. We also:
• Identify and assess the risks of material misstatement of the consolidated financial statements, whether due to fraud or error, design and perform audit procedures responsive to those risks, and obtain audit evidence that is sufficient and appropriate to provide a basis for our opinion. The risk of not detecting a material misstatement resulting from fraud is higher than for one resulting from error, as fraud may involve collusion, forgery, intentional omissions, misrepresentations, or the override of internal control.
• Obtain an understanding of internal control relevant to the audit in order to design audit procedures that are appropriate in the circumstances, but not for the purpose of expressing an opinion on the effectiveness of the Group’s internal control.
• Evaluate the appropriateness of accounting policies used and the reasonableness of accounting estimates and related disclosures made by the Board of Directors of W.A.G. payment solutions, a.s.
• Conclude on the appropriateness of the Board of Directors’ use of the going concern basis of accounting and, based on the audit evidence obtained, whether a material uncertainty exists related to events or conditions that may cast significant doubt on the Group’s ability to continue as a going concern. If we conclude that a material uncertainty exists, we are required to draw
attention in our auditor’s report to the related disclosures in the consolidated financial statements or, if such disclosures are inadequate, to modify our opinion. Our conclusions are based on the audit evidence obtained up to the date of our auditor’s report. However, future events or conditions may cause the Group to cease to continue as a going concern. • Evaluate the overall presentation, structure and content of the
consolidated financial statements, including the disclosures, and whether the consolidated financial statements represent
the underlying transactions and events in a manner that achieves fair presentation.
• Obtain sufficient appropriate audit evidence regarding the financial information of the entities or business activities within the Group to express an opinion on the consolidated financial statements. We are responsible for the direction, supervision and performance of the group audit. We remain solely responsible for our audit opinion.
We communicate with the Board of Directors and the Supervisory Board of W.A.G. payment solutions, a.s., regarding, among other matters, the planned scope and timing of the audit and significant audit findings, including any significant deficiencies in internal control that we identify during our audit.
Ernst & Young Audit, s.r.o. License No. 401
Radek Sumpik, Auditor License No. 2284
13.6. 2019Prague, Czech Republic
EUROWAG ANNUAL REPORT 2018 | INDEPENDENT AUDITOR’S REPORT
INDEPENDENT AUDITOR’S REPORTOPINIONWe have audited the accompanying consolidated financial statements of W.A.G. payment solutions, a. s., and its subsidiaries (hereinafter also the “Group”) prepared in accordance with International Financial Reporting Standards as adopted by the European Union, which comprise the consolidated statement of financial position as at 31 December 2018, and the consolidated statement of comprehensive income, statement of changes in equity and consolidated statement of cash flows for the year then ended, and notes to the consolidated financial statements, including a summary of significant accounting policies and other explanatory information. For details of the Group, see Note 1 to the consolidated financial statements.
In our opinion, the accompanying consolidated financial statements give a true and fair view of the consolidated financial position of W.A.G. payment solutions, a.s., as at 31 December 2018, and of its consolidated financial performance and its consolidated cash flows for the year then ended in accordance with International Financial Reporting Standards as adopted by the European Union.
BASIS FOR OPINIONWe conducted our audit in accordance with the Act on Auditors and Auditing Standards of the Chamber of Auditors of the Czech Republic, which are International Standards on Auditing (ISAs), as amended by the related application clauses. Our responsibilities under this law and regulation are further described in the Auditor’s Responsibilities for the Audit of the Financial Statements section of our report. We are independent of the Group in accordance with the Act on Auditors and the Code of Ethics adopted by the Chamber of Auditors of the Czech Republic and we have fulfilled our other ethical responsibilities in accordance with these requirements. We believe that the audit evidence we have obtained is sufficient and appropriate to provide a basis for our opinion.
OTHER INFORMATIONIn compliance with Section 2(b) of the Act on Auditors, the other information comprises the information included in the
Consolidated Annual Report other than the consolidated financial statements and auditor’s report thereon. The Board of Directors is responsible for the other information.
Our opinion on the consolidated financial statements does not cover the other information. In connection with our audit of the consolidated financial statements, our responsibility is to read the other information and, in doing so, consider whether the other information is materially inconsistent with the consolidated financial statements or our knowledge obtained in the audit or otherwise appears to be materially misstated. In addition, we assess whether the other information has been prepared, in all material respects, in accordance with applicable law or regulation, in particular, whether the other information complies with law or regulation in terms of formal requirements and procedure for preparing the other information in the context of materiality, i.e. whether any non-compliance with these requirements could influence judgments made on the basis of the other information.
Based on the procedures performed, to the extent we are able to assess it, we report that:• The other information describing the facts that are also
presented in the consolidated financial statements is, in all material respects, consistent with the consolidated financial statements; and
• The other information is prepared in compliance with applicable law or regulation.
In addition, our responsibility is to report, based on the knowledge and understanding of the Group obtained in the audit, on whether the other information contains any material misstatement. Based on the procedures we have performed on the other information obtained, we have not identified any material misstatement.
Responsibilities of the Board of Directors and Supervisory Board of W.A.G. payment solutions, a.s., for the Consolidated Financial Statements
TO THE SHAREHOLDERS OF W.A.G. PAYMENT SOLUTIONS, A. S.:
111 112