annual report 2018source: sultanate of oman ministry of oil and gas consession boundaries sultanate...
TRANSCRIPT
Annual Report 2018

ContentsLetter to the shareholders 5Tethys Oil 6Mission, Vision and Values 8Expanding reserve and resource base 9Operations 10Corporate governance report 20Board of Directors 26Executive management 28The Tethys Oil share 29Payments to authorities 32Key financial data 33Definitions and abbreviations 34Administration report 35Financial statements for the group 42Financial statements for the parent company 46Notes 50Assurance 63Auditor’s report 64Financial information 67Address 68
Annual General MeetingThe Annual General Meeting will be held on 15 May 2019, 3:00 p.m. at Grand Hôtel, Södra Blasie-holmshamnen 8, in Stockholm. To attend the AGM, please visit Tethys Oil’s website, www.tethysoil.com, for more information.
The Sustainability Report has been moved to a sep-arate document, available on www.tethysoil.com.

Another successful year for Tethys Oil
Prod.= Production Add. = Additions
mmbo
0
5
10
15
20
25
30
35
40
-2.8
7.9 -3.5
6.3 -4.4
6.3
20.0
Possible
Probable
Proven
25.9
Possible
Probable
Proven
27.9
Possible
Probable
Proven
29.7
Possible
Probable
Proven
-4.4
7.1 32.4
Possible
Probable
Proven
-4.3
7.8 35.9
Possible
Probable
Proven
Add.Prod.Add.Prod.Add.Prod.Add.Prod.Add.Prod. 3P 20183P 20173P 20163P 20153P 20143P 2013
Prod.
Prod.
Prod.
Prod.
Prod.
Add.
Add.
Add.Add.
Add.
Reserves
Contingent resourcesTotal 31 December 2018
0
5
10
15
20
25
3C2C1C
mmbo
• Successful appraisal of Tethys Oil’s contingent resources
• Record financial results in 2018 with a record distribution proposal to shareholders
• Excellent continuation of the 2P reserves replacement ratio – 177 percent in 2018. Seventh consecutive year of increasing 2P reserves
50
100
150
200
2014 2015 2016 2017 2018
Reserve replacement ratio, %
44
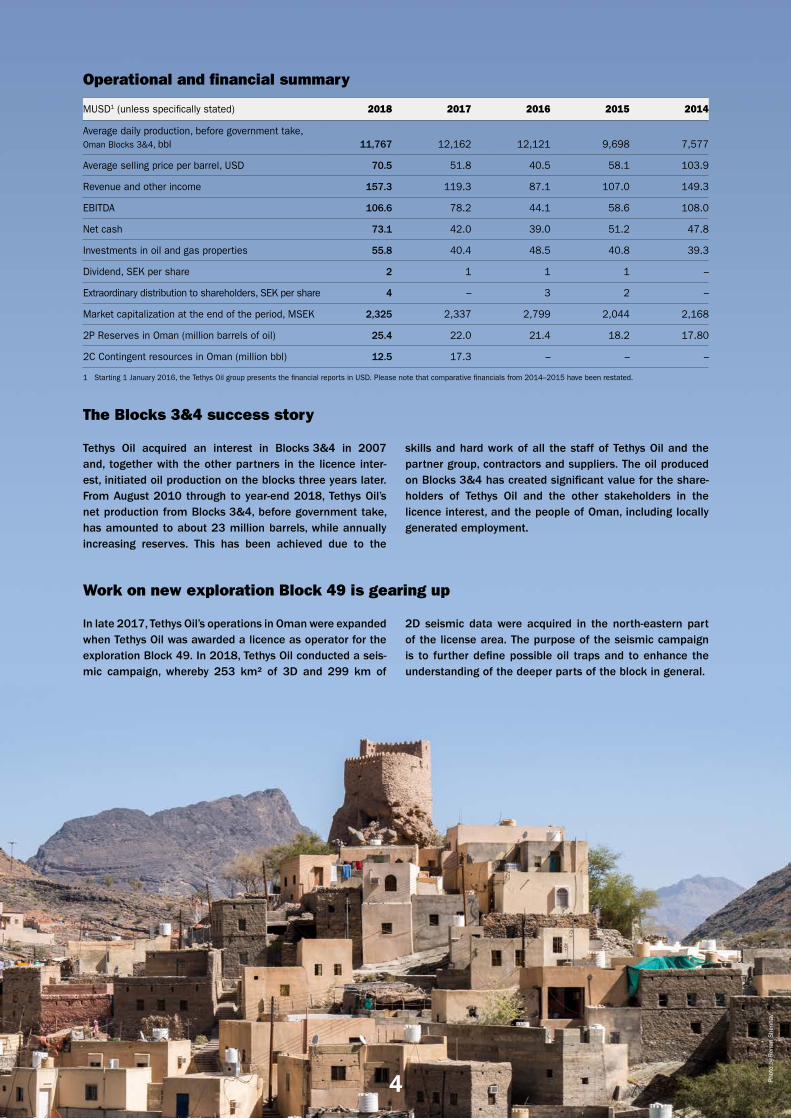
Tethys Oil acquired an interest in Blocks 3&4 in 2007 and, together with the other partners in the licence inter-est, initiated oil production on the blocks three years later. From August 2010 through to year-end 2018, Tethys Oil’s net production from Blocks 3&4, before government take, has amounted to about 23 million barrels, while annually increasing reserves. This has been achieved due to the
skills and hard work of all the staff of Tethys Oil and the partner group, contractors and suppliers. The oil produced on Blocks 3&4 has created significant value for the share-holders of Tethys Oil and the other stakeholders in the licence interest, and the people of Oman, including locally generated employment.
Operational and financial summary
MUSD1 (unless specifically stated) 2018 2017 2016 2015 2014
Average daily production, before government take, Oman Blocks 3&4, bbl 11,767 12,162 12,121 9,698 7,577
Average selling price per barrel, USD 70.5 51.8 40.5 58.1 103.9
Revenue and other income 157.3 119.3 87.1 107.0 149.3
EBITDA 106.6 78.2 44.1 58.6 108.0
Net cash 73.1 42.0 39.0 51.2 47.8
Investments in oil and gas properties 55.8 40.4 48.5 40.8 39.3
Dividend, SEK per share 2 1 1 1 –
Extraordinary distribution to shareholders, SEK per share 4 – 3 2 –
Market capitalization at the end of the period, MSEK 2,325 2,337 2,799 2,044 2,168
2P Reserves in Oman (million barrels of oil) 25.4 22.0 21.4 18.2 17.80
2C Contingent resources in Oman (million bbl) 12.5 17.3 – – –
1 Starting 1 January 2016, the Tethys Oil group presents the financial reports in USD. Please note that comparative financials from 2014–2015 have been restated.
The Blocks 3&4 success story
Work on new exploration Block 49 is gearing up
In late 2017, Tethys Oil’s operations in Oman were expanded when Tethys Oil was awarded a licence as operator for the exploration Block 49. In 2018, Tethys Oil conducted a seis-mic campaign, whereby 253 km² of 3D and 299 km of
2D seismic data were acquired in the north-eastern part of the license area. The purpose of the seismic campaign is to further define possible oil traps and to enhance the understanding of the deeper parts of the block in general.
Phot
o by

5
Letter to the shareholdersDear friends and investors,We are delighted to report record financial results for the full year 2018. Our revenues and other income increased 32 percent to MUSD 157.3 and our EBITDA increased 36 percent and amounted to MUSD 106.6. We are equally delighted to report a 2P reserve replacement ratio of 177 percent for 2018 – the highest for three years and the seventh consecutive year of increasing our 2P reserves. So our main asset, Blocks 3&4 onshore Oman certainly continues to con-firm its growth potential!
We generated a substantial amount of cash last year enabling us to increase our distri-bution to shareholders to about MUSD 30. Cash generation remains strong and our balance sheet continues to be among the strongest of comparable companies. With no debt and still a substantial amount of cash, we are in strong position to expand our project portfolio.
An important part of the 2018 work pro-gramme on Blocks 3&4 has been the appraisal and development of the significant three discoveries that were made in 2017. The Ulfa, Erfan and Samha fields, as the discoveries now are called, have contributed materially to our reserves and production.
Production in 2018 was very stable and aver-aged 11,767 bopd. For 2019 we expect aver-age production to increase and have guided for an average between 12–13 000 bopd for the year. Our average selling price contin-ued to increase throughout the year, and averaged at USD 70.5 per barrel in 2018, a level we haven’t seen since 2014.
In 2018, we produced 4.3 million bar-rels and we added 7.6 million barrels of 2P reserves. The additions and revisions include maturation of contingent resources to reserves and upside revisions of the Farha South, Shahd and Erfan fields.
Appraisal and development of the Ulfa, Samha and Erfan fields will continue in 2019 and with a remaining resource base of 2C contingent resources of 12.5 million bar-rels, we are in a good position to continue to replace and increase our reserves in 2019.
Seismic surveysA significant amount of new seismic data was acquired in 2018 – 2,750 km2 3D seis-mic on Blocks 3&4 and 253 km2 of 3D and 299 km of 2D on Block 49. All new seismic data will guide our exploration drilling on our blocks in the years to come. So 2019 looks like it could be quite an active year from the exploration perspective.
Block 49 We have reprocessed some 1,500 km of vin-tage 2D seismic data, and a number of seis-mic anomalies were identified. This could be possible – primarily stratigraphic – oil traps. After integration of all available data in Tethys Oil’s geological model, the presence of source rock as well as potential reservoir rocks have also been confirmed. Processing of the seismic data acquired late in 2018 is ongoing and the data will be ready for inter-pretation and mapping during 2019.
New venturesIn December 2018, we attempted to increase our presence in Oman further by entering into an agreement to acquire a two percent interest in the Mukhaizna field. Unfortunately, Tethys Oil was informed by the seller that partner pre-emption rights had been exercised, preventing us from completing the transaction. This slight set-back does not, however, diminish our ambi-tion to grow in Oman and elsewhere.
Continued distribution to our shareholdersReflecting the strong operational and financial position of Tethys Oil, the board of directors is proposing an ordinary divi-dend of SEK 2.00 per share. Further, in line with Tethys Oil’s long-term capital structure target, the board of directors is proposing an extraordinary distribution of SEK 6.00 per share.
Looking forwardWe continue to see large possibilities for organic growth on Blocks 3&4. We will con-tinue our appraisal programme on the 2017 discoveries. We still have over 12 million barrels of contingent resources to mature to reserves. We expect the results of three to five exploration wells on Blocks 3&4 and prospect maturation on Block 49 will get seriously under way. Not to mention any-thing else that may come our way.
We expect our investments in Oman to amount to MUSD 50–55 in 2019, the bulk of which will be spent on Blocks 3&4.
So stay with us – it will be an exciting year 2019!
Stockholm in April 2019
Magnus NordinManaging Director
6
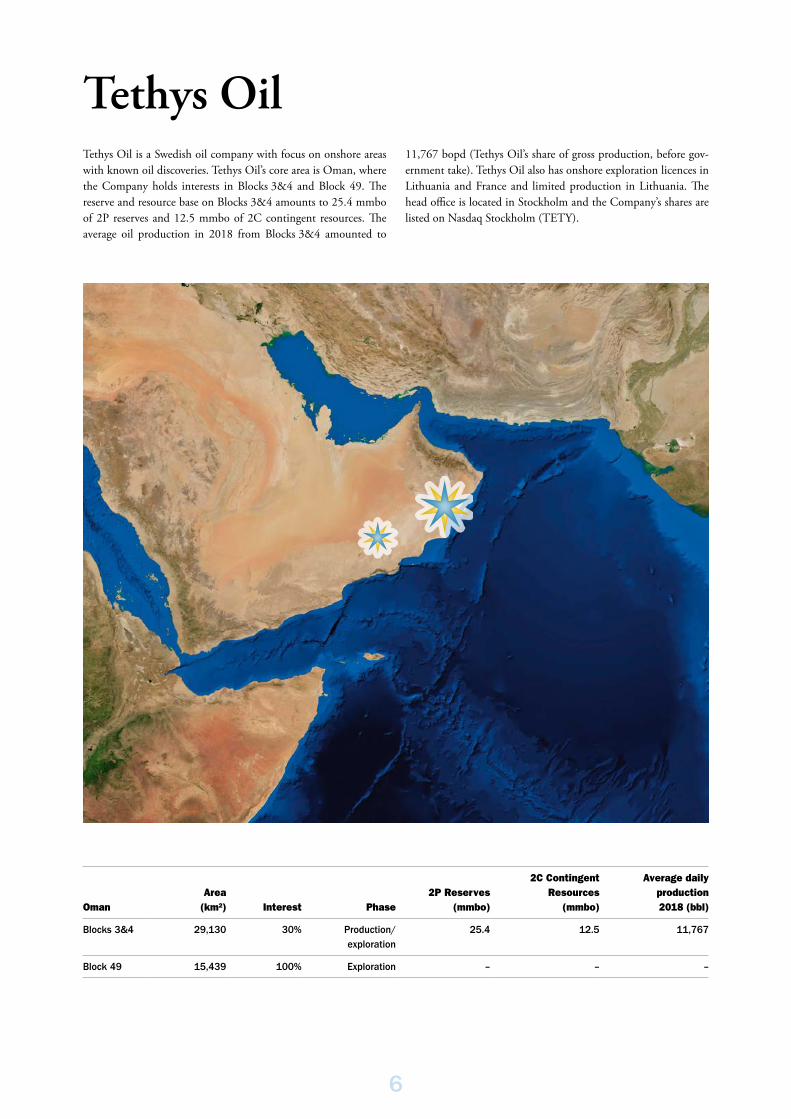
Tethys OilTethys Oil is a Swedish oil company with focus on onshore areas with known oil discoveries. Tethys Oil’s core area is Oman, where the Company holds interests in Blocks 3&4 and Block 49. The reserve and resource base on Blocks 3&4 amounts to 25.4 mmbo of 2P reserves and 12.5 mmbo of 2C contingent resources. The average oil production in 2018 from Blocks 3&4 amounted to
11,767 bopd (Tethys Oil’s share of gross production, before gov-ernment take). Tethys Oil also has onshore exploration licences in Lithuania and France and limited production in Lithuania. The head office is located in Stockholm and the Company’s shares are listed on Nasdaq Stockholm (TETY).
OmanArea
(km²) Interest Phase2P Reserves
(mmbo)
2C Contingent Resources
(mmbo)
Average daily production 2018 (bbl)
Blocks 3&4 29,130 30% Production/exploration
25.4 12.5 11,767
Block 49 15,439 100% Exploration – – –
77
52ENI
6PDO
59Open
41Open
18Open
38Open
42OOCEP
36APEX
43BOpen
4CC Energy
31ARA
51Open
49Tethys Oil
47Open
39Petrotel
55Open
43AOpen
50Masirah Oil Ltd
NLS
66MOL
Open
54Lasso
61BP
56Medco58
Open
40Petrotel
74Open
73Open
7HCF
3CC Energy
72Open
75Open
57Petroleb
9Occidental
62 OilOpen
15HCF
44ARA
30Occidental
48OOCEP
17Petrotel
67Petrotel
62Occidental
60OOCEP
5Daleel
76Open
27Occidental
70Open
VacantOpen
53Occidental
71Open
8MOGC
65Government of Sultanate of Oman
8MOGC
MADHAOpen
77Open
MUSCAT
SALALAH
100 0 100 km50
MUSANDAMمسندم
مدحاء
مسقط
صاللة
Masirah
Juzor ad Daymaniyyat
مصیرة
Juzor al Hallaniyyatجزر الحالنیات
جزر الدیمانیات
Source: Sultanate of Oman Ministry of Oil and Gas
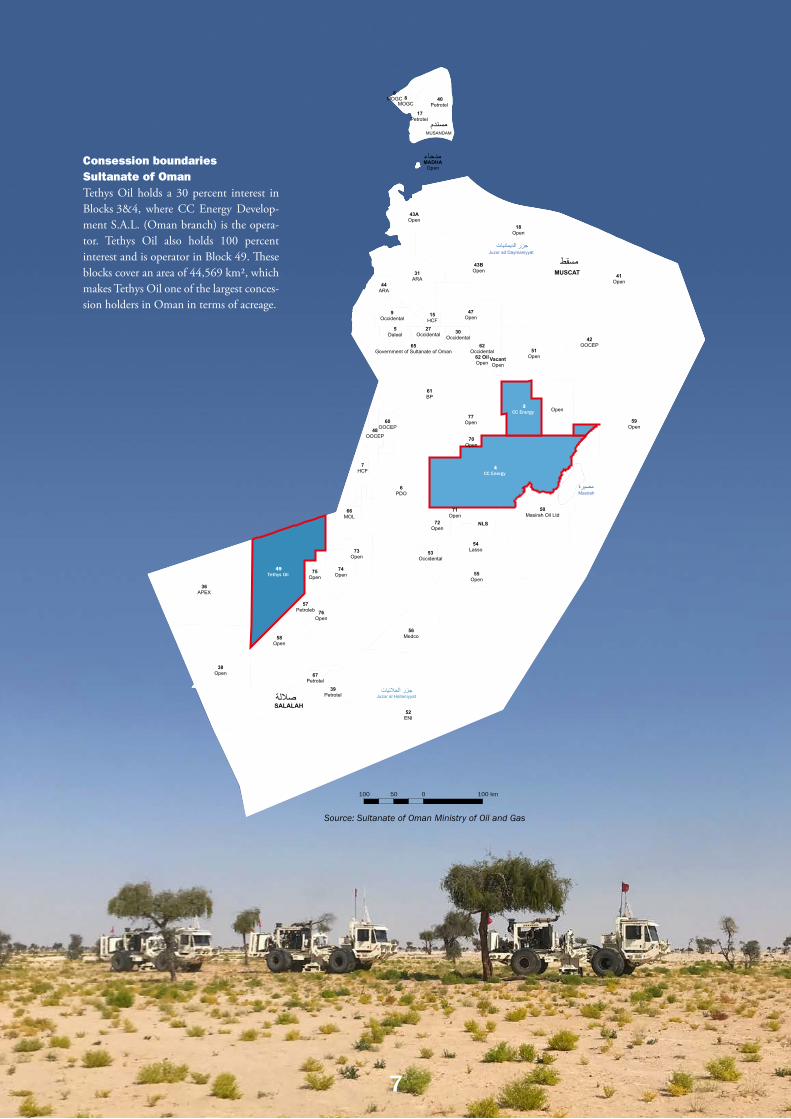
Consession boundaries Sultanate of OmanTethys Oil holds a 30 percent interest in Blocks 3&4, where CC Energy Develop-ment S.A.L. (Oman branch) is the opera-tor. Tethys Oil also holds 100 percent interest and is operator in Block 49. These blocks cover an area of 44,569 km2, which makes Tethys Oil one of the largest conces-sion holders in Oman in terms of acreage.

88
MissionTethys Oil is an oil and gas exploration and production company with a primary objec-tive of creating shareholder value working across the whole upstream industry lifecy-cle of exploration, appraisal, development and production. A central belief in Tethys Oil’s business model is to explore for and produce oil and gas in an economically, socially, and environmentally responsible way. The Group applies the same standards to its activities worldwide to satisfy both its commercial and ethical requirements as per Tethys Oil’s Code of Conduct.
Tethys Oil seeks to be a sustainable and profitable business long-term. Sustain-ability means running a business that is not only profitable but in tune with the requirements and expectations of stake-holders both within and outside the Group.
VisionTethys Oil’s vision is that growth continues through the Group’s exploration success. Tethys Oil seeks to build, maintain and expand a well-balanced and self-financed portfolio of oil assets, offering a measured exposure to onshore production, develop-ment, appraisal and exploration potential. The focus today and tomorrow is on geog-raphies with proven petroleum systems, existing infrastructure, established institu-tional frameworks and low political risk. In all its activities, Tethys Oil seeks a balanced approach to risk.
Tethys Oil will continue to create increased shareholder value with a balanced approach to growth and shareholder distributions, with a long-term capital structure target of a zero net cash position.
ValuesTethys Oil’s corporate culture emanate from the Company’s Scandinavian roots. It is the responsibility of the Tethys Oil’s management to foster a corporate culture that promotes the values and principles outlined in Tethys Oil’s Code of Conduct. Tethys Oil aims to act in all respects in a responsible, fair, accountable and ethical manner towards all aspects of the environ-ment and to all individuals and entities that the Company encounters in its course of doing business. Tethys Oil aims to apply the same standards to all its activities wher-ever they are carried out.
It is of vital importance to Tethys Oil that the Company maintains and further builds on its reputation as a responsible and for-ward-looking corporate citizen in all coun-tries where Tethys Oil has a presence and in relation to all stakeholders, may they be shareholders, employees, contractors, part-ners or someone else.
Mission, Vision and Values
99
Tethys Oil’s net working interest Reserves in Blocks 3&4 Oman as per 31 December 2018 amount to 25,357 thousand barrels of oil (“mbo”) of proven and probable Reserves (2P). The 2P reserve replacement ratio amounts to 177 percent. In addition, Tethys Oil’s net working interest resources oil base in Oman amounts to 12,533 mbo of 2C contingent resources. The Company’s 2018 and 2017 year-end Reserves reports were audited by ERC Equipoise Limited (“ERCE”) as independent qualified Reserves evaluator.
Development of Reserves, Blocks 3&4 (Audited)
mbo 1P 2P 3P
Total 31 December 2017 15,559 22,044 32,414
Production 2018 -4,295 -4,295 -4,295
Additions and revisions 5,471 7,608 7,765
Total 31 December 2018 16,735 25,357 35,884
Reserve replacement ratio, % 127 177 181
Additions and revisions include maturation of over 4 mmbo of contingent resources to Reserves from the ongoing appraisal program of the 2017 discoveries as well as upside revisions of the Reserves on the Farha South, Shahd and Erfan fields and a small amount of Reserves attributable to the Tibyan discovery, the exploration well drilled in 2018.
Based on ERCE’s model, Tethys Oil’s net entitlement Reserves (Reserves after government take) amount to 7,781 mbo of 1P, 10,477 mbo of 2P and 13,824 mbo of 3P.
In addition to Reserves, Tethys Oil also announces contingent resources. The estimated contingent resources are contained in the discoveries made in 2017. Development of the contingent resources is contingent on the results of the on-going appraisal programme and also a work programme and budget to access these resources.
Contingent resources, Blocks 3&4 (Audited)
mbo 1C 2C 3C
Total 31 December 2018 5,472 12,533 24,767
The audit of the Reserves in Oman have been conducted using 2018 Petroleum Resources Management System (PRMS2018), sponsored by the Society of Petroleum Engineers (SPE), World Petroleum Council (WPC), American Association of Petroleum Geologists (AAPG) and Society of Petroleum Evaluation Engi-neers (SPEE).
Expanding reserve and resource base

10
Oman – part of the oil fairwayThe Sultanate of Oman, strategically located in the southeastern part of the Ara-bian Peninsula, overlooks the Arabian Sea, the Sea of Oman and the Arabian Gulf. It also overlooks the strategic Strait of Hor-muz at the point of entry to the Arabian Gulf. Oman’s neighbours include United Arab Emirates, Saudi Arabia and Yemen.
Oman is a beautiful country, combining white sand beaches, rolling desert dunes and expansive mountain ranges. Oman is also the oldest independent state in the Arab world with a long and exciting history over thousands of years. Modern archaeological discoveries suggest that humans settled in Oman during the Stone Age, i.e. more than 10,000 years ago.
Oman as an oil countryMost importantly for Tethys Oil, Oman is also a major oil nation, the largest in the Middle East that is not a member of OPEC. Oman has in excess of five billion barrels of estimated proven oil reserves, ranking Oman as the seventh largest proved oil reserve holder in the Middle East and the 22nd largest in the world (BP
Statistical Review of World Energy, June 2018). Oman’s crude oil and condensate production amounted in 2017 to almost 1 mmbo per day.
The largest producer in Oman is PDO, who holds Block 6. Block 6 covers an area of 90,874 km2 in north, central and south Oman. In 2018, 665,000 barrels of oil and condensate per day were pro-duced by PDO, corresponding to close to 70 percent of the total production in Oman. PDO is owned by the Omani gov-ernment (60 percent), Shell (34 percent), Total (four percent), and Partex (two per-cent). Occidental Petroleum (Oxy), is the second-largest producer in Oman, and produced about 200,000 bopd in 2018. Oxy is producing from Blocks 9, 27 and 62 in northern Oman and the Mukhaizna field in Block 53 in the south.
Tethys Oil in OmanWith the desire and ambition to become a dedicated and successful player in the Omani oil and gas industry, Tethys Oil acquired an interest in the licence for Blocks 3&4 in 2007. The blocks now cover an area of 29,130 km2 in the central-
eastern part of Oman. Tethys Oil, through its wholly owned subsidiary Tethys Oil Block 3 & 4 Ltd, has a 30 percent inter-est in Blocks 3&4. Its partners are Mitsui E&P Middle East B.V. with 20 percent and the operator CC Energy Develop-ment S.A.L. (Oman branch) holding the remaining 50 percent.
In December 2017, Tethys Oil’s opera-tions in Oman expanded when the explo-ration Block 49 was awarded to Tethys Oil as operator. Block 49 covers an area of 15,439 km2 in the southwestern part of Oman, bordering Saudi Arabia. Tethys Oil holds 100 percent of Block 49. The com-bined area of Blocks 3&4 and Block 49 amounts to almost 45,000 km2, one of the largest concession holders in Oman in terms of acreage.
The partner group on Blocks 3&4 pro-duced 39,200 bopd in 2018, correspond-ing to about four percent of Oman’s total production. The produced oil is lifted at the Mina Al Fahal Terminal in Mus-cat, on the Sea of Oman, and it therefore never needs to pass through the Strait of Hormuz.
Phot
o by
Operations
Tethys Oil’s core area Oman

Block 49
1111
Block 3
Block 3
Muscat
Block 4
SULTANATE OF OMAN
Une
arth
ed O
utdo
ors,
LLC
Salalah

Oil producing fault blocks
Oil producing fault blocks with water injection
Drilled fault blocks
Prospective fault blocks
12
The successful exploration and development of Blocks 3&4In 2009, the first commercial oil well was drilled on Block 3&4. The year after, in 2010, an early production system was launched and the oil production on Blocks 3&4 was launched. In 2012, the Field Development Plan was approved and the exploration and production terms for the licence were extended until 2040. Since 2010, Tethys Oil net production, before government take, from Blocks 3&4 has amounted to 23 million barrels of oil.
First oil at Farha SouthThe drilling of the Farha South-3 well on Block 3 in early 2009 was the starting point for the successful exploration and development of Blocks 3&4. Through the Farha South-3 well, the Farha South oil field was discovered, which has been the star performer on the blocks ever since.
Oil on Farha South was originally discov-ered in 1986 by a previous operator, when the Lower Al Bashir sandstone layer flowed oil. With Farha South-3, oil was again found in the Lower Al Bashir layer, but a long-term production test revealed a tight reservoir. The Barik sandstone, at an aver-age depth of 1,600 metres and overlaying the Lower Al Bashir, also had excellent oil shows in the Farha South-3 well. The well was put on long-term production test where the Barik sandstone proved itself to be a reliable producer.
The oil of the Farha South is not trapped in one large continuous reservoir. It is instead trapped in a large number of smaller, usu-ally adjacent fault blocks. The low content of gas combined with the absence of a water drive in the Barik layer make pumps and water injection necessary. Water is injected into the reservoir via injection wells in order to increase the pressure and thereby stimulate production. Almost 30 fault blocks have been drilled and put in production. The major part of the field has been developed with water injection. The oil from the Barik layer is of high quality, more than 40 degrees API, and contains very limited sulphur.
Second early discoveryShortly after the Farha South-3 well, the Saiwan East-2 was drilled, marking another successful well. At the Saiwan oil
field, the oil is produced from the Khufai carbonate at depths ranging from 1,700 to 2,400 metres. This reservoir was previously unknown as an oil producer in Oman. The oil from the Khufai layer holds a quality of approximately 32 degrees API.
Large quantities of oil with different gravi-ties and viscosities, including heavy oil, have also been found in different forma-tions on the field. Any potential produc-tion from the heavy oil in Saiwan East will require enhanced oil recovery techniques.
The Shahd fieldThe Shahd field was discovered in 2013 in a previously unexplored area through exploration on the Shahd B structure. At the Shahd area, oil is mainly extracted from
the Lower Buah carbonate at 2,000 metres but also from the Khufai carbonate and the Lower al Bashir sandstone.
The oil from the Lower Buah layer holds a quality of approximately 38 degrees API. Like the Farha South field, this area is also highly faulted and the Lower Buah layer in the field is not one large continu-ous reservoir. The oil is instead trapped in separate structures. Eight structures have been put into production. Like the Farha South field, water injection is required on the Shahd oil field in order to reach a good recovery rate.
Infrastructure developmentFull production facilities have been con-structed both on the Farha South field and on Saiwan East field. At these facilities, reservoir fluids are being processed in sepa-rators and heater treaters to remove water, gas and impurities in order to make the oil ready for export. The facilities also include large storage tanks, different pumps and other necessary infrastructure, including field camps for the oil field workers.
In addition, early production facilities (EPF) has been constructed on Shahd and on Ulfa fields. An EPF is a smaller production facil-ity, which, to some extent rely on the infra-structure on the Farha South and Saiwan East fields. However, also at an EPF, the oil can be processed to be ready for export.

Ulfa-1
Ulfa-4
Ulfa-5Ulfa-6
Ulfa-2
Ulfa-3
Samha-1 Samha-2Samha-3
Erfan-4
Erfan-1
Erfan-3
Erfan-2
BLOCK 3
BLOCK 3
BLOCK 4
Saiwan
Shahd HShahd I
Shahd B(D & F)
Farha
50 km
25 km
23 km
83 km
12 km
37 km
Ulfa EPF
Erfan
Saiwan station
Alam Station &Pipeline System
BLOCK 3
BLOCK 3
BLOCK 4
Saiwan
Shahd HShahd I
Shahd B(D & F)
Farha
50 km
25 km
23 km
83 km
12 km
37 km
Ulfa EPF
Erfan
Saiwan station
N
Export quality
Unprocessed
13
All production is transported through pipe-lines to the main exporting point at the Sai-wan East facility. From Saiwan East, the oil is pumped through an 83 km long 16 inch pipe-line to Alam Station just west of Blocks 3&4, for further transportation through the national pipeline system to the export port in Muscat, the Mina Al Fahal Terminal.
The new fieldsAfter some years with focus on develop-ment activities aiming at increasing pro-duction, a number of exploration wells were drilled in 2017, which resulted in the discovery of significant amounts of oil in three new structures near the existing pro-ducing areas on Blocks 3&4 – the Erfan, Ulfa and Samha discoveries.
The Erfan field was discovered in the first quarter 2017. It was drilled some 6 km
southwest of the Saiwan East field on Block 4 and flowed oil to surface from the Khufai formation. The discovery has been further appraised by two successful appraisal wells in 2017 and one in 2018. Erfan is producing from the Khufai car-bonate formation, at depths ranging from 1,700 to 2,400 metres, which is the same producing formation as in neighbouring Saiwan East field.
The Ulfa field was discovered in the sec-ond quarter 2017. Ulfa-1 was drilled on a
structure located on trend with the Farha South field on Block 3 and flowed oil to surface from the Khufai formation. The appraisal of the field started in 2018, and five appraisal wells were drilled and com-pleted by year-end. Both the Buah and the Khufai reservoir sections are being appraised, although the main present pro-ducer in the field is the Khufai carbonate formation.
The Samha field was discovered in the fourth quarter 2017. Samha-1 was drilled on a structure located five km south of the Ulfa discovery on Block 3 and flowed oil to surface from the Khufai and Buah forma-tions. The Samha field has been appraised by two further wells in 2018.
Some oil from these discoveries was added to the reserves in the 2017 year-end reserve report, but most of the oil was added to contingent resources. The appraisal of these discoveries has been a major part of the 2018 work programme, and will con-tinue to be so in 2019 with the aim to con-tinue to mature the resources into reserves.
Late in 2018, the construction of the Ulfa EPF was finalised and the facility was in full production towards the very end of the year. The EPF includes separators, heater treaters and pipelines. Following the com-missioning of the EPF, wells on Ulfa and Samha were connected to Ulfa EPF and put into production. The Erfan, Ulfa and Samha discoveries are all undergoing long-term production tests.
Gharif
Ghudun
BarikAl BashirMiqrat
Amin
Buah
Shuram
KhufaiMasirah Bay
1414
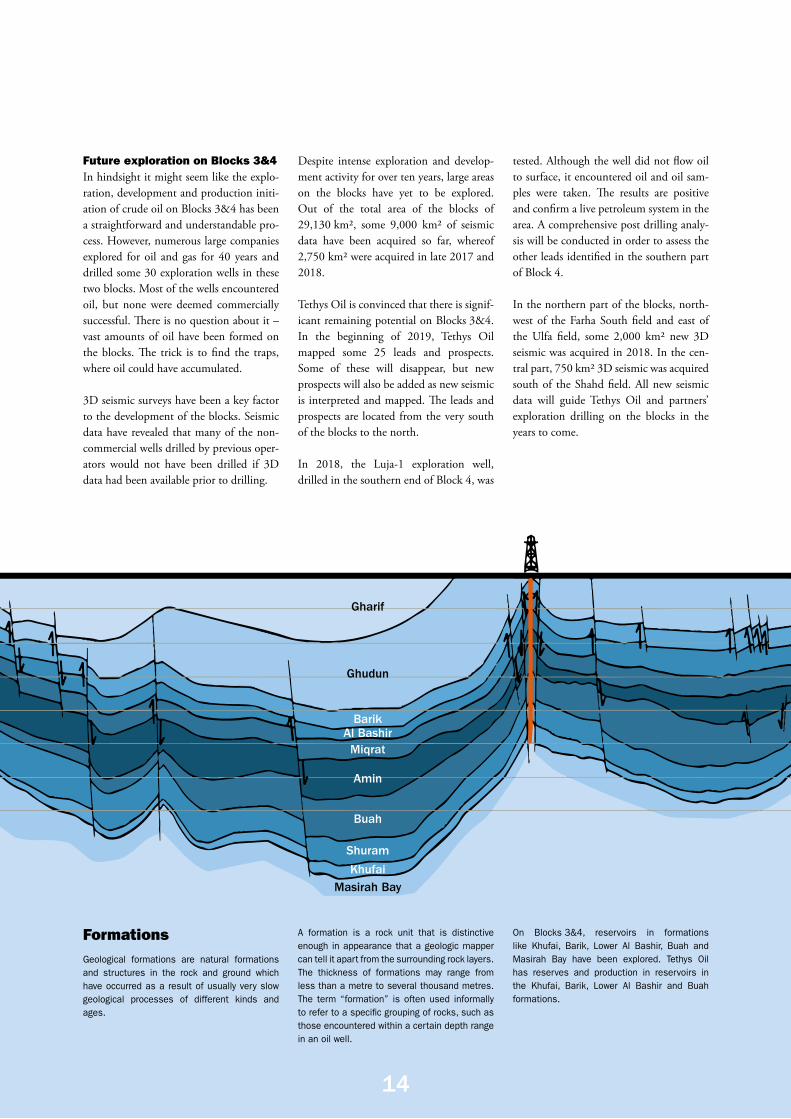
Future exploration on Blocks 3&4In hindsight it might seem like the explo-ration, development and production initi-ation of crude oil on Blocks 3&4 has been a straightforward and understandable pro-cess. However, numerous large companies explored for oil and gas for 40 years and drilled some 30 exploration wells in these two blocks. Most of the wells encountered oil, but none were deemed commercially successful. There is no question about it – vast amounts of oil have been formed on the blocks. The trick is to find the traps, where oil could have accumulated.
3D seismic surveys have been a key factor to the development of the blocks. Seismic data have revealed that many of the non-commercial wells drilled by previous oper-ators would not have been drilled if 3D data had been available prior to drilling.
Despite intense exploration and develop-ment activity for over ten years, large areas on the blocks have yet to be explored. Out of the total area of the blocks of 29,130 km2, some 9,000 km2 of seismic data have been acquired so far, whereof 2,750 km2 were acquired in late 2017 and 2018.
Tethys Oil is convinced that there is signif-icant remaining potential on Blocks 3&4. In the beginning of 2019, Tethys Oil mapped some 25 leads and prospects. Some of these will disappear, but new prospects will also be added as new seismic is interpreted and mapped. The leads and prospects are located from the very south of the blocks to the north.
In 2018, the Luja-1 exploration well, drilled in the southern end of Block 4, was
tested. Although the well did not flow oil to surface, it encountered oil and oil sam-ples were taken. The results are positive and confirm a live petroleum system in the area. A comprehensive post drilling analy-sis will be conducted in order to assess the other leads identified in the southern part of Block 4.
In the northern part of the blocks, north-west of the Farha South field and east of the Ulfa field, some 2,000 km2 new 3D seismic was acquired in 2018. In the cen-tral part, 750 km2 3D seismic was acquired south of the Shahd field. All new seismic data will guide Tethys Oil and partners’ exploration drilling on the blocks in the years to come.
FormationsGeological formations are natural formations and structures in the rock and ground which have occurred as a result of usually very slow geological processes of different kinds and ages.
A formation is a rock unit that is distinctive enough in appearance that a geologic mapper can tell it apart from the surrounding rock layers. The thickness of formations may range from less than a metre to several thousand metres. The term “formation” is often used informally to refer to a specific grouping of rocks, such as those encountered within a certain depth range in an oil well.
On Blocks 3&4, reservoirs in formations like Khufai, Barik, Lower Al Bashir, Buah and Masirah Bay have been explored. Tethys Oil has reserves and production in reservoirs in the Khufai, Barik, Lower Al Bashir and Buah formations.

BLOCK 3
BLOCK 3
BLOCK 4
Saiwan East Field
Alam Station &Pipeline System
Shahd field
3D seismic programme 2017/2018
3D seismic area
2D seismic area
Discoveries 2017 (undergoing appraisal/development)
Fields / structures in production
Leads and prospects
Farha South Field
UlfaSamah
ErfanTibyan
N
Seismic mapping, prospects and leads, Blocks 3&4, Oman
1515

Vibrator truck Receiver truck
Geophones (receivers)
GAS
OIL
WATER WATER
Seismic studiesA key exploration activity is the use of geophysical seismic. The principle behind seismic is that sound waves travel at different speeds in different materials and that the sound waves, at the transition between different materials, partly bend and reflect back to the surface. Since rocks have different compositions, it is possible, based on variations in the speed of
the sound wave and angle, to estimate the location of structures that could hold oil and/or natural gas reserves in an exploration area.
Single linear lines of seismic provide information about the subsurface rocks directly beneath the seismic equipment. This type of seismic data is referred to as two-dimensional or 2D seismic, because it provides data along two axis, length and depth. If seismic acquisition
is done across multiple lines simultaneously, the third dimension of width is gained, hence referred to as three-dimensional seismic, or 3D seismic. 3D seismic offers much greater density of information about the subsurface but is much more costly and covers a smaller area. Since the oil at Blocks 3&4 is trapped in smaller fault blocks or structures, 3D seismic has been essential in the mapping of possible oil bearing structures.
1616
Exploration gears up on Block 49
Tethys Oil was awarded a new explora-tion license by the Government of Sultan-ate of Oman in the fourth quarter 2017. Block 49, Montasar, is an onshore block that covers a prospective but still rather unexplored area in the Governorate of Dhofar in the south-west of Oman bor-dering Saudi Arabia. Tethys Oil holds 100 percent of the license interest and is the operator.
The Block 49 licence covers an area of 15,439 km2. More than 11,000 km of 2D seismic data that has been acquired by pre-vious operators has been made available to Tethys Oil. Nine wells have been drilled by previous operators within the block boundaries, several of which are reported to have encountered oil shows. Among the legacy wells is the first well ever drilled in Oman in 1955 (Dauka-1).
Through the reprocessing of some 1,464 km of older 2D seismic data, acquired by previous operators, a number of seismic anomalies have been identified, which could be possible – primarily strati-graphic – oil traps. The anomalies have been identified within the deeper forma-tions in the block at depths of 2,500 metres or below. After integration of all available data in Tethys Oil’s geological model, the presence of source rock as well as potential reservoir rocks have also been confirmed.
In the fourth quarter 2018, Tethys Oil launched and completed a seismic cam-paign on Block 49, whereby 253 km2 of 3D and 299 km of 2D seismic data was acquired in the north-eastern part of the license area. The purpose of the seismic campaign is to further define possible oil traps and to enhance the understanding
of the deeper parts of the block in general. The data is being processed and will, when interpreted, guide the continued work on Block 49.
The EPSA for Block 49 covers an initial exploration period of three years with an optional extension period of another three years. In the event of Declaration of Com-merciality the term of the agreement shall be extended for a period of 15 years which can be extended for another five years. In case of a commercial discovery, Oman gov-ernment company has a back-in right of up to 30 percent against refunding of pro rata past expenditure. The initial work com-mitments during the first period include geological studies, seismic acquisition and processing and exploratory drilling.

Vibrator truck Receiver truck
Geophones (receivers)
GAS
OIL
WATER WATER
Seismic mapping, prospects and leads, Block 49, Oman
1717
0
N
3D seismic area
2D seismic area
40,000 m
1818
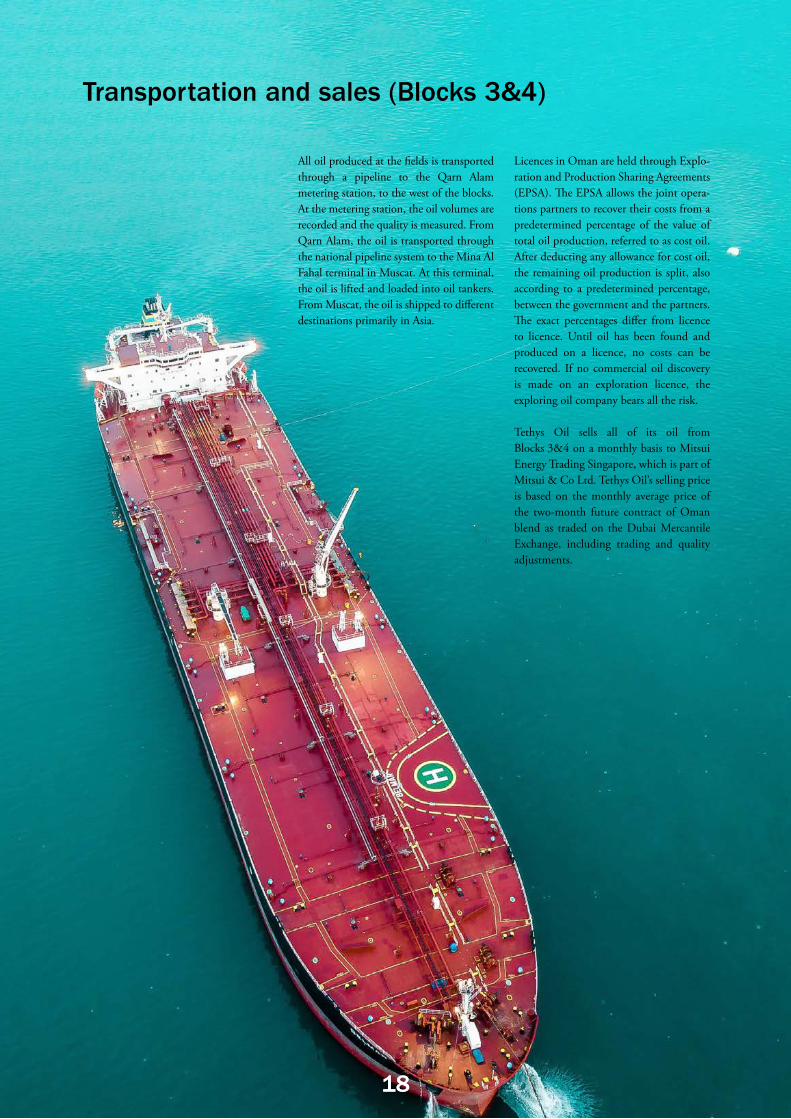
Transportation and sales (Blocks 3&4)
All oil produced at the fields is transported through a pipeline to the Qarn Alam metering station, to the west of the blocks. At the metering station, the oil volumes are recorded and the quality is measured. From Qarn Alam, the oil is transported through the national pipeline system to the Mina Al Fahal terminal in Muscat. At this terminal, the oil is lifted and loaded into oil tankers. From Muscat, the oil is shipped to different destinations primarily in Asia.
Licences in Oman are held through Explo-ration and Production Sharing Agreements (EPSA). The EPSA allows the joint opera-tions partners to recover their costs from a predetermined percentage of the value of total oil production, referred to as cost oil. After deducting any allowance for cost oil, the remaining oil production is split, also according to a predetermined percentage, between the government and the partners. The exact percentages differ from licence to licence. Until oil has been found and produced on a licence, no costs can be recovered. If no commercial oil discovery is made on an exploration licence, the exploring oil company bears all the risk.
Tethys Oil sells all of its oil from Blocks 3&4 on a monthly basis to Mitsui Energy Trading Singapore, which is part of Mitsui & Co Ltd. Tethys Oil’s selling price is based on the monthly average price of the two-month future contract of Oman blend as traded on the Dubai Mercantile Exchange, including trading and quality adjustments.

19
Office and staff
Tethys Oil’s staff consist of 20 highly motivated individuals from seven differ-ent nationalities, ranging in age from early twenties to mid seventies and with a bal-anced gender representation (35 percent female and 65 percent male). A majority of the staff have graduated from universities and colleges, primarily with geosciences, engineering or business administration.
Muscat OfficeA team of highly trained engineers and subsurface specialists are based at Tethys Oil’s office in Muscat together with finance and administration staff. As per the Omani government directive related to the employment, preference is given to Omani nationals in recruiting new staff. The Mus-cat office is the base for Tethys Oil’s CTO.
Stockholm OfficeTethys Oil head office is located in central Stockholm, Sweden. The Stockholm office is the base for the Managing Director and the CFO, along with Tethys Oil’s finance, legal, business development and commu-nication staff.
Operational areas outside Oman
Tethys Oil’s portfolio also includes Euro-pean licences, with indirect interests in three onshore licenses in Lithuania and one dormant onshore licence in France.
Lithuania, on the Baltic Sea in the north-eastern part of Europe, is a small oil pro-ducer. Oil was discovered in Lithuania some 60 years ago. From a peak at about 10,000 bopd around 20 years ago, the pro-duction has now dropped to about 2,000 bopd. The production is located in the
western part of the country. The Lithu-ania tax regime is very attractive, so even smaller amounts of oil can generate good value.
Tethys Oil’s Lithuanian licences cover an area of some 4,000 km2. The Gargzdai licence is in production with 85 bopd net to Tethys Oil in 2018. The oil produced at the Gargzdai licence has an API of about 42 degrees and is normally sold on a weekly basis to a nearby refinery.
The Rietavas and the Raseiniai licences are exploration licences. Since the acquisition of the licence interests in 2012, several exploration wells have been drilled, which have confirmed the presence of oil in the area, and seismic studies been conducted.
The Attila licence is located some 250 km east of Paris. Tethys Oil is reviewing the prospectivety and potential for additional work at the licence.
20
Corporate Governance Report 2018Corporate Governance practices refer to the decision-making systems through which owners, directly or indirectly, control a company. Tethys Oil is a publicly traded company listed on Nasdaq Stockholm, Mid Cap. Tethys Oil adheres to the Swed-ish Code of Corporate Governance (“the Code”). The Code is published on www.bolagsstyrning.se, where a description of the Swedish Corporate Governance model can be found. This Corporate Governance Report 2018 is submitted in accordance with the Swedish Annual Accounts Act and the Code. It explains how Tethys Oil has conducted its corporate governance activities during 2018. Tethys Oil does not report any deviations from the Code, Nas-daq Stockholm’s rule book for issuers, rec-ommendations from the Swedish Securities Council, decisions from Disciplinary Com-mittee at Nasdaq Stockholm or statements from the Swedish Securities Council. The report has been examined by the Compa-ny’s auditors, please see page 25.
External and internal framework for governance in Tethys OilExternal:• Swedish Companies Act• Accounting legislation (e.g. Swed-
ish accounting act, Swedish Annual Accounts Act and IFRS)
• Nasdaq Stockholm’s rule book for issuers• Swedish Code of Corporate Governance
Internal:• Articles of Association• Board instructions, rules of procedures• Internal control framework with Code
of Conduct, polices etc.
ShareholdersTethys Oil’s shares are traded on Nasdaq Stockholm. At year end 2018 the share capital amounted to SEK 5,984,402, rep-resented by 35,896,310 shares, each with a par value of SEK 0.17. All shares represent one vote each. At 31 December 2018, the number of shareholders was 6,602 (5,043). Of the total number of shares, foreign shareholders accounted for approximately 68 percent. Lansdowne Partners LLP is the only shareholder with a holding in excess of 10 percent of shares and votes, with a holding of 3,593,699 shares representing 10.1 percent of shares and votes. Tethys
Oil’s holding of its own shares amounted to 1,644,163 (4.6 percent). For further information on share, share capital devel-opment and shareholders, see pages 29–31 and Tethys Oil’s website.
Annual General MeetingThe Annual General Meeting (“AGM”) must be held within six months of the close of the fiscal year. All shareholders who are listed in the share register on the record date, and who have notified the Company of their participation in due time, are enti-tled to participate in the AGM. The AGM was held in Stockholm on 9 May 2018. 158 shareholders were represented at the AGM, representing 42 percent of the votes and share capital in the company. The reso-lutions passed by the meeting included the following:
• Adoption of the income statements and balance sheets for 2017 and discharge of liability for the Board of Directors and the Managing Director;
• Re-election of Robert Anderson, Alexan-dra Herger, Magnus Nordin, Per Seime and Geoffrey Turbott. Geoffrey Turbott was elected chairman of the Board;
• Remuneration of the members of the Board of Directors and the chairman of the Board of Directors, including Board committee membership, to be as fol-lows: (i) annual fees of the members of the Board of Directors of SEK 300,000 (excluding the); (ii) annual fees of the chairman of the Board of Directors of SEK 630,000; (iii) annual fees for committee members of SEK 35,000 per committee assignment, annual fees for the chairmen of the remuneration committee and technical committee, if applicable, of SEK 65,000 each and an annual fee for the chairman of the audit committee of SEK 90,000, unless the committee is chaired by the chairman of the Board of Directors in which case an annual fee of SEK 65,000. The total fees for committee work, including com-mittee chairmen fees shall not exceed SEK 360,000; and (iv) if a member of the Board of Directors, following a reso-lution by the Board of Directors, per-forms tasks which are outside the regu-lar Board work, separate remuneration in the form of hourly fees on market
terms, within a frame of SEK 250,000, may be paid by resolution of the Board of Directors;
• Re-election of PricewaterhouseCoopers AB as auditors. Auditors will be paid as invoices are approved;
• Guidelines for compensation of senior executives;
• Incentive programme as part of the remuneration package to employees. Issuance of 350,000 warrants where each warrant entitled to subscription to one new share in Tethys Oil during the period 1 June 2021 up to an including 2 October 2021. Subscription price for the warrants is SEK 89.00 per share;
• Authorisation for the Board to resolve on repurchasing own shares up to not more than one-tenth of all outstanding shares and to resolve on transfer of own shares;
• Rules for the appointment and work of the nomination committee; and
• Authorisation for the Board to resolve to issue new shares and/or convertibles with consideration in cash and/or with consideration in kind or by set-off, to enable the company to make business acquisitions and to raise capital for the Company’s business operations.
The minutes recorded at the AGM can be found at Tethys Oil’s website, www.tethys-oil.com.
Nomination processIn accordance with the nomination com-mittee process approved by the AGM 2018, the nomination committee for the AGM 2019 consists of members appointed by three of the largest shareholders of the Company based on shareholdings as per 30 September 2018 and the chairman of the Board. The names of the members of the nomination committee were announced and posted on the Company’s website on 14 November 2018, i.e. six months before the AGM as prescribed by the Code.
The nomination committee for the AGM 2019 has held four meetings during its mandate and informal contacts have taken place between such meetings. The nomina-tion committee report, including the final proposals to the AGM 2019, is published on the Company’s website together with the notice of the AGM.
21
The Nomination Committee’s assignment is to produce proposals for the following matters, which will be presented to the AGM for resolution:
• AGM chairman:• Board members:• Chairman of the Board:• Board fees and remuneration for com-
mittee work allocated to each member:• Auditors and auditor’s fee: and• Proposal regarding procedures and prin-
ciples for establishing a nomination committee and issues pertaining thereto for the AGM 2020.
The work of the nomination committee included evaluation of the Board’s work, competence and composition, as well as the independence of the members. The nomination committee also considered other criteria such as the background and experience and has also taken part in the Board evaluation. Further, the nomination committee has considered the Company’s Board diversity policy in its proposal for Board members. The Board diversity pol-icy is available on the Company’s website.
The nomination committee for the AGM 2019 consisted of the following members:
• Viktor Modigh, chairman of the nomi-nation committee, representing Magnus Nordin;
• Mikael Petersson, representing Lans-downe Investment Company Limited and Coeli Asset Management AB;
• Johan Strandberg, representing SEB Investment Management AB; and
• Geoffrey Turbott, chairman of Tethys Oil
The Board and its work Board compositionThe Articles of Association stipulate that the Board of Directors of Tethys Oil shall consist of no less than three and no more than ten Board members with no more than three deputy Board members. Board members are elected for a maximum of one year at a time. The Board of Directors of Tethys Oil since the AGM 2018 has con-sisted of five members and no deputies. Geoffrey Turbott has been chairman of the Board. Four Board members are independ-ent from the Company and the Company’s
Rules of procedureThe Board of Directors’ work is governed by annually adopted rules of procedure. The Board of Directors supervise the work of the Managing Director by continually following up the Company’s operations. The Board of Directors also ensures that the Company’s organisation, administra-tion and controls are properly managed. The Board of Directors adopts strategies and goals and resolves on larger invest-ments, acquisitions and disposals of busi-ness activities or assets. It also appoints the Managing Director and determines the Managing Director’s salary and other compensation.
The chairman of the Board of Directors supervises the work and is responsible for
management, and five Board members are independent from larger shareholders.
For further information on the Board members, please see pages 26–27.
it being well organised and efficient. This entails, among other things, continually following the Company’s operations in contact with the Managing Director and being responsible for other Board mem-bers receiving the information and docu-mentation needed to ensure high quality discussions and well-founded decisions by the Board of Directors. The chairman is responsible for the evaluation of the Board of Directors’ and the Managing Director’s work and represents the Board of Directors in ownership matters.
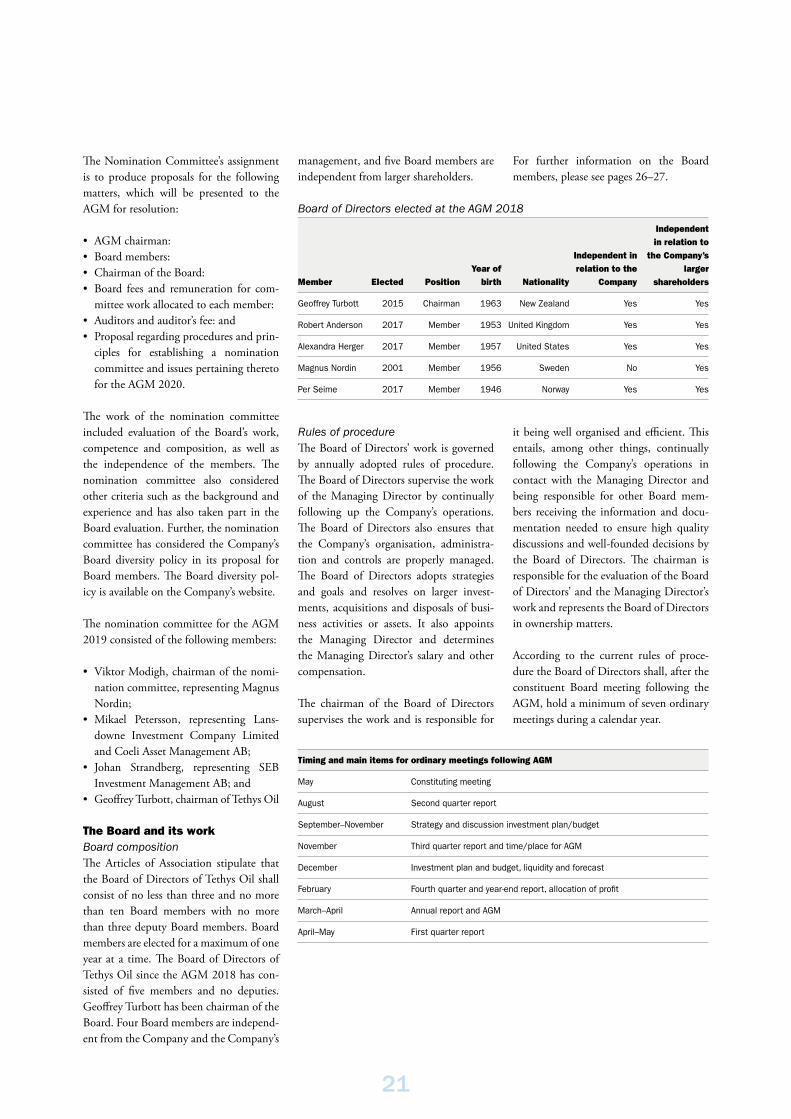
According to the current rules of proce-dure the Board of Directors shall, after the constituent Board meeting following the AGM, hold a minimum of seven ordinary meetings during a calendar year.
Timing and main items for ordinary meetings following AGM
May Constituting meeting
August Second quarter report
September–November Strategy and discussion investment plan/budget
November Third quarter report and time/place for AGM
December Investment plan and budget, liquidity and forecast
February Fourth quarter and year-end report, allocation of profit
March–April Annual report and AGM
April–May First quarter report
Board of Directors elected at the AGM 2018
Member Elected PositionYear of
birth Nationality
Independent in relation to the
Company
Independent in relation to
the Company’s larger
shareholders
Geoffrey Turbott 2015 Chairman 1963 New Zealand Yes Yes
Robert Anderson 2017 Member 1953 United Kingdom Yes Yes
Alexandra Herger 2017 Member 1957 United States Yes Yes
Magnus Nordin 2001 Member 1956 Sweden No Yes
Per Seime 2017 Member 1946 Norway Yes Yes
22
Assessment of the board’s workThe chairman of the Board is responsible for assessing the Board’s work including the performance of individual Board members. This is done on an annual basis through a questionnaire which is anonymous for the Board members. The assessment focuses on such factors as the Board’s way of working, number of meetings and effectiveness, time for preparation, available competence and
individual Board members influence of the Board’s work. The nomination committee takes part in assessing the results, and it is a component in the nomination commit-tee’s work to submit a proposal to the AGM concerning Board members.
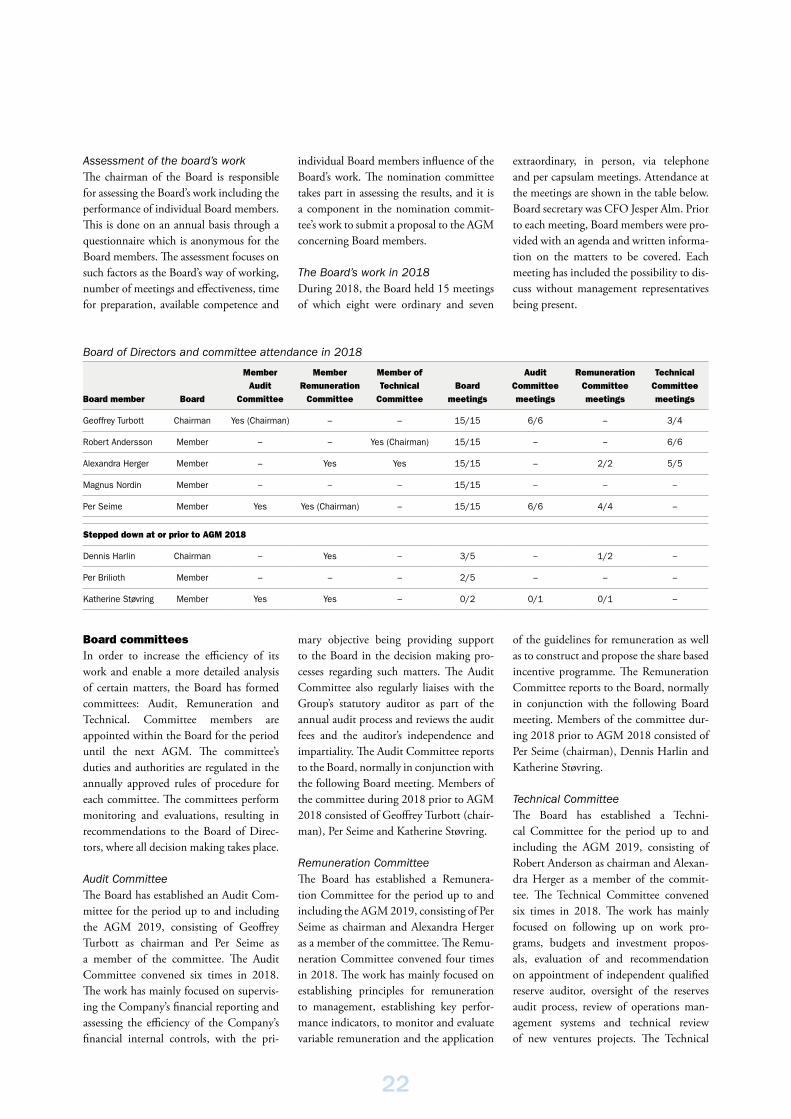
The Board’s work in 2018During 2018, the Board held 15 meetings of which eight were ordinary and seven
extraordinary, in person, via telephone and per capsulam meetings. Attendance at the meetings are shown in the table below. Board secretary was CFO Jesper Alm. Prior to each meeting, Board members were pro-vided with an agenda and written informa-tion on the matters to be covered. Each meeting has included the possibility to dis-cuss without management representatives being present.
of the guidelines for remuneration as well as to construct and propose the share based incentive programme. The Remuneration Committee reports to the Board, normally in conjunction with the following Board meeting. Members of the committee dur-ing 2018 prior to AGM 2018 consisted of Per Seime (chairman), Dennis Harlin and Katherine Støvring.
Technical CommitteeThe Board has established a Techni-cal Committee for the period up to and including the AGM 2019, consisting of Robert Anderson as chairman and Alexan-dra Herger as a member of the commit-tee. The Technical Committee convened six times in 2018. The work has mainly focused on following up on work pro-grams, budgets and investment propos-als, evaluation of and recommendation on appointment of independent qualified reserve auditor, oversight of the reserves audit process, review of operations man-agement systems and technical review of new ventures projects. The Technical
Board of Directors and committee attendance in 2018
Board member Board
Member Audit
Committee
Member Remuneration
Committee
Member of Technical
CommitteeBoard
meetings
Audit Committee meetings
Remuneration Committee meetings
Technical Committee meetings
Geoffrey Turbott Chairman Yes (Chairman) – – 15/15 6/6 – 3/4
Robert Andersson Member – – Yes (Chairman) 15/15 – – 6/6
Alexandra Herger Member – Yes Yes 15/15 – 2/2 5/5
Magnus Nordin Member – – – 15/15 – – –
Per Seime Member Yes Yes (Chairman) – 15/15 6/6 4/4 –
Stepped down at or prior to AGM 2018
Dennis Harlin Chairman – Yes – 3/5 – 1/2 –
Per Brilioth Member – – – 2/5 – – –
Katherine Støvring Member Yes Yes – 0/2 0/1 0/1 –
Board committeesIn order to increase the efficiency of its work and enable a more detailed analysis of certain matters, the Board has formed committees: Audit, Remuneration and Technical. Committee members are appointed within the Board for the period until the next AGM. The committee’s duties and authorities are regulated in the annually approved rules of procedure for each committee. The committees perform monitoring and evaluations, resulting in recommendations to the Board of Direc-tors, where all decision making takes place.
Audit CommitteeThe Board has established an Audit Com-mittee for the period up to and including the AGM 2019, consisting of Geoffrey Turbott as chairman and Per Seime as a member of the committee. The Audit Committee convened six times in 2018. The work has mainly focused on supervis-ing the Company’s financial reporting and assessing the efficiency of the Company’s financial internal controls, with the pri-
mary objective being providing support to the Board in the decision making pro-cesses regarding such matters. The Audit Committee also regularly liaises with the Group’s statutory auditor as part of the annual audit process and reviews the audit fees and the auditor’s independence and impartiality. The Audit Committee reports to the Board, normally in conjunction with the following Board meeting. Members of the committee during 2018 prior to AGM 2018 consisted of Geoffrey Turbott (chair-man), Per Seime and Katherine Støvring.
Remuneration CommitteeThe Board has established a Remunera-tion Committee for the period up to and including the AGM 2019, consisting of Per Seime as chairman and Alexandra Herger as a member of the committee. The Remu-neration Committee convened four times in 2018. The work has mainly focused on establishing principles for remuneration to management, establishing key perfor-mance indicators, to monitor and evaluate variable remuneration and the application

23
Managing Director and executive managementThe executive management in Tethys Oil throughout 2018 has consisted of the Managing Director (Magnus Nordin), CFO (Jesper Alm) and the CTO (Fre-drik Robelius). The Board of Directors has adopted an instruction for the Man-aging Director which clarifies the respon-sibilities and authority of the Managing Director. According to the instruction, the Managing Director shall provide the Board of Directors with decision data in order to enable the Board to make well-founded decisions and with documents to enable it to continually monitor the activi-ties for the year. The Managing Director is responsible for the day to day business of the Company and shall take the deci-sions needed for developing the business – within the legal framework, the busi-ness plan, the budget and the instruction for the Managing Director adopted by the Board of Directors as well as in accordance with other guidelines and instructions communicated by the Board of Directors.
Remuneration policy to executive managementRemuneration policy to the executive management includes five elements:
• Basic salary;• Pension arrangements;• Yearly variable salary, including the right
to participate in share-based long-term incentive;
• Other benefits; and• Severance arrangements
The Board has the right to deviate from the remuneration policy if there are particular reasons.
Basic salaryThe basic salary shall be in line with mar-ket conditions, be competitive, and shall take into account the scope and responsi-bility associated with the position, as well as the skills, experience, and performance of the executive.
Pension arrangementsThe pension benefits comprise a defined contribution scheme with premiums cal-culated on the full basic salary. The pen-
Committee reports to the Board, normally in conjunction with the following Board meeting. Members of the committee dur-ing 2018 prior to AGM 2018 consisted of Robert Anderson (chairman), Alexandra Herger and Geoffrey Turbott.
External auditors of the Company Statutory auditorPursuant to its Articles of Association, Tethys Oil must have one or two auditors, and no more than two deputies. A regis-tered firm of auditors may be appointed as the Company’s auditor. Tethys Oil’s audi-tor is PricewaterhouseCoopers AB with Ulrika Ramsvik as lead partner and Bo Hjalmarsson as co-signing auditor. Price-waterhouseCoopers AB was elected as the Company’s auditor at the AGM 2018.
Tethys Oil’s auditor: Pricewaterhouse-Coopers AB
Ulrika Ramsvik
Bo Hjalmarsson
Role Lead partner Co-signing auditor
Company auditor since
2014 2018
The audit firm has, besides the audit, con-ducted a limited number of other assign-ments on behalf of Tethys Oil. These assignments mainly consisted of services associated with auditing, such as in-depth reviews during the audit. Remuneration to the auditors of Tethys Oil is paid in accord-ance with approved current accounts. In 2018, remuneration to Pricewaterhouse- Coopers AB amounted to MUSD 0.1 (MUSD 0.2). For details on remuneration to auditors, see note 10, Auditor’s fees.
Independent qualified reserves auditorTethys Oil’s independent qualified reserves auditor annually certifies Tethys Oil’s oil reserves and resources, although such assets are not included in the Company’s balance sheet. The independent qualified reserves auditor for the 2018 report was ERC Equi-poise Limited (“ERCE”), that also audited the 2017 report. For further information, see Reserves on page 9.
sion contributions shall be in relation to the basic salary and is set on an individual basis but shall not be higher than what is tax deductible.
Variable salarySenior executives shall be part of two variable remuneration systems payable in cash and/or in combination with a right to acquire warrants in the Company in a long-term incentive programs.
Senior executives may have the right to participate in share based long-term incen-tive programs. When allocating warrants the same financial and operational key indicators as for variable cash salary shall be considered.
The yearly variable cash salary shall be within the range of 1–12 monthly sala-ries per person and year. The targets for variable cash remuneration shall be deter-mined by the Board prior to each finan-cial year and individual agreements shall be arranged with each participant, the content of which depends on the partici-pant’s position at the time the agreement is arranged. The targets shall be objectively quantifiable and related to budget. The targets shall consist of key performance indicators both for the group’s overall and financial performance as well as individual performance. The yearly variable salary will be determined annually in connection with publication of the year-end report for the respective financial year based on an evaluation of the participants’ achievement of the targets as described in the individual agreements.
Payment of variable cash remuneration shall be conditional upon the participant remaining employed for the duration of the programme. The Board has the right to adjust the incentive program during the term of the programme in the case of, for example, extraordinary increases or decreases in the Group’s earnings. The variable remuneration shall not be pensionable.
Other benefitsNon-financial benefits shall be based on market terms and shall facilitate the duties of each senior executive.
24
Severance arrangementsA mutual termination period of 12 months applies between the Company and the Managing Director and up to six months
between the Company and other senior executives. Severance pay shall be paid to the Managing Director of up to 12 months fixed salary and up to 12 months fixed sal-
ary for other senior executives if the Com-pany terminates their employment.
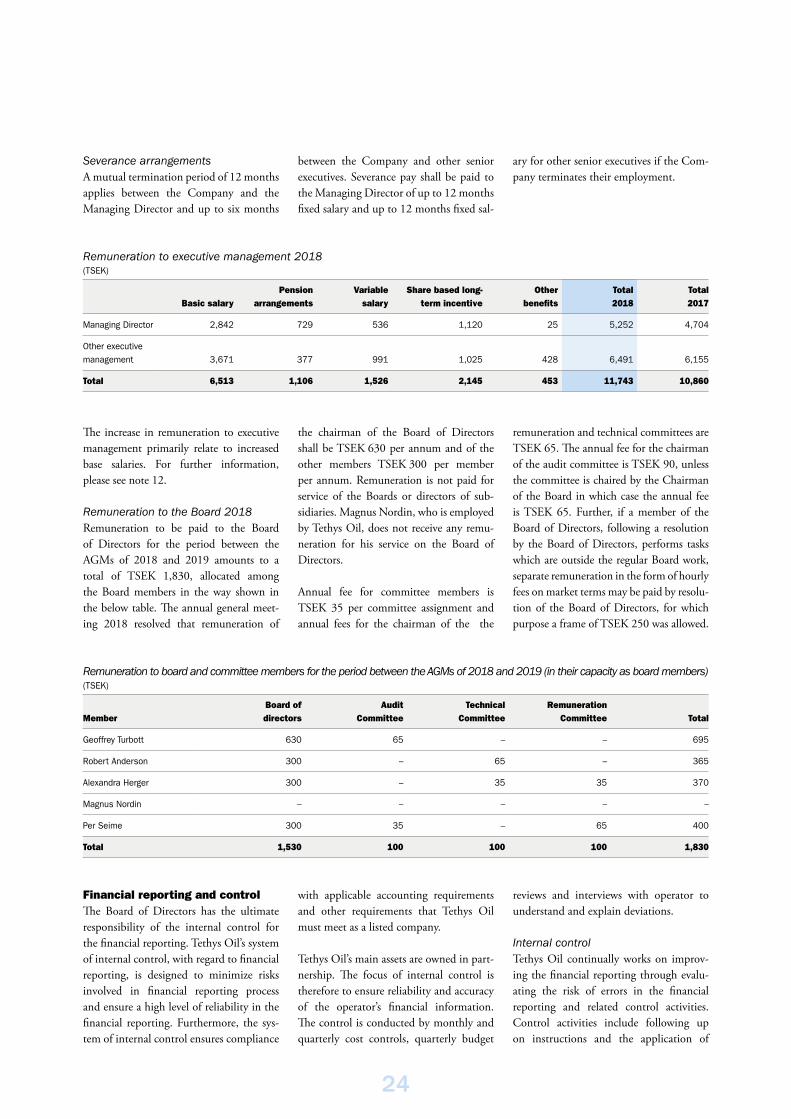
Remuneration to executive management 2018(TSEK)
Basic salaryPension
arrange mentsVariable
salaryShare based long-
term incentiveOther
benefitsTotal 2018
Total 2017
Managing Director 2,842 729 536 1,120 25 5,252 4,704
Other executive management 3,671 377 991 1,025 428 6,491 6,155
Total 6,513 1,106 1,526 2,145 453 11,743 10,860
The increase in remuneration to executive management primarily relate to increased base salaries. For further information, please see note 12.
Remuneration to the Board 2018Remuneration to be paid to the Board of Directors for the period between the AGMs of 2018 and 2019 amounts to a total of TSEK 1,830, allocated among the Board members in the way shown in the below table. The annual general meet-ing 2018 resolved that remuneration of
the chairman of the Board of Directors shall be TSEK 630 per annum and of the other members TSEK 300 per member per annum. Remuneration is not paid for service of the Boards or directors of sub-sidiaries. Magnus Nordin, who is employed by Tethys Oil, does not receive any remu-neration for his service on the Board of Directors.
Annual fee for committee members is TSEK 35 per committee assignment and annual fees for the chairman of the the
remuneration and technical committees are TSEK 65. The annual fee for the chairman of the audit committee is TSEK 90, unless the committee is chaired by the Chairman of the Board in which case the annual fee is TSEK 65. Further, if a member of the Board of Directors, following a resolution by the Board of Directors, performs tasks which are outside the regular Board work, separate remuneration in the form of hourly fees on market terms may be paid by resolu-tion of the Board of Directors, for which purpose a frame of TSEK 250 was allowed.
Remuneration to board and committee members for the period between the AGMs of 2018 and 2019 (in their capacity as board members)(TSEK)
MemberBoard of directors
Audit Committee
Technical Committee
Remuneration Committee Total
Geoffrey Turbott 630 65 – – 695
Robert Anderson 300 – 65 – 365
Alexandra Herger 300 – 35 35 370
Magnus Nordin – – – – –
Per Seime 300 35 – 65 400
Total 1,530 100 100 100 1,830
Financial reporting and controlThe Board of Directors has the ultimate responsibility of the internal control for the financial reporting. Tethys Oil’s system of internal control, with regard to financial reporting, is designed to minimize risks involved in financial reporting process and ensure a high level of reliability in the financial reporting. Furthermore, the sys-tem of internal control ensures compliance
with applicable accounting requirements and other requirements that Tethys Oil must meet as a listed company.
Tethys Oil’s main assets are owned in part-nership. The focus of internal control is therefore to ensure reliability and accuracy of the operator’s financial information. The control is conducted by monthly and quarterly cost controls, quarterly budget
reviews and interviews with operator to understand and explain deviations.
Internal controlTethys Oil continually works on improv-ing the financial reporting through evalu-ating the risk of errors in the financial reporting and related control activities. Control activities include following up on instructions and the application of

25
Stockholm, 3 April 2019
Tethys Oil AB (publ)The Board of Directors
Engagement and responsibilityIt is the Board of Directors who is responsible for the corporate governance statement for the year 2018 on pages 20–25 and that it has been prepared in accordance with the Annual Accounts Act.
The scope of the auditOur examination has been conducted in accordance with FAR’s auditing standard RevU 16 The auditor’s examination of the cor-porate governance statement. This means that our examination of the corporate governance statement is different and substantially less in scope than an audit conducted in accordance with Inter-national Standards on Auditing and generally accepted auditing standards in Sweden. We believe that the examination has pro-vided us with sufficient basis for our opinions.
OpinionA corporate governance statement has been prepared. Disclosures in accordance with chapter 6 section 6 the second paragraph points 2–6 the Annual Accounts Act and chapter 7 section 31 the second paragraph the same law are consistent with the annual accounts and the consolidated accounts and are in accordance with the Annual Accounts Act.
Stockholm, 3 April 2019PricewaterhouseCoopers AB
Ulrika RamsvikAuthorized Public Accountant
Lead Partner
Bo HjalmarssonAuthorized Public Accountant
accounting principles. The Board of Direc-tors is responsible for and monitors the control activities, which involve all levels of the organisation. The activities limit the identified risks and ensure correct and reli-able financial reporting. The Company’s central financial department analyses and follows up on budget deviations, draws up forecasts, follows up on significant varia-tions between periods and reports to the Board of Directors, which minimises the risks for errors in the financial reporting. The control activities also include fol-lowing up on the authorisation manual and accounting principles. These control activities also include the operators in part-nerships. The Board of Directors further
decides on specific control activities and auditing of operators in partnerships. The financial department regularly follows up on deviations and irregularities and reports to the audit committee. This structure is considered sufficient and suitable given the size and nature of the Company’s business. At the current size of the Company and the fact that the Company holds non-operated interests or early stage operated explora-tion interests, it is not considered necessary for a dedicated internal auditor function.
Information and communicationThe Board has adopted an information policy for the purpose of ensuring that the external information is correct and com-
plete. There are also instructions regarding information security and how to commu-nicate financial information.
MonitoringBoth the Board and the management fol-low up on the compliance and effective-ness of the Company’s internal controls to ensure the quality of internal processes. The Board receives detailed monthly reports on the financial situation and development of the business to this end. The Audit Com-mittee ensures and monitors that control activities are in place for important areas of risk related to financial reporting.
This is a literal translation of the Swedish original reportAuditor’s report on the Corporate Governance Statement
To the general meeting of the shareholders in Tethys Oil AB (publ), corporate identity number 556615-8266.

2626
Board of Directors
Member Geoffrey Turbott Rob Anderson Alexandra Herger
Function Chairman of the Board and chairman of the Audit Committee
Board member and chairman of the Technical Committee
Board member and member of the Remuneration and Technical Committees
Elected 2015 2017 2017
Year of birth 1963 1953 1957
Nationality New Zealand United Kingdom United States
Education/background Former member of New Zealand’s institute of chartered accountants
MA Engineering, Christ's College, Cambridge University. Chartered Engineer & Fellow of the Institution of Mechanical Engineers
BA Geology, Ohio Wesleyan University and Master studies Geology, University of Houston
Experience Worked with public companies in which the Lundin family holds a major shareholding from 1995 to 2013, whereof as Chief Financial Officer and Vice President of Finance at Lundin Petroleum AB from 2002 to 2013
VP Projects & Engineering at TNK-BP, Head of Projects at BP. Engineer with deep experience in oil installations and major oil and gas field developments
VP Global Exploration at Marathon Oil, executive positions at Shell and Enterprise Oil
Other board duties Board member: Tetbury Forestry Ltd. And Progress Land Ltd.
– Board member: Panoro Energy ASA and Tortoise Capital Advisors Member: Women's Leadership Committee, Oil Council and Leadership Texas, Foundation for women's resources
Shares in Tethys Oil (per 31 December 2018)1
31,700 – –
Warrants in Tethys Oil (per 31 December 2018)1
– – –
Board and committe remuneration (TSEK)2
695 365 370
Independent in relation to the Company
Yes Yes Yes
Independent in relation to the Company's larger shareholders
Yes Yes Yes
1 Privately, via company and insurance policy2 Resolved upon at the AGM 2018

2727
Member Magnus Nordin Per Seime
Function Board member and Managing Director Board member, chairman of the Remuneration Committee and member of the Audit Committee
Elected 2001 2017
Year of birth 1956 1946
Nationality Sweden Norway
Education/background Bachelor of Arts, University of Lund and Master of Arts, University of California, Los Angeles
Master of Law, University of Oslo. Master of Comparative Law, University of Chicago Law School (Oil & Gas)
Experience Several executive positions in different oil companies
Oil and gas lawyer with experience from the Norwegian Continental Shelf and internationally. 17 years as head of the oil and gas group in the law firm Simonsen Vogt Wiig, Oslo. Counsel/General Counsel for Mobil Oil in Norway, USA and Indonesia. Board chairman for Premier Oil Norge (2004–2013) and Nexen Exploration Norge (2005–2014). General Counsel in Kongsberg Gruppen for nine years.
Other board duties Board member: Minotaurus AB, including subsidiaries, and Minotaurus Energi AS
–
Shares in Tethys Oil (per 31 December 2018)1
1,464,127 5,000
Warrants in Tethys Oil (per 31 December 2018)1
2016/19: 70,000 2017/20: 75,000 2018/21: 75,000
–
Board and committe remuneration (TSEK)2
– 400
Independent in relation to the Company
No Yes
Independent in relation to the Company's larger shareholders
Yes Yes
1 Privately, via company and insurance policy2 Resolved upon at the AGM 2018
2828
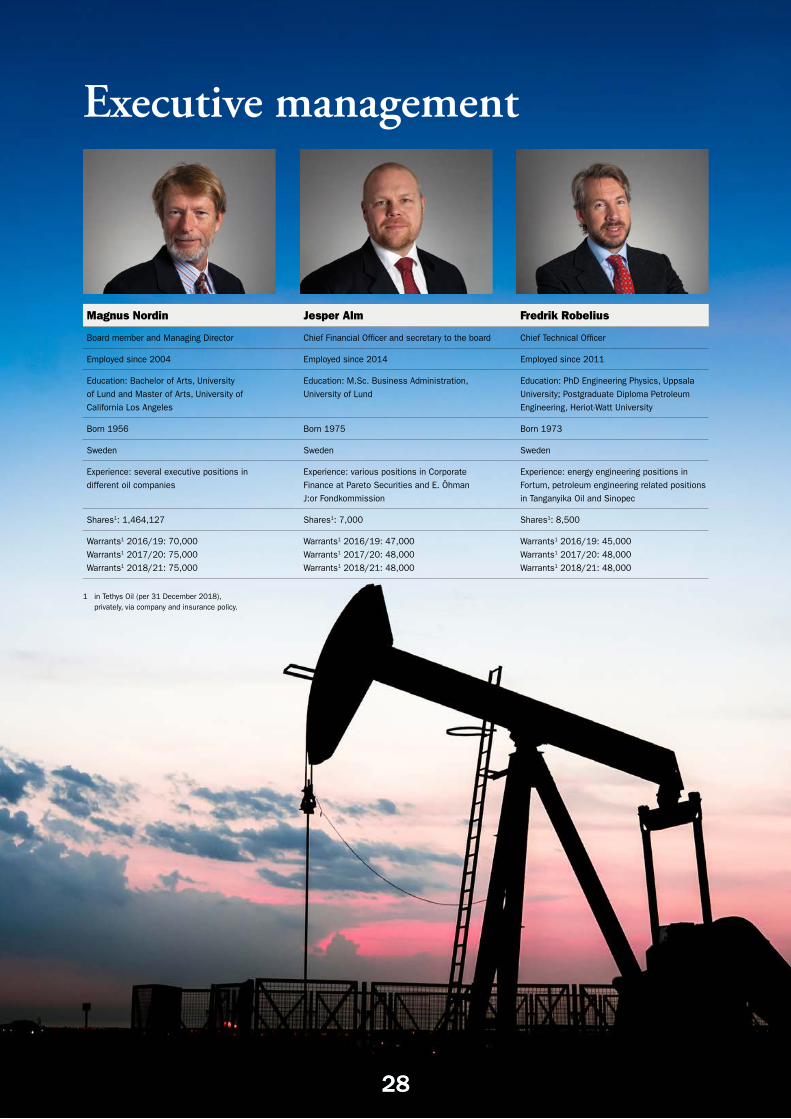
Magnus Nordin Jesper Alm Fredrik Robelius
Board member and Managing Director Chief Financial Officer and secretary to the board Chief Technical Officer
Employed since 2004 Employed since 2014 Employed since 2011
Education: Bachelor of Arts, University of Lund and Master of Arts, University of California Los Angeles
Education: M.Sc. Business Administration, University of Lund
Education: PhD Engineering Physics, Uppsala University; Postgraduate Diploma Petroleum Engineering, Heriot-Watt University
Born 1956 Born 1975 Born 1973
Sweden Sweden Sweden
Experience: several executive positions in different oil companies
Experience: various positions in Corporate Finance at Pareto Securities and E. Öhman J:or Fondkommission
Experience: energy engineering positions in Fortum, petroleum engineering related positions in Tanganyika Oil and Sinopec
Shares1: 1,464,127 Shares1: 7,000 Shares1: 8,500
Warrants1 2016/19: 70,000 Warrants1 2017/20: 75,000Warrants1 2018/21: 75,000
Warrants1 2016/19: 47,000Warrants1 2017/20: 48,000Warrants1 2018/21: 48,000
Warrants1 2016/19: 45,000Warrants1 2017/20: 48,000Warrants1 2018/21: 48,000
1 in Tethys Oil (per 31 December 2018), privately, via company and insurance policy.
Executive management
29
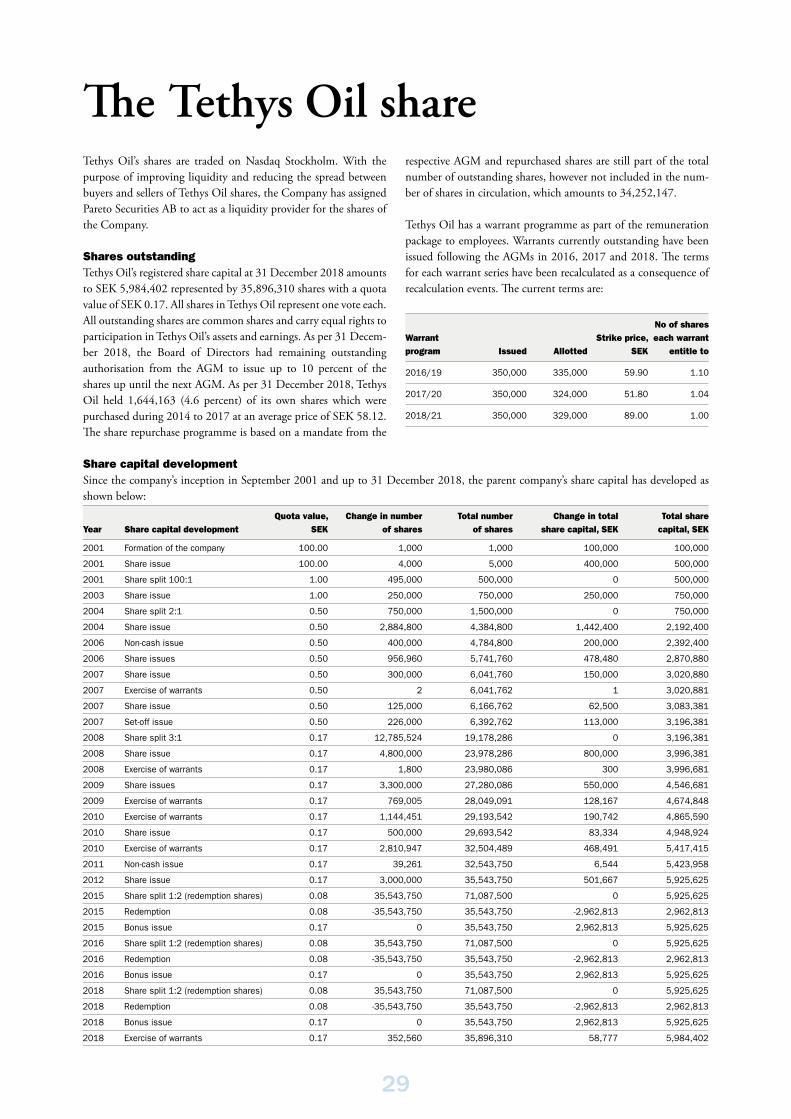
The Tethys Oil shareTethys Oil’s shares are traded on Nasdaq Stockholm. With the purpose of improving liquidity and reducing the spread between buyers and sellers of Tethys Oil shares, the Company has assigned Pareto Securities AB to act as a liquidity provider for the shares of the Company.
Shares outstandingTethys Oil’s registered share capital at 31 December 2018 amounts to SEK 5,984,402 represented by 35,896,310 shares with a quota value of SEK 0.17. All shares in Tethys Oil represent one vote each. All outstanding shares are common shares and carry equal rights to participation in Tethys Oil’s assets and earnings. As per 31 Decem-ber 2018, the Board of Directors had remaining outstanding authorisation from the AGM to issue up to 10 percent of the shares up until the next AGM. As per 31 December 2018, Tethys Oil held 1,644,163 (4.6 percent) of its own shares which were purchased during 2014 to 2017 at an average price of SEK 58.12. The share repurchase programme is based on a mandate from the
respective AGM and repurchased shares are still part of the total number of outstanding shares, however not included in the num-ber of shares in circulation, which amounts to 34,252,147.
Tethys Oil has a warrant programme as part of the remuneration package to employees. Warrants currently outstanding have been issued following the AGMs in 2016, 2017 and 2018. The terms for each warrant series have been recalculated as a consequence of recalculation events. The current terms are:
Warrant program Issued Allotted
Strike price, SEK
No of shares each warrant
entitle to
2016/19 350,000 335,000 59.90 1.10
2017/20 350,000 324,000 51.80 1.04
2018/21 350,000 329,000 89.00 1.00
Share capital developmentSince the company’s inception in September 2001 and up to 31 December 2018, the parent company’s share capital has developed as shown below:
Year Share capital developmentQuota value,
SEKChange in number
of shares Total number
of shares Change in total
share capital, SEK Total share
capital, SEK
2001 Formation of the company 100.00 1,000 1,000 100,000 100,000
2001 Share issue 100.00 4,000 5,000 400,000 500,000
2001 Share split 100:1 1.00 495,000 500,000 0 500,000
2003 Share issue 1.00 250,000 750,000 250,000 750,000
2004 Share split 2:1 0.50 750,000 1,500,000 0 750,000
2004 Share issue 0.50 2,884,800 4,384,800 1,442,400 2,192,400
2006 Non-cash issue 0.50 400,000 4,784,800 200,000 2,392,400
2006 Share issues 0.50 956,960 5,741,760 478,480 2,870,880
2007 Share issue 0.50 300,000 6,041,760 150,000 3,020,880
2007 Exercise of warrants 0.50 2 6,041,762 1 3,020,881
2007 Share issue 0.50 125,000 6,166,762 62,500 3,083,381
2007 Set-off issue 0.50 226,000 6,392,762 113,000 3,196,381
2008 Share split 3:1 0.17 12,785,524 19,178,286 0 3,196,381
2008 Share issue 0.17 4,800,000 23,978,286 800,000 3,996,381
2008 Exercise of warrants 0.17 1,800 23,980,086 300 3,996,681
2009 Share issues 0.17 3,300,000 27,280,086 550,000 4,546,681
2009 Exercise of warrants 0.17 769,005 28,049,091 128,167 4,674,848
2010 Exercise of warrants 0.17 1,144,451 29,193,542 190,742 4,865,590
2010 Share issue 0.17 500,000 29,693,542 83,334 4,948,924
2010 Exercise of warrants 0.17 2,810,947 32,504,489 468,491 5,417,415
2011 Non-cash issue 0.17 39,261 32,543,750 6,544 5,423,958
2012 Share issue 0.17 3,000,000 35,543,750 501,667 5,925,625
2015 Share split 1:2 (redemption shares) 0.08 35,543,750 71,087,500 0 5,925,625
2015 Redemption 0.08 -35,543,750 35,543,750 -2,962,813 2,962,813
2015 Bonus issue 0.17 0 35,543,750 2,962,813 5,925,625
2016 Share split 1:2 (redemption shares) 0.08 35,543,750 71,087,500 0 5,925,625
2016 Redemption 0.08 -35,543,750 35,543,750 -2,962,813 2,962,813
2016 Bonus issue 0.17 0 35,543,750 2,962,813 5,925,625
2018 Share split 1:2 (redemption shares) 0.08 35,543,750 71,087,500 0 5,925,625
2018 Redemption 0.08 -35,543,750 35,543,750 -2,962,813 2,962,813
2018 Bonus issue 0.17 0 35,543,750 2,962,813 5,925,625
2018 Exercise of warrants 0.17 352,560 35,896,310 58,777 5,984,402
30
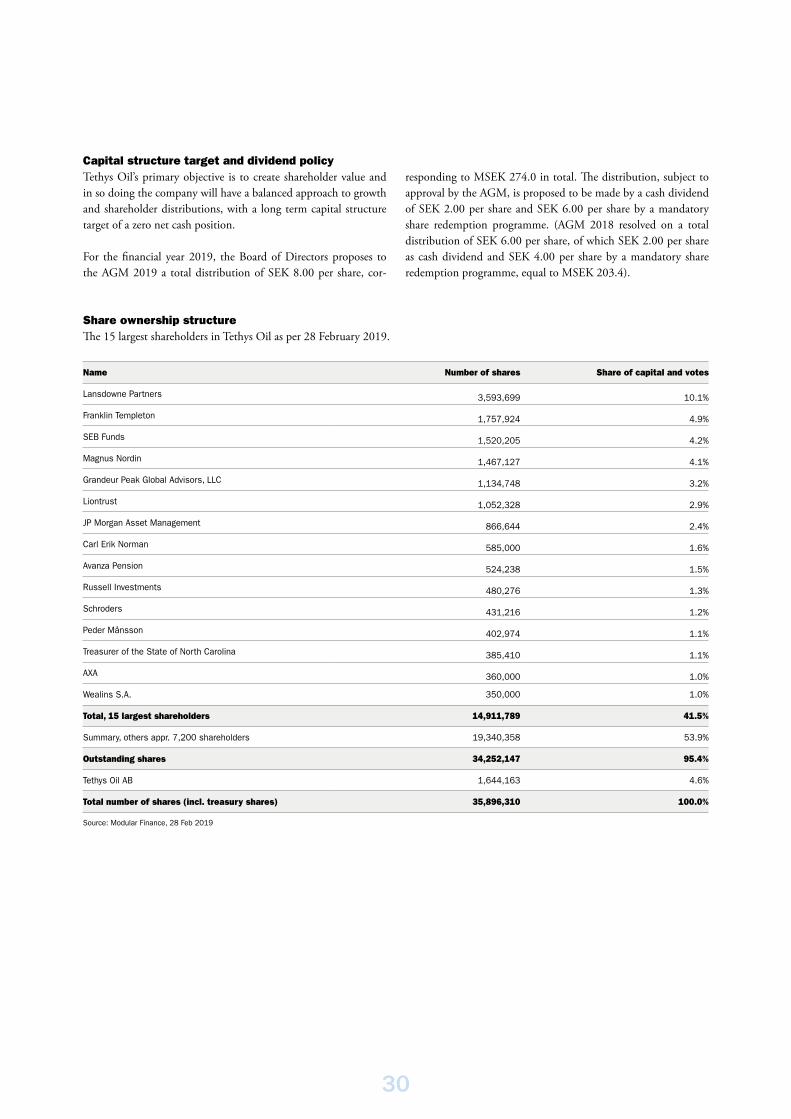
Capital structure target and dividend policyTethys Oil’s primary objective is to create shareholder value and in so doing the company will have a balanced approach to growth and shareholder distributions, with a long term capital structure target of a zero net cash position.
For the financial year 2019, the Board of Directors proposes to the AGM 2019 a total distribution of SEK 8.00 per share, cor-
responding to MSEK 274.0 in total. The distribution, subject to approval by the AGM, is proposed to be made by a cash dividend of SEK 2.00 per share and SEK 6.00 per share by a mandatory share redemption programme. (AGM 2018 resolved on a total distribution of SEK 6.00 per share, of which SEK 2.00 per share as cash dividend and SEK 4.00 per share by a mandatory share redemption programme, equal to MSEK 203.4).
Share ownership structureThe 15 largest shareholders in Tethys Oil as per 28 February 2019.
Name Number of shares Share of capital and votes
Lansdowne Partners 3,593,699 10.1%
Franklin Templeton 1,757,924 4.9%
SEB Funds 1,520,205 4.2%
Magnus Nordin 1,467,127 4.1%
Grandeur Peak Global Advisors, LLC 1,134,748 3.2%
Liontrust 1,052,328 2.9%
JP Morgan Asset Management 866,644 2.4%
Carl Erik Norman 585,000 1.6%
Avanza Pension 524,238 1.5%
Russell Investments 480,276 1.3%
Schroders 431,216 1.2%
Peder Månsson 402,974 1.1%
Treasurer of the State of North Carolina 385,410 1.1%
AXA 360,000 1.0%
Wealins S.A. 350,000 1.0%
Total, 15 largest shareholders 14,911,789 41.5%
Summary, others appr. 7,200 shareholders 19,340,358 53.9%
Outstanding shares 34,252,147 95.4%
Tethys Oil AB 1,644,163 4.6%
Total number of shares (incl. treasury shares) 35,896,310 100.0%
Source: Modular Finance, 28 Feb 2019

31
Distribution of shareholdingsDistribution of shareholdings per 28 February 2019.
HoldingNumber of
sharesPercentage of
sharesNumber of
shareholdersPercentage of shareholders
1 – 500 540,115 1,5% 5,741 79.7%
501 – 1,000 525,730 1,5% 637 8.8%
1,001 – 5,000 1,276,841 3,6% 540 7.5%
5,001 – 10,000 626,751 1,8% 86 1.2%
10,001 – 15,000 488,465 1,4% 38 0.5%
15,001 – 20,000 379,860 1,1% 21 0.3%
20,001 – 32,058,548 89,3% 141 2.0%
Total 35,896,310 100,0% 7,204 100.0%
Source: Euroclear, 28 Feb 2019
SEK
0
30
60
90
120
Share price development and turnover 2018
TurnoverShare priceShare volumeper day
0
400,000
800,000
1,200,000
1,600,000
FebJan2019
DecNovOctSepAugJulJunMayAprMarFebJan2018
Share statistics 2018The final transaction price in 2018 was SEK 64.77 correspond-ing to a total market capitalization of MSEK 2,325. During the year the price of Tethys Oil’s share decreased by 1.5 percent.
Based on data from NASDAQ Stockholm, the highest transaction price in 2018 was SEK 113.00 on 13 August and the lowest was SEK 58.80 on 9 February. The turnover velocity (annual turnover/outstanding shares) was 97 percent on Nasdaq Stockholm.

32
Payments to authorities 2018
This report has been prepared in accordance with the law SFS 2015:812 (Lag 2015:812 om rapportering av betalningar till myndigheter) regarding payments to authorities. The reported amounts refer to direct payments in excess of the threshold amount
of SEK 860,000 and production sharing for the fiscal year 2018 for the group in which Tethys Oil AB (publ) (“Tethys Oil”) is the parent company.
Per project
Project Production sharing License costs Total
Barrels (’000) USD (’000) USD (’000) USD (’000)
Oman
Blocks 3&4 2,062 144,873 – 144,873
Block 49 – – 250 250
Total Oman 2,062 144,873 250 145,123
Total 2,062 144,873 250 145,123
Per Authority
Production sharing License costs Total
Barrels (’000) USD (’000) USD (’000) USD (’000)
Sultanate of Oman – Ministry of Oil & Gas 2,062 144,873 100 144,973
Sultanate of Oman – Ministry of Finance – – 150 150
Total Oman 2,062 144,873 250 145,123
Total 2,062 144,873 250 145,123
Production sharingThe category includes non-cash taxes and compensation to receiv-ing state/authority in barrels of oil from Tethys Oil’s working interest share of production. The presented amounts are based on net entitlement and have been valued using the reported average price for the period.
License costsThis pertains to costs for maintaining the exploration license for Oman Block 49 where payment was made to Oman’s Ministry of Oil and Gas and Oman’s Ministry of Finance.
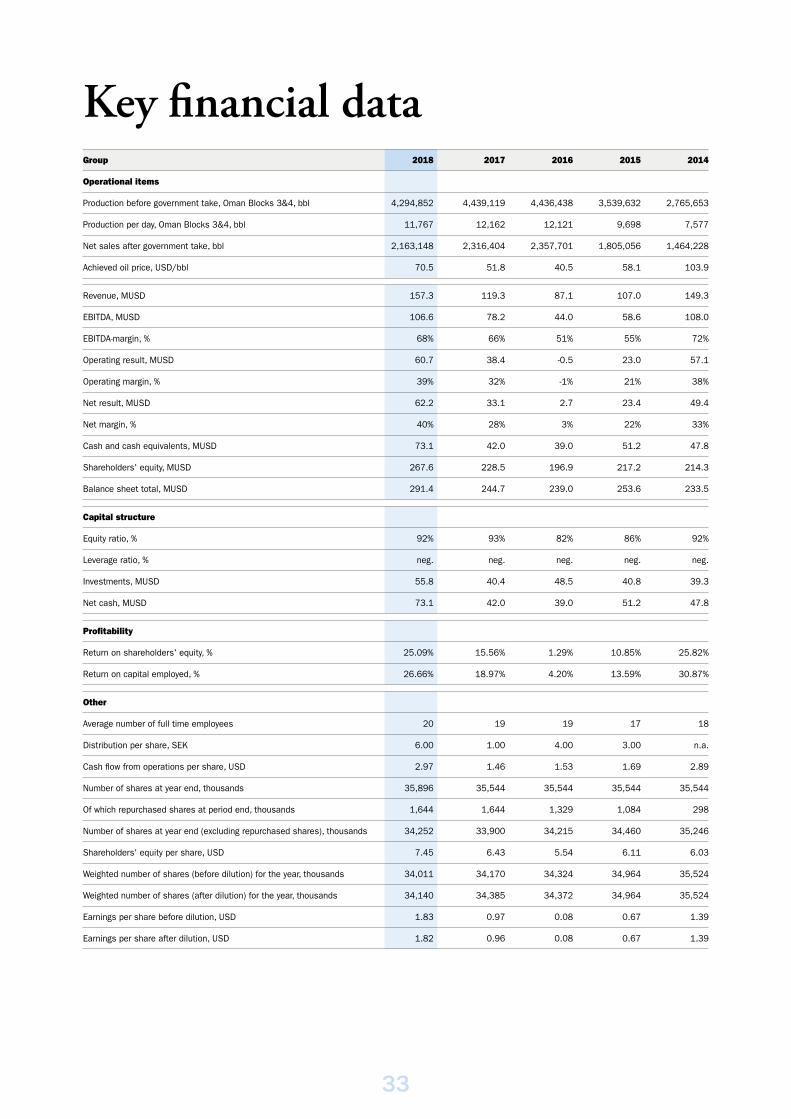
33
Group 2018 2017 2016 2015 2014
Operational items
Production before government take, Oman Blocks 3&4, bbl 4,294,852 4,439,119 4,436,438 3,539,632 2,765,653
Production per day, Oman Blocks 3&4, bbl 11,767 12,162 12,121 9,698 7,577
Net sales after government take, bbl 2,163,148 2,316,404 2,357,701 1,805,056 1,464,228
Achieved oil price, USD/bbl 70.5 51.8 40.5 58.1 103.9
Revenue, MUSD 157.3 119.3 87.1 107.0 149.3
EBITDA, MUSD 106.6 78.2 44.0 58.6 108.0
EBITDA-margin, % 68% 66% 51% 55% 72%
Operating result, MUSD 60.7 38.4 -0.5 23.0 57.1
Operating margin, % 39% 32% -1% 21% 38%
Net result, MUSD 62.2 33.1 2.7 23.4 49.4
Net margin, % 40% 28% 3% 22% 33%
Cash and cash equivalents, MUSD 73.1 42.0 39.0 51.2 47.8
Shareholders' equity, MUSD 267.6 228.5 196.9 217.2 214.3
Balance sheet total, MUSD 291.4 244.7 239.0 253.6 233.5
Capital structure
Equity ratio, % 92% 93% 82% 86% 92%
Leverage ratio, % neg. neg. neg. neg. neg.
Investments, MUSD 55.8 40.4 48.5 40.8 39.3
Net cash, MUSD 73.1 42.0 39.0 51.2 47.8
Profitability
Return on shareholders' equity, % 25.09% 15.56% 1.29% 10.85% 25.82%
Return on capital employed, % 26.66% 18.97% 4.20% 13.59% 30.87%
Other
Average number of full time employees 20 19 19 17 18
Distribution per share, SEK 6.00 1.00 4.00 3.00 n.a.
Cash flow from operations per share, USD 2.97 1.46 1.53 1.69 2.89
Number of shares at year end, thousands 35,896 35,544 35,544 35,544 35,544
Of which repurchased shares at period end, thousands 1,644 1,644 1,329 1,084 298
Number of shares at year end (excluding repurchased shares), thousands 34,252 33,900 34,215 34,460 35,246
Shareholders' equity per share, USD 7.45 6.43 5.54 6.11 6.03
Weighted number of shares (before dilution) for the year, thousands 34,011 34,170 34,324 34,964 35,524
Weighted number of shares (after dilution) for the year, thousands 34,140 34,385 34,372 34,964 35,524
Earnings per share before dilution, USD 1.83 0.97 0.08 0.67 1.39
Earnings per share after dilution, USD 1.82 0.96 0.08 0.67 1.39
Key financial data

34
Definitions of key ratios
Relevant reconciliations of alternative performance measures
MUSD 2018 2017 2016 2015 2014
Operating result 60.7 38.4 -0.5 23.0 57.1
Add: Depreciation, depletion and amortization 45.9 39.5 44.4 34.7 31.1
Add: Exploration costs – 0.3 0.1 1.0 19.8
EBITDA 106.6 78.2 44.0 58.6 108.0
Cash and bank 73.1 42.0 39.0 51.2 47.8
Less: Interest bearing debt – – – – –
Net cash 73.1 42.0 39.0 51.2 47.8
MarginsOperating margin Operating result as a percentage of yearly turnover.
Net margin Net result as a percentage of yearly turnover.
EBITDA-marginEBITDA as a percentage of yearly turnover.
Capital structureEquity ratio Shareholders’ equity as a percentage of total assets.
Leverage ratioNet interest bearing debt as a percentage of shareholders’ equity.
Net cash/net debt Cash and equivalents less interest bearing debt.
Investments Total investments during the year.
ProfitabilityReturn on shareholders’ equity Net result as percentage of average share-holders’ equity.
Return on capital employed Net result plus financial costs as a per-centage of average capital employed (total assets less non interests-bearing liabilities).
OtherNumber of employees Average number of employees full-time.
Shareholders’ equity per share Shareholders’ equity divided by the num-ber of outstanding shares.
Weighted numbers of shares Weighted number of shares during the year. Earnings per share Net result divided by the number of out-standing shares.
n.a. Not applicable.
n.m. Not meaningful.
Tethys Oil discloses alternative performance measures as part of its financial statements prepared in accordance with ESMA’s (Euro-pean Securities and Markets Authority) guidelines. Tethys Oil believes that the alter-native performance measures provide use-ful supplemental information to manage-
ment, investors, security analysts and other stakeholders. They are meant to provide an enhanced insight into the financial devel-opment of Tethys Oil’s business operations and improve comparability between peri-ods. Alternative performance measures are not defined under IFRS and should not be
viewed as a substitute for financial informa-tion presented in accordance with IFRS but rather as a complement. Reconciliations of relevant alternative performance measures are provided on the following page. Defini-tions of the performance measures are pro-vided under the key ratio definitions below.
Definitions and abbreviations
SEK Swedish krona
TSEK Thousands of Swedish kronor
MSEK Millions of Swedish kronor
USD US dollar
TUSD Thousands of US dollars
MUSD Million US dollars
bbl Oil production is often given in numbers of barrels per day. One barrel of oil = 159 litres, Barrel Volume measurement.
bopd Barrels of Oil per Day
mbo Thousand Barrels
mmbo Million Barrels
Definitions and abbreviations
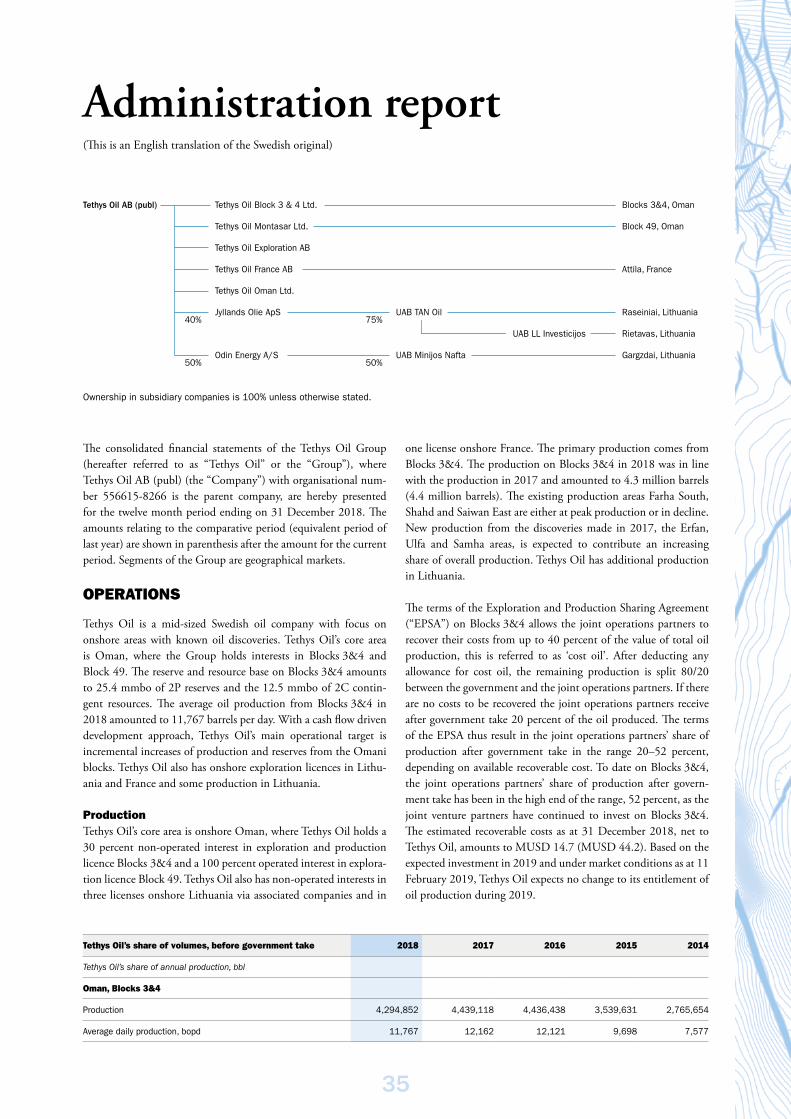
35
Administration report(This is an English translation of the Swedish original)
The consolidated financial statements of the Tethys Oil Group (hereafter referred to as “Tethys Oil” or the “Group”), where Tethys Oil AB (publ) (the “Company”) with organisational num-ber 556615-8266 is the parent company, are hereby presented for the twelve month period ending on 31 December 2018. The amounts relating to the comparative period (equivalent period of last year) are shown in parenthesis after the amount for the current period. Segments of the Group are geographical markets.
OPERATIONS
Tethys Oil is a mid-sized Swedish oil company with focus on onshore areas with known oil discoveries. Tethys Oil’s core area is Oman, where the Group holds interests in Blocks 3&4 and Block 49. The reserve and resource base on Blocks 3&4 amounts to 25.4 mmbo of 2P reserves and the 12.5 mmbo of 2C contin-gent resources. The average oil production from Blocks 3&4 in 2018 amounted to 11,767 barrels per day. With a cash flow driven development approach, Tethys Oil’s main operational target is incremental increases of production and reserves from the Omani blocks. Tethys Oil also has onshore exploration licences in Lithu-ania and France and some production in Lithuania.
Production Tethys Oil’s core area is onshore Oman, where Tethys Oil holds a 30 percent non-operated interest in exploration and production licence Blocks 3&4 and a 100 percent operated interest in explora-tion licence Block 49. Tethys Oil also has non-operated interests in three licenses onshore Lithuania via associated companies and in
one license onshore France. The primary production comes from Blocks 3&4. The production on Blocks 3&4 in 2018 was in line with the production in 2017 and amounted to 4.3 million barrels (4.4 million barrels). The existing production areas Farha South, Shahd and Saiwan East are either at peak production or in decline. New production from the discoveries made in 2017, the Erfan, Ulfa and Samha areas, is expected to contribute an increasing share of overall production. Tethys Oil has additional production in Lithuania.
The terms of the Exploration and Production Sharing Agreement (“EPSA”) on Blocks 3&4 allows the joint operations partners to recover their costs from up to 40 percent of the value of total oil production, this is referred to as ‘cost oil’. After deducting any allowance for cost oil, the remaining production is split 80/20 between the government and the joint operations partners. If there are no costs to be recovered the joint operations partners receive after government take 20 percent of the oil produced. The terms of the EPSA thus result in the joint operations partners’ share of production after government take in the range 20–52 percent, depending on available recoverable cost. To date on Blocks 3&4, the joint operations partners’ share of production after govern-ment take has been in the high end of the range, 52 percent, as the joint venture partners have continued to invest on Blocks 3&4. The estimated recoverable costs as at 31 December 2018, net to Tethys Oil, amounts to MUSD 14.7 (MUSD 44.2). Based on the expected investment in 2019 and under market conditions as at 11 February 2019, Tethys Oil expects no change to its entitlement of oil production during 2019.
Tethys Oil AB (publ) Tethys Oil Block 3 & 4 Ltd. Blocks 3&4, Oman
Tethys Oil Montasar Ltd. Block 49, Oman
Tethys Oil Exploration AB
Tethys Oil France AB Attila, France
Tethys Oil Oman Ltd.
40%Jyllands Olie ApS
75%UAB TAN Oil Raseiniai, Lithuania
UAB LL Investicijos Rietavas, Lithuania
50%Odin Energy A/S
50%UAB Minijos Nafta Gargzdai, Lithuania
Ownership in subsidiary companies is 100% unless otherwise stated.
Tethys Oil’s share of volumes, before government take 2018 2017 2016 2015 2014
Tethys Oil’s share of annual production, bbl
Oman, Blocks 3&4
Production 4,294,852 4,439,118 4,436,438 3,539,631 2,765,654
Average daily production, bopd 11,767 12,162 12,121 9,698 7,577

36
Reserves and contingent resourcesOman, Blocks 3&4 Tethys Oil’s net working interest Reserves in Blocks 3&4 Oman as at 31 December 2018 amount to 25,357 thousand barrels of oil (“mbo”) of proven and probable Reserves (2P). The 2P reserve replacement ratio amounts to 177 percent. In addition, Tethys Oil’s net working interest resources oil base in Oman amounts to 12,533 mbo of 2C contingent resources. The Company’s 2018 and 2017 year-end Reserves reports were audited by ERC Equipoise Limited (“ERCE”) as independent qualified Reserves evaluator.
Development of reserves, Blocks 3&4 (audited)
mbo 1P 2P 3P
Total 31 December 2017 15,559 22,044 32,414
Production 2018 -4,295 -4,295 -4,295
Additions and revisions 5,471 7,608 7,765
Total 31 December 2018 16,735 25,357 35,884
Reserve replacement ratio, % 127 177 181
Additions and revisions include maturation of over 4 mmbo of con-tingent resources to Reserves from the ongoing appraisal program of the 2017 discoveries as well as upside revisions of the Reserves on the Farha South, Shahd and Erfan fields and a small amount of Reserves attributable to the Tibyan discovery, the exploration well drilled in 2018.
Based on ERCE’s model, Tethys Oil’s net entitlement Reserves (Reserves after government take) amount to 7,781 mbo of 1P, 10,477 mbo of 2P and 13,824 mbo of 3P.
In addition to Reserves, Tethys Oil also announces contingent resources. The estimated contingent resources are contained in the discoveries made in 2017. Development of the contingent resources is contingent on the results of the on-going appraisal programme and also a work programme and budget to access these resources.
Contingent resources Blocks 3&4 (audited)
mbo 1C 2C 3C
Total 31 December 2018 5,472 12,533 24,767
The audit of the Reserves in Oman have been conducted using 2018 Petroleum Resources Management System (PRMS2018), sponsored by the Society of Petroleum Engineers (SPE), World Petroleum Coun-cil (WPC), American Association of Petroleum Geologists (AAPG) and Society of Petroleum Evaluation Engineers (SPEE).
Revenue and other income
Revenue and other income 2018 2017 2016 2015 2014
Oil sold, bbl 2,163,148 2,316,404 2,357,701 1,805,056 1,464,228
Underlift (overlift) movement, bbl 70,174 -8,062 -50,754 35,552 -26,088
Net barrels produced, after government take, bbl 2,233,323 2,308,342 2,306,947 1,840,608 1,438,140
Oil price, USD/bbl 70.5 51.8 40.5 58.1 103.9
Revenue, MUSD 152.6 119.9 95.4 104.9 152.1
Underlift (overlift) adjustments, MUSD 4.7 (0.6) (2.4) 2.2 (2.8)
Overlift adjustment reporting error, MUSD – – (5.9) – –
Revenue and other income, MUSD 157.3 119.3 87.1 107.0 149.3
Revenue and other income for 2018 is up 32 percent compared to 2017 and the main reason is the increase in the oil price which is up 36 percent between the years. There has been a change from overlift to underlift position from 2017 to 2018.
20182017201620152014201320122010 2011
Average daily production net to Tethys Oil, yearly
0
2,000
4,000
6,000
8,000
10,000
12,000
bopd

37
During 2018, Tethys Oil sold 2,163,148 barrels of oil from Blocks 3&4, representing a seven percent decrease in comparison with 2017 when 2,316,404 barrels of oil were sold. This resulted in revenue during 2018 of MUSD 152.6 compared to MUSD 119.9 during 2017. In addition to revenue, there has been an adjust-ment for underlift amounting to MUSD 4.7 which together with revenue adds up to revenue and other income of MUSD 157.3 in 2018.
The average selling price amounted to USD 70.5 per barrel during 2018, 36 percent higher compared to 2017.
Sale quantities for oil sales are nominated two months in advance and are not based upon the actual production in a month; as a result, sales quantities can be above or below production quanti-ties. Where the sales quantity exceeds the quantity of barrels pro-duced an overlift position occurs and where it is less, an underlift position occurs. There was a movement from overlift to underlift between year-end 2018 and 2017. The total underlift position as per 31 December 2018 is 34,083 barrels. The valuation of both over and underlift is based on market price.
Tethys Oil sells all of its oil through Mitsui Energy Trading Singa-pore, which is part of Mitsui & Co Ltd. All oil sales originate from Blocks 3&4 and are made on a monthly basis. The selling price is based on the monthly average price of the two-month future con-tract of Oman blend as traded on the Dubai Mercantile Exchange, including trading and quality adjustments.
Operating expenses
Operating expenses, Blocks 3&4 2018 2017 2016 2015 2014
Production costs, MUSD 42.6 32.6 33.5 38.4 32.7
Well workovers, MUSD 3.4 2.3 3.1 4.5 4.4
Total operating expenses, MUSD 45.9 34.9 36.5 42.9 37.2
Operating expenses per barrel, USD 10.7 7.9 8.2 12.1 13.4
Production costs relate to oil production on Blocks 3&4, and comprise expenses for throughput fees, energy, consumables, field staff, maintenance, as well as administration, including operator overhead. Well workovers and interventions relate to downhole work and replacing of electric submersible pumps enabling shut-in wells to restart production. The work programme for well work-overs for the year was increased.
Production costs and well workover together make up operating expenses, amounting to MUSD 45.9 in 2018, which were higher than MUSD 34.9 during 2017. The majority of production comes from mature fields where many wells have higher production costs, compared to new production wells, due to increased maintenance, water handling and energy requirements to maintain production.The cost for rented equipment also increased in 2018.
Depletion, depreciation and amortisation
DD&A, Blocks 3&4 2018 2017 2016 2015 2014
DD&A, MUSD 45.9 39.5 44.4 34.6 31.0
DD&A per barrel, USD 10.7 8.9 10.0 9.8 11.2
Depletion, depreciation and amortisation (“DD&A”) for 2018 amounted to MUSD 45.9, which is higher than 2017 and attrib-utable to an increased DD&A rate per barrel. The DD&A charge relates to Blocks 3&4.
Netback
Netback, Blocks 3&4, USD/bbl 2018 2017 2016 2015 2014
Oil price achieved (sales barrels) 70.5 51.8 40.5 58.1 103.9
Revenue (after government take) 36.7 27.0 21.0 30.2 54.0
Operating expenses 10.7 7.9 8.2 12.1 13.4
Netback 26.0 19.1 12.8 18.1 40.6
The increase in netback per barrel during 2018 has mainly been driven by the oil price development.
Administrative expensesAdministrative expenses amounted to MUSD 5.7 for 2018 com-pared to MUSD 5.9 during 2017. Administrative expenses are mainly salaries, rents, listing costs and external services. Admin-istrative expenses have been stable between years 2018 and 2017.
Net financial resultThe net financial result for 2018 of MUSD 1.5 (MUSD -5.3)has been impacted by gains and losses due to changes in foreign exchange rates due to the USD strengthening against the SEK, net MUSD 1.6, as well as interest income of MUSD 0.3 and other financial expenses of MUSD -0.4. Currency translation differences recorded on loans between the parent company and subsidiaries are non-cash related items. Interest and fees related to the credit facility, which expired during the first quarter 2018, amounted to MUSD 0.0.
TaxTethys Oil’s oil and gas operations in Oman are governed by an Exploration and Production Sharing Agreement for each licence (“EPSA”) whereby Tethys Oil receives its share of oil after govern-ment take. Under the terms of each EPSA, Tethys Oil is subject to Omani income taxes and royalties, which are paid in full, on behalf of Tethys Oil, from the government share of oil. The effect of these taxes is netted against revenue and other income in the income statement.
ResultTethys Oil reports a net result after tax for 2018 of MUSD 62.2, representing earnings per share of USD 1.82. The result for 2018 is up compared to 2017. Net result is mainly up due to the higher oil prices.

38
Investments and work programme Summary of oil and gas interests (MUSD):
Country/Asset
Book value 31 Dec
2018
Investments Jan–Dec
2018
Book value 31 Dec
2017
Investments Jan–Dec
2017
Oman Blocks 3&4 194.0 50.4 189.1 39.9
Oman Block 49 5.7 5.3 0.4 0.4
Lithuania – – – –
France – – – –
New ventures 0.3 0.1 0.2 0.1
Total 200.0 55.8 189.7 40.4
During 2018, total investments amounted to MUSD 55.8, of which 50.4 relate to Blocks 3&4. Investments during the year have been higher than investments in 2017 primarily due to more activity within geology and geophysics on Blocks 3&4 as well as the seismic acquisition on Block 49.
Blocks 3&4
Investments Blocks 3&4, MUSD 2018 2017 2016 2015 2014
Drilling 25.5 26.6 30.3 20.5 19.8
G&G 11.2 4.2 4.5 8.9 6.6
Facilities 13.7 9.1 13.4 11.3 11.9
Total investments Blocks 3&4 50.4 39.9 48.2 40.7 38.3
Three rigs and one workover unit have been operating and a total of 44 wells were completed on Blocks 3&4 during 2018.
Wells completed 2018 (primary purpose)
Discoveries made in
2017
Farha South Field
Shahd and Saiwan East
Fields
Near and far field
exploration Total
Appraisal/Production 7 17 1 – 25
Water injection – 15 1 – 16
Water source – – 1 – 1
Exploration – – – 2 2
Total 7 32 3 2 44
Discoveries made in 2017The appraisal programme of the Ulfa and Samha discoveries has been one of the central components of the investments during 2018. It was initiated in the first quarter 2018 with the objec-tive to mature contingent resources into reserves and to optimise plans for future production by gathering data on volumes, reser-voir quality and continuity, fluid levels and productivity. Both the Buah and the Khufai reservoir sections are being appraised. Cores are taken for analysis and advanced logging is being conducted.
In 2018, four appraisal wells were drilled on the Ulfa field. Ulfa-2 and Ulfa-3 were completed in the second quarter 2018. Ulfa-2 was drilled in the western part of Ulfa discovery and Ulfa-3 was drilled even farther west to appraise the western flank in order to define the reservoir’s extent/boundary and oil/water contact. Both Ulfa-2 and Ulfa-3 were completed as producers from the Khu-
fai layer. Ulfa-4 and Ulfa-5 were successfully drilled in the fourth quarter 2018 and encountered oil as expected. Ulfa-4 was drilled to appraise and produce the eastern part of Ulfa discovery and Ulfa-5 was drilled south of the discovery well in the central part in order to produce from the Buah formation. One well was com-pleted as producer in the Khufai and one in the Buah reservoirs. The drilling of appraisal well Ulfa-6 also commenced in the fourth quarter 2018.
Two new appraisal wells were drilled on Samha in 2018. The Samha-2 well was successfully drilled in the third quarter 2018 and encountered oil as expected. The well was drilled to appraise the southeastern part of Samha discovery. The Samha-3 well was successfully drilled in the fourth quarter 2018 and encountered oil as expected. The Samha-3 well was drilled south of the Samha-2 well and was completed as producers in the Khufai reservoir.
The construction of the Ulfa EPF was finalized in the fourth quar-ter and the facility was in full production towards the very end of the year. The EPF includes separators, heater treaters and pipe-lines. A new pipeline has been constructed to connect the Ulfa EPF with the Saiwan East production facility. Following the com-missioning of the EPF, wells on Ulfa and Samha were connected to Ulfa EPF and put into production. Some of the new wells at Ulfa and Samha had previously been temporary connected to the Farha South production facility. The commissioning of the EPF has released capacity at the Farha South production facility.
The majority of the information gathered in 2018 from the appraisal wells on Ulfa and Samha were as, or slightly better than, expected. However, the revised time plan for the Ulfa EPF resulted in a delay of the part of the appraisal programme that relates to pressure data and production levels. This affected the proportion of the contingent resources converted into reserves by year-end. More comprehensive data is being gathered as the Ulfa EPF has come on stream, which is important to continue the maturation process.
The Erfan discovery was appraised by two wells in addition to the discovery well already in 2017. A further appraisal well, Erfan-4, was drilled during the second quarter 2018. Erfan-4 was drilled centrally on the structure in order to drain and evaluate an area between Erfan-2 and Erfan-3. The well encountered oil and was connected to the Saiwan East production facilities.
Block 3: Farha South FieldNine appraisal/production wells were drilled in previously undrilled fault blocks on the Farha South oil field. All wells were drilled vertically down to the targeted Barik sandstone. Four wells encountered oil and were connected to the Farha South produc-tion facility. Eight production wells were also drilled on producing fault blocks on Farha South. The wells have been connected to the Farha South production facility. In addition, 15 water injection wells were drilled on the field.
Block 4: Shahd and Saiwan East oil fields One production well was drilled on the Shahd oil field in 2018. The well encountered oil and was connected to the production system. One side track was also drilled in an old well on the Shahd field. In addition, one water injection well and one water source well was drilled.

39
Exploration on Blocks 3&4The testing of the exploration well Luja-1, that was drilled in the southern part of Block 4 in the first quarter 2018, has been final-ised. Luja-1 was drilled about 110 km southwest of the Shahd field. The well reached a total depth (TVD) of 3,609 m. Since the well is located far from the infrastructure facilities on the pro-ducing fields, a supporting field camp was required in order to enable comprehensive testing operations. Oil was encountered and oil samples were taken from both the AbuMahara group and the Khufai formation. However, the well did not flow oil to surface during testing. The well has been plugged. The results are positive and confirm a live petroleum system in the area. A comprehensive post drilling analysis will be conducted in order to assess the other leads identified in the Southern part of Block 4.
The exploration well Tibyan-1 was spudded and completed in the first quarter. Tibyan-1 is located about nine km southwest of the Erfan-1 discovery. The target of the well was the Khufai formation which resulted in a new smaller oil discovery. The well was con-nected to the production system during the second quarter 2018.
The drilling of two exploration wells commenced in the fourth quarter 2018. One well is located about 11 km east of the Farha South infrastructure to explore deeper sections of Block 3. The second well, a near field Ulfa/Samha analogy well, is located about 10 km northeast of the Ulfa discovery.
Seismic acquisitionA seismic acquisition programme on Blocks 3&4 was launched in the fourth quarter 2017. The programme covered three areas on Blocks 3&4. On the first two areas, 1,200 km2 area east of the Ulfa discovery and 800 km2 area north-west of the Farha South field, seismic acquisition and processing were completed in the first half of 2018. Interpretation and mapping of the processed data con-tinues. The exploration well that was spudded in late 2018 east of Farha South infrastructure is within this 3D seismic area and the location is a result of the interpretation of the new seismic. The seismic acquisition on the third area, 750 km2 south of the Shahd field, was completed in September 2018 and the data is being processed.
Block 49Investments on Block 49 during 2018 amounted to MUSD 5.3, compared to MUSD 0.4 during 2017. The investments primarily relate to the seismic campaign that was launched and completed during the fourth quarter 2018.
Tethys Oil was awarded the exploration license for Block 49 in the fourth quarter 2017. Block 49 covers an area of 15,439 km2 in the south-west of Oman. More than 11,000 km of 2D seismic acquired by previous operators has been made available to Tethys Oil. Nine wells have been drilled within the block boundaries, sev-eral of which are reported to have encountered oil shows.
In the fourth quarter 2018, Tethys Oil launched a seismic cam-paign on Block 49, whereby 253 km2 of 3D and 299 km of 2D seismic data were acquired in the north-eastern part of the license area. The purpose of the seismic campaign is to further define
possible oil traps and to enhance the understanding of the deeper parts of the block in general. The data is being processed and will, when interpreted, guide the continued work on Block 49.
Through the reprocessing of some 1,464 km of older 2D seismic data, acquired by previous operators, a number of seismic anoma-lies have been identified, which could be possible – primarily stratigraphic – oil traps. The anomalies have been identified within the deeper formations in the block at depths of 2,500 metres or below. After integration of all available data in Tethys Oil’s geologi-cal model, the presence of source rock as well as potential reservoir rocks have also been confirmed.
New venturesIn December 2018, Tethys Oil announced that it had entered into an agreement to acquire a two percent participating interest in Block 53 onshore Oman from Total E&P Oman, a wholly-owned subsidiary of Total S.A. Block 53 holds the Mukhaizna oil field, the single largest producing oil field in Oman. The Mukhaizna field is a giant heavy-oil development operated by Occidental Petroleum, with an average gross daily production in excess of 100,000 bopd. The closing of the acquisition was subject to government approval and the waiver of partner pre-emption rights. Tethys Oil was in the first quarter 2019 informed by the seller that partner pre-emption rights have been exercised, and as a result Tethys Oil will not be able to complete the transaction.
A number of new venture projects have been reviewed in 2018 and several continue to be evaluated.
Associated companiesLithuaniaThe interest in the three Lithuanian licences is held indirectly through a shareholding in two Danish private companies, which in turn hold shares in Lithuanian companies holding 100 per-cent of the licences. The two companies are consolidated through a one-line consolidation in Tethys Oil’s financial statements and are presented in the balance sheet under “Investments in associ-ates” and in the income statement as “Share of net profit/loss from associates”.
As at 31 December 2018, the value of the shareholding in the two associated Danish companies holding the interests in Lithuanian licenses, amounted to MUSD 0.0 compared to MUSD 0.0 at the end of 2017. Share of net profit/loss from associated companies amounted to MUSD 0.9 following receipt of dividends during 2018 (-0.3). The book value related to Minijos Nafta (Gargzdai) is zero and as there are no formal or informal obligations related to Minijos Nafta, Tethys Oil does not recognize any negative net result from Minijos Nafta.
Production on the Gargzdai licence has decreased following natu-ral decline of the wells. During 2018, an average of 15 wells were in production on the license. A 100 km 2D seismic acquisition was conducted during 2018 on Gargzdai licence in order to further delineate the Kintai structure. The seismic data has been processed and is being interpreted.
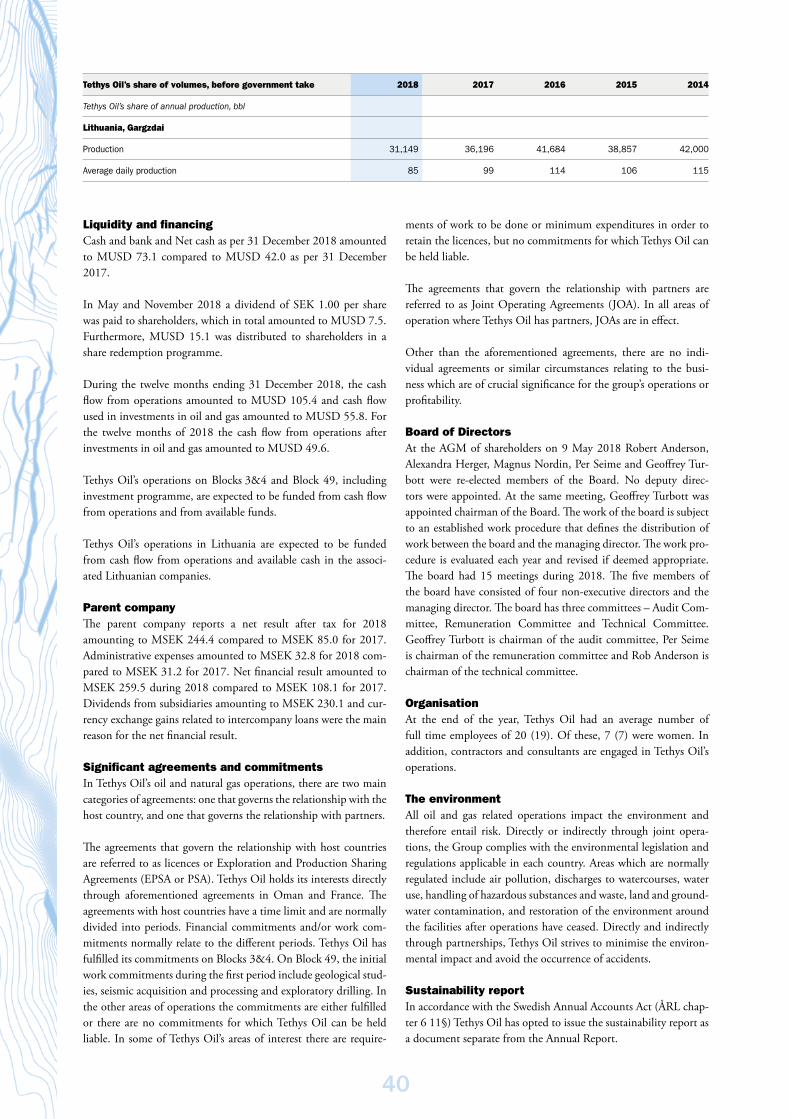
40
Liquidity and financingCash and bank and Net cash as per 31 December 2018 amounted to MUSD 73.1 compared to MUSD 42.0 as per 31 December 2017.
In May and November 2018 a dividend of SEK 1.00 per share was paid to shareholders, which in total amounted to MUSD 7.5. Furthermore, MUSD 15.1 was distributed to shareholders in a share redemption programme.
During the twelve months ending 31 December 2018, the cash flow from operations amounted to MUSD 105.4 and cash flow used in investments in oil and gas amounted to MUSD 55.8. For the twelve months of 2018 the cash flow from operations after investments in oil and gas amounted to MUSD 49.6.
Tethys Oil’s operations on Blocks 3&4 and Block 49, including investment programme, are expected to be funded from cash flow from operations and from available funds.
Tethys Oil’s operations in Lithuania are expected to be funded from cash flow from operations and available cash in the associ-ated Lithuanian companies.
Parent companyThe parent company reports a net result after tax for 2018 amounting to MSEK 244.4 compared to MSEK 85.0 for 2017. Administrative expenses amounted to MSEK 32.8 for 2018 com-pared to MSEK 31.2 for 2017. Net financial result amounted to MSEK 259.5 during 2018 compared to MSEK 108.1 for 2017. Dividends from subsidiaries amounting to MSEK 230.1 and cur-rency exchange gains related to intercompany loans were the main reason for the net financial result.
Significant agreements and commitmentsIn Tethys Oil’s oil and natural gas operations, there are two main categories of agreements: one that governs the relationship with the host country, and one that governs the relationship with partners.
The agreements that govern the relationship with host countries are referred to as licences or Exploration and Production Sharing Agreements (EPSA or PSA). Tethys Oil holds its interests directly through aforementioned agreements in Oman and France. The agreements with host countries have a time limit and are normally divided into periods. Financial commitments and/or work com-mitments normally relate to the different periods. Tethys Oil has fulfilled its commitments on Blocks 3&4. On Block 49, the initial work commitments during the first period include geological stud-ies, seismic acquisition and processing and exploratory drilling. In the other areas of operations the commitments are either fulfilled or there are no commitments for which Tethys Oil can be held liable. In some of Tethys Oil’s areas of interest there are require-
ments of work to be done or minimum expenditures in order to retain the licences, but no commitments for which Tethys Oil can be held liable.
The agreements that govern the relationship with partners are referred to as Joint Operating Agreements (JOA). In all areas of operation where Tethys Oil has partners, JOAs are in effect.
Other than the aforementioned agreements, there are no indi-vidual agreements or similar circumstances relating to the busi-ness which are of crucial significance for the group’s operations or profitability.
Board of Directors At the AGM of shareholders on 9 May 2018 Robert Anderson, Alexandra Herger, Magnus Nordin, Per Seime and Geoffrey Tur-bott were re-elected members of the Board. No deputy direc-tors were appointed. At the same meeting, Geoffrey Turbott was appointed chairman of the Board. The work of the board is subject to an established work procedure that defines the distribution of work between the board and the managing director. The work pro-cedure is evaluated each year and revised if deemed appropriate. The board had 15 meetings during 2018. The five members of the board have consisted of four non-executive directors and the managing director. The board has three committees – Audit Com-mittee, Remuneration Committee and Technical Committee. Geoffrey Turbott is chairman of the audit committee, Per Seime is chairman of the remuneration committee and Rob Anderson is chairman of the technical committee.
OrganisationAt the end of the year, Tethys Oil had an average number of full time employees of 20 (19). Of these, 7 (7) were women. In addition, contractors and consultants are engaged in Tethys Oil’s operations.
The environmentAll oil and gas related operations impact the environment and therefore entail risk. Directly or indirectly through joint opera-tions, the Group complies with the environmental legislation and regulations applicable in each country. Areas which are normally regulated include air pollution, discharges to watercourses, water use, handling of hazardous substances and waste, land and ground-water contamination, and restoration of the environment around the facilities after operations have ceased. Directly and indirectly through partnerships, Tethys Oil strives to minimise the environ-mental impact and avoid the occurrence of accidents.
Sustainability reportIn accordance with the Swedish Annual Accounts Act (ÅRL chap-ter 6 11§) Tethys Oil has opted to issue the sustainability report as a document separate from the Annual Report.
Tethys Oil’s share of volumes, before government take 2018 2017 2016 2015 2014
Tethys Oil’s share of annual production, bbl
Lithuania, Gargzdai
Production 31,149 36,196 41,684 38,857 42,000
Average daily production 85 99 114 106 115
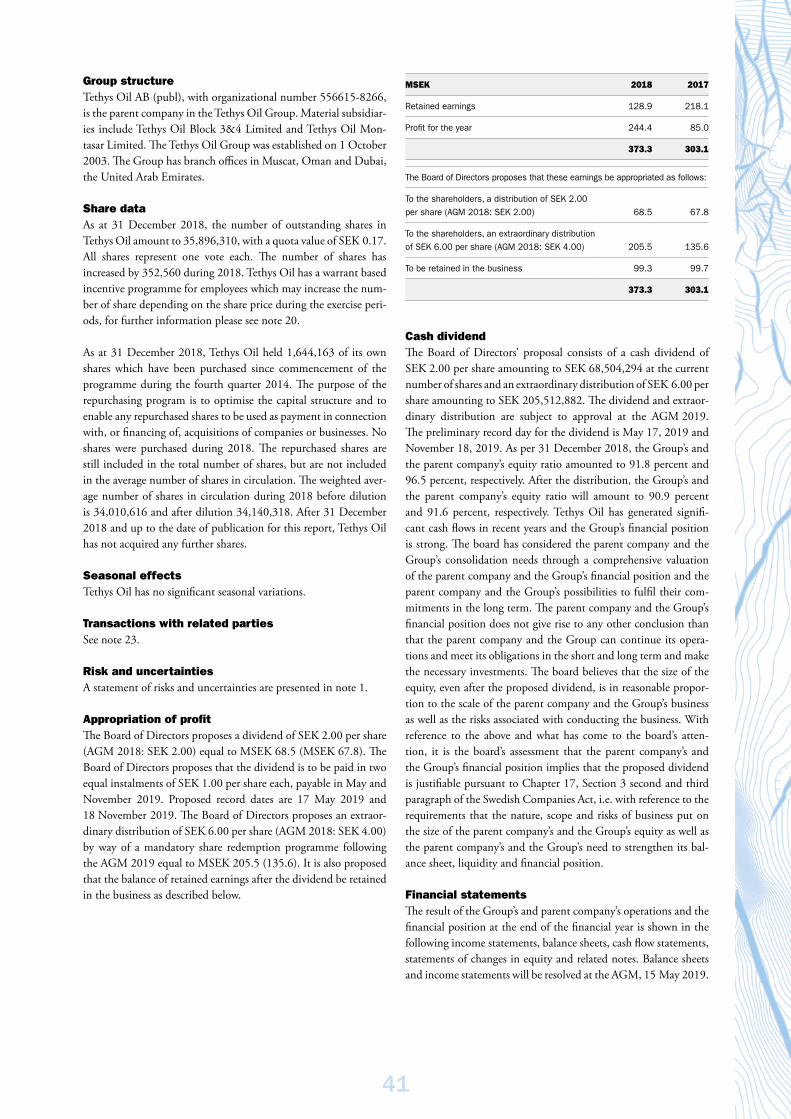
41
Group structure Tethys Oil AB (publ), with organizational number 556615-8266, is the parent company in the Tethys Oil Group. Material subsidiar-ies include Tethys Oil Block 3&4 Limited and Tethys Oil Mon-tasar Limited. The Tethys Oil Group was established on 1 October 2003. The Group has branch offices in Muscat, Oman and Dubai, the United Arab Emirates.
Share data As at 31 December 2018, the number of outstanding shares in Tethys Oil amount to 35,896,310, with a quota value of SEK 0.17. All shares represent one vote each. The number of shares has increased by 352,560 during 2018. Tethys Oil has a warrant based incentive programme for employees which may increase the num-ber of share depending on the share price during the exercise peri-ods, for further information please see note 20.
As at 31 December 2018, Tethys Oil held 1,644,163 of its own shares which have been purchased since commencement of the programme during the fourth quarter 2014. The purpose of the repurchasing program is to optimise the capital structure and to enable any repurchased shares to be used as payment in connection with, or financing of, acquisitions of companies or businesses. No shares were purchased during 2018. The repurchased shares are still included in the total number of shares, but are not included in the average number of shares in circulation. The weighted aver-age number of shares in circulation during 2018 before dilution is 34,010,616 and after dilution 34,140,318. After 31 December 2018 and up to the date of publication for this report, Tethys Oil has not acquired any further shares.
Seasonal effectsTethys Oil has no significant seasonal variations.
Transactions with related partiesSee note 23.
Risk and uncertainties A statement of risks and uncertainties are presented in note 1.
Appropriation of profitThe Board of Directors proposes a dividend of SEK 2.00 per share (AGM 2018: SEK 2.00) equal to MSEK 68.5 (MSEK 67.8). The Board of Directors proposes that the dividend is to be paid in two equal instalments of SEK 1.00 per share each, payable in May and November 2019. Proposed record dates are 17 May 2019 and 18 November 2019. The Board of Directors proposes an extraor-dinary distribution of SEK 6.00 per share (AGM 2018: SEK 4.00) by way of a mandatory share redemption programme following the AGM 2019 equal to MSEK 205.5 (135.6). It is also proposed that the balance of retained earnings after the dividend be retained in the business as described below.
MSEK 2018 2017
Retained earnings 128.9 218.1
Profit for the year 244.4 85.0
373.3 303.1
The Board of Directors proposes that these earnings be appropriated as follows:
To the shareholders, a distribution of SEK 2.00 per share (AGM 2018: SEK 2.00) 68.5 67.8
To the shareholders, an extraordinary distribution of SEK 6.00 per share (AGM 2018: SEK 4.00) 205.5 135.6
To be retained in the business 99.3 99.7
373.3 303.1
Cash dividendThe Board of Directors’ proposal consists of a cash dividend of SEK 2.00 per share amounting to SEK 68,504,294 at the current number of shares and an extraordinary distribution of SEK 6.00 per share amounting to SEK 205,512,882. The dividend and extraor-dinary distribution are subject to approval at the AGM 2019. The preliminary record day for the dividend is May 17, 2019 and November 18, 2019. As per 31 December 2018, the Group’s and the parent company’s equity ratio amounted to 91.8 percent and 96.5 percent, respectively. After the distribution, the Group’s and the parent company’s equity ratio will amount to 90.9 percent and 91.6 percent, respectively. Tethys Oil has generated signifi-cant cash flows in recent years and the Group’s financial position is strong. The board has considered the parent company and the Group’s consolidation needs through a comprehensive valuation of the parent company and the Group’s financial position and the parent company and the Group’s possibilities to fulfil their com-mitments in the long term. The parent company and the Group’s financial position does not give rise to any other conclusion than that the parent company and the Group can continue its opera-tions and meet its obligations in the short and long term and make the necessary investments. The board believes that the size of the equity, even after the proposed dividend, is in reasonable propor-tion to the scale of the parent company and the Group’s business as well as the risks associated with conducting the business. With reference to the above and what has come to the board’s atten-tion, it is the board’s assessment that the parent company’s and the Group’s financial position implies that the proposed dividend is justifiable pursuant to Chapter 17, Section 3 second and third paragraph of the Swedish Companies Act, i.e. with reference to the requirements that the nature, scope and risks of business put on the size of the parent company’s and the Group’s equity as well as the parent company’s and the Group’s need to strengthen its bal-ance sheet, liquidity and financial position.
Financial statementsThe result of the Group’s and parent company’s operations and the financial position at the end of the financial year is shown in the following income statements, balance sheets, cash flow statements, statements of changes in equity and related notes. Balance sheets and income statements will be resolved at the AGM, 15 May 2019.
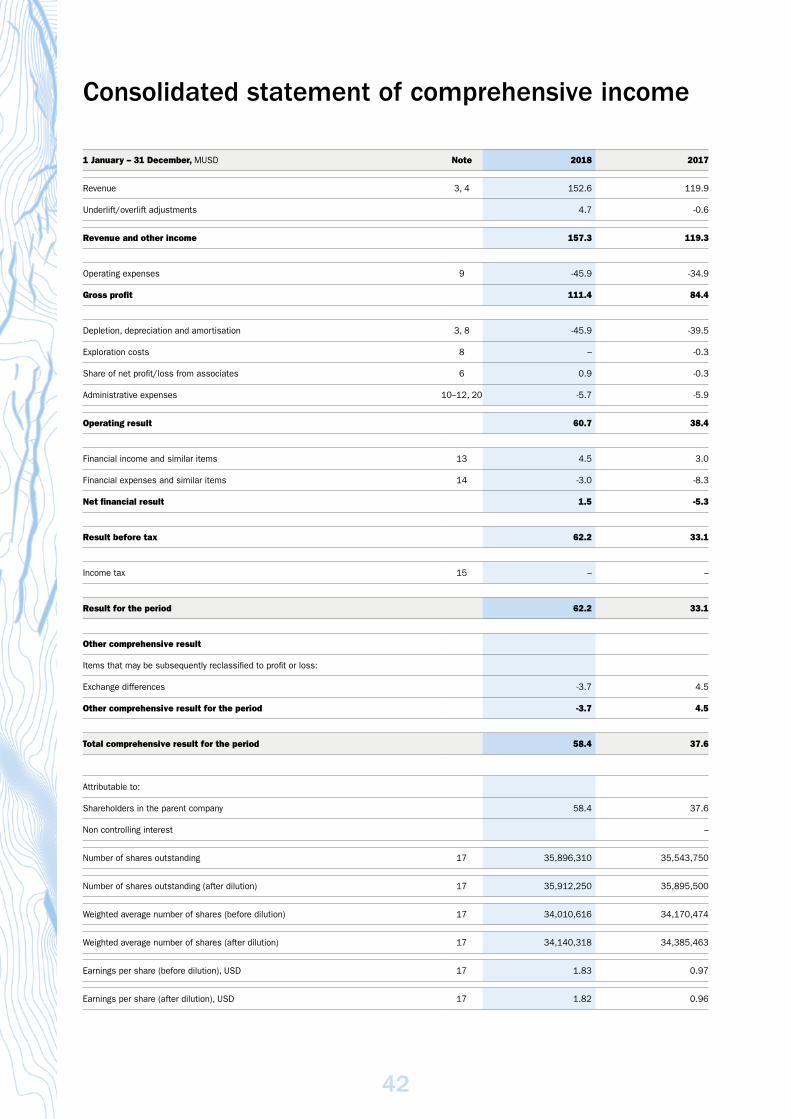
42
Consolidated statement of comprehensive income
1 January – 31 December, MUSD Note 2018 2017
Revenue 3, 4 152.6 119.9
Underlift/overlift adjustments 4.7 -0.6
Revenue and other income 157.3 119.3
Operating expenses 9 -45.9 -34.9
Gross profit 111.4 84.4
Depletion, depreciation and amortisation 3, 8 -45.9 -39.5
Exploration costs 8 – -0.3
Share of net profit/loss from associates 6 0.9 -0.3
Administrative expenses 10–12, 20 -5.7 -5.9
Operating result 60.7 38.4
Financial income and similar items 13 4.5 3.0
Financial expenses and similar items 14 -3.0 -8.3
Net financial result 1.5 -5.3
Result before tax 62.2 33.1
Income tax 15 – –
Result for the period 62.2 33.1
Other comprehensive result
Items that may be subsequently reclassified to profit or loss:
Exchange differences -3.7 4.5
Other comprehensive result for the period -3.7 4.5
Total comprehensive result for the period 58.4 37.6
Attributable to:
Shareholders in the parent company 58.4 37.6
Non controlling interest –
Number of shares outstanding 17 35,896,310 35,543,750
Number of shares outstanding (after dilution) 17 35,912,250 35,895,500
Weighted average number of shares (before dilution) 17 34,010,616 34,170,474
Weighted average number of shares (after dilution) 17 34,140,318 34,385,463
Earnings per share (before dilution), USD 17 1.83 0.97
Earnings per share (after dilution), USD 17 1.82 0.96
Financial statements for the group

43
Consolidated balance sheet
As at 31 December, MUSD Note 2018 2017
ASSETS
Non current assets
Oil and gas properties 8 200.0 189.7
Office equipment 0.1 0.0
Investment in associates 6 – 0.0
200.1 189.7
Current assets
Other receivables 16 17.9 12.7
Prepaid expenses 0.3 0.3
Cash and cash equivalents 1 73.1 42.0
91.3 55.0
TOTAL ASSETS 291.4 244.7
SHAREHOLDERS' EQUITY AND LIABILITIES
Shareholders' equity 17
Share capital 0.8 0.8
Additional paid in capital 74.0 71.0
Reserves -0.3 3.4
Retained earnings 193.1 153.3
Total shareholders' equity 267.6 228.5
Non current liabilities
Non current provisions 7 8.9 9.1
8.9 9.1
Current liabilities
Current provisions 7 1.0 1.0
Accounts payable and other current liabilities 18 13.9 6.1
Loan facility – –
14.9 7.1
Total liabilities 23.8 16.2
TOTAL SHAREHOLDERS' EQUITY AND LIABILITIES 291.4 244.7
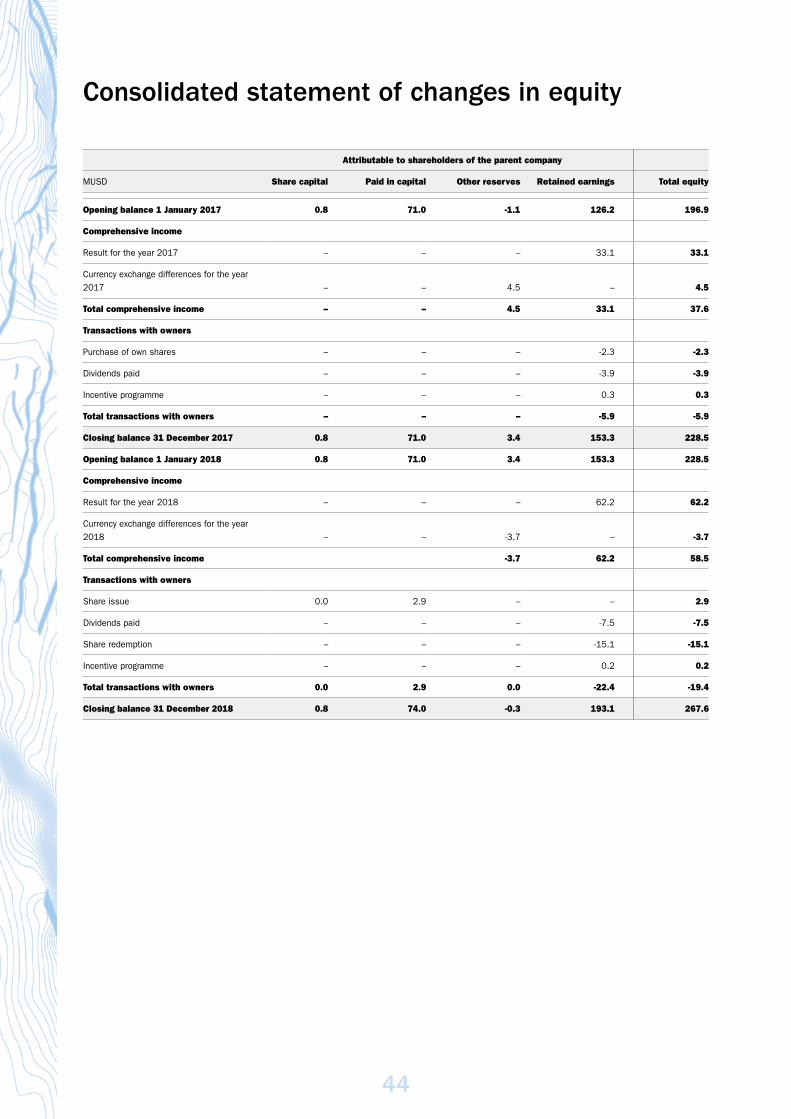
44
Consolidated statement of changes in equity
Attributable to shareholders of the parent company
MUSD Share capital Paid in capital Other reserves Retained earnings Total equity
Opening balance 1 January 2017 0.8 71.0 -1.1 126.2 196.9
Comprehensive income
Result for the year 2017 – – – 33.1 33.1
Currency exchange differences for the year 2017 – – 4.5 – 4.5
Total comprehensive income – – 4.5 33.1 37.6
Transactions with owners
Purchase of own shares – – – -2.3 -2.3
Dividends paid – – – -3.9 -3.9
Incentive programme – – – 0.3 0.3
Total transactions with owners – – – -5.9 -5.9
Closing balance 31 December 2017 0.8 71.0 3.4 153.3 228.5
Opening balance 1 January 2018 0.8 71.0 3.4 153.3 228.5
Comprehensive income
Result for the year 2018 – – – 62.2 62.2
Currency exchange differences for the year 2018 – – -3.7 – -3.7
Total comprehensive income -3.7 62.2 58.5
Transactions with owners
Share issue 0.0 2.9 – – 2.9
Dividends paid – – – -7.5 -7.5
Share redemption – – – -15.1 -15.1
Incentive programme – – – 0.2 0.2
Total transactions with owners 0.0 2.9 0.0 -22.4 -19.4
Closing balance 31 December 2018 0.8 74.0 -0.3 193.1 267.6

45
Consolidated cash flow statement
1 January – 31 December, MUSD Note 2018 2017
Cash flow from operations
Operating result 60.7 38.4
Interest received 13 0.3 –
Interest paid 14 0.0 -0.2
Adjustment for exploration costs 8 – 0.3
Adjustment for depletion, depreciation and other non-cash related items 8 41.7 38.2
Total cash flow from operations before change in working capital 102.7 76.7
Change in receivables -7.2 -5.4
Change in liabilities 9.9 -21.2
Cash flow from operations 105.4 50.1
Investment activity
Investment in oil and gas properties 8 -55.8 -40.4
Investment in office equipment -0.1 –
Cash from associated companies, net 0.9 –
Cash flow from investment activity -55.0 -40.4
Financing activity
Purchase of own shares 17 – -2.3
Share redemption -15.1 –
Dividend -7.5 -3.9
Proceeds from share issue 2.9 –
Cash flow from financing activity -19.7 -6.2
Period cash flow 30.7 3.5
Cash and cash equivalents at the beginning of the period 42.0 39.0
Exchange gains/losses on cash and cash equivalents 0.5 -0.5
Cash and cash equivalents at the end of the period 73.1 42.0

46
Parent company income statement
1 January – 31 December, MSEK Note 2018 2017
Other income 5 9.7 10.9
Share of net profit/loss from associates 6 8.0 -2.8
Administrative expenses 10–12, 20 -32.8 -31.2
Operating result -15.1 -23.1
Financial income and similar items 13 282.7 164.6
Financial expenses and similar items 14 -23.2 -53.6
Write down of shares in subsidiaries 19 -0.0 -2.9
Net financial result 259.5 108.1
Result before tax 244.4 85.0
Income tax 15 – –
Result for the year1 244.4 85.0
1 As there are no items in the parent company’s other comprehensive income, no separate report on total comprehensive income is presented.
Financial statements for the parent company

47
Parent company balance sheet
As at 31 December, MSEK Note 2018 2017
ASSETS
Non-current assets
Other fixed assets 0.0 0.1
Shares in subsidiaries 19 1.0 0.9
Long term receivables from subsidiaries 222.0 355.6
Investment in associates 6 – 0.0
223.0 356.6
Current assets
Other receivables 16 2.3 5.5
Prepaid expenses 0.9 0.7
Cash and cash equivalents 1 240.2 58.2
243.4 64.4
TOTAL ASSETS 466.5 421.0
SHAREHOLDERS' EQUITY AND LIABILITIES
Shareholders' equity 17
Restricted equity:
Share capital 5.9 5.9
Statutory reserve 71.1 71.1
Unrestricted equity:
Share premium reserve 481.0 481.0
Retained earnings -352.1 -262.9
Result for the year 244.4 85.0
Total shareholders' equity 450.3 380.1
Current liabilities
Accounts payable and other current liabilities 18 3.9 5.7
Other current liabilities to subsidiaries 12.2 35.2
Total liabilities 16.2 40.9
TOTAL SHAREHOLDERS' EQUITY AND LIABILITIES 466.5 421.0

48
Parent company statement of changes in equity
Restricted equity Unrestricted equity
MSEKShare
capitalStatutory
reserve
Share premiumreserve
Retainedearnings
Netresult Total equity
Opening balance 1 January 2017 5.9 71.1 481.0 -235.2 23.4 346.2
Transfer of prior year net result – – – 23.4 -23.4 –
Comprehensive income
Result for the year 2017 – – – – 85.0 85.0
Period result – – – – 85.0 85.0
Total comprehensive income – – – – 85.0 85.0
Transactions with owners
Purchase of own shares – – – -19.3 – -19.3
Dividends paid – – – -34.2 – -34.2
Incentive programme – – – 2.4 – 2.4
Total transactions with owners – – – -51.1 – -51.1
Closing balance 31 December 2017 5.9 71.1 481.0 -262.9 85.0 380.1
Opening balance 1 January 2018 5.9 71.1 481.0 -262.9 85.0 380.1
Transfer of prior year net result – – – 85.0 -85.0 –
Comprehensive income
Result for the year 2018 – – – – 244.4 244.4
Period result – – – – 244.4 244.4
Total comprehensive income – – – – 244.4 244.4
Transactions with owners
Impacting share issue 0.0 – – 25.9 – 25.9
Dividends paid – – – -68.1 – -68.1
Share redemption – – – -135.6 – -135.6
Incentive programme – – – 2.1 – 2.1
Total transactions with owners – – – -175.7 – -175.7
Merger difference – – – 1.5 – 1.5
Closing balance 31 December 2018 5.9 71.1 481.0 -352.1 245.9 450.3

49
Parent company cash flow statement
1 January – 31 December, MSEK Note 2018 2017
Cash flow from operations
Operating result -15.1 -23.1
Interest received 13 0.2 0.0
Interest paid 14 0.0 0.0
Adjustment for non cash related items -3.0 -3.1
Total cash flow from operations before change in working capital -17.9 -26.2
Change in receivables 3.0 -2.7
Change in liabilities -4.4 -0.2
Cash flow from operations -19.3 -29.1
Investment activity
Dividend from subsidiaries 210.0 –
Investment in long term receivables 164.0 43.4
Cash flow from investment activity 374.0 43.4
Financing activity
Purchase of own shares 17 – -19.3
Issuance of shares 17 25.9 –
Dividends paid -68.1 -34.2
Share redemption -135.6 –
Cash flow from financing activity -177.8 -53.5
Cash flow for the year 176.9 -39.2
Cash and cash equivalents at the beginning of the year 58.2 104.6
Exchange gains on cash and cash equivalents 5.1 -7.2
Cash and cash equivalents at the end of the year 240.2 58.2

50
Notes
General informationTethys Oil AB (publ) (“the Company”), corporate identity number 556615- 8266, and its subsidiaries (together “the Group” or “Tethys Oil”) are focused on exploration for and production of oil and natural gas. The Group has interests in exploration licences in Oman, France and Lithuania. The Company is a limited liability company incorporated and domiciled in Stock-holm, Sweden. The Company is listed on Nasdaq Stockholm.
These consolidated financial statements have been approved for issue by the Board of Directors on 3 April 2019.
Basis of preparationThe annual report of Tethys Oil AB/the Group have been prepared in accord-ance with prevailing International Financial Reporting Standards (IFRS) and IFRS Interpretations Committee (IFRIC) interpretations adopted by the EU Commission and the Swedish Annual Accounts Act (1995:1554). In addi-tion, RFR 1 “Supplementary Rules for Groups” has been applied as issued by the Swedish Financial Reporting Board.
The preparation of financial statements in conformity with IFRS requires the use of certain critical accounting estimates. It also requires management to exercise its judgement in the process of applying the Group’s accounting policies. The areas involving a higher degree of judgement or complexity, or areas where assumptions and estimates are significant to the consolidated financial statements are disclosed in note 2.
The consolidated financial statements have been prepared under the his-torical cost basis except as disclosed in the accounting policies below.
Accounting principlesThe accounting principles applied in the preparation of these consolidated financial statements are set out below. The same accounting principles were used in the 2017 Annual report, save for the implementation of IFRS 9 and 15 which came into effect on 1 January 2018, and have been consist-ently applied to all the years presented. The Annual report of the Group has been prepared in accordance with International Financial Reporting Standards (IFRS) as adopted by the EU, the Annual Accounts Act and RFR 1 “Supplementary rules for groups”. The Annual report for the parent com-pany has been prepared in accordance with the Annual Accounts Act and Swedish Financial Accounting Standards Council’s RFR 2 “Accounting for legal entities”. RFR 2 means that the parent company in the annual report for the legal entity shall apply IFRS’ rules and statements as adopted by the EU, so far this is possible within the framework of the Annual Accounts Act and with regard to the connection between accounting and taxation. The recommendation states which exceptions and additions that shall be or are allowed to be made from IFRS. The accounting principles of the parent com-pany are the same as for the Group, except in the cases specified below in the section entitled “Parent company accounting principles”.
New accounting principles for 2018IFRS 9 has come into effect with effective date 1 January 2018. IFRS 9 Financial instruments, addresses the classification, measurement and rec-ognition of financial assets and financial liabilities, introduced new rules for hedge accounting and a new impairment model for financial assets. IFRS 9 has not had any material effect on the financial reporting. IFRS 15 has come into effect with effective date 1 January 2018. IFRS 15 Revenue from contract with customers addresses revenue recognition and established principles for reporting useful information to users of financial statements. Based on this standard, certain transactions are no longer reported as rev-enue but as other income instead. IFRS 15 has not had any material effect on the financial reporting apart from changes in presentation.
New standards and interpretations not yet adoptedIFRS 16 Leases. In January 2016, IASB issued a new lease standard that will replace IAS 17 Leases and the related interpretations IFRIC 4, SIC-15 and SIC-27. The standard requires assets and liabilities arising from all leases, with some exceptions, to be recognised on the balance sheet. This model reflects that, at the start of a lease, the lessee obtains the right to use an asset for a period of time and has an obligation to pay for that right. The accounting for lessors will in all material aspects be unchanged. The
standard is effective for annual periods beginning on or after 1 January 2019.
Tethys Oil has chosen the modified retrospective method, applying the short-term lease and the asset of low value exceptions. The standard will primarily impact the accounting of the group’s operational leases. The cur-rent interpretation is that IFRS 16 does not relate to leases within the group’s joint operations and at present the group only has office leases and IT-servers/-programs and other leases concerning items of lesser value. Considering the few leases in the group, the preliminary assessment is that the standard will have no material impact on the Group.
MUSD
Closing balance
31 Dec 2018
before transi-
tion to IFRS 16
Leases
Estimated
reclassifications
due to transi-
tion to IFRS 16
Leases
Estimated
adjustment due
to transition
IFRS 16 Leases
Estimated
adjusted open-
ing balance
1 Jan 2019
Right-of-use
assets – – 0.7 0.7
Lease liabilities,
interest bearing – – 0.7 0.7
There are no other IFRSs or IFRIC interpretations that are not yet effective that would be expected to have a material impact on the Group.
Principles of consolidationSubsidiaries are all entities (including structured entities) over which the Group has control. The Group controls an entity when the Group is exposed to, or has rights to variable returns from, its involvement with the entity and has the ability to affect those returns through its power over the entity. Sub-sidiaries are fully consolidated from the date on which control is transferred to the Group. They are de-consolidated from the date that control ceases.
The Group uses the acquisition method of accounting to account for busi-ness combinations. The consideration transferred for the acquisition of a subsidiary is the fair values of the assets transferred, the liabilities incurred and the equity interests issued by the Group. The consideration transferred includes the fair value of any asset or liability resulting from a contingent consideration arrangement. Acquisition-related costs are expensed as incurred. Identifiable assets acquired and liabilities and contingent liabili-ties assumed in a business combination are measured initially at their fair values at the acquisition date. On an acquisition-by-acquisition basis, the Group recognises any non-controlling interest in the acquiree either at fair value or at the non-controlling interest’s proportionate share of the acquiree’s net assets.
Inter-company transactions, balances and unrealised gains on transac-tions between subsidiaries are eliminated. Unrealised losses are also eliminated. Accounting policies of subsidiaries have been changed where necessary to ensure consistency with the policies adopted by the Group.
Joint arrangementsUnder IFRS 11 Joint Arrangements, investments in joint arrangements are classified as either joint operations or joint ventures. The classifica-tion depends on the contractual rights and obligations of each investor, rather than the legal structure of the joint arrangement. Tethys Oil has joint operations.
Joint operationsTethys Oil recognises its direct right to the assets, liabilities, revenues and expenses of joint operations and its share of any jointly held or incurred assets, liabilities, revenues and expenses. These have been incorporated in the financial statements under the appropriate headings. The Group con-ducts oil- and gas operations as a joint operation that does not have a sepa-rate legal entity status through licenses which are held jointly with other companies. The Groups financial statements reflect the Group’s share of production, capital costs, operational costs, current assets and liabilities in the joint operations.

51
Associated companiesAn investment in an associated company is an investment in an undertak-ing where the Group exercises significant influence but not control, gener-ally accompanying a shareholding of at least 20 percent but not more than 50 percent of the voting rights. Such investments are accounted for in the consolidated financial statements in accordance with the equity method and are initially recognised at cost. The difference between the acquisi-tion cost of shares in an associated company and the net fair value of the assets, liabilities and contingent liabilities of the associated company rec-ognised at the date of acquisition is recognised as goodwill. The goodwill is included within the carrying amount of the investment and is assessed for impairment as part of the investment. The Group’s share in the post-acquisition results of the associated company is recognised in the income statement and the Group’s share in post-acquisition movements in other comprehensive income of the associated company is recognised directly in other comprehensive income of the Group. When the Group’s accumulated share of losses in an associated company equals or exceeds its interest in the associated company, the Group does not recognise further losses, unless it has incurred obligations or made payments on behalf of the asso-ciate. Dividends from associated companies are presented in the balance sheet under ”Investments in associates” and in the income statement as “Share of net profit/loss from associates”.
Unrealised gains on transactions between the Group and its associates are eliminated to the extent of the Group’s percentage in the associates. Unre-alised losses are also eliminated unless the transaction provides evidence of an impairment of the asset transferred. Accounting policies of associ-ates have been changed where necessary to ensure consistency with the policies adopted by the Group.
Foreign currenciesItems included in the financial statements of each of the Group’s entities are measured using the currency of the primary economic environment in which the entity operates (‘functional currency’). The consolidated financial statements are presented in US dollars (USD) which is the currency the Group has elected to use as the presentation currency.
Transactions and balancesMonetary assets and liabilities denominated in foreign currencies are translated at the rates of exchange prevailing at the balance sheet date and foreign exchange currency differences are recognised in the income statement. Transactions in foreign currencies are translated at exchange rates prevailing at the transaction date. Exchange differences are included in financial income/expenses in the income statement. Goodwill and fair value adjustments arising on the acquisition of a foreign entity are treated as assets and liabilities of the foreign entity and translated at the balance sheet rate of exchange.
Presentation currency The balance sheets and income statements of foreign subsidiaries are translated for consolidation purposes using the current rate method. All assets and liabilities of the subsidiary companies are translated at the balance sheet date rates of exchange, whereas the income statements are translated at average rates of exchange for the year, except for trans-actions where it is more relevant to use the rate of the day of the trans-action. The translation differences that arise are recorded directly in the foreign currency translation reserve within other comprehensive income. Upon disposal of a foreign operation, the translation differences relating to that operation will be transferred from equity to the income statement and included in the result on sale. Translation differences arising from net investments in subsidiaries, used for financing exploration activities, are recorded directly in other comprehensive income.
For the preparation of the financial statements for the reporting period, the following exchange rates have been used.
31 December 2018 31 December 2017
Currency 2018 Average 2018 Period end 2017 Average 2017 Period end
SEK/USD 8.75 9.14 8.67 9.42
SEK/EUR 10.32 10.42 9.73 9.80
Segment reportingOperating segments are based on geographic perspective and reported in a manner consistent with the internal reporting provided to the Executive Management.
Classification of assets and liabilitiesNon-current assets, long-term liabilities and provisions consist for the most part solely of amounts that are expected to be recovered or paid more than twelve months after the balance sheet date. Current assets and current liabilities consist solely of amounts that are expected to be recovered or paid within twelve months after the balance sheet date.
Oil and gas propertiesOil and gas properties are initially recorded at historical cost, where it is probable that they will generate future economic benefits. All costs for acquiring concessions, licences or interests in production sharing con-tracts and for the survey, drilling and development of such interests are capitalised on a field area cost centre basis. This includes capitalisation of decommissioning and restoration costs associated with provisions for asset retirement (see “Provisions”). Oil and gas properties are sub-sequently carried at cost less accumulated depreciation, depletion and amortisation (including any impairment). Gains and losses on disposals are determined by comparing the proceeds with the carrying amounts of assets sold and are recognised in income.
Routine maintenance and repair costs for producing assets are expensed to the income statement when they occur.
Proceeds from the sale or farm-out of oil and gas concessions in the explo-ration stage are off set against the related capitalised costs of each cost centre with any excess of net proceeds over all costs capitalised included in the income statement. In the event of a sale in the exploration stage any deficit is included in the income statement.
Oil and gas properties are categorised as either producing or non-producing.
Depreciation, depletion and amortisationProducing oil and gas properties are depleted on a unit-of-production basis over the proved and probable reserves of the field concerned, except in the case of assets whose useful lives differ from the lifetime of the field, in which case the straight-line method is applied.
In accordance with the unit of production method, net capitalised costs to reporting date, together with anticipated future capital costs for the devel-opment of the proved and probable reserves determined at the balance sheet date price levels, are depleted based on the year’s production in rela-tion to estimated total proved and probable reserves of oil and gas. Deple-tion of a field area is charged to the income statement once commercial production commences, under Depletion, depreciation and amortisation.
Proved reserves are those quantities of petroleum which, by analysis of geological and engineering data, can be estimated with reasonable cer-tainty to be commercially recoverable, from a given date forward, from known reservoirs and under current economic conditions, operating meth-ods and governmental regulations. Proved reserves can be categorised as developed or undeveloped. If deterministic methods are used, the term reasonable certainty is intended to express a high degree of confidence that the quantities will be recovered. If probabilistic methods are used, there should be at least a 90 percent probability that the quantities actually recovered will equal or exceed the estimates.
Probable reserves are those unproved reserves which analysis of geologi-cal and engineering data suggests are more likely than not to be recover-able. In this context, when probabilistic methods are used, there should be at least a 50 percent probability that the quantities actually recovered will equal or exceed the sum of estimated proved plus probable reserves.
Exploration costsExploration costs relate to non-producing oil and gas properties and are recognised in the income statement when a decision is made not to pro-ceed with an oil and gas project, or when expected future economic benefits of an oil and gas project are less than capitalised costs. No depletion is charged to non-producing oil and gas properties.
Costs related to non-producing oil and gas properties and directly asso-ciated with an exploration well are capitalised until the determination of reserves is evaluated. If it is determined that a commercial discovery has not been achieved, these exploration costs are charged to the income statement as exploration costs.

52
The field will be transferred from the non-production cost pool to the pro-duction cost pool within oil and gas properties once commercial production commences, and accounted for as a producing asset.
ImpairmentTethys Oil continuously assesses its producing oil and gas properties for any need for impairment. This is performed in conjunction with each bal-ance sheet date or if there are events or changes in circumstances that indicate that carrying values of assets may not be recoverable. Such indica-tors include changes in the Group’s business plans, relinquished licences, changes in raw materials prices leading to lower revenues and, for oil and gas properties, downward revisions of estimated reserve quantities.
Testing for impairment losses is performed for each cash generating unit, which corresponds to licence right, production sharing agreement or equiva-lent owned by Tethys Oil. A cash generating unit thus usually corresponds to each acquired asset in each country in which Tethys Oil carries on oil and gas operations. Impairment testing means that the balance sheet item amount for each cash generating unit is compared to the recoverable amount for the assets, which is the higher of the fair value of the assets less sales expenses and the value in use. The value in use of the assets is based on the present value of future cash flows discounted by a discount rate; see also note 8 under the section Impairment testing. An impairment loss is recorded when an asset’s or a cash generating unit’s recorded value exceeds the recoverable amount. Impairment losses are charged to the income statement.
InterestInterest on borrowings to finance the acquisition of producing oil and gas properties is charged to income as incurred. Interest on borrowings to finance fields under development is capitalized within oil and gas proper-ties until production commences.
Valuation principles financial itemsThe Group classifies its financial assets in the following categories: at fair value through profit or loss, loans and receivables and other liabilities. The classification depends on the purpose for which the financial assets were acquired. Management determines the classification of its financial assets at initial recognition.
Tethys Oil reports a financial asset or a financial liability in the balance sheet when it becomes a party to the instrument’s contractual terms. Tethys Oil derecognises a financial liability or part thereof when the obli-gation stated in the relevant contract is fulfilled or otherwise terminated.
Tethys Oil bases the fair value of financial instruments depending on avail-able market data at time of valuation. Data are categorised into three cat-egories: Level 1: quoted prices in active markets. Level 2: valuation based on observable market data. Level 3: valuation techniques incorporating information other than observable market data. The reported value – after any impairment – of accounts receivable and accounts payable is assumed to equate to their fair value, since these entries are short-term in nature.
a) Financial assets and liabilities at fair value through profit or lossFinancial assets and liabilities at fair value through profit or loss are finan-cial assets held for trading. Financial assets and liabilities are classified in this category if acquired principally for the purpose of selling in the short term. Derivatives are also categorised as held for trading unless they are designated as hedges. Assets and liabilities in this category are classified as current assets or liabilities if expected to be settled within 12 months; otherwise, they are classified as non-current. The Group did not have any financial assets held for trading during 2018.
b) Receivables and other receivablesReceivables and other receivables are non-derivative financial assets with fixed or determinable payments that are not quoted in an active market. They are included in current assets, except for maturities greater than 12 months after the end of the reporting period. These are classified as non-current assets. The group’s receivables comprise ‘trade and other receiva-bles’ and ‘cash and cash equivalents’ in the balance sheet. Receivables and other receivables are recognised initially at fair value and subsequently measured at amortised cost using the effective interest method. Assets are also measured less provision for impairment.
c) Other liabilitiesOther liabilities are non-derivative financial liabilities with fixed or determi-nable payments that are not quoted in an active market. They are included
in current liabilities, except for maturities greater than 12 months after the end of the reporting period. These are classified as non-current liabilities. Other liabilities are recognised initially at fair value and subsequently meas-ured at amortised cost using the effective interest method.
d) Impairment of financial assetsThe group assesses at the end of each reporting period whether there is objective evidence that a financial asset or group of financial assets is impaired. A financial asset or a group of financial assets is impaired and impairment losses are incurred only if there is objective evidence of impairment as a result of one or more events that occurred after the initial recognition of the asset (a ‘loss event’) and that loss event (or events) has an impact on the estimated future cash flows of the financial asset or group of financial assets that can be reliably estimated. For loans and receivables category, the amount of the loss is measured as the difference between the asset’s carrying amount and the present value of estimated future cash flows (excluding future credit losses that have not been incurred) dis-counted at the financial asset’s original effective interest rate. The carrying amount of the asset is reduced and the amount of the loss is recognised in the consolidated income statement.
Fixed assets other than oil and gasOther tangible fixed assets are stated at cost less accumulated depre-ciation. Depreciation is based on cost and is calculated on a straight line basis over the estimated economic life of 3 to 5 years for office equipment and other assets.
Additional costs to existing assets are included in the assets’ net book value or recognised as a separate asset, as appropriate, only when it is probable that future economic benefits associated with the item will flow to the Group and the cost of the item can be measured reliably.
The net book value of any replaced parts is written off. Other additional expenses are deemed to be repair and maintenance costs and are charged to the income statement when they are incurred. The net book value is writ-ten down immediately to its recoverable amount when the net book value is higher. The recoverable amount is the higher of an asset’s fair value less cost to sell and value in use.
Cash and cash equivalentsCash and cash equivalents comprise cash at bank and in hand, short-term deposits, money market funds and commercial paper that have a maturity of three months or less at the date of acquisition.
EquityShare capital consists of the registered share capital for the parent com-pany. Share issue costs associated with the issuance of new equity are treated as a direct reduction of proceeds. Excess contribution in relation to the issuance of shares is accounted for in the item additional paid-in-capital.
Should any Group company purchase parent company shares (repurchase of own shares) the proceeds including any directly attributable transaction costs (net after tax) will reduce equity attributable to the shareholders of the parent company until the shares are annulled or realized. If the shares are realized, proceeds net after directly attributable transaction costs and tax effects are shown in equity attributable to the shareholders of the par-ent company.
The currency translation reserve contains unrealised translation differ-ences due to the conversion of the functional currencies into the presenta-tion currency.
Retained earnings contain the accumulated results attributable to the shareholders of the parent company.
ProvisionsA provision is reported when Tethys Oil has a legal or constructive obligation as a consequence of an event and when it is more likely than not that an outflow of resources is required to settle the obligation and a reliable esti-mate can be made of the amount. Provisions are measured at the present value of the expenditures expected to be required to settle the obligation using a pre-tax rate that reflects current market assessments of the time value of money and the risks specific to the obligation. The increase in the provision due to passage of time is recognised as financial expense.
On fields where the Group is required to contribute to site restoration costs, a provision is recorded to recognise the future commitment. An asset is

53
created, as part of the oil and gas properties, to represent the discounted value of the anticipated site restoration liability and depleted over the life of the field on a unit of production basis. The corresponding accounting entry to the creation of the asset recognises the discounted value of the future liability. The discount applied to the anticipated site restoration liability is subsequently released over the life of the field and is charged to financial expenses. Changes in site restoration costs and reserves are treated prospectively and consistent with the treatment applied upon initial recognition.
RevenueRevenues from the sale of oil and gas are recognised in the income state-ment net of royalties in kind or in cash (government take). Revenues asso-ciated with the sale of crude oil are recognised at the fair value of the consideration received or receivable when the significant risks and rewards of ownership have been transferred, which is when title passes from Tethys Oil to the customer. For Tethys Oil’s operations, customers take title when the crude oil is loaded onto a tanker.
Underlift and overliftCrude oil and natural gas produced and sold, below or above Tethys Oil’s working interest share in the related oil and gas property, results in produc-tion underliftings, or overliftings. Underliftings are recorded as Other receiv-ables valued at market value, and overliftings are recorded in Other cur-rent liabilities and accrued at the market value. Underliftings are reversed from Other receivables when the crude oil is lifted and sold. Overliftings are reversed from Other current liabilities when sufficient volumes are pro-duced to make up the overlifted volume.
Profit oil and cost recoveryBlocks 3&4, being Tethys Oil’s main and only producing oil and gas prop-erty, is governed by an Exploration and Production Sharing Contract (EPSA). Under the EPSA, revenues are derived from cost recovery oil and gas and profit oil and gas. Cost recovery oil and gas allows Tethys Oil generally to recover all investments and operating expenses (CAPEX and OPEX). Profit oil and gas is allocated to the host government and contract parties in accordance with their respective equity interests.
OtherIncidental revenues from the production of oil and gas are offset against capitalised costs of the related cost centre until quantities of proven and probable reserves are determined or commercial production has com-menced. Service income, generated by providing technical and manage-ment services to joint operations, is recognised as other income.
Income taxesPresented income taxes include tax payable or tax receivable for the report-ing period, adjustments in regard to previous year’s taxes and changes in deferred tax.
Valuations of all tax liabilities/claims is in nominal amounts and are pre-pared in accordance with tax legislation and tax rates decided or announced and at which they are likely to be resolved.
The tax expense for the period comprises current and deferred tax. Tax is recognised in the income statement, except to the extent that it relates to items recognised in other comprehensive income or directly in equity. In this case, the tax is also recognised in other comprehensive income or directly in equity, respectively. Deferred income tax is recognised, using the liability method, on temporary differences arising between the tax bases of assets and liabilities and their carrying amounts in the consolidated finan-cial statements. Deferred income tax assets are recognised only to the extent that it is probable that future taxable profit will be available against which the temporary differences can be utilised.
Employee benefitsShort-term employee benefits such as salaries, social premiums and holi-day pay, are expensed when incurred.
Pension obligationsThe majority of the pension obligations of the Group are governed by legally required social costs. Additional pension schemes exists which are funded through payments to insurance companies. These are defined contribution plans. A defined contribution plan is a pension plan under which the group pays fixed contributions into a separate entity. The Group has no legal or constructive obligations to pay further contributions should this legal entity not hold sufficient assets to pay all employees the benefits relating to employee service in the current or prior periods.
Share based incentive programmeEquity-settled share based payments are recognized in the income state-ment as administrative expenses and as equity in the balance sheet. The option is measured at fair value at the date of grant using the Black & Scholes options pricing model and is charged to the income statement without revaluation of the value of the option.
Severance paySeverance pay is payable when employment is terminated by the Group before the normal retirement date, or whenever an employee accepts volun-tary redundancy in exchange for the severance pay. The Group recognises severance pay when it is demonstrably committed to either terminating the employment of current employees according to a detailed formal plan without possibility of withdrawal or providing severance pay as a result of an offer made to encourage voluntary redundancy. Benefits falling due more than 12 months after the balance sheet date are discounted to their pre-sent value.
Related party transactionsTethys Oil recognises the following related parties: associated companies, jointly controlled entities, members or the family of the key management personnel or other parties that are partly, directly or indirectly, controlled by key management personnel or of its family or of any individual that controls, or has joint control or significant influence over the entity.
Parent company accounting principles The parent company has prepared its Annual Report in compliance with Swedish Annual Accounts Act and recommendation RFR 2, Accounting for Legal Entities of the Swedish Financial Reporting Board. The implementa-tion of IFRS 9 Financial assets and IFRS 15 Revenue from contracts with customers had only limited impact of the accounting of the parent company. The effects are considered immaterial and there has not been a transition impact to the opening balances for 2018. See Note “New accounting prin-ciples for 2018” for more information.
Financial instrumentsAssets and liabilities are recognised initially at fair value plus transaction costs and subsequently measured at amortised cost unless stated other-wise. Financial assets are derecognised when the rights to receive cash flows from the investments have expired, or have been transferred and the Group has transferred substantially all risks and rewards of ownership.
SubsidiariesHoldings in subsidiaries are recognised in the parent company financial statements according to the cost method of accounting. The values of sub-sidiaries are tested for impairment when there is an indication of a decline in the value.
Group contributionsThe parent company uses the alternative method in accounting for group contributions and records paid as well as received contributions as appro-priations in the income statement.
TaxesThe parent company’s financial statements recognise untaxed reserves including deferred tax. The consolidated financial statements, however, reclassify untaxed reserves to deferred tax liability and equity.

54
Note 1, Risk managementThe Group’s activities expose it to a number of risks and uncertainties which are continuously monitored and reviewed. Presented below are the main risks and uncertainties of the group as identified by the directors and how the group handles these risks.
Operational risk managementTechnical and geological riskAt its current stage of development Tethys Oil is partly commercially produc-ing oil and partly exploring for and appraising undeveloped known oil and/ or natural gas accumulations. The operational risk is different in these different parts of Tethys Oil’s operations. The main operational risk in explo-ration and appraisal activities is that the activities and investments made by Tethys Oil and its partners will not evolve into commercial reserves of oil and gas.
Oil priceThe oil price is of significant importance to Tethys Oil in all parts of opera-tions as income and profitability is and will be dependent on prices pre-vailing from time to time. Significantly lower oil prices will reduce current and expected profitability in projects and can make projects sub economic. Lower oil prices could also decrease the industry interest in Tethys Oil’s projects regarding farmout or sale of assets. There were no oil price hedges in place as at 31 December 2018.
Tethys Oil’s has a flexible approach towards oil price hedging, based on an assessment of the benefits of the hedge contract in specific circum-stances. Based on analysis of the circumstances Tethys Oil will assess the benefits of forward hedging sales contracts for the purpose of establishing a secured cash flow. If Tethys Oil believes that the hedging contract will provide an enhanced cash flow or if the risk of not being able to meet investment commitments is high, then Tethys Oil may choose to enter into an oil price hedge.
Net result in financial statements (MUSD) 62.2 62.2
Shift in oil price (USD/barrel) +5 -5
Total effect on net result (MUSD) 10.9 -10.9
Access to equipmentAn operational risk factor is access to equipment in Tethys Oil’s project. Espe-cially in the drilling/development phase of a project, the Group is dependent on advanced equipment such as rigs, casing, pipes etc. A shortage of the-ses supplies can present difficulties for Tethys Oil to fulfil projects. Limited access to drilling rigs has in the past led to cost increases and has in part been the cause of project delays.
Political riskTethys Oil has operations, alone or with partners, in several different coun-tries and can therefore be subject to political risk. The political risks are monitored and factored in when evaluating possible projects. Asset diversi-fication is again Tethys Oil’s principal approach to deal with this risk. Specifi-cally, Tethys Oil also deals with political risk by emphasising continuous close dialog with host country authorities and interest groups, nationally as well as locally. Tethys Oil holds its oil and gas interest through licences, directly or indirectly, which are granted by national governments. Tethys Oil’s operations are often also subject to local permits. Therefore, Tethys Oil and the industry are subject to a wide range of political risks on different levels and the busi-ness is highly sensitive to political changes.
EnvironmentOil and gas operations can be environmentally sensitive. Tethys Oil devotes considerable effort and expense to identify and mitigate any perceived envi-ronmental risk. The operations are subject to extensive regulatory control with regard to environmental matters, both on national and international lev-els. Environmental legislation regulates inter alia the control of water and air contamination, waste material, licensing requirements, restrictions on carry-ing out operations in environmentally sensitive and littoral areas.
Key personnelTethys Oil is dependent on certain key personnel, some of whom have founded the Company at the same time as they are among the existing shareholders and members of the Board of Directors of the Company. These people are important for the successful development of Tethys Oil. The Com-pany actively tries to strike an optimal balance between its dependence of key personnel and its methods for retaining these.
LicensesTethys Oil’s direct interests are held through agreements with host countries, for example licenses or production sharing agreements. These agreements are often limited in time and there are no guarantees that the agreements can be extended when a time limit is reached.
Financial risk managementThe Group’s activities expose it to a variety of financial risks, mainly catego-rized as exchange rate risk and liquidity risk. The Group’s risks are continu-ously monitored and analysed by the Board of Directors and management. The aim is to minimise potential adverse effects on the Group’s financial performance.
Foreign currency riskThe Group is exposed to fluctuations in the foreign exchange markets as fluctuations in exchange rates can negatively affect the result, cash flow and equity. The major proportion of the Group´s assets relate to international oil and gas discoveries valued in USD and which generate revenues in USD. During 2018, all of Tethys Oil’s oil sales and operative expenditures were denominated in USD. The exchange risk affects the Group by transaction risk and translation risk.
Transaction riskTransaction exposure arises in the cash flow when invoicing or the costs of invoiced goods and services are not in the local currency. The Group only has limited costs in currencies other than USD, primarily relating to the SEK costs in the parent company. Presented below is the exposure to currencies with reference to items in the financial statements:
2018 2017
Revenue 100% in USD 100% in USD
Investments 99,8% in USD 99,9% in USD
External financing at year end None None
Tethys Oil does not currently hedge exchange rates. The Group policy is that cash held in bank should be held in USD, with the exception of the relatively minor amounts in SEK held in the Parent company, in order to reduce the exchange rate exposure.
Translation riskExchange-rate changes affect the Group in conjunction with the translation of the income statements of Group entities to USD as the Group’s operat-ing profit is affected and when net assets are translated into USD which can negatively affect the Group’s operating profit and statement of financial position. The parent company has issued loans to its subsidiaries denomi-nated in USD and exchange rate changes impact the income statement of the parent company. The Group does not hedge its translation exposure and fluctuating currency rates might negatively affect the operating profit and financial position of the Group.
Liquidity risks and capital riskBy operating in several countries, Tethys Oil is exposed to currency fluctua-tions. Income is and will also most likely be denominated in foreign curren-cies, US dollars in particular. Furthermore, Tethys Oil has since inception been equity and debt financed through share and bond issues, bank loans and also financed by asset divestment. Additional capital could be needed to finance Tethys Oil’s future operations and/or for acquisition of additional licences. The main risk is that this need could occur during less favourable market conditions. Tethys Oil continuously ensures that sufficient cash bal-ances are maintained in order to cover day to day operations. Management relies on cash forecasting to assess Tethys Oil’s cash position based on expected future cash flows.
Fall due profile on Tethys Oil’s
financial liabilities 31 December 2018 31 December 2017
MUSD <1 year 1–3 year <1 year 1–3 year
Accounts payables and other
liabilities 13.9 – 6.1 –
Total 13.9 – 6.1 –

55
Credit riskTethys Oil’s policy is to limit credit risk by limiting the counter-parties to major banks and oil trading companies. Tethys Oil is selling all of its oil through Mitsui Energy Trading Singapore which is part of Mitsui & Co. Ltd. As at 31 December 2018 the Group’s receivables on oil sales amounted to MUSD 14.9 (MUSD 12.1), this also represents the maximal exposure on accounts receivable. There is no history of default and the Group does currently not anticipate future credit losses. Cash and cash equivalents are maintained with banks having strong long-term credit ratings. Maximal exposure regarding other financial assets is those presented in the bal-ance sheet.
It is the responsibility of the Board of Directors to overview the Group’s capital structure and financial management, approve certain business regarding acquisition, investments, possible lending as well as on-going monitoring exposure to financial risks.
IFRS 9 valuation categories and related balance sheet items
31 December 2018
MUSD
Financial assets and
liabilities at fair value
through profit or loss
Financial
assets at
amortised cost
Financial
liabilities at
amortised cost
Other receivables – 17.9
Cash and bank – 73.1
Accounts payable and
other current liabilities – 13.9
31 December 2017
MUSD
Financial assets and
liabilities at fair value
through profit or loss
Financial
assets at
amortised cost
Financial
liabilities at
amortised cost
Other receivables – 12.7 –
Cash and bank – 42.0 –
Accounts payable and
other current liabilities – – 6.1
All financial assets and liabilities are current and the fair value of these are deemed to be the carrying amount as the discounting effects are not material
Events after the balance sheet dateAll events up to the date when the financial statements were authorised for issue and which have a material effect in the financial statements have been disclosed.
Note 2, Critical accounting estimates and judgements
Estimates and judgements are continuously evaluated and are based on historical experience and other factors, including expectations of future events which are believed to be reasonable under the circumstances. The Group makes estimates and assumptions concerning the future. The esti-mates and assumptions that have a significant risk of causing a material adjustment to the carrying amounts of assets within the next financial year are discussed below.
Estimates in oil and gas reserves and resourcesThe business of the Group is the exploration for, development of and pro-duction of oil and gas reserves. Estimates of oil and gas reserves and resources are used in the calculations for impairment tests, in-house mod-eling and accounting for depletion and site restoration. Changes in esti-mates in oil and gas reserves and resources, resulting in different future production profiles, will affect the discounted cash flows used in impair-ment testing, the anticipated date of site decommissioning and restora-tion and the depletion charges in accordance with the unit of production method. Estimates in oil and gas reserves and resources may change fol-lowing for instance new wells, long term production data and changes in macro economic data.
Site restoration provisionAmounts used in recording a provision for site restoration are estimates based on current legal and constructive requirements and current technol-ogy and price levels for the removal of facilities and plugging and abandon-ing of wells. Due to changes in relation to these items, the future actual cash outflows in relation to the site decommissioning and restoration can be different. To reflect the effects due to changes in legislation, require-ments and technology and price levels, the carrying amounts of site resto-ration provisions are reviewed on a regular basis. The effects of changes in estimates do not give rise to prior year adjustments and are treated pro-spectively over the estimated remaining commercial reserves of each field. While the Group uses its best estimates and judgement, actual results could differ from these estimates.
Impairment of oil and gas propertiesTethys Oil continuously assesses its producing oil and gas properties for any need for impairment testing. This is performed in conjunction with each balance sheet date or if there are events or changes in circumstances that indicate that carrying values of assets may not be recoverable. Such indica-tors include changes in the Group’s business plans, relinquished licences, changes in oil prices leading to lower revenues and, for oil and gas proper-ties, downward revisions of estimated reserve quantities.
Testing for impairment losses is performed when necessary for each cash generating unit, which corresponds to licence right, production sharing agreement or equivalent owned by Tethys Oil. A cash generating unit thus usually corresponds to each acquired asset in each country in which Tethys Oil carries on oil and gas operations. Impairment testing means that the balance sheet item amount for each cash generating unit is compared to the recoverable amount for the assets, which is the higher of the fair value of the assets less sales expenses and the value in use. The value in use of the assets is based on the present value of future cash flows discounted by a discount rate; see also note 8 under the section Impairment testing. An impairment loss is recorded when an asset’s or a cash generating unit’s recorded value exceeds the recoverable amount. Impairment losses are charged to the income statement.
TaxTethys Oil has not recorded a deferred tax asset in relation to the tax losses carried forward as there is uncertainty as to if the tax losses may be utilised note 15.
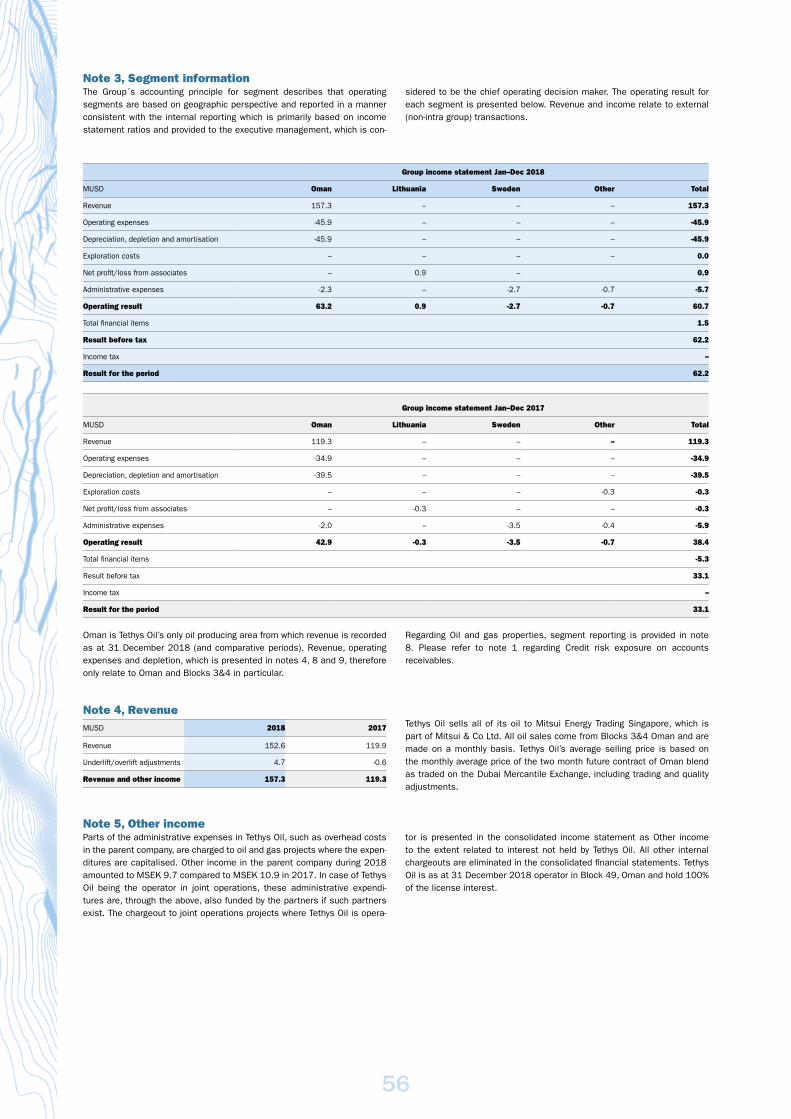
56
Note 3, Segment information The Group´s accounting principle for segment describes that operating segments are based on geographic perspective and reported in a manner consistent with the internal reporting which is primarily based on income statement ratios and provided to the executive management, which is con-
sidered to be the chief operating decision maker. The operating result for each segment is presented below. Revenue and income relate to external (non-intra group) transactions.
Group income statement Jan–Dec 2018
MUSD Oman Lithuania Sweden Other Total
Revenue 157.3 – – – 157.3
Operating expenses -45.9 – – – -45.9
Depreciation, depletion and amortisation -45.9 – – – -45.9
Exploration costs – – – – 0.0
Net profit/loss from associates – 0.9 – 0.9
Administrative expenses -2.3 – -2.7 -0.7 -5.7
Operating result 63.2 0.9 -2.7 -0.7 60.7
Total financial items 1.5
Result before tax 62.2
Income tax –
Result for the period 62.2
Group income statement Jan–Dec 2017
MUSD Oman Lithuania Sweden Other Total
Revenue 119.3 – – – 119.3
Operating expenses -34.9 – – – -34.9
Depreciation, depletion and amortisation -39.5 – – – -39.5
Exploration costs – – – -0.3 -0.3
Net profit/loss from associates – -0.3 – – -0.3
Administrative expenses -2.0 – -3.5 -0.4 -5.9
Operating result 42.9 -0.3 -3.5 -0.7 38.4
Total financial items -5.3
Result before tax 33.1
Income tax –
Result for the period 33.1
Oman is Tethys Oil’s only oil producing area from which revenue is recorded as at 31 December 2018 (and comparative periods). Revenue, operating expenses and depletion, which is presented in notes 4, 8 and 9, therefore only relate to Oman and Blocks 3&4 in particular.
Regarding Oil and gas properties, segment reporting is provided in note 8. Please refer to note 1 regarding Credit risk exposure on accounts receivables.
Note 4, RevenueMUSD 2018 2017
Revenue 152.6 119.9
Underlift/overlift adjustments 4.7 -0.6
Revenue and other income 157.3 119.3
Tethys Oil sells all of its oil to Mitsui Energy Trading Singapore, which is part of Mitsui & Co Ltd. All oil sales come from Blocks 3&4 Oman and are made on a monthly basis. Tethys Oil’s average selling price is based on the monthly average price of the two month future contract of Oman blend as traded on the Dubai Mercantile Exchange, including trading and quality adjustments.
Note 5, Other incomeParts of the administrative expenses in Tethys Oil, such as overhead costs in the parent company, are charged to oil and gas projects where the expen-ditures are capitalised. Other income in the parent company during 2018 amounted to MSEK 9.7 compared to MSEK 10.9 in 2017. In case of Tethys Oil being the operator in joint operations, these administrative expendi-tures are, through the above, also funded by the partners if such partners exist. The chargeout to joint operations projects where Tethys Oil is opera-
tor is presented in the consolidated income statement as Other income to the extent related to interest not held by Tethys Oil. All other internal chargeouts are eliminated in the consolidated financial statements. Tethys Oil is as at 31 December 2018 operator in Block 49, Oman and hold 100% of the license interest.

57
Note 6, Associated companies Tethys Oil holds an indirect interest of three Lithuanian companies hold-ing three licences; Gargzdai, Rietavas and Raiseiniai licences. The interest is held through two Danish private companies which are part of the Odin
owns of owns of owns of owns of
Tethys Oil’s
indirect interest
Tethys Oil AB (publ) 50% Odin Energy A/S 50% UAB Minijos Nafta 100% Gargzdai licence 25%
40% Jyllands Olie ApS 75% UAB TAN Oil 100% Raseiniai licence 30%
100% UAB LL Investicijos 100% Rietavas licence 30%
MUSD 2018 2017
Tethys Oil’s share of net profit from associated companies 0.9 -0.3
Group of companies, Odin Energi and Jylland Olie. The table below presents the ownership and the result from associates for the full year 2018.
Note 7, ProvisionsTethys Oil estimates that Tethys Oil’s share of site restoration regarding Blocks 3&4 at year end 2018 amounts to MUSD 6.9 (6.1). As a conse-quence of this provision, oil and gas properties have increased with an equal amount. The change in provision follows an annual review of the site restoration calculation where the number of wells drilled is one of the main components that affect the provision’s net present value.
Tethys Oil has a non-current provision of MUSD 2.0 (3.0) from of the esti-mated total error amount of MUSD 5.9 from the Export Reporting Error on Blocks 3&4. Tethys Oil also has a current provision of 1.0 (1.0) MUSD related to the Export Reporting Error.
Note 8, Oil and gas propertiesThe agreements that govern the relationship with host countries are referred to as licences or Exploration and Production Sharing Agreements (EPSA or PSA). Tethys Oil holds its interest directly through aforementioned agreements in Oman and France. The agreements with host countries have a time limit and are normally divided into periods. Financial commitments and or work commitments normally relates to the different periods. Tethys Oil has fulfilled its commitments on Blocks 3&4. In Block 49 the initial
work commitments during the first period include geological studies, seis-mic acquisition and processing and exploratory drilling. In the other areas of operations the commitments are either fulfilled or there are no commit-ments of which Tethys Oil can be held liable for. In some of Tethys Oil’s areas of interest there are requirements of work to be done or minimum expenditures in order to retain the licences, but no commitments of which Tethys Oil can be held liable for.
MUSD
Abandonment
provision
Other
provisions Total
1 January 2018 6.1 4.0 10.1
Additions – – –
Payments – -1.0 -1.0
Changes in estimates 0.4 – 0.4
Unwinding of discount 0.4 – 0.4
31 December 2018 6.9 3.0 9.9
Current – 1.0 1.0
Non-current 6.9 2.0 8.9
Total 6.9 3.0 9.9
MUSD
Abandonment
provision
Other
provisions Total
1 January 2017 4.8 5.9 10.7
Additions – – –
Payments – -1.9 -1.9
Changes in estimates 1.0 – 1.0
Unwinding of discount 0.3 – 0.3
31 December 2017 6.1 4.0 10.1
Current – 1.0 1.0
Non-current 6.1 3.0 9.1
Total 6.1 4.0 10.1
Country Licence Phase Expiration date Tethys Oil Partners (operator in bold)
Oman Blocks 3 & 4 Production July 2040 30% CCED, Mitsui, Tethys Oil
Oman Blocks 49 Exploration1 Nov 20201 100% Tethys Oil
France Attila2 Exploration Feb 2019 40% Galli Coz, Tethys Oil
Lithuania Gargzdai3 Production No expiration date 25% Odin, GeoNafta, Tethys Oil
Lithuania Rietavas3 Exploration No expiration date 30% Odin, Tethys Oil, private investors
Lithuania Raseiniai3 Exploration Sep 2022 30% Odin, Tethys Oil, private investors
MUSD 31 Dec 2018 31 Dec 2017
Producing cost pools 194.0 189.1
Non-producing cost pools 6.0 0.6
Total oil and gas properties 200.0 189.7
1 The exploration and production sharing agreement (EPSA) for Block 49 covers an initial exploration period of three years with an optional extension period of another three years. In case of a commercial oil or gas discovery, the EPSA will be transformed in to a 15 year production license which can be extended for another five years. In case of a commercial discovery Oman Government Company, has a right to acquire up to a 30% interest in Block 49 against refunding of past expenditure. The initial work commitments during the first period include geological studies, seismic acquisition and processing and exploratory drilling.
2 The Attila licence had an expiry date in February 2019. Tethys Oil is currently reviewing further measures.
3 The interest in the three Lithuanian licences are indirectly held through a shareholding in two Danish private companies, which in turn hold shares in Lithuanian companies holding 100 percent of the licences. The two Danish companies, Odin Energi and Jylland Olie, are not consolidated in Tethys Oils financial statements due to the ownership structure, which is why there are no oil and gas properties related to the licences. The ownership of Jylland Olie and Odin Energi are presented in the balance sheet under Shares in associated companies.

58
MUSD
Country Asset type
Book value
31 Dec 2018
Other non–cash
adjustments
1 Jan–31 Dec 2018
DD&A
1 Jan–31 Dec
2018
Exploration costs
1 Jan–31 Dec
2018
Investments
1 Jan–31 Dec
2018
Book value
1 Jan 2018
Oman Blocks 3&4 Producing 194.0 0.4 -45.9 – 50.4 189.1
Oman Block 49 Non-producing 5.7 – – – 5.3 0.4
France Attila Non-producing 0.0 – – – – –
New ventures Non-producing 0.3 – – – 0.1 0.2
Total 200.0 0.4 -45.9 – 55.8 189.7
MUSD
Country Asset type
Book value
31 Dec 2017
Other non–cash
adjustments
1 Jan–31 Dec 2017
DD&A
1 Jan–31 Dec
2017
Exploration costs
1 Jan–31 Dec
2017
Investments
1 Jan–31 Dec
2017
Book value
1 Jan 2017
Oman Blocks 3&4 Producing 189.1 -2.0 -39.5 – 39.9 190.8
Oman Block 49 Non-producing 0.4 – – – 0.4 –
France Attila Non-producing – – – – – –
New ventures Non-producing 0.2 – – -0.3 0.2 0.3
Total 189.7 -2.0 -39.5 -0.3 40.4 191.1
MUSD
Depletion Oman Blocks 3&4 Total
1 January 2018 -178.4 -178.4
Depletion charge for the year -45.9 -45.9
31 December 2018 -224.3 -224.3
MUSD
Depletion Oman Blocks 3&4 Total
1 January 2017 -138.9 -138.9
Depletion charge for the year -39.5 -39.5
31 December 2017 -178.4 -178.4
Impairment testingIn Tethys Oil’s assessment of the need for impairment testing, the Com-pany uses its best efforts to estimate production profiles, general cost and development environment. To calculate future free cash flows, the forward oil price as traded in the market as per 31 December 2018 was used. There has been no impairment of assets during 2018 or 2017.
Exploration costs during 2018 amounted to MUSD 0.0 (MUSD 0.3).
MUSD
Investments Block 3&4
Categories 2018 2017
Drilling 25.5 26.6
G&G 11.2 4.2
Facilities 13.7 9.1
Total 50.4 39.9
MUSD
Oil & gas properties Block 3&4
Categories 31 Dec 2018 31 Dec 2017
Drilling 101.1 98.9
G&G 27.3 24.4
Facilities 65.7 65.8
Total 194.1 189.1
Note 9, Operating expendituresGroup MUSD Parent MSEK
Operating expenditures 2018 2017 2018 2017
Production costs -42.6 -32.6 – –
Well workovers -3.4 -2.3 – –
Total -45.9 -34.9 – –
Note 10, Remuneration to Company auditorGroup MUSD Parent MSEK
Remuneration to company
auditor include: 2018 2017 2018 2017
PwC:
Audit fee -0.1 -0.2 -1.0 -1.0
Audit-related fees -0.0 -0.0 -0.0 -0.0
Tax consultation – – – –
Other – – – –
Total -0.1 -0.2 -1.0 -1.0
Of the Group total during 2018, MUSD 0.1 (MUSD 0.2) has been in relation to PwC Sweden.
Note 11, Administrative expensesGroup MUSD Parent MSEK
Administrative expenses 2018 2017 2018 2017
Personnel costs -3.1 -3.6 -16.5 -16.5
Rent -0.5 -0.4 -1.9 -1.9
Other office costs -0.1 -0.1 -0.6 -0.3
Listing costs -0.1 -0.1 -1.1 -0.7
Costs of external communication -0.2 -0.2 -1.3 -1.4
Other costs -1.7 -1.5 -11.4 -10.4
Total -5.7 -5.9 -32.8 -31.2

59
Note 12, Employees
Average number of full time
employees per country
2018 2017
Total Total men Total Total men
Parent company
Sweden 7 4 7 4
Total parent company 7 4 7 4
Subsidiary companies in Sweden – – – –
Subsidiary companies foreign
Oman 12 9 11 8
United Arab Emirates 1 0 1 0
Total subsidiary companies foreign 13 9 12 8
Total group 20 13 19 12
MUSD 2018 2017
Salaries, other remuneration
and social costs
Salaries,
other
remune-
ration
Social
costs
Salaries,
other
remune-
ration
Social
costs
Parent company
Sweden -1.4 -0.5 -1.4 -0.5
Total parent company -1.4 -0.5 -1.4 -0.5
Subsidiary companies in Sweden – – – –
Subsidiary companies foreign
Oman -1.6 – -1.5 –
United Arab Emirates -0.2 – -0.2 –
Total subsidiary companies foreign -1.8 – -1.7 –
Total group -3.2 -0.5 -3.1 -0.5
MUSD 2018 2017
Salaries and other remuneration
distributed between the board
and other employees
Board and
Managing
Director
Other
employees
Board and
Managing
Director
Other
employees
Parent company
Sweden -0.6 -0.8 -0.5 -0.9
Total parent company -0.6 -0.8 -0.5 -0.9
Subsidiary companies in Sweden – – – –
Subsidiary companies foreign
Oman – -1.6 – -1.5
United Arab Emirates – -0.2 – -0.2
Total subsidiary companies foreign – -1.8 – -1.7
Total group -0.6 -2.6 -0.5 -2.6
A termination period of twelve months applies between the Company and Managing Director and three to six months between the Company and other members of executive management. The Managing Director is entitled to twelve month’s payments if the Company terminates the contract and other members of executive management are entitled to six to twelve month’s payments. Executive management consists of three members of which the Managing Director is one.
During 2018, one woman has been members of the Board of Directors, compared to two in 2017. No women have been members of the executive management. At the AGM of shareholders on 9 May 2018 Robert Ander-son, Alexandra Herger, Magnus Nordin, Per Seime and Geoffrey Turbott were re-elected members of the board. No deputy directors were appointed. At the same meeting, Geoffrey Turbott was appointed chairman of the board. There have not been any agreements on pensions for any of the directors of the board. For the executive management, the pension costs follow a defined contribution plan. The increase in remuneration to executive man-agement primarily relate to increased base salaries.
Salaries and other
remuneration to
executive management
during 2018, MSEK
Basic
salary
Pension
arrange-
ments
Variable
Salary
Share based
long term
incentive1
Other
benefits
Total
2018
Managing Director 2.842 0.729 0.536 1.120 0.025 5.252
Other executive manage-
ment 3.847 0.377 0.875 1.164 0.156 6.420
Total 6.689 1.106 1.411 2.284 0.181 11.672
Salaries and other
remuneration to
executive management
during 2017, MSEK
Basic
salary
Pension
arrange-
ments
Variable
Salary
Share based
long term
incentive1
Other
benefits
Total
2017
Managing Director 2.186 0.549 0.680 1.277 0.012 4.704
Other executive manage-
ment 3.548 0.317 0.967 1.161 0.162 6.155
Total 5.734 0.866 1.648 2.438 0.174 10.860
1 The Managing director received 75,000 (75,000) and Other executive management received 96,000 (96,000) warrants in the 2018 incentive programme, totalling 171,000 (171,000) warrants.
Remuneration to board members AGM 2018 to AGM 2019 MSEK
Geoffrey Turbott 0.695
Robert Anderson 0.365
Alexandra Herger 0.370
Magnus Nordin –
Per Seime 0.400
Total 1.830
Remuneration to board members AGM 2017 to AGM 2018 MSEK
Dennis Harlin 0.630
Robert Anderson 0.330
Per Brilioth 0.265
Alexandra Herger 0.300
Magnus Nordin –
Per Seime 0.365
Katherine Støvring 0.335
Geoffrey Turbott 0.390
Total 2.615
Remuneration policy to executive managementRemuneration policy to the executive management includes five elements:• Basic salary• Pension arrangements• Yearly variable salary, including the right to participate in share-based
long-term incentive• Other benefits• Severance arrangements
The Board has the right to deviate from the remuneration policy if there are particular reasons.
Basic salaryThe basic salary shall be in line with market conditions, be competitive, and shall take into account the scope and responsibility associated with the position, as well as the skills, experience, and performance of the executive.
Pension arrangementsThe pension benefits comprise a defined contribution scheme with premi-ums calculated on the full basic salary. The pension contributions shall be in relation to the basic salary and is set on an individual basis but shall not be higher than what is tax deductible.
Variable salarySenior executives shall be part of two variable remuneration systems pay-able in cash and/or in combination with a right to acquire warrants in the Company in a long-term incentive programs.
60
in the case of, for example, extraordinary increases or decreases in the Group’s earnings. The variable remuneration shall not be pensionable.
Share based incentive programmeThe share based incentive programme has the purpose to retain and recruit qualified and committed personnel on a global market for oil companies. The programme is available to all employees and is intended to be re-occurring annually.
Other benefitsNon-financial benefits shall be based on market terms and shall facilitate the duties of each senior executive.
Severance arrangementsA mutual termination period of 12 months applies between the Company and the Managing Director and up to six months between the Company and other senior executives. Severance pay shall be paid to the Managing Director of up to 12 months fixed salary and up to 12 months fixed salary for other senior executives if the Company terminates their employment.
Senior executives may have the right to participate in share based long-term incentive programs. When allocating warrants the same financial and operational key indicators as for variable cash salary shall be considered.
The yearly variable cash salary shall be within the range of 1-12 monthly salaries per person and year. The targets for variable cash remuneration shall be determined by the Board prior to each financial year and individ-ual agreements shall be arranged with each participant, the content of which depends on the participant’s position at the time the agreement is arranged. The targets shall be objectively quantifiable and related to budget. The targets shall consist of key performance indicators both for the Group’s overall and financial performance as well as individual perfor-mance. The yearly variable salary will be determined annually in connec-tion with publication of the year-end report for the respective financial year based on an evaluation of the participants’ achievement of the targets as described in the individual agreements.
Payment of variable cash remuneration shall be conditional upon the partici-pant remaining employed for the duration of the programme. The Board has the right to adjust the incentive program during the term of the programme
Note 13, Financial income and similar itemsGroup MUSD Parent MSEK
2018 2017 2018 2017
Interest income 0.3 – 15.8 15.0
Gain on currency exchange rates 4.2 3.0 36.9 23.1
Dividend from subsidiaries – – 230.1 126.5
Total 4.5 3.0 282.8 164.6
Note 14, Financial expenses and similar itemsGroup MUSD Parent MSEK
2018 2017 2018 2017
Interest expenses 0.0 -0.2 -0.2 –
Currency exchange losses -2.6 -6.9 -23.1 -53.6
Other financial expenses -0.4 -1.2 0.0 –
Total -3.0 -8.3 -23.3 -53.6
Note 15, TaxThe Group’s income tax charge amount to MUSD 0.0 (MUSD 0.0). Tethys Oil has not recorded a deferred tax asset in relation to the tax losses carried forward since there is uncertainty as to if the tax losses may be utilised. The tax losses are in another jurisdiction than where main profits are gener-ated. Tax losses carried forward amounted to MSEK 236.3 (MSEK 242.8). There are no time limits to the utilization of the tax losses.
The tax on the parent company’s result before tax differs from the theoreti-cal amount that would arise using the Swedish tax rate as follows:
Parent (MSEK) 2018 2017
Result before tax 244.4 85.0
Tax at applicable tax rate 22% -53.8 -18.7
Non-deductible expenses -0.1 -1.4
Non-taxable income 52.4 27.8
Utilized (+) / Built up (–) tax loss carry forwards previously not
recorded as deferred tax assets 1.5 -7.7
Tax expense 0.0 0.0
Tethys Oil’s oil and gas operations in Oman are governed by an Explora-tion and Production Sharing Agreement for each licence (“EPSA”) whereby Tethys Oil receives its share of oil after government take. Under the terms of each EPSA, Tethys Oil is subject to Omani income taxes and royalties, which are paid in full, on behalf of Tethys Oil, from the government share of oil. The effect of these taxes is netted against revenue and other income in the income statement.
Note 16, Other receivablesGroup MUSD Parent MSEK
Other receivables 2018 2017 2018 2017
VAT 0.3 0.6 2.3 5.4
Receivables Oil sales 17.6 12.1 – –
Other – – 0.0 0.1
Total 17.9 12.7 2.3 5.5
Note 17, Shareholders’ equityAs at 31 December 2018, the number of outstanding shares in Tethys Oil amount to 35,896,310, with a quota value of SEK 0.17. All shares represent one vote each. During 2018, the number of outstanding shares increased by 352,560 share, from 35,543,750 to 35,896,310. Tethys Oil has a war-rant based incentive programme for employees, for further information please see note 20. As the average subscription price for three tranches of the incentive programme were partly below the average share price during 2018, dilution effects of the warrants are included in the weighted average number of shares after dilution, which amounted to 34,140 thousand dur-ing 2018.If the subscription prices have been below the share price during the reporting period, the dilution effects have been included in the weighted average number of shares in circulation after dilution.
As at 31 December 2018, Tethys Oil held 1,644,163 of its own shares which have been purchased since commencement of the programme dur-ing the fourth quarter 2014. The purpose of the repurchasing program is to optimize the capital structure and to enable any repurchased shares to be used as payment in connection with, or financing of, acquisitions of com-panies or businesses. No shares were purchased during 2018 (314,939). The repurchased shares are still included in the total number of shares, but are not included in the average number of shares in circulation. The weighted average number of shares in circulation during 2018 before dilu-tion is 34,010,616 and after dilution 34,140,318.
After 31 December 2018 and up to the date of publication for this report, Tethys Oil has not acquired any further shares.
Earnings per shareEarnings per share before dilution are calculated by dividing profit for the year attributable to ordinary shareholders of the parent company by weighted average number of ordinary shares outstanding and in circulation during the year. Total repurchased shares amounting to 1,644,163 have been excluded from shares in circulation.
Earnings per share after dilution are calculated by dividing profit for the year attributable to ordinary shareholders of the parent company by weighted average number of ordinary shares outstanding and in circulation during the year while also including the effect of warrants where the subscription price is below the share price.

61
Appropriation of profitThe Board of Directors proposes a dividend of SEK 2.00 per share (AGM 2018: SEK 2.00). The Board of Directors proposes that the dividend is to be paid in two equal instalments of SEK 1.00 per share each, payable in May and November 2019. Proposed record dates are 17 May 2019 and 18 November 2019.
The Board of Directors proposes an extraordinary distribution of SEK 6.00 per share by way of a mandatory share redemption programme following the AGM 2019 (AGM 2018: SEK 4.00). Further details to follow in the proposal to the 2019 AGM.
Note 18, Accounts payable and other current liabilities
Group MUSD Parent MSEK
Accounts payable and
other current liabilities 2018 2017 2018 2017
Accounts payable 0.1 0.1 1.1 0.5
Overlift position – 2.0 – –
Operator balance, Blocks 3&4 Oman 9.9 3.2 – –
Other current liabilities 3.9 0.8 2.8 5.2
Total 13.9 6.1 3.9 5.7
Note 19, Shares in subsidiaries
Company Reg. Number Reg. office Number of shares Percentage
Nominal value
per share
Tethys Oil Invest AB 556658-1442 Sweden 1,000 100% SEK 100
Tethys Oil Turkey AB 556658-1913 Sweden 1,000 100% SEK 100
Tethys Oil Exploration AB 556658-1483 Sweden 1,000 100% SEK 100
Tethys Oil France AB 556658-1491 Sweden 1,000 100% SEK 100
Tethys Oil Oman Ltd 95212 Gibraltar 100 100% GBP 1
Tethys Oil Block 3&4 Ltd 101981 Gibraltar 1,000 100% USD 1
Tethys Oil Montasar Ltd 115710 Gibraltar 1,000 100% USD 1
Tethys Oil Oman Onshore, Ltd 118203 Gibraltar 1,000 100% USD 1
Windsor Petroleum (Spain) Inc. 549 282 British Virgin Islands 1 100% USD 1
On 25 October 2018 Tethys Oil Denmark AB (556658-1467) was merged with the parent company. Tethys Oil Denmark AB had no operations at the time of the merger. The effect on the parent company’s financial statements and position resulting from the merger are immaterial.
MSEK Parent Parent
Shares in subsidiaries 31 December 2018 31 December 2017
1 January 2018 0.9 1.0
Acquisitions/Relinquishments 0.0 -0.1
Shareholder’s contribution – 2.9
Merger, net 0.1 –
Write down of shares in subsidiaries – -2.9
31 December 2018 1.0 0.9
62
As the average subscription price for three tranches of the incentive pro-gramme were partly below the average share price during 2018, dilution effects of the warrants are included in the weighted average number of shares after dilution, which amounted to 34,140 thousand during 2018. The cost is calculated in accordance with the Black & Scholes formula where the main inputs are the factors in the above table, expected volatility, share price at valuation and an equity discount rate. The cost for the incen-tive programme is included as part of administrative expenses and includes tax and social charges where applicable.
Note 21, Pledged assets As at 31 December 2018, pledged assets amounted to MUSD 0.1 related to a pledge in relation to office rental in the parent company (214.9). In 2017 all shares in the subsidiary Tethys Oil Block 3&4 Ltd was included related to a credit facility.
Note 22, Contingent liabilitiesThere are no outstanding contingent liabilities as at 31 December 2018, nor for the comparative period.
Note 23, Related party transactions In the Tethys Oil Group, Tethys Oil AB (publ) with organisational number 556615-8266 is the parent company. Material subsidiaries include Tethys Oil Block 3&4 Limited and Tethys Oil Montasar Limited
During the year, the Company entered into the following significant transac-tions with related parties:
Transactions with subsidiaries, MSEK 2018 2017
Interest income 15.6 15.0
Other income 9.7 10.9
Dividends received 230.1 126.5
Group contributions – –
Shareholder contributions -0.0 -2.9
Total 255.4 149.5
Balance with related parties, MSEK 2018 2017
Receivable from subsidiaries 222.0 355.6
Total 222.0 355.6
Balance with related parties, MSEK 2018 2017
Payable to subsidiaries 12.2 35.2
Total 12.2 35.2
The receivables or payables from related parties arise from the net of purchased services and upstreamed or downstreamed funds between par-ent and subsidiaries. The interest rates on receivables are in the range of LIBOR +4-6% per annum. Receivables are long term in duration and unse-cured in nature. Payables are short term in duration, unsecured in nature and bear no interest.
Note, 24 Subsequent eventsTethys Oil’s share of the production, before government take, from Blocks 3&4 amounted during January and February 2019 to 380,340 and 326,656 barrels of oil, respectively, corresponding to 12,269 and 11,666 barrels of oil per day, respectively.
Tethys Oil announced on 23 December 2018 an agreement to acquire a two percent participating interest in Block 53 onshore Oman from Total E&P Oman, a wholly-owned subsidiary of Total S.A, for a cash consideration of MUSD 32 with an effective date of 1 January 2018 with customary cash adjustment to be made at closing. The closing of the acquisition was sub-ject to government approval and the waiver of partner pre-emption rights. Tethys Oil announced on 25 January 2019 that partner pre-emption rights had been exercised, and as a result, Tethys Oil will not be able to complete the transaction.
Note 20, Incentive programmeTethys Oil has an incentive programme as part of the remuneration package to employees. The allocation is not guaranteed and the Board of Direc-tors of the Company shall resolve on and implement the allocation. The warrants have no vesting period or other restrictions and have been trans-ferred free of charge to the participants and the Group accounts for any income tax for the participants to the extent such tax is attributable to the programme. The market value of the warrants has been calculated in accordance with the Black & Scholes formula by an independent valuation
institution. The subscription price is based on the volume-weighted average of the purchase price for the Company’s share on Nasdaq Stockholm during approximately a two week period prior to the date of allocation.
Warrants were issued 2018 and 2017 following a decision by the respective AGM. The number of issued warrants during 2018 was 350,000 (350,000) and the number of warrants allocated during 2018 was 329,000. Issued but not allocated warrants are held by the Company. Warrants exercised during the year were 312,000 and expired 44,000.
Warrant incentive
programme
Exercise period
Subscription
price, SEK
Shares per
warrant
Number of warrants
1 Jan 2018 Issued 2018 Exercised 2018 Expired 2018 31 Dec 2018
2015 incentive programme 23 May – 5 Oct, 2018 73.50 1.13 356,000 0 -312,000 -44,000 0
2016 incentive programme 28 May – 4 Oct, 2019 59.90 1.10 350,000 0 0 0 350,000
2017 incentive programme 30 May – 2 Oct, 2020 81.80 1.04 350,000 0 0 0 350,000
2018 incentive programme 1 Jun – 2 Oct, 2021 89.00 1.00 350,000 0 0 350,000
Total 1,056,000 350,000 -312,000 -44,000 1,050,000
Warrant incentive
programme
Exercise period
Subscription
price, SEK
Shares per
warrant
Number of warrants
1 Jan 2017 Issued 2017 Exercised 2017 Expired 2017 31 Dec 2017
2015 incentive programme 23 May – 5 Oct, 2018 76.80 1.08 356,000 0 0 0 356,000
2016 incentive programme 28 May – 4 Oct, 2019 62.60 1.05 350,000 0 0 0 350,000
2017 incentive programme 30 May – 2 Oct, 2020 85.50 1.00 0 350,000 0 0 350,000
Total 706,000 350,000 0 0 1,056,000
Group MUSD Parent MSEK
Warrant incentive programme 2018 2017 2018 2017
Incentive programme cost -0.5 -0.5 -2.1 -3.6
Total -0.5 -0.5 -2.1 -3.6

63
Assurance
The Board of Directors and the managing director declare that the consolidated financial statements have been prepared in accord-ance with IFRS as adopted by the EU and give a true and fair view of the Group’s financial position and results of operations. The financial statements of the parent company have been pre-pared in accordance with generally accepted accounting principles in Sweden and give a true and fair view of the parent company’s
financial position and results of operations. The statutory Admin-istration Report of the Group and the parent company provides a fair review of the development of the Group’s and the parent company’s operations, financial position and results of operations and describes material risks and uncertainties facing the parent company and the companies included in the Group.
Stockholm, 3 April 2019
Geoffrey Turbott Chairman of the board
Rob Anderson Director
Alexandra Herger Director
Magnus Nordin Managing Director
Per Seime Director
Auditor’s endorsement
Our audit report was submitted on 3 April 2019.PricewaterhouseCoopers AB
Ulrika Ramsvik Authorized Public Accountant
Lead Partner
Bo Hjalmarsson Authorized Public Accountant
64
Auditor’s reportTo the general meeting of the shareholders of Tethys Oil AB (publ), corporate identity number 556615-8266
Report on the annual accounts and consolidated accounts
OpinionsWe have audited the annual accounts and consolidated accounts of Tethys Oil AB (publ) for the year 2018. The annual accounts and consolidated accounts of the company are included on pages 35–63 in this document.
In our opinion, the annual accounts have been prepared in accord-ance with the Annual Accounts Act and present fairly, in all mate-rial respects, the financial position of parent company and the group as of 31 December 2018 and its financial performance and cash flow for the year then ended in accordance with the Annual Accounts Act. The consolidated accounts have been prepared in accordance with the Annual Accounts Act and present fairly, in all material respects, the financial position of the group as of 31 December 2018 and their financial performance and cash flow for the year then ended in accordance with International Finan-cial Reporting Standards (IFRS), as adopted by the EU, and the Annual Accounts Act. The statutory administration report is con-sistent with the other parts of the annual accounts and consoli-dated accounts.
We therefore recommend that the general meeting of sharehold-ers adopts the income statement and balance sheet for the parent company and the group.
Our opinions in this report on the annual accounts and consoli-dated accounts are consistent with the content of the additional report that has been submitted to the parent company’s audit committee in accordance with the Audit Regulation (537/2014) Article 11.
Basis for OpinionsWe conducted our audit in accordance with International Stand-ards on Auditing (ISA) and generally accepted auditing standards in Sweden. Our responsibilities under those standards are further described in the Auditor’s Responsibilities section. We are inde-pendent of the parent company and the group in accordance with professional ethics for accountants in Sweden and have other-wise fulfilled our ethical responsibilities in accordance with these requirements. This includes that, based on the best of our knowl-edge and belief, no prohibited services referred to in the Audit Regulation (537/2014) Article 5.1 have been provided to the audited company or, where applicable, its parent company or its controlled companies within the EU.
We believe that the audit evidence we have obtained is sufficient and appropriate to provide a basis for our opinions.
Our audit approachAudit scopeTethys Oil is a Swedish Oil and Gas company with its primary operations located in Oman. The operations in Oman represented 100% of the group’s revenue for the financial year 2018 and 69% of the group’s assets as per 31 December 2018. We designed our audit by determining materiality and assessing the risks of mate-rial misstatement in the consolidated financial statements. In par-ticular, we considered where the management and the Managing Director made subjective judgements; for example, in respect of significant accounting estimates that involved making assump-tions and considering future events that are inherently uncertain. As in all of our audits, we also addressed the risk of management override of internal controls, including among other matters con-sideration of whether there was evidence of bias that represented a risk of material misstatement due to fraud.
We tailored the scope of our audit in order to perform sufficient work to enable us to provide an opinion on the consolidated finan-cial statements as a whole, taking into account the structure of the Group, the accounting processes and controls, and the industry in which the Group operates.
Our planning of the audit included an assessment of the level of audit work to be performed at the group’s headquarters and at local offices. Following the group’s organisation certain processes for accounting and financial reporting are performed outside the group’s headquarter which means that we as a group audit team performed our audit work at the group’s headquarters but we also obtained reporting from specified procedures performed by our audit team in Oman.
We have reported the results from our procedures to management and the Audit Committee after the review of the Report for the nine months period ended 30 September, 2018 and after the year-end audit of the financial year 2018.
MaterialityThe scope of our audit was influenced by our application of mate-riality. An audit is designed to obtain reasonable assurance whether the financial statements are free from material misstatement. Mis-statements may arise due to fraud or error. They are considered material if individually or in aggregate, they could reasonably be expected to influence the economic decisions of users taken on the basis of the consolidated financial statements.
Based on our professional judgement, we determined certain quantitative thresholds for materiality, including the overall group

65
Key audit matterRecoverability of the carrying value of oil and gas propertiesThe carrying value of oil and gas properties amounted to $200.0 million as per 31 December 2018 and the major part represented by the producing assets in Blocks 3&4 in Oman. The oil and gas properties relating to Blocks 3&4 in Oman amounted to $194.0 million by 31 December 2018.
During the year management follows a process to identify potential indicators of impairment and to the extent that indi-cators are identified impairment tests are prepared.
The carrying value of oil and gas properties is supported by the higher of either value in use calculations or fair value less cost of disposal (recoverable amount).
The assessment to identify potential impairment indicators and to perform impairment tests requires management to exercise significant judgement where there is a risk that the valuation of oil and gas properties and any potential impairment charge or reversal of impairment may be incorrect.
Management’s test requires consideration of a number of fac-tors, including but not limited to, the Group’s intention to pro-ceed with a future work programme, the probability of success of future drilling, the size of proved, probable reserves as well as prospective resources, short and long term oil prices, future costs as well as the discount and inflation rates.
Following the analysis of potential impairment indicators for Blocks 3&4 in it was concluded that no impairment was recorded.
Refer to pages 38 in the Directors’ report, page 51 in the Accounting Policies and note 2 and 8 in the financial state-ments for more information.
How our audit addressed the Key audit matterWe have audited management’s assessment for determining the impairment indicators and concluded that there are no impair-ment indicators identified.
The assumptions that underpin management’s assessment are inherently judgmental. Our audit work therefore assessed the reasonableness of management’s key judgements of the recov-erable amount of Blocks 3&4. Specifically our work included, but was not limited to, the following procedures:
• comparison of management’s short-term oil price assump-tions against external oil price forward curves;
• comparison of long-term oil price assumptions against views published by brokers, economists, consultancies and respected industry bodies, which provided a range of rel-evant third-party data points;
• reconciliation of hydrocarbon production profiles to the combination of proved and probable reserves from reserve reports from ERC Equipoise Limited and contingent resources estimates prepared by in-house reservoir engineer;
• verification of estimated future costs by agreement to budg-ets and where applicable, third party data;
• benchmarking of inflation and discount rates applied; • testing of the mathematical accuracy of the model
We have obtained the estimation of proven and probable reserves and contingent resources certified by the group’s external reserves auditor and management’s in-house estimation of contingent resources. Our work included but was not limited to:
• determining that the group’s process for collecting relevant reports were sufficiently robust;
• assessing competence and objectivity of reserves audi-tor ERC Equipoise Limited, to satisfy ourselves they were appropriately qualified to carry out the volumes estimation;
• assessing the process for making in-house estimates of pro-spective resources;
• validation of that the updated reserves and resources estimates were included appropriately in management’s consideration of impairment and in accounting for depletion charges.
materiality for the consolidated financial statements as a whole. These, together with qualitative considerations, helped us to deter-mine the scope of our audit and the nature, timing and extent of our audit procedures and to evaluate the effect of misstatements, both individually and in aggregate on the financial statements as a whole.
Key audit mattersKey audit matters of the audit are those matters that, in our pro-fessional judgment, were of most significance in our audit of the annual accounts and consolidated accounts of the current period. These matters were addressed in the context of our audit of, and in forming our opinion thereon, the annual accounts and con-solidated accounts as a whole, but we do not provide a separate opinion on these matters.

66
Other Information than the annual accounts and consolidated accountsThis document also contains other information than the annual accounts and consolidated accounts and is found on pages 1–19 and 26–34. Other information those not include the Financial statements, consolidated accounts and our audit report related to the Financial statements. The Board of Directors and the Manag-ing Director are responsible for this other information.
Our opinion on the annual accounts and consolidated accounts does not cover this other information and we do not express any form of assurance conclusion regarding this other information.
In connection with our audit of the annual accounts and consoli-dated accounts, our responsibility is to read the information iden-tified above and consider whether the information is materially inconsistent with the annual accounts and consolidated accounts. In this procedure we also take into account our knowledge oth-erwise obtained in the audit and assess whether the information otherwise appears to be materially misstated.
If we, based on the work performed concerning this information, conclude that there is a material misstatement of this other infor-mation, we are required to report that fact. We have nothing to report in this regard.
Responsibilities of the Board of Director’s and the Managing DirectorThe Board of Directors and the Managing Director are responsi-ble for the preparation of the annual accounts and consolidated accounts and that they give a fair presentation in accordance with the Annual Accounts Act and, concerning the consolidated accounts, in accordance with IFRS as adopted by the EU. The Board of Directors and the Managing Director are also responsible for such internal control as they determine is necessary to enable
the preparation of annual accounts and consolidated accounts that are free from material misstatement, whether due to fraud or error.
In preparing the annual accounts and consolidated accounts, The Board of Directors and the Managing Director are responsible for the assessment of the company’s and the group’s ability to continue as a going concern. They disclose, as applicable, matters related to going concern and using the going concern basis of accounting. The going concern basis of accounting is however not applied if the Board of Directors and the Managing Director intend to liqui-date the company, to cease operations, or has no realistic alterna-tive but to do so.
The Audit Committee shall, without prejudice to the Board of Director’s responsibilities and tasks in general, among other things oversee the company’s financial reporting process.
Auditor’s responsibilityOur objectives are to obtain reasonable assurance about whether the annual accounts and consolidated accounts as a whole are free from material misstatement, whether due to fraud or error, and to issue an auditor’s report that includes our opinions. Reasonable assurance is a high level of assurance, but is not a guarantee that an audit conducted in accordance with ISAs and generally accepted auditing standards in Sweden will always detect a material mis-statement when it exists. Misstatements can arise from fraud or error and are considered material if, individually or in the aggre-gate, they could reasonably be expected to influence the economic decisions of users taken on the basis of these annual accounts and consolidated accounts.
A further description of our responsibility for the audit of the annual accounts and consolidated accounts is available on Revi-sorsinspektionen’s website: www.revisorsinspektionen.se/revisorn-sansvar. This description is part of the auditor’s report.
OpinionsIn addition to our audit of the annual accounts and consolidated accounts, we have also audited the administration of the Board of Director’s and the Managing Director of Tethys Oil AB for the year 2018 and the proposed appropriations of the company’s profit or loss.
We recommend to the general meeting of shareholders that the profit be appropriated in accordance with the proposal in the stat-utory administration report and that the members of the Board of Director’s and the Managing Director be discharged from liability for the financial year.
Basis for OpinionsWe conducted the audit in accordance with generally accepted auditing standards in Sweden. Our responsibilities under those
standards are further described in the Auditor’s Responsibilities section. We are independent of the parent company and the group in accordance with professional ethics for accountants in Sweden and have otherwise fulfilled our ethical responsibilities in accord-ance with these requirements.
We believe that the audit evidence we have obtained is sufficient and appropriate to provide a basis for our opinions.
Responsibilities of the Board of Director’s and the Managing DirectorThe Board of Directors is responsible for the proposal for appro-priations of the company’s profit or loss. At the proposal of a dividend, this includes an assessment of whether the dividend is justifiable considering the requirements which the company’s and the group’s type of operations, size and risks place on the size of
Report on other legal and regulatory requirements

67
the parent company’s and the group’ equity, consolidation require-ments, liquidity and position in general.
The Board of Directors is responsible for the company’s organiza-tion and the administration of the company’s affairs. This includes among other things continuous assessment of the company’s and the group’s financial situation and ensuring that the company’s organization is designed so that the accounting, management of assets and the company’s financial affairs otherwise are controlled in a reassuring manner. The Managing Director shall manage the ongoing administration according to the Board of Direc-tors’ guidelines and instructions and among other matters take measures that are necessary to fulfill the company’s accounting in accordance with law and handle the management of assets in a reassuring manner.
Auditor’s responsibilityOur objective concerning the audit of the administration, and thereby our opinion about discharge from liability, is to obtain audit evidence to assess with a reasonable degree of assurance whether any member of the Board of Directors or the Managing Director in any material respect:
• has undertaken any action or been guilty of any omission which can give rise to liability to the company, or
• in any other way has acted in contravention of the Companies Act, the Annual Accounts Act or the Articles of Association.
Our objective concerning the audit of the proposed appropriations of the company’s profit or loss, and thereby our opinion about this, is to assess with reasonable degree of assurance whether the proposal is in accordance with the Companies Act.
Reasonable assurance is a high level of assurance, but is not a guarantee that an audit conducted in accordance with generally accepted auditing standards in Sweden will always detect actions or omissions that can give rise to liability to the company, or that the proposed appropriations of the company’s profit or loss are not in accordance with the Companies Act.
A further description of our responsibility for the audit of the administration is available on Revisorsinspektionen’s website: www.revisorsinspektionen.se/revisornsansvar. This description is part of the auditor’s report.
PricewaterhouseCoopers AB, 405 32 Göteborg, was appointed auditor of Tethys Oil AB by the general meeting of the sharehold-ers on the 9 maj 2018 and has been the company’s auditor since the 2001. The company has been listed at NasdaqOMX since the 2 May 2013.
Stockholm, 3 April 2019
PricewaterhouseCoopers AB
Ulrika Ramsvik Bo HjalmarssonAuthorized Public Accountant Authorized Public Accountant
Lead Partner
Financial information
The company plans to publish the following financial reports:Three month report 2019 (January – March 2019) on 7 May 2019Six month report 2019 (January – June 2019) on 13 August 2019
Nine month report 2019 (January – September 2019) on 5 November 2019Year-end report 2019 (January – December 2019) on 11 February 2020
Address
Corporate Head Office
Tethys Oil AB (publ)Hovslagargatan 5BSE-111 48 Stockholm Sweden
Telephone: +46 8 505 947 00 Fax: +46 8 505 947 99E-mail: [email protected]
www.tethysoil.com
Land
sten
Rek
lam
201
9. D
esig
n H
enrik
Str
ömbe
rg. P
rinte
d in
Sw
eden
.