annual report 2018 - interserve
TRANSCRIPT

A
Governance
Financial Statements
Strategic Report
Overview
ANNUAL REPORT 2018

INTERSERVE IS ONE OF THE WORLD’S FOREMOST SUPPORT SERVICES, CONSTRUCTION AND EQUIPMENT COMPANIES.
WE OFFER ADVICE, DESIGN, CONSTRUCTION, EQUIPMENT, FACILITIES MANAGEMENT AND FRONTLINE SERVICES TO PUBLIC AND PRIVATE-SECTOR CLIENTS IN MORE THAN 40 COUNTRIES.
WE ARE A LEADER IN DEVELOPING AND DELIVERING DESIRABLE OUTCOMES FOR OUR CLIENTS AND A GREAT PLACE TO WORK FOR OUR PEOPLE.
HEADQUARTERED IN THE UK AND FTSE LISTED, WE HAVE CONSOLIDATED REVENUES OF £2.9 BILLION AND A WORKFORCE OF MORE THAN 68,000 PEOPLE WORLDWIDE.

Overview
Who we are 02
Our proud history 04
Chairman’s statement 06
Chief Executive Officer’s statement 08
Results in summary 12
Our markets 13
Strategic Report
Strategic objectives 16
Fit for Growth 17
Divisional strategies 18
Business model 19
What we have achieved 20
Performance 22
Operational review 24
Principal risks and uncertainties 31
Financial review 35
Governance
Board of directors 42
Advisers 43
Corporate governance 44
Audit Committee report 52
Directors’ remuneration report 58
Directors’ report 80
Directors’ responsibility statement 87
Financial Statements
Independent auditor’s report 88
Consolidated financial statements 100
Notes to the consolidated financial statements 106
Company financial statements 159
Notes to the Company financial statements 161
Related undertakings 175
Five-year analysis 181
Shareholder information 183
Contents
The purpose of this reportThis Annual Report and Accounts provides shareholders and interested parties with an insight into how we create value. It contains details on our Company, strategy, markets and how we manage risk, as well as a comprehensive report on the Company’s activities this financial year.
FOR FURTHER INVESTOR INFORMATION:www.interserve.com/investors
01
Governance
Financial Statements
Strategic Report
Overview
01

Who we are
BUSINESSES BY OPERATING PROFIT*
* Excluding non-underlying
SUPPORT SERVICES 51%
EQUIPMENT SERVICES 35%
CONSTRUCTION 14%
7,500Clients230
Offices worldwide
3Core
business lines:SUPPORT SERVICES,
CONSTRUCTION & EQUIPMENT SERVICES
02
OVERVIEW

68,380Employees
150Services
03
Governance
Financial Statements
Strategic Report
Overview

Our proud historyOUR HISTORYInterserve’s origins date back to 1884 when brothers Edmund and Augustus Hughes formed London and Tilbury Lighterage Company Limited, which specialised in transferring cargo between vessels. At the beginning of the 20th century the Company launched a successful dredging business, securing a contract from the Port of London.
Between 1930 and 1950, the business diversified by moving into waste disposal and purchasing a civil engineering firm. Further growth occurred after the Company bought a construction and engineering arm following the acquisition of RM Douglas Holdings, which included expansion into the Middle East in the 1990s.
A further acquisition involved Kwikform, a UK market leader in non-industrial access scaffolding, which was merged with RMD to create RMD Kwikform.
In 2001 the Tilbury Group was renamed Interserve Plc and entered the FTSE 250, transferring from the construction sector to Support Services.
Interserve now employs 68,380 people worldwide who provide a wide range of services to more than 7,500 clients.
04
OVERVIEW

Interserve has delivered the UK’s first NHS high-energy Proton Beam Therapy Centre in the North West on time and under budget.
The Christie NHS Foundation Trust was selected by the Department of Health as one of two providers of the Proton Beam Therapy (PBT) service. They worked in partnership with Interserve, together with University College London Hospitals NHS Trust to successfully deliver this scheme.
The state of the art 15,000m2 five-storey building includes: three treatment rooms; a patient reception; consultation rooms and public space. The building is designed to be future proof with additional space for the Trust to grow into, along with a dedicated research room for the University of Manchester.
Patients have already begun receiving treatment at the PBT, and once fully operational it will treat around 750 people a year. This life-changing facility will also prevent families from enduring expensive, stressful and potentially dangerous travel abroad for treatment.
Though there are other centres internationally which offer this treatment, the facility is the first high-energy NHS facility in the UK. As such, we had no blueprint to follow, so our team travelled extensively to learn from foreign expertise so that the world-class facility could be delivered.
THE CHRISTIE PROTON BEAM THERAPY CENTRE CASE STUDYPBT is an advanced form of radiotherapy used for the treatment of complex and hard-to-treat cancers in children and adults. It uses a high-energy beam of protons rather than high-energy X-rays to deliver a dose of radiotherapy. It directs the radiation treatment to precisely where it is needed with minimal damage to surrounding tissue.
To contain the radiation, the concrete walls are up to six metres thick. The building incorporates 20,000m³ of concrete and 1,700 tonnes of reinforcement, including steel bars up to 100mm in diameter. Through this, 10km of services pipework has been carefully threaded. The concrete itself weighs 48,000 tonnes, the equivalent of two aircraft carriers.
The building is the first PBT Centre to target BREEAM excellent rating. The contract built on our pre-existing relationship with The Christie which dates back a decade. We are committed to further collaborative working to deliver the new multi-tiered carpark and fit-out of the PBT Outpatient facility.
George Franks, Managing Director of Interserve Construction, said, “Our work on the Proton Beam Therapy Centre underscores the close partnership we have established with The Christie and our track record for delivering award-winning and life-changing healthcare facilities across the UK.
“Our strategic focus is to create a sustainable, manageable and profitable business based on construction, engineering and infrastructure work and this project underscores that commitment, particularly in the UK health sector.”
05
Governance
Financial Statements
Strategic Report
Overview

My comments will cover the previous fiscal year and the first few months of 2019 in view of the significant events which have taken place in that period. The period has been the most difficult in Interserve’s history since the Group was established in 1884.
The resulting stress and uncertainty have led to anxiety amongst our staff, suppliers and customers and significant loss of value for our shareholders from the fall in our share price. I would like to thank them for their support during this challenging period.
Interserve remains one of the world’s foremost support services, construction and equipment companies delivering a range of services for our clients, helping them to improve their efficiency and productivity. It is a business with a strong purpose, providing important and valued services that enhance people’s lives on a daily basis.
However, over the years, the business lost its operating and financial discipline, became too federated and inefficient, lacked a coherent approach and entered some businesses it shouldn’t have done.
Debbie White and her management team have made excellent progress over the last eighteen months addressing the problems. The proposed Deleveraging Plan and the continuing progress of the Fit for Growth programme are significant steps towards restoring stability, future financial success and underlying resilience in Interserve and to rebuilding trust with all our stakeholders. I comment on each of these points in more detail below.
DELEVERAGING PLAN The Board believes the Deleveraging Plan will provide Interserve with a strong balance sheet and the platform to deliver on its strategy. Agreeing the key commercial terms of the Deleveraging Plan with our lenders, bonding providers and Pension Trustee was a significant step forward in our plans to strengthen the balance sheet. The Board believes that this agreement will secure a strong future for Interserve. This proposal has been achieved following a long period of intensive negotiation and has the support of our financial stakeholders and UK Government. The Deleveraging Plan is subject to approval by Interserve’s shareholders.
Its successful implementation is critical to the Interserve Group’s future and all of its stakeholders. Without its successful implementation there will be significant disruption to the business.
The Deleveraging Plan will, alongside our Fit for Growth programme, place us in a strong position to deliver our strategy, be competitive in the marketplace and provide a secure future for the Interserve Group’s employees, customers and suppliers and the Board recommends that shareholders vote in favour of it.
FINANCIAL PERFORMANCE The business has traded robustly in some challenging markets and continued to win significant new contracts. This has been achieved in an environment which is challenging for the sector and particularly so for Interserve. The Fit for Growth programme is delivering material cost savings and a simpler and more effective business structure.
The Board remains focused on positioning the Group for long-term, sustainable success. This means continuing the operational progress we are making to put legacy issues behind us, particularly in closing out and exiting the Energy from Waste business. It also means reducing debt and putting a strong long-term capital structure in place through the proposed Deleveraging Plan.
MANAGEMENT CHANGES There were three senior management changes in the year, with the departure of Robin O’Kelly, Director of Communications, Yvonne Thomas, Managing Director Citizen Services and Gordon Kew, UK Construction Director.
BOARD AND GOVERNANCE The Company now runs through clear business structures and accountabilities in its three operating divisions: Support Services, Construction and Equipment Services.
Following the departure of Keith Ludeman from the Board in May, Nick Salmon has taken on the chairmanship of the Remuneration Committee. We also welcomed Nicholas Pollard as a non-executive director to the Board in June. Dougie Sutherland also left the Board in February 2019.
OUR PEOPLE I have highlighted the challenges that the leadership team have faced in recent months, but inevitably the impact of those changes has been felt by people throughout the business. These are difficult times for the Company and the sectors it operates in. Dealing with these challenges will necessitate changes for all staff. Across Interserve, our people have shown great resilience and loyalty. They have embraced the need for change and I thank them for this and their continued support.
Chairman’s statement
Glyn BarkerChairman
06
OVERVIEW

Interserve has supported top international law firm, CMS, since being awarded their property and facilities management contract in 2013, including helping the firm during its expansion following a major merger.
CMS, which won the coveted ‘Law Firm of the Year’ title in the 2018 British Legal Awards, has 73 offices globally.
As CMS has grown, we have expanded our team to support their needs. A total of 130 Interserve colleagues work across CMS’s UK offices, and undertake roles ranging from client reception, security, cleaning, building services and some maintenance projects.
Because of Interserve’s expertise in national facilities management contracts and focus on improving the customer experience, the Company was uniquely placed to deliver this contact.
In 2017, CMS merged with Olswang LLP and Nabarro LLP to create a new global firm with more than a thousand partners and 5,000 lawyers, making it the sixth largest law firm in
INTERSERVE HELPING CMS DELIVERthe UK by revenue and the sixth largest in the world by lawyer headcount. Preparing for the merger, the Interserve facilities and property team worked closely with CMS to project manage the on-boarding of three new UK locations in Reading, Sheffield and Manchester, as well as two additional floors and a larger client area at Cannon Place in London.
Chris Trim, Head of Outsourcing for CMS, said, “The practicalities of delivering the merger just would not have happened without you and your team’s help. So, a massive thanks from CMS for the work that was undertaken by Interserve.”
Iain Shorthose, Interserve’s Customer Experience Director, said, “Our work with CMS illustrates how we view our clients more as partners than as customers. We have worked with CMS to meet their needs, ensuring there is a relentless focus on delivering the best customer experience.
“I believe this approach sets Interserve apart from our competitors.”
LOOKING AHEAD Following the challenges of 2017, this year has been about creating a stable platform for the future growth of the Group. Major progress has been made, but we recognise there is still much to do, and the leadership remain focused on the job in hand.
The successful handover of all its remaining Energy from Waste projects remains a core priority for the Group.
The proposed Deleveraging Plan will, if implemented, restore financial resilience to our balance sheet, but the process of rebuilding trust with, and value for, our shareholders is just beginning.
Once again, I would like to thank our staff, customers and suppliers for their support during this difficult period. I would also like to express my appreciation to those shareholders and lenders who have continued to support us.
Glyn BarkerChairman 8 March 2019
07
Governance
Financial Statements
Strategic Report
Overview

Throughout 2018 and the early months of 2019 it has been an extremely difficult time for Interserve and the Group has faced an unprecedented level of challenges. However, it has also been a period of considerable progress. The Group has benefited enormously from its hard-working employees who are our greatest source of competitive advantage, the depth of our client relationships, the underlying business strategy, and the strong support of our stakeholders.
Our most important priority remains the health and safety of our employees. I am pleased to say the Group’s performance improved in the year. While there will always be more that can be achieved through ongoing actions, our Lost Time Injury Rate improved by 25 per cent falling to 0.98 in 2018.
Whilst the majority of my first 18 months as Chief Executive Officer has been spent establishing the long-term financial stability of the Group, I have had the opportunity to spend time visiting our UK and international operations. There is a lot to be excited about: it is very clear we have extremely strong delivery capability and client relationships. Interserve has significant opportunities as a best-in-class partner to the public and private sector, and we are working with all stakeholders to put in place the right standards, services, governance and financing to deliver a stronger future for Interserve’s customers and our 68,000 people.
PROGRESS ON DELEVERAGING PLAN On 6 February 2019, Interserve announced that the key commercial terms of the proposed Deleveraging Plan, which the directors believe will provide the Group with sufficient liquidity to service its short-term cash obligations, create a strong balance sheet and a competitive financial structure from which the Group can improve its business and deliver on its long-term strategy.
The Deleveraging Plan is a consensual restructuring of Interserve, which is urgently required to avoid a default in the existing financing arrangements and to provide sufficient liquidity, cash and bonding facilities to allow the Group to service short-term obligations and secure a stable platform. Such a default, were it to occur, would be expected to have material adverse consequences for all stakeholders and, in particular, for existing shareholders.
The Board considers the Deleveraging Plan to be in the best interests of the Group and its shareholders as a whole. The Deleveraging Plan preserves fully the pre-emption rights of existing shareholders. If shareholders take up their entitlements in the equity raise their ownership will not be diluted.
The Board believes that the Deleveraging Plan will secure a strong future for Interserve. This proposal has been achieved following a long period of intensive negotiation and has the support of our financial stakeholders and Government. Its successful implementation is critical to Interserve’s future and all the Company’s stakeholders. The Deleveraging Plan will, alongside our Fit for Growth programme, place us in a strong position to deliver our strategy, be competitive in the marketplace and provide a
secure future for the Interserve Group’s employees, customers and suppliers.
The Deleveraging Plan will be subject to approval by Interserve’s shareholders.
BUILDING A BETTER INTERSERVE – STRATEGIC PRIORITIESStrategic review and transformation programmeIn April 2018, Interserve announced that it had completed a Group-wide strategic review and launched a strategic plan, based on four priorities:
1. Fit for Growth – improving cost efficiency and effectiveness;
2. Strengthening Interserve’s competitive value proposition;
3. Standardising operational delivery; and
4. Developing its people and a consistent, ‘One Interserve’ culture.
PROGRESS AGAINST OUR FOUR STRATEGIC PRIORITIESFit for Growth The three-phase Fit for Growth programme was designed to ensure that the Group has the right strength, depth and level of resources to consistently win and consistently deliver services for our customers. The programme is delivering material cost savings and a simpler and more effective business and operating structure. The programme over delivered its target of £15 million savings by 33 per cent to £20 million in 2018 and is on track to deliver at least £40-50 million annual benefit to Group performance by 2021.
Phases one and two of the programme have now been successfully completed. An initial cost-out programme was undertaken in late 2017 and a Group-wide organisational design project was implemented in 2018 and completed in early 2019. In addition, Interserve has focused on improving governance, key processes and efficiency across the Group.
Phase three of the programme is about continuing to deliver on our promises to achieve our savings targets for both cash and the P&L. Key objectives include simplifying our technology, standards and processes to improve efficiency as well as driving one way of doing things across Interserve. Improving the performance of our business and our culture remains a key priority across the Group.
Competitive value proposition The Group’s second strategic priority is to have competitive customer value propositions in each of the markets the Group chooses to operate in. A key component of a competitive value proposition is the strength of our balance sheet; our proposed Deleveraging Plan will deliver us this.
Interserve is focused on bringing the depth of our expertise and knowledge to its customers, enabling them to deliver strategic goals. We have made progress toward achieving this objective, such as in Support Services, developing our customer experience
Debbie WhiteChief Executive Officer
Chief Executive Officer’s statement
08
OVERVIEW

proposition to ensure we add value for our customers and we have developed the interchange model to improve how our rehabilitative companies support our service users. We also realise that more needs to be done. There will be a greater focus on where these propositions best meet the needs of Interserve’s customers; a major aspect of this approach is the deepening of relationships with our clients. We are moving away from our traditional reliance on single-service operations to the provision of a broader, deeper span of services which have an emphasis on the formation of long-term relationships.
Operational deliveryIn order to achieve this within Support Services, Interserve has successfully reorganised its business teams to align to the four focus segments of Government and Defence, Private Sector, Communities and Citizen Services. The Group has also completed a review of its service offerings to ensure that they are appropriate for these customer segments and that it is best positioned to offer and deliver consistent integrated facilities management services. Interserve has started to wind down service offerings that are not core to its future offering and will continue to do this proactively and as contracts end. In UK Construction we have developed a focused approach to the market which will be rolled out during 2019.
One Interserve Our Fit for Growth programme involves creating a One Interserve culture. The aim of One Interserve is to enable our colleagues to work and collaborate together to deliver better services for our customers.
One Interserve addresses the fact that historically Interserve was fragmented and federalised, which frustrated the business’s ability to develop and realise opportunities for growth. Unlocking these aspects and building a common company culture is our fourth strategic priority and will enable Interserve to bring the very best of the Group’s capabilities and service expertise to customers in its three sectors. A key component of the culture will be strong governance and accountability.
The plan includes a focus on the self-delivery of services - which is an important part of margin development and control.
A final aspect of One Interserve involves following a standard approach to leadership, to performance management, to training and development and to reward and recognition in order to streamline the business and ensure we are in the best possible shape to serve our customers.
The key to the delivery of the strategy and the business plan is Interserve’s people. Our most recent staff survey elicited a strong and positive engagement score of 72 per cent. More than 78 per cent of our colleagues said that their manager cared about them, while almost 80 per cent said that what they do matters. Action planning around feedback is helping us drive continuous improvement.
2018 FINANCIAL RESULTS Despite challenging market conditions, the directors believe that Interserve has made significant operational progress in 2018. Following the successful completion of the refinancing in April, the business has traded robustly in some challenging markets and continued to win significant new contracts. The Fit for Growth programme is delivering material cost savings and a simpler and more effective business structure.
The implementation of the Group’s strategy remains on track and we have delivered a significantly improved operating profit up 9.7 per cent to £92.7 million, driven by cost savings and increased margins. Net debt increased to £631.2 million and was within the expected range of £625-650 million as revised in November. This was driven by UK Construction, Energy from Waste outflows, non-underlying charges and delayed payments on certain Middle East projects.
Since 31 December 2018 the Group’s net debt position has increased, partly in line with expected seasonality, but also as a consequence of the recognition of costs associated with the deleveraging transaction, a further deterioration in the Middle East relating to receivables for Support Services and RMDK and further working capital unwind in the construction business which, in aggregate, represent a deterioration of approximately £107 million above the expected increase in net debt due to seasonality. These items, as well as an updated expectation with respect to the Energy from Waste projects, have driven the requirement for new liquidity within the Group and the lenders agreeing to provide a further facility of £110 million as part of the Deleveraging Plan. If the Deleveraging Plan is not passed on 15 March 2019, the Group will have an immediate working capital shortfall, regardless of whether the lenders have demanded the repayment of the Group’s borrowings under the Existing Cash Financing Arrangements.
Our transformation programme is delivering strong operational momentum. The Group has a future workload of £7.1 billion as of 31 December 2018, with steady growth particularly in Support Services.
The Board remains focused on positioning the Group for long-term, sustainable success. This means continuing the operational progress we are making to put legacy issues behind us, particularly in closing out and exiting the Energy from Waste business.
The Group remains over-leveraged and the successful implementation of the Deleveraging Plan is critical to our future.
The Board considers the Deleveraging Plan to be in the best interests of Interserve and will preserve maximum value for employees, pensioners, lenders, suppliers, customers and shareholders. Alongside the Company-wide Fit for Growth programme, it will provide a strong platform for Interserve’s future growth.
09
Governance
Financial Statements
Strategic Report
Overview

CONTRACT WINSDespite challenging market conditions and concerns arising out of our financial condition, we still continued to make progress winning new work in the year. In our Support Services division we secured the following contracts: AENA (£37 million), King George Hospital (£35 million), Ministry of Justice (£25 million) and the Foreign and Commonwealth Office (£67 million), among others. In our Construction division major contracts included: Durham University (£78 million), Liverpool Women’s NHS Foundation Trust (£15 million) and Prince Charles Hospital, Merthyr (£25 million). In our Equipment Services division, contract wins included: Royal Atlantis Residences in Dubai (£5 million) and the Las Vegas Raiders Stadium (£1 million).
DIVISIONAL PERFORMANCE Considerable work has been put into focusing Interserve’s core capabilities to create value for its customers. Following the strategic review in 2018, the Company completed the streamlining of its divisional structure from more than 40 to three divisions in December 2018, replacing the federated entity that existed up until the end of 2017. This reorganisation is helping us to be leaner and better aligned to our customers, increasing leadership accountability and importantly making Interserve even more competitive.
Support ServicesSupport Services UK delivered a robust performance over the year as it continued to implement the Fit for Growth programme and had excellent client retention in the UK. A decrease in revenue was counterbalanced by increased margins and profits. This included leveraging the Group-wide back office systems and processes, implementing a clearly defined market strategy leading to the divestment of non-core operations, exiting poorly performing market sectors, increasing self-delivery, and laying the foundations for greater operational standardisation across the business. As we outlined in our 2017 Annual Report, we have focused on cost reduction and stronger discipline on contract management governance, helping us realise the benefits in 2018 and ensuring we enter 2019 with a solid platform for growth. Revenue increased in target sectors following key contract retentions, organic contract growth, and successful delivery of key contract mobilisations. Interserve’s international support services business was negatively impacted by a debtor balance of £36 million by one of its clients.
Construction2018 was a challenging year for our UK construction business with a decrease in revenues being counterbalanced by higher margins. Progress has been made in closing out some complex projects and legacy accounts. We have successfully exited the London Construction market as part of our strategy to focus on our core sectors. Our regional building business, infrastructure business and engineering services business all made solid returns, which resulted in a return to profit for the division.
We continue to focus on core sectors and activities and ensure that the risk profile of work that we take on is commensurate with levels of return. Revenue is expected to fall in 2019 as some of the larger legacy contracts complete and due to some of the wider financial challenges the Group faced in 2018. Whilst we expect the division to be a smaller business by revenue in 2019, we believe it will be one which is more agile and capable of consistent profit margins in line with industry norms going forward.
Whilst the order book for the International construction business, particularly in Qatar, continues to be lower than expected, the business secured a number of contract wins in the period, particularly in the UAE where a strengthened oil price provides a more favourable backdrop for this competitive market.
Equipment ServicesChallenging market conditions in several of our core markets through 2018 as well as supply-chain challenges have slowed our overall rate of growth. Through 2018 we have seen the UK construction sector hit by the uncertainty of the Brexit talks with the consequence of investment and work on major infrastructure projects being delayed. RMDK remains a highly profitable business and has strengthened its competitive position during the period with the roll-out of new product ranges in the UK.
ENERGY FROM WASTEInterserve is continuing to pursue its strategy to exit from unprofitable businesses as rapidly as possible. The construction of all of our Energy from Waste projects was substantially completed during 2018, but while the Company expects to fully exit its Energy from Waste business during the first half of 2019, significant uncertainty remains on the timing of those remaining projects.
Interserve continues to expect to benefit from significant further insurance proceeds arising from these projects in 2019. The receipt of further insurance income remains a key focus for the Group.
OUTLOOK Interserve’s ability to deliver its strategy and business plan will be significantly influenced by our ability to successfully implement the Deleveraging Plan, thereby providing it with sufficient liquidity and giving it a foundation for financial stability.
Interserve will continue to implement its multi-year Fit for Growth programme and 2019 will be the second year of the overall transformation programme. This will be a transitional year for the three operational divisions as Interserve continues to focus on exiting non-core areas and implementing the Group’s cost and efficiency programme.
This year, through the outstanding expertise of our people, we will continue to deliver projects safely and ensure that we are best placed to serve our customers. The significant improvements we have made as part of our Fit for Growth programme will ensure we continue to make progress in 2019 with the transformation of Interserve.
Debbie WhiteChief Executive Officer8 March 2019
Chief Executive Officer’s statement continued
10
OVERVIEW

Our new regional hub, Ingenuity House, showcases the very best of what we can do.
In 2018, we moved 1,600 colleagues from four of our existing offices in the region; having finished the construction of the award-winning building. Complete with 1,350 workstations, Ingenuity House is a highly-sustainable, energy efficient 12,000m2 building which demonstrates Interserve’s construction and facilities management expertise.
Ingenuity House represents our drive to create a collaborative and modern working environment for employees.
Sally Cabrini, Director of Transformation, IT and People, said, “Our vision was to create a workplace that enables our colleagues to work more closely together in a sustainable, healthy and inspirational working environment. Ingenuity House provides a working environment that is safe, vibrant, and dynamic, that meets the specific needs of the business.
“Ingenuity House reflects key aspects of our strategy, because the work practices that the building supports will enable us to strengthen our competitive value proposition and help us foster our One Interserve culture.”
Triangular on plan, Ingenuity House stands at 22m high and is set over five storeys, with 3,000m2 floorplates around the atrium which features the restaurant at the heart of the space to enable colleagues and clients to meet, greet, gather and work.
Specialists from across Interserve came together to connect the various elements of Ingenuity House:
• Interserve Construction built the physical structure
• RMD Kwikform supplied the plant equipment for ground works
• Site Services provided the eco cabins as temporary offices for the project team
• Interserve Retail and Interiors created bespoke furniture and joinery
• Interserve Support Services provided the onsite catering, cleaning and security and are now operationally managing the building
• Our IT teams put in place infrastructure and network technology supporting our colleagues in smarter working
• BREEAM Excellent rating achieved.
BUILDING OUR HOME – INGENUITY HOUSE
11
Governance
Financial Statements
Strategic Report
Overview

CONSOLIDATED REVENUE LOSS BEFORE TAX
CASH GENERATED BY OPERATIONS - ONGOING BUSINESS
UNDERLYING EBITDA1
FUTURE ORDER BOOK HEADLINE EARNINGS PER SHARE 2
Results in summary
1 Underlying EBITDA comprises underlying operating profit for 2018 of £92.7 million (2017: £84.5 million) plus depreciation and amortisation for 2018 of £41.8 million (2017: £41.2 million).
2 See note 11 for calculation of earnings per share.
2017 comparatives as restated
20182018
2018
2018
2018
2017
2017 2017
20172017
2017
£2,904.0m £(111.3)m
£11.3m2018
£134.5m
1.1p£7.1bn £7.6bn
£3,250.8m
£32.9m £125.7m
35.6p
£(244.4)m
12
OVERVIEW

WHAT WE DO MARKET THEMES
SUPPORT SERVICES
• The management and delivery of outsourced operational activities across a range of sectors in both public and private markets
• Provision of citizen services in the Justice, Health and Training and Employment sectors
• Services provided in the UK and the Middle East
• The UK outsourced FM market was £90 billion in 2017 and we expect fastest areas of growth to be in bundled and total FM services
• The outsourcing market continues to grow at around two per cent per annum
• Our UK Government outsourcing contracts are exceptionally well developed
• Growth opportunities in the Justice market from prison renewal and privatisation, together with the retendering of second generation probation (Community Rehabilitation Company) contracts
• Training and employment opportunities resulting from Apprenticeship Levy
CONSTRUCTION
• Provision of advice, design, construction and fit-out services for buildings and infrastructure across a range of sectors in both public and private markets
• Focused on creating and maintaining long-term relationships and delivering repeat business through lower risk commercial structures such as frameworks
• Fragmented market
• Infrastructure and private housing are forecast to grow faster than the market as a whole
• Infrastructure market driven by the structural growth in global infrastructure spend
EQUIPMENT SERVICES
• Provision of engineering solutions for the construction industry in the specialist field of temporary structures, i.e. formwork, falsework and shoring
• Operating in over 20 countries around the world
• Global presence in infrastructure and buildings markets
• Short-term headwinds from project delays in key markets and increasing regional and local competition
• Interserve’s subsidiary, RMDK, is a global market leader, whose markets are driven by growth in infrastructure and buildings sectors
Our markets
13
Governance
Financial Statements
Strategic Report
Overview

Interserve’s global formwork, falsework and ground shoring solutions business has helped build a multi-million pound ventilation system for a section of the M4 motorway near Sydney, south eastern Australia.
Interserve’s equipment business, RMD Kwikform, was hired to support work on the Parramatta Road Ventilation Facility (PRVF), a project that will provide tunnel ventilation for WestConnex, the country’s largest road infrastructure scheme.
Due to the stringent timescales and the project’s logistical complexity, RMD Kwikform worked closely with the main contractor to provide a formwork and shoring solution that would allow for the safe and efficient construction of the PRVF’s suspended concrete slabs and beams. Using LocusEye, an in-house designed visualisation software, RMD Kwikform generated highly realistic 3D rendered models of the temporary works solution. This meant that the client was able to visualise, interrogate and truly understand the solution in order to drive productivity gains during construction.
VISUALISING HOW TO CREATE A VENTILATION FACILITY
1414
OVERVIEW
14

The structure has a series of suspended concrete slabs and beams, varying in depth from 300mm to 1,700mm throughout the 50m deep shaft and 20m above ground level. The initial suspended slab varies to a maximum height of up to 19m. Due to the depths of the concrete slabs, the client required a solution that would withstand high loads, which is why RMD Kwikform’s Rapidshor shoring was selected as a preferred solution.
Robert Novak, Senior Account Manager at RMD Kwikform, said, “This was an incredible project to be involved in and really highlights the quality of our products, our engineering expertise and digital capabilities. With each facet combined, we ensured the site team remained safe, efficient, and the project remained on schedule.”
15
Governance
Financial Statements
Strategic Report
Overview
15

INTERSERVE HAS DEVELOPED A COHERENT AND CONSISTENT
FOUR-POINT STRATEGY TO DRIVE THE OVERALL DIRECTION OF THE BUSINESS:
DEFINE AND DELIVER A VALUE
PROPOSITION FOR CUSTOMERS,focused on growth in
markets where Interserve is best placed to
win business.
STANDARDISE OPERATIONAL
DELIVERY, with increased
self-delivery where appropriate, to increase efficiency and reduce
operational risk.
DELIVER THE FIT FOR GROWTH
TRANSFORMATION PLAN,expected to deliver at
least £40-50 million annual benefit to Group operating
profit by 2020.
DEVELOP A ONE INTERSERVE
CULTURE AND APPROACH,
creating a strong sense of ownership and openness to change and a compelling
proposition to attract the best talent in
the market.
1616
STRATEGIC REPORT

The Company launched the Fit for Growth programme in 2018, a Group-wide initiative that has the objective of laying the foundations for the Company’s future growth.
Fit for Growth is underpinned by strong governance, reporting and auditing practices. Our good governance practices mean the Company can provide a high level of assurance to our customers and investor community that we are achieving our objectives.
The first half of the year was an important period for Interserve as the new management team took actions to bring stability to the business and agree the direction of the Company’s future strategy. The Fit for Growth initiatives we are implementing are delivering material cost savings and will result in a simpler, more focused and more effective Interserve. The refinancing we completed in April 2018 provides a firmer financial footing from which to execute these plans.
We now have a strategy that provides a clear direction, leveraging our areas of strength, where we can provide compelling customer propositions, delivered with rigorous operational and financial discipline. While there remains significant work to do, we have energy and momentum in the business as evidenced by new contract wins as we make further progress with the implementation of our strategy and the Fit for Growth programme.
FIT FOR GROWTH – WHAT WE HAVE DELIVERED SO FARPhase One consisted of:• rapidly reducing headcount and vacant roles
• stopping all internal projects and non-critical discretionary spend
• strengthening our management processes and controls
• achieving savings through leveraging our purchasing activities and negotiating improved deals with our suppliers.
Phase Two consisted of:• removing more roles through changes of reporting lines
• removing functions duplicated across the business
• implementing stronger governance, controls and processes
• freezing recruitment.
We consolidated our property portfolio and introduced smaller changes such as reducing our travel and simplifying our technology.
Fit for Growth was accompanied by a strong engagement plan to ensure change was driven through all levels of the business. Processes have also been implemented to ensure the risk of costs creeping back into the organisation has been mitigated.
We firmly believe our current activities will deliver all of the required target benefit by 2020.
FIT FOR GROWTH – MORE THAN JUST COST SAVINGSFollowing a root and branch analysis of the business, we are progressing well with delivery of a new organisational design that is more efficient, has reduced overheads and offers improved working practices and processes. As part of this process, we have simplified the divisional structure and now – as described on page 18 – have three divisions to carry forward our business.
We are creating an environment in which skilled and engaged employees can thrive and we are focused on retaining and attracting talented people who are motivated to deliver for the future.
Phase Three: One InterserveThe aim of Phase Three is to create a ‘One Interserve’ culture while continuing to deliver savings. One Interserve’s aim is to enable our colleagues to work and collaborate together to deliver better services for our customers. One Interserve includes five elements, which are:
Organisational design: savings created by a switch to Shared Service Centres, process simplification, supplier rationalisation and removal of divisional overheads.
Procurement: savings will continue through rebates and unit cost reductions. Work is ongoing to shape our procurement operating model for delivery in the second half of 2019.
Information technology: we have designed our IT strategy which includes how we will embrace modern technology to help us drive improvements in performance. Implementation of the two-year strategy is progressing well as we continue to simplify and standardise the current technology estate.
People and culture: our annual colleague survey – Your Voice – was issued across the Company in December last year and elicited a strong and positive engagement score of 72 per cent. More than 78 per cent said they felt their manager cared about them and almost 80 per cent said they feel like what they do matters. Action planning around issues raised is underway so we can drive improvements based on what our colleagues are telling us.
Strategy: each division is implementing our four strategic objectives to deliver a solid platform for future profitable growth.
The aim of Fit for Growth is to create an efficient organisation equipped with the right structure to achieve long-term growth. Fit for Growth underpins our approach towards stabilising the business, and consists of three phases.
Phases One and Two were successfully completed last year and have both over-achieved the required savings for our 2018 forecast. We had targeted savings of £65 million but achieved £67 million.
PHASE ONE:rapid implementation of ‘quick win’ cost savings initiatives
PHASE TWO:significant restructure, procurement savings and other smaller initiatives
PHASE THREE:Further organisation design changes delivering savings through investment in technology and/or outsourcing
1717
Governance
Financial Statements
Strategic Report
Overview
Fit for Growth
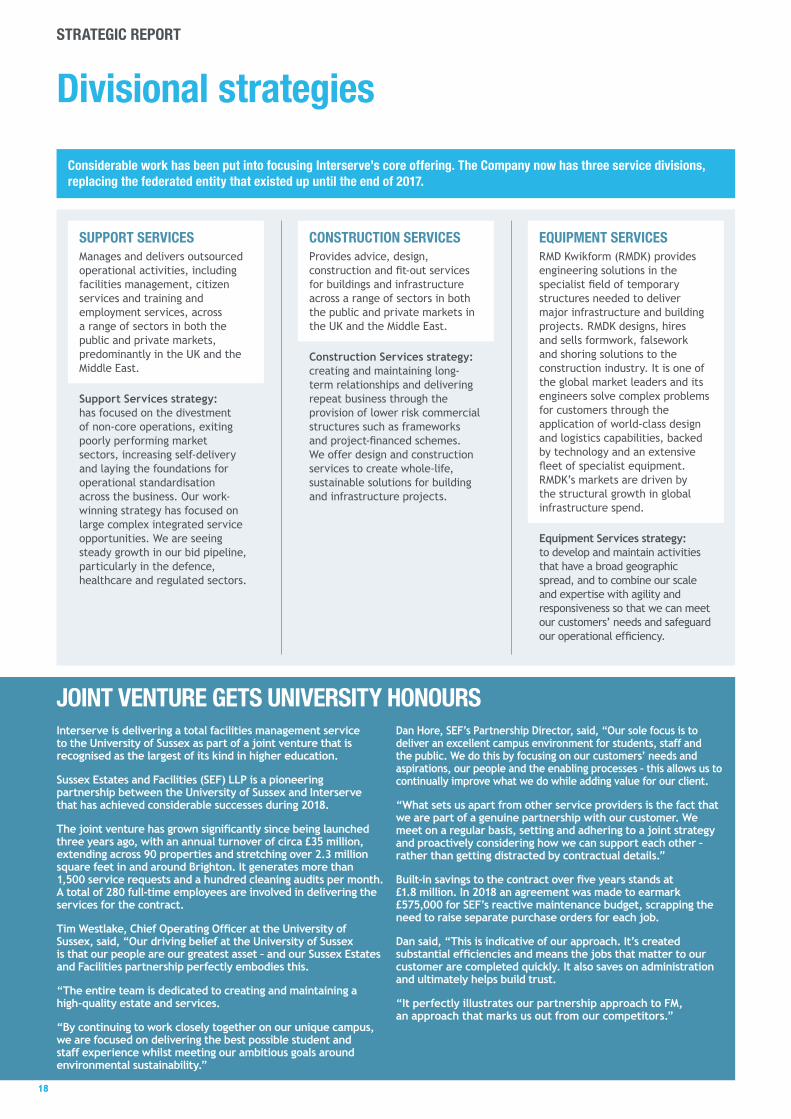
Interserve is delivering a total facilities management service to the University of Sussex as part of a joint venture that is recognised as the largest of its kind in higher education.
Sussex Estates and Facilities (SEF) LLP is a pioneering partnership between the University of Sussex and Interserve that has achieved considerable successes during 2018.
The joint venture has grown significantly since being launched three years ago, with an annual turnover of circa £35 million, extending across 90 properties and stretching over 2.3 million square feet in and around Brighton. It generates more than 1,500 service requests and a hundred cleaning audits per month. A total of 280 full-time employees are involved in delivering the services for the contract.
Tim Westlake, Chief Operating Officer at the University of Sussex, said, “Our driving belief at the University of Sussex is that our people are our greatest asset – and our Sussex Estates and Facilities partnership perfectly embodies this.
“The entire team is dedicated to creating and maintaining a high-quality estate and services.
“By continuing to work closely together on our unique campus, we are focused on delivering the best possible student and staff experience whilst meeting our ambitious goals around environmental sustainability.”
Dan Hore, SEF’s Partnership Director, said, “Our sole focus is to deliver an excellent campus environment for students, staff and the public. We do this by focusing on our customers’ needs and aspirations, our people and the enabling processes – this allows us to continually improve what we do while adding value for our client.
“What sets us apart from other service providers is the fact that we are part of a genuine partnership with our customer. We meet on a regular basis, setting and adhering to a joint strategy and proactively considering how we can support each other – rather than getting distracted by contractual details.”
Built-in savings to the contract over five years stands at £1.8 million. In 2018 an agreement was made to earmark £575,000 for SEF’s reactive maintenance budget, scrapping the need to raise separate purchase orders for each job.
Dan said, “This is indicative of our approach. It’s created substantial efficiencies and means the jobs that matter to our customer are completed quickly. It also saves on administration and ultimately helps build trust.
“It perfectly illustrates our partnership approach to FM, an approach that marks us out from our competitors.”
JOINT VENTURE GETS UNIVERSITY HONOURS
SUPPORT SERVICESManages and delivers outsourced operational activities, including facilities management, citizen services and training and employment services, across a range of sectors in both the public and private markets, predominantly in the UK and the Middle East.
CONSTRUCTION SERVICESProvides advice, design, construction and fit-out services for buildings and infrastructure across a range of sectors in both the public and private markets in the UK and the Middle East.
EQUIPMENT SERVICES RMD Kwikform (RMDK) provides engineering solutions in the specialist field of temporary structures needed to deliver major infrastructure and building projects. RMDK designs, hires and sells formwork, falsework and shoring solutions to the construction industry. It is one of the global market leaders and its engineers solve complex problems for customers through the application of world-class design and logistics capabilities, backed by technology and an extensive fleet of specialist equipment. RMDK’s markets are driven by the structural growth in global infrastructure spend.
Support Services strategy: has focused on the divestment of non-core operations, exiting poorly performing market sectors, increasing self-delivery and laying the foundations for operational standardisation across the business. Our work-winning strategy has focused on large complex integrated service opportunities. We are seeing steady growth in our bid pipeline, particularly in the defence, healthcare and regulated sectors.
Construction Services strategy: creating and maintaining long-term relationships and delivering repeat business through the provision of lower risk commercial structures such as frameworks and project-financed schemes. We offer design and construction services to create whole-life, sustainable solutions for building and infrastructure projects.
Equipment Services strategy: to develop and maintain activities that have a broad geographic spread, and to combine our scale and expertise with agility and responsiveness so that we can meet our customers’ needs and safeguard our operational efficiency.
Considerable work has been put into focusing Interserve’s core offering. The Company now has three service divisions, replacing the federated entity that existed up until the end of 2017.
1818
STRATEGIC REPORT
Divisional strategies

SUPPLY CHAIN MANAGEMENTWe manage and work with our extensive supply chain to ensure we get the best value to meet our clients’ needs safely and sustainably. We manage risk by ensuring our supply chain complies with our policies and consider the cost of ownership, quality, service and delivery when selecting our suppliers. We treat our supply chain in a consistent manner from selection to contract agreement and ongoing management.
> See page 22 for our safety record
SYSTEMS AND PROCESSESInterserve’s proven expertise over many years lies in the evolution of systems and processes to maximise impact and manage resources. Through the innovative use of technology and thanks to our years of experience, we are constantly looking at ways to enhance process management. As our case studies illustrate, Interserve strives to improve systems and processes in partnership with our customers in order to deliver the right result.
> See pages 14 and 15 – Visualising how to create a ventilation facility
PROJECT MANAGEMENT AND DELIVERYWe use proven programme management tools and draw from our vast experience of delivering complex projects for both public and private-sector organisations. This includes mobilising, transitioning and transforming large-scale contracts across a range of sectors.
We recognise the importance of using proven systems to assure our readiness for service commencement, allowing us to deliver the best service possible to our customers.
> See page 5 – Christie Proton Beam facility
HOW WE CREATE VALUE
WHAT WE DO
EVERYTHING WE DO IS SHAPED BY OUR CORE VALUES
We listen and encourage openness.
Whatever the task in hand, everybody can and should take pride in a job well done.
We strive to always work in a safe and sustainable way.
We ask questions, think differently, seek solutions and create ideas to support our customers and add value.
OUR EXPERTISE
Interserve provides world-class support services, construction and equipment services to private and public clients in the UK and over 40 international markets.
We provide our clients with innovative and compelling solutions to complex challenges, delivered with rigorous operational discipline.
This helps to create improved customer and public services for the end-user and adds value to local economies.
OUR VALUES
1919
Governance
Financial Statements
Strategic Report
Overview
Business model

What we have achieved
We have:
• refinanced the Group
• greatly simplified our previously federated structure, reducing it from more than 40 different business units to three: Support Services; Construction and Equipment Services
• created efficient systems and management processes so performance can be constantly reviewed
• improved our safety performance
• worked towards an exit from unprofitable businesses, such as Energy from Waste
• listened to our customers, suppliers and employees to drive continuous improvement
• defined divisional strategies
• completed Phases One and Two of our Fit for Growth strategy
• delivered what we were contracted to deliver profitably.
ONE INTERSERVEAt Interserve our people are at the heart of our business. To ensure that we can deliver on our promise to deliver the right solutions for our customers at the right price and to help drive our Company forward, we have developed a One Interserve culture. One Interserve has the two-fold aim of making the Company a better place to work while also ensuring we deliver the best possible services to our customers and partners.
Objectives achieved in adopting a One Interserve culture during 2018 include:
• making improvements to our organisational design so it is more efficient and effective
• improving how we plan and prioritise by adopting a clear strategy which is delivered by adhering to consistent processes
• adopting strong governance and accountability
• adopting strong and clear management processes and ensuring our leaders have good internal visibility
• consistent and robust reporting of operational performance
• implementing standard and effective review processes.
EXITED BUSINESSESInterserve is delivering on its strategy to exit from unprofitable businesses. The construction of all of our Energy from Waste projects – namely Derby, Dunbar, Margam and Templeborough – was substantially completed during 2018. Dunbar has been handed over, while Derby, Templeborough and Margam are operating and generating energy and are in the final stages of commissioning. While the Company expects to fully exit its Energy from Waste business and to substantially complete its role in the construction of each of the remaining projects by the first half of 2019, significant uncertainty remains on the timing of completion of commissioning of those remaining projects.
Earlier in the year, we also agreed the sale of Haymarket development in Edinburgh for net proceeds of £47.0 million, completing the exit from the property development business. This has enabled the Company to give greater focus to our core activities.
OUR PLANS FOR THE FUTUREInterserve is now focused on core markets where we have competitive advantages. This will help us to provide the best service to our customers and drive the growth of the Company.
Considerable progress has been made towards achieving the Company’s four strategic aims as outlined on page 16.
2020
STRATEGIC REPORT
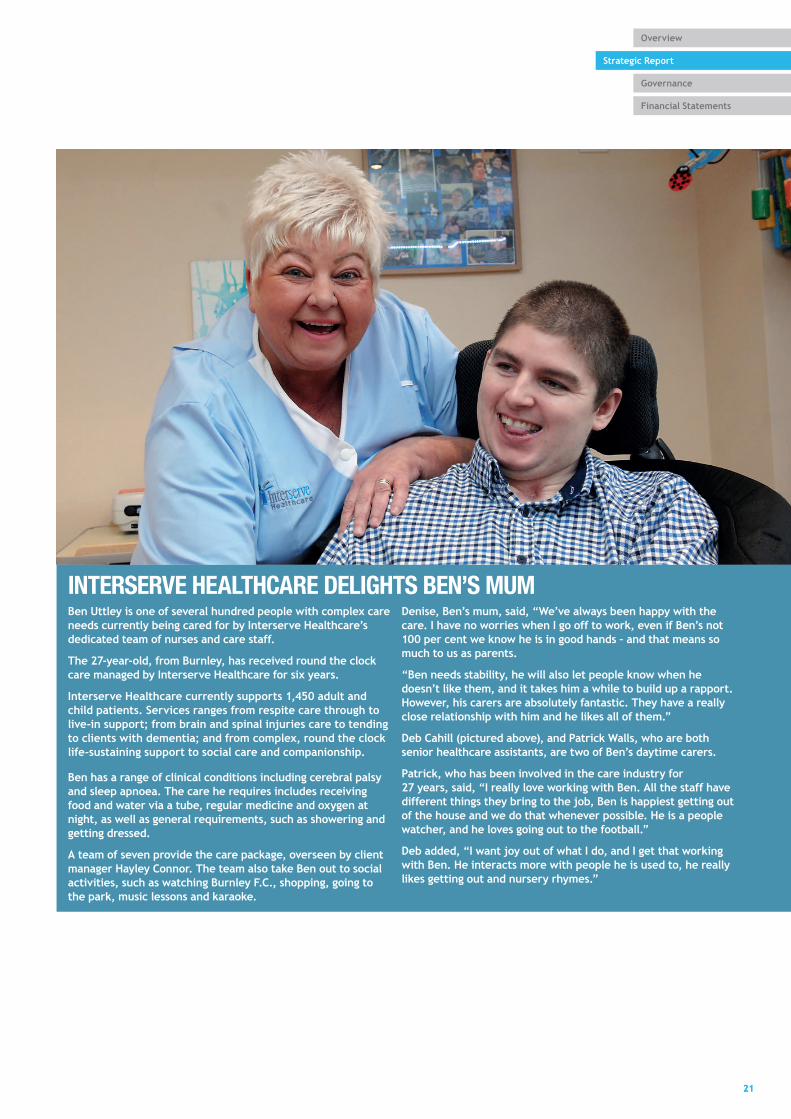
Ben Uttley is one of several hundred people with complex care needs currently being cared for by Interserve Healthcare’s dedicated team of nurses and care staff.
The 27-year-old, from Burnley, has received round the clock care managed by Interserve Healthcare for six years.
Interserve Healthcare currently supports 1,450 adult and child patients. Services ranges from respite care through to live-in support; from brain and spinal injuries care to tending to clients with dementia; and from complex, round the clock life-sustaining support to social care and companionship.
Ben has a range of clinical conditions including cerebral palsy and sleep apnoea. The care he requires includes receiving food and water via a tube, regular medicine and oxygen at night, as well as general requirements, such as showering and getting dressed.
A team of seven provide the care package, overseen by client manager Hayley Connor. The team also take Ben out to social activities, such as watching Burnley F.C., shopping, going to the park, music lessons and karaoke.
INTERSERVE HEALTHCARE DELIGHTS BEN’S MUMDenise, Ben’s mum, said, “We’ve always been happy with the care. I have no worries when I go off to work, even if Ben’s not 100 per cent we know he is in good hands – and that means so much to us as parents.
“Ben needs stability, he will also let people know when he doesn’t like them, and it takes him a while to build up a rapport. However, his carers are absolutely fantastic. They have a really close relationship with him and he likes all of them.”
Deb Cahill (pictured above), and Patrick Walls, who are both senior healthcare assistants, are two of Ben’s daytime carers.
Patrick, who has been involved in the care industry for 27 years, said, “I really love working with Ben. All the staff have different things they bring to the job, Ben is happiest getting out of the house and we do that whenever possible. He is a people watcher, and he loves going out to the football.”
Deb added, “I want joy out of what I do, and I get that working with Ben. He interacts more with people he is used to, he really likes getting out and nursery rhymes.”
2121
Governance
Financial Statements
Strategic Report
Overview
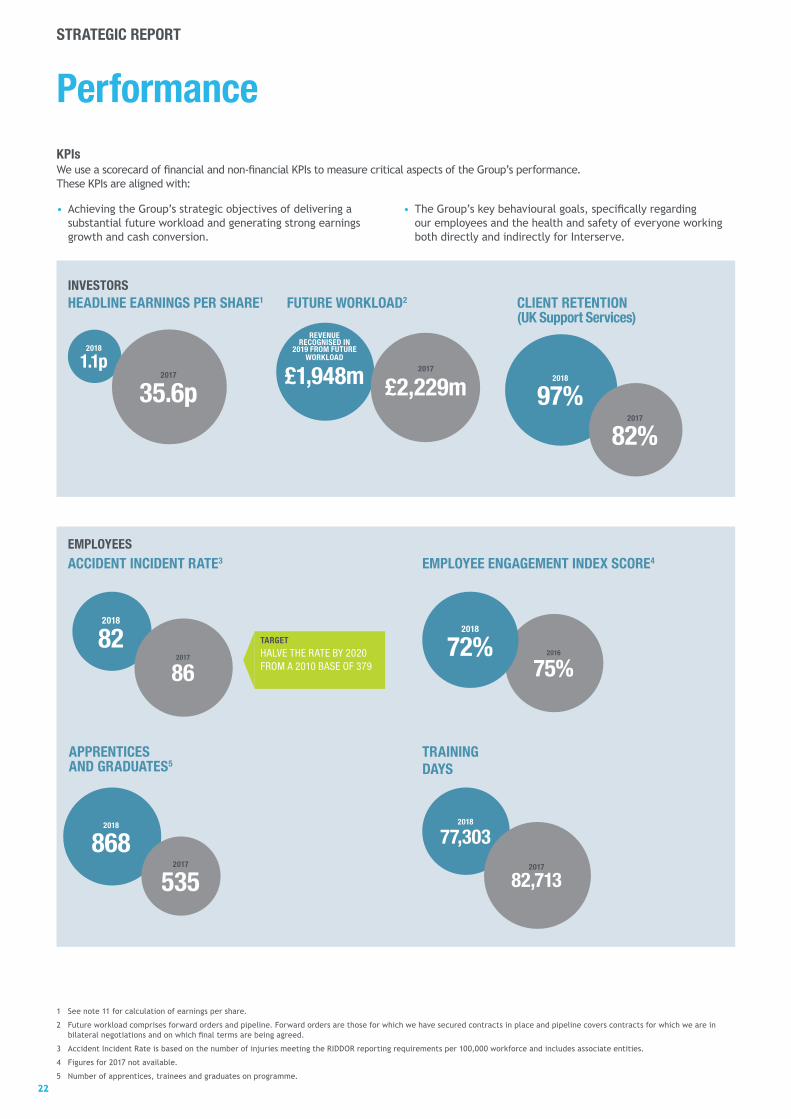
PerformanceKPIs We use a scorecard of financial and non-financial KPIs to measure critical aspects of the Group’s performance. These KPIs are aligned with:
• Achieving the Group’s strategic objectives of delivering a substantial future workload and generating strong earnings growth and cash conversion.
• The Group’s key behavioural goals, specifically regarding our employees and the health and safety of everyone working both directly and indirectly for Interserve.
1 See note 11 for calculation of earnings per share.
2 Future workload comprises forward orders and pipeline. Forward orders are those for which we have secured contracts in place and pipeline covers contracts for which we are in bilateral negotiations and on which final terms are being agreed.
3 Accident Incident Rate is based on the number of injuries meeting the RIDDOR reporting requirements per 100,000 workforce and includes associate entities.
4 Figures for 2017 not available.
5 Number of apprentices, trainees and graduates on programme.
EMPLOYEE ENGAGEMENT INDEX SCORE4
APPRENTICES AND GRADUATES5
TRAINING DAYS
ACCIDENT INCIDENT RATE3
2018
868
2018
82
2017
535
2017
862016
75%TARGET
HALVE THE RATE BY 2020 FROM A 2010 BASE OF 379
2018
72%
2018
77,3032017
82,713
EMPLOYEES
HEADLINE EARNINGS PER SHARE1
INVESTORSFUTURE WORKLOAD2 CLIENT RETENTION
(UK Support Services)
2018
97%
2018
1.1p2017
35.6p2017
82%
REVENUE RECOGNISED IN
2019 FROM FUTURE WORKLOAD
£1,948m 2017
£2,229m
2222
STRATEGIC REPORT

We recognise the natural environment plays a significant role in the economy and society. Our approach to managing natural capital includes minimising our impacts, focusing on responsible sourcing and improving resources efficiency, and protecting the services the natural environment provides.
The following key environmental issues are addressed through our aim to generate a positive environmental impact as part of our sustainability programme:
• Mitigating climate change through reducing carbon emissions associated with our use of energy, fuel and travel.
• Waste management – generation, treatment and disposal.
• Water use and scarcity.
• Responsible sourcing and efficient use of natural resources.
During 2018 we have made considerable progress towards achieving our aim of making a positive contribution through both our own operations and those we undertake on behalf of clients. This includes reducing our carbon emissions by 22 per cent (on an absolute basis over the past five years). This has been driven primarily by a focus on fuel use in our fleet and a focus on energy use across our estate and estate transformation.
These performance metrics will be revisited as our strategy evolves.
Natural Capital
2018 Performance vs. 2013 Yr on Yr Change 2018 vs. 2017
Absolute Relative Absolute Relative
Water consumption (m3) (relative metric: m3/£m)1
UK 8.9% 5.6% 19.5% 35.4%
ROW -2.5% 27.4% -4.1% 75%
Total -2.1% 0.8% -3.4% -21.4%
Construction waste (tonnes) (relative metric: tonnes/£m)1
UK -39.7% -41.5% -40.3% -32.4%
ROW -56.4% -43.0% -27.7% 31.8%
Total -53.5% -52.1% -31.0% -13.3%
Total carbon emissions (tonnes CO2e) (relative metric: tonnes CO2e/£m)1
UK -23.6% -25.9% -2.8% 10.1%
ROW -21.0% 3.2% -13.1% 58.6%
Total -21.6% -19.2% -11.1% 11.7%
1 £m revenue.
ENVIRONMENT
2323
Governance
Financial Statements
Strategic Report
Overview
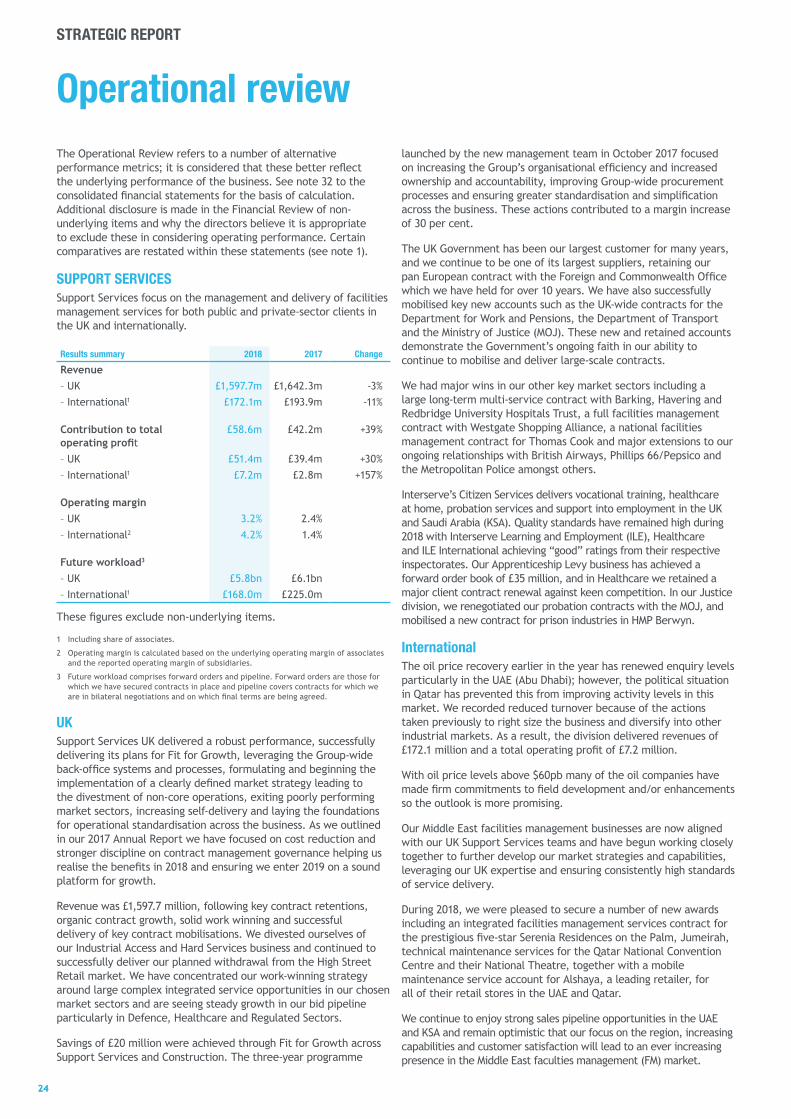
Operational reviewThe Operational Review refers to a number of alternative performance metrics; it is considered that these better reflect the underlying performance of the business. See note 32 to the consolidated financial statements for the basis of calculation. Additional disclosure is made in the Financial Review of non-underlying items and why the directors believe it is appropriate to exclude these in considering operating performance. Certain comparatives are restated within these statements (see note 1).
SUPPORT SERVICESSupport Services focus on the management and delivery of facilities management services for both public and private-sector clients in the UK and internationally.
Results summary 2018 2017 Change
Revenue– UK £1,597.7m £1,642.3m -3%
– International1 £172.1m £193.9m -11%
Contribution to total operating profit
£58.6m £42.2m +39%
– UK £51.4m £39.4m +30%
– International1 £7.2m £2.8m +157%
Operating margin
– UK 3.2% 2.4%
– International2 4.2% 1.4%
Future workload3
– UK £5.8bn £6.1bn
– International1 £168.0m £225.0m
These figures exclude non-underlying items.
1 Including share of associates.
2 Operating margin is calculated based on the underlying operating margin of associates and the reported operating margin of subsidiaries.
3 Future workload comprises forward orders and pipeline. Forward orders are those for which we have secured contracts in place and pipeline covers contracts for which we are in bilateral negotiations and on which final terms are being agreed.
UKSupport Services UK delivered a robust performance, successfully delivering its plans for Fit for Growth, leveraging the Group-wide back-office systems and processes, formulating and beginning the implementation of a clearly defined market strategy leading to the divestment of non-core operations, exiting poorly performing market sectors, increasing self-delivery and laying the foundations for operational standardisation across the business. As we outlined in our 2017 Annual Report we have focused on cost reduction and stronger discipline on contract management governance helping us realise the benefits in 2018 and ensuring we enter 2019 on a sound platform for growth.
Revenue was £1,597.7 million, following key contract retentions, organic contract growth, solid work winning and successful delivery of key contract mobilisations. We divested ourselves of our Industrial Access and Hard Services business and continued to successfully deliver our planned withdrawal from the High Street Retail market. We have concentrated our work-winning strategy around large complex integrated service opportunities in our chosen market sectors and are seeing steady growth in our bid pipeline particularly in Defence, Healthcare and Regulated Sectors.
Savings of £20 million were achieved through Fit for Growth across Support Services and Construction. The three-year programme
launched by the new management team in October 2017 focused on increasing the Group’s organisational efficiency and increased ownership and accountability, improving Group-wide procurement processes and ensuring greater standardisation and simplification across the business. These actions contributed to a margin increase of 30 per cent.
The UK Government has been our largest customer for many years, and we continue to be one of its largest suppliers, retaining our pan European contract with the Foreign and Commonwealth Office which we have held for over 10 years. We have also successfully mobilised key new accounts such as the UK-wide contracts for the Department for Work and Pensions, the Department of Transport and the Ministry of Justice (MOJ). These new and retained accounts demonstrate the Government’s ongoing faith in our ability to continue to mobilise and deliver large-scale contracts.
We had major wins in our other key market sectors including a large long-term multi-service contract with Barking, Havering and Redbridge University Hospitals Trust, a full facilities management contract with Westgate Shopping Alliance, a national facilities management contract for Thomas Cook and major extensions to our ongoing relationships with British Airways, Phillips 66/Pepsico and the Metropolitan Police amongst others.
Interserve’s Citizen Services delivers vocational training, healthcare at home, probation services and support into employment in the UK and Saudi Arabia (KSA). Quality standards have remained high during 2018 with Interserve Learning and Employment (ILE), Healthcare and ILE International achieving “good” ratings from their respective inspectorates. Our Apprenticeship Levy business has achieved a forward order book of £35 million, and in Healthcare we retained a major client contract renewal against keen competition. In our Justice division, we renegotiated our probation contracts with the MOJ, and mobilised a new contract for prison industries in HMP Berwyn.
InternationalThe oil price recovery earlier in the year has renewed enquiry levels particularly in the UAE (Abu Dhabi); however, the political situation in Qatar has prevented this from improving activity levels in this market. We recorded reduced turnover because of the actions taken previously to right size the business and diversify into other industrial markets. As a result, the division delivered revenues of £172.1 million and a total operating profit of £7.2 million.
With oil price levels above $60pb many of the oil companies have made firm commitments to field development and/or enhancements so the outlook is more promising.
Our Middle East facilities management businesses are now aligned with our UK Support Services teams and have begun working closely together to further develop our market strategies and capabilities, leveraging our UK expertise and ensuring consistently high standards of service delivery.
During 2018, we were pleased to secure a number of new awards including an integrated facilities management services contract for the prestigious five-star Serenia Residences on the Palm, Jumeirah, technical maintenance services for the Qatar National Convention Centre and their National Theatre, together with a mobile maintenance service account for Alshaya, a leading retailer, for all of their retail stores in the UAE and Qatar.
We continue to enjoy strong sales pipeline opportunities in the UAE and KSA and remain optimistic that our focus on the region, increasing capabilities and customer satisfaction will lead to an ever increasing presence in the Middle East faculties management (FM) market.
2424
STRATEGIC REPORT

EQUIPMENT SERVICESEquipment Services, which trades globally as RMD Kwikform (RMDK), provides engineering solutions in the specialist field of temporary structures needed to deliver major infrastructure and building projects. It is a global market leader and our engineers solve complex problems for our customers, through the application of world-class design and logistics capabilities, backed up by technology and an extensive fleet of specialist equipment. Our activities have a broad geographic spread, the mix of which can change quickly, hence we manage our equipment fleet globally, combining our scale and expertise with agility and responsiveness to meet customers’ needs and safeguard our operational efficiency.
Results summary1 2018 2017 Change
Revenue £195.5m £229.0m -15%
Contribution to total operating profit
£39.6m £54.4m -27%
Operating margin 20.3% 23.8%
1 Excludes Exited Business.
Challenging market conditions in several of our core markets through 2018 have slowed our overall rate of growth.
Through 2018 we have seen the UK construction sector hit by the uncertainty of the Brexit talks with the consequence of investment and work on major infrastructure projects being delayed.
Across Asia-Pacific we have seen a strong recovery in our Australian business, where we have won work across a significant spread of sectors, including infrastructure and commercial building. Hong Kong, which saw the completion of two huge infrastructure projects in 2017, now awaits the mobilisation of the next wave of infrastructure spending. The performance in the Middle East has been hampered by the trade blockade placed on Qatar by other GCC countries and delays to project announcements in KSA. The UAE continues to be a strong market although due to weakening of other Middle Eastern markets has become significantly more competitive.
Our investment in ground shoring products continues, with a launch into Hong Kong and the Middle East regions. Products landed in country in the final quarter of 2018 and this continues to be a focus of our expansion plans. The year also saw the RMDK exit Spain and Panama, as a consequence of our recent strategic review.
The directors believe that the next 12 months will continue to see the expansion of the ground shoring products into new markets, and the further development of our product offering into the commercial building sector which will help us reduce the impact of project delays in the infrastructure sector.
CONSTRUCTIONWe offer design and construction services to create whole-life, sustainable solutions for building and infrastructure projects. Our focus is on forming long-term relationships and delivering repeat business through commercial structures such as framework agreements and project-financed schemes.
Our presence in the Middle East (in UAE, Qatar and Oman) is structured through longstanding joint-venture partnerships, enabling us to form enduring relationships with clients and to combine our international experience with our partners’ local knowledge to deliver outstanding service.
Results summary 2018 2017 Change
Revenue
– UK1 £756.6m £972.8m -22%
– International2 £246.6m £290.5m -15%
Contribution to total operating profit
£15.5m £8.9m
– UK1 £2.2m (£10.3m)
– International2 £13.3m £19.2m
Operating margin
– UK1 0.3% -1.1%
– International3 5.4% 6.6%
Future workload
– UK1 £0.9bn £1.0bn
– International2 £233.0m £236.0m
1 Excludes Exited Business.
2 Includes share of associates.
3 Operating margin is calculated based on the underlying operating margin of associates and subsidiaries.
InternationalConstruction in the Middle East continues to be impacted by macroeconomic challenges and, in particular, the trade blockade by surrounding GCC countries of Qatar, which has delayed contract awards, created supply pressures and increased costs there. Our construction business in the UAE had a strong second half and our business in Oman continues to have a healthy forward workload.
In the UAE, we have successfully completed the refurbishment of Jumeirah Beach Hotel for the Jumeirah Group, we have commenced the construction of Leader Sports Mall (a dynamic new landmark in Dubai worth circa £64 million) and recent contract awards include repeat business with Easa Saleh Al Gurg for a residential project to build 78 villas, a fitness centre, outdoor swimming pool, tennis courts and community centre (circa £41 million). Development plans such as Expo 2020 continue to drive growth.
In Oman, we have completed a successful fast-tracked 100-day renovation of the Crowne Plaza in Muscat, including a remodelled lobby, lounge and arrival area and a revamped all day-dining restaurant and pool bar. We continue to make good progress on our Liwa Plastics project, which is part funded with the support of UK Export Finance. We have also seen our first win in Duqm to deliver the civil works for the process units at the new refinery (a flagship development in Oman) expanding our portfolio of supporting international EPC contractors to deliver industrial projects in the country.
In Qatar, we have completed the construction of Doha Festival City (with our joint-venture partner). We continue to deliver a £102-million contract to build a range of sub-stations across Doha to further support development. Our interior fit-out business continues to establish a good reputation and is being awarded more repeat business. The trade blockade has, however, meant that the building construction market has remained depressed during 2018, although we expect preparations for the World Cup in 2022 to provide impetus and further opportunities going forward.
Our International Construction division remains a well-performing business and our experience in the Middle East region continues to stand us in good stead, with upcoming events such as Expo 2020 in Dubai and the ongoing need for infrastructure development continuing to support work winning in 2019.
2525
Governance
Financial Statements
Strategic Report
Overview

Operational review continuedUKInterserve’s construction business offers design and construction services to create whole-life solutions including client needs analysis, business case support, design, construction and FM (provided though Support Services), maintenance, remodel, refurb and eventual demolition and estates planning sustainable solutions for building and infrastructure projects.
The UK construction market, while benefiting from major infrastructure improvements and housing investment, remains volatile at a macro level from Brexit, resources and associated headwinds but also construction confidence generally, post-Carillion.
The construction business strategy to focus on low risk, principally government assets and infrastructure is a partial hedge against economic downturn, post Brexit. Growth in government infrastructure is driven by policy and demographic changes in the UK with expected long-term investments from the UK Government in order to support economic growth as described in the Government Construction Sector Deal. In addition, digital technology and long-term trends in travel and freight are creating demand for the construction of transport infrastructure such as logistics centres and airports. Similarly, demographic changes are expected to create demand for schools and universities as well as medical services facilities. Across the sectors, there has been a movement in recent years towards the increased use of modern methods of construction, which offer faster, more reliable and more efficient production.
The construction business’s focus is on forming long-term relationships and delivering repeat business through commercial structures such as framework agreements.
2018 was a better year for our UK Construction business despite the ongoing period of challenging market conditions. Good progress has been made in closing out some challenging projects and legacy accounts. Our regional building business, infrastructure business and engineering services business all made solid returns, which resulted in a return to profit for the division.
We continue to focus on core sectors and activities and ensure that the risk profile of work that we take on is commensurate with levels of return. Revenue is expected to fall in 2019 as some of the larger legacy contracts complete and also due partly to some of the wider challenges the Group faced in 2018. Whilst we expect the division to be a smaller business by revenue in 2019 it will be capable of consistent profit margins in line with industry norms and capable of steady growth going forward.
During the year we continued to focus on cost, pricing and bidding controls, establishing a narrow strategic focus and restricting work-winning activity to select sectors, regions and activities.
Our operating model continues to combine a strong regional presence and exposure to framework agreements with infrastructure and public-sector customers, in core sectors such as the defence, education, healthcare and fit-out markets.
In the last 12 months, UK Construction has also secured further new construction frameworks including the Department for Work and Pensions, the Department of Education, Crown Commercial (Government Property Unit Framework) and Welsh Government Healthcare framework, adding to the existing portfolio of customers.
This gives a combined forward opportunity pipeline in excess of £1.2 billion per annum from which tender opportunities are carefully selected through a PLC governed selection process. Revenue is 70 per cent with public or arm’s length public bodies aligned to the lower risk defensive strategy.
Plans are in place to improve organisational structure and capability to support future profitability and performance and will be rolled out in early 2019. Our focus remains on quality contracts, targeting profits and not revenue.
ENERGY FROM WASTE
2018 2017
Revenue – UK Exited Business (consolidated revenue)
£32.5m £48.6m
Total pre-tax non-underlying loss (£12.6m) (£35.1m)
Further details relating to the Energy from Waste business are included in the Financial Review on page 35.
FINANCIAL CONDUCT AUTHORITY INVESTIGATION UPDATEAs notified to the market on 11 May 2018, Interserve is the subject of an investigation by the Enforcement Division of the Financial Conduct Authority (FCA) in connection with the Company’s handling of inside information and its market disclosures in relation to its exited Energy from Waste business during the period from 15 July 2016 to 20 February 2017.
The Company is co-operating fully with the investigation. As with any regulatory investigation of this nature it is difficult to predict when the investigation will be completed or its outcome. If the FCA takes further action, members of the Group and/or their current or former directors or employees could face regulatory or compensatory sanctions, which could result in adverse publicity and/or reputational damage and which could have a material adverse effect on the Group’s business, results of operations and financial condition.
OUR PEOPLEEmployee consultation and participationWe believe in involving our people in matters affecting them as employees and keeping them informed of all relevant factors concerning the Group’s performance, strategy, financial status, charitable activities and other issues. We achieve this through formal and informal briefings and via our internal communication channels, including our intranet.
We continued to grow our web-based employee portal, www.MyInterserve.com, specifically aimed at reaching our thousands of frontline employees. The portal, which now has around 25,000 regular users, is accessible on mobile devices, giving staff access to e-pay slips, Company news, the ability to participate in discussion forums, and to give days of their time in support of good causes, as well as access to staff discounts at a range of retailers and leisure outlets. We also measure employee engagement through our Your Voice Engagement Survey. In 2018 we saw an overall engagement score of 72 per cent for the business. We will work with our teams to act upon the results, demonstrating that we have listened to their feedback. As part of our wider workforce engagement the Board will meet a cross section of our workforce twice a year with the opportunity for them to receive feedback and to run question and answer sessions.
2626
STRATEGIC REPORT

Interserve Construction built the stunning five-storey Allam Medical Building at the University of Hull which was opened by the Her Majesty the Queen in 2018.
The specialist medical teaching facility includes a full mock ward, operating theatre and intensive care nursing areas. It also boasts a large lecture theatre with a fully flexible layout and collaborative working areas for researchers and students, as well as fully-equipped meeting rooms.
The building, which represented a £19 million construction cost and £25 million capital cost, was designed to attract and develop students and staff who will shape the healthcare workforce of the future.
In April 2018 the Allam Medical Building won the Buildings that Inspire category at the Guardian University Awards.
John Gittins, Divisional Director at Interserve Construction in Yorkshire and the North-East, said, “The building
ALLAM MEDICAL BUILDING CASE STUDYhas transformed the way the university teaches the next generation of health professionals. It provides a collaborative environment that enables doctors, nurses and midwives to train together, preparing them more effectively for their future careers.
“The Allam Medical Building neatly showcases Interserve Construction’s strategy to create a sustainable, manageable and profitable business based on construction, engineering and infrastructure work in key sectors like health and education.”
The concrete framed building features innovative precast concrete cladding panels which provide the building’s stunning façade. Targeting BREEAM Very Good building standards, the new building also incorporated sustainable design elements such as green roofs.
We used 4D BIM technology, linking the construction programme to the model so that progress at any given stage could be viewed.
2727
Governance
Financial Statements
Strategic Report
Overview

ApprenticesInterserve continued to make a strong investment in its workforce via its apprenticeship scheme during 2018 and invested £1.8 million to support apprenticeship programme delivery. At any given time during the year the Company had between 720-780 apprentices undertaking a diverse range of programmes. Apprenticeships, a key pillar of Interserve’s early career strategy, provided a range of entry point roles to individuals taking their first step into careers such as engineering, construction management, IT and finance. Another aspect of the strategy included upskilling colleagues already with the Company and unlocking opportunities for their career progression.
Looking forward to 2019, Interserve will be focusing on creating more apprenticeship entry points to attract those starting or returning to the world of work to join the business and develop their career.
Equal opportunitiesInterserve is committed to eliminating discrimination among our workforce in order that we may offer employees an environment where there is no unlawful discrimination and all decisions are based on merit.
Our policy is to promote equality and fairness for all in our employment. The Group aims to ensure that no job applicant or employee receives less favourable treatment or is disadvantaged by imposed conditions or requirements that cannot be shown to be justifiable, on the grounds of gender (including sex, marital or civil-partner status, gender reassignment), race (including ethnic origin, colour, nationality and national origin), disability, sexual orientation, religion or belief, age, and pregnancy or maternity.
We take every step to ensure working environments are free from harassment and bullying, where all individuals are treated equally and fairly and that selection for employment, promotion, training or any other benefit will be taken solely on merit and ability against job-based criteria. We avoid discrimination in working conditions and terms of employment and are committed to making reasonable adjustments for disabled employees. We oppose all forms of unlawful and unfair discrimination.
Diversity and inclusionFollowing our award of the National Equality Standard (NES) for equality, diversity and inclusion in 2016, our work to develop and promote equality, diversity and inclusion across the business continues.
During the year Interserve worked with a variety of different organisations that helped us put in place programmes and practices that improve the diversity of our talent pipeline and build our culture of inclusion. These include BITC (Business in the Community), Investors in Diversity (IiD), The Prince’s Trust, WISE, Ban the Box, Leonard Cheshire and Two Ticks (for disability).
The NES is the consolidating standard that binds all our activities together and through their process will help our selection of partner organisations moving forward.
At Interserve we are committed to creating a diverse and inclusive workplace where all of our people feel at ease and can progress. We take this commitment extremely seriously and have a range of programmes underway and more initiatives planned to ensure this happens.
We welcome the UK Government’s requirement for large companies to be more transparent on gender pay and we have published our data. The organisation is currently in the process of aligning all of our central functions together under the One Interserve vision with the aim to provide a more cohesive and joined-up approach to our diversity and inclusion agenda, as well as opportunities to address our gender balance and representation issues.
Due to having a multifaceted business, the entities we have reported on display diverse statistics as the employees they traditionally attract vary across the divisions. It should also be noted that the Company-wide annual bonus scheme payments that were awarded this year were delayed and therefore fell outside of the ‘relevant bonus period’ (6 April 2017 – 5 April 2018). As a result, the Company’s annual bonus payments were not included in this year’s gender pay gap reporting figures.
The bonus data displayed throughout this year’s results relate to the other local and smaller bonus arrangements that continue to be awarded.
This year we have captured the wider picture, bringing together all of the data from our divisional entities as part of our One Interserve approach. Within the UK Interserve has a 51 per cent – 49 per cent male-female split. These figures display a median gender pay gap of 26.3 per cent and a median bonus gender pay gap of 61.9 per cent.
The gender pay gap at Interserve highlights a gender balance issue particularly in more senior roles and sectors traditionally dominated by males, it is not an equal pay issue. The 61.9 per cent median bonus gender pay gap is present due to the majority of the payments made were to male operatives and engineers. These roles attract a higher base salary than the roles where we have paid bonuses to women in predominantly administrative and cleaning roles. Where we made bonus payments to administrators and cleaners, payments to men and women were comparable.
As previously mentioned, the Company-wide annual bonus scheme payments fell outside of the ‘relevant bonus period’ this year. The timing of these payments means that, as a Company, we will not be able to compare on a like-for-like basis in regards to the One Interserve bonus figures this year or next.
We are committed to redressing the balance. Our One Interserve strategy will assist us as we drive the standardisation and simplification of our talent processes across the Group and leverage our expertise.
To improve the gender split of our talent pipeline during the year we continued to audit recruitment and training practices across the divisions to ensure they are free of bias and to seek equal gender balance in general recruitment, apprentice and graduate applications. We are also introducing measures to address gender imbalances in those training for management roles and to ensure that mentoring and coaching programmes are provided by trained coaches who are sensitive to gender specific matters.
As at 31 December 2018, 27,078 of our global workforce of 50,278 were male and 23,200 were female.
Operational review continued
2828
STRATEGIC REPORT

HUMAN RIGHTSWe have a Group-wide Human Rights Policy, which is available to download from our intranet. The policy states that the upholding of human rights is wholly aligned with our values, and forms part of our decision-making and the delivery of our strategy. As a large employer with global operations, Interserve aims to make a positive difference in the communities where we operate. This is the intention behind our sustainability plan, designed to deliver social, economic and environmental benefits. We respect internationally-recognised human rights, aiming to work within the principles set out by the UN Declaration of Human Rights as well as the International Labour Organisation’s Declaration on Fundamental Principles and Rights at Work, and work hard to ensure that in all areas of interaction with our employees, clients, suppliers, third parties, interviewees and joint-venture partners, everyone is protected and treated fairly.
Our commitment means that we seek to identify, prevent or mitigate potential human rights risks, and address any shortcomings which actions within our control may have caused. In implementing this policy we are subject to the laws of the many countries in which we operate. We are committed to comply with all such applicable laws. The policy sets out the core principles we respect and promote and is a reference point for employees, suppliers, sub-contractors, customers and joint-venture partners. These principles apply to Group subsidiaries and joint ventures where we have management control and will be championed and promoted where we don’t. The principles are applied in conjunction with our other policies on the ethical standards we expect in our business activities, which include:
• Conducting Business with Interserve
• Health and Safety Policy
• Conflicts of Interest Policy
• Code of Conduct and Competition Law Compliance Policy
• Anti Bribery and Corruption Policy
• Fraud Policy
• Whistleblowing Policy
• Sustainable Procurement Policies
• Supplier Codes of Conduct
Our Human Rights Policy is supplemented by policies relating to Modern Slavery and Business Practices, which are also available to download from our intranet.
HEALTH AND SAFETYSummaryAbove all else, our number one value and priority is the health, safety and well-being of our colleagues and contractors who work for us. The Group’s health and safety performance improved in the year with our Lost Time Injury Rate falling by 25 per cent from 1.3 in 2017 to 0.98. Our active health and well-being programme for 2018 has been a great success, with the focused campaigns on musculoskeletal disorders, healthy eating and mental heath and well-being achieving over 375,000 hits on social media, and over 35,000 video views. There is always more to be done with respect to colleagues’ health, safety and well-being, and Interserve is committed fully to deliver a continued and sustained year-on-year improvement.
Proactive approachInterserve adopts a formal and proactive approach to the management of health and safety throughout our operations. To ensure Board-level visibility, an Executive Team member is designated as Safety Champion and senior directors are appointed with responsibility for health and safety in each operational division. These directors, together with the Heads of Safety from each of the divisions, met six times during the year to review performance and the various health and safety initiatives being undertaken to facilitate the spread of best practice. Our standard is for all operating businesses to implement safety management systems that meet OHSAS 18001/ISO 45001. Across Interserve’s global operations, 97 per cent of our employees work under safety management systems certified to this standard.
Safety performance is clearly defined as a line-management responsibility and together with formal management systems, we provide appropriate training and professional support to ensure managers effectively discharge their duties. Proactive site visits and safety inspections are carried out by directors, management teams and safety advisers. Members of the Executive Team carried out a total of 102 site-safety visits during the year and across the Group over 5,850 management safety tours were recorded. As a result of these and other inspections 119,775 unsafe conditions were identified and corrected, preventing potential incidents. In addition, 137,392 safe conditions were observed.
Our employee Lost Time Injury Rate (LTIFR), 0.98, has reduced by 25 per cent in 2018 and 46 per cent over the last two years. The employee Accident Incident Rate (RIDDOR AIR), 82, has reduced by five per cent in 2018 and 38 per cent over the last two years.
Gender
Total2017
Male Female
2018 2017 2018 2017Total2018
Number of persons who were directors of the Company1 7 7 2 2 9 9
Number of persons who were senior managers of the Group2 72 98 5 8 77 106
Number of persons who were employees of the Group3 27,071 29,660 23,198 25,575 50,269 55,235
Total 27,078 29,765 23,200 25,585 50,278 55,350
1 Plc Board directors at year end.
2 Subsidiary directors and Persons Discharging Managerial Responsibility (PDMRs) at year end.
3 Employees of wholly-owned subsidiaries included within Group consolidation at year end, excluding senior managers.
Further information is provided in the table below.
2929
Governance
Financial Statements
Strategic Report
Overview

Our All-Labour (employees and contractors) LTIFR, 1.05, has reduced by 20 per cent in 2018 and 48 per cent over the last two years. The All-Labour (RIDDOR AIR), 98, has increased slightly by three per cent in 2018 but shows a two-year reduction of 28 per cent. We are regularly recognised for our contributions to delivering high standards of health and safety and in 2018 received 14 awards in the Royal Society for the Prevention of Accidents (RoSPA) Occupational Health and Safety Awards, taking the Group’s total RoSPA honours over the last decade to more than 255.
Achievements in 2018 included:Construction and Engineering were awarded:
• RoSPA’s prestigious Order of Distinction, which is presented to companies that have received 15 or more consecutive Gold Awards. Construction has now won 18 consecutive Gold Awards and Interserve Engineering Services has won 17 consecutive Gold Awards.
Support Services won a range of honours, including:
• Interserve FM
– RoSPA Gold Medal Award (for six consecutive Gold Awards)
• Interserve Defence
– PJOB Gibraltar RoSPA Gold
– Achievement Award (third consecutive achievement)
– Project Armada - RoSPA President’s Award (for 12 consecutive Gold Awards)
– PJOB ISP (Cyprus) RoSPA Gold Medal Award (for seven consecutive Gold Awards)
• Interserve Commercial
– RoSPA President’s Award (for 12 consecutive Gold Awards)
– Russell Hall, RoSPA President’s Award (for 14 consecutive Gold Awards)
RMD Kwikform received:
• Five RoSPA President’s Awards
• RoSPA Gold Medal Award for head office.
ANTI-BRIBERY AND CORRUPTION, AND WHISTLEBLOWINGWe have in place an Anti-Bribery and Corruption Policy, and associated procedures and training. The policy sets out that every individual with whom we work will comply with any anti-bribery and corruption laws that apply to our business.
The policy (and associated procedures and training) is reviewed annually and signed-off by the Chief Executive Officer and Group General Counsel.
Moreover, as part of Fit for Growth, we have instituted a review of each of those core policies and procedures (identified above) which embody and drive the ethical standards we expect in our business. In doing so, we have established a resilient and repeatable approach in relation to each, which drives continual engagement and the application of ethical standards in our business.
In relation to Anti-Bribery and Corruption matters, after a policy review and engagement with stakeholders in our business, we have updated our policy and our associated procedures. In addition, a communications and training plan has been established to ensure such matters are further engrained in our business. Furthermore, a working group has been established, comprised of leaders from each of our business units and functions, to meet regularly, and to drive policy, procedure, training and the sharing of best practice.
Indeed, the same approach to reviewing, updating and driving ethical standards is being applied to each of our policies and associated procedures. In relation thereto, we have also reviewed and updated our whistleblowing policy, procedures and training. This allows individuals to make protected disclosures without fear of retribution where they become aware of behaviour that does not meet the legal and ethical standards we uphold.
Operational review continued
3030
STRATEGIC REPORT

Principal risks and uncertaintiesWe operate in a business environment in which a number of risks and uncertainties exist. While it is not possible to eliminate these completely, the established risk-management and internal control procedures, which are regularly reviewed by the Group Risk Committee on behalf of the Board, are designed to manage their effects and thus contribute to the preservation and creation of value for the Group’s shareholders as we pursue our business objectives.
The Group continues to be dependent on effective maintenance of its systems and controls. The table below details the principal risks and uncertainties which the Group addresses through its risk-management measures. The changes to these risks relative to the last bi-annual review undertaken by the Board in August 2018 are depicted in the column entitled “Risk Environment”.
RISK POTENTIAL IMPACT RISK ENVIRONMENT MITIGATION AND MONITORING
DELEVERAGING PLAN
On 6 February 2019, Interserve announced the key commercial terms of the proposed Deleveraging Plan. The Deleveraging Plan is a consensual restructuring of Interserve, which is urgently required to avoid a default in the existing financing arrangements and to provide sufficient liquidity, cash and bonding facilities to allow the Group to service short-term obligations and secure a stable platform.
Such a default, were it to occur, would be expected to have material adverse consequences for all stakeholders and, in particular, for existing shareholders.
The Board considers the Deleveraging Plan to be in the best interests of the Group and its shareholders as a whole. The Deleveraging Plan preserves fully the pre-emption rights of existing shareholders. If shareholders take up their entitlements in the equity raise their ownership will not be diluted.
The Board believes that the Deleveraging Plan will secure a strong future for Interserve. This proposal has been achieved following a long period of intensive negotiation and has the support of our financial stakeholders and Government. Its successful implementation is critical to Interserve’s future.
The Deleveraging Plan will be subject to approval by Interserve’s shareholders. Failure to secure shareholder approval represents a material uncertainty that may cast significant doubt over the Group’s ability to continue as a going concern.
BUSINESS, ECONOMIC AND POLITICAL ENVIRONMENT
Among the changes which could affect our business are:
• risk of the Company not achieving its strategic objectives to focus on core profitable services, completing its Fit for Growth transitional programme and disposal of non-core assets, which may not result in the expected anticipated benefits;
• shifts in the economic climate both in the UK and internationally;
• changes in the UK Government’s policy with regard to employment costs, expenditure on improving public infrastructure, buildings, services and modes of service delivery (including appetite to outsource services) and delays in or cancellation of the procurement of Government-related projects;
• Changing market practices following the Carillion liquidation and resulting attitudes towards the sector;
• Brexit, in particular our reliance on the large number of EU nationals within our workforce, as well as its impact on the economy and public spending;
• the imposition of unusually onerous contract conditions by major clients;
• changes in the behaviour of our suppliers, sub-contractors and our competitors’ behaviour;
• a deterioration in the profile of our counterparty risk; and
• civil unrest and/or shifts in the political climate in some of the regions in which we operate;
any one or more of which might result in a failure to win new or sufficiently profitable contracts in our chosen markets or to deliver contracts with sufficient profitability.
We seek to mitigate these risks in a number of ways. These include:
• fostering long-term relationships with our clients and partners;
• the development of additional capabilities to meet anticipated demand in new growth areas;
• maintaining a flexible cost base;
• effective supply-chain management; and
• strong management and leadership with our Fit for Growth and other transitional programmes.
We have continued to maintain strong dialogue with our key clients and partners in relation to our delivery of services and the status of our transformation programmes to help maintain confidence with our business.
As part of our competitive assessment, we assess our success rate in competitive situations. Whether we win, lose or retain a contract we analyse the reasons for our success or shortcomings and feed the information back at both tactical and strategic levels. Our major transformation programme, Fit for Growth, remains on track to deliver the savings required to ensure that our cost base is appropriate for the services we offer and to enable us to be cost competitive.
We monitor and assess levels of political risk and have contingency plans to mitigate some of these risks.
3131
Governance
Financial Statements
Strategic Report
Overview

RISK POTENTIAL IMPACT RISK ENVIRONMENT MITIGATION AND MONITORING
IT SYSTEMS/ SECURITY
As our IT systems become ever more critical to business success and to meet customer expectations, there is an increasing need to:
• prevent service failures;
• ensure confidentiality, availability and integrity of data;
• protect our staff and systems from cyber-attack; and
• recover critical systems in a timely and effective manner.
We are committed to ensuring that our IT applications and infrastructure and the IT organisation that manages them are provided with the necessary skills and tools to maintain the health of our IT services.
We are currently undertaking a review of our IT infrastructure and processes to ensure we can operate best practice, cost effective solutions across our Group. We have launched an IT Investment Committee to provide greater governance over our IT infrastructure expenditure, with committee approval required for expenditure.
We operate robust monitoring and preventative maintenance regimes to minimise the potential impact of IT failures or security incidents in accordance with good industry practice.
Where necessary, we also ensure that both ISO 27001 and CES certifications are obtained for key contracts.
DATA MANAGEMENT
As we continue to onboard new customers, increasingly collaborate across our organisation and its supply chain and enable mobility for our diverse workforce, there is an increasing need to ensure that our customer, supplier and employee data is:
• classified appropriately;
• processed securely; and
• stored in accordance with legal and contractual requirements.
The increasing reliance on our data to provide commercial opportunity and enhanced risk management is driving more diverse use of our data across the Group.
Our Group-wide information security programme continues to improve our staff’s awareness of the need for effective data management activity.
Initiatives include management and end-user training, contingency planning and detailed risk-management activities that address many difference types of data loss.
We implemented a broad programme to address the General Data Protection Regulation which came into force in May 2018. This has been supported by an extensive internal training programme.
In addition, a working group has been established to meet regularly to drive policy, procedure, training and the sharing of best practice.
OPERATING SYSTEM
We enjoy demonstrable success in working with third parties both through joint ventures and associated companies in the UK and abroad. This success results in a material proportion of our profits and cash flow being generated from businesses in which we do not have overall control. The alignment of the Group’s interests and the interests of our partners is critical to that success. Any weakening of our strong relationships with these business partners could have an effect on our profits and cash flow.
We have a proven track record of developing and re-enforcing such relationships in a mutually beneficial way over a long period of time and our experience of this places us well to preserve existing relationships and create new ones as part of our business model. The measures taken to limit risk in this area include: Board representation, shareholders’ agreements, management secondments, local borrowings and rights of audit in addition to investing time in personal relationships.
FINANCIAL RISKS
The Group, due to a number of factors, has found itself with very high levels of debt relative to its earnings and cash flow. This has necessitated the refinancing of the existing debt structure and the injection of further additional debt funding. This is discussed in the Financial Review. The Group has agreed to meet a number of covenants as part of its refinancing arrangements, including commitments on repayment of debts, disposals of assets, savings associated with transformation programmes and the provision of information to its lenders.
The Group has put into place additional policies and resources to monitor the effective management of working capital, including the production of daily balances, weekly cash reports and forecasts together with monthly management reporting.
The Contract and Investment Committee (as discussed under ‘Major Contracts’ overleaf) considers the implications of new business opportunities relative to the financial constraints as part of its assessment and review process.
Principal risks and uncertainties continued
3232
STRATEGIC REPORT

RISK POTENTIAL IMPACT RISK ENVIRONMENT MITIGATION AND MONITORING
MAJOR CONTRACTS
In Support Services our strategy is to focus on offering a broad range of services to large-scale customers whilst our Construction business focuses on lower risk infrastructure and assets. Termination of large contracts which account for a significant portion of our revenue would be likely to reduce our revenue and profit.
In addition, the management of contracts entails a range of potential risks. These include: mis-pricing; inaccurate specification; poor mobilisation of new contracts leading to non-delivery of promised cost or efficiency improvements; poor control of costs or of service delivery; sub-contractor performance and/or insolvency, under-delivery of performance, any of which could have adverse financial implications.
In relation to Energy from Waste, the construction of all projects has now reached physical completion, although risks remain on further delays with the completion of the contractual programme and associated costs.
In PFI/PPP contracts, which can last for periods of around 30 years, there may be increases in costs, including wage inflation, beyond those anticipated or clients under financial pressure seeking to implement alternative interpretations of the contract in order to reduce payments.
Risk of recoveries of payments from material debtors of major contracts.
Among our mitigation strategies are targeting work within, or complementary to, our existing competencies, engagement of experts to effectively deploy both business and cultural change requirements, the fostering of long-term relationships with clients, operating an authority matrix for the approval of large bids, monthly management reporting with key performance indicators at contract and business level, the use of monthly cost-value reconciliation, supply-chain management and ensuring that periodic benchmarking and/or market testing are included in long-term contracts.
We monitor the risk on contractual counterparties to avoid over-dependency on any one customer or sub-contractor.
The Group is focused on the completion of the Energy from Waste programme with dedicated resources to manage the delivery of the contracts, recoveries from insurers and ongoing dialogue to resolve outstanding issues.
As part of our Fit for Growth programme all new tenders requiring bonding or other security instruments are referred to the Contract and Investment Committee (CIC), comprising the CEO, CFO and General Counsel, who deliberate and consider approval based on assessment of commercial terms, profitability and risk.
Our Fit for Growth programme will ensure we are fit to compete in increasingly challenging environments and markets by focusing on how we can improve our governance and processes, simplify our structures and improve efficiency across the whole Group.
The Group continues to monitor the repayment of material debtors. In relation to the Middle East, the Company is focused on repayment of material debts outstanding in the region.
KEY PEOPLE The success of our business is dependent on recruiting, retaining, developing, motivating and communicating with sufficient numbers of appropriately skilled, competent people of integrity at all levels of the organisation. This is particularly relevant during periods of financial instability and change when improvement to profitability and competitiveness is required.
Risks with the high number of shareholdings by lenders following a successful implementation of the de-leveraging plan and their potential influence on management.
We are focused on engaging with all of our people at all levels and wherever they work in the organisation to ensure that they continue to deliver great customer service for our clients.
As part of our Fit for Growth programme we will design and build a more effective and efficient organisation in which skilled and engaged employees can thrive.
We have various incentive schemes and run a broad range of training courses for people at all stages in their careers. With active people management and Investors in People accreditation in many parts of the Group, we manage our people professionally and encourage them to develop and fulfil their maximum potential with the Group.
As part of our commitment to a diverse and inclusive workforce we are keen to offer ‘Opportunities for All’ and our approach focuses on how we can deliver, and work with others, to provide disadvantaged groups with the skills and employment opportunities that will help to turn their lives around.
Strong governance will be maintained by the Board on its responsibilities as directors to shareholders.
3333
Governance
Financial Statements
Strategic Report
Overview

RISK POTENTIAL IMPACT RISK ENVIRONMENT MITIGATION AND MONITORING
DAMAGE TO REPUTATION
Challenges with the market’s perception of our Group and sector because of the Carillion liquidation, as well as negative publicity about the Group’s financial condition, impacting the Group’s ability to trade normally.
Issues arising within contracts, from the management of our businesses or from the behaviour of our employees at all levels, can have broader repercussions on the Group’s reputation than simply their direct impact and may have an adverse impact upon the Group’s ‘licence to operate’.
This risk increases as we expand the range of frontline services being delivered, some of which are high profile and/or politically sensitive.
Risks that our clients and suppliers will modify their behaviour as a result of negative publicity surrounding the financial condition of the Group; for example, tightening of credit terms, cancellation or deferral of projects and failing to qualify or not being invited to bid for contracts.
See Financial Conduct Authority Investigation Update on page 26. There is a risk of adverse publicity and reputational damage to the Group should the FCA impose regulatory or compensatory sanctions on members of the Group and/or their current or former directors or employees which could have a material adverse effect on the Group’s business, results of operations and financial condition.
We have maintained dialogue with our key clients and partners in relation to our delivery of services and the status of our transformation programmes to help maintain confidence with our business.
Control procedures and checks governing the operation of our contracts and of our businesses, supported by business continuity plans, are in place. With the expansion of our frontline services there is even more emphasis placed upon assessing reputational risk before entering into such contracts, having proper procedures in place to monitor performance, escalate issues and monitor our response, promoting a good understanding of our brand amongst stakeholders through timely, clear and consistent communications.
We have a clear set of core values which we strive to embed within our organisation and set ourselves the goals of creating a culture of innovation in sustainability and offering transparency to clients on public-sector projects.
The Company is co-operating fully with the FCA and continually monitors its disclosure obligations under the Market Abuse Regulation.
HEALTH AND SAFETY REGIME
The nature of the businesses conducted by the Group means that employees and third parties are exposed to potential health and safety risks. Management of these risks is critical to the success of the business and they are addressed through the adoption and maintenance of occupational health and safety procedures and operating standards setting out ‘ways of working’.
A commitment to Health, Safety & Environment (HS&E) is embedded in all our core values and the subject leads every Board meeting both at Group and divisional level. Group and Divisional HS&E Governance committees meet quarterly to evaluate current risks for relevance and conduct independent reviews of high potential HS&E events and investigations. Each member of the Executive Team undertakes dedicated visits to review health and safety measures in place at our operational sites and we have ongoing training and communication campaigns across the Group emphasising its importance.
The move in 2018 to leading based and common reporting metrics has resulted in our employee Lost Time Injury Rate reducing by 25 per cent during 2018. The employee Accident Incident Rate has also reduced by five per cent during the same period.
The Group is exposed to operational currency risk in its International and Equipment Services businesses. These are not material on a net basis. In addition, the Group has foreign currency exposure in relation to its historical US Private Placement borrowings and the interest cost of servicing those borrowings. Whilst it does not trade in commodities, the Group does operate in countries where their economies depend upon commodity extraction and are therefore subject to volatility in commodity prices. The Group’s principal businesses operate in countries which we regard as politically stable.
Principal risks and uncertainties continued
3434
STRATEGIC REPORT

2018 has seen an improved operating performance for the Group as we have focused on executing our Fit for Growth programme and delivered savings from the simplification of our businesses. This is despite the decline in revenue and reflects the focus on quality of work within our UK Construction business.
Net debt increased in the year as we have continued to address the Energy from Waste (EfW) contracts as well as the exiting of London and South East regional building business. This has also been impacted by the £43.0 million of adviser fees related to the April 2018 refinancing as well as the £42.8 million cash interest cost in the year resulting from the higher finance costs and increased debt levels.
The Financial Review does not deal with the underlying operating profit and revenue of each individual trading division. For commentary on these underlying operational results please refer to the Operational Review section of the Strategic Report.
REPORTED FINANCIAL PERFORMANCE
£million 2018 2017
Consolidated revenue 2,904.0 3,250.8
Total operating profit pre-amortisation and non-underlying items
92.7 84.5
Amortisation of acquired intangible assets (18.7) (21.6)
Goodwill and other asset impairments (55.2) (76.7)
Contract and balance sheet review charges (5.2) (86.1)
Energy from Waste (12.6) (35.1)
Property development 17.0 (26.0)
London Construction (24.8) (10.3)
Restructuring costs (20.0) (33.2)
Professional adviser fees (43.0) (13.9)
Strategic review of Equipment Services - (7.1)
Exit from Site Services and Power businesses
(6.7) 0.7
Pension indexation gain 70.6 -
Total operating (loss) (5.9) (224.8)
2018 consolidated revenue of £2,904.0 million was 10.7 per cent lower than in 2017 (£3,250.8 million) with a substantial reduction (£216.2 million) in UK Construction driven by lower activity levels as we have struggled to win new work and EfW projects completing. After amortisation of acquired intangible assets, goodwill impairment and other non-underlying items, analysed in further detail in note 5 to the consolidated financial statements and discussed further below, the total operating loss was £5.9 million (2017: loss £224.8 million).
AMORTISATION OF ACQUIRED INTANGIBLE ASSETSIntangible assets acquired as part of historic acquisitions of businesses are amortised over their useful economic life and during 2018 £18.7 million of amortisation was charged to the income statement (2017: £21.6 million).
GOODWILL AND OTHER ASSET IMPAIRMENTSDuring 2018 the carrying value of the Industrial Services business was impaired by £15.0 million and a further £7.1 million loss incurred on its final disposal.
As part of the Group’s 31 December 2018 annual goodwill and intangible assets impairment review, further write-downs were made of the carrying values of its Support Services Private-Sector cash generating unit (£26.9 million), principally related to the acquisition of Initial Facilities in 2014 and a further £6.2 million on its Learning and Education business.
CONTRACT REVIEW AND BALANCE SHEET REVIEWDuring 2018 a further net £5.2 million of contract review provisions were made being largely £13.7 million on the CRC Transforming Rehabilitation contracts, partly offset by an £8.0 million release of provisions against the US Prime Forces onerous contract.
ENERGY FROM WASTEA further net £12.6 million of provision for losses from our EfW facilities has been made during 2018 which relates principally to further costs to complete our Derby City and County Councils facilities. Insurance proceeds totalling £35 million were received during 2018 on EfW contracts.
PROPERTY DEVELOPMENTAs announced in the 2017 year-end results, we took the decision at the end of last year to exit from the business of Property Development. During 2018 we have sold our one remaining development asset (the Haymarket site in Edinburgh) for net proceeds of £47.0 million and realised a gain of £17.0 million on disposal.
LONDON CONSTRUCTIONWe took the decision during 2018 to exit from activities in the London construction market but will continue to offer fit-out but not building projects in the London region. Costs associated with this exit and anticipated losses on the close out of contracts within this business amounted to £24.8 million. We anticipate that this exit and the associated cash outflows will conclude in 2019.
RESTRUCTURING COSTSThe Group has embarked on a three-year plan, Fit for Growth, to increase the Group’s organisational efficiency, improve Group-wide procurement processes and ensure greater standardisation and simplification across the business. During the year it incurred termination costs in respect of former employees and directors, property rationalisation expenses and other business closure costs amounting to £20.0 million.
PROFESSIONAL ADVISER FEESProfessional fees incurred in connection with our refinancing totalled £43.0 million during the year. We anticipate that we will incur a further circa £33 million of fees in connection with the Deleveraging Plan.
Financial review
3535
Governance
Financial Statements
Strategic Report
Overview

Financial review continuedEXIT FROM SITE SERVICES AND POWER BUSINESSESDuring the year we took the decision to exit from the Power business in Support Services and the Site Services business in Construction at a cost of £4.2 million and £2.5 million respectively.
PENSION INDEXATION GAINDuring 2018, following discussions in recent years between the Company and the Trustee of the Interserve Pension Scheme, the Trustee agreed to change scheme terms relating to the inflation reference index used to calculate increases to some members benefits in the scheme from RPI to CPI. The gain arising from this change in inflation index during 2018 amounted to £70.6 million.
NET FINANCE COSTSThe net finance cost for the year of £105.4 million can be analysed as follows:
£million 2018 2017
Net interest on Group debt (79.4) (21.4)
Foreign exchange (loss)/gain on US private placement loan (26.4) 2.9
Pension finance credit (charge) 0.4 (1.1)
Group net interest charge (105.4) (19.6)
Higher net interest on Group debt of £79.4 million (2017: £21.4 million) reflects the much higher average prevailing net debt levels during 2018 and the substantially higher interest rates on Group debt following the April 2018 refinancing.
Within net debt the Group carries $348.3 million of US private placement notes. On 13 December 2017 the Group disposed of all hedging instruments resulting in the free float of the borrowings with all subsequent retranslation gains or losses on the value of this debt being recognised through the income statement as a non-underlying item. During 2018 this resulted in a loss of £26.4 million (2017: gain of £2.9 million). The $348.3 million private placement has a GBP value of £272.3 million as at the balance sheet date, reflecting the closing rate of 1.28 USD : 1 GBP.
The IAS 19 pension credit position results in a non-cash pension finance income of £0.4 million (2017: £1.1 million cost). See notes 7/8 to the consolidated financial statements for further details.
TAXATIONThe underlying tax charge for the year of £8.7 million on the headline profit before tax represents an effective rate of 63.5 per cent.
2018 2017
£million Profit Tax Rate Profit Tax Rate
Subsidiary companies (3.6) 8.7 0.0% 36.5 8.1 22.2%
Joint ventures and associates1 17.3 - 0.0% 25.5 – 0.0%
Headline profit before tax 13.7 8.7 63.5% 62.0 8.1 13.1%
Amortisation of intangible assets (18.7) (3.1) 16.6% (21.6) (3.6) 16.7%
Goodwill impairment (33.1) - - (60.0) – –
Exited business and non-underlying items (73.2) 12.0 (16.4%) (224.8) 5.5 (2.4%)
Effective tax charge and rate (111.3) 17.6 (15.8%) (244.4) 10.0 (4.1%)
1 The Group’s share of the post-tax results of joint ventures and associates is included in profit before tax in accordance with IFRS.
The subsidiary companies’ tax is considerably higher than the UK rate of 19 per cent, principally driven by the impact of unrelieved UK losses. For further disclosure of the non-underlying items and amortisation see note 5 to the consolidated financial statements. See note 9 for further tax disclosures.
DIVIDENDThe dividend remains suspended with no interim or final dividend due to be paid. Under the terms of our existing financing facilities, no dividend is payable until historical net debt to EBITDA is below 2.5 times. This will change under the Deleveraging Plan which will require more than two-thirds of the new money lenders and more than two-thirds of the new money bonders to approve any dividend.
3636
STRATEGIC REPORT

CASH FLOWYear-end net debt stands at £631.2 million (2017: £502.6 million), an increase of £128.6 million.
£million 2018 2017
Operating cash flows before movements in working capital
17.6 (111.3)
Movements in working capital (77.5) (37.0)
Net capital expenditure - hire fleet (0.3) 12.4
Cash generated by operations (60.2) (135.9)
Taxes paid (11.4) (8.6)
Net cash from operating activities (71.6) (144.5)
Net interest paid (39.6) (21.4)
Dividends received from associates and joint ventures
11.8 17.2
Dividends paid to non-controlling interests (3.7) -
Proceeds from issue of warrants and shares 35.7 -
Proceeds on disposal of non-hire fleet plant and equipment
8.9 1.6
Capital expenditure - non-hire fleet (19.6) (39.3)
Net investments in joint-venture entities (0.8) (32.0)
Proceeds from disposal of subsidiary 2.5 -
Proceeds from disposal of derivatives - 44.1
Foreign exchange (13.7) (53.9)
(Increase) in net debt (90.1) (228.2)
Opening net debt (502.6)
Movement in net debt above (90.1)
Unwinding of discount on debt (13.8)
Capitalised PIK interest (24.7)
Closing net debt (631.2)
In 2018 there has been a much stronger operating cash flow performance (before movements in working capital) than in 2017 (+£17.6 million versus -£111.3 million) driven to a large extent by a reduction in the EfW cash outflows in the current year versus 2017 of £66.2 million.
Net interest paid in 2018 of £39.6 million has increased significantly compared to 2017 (£21.4 million) in line with much higher average Group borrowings during the year and significant increases in the interest rates charged post the debt re-financing in April 2018.
As part of the refinancing of the Group’s borrowings in April 2018 we issued warrants to the providers of debt and bonding facilities with fair-value proceeds of £35.7 million including £0.4 million from the exercise of warrants.
Capital expenditure on non-hire fleet of £19.6 million principally relating to spend on Ingenuity House and vehicles, was significantly lower in 2018 compared to £39.3 million in 2017 as the Group exercised investment restraint in a cash constrained climate.
Net working capital outflows of £77.5 million (2017: £37.0 million outflow) are largely made up of the following: a favourable movement in receivables of £59.2 million being mainly improved cash management in Support Services and the unwinding of debtors in Construction as a result of a reduction in the size of their business; and a £135.0 million decrease in trade payables
which reflects a more normalised year-end payment process compared to the prior year and the close out of a number of large projects in Construction during 2018.
PENSIONSAt 31 December 2018 the Group had an IAS 19 pension surplus of £93.9 million (2017: £48.0 million net deficit).
£million 2018 2017
Gross liabilities (844.8) (1,064.1)
Gross assets 938.7 1,016.1
Total surplus/(deficit) 93.9 (48.0)
The IAS 19 accounting position on the Group’s defined benefit pension scheme increased from a deficit of £48.0 million to a surplus of £93.9 million largely due to a change in the basis of indexation on future pension increases from RPI to CPI (£70.6 million) together with an actuarial valuation gain of £54.0 million.
NEW ACCOUNTING STANDARDSIFRS 9 Financial instrumentsWe have adopted IFRS 9 Financial instruments from the beginning of this period. During the period we concluded our review of the implications of the adoption of IFRS 9 Financial instruments. The review included a consideration of the classification of assets previously held as available-for-sale under IAS 39, and the application of an expected credit loss model under IFRS 9. The review, comprising the assessment of amounts receivable from the sale of goods and services and amounts due from construction contract customers, concluded that the adoption of IFRS 9 did not result in any material change. As disclosed in the 2017 Annual Report, there was no quantitative impact on the Group upon adoption.
IFRS 15 Revenue from contracts with customersDuring the period we concluded our review of the implications of the adoption of IFRS 15 Revenue from contracts with customers which we adopted from the beginning of this period. As disclosed in the 2017 Annual Report, we identified no material change in the way that we recognise revenue on contracts with customers.
However, we did identify an issue with the transition from IAS 11 Construction contracts whereby costs that we had previously capitalised under that standard on contracts that were ultimately onerous, where future recovery was anticipated from a third party other than the customer, are not covered by similar provisions in IFRS 15. As such, the recognition of an asset in these circumstances falls to the more restrictive requirements of IAS 37 Provisions, contingent liabilities and contingent assets. In order to recognise the asset, IAS 37 requires recovery to be virtually certain rather than expected, otherwise it falls to be treated as a contingent asset and disclosed rather than recognised. Whilst we remain confident of recovery and our ultimate expectation is unchanged, we are not able to meet the requirement of virtually certain which we have interpreted as being as close to 100 per cent as to make any remaining uncertainty insignificant.
We have adopted IFRS 15 through the ‘modified retrospective adoption’ approach and, as such, have booked a cumulative catch- up adjustment to the opening balance sheet (charge to equity and increase in provisions) of £37.5 million without altering comparatives.
3737
Governance
Financial Statements
Strategic Report
Overview

Financial review continuedThese recoveries will now flow through the income statement as received (in effect the £37.5 million became an unrecognised contingent asset). Had IFRS 15 not been adopted, 2018 revenue would have increased by approximately £32.5 million.
We have made a number of other immaterial adjustments as a result of the application of IFRS 15, including minor amendments to revenue recognition where we believe that it is not highly probable that amounts will not be reversed.
At the date of authorisation of these financial statements the following standards and interpretations were in issue but not yet effective, and therefore have not been applied in these year-end financial statements.
IFRS 16 LeasesThe new standard will replace IAS 17 Leases. It will become effective for accounting periods on or after 1 January 2019, at the earliest. It will require nearly all leases to be recognised on the balance sheet as liabilities, including those currently recognised as operating leases, with corresponding assets being created.
The Group has assessed the estimated impact that initial application of IFRS 16 will have on its consolidated financial statements, as described below. The actual impacts of adopting the standard may change because:
• the Group has not finalised the testing and assessment of controls over its new IT systems; and
• the new accounting policies are subject to change until the Group presents its first financial statements that include the date of initial application.
IFRS 16 introduces a single, on-balance sheet lease accounting model for lessees. A lessee recognises a right-of-use asset representing its right to use the underlying asset and a lease liability representing its obligation to make lease payments. There are recognition exemptions for short-term leases and leases of low-value items. Lessor accounting remains similar to the current standard – i.e. lessors continue to classify leases as finance or operating leases.
Based on the information currently available, the Group estimates that it will recognise additional lease liabilities of between £125 million and £150 million as at 1 January 2019 and that IFRS 16 will increase the Group’s EBITDA by approximately £30 million and reduce profits before tax by around £2 million.
Except for IFRS 16 noted above, the directors do not currently anticipate that the adoption of any other standard and interpretation that has been issued but is not yet effective will have a material impact on the financial statements of the Group in future periods.
TAX STRATEGY AND RISK MANAGEMENTGovernanceThe Group seeks constantly to evolve its systems, processes and procedures as they relate to taxation to ensure that confidence is maintained in the Group’s ability to process and deal with its taxation affairs. All tax decisions and considerations are routed through the specialist Group Tax Department prior to being considered further and, when appropriate, put forward for approval at Board level. All tax disclosures and errors are reported
to the Group Tax Department which also forms the principal point of contact between the Group and HMRC.
The Group has a robust system of documented controls which are regularly reviewed to ensure they remain fit for their intended purpose and which ensure that we are able to meet our taxation obligations and the requirements of the Senior Accounting Officer (SAO) reporting obligations. A comprehensive review is undertaken each year of adherence to SAO requirements before considering whether it is necessary to draw attention to errors which may have affected the Group’s ability to account for the correct amount of tax.
Responsibility for the execution of the Group’s tax strategy rests with the Chief Financial Officer and the Head of Tax and Treasury.
PlanningEfficient management of the tax base of the Group involves structuring the Group’s affairs efficiently for tax and conducting the Group’s affairs in accordance with tax legislation but does not involve or permit the use of risky or aggressive tax structures or schemes.
The Group’s tax strategy is determined by the Board and is summarised in the following statement:
“The Group will seek to manage the tax it pays (i) by abiding by legal and regulatory principles, (ii) by considering acceptability to stakeholders, and (iii) by avoiding any acts inconsistent with the Group’s reputation.”
The Group seeks to create value for its shareholders and efficient management of the tax base of the Group is an integral part of that value creation, subject to the principles outlined above.
Relationship with UK tax authoritiesInterserve seeks to maintain an open dialogue in the UK with HMRC regarding its plans and tax affairs, discussing potential tax issues which may arise in the business as well as initiating discussion around the suitability of the systems and controls in place to control and manage its tax position.
TREASURY RISK MANAGEMENTWe operate a centralised Treasury function whose primary role is to manage interest rate, liquidity and foreign exchange risks. The Treasury function is not a profit centre and it does not enter into speculative transactions. Where possible it aims to reduce financial risk by the use of hedging instruments, operating within a framework of policies and guidelines approved by the Board.
Liquidity riskWe seek to maintain sufficient facilities to ensure access to funding for our current and anticipated future requirements, determined from budgets and medium-term plans.
During 2018 the Group had access to committed debt facilities comprising a $350 million US private placement and £583 million of committed bank facilities. The US private placement was translated into GBP at the prevailing exchange rate at 31 December 2018 (£272.3 million). During the year £33.2 million of committed facilities were prepaid and cancelled. The aggregate facilities of £824.3 million at the year-end date had a weighted average expiry date of September 2021.
3838
STRATEGIC REPORT
On 27 April 2018 the Group secured new financing from its lenders. The additional facilities, totalling £196.5 million, comprised a term loan of £175 million and £21.5 million of money market lines and committed bonding facilities of £95 million. These facilities are scheduled to expire in September 2021.
Additionally, as part of the proposed deal terms, the Company issued warrants to the providers of the new cash and bonding facilities to buy shares at 10 pence per share (the nominal price of each share). If exercised, this would provide the warrant holders with an interest of up to 20 per cent of the post-issue share capital.
The agreement by the lenders to provide new facilities contains provisions to charge interest on the facilities which does not become payable until the maturity of the facilities. The interest is capitalised on each quarter-end date and forms part of the debt balance at the balance sheet date. The value of interest capitalised on loan facilities in 2018 was £24.7 million. The value of interest accrued in respect of issued instruments drawn on the committed facilities was £4.3 million.
Market price riskThe objectives of our interest rate policy are to match funding costs with operational revenue performance and to ensure that adequate interest cover is maintained, in line with Board-approved targets and banking covenants.
Foreign currency riskTransactional currency translationThe revenues and costs of our trading entities are typically denominated in their functional currency. The impact of retranslating any entity’s non-functional currency balances into its functional currency was not material.
Consolidation currency translationWe do not hedge the impact of translating overseas entities’ trading results or net assets into the consolidation currency.
As at the balance sheet date the $348.3 million of debt relating to the US private placement was unhedged.
The impact of changes in the 31 December 2018 year-end exchange rates, compared to the rates used in preparing the 2017 consolidated financial statements, has been an increase in net assets attributable to equity holders of £14.0 million (2017: £35.2 million decrease).
VIABILITY STATEMENTThis statement is made against a background of challenging market conditions in the UK support services and construction sectors and the collapse into liquidation of a major competitor, Carillion, in early 2018. In the face of adverse media speculation, Interserve, Capita, Kier and others in similar markets have taken steps to improve balance sheet strength and resilience.
The directors have reviewed the viability of the Group over a three-year period to December 2021. The choice of a three-year period reflects the secured nature of the Group’s revenues with £7.1 billion (of which £5.5 billion is secured) of work in the order book. There is a negligible amount of secured work outside of this timeframe in the Construction division and only 35 per cent in the Support Services division. The viability period chosen aligns with the annual planning process.
Strategy and key judgementsIn April 2018 the Group announced a multi-year strategy with four key priorities:
1. Fit for Growth – a simplified organisation that will deliver reduced overhead costs.
2. A competitive customer value proposition.
3. Standardised operational delivery.
4. One Interserve – a consistent approach to leadership, performance management, reward and recognition.
In creating its plan, the Board has considered the principal risks and uncertainties in the implementation of the Group strategy as well as those inherent in the business. The key planning assumptions are outlined below:
1. The new financing structure is concluded with necessary consent obtained from lenders and shareholders.
2. No significant political changes in the UK or overseas that will impact public-sector outsourcing.
3. Continued progress in improving margins and operating profit driven by targeted cost savings and selective contract bidding.
4. Success in recovering professional indemnity insurance claims relating to the construction of the Derby EfW plant. This follows a successful outcome in relation to similar claims in 2018 in respect of the Glasgow EfW plant.
5. Termination account payments on the Glasgow EfW plant will be within the allowance made, a sum that is materially lower than amounts claimed by the client. This is considered in further detail in this statement.
6. Trade debt with Saudi colleges will be fully recoverable in line with previous debt recovery experience in the region.
7. The plans for dealing with loss-making contracts within the profitable PFI portfolio in the Support Services division will be successful in reducing any future losses.
8. Both customer and supplier payment terms will improve following the refinancing.
As part of the planned refinancing, the Group and/or its subsidiaries will be making undertakings to its lenders which are summarised below. Plans have been made to meet all the requirements but it is noted that non-compliance would be an event of default under the terms of these financing arrangements and would potentially impact on the ability of the Group and/or its subsidiaries to continue trading as going concerns.
A condition of the additional lending are financial covenants, starting in December 2019 for the Interserve Group excluding RMDK, and in June 2019 for RMDK.
For the Interserve Group, excluding RMDK, there is a proposed minimum EBITDA covenant: December 2019: £50 million, June 2020: £60 million, December 2020: £60 million, June 2021: £70 million, December 2021: £70 million. Also, a minimum cash flow available for debt service December 2019: £(145) million, June 2020: £20 million, December 2020: £45 million, June 2021: £50 million, December 2021: £50 million. The loan maturity is 2022.
For the RMDK facility (non-recourse to the rest of the Interserve Group) there is a maximum leverage covenant being multiples of EBITDA: December 2019: 3.1, March 2020: 2.6, June 2020: 2.6, September 2020: 2.3 and December 2020: 2.0. Also a minimum liquidity requirement of £3 million from September 2019. The loan maturity is 2023.
3939
Governance
Financial Statements
Strategic Report
Overview

Financial review continuedIn addition, the Group has committed to provide a funding proposal in respect of any EfW settlements greater than those currently forecast in the business plan.
It is also required to engage with lenders within three weeks of submitting two consecutive short-term cash flow forecasts that predict a cash requirement not covered by the debt facility.
As discussed in note 1 to the consolidated financial statements, significant judgements have also been taken with respect to the outcome of other contracts and there is an assumption that costs will fall within anticipated and provided levels. This relies upon, as yet, unsecured negotiations to settle or de-scope contracts. Conclusion of these negotiations is, at least, partially outside the control of the directors and could have a sizeable adverse impact on the Group.
It is management’s view that the Deleveraging Plan, if approved by shareholders on 15 March 2019, will place the Group in a strong position to deliver the strategy, be competitive in the marketplace and provide a secure future for the Group’s employees, customers and suppliers.
Prior to successful conclusion of the Deleveraging Plan, the level of uncertainty around the Group’s financial position has been adversely impacting customer and supplier confidence as well as influencing employee morale and credit ratings. If confidence is slow to return it will be detrimental to the Group’s recovery plans in 2019.
Looking beyond the 12-month timeframe, to the remainder of 2020 and 2021, there are additional assumptions about market stability in the UK and overseas which are outside the control of the directors. A significant deterioration in these markets would impact the Group’s long-term viability.
The Group has carried out a comprehensive business planning exercise on all other aspects of its business. The approach that has been adopted and the sensitivities considered are discussed further below.
Assessment processThe future prospects of the Group are assessed primarily through the annual planning process. This entails a series of detailed operational reviews culminating with divisional reviews involving the Chief Executive Officer, Chief Financial Officer and divisional management team. The results of these reviews are then submitted to the Board in the form of a plan summary document for debate and approval.
The output is a full set of income statement, cash flow and balance sheet projections for each of the reporting entities of the Group. These exist at monthly frequency for the first two years of the strategic plan (2019 and 2020) and annually for the final year (2021).
This year, the outputs were reviewed and reported on by advisers acting on behalf of the Group’s lenders.
Progress against this plan is monitored, on a monthly basis, via monthly divisional business reviews with the Chief Executive Officer and Chief Financial Officer and management accounts which are submitted to the Board.
Subsequent to December 2018 the plan was amended to reflect the deleveraging proposal presented to the Group’s debt holders and the approximately £33 million of adviser fees associated with this.
Following these amendments, the plan reflects a reduction in Interserve Group’s pro forma net debt from the issuance of £480 million of new equity. £350 million of existing debt is allocated to RMDK, of which £169 million is cash-pay and £181 million has been converted into a subordinated non-cash pay debt instrument. The debt allocated to RMDK is non-recourse to the rest of Interserve Group and has maturities extended to 2023. Following the refinancing, Interserve Group, excluding RMDK, will have a £110 million committed debt facility which matures in 2022.
Net cash-pay leverage of the Interserve Group (excluding the RMDK non-cash pay debt instrument) is expected to reduce to less than 1 x EBITDA and total net leverage (including the RMDK non-cash pay debt instrument) reduces to less than 2 x EBITDA.
Assessment of viabilityAlthough they consider that the output of the annual strategic planning process represents the best estimate of future prospects of the Group, the directors have also stress tested the future viability of the Group by considering a number of sensitivities to the plan.
These scenarios have been informed with reference to both the Principal Risks and Uncertainties of the Group and the key strategic planning assumptions on page 39. All scenarios assume the successful completion of the proposed Deleveraging Plan. The scenarios are:
4040
STRATEGIC REPORT
ScenarioLinkage to the key judgements and the principal risks or uncertainties Sensitivity modelled
1. Significantly reduced work winning from a combination of a downturn in market conditions, changes in the political appetite for outsourcing, political pressures in the Middle East or from reduced overall customer confidence in Interserve.
Key strategic planning assumption: 2
Principal risks and uncertainties: business, economic and political environment, damage to the Company’s reputation
A shortfall in 2019 forecast revenue from future contract wins leading to reduced revenue and profits in the Support Services division over a three-year period. A 25 per cent reduction in the revenue in the Construction division resulting in reduced profits and increased working capital outflows impacting 2019 to 2021.
2. Cost reductions that form part of the Fit for Growth programme are not fully realised or are offset by other cost increases.
Key strategic planning assumption: 3
Principal risks and uncertainties: operating system, key people, financial risks
Costs of change incurred as planned but with reduced benefits. Impact of mandatory increases in UK and Spanish pay rates.
3. Increase in working capital requirement. Key strategic planning assumption: 4, 8
Principal risks and uncertainties: financial risks
Planned disposals of non-core businesses are assumed to be delayed by three to six months.
The expected improvement in day sales outstanding in the Support Services and RMDK divisions does not occur.
4. Energy from Waste – insurance proceeds delayed at Derby and final account settlement higher than assumed at Glasgow.
Key strategic planning assumption: 5, 6
Principal risks and uncertainties: major contracts
Derby professional indemnity proceeds are delayed by six months during which time additional costs of £1.4 million per month are incurred.
Glasgow final account settlement is higher than assumed.
5. Poor recovery of debts in the Middle East. Key strategic planning assumption: 2, 6
Principal risks and uncertainties: financial risks
There are no further receipts from education contracts in Saudi Arabia.
With the anticipated Deleveraging Plan in place, the Company would be able to sustain all of these scenarios in combination and still remain within the proposed committed facility limits and comply with the covenant tests. However, additional unmodelled scenarios exist that could cause breaches of either the absolute committed facilities or covenants. These principally involve a failure to secure the proposed financing, a significant worsening in the cost to complete or final account settlements within the EfW business or significant adverse macroeconomic events. The directors have applied the assumption that unmodelled scenarios will not occur.
The Group faces a number of uncertainties in relation to the final outcomes on its EfW contracts and political uncertainties in the Middle East which are detailed in this statement and in the Deleveraging Plan Prospectus. It has plans in place that have been stress tested with a number of reasonable worst case scenarios; however, there can be no certainty that it will remain viable. The directors have a plan which they are implementing but they acknowledge the inherent risks of delivery, some of which are outside their control.
While the directors have every expectation of successful completion of the financial restructuring, this is contingent on approval of the detailed transaction by 50 per cent of shareholders. The Group has been in discussion with lenders and there is every indication that the detail will be agreed and confirmed by 15 March but there is no certainty. The transactions will be put to shareholder vote on this date. Failure to conclude the Deleveraging Plan may cast significant doubt over the Group’s ability to continue as a going concern, and consequently may cast significant doubt over its viability.
GOING CONCERN STATEMENTThe directors have carried out a detailed review of the viability of the Group over the period to December 2021. This review has involved stress testing of the current strategic plan of the Group under a number of scenarios and has considered risks and uncertainties to both the near and medium term.
Based on this analysis, with no unforeseen deterioration in the remaining EfW projects and approval of the Deleveraging Plan by shareholders, the directors have a reasonable expectation that the Group has adequate resources to continue as a going concern for the foreseeable future, representing a period of at least a year from the date of this statement. The Board of Directors has considered the length of going concern period for this assessment and, taking into account the terms of the replacement financing facilities and proposed Deleveraging Plan, has concluded that a going concern period of 12 months remains appropriate.
In making this assessment the directors recognise that there is a material uncertainty in relation to the approval of the Deleveraging Plan by shareholders and failure to secure shareholder approval represents a material uncertainty that may cast significant doubt over the Group’s ability to continue as a going concern.
Based on current expectations, and on the basis that the directors have every expectation of successful completion of the financial restructuring, the directors consider it appropriate to continue to adopt the going concern basis in preparing the financial statements.
Debbie White Mark WhitelingChief Executive Officer Chief Financial Officer
4141
Governance
Financial Statements
Strategic Report
Overview

Board of directors
Skills and experienceGlyn has extensive experience as a business leader and trusted adviser to FTSE-100 companies and their boards on a wide variety of corporate finance issues. He previously held a number of senior positions during his 35-year career at PricewaterhouseCoopers and developed and led PwC’s private-equity focused Transactions Services business. He has a deep understanding of accounting and regulatory issues, together with comprehensive transactional and financial services experience. Glyn is a Fellow of the Institute of Chartered Accountants in England and Wales and holds a BSc (Hons) in Economics and Accountancy from the University of Bristol.
External appointments• Senior Independent Non-Executive
Director, Aviva plc
• Senior Independent Non-Executive Director and Remuneration Committee Chairman, The Berkeley Group Holdings plc
• Non-Executive Chairman, Irwin Mitchell Holdings Ltd
• Non-Executive Director and Audit Committee Chairman, Transocean Ltd (NYSE)
• Adviser, Novalpina Capital LLP
Former key appointments• Non-Executive Chairman,
Transocean Partners LLC (NYSE)
• Vice Chairman, UK, PricewaterhouseCoopers LLP
• Managing Partner, UK, PricewaterhouseCoopers LLP
• Head of Assurance, UK, PricewaterhouseCoopers LLP
• Deputy Chairman, English National Opera
Skills and experienceDebbie joined Interserve as Chief Executive Officer in September 2017 after spending 13 years at Sodexo where, most recently, she served as Chief Executive Officer of Global Healthcare and Government, leading its business in Justice, Defence and Government Services and Healthcare. A Cambridge graduate who qualified as a chartered accountant and tax adviser with Arthur Andersen in the UK, Debbie spent her early career in finance roles at Astra Zeneca and in a global advisory role at PwC Consulting. She is a member of the Women 1st Top 100 Club.
External appointments• Non-Executive Director, Howden
Joinery Group Plc
• Trustee and Audit Committee Chair, Wellbeing of Women
Former key appointments• Chief Executive Officer, Sodexo
Global Healthcare and Government
• Chief Executive Officer, Sodexo UK and Ireland
• Chief Financial Officer, Sodexo Inc
• Chief Financial Officer, Sodexo UK and Ireland
Skills and experienceMark has considerable financial and leadership experience in listed companies, most recently having spent four years at Premier Farnell in various roles, including Chief Financial Officer and Deputy Chief Executive. Mark started his career with Coopers and Lybrand in New Zealand before moving to the USA where he held a number of finance roles. A graduate of the University of Canterbury in Christchurch, New Zealand, Mark holds a Masters of Commerce (Hons) degree.
External appointments• Senior Independent Non-Executive
Director and Audit Committee Chairman, Connect Group Plc
Former key appointments• Senior Independent Non-Executive
Director and Audit Committee Chairman, Hogg Robinson Group PLC
• Non-Executive Director, Future plc
• Deputy Chief Executive/Interim Chief Executive/Chief Financial Officer, Premier Farnell plc
• Chief Financial Officer, Autobar Group Ltd
• Finance Director, Communisis plc
• Group Finance Director, Tibbett & Britten Group Plc
• Chief Financial Officer for the food equipment division (Europe and International), Enodis Plc
• Vice President – finance, diversified pharmaceutical services, Smithkline Beecham
Skills and experienceFollowing his appointment to the Board in September 2014, Russell was appointed as Senior Independent Director in May 2015. Russell has extensive board experience as a Chairman, Senior Independent Director and Remuneration Committee Chairman. In addition, he has broad international experience especially in business/strategy development, human resources and sustainable development acquired during his career at ICI and Anglo American plc. Russell holds a BA (Hons) in Politics from the University of Durham.
External appointments• Non-Executive Chairman,
Hummingbird Resources PLC
• Senior Independent Non-Executive Director and Remuneration Committee Chairman, Spectris Plc
• Independent Non-Executive, BDO LLP
Former key appointments• Senior Independent Non-Executive
Director and Remuneration Committee Chairman, Aggreko plc
• Senior Adviser, Heidrick & Struggles
• Chairman, Sepura plc
• Chairman, GeoProMining Ltd
• Senior Adviser, RBC Capital Markets on Metals and Mining
• Chairman, Bergteamet AB
• Non-Executive Director, Anglo Platinum Ltd
• Chief Strategy Officer, Anglo American plc
• Executive Vice President of Group Human Resources and Business Development, Anglo American plc
GLYN BARKER ChairmanJoined the Board in January 2016 and became Chairman in March 2016
Chairman of the Nomination Committee and member of the Remuneration Committee
DEBBIE WHITEChief Executive Officer Joined the Board in September 2017
MARK WHITELING Chief Financial OfficerJoined the Board in October 2017
RUSSELL KING Senior Independent DirectorJoined the Board in September 2014
Member of the Audit, Nomination and Remuneration Committees
42
GOVERNANCE

Skills and experienceAs a former partner at international law firm, Pinsent Masons, Gareth’s expertise is in corporate legal matters, but he also has extensive experience as an adviser to boards and CEOs at a range of public, private and entrepreneurial companies on their strategy and wider business and commercial issues. He has considerable international experience, particularly in the Middle East, and was instrumental in expanding Pinsent Masons’ offices in continental Europe and facilitating business development between its Asian, Middle Eastern and European offices. Gareth, a qualified solicitor, has a BA in French and German from the University of Keele.
External appointments• Non-Executive Chairman, Honye
Financial Services Ltd (Cayman Islands) (LSE)
Former key appointments• Partner, Global Head of Corporate,
Pinsent Masons LLP
• Non-Executive Director, Positive Healthcare plc
Skills and experienceDuring her 27 years at BP, Anne gained extensive experience of global business, developing markets, risk management, internal control, compliance and strategy development in the aviation, petrochemicals, trading and retail sectors. She is a Fellow of the Institute of Chartered Accountants in Ireland and a Bachelor of Commerce in Economics, Accounting and Business from University College Galway, Ireland. Anne has chaired the Audit Committee since May 2013.
External appointments• Non-Executive Director and
Audit/Risk Committee Chair, Coats Group plc
• Non-Executive Director and Audit Committee Chair, Nystrar NV (Belgium)
• Non-Executive Director and Audit Committee Chair, SThree plc
• Director/Trustee and Chair of Finance Committee, Save the Children
Former key appointments• Chief Financial Officer, Global
Fuels, BP
• Controller Strategic Businesses, BP
• Controller Petrochemicals, BP
• Senior Audit Manager, KPMG (Ireland and Australia)
Skills and experienceNick has extensive experience as an advisor to boards at a range of public and private companies on their strategy and wider business issues, particularly in the construction industry. He also has considerable international experience, principally in the Middle East and Asia Pacific. Nick is a member of the CBI Infrastructure Board and a board member of the Environmental Services Association. Currently CEO of Cory Riverside Energy, previous experience has seen him as CEO at Balfour Beatty Construction Services (UK), CEO at Bovis Lend Lease (UK), and a senior private-sector leader at Navigant Consulting, Railtrack plc, Network Rail, and Skanska.
External appointments• Group CEO, Cory Riverside Energy
• Member, CBI Infrastructure Board
• Director, Environmental Services Association
Former key appointments• Chief Executive Officer,
Construction Services UK, Balfour Beatty plc
• Chief Operating Officer, Navigant Consulting, Inc
• Chief Executive Officer, Bovis Lend Lease Ltd
• Executive Vice President, Skanska UK Plc
• Director, Possessions, Network Rail
• Network Development Director, Railtrack plc
Skills and experienceNick brings a wealth of experience from a number of senior executive roles in multinational companies and several non-executive directorships. He spent the first 20 years of his career in the power station construction industry internationally before joining Babcock as Chief Executive in 1993. During his tenure at Babcock, Alstom and Cookson over the next 20 years Nick was responsible for leading several major restructuring projects and negotiating complex acquisitions and disposals.He is a Fellow of the Royal Academy of Engineering and holds a BSc (Hons) from the University of Bristol. Nick has chaired the Remuneration Committee since June 2018.
External appointments• Non-Executive Chairman, South
East Water Ltd
• Senior Independent Non-Executive Director, Elementis plc
Former key appointments• Senior Independent Non-Executive
Director, United Utilities Group plc
• Chief Executive, Cookson Group plc
• Executive Vice President, Alstom SA
• Chief Executive, Babcock International Group plc
GARETH EDWARDS Independent Non-Executive DirectorJoined the Board in February 2017
Member of the Audit, Nomination and Remuneration Committees
ANNE FAHY Independent Non-Executive DirectorJoined the Board in January 2013
Chair of the Audit Committee, and member of the Nomination and Remuneration Committees
NICHOLAS POLLARDIndependent Non-Executive DirectorJoined the Board in June 2018
Member of the Audit Committee
NICK SALMONIndependent Non-Executive DirectorJoined the Board in August 2014
Chairman of the Remuneration Committee, and member of the Audit and Nomination Committees
ADVISERSGeneral Counsel and Company SecretaryAndrew McDonald
Registered office Interserve House Ruscombe Park Twyford, Reading Berkshire RG10 9JU T +44 (0)118 932 0123 F +44 (0)118 932 0206 [email protected] www.interserve.com
Registered number00088456
Registrar and share transfer officeLink Asset Services The Registry 34 Beckenham Road Beckenham, Kent BR3 4TU T +44 (0)371 664 0300 [email protected] www.signalshares.com
AuditorsGrant Thornton UK LLP
StockbrokersNumis Securities Limited
LawyersAshurst LLP
43
Governance
Financial Statements
Strategic Report
Overview

Corporate governance
Dear Shareholder
I reported last year that some of the recent challenges faced by the Group were, in my view, due in part to weaknesses in the governance framework. During 2018 we commissioned an independent review of our systems and processes aimed at strengthening our internal controls processes and procedures so that they are effective, robust and an integral part of our culture. We have also engaged the services of Independent Board Evaluation Ltd to conduct an external board evaluation on the effectiveness of the Board. The findings of both reviews will be concluded during 2019 and we will be in position to report more fully in next year’s Corporate Governance Report.
The Financial Reporting Council (FRC) published the new UK Corporate Governance Code in 2018 (the 2018 Code). The 2018 Code puts the relationships between companies and their key stakeholders at the heart of long-term sustainable growth in the UK economy, placing emphasis on businesses building trust by forging strong relationships with key stakeholders. It also calls for companies to establish a corporate culture that is aligned with the company purpose, business strategy, promotes integrity and values diversity.
The 2018 Code will apply to the financial year beginning 1 January 2019, meaning Interserve intends to report against the 2018 Code in the 2019 Annual Report. However, we are already engaging with our stakeholders across the Group and there are various informal engagement processes via town halls, directors’ tours and site visits, which actively seek to engage employees. We also recently launched our employee engagement survey Group-wide, the results of which will help shape our future Board engagement with our employees. The Group has continued to engage its shareholders in order to gain an understanding of their aspirations for the Company and to afford them the opportunity to give their views.
We have also embarked on a talent review programme, sponsored by our Nomination Committee, that will address the need to review our pipeline of talent in the context of diversity and our need to ensure we have a robust succession plan for the future.
As I have already outlined in my Chairman’s Statement, Interserve has endured enormous change in 2018 and the new executive team has brought demonstrable leadership to drive improvement to the culture and control environment of the organisation and to guide the Group on its transformation journey. This is demonstrated by the Deleveraging Plan which will provide Interserve with a strong balance sheet and platform to deliver on its strategy, and our Fit for Growth programme which was launched at the end of 2017 and has delivered on its objectives which underpin our strategic priorities: to simplify our processes so that across the Group we can operate in a One Interserve way.
It is my belief that we have the key ingredients in place to continue our aim, to deliver a sustainable and stable business for future growth.
As was the case last year, all directors wishing to remain in office will seek re-election at the AGM.
Glyn BarkerChairman
Glyn BarkerChairman
44
GOVERNANCE
COMPLIANCE WITH THE CODEThe FRC requires the Company to disclose how it has applied the principles of the UK Corporate Governance Code published in April 2016 (the Code) and whether there has been compliance with its provisions throughout the financial year. In the case of non-compliance, the Company must specify those provisions with which it has not complied and give reasons for this. The Code may be found on the FRC website (www.frc.org.uk).
The directors consider that the Company has complied throughout the year with all provisions of the Code applicable to it, save for the following provisions:
• E.2.4 which requires at least 14 working days’ notice in advance of a general meeting of the Company.
On 11 April 2018 the Company gave notice to shareholders of a general meeting on 27 April 2018 at which resolutions were passed increasing the Company’s borrowing limit and ratifying any possible prior breach of the borrowing limit. Whilst the length of notice given for this general meeting complied with the requirements of the Companies Act 2006 and the Company’s articles of association, it did not comply with the requirement under provision E.2.4 of the Code that notices of general meetings and related papers should be sent to shareholders at least 14 working days before the meeting. In this case, 12 working days’ notice was given.
The reason for the shorter period of notice was the need for the Company’s borrowing limit to be increased before the publication, on 27 April 2018, of the Group’s financial statements for the financial year ended 31 December 2017. Whilst the increase in the Group’s borrowing limit was not directly linked to the refinancing undertaken by the Group that was announced on 27 April 2018 and would have been required in any case to enable the publication of the Group’s financial statements for the financial year ended 31 December 2017, the Company would not have had the necessary authority to allow for the successful execution of all documentation required for the refinancing unless the borrowing limit had been increased. The Board is therefore satisfied that non-compliance with provision E.2.4 of the Code was, in the circumstances, in the best interests of the Company’s shareholders as a whole and was not detrimental to the Group’s overall governance culture for the reasons explained.
LEADERSHIPThe BoardOperation of the BoardThe Board has a formal schedule of matters reserved for its decision, whilst day-to-day operational decisions are managed by the Executive Team, as referred to on page 47.
In order to facilitate the efficient use of its time the Board has delegated certain of its powers to Board committees, details of which are set out later in this report. From time to time the Board also establishes certain other committees to deal with a specific issue which the Board has approved.
Board activities in the 2018 financial yearThe Board is responsible for reviewing the Group’s strategic direction, governance, ethics, values and risk management. Set out below are the key matters dealt with by the Board during the course of the year, in addition to the ongoing monitoring of operational and financial performance of the Group:
Strategy• delivering on the objectives of the Group’s Fit for Growth
transformation programme aimed at improving cash and margin performance. 2018 saw the completion of phases one and two and the continuation of the final phase of the plan;
• setting the health and safety targets for the Group and monitoring performance on a monthly basis;
• determining the method and formulating a plan for the deleveraging of the Group debt;
• regular stakeholder engagement and review of pipeline business development opportunities presented at each board meeting by the Chief Executive Officer;
Finance/governance• ongoing monitoring of key contracts where outcomes could
impact financial performance with particular reference to the exited Energy from Waste (EfW) business;
• ongoing monitoring of the Group’s working capital, net debt positions and funding requirements, and related discussions with the Group’s lenders;
• considering capital investments and requests by the businesses for approval of significant tenders within the framework of matters reserved for the Board’s decision;
• approval of capital divestments in accordance with commitments with the Group’s lenders;
• setting the Group’s annual budget and plan;
• approval of the Annual and Half-Year Reports;
• satisfying itself as to the basis for and appropriateness of the going concern and viability statements;
Risk management• reviewing the current system of internal controls and a risk
management and assurance strategy; and
• careful consideration of the risk/reward profile of significant bids and potential joint ventures.
Division of responsibilitiesThere is a clear division of responsibilities between the role of the Group Chairman and Chief Executive Officer which are clearly defined in written terms of reference, agreed by the Board.
The role of the ChairmanThe Group Chairman leads the Board and creates the conditions for overall Board and individual director effectiveness, both inside and outside the boardroom. The Group Chairman considers succession planning and the Board’s composition with the Nomination Committee and ensures effective communication with shareholders and other stakeholders.
The Group Chairman, assisted by the Company Secretary, sets the agenda for Board meetings and ensures that Board members receive timely information and are briefed on issues arising at Board meetings to assist them in making an effective contribution.
The Group Chairman’s other commitments are set out in his biography on page 42.
45
Governance
Financial Statements
Strategic Report
Overview

Corporate governance continuedThe role of the Chief Executive OfficerThe Chief Executive Officer manages the Group, leading the formulation of and, once set by the Board, implementing strategy. She chairs the Executive Team and is responsible for investor communications and all social and ethical matters within the Group.
The role of the Senior Independent DirectorThe Senior Independent Director is available to shareholders should they have any concerns which contact through other channels has failed to resolve or for which such contact may be inappropriate. He also acts as a sounding board for the Group Chairman, serves as an intermediary for the other directors when necessary, conducts the Group Chairman’s annual performance evaluation and leads any new Chairman appointment process.
The role of the Company SecretaryThe Company Secretary distributes Board papers and other information sufficiently far in advance of each meeting for the directors to be properly briefed, presenting certain papers to the Board and its committees, advises on Board procedures and ensures that the Board follows them.
The Board papers include information from management on financial, business and corporate issues. Matters requiring Board and committee approval are generally the subject of a written proposal and circulated as part of the Board papers. The Company Secretary plays a key role in the good governance of the Company and, in particular, by supporting the Group Chairman on all Board matters pertaining to governance.
Non-executive director independence and appointmentsThe Board reviews the independence of its non-executive directors on an annual basis as part of its nomination for re-election process. The Group Chairman and the non-executive directors are considered by the Board to be independent in character and judgement and free from any relationships or circumstances which are likely to affect, or could appear to affect, their judgement. The non-executive directors have complementary skills, experience and qualifications in a wide range of economic sectors and so are able to bring independent judgement and constructive challenge to bear on matters for consideration.
As at 31 December 2018 the Board comprised nine members: the Group Chairman, three executive and five non-executive directors.
Non-executive directors and the Group Chairman are required to confirm, on appointment, that they have sufficient time to meet what is expected of them and to seek the committee chairman’s agreement, or in the case of the Group Chairman, the Senior Independent Director’s agreement, before accepting additional commitments that might impact upon the time they are able to devote to their role as a non-executive director of the Company. The letters of appointment of the non-executive directors and the Group Chairman specify the anticipated level of time commitment.
The terms and conditions of appointment of the non-executive directors and the Group Chairman are available for inspection at the Company’s registered office during normal business hours.
BOARD EFFECTIVENESSMeetingsThe Board held nine pre-scheduled meetings throughout the year and 17 ad hoc meetings to deal with time-critical matters. Attendance at Board and committee meetings during the year is set out in the table below.
Number of meetings attended
Board Audit Remuneration Nomination
G A Barker 23/26 7/7 1/2
G M Edwards 23/26 6/6 7/7 2/2
A K Fahy 21/26 6/6 6/7 2/2
R J King 22/26 5/6 7/7 2/2
K L Ludeman1 10/14 2/3 4/4 1/2
C N Pollard2 9/10 3/3
N R Salmon 23/26 6/6 7/7 2/2
D I Sutherland 22/26
D J White 26/26
M A Whiteling 25/26
1 Keith Ludeman resigned from the Board on 12 June 2018.
2 Nick Pollard was appointed to the Board on 26 June 2018.
Several ad hoc Board meetings relating to the Group refinancing and deleveraging were convened at short notice during the year, resulting in certain directors being unable to attend due to other longstanding commitments. There was full attendance at the nine scheduled Board meetings, with the exception of Anne Fahy who was unable to attend the October meeting due to a late change in timing by the Company as she was overseas on business. Anne provided input by email on the main topics and met with the Chief Financial Officer and Company Secretary on her return.
The Group Chairman held a private session with the non-executive directors at which no executive directors were present plus a number of informal discussions with the Chief Executive Officer present. Under the leadership of the Senior Independent Director a review of the Group Chairman’s performance was conducted without his involvement and feedback provided to him.
Board induction, training and developmentOn appointment, new directors receive a tailored induction programme arranged by the Company Secretary which includes, for example, refresher training on the duties of a listed company director, the operation and activities of the Group, meetings with management and other corporate advisers, and operational site visits encompassing a representative cross-section of most of the Group’s UK operations accompanied by the executive director responsible for that part of the Group.
Upon appointment, Nick Pollard undertook a comprehensive induction programme that included individual sessions with the Board and Executive Team leaders as well as key site visits accompanied by an executive director and refresher training on directors’ duties.
The Group Chairman and non-executive directors took part in a site visit to our RMDK headquarters during the year to gain insights and obtain feedback from its employees.
46
GOVERNANCE

Performance evaluationThe Board has engaged the services of an external evaluator, Independent Board Evaluation Ltd (IBE), to evaluate its performance and effectiveness. IBE has no other connections with the Company. IBE’s approach is to attend and observe Board and committee meetings and conduct a series of one-to-one interviews with Board members and other key executives. The process with be concluded in 2019 and findings and recommendations will be reported in next year’s Annual Report.
The overall time commitment of the non-executive directors in the attendance of Board meetings/visits was in the order of circa 21 days in addition to the time taken to read Board papers and attendance at six meetings held by the Group Chairman.
Information and supportIndividual directors may, after consultation with the Group Chairman, take independent legal advice in furtherance of their duties at the Company’s expense up to a limit of £10,000 in relation to any one event. In the case of the Group Chairman he must consult with the Senior Independent Director. All directors have access to the advice and services of the Company Secretary, whose appointment or removal is a matter reserved for the approval of the Board or any duly delegated committee thereof.
Election and re-electionNick Pollard, having been appointed since the previous AGM, will submit himself for election by shareholders at the 2019 AGM in accordance with the Company’s Articles of Association. All remaining directors will also submit themselves for re-election.
Biographical details for each of the directors standing for election or re-election are set out on pages 42 and 43.
EXECUTIVE TEAMThe Executive Team, which, during the year, comprised the executive directors together with the senior operational and functional leaders of the Group, is chaired by the Chief Executive Officer.
The Executive Team, which met 10 times during the course of the year, is responsible for:
• the operational management and delivery against budget and forecast of the Group;
• implementing resolutions of the Board, formulation of strategy, annual budgets and other proposals for consideration by the Board;
• the identification and evaluation for consideration by the Board of risks faced by the Group;
• designing, operating and monitoring a suitable system of internal control embracing the policies adopted by the Board and providing assurance to the Board that it has done so; and
• conducting monthly Senior Leadership Business Updates reflecting the Group’s open and collaborative culture and demonstrating the importance that the Executive Team places on employee engagement.
The Executive Team is also responsible for devising and, once approved by the Board, implementing suitable policies and monitoring procedures for health and safety, environmental, social and ethical, treasury, human resources and information technology.
AUDIT COMMITTEEThe Audit Committee is responsible for carrying out the audit functions required by paragraph 7.1.3R of the FCA’s Disclosure Guidance and Transparency Rules, details of which are included in the Audit Committee Report on pages 52 to 57 and are incorporated into this Corporate Governance report by reference.
NOMINATION COMMITTEEThe Nomination Committee is chaired by the Group Chairman and the members are independent non-executive directors. External consultants are generally used for new appointments. The Committee keeps the Board structure, size and composition, balance of skills and knowledge and experience (both executive and non-executive) under review and makes recommendations for any changes to the Board. The composition of the Board will continue to be reviewed during 2019.
The Committee’s terms of reference set out clearly its authority and duties and are available on the Company’s website at www.interserve.com and on request.
Overview of activitiesBusiness conducted during the year included recommendations to the Board for the re-election of retiring directors at the AGM, recruitment of a non-executive director and the membership composition of the Committee. The effectiveness of the Committee and its terms of reference were also reviewed.
Re-election of retiring directors at the AGMIn making its recommendation to the Board for the re-election of directors, the subject of “over-boarding” was considered by the Committee at the February 2018 Committee meeting. It reached the conclusion that all directors were sufficiently available to the Company. Moreover, the Committee considers these other directorships assist in bringing valuable knowledge and experience to Board and committee debate.
The Company’s policy relating to the terms of appointment and remuneration of the executive and non-executive directors is detailed in the Directors’ Remuneration Report on pages 58 to 67.
EffectivenessThe Committee also reviewed its effectiveness against its terms of reference and concluded that it continued to operate effectively. The Committee had access to sufficient resources (including access to the company secretariat) to enable the Committee to fulfil its duties.
Accordingly, it was concluded that the Committee was performing satisfactorily against its terms of reference.
Equality, diversity and inclusionThe Group’s Diversity Policy states that diversity in all its forms is fundamental to the Group’s business. It is available on our website at www.interserve.com/about-us/policies. The goal is to recruit, motivate, develop and retain outstanding people that reflect the diversity of the communities in which the Group operates.
47
Governance
Financial Statements
Strategic Report
Overview

Corporate governance continuedSuccession planningSuccession planning remains a key priority for the Board and, having established new leadership in 2017, a full talent review will take place in 2019 under the stewardship of the Committee to establish the current status of the talent pipeline and make recommendations to the Board as to how the business will attract and select candidates for Board and executive positions referencing a broader commitment to diversity and inclusion as required under the 2018 Code.
REMUNERATION COMMITTEE
The Remuneration Committee is composed entirely of independent non-executive directors, details of whom are set out in the table on page 46. The responsibilities of the Committee, together with an explanation of the work undertaken and how it applies the directors’ remuneration principles of the Code, are set out in more detail in the Directors’ Remuneration Report on pages 58 to 79 and are incorporated by reference into this Corporate Governance report.
CONTRACT AND INVESTMENT COMMITTEEThe Contract and Investment Committee (CIC) is composed of the Chief Executive Officer, the Chief Financial Officer and the Company Secretary. The CIC is responsible for deliberating and approving all new tenders involving bond and other security instruments based on an assessment of commercial terms, profitability and risk. Divisional managing directors submit standardised proposals to the CIC for new tenders, setting out the required credit support.
The Company Secretary and Treasury function maintain an up-to-date schedule of issued and upcoming instruments approved by the CIC which ensures an efficient and streamlined instrument administration process.
OTHER BOARD COMMITTEESThe Conflicts Committee comprises the Group Chairman or, in the event that he is interested in the matter to be considered, the Senior Independent Director, and the Company Secretary.
The General Purposes Committee comprises any two executive directors (one of whom must be the Chief Executive Officer or, in her absence, the Chief Financial Officer).
The Inside Information Committee comprises the Group Chairman, Chief Executive Officer and Chief Financial Officer.
The Private Finance Initiative (PFI) Committee comprises any two or more directors.
Each committee has written terms of reference and reports on the business conducted to the following Board meeting. Committee meetings held during the year are as follows:
Committee Number of meetings
Conflicts 1
General Purposes 18
Inside Information 20
PFI –
ACCOUNTABILITYFinancial and business disclosuresIn order to present a balanced assessment of the Company’s position and prospects, the Annual Report contains a Directors’ Responsibility Statement on page 87, an Independent Auditor’s Report about their reporting responsibilities on pages 88 to 99, a going concern statement on page 41 and a viability statement on pages 39 to 41. An explanation of the Company’s business model and strategy for delivering the Company’s objectives is set out on pages 16 to 20.
The Directors’ Report contained on pages 80 to 86, of which this Corporate Governance report forms part, contains the information required by paragraph 13(2)(c), (d), (f), (h) and (i) of Schedule 7 to the Large and Medium-sized Companies and Groups (Accounts and Reports) Regulations 2008 (as amended by The Companies Act 2006 (Strategic Report and Directors’ Report) Regulations 2013 and The Large and Medium-sized Companies and Groups (Accounts and Reports) (Amendment) Regulations 2013)).
Risk management and internal controlThe Board has documented a risk management framework setting out its objectives in terms of the risk management framework and risk appetite, risk management policy, risk oversight structures and accountability, risk identification and assessment, escalation, monitoring and reporting, and guidance on the application of the framework, which is included within the Group’s internal controls manual.
During the period under review, the Board commissioned an independent law firm to conduct a high-level review of the corporate governance arrangements of the Group in order to identify key features and mitigate any potential risks associated with Interserve’s governance systems, controls and processes in the context of its listed company obligations. It is intended that the review will be forward-looking and constructive and will involve interviews with key personnel from different functions within the business, in order to get a variety of perspectives. The outcome of the review is due to be presented to the Board in Spring 2019 and key findings and recommendations will be outlined in next year’s Annual Report.
The Board has carried out a robust assessment of the principal risks facing the Group, as required by the Code, during the period covered by this report and has not identified nor been advised of any failings or weaknesses in the operational or financial controls which it determines to be significant. Further details of the Group’s Principal Risks and Uncertainties, their potential to affect the business, how they are being mitigated and changes in the current risk and environment are set out in the Strategic Report on pages 31 to 34.
Because of the limitations that are inherent in any system of internal control, the Group’s system of internal control is designed to manage rather than eliminate the risk of failure to achieve business objectives, and can only provide reasonable, but not absolute, assurance against material misstatement or loss. The Group’s governance framework distinguishes between entities which are wholly controlled and joint ventures and associate companies in which the Group does not have overall control. For these joint ventures and associate companies, systems of internal control are applied as agreed between the Group and the other joint-venture parties or members of the associate company, as the case may be.
48
GOVERNANCE

Risk management frameworkThe Board has overall responsibility for the Group’s systems of risk management and internal controls, together with the ongoing review of its effectiveness, and sets appropriate policies having regard to the objectives of the Group.
Key decisions are reserved by the Board to itself. Other decisions are taken under various delegated authorities down through the management chain.
The Executive Team, under delegated responsibility from the Board, identifies, assesses, manages and monitors risk and operates and monitors the system of internal control and provides assurance to the Board that it has done so. The Risk Committee assists the Executive Team in discharging its risk management responsibilities.
The Risk Committee, comprising the Chief Financial Officer, Group Health, Safety and Environmental Manager, Group Insurance Manager, the General Counsel and Company Secretary (who is its secretary), the Director of Transformation, IT and People, the Group Information Security Officer and a representative from each of the Group’s operating divisions, met three times during the course of the year. The internal audit partner has a standing invitation to attend. The Committee has written terms of reference and provides copies of its meeting minutes to the Board.
Work undertaken by the Risk Committee included reviewing the Group’s prime risk areas1 and principal risks and uncertainties, providing a bi-annual risk and control report to the Executive Team, a programme of reviewing (on a divisional bottom-up basis) a selection of the Board’s key risks against the overall assurance map mapping (on a top-down basis) the three lines of assurance (management, functional oversight and independent internal reporting), receiving reports from the Information Security Forum, regular horizon scanning for risks presented by legal developments and forthcoming legislation, as well as changing business environments, reviewing business continuity planning, reviewing whistleblowing notifications and the results of subsequent investigations, and reviewing the Group’s readiness for the General Data Protection Regulation, which came into force in May 2018.
Risk committees have also been established by most divisions. These committees review risk at a divisional and business unit level, providing both reports to and attendance at the Risk Committee.
A review of the Risk Committee agenda and terms of reference is underway with the results to be outlined in next year’s Annual Report.
Risk oversight, structures and accountabilityThe risk and control framework is predicated on the basis that line management is best placed to ensure that appropriate risk management is being exercised to maintain risk within the constraints of the Board’s risk appetite.
The risk oversight structure mirrors the operating style and culture of the Group, devolving responsibility for operational risk mitigation controls to those best placed to supervise and ensure
their proper implementation. Divisional line management exercise oversight to manage risk appropriately and to ensure that the Board’s risk appetite is not being exceeded.
The Board’s risk appetite is cascaded throughout the Group indirectly by defined delegated decision boundaries and authority matrices. Certain key areas listed on pages 31 to 34 are subject to central management or control.
Best practice, procedure and, where appropriate, policies in the areas of information security, business continuity and human resources, are promulgated by specialist forums comprised of subject matter experts from across the business.
Risk identification and assessmentAs a normal part of Board business, consideration is given to any emerging or changing risks and whether these affect the strategy.
A thorough risk identification and assessment exercise is undertaken of the prime risk areas by the Risk Committee on a six-monthly basis. This review focuses on risks with the potential for material impact on the Group’s operational, financial or reputational standing. The review takes into account the latest divisional updates, actions taken, current performance against existing and any new key performance indicators and whether, as a result of the foregoing, the residual (net) risk of the prime risk area has changed since the last assessment.
The identification of risks associated with new business and associated risk controls/mitigation is part of the process for obtaining Board approval.
New and emerging risks are captured by divisional risk committee bi-annual risk reviews which are consolidated into the risk and control performance report by the Risk Committee. The Board also gives consideration to emerging risks as part of its bi-annual risk review and more generally as part of its ongoing consideration of the future development of the Group.
Escalating, reporting, monitoring and reviewMonthly management accounts, divisional board meetings, the March, May and September forecast reviews, monthly and quarterly safety and quarterly legal and insurance reports all provide an opportunity for emerging risks to be escalated.
Divisional boards are required bi-annually to review their risk matrices, in January/February and June/July, to facilitate aggregation ahead of the release of the annual and half-year results.
Divisional management monitor the implementation, operation and efficacy of the risk management procedures within their division. Improvements implemented by divisional management are reported as part of the bi-annual risk reviews.
The Executive Team and the Board monitor risk as part of their monthly review of trading.
The internal audit function also undertakes a rolling review of the effectiveness of the internal control and risk management procedures as part of its annual work programme. Divisional risk and assurance resources have also been increased to support this work.
1 The Group’s prime risk areas are sub-sets of and have been mapped to the Principal Risks and Uncertainties set out on pages 31 to 34 of the Strategic Report and are matters which, if not appropriately managed, may to lead to events which breach the Board’s risk appetite.
49
Governance
Financial Statements
Strategic Report
Overview

Corporate governance continuedThe Board performs a formal assessment of the effectiveness of the risk management process twice a year prior to publication of the half-year and annual results, taking into account the risk and control performance report from the Executive Team.
The Board has an ongoing process for identifying, evaluating and managing principal risks that the Group faces, together with an ongoing process to embed internal control and risk management within the business operations. This process was in place for the period under review and up to the date of approval of this Annual Report and Financial Statements and the systems accord with the FRC’s guidance on Risk Management, Internal Control and Related Financial and Business Reporting.
Control effectivenessDivisional boards undertake an ongoing assessment of, and effect improvements to, the control environment, and report their actions through the bi-annual risk review process.
The internal audit function assesses the effectiveness of certain internal control and risk management procedures as part of its annual work programme.
Enhancements to the risk management process include the development of an assurance map which identifies the three lines of assurance (management, functional oversight and independent internal reporting) over the prime risk areas. This enables the Board to make an informed assessment of the appropriateness of assurance.
Financial reportingBased on submissions from the trading divisions, a budget is prepared for approval by the Board before the start of each financial year. Subsequently, forecasts of prospective financial performance are prepared as at the end of March, May and September of each year. Budgets and forecasts include the financial results, financial position and cash flows for each division and Group Services.
The Group has risk management systems and documented accounting policies and procedures to be applied by all entities in the Group in submitting their financial statements for consolidation to ensure that adequate accounting records are maintained and transactions are recorded accurately and fairly to permit the preparation of consolidated financial statements in accordance with International Financial Reporting Standards.
Each month, every entity within the Group submits management accounts in local currency to the Group Finance team. The consolidated management accounts include the financial results, financial position, cash flows and projections and are submitted, along with analytical commentary, to the Executive Team and subsequently the Board for review.
The management accounts for June and December are used to prepare the half-yearly and annual financial statements. The Group Finance team reviews the disclosures in the financial statements to ensure that they comply with applicable reporting standards. The half-yearly and annual financial statements are reviewed by the Executive Team, the Audit Committee and the Board before publication.
The financial reporting process is reviewed periodically by internal audit in accordance with the programme approved by the Audit Committee each year.
A summary of the key financial risks inherent in the Group’s business is given on pages 38 and 39 and a description of how the Group manages those risks is set out on page 32.
Operational controlsThe principal features of the Group’s system of operational control are:
• An established management structure comprising the Board with its various committees and the Executive Team.
• Executive Team and Board review of the monthly finance and divisional trading reports.
• Documented delegated authority limits which are kept under regular review. Larger value proposals and business acquisitions and disposals are controlled by the Board.
• All Group companies operate detailed tendering procedures designed to ensure effective risk management when tendering for high-value projects or projects with difficult conditions, onerous obligations, guarantees, bonds and adverse cash flow conditions which are monitored by the relevant Executive Team member and, where appropriate, in conjunction with the Chief Executive Officer.
• Manuals setting out Group policy and procedures, with which all Group companies must comply.
• The Group has certain key areas which are subject to central management or control, which include health, safety and environmental policies, legal, insurance, tax and treasury, real estate, internal and external communication, investor relations, information technology network services and operating systems, human resources, motor fleet and company secretarial. These functions report to members of the Executive Team.
• During the course of each year members of the Executive Team or other senior operational and financial management visit or review all trading companies to discuss and monitor the performance of those businesses.
• The Group has in place a whistleblowing policy which sets out a framework for dealing with any allegations of fraud, financial misreporting and any whistleblowing notification. A copy of the policy is available on the Company’s website at www.interserve.com.
RELATIONSHIP WITH STAKEHOLDERSThe main communications with financial investors are the half-year and annual results presentations including sessions with some investors which normally take place after the results are announced. The results presentations are posted on our website and are available for all investors to view, along with a recording of the presentations themselves. A live webcast of the capital markets day was publicised via the Regulatory News Service (RNS) and copies of the presentations were made available on the Company’s website.
The Company also encourages two-way communication with both institutional and private investors to develop an understanding of the views of major shareholders about the Company.
The Group Chairman met with eight of the Company’s major shareholders in order to gain an understanding of their aspirations for the Company and to afford them the opportunity to give their views. The key themes emerging from these meetings were then fed back to the Board.
50
GOVERNANCE
During the year ended 31 December 2018 Debbie White and Mark Whiteling attended 30 meetings with analysts and institutional investors and, respectively, 16 and 54 individual meetings, accompanied by other staff members.
One-to-one post-results meetings held with institutional investors tend to focus on such matters as Group strategy, operational performance, market trends, macro-economic influences, financial performance, merger and acquisition ambitions, peer group issues, the political environment and progress of key bids and key contract renewals. Meetings held with analysts focus on the foregoing issues and, in addition, the key factors which influence analysts’ financial forecasts, with a view to ensuring market consensus is based on accurate and up-to-date information, properly interpreted.
On 6 February 2019, Interserve announced it had received a letter from Coltrane Master Fund, L.P., a shareholder holding in excess of five per cent of the paid-up capital of the Company, requisitioning a General Meeting of the Company’s shareholders. On 26 February 2019, Interserve published a shareholder circular, as required by the Companies Act, giving notice of a General Meeting convened for 26 March 2019 at 1.00 p.m. at which the Coltrane resolutions will be proposed. The Board is recommending unanimously that shareholders vote against the Coltrane resolutions as they intend to do so in respect of their own shareholdings accounting for approximately 0.54 per cent of the issued share capital of the Company.
Engagement with lenders Having due regard to their importance as stakeholders, we also undertake regular one-to-one meetings and group presentations with our bank and private-placement lenders, in which operational, strategic and market issues are discussed, together with the implications for our future financing requirements in the context of the Deleveraging Plan.
The Group’s annual and half-yearly results, trading updates, presentations given to analysts and all announcements made through the RNS are published on the Company’s website at www.interserve.com.
All shareholders are given at least 21 clear days’ notice of the AGM. It is standard practice for all directors to attend the AGM to which all shareholders are invited and at which they may put questions to the chairs of the various committees or the Board generally. The voting results of the AGM are announced through the RNS and posted on the Company’s website shortly after the close of the meeting.
APPROVALThis report was approved by the Board of Directors on 8 March 2019 and signed on its behalf by:
Glyn BarkerChairman8 March 2019
51
Governance
Financial Statements
Strategic Report
Overview

Audit Committee report
Dear Shareholder
I am pleased to present, on behalf of the Board, our Audit Committee Report on our work in relation to the financial year ended 31 December 2018.
2018 has been another challenging year for the Company with the recognition of difficult trading conditions and refinancing needs.
The Committee was also focused on trading judgements and estimates which underpin our revenue and margin on long-term construction and service contracts, and the operational management and risk processes which were strengthened during the period, which included the appointment of a Group Construction Risk Manager to review and report on Construction Contract risks.
A key focus for the Committee in finalising the annual results has been to challenge, test and validate the Company’s going concern and viability statements and to provide assurance to the Board in making these statements.
In making this assessment the Committee recognises that there is a material uncertainty in relation to the approval of the Deleveraging Plan by shareholders and failure to secure shareholder approval represents a material uncertainty that may cast significant doubt over the ability of some or all of the Group to continue as a going concern.
Based on current expectations, and on the basis that the directors continue to expect a successful completion of the financial restructuring and with no unforeseen deterioration in the remaining EfW projects, the Committee considers it appropriate to continue to adopt the going concern basis in preparing the financial statements.
In addition to going concern and viability, long-term contracts, and revenue and margin recognition, we also focused on measurement presentation and disclosure of non-underlying items, carrying value of goodwill and intangibles, retirement benefit accounting and judgements on borrowings.
Having reviewed the Annual Report, the Committee considers that, taken as a whole, it is fair, balanced and understandable and provides the information necessary to assess the Group’s strategy, business model, position and performance.
Anne FahyChair of the Audit Committee
Anne FahyChair of the Audit Committee
52
GOVERNANCE

MEMBERSHIPThe Audit Committee is responsible for carrying out the audit functions required by paragraph 7.1.3R of the FCA’s Disclosure Guidance and Transparency Rules (DTR). It is composed entirely of independent non-executive directors, in accordance with the provisions of the UK Corporate Governance Code published in April 2016 (the Code) and has been chaired by Anne Fahy since 13 May 2013. The directors who have served on the Committee during the year are:
Name Date of appointment to Committee
A K Fahy (Chair) 1 January 2013
G M Edwards 23 June 2017
R J King 1 September 2014
C N Pollard 26 June 2018
N R Salmon 1 August 2014
Appointments to the Committee are made by the Board, on the recommendation of the Nomination Committee and in consultation with the Committee Chair. Keith Ludeman stepped down from the Committee and Board on 12 June 2018. Nick Pollard was appointed to the Board and the Committee on 26 June 2018.
Anne Fahy is a qualified chartered accountant and has significant, recent and relevant financial experience. The other members of the Committee all have extensive business and financial experience in multinational and/or complex organisations and a good understanding of the Company’s business. The Committee, as a whole, is therefore considered by the Board to be competent. The biographies of the Committee members are set out on pages 42 and 43.
The Company Secretary is secretary to the Committee.
MEETINGSThe Committee met six times during the year. Members’ attendance at the meetings is set out in the table on page 46. The external auditor was present at all of the meetings and representatives from PricewaterhouseCoopers LLC (PwC), the provider of the internal audit function, were present at four of the meetings. The Group Chairman, Chief Executive Officer, Chief Financial Officer and Group Financial Controller also attended the majority of the meetings by invitation.
The Committee has, on two occasions, taken the opportunity to seek the views of the external auditors in private. Both the external and internal auditors have the opportunity to address the Committee in private at any time should they so wish. In addition, the Chair met frequently with both parties to review audit and internal control topics and to ensure open and continuous dialogue with the Committee.
ROLE AND RESPONSIBILITIESThe role and responsibilities of the Committee are set out in its terms of reference which are available on the Company’s website at www.interserve.com and on request. These terms of reference, which include all matters described in the Code and paragraph 7.1.3 of the DTR, are reviewed at least annually by the Committee and were last updated in December 2017 when no further changes were considered necessary.
The principal responsibilities of the Committee are to:
• review with management and the external auditor the Group’s Annual Report and consolidated financial statements and the Half-Year Report and any formal announcements relating to the Group’s financial performance based on the statutory audit or half-yearly review, as the case may be, before submission to the Board;
• review the Annual Report and advise the Board as to whether, taken as a whole, it is fair, balanced and understandable and provides the information necessary for shareholders to assess the Company’s position and performance, business model and strategy;
• make recommendations to the Board on the appointment and re-appointment of the external auditor, take responsibility for reviewing the scope and effectiveness of the statutory audit and agreement of the fees in respect of both the statutory audit and non-audit services provided by the external auditor;
• review and monitor the appropriateness of the provision of non-audit services by the external auditor in the context of reviewing the auditor’s independence;
• approve the annual work programme of the internal auditor, the fees to be paid in connection with that work and review the effectiveness of the internal audit process;
• provide an independent overview of the integrity of the Group’s systems of internal control, fraud prevention, compliance, whistleblowing, prevention of bribery and corruption, risk management and financial reporting processes through the co-ordination and supervision of the quality, independence and effectiveness of the internal and external auditors, reviewing the Company’s financial reporting and making further enquiries as appropriate; and
• report to the Board on how it has discharged its responsibilities.
The effectiveness of the Company and the Group’s internal control and risk management systems is reviewed and monitored throughout the year by the Board, as set out in the Corporate Governance report on pages 44 to 51.
A full set of Committee papers is provided to all directors and the Chair of the Committee reports at the subsequent Board meeting on the Committee’s work. The Board also receives a copy of the minutes of each meeting.
OVERVIEW OF ACTIVITIESIn relation to the 2018 financial year the Committee:
• continued monitoring the principal elements of management’s recommendation regarding the EfW cost provision together with all other items categorised as non-underlying (further details of which are included under Significant Issues Considered on pages 54 and 55) ensuring the measurement, presentation and disclosure were consistent with the Company’s disclosed accounting policy and with FRC guidance and were clearly explained, reconciled to statutory measures and consistent with fair, balanced and understandable principles;
• received an update from the Finance Transformation Manager on progress being made on the Finance Transformation workstream under the Fit for Growth transformation programme;
• requested that the newly-appointed Chief Construction Risk Executive conduct a review of Construction contracts and provisions (which is in progress);
53
Governance
Financial Statements
Strategic Report
Overview
Audit Committee report continued• requested the Company Secretary conduct a best practice
review of the Group’s whistleblowing process. The review demonstrated the benefits of an Independent Whistleblowing System which the Company is now implementing with an external provider;
• received a report at each meeting on the progress and outcome of the investigation of the 12 whistleblowing notifications received during the course of the year, three of which were upheld and four where investigations continue;
• requested an on-boarding session for Nick Pollard, a newly-appointed Committee member, with the Internal Audit Partner at PwC as part of his wider induction programme;
• reviewed a management paper supporting the going concern and viability statements and satisfied itself as to the appropriateness of the underlying assumptions, ensuring consistency with the Group’s longer-term planning and annual budgeting cycle financing arrangements and any material contingent risks, as well as ensuring appropriate disclosure of judgements and uncertainties;
• received a briefing from the Chief Financial Officer on the principal judgements made in determining the half-yearly review and Annual Report, reviewed and questioned those judgements in the light of operational performance and other evidence and, taking into account the external auditor’s view, satisfied itself that the judgements and estimates were both appropriate and robust and in accordance with the Group’s accounting policies;
• reviewed both the Half-Year Report and Annual Report and Financial Statements. As part of each review the Committee satisfied itself as to the clarity and completeness of disclosures in the financial statements and that they were appropriately contextualised. It also reviewed the Audit Committee Report, together with the Chairman’s Statement, Strategic Report and Corporate Governance statement relating to audit and risk management. As part of each review the Committee received a report from the external auditor on their audit of the Annual Report and review of the Half-Year Report, respectively;
• reviewed, prior to their consideration by the Board, the representation letters to be given to the external auditor in respect of the half-yearly review and the Annual Report;
• conducted an assessment of the effectiveness of the external audit process, as detailed on pages 56 and 57;
• reviewed the independence and objectivity of the external auditor, as detailed on page 56;
• reviewed and approved the external auditor’s terms of engagement for the half-yearly review and for the audit of the Annual Report;
• considered and agreed the scope, focus and fees to be paid to the external auditor for the half-yearly review and the statutory audit;
• reviewed and updated the Company’s policy on the provision of non-audit services by the external auditor and regularly monitored non-audit fees in comparison to the audit fees in accordance with this policy (as detailed in Objectivity and Independence on page 56);
• regularly reviewed both the external and internal audit risk assessments and satisfied itself that the audit activities appropriately addressed those risks;
• reviewed both the internal audit programme and the findings and remediation actions, ensuring an adequate coverage of risks (as detailed on page 57). A draft 2019 internal audit plan has been agreed for the first half of the year, with flexibility maintained to adapt to changes as the Company’s transformation and Fit for Growth programmes continue to evolve;
• established the Committee’s calendar of actions for the 2019 financial year; and
• received, considered and reviewed management’s response to the FRC in respect of correspondence received in connection with queries raised regarding the 2017 financial statements and ensured agreed recommendations were implemented.
An independent evaluation of the Committee’s effectiveness is included within the independent board evaluation process that is due to report in 2019, as detailed in the Corporate Governance Report on page 47.
SIGNIFICANT ISSUES CONSIDEREDThe Committee reviewed the key judgements applied in the preparation of the consolidated financial statements which have been prepared in accordance with the accounting policies and detailed notes to the financial statements on pages 106 to 158 as well as considering the overall quality of earnings. The Committee received a paper, prepared by management, setting out the key judgements and reviewed and challenged these in the light of its own knowledge, taking into account the audit findings and views of Grant Thornton and further enquiry of executive management, as appropriate, in relation to the following matters:
Going concern and viability statement Following the recognition of difficult trading conditions and refinancing needs, the Board and Committee were vigilant throughout the period to ensure the Company remained solvent, was able to meet its liabilities as they fell due and had sufficient liquidity in place at all times. Management prepared cash flow forecasts, financing arrangements, covenant tests and assumptions together with sensitised cases and various stress test scenarios. These, together with the audit findings, were reviewed in detail by the Committee. It was noted that the forecasts, which were reviewed by advisers, were prepared on the assumption that the Deleveraging Plan would be successfully concluded. This is contingent on approval of the Plan by 50 per cent of shareholders on 15 March 2019. Based on the current expectations, and on the basis that the directors continue to expect a successful completion of the financial restructuring, the Committee considers it appropriate to continue to adopt the going concern basis in preparing the 2018 accounts as disclosed in the Basis of Preparation section on page 106.
The Company has set out a comprehensive viability statement in the Strategic Report on pages 39 to 41 and describes very clearly the principal risks, judgements, uncertainties and planning assumptions underpinning this statement as well as the key covenant compliance requirements of the refinancing agreements. In considering and in support of the viability statement executive management had overlaid various sensitivities and stress tested the three-year business plan and compared these outcomes both in terms of liquidity and covenant compliance headroom.
54
GOVERNANCE

Revenue, margin recognition and contract accountingThe recognition of revenue and profits on long-term construction and service contracts requires management to exercise significant levels of judgement involving a high degree of disciplined governance and control. For construction-type contracts the key judgement concerns the recognition of profits appropriate to progress and risk, the recovery of work-in-progress and debtors, especially with respect to the risks of any non-certified amounts (including variations and claims) and forecast timescales and commercial outcomes. For service-type contracts the key accounting risk is that the revenue and costs are not recognised in the correct period and provisions are not made for losses whenever foreseen. For contracts in the Equipment Services division, where revenue is recognised on either the sale of equipment or over the period of an equipment hire, the key accounting risk relates to whether the appropriate cut-off for sales and period of hire has been applied and the recoverability of debtors.
The Committee reviewed the level of provisioning made by management at both contract level and centrally at the year end in order to form a view of the completeness of provisions on loss-making contracts and whether there was a requirement to include a forward-loss provision on longer-term contracts. The quality of earnings and movement in provisions during the course of the year was also reviewed.
During the year the Committee considered management’s approach to the adoption of the new IFRS 15 Revenue standard and satisfied itself that the accounting treatments and the required financial statement disclosures have been suitably addressed in the year-end 2018 Group financial statements (see pages 37 and 38 for further details on IFRS 15 adoption).
As part of this review, the Committee considered the significant contracts set out in the Key Estimates and Judgements in note 1(b) to the consolidated financial statements on pages 107 to 111 and assured itself as to the reasonableness of the estimates and judgements made in respect of these contracts.
Non-underlying items – measurement, presentation and disclosureManagement, as part of its presentation to the Committee on its principal judgements and estimates, covered the basis on which non-underlying items were being accounted for and disclosed in the year-end 2018 financial statements. The Committee also reviewed recent recommendations from the FRC on our accounting definitions and financial statement disclosures of non-underlying items and has satisfied itself that management have addressed these points appropriately in the year-end 2018 Group financial statements. Supported by views, analysis and insights from our external auditors and taking into account our knowledge and understanding of the items treated as non-underlying, the Committee concluded that both the basis of recognition and the presentation in the financial statements were appropriate. In addition, the Committee ensured that the disclosures relating to non-underlying items were fair, balanced and understandable throughout the financial statements.
Carrying value of goodwill and other intangible assetsThe carrying value of goodwill and other intangible assets on the balance sheet at the year end was £373.2 million, which included goodwill with a value of £342.3 million.
The majority of goodwill and other intangible assets is held within UK Support Services and arises mainly from private-sector related acquisitions.
The Committee reviewed management’s determination of its principal cash generating units, the key assumptions used, such as the discount rate and future cash flows in light of current business performance and that future projections were consistent with medium-term plans, and satisfied itself of the appropriateness of management’s impairment testing. As a result, goodwill of £26.9 million relating to the private-sector business in Support Services was impaired in 2018. This is principally due to an underperformance against pre-acquisition expectations primarily due to competitive pricing, impact of regulatory labour cost increases, customer churn and cost synergies not fully delivered, together with an increase in its risk-adjusted discount rate from 10.3 per cent in 2017 to 11.8 per cent in 2018. In addition, a further impairment of £6.2 million was recognised on the Support Services Learning and Education CGU due to under-performance of this business against the three-year plan targets and as a result of the increase in its risk-adjusted discount factor from 10.3 per cent in 2017 to 11.8 per cent in 2018.
Otherwise, the Committee assured itself that significant headroom exists on other cash generating units and that any reasonable sensitivity to the assumptions did not indicate additional impairment.
Retirement benefit accounting Calculation of the retirement benefit asset/obligation requires management to make a number of assumptions including the selection of an appropriate discount and mortality rate.
The Committee satisfied itself as to the reasonableness of the assumptions set out in note 29 to the consolidated financial statements, taking into account the independent third-party confirmations of the pension assets valuation at the balance sheet date and that pension balances are accounted for in accordance with relevant accounting standards and guidance.
Accounting for new long-term borrowings Accounting for debt restructuring under the new IFRS 9.
On 27 April 2018 the Group re-negotiated its existing credit facilities which consisted of the renewal of existing Revolving Credit Facilities (RCF) of £388.6 million and $350 million of US$ Loan Notes and obtaining £175 million of new Term Loans (LIBOR + 8.75 per cent) together with £21.5 million of Money Market lines. These renewals of the RCF and US$ Loan Notes (together, the April 2018 Refinancing) were at significantly higher rates of interest than previously (LIBOR + 6.43 per cent for RCF versus average of LIBOR + 2.8 per cent in 2017) and 7.61 per cent for the US$ Loan Notes versus average of 5.6 per cent in 2017.
The Committee concluded that, based on the information provided by management and input from the external auditors, the changes in the terms of the Override Agreement constituted a substantial debt modification under IFRS 9 and therefore existing loans were de-recognised and new loan balances were recognised. The substantially modified debt was initially recognised at fair value, calculated based on the expected present value of future cash flows, discounted at an effective interest rate reflecting the Group’s cost of borrowing. Management’s view, with which the Committee concurs, is that the effective rate of interest on the loan was consistent with the market rates existing in April 2018.
55
Governance
Financial Statements
Strategic Report
Overview

Audit Committee report continuedFAIR, BALANCED AND UNDERSTANDABLE FINANCIAL STATEMENTSThe directors are responsible for preparing the Annual Report. At the request of the Board the Committee considered whether the report and accounts, taken as a whole, was fair, balanced and understandable. In making that assessment, the Committee took into account whether the report and accounts provided the necessary information for shareholders to assess the Company’s position and performance, business model and strategy.
In reviewing and conducting our enquiries we, amongst other activities, challenged the criteria and consistent application in classifying, measuring and disclosure of non-underlying items, we focused on the outlook statements to ensure consistency with our collective understanding and interpretation of the Company’s recent and anticipated performance and satisfied ourselves that risks and mitigations were appropriately disclosed.
The Committee was satisfied that, taken as a whole, the 2018 Annual Report was fair, balanced and understandable and contained the information set out above and reported accordingly to the Board. The Board’s statement in this regard is set out on page 87.
EXTERNAL AUDITOversightThe Committee considers and makes recommendations to the Board as regards audit matters. The Committee manages the relationship with the Company’s auditor, which includes a review of the effectiveness of the statutory audit at the end of the audit cycle, agrees, for and on behalf of the Board, the statutory audit fees and scope of the statutory audit and makes recommendations to the Board as to the auditor appointment or re-appointment. The Committee also seeks to ensure co-ordination between the activities of the external and internal auditors.
TenureGrant Thornton was formally appointed as the Company’s auditor on 13 June 2014 following a competitive tender exercise involving four audit firms at the end of the 2013 statutory audit and approval by shareholders at the 2014 AGM. Based upon the review of audit effectiveness, the Committee has recommended to the Board that Grant Thornton be re-appointed for the sixth year as the Company’s independent auditor to carry out the audit for the 2019 financial year.
Grant Thornton rotated their Audit Engagement Partner during the year after Simon Lowe had completed four out of a maximum of five years in post and to facilitate both continuity and independence in future years. The new Audit Engagement Partner is Phil Westerman, who attended his first Committee meeting in July.
The Committee will continue to review the auditor appointment and the need to ensure that the Group complies with the provisions of The Statutory Audit Services for Large Companies Market Investigation (Mandatory Use of Competitive Tender Processes and Audit Committee Responsibilities) Order 2014 made by the Competition and Markets Authority (the CMA Order) relating to mandatory audit tenders every 10 years and rotation after 20 years.
Objectivity and independenceThe Company has an established policy aimed at safeguarding the independence and objectivity of the Group’s external auditor. The policy sets out the approach to be taken when considering engaging the external auditor for non-audit work. There is no inconsistency between the FRC Revised Ethical Standard 2016 and the Group’s policy.
The external auditor may carry out certain categories of non-audit work in areas that have been pre-approved by the Committee up to a monetary limit of £150,000 per transaction. Any other work for which management may wish to instruct the external auditor with a value not exceeding £250,000 must be approved in advance by the Committee or, more normally, by the Committee Chair on its behalf. Instructions above £250,000 require prior approval of the Board. The pre-approved services may be summarised as follows:
• assurance services; and
• audit reports required by statute or regulation.
The above policy also prohibits the auditor auditing their own work or entering into any arrangement in relation to audit work whereby a joint interest is created between the Company and the auditor, without the Committee’s prior consent.
The Committee received a report at each of its meetings itemising the fees expended and forecast to be expended with Grant Thornton for non-audit services. In addition to the above safeguards, a minimal amount of non-audit services was delivered by specialists and advisers who were independent of the audit team.
Non-audit fees incurred for the year were £0.1 million (3 per cent) compared to audit fees of £3.0 million (including £1.3 million of year-end 2017 additional fees billed), the largest element of which - £0.1 million - related to the interim 2018 review. Further details of the audit and non-audit fees paid to Grant Thornton are included in note 4 to the consolidated financial statements on page 122. In 2019 Grant Thornton were engaged as reporting accountants to provide services in relation to the Deleveraging Plan and fees relating to this service are estimated at £1.8 million. Provision of these services are not prohibited by the Ethical Standard.
The Committee concluded that the safeguards set out above were sufficient so as not to compromise auditor objectivity and independence.
Effectiveness and audit qualityThe Committee reviewed Grant Thornton’s audit effectiveness following the audit of the 2017 Annual Report, taking into account:
• the partners’ and senior audit staff’s understanding of the business;
• the effectiveness of the audit work in relation to key judgements and how those were addressed;
• the quality of suggested control improvements;
• the appropriateness of assurance gained over parts of the Group not audited by Grant Thornton;
• the appropriateness and deployment of experts on technical items;
56
GOVERNANCE

• the quality and comprehensibility of the audit findings reports;
• the quality and clarity of the auditor’s external report; and
• feedback from senior management on the audit process generally.
In addition, the Committee reviewed the FRC’s 2017/18 Audit Quality Inspection (AQI) of Grant Thornton and discussed its findings with the Audit Engagement Partner as well as satisfying itself as to the adequacy of the firm’s internal quality assurance processes.
The Audit Engagement Partner has direct access to the Chair of the Committee and they meet on a regular basis in addition to the formal committee process. On 21 February 2019, the Committee received the FRC report following completion of their review of the Grant Thornton 2017 audit file and will be reviewing and discussing the findings and proposed actions with the auditors.
INTERNAL AUDITThe internal audit function provides an independent and objective appraisal to the Board, through the Committee, of the adequacy and effectiveness of the processes established to manage risk and control the business, makes recommendations on how the system of internal control might be improved, assists the Board in meeting its objectives and discharging its responsibilities and also provides certain advisory reports on business initiatives in support of management initiatives. The Internal Audit function is outsourced to PwC assuring a further level of independence.
The annual internal audit plan of work, submitted to the Committee each December for approval, is risk-based and designed to provide core assurance against those areas identified as high risk and deliver cyclical reviews of key business activities, financial reporting processes and medium-risk areas. The annual plan for 2018 was reviewed and refreshed, subject to agreement by the Committee, at the half year to ensure it remained relevant and focused and in the context of the current financial and operational restructuring of the Group.
Specialist subject matter experts are engaged where appropriate across many reviews to address areas such as engineering and commercial issues, VAT, employment law, IT, business continuity, culture and behaviour, working capital and information security. The 2018 plan focused on Fit for Growth savings, key financial controls across the Group, and controls over the utilisation and reporting of information on the contracts with large forward-loss provisions.
The Committee received full copies of each internal audit review undertaken during the year comprising a set of findings, proposed corrective actions, management’s responses to those findings and, where appropriate, recommendations for improvements.
Closure of the agreed corrective actions was tracked via a web-based system and monitored by management, with progress reported to the Committee in July 2018, December 2018 and February 2019.
In 2018 Internal Audit refreshed the controls self-assessment checklist that is used by the Group to monitor controls across 11 business processes. In November 2018 the Chief Financial Officer requested each of the Divisional Finance Directors to complete the updated self-assessment checklist for their divisions and to submit the results to Group Finance.
The results were collated and presented to the December 2018 Audit Committee by the Chief Financial Officer. Group Finance will use the outputs of the exercise to support control improvement plans as part of the transformation activities in 2019.
Internal Audit will consider the results of management’s self-assessment alongside the delivery of internal audit work in related areas during 2019.
A draft 2019 internal audit plan has been agreed for the first half of the year but with flexibility maintained to adapt to changes as the Company’s transformation continues.
The Committee also monitored, reviewed and assessed the role and effectiveness of internal audit in the overall context of the Group’s risk management system and review.
The Internal Audit Partner has direct access to the Chair of the Committee and they meet on a regular basis in addition to the formal committee process.
REVIEWThe Committee confirms that it has fulfilled its responsibilities during the year in relation to, and confirms the Group is in compliance with, The Statutory Audit Services for Large Companies Market Investigation (Mandatory Use of Competitive Tender Processes and Audit Committee Responsibilities) Order 2014.
AGMThe Chair of the Audit Committee will be available at the AGM to answer questions about the work of the Committee.
APPROVALThis report was approved by the Board of Directors on 8 March 2019 and signed on its behalf by:
Anne FahyChair of the Audit Committee8 March 2019
57
Governance
Financial Statements
Strategic Report
Overview

Directors’ remuneration report
Dear Shareholder
On behalf of the Board, I am pleased to present the Remuneration Committee’s annual report on directors’ remuneration for the year ended 31 December 2018 which sets out the amounts earned by the directors under the Remuneration Policy approved by shareholders at the 2018 AGM. This is my first time of writing to you as Chair of the Remuneration Committee. I took over from Keith Ludeman following the AGM on 12 June 2018 when he stepped down from the Board.
ALIGNMENT OF REMUNERATION WITH STRATEGY Our current Remuneration Policy was approved by over 97 per cent of our shareholders at last year’s AGM. The policy is a conventional remuneration structure that includes separate annual and long-term incentives albeit with a weighting towards long-term performance. This structure is fully aligned with Interserve’s businesses which require operational excellence in the short term to support the delivery of long-term contracts with our customers.
We made minimal changes to the policy at the AGM given that it already included standard ‘best practice’ features such as 200 per cent of salary share ownership requirements, recovery and withholding provisions and a two-year holding period on vested long-term incentive award shares.
Our future approach on remuneration is likely to be influenced by the imminent deleveraging event and the Committee will be keeping this matter under review to ensure the Company has a policy that is aligned with stakeholder objectives and the Company’s strategy.
2018 REMUNERATION PAYMENTSAs detailed in the Strategic Report, notwithstanding the challenging external environment, 2018 was a year of significant progress. We achieved a successful refinancing in April, and the business traded robustly and continued to win major new contracts. Our Fit for Growth programme is delivering material cost savings and a simpler and more effective business structure.
In addition to the above, we also made good progress in relation to positioning the Group for long-term sustainable success. We moved much closer to closing out and exiting the Energy from Waste (EfW) business and we continued the discussions with our lenders to reach agreement on key terms of a proposed Deleveraging Plan which was announced in February.
Annual Variable Pay The annual bonus targets set at the start of 2018 were equally weighted against a challenging range of operating profit, operating cash flow and strategic targets. These targets reflected the Group’s key operational priorities for the year.
An element of the profit and strategic targets were met, but neither were achieved in full. In particular, whilst elements of the strategic targets set in relation to EfW were achieved, the Committee considered it appropriate given the wider context of EfW that no vesting should be attributed to this element.
Full details of the annual bonus targets initially set, and performance against them, are set out on pages 70 and 71. The Committee has not yet approved any bonus payments and has a discretion over the quantum of any payments made. It will consider the exercise of this discretion in finalising any awards after the outcome of the deleveraging event is known. It is anticipated that any bonuses would be paid in April/May.
Long-term variable pay 2016 Performance Share Plan (PSP) awardsThe long-term incentive awards granted in 2016 were eligible to vest based on independent, challenging three-year normalised EPS1 and relative total shareholder return (TSR) targets (versus the FTSE 250, excluding investment trusts).
Under the EPS element of the award, the threshold performance target was not met. With regards to our relative TSR performance, we were below the median when compared against the peer group and so this target was also missed. Accordingly, there will be no vesting in relation to the 2016 long-term incentive award.
As disclosed last year, we granted PSP awards in 2018 with challenging targets based on relative TSR, cumulative operating profit and strategic targets linked to the business transformation plan. Details of the specific performance targets are set out on pages 75 and 76.
Base salariesDetails of the executive directors’ salaries are set out on page 68. There was an increase of circa two per cent in executive directors’ base salaries during the year under review. This was consistent with the typical increase awarded to the general salaried workforce.
Nick Salmon Chairman of the Remuneration Committee
1 Normalised EPS is headline EPS adjusted to reflect growth in underlying value created by (a) removing the impact of IAS 36 Impairment of assets and IAS 39 Financial instruments; and (b) recognising or removing “one-off” events at the judgement of the Committee.
58
GOVERNANCE

APPLICATION OF REMUNERATION POLICY IN 2019As noted above, the Remuneration Policy will be reconsidered after the deleveraging event in consultation with major shareholders and, if changed, submitted for shareholder approval.
Annual Variable Pay Under the current policy, executive directors are eligible for Annual Variable Pay of up to 125 per cent of basic salary in the case of the Chief Executive Officer and the Chief Financial Officer and 100 per cent of basic salary in the case of other executive directors. Part of the bonus is subject to deferral into Interserve shares, and recovery and withholding provisions will apply.
Long-term variable pay Under the current policy, executive directors may be awarded up to 150 per cent of basic salary.
Following the announcement of the deleveraging proposal, the Committee is currently in the process of considering the implications on 2019 long-term incentive awards both in terms of the potential quantum of award and the associated performance targets.
The expectation is that any variable pay awards will be subject to performance conditions that are aligned with our key objectives, including delivering long-term profitability, returns for shareholders and delivering against the Board’s long-term transformation plan.
Developments in corporate governanceThe Committee has monitored developments in corporate governance over the course of 2018 and has reviewed the new legislation on remuneration reporting and the 2018 UK Corporate Governance Code. These matters will be given further consideration during 2019. We will, for example, undertake further work to determine the most appropriate method of disclosing the ratio of CEO pay to the pay of our UK employees, in line with the new regulations. In line with the 2018 Code, we will also engage with the workforce to explain how executive remuneration aligns with wider company pay policy. We will formally report against these matters next year.
Shareholder engagementThe Committee is committed to maintaining an ongoing dialogue with shareholders on the issue of executive remuneration and we welcome any further feedback you may have.
We look forward to your support on the resolutions relating to remuneration at the 2019 AGM.
On behalf of the Remuneration Committee
Nick Salmon Chairman of the Remuneration Committee
59
Governance
Financial Statements
Strategic Report
Overview

In this section:
Page
REMUNERATION POLICY
Executive directors’ remuneration policy 60
Terms of appointment and remuneration policy for non-executive directors 67
ANNUAL REPORT ON REMUNERATION
How the Remuneration Policy will be applied in 2019 68
How the Remuneration Policy was applied in 2018 68
Governance and operation of the Remuneration Committee 78
REMUNERATION POLICYThis part of the report sets out the Company’s Remuneration Policy, which was approved by shareholders at the AGM on 12 June 2018 and which took effect from that date.
EXECUTIVE DIRECTORS’ REMUNERATION POLICYThe following table summarises the main elements of the executive directors’ remuneration policy, the key features of each element, their purpose and linkage to our current strategy. Details of the remuneration arrangements for the non-executive directors are set out on page 67.
Element of pay Purpose and link to strategyHow operated in practice (including framework for assessing performance) Maximum opportunity
Base salary To recruit and retain executives of a suitable calibre for the role and duties required.
Reflects the market rate for the individual and their role.
Reviewed annually with any changes generally taking effect from 1 July.
Salaries are determined taking into account:
• the experience, responsibility, effectiveness and market value of the executive;
• the pay and conditions in the workforce;
• pay relativities within the Group;
• broadly the median position in light of remuneration within other similar companies and the rest of the Company; and
• affordability, given the profits of the Company.
Normally paid monthly in cash.
There is no prescribed maximum annual increase. The Committee is guided by the general increase for the broader workforce but recognises that higher increases may be appropriate where an individual is promoted, changes role, where the size, composition and/or complexity of the Group changes or where an individual is materially below market comparators or is appointed on a below-market salary with the expectation that his/her salary will increase with experience and performance.
Benefits To provide benefits commensurate to the market in which the Company operates and/or the market in which the director is based and in line with policies applicable to all other senior salaried employees.
Car (cash allowance and/or company car) and fuel (or fuel allowance).
Private medical insurance.
Permanent health insurance.
Life assurance.
Relocation expenses, allowance for disruption and ongoing expatriate benefits. These benefits are provided for defined periods only.
Directors’ and officers’ liability insurance.
Reasonable personal use of mobile telephone.
Small tokens with a value not exceeding £1,000 to mark significant events (e.g. long service, retirement etc).
The value of benefits may vary from year to year depending on the cost to the Company.
Additional benefits may be provided and the range of those benefits may vary taking into account market practice, the relevant circumstances and the requirements of the executive.
Directors’ remuneration report
60
GOVERNANCE
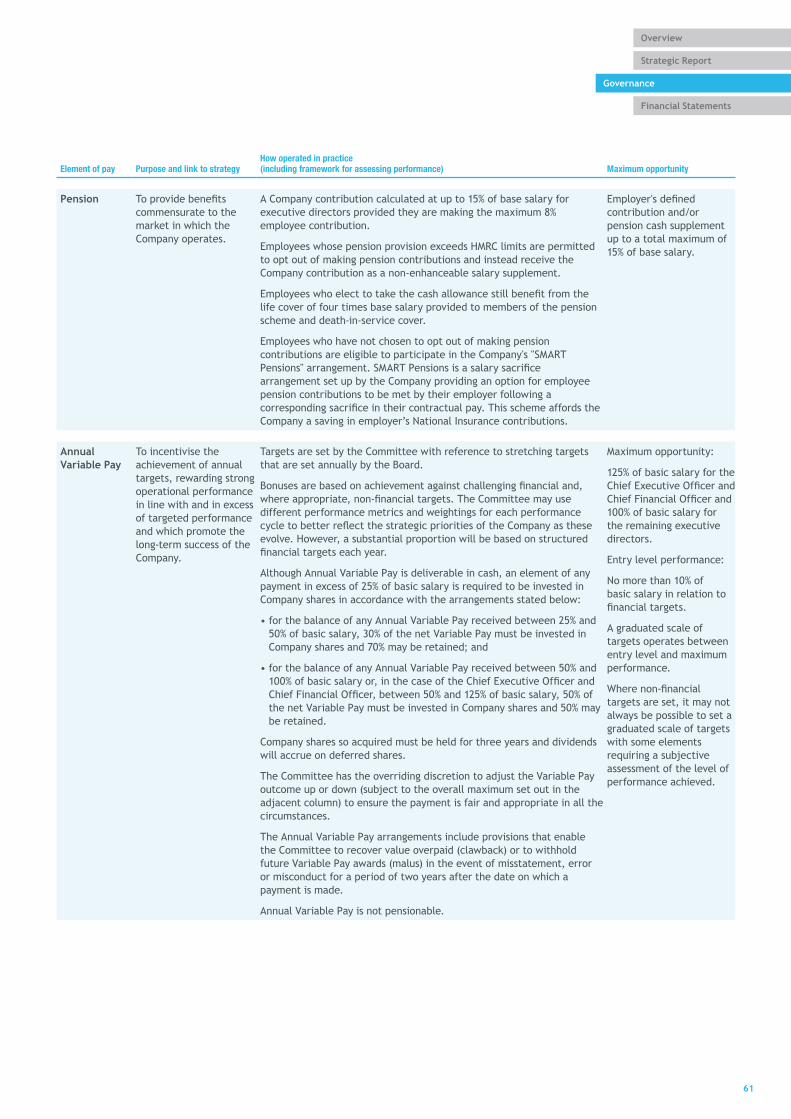
Element of pay Purpose and link to strategyHow operated in practice (including framework for assessing performance) Maximum opportunity
Pension To provide benefits commensurate to the market in which the Company operates.
A Company contribution calculated at up to 15% of base salary for executive directors provided they are making the maximum 8% employee contribution.
Employees whose pension provision exceeds HMRC limits are permitted to opt out of making pension contributions and instead receive the Company contribution as a non-enhanceable salary supplement.
Employees who elect to take the cash allowance still benefit from the life cover of four times base salary provided to members of the pension scheme and death-in-service cover.
Employees who have not chosen to opt out of making pension contributions are eligible to participate in the Company's "SMART Pensions" arrangement. SMART Pensions is a salary sacrifice arrangement set up by the Company providing an option for employee pension contributions to be met by their employer following a corresponding sacrifice in their contractual pay. This scheme affords the Company a saving in employer’s National Insurance contributions.
Employer's defined contribution and/or pension cash supplement up to a total maximum of 15% of base salary.
Annual Variable Pay
To incentivise the achievement of annual targets, rewarding strong operational performance in line with and in excess of targeted performance and which promote the long-term success of the Company.
Targets are set by the Committee with reference to stretching targets that are set annually by the Board.
Bonuses are based on achievement against challenging financial and, where appropriate, non-financial targets. The Committee may use different performance metrics and weightings for each performance cycle to better reflect the strategic priorities of the Company as these evolve. However, a substantial proportion will be based on structured financial targets each year.
Although Annual Variable Pay is deliverable in cash, an element of any payment in excess of 25% of basic salary is required to be invested in Company shares in accordance with the arrangements stated below:
• for the balance of any Annual Variable Pay received between 25% and 50% of basic salary, 30% of the net Variable Pay must be invested in Company shares and 70% may be retained; and
• for the balance of any Annual Variable Pay received between 50% and 100% of basic salary or, in the case of the Chief Executive Officer and Chief Financial Officer, between 50% and 125% of basic salary, 50% of the net Variable Pay must be invested in Company shares and 50% may be retained.
Company shares so acquired must be held for three years and dividends will accrue on deferred shares.
The Committee has the overriding discretion to adjust the Variable Pay outcome up or down (subject to the overall maximum set out in the adjacent column) to ensure the payment is fair and appropriate in all the circumstances.
The Annual Variable Pay arrangements include provisions that enable the Committee to recover value overpaid (clawback) or to withhold future Variable Pay awards (malus) in the event of misstatement, error or misconduct for a period of two years after the date on which a payment is made.
Annual Variable Pay is not pensionable.
Maximum opportunity:
125% of basic salary for the Chief Executive Officer and Chief Financial Officer and 100% of basic salary for the remaining executive directors.
Entry level performance:
No more than 10% of basic salary in relation to financial targets.
A graduated scale of targets operates between entry level and maximum performance.
Where non-financial targets are set, it may not always be possible to set a graduated scale of targets with some elements requiring a subjective assessment of the level of performance achieved.
61
Governance
Financial Statements
Strategic Report
Overview
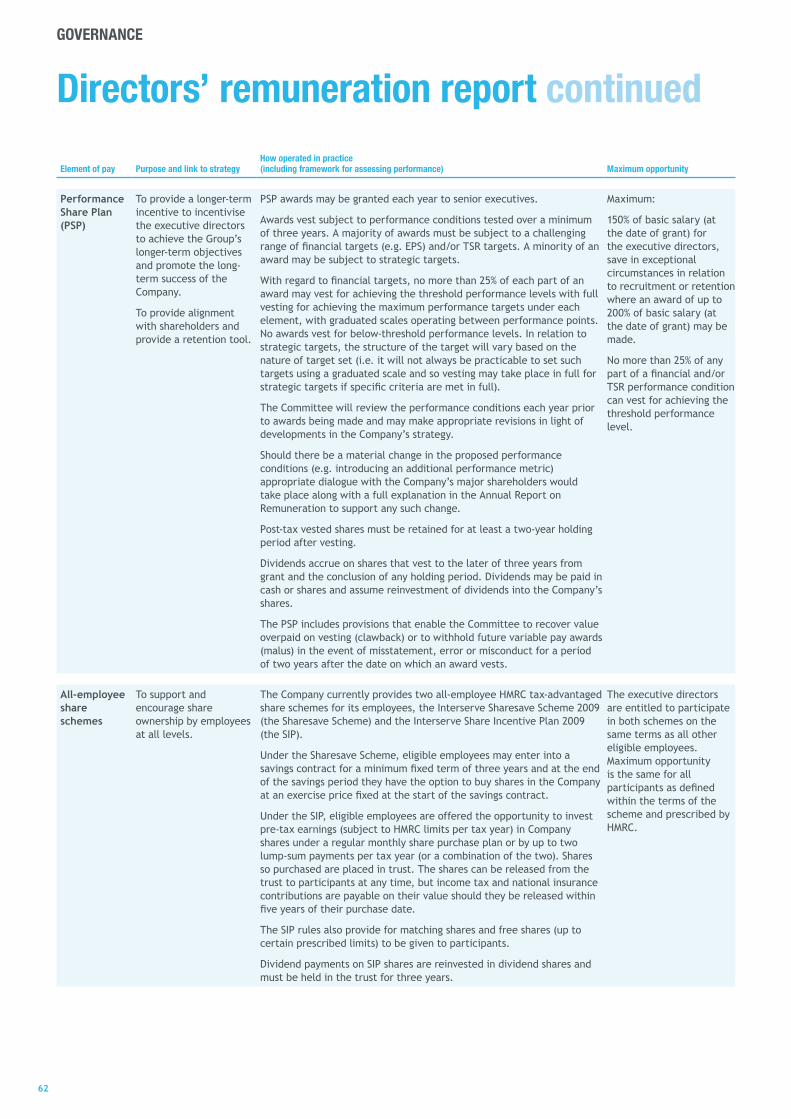
Element of pay Purpose and link to strategyHow operated in practice (including framework for assessing performance) Maximum opportunity
Performance Share Plan (PSP)
To provide a longer-term incentive to incentivise the executive directors to achieve the Group’s longer-term objectives and promote the long-term success of the Company.
To provide alignment with shareholders and provide a retention tool.
PSP awards may be granted each year to senior executives.
Awards vest subject to performance conditions tested over a minimum of three years. A majority of awards must be subject to a challenging range of financial targets (e.g. EPS) and/or TSR targets. A minority of an award may be subject to strategic targets.
With regard to financial targets, no more than 25% of each part of an award may vest for achieving the threshold performance levels with full vesting for achieving the maximum performance targets under each element, with graduated scales operating between performance points. No awards vest for below-threshold performance levels. In relation to strategic targets, the structure of the target will vary based on the nature of target set (i.e. it will not always be practicable to set such targets using a graduated scale and so vesting may take place in full for strategic targets if specific criteria are met in full).
The Committee will review the performance conditions each year prior to awards being made and may make appropriate revisions in light of developments in the Company’s strategy.
Should there be a material change in the proposed performance conditions (e.g. introducing an additional performance metric) appropriate dialogue with the Company’s major shareholders would take place along with a full explanation in the Annual Report on Remuneration to support any such change.
Post-tax vested shares must be retained for at least a two-year holding period after vesting.
Dividends accrue on shares that vest to the later of three years from grant and the conclusion of any holding period. Dividends may be paid in cash or shares and assume reinvestment of dividends into the Company’s shares.
The PSP includes provisions that enable the Committee to recover value overpaid on vesting (clawback) or to withhold future variable pay awards (malus) in the event of misstatement, error or misconduct for a period of two years after the date on which an award vests.
Maximum:
150% of basic salary (at the date of grant) for the executive directors, save in exceptional circumstances in relation to recruitment or retention where an award of up to 200% of basic salary (at the date of grant) may be made.
No more than 25% of any part of a financial and/or TSR performance condition can vest for achieving the threshold performance level.
All-employee share schemes
To support and encourage share ownership by employees at all levels.
The Company currently provides two all-employee HMRC tax-advantaged share schemes for its employees, the Interserve Sharesave Scheme 2009 (the Sharesave Scheme) and the Interserve Share Incentive Plan 2009 (the SIP).
Under the Sharesave Scheme, eligible employees may enter into a savings contract for a minimum fixed term of three years and at the end of the savings period they have the option to buy shares in the Company at an exercise price fixed at the start of the savings contract.
Under the SIP, eligible employees are offered the opportunity to invest pre-tax earnings (subject to HMRC limits per tax year) in Company shares under a regular monthly share purchase plan or by up to two lump-sum payments per tax year (or a combination of the two). Shares so purchased are placed in trust. The shares can be released from the trust to participants at any time, but income tax and national insurance contributions are payable on their value should they be released within five years of their purchase date.
The SIP rules also provide for matching shares and free shares (up to certain prescribed limits) to be given to participants.
Dividend payments on SIP shares are reinvested in dividend shares and must be held in the trust for three years.
The executive directors are entitled to participate in both schemes on the same terms as all other eligible employees. Maximum opportunity is the same for all participants as defined within the terms of the scheme and prescribed by HMRC.
Directors’ remuneration report continued
62
GOVERNANCE

Element of pay Purpose and link to strategy
Shareholding Guidelines
Under the Shareholding Guidelines executive directors are expected to build up over time a shareholding equivalent to 200% of their base salary. Shares purchased under the Annual Variable Pay arrangements, vested awards under the PSP (whether or not exercised), the Sharesave Scheme and the SIP also count toward this limit. Share options, whether or not vested, do not count towards satisfying these Guidelines.
The Remuneration Committee retains the discretion to adjust the requirement to invest Annual Variable Pay in Company shares and retain share awards on vesting in appropriate circumstances.
Discretion retained by the CommitteeThe Committee will operate the Company's incentive plans according to their respective rules and consistent with normal market practice, the Listing Rules and HMRC rules, where relevant, including flexibility and discretion in a number of respects and as set out in the respective plan rules. In particular, but without limitation, the Committee has flexibility regarding: the testing of a performance condition over a shortened performance period; how to deal with a change of control or restructuring of the Group (as set out in more detail on page 66); determination of a good/bad leaver for incentive plan purposes; and adjustments required in certain circumstances (e.g. rights issues, corporate restructuring, events and special dividends).
The Committee also retains the discretion to:
• adjust the targets and/or set different measures and alter weightings for the Annual Variable Pay arrangements and PSP, or to remove the effects of “one-off” events in relation to the PSP, if events occur that cause it to determine that the metrics are no longer appropriate and amendment is required so they can achieve their original intended purpose; and
• waive some or all of the Shareholding Guidelines or the requirement to invest Annual Variable Pay in Company shares and retain share awards on vesting in exceptional circumstances.
Operation of Annual Variable Pay and the Performance Share PlanWith regard to performance conditions, the Committee will continue to select financial and, if appropriate, non-financial strategic measures as targets for Annual Variable Pay that are key performance indicators for the business over the short term.
For the long-term incentives, the Committee will continue to select a combination of measures that provide a good focus on the outcomes of the Company’s strategy together with sustainable improvements in long-term profitability, together with appropriate and demanding targets in the context of the Company's trading environment and strategic objectives.
There are no performance conditions for the Sharesave Scheme and SIP as they are all-employee share plans aimed at encouraging wider employee share ownership.
Targets are set based on sliding scales that take account of internal planning and external market expectations for the Company. Only modest rewards are available for delivering threshold performance levels with maximum rewards requiring substantial out-performance of the challenging plans approved at the start of each year.
How the executive directors’ Remuneration Policy relates to the wider GroupThe Remuneration Policy for the executive directors is designed with regard to the policy for employees across the Group as a whole. There are some differences in the structure of the Remuneration Policy for executive directors, other senior employees and employees more generally. Variable pay opportunity tends to be set at higher levels at more senior executive levels as these employees are those that are perceived to have the greatest ability to influence overall Group performance. In addition, the choice of performance metrics for executive directors tends to be more heavily weighted towards Group results rather than business unit or individual performance. Incentive plan targets for senior employees are typically set against a combination of metrics (e.g. Group, division and business unit) with wider employee targets more likely to be weighted towards division and business unit performance. In all cases targets link back to overall Group business plans. This approach provides a strong alignment of interest between senior executives, employees and investors.
Operation of the PSP is limited to the most senior employees who are perceived to have the greatest ability to influence Group-level performance. Historically, circa 130 senior employees have participated in the PSP, but in 2018 PSP awards were made to 10 employees; all members of the Executive Team.
Benefits are provided across the Group at all levels with these often linked to employee grade. In terms of the most valuable benefits to executive directors these include the provision of a cash allowance and/or company car benefit with the value limited to £30,000.
The Shareholding Guidelines are not applicable other than to the executive directors.
How the views of employees are taken into accountIn light of the new 2018 UK Corporate Governance Code, the Board has determined that in 2019 two “town hall” meetings will be held with employees that will be attended by, as a minimum, both the Chief Executive Officer and the Group Chairman, that will allow the views from a broad cross-section of the employee population. The Board will also utilise the new employee engagement survey to gain insights into employee views.
The Committee takes due account of remuneration structures elsewhere in the Group when setting pay for the executive directors (for example, consideration is given to the overall salary increase budget and the incentive structures that operate across the Group).
63
Governance
Financial Statements
Strategic Report
Overview

How the views of shareholders are taken into accountThe Remuneration Committee considers shareholder feedback received in relation to the AGM each year and guidance from shareholder representative bodies more generally. This feedback, plus any additional feedback received during any meetings held with shareholders from time to time, is then considered as part of the Committee’s ongoing review of remuneration policy.
Ability to make payments to executive directors Remuneration payments can only be made if they are consistent with the approved Remuneration Policy, the relevant plan rules or are otherwise approved by ordinary resolution of the members of the Company.
When approving this directors' Remuneration Policy, authority was given to the Company to honour any commitments entered into with current or former directors (such as the payment of a pension or the vesting or exercise of past share awards) that have either been set out in the previously approved Remuneration Policy or remuneration reports or disclosed to and approved by shareholders and in respect of outstanding share awards as detailed on pages 74 to 77 of the Annual Report on Remuneration. Details of any payments to former directors will be set out in the Annual Report on Remuneration as they arise.
Remuneration scenarios for executive directorsThe Remuneration Policy results in a significant proportion of remuneration received by executive directors being dependent on Group performance. The graph below illustrates how the total pay opportunities for the executive directors varies under three different performance scenarios: below target, on-target and maximum. When reviewing the graph, it should be noted that it has been prepared based on the policy detailed above but also includes a scenario showing an assumed future share price growth of 50 per cent.
3,500 2,000
Fixed Pay
CEO CFO
Annual Bonus LTIP LTIP value with 50% share price growth
Minimum
100%
£860k
Minimum
£488k
100%
£1,920k
45%
22%
33%
On-target
£1,098k
45%
22%
33%
On-target
£2,683k
£3,180k
37%
31%
32%
Maximum
£1,521k
£1,831k
37%
31%
32%
Maximum
2,500
1,6003,000
1,800
2,000
1,400
1,500
1,200
1,000
1,000
800
600
500400
200
0 0
Assumptions: • Minimum – fixed pay only, based on salary effective 1 January 2019, 15 per cent of salary pension contribution (or 15 per cent of
salary contribution in lieu of pension) and benefits received in the 2018 financial year (annualised where relevant).
• On-target – minimum plus 50 per cent of the maximum pay-out under the Annual Variable Pay scheme, and 65 per cent PSP vesting.
• Maximum – minimum plus 100 per cent of the maximum pay-out under the Annual Variable Pay scheme, and full PSP vesting and full PSP vesting with 50 per cent share price growth.
Dividend equivalent payments provided for under the PSP have been disregarded and other than for the share price growth scenario, no share price growth is assumed for the purposes of these charts.
Service contracts and policy on payments for loss of officeAll newly-appointed executive directors will have contracts terminable at any time on up to one year's notice. Under the terms of the contract, should notice be served by either party, the executives can continue to receive basic salary, benefits and pension for the duration of their notice period during which time the Company may require the individual to continue to fulfil their current duties or may assign a period of garden leave.
Contracts also contain the ability, at the Company's discretion, to make a payment in lieu of notice of up to one year’s basic annual salary.
Details of the executive directors’ service contracts are summarised below. Each contract has an indefinite unexpired term and a notice period of one year.
Name Date of contract
D J White 1 September 2017
M A Whiteling 1 October 2017
D I Sutherland1 1 January 2011
1 Dougie Sutherland stepped down from the Board on 12 February 2019.
Directors’ remuneration report continued
64
GOVERNANCE
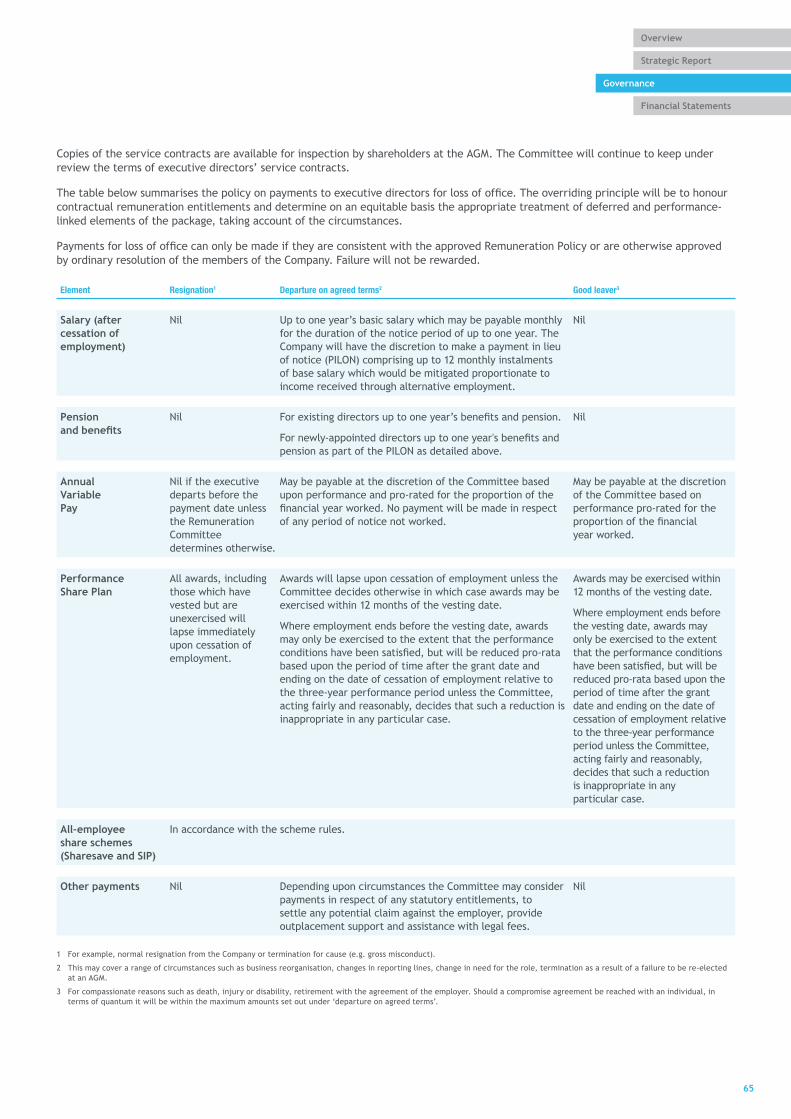
Copies of the service contracts are available for inspection by shareholders at the AGM. The Committee will continue to keep under review the terms of executive directors’ service contracts.
The table below summarises the policy on payments to executive directors for loss of office. The overriding principle will be to honour contractual remuneration entitlements and determine on an equitable basis the appropriate treatment of deferred and performance-linked elements of the package, taking account of the circumstances.
Payments for loss of office can only be made if they are consistent with the approved Remuneration Policy or are otherwise approved by ordinary resolution of the members of the Company. Failure will not be rewarded.
Element Resignation1 Departure on agreed terms2 Good leaver3
Salary (after cessation of employment)
Nil Up to one year’s basic salary which may be payable monthly for the duration of the notice period of up to one year. The Company will have the discretion to make a payment in lieu of notice (PILON) comprising up to 12 monthly instalments of base salary which would be mitigated proportionate to income received through alternative employment.
Nil
Pension and benefits
Nil For existing directors up to one year’s benefits and pension.
For newly-appointed directors up to one year's benefits and pension as part of the PILON as detailed above.
Nil
Annual Variable Pay
Nil if the executive departs before the payment date unless the Remuneration Committee determines otherwise.
May be payable at the discretion of the Committee based upon performance and pro-rated for the proportion of the financial year worked. No payment will be made in respect of any period of notice not worked.
May be payable at the discretion of the Committee based on performance pro-rated for the proportion of the financial year worked.
Performance Share Plan
All awards, including those which have vested but are unexercised will lapse immediately upon cessation of employment.
Awards will lapse upon cessation of employment unless the Committee decides otherwise in which case awards may be exercised within 12 months of the vesting date.
Where employment ends before the vesting date, awards may only be exercised to the extent that the performance conditions have been satisfied, but will be reduced pro-rata based upon the period of time after the grant date and ending on the date of cessation of employment relative to the three-year performance period unless the Committee, acting fairly and reasonably, decides that such a reduction is inappropriate in any particular case.
Awards may be exercised within 12 months of the vesting date.
Where employment ends before the vesting date, awards may only be exercised to the extent that the performance conditions have been satisfied, but will be reduced pro-rata based upon the period of time after the grant date and ending on the date of cessation of employment relative to the three-year performance period unless the Committee, acting fairly and reasonably, decides that such a reduction is inappropriate in any particular case.
All-employee share schemes (Sharesave and SIP)
In accordance with the scheme rules.
Other payments Nil Depending upon circumstances the Committee may consider payments in respect of any statutory entitlements, to settle any potential claim against the employer, provide outplacement support and assistance with legal fees.
Nil
1 For example, normal resignation from the Company or termination for cause (e.g. gross misconduct).
2 This may cover a range of circumstances such as business reorganisation, changes in reporting lines, change in need for the role, termination as a result of a failure to be re-elected at an AGM.
3 For compassionate reasons such as death, injury or disability, retirement with the agreement of the employer. Should a compromise agreement be reached with an individual, in terms of quantum it will be within the maximum amounts set out under ‘departure on agreed terms’.
65
Governance
Financial Statements
Strategic Report
Overview

There are no provisions in executive directors’ service agreements entitling them to terminate their employment or receive damages in the event of a change in control of the Company. The Annual Variable Pay scheme does not include any provision entitling early or any payment to be made on a change in control of the Company.
In the event of change of control, PSP awards would be eligible to vest based on (i) the extent to which performance targets had been met, as assessed by the Committee, over the shortened performance period and (ii) subject to a pro-rata reduction for time (which the Committee retains discretion to disapply if it considers it appropriate to do so). As an alternative, and in agreement with an acquiring company, the awards may be replaced with equivalent awards in the acquiring company's shares.
The Sharesave Scheme provides that if a change in control of the Company occurs, any options may be exercised within a month (or such longer period as the Board may permit up to a maximum of six months). There are also rollover provisions similar to those under the PSP explained above.
Recruitment remunerationIn cases where the Company recruits a new executive director, the Committee will follow the policy set out below to determine his/her ongoing remuneration package. In arriving at a total package and in considering quantum for each element of the package, the Committee will take into account the skills and experience of the candidate, the market rate for a candidate of that experience as well as the importance of securing the preferred candidate. The remuneration package for a new executive director would be set in accordance with the terms of the Company's approved remuneration policy in force at the time of appointment.
Element General policy Specifics
Salary At a level required to attract the most appropriate candidate.
Discretion to pay a lower basic salary with increases at a rate above inflation over two to three years as the new appointee becomes established in the role.
Pension and benefits
In line with Company policies. Where appropriate, relocation expenses/arrangements may be provided.
Annual Variable Pay
In line with existing schemes.
Maximum opportunity 100% of base salary or in the case of a Chief Executive Officer or Chief Financial Officer, 125% of base salary.
Specific targets could be introduced for an individual where necessary for the first year of appointment if it is appropriate to do so to reflect the individual’s responsibilities and the point in the year in which they joined the Board.
Performance Share Plan
In line with Company policies and PSP rules.
Maximum award up to 200% of basic salary (at the date of grant) may be made.
An award may be made in the year of joining or, alternatively, the award can be delayed until the following year. Targets would be the same as for other directors.
Other share awards or remuneration1
The Committee may make an incentive award to replace remuneration forfeited on an executive leaving a previous employer, where to do so would be in the commercial interests of the Company.
Awards would, where possible, take into account the awards forfeited in terms of vesting periods, expected value and performance conditions.
For unvested performance-related awards, awards of broadly similar quantum (allowing for the impact of any performance targets), with appropriate performance conditions.
1 The Committee may make use of the flexibility provided in the Listing Rules to make such awards if deemed appropriate in terms of replacing forfeited variable pay.
In the case of an internal appointment, any variable pay element awarded in respect of the prior role may be allowed to pay out according to its terms on grant, adjusted as relevant to take into account the appointment. In addition, any other ongoing remuneration obligations existing prior to appointment may continue as appropriate.
External directorshipsThe Board is comfortable with the principle of executive directors sitting on another company board as a non-executive in order to assist with their development, subject to the prior approval of the Chief Executive Officer and the Board. Any fees earned in that capacity may be retained by the executive director.
Directors’ remuneration report continued
66
GOVERNANCE

TERMS OF APPOINTMENT AND REMUNERATION POLICY FOR NON-EXECUTIVE DIRECTORSTerms of appointmentNon-executive directors are appointed initially until the first AGM of the Company following appointment, when they are required to stand for election by shareholders. Non-executive directors do not have service contracts, they are engaged by letters of appointment which are terminable upon one month’s notice by either party, without compensation, save for the Group Chairman whose appointment is terminable upon six months’ notice by either party, without compensation.
The dates of appointment of the non-executive directors are set out below:
Name Date first appointed Date last elected/re-elected
G A Barker 1 January 2016 12 June 2018
G M Edwards 1 February 2017 12 June 2018
A K Fahy 1 January 2013 12 June 2018
R J King 1 September 2014 12 June 2018
C N Pollard1 26 June 2018 n/a
N R Salmon 1 August 2014 12 June 2018
1 Nick Pollard will be proposed for election by shareholders at the 2019 AGM.
The following table summarises the non-executive directors’ Remuneration Policy.
Element Purpose and link to strategy How operated in practice Maximum opportunity
Fees To recruit and maintain non-executives of a suitable calibre for the role and duties required.
The Group Chairman’s fee is reviewed by the Committee (without the Group Chairman present).
The Remuneration Policy for the non-executive directors, other than the Group Chairman, is determined by a sub-committee of the Board comprising the Group Chairman and the executive directors.
Non-executive directors receive a fee for carrying out their duties, together with additional fees for the Senior Independent Director and for those non-executive directors who chair the primary Board committees (i.e. Audit and Remuneration Committees). Other fees may be introduced if considered appropriate, for example in the event of exceptional levels of additional time being required, or new responsibilities being assigned in response to corporate developments.
The non-executive directors and the Group Chairman do not currently receive benefits, but the Board retains a discretion to introduce such benefits if considered appropriate (e.g. paying reasonable travel expenses incurred undertaking Company business to keep individuals whole on a net of tax basis). Small tokens with a value not exceeding £1,000 may be made to mark significant events (e.g. long service, retirement etc).
The fees of the non-executive directors are determined by the Board taking into account amounts paid by other similar-sized listed companies, the time commitment of the individual, role and responsibilities. Fees are reviewed in detail biennially with an annual interim review.
There is no prescribed maximum annual increase. The Committee is guided by the general increase in the non-executive director market and for the broader employee population but on occasions may need to recognise, for example, an increase in the scale, scope or responsibility of the role.
67
Governance
Financial Statements
Strategic Report
Overview

ANNUAL REPORT ON REMUNERATIONThe Annual Report on Remuneration will be put to an advisory vote at the 2019 AGM.
HOW THE DIRECTORS’ REMUNERATION POLICY WILL BE APPLIED FOR THE YEAR ENDING 31 DECEMBER 2019Executive directors’ remuneration Given the recent announcement in relation to the proposed deleveraging event, the Committee will review the appropriateness of the current policy and, if appropriate, formulate a new policy and seek shareholder approval of that new policy. Hence it is not possible at this point to state the basis on which the current, or any revised policy, will be applied for the year ending 31 December 2019.
Non-executive director fees The fee levels operated in 2018 will remain unchanged during 2019 and are set out in the table below:
Element
Fee effective 1 January 2019
£
Fee effective 1 January 2018
£Percentage
change
Fee paid to Group Chairman 170,000 170,000 nil
Base fee paid to other non-executive directors 51,400 51,400 nil
Supplementary fees:1
- Senior Independent Director 7,000 7,000 nil
- Audit Committee Chairman 10,000 10,000 nil
- Remuneration Committee Chairman 10,000 10,000 nil
- Nomination Committee Chairman See note2 See note2 n/a
1 Nick Pollard is paid an additional fee of £10,000 per annum to recognise his additional responsibility and commitments in respect of supporting the restructuring and engagement with the lender group.
2 The Group Chairman is Chairman of the Nomination Committee and receives no supplementary fee for chairing this committee.
HOW THE REMUNERATION POLICY WAS APPLIED FOR THE YEAR ENDED 31 DECEMBER 2018The salaries for the executive directors are set out in the table below:
Name
Salary as at 1 January 2019
£
Salary as at 1 January 2018
£
D J White 663,000 650,000
M A Whiteling 413,100 405,000
D I Sutherland 322,205 315,188
Cost of living increases of circa two per cent were made to the executive directors, broadly in line with those awarded to the general salaried workforce, with the increases effective from 1 July 2018 in line with the Remuneration Policy.
Debbie White is a non-executive director of Howden Joinery Group plc for which she receives a fee of £55,000 per annum. She is also an unremunerated trustee of Wellbeing of Women.
Mark Whiteling is a non-executive director of Connect Group Plc for which he receives an annual fee of £53,000.
The table on the following page shows the remuneration paid to each director and also includes the potential Annual Variable Pay that may be received based on an assessment of performance against the performance targets. The Remuneration Committee retains a discretion as to whether and to what extent any payments are made and is reserving the right to exercise that discretion only following the deleveraging event such that any payment determined by the Committee would be due in April/May. Furthermore, as a good leaver, the Committee has a further discretion to consider as to whether any payment should be made to Mr Sutherland which, again, will be determined post-deleveraging. Further details are included on pages 70 and 71.
Directors’ remuneration report continued
68
GOVERNANCE

Remuneration paid to each director (audited information)
£ Year Salary & feesTaxable benefits
Annual Variable Pay12 PSP9/10 Pension11
Other remuneration Total
Executive directors
D J White1 2018 656,500 97,093 404,430 - 98,475 - 1,256,498
2017 216,667 6,641 270,089 - 32,500 - 525,897
M A Whiteling2 2018 409,050 13,450 251,991 - 61,358 - 735,849
2017 101,250 3,433 126,562 - 15,188 - 246,433
Sub-total 2018 1,065,550 110,543 656,421 - 159,833 - 1,992,347
20177 317,917 10,074 396,651 - 47,688 - 772,330
Non-executive directors
G A Barker 2018 170,000 - - - - - 170,000
2017 170,000 - - - - - 170,000
G M Edwards3 2018 51,400 - - - - - 51,400
2017 47,117 - - - - - 47,117
A K Fahy 2018 61,400 - - - - - 61,400
2017 61,400 - - - - - 61,400
R J King 2018 58,400 - - - - - 58,400
2017 58,400 - - - - - 58,400
C N Pollard4 2018 25,700 - - - - - 25,700
2017 - - - - - - -
N R Salmon 2018 56,400 - - - - - 56,400
2017 51,400 - - - - - 51,400
Sub-total 2018 423,300 - - - - - 423,300
2017 388,317 - – - - - 388,317
Former directors
K L Ludeman5 2018 30,700 - - - - - 30,700
2017 61,400 - - - - - 61,400
D I Sutherland6 2018 318,697 17,390 157,236 - 47,805 - 541,128
2017 315,188 17,973 - - 47,278 - 380,439
Sub-total 2018 349,397 17,390 157,236 - 47,805 - 571,828
20178 376,588 17,973 - - 47,278 441,839
Total 2018 1,838,247 127,933 813,657 - 207,638 - 2,987,475
20178 1,082,822 28,047 396,651 - 94,966 - 1,602,486
1 Debbie White was appointed on 1 September 2017.
2 Mark Whiteling was appointed on 1 October 2017.
3 Gareth Edwards was appointed on 1 February 2017.
4 Nick Pollard was appointed on 26 June 2018.
5 Keith Ludeman resigned on 12 June 2018.
6 Dougie Sutherland stepped down from the Board on 12 February 2019 and ceased employment on 28 February 2019.
7 The 2017 comparator remuneration sub-total figure does not include Dougie Sutherland’s 2017 remuneration as disclosed in the 2017 Annual Report, which has moved to the former directors’ section of the table.
8 The 2017 comparator remuneration sub-total and total figures do not include former directors’ remuneration as disclosed in the 2017 Annual Report (Lord Blackwell, Adrian Ringrose, Tim Haywood and Bruce Melizan).
9 The PSP awards awarded on 5 April 2016 have not met the performance conditions and will not vest. For further information see page 72.
10 The PSP awards awarded on 1 June 2015 did not meet the performance conditions and did not vest. For further information see last year’s Remuneration Report.
11 15 per cent salary supplement in lieu of pension.
12 As noted on page 68 these amounts have not been paid. The Committee will determine whether and to what extent payments are to be made following the deleveraging event. Whether any payment is made to Mr Sutherland is also subject to an independent discretion noting Mr Sutherland is a good leaver.
69
Governance
Financial Statements
Strategic Report
Overview

Additional notes to the directors’ remuneration table (audited information)1. Taxable benefitsThe table below sets out the constituent elements of the taxable benefits for the executive directors included in the single figure table above for the period that each individual was a member of the Company’s Board:
YearCompany car
£
Cash allowance in lieu of
company car £
Fuel benefit £
Travel and accommodation
£
Medical insurance
£Total
£
Executive directors
D J White 2018 - 18,000 - 77,1362 1,957 97,093
2017 - 6,000 - 32,3092 641 6,641
M A Whiteling 2018 - 12,000 - - 1,450 13,450
2017 - 3,000 75 - 358 3,433
Former directors1
D I Sutherland 2018 - 13,896 1,537 - 1,957 17,390
20173 - 13,896 2,208 - 1,869 17,973
Total 2018 - 43,896 1,537 77,136 5,364 127,933
20173 - 22,896 2,283 32,309 2,868 28,047
1 Values represent the benefit received as a serving director during the year.
2 This amount relates to expenses that were agreed to be reimbursed to the CEO on a cost-neutral basis (net of tax basis) at the time of her recruitment to enable her to work across different offices. The 2018 amount relates to the reimbursement of expenses in relation to the 2018 financial year. In addition, a further payment was made in the 2018 financial year as a reimbursement of expenses incurred in the 2017 financial year of £32,309. The amount of this payment had not been finalised at the time of publishing the 2017 Annual Report.
3 The 2017 comparator remuneration sub-total and total figures do not include former directors’ remuneration as disclosed in the 2017 Annual Report (Adrian Ringrose, Tim Haywood and Bruce Melizan).
2. Determination of 2018 Annual Variable PayThe bonus structure applicable to all executive directors in 2018 was as follows:
Proportion of bonus Metric
One-third Operating profit
One-third Operating cash flow
One-third Achievement of defined strategic targets
Operating profit and operating cash flow were introduced as part of a Group-wide focus on returning the Company back to targeted levels of profitability and cash generation. It was also considered appropriate to include a greater weighting than in prior years on delivery against specific objectives arising from the Energy from Waste plans and early conclusions of the strategic review and those in the transformation plan.
The targets relating to operating profit and operating cash flow were set using a challenging sliding scale set with reference to the Company’s internal planning expectations, market expectations for our performance and the plans presented to lenders and other financial stakeholders in connection with the refinancing of the Company’s debt. With regard to the non-financial targets, a combination of quantitative and qualitative targets applied that were based on delivery against the Company’s Fit for Growth strategy and leadership to ensure that the changes agreed by the Board to be driven through the business were sustainable.
In relation to any payment in connection with the above targets, the Committee retained the discretion to reduce these elements of Variable Pay (to zero) if it considered it appropriate to do so in light of the Company’s overall financial performance achieved during the year. The Committee has not yet approved any bonus payments and will consider the exercise of discretion in finalising any awards after the outcome of the deleveraging event is known. Furthermore, whether any payment is made to Mr Sutherland, is also down to Committee discretion in considering Mr Sutherland as a good leaver. It is anticipated that any bonuses will be paid in April/May.
Directors’ remuneration report continued
70
GOVERNANCE

The actual targets set and performance against the targets is set out below.
Metric
Maximum award as a proportion of salary Original performance target
Percentage of element
payable Performance assessment
Extent of achievement
[TBC]
Actual award as a
percentage of salary [TBC]
Targets applicable to Debbie White and Mark Whiteling
Operating profit 41.67% Less than £76 million 0%
£76 million 10%
£91 million 50%
£101 million 100% 79.7% 33.22%
Straight-line pay-out occurs between performance points.
Operating cash flow 41.67% Less than £11 million 0%
£11 million 10%
£31 million 50%
£51 million 100% Nil Nil
Straight-line pay-out occurs between performance points.
Strategic targets 41.67% Delivery of sustainable savings in line with the agreed targets in the business plan and with the agreed timescales.
33.3% Savings figure exceeded so target met in full.
100% 13.89%
Good governance of the change programme overall delivering confidence against the strategic milestones and benefits delivery and reviewed by internal audit as appropriate.
33.3% Regular monthly comprehensive updates including a full-year review in December 2018 have been provided to the Board and key external stakeholders. Further assurance work confirming good governance and progress to complement programme testing has been provided through external advisors in May and December 2018 and reported to the Audit Committee resulting in the assessment of the condition being achieved in full.
100% 13.89%
Delivery of EfW projects and overall programme to the timeline, cost and cash profile consistent with the agreed business plan provided to lenders.
33.3% Nil vesting
Targets applicable to Dougie Sutherland and the extent the targets were achieved are as stated above, but with the maximum award for each element being 33.33% as a proportion of salary rather than 41.67% and noting that any payment to Mr Sutherland is at the discretion of the Committee as a leaver.
The above provides full disclosure of the original financial targets set for the year and the calculation of performance against those targets. In determining the vesting percentage the Committee had the discretion to adjust the calculation and it had exercised that discretion which is reflected in the stated vesting percentage for the Operating Profit element. For example, the original targets may be adjusted for any discontinued, divested or acquired businesses to ensure the targets remained similarly challenging and it had made such an adjustment to the targets in respect of the disposal of Access Hard Services which is reflected in the vesting percentage disclosed. In relation to non-financial targets, an overview has been provided which omits any disclosures that are considered commercially sensitive. As the Committee has retained the discretion to consider and determine the quantum of actual bonus payments post-deleveraging, further disclosures on the discretion exercised in respect of 2018 performance and the adjusted targets that determine the basis of the actual payments made will be provided when preparing the 2019 Annual Report on Remuneration.
71
Governance
Financial Statements
Strategic Report
Overview

3. Determination of 2018 Performance Share Plan paymentsThe analysis below explains how the PSP payments for the performance period ending 31 December 2018 were determined.
The PSP awards granted on 5 April 2016 were based on performance over the three-year period from 1 January 2016 to 31 December 2018 and were subject to the following performance conditions, neither of which were satisfied:
The EPS Performance Condition for two-thirds of the 2016 Awards
Normalised EPS1 growth of the Company over the performance period Vesting percentage of two-thirds of shares subject to the award
Less than 16.7% 0%
16.7% to 37% 25% to 65% (pro-rated)
37% to 65% 65% to 100% (pro-rated)
Greater than 65% 100%
1 Normalised EPS is headline EPS adjusted to reflect growth in underlying value created by (a) removing the impact of IAS 36 Impairment of assets and IAS 39 Financial instruments; and (b) recognising or removing “one-off” events at the discretion of the Committee.
In testing the performance condition, the Committee assessed performance based on the definition of EPS detailed above and noted that no growth in EPS had occurred over the period which meant the target was not achieved and therefore the EPS condition had not been met and the EPS part of the award will not vest.
The TSR Performance Condition for one-third of the 2016 AwardsThis condition is determined by comparing the Company’s TSR performance to the TSR of each company in the FTSE 250, excluding investment trusts.
TSR ranking of the Company compared to the Comparator Group over the performance period Vesting percentage of one-third of shares subject to the award
Below median ranking 0%
Median ranking (top 50%) 25%
Median to upper quartile ranking 25% to 100% (pro-rated)
Upper quartile ranking (top 25%) 100%
TSR performance was below the median of the comparator group and therefore the TSR condition was not met and the TSR part of the awards will not vest.
4. Directors’ pension entitlements During 2018 none of the executive directors were active participants of the Defined Contribution section of the Interserve Pension Scheme and, as at 31 December 2018, all the executive directors who were former members of the Scheme had transferred their deferred benefits out of this section of the Scheme. All the executive directors receive 15 per cent salary supplement in lieu of pension contributions.
Non-executive directors’ fees are not pensionable.
5. Payments for cessation of employment Dougie Sutherland stepped down from the Board on 12 February 2019 and ceased employment on 28 February 2019. A payment to Mr Sutherland of £322,205, being a payment in lieu of the contractual notice of period of 12 months, has been made along with a statutory redundancy payment of £9,144. In view of the reason for termination being by way of redundancy, the Committee resolved Mr Sutherland to be a “good leaver”. His unvested PSP awards over 213,802 and 524,730 shares granted in 2017 and 2018 respectively, will become exercisable at the end of the respective performance periods subject to the applicable performance conditions being satisfied and time pro-rating of the award to the date of cessation of employment, being 28 February 2019. Any vested awards must be exercised within 12 months of the vesting date, after which time they will lapse. Any shares acquired must be held for a further two years and are subject to the recovery and withholding provisions of the PSP.
Shares purchased by Mr Sutherland under the Share Incentive Plan (along with any associated dividend shares) are transferable to him under the terms of that plan.
The Committee will consider whether it is appropriate to exercise its discretion to award a bonus to Mr Sutherland in respect of the 2018 financial year.
The payment of £322,205 will be subject to such deductions in respect of tax and national insurance that the Company is required by law to make.
Directors’ remuneration report continued
72
GOVERNANCE

Performance graph The graph below shows the value, on 31 December 2018, of £100 invested in Interserve Plc on 31 December 2009 compared with the value of £100 invested in the companies comprising the Support Services sector of the FTSE All-Share Index. This was chosen for comparison because it is considered to be the relevant benchmark against which to compare our performance.
Change in Chief Executive remunerationThe table below provides a summary of the Chief Executive’s remuneration over the last ten years:
2018 2017 2016 2015 2014 2013 2012 2011 2010 2009
Total remuneration (£000) 1,2566 9851 679 1,418 1,797 2,054 1,928 1,318 543 943
Annual Variable Pay (% of maximum) 48.8%4 33.02%2 nil 77.8% 62.6% 58.7% 100.0% 100.0% 30.0% 98.0%
PSP vesting (% of maximum) nil5 nil3 nil 44.5% 54.2% 100.0% 100.0% 50.0% nil 50.0%
The data for this table was taken from the Directors’ Remuneration Reports for the relevant years and adjusted to take account of the actual share price on the date of vesting for the PSP.
1 This figure represents the total remuneration for Adrian Ringrose for the period during the year that he served as Chief Executive (1 January to 31 August 2017) combined with the total remuneration for Debbie White for the period during the year that she served as Chief Executive Officer (1 September to 31 December 2017).
2 This figure represents the average bonus paid based on Adrian Ringrose receiving no bonus (0% of the maximum) for the eight-month period from 1 January 2017 to 31 August 2017 and Debbie White receiving a bonus (100% of the maximum) for the period of four months from 1 September 2017 to 31 December 2017.
3 This figure represents the vesting of PSP awards with performance conditions ending at 31 December 2017; in this case, the PSP award granted to Adrian Ringrose on 1 June 2015 which did not vest. The recruitment award to Debbie White (detailed on page 76) is excluded since it does not relate to performance at Interserve.
4 This figure is an estimate of the potential maximum that may be paid based on the performance targets. Whether and to what extent such amount is paid will be determined by the Committee after the deleveraging event.
5 Debbie White had no PSP awards vesting with performance conditions ending at 31 December 2018.
6 This includes the calculated maximum potential bonus payment that has not yet been paid and may not be paid as noted in 4 above.
Historical TSR Performance
£400
£300
£200
£100
0
December 2008
Interserve Plc FTSE All-Share Support Services
December 2009
December 2010
December 2011
December 2012
December 2013
December 2014
December 2015
December 2016
December 2017
December 2018
Source: Thomson Reuters Datastream
73
Governance
Financial Statements
Strategic Report
Overview

Percentage change in Chief Executive’s remuneration compared to employeesThe table below shows the percentage change in the Chief Executive’s salary, benefits and annual bonus between the financial years ending 31 December 2017 and 31 December 2018, compared to the percentage increase for UK Senior Management (on a per capita basis):
Percentage change
Salary
Chief Executive 2.00%
Senior Management1 3.00%
Benefits
Chief Executive2 (16.87)%
Senior Management1 10.20%
Annual bonus
Chief Executive3 41.10%
Senior Management1 4 46.67%
1 The comparator group relates to UK Senior Management rather than all Group employees. We have chosen this group because the Committee believes that it provides a sufficient comparator group to give a reasonable understanding of underlying increases based on similar remuneration constituents applicable to Senior Management whilst reducing the distortion that would otherwise arise from the changing mix between UK and overseas employees.
2 For the purposes of providing comparable information the benefits and expenses for 2017 for the CEO have been annualised and the expenses incurred attributed to the appropriate financial year.
3 Based on the maximum potential bonus that could be paid, noting that no such bonus may be paid and this remains at the discretion of the Committee post the deleveraging event.
4 This figure is an estimate only of the potential 2018 bonus. To the extent that there is a material difference this will be disclosed in the 2019 report.
Relative importance of spend on pay The table below illustrates the change in expenditure by the Company on remuneration paid to all the employees of the Group against other significant distributions and payments from the financial year ending 31 December 2017 compared to the financial year ending 31 December 2018:
2018 £million
2017 £million
Percentage change
Overall expenditure on pay 1,093.7 1,147.0 (4.7)%
Dividends paid – – –
Performance Share Plan (audited information) The following grants were made to the executive directors under the PSP during the year:
Executive director Date of grant Number of shares Face value
£ Performance period Exercise period
D J White 03.05.18 1,082,130 963,6371 01.01.18 - 31.12.20 03.05.21 – 02.05.23
M A Whiteling 03.05.18 674,250 600,4201 01.01.18 - 31.12.20 03.05.21 – 02.05.23
D I Sutherland 03.05.18 524,730 467,2721 01.01.18 - 31.12.20 03.05.21 – 02.05.23
1 Valued using the closing share price at the date of grant, being 89.05p per share.
All awards were made in the form of nil-cost options equivalent to 150 per cent of base salary.
As disclosed last year, the performance conditions attached to the awards to the executive directors were a combination of relative TSR performance, cumulative operating profit and the implementation of the Company’s business transformation plan and strategy, as detailed on pages 75 and 76.
Achievement of the minimum performance over the performance period would result in 25 per cent of the awards vesting on 3 May 2021 together with the corresponding dividend equivalent. The 2018 PSP awards are subject to the two-year post-vesting holding period and recovery and withholding provisions detailed in the policy table on page 62.
Directors’ remuneration report continued
74
GOVERNANCE

The number of awards over shares in the Company (pursuant to the PSP) held by each person who served as an executive director of the Company during the financial year, is shown below:
Executive directorDate
granted
Balance as at 1 January
2018*Granted
during year
Market price at date of award pence
Vested during
year
Market price at date of vesting
pence
Market price at date of
exercise pence
Lapsed during
year
Amount realised on
exercise £
Balance as at 31 December
2018* Performance period
D J White 11.09.17 599,778 - 161.50 – n/a n/a – n/a 599,778 01.01.17-31.12.193
03.05.18 – 1,082,130 89.05 - n/a n/a - n/a 1,082,130 01.01.18-31.12.205
M A Whiteling 02.10.17 526,840 - 116.25 - n/a n/a - n/a 526,840 01.01.17-31.12.19 3
03.05.18 - 674,250 89.05 - n/a n/a – n/a 674,250 01.01.18-31.12.205
D I Sutherland 01.06.15 71,784 - 619.50 - n/a n/a 71,784 - - 01.01.15-31.12.171
05.04.16 106,425 - 419.60 - n/a n/a - n/a 106,425 01.01.16-31.12.182
06.04.17 213,802 - 223.50 - n/a n/a - n/a 213,802 01.01.17-31.12.194
03.05.18 - 524,730 89.05 - n/a n/a - n/a 524,730 01.01.18–31.12.205
1 As detailed in last year’s Remuneration Report, the 2015 PSP award’s performance conditions were not met and the awards lapsed in full on 1 June 2018.
2 As detailed on page 72, the 2016 PSP award’s performance conditions were not met and the awards will lapse in full.
* The maximum number of shares that could be receivable by the executive if performance conditions set out below are fully met:
3 The Reduction of Net Debt Performance Condition for the 2017 Awards (applicable to Debbie White and Mark Whiteling only) As disclosed last year, net debt targets were set for the PSP awards granted to Debbie White and Mark Whiteling in 2017 to align with the Group’s core strategic priority. The actual average net debt numbers underpinning the sliding scale are considered to be commercially sensitive and as a result have not been included below. The actual targets and performance against them will be published in the 2019 Directors’ Remuneration Report. For further details, see last year’s Remuneration Report. The 2017 PSP awards were granted in the form of nil-cost options. Debbie White’s options are exercisable between 11 September 2020 and 10 September 2022. Mark Whiteling’s options are exercisable between 2 October 2020 and 1 October 2022.
Average Q4 2019 net debt Vesting percentage of shares subject to the award
Less than target 0%
Target 25%
Between target and maximum 25% to 100% (pro-rated)
Maximum (89.2% of target to reflect reduced debt aspiration) 100%
4 The EPS Performance Condition for the 2017 Awards (applicable to Dougie Sutherland only) The EPS condition measures EPS growth from the 2016 normalised EPS result through to the conclusion of the 2019 financial year.
Normalised EPS growth of the Company over the performance period Vesting percentage of two-thirds of shares subject to the award
Less than 6% 0%
6% to 30% 25% to 100% (pro-rated)
Greater than 30% 100%
4 The TSR Performance Condition for the 2017 Awards (applicable to Dougie Sutherland only) This condition is determined by comparing the Company’s TSR performance to the TSR of each company in the FTSE Small Cap and the FTSE 250, excluding investment trusts.
TSR ranking of the Company compared to the Comparator Group over the performance period Vesting percentage of one-third of shares subject to the award
Below median ranking 0%
Median ranking (top 50%) 25%
Median to upper quartile ranking 25% to 100% (pro-rated)
Upper quartile ranking (top 25%) 100%
The 2017 PSP awards were granted to Dougie Sutherland in the form of nil-cost options, exercisable between 6 April 2020 and 5 April 2022.
5 The TSR Performance Condition for the 2018 Awards This condition is determined by comparing the Company’s TSR performance to the TSR of each company in the FTSE Small Cap and the FTSE 250, excluding investment trusts.
TSR ranking of the Company compared to the Comparator Group over the performance period Vesting percentage of one-third of shares subject to the award
Below median ranking 0%
Median ranking (top 50%) 25%
Median to upper quartile ranking 25% to 100% (pro-rated)
Upper quartile ranking (top 25%) 100%
75
Governance
Financial Statements
Strategic Report
Overview

5 The Cumulative Operating Profit Condition for the 2018 Awards The actual operating profit numbers underpinning the sliding scale are considered to be commercially sensitive and as a result have not been included below. The targets and performance against them will be disclosed in the 2020 Directors’ Remuneration Report. For further details, see last year’s Remuneration Report.
Cumulative operating profit (2018 + 2019 + 2020) Vesting percentage of one-third of shares subject to the award
Less than 86.3% of target operating profit 0%
86.3% of target operating profit 25%
100% of target operating profit 50%
113.7% of target operating profit 100%
Straight-line vesting between performance points
5 The Strategic Targets Condition for the 2018 Awards One-third of the award will vest based on how successfully the Company’s business transformation plan and strategy are implemented. The strategic targets have been set against the targets included in the Company’s transformation plan and strategy through to 2020. As with the operating profit target detailed above, the actual strategic targets are considered commercially sensitive and the Committee intends to provide full details of the actual targets and our performance against them in the 2020 Directors’ Remuneration Report. For further details, see last year’s Remuneration Report.
In addition to the above, the vesting of the award will be subject to a general financial underpin that will require the Committee to be satisfied that the vesting result is consistent with the underlying financial performance of the Company over the performance period. Should this not be the case, the Committee retains discretion to reduce the vesting outcome to better reflect underlying financial performance.
The 2018 PSP awards were granted in the form of nil-cost options, exercisable between 3 May 2021 and 2 May 2023.
Chief Executive Officer’s buy-out awards (audited information) On 11 September 2017 Debbie White was granted a share award over 1,897,899 shares to replace her forfeited awards from previous employment. Consistent with the Company’s Remuneration Policy, the share award replicates, as far as practicable, the terms (including performance conditions where relevant and time period to vesting) and value of awards forfeited by Mrs White in agreeing to join the Company. Where forfeited awards were subject to performance conditions, these awards have been exchanged for shares in Interserve at an equivalent face value at the date she joined the Company but with the number of shares vesting remaining subject to the extent to which the performance conditions in her previous employer are ultimately met. This approach results in the new Chief Executive Officer being aligned with Interserve shareholders through holding an interest in the Company’s shares but results in no personal benefit being derived from the switching of employment. Details of the performance conditions applying to Mrs White’s share awards are included in the Report and Accounts of Mrs White’s previous employer. Where share awards were not subject to performance conditions (i.e. shares were awarded that vested based on continued employment only), these shares were replaced by an equivalent value of Interserve shares calculated at the time of commencing employment with vesting to take place over the same time period as the awards forfeit. No consideration was paid for the grant of these awards.
Details of the share awards, which will be satisfied by market purchase shares and which are subject to the rules governing the award and to Mrs White’s ongoing employment with the Company, are shown below:
TrancheDate
granted
Balance as at 1 January
2018Granted
during year
Market price at date of
award pence
Vested during year
Market price at date of
vesting pence
Lapsed during year
Amount realised on
vesting £
Balance as at 31 December
2018 Vesting date
1 11.09.17 481,158 - 161.50 481,158 90.20 - 442,665 - 01.05.181 3
2 11.09.17 267,310 - 161.50 - n/a - n/a 267,310 27.04.191
3 11.09.17 133,655 - 161.50 - n/a - n/a 133,655 27.04.192
4 11.09.17 133,655 - 161.50 - n/a - n/a 133,655 27.04.192
5 11.09.17 133,655 - 161.50 - n/a - n/a 133,655 09.09.191
6 11.09.17 66,827 - 161.50 - n/a - n/a 66,827 09.09.192
7 11.09.17 66,827 - 161.50 - n/a - n/a 66,827 09.09.192
8 11.09.17 307,406 - 161.50 - n/a - n/a 307,406 27.04.201
9 11.09.17 153,703 - 161.50 - n/a - n/a 153,703 27.04.202
10 11.09.17 153,703 - 161.50 - n/a - n/a 153,703 27.04.202
1 No performance conditions apply.
2 Performance conditions apply.
3 Vesting of the first tranche was originally due to take place on 11 March 2018 but was conditionally deferred until the dealing day after the Company announced its annual results, in accordance with the terms of the restricted stock contract.
Directors’ remuneration report continued
76
GOVERNANCE

Share options (audited information)No options were granted to, or exercised by, the executive directors during the year pursuant to an executive share option scheme and none remain outstanding. The aggregate gain made on the exercise of options was £nil (2017: £nil). The market price of the shares as at 31 December 2018 was 10.62p. The highest and lowest market prices of the shares during the financial year were 123.5p and 10.4p respectively.
Sharesave Scheme (audited information) No grants were made to the executive directors under the Interserve Sharesave Scheme 2009 during the year and no options remain outstanding. All eligible employees are entitled to apply for options under the Sharesave Scheme. The maximum monthly savings amount is set annually by the Remuneration Committee within HMRC limits. There are no performance conditions attached to the options.
Under the scheme rules, the exercise price is calculated by taking the average of the mid-market closing share price for the five dealing days immediately preceding the invitation date less a discount set by the Remuneration Committee up to a maximum of 20 per cent.
Shareholding guidelinesExecutive directors are expected to build up over time a shareholding equivalent to 200 per cent of their base salary. Further details of the shareholding guidelines are set out in the executive directors’ remuneration policy table on page 63.
Shareholdings of directors (audited information)The beneficial interests of each person who served as a director of the Company during the financial year in the share capital of the Company, together with interests held by his connected persons, are shown below, together with details of the extent to which the executive directors have met the requirement to hold shares to the value of 200 per cent of salary:
31 December 2018 Beneficially Owned
31 December 2017 Beneficially Owned
31 December 2018
Outstanding vested PSP awards
% shareholding requirement
(% of salary/fee)
% actual shareholding
(% of salary/fee)1
Executive directors
D J White 640,030 65,408 - 200% 34.4%
M A Whiteling 30,000 - - 200% 2.6%
D I Sutherland 149,147 149,145 - 200% 16.5%
Non-executive directors
G A Barker 93,970 93,970 - n/a n/a
G M Edwards 21,350 21,350 - n/a n/a
A K Fahy 8,000 8,000 - n/a n/a
R J King 3,000 3,000 - n/a n/a
K L Ludeman 4,9902 4,990 - n/a n/a
C N Pollard 7,723 –3 - n/a n/a
N R Salmon 5,000 5,000 - n/a n/a
1 Using a share price of 35.63p, being the three-month average to 31 December 2018.
2 As at 12 June 2018, when Keith Ludeman stepped down from the Board.
3 As at 26 June 2018, when Nick Pollard was appointed to the Board.
The above figures include shares held in trust pursuant to the Share Incentive Plan (SIP).
Between the year end and the date of this report, there have been no changes in the shareholdings of the directors who held office at the year end.
Dilution limits Under present dilution limits the Company is permitted to allocate a rolling 10-year aggregate of up to 10 per cent of its ordinary share capital (14,971,993 shares) under all its share schemes. At 31 December 2018 there remained headroom equivalent to 4,420,523 shares over which options may be granted under the Company’s share schemes.
77
Governance
Financial Statements
Strategic Report
Overview

GOVERNANCE AND OPERATION OF THE REMUNERATION COMMITTEE Role and membershipThe Committee is responsible for determining, on behalf of the Board, the remuneration of all executive directors, the Group Chairman and the Company Secretary. The terms of reference of the Committee are available on the Company’s website at www.interserve.com and on request.
The Committee’s role is, after consultation with the Group Chairman and/or the Chief Executive Officer (except when determining their own remuneration), to set the remuneration policy and determine the individual remuneration and benefit packages of the Group Chairman, the Chief Executive Officer and the senior management team (comprising the executive directors, the Company Secretary and the other senior executives below the Board who report to the Chief Executive Officer). This includes formulating for Board approval long-term incentive plans which require shareholder consent and overseeing their operation. The Committee also monitors the terms of service for, and level and remuneration structure of, other senior management. The table below lists the members of the Committee who served during the year and are regarded as independent by the Board.
Name Date of appointment to Committee
N R Salmon (Committee Chairman)1 1 August 2014
G A Barker 1 January 2016
G M Edwards 23 June 2017
A K Fahy 1 January 2013
R J King 1 September 2014
K L Ludeman2 1 January 2011
1 Appointed as Committee Chairman on 12 June 2018.
2 Keith Ludeman (former Committee Chairman) resigned on 12 June 2018.
The Committee meets as often as is necessary to discharge its duties and met seven times during the year ended 31 December 2018. Members’ attendance at the meetings is set out in the table on page 46. The Chief Executive Officer and Chief Financial Officer may be invited to attend meetings as appropriate.
No member of the Committee has any personal financial interest in the Company (other than as a shareholder), any conflict of interest arising from cross-directorships, or any day-to-day involvement in running the business. No individual is present when matters relating directly to their own remuneration are discussed.
An independent evaluation of the Committee’s effectiveness is included with the independent board evaluation process that is due to report in 2019, as detailed in the Corporate Governance Report on page 47.
Advisers In determining the executive directors’ remuneration, the Committee consulted with and received recommendations from Debbie White. The Committee also received advice from Korn Ferry and Sally Cabrini, Director of Transformation, People and IT, which materially assisted the Committee in relation to the 2018 financial year. Executives are not present when matters affecting their own remuneration arrangements are decided.
Korn Ferry was appointed to provide independent advice to the Committee on remuneration matters for a period of three years commencing on 1 January 2017. Korn Ferry is a signatory to the Remuneration Consultants’ Code of Conduct and has confirmed its compliance with the Code. The fees paid to Korn Ferry in respect of its services to the Committee during the year was £95,000 excluding VAT. The advice provided included providing IFRS 2 and performance monitoring in addition to providing advice in relation to the design and implementation of incentive arrangements. The Committee reviews the performance of its advisers periodically and is satisfied that the advice it has received from Korn Ferry has been objective and independent.
Representatives from Korn Ferry meet either on a one-to-one basis with the Committee Chairman, or with the Director of Transformation, People and IT or Company Secretary, as necessary, to discuss matters such as topical issues in remuneration which are of relevance to the Company or if there are specific pieces of work which the Committee requires to be undertaken.
Directors’ remuneration report continued
78
GOVERNANCE

Statement of shareholder voting at AGMAt the AGM held on 12 June 2018, the Directors’ Remuneration Policy and the Annual Report on Remuneration received the following votes from shareholders:
Resolution Votes for % for Votes against % againstTotal votes cast
(excluding votes withheld) Votes withheld
Directors’ Remuneration Policy 41,540,619 97.86 908,028 2.14 42,448,647 561,872
Annual Report on Remuneration 34,729,009 82.87 7,179,574 17.13 41,908,583 1,109,937
APPROVALThe Directors’ Remuneration Report was approved by the Board of Directors on 8 March 2019 and signed on its behalf by:
Nick SalmonChairman of the Remuneration Committee 8 March 2019
79
Governance
Financial Statements
Strategic Report
Overview

Directors’ report
The directors of Interserve Plc (the Company) present their report and the audited consolidated financial statements for the year ended 31 December 2018.
SCOPE OF REPORTINGFor the purposes of compliance with paragraphs 4.1.5R(2) and 4.1.8R of the Disclosure Guidance and Transparency Rules (the DTRs) of the Financial Conduct Authority (the FCA), the required content of the “management report” can be found in the Strategic Report and this Directors’ Report (including the sections of the Annual Report and Financial Statements incorporated by reference).
The directors’ responsibility for the preparation of the Annual Report and Financial Statements, which forms part of this report, and the statement by the auditors about their reporting responsibilities, are set out on pages 87 and 98, respectively, of this Annual Report.
A review of the development of the Group and its future prospects is included in the Chairman’s Statement, which is incorporated into this Directors’ Report by reference. The Group’s business model and strategy are summarised in the Strategic Report.
The DTRs also require certain information to be included in a corporate governance statement in the Directors’ Report. Information that fulfils the requirements of the corporate governance statement can be found in the Corporate Governance Report and the Audit Committee Report, which are incorporated into this Directors’ Report by reference.
Information required to be disclosed under Listing Rule 9.8.4R can be found in the following locations:
Section of LR 9.8.4R Topic Location
(1) Interest capitalised by the Group Financial Review
(2) Information required by Listing Rule 9.2.18
Consolidated Financial Statements
(4) Details of long-term incentive schemes
Directors’ Remuneration Report
(12) Shareholder waivers of dividends Directors’ Report
(13) Shareholder waivers of future dividends
Directors’ Report
The remaining disclosures required by Listing Rule 9.8.4R are not applicable to the Company.
All the information cross-referenced above is hereby incorporated by reference into this Directors’ Report.
THE COMPANYPrincipal activitiesThe Company is incorporated in the UK with company number 00088456 and is the holding company of the Interserve Group. The Group’s activities, both in the UK and internationally, are focused on the provision of outsourced support services; the design, construction and maintenance of buildings and infrastructure; and the design, hire and sale of formwork, falsework and associated access equipment.
BranchesThe Company, through various subsidiaries, has established branches in a number of different countries in which the Group operates. Details of the Company’s related undertakings are listed on page 175 to 180.
Amendment of the Articles of AssociationThe Company’s constitution, known as the articles of association (the Articles), is essentially a contract between the Company and its shareholders, governing the management of the Company. A copy of the Articles is available on our website at www.interserve.com or can be obtained on request from the Company Secretary. Amendments to the Articles must be approved by at least 75 per cent of those voting in person or by proxy at a general meeting of the Company.
FINANCIAL RESULTSThe Group’s Consolidated Income Statement set out on page 100 shows Group loss before taxation of £111.3 million (2017: loss of £244.4 million). The detailed results of the Group are given in the financial statements on pages 100 to 158 and further comments on divisional results are given in the Operational Review on pages 24 to 30.
On 27 February 2019 Interserve announced a proposed Deleveraging Plan, which the directors believe will provide the Group with sufficient liquidity to service its short-term cash obligations, create a strong balance sheet and a fundamentally strong foundation from which the Group can improve its business and deliver on its long-term strategy.
The Deleveraging Plan is a consensual restructuring of Interserve, which is urgently required to avoid a default in the existing financing arrangements and to provide sufficient liquidity, cash and bonding facilities to allow the Group to service short-term obligations and secure a stable platform. Such a default, were it to occur, would be expected to have material adverse
Andrew McDonaldGeneral Counsel and Company Secretary
80
GOVERNANCE

consequences for stakeholders and, in particular, for existing shareholders.
The Deleveraging Plan preserves fully the pre-emption rights of existing shareholders. If they take up their entitlements in the equity raise their ownership will not be diluted and they will participate on the same terms as lenders.
Shareholders are being asked to approve the Deleveraging Plan at a General Meeting which has been convened at 11.00 am on 15 March 2019. For further information on the Deleveraging Plan, including a copy of the prospectus published on 27 February 2019, please visit www.interserve.com.
Further post-balance sheet events that require disclosure or adjustment in the financial statements can be found in note 33 to the consolidated financial statements and the Financial Review on pages 35 to 41.
DIVIDENDSNo interim dividend was paid in respect of the 2018 financial year (2017: nil). The directors do not recommend a final dividend to be paid for 2018 (2017: nil).
Link Trustees (Jersey) Limited, the trustee of the Interserve Employee Benefit Trust (the Trust), has waived its rights to receive dividends on any shares held by the Trust in the name of Link Market Services Trustees (Nominees) Limited. As no dividends were paid during the 2018 financial year, no dividends were waived over shares held by the Trust (2017: nil).
DIRECTORS AND DIRECTORS’ INTERESTSThe following have served as directors during the year:
Glyn Barker* (Group Chairman)
Gareth Edwards*
Anne Fahy*
Russell King* (Senior Independent Director)
Keith Ludeman*1
Nick Pollard*2
Nick Salmon*
Dougie Sutherland
Debbie White (Chief Executive Officer)
Mark Whiteling (Chief Financial Officer)
* Non-executive director
1 Resigned from the Board on 12 June 2018
2 Appointed to the Board on 26 June 2018
Since the year end, Dougie Sutherland stepped down from the Board on 12 February 2019.
The biographical details of the directors of the Company are given on pages 42 and 43.
The powers of the directors, and their service contracts and terms of appointment, are described in the Corporate Governance report.
The directors’ beneficial interests in, and options to acquire, shares in the Company, are set out on pages 74 to 77 of the Directors’ Remuneration Report.
The directors do not have any interest in any other Group company, other than as directors. No director has, or has had,
a material interest, directly or indirectly, at any time during the year under review in any contract significant to the Company’s business.
APPOINTMENT AND REPLACEMENT OF DIRECTORSThe Board must comprise of not less than three and no more than 12 directors. Directors may be appointed by shareholders (by ordinary resolution) or by the Board.
Under the Company’s Articles, any director appointed by the Board since the last AGM may only hold office until the date of the next AGM, at which time that director must stand for election by shareholders. Nick Pollard will therefore be standing for election at the 2019 AGM.
The Articles also require one-third of the directors to retire by rotation at each AGM. Any director who has not retired by rotation must retire at the third AGM after his or her last appointment or re-appointment. However, in accordance with the UK Corporate Governance Code, all the directors will be subject to election or re-election at this year’s AGM.
No person other than a director retiring at a general meeting shall, unless recommended by the directors for election, be eligible for election to the office of director unless, not less than seven nor more than 21 days beforehand, the Company has been given notice, executed by a shareholder eligible to vote at the meeting, of his intention to propose such person for election together with a notice executed by that person of his willingness to be elected.
The Company may, by ordinary resolution, of which special notice has been given in accordance with section 312 of the Companies Act 2006 (the 2006 Act), remove any director before the expiration of his period of office and may, by ordinary resolution, appoint another person in his stead.
DIRECTORS’ INDEMNITIES AND INSURANCEAs permitted by the Company’s Articles, qualifying third-party indemnities have been in place throughout the period under review and remain in force at the date of this report in respect of liabilities suffered or incurred by each director. The Company also undertakes to loan such funds to a director as it, in its reasonable discretion, considers appropriate for the director to meet expenditure incurred in defending any criminal or civil proceeding or in connection with any application under section 661(3) or 1157 of the 2006 Act on terms which require repayment by the director of amounts so advanced upon conviction of final judgment being given against him or her. The deeds of indemnity are available for inspection by shareholders at the Company’s registered office. The Company also maintains an appropriate level of directors’ and officers’ insurance in respect of legal actions against the directors. Neither the qualifying third-party indemnities nor the insurance provide cover where the director has acted fraudulently or dishonestly.
On 26 September 2007 the rules of the Interserve Pension Scheme were amended in order to provide the directors of Interserve Trustees Limited, the corporate trustee of the Interserve Pension Scheme, with a qualifying pension scheme indemnity to the extent that insurance has not been taken out by the trustee to cover its liabilities, or such liabilities cannot be paid from the proceeds of any insurance taken out by the trustee. That qualifying pension scheme indemnity remains in force at the date of this report and is available for inspection by shareholders at the Company’s registered office.
81
Governance
Financial Statements
Strategic Report
Overview

Directors’ report continuedIn January 2011 an indemnity was given to the trustees of the Douglas Group Compass Pension Plan for any claim, costs, loss, damages and expenses which may be made against them or which they may pay or incur (save as a consequence of breach of trust committed knowingly and intentionally or as a result of negligence) in connection with the administration of the Plan and the winding-up of the Plan. Two of the trustees were also directors of one or more Group subsidiary companies. This Plan was formally wound up on 7 January 2011 but the indemnity remains in force.
In January 2012 an indemnity was given to the trustees of the Interserve Retirement Plan against all and any claims, costs, damages and expenses which may be made against them or which they may pay or incur in connection with their administration of the Plan and the winding-up of the Plan (other than liabilities arising as a consequence of breach of trust committed knowingly and intentionally). One of the trustees was also a director of various Group subsidiary companies. This Plan was formally wound up 31 January 2012 but the indemnity remains in force.
EMPLOYEESThe average number of persons, including directors, employed by the Group and their remuneration, is set out in note 6 to the consolidated financial statements. A breakdown of employee diversity, as required by the 2006 Act, can be viewed on pages 28 and 29 of the Strategic Report. The Group’s statement with regard to its employees, including its disclosure on employee consultation, equal opportunities and diversity, is set out within the Strategic Report on pages 26 to 29.
GREENHOUSE GAS EMISSIONSIn this section we report on greenhouse gas (GHG) emissions in accordance with the Companies Act 2006 (Strategic Report and Directors’ Report) Regulations 2013.
A range of approaches can be taken to determine the boundaries of an organisation for the purposes of GHG reporting including ‘financial control’, ‘operational control’ or ‘equity share’. We report using the financial control approach to define our organisational boundary.
On this basis, we are including emissions associated with our owned and controlled businesses but not the emissions from our associate companies. GHG emissions from our leased vehicles when used on company business are reported, in addition to emissions associated with our construction sites.
Summary tableGlobal GHG emissions data for 1 January 2013 to 31 December 2018 is as follows:
2018 2017 2016 2015 2014 2013
Emissions from:
- Combustion of fuel and operation of facilities 57,718 61,596 79,9491 61,352 64,440 61,174
- Electricity, heat, steam and cooling purchased for own use 14,007 14,476 14,366 20,133 14,331 13,045
Intensity measurement:
- Emissions reported above, normalised to tonnes CO2e per £m revenue
24.02 23.24 28.70 25.09 25.03 31.54
1 Increase predominantly relates to the consumption of 6 million litres of gas oil/diesel associated with specific contracts undertaken by The Oman Construction Company LLC and Adyard Abu Dhabi LLC.
We have reported on all of the emissions sources required under the Companies Act 2006 (Strategic Report and Directors’ Report) Regulations 2013. These sources fall within our consolidated financial statements.
We have used the “Environmental Reporting Guidelines: including mandatory greenhouse gas emissions reporting guidance” (June 2013) issued by DEFRA and the “UK Government GHG Conversion Factors for Company Reporting” (June 2016) to calculate our emissions based on data gathered from each of our business units.
Additional information relating to the Group’s GHG emissions and some of the actions being taken to mitigate our impact on the environment are set out within the Strategic Report.
POLITICAL DONATIONSThe Group made no political donations and incurred no political expenditure during the year (2017: £nil). It is not the Company’s policy to make cash donations to political parties. This policy is strictly adhered to and there is no intention to change it.
FINANCIAL INSTRUMENTS AND RISK MANAGEMENTThe Group’s exposure to and management of capital, liquidity, credit, interest rate and foreign currency risk are set out within the Financial Review section of the Strategic Report on pages 35 to 41.
82
GOVERNANCE

SHARE CAPITAL AND STRUCTUREGeneralThe Group is financed through both equity share capital and debt instruments. Details of the Company’s share capital is provided below and information on the debt instruments is set out in note 20 to the consolidated financial statements.
In connection with the 2018 refinancing, on 2 May 2018 the Company created and issued 36,428,530 warrants over ordinary shares in the capital of the Company to certain of its lenders, representing 20 per cent of the Company’s existing issued share capital at that time as enlarged by the exercise of the warrants. The warrants are freely transferable and may be exercised at any time at a subscription price of 10p per share, either by payment of the subscription price or by a cashless exercise mechanism. Further details are set out in note 20 to the consolidated financial statements.
Following approval by shareholders at the AGM on 12 June 2018 and in connection with the issue of the warrants, the Company’s issued share capital of 149,719,938 ordinary 10p shares was sub-divided into 149,719,938 ordinary shares of 0.1p and 149,719,938 deferred shares of 9.9p. The sub-division was required to enable the exercise price of the warrants to be reduced to less than 10p, if necessary, as a result of certain dilutive events such that ordinary shares could be allotted pursuant to the exercise of warrants at a price not less than the nominal value of the ordinary shares (as would be prohibited under the 2006 Act).
The economic and voting rights of the ordinary 0.1p shares remain the same as the ordinary 10p shares. The deferred shares were created to enable the Company to reduce the nominal value of the ordinary shares without going through a process that would require Court approval. The deferred shares were issued to all persons on the Company’s register of members as at 12 June 2018 on the basis of one deferred share for each ordinary share held. The deferred shares, which are not listed or admitted to trading on any investment exchange, are not transferable, do not carry any voting or dividend rights and are not expected to have any economic value.
All ordinary and deferred shares are fully paid up. The ordinary 0.1p shares are quoted on the London Stock Exchange. No person holds shares carrying special rights with regard to control of the Company.
4,005,818 of the warrants were exercised on 16 May 2018 for a cash consideration of approximately £0.4 million and the equivalent number of ordinary 10p shares issued to the warrant holders who had exercised those warrants. The Company’s issued share capital at the end of the year therefore stood at 149,719,938 ordinary shares of 0.1p each and 149,719,938 deferred shares of 9.9p each (£14,971,994) (2017: 145,714,120 ordinary shares of 10p each - £14,571,412).
No further shares have been issued since the year end. The issued share capital at the date of this report therefore stands at 149,719,938 ordinary shares of 0.1p each (£149,719.94) (representing 1 per cent of the Company’s issued share capital) and 149,719,938 deferred shares of 9.9p each (£14,822,273.86) (representing 99 per cent of the Company’s issued share capital).
Details of outstanding awards and options over shares in the Company as at 31 December 2018 are set out in notes 26 and 28 to the consolidated financial statements.
Issue of sharesSection 551 of the 2006 Act provides that the directors may not allot shares unless empowered to do so by shareholders. As detailed above, the Company issued 36,428,530 warrants over ordinary shares in the capital of the Company during the year under the authority granted at the 2017 AGM. 4,005,818 of the warrants were exercised during the year and the equivalent number of ordinary 10p shares issued to the warrant holders who had exercised those warrants. No further warrants were exercised during the year or since the year end.
A resolution giving such authority was also passed at the AGM held on 12 June 2018. No shares have been allotted by the Company under the authority granted at the 2018 AGM.
The directors will propose a similar resolution at the 2019 AGM to renew the authority granted to them at the 2018 AGM to allot shares up to an aggregate nominal value of one-third of the Company’s issued share capital and, in accordance with the Investment Association’s Share Capital Management Guidelines, the directors again propose to extend this by a further one-third (i.e. two-thirds in all) where the allotment is in connection with a rights issue.
Under section 561 of the 2006 Act, if the directors wish to allot unissued shares for cash (other than pursuant to an employee share scheme) they must first offer them to existing shareholders in proportion to their holdings (a pre-emptive offer). In March 2015, the Pre-Emption Group issued a revised Statement of Principles for the disapplication of pre-emption rights (the Principles). In addition to the standard annual disapplication of pre-emption rights up to a maximum equal to five per cent of issued ordinary share capital, the Pre-Emption Group is now supportive of extending the general disapplication authority for an additional five per cent in connection with an acquisition or specified capital investment.
In line with the Principles, the directors are again seeking approval at the 2019 AGM for the disapplication of pre-emption rights up to an aggregate nominal value of no more than five per cent of the Company’s issued ordinary share capital on an unrestricted basis and an additional five per cent in connection with an acquisition or specified capital investment. In accordance with recommended best practice, the Company has split the section 561 resolution into two separate resolutions. Further information is set out in the Notice of AGM.
The Principles also require that in any rolling three-year period a company does not make non-pre-emptive issues for cash or of equity securities exceeding 7.5 per cent of the company’s issued share capital without prior consultation with shareholders.
Pursuant to its employee share schemes, the Company issued none of its issued share capital on a non-pre-emptive basis in 2018 and 0.3 per cent in the period 2016 to 2018 (calculated by reference to the Company’s closing issued share capital at 31 December 2018).
The warrants described above were issued to the Company’s lenders for non-cash consideration on the basis that the consideration was the lenders’ agreement to vary the terms of the existing financing and their agreement to provide a new loan. The statutory pre-emption requirements in section 561 do not apply to an allotment of equity securities if they are to be paid up otherwise than in cash (as was the case for the warrants).
83
Governance
Financial Statements
Strategic Report
Overview

Directors’ report continuedSave for issues of shares in respect of various employee share schemes, the directors have no current plans to make use of the renewed authorities sought by the three resolutions outlined above, although they consider their renewal appropriate in order to retain maximum flexibility to take advantage of business opportunities as they arise.
Purchase of own sharesThe Company has authority under a shareholders’ resolution passed at the 2018 AGM to repurchase up to 14,571,412 of the Company’s ordinary shares in the market. This authority expires on 30 June 2019 or at the conclusion of the 2019 AGM, whichever is earlier. No shares have been repurchased by the Company under the authority granted at the 2018 AGM.
A similar resolution will be proposed as a special resolution at the 2019 AGM in order to renew this authority. Although the directors have no immediate plans to do so, they believe it is prudent to seek general authority from shareholders to be able to act if circumstances were to arise in which they considered such purchases to be desirable. This power will only be exercised if and when, in the light of market conditions prevailing at that time, the directors believe that such purchases would increase expected earnings per share and would be for the benefit of shareholders generally.
The authority sets the minimum and maximum prices at which the shares may be bought and it will be limited to a maximum of 10 per cent of the Company’s issued share capital calculated at the latest practicable date prior to the publication of the Notice of AGM. Any shares purchased under this authority will be cancelled (unless the directors determine that they are to be held as treasury shares) and the number of shares in issue will be reduced accordingly.
Whilst the Company does not presently hold shares in treasury, the Treasury Shares Regulations allow shares purchased by the Company out of distributable profits to be held as treasury shares, which may then be cancelled, sold for cash or used to meet the Company’s obligations under its employee share schemes. The authority sought by this resolution is intended to apply equally to shares to be held by the Company as treasury shares in accordance with the Treasury Shares Regulations.
SHAREHOLDERS’ RIGHTSGeneralThe rights attaching to the ordinary and deferred shares are set out in the 2006 Act and the Company’s Articles.
A shareholder whose name appears on the register of members may choose whether those shares are evidenced by share certificates (certificated form) or held in electronic form (uncertificated) in CREST.
VotingSubject to the restrictions set out below (particularly in relation to the deferred shares), a shareholder is entitled to attend (or appoint another person as his representative (a proxy) to attend) and to exercise all or any of his rights to speak, ask questions and vote at any general meeting of the Company. A shareholder may also appoint more than one proxy, provided that each proxy is appointed to exercise the rights attached to a different share or shares held by that shareholder. A proxy need not be a shareholder of the Company.
In accordance with section 327 of the 2006 Act, in order to be valid, any form of proxy sent by the Company to shareholders or any proxy registered electronically in relation to any general meeting must be delivered to the Company’s registrars not later than 48 hours before the time fixed for holding the meeting (or any adjourned meeting). In calculating the 48-hour period no account shall be taken of any part of a day that is not a working day. Full details of the deadlines for exercising voting rights in respect of the 2019 AGM are set out in the Notice of AGM.
Subject to any rights or restrictions for the time being attached to any class or classes of shares and to any other provisions of the Articles or statutes, on a vote on a resolution at a general meeting on a show of hands every shareholder present in person, every proxy present who has been duly appointed by one or more shareholders entitled to vote on the resolution and every authorised representative of a corporation which is a shareholder of the Company entitled to vote on the resolution, shall have one vote. If a proxy has been duly appointed by more than one shareholder and has been instructed by one or more of those shareholders to vote for the resolution and by one or more of those shareholders to vote against it, that proxy shall have one vote for and one vote against the resolution. On a poll, every shareholder present in person or by proxy shall have one vote for every share held.
If a person fails to comply with a notice served on him by the Company under section 793 of the 2006 Act (which confers upon public companies the power to require information to be supplied in respect of a person’s interests in the Company’s shares) then the Company may, no sooner than 21 days later, and after warning that person, serve a disenfranchisement notice upon the shareholder. Unless the information required is given within 14 days, such holder will not be entitled to receive notice of any general meeting or attend any such meeting of the Company and shall not be entitled to exercise, either personally or by proxy, the votes attaching to such shares in respect of which the disenfranchisement notice has been given until the information required by the section 793 notice has been provided.
The Company operates a number of employee share schemes. Under some of these arrangements, shares are held by trustees on behalf of employees. The employees are not entitled to exercise directly any voting or other control rights. The trustees abstain from voting on these shares.
As permitted by the Company’s Articles and in line with practice increasingly adopted by UK public companies, voting at the 2019 AGM will be conducted by way of a poll rather than a show of hands. Voting by poll is considered to be a more transparent and equitable method of voting because it includes the votes of all shareholders, including those cast by proxies in advance of the meeting, rather than just the votes of those shareholders who attend the meeting. As soon as practicable following the AGM, the results of the poll will be published via a Regulatory News Service and on the Company’s website at www.interserve.com.
DividendsSubject to the restrictions below in respect of deferred shares and subject to the provisions of the 2006 Act, the Company may, by ordinary resolution, declare a dividend to be paid to the shareholders but the amount of the dividend may not exceed the amount recommended by the directors. The directors may also pay interim dividends on any class of shares on any dates and in any amounts and in respect of any periods as appear to the directors to be justified by the distributable profits of the Company.
84
GOVERNANCE

Transfer of sharesSubject to the restrictions below in respect of deferred shares, there are no specific restrictions on the transfer of securities in the Company, or on the size of a shareholder’s holding, which are both governed by the Articles and prevailing legislation. In accordance with the EU Market Abuse Regulation, certain employees are required to seek the approval of the Company to deal in its shares.
The Company is not aware of any agreements between its shareholders that may result in restrictions on the transfer of securities or on voting rights.
Subject to the 2006 Act, the directors may refuse to register any transfer of any share which is not fully paid (whether certificated or uncertificated), provided that the refusal does not prevent dealing in shares in the Company from taking place on an open and proper basis.
The directors may also decline to register the transfer of any certificated share unless the instrument of transfer is duly stamped (if stampable) and accompanied by the certificate of the shares to which it relates and such other evidence as the directors may reasonably require to show the right of the transferor to make the transfer.
Transfers of uncertificated shares must be conducted through CREST and the directors can refuse to register transfers in accordance with the regulations governing the operation of CREST.
All share transfers must be registered as soon as practicable.
Deferred sharesA deferred share does not entitle its holder to receive dividends or distributions, does not entitle its holder to receive notice of nor to attend, speak or vote at, any general meeting of the Company and is not capable of transfer without the prior written consent of the directors of the Company.
Further, the Company, at its option, may force a transfer of any or all deferred shares for nil consideration to any person appointed by the directors, may purchase any or all of the deferred shares for nominal consideration, or may cancel any or all deferred shares for nil consideration.
SUBSTANTIAL SHAREHOLDINGSAs at 31 December 2018 the Company had been notified, pursuant to paragraph 5 of the DTRs, of the following notifiable voting rights in its ordinary share capital:
Name of holder Number of ordinary shares Percentage of total voting rights1 Nature of holding
Coltrane Asset Management, LP 40,874,655 27.3 Indirect
The Goldman Sachs Group, Inc 15,232,700 10.2 Indirect
Standard Life Aberdeen plc 10,325,162 6.9 Indirect
Farringdon Capital Management2 10,095,665 6.7 Indirect
Deutsche Bank AG 8,550,819 5.7 Direct
Old Mutual Plc 7,184,490 4.8 Indirect
Blackwell Partners LLC2 5,916,987 4.0 Direct
1 Calculated according to the number of total voting rights as at 31 December 2018.
2 Farringdon’s direct holding (Blackwell Partners LLC) is included within its larger indirect holding.
Between the year end and the date of this report (being a date not more than one month prior to the date of the AGM Notice), the Company has been notified that the interests in the voting rights have changed as follows:
• Coltrane Asset Management, LP – increase to 41,458,971 shares (27.7 per cent).
• The Goldman Sachs Group, Inc – decrease to 256,151 shares (0.2 per cent).
• Standard Life Aberdeen plc – decrease to 7,384,204 shares (4.9 per cent).
No further notifications have been received between the year end and the date of this report (being a date not more than one month prior to the date of the AGM Notice).
SIGNIFICANT AGREEMENTS – CHANGE OF CONTROL PROVISIONSThe following significant agreements contain provisions entitling the counterparties to exercise termination rights in the event of a change of control in the Company:
• Under the terms of the debt documents detailed on pages 38 and 39 of the Strategic Report, if any person, or group or persons acting in concert, gains control of the Company, all facilities will be cancelled and all outstanding loans or instruments or notes under the debt documents, together with accrued interest and all other amounts payable under the debt documents, shall become immediately due and payable.
• The Group’s share schemes also contain provisions relating to the vesting and exercising of awards/options in the event of a change of control of the Group. These are set out on page 66 of the Directors’ Remuneration Report.
85
Governance
Financial Statements
Strategic Report
Overview

Directors’ report continuedAUDITORResolutions to re-appoint Grant Thornton UK LLP as the Company’s auditor and to authorise the directors to determine their remuneration will be proposed at the forthcoming AGM.
Statement of disclosure of information to auditorThe directors in office at the date of approval of this report confirm that:
(a) so far as they are each aware, there is no relevant audit information of which the Company’s auditor is unaware; and
(b) they have each made such enquiries of their fellow directors and of the Company’s auditor and have each taken such other steps as were required by their duty as a director of the Company to exercise due care, skill and diligence in order to make themselves aware of any relevant audit information and to establish that the Company’s auditor is aware of that information.
This confirmation is given and should be interpreted in accordance with the provisions of section 418 of the 2006 Act.
ANNUAL GENERAL MEETINGThe resolutions to be proposed at the 2019 AGM, together with the explanatory notes, appear in the separate Notice of AGM accompanying this Annual Report. The Notice is also available on our website at www.interserve.com.
APPROVALThis report was approved by the Board of Directors on 8 March 2019 and signed on its behalf by:
Andrew McDonaldGeneral Counsel and Company Secretary8 March 2019
Interserve HouseRuscombe ParkTwyfordReadingBerkshireRG10 9JU
CAUTIONARY STATEMENTThe Strategic Report, Directors’ Report and Directors’ Remuneration Report have been prepared solely for existing members of the Company in compliance with UK company law and the Listing, Prospectus, and DTRs of the FCA. The Company, the directors and employees accept no responsibility to any other person for anything contained in the Strategic Report, Directors’ Report and Directors’ Remuneration Report. The directors’ liability for the Strategic Report, Directors’ Report and Directors’ Remuneration Report is limited, as provided in the 2006 Act.
The Company’s auditor provides an opinion on:
(a) whether the information given in the Strategic Report and the Directors’ Report is consistent with the financial statements;
(b) whether the Strategic Report and the Directors’ Report have been prepared in accordance with applicable legal requirements;
(c) whether in the light of the knowledge and understanding of the Company and its environment obtained in the course of the audit, the auditor has identified material misstatements in the Strategic Report and the Directors’ Report and, if applicable, give an indication of the nature of each of those misstatements;
but neither the Strategic Report nor the Directors’ Report are audited.
Statements made in the Strategic Report, Directors’ Report and Directors’ Remuneration Report reflect the knowledge and information available at the time of their preparation. The Strategic Report and the Directors’ Report contain forward-looking statements in respect of the Group’s operations, performance, prospects and financial condition. By their nature, these statements involve uncertainty. In particular, outcomes often differ from plans or expectations expressed through forward-looking statements, and such differences may be significant. Assurance cannot be given that any particular expectation will be met. No responsibility is accepted to update or revise any forward-looking statement, resulting from new information, future events or otherwise. Liability arising from anything in this Annual Report and Financial Statements shall be governed by English law.
86
GOVERNANCE

Directors’ responsibility statementThe directors are responsible for preparing the Annual Report and Financial Statements in accordance with applicable law and regulations.
Company law requires the directors to prepare financial statements for each financial year. Under that law the directors are required to prepare the Group financial statements in accordance with International Financial Reporting Standards (IFRS) as adopted by the European Union and Article 4 of the IAS Regulation and have elected to prepare the parent company financial statements in accordance with United Kingdom Generally Accepted Accounting Practice (UK GAAP) (UK Accounting Standards and applicable law), including the requirements of FRS 101 Reduced disclosure framework.
Under company law the directors must not approve the financial statements unless they are satisfied that they give a true and fair view of the state of affairs of the Group and parent company and of their profit or loss for that period.
In preparing the parent company financial statements, the directors are required to:
• select suitable accounting policies and then apply them consistently;
• make judgements and estimates that are reasonable and prudent;
• state whether applicable UK Accounting Standards have been followed, subject to any material departures disclosed and explained in the financial statements; and
• prepare the financial statements on the going concern basis unless it is inappropriate to presume that the company will continue in business.
In preparing the Group financial statements, International Accounting Standard 1 requires that the directors:
• properly select and apply accounting policies;
• present information, including accounting policies, in a manner that provides relevant, reliable, comparable and understandable information;
• provide additional disclosures when compliance with the specific requirements in IFRSs are insufficient to enable users to understand the impact of particular transactions, other events and conditions on the entity’s financial position and financial performance; and
• make an assessment of the Group’s ability to continue as a going concern.
The directors are responsible for keeping adequate accounting records that are sufficient to show and explain the parent company’s transactions and disclose with reasonable accuracy at any time the financial position of the parent company and enable them to ensure that the financial statements comply with the Companies Act 2006 and Article 4 of the IAS Regulations. They are also responsible for safeguarding the assets of the Group and hence for taking reasonable steps for the prevention and detection of fraud and other irregularities.
Under applicable law and regulations, the directors are also responsible for preparing a Strategic Report, Directors’ Report, Directors’ Remuneration Report and Corporate Governance statement that comply with that law and those regulations.
The directors confirm that, to the best of their knowledge:
(a) the parent company and Group financial statements in this Annual Report, which have been prepared in accordance with UK GAAP, including the requirements of FRS 101 Reduced disclosure framework and IFRS, respectively, give a true and fair view of the assets, liabilities, financial position and profit of the parent company and of the Group taken as a whole;
(b) the management report required by paragraph 4.1.8R of the FCA’s Disclosure Guidance and Transparency Rules (contained in the Strategic Report and the Directors’ Report) includes a fair review of the development and performance of the business and the position of the parent company and the Group taken as a whole, together with a description of the principal risks and uncertainties that they face; and
(c) the Annual Report and Financial Statements, taken as a whole, are fair, balanced and understandable and provide the information necessary for shareholders to assess the Group’s position and performance, business model and strategy.
By order of the Board
Debbie White Mark WhitelingChief Executive Officer Chief Financial Officer8 March 2019
87
Governance
Financial Statements
Strategic Report
Overview

8888
Independent auditor’s report to the members of Interserve Plc
FINANCIAL STATEMENTS
OPINIONOur opinion on the financial statements is unmodifiedWe have audited the financial statements of Interserve Plc (the ‘parent company’) and its subsidiaries (the ‘Group’) for the year ended 31 December 2018 which comprise the Consolidated Income Statement, the Consolidated Statement of Comprehensive Income, the Consolidated and Parent Company Balance Sheets, the Consolidated and Parent Statement of Changes in Equity, the Consolidated Cash Flow Statement and notes to the financial statements, including a summary of significant accounting policies. The financial reporting framework that has been applied in the preparation of the Group financial statements is applicable law and International Financial Reporting Standards (IFRSs) as adopted by the European Union. The financial reporting framework that has been applied in the preparation of the parent company financial statements is applicable law and United Kingdom Accounting Standards, including Financial Reporting Standard 101 Reduced disclosure framework (United Kingdom Generally Accepted Accounting Practice) .
In our opinion:
• the financial statements give a true and fair view of the state of the Group’s and of the parent company’s affairs as at 31 December 2018 and of the Group’s loss for the year then ended;
• the Group financial statements have been properly prepared in accordance with International Financial Reporting Standards (IFRSs) as adopted by the European Union;
• the parent company financial statements have been properly prepared in accordance with United Kingdom Generally Accepted Accounting Practice; and
• the financial statements have been prepared in accordance with the requirements of the Companies Act 2006; and, as regards the Group financial statements, Article 4 of the IAS Regulation.
Basis for opinionWe conducted our audit in accordance with International Standards on Auditing (UK) (ISAs (UK) ) and applicable law. Our responsibilities under those standards are further described in the ‘Auditor’s responsibilities for the audit of the financial statements’ section of our report. We are independent of the Group and the parent company in accordance with the ethical requirements that are relevant to our audit of the financial statements in the UK, including the FRC’s Ethical Standard as applied to listed public-interest entities, and we have fulfilled our other ethical responsibilities in accordance with these requirements. We believe that the audit evidence we have obtained is sufficient and appropriate to provide a basis for our opinion.
Material uncertainty related to going concernWe draw attention to note 1 in the financial statements, which indicates that successful completion of the Group’s proposed Deleveraging Plan is subject to a shareholder vote, an event which is outside of the control of the Group. The Board’s going concern assessment and conclusion includes anticipated receipt of proceeds from the successful completion of the Group’s proposed Deleveraging Plan. As stated in note 1, these events or conditions indicate that a material uncertainty exists that may cast significant doubt on the Group and parent company’s ability to continue as a going concern. Our opinion is not modified in respect of this matter.

8989
Governance
Financial Statements
Strategic Report
Overview
Material uncertainty related to going concern
See the Group statement on going concern on page 41 and note 1 to the financial statements, which indicates that there is a material uncertainty relating to the Group and parent company’s ability to continue as a going concern.
The Board’s going concern assessment and conclusion includes anticipated proceeds from the Group’s proposed Deleveraging Plan, first announced to the market on 10 December 2018 and updated on 6 February 2019. The anticipated proceeds are dependent on shareholder approval.
The fact that a shareholder vote is required to raise additional capital via the conclusion of the proposed Deleveraging Plan is outside of the control of the Group.
These events and conditions give rise to a material uncertainty that may cast significant doubt about the Group and parent company’s ability to continue as a going concern. Our opinion is not modified in respect of this matter.
Our audit work included, but was not restricted to:
• Assessing the construction, integrity and accuracy of the model used for the purposes of cash flow forecasting, with the support of a review by a restructuring specialist acting as an auditor’s expert
• Agreeing key inputs into the model, such as revenue and margin assumptions, to underlying divisional budgets and forecasts approved by the Board
• Assessing the historical accuracy of the Group’s budgets and forecasts for the last three years, to analyse its track record of including accurate forecast projections within its financial model
• Challenging the appropriateness of key judgements and key assumptions made in the Group’s cash flow forecast model
• Assessing the projected level of liquidity headroom in the Group’s cash flow forecast model over the going concern period
• Challenging the process that management has undertaken to conclude over the duration of the going concern period
• Reading other information that includes projections beyond the assessed going concern period, including, but not limited to, the viability statement, and assessing whether the disclosures provided give rise to any event or condition outside of the going concern period that may cast significant doubt over the Group and parent company’s ability to continue as a going concern
• Recalculating the sensitivities prepared by management to assess their accuracy, challenge management’s assessment of going concern and consider the appropriateness of management’s sensitivity analysis
• Challenging management on the sufficiency and appropriateness of the disclosures within the Board’s viability statement and going concern statement
• Obtaining a copy of the new proposed financing agreement pursuant to the proposed Deleveraging Plan, and checking that continuing obligations (including compliance with financial and non-financial covenants) have been appropriately modelled and tested against forecast projections
Key observationsA material uncertainty exists that may cast significant doubt over the Group and parent company’s ability to continue as a going concern. Our opinion is not modified in respect of this matter.

9090
FINANCIAL STATEMENTS
Independent auditor’s report continuedto the members of Interserve Plc
Conclusions relating to principal risks, going concern and viability statementThe events and conditions set out in note 1 to the financial statements indicate that a material uncertainty exists that may cast significant doubt over the Group and parent company’s ability to continue as a going concern. The Group’s viability scenarios all assume the successful completion of the proposed Deleveraging Plan. Failure to complete the proposed Deleveraging Plan represents a material uncertainty which may cast significant doubt over the Group and Company’s ability to continue as a going concern, and also may cast significant doubt over the viability of the Group and parent company.
Other than this matter, we have nothing to report in respect of the following information in the Annual Report, in relation to which the ISAs (UK) require us to report to you whether we have anything material to add or draw attention to:
• the disclosures in the Annual Report set out on pages 31 to 34 that describe the principal risks and explain how they are being managed or mitigated;
• the directors’ confirmation, set out on page 48 of the Annual Report that they have carried out a robust assessment of the principal risks facing the Group, including those that would threaten its business model, future performance, solvency or liquidity;
• whether the directors’ statements relating to going concern and their assessment of the prospects of the Company required under the Listing Rules in accordance with Listing Rule 9.8.6R(3) is materially inconsistent with our knowledge obtained in the audit; or
• the directors’ explanation, set out on pages 39 to 41 of the Annual Report as to how they have assessed the prospects of the Group, over what period they have done so and why they consider that period to be appropriate, and their statement as to whether they have a reasonable expectation that the Group will be able to continue in operation and meet its liabilities as they fall due over the period of their assessment, including any related disclosures drawing attention to any necessary qualifications or assumptions.
Overview of our audit approach• Overall Group materiality: £4.6 million, which represents five per cent of the Group’s
operating profit before non-underlying items and amortisation of acquired intangible assets.
• Key audit matters were identified as revenue recognition and contract accounting (Group) , the presentation and disclosure of non-underlying items (Group) , impairment of goodwill and interests in joint-venture entities and associated undertakings (Group) and investments in subsidiaries (parent company) , defined benefit pension schemes (Group and parent company) , and accounting for new long-term borrowings (Group) .
• We performed full-scope procedures at all operating locations in the United Kingdom. We performed targeted procedures over component entities in Guernsey, Oman, Qatar, the United Arab Emirates, Saudi Arabia, and Australia. We performed analytical procedures over component entities in all other geographical locations.
Key audit mattersKey audit matters are those matters that, in our professional judgement, were of most significance in our audit of the financial statements of the current period and include the most significant assessed risks of material misstatement (whether or not due to fraud) that we identified. These matters included those that had the greatest effect on: the overall audit strategy; the allocation of resources in the audit; and directing the efforts of the engagement team. These matters were addressed in the context of our audit of the financial statements as a whole, and in forming our opinion thereon, and we do not provide a separate opinion on these matters.
In addition to the matter described in the ‘Material uncertainty related to going concern’ section, we have determined the matters described below to be the key audit matters to be communicated in our report.

9191
Governance
Financial Statements
Strategic Report
Overview
Key audit matter How the matter was addressed in the audit
Revenue recognition and contract accounting (Group)Revenue £2,904.0 million (2017: £3,250.8 million)Trade receivables, accrued income and amounts due from construction contract customers £544.6 million (2017: £610.3 million)Contract provisions £22.5 million (2017: £60.3 million)Revenue is recognised in the Group financial statements as the fair value of consideration received or receivable in respect of provision of service and construction contracts. Provision is made for expected contract losses as soon as they are foreseen.
Determining the amount of revenue to be recognised in respect of construction and service contracts requires management to make significant judgements and estimates including the cost to complete, and the identification of any other costs that might arise, the probability of customer acceptance of claims and variations and the recoverability of work-in-progress and receivables balances.
Additionally, the Group has adopted IFRS 15 in the year which involved significant management judgement and potentially restating prior year balances and updating accounting policies.
We therefore identified revenue recognition and contract accounting as a significant risk, which was one of the most significant assessed risks of material misstatement.
Our audit work included, but was not restricted to:
• selecting a sample of contracts in progress (determined by reference to materiality and other risk factors, including loss-making contracts and contracts with aged work-in-progress and debtor balances) , and on each selected contract carrying out the following procedures:
◦ confirming that a signed contract was in place and the work being performed is in line with each selected contract;
◦ testing management’s application of the contractual terms and conditions, recalculating revenue recognised under the percentage of completion method based on costs incurred to date (where applicable) and testing a sample of costs recorded on projects to purchase invoice or other source documents (where percentage of completion applies) ;
◦ performing a detailed analytical review of margins and balance sheet items throughout the year;
◦ challenging management’s assertions relating to the expected costs to complete (where relevant) by reference to supporting documentation such as customer certifications, forecast models and comparing previous cost estimates against actual results and examining variation and claim agreements;
◦ agreeing revenues per the Group financial statements either to the contracted amounts, reconciling differences to variations that were submitted during the period, or to the monthly Cost Variance Report;
• agreeing a sample of balances within accrued income to supporting third-party documentation and subsequent authorisation to bill;
• testing a sample of revenue items for non-contract revenue, covering both hire and sale revenue, agreeing items selected for testing through to documented supporting existence;
• agreeing a sample of claims and variations to evidence of the work having been performed;
• evaluating management’s assessment of forward-loss provisions recorded on long-term contracts (the most significant and judgemental of which are identified in the Key Estimates and Judgements section in note 1(b) to the financial statements on pages 107 to 111) , including challenging management on the judgements inherent within the forecast revenue and profit on the contract, understanding the basis for cost savings, consideration of historical experience, comparing against expected outcomes, and the latest status of disputes with customers;
• investigating the extent of historic recovery of work-in-progress balances held by the Group, with reference to certifications and correspondence from customers, and testing a sample of aged work-in-progress balances to identify any unrecoverable WIP;
• testing the operating effectiveness of key controls within the Construction division over contract execution, certification, invoicing, collections, cost approvals and cost allocations, to confirm they were executed as designed;
• testing the operating effectiveness of key controls within the Support Services division over customer and contract existence, and management’s monthly review of contract performance; and

9292
FINANCIAL STATEMENTS
Independent auditor’s report continuedto the members of Interserve Plc
Key audit matter How the matter was addressed in the audit
• assessing the implementation of IFRS 15 on contract accounting by considering management’s assessment and determining whether the treatments proposed met the requirements of the standard, obtaining the analysis of contracts prepared at a divisional level and agreeing this analysis to the work performed on the contract, and recalculating the impact on revenue recognition and bad debt provision respectively.
The Group’s accounting policy on revenue recognition and contract accounting is shown in note 1(d) to the financial statements and related disclosures are included in note 2. The Audit Committee identified revenue recognition and contract accounting as a significant issue in its report on page 55, where the Audit Committee also described the action that it has taken to address this issue.
Key observationsAs a result of our work, we concluded that revenue recognition and contract accounting was acceptable.
Presentation and disclosure of non‑underlying items (Group)Non‑underlying items £(133.9) million losses (2017: £(308.3) million)The Group has presented separately certain items on the face of the Consolidated Income Statement as non-underlying. The directors believe that the resulting “underlying” income statement reflects better the Group’s trading performance during the year.
In the Group’s reported results, significant adjustments have been made to statutory loss before tax of £111.3 million to derive underlying profit before tax of £13.7 million, and to statutory loss after tax of £128.9 million to derive underlying loss after tax of £5 million. The most significant of these are discussed in detail in note 32(a) .
Non-underlying items are not defined by IFRSs as adopted by the European Union. Consequently, management have written an accounting policy to define non-underlying items in the financial statements, which is set out in note 1. In applying this accounting policy, management exercises significant judgement in respect of what it determines as a non-underlying transaction. In making this assessment, management has identified significant non-recurring transactions that, by their size or nature, require separate presentation. As such, there is a risk of management bias in the selection of the items identified as non-underlying.
Alternative performance measures can provide shareholders with appropriate additional information and understanding of a company’s financial performance and strategy. However, when improperly used and presented, such measures might prevent the Annual Report being fair, balanced and understandable by confusing the real financial position and results or by making the results of the reporting entity seem more attractive. Failure to disclose clearly the nature and impact of material non-underlying earnings may distort the reader’s view of the financial result in the year.
We therefore identified the following significant risks in respect of non-underlying items in the Consolidated Income Statement, which was one of the most significant assessed risks of material misstatement:
Classification of non-underlying items and whether they meet the definition set out in the policy;
Our audit work included, but was not restricted to:
Classification• inspecting and challenging the nature of the items included within
non-underlying items as follows:
◦ for contract-related items, agreeing the revenue and cost in the current and prior year to our work on that contract. In each case, as these contracts represent a material judgement in their own right, performing a detailed contract review which is commented on under the previous Key Audit Matter; and
◦ for non-contract items, obtaining a detailed breakdown of these items and obtaining an understanding of the nature of each cost or income item; substantively testing a sample of items to invoice or other supporting evidence, confirming that the specific project or activity is one identified as non-underlying by management.
Presentation• Challenging management’s rationale for the basis for inclusion of
certain classes of items within the Consolidated Income Statement as non-underlying, particularly around the areas of higher judgement, to determine whether the items recognised as non-underlying meet the criteria of the accounting policy for such items defined by the Group.
• Evaluating the appropriateness of the inclusion of items, both individually and in aggregate, within non-underlying items, including ensuring adherence to IFRS requirements and latest FRC guidance, and benchmarking them against market practice.
DisclosureWe also assessed the disclosures made, and considered:
• the extent to which the prominence given to the ‘underlying’ financial information and related commentary in the Annual Report compared to the statutory financial information and related commentary could be misleading;
• whether the statutory and ‘underlying’ financial information are reconciled with sufficient prominence given to that reconciliation;
• whether the basis of the ‘underlying’ financial information is clearly and accurately described and consistently applied; and
• whether the ‘underlying’ financial information is not otherwise misleading in the form and context in which it appears in the Annual Report and whether the overall presentation is fair, balanced and understandable.

9393
Governance
Financial Statements
Strategic Report
Overview
Key audit matter How the matter was addressed in the audit
Presentation of non-underlying items as a separate column in the income statement, and whether the presentation of the ‘underlying’ financial information is fair, balanced, and understandable in its representation of underlying trading, or whether undue prominence has been given to this information over the GAAP information; and
Disclosure of information in respect of the non-underlying items in respect of its appropriateness and quality, including associated critical judgements and estimates.
The Group’s accounting policy on non-underlying items is shown in note 1(s) and related disclosures are included in note 5. The Audit Committee identified non-underlying items as a significant issue in its report on page 55, where the Audit Committee also described the action that it has taken to address this issue.
Key observationsAs a result of our work, we concluded that the classification, presentation and disclosure of non-underlying items was acceptable.
Impairment of goodwill and interests in joint‑venture entities and associated undertakings (Group) and investments in subsidiaries (parent company)Goodwill: £342.3 million (2017: £372.9 million)Interests in joint‑venture entities and associated undertakings: £121.5 million (2017: £124.9 million)Investments in subsidiaries: £462.9 million (2017: £462.9 million)Under International Accounting Standard 36 Impairment of assets, the directors are required to make an annual assessment to determine whether the Group’s goodwill and investments are impaired: under FRS 101 the directors are required to make the same assessment in respect of the parent company’s investments in its subsidiaries.
The process for assessing whether impairment exists under both standards is complex. The process of determining the recoverable amount, being the higher of the value in use and the fair value less cost to sell, through forecasting cash flows related to cash generating units (CGUs) and the determination of the appropriate discount rate and other assumptions to be applied can be highly judgemental and can significantly impact the results of the impairment review.
Due to the inherent uncertainty and key assumptions involved in forecasting and discounting future cash flows, we therefore identified the impairment of goodwill and interests in joint-venture entities and associated undertakings (Group) and investments in subsidiaries (parent company) as a significant risk, which was one of the most significant assessed risks of material misstatement.
Our audit work included, but was not restricted to:
• obtaining management’s assessment of the relevant CGUs used in the impairment calculations and comparing those to our understanding of the business units and operating structure of the Group;
• checking the arithmetical accuracy of management’s impairment calculations, and performing sensitivity analysis of cash flow inputs including the discount rate applied;
• testing the assumptions utilised in the impairment models, including growth rates and discount rates, by checking the accuracy of the calculations and agreeing the inputs to market data and considering management’s assessment of whether any modifications should be made to this data to take into account Interserve’s specific circumstances;
• checking the assumptions used are consistent across the business, and that where different assumptions are used based on the profile of different divisions, these are consistent with our knowledge of the business and our detailed work performed on the forecasts used for going concern and viability;
• testing the accuracy of management’s forecasting through a comparison of budget to actual data and historical variance trends and inspecting the cash flows for non-underlying or unusual items or assumptions; and
• taking all the above procedures into account, assessing whether the resulting impairment charge is complete.
The Group’s accounting policy on impairment is shown in note 1(g) to the financial statements and related disclosures are included in note 12. The Audit Committee identified impairment as a significant issue in its report on page 55, where the Audit Committee also described the action that it has taken to address this issue.
Key observationsAs a result of our work, we noted adjustments related to the assessment of carrying value of CGUs. Management has corrected these adjustments in the Annual Report. Following these corrections, we concluded that the carrying value of goodwill, reduced following the recognition of an impairment charge in the year, was acceptable.
9494
FINANCIAL STATEMENTS
Independent auditor’s report continuedto the members of Interserve Plc
Key audit matter How the matter was addressed in the audit
Defined benefit pension schemes (Group and parent company)Retirement benefit surplus/(obligation) (Group): £93.9 million (2017: (£48.0 million))Fair value of scheme’s assets (Group): £938.7 million (2017: £1,016.1 million)Present value of defined benefit asset (Group): £844.8 million (2017: £1,064.1 million)Retirement benefit surplus/(obligation) (parent): £98.8 million (2017: (£38.5 million))Fair value of scheme’s assets (parent): £856.5 million (2017: £928.7 million)Present value of defined benefit asset (parent): £757.7 million (2017: £967.2 million)The Group has a number of defined benefit pension schemes that provide benefits to a significant number of current and former employees.
The measurement of the defined benefit pension scheme asset in accordance with IAS 19 Employee benefits involves significant judgement and their valuation is subject to complex actuarial assumptions. Small variations in those actuarial assumptions can lead to a materially different defined benefit pension scheme asset or liability being recognised within the Group financial statements. The Group has changed its assumptions from RPI to CPI in the year and as a result the net position on the balance sheet is an asset.
We therefore identified the assets and liabilities associated with the defined benefit pension schemes, specifically the valuation of the assets and completeness of the liabilities, as a significant risk, which was one of the most significant assessed risks of material misstatement.
Our audit work included, but was not restricted to:
• reviewing the model and assumptions to ensure that they are reasonable and consistent, and in line with IAS 19;
• utilising the expertise of our in-house actuarial specialists to assess and challenge the assumptions used for reasonableness and the methods employed in the calculation of the obligation;
• confirming that the change in assumptions in the year from RPI to CPI was correctly calculated, and is correctly accounted for in line with the pension scheme agreement; and
• confirming that the pension scheme agreement allows an overall asset to be recognised on the balance sheet.
The Group’s accounting policy on defined benefit pension schemes is shown in note 1(q) to the financial statements and related disclosures are included in note 29. The Audit Committee identified defined benefit pension schemes as a significant issue in its report on page 55, where the Audit Committee also described the action that it has taken to address this issue.
Key observationsAs a result of our work, we concluded that the carrying value of the pension scheme asset was acceptable.

9595
Governance
Financial Statements
Strategic Report
Overview
Key audit matter How the matter was addressed in the audit
Accounting for new long‑term borrowings (Group)Borrowings: £827.9 million (2017: £657.7 million)On 27 April 2018 the Group concluded refinancing negotiations and secured access to £834 million of committed borrowing facilities. This involved the renewal of existing credit facilities and US loan notes alongside the injection of a new £175 million long-term loan and £21.5 million of money-market lines. As part of the refinancing, the Group issued 36.4 million warrants at a fair value of £35.3 million, accounted for as a separate equity instrument.
The accounting treatment for the warrants is assessed under IAS 32, in particular whether the requirements for the “fixed for fixed” test have been met. The directors concluded that the requirements were met, leading to classification of the warrants as a separate component of equity.
The new debt is required to be accounted for under IFRS 9 Financial instruments, adopted for the first time in the year to 31 December 2018. Under IFRS 9, the Group is first required to establish whether debt is legally extinguished or modified on refinancing. If the debt has been modified, the Group is also required to determine if the modification is substantial or non-substantial.
The directors have concluded that the refinancing has led to a substantial modification of the previous facilities and US loan notes and are therefore required to derecognise existing debt and recognise refinanced facilities at their fair value. The calculation of fair value involves significant judgement.
We therefore identified the renewal of the revolving credit facilities and US loan notes, specifically initial recognition under IAS 32 and subsequent measurement under IFRS 9, as a significant risk, which was one of the most significant assessed risks of material misstatement.
Our audit work included, but was not restricted to:
• assessing terms of the warrant agreement, with particular focus on the legal requirements of “anti-dilution” provisions, to ascertain whether the requirements of the IAS 32 fixed for fixed test had been met;
• obtaining management’s assessment of compliance with IFRS 9, specifically their consideration of IFRS 9 in respect of the refinancing;
• obtaining and reviewing key terms in result of the modifications to loan agreements to understand significant changes, and confirming these changes to management’s assessment;
• challenging management on their assessment of the significance of the modification of debt, as defined by IFRS 9; and
• challenging management on their assessment of fair value on recognition of new debt facilities, and their disclosure of key judgements and sources of estimation uncertainty.
The Group’s accounting policy on borrowings is shown in note 1(n) to the financial statements and related disclosures are included in note 20. The Audit Committee identified accounting for debt as a significant issue in its report on page 55, where the Audit Committee also described the action that it has taken to address this issue.
Key observationsAs a result of our work, we concluded that the accounting for new long-term borrowings was acceptable.

9696
FINANCIAL STATEMENTS
Independent auditor’s report continuedto the members of Interserve Plc
Our application of materialityWe define materiality as the magnitude of misstatement in the financial statements that makes it probable that the economic decisions of a reasonably knowledgeable person would be changed or influenced. We use materiality in determining the nature, timing and extent of our audit work and in evaluating the results of that work.
Materiality was determined as follows:
Materiality measure Group Parent company
Financial statements as a whole £4.6 million which is five per cent of Group operating profit before non-underlying items and amortisation of acquired intangible assets. This benchmark is considered the most appropriate because this is a key performance measure used by the Board of Directors to report to investors on the financial performance of the Group.
£3.2 million which is two per cent of total assets capped at Group performance materiality. This benchmark is considered the most appropriate because the parent company does not trade externally but functions primarily as a holding company for its investments in subsidiaries.
Materiality for the current year is higher than the level that we determined for the year ended 31 December 2017. In the prior year, materiality was determined based on statutory loss before tax due to the significant uncertainty over the allocation of non-underlying items, which meant that during our planning procedures there was no confirmed expected operating profit before non-underlying items and intangible assets and, as a result, this benchmark could not be used. Given the fact that the classes of items and contracts included as non-underlying are now established, the operating profit before non-underlying items and amortisation could be more clearly identified at the planning stage this year.
Materiality for the current year is higher than the level that we determined for the year ended 31 December 2017, as it is capped at Group performance materiality, its movement reflects the increase in Group materiality.
The increase in materiality reflects the different benchmark used in the year and the increase in underlying operating profit.
Performance materiality used to drive the extent of our testing
70 per cent of financial statement materiality.
70 per cent of financial statement materiality.
Specific materiality We also determine a lower level of specific materiality for certain areas such as directors’ remuneration.
We also determine a lower level of specific materiality for certain areas such as directors’ remuneration.
Communication of misstatements to the Audit Committee
£229,000 and misstatements below that threshold that, in our view, warrant reporting on qualitative grounds.
£160,000 and misstatements below that threshold that, in our view, warrant reporting on qualitative grounds.

9797
Governance
Financial Statements
Strategic Report
Overview
An overview of the scope of our auditOur audit approach was based on a thorough understanding of the Group’s business and is risk-based. An interim visit was conducted before the year end at all significant components of the Group to complete advance substantive audit procedures and to evaluate the Group’s internal control environment, including its IT systems. The components of the Group were evaluated by the group audit team based on a measure of materiality considering each as a percentage of total Group assets, liabilities, revenues and profit before taxes, to assess the significance of the component and to determine the planned audit response. For those components that were evaluated as significant, either a full-scope or targeted audit approach was determined based on their relative materiality to the Group and our assessment of the audit risk. For significant components requiring a full-scope approach we evaluated and tested the operating effectiveness of controls over the financial reporting systems identified as part of our risk assessment, reviewed the accounts production process and addressed critical accounting matters. We sought, wherever possible, to rely on the effectiveness of the Group’s internal controls in order to reduce substantive testing. We then undertook substantive testing on significant transactions and material account balances.
In order to address the audit risks described above as identified during our planning procedures, we performed a full-scope audit of the financial statements of the parent company, Interserve Plc, and of the Group’s operations throughout the United Kingdom. The operations that were subject to full-scope audit procedures made up 85 per cent of consolidated revenues and 59 per cent of operating profit before non-underlying items and amortisation of intangible assets. Statutory audits of subsidiaries, where required by local laws, were performed to lower materiality where applicable.
While the majority of the operations are located within the United Kingdom, the Group has material operations spanning the globe, particularly in its Equipment Services and Construction divisions. Through an analysis of these operations we determined that targeted audit procedures were to be carried out in eight entities located in Guernsey, Oman, Qatar, the United Arab Emirates (UAE), Saudi Arabia and Australia. These targeted procedures addressed the Key Audit Matters described above, where relevant to the entity. Those components subjected to targeted audit procedures comprise seven per cent of total revenues and 15 per cent of operating profit before non-underlying items and amortisation of intangible assets. The joint ventures and associates which were subjected to targeted audit procedures contributed 10 per cent of operating profit before non-underlying items and amortisation of intangible assets.
The remaining operations of the Group were subject to analytical procedures over the balance sheet and income statements of the related entities with a focus on the Key Audit Matters and the significance to the Group’s balances.
Detailed audit instructions were issued to the auditors of the reporting components where a full-scope or targeted audit approach had been identified. The instructions detailed the significant risks that were to be addressed through the audit procedures and indicated the information that needed to be reported back to the group audit team. The group audit team performed site visits in Oman and the UAE, which included a review of the work performed by the component auditors. Where targeted components outside of the UK were not physically visited, an assessment of the supporting working papers was conducted remotely. The group audit team communicated with all component auditors throughout the planning, fieldwork and concluding stages of the local audits.
Other informationThe directors are responsible for the other information. The other information comprises the information included in the Annual Report, other than the financial statements and our auditor’s report thereon. Our opinion on the financial statements does not cover the other information and, except to the extent otherwise explicitly stated in our report, we do not express any form of assurance conclusion thereon.
In connection with our audit of the financial statements, our responsibility is to read the other information and, in doing so, consider whether the other information is materially inconsistent with the financial statements or our knowledge obtained in the audit or otherwise appears to be materially misstated. If we identify such material inconsistencies or apparent material misstatements, we are required to determine whether there is a material misstatement in the financial statements or a material misstatement of the other information. If, based on the work we have performed, we conclude that there is a material misstatement of this other information, we are required to report that fact.
We have nothing to report in this regard.
In this context, we also have nothing to report in regard to our responsibility to specifically address the following items in the other information and to report as uncorrected material misstatements of the other information where we conclude that those items meet the following conditions:
• fair, balanced and understandable set out on page 87 – the statement given by the directors that they consider the Annual Report and Financial Statements taken as a whole is fair, balanced and understandable and provides the information necessary for shareholders to assess the Group’s performance, business model and strategy, is materially inconsistent with our knowledge obtained in the audit; or
• the Audit Committee report set out on page 53 – the section describing the work of the Audit Committee does not appropriately address matters communicated by us to the Audit Committee; or
• the directors’ statement of compliance with the UK Corporate Governance Code set out on page 45 – the parts of the directors’ statement required under the Listing Rules relating to the Company’s compliance with the UK Corporate Governance Code containing provisions specified for review by the auditor in accordance with Listing Rule 9.8.10R(2) do not properly disclose a departure from a relevant provision of the UK Corporate Governance Code.

9898
FINANCIAL STATEMENTS
Independent auditor’s report continuedto the members of Interserve Plc
Our opinions on other matters prescribed by the Companies Act 2006 are unmodifiedIn our opinion, the part of the Directors’ Remuneration Report to be audited has been properly prepared in accordance with the Companies Act 2006.
In our opinion, based on the work undertaken in the course of the audit:
• the information given in the Strategic Report and the Directors’ Report for the financial year for which the financial statements are prepared is consistent with the financial statements; and
• the Strategic Report and the Directors’ Report have been prepared in accordance with applicable legal requirements.
Matters on which we are required to report under the Companies Act 2006In the light of the knowledge and understanding of the Group and the parent company and its environment obtained in the course of the audit, we have not identified material misstatements in the Strategic Report or the Directors’ Report.
Matters on which we are required to report by exceptionWe have nothing to report in respect of the following matters in relation to which the Companies Act 2006 requires us to report to you if, in our opinion:
• adequate accounting records have not been kept by the parent company, or returns adequate for our audit have not been received from branches not visited by us; or
• the parent company financial statements and the part of the Directors’ Remuneration Report to be audited are not in agreement with the accounting records and returns; or
• certain disclosures of directors’ remuneration specified by law are not made; or
• we have not received all the information and explanations we require for our audit.
Responsibilities of directors for the financial statementsAs explained more fully in the Directors’ Responsibility Statement set out on page 87, the directors are responsible for the preparation of the financial statements and for being satisfied that they give a true and fair view, and for such internal control as the directors determine is necessary to enable the preparation of financial statements that are free from material misstatement, whether due to fraud or error.
In preparing the financial statements, the directors are responsible for assessing the Group’s and the parent company’s ability to continue as a going concern, disclosing, as applicable, matters related to going concern and using the going concern basis of accounting unless the directors either intend to liquidate the Group or the parent company or to cease operations, or have no realistic alternative but to do so.
Auditor’s responsibilities for the audit of the financial statementsOur objectives are to obtain reasonable assurance about whether the financial statements as a whole are free from material misstatement, whether due to fraud or error, and to issue an auditor’s report that includes our opinion. Reasonable assurance is a high level of assurance, but is not a guarantee that an audit conducted in accordance with ISAs (UK) will always detect a material misstatement when it exists. Misstatements can arise from fraud or error and are considered material if, individually or in the aggregate, they could reasonably be expected to influence the economic decisions of users taken on the basis of these financial statements.
We are responsible for obtaining reasonable assurance that the financial statements taken as a whole are free from material misstatement, whether caused by fraud or error. Owing to the inherent limitations of an audit, there is an unavoidable risk that material misstatements of the financial statements may not be detected, even though the audit is properly planned and performed in accordance with the ISAs (UK) . Our audit approach is a risk-based approach and is explained more fully in the ‘An overview of the scope of our audit’ section of our audit report.
A further description of our responsibilities for the audit of the financial statements is located on the Financial Reporting Council’s website at: www.frc.org.uk/auditorsresponsibilities. This description forms part of our auditor’s report.

9999
Governance
Financial Statements
Strategic Report
Overview
Other matters which we are required to addressWe were appointed by the Audit Committee on 13 June 2014. Our total uninterrupted period of engagement is five years, covering the periods ending 31 December 2014 to 31 December 2018.
The non-audit services prohibited by the FRC’s Ethical Standard were not provided to the Group or the parent company and we remain independent of the Group and the parent company in conducting our audit.
Our audit opinion is consistent with the additional report to the Audit Committee.
Use of our reportThis report is made solely to the Company’s members, as a body, in accordance with Chapter 3 of Part 16 of the Companies Act 2006. Our audit work has been undertaken so that we might state to the Company’s members those matters we are required to state to them in an auditor’s report and for no other purpose. To the fullest extent permitted by law, we do not accept or assume responsibility to anyone other than the Company and the Company’s members as a body, for our audit work, for this report, or for the opinions we have formed.
Philip WestermanSenior Statutory Auditor for and on behalf of Grant Thornton UK LLP Statutory Auditor, Chartered Accountants London 8 Match 2019

100
FINANCIAL STATEMENTS
Consolidated income statement for the year ended 31 December 2018
Year ended 31 December 2018 Year ended 31 December 2017
Notes
Before non‑underlying items and
amortisation of acquired
intangibleassets
£million
Non‑underlying items and
amortisation of acquired
intangible assets(note 5)
£millionTotal
£million
Before non‑underlying items and
amortisation of acquired
intangible assets #£million
Non‑underlying items and
amortisation of acquired
intangible assets #
(note 5) £million
Total£million
Continuing operations
Revenue including share of associates and joint ventures 2 3,019.2 206.5 3,225.7 3,408.6 258.3 3,666.9
Less: Share of associates and joint ventures (321.7) – (321.7) (416.1) – (416.1)
Consolidated revenue 2 2,697.5 206.5 2,904.0 2,992.5 258.3 3,250.8
Cost of sales (2,372.2) (242.5) (2,614.7) (2,640.9) (368.7) (3,009.6)
Gross profit 325.3 (36.0) 289.3 351.6 (110.4) 241.2
Administration expenses (249.9) (27.8) (277.7) (292.6) (86.7) (379.3)
Amortisation of acquired intangible assets – (18.7) (18.7) – (21.5) (21.5)
Impairment of goodwill – (33.1) (33.1) – (60.0) (60.0)
Total administration expenses (249.9) (79.6) (329.5) (292.6) (168.2) (460.8)
Operating profit/(loss) 75.4 (115.6) (40.2) 59.0 (278.6) (219.6)
Share of result of associates and joint ventures 15 17.3 17.0 34.3 25.5 (30.6) (5.1)
Amortisation of acquired intangible assets 4 – – – – (0.1) (0.1)
Total share of result of associates and joint ventures 17.3 17.0 34.3 25.5 (30.7) (5.2)
Total operating profit/(loss) 92.7 (98.6) (5.9) 84.5 (309.3) (224.8)
Investment revenue 7 3.5 – 3.5 5.9 2.9 8.8
Finance costs 8 (82.5) (26.4) (108.9) (28.4) – (28.4)
Profit/(loss) before tax 13.7 (125.0) (111.3) 62.0 (306.4) (244.4)
Tax charge 9 (8.7) (8.9) (17.6) (8.1) (1.9) (10.0)
Profit/(loss) for the year 5.0 (133.9) (128.9) 53.9 (308.3) (254.4)
Attributable to:
Equity holders of the parent 1.7 (133.9) (132.2) 51.9 (308.3) (256.4)
Non-controlling interests 3.3 – 3.3 2.0 – 2.0
5.0 (133.9) (128.9) 53.9 (308.3) (254.4)
Earnings per share 11
Basic (89.2p) (176.0p)
Diluted (89.2p) (176.0p)
Headline 1.1p 35.6p
Diluted headline 0.9p 34.0p
# restated (note 1)

101
Consolidated statement of comprehensive income for the year ended 31 December 2018
Governance
Financial Statements
Strategic Report
Overview
Notes
Year ended 31 December 2018
£million
Year ended 31 December 2017
£million
Loss for the year (128.9) (254.4)
Items that will not be reclassified subsequently to profit or loss:
Actuarial gains/(losses) on defined benefit pension schemes 29 54.0 (10.4)
Deferred tax on above items taken directly to equity 9 (9.2) 1.8
44.8 (8.6)
Items that may be reclassified subsequently to profit or loss:
Exchange differences on translation of foreign operations 14.0 (34.8)
(Losses) /gains on cash flow hedging instruments (excluding joint ventures) - (23.0)
Recycling of cash flow hedge reserve to profit and loss account 10.4 22.7
Deferred tax on above items taken directly to equity 9 (1.8) 0.2
Net impact of items relating to joint-venture entities 0.8 3.0
23.4 (31.9)
Other comprehensive income/(loss) net of tax 68.2 (40.5)
Total comprehensive (loss) (60.7) (294.9)
Attributable to:
Equity holders of the parent (64.0) (297.3)
Non-controlling interests 3.3 2.4
(60.7) (294.9)
# restated (note 1)

102
FINANCIAL STATEMENTS
Consolidated balance sheet at 31 December 2018
Notes31 December 2018
£million31 December 2017
£million
Non-current assets
Goodwill 12 342.3 372.9
Other intangible assets 13 30.9 54.5
Property, plant and equipment 14 209.9 228.6
Interests in joint-venture entities 15 33.2 46.5
Interests in associated undertakings 15 88.3 78.4
Retirement benefit surplus 29 93.9 -
Deferred tax asset 16 1.3 23.4
799.8 804.3
Current assets
Inventories 17 35.8 34.0
Trade and other receivables 19 641.3 722.0
Cash and deposits 20 196.7 155.1
873.8 911.1
Total assets 1,673.6 1,715.4
Current liabilities
Bank overdrafts 20 - (6.8)
Trade and other payables 22 (741.3) (798.6)
Current tax liabilities (4.5) (7.2)
Short-term provisions 25 (29.3) (50.2)
(775.1) (862.8)
Net current assets 98.7 48.3
Non-current liabilities
Borrowings 20 (827.5) (647.5)
Trade and other payables 23 (12.7) (14.5)
Long-term provisions 25 (59.4) (80.0)
Retirement benefit obligation 29 - (48.0)
(899.6) (790.0)
Total liabilities (1,674.7) (1,652.8)
Net assets/(liabilities) (1.1) 62.6
Equity
Share capital 26 15.0 14.6
Share premium account 116.5 116.5
Warrants in issue 31.4 -
Capital redemption reserve 0.1 0.1
Merger reserve 121.4 121.4
Hedging and revaluation reserve 3.5 (5.9)
Translation reserve 88.5 74.5
Investment in own shares - (1.9)
Retained earnings (392.4) (272.0) Retained earnings (392.4) (272.0)
Equity attributable to equity holders of the parent (16.0) 47.3
Non-controlling interests 14.9 15.3
Total equity (1.1) 62.6
These financial statements were approved by the Board of Directors on 8 March 2019.
Signed on behalf of the Board of Directors
D J White M A WhitelingDirector Director

103
Consolidated statement of changes in equity for the year ended 31 December 2018
Governance
Financial Statements
Strategic Report
Overview
Share capital
£million
Share premium£million
Warrants in issue£million
Capital redemption
reserve£million
Merger reserve1
£million
Hedging and
revaluation reserve2
£million
Translationreserve£million
Investmentin own
shares3
£million
Retained earnings£million
Attributable to equity
holders of the parent
£million
Non‑ controlling
interests£million
Total£million
Balance at 1 January 2017 14.6 116.5 – 0.1 121.4 (8.8) 109.7 (1.9) (9.4) 342.2 12.9 355.1
Profit/(loss) for the year – – – – – – – – (256.4) (256.4) 2.0 (254.4)
Other comprehensive income – – – – – 2.9 (35.2) – (8.6) (40.9) 0.4 (40.5)
Total comprehensive income – – – – – 2.9 (35.2) – (265.0) (297.3) 2.4 (294.9)
Dividends paid – – – – – – – – – – – –
Shares issued – – – – – – – – – – – –
Purchase of Company shares – – – – – – – – – – – –
Company shares used to settle share-based payment obligations – – – – – – – – – – – –
Share-based payments – – – – – – – – 2.4 2.4 – 2.4
Transactions with owners – – – – – – – – 2.4 2.4 – 2.4
Balance at 31 December 2017 14.6 116.5 – 0.1 121.4 (5.9) 74.5 (1.9) (272.0) 47.3 15.3 62.6
Impact of adoption of IFRS 15 (see note 1(a)) – – – – – – – – (37.5) (37.5) – (37.5)
Balance at 1 January 2018 as restated 14.6 116.5 – 0.1 121.4 (5.9) 74.5 (1.9) (309.5) 9.8 15.3 25.1
Profit/(loss) for the year – – – – – – – – (132.2) (132.2 ) 3.3 (128.9)
Other comprehensive income – – – – – 9.4 14.0 – 44.8 68.2 – 68.2
Total comprehensive income – – – – – 9.4 14.0 – (87.4) (64.0) 3.3 (60.7)
Dividends paid - - - - - - - - - - (3.7) (3.7)
Shares issued 0.4 - - - - - - - - 0.4 - 0.4
Warrants issued - - 35.3 - - - - - - 35.3 - 35.3
Warrants exercised - - (3.9) - - - - - 3.9 - - -
Purchase of Company shares - - - - - - - - - - - -
Company shares used to settle share-based payment obligations - - - - - - - 1.9 (1.9) - - -
Share-based payments - - - - - - - - 2.5 2.5 - 2.5
Transactions with owners 0.4 - 31.4 - - - - 1.9 4.5 38.2 (3.7) 34.5
Balance at 31 December 2018 15.0 116.5 31.4 0.1 121.4 3.5 88.5 - (392.4) (16.0) 14.9 (1.1)
1 The £121.4 million merger reserve represents £16.4 million premium on the shares issued on the acquisition of Robert M. Douglas Holdings Plc in 1991, £32.6 million premium on the shares issued on the acquisition of MacLellan Group Plc in 2006 and £72.4 million premium on the shares placed to partially fund the acquisition of Initial Facilities in 2014.
2 The hedging and revaluation reserve includes £14.8 million relating to the revaluation of financial assets within the joint ventures held at fair value through other comprehensive income (2017: £16.0 million) .
3 The investment in own shares reserve represents the cost of shares in Interserve Plc held by the trustees of the Interserve Employee Benefit Trust. The number of shares held at 31 December 2018 was 32,144 (2017: 466,909) , with the market value of these shares at 31 December 2018 being £nil (2017: £0.4 million) .

104
FINANCIAL STATEMENTS
Consolidated cash flow statement for the year ended 31 December 2018
Notes
Year ended 31 December 2018
£million
Year ended 31 December 2017 #
£million
Operating activities
Total operating profit/(loss) (5.9) (224.8)
Adjustments for:
Amortisation of acquired intangible assets 13 18.7 21.5
Impairment of goodwill 12 33.1 60.0
Amortisation of capitalised software development 13 6.1 1.6
Impairment of capitalised software development 13 - 6.3
Depreciation of property, plant and equipment 14 35.7 39.5
Impairment of capitalised IT development 14 - 9.4
Profit on disposal of investments in joint ventures 15 (17.0) (7.5)
Proceeds on disposal of PFI investments 47.0 12.3
Non-cash gain on pension indexation 5 (70.6) -
Other non-current asset non-cash impairment items 5 15.0 1.4
Loss on disposal of subsidiary 5 7.1 -
Pension contributions in excess of the income statement charge (16.9) (15.9)
Share of results of associates and joint ventures (17.3) 5.2
Charge relating to share-based payments 28 2.5 2.1
Gain on disposal of plant and equipment – hire fleet (17.0) (22.2)
Gain on disposal of plant and equipment – other (2.9) (0.2) Gain on disposal of plant and equipment - hire fleet (17.0) (22.2)
Operating cash flows before movements in working capital 17.6 (111.3)
(Increase) /decrease in inventories (1.7) 0.5
(Increase) /decrease in receivables 59.2 (11.1)
Increase/(decrease) in payables (135.0) (26.4)
Capital expenditure - hire fleet 14 (20.3) (17.8)
Proceeds on disposal of plant and equipment - hire fleet 20.0 30.2
Cash used by operations (60.2) (135.9)
Cash used by operations - Energy from Waste exited business (29.7) (95.9)
Cash used by operations - other non-underlying (41.8) (72.9)
Cash generated by operations - ongoing business 11.3 32.9
Taxes paid (11.4) (8.6)
Net cash from operating activities (71.6) (144.5)
Investing activities
Interest received 3.2 5.9
Dividends received from associates and joint ventures 15a 11.8 17.2
Proceeds on disposal of plant and equipment - non-hire fleet 8.9 1.6
Capital expenditure - non-hire fleet 13/14 (19.6) (39.3)
Investment in joint-venture entities 15b (0.8) (32.7)
Proceeds on disposal of subsidiary 2.5
Receipt of loan repayment - investments 15b - 0.7
Net cash from/(used in) investing activities 6.0 (46.6)
# restated (note 1)
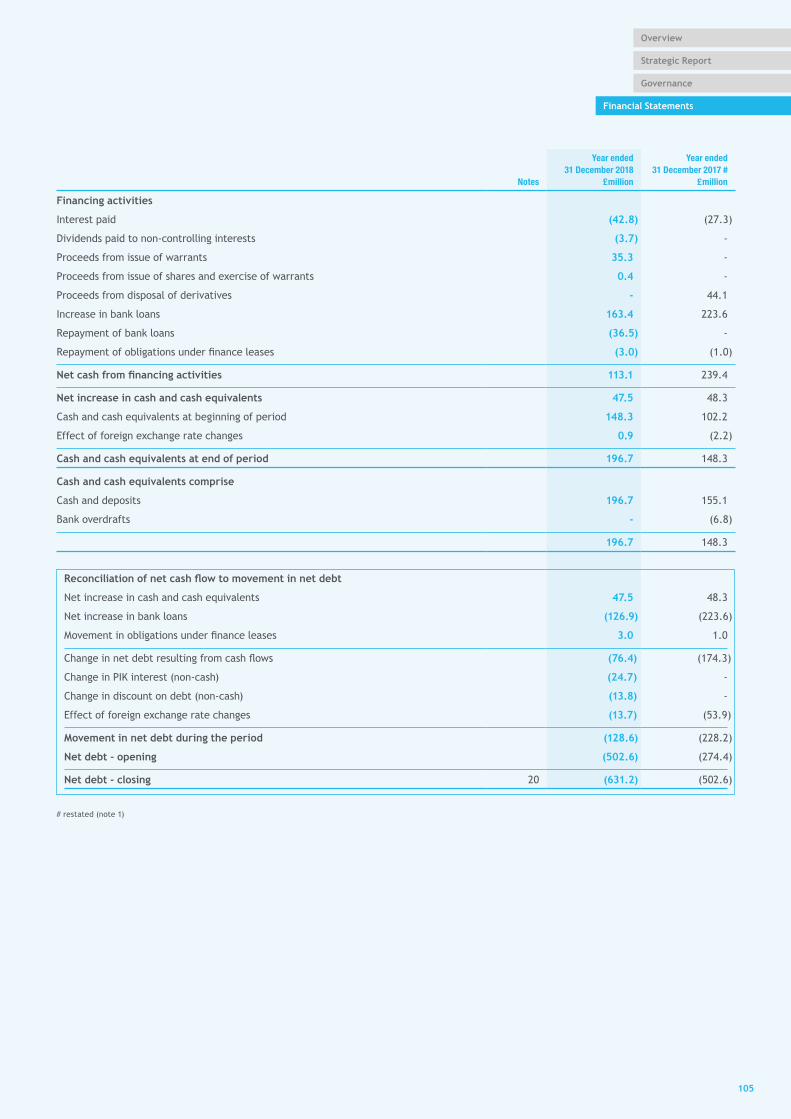
105
Consolidated cash flow statement continued for the year ended 31 December 2018
Governance
Financial Statements
Strategic Report
Overview
Notes
Year ended 31 December 2018
£million
Year ended 31 December 2017 #
£million
Financing activities
Interest paid (42.8) (27.3)
Dividends paid to non-controlling interests (3.7) -
Proceeds from issue of warrants 35.3 -
Proceeds from issue of shares and exercise of warrants 0.4 -
Proceeds from disposal of derivatives - 44.1
Increase in bank loans 163.4 223.6
Repayment of bank loans (36.5) -
Repayment of obligations under finance leases (3.0) (1.0)
Net cash from financing activities 113.1 239.4
Net increase in cash and cash equivalents 47.5 48.3
Cash and cash equivalents at beginning of period 148.3 102.2
Effect of foreign exchange rate changes 0.9 (2.2)
Cash and cash equivalents at end of period 196.7 148.3
Cash and cash equivalents comprise
Cash and deposits 196.7 155.1
Bank overdrafts - (6.8)
196.7 148.3
Reconciliation of net cash flow to movement in net debt
Net increase in cash and cash equivalents 47.5 48.3
Net increase in bank loans (126.9) (223.6)
Movement in obligations under finance leases 3.0 1.0
Change in net debt resulting from cash flows (76.4) (174.3)
Change in PIK interest (non-cash) (24.7) -
Change in discount on debt (non-cash) (13.8) -
Effect of foreign exchange rate changes (13.7) (53.9)
Movement in net debt during the period (128.6) (228.2)
Net debt - opening (502.6) (274.4)
Net debt - closing 20 (631.2) (502.6)
# restated (note 1)

106
FINANCIAL STATEMENTS
Notes to the consolidated financial statements for the year ended 31 December 2018
1. BASIS OF PREPARATION AND ACCOUNTING POLICIESBasis of preparationThe financial statements have been prepared in accordance with International Financial Reporting Standards (IFRS) adopted for use in the European Union and therefore comply with Article 4 of the EU IAS Regulation and with those parts of the Companies Act 2006 that are applicable to companies reporting under IFRS.
The financial statements are presented in sterling, rounded to the nearest one hundred thousand unless otherwise stated. They have been prepared under the historical cost convention, except for the revaluation of certain financial instruments that have been measured at fair value.
The financial statements have been prepared on the going concern basis, which assumes that the Group will continue to be able to meet its liabilities as they fall due for the foreseeable future. In assessing the going concern assumptions, the Board has reviewed the base case plans, identified downsides and anticipated receipt of proceeds from the proposed Deleveraging Plan. Following this assessment, the Board has a reasonable expectation that the Group will be able to operate as a going concern for the foreseeable future.
In undertaking the assessment, the Board has considered the fact that the Deleveraging Plan is subject to a shareholder vote, an event which is outside of the control of the Group. These events and conditions indicate a material uncertainty on the completion of the Deleveraging Plan, which may cast significant doubt about the Group’s ability to continue as a going concern.
The going concern basis has been adopted for 2018 because the directors believe that the Group has realistic plans for the future growth of the business and every expectation of successfully completing the Deleveraging Plan by the end of March 2019. The Board believes that, with the Deleveraging Plan in place, even in a reasonable worst-case scenario, the Group will continue to have adequate financial resources to realise their assets and discharge their liabilities as they fall due. Accordingly, the directors have formed the judgement that it is appropriate to prepare the financial statements on the going concern basis. Therefore, the financial statements do not include any adjustments which would be required if the going concern basis of preparation is inappropriate.
(a) Adoption of new and revised standardsIFRS 9 Financial instrumentsThe adoption of IFRS 9 has impacted the Group in the following areas. The Group continues to record movements in its financial assets held within its PFI Joint Ventures through other comprehensive income (OCI) using the fair value through OCI category. This is because these financial assets are held within a business model whose objective at Group level is achieved by both collecting contractual cash flows and selling financial assets and the contractual terms of the financial assets meet the “solely payments of principal and interest on the principal outstanding” criterion.
Therefore, there is no quantitative impact on the Group upon adoption of IFRS 9.
IFRS 15 Revenue from contracts with customersDuring the year we concluded our review of the implications of the adoption of IFRS 15 Revenue from contracts with customers which we adopted from the beginning of this year. As disclosed in the 2017 Annual Report, we identified no material change in the way that we recognise revenue on contracts with customers. However, we did identify an issue with the transition from IAS 11 Construction contracts whereby costs that we had previously capitalised under that standard on contracts that were ultimately onerous, where future recovery was anticipated from a third party other than the customer, are not covered by similar provisions in IFRS 15. As such the recognition of an asset in these circumstances falls to the more restrictive requirements of IAS 37 Provisions, contingent liabilities and contingent assets. In order to recognise the asset, IAS 37 requires recovery to be virtually certain rather than expected, otherwise it falls to be treated as a contingent asset and disclosed rather than recognised. Whilst we remain confident of recovery and our ultimate expectation is unchanged, we are not able to meet the requirement of virtually certain which we have interpreted as being as close to 100% as to make any remaining uncertainty insignificant.
We have adopted IFRS 15 through the “modified retrospective adoption” approach and as such have booked a cumulative catch-up adjustment to the opening balance sheet (charge to equity and increase in provisions) of £37.5 million without altering comparatives. These recoveries will now flow through the income statement as received (in effect the £37.5 million becomes an unrecognised contingent asset) .
During 2018 the Group has identified a number of minor differences as a result of the implementation of IFRS 15 which are as follows:
(i) where revenue from insurance claims on contracts that would have previously been recognised that does not any longer meet the criteria of being highly probable that these amounts would not be reversed. The total impact on the year ended 31 December 2018 revenue is a reduction of £32.5 million with a corresponding effect on provisions in the balance sheet.
(ii) where construction-related revenues have been subject to profit abatement rules the impact on the year ended 31 December 2018 has been a reduction in revenues of £7.3 million and a corresponding reduction in cost of sales. The impact on the balance sheet has been a reduction in amounts due from contract customers and a reduction in the amounts due to contract customers.
At the date of authorisation of these financial statements the following standards and interpretations were in issue but not yet effective, and therefore have not been applied in these year-end financial statements:
107107
Governance
Financial Statements
Strategic Report
Overview
IFRS 16 LeasesThe new standard will replace IAS 17 Leases. It will become effective for accounting periods on or after 1 January 2019, at the earliest. It will require nearly all leases to be recognised on the balance sheet as liabilities, including those currently recognised as operating leases, with corresponding assets being created.
The Group has assessed the estimated impact that initial application of IFRS 16 will have on its consolidated financial statements, as described below. The actual impacts of adopting the standard may change because:
• the Group has not finalised the testing and assessment of controls over its new IT systems; and
• the new accounting policies are subject to change until the Group presents its first financial statements that include the date of initial application.
IFRS 16 introduces a single, on-balance sheet lease accounting model for lessees. A lessee recognises a right-of-use asset representing its right to use the underlying asset and a lease liability representing its obligation to make lease payments. There are recognition exemptions for short-term leases and leases of low-value items. Lessor accounting remains similar to the current standard – i.e. lessors continue to classify leases as finance or operating leases.
IFRS 16 replaces existing leases guidance, including IAS 17 Leases, IFRIC 4 Determining whether an arrangement contains a lease, SIC-15 Operating leases – incentives and SIC-27 Evaluating the substance of transactions involving the legal form of a lease.
(i) Leases in which the Group is a lesseeThe Group will recognise new assets and liabilities for its operating leases of properties, fleet vehicles and other assets (see note 24(b)) . The nature of expenses related to those leases will now change because the Group will recognise a depreciation charge for right-of-use assets and an interest expense on lease liabilities.
Previously, the Group recognised operating lease expense on a straight-line basis over the term of the lease, and recognised assets and liabilities only to the extent that there was a timing difference between actual lease payments and the expense recognised.
In addition, the Group will no longer recognise provisions for operating leases that it assesses to be onerous as described in note 25. Instead, the Group will include the payments due under the lease in its lease liability.
No significant impact is expected for the Group’s finance leases.
Based on the information currently available, the Group estimates that it will recognise additional lease liabilities of between £125 million and £150 million as at 1 January 2019 and that IFRS 16 will increase the Group’s EBITDA by approximately £30 million and reduce profits before tax by around £2 million.
(ii) Leases in which the Group is a lessorThe Group will reassess the classification of sub-leases in which the Group is a lessor. Based on the information currently available no significant impact is expected for leases in which the Group is a lessor.
(iii) TransitionThe Group is applying IFRS 16 in 2019, using the modified retrospective approach. Therefore, the cumulative effect of adopting IFRS 16 will be recognised as an adjustment to the opening balance of retained earnings at 1 January 2019, with no restatement of comparative information.
The Group plans to apply the practical expedient to grandfather the definition of a lease on transition. This means that it will apply IFRS 16 to all contracts entered into before 1 January 2019 and identified as leases in accordance with IAS 17 and IFRIC 4.
Except for IFRS 16 noted above, the directors do not currently anticipate that the adoption of any other standard and interpretation that has been issued but is not yet effective will have a material impact on the financial statements of the Group in future periods.
(b) Critical accounting judgements and key sources of estimation and uncertaintyIn the preparation of the consolidated financial statements management makes certain judgements and estimates that impact the financial statements. While these judgements and estimates are continually reviewed the facts and circumstances underlying them may change and that could impact the results of the Group. Each judgement identified below also includes, where relevant, an assessment of the key sources of estimation uncertainty. In particular:
JudgementsGlasgow EfW plantIn July 2012 Interserve was appointed by Viridor as the Engineer Procure Construct (EPC) contractor for the construction of the Glasgow Energy from Waste (EfW) plant. In December 2016 this contract was terminated by the client. During 2018 the Group successfully concluded its professional indemnity insurance claims, with all cash being received in the period. The key remaining judgement remains the final account settlement with Viridor and whether this will crystallise within current expected parameters.

108108
FINANCIAL STATEMENTS
Notes to the consolidated financial statements continuedfor the year ended 31 December 2018
Differences of interpretation of certain contract provisions between the parties exist, which are capable of having a material impact on the liability of the Group for compensation on termination. These issues include, but are not limited to:
(i) Application of the liability cap to Viridor’s claims;
(ii) The order in which limitations on liability are taken into account in the compensation calculation;
(iii) The scope of contractual pain-share provisions;
(iv) The recovery of Viridor’s indirect losses; and
(v) Viridor’s duty to mitigate its costs incurred in completing the works.
The judgements in this regard have been based upon appropriate legal and technical advice and the directors regard them as appropriate. Viridor’s parent company’s half-year results to 30 September 2018 included a net receivable due from Interserve relating to this project of £64 million. Since the year end Viridor has submitted a draft termination account to Interserve significantly in excess of this receivable. The directors believe this has no technical merit. The Glasgow contract contains an overall limit on Interserve’s liability to Viridor under the contract which Interserve calculates after deducting payments to date as £71.0 million.
The directors have taken the view that the differences between the parties will be substantially narrowed if the interpretation disputes (i) , (ii) and (iii) above are resolved. Assuming the directors’ views on these points are correct, the liability would be between £nil and £33.5 million. If not, the liability could be higher. The directors consider that their best estimate of the outcome is £14.7 million which is the accrued cost in the balance sheet to settle the final account.
Interserve believes that there are strong claims that there are provisions in the contract that limit the scope of the Group’s liability. Accordingly, Interserve commenced an adjudication seeking a statement of law in respect of (i) , (ii) and (iii) above on 8 February 2019 and expects a decision to be delivered by April 2019. Any decision by the adjudicator could be subsequently challenged through formal arbitration. There can, however, be no assurances as to the ultimate amount of any liability.
Derby EfW plantIn August 2014 a special-purpose vehicle (SPV) (formed as a 50:50 joint venture between Interserve and Renewi) , Resource Recovery Solutions (RRS) , was awarded the contract by Derby City and County Councils (the Councils) for the construction and operation of the Derby EfW plant. The SPV awarded an EPC contract to Interserve Construction for the construction of the plant.
The Group completed the physical construction of the plant in 2017 and started receiving municipal waste in January 2018; however, the project has been delayed past the long-stop date of September 2018. During the fourth quarter of 2018 acceptance testing commenced and discussions are currently ongoing as to how to demonstrate satisfactory completion of the tests. Transfer testing is due to commence shortly once the plant is believed to be capable of performing at the optimum levels.
The key remaining judgements are:
• The acceptance and transfer tests are passed and independently certified within the current projected timescales.
◦ The Derby EfW plant has been operational since September 2018, excluding periods where defect rectification works have been completed. The directors are confident that the Derby EfW plant will ultimately meet or exceed the required outputs.
◦ Delays would likely result in increased contractual costs to complete and damages. Depending on the cause, these costs could be recovered from insurers. It is not possible to quantify unknown circumstances which could cause delays; however, current rates of costs and damages are c£1.5 million per month and the adjustment would increase cost of sales and either provisions or accruals in the balance sheet.
• Performance and availability damages are not levied as the plant operates at the required contractual levels.
• Interserve is not terminated on the project.
◦ In the event that Interserve and the Councils cannot come to an agreement, the Councils may exercise their contractual right to terminate the Project Agreement which, in turn, would lead to the termination of the construction contract.
◦ Given the stage of completion of the project, the directors do not believe this would be a desirable outcome for all parties.
◦ The financial impact of such an event would depend on the calculation of the market value of the project, which the directors expect would reduce Interserve’s debt and equity return in the SPV but not create a claim against Interserve. Interserve’s equity and debt interests in the SPV were valued at £12.4 million at 31 December 2018, which is shown as an investment in joint ventures in the balance sheet. In addition, the project finance lenders would seek to recover their losses from Interserve as a result of Interserve’s alleged default in terms of failing to achieve completion by the long-stop date.
◦ The directors believe Renewi require Interserve’s consent as shareholder of the SPV to terminate Interserve’s construction contract.
1. BASIS OF PREPARATION AND ACCOUNTING POLICIES CONTINUED(b) Critical accounting judgements and key sources of estimation and uncertainty continuedJudgements continued

109109
Governance
Financial Statements
Strategic Report
Overview
• The Company has, as yet, not recognised any value for professional indemnity (PI) insurance claims relating to the construction of the Derby EfW plant.
◦ This contract has been significantly loss making and, as required under IFRS, a forward-loss provision has been taken. This forward-loss provision does not assume any PI insurance recoveries. The directors expect that, as on the Glasgow EfW project in 2018, significant PI recoveries on Derby EfW plant will be achieved.
◦ A notification has been made to the PI insurer of claims. The claims predominantly relate to alleged design deficiencies and negligence of key sub-contractors, particularly design deficiencies relating to the Advanced Conversion Facility (ACF) power plant. The claims are conceptually similar to the successful claims made on the Glasgow EfW plant.
◦ Interserve is yet to fully establish its entitlements as the project has not concluded, and recoveries will be recognised in the income statement when cash is received. It is only at this point the directors deem the likelihood of recovery to meet the virtually certain recognition criteria of IAS 37. The range in outcome from these claims is between £nil and £50 million, which is the maximum receivable through a single claim under the policy. As at the balance sheet date, the directors expect to receive in excess of £30 million; however, fully detailed and substantiated submissions have not been submitted. The timing of the resolution of the insurance claims is not fully within the control of the Group; however, the directors expect substantial insurance proceeds during the second half of 2019.
Future losses on the Ministry of Justice CRC contracts will fall within acceptable levelsInterserve is involved in providing probation and rehabilitation services to the Ministry of Justice (MoJ) . These services are provided via five community rehabilitation companies (CRCs) each of which holds a contract to provide services in a given geographic area. During 2018, a fundamental variation to the contracts was agreed which improved their viability but still left a substantial loss over their remaining life across all five of the contracts. The forward-loss provision of £12.1 million booked in the prior year has been updated for these developments and continues to be reviewed on a regular basis.
The year-end 31 December 2018 forward-loss and impairment provisions of £11.4 million included within other debtors represents a fair assessment of a number of potential outcomes. The sensitivities principally pertain to the Performance by Results income which is impacted by reoffending data published by the MoJ on a quarterly basis and there are a number of factors which have a material impact on reoffending.
ILE International Saudi debtInterserve Learning and Employment International (ILE) had £36.0 million of outstanding debt at 31 December 2018 including trade debtors and accrued income. Of this, approximately £17 million is recorded in deferred income as relating to activities to be undertaken in 2019. £15.7 million of the debt was greater than 90 days old at the year end and only £1.8 million is over a year old.
Since the start of Q4 2018, it has been evident that our immediate customer, Colleges of Excellence (COE) , has had a funding shortfall from its funding partner, Human Resources Development Fund (HRDF) . Initially COE commented to us that only 44% of outstanding payments would be made. We received 44% of the amount due on the main COE contract but between the second half of October and 31 December 2018, we have had no further receipts. The Health programme, where we have been paid, is funded by the Ministry of Health.
We believe that we will be paid in full for all of the outstanding sums and that no bad debt provision is necessary at this stage based on the following reasons:
(i) The client has verbally assured us on innumerable occasions that we will be paid and that the issue is purely one of timing.
(ii) Moreover, the client has asserted in writing on a number of occasions that we have performed all of our obligations, that the sums are due and that, subject to the finalisation of its own funding arrangements, these sums will be paid. We are establishing a fact pattern for each contract to affirm the weight of evidence supporting these assertions.
(iii) We have now raised breach notices on all contracts and we have had no responses from the customer which would contest our right to raise the breach notices, or entitlement to payment. If they had, such an action would prejudice our right to 100% of the debt.
(iv) Our contracts are reasonably straightforward, we have carried out those contracts and have exercised our rights according to these contracts.
(v) It is not uncommon for payments to be made relatively slowly in Saudi Arabia and our experience of COE is that, whilst payments have been slow, we have historically been paid.
(vi) The COE have continually stated throughout this process that Interserve is a strong strategic partner for the programme and that they will shortly be entering into discussion to extend the current contracts, prior to commencing the process of the recommissioning and expansion of the current programme.
(vii) We have robustly documented our position and we believe we are in a strong place if ever we were to have to take our case to a higher authority – the Saudi Crown Prince or the Courts.
In the circumstances, we are firmly of the view, therefore, that we will be paid in full in due course for all of the sums due and this position is supported by the fact that we have recently received approximately £13 million of cash in part settlement of the outstanding debt.

110110
FINANCIAL STATEMENTS
Notes to the consolidated financial statements continuedfor the year ended 31 December 2018
Accounting for debt restructuring under IFRS 9On 27 April 2018 the Group re-negotiated its existing credit facilities which consisted of the renewal of existing Revolving Credit Facilities (RCF) of £388.6 million and $350 million of US$ Loan Notes and obtaining £175 million of new Term Loans (LIBOR + 8.75%) together with £21.5 million of Money Market lines. These renewals of the RCF and US$ Loan Notes (together, ‘the Override Agreement’) were at significantly higher rates of interest than previously (LIBOR + 6.43% for RCF vs average of 2.8% in 2017 and LIBOR + 7.61% for the US$ Loan Notes vs average of 5.6% in 2017) .
We concluded that the changes in the terms of the Override Agreement constituted a substantial debt modification under IFRS 9 and therefore existing loans were derecognised and new loan balances were recognised. The Override Agreement was concluded at the same time as the Group securing new lending, under the terms of a new ‘Super Senior Agreement’. The substantially modified debt was initially recognised at fair value, calculated based on the expected present value of future cash flows, discounted at an effective interest rate reflecting the Group’s cost of borrowing. Our view is that the effective rate of interest on the loan was consistent with the market rates existing in April 2018. A total of 23 different banks participated as a syndicate on the RCF and five institutions on the US$ bond. A significant proportion of these banks also participated in the Super Senior Agreement, alongside two lenders who had not previously participated in the syndicate. On the basis of these facts, we concluded that this indicates that the interest rates offered were arms-length in nature based on market-based pricing. The impact of these judgements was that there was no significant gain or loss on refinancing under the terms of the Override Agreement, and that the increased cost of borrowing in the Override Agreement is consistent with the prevailing market rate.
Measurement of impairment of goodwill and intangible assets The carrying value of goodwill and intangible assets is reviewed for impairment at least annually. In determining whether goodwill is impaired, an estimation of the value in use of the cash generating unit (CGU) to which the goodwill has been allocated is required. This calculation of value in use requires estimates to be made relating to the timing and amount of future cash flows expected from the CGU and suitable discount rates based on the Group’s weighted average cost of capital adjusted to reflect the specific economic environment of the relevant CGU. These estimates have been used to calculate a £33.1 million impairment against goodwill in Support Services.
An impairment review of the Group’s investments in associates was also carried out at 31 December 2018. We specifically assessed the impact of the current economic blockade in Qatar as a potential indicator of impairment. We have concluded, however, that the Qatar blockade is of a temporary nature and that therefore no impairment provision is required at 31 December 2018.
Retirement benefit obligationsThe Group has assessed that under IFRIC 14 IAS 19 it is appropriate to recognise a pension asset in the balance sheet at 31 December 2018.
Judgement is exercised in establishing the fair value of retirement benefit assets, most notably the valuation of the buy-in contract to insure some of the benefits of a subset of the pension membership of the scheme provided by the insurer. This requires judgement of the proportion of the buy-in contract that exactly matches the amount and timing of benefits payable and the choice of an appropriate valuation technique in accordance with IFRS 13.
Non‑underlying item presentationIAS 1 requires material items to be disclosed separately in a way that enables users to assess the quality of a company’s profitability. In practice, these are commonly referred to as ‘exceptional’ or ‘non-underlying items’, but this is not a concept defined by IFRS and therefore there is a level of judgement involved in determining what to include in headline profit. We consider items which relate to non-recurring events and are significant in size or in nature to be suitable for separate presentation (see note 5) .
Estimates and uncertaintyMeasurement of impairment of goodwill and intangible assetsAs set out in notes 1(b) and (g) , the carrying value of goodwill and intangible assets is reviewed for impairment at least annually. In determining whether goodwill is impaired an estimation of the value in use of the CGU to which the goodwill has been allocated is required. This calculation of value in use requires estimates to be made relating to the timing and amount of future cash flows expected from the CGU, and suitable discount rates based on the Group’s weighted average cost of capital adjusted to reflect the specific economic environment of the relevant CGU.
These estimates have been used in the year to test for impairment against the goodwill held in the Group but are judgemental in nature.
1. BASIS OF PREPARATION AND ACCOUNTING POLICIES CONTINUED(b) Critical accounting judgements and key sources of estimation and uncertainty continuedJudgements continued

111111
Governance
Financial Statements
Strategic Report
Overview
Retirement benefit obligationsIn accordance with IAS 19 Employee Benefits, the Group has disclosed in note 29 the assumptions used in calculating the defined benefit obligations. In the calculation a number of assumptions around future salary increases, increase in pension benefits, mortality rates, inflation and discount rates have been made. Small changes in these assumptions can lead to significant changes to the overall scheme liabilities, as disclosed in note 29.
(c) Restatement of comparativesCertain items treated as non-underlying in the year ended 31 December 2018 financial statements have been restated for 2017 comparison purposes, and they relate to businesses exited in the current year, including London Construction, Site Services and Power. This has reduced underlying revenues in 2017 by £120.6 million and increased underlying operating profit by £9.6 million, with an equal and opposite impact on non-underlying revenue and operating profits.
Accounting policies Interserve Plc (the Company) is a company incorporated in the United Kingdom under the Companies Act 2006. The consolidated financial statements comprise the Company and its subsidiaries (together referred to as the Group) and the Group’s interest in joint ventures and associates.
The significant accounting policies adopted by the directors are set out below and have been applied consistently in dealing with items which are considered material to the Group’s financial statements.
(a) Basis of consolidationThe Group financial statements incorporate the financial statements of the Company and entities controlled by the Company (its subsidiaries) . The results, assets and liabilities of associates and joint-venture entities are accounted for under the equity method of accounting. The results of subsidiaries acquired or disposed of during the year are included from the effective date of acquisition or until the effective date of disposal respectively.
Non-controlling interests in the net assets of the consolidated subsidiaries are identified separately from the Group’s equity interest therein. Non-controlling interests consist of those interests at the date of the original business combination and the minority’s share of the changes in equity since the date of the combination.
All intra-group transactions, balances, income and expenses are eliminated on consolidation.
Where necessary, adjustments are made to the financial statements of the associates, joint ventures and any newly acquired subsidiaries to bring their accounting policies into line with those used by the Group. When an entity has an accounting reference date other than 31 December, due to the influence of a co-shareholder or customer requirements, the consolidation includes management accounts, prepared using these Group accounting policies, drawn up for the year ended 31 December.
Where a Group company is party to a jointly-controlled operation, that company proportionately accounts for its share of the income and expenditure, assets, liabilities and cash flows on a line-by-line basis. Such arrangements are reported in the consolidated financial statements on the same basis.
(b) Business combinationsBusiness combinations are accounted for using the acquisition accounting method. The cost of the acquisition is measured at the aggregate of the fair values, at the date of acquisition, of assets given, liabilities incurred or assumed and equity instruments issued by the Group in exchange for control of the acquired company. The acquired company’s identifiable assets, liabilities and contingent liabilities are recognised at their fair value as at the acquisition date. Before the adoption of IFRS 3 (revised) , the cost of acquisition included any costs directly attributable to the business combination. Costs incurred on acquisitions completed since 1 January 2010, the date of adoption of the revision to IFRS 3, are expensed.
Goodwill arising on consolidation represents the excess of the cost of acquisition over the Group’s interest in the fair value of the identifiable assets and liabilities of a subsidiary at the date of acquisition. Goodwill is recognised as an asset and reviewed for impairment at least annually. Any impairment is recognised immediately in the income statement and is not subsequently reversed.
On disposal of a subsidiary, associate or jointly-controlled entity, the attributable amount of goodwill is included in the determination of the profit or loss on disposal.
Goodwill arising on acquisitions before the date of transition to IFRS has been retained at the previous UK GAAP value at that date, subject to being subsequently tested for impairment. Goodwill written off to reserves under UK GAAP prior to 1998 has not been reinstated and is not included in determining any subsequent profit or loss on disposal. Goodwill arising on the acquisition of shares in associated undertakings is included within investments in associated undertakings.
The level of non-controlling interests in the acquired company is initially measured at the minorities’ proportion of the net fair value of the assets, liabilities and contingent liabilities recognised.

112112
FINANCIAL STATEMENTS
Notes to the consolidated financial statements continuedfor the year ended 31 December 2018
(c) Foreign currencyTransactions denominated in foreign currency are translated at the rates ruling at the dates of the transactions.
Monetary assets and liabilities denominated in foreign currencies at the balance sheet date are translated at the rates ruling at that date. These translation differences are dealt with in the profit for the year.
The financial results and cash flows of foreign subsidiaries, associated undertakings and joint ventures are translated into sterling at the average rate of exchange for the year. The balance sheets are translated into sterling at the closing rate of exchange, and the difference arising from the translation of the opening net assets and financial results for the year at the closing rate is taken directly to other comprehensive income.
(d) Revenue Effective 1 January 2018 the Group has applied IFRS 15 Revenue from contracts with customers. For additional information on the new standard and the impact on our results of operations, refer to Adoption of New and Revised Standards.
Revenue depicts the transfer of promised goods or services to our customers in an amount that reflects the consideration which we expect to be entitled in exchange for those goods or services. Across the Group revenue is recognised at the contract level, unless there are separately identifiable parts which can be measured individually (e.g. separate buildings in a construction contract) . Where separately identifiable parts can be measured individually revenue is recognised as and when performance obligations are completed.
The Group earns and recognises revenue across its divisions as follows:
ConstructionRevenue is earned from the provision of advice, design, construction and fit-out services for buildings and infrastructure across a range of sectors in both public and private markets.
The Group enters into construction contracts on a fixed and variable fee basis and recognises the related revenue over time. Due to the high degree of interdependence between the various elements of these projects, they are accounted for as a single performance obligation.
To depict the progress by which the Group transfers control of the constructed assets to the customer and to establish when and to what extent revenue can be recognised, the Group measures its progress towards complete satisfaction of the performance obligation using surveys of work performed by quantity surveyors in conjunction with clients. The quantity surveyor assessments provide the most faithful depiction of the transfer of goods and services to each customer due to the Group’s ability to make reliable estimates of the costs required to complete each project, arising from its significant historical experience of constructing similar assets. In addition to the fixed fee, some contracts include bonus payments which the Group can earn by completing a project in advance of a targeted delivery date.
Revenue for contract variations and claims are included in the Group’s estimate of the transaction price only if it is highly probable that a significant reversal of revenue will not occur. In making this assessment the Group considers its historical record of performance on similar contracts, whether the Group has access to the labour and materials resources needed to meet the contract programme, and the potential impact of other reasonably foreseen constraints.
When payments received from customers exceed revenue recognised to date on a particular contract, any excess (a contract liability) is reported in the balance sheet under advances received.
Construction projects do not typically include significant financing components. Where specific material contractual advance payments are made, which are not for the purposes of proportionately providing security of payment to the Group, then the contract consideration is reduced to reflect the value of the financing component which is then included within finance income in the income statement.
Support ServicesThe Group earns revenue from the provision of facilities management and other support services. Revenue for such services are accounted for over time in the accounting period when services are rendered.
Fee arrangements from services include fixed fee arrangements (where the customer pays a regular invoice to reflect the service provided) , one-off additional fees for the performance of a specific service and certain variable fee arrangements which are dependent on achieving required KPIs.
For fixed fee arrangements, revenue is recognised based on the actual services provided to date as the provision and consumption of service occur simultaneously. Revenue for one-off additional fees is recognised when the associated performance obligations have been met (i.e. completion of service) . Variable consideration is only recognised in the accounts to the extent that it is highly probable that the amount will not be subject to a significant reversal when the uncertainty is resolved.
The Group has determined that no significant financing component exists in respect of the service revenue streams. This has been determined because the period from when the service is rendered to the date the invoice is paid will be less than one year.
1. BASIS OF PREPARATION AND ACCOUNTING POLICIES CONTINUED
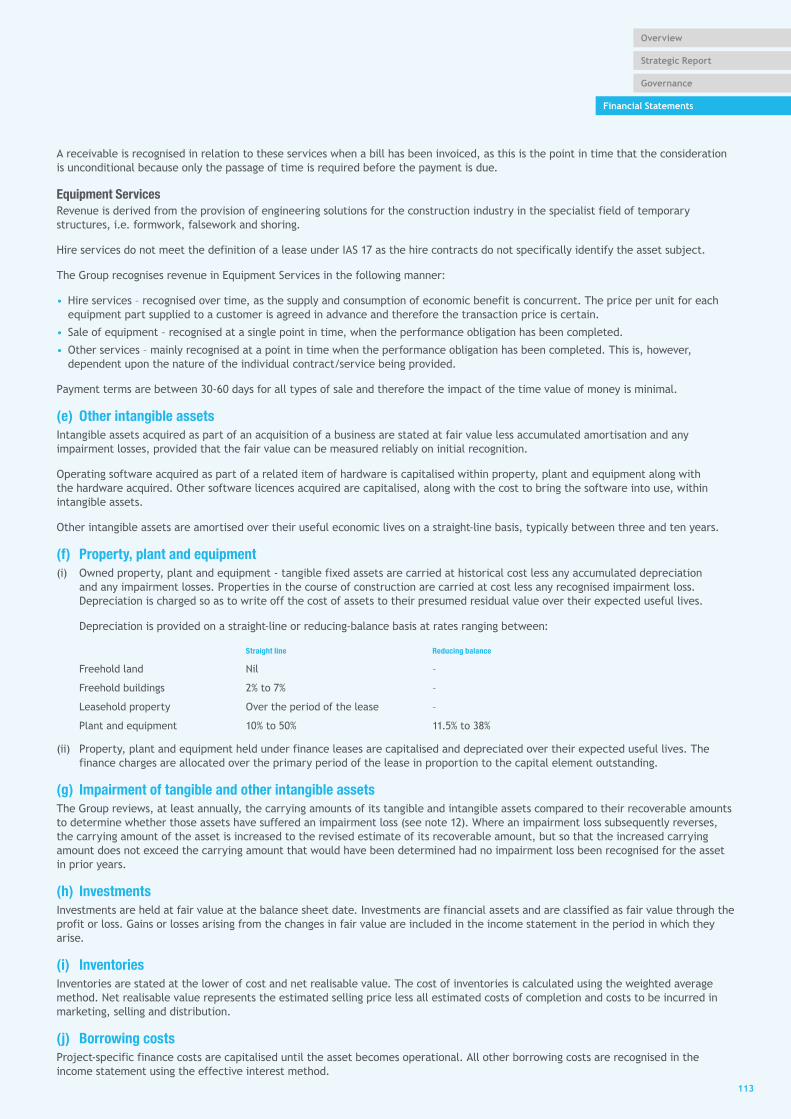
113113
Governance
Financial Statements
Strategic Report
Overview
A receivable is recognised in relation to these services when a bill has been invoiced, as this is the point in time that the consideration is unconditional because only the passage of time is required before the payment is due.
Equipment ServicesRevenue is derived from the provision of engineering solutions for the construction industry in the specialist field of temporary structures, i.e. formwork, falsework and shoring.
Hire services do not meet the definition of a lease under IAS 17 as the hire contracts do not specifically identify the asset subject.
The Group recognises revenue in Equipment Services in the following manner:
• Hire services – recognised over time, as the supply and consumption of economic benefit is concurrent. The price per unit for each equipment part supplied to a customer is agreed in advance and therefore the transaction price is certain.
• Sale of equipment – recognised at a single point in time, when the performance obligation has been completed.
• Other services – mainly recognised at a point in time when the performance obligation has been completed. This is, however, dependent upon the nature of the individual contract/service being provided.
Payment terms are between 30-60 days for all types of sale and therefore the impact of the time value of money is minimal.
(e) Other intangible assetsIntangible assets acquired as part of an acquisition of a business are stated at fair value less accumulated amortisation and any impairment losses, provided that the fair value can be measured reliably on initial recognition.
Operating software acquired as part of a related item of hardware is capitalised within property, plant and equipment along with the hardware acquired. Other software licences acquired are capitalised, along with the cost to bring the software into use, within intangible assets.
Other intangible assets are amortised over their useful economic lives on a straight-line basis, typically between three and ten years.
(f) Property, plant and equipment (i) Owned property, plant and equipment - tangible fixed assets are carried at historical cost less any accumulated depreciation
and any impairment losses. Properties in the course of construction are carried at cost less any recognised impairment loss. Depreciation is charged so as to write off the cost of assets to their presumed residual value over their expected useful lives.
Depreciation is provided on a straight-line or reducing-balance basis at rates ranging between:
Straight line Reducing balance
Freehold land Nil –
Freehold buildings 2% to 7% –
Leasehold property Over the period of the lease –
Plant and equipment 10% to 50% 11.5% to 38%
(ii) Property, plant and equipment held under finance leases are capitalised and depreciated over their expected useful lives. The finance charges are allocated over the primary period of the lease in proportion to the capital element outstanding.
(g) Impairment of tangible and other intangible assets The Group reviews, at least annually, the carrying amounts of its tangible and intangible assets compared to their recoverable amounts to determine whether those assets have suffered an impairment loss (see note 12) . Where an impairment loss subsequently reverses, the carrying amount of the asset is increased to the revised estimate of its recoverable amount, but so that the increased carrying amount does not exceed the carrying amount that would have been determined had no impairment loss been recognised for the asset in prior years.
(h) InvestmentsInvestments are held at fair value at the balance sheet date. Investments are financial assets and are classified as fair value through the profit or loss. Gains or losses arising from the changes in fair value are included in the income statement in the period in which they arise.
(i) Inventories Inventories are stated at the lower of cost and net realisable value. The cost of inventories is calculated using the weighted average method. Net realisable value represents the estimated selling price less all estimated costs of completion and costs to be incurred in marketing, selling and distribution.
(j) Borrowing costsProject-specific finance costs are capitalised until the asset becomes operational. All other borrowing costs are recognised in the income statement using the effective interest method.

114114
FINANCIAL STATEMENTS
Notes to the consolidated financial statements continuedfor the year ended 31 December 2018
(k) PFI bid costs and other pre‑contract costs Incremental costs of obtaining a contract are recognised as an asset where the Group expects to recover these costs.
(l) Leases Leases are classified as finance leases whenever the terms of the lease transfer substantially all risks and rewards of ownership to the lessee. All other leases are classified as operating leases.
Finance leases are capitalised at the inception of the lease at the fair value of the leased property or, if lower, at the present value of the minimum lease payments. Lease payments are apportioned between the finance charges and the reduction of the lease liability so as to achieve a constant rate of interest on the remaining balance of the liability. Finance charges are reflected in the income statement.
Operating lease payments are recognised as an expense in the income statement on a straight-line basis over the lease term.
(m) Provisions Provisions are recognised when the Group has a present obligation (legal or constructive) as a result of a past event, it is probable that an outflow of resources embodying economic benefits will be required to settle the obligation and a reliable estimate can be made of the amount of the obligation. The expense relating to any provision is presented in the income statement net of any virtually certain reimbursement. If the effect of the time value of money is material, provisions are discounted using an appropriate rate that takes into account the risks specific to the liability. Where discounting is used, the increase in the provision due to the passage of time is recognised as a finance cost.
Provisions for onerous contracts are calculated at the lower of the cost of fulfilling the contract and any compensation or penalties arising from failure to fulfil it.
Vacant property provisions, including dilapidation costs, are recognised when the Group has committed to a course of action that will result in the property becoming vacant.
(n) Financial instruments Trade receivables Trade receivables are initially measured at fair value, and subsequently at their amortised cost as reduced by appropriate allowances for estimated irrecoverable amounts.
Impairment of financial assetsIFRS 9 impairment requires the use of more forward-looking information to evaluate expected credit losses. The new standard’s expected credit loss model (ECL) replaces IAS 39’s incurred loss model. Instruments within the scope of IFRS 9 included loans measured at amortised cost, trade receivables and contract assets recognised and measured under IFRS 15.
Recognition of credit losses is no longer reliant on the Group first identifying a credit loss event but, instead, the Group considers a wider range of information when assessing credit risk and measuring expected credit losses. This information includes past events, current conditions and reasonable forecasts in respect of the collectability of future cash flows of the instrument.
Cash and deposits Cash and deposits comprise cash on hand and demand deposits and other short-term, highly liquid investments that are readily convertible to a known amount of cash and are subject to an insignificant risk of changes in value. Cash and deposits are financial assets and are classified as loans and receivables.
Borrowings Interest-bearing bank loans and overdrafts are recorded at the proceeds received, net of direct issue costs. Finance charges, including premiums payable on settlement or redemption and direct issue costs, are accounted for on an accruals basis in the income statement and are added to the carrying amount of the instrument to the extent that they are not settled in the period in which they arise. Borrowings are measured at amortised cost.
Trade payables Trade payables are other financial liabilities initially measured at fair value and subsequently measured at amortised cost using the effective interest rate method.
Equity instruments Equity instruments issued by the Company are recorded at the proceeds received, net of direct issue costs.
Derivative financial instruments and hedge accounting The Group holds derivative financial instruments to hedge its foreign currency and interest rate risk exposures. Embedded derivatives are separated from the host contract and accounted for separately if the host contract is not a financial asset and certain criteria are met.
1. BASIS OF PREPARATION AND ACCOUNTING POLICIES CONTINUED

115115
Governance
Financial Statements
Strategic Report
Overview
Derivatives are initially measured at fair value. Subsequent to initial recognition, derivatives are measured at fair value, and changes therein are recognised in profit or loss.
The Group designates certain derivatives as hedging instruments to hedge the variability in cash flows associated with highly probable forecast transactions arising from changes in foreign exchange rates and interest rates and certain derivatives and non-derivative financial liabilities as hedges of foreign exchange risk on a net investment in a foreign operation.
At inception of designated hedging relationships, the Group documents the risk management objective and strategy for undertaking the hedge. The Group also documents the economic relationship between the hedged item and the hedging instrument, including whether the changes in cash flows of the hedged item and hedging instrument are expected to offset each other.
Cash flow hedgesWhen a derivative is designated as a cash flow hedging instrument, the effective portion of changes in the fair value of the derivative is recognised in OCI and accumulated in the hedging reserve. The effective portion of changes in the fair value of the derivative that is recognised in OCI is limited to the cumulative change in fair value of the hedged item, determined on a present value basis, from inception of the hedge. Any ineffective portion of changes in the fair value of the derivative is recognised immediately in profit or loss.
The Group designates only the change in fair value of the spot element of forward exchange contracts as the hedging instrument in cash flow hedging relationships. The change in fair value of the forward element of forward exchange contracts (forward points) is separately accounted for as a cost of hedging and recognised in a costs of hedging reserve within equity.
When the hedged forecast transaction subsequently results in the recognition of a non-financial item such as inventory, the amount accumulated in the hedging reserve and the cost of hedging reserve is included directly in the initial cost of the non-financial item when it is recognised. For all other hedged forecast transactions, the amount accumulated in the hedging reserve and the cost of hedging reserve is reclassified to profit or loss in the same period or periods during which the hedged expected future cash flows affect profit or loss.
If the hedge no longer meets the criteria for hedge accounting or the hedging instrument is sold, expires, is terminated or is exercised, then hedge accounting is discontinued prospectively. When hedge accounting for cash flow hedges is discontinued, the amount that has been accumulated in the hedging reserve remains in equity until, for a hedge of a transaction resulting in the recognition of a non-financial item, it is included in the non-financial item’s cost on its initial recognition or, for other cash flow hedges, it is reclassified to profit or loss in the same period or periods as the hedged expected future cash flows affect profit or loss.
If the hedged future cash flows are no longer expected to occur, then the amounts that have been accumulated in the hedging reserve and the cost of hedging reserve are immediately recycled to profit or loss.
Net investment hedgesWhen a derivative instrument or a non-derivative financial liability is designated as the hedging instrument in a hedge of a net investment in a foreign operation, the effective portion of, for a derivative, changes in the fair value of the hedging instrument or, for a non-derivative, foreign exchange gains and losses is recognised in OCI and presented in the translation reserve within equity. Any ineffective portion of the changes in the fair value of the derivative or foreign exchange gains and losses on the non-derivative is recognised immediately in profit or loss. The amount recognised in OCI is recycled to profit or loss as an adjustment on disposal of the foreign operation.
(o) Share‑based paymentsThe Group has applied the requirements of IFRS 2 Share-based payment.
The Group issues share-based payments to certain employees. The fair value determined at the grant date is expensed on a straight-line basis over the vesting period, based on the Group’s estimate of shares that will eventually vest. Fair value is measured by use of an appropriate valuation model. The Black-Scholes option pricing model has been used to value the Sharesave Scheme. A stochastic model has been used to value the Performance Share Plan.
(p) PFI projectsTreatment on consolidationThe Group’s investments in PFI jointly-controlled entities (“Joint ventures - PFI Investments”) are accounted for under the equity method. The Group conducts a trade in the realisation of these types of investments and, as a result, any proceeds on disposal of these investments are treated as part of operating cash flows in the consolidated cash flow statement.
Treatment in the underlying joint‑venture entityThe joint-venture entities have determined the appropriate treatment of the principal assets of, and income streams from, PFI and similar contracts. The balance of risks and rewards derived from the underlying assets is not borne by the entities, and therefore the asset provided is accounted for as a financial asset.
Income is recognised on PFI projects both as operating revenue and interest income: a proportion of total cash receivable is allocated to operating revenue by means of a margin on service costs taking account of operational risks, and interest income on the financial asset is recognised in the income statement using the effective interest method. The residual element is allocated to the amortisation of the financial asset.

116116
FINANCIAL STATEMENTS
Notes to the consolidated financial statements continuedfor the year ended 31 December 2018
The fair value of the financial asset is measured at each balance sheet date by computing the discounted future value of the cash flow allocated to the financial asset. Discount rates are determined using long-term interest rates, subject to a floor, plus risk factors specific to individual projects.
The Group accounts for PFI financial assets at FVOCI if the assets meet the following conditions:
• they are held under a business model whose objective is to “hold to collect” the associated cash flows and sell; and
• the contractual terms of the financial assets give rise to cash flows that are solely payments of principal and interest on the principal amount outstanding.
Any gains or losses recognised in other comprehensive income (OCI) will be recycled upon derecognition of the asset.
(q) PensionsThe Group has both defined benefit and defined contribution pension schemes for the benefit of permanent members of staff. For the defined benefit schemes the cost of providing benefits is determined using the projected unit credit method, with actuarial valuations being carried out at each balance sheet date.
Actuarial gains and losses are recognised in full in the period in which they occur. They are recognised directly in other comprehensive income and presented in the statement of comprehensive income.
For defined contribution schemes, the amount recognised in the income statement is equal to the contributions payable to the schemes during the year.
(r) TaxationCurrent tax is provided at amounts expected to be paid (or recovered) using the tax rates and laws that have been enacted or substantively enacted by the balance sheet date. The Group’s research and development activities allow it to claim R&D tax credits from HMRC in respect of qualifying expenditure; these credits are reflected in the income statement in cost of sales. Deferred tax assets and liabilities are calculated at the rates at which they are likely to reverse in the tax jurisdiction to which they relate.
Deferred tax is provided in full on temporary differences which arise between the carrying value of an asset or liability and its tax base. Deferred tax assets are recognised to the extent that it is probable that there will be sufficient profits in the future to enable the assets to be utilised and reviewed at least annually. Deferred tax liabilities are normally recognised for all taxable temporary differences. Deferred tax assets and liabilities are not discounted.
Deferred tax is charged/credited to the income statement except to the extent that the underlying asset or liability is credited/charged to equity in which case the deferred tax follows that treatment to equity.
Deferred tax assets and liabilities are offset when there is a legally enforceable right to set off current tax assets against current tax liabilities and when they relate to income taxes levied by the same taxation authority and the Group intends to settle its current tax assets and liabilities on a net basis.
(s) Non‑underlying itemsIAS 1 requires material items to be disclosed separately in a way that enables users to assess the quality of a company’s profitability. In practice, these are commonly referred to as ‘exceptional’ or ‘non-underlying items’, but this is not a concept defined by IFRS and therefore there is a level of judgement involved in determining what to include in ‘underlying’ profit. We consider items which relate to non-recurring events and are significant in size or in nature to be suitable for separate presentation (see note 5) . Where an item has been identified as ‘non-underlying’ due to a past event, any future impact will also be disclosed as non-underlying, to ensure consistency of presentation.
1. BASIS OF PREPARATION AND ACCOUNTING POLICIES CONTINUED(p) PFI projects continued

117117
Governance
Financial Statements
Strategic Report
Overview
2. REVENUEAn analysis of the Group’s revenue for the year is as follows:
Revenue including share of associates and joint ventures Consolidated revenue
2018£million
2017£million
2018£million
2017£million
Continuing operations
Provision of services 1,907.4 2,028.2 1,858.9 1,924.1
Revenue from construction contracts 1,103.8 1,379.6 830.6 1,067.6
Equipment sales and rental income 214.5 259.1 214.5 259.1
3,225.7 3,666.9 2,904.0 3,250.8
3. BUSINESS AND GEOGRAPHICAL SEGMENTS(a) Business segmentsThe Group is organised into three operating divisions, as set out below. Information reported to the Executive Team for the purposes of resource allocation and assessment of segment performance is based on the products and services provided.
• Support Services: provision of outsourced support services to public-sector and private-sector clients, both in the UK and internationally.
• Construction: design, construction and maintenance of buildings and infrastructure, both in the UK and internationally.
• Equipment Services: design, hire and sale of formwork, falsework and associated access equipment.
Costs of central services, including the financial impact of our PFI investments, are shown in “Group Services”.

118118
FINANCIAL STATEMENTS
Notes to the consolidated financial statements continuedfor the year ended 31 December 2018
Revenue including share of associates and
joint ventures Consolidated revenue Result
2018£million
2017 #£million
2018£million
2017 #£million
2018£million
2017 #£million
Support Services - UK 1,597.7 1,642.3 1,584.3 1,625.5 51.4 39.4
Support Services - International 172.1 193.9 138.0 142.2 7.2 2.8
Support Services 1,769.8 1,836.2 1,722.3 1,767.7 58.6 42.2
Construction - UK 756.6 972.8 756.6 972.8 2.2 (10.3)
Construction - International 246.6 290.5 13.5 - 13.3 19.2
Construction 1,003.2 1,263.3 770.1 972.8 15.5 8.9
Equipment Services 195.5 229.0 195.5 229.0 39.6 54.4
Group Services 57.9 92.1 16.8 35.0 (21.0) (21.0)
Inter-segment elimination (7.2) (12.0) (7.2) (12.0) - -
3,019.2 3,408.6 2,697.5 2,992.5 92.7 84.5
Non-underlying items and amortisation of acquired intangible assets (note 5) 206.5 258.3 206.5 258.3 (98.6) (309.3)
Revenue/total operating profit/(loss) 3,225.7 3,666.9 2,904.0 3,250.8 (5.9) (224.8)
Investment revenue 3.5 8.8
Finance costs (108.9) (28.4)
Profit/(loss) before tax (111.3) (244.4)
Tax (17.6) (10.0)
Profit/(loss) for the year (128.9) (254.4)
# restated (note 1) Segment assets Segment liabilities Net assets/(liabilities)
2018£million
2017£million
2018£million
2017£million
2018£million
2017£million
Support Services - UK 422.2 423.1 (362.6) (382.8) 59.6 40.3
Support Services - International 107.7 109.4 (46.0) (51.4) 61.7 58.0
Support Services 529.9 532.5 (408.6) (434.2) 121.3 98.3
Construction - UK 209.1 231.5 (248.7) (350.4) (39.6) (118.9)
Construction - International 62.9 55.9 - - 62.9 55.9
Construction 272.0 287.4 (248.7) (350.4) 23.3 (63.0)
Equipment Services 264.0 255.1 (41.1) (56.2) 222.9 198.9
1,065.9 1,075.0 (698.4) (840.8) 367.5 234.2
Group Services, goodwill and acquired intangible assets 411.0 484.0 (163.3) (168.3) 247.7 315.7
1,476.9 1,559.0 (861.7) (1,009.1) 615.2 549.9
Net debt per balance sheet (631.2) (502.6)
Net assets/(liabilities) (excluding non-controlling interests) (16.0) 47.3
3. BUSINESS AND GEOGRAPHICAL SEGMENTS CONTINUED(a) Business segments continued

119119
Governance
Financial Statements
Strategic Report
Overview
Depreciation and amortisationAdditions to property, plant and equipment
and intangible assets
2018£million
2017£million
2018£million
2017£million
Support Services - UK 18.0 13.5 13.9 23.3
Support Services - International 2.9 3.9 1.1 1.1
Support Services 20.9 17.4 15.0 24.4
Construction - UK 2.5 3.0 0.4 0.7
Construction - International - - - -
Construction 2.5 3.0 0.4 0.7
Equipment Services 17.7 17.6 21.3 16.3
41.1 38.0 36.7 41.4
Group Services 19.4 24.7 3.2 15.9
60.5 62.7 39.9 57.3
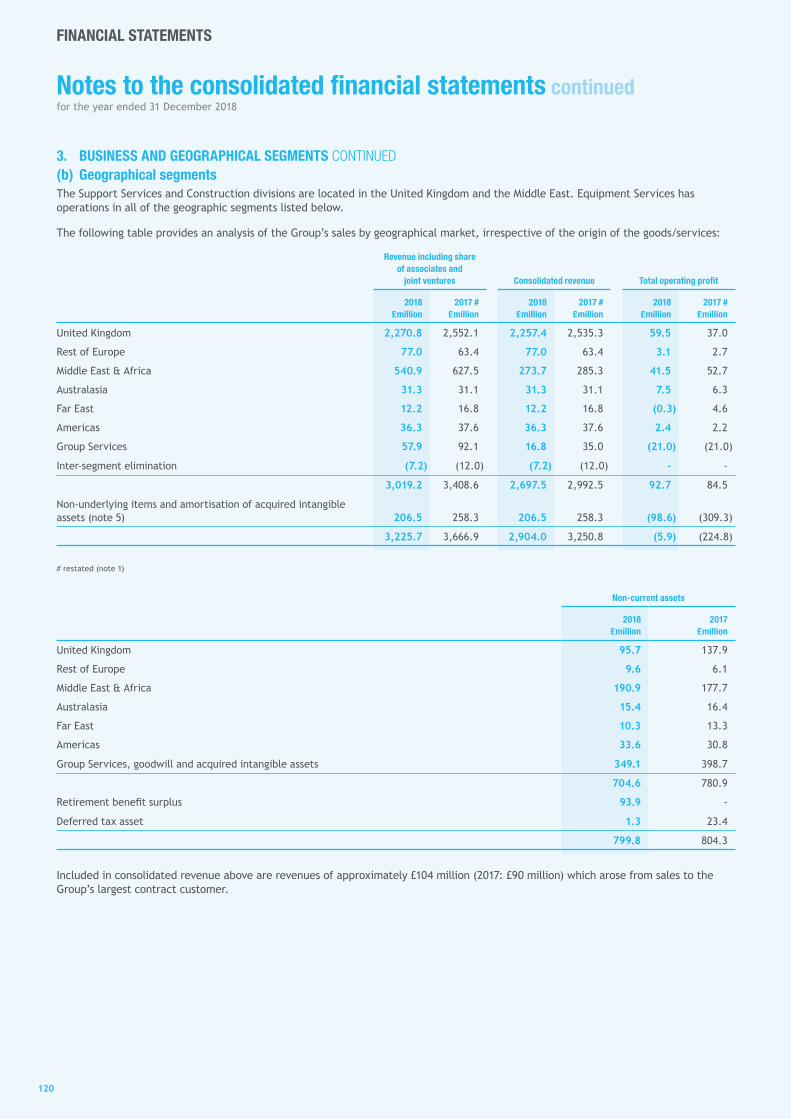
120120
FINANCIAL STATEMENTS
Notes to the consolidated financial statements continuedfor the year ended 31 December 2018
(b) Geographical segmentsThe Support Services and Construction divisions are located in the United Kingdom and the Middle East. Equipment Services has operations in all of the geographic segments listed below.
The following table provides an analysis of the Group’s sales by geographical market, irrespective of the origin of the goods/services:
Revenue including share of associates and
joint ventures Consolidated revenue Total operating profit
2018£million
2017 #£million
2018£million
2017 #£million
2018£million
2017 #£million
United Kingdom 2,270.8 2,552.1 2,257.4 2,535.3 59.5 37.0
Rest of Europe 77.0 63.4 77.0 63.4 3.1 2.7
Middle East & Africa 540.9 627.5 273.7 285.3 41.5 52.7
Australasia 31.3 31.1 31.3 31.1 7.5 6.3
Far East 12.2 16.8 12.2 16.8 (0.3) 4.6
Americas 36.3 37.6 36.3 37.6 2.4 2.2
Group Services 57.9 92.1 16.8 35.0 (21.0) (21.0)
Inter-segment elimination (7.2) (12.0) (7.2) (12.0) - -
3,019.2 3,408.6 2,697.5 2,992.5 92.7 84.5
Non-underlying items and amortisation of acquired intangible assets (note 5) 206.5 258.3 206.5 258.3 (98.6) (309.3)
3,225.7 3,666.9 2,904.0 3,250.8 (5.9) (224.8)
# restated (note 1)
Non‑current assets
2018£million
2017£million
United Kingdom 95.7 137.9
Rest of Europe 9.6 6.1
Middle East & Africa 190.9 177.7
Australasia 15.4 16.4
Far East 10.3 13.3
Americas 33.6 30.8
Group Services, goodwill and acquired intangible assets 349.1 398.7
704.6 780.9
Retirement benefit surplus 93.9 -
Deferred tax asset 1.3 23.4
799.8 804.3
Included in consolidated revenue above are revenues of approximately £104 million (2017: £90 million) which arose from sales to the Group’s largest contract customer.
3. BUSINESS AND GEOGRAPHICAL SEGMENTS CONTINUED

121121
Governance
Financial Statements
Strategic Report
Overview
(c) Disaggregated revenueThe Group’s consolidated revenue has been disaggregated by major service line, primary geographical market and pattern of revenue recognition and the tables below disclose this information by reference to the Group’s reportable segments.
The Group’s consolidated revenue disaggregated by major service lines is as follows:
Support Services
UK
Support Services
InternationalConstruction
UKConstructionInternational
Equipment Services
Group Services Total
2018£million
2018£million
2018£million
2018£million
2018£million
2018£million
2018£million
Facilities management 1,692.9 138.0 13.1 - - 14.9 1,858.9
Construction 2.6 - 819.7 13.5 - (5.2) 830.6
Equipment sales - - - - 56.3 - 56.3
Equipment rental income 19.1 - - - 139.2 (0.1) 158.2
1,714.6 138.0 832.8 13.5 195.5 9.6 2,904.0
The Group’s consolidated revenue disaggregated by primary geographical markets is as follows:
Support Services
UK
Support Services
InternationalConstruction
UKConstructionInternational
Equipment Services
Group Services Total
2018£million
2018£million
2018£million
2018£million
2018£million
2018£million
2018£million
United Kingdom 1,599.8 - 832.8 - 31.3 9.6 2,473.5
Rest of Europe 71.7 - - - 5.3 – 77.0
Middle East & Africa 43.1 138.0 - 13.5 79.1 – 273.7
Australasia - - - - 31.3 – 31.3
Far East - - - - 12.2 – 12.2
Americas - - - - 36.3 – 36.3
1,714.6 138.0 832.8 13.5 195.5 9.6 2,904.0
The Group’s consolidated revenue disaggregated by pattern of revenue recognition is as follows:
Support Services
UK
Support Services
InternationalConstruction
UKConstructionInternational
Equipment Services
Group Services Total
2018£million
2018£million
2018£million
2018£million
2018£million
2018£million
2018£million
Single service with fixed monthly fee subject to non-performance deductions 374.8 - - - - - 374.8
Bundled services with fixed monthly fee subject to non-performance deductions 1,196.6 3.5 - - - (1.9) 1,198.2
Construction services over time - 134.5 832.8 13.5 - (5.2) 975.6
Equipment rental for a period of time - - - - 139.2 (0.1) 139.1
Goods and services transferred over time 1,571.4 138.0 832.8 13.5 139.2 (7.2) 2,687.7
Service at schedule of rates (hours or tasks) 143.2 - - - - 16.8 160.0
Equipment sales at a point in time - - - - 56.3 - 56.3
Goods and services transferred at a point in time 143.2 - - - 56.3 16.8 216.3
1,714.6 138.0 832.8 13.5 195.5 9.6 2,904.0

122122
FINANCIAL STATEMENTS
Notes to the consolidated financial statements continuedfor the year ended 31 December 2018
4. PROFIT FOR THE YEARProfit for the year has been arrived at after charging/(crediting) :
Notes2018
£million2017
£million
Depreciation of property, plant and equipment:
On owned assets 14 34.4 38.6
On assets held under finance leases 14 1.3 1.0
Amortisation of capitalised software development 13 6.1 1.6
Impairment of capitalised software development 13 - 6.3
Impairment of capitalised IT development costs 14 - 9.4
Gain on disposal of plant and equipment - hire fleet (17.0) (22.2)
Gain on disposal of plant and equipment - other (2.9) (0.2)
Amortisation of acquired intangible assets (subsidiary undertakings) 13 18.7 21.5
Amortisation of acquired intangible assets (associated undertakings) 15 - 0.1
Rentals under operating leases:
Hire of plant and machinery 30.3 33.6
Other lease rentals 51.4 49.4
Cost of inventories recognised in cost of sales 18.5 27.0
Staff costs 6 1,093.7 1,147.0
Auditors’ remuneration for audit services (see below) 3.0 1.1
A more detailed analysis of auditors’ remuneration on a worldwide basis is provided below:
2018£million
2017£million
Fees payable to the Company's auditors for the audit of the Company's annual accounts 0.2 0.2
The audit of the Company's subsidiaries pursuant to legislation:
Current year fees 1.5 0.9
Prior year additional fee 1.3 -
Total audit fees 3.0 1.1
Audit-related assurance services 0.1 0.1
Other services – -
Total non-audit fees 0.1 0.1
Total fees paid to the Company's auditors 3.1 1.2
In 2019 Grant Thornton were engaged as reporting accountants to provide services in relation to the deleveraging. Fees in relation to this service are estimated at £1.8 million. Provision of these services are not prohibited by the ethical standard and were approved by the Audit Committee.
An explanation of how auditor objectivity and independence is safeguarded when non-audit services are provided by the auditors is set out in the Audit Committee Report on page 56.

123123
Governance
Financial Statements
Strategic Report
Overview
5. NON‑UNDERLYING ITEMS AND AMORTISATION OF ACQUIRED INTANGIBLE ASSETS
2018
Exited businesses1
Foreign exchange
gain/(loss) on retranslation of
loan notes£million
Energy from Waste
Strategic review of
Equipment Services
Property development
London Construction
Other (Site Services/
Power) Restructuring
costs
Professional adviser
feesContract
review
Asset impairments/
disposal of Industrial
Pension indexation
Amortisation of acquired
intangible assets Total
£million £million £million £million £million £million £million £million £million £million £million £million
Consolidated revenue 32.5 - - 27.2 19.5 - - 127.3 - - - - 206.5
Cost of sales (45.1) - - (50.0) (23.7) (4.9) - (118.8) - - - - (242.5)
Gross profit/(loss) (12.6) - - (22.8) (4.2) (4.9) - 8.5 - - - - (36.0)
Administration expenses - - - (2.0) (2.5) (15.1) (43.0) (13.7) (22.1) 70.6 - - (27.8)
Amortisation of acquired intangible assets - - - - - - - - - - - (18.7) (18.7)
Impairment of goodwill - - - - - - - - (33.1) - - - (33.1)
Total administration expenses - - - (2.0) (2.5) (15.1) (43.0) (13.7) (55.2) 70.6 - (18.7) (79.6)
Operating profit/(loss) (12.6) - - (24.8) (6.7) (20.0) (43.0) (5.2) (55.2) 70.6 - (18.7) (115.6)
Share of results of associates and joint ventures - - 17.0 - - - - - - - - - 17.0
Amortisation of acquired intangible assets of associates - - - - - - - - - - - - -
Total operating profit/(loss) (12.6) - 17.0 (24.8) (6.7) (20.0) (43.0) (5.2) (55.2) 70.6 - (18.7) (98.6)
Net finance costs - - - - - - - - - - (26.4) - (26.4)
Total profit/(loss) (12.6) - 17.0 (24.8) (6.7) (20.0) (43.0) (5.2) (55.2) 70.6 (26.4) (18.7) (125.0)
Tax on non-underlying items
Prior period adjustment - - - - - - - - - - - - -
Other - - - - - - - - - (12.0) - - (12.0)
Amortisation of acquired intangible assets - - - - - - - - - - - 3.1 3.1
Tax on non-underlying items - - - - - - - - - (12.0) - 3.1 (8.9)
Profit/(loss) after taxation (12.6) - 17.0 (24.8) (6.7) (20.0) (43.0) (5.2) (55.2) 58.6 (26.4) (15.6) (133.9)
1 The construction of Energy from Waste facilities, where there was contractual responsibility taken for process risk, and business streams exited as a result of the strategic review of Equipment Services and the decision to exit Property Development, and the Power and Site Services businesses, along with directly associated costs, are considered to be Exited Businesses. Exited Businesses are presented as non-underlying items and are excluded from the calculation of headline earnings per share (reflecting their material and non-recurring nature) . The Exited Businesses do not meet the definition of discontinued operations as stipulated by IFRS 5 Non-current assets held for sale and discontinued operations because the business has not been disposed of and there are no assets classified as held for sale. Accordingly the disclosures within non-underlying items differ from those applicable for discontinued operations.

124124
FINANCIAL STATEMENTS
Notes to the consolidated financial statements continuedfor the year ended 31 December 2018
2017 #
Exited businesses1
Foreign exchange
gain/(loss) on retranslation of
loan notes£million
Energy from Waste
Strategic review of
Equipment Services
Property development
London Construction
Other (Site Services/
Power) Restructuring
costs
Professional adviser
feesContract
review
Asset impairments/
disposal of Industrial
Pension indexation
Amortisation of acquired
intangible assets Total
£million £million £million £million £million £million £million £million £million £million £million £million
Consolidated revenue 48.6 4.5 - 50.3 40.6 - - 114.3 - - - - 258.3
Cost of sales (81.6) (7.2) - (56.6) (36.3) (0.4) - (186.6) - - - - (368.7)
Gross profit/(loss) (33.0) (2.7) - (6.3) 4.3 (0.4) - (72.3) - - - - (110.4)
Administration expenses (2.1) (4.4) - (4.0) (3.6) (32.8) (13.9) (9.2) (16.7) - - - (86.7)
Amortisation of acquired intangible assets - - - - - - - - - - - (21.5) (21.5)
Impairment of goodwill - - - - - - - - (60.0) - - - (60.0)
Total administration expenses (2.1) (4.4) - (4.0) (3.6) (32.8) (13.9) (9.2) (76.7) - - (21.5) (168.2)
Operating profit/(loss) (35.1) (7.1) - (10.3) 0.7 (33.2) (13.9) (81.5) (76.7) - - (21.5) (278.6)
Share of results of associates and joint ventures - - (26.0) - - - - (4.6) - - - - (30.6)
Amortisation of acquired intangible assets of associates - - - - - - - - - - - (0.1) (0.1)
Total operating profit/(loss) (35.1) (7.1) (26.0) (10.3) 0.7 (33.2) (13.9) (86.1) (76.7) - - (21.6) (309.3)
Net finance costs - - - - - - - - - - 2.9 - 2.9
Total profit/(loss) (35.1) (7.1) (26.0) (10.3) 0.7 (33.2) (13.9) (86.1) (76.7) - 2.9 (21.6) (306.4)
Tax on non-underlying items
Prior period adjustments - - - - - - - - (5.5) - - - (5.5)
Amortisation of acquired intangible assets - - - - - - - - - - - 3.6 3.6
Tax on non-underlying items - - - - - - - - (5.5) - - 3.6 (1.9)
Profit/(loss) after taxation (35.1) (7.1) (26.0) (10.3) 0.7 (33.2) (13.9) (86.1) (82.2) - 2.9 (18.0) (308.3)
1 The construction of Energy from Waste facilities, where there was contractual responsibility taken for process risk, and business streams exited as a result of the strategic review of Equipment Services and the decision to exit Property Development, and the Power and Site Services businesses, along with directly associated costs, are considered to be Exited Businesses. Exited Businesses are presented as non-underlying items and are excluded from the calculation of headline earnings per share (reflecting their material and non-recurring nature) . The Exited Businesses do not meet the definition of discontinued operations as stipulated by IFRS 5 Non-current assets held for sale and discontinued operations because the business has not been disposed of and there are no assets classified as held for sale. Accordingly the disclosures within non-underlying items differ from those applicable for discontinued operations.
# restated (note 1)
Exit from Energy from WasteDuring 2018 a further £12.6 million of further losses have been recognised on these contracts, mainly in respect of Derby EfW, taking the cumulative 2015 to 2018 losses to £229.2 million. During 2018 £35 million of insurance proceeds were received in respect of Energy from Waste projects.
During 2017 a further £35.1 million of losses were recognised on these contracts which reflected costs incurred to date, estimated costs to complete and damages which took the cumulative losses on these projects to £216.6 million.
Strategic review of Equipment ServicesFurther closure costs of £7.1 million resulting from the strategic review of Equipment Services and the decision to exit a number of smaller less attractive businesses were incurred in 2017 bringing total costs to just over £17.0 million that was announced at the time of the review.
Property developmentDuring 2017, as part of review of assets held, we took the decision to exit the business of Property Development. As a result of that decision and a review of the carrying value of property assets held, it became necessary to impair those carrying values by £26.0 million to bring them in line with their estimated net recoverable amounts.
As announced with the 2017 year-end results, we took the decision at the end of 2017 to exit from the business of Property Development and during 2018 we have sold our one remaining development asset (the Haymarket site in Edinburgh) for net proceeds of £47 million and realised a non-underlying profit of £17.0 million.
5. NON‑UNDERLYING ITEMS AND AMORTISATION OF ACQUIRED INTANGIBLE ASSETS CONTINUED
125125
Governance
Financial Statements
Strategic Report
Overview
London ConstructionWe took the decision during the year to exit from activities in the London construction market. We will continue to offer fit-out but not building projects in the London region. Costs associated with this exit and anticipated losses on the close-out of contracts within this business resulted in losses of £24.8 million (2017: £10.3 million) .
Exit from Site Services and Power businessesWe took the decision during the year to exit from the Power business in Support Services and the Site Services business in Construction at a cost of £4.2 million and £2.5 million respectively.
Restructuring costsThe Group has embarked on a three-year plan, “Fit For Growth”, to increase the Group’s organisational efficiency, improve Group-wide procurement and ensure greater standardisation and simplification across the business. During the year the Group incurred termination costs in respect of former directors and employees, property rationalisation expenses and other business closure costs of £20.0 million (2017: £33.2 million) .
Professional adviser feesProfessional fees incurred during 2018 in connection with our strategic review and short-term refinancing totalled £43.0 million (2017: £13.9 million) .
Contract review As previously disclosed, the new management team commissioned a comprehensive contract and balance sheet review with the independent support of PwC in the latter part of 2017. The contract review identified provisions and write-downs relating to 18 individual contract issues. Of these, two contracts were regarded as neither operationally or financially complete. Revenues and costs in respect of these two contracts have been separately identified and disclosed above in 2018, to ensure consistency of presentation. This resulted in 2017 of £86.1 million of non-underlying charges in respect of balance sheet write-downs and onerous contracts. Within this amount 18 individual contracts were subject to £42.4 million of balance sheet write-downs principally in relation to work-in-progress and receivables beyond existing provisions and impairment charges, and £43.7 million was provided in respect of loss-making onerous contracts. During 2018 a further amount of £5.2 million of provision was made against these contracts being largely the net release of £8.0 million on US Forces Prime contract following receipts from the UK Ministry of Defence in December 2018 and a further provision made of £13.7 million on the CRC Transforming Rehabilitation contracts reflecting the terms of a recently signed settlement agreement with the Ministry of Justice in December 2018.
Asset impairments/disposal of IndustrialAt 31 December 2018 goodwill and intangible assets in the Support Services segment were impaired by £33.1 million (2017: £60.0 million) (see note 12) .
During the year the carrying value of the Industrial Services business was impaired by £15.0 million and a further loss of £7.1 million was incurred on final disposal.
During 2017, capitalised IT development costs of £16.7 million were written off (£6.3 million of Other Intangible Assets, £9.4 million of Property, Plant and Equipment and £1.0 million of working capital) , as well as £5.5 million of deferred tax assets.
Pension indexationDuring the year the Trustee of the Interserve Pension Scheme (IPS) agreed to our request to change the scheme’s terms relating to basis of indexation for future pension increases in respect of deferred and pensioner members of the scheme. This plan amendment from RPI to CPI resulted in the recognition of a one-off gain of £70.6 million (see note 29) .
Foreign exchange (loss)/gain on retranslation of loan notesNon-underlying finance costs of £26.4 million (2017: £2.9 million gain) represent the impact of the retranslation of $350 million US Private Placement Notes to current exchange rates following the termination of exchange rate swaps in 2017, as well as the loss previously recognised in equity on the swaps being recycled to the income statement over the remaining life of the originally hedged instruments. Following the refinancing of the US loan notes on 27 April 2018, which represents a substantial debt modification under IFRS 9, the outstanding amount at that date of £9.8 million was recycled to the income statement (see note 8) .
Restatement of prior year non‑underlying itemsThe 2017 restatement of non-underlying items relates to £10.3 million of costs of a decision made to exit from the London construction market during the first half of 2018 and in the second half of 2018 £0.5 million of Power business closure costs in Support Services and a £1.2 million credit in respect of the Site Services business closure in the Construction division.

126126
FINANCIAL STATEMENTS
Notes to the consolidated financial statements continuedfor the year ended 31 December 2018
6. STAFF COSTSThe average number of full-time equivalent employees within each division during the year, including executive directors, was:
2018Number
2017Number
Support Services 37,721 40,247
Construction 2,006 2,599
Equipment Services 1,414 1,459
Group Services 282 406
41,423 44,711
Their aggregate remuneration comprised:
2018£million
2017£million
Wages and salaries 979.1 1,025.3
Social security costs 88.3 91.5
Share-based payments 2.3 2.1
Other pension costs (see below) 24.0 28.1
1,093.7 1,147.0
Defined benefit scheme current service costs (note 29) 3.4 5.2
Other UK - defined contribution 19.3 20.9
Other overseas - defined contribution 1.3 2.0
Pension costs 24.0 28.1
Detailed disclosures of directors’ aggregate and individual remuneration and share-based payments are given in the Directors’ Remuneration Report on pages 58 to 79 and should be regarded as an integral part of this note.
7. INVESTMENT REVENUE2018
£million2017
£million
Bank interest 1.5 3.0
Interest income from joint-venture investments 1.1 2.2
Net return on defined benefit pension assets (note 29) 0.4 -
Foreign exchange gain on US private placement loan (note 20) - 2.9
Other interest 0.5 0.7
3.5 8.8
8. FINANCE COSTS2018
£million2017
£million
Borrowings and overdrafts (82.5) (27.3)
Net interest cost on pension obligations (note 29) - (1.1)
Foreign exchange loss on US private placement loan and recycling of hedging reserve (note 20) (26.4) -
(108.9) (28.4)
The borrowings and overdrafts costs includes £3.4 million (2017: £1.6 million) relating to loan facility expenses.
The foreign exchange gain/loss on US private placement loan, representing the impact of the retranslation of $350 million US Private Placement Notes to current exchange rates following the termination of exchange rate swaps in 2017, also includes the loss previously recognised in equity on the swaps being recycled to the income statement over the remaining life of the originally hedged instruments. Following the refinancing of the US loan notes on 27 April 2018, which represents a debt modification under IFRS 9, the outstanding amount at that date of £9.8 million was recycled to the income statement.

127127
Governance
Financial Statements
Strategic Report
Overview
9. TAX2018
£million2017
£million
Current tax - UK 2.2 5.8
Current tax - overseas 5.5 6.9
Deferred tax (note 16) 9.9 (2.7)
Tax charge for the year 17.6 10.0
Tax charge before prior period adjustments 16.4 2.9
Prior period adjustments - charges 1.2 7.1
17.6 10.0
2018 2017
Profit£million
Tax£million
Effective rate%
Profit£million
Tax£million
Effective rate%
Subsidiary undertakings' profit before tax, excluding one-offs (3.6) 8.7 0.0% 36.5 8.1 22.2%
Group share of profit after tax of associates and joint ventures 17.3 - - 25.5 – –
13.7 8.7 63.5% 62.0 8.1 13.1%
Other non-underlying items (73.2) 12.0 (16.4%) (224.8) 5.5 (2.4%)
Goodwill impairment (33.1) - - (60.0) – –
Amortisation (18.7) (3.1) 16.6% (21.6) (3.6) 16.7% b
(Loss) before tax (111.3) 17.6 (15.8%) (244.4) 10.0 (4.1%) b
UK corporation tax is calculated at 19% (2017: 19.25%) of the estimated taxable profit for the year. Taxation for other jurisdictions is calculated at the rates prevailing in the relevant jurisdictions.
The Group is aware of the ongoing review by the European Commission of the UK Controlled Foreign Company (CFC) rules that exempt certain transactions by multinational groups from a full CFC apportionment. Due to the uncertainty of the outcome of this review, no provision for any UK corporation tax has been recognised at 31 December 2018; however, there is a contingent liability of approximately £2.1 million at the balance sheet date.
The total charge for the year can be reconciled to the loss per the income statement as follows:
2018 2017
£million % £million %
(Loss) before tax (111.3) (244.4)
Tax at the UK income tax rate of 19% (2017: 19.25%) (21.1) 19.0% (47.0) 19.2%
Tax effect of expenses not deductible in determining taxable profit 9.8 (8.8%) 18.2 (7.4%)
Current-year losses for which no deferred tax asset is recognised 38.1 (34.2%) 33.4 (13.7%)
Tax effect of share of results of associates (3.0) 2.7% 1.0 (0.4%)
Effect of tax rates in foreign jurisdictions (6.1) 5.5% (3.4) 1.4%
Effect of change in rate of deferred tax (1.3) 1.2% 0.7 (0.3%)
Prior period adjustments 1.2 (1.1%) 7.1 (2.9%) b
Tax charge and effective tax rate for the year 17.6 (15.8%) 10.0 (4.1%) b

128128
FINANCIAL STATEMENTS
Notes to the consolidated financial statements continuedfor the year ended 31 December 2018
In addition to the income tax charged to the income statement, the following deferred tax charges/(credits) have been recorded directly to other comprehensive income and to statement of changes in equity in the year:
2018£million
2017£million
Tax on actuarial gains/(losses) on pension liability 9.2 (1.8)
Tax on movements in cash flow hedging instruments - (4.0)
Tax on exchange movements on hedged financial instruments 1.8 3.8
Tax on the intrinsic value of share-based payments - -
11.0 (2.0)
10. DIVIDENDSThere were no dividends paid in the current year or the prior year. There is no proposed dividend in respect of 2018.
11. EARNINGS PER SHARECalculation of earnings per share is based on the following data:
Earnings2018
£million2017 #
£million
Net loss attributable to equity holders of the parent (for basic and diluted basic earnings per share) (132.2) (256.4)
Adjustments:
Non-underlying items and amortisation of acquired intangible assets (note 5) 133.9 308.3
Headline earnings (for headline and diluted headline earnings per share) 1.7 51.9
Number of shares2018
Number2017
Number
Weighted average number of ordinary shares for the purposes of basic and headline earnings per share 148,227,359 145,714,120
Effect of dilutive potential ordinary shares:
Share options and awards1 33,839,453 6,781,433
Weighted average number of ordinary shares for the purposes of diluted basic1 and diluted headline earnings per share 182,066,812 152,495,553
Earnings per share2018
pence2017 #pence
Basic earnings per share (89.2) (176.0)
Diluted basic earnings per share (89.2) (176.0)
Headline earnings per share 1.1 35.6
Diluted headline earnings per share 0.9 34.0
# restated (note 1)
1 Due to basic earnings per share being a loss in 2018 and 2017 these adjustments are anti-dilutive and are therefore ignored in calculating diluted basic earnings per share for 2018 and 2017.
9. TAX CONTINUED

129129
Governance
Financial Statements
Strategic Report
Overview
12. GOODWILL2018
£million2017
£million
Cost
At 1 January 492.9 497.0
Exchange movements 2.5 (4.1)
At 31 December 495.4 492.9
Accumulated impairment
At 1 January 120.0 60.0
Impairment losses for the year 33.1 60.0
At 31 December 153.1 120.0
Carrying amount
At 31 December 342.3 372.9
Goodwill acquired in a business combination is allocated, at acquisition, to the cash generating units (CGUs) that are expected to benefit from that business combination and are summarised as follows:
Construction£million
Support Services£million
Equipment Services£million
Total£million
At 1 January 2016 11.9 424.1 1.0 437.0
Impairment losses for the year - (60.0) - (60.0)
Exchange movements - (4.0) (0.1) (4.1)
At 31 December 2017 11.9 360.1 0.9 372.9
Impairment losses for the year - (33.1) - (33.1)
Exchange movements - 2.5 - 2.5
At 31 December 2018 11.9 329.5 0.9 342.3
Goodwill impairment testingThe Group tests goodwill annually for impairment, or more frequently if there are indications that goodwill might be impaired.
Key assumptionsThe recoverable amounts of the CGUs are determined from value in use calculations. The key assumptions for the value in use calculations are those regarding the discount rates, cash flows, growth rates and margins during the period.
Discount ratesManagement estimates discount rates using pre-tax rates that reflect current market assessments of the time value of money and the risks specific to the CGUs.
The rates used to discount the future cash flows range from 11.8% for Support Services (2017: 10.3%) to 12.8% for Construction and Equipment Services (2017: 11.3%) and are based on the Group’s pre-tax weighted average cost of capital (WACC) . The increases reflect a 3% small capital company premium added to the Group WACC.
Growth rates and terminal valuesThe revenue growth rates and margins are based on current Board-approved budgets and forecasts based on prevailing market conditions and expert forecasts. The Group produces three-year plans and then projects a further year based on growth rates of 2.0%, followed by a terminal value based on a perpetuity calculated at a nominal 2.0% growth which does not exceed current market growth rates.
Sensitivity analysisAs part of this annual review a sensitivity analysis was performed on the impairment test of each CGU, including an increase in the discount rate of up to 2.0% or a 1.0% reduction in the terminal growth rate. No further impairment in the carrying value of the goodwill in the Equipment Services or Construction CGUs would occur as a result of adopting these sensitivities.
In the case of Support Services, however, if the discount rate is increased by 2% there would be further impairments of £30.1 million in Support Services Private Sector CGU, and a further £11.5 million on the Learning and Education CGU. On the basis of a 1% reduction in the terminal growth rate, Support Services Private Sector would be further impaired by £11.5 million and the Learning and Education CGU by a further £4.3 million.

130130
FINANCIAL STATEMENTS
Notes to the consolidated financial statements continuedfor the year ended 31 December 2018
Review of the carrying value of goodwill in the Support Services CGUPast acquisitions, principally Initial Facilities in 2014, have focused on the delivery of support services to the private sector and performance in this sector has not been in line with previous projections. As part of its annual review of impairment, the Group has updated its estimate of the recoverable amount of the CGU that relates to the delivery of support services to the private sector, which has resulted in an impairment of £26.9 million being recognised against goodwill in Support Services.
The Group also focused on the carrying value of its Learning and Education CGU that is part of the Support Services segment and due to underperformance against its previous profit projections and an increase in its risk adjusted discount factor from 10.3% in 2017 to 11.8% in 2018, a goodwill impairment of £6.2 million has been recognised.
Key assumptionsThe key assumptions underpinning the calculations of the net present value of future cash flows in respect of private-sector delivered Support Services include:
• the calculations are based on a three-year plan approved by the Board;
• revenue of £630.0 million in 2018 and compound annual nominal growth rate of 3% over the plan period in line with the approved detailed plan;
• an average operating margin of 2.3% after management charges;
• a terminal nominal growth rate of 2.0%; and
• a pre-tax discount rate for the CGU of 11.8% which has been adjusted for the risks specific to the market in which the CGU operates.
The key assumptions underpinning the calculations of the net present value of future cash flows in respect of Learning and Education include:
• the calculations are based on a three-year plan approved by the Board;
• revenue of £75.5 million in 2018 and compound annual nominal growth rate of 3% over the plan period in line with the approved detailed plan;
• an average operating margin of 6.6% after management charges;
• a terminal nominal growth rate of 2.0%; and
• a pre-tax discount rate for the CGU of 11.8% which has been adjusted for the risks specific to the market in which the CGU operates.
In reviewing the carrying value, the following factors have also been considered:
• macro pressures in the support services sector;
• a renewed focus on cost control under the Fit For Growth programme; and
• management resource to deliver the budget.
The value in use calculations are reliant on the accuracy of management’s forecast and the assumptions that underly them as well as the discount rate and growth rates applied. Sensitivity analysis was performed on the forecasts to consider the impact of certain trading scenarios and changes in assumptions both individually and in combination as referred to above.
A combination of these sensitivities concluded that a total goodwill impairment of £33.1 million represented the Audit Committee’s best estimate.
12. GOODWILL CONTINUED

131131
Governance
Financial Statements
Strategic Report
Overview
13. OTHER INTANGIBLE ASSETSAcquired
Computer software£million
Customer relationships
£millionOther
£millionTotal
£million
Cost
At 1 January 2017 37.8 178.0 3.4 219.2
Additions 7.7 - - 7.7
Disposals (6.4) - - (6.4)
Exchange movements - (1.1) (0.2) (1.3) Exchange movements
At 31 December 2017 39.1 176.9 3.2 219.2
Additions 1.9 - - 1.9
Disposals (1.7) - - (1.7)
Exchange movements - 0.7 - 0.7
At 31 December 2018 39.3 177.6 3.2 220.1
Accumulated amortisation
At 1 January 2017 12.7 126.8 2.7 142.2
Charge for the year 1.6 21.1 0.4 23.1
Impairments (note 5) 6.3 - - 6.3
Eliminated on disposals (5.7) - - (5.7)
Exchange movements - (1.0) (0.2) (1.2)
At 31 December 2017 14.9 146.9 2.9 164.7
Charge for the year 6.1 18.4 0.3 24.8
Eliminated on disposals (1.0) - - (1.0)
Exchange movements - 0.7 - 0.7
At 31 December 2018 20.0 166.0 3.2 189.2
Carrying amount
At 31 December 2018 19.3 11.6 – 30.9
At 31 December 2017 24.2 30.0 0.3 54.5
Useful lives 5 years 5-10 years 3-5 years
The useful life and amortisation period of each group of intangible assets varies according to the underlying length of benefit expected to be received.

132132
FINANCIAL STATEMENTS
Notes to the consolidated financial statements continuedfor the year ended 31 December 2018
14. PROPERTY, PLANT AND EQUIPMENT (a) Movements
Land andbuildings£million
Hirefleet
£million
Otherplant and
equipment£million
Total£million
Cost
At 1 January 2017 34.3 315.4 146.4 496.1
Additions 10.3 17.8 21.5 49.6
Write-off (note 5) - - (9.4) (9.4)
Disposals (2.8) (29.0) (8.7) (40.5)
Exchange differences (1.4) (13.9) (8.4) (23.7)
At 31 December 2017 40.4 290.3 141.4 472.1
Additions 3.9 20.3 13.8 38.0
Disposals (2.5) (23.8) (29.9) (56.2)
Eliminated on disposal of subsidiary (1.8) (54.4) (3.1) (59.3)
Exchange differences 0.5 3.4 5.2 9.1
At 31 December 2018 40.5 235.8 127.4 403.7
Accumulated depreciation
At 1 January 2017 18.2 129.6 97.9 245.7
Charge for the year 2.2 18.2 19.2 39.6
Eliminated on disposals (0.6) (21.0) (8.6) (30.2)
Exchange differences (1.0) (3.8) (6.8) (11.6)
At 31 December 2017 18.8 123.0 101.7 243.5
Charge for the year 2.7 18.0 15.0 35.7
Eliminated on disposals (1.4) (20.9) (25.6) (47.9)
Eliminated on disposal of subsidiary (1.2) (39.6) (2.0) (42.8)
Exchange differences 0.4 0.6 4.3 5.3 Exchange differences (1.0) (3.8) (6.8) (11.6)
At 31 December 2018 19.3 81.1 93.4 193.8
Carrying amount
At 31 December 2018 21.2 154.7 34.0 209.9
At 31 December 2017 21.6 167.3 39.7 228.6
The carrying amount of the Group’s plant and equipment includes an amount of £nil (2017: £3.6 million) in respect of assets held under finance leases. Details of property, plant and equipment held under finance leases are shown in note 24.

133133
Governance
Financial Statements
Strategic Report
Overview
(b) Carrying amount of land and buildings31 December 2018
£million31 December 2017
£million
Freehold:
Land at cost 2.0 2.5
Buildings at cost less depreciation 1.1 1.2
3.1 3.7
Leaseholds under 50 years at cost less depreciation 18.1 17.9
21.2 21.6
(c) Future capital expenditure not provided for in the financial statements31 December 2018
£million31 December 2017
£million
Committed 2.3 0.7
15. INTERESTS IN ASSOCIATES AND JOINT‑VENTURE ENTITIES(a) Results of joint‑venture entities and associated undertakings The aggregate results of joint-venture entities and associated undertakings were as follows:
Year ended 31 December 2018 Year ended 31 December 2017
Joint ventures£million
Associates£million
Total£million
Joint ventures£million
Associates£million
Total£million
Revenues 89.0 600.1 689.1 134.6 770.8 905.4
Operating profit 2.6 38.1 40.7 (22.1) 49.6 27.5
Net interest receivable (0.8) 0.4 (0.4) (1.2) 0.5 (0.7)
Taxation (0.4) (3.6) (4.0) (0.7) (3.6) (4.3)
Profit after tax 1.4 34.9 36.3 (24.0) 46.5 22.5
Less: Profit after tax attributable to non-Group interests 16.0 (18.0) (2.0) (1.3) (26.3) (27.6)
Profit after tax attributable to the Group 17.4 16.9 34.3 (25.3) 20.2 (5.1)
Group amortisation of acquired intangible assets - - - - (0.1) (0.1)
Contribution to Group total operating profit 17.4 16.9 34.3 (25.3) 20.1 (5.2)
Dividends paid to the Group (0.2) (11.6) (11.8) (0.3) (16.9) (17.2)
Retained result for the period attributable to the Group 17.2 5.3 22.5 (25.6) 3.2 (22.4)

134134
FINANCIAL STATEMENTS
Notes to the consolidated financial statements continuedfor the year ended 31 December 2018
(b) Joint‑venture entities(i) Results and net assetsThe aggregate results of joint ventures were as follows:
Year ended 31 December 2018 Year ended 31 December 2017
Support Services£million
Group Services£million
Total£million
Support Services£million
Group Services£million
Total£million
Revenues 4.8 84.2 89.0 7.5 127.1 134.6
Operating profit - 2.6 2.6 0.4 (22.5) (22.1)
Net interest receivable - (0.8) (0.8) - (1.2) (1.2)
Taxation - (0.4) (0.4) - (0.7) (0.7)
Profit after tax - 1.4 1.4 0.4 (24.4) (24.0)
Less: Profit after tax attributable to non-Group interests - 16.0 16.0 (0.2) (1.1) (1.3)
Profit after tax attributable to the Group - 17.4 17.4 0.2 (25.5) (25.3)
Group amortisation of acquired intangible assets - - - - - -
Contribution to Group total operating profit - 17.4 17.4 0.2 (25.5) (25.3)
Dividends paid to the Group (0.1) (0.1) (0.2) (0.1) (0.2) (0.3)
Retained result for the period attributable to the Group (0.1) 17.3 17.2 0.1 (25.7) (25.6)
There are no significant restrictions on the ability of joint ventures to pay dividends or repay loans if agreed by the shareholders.
The net assets of joint-venture entities were as follows:
Year ended 31 December 2018 Year ended 31 December 2017
Support Services£million
Group Services£million
Total£million
Support Services£million
Group Services£million
Total£million
Non-current assets - 167.5 167.5 - 206.4 206.4
Current assets 0.5 401.9 402.4 1.7 386.6 388.3
Current liabilities (0.7) (38.5) (39.2) (1.6) (44.8) (46.4)
Non-current liabilities - (504.2) (504.2) - (480.7) (480.7)
Net assets (0.2) 26.7 26.5 0.1 67.5 67.6
Less: Net assets attributable to non-Group interests 0.1 6.6 6.7 (0.1) (21.0) (21.1)
Net assets attributable to the Group (0.1) 33.3 33.2 - 46.5 46.5
Goodwill - - - - - -
Acquired intangible assets - - - - - -
Carrying value of net assets and goodwill (0.1) 33.3 33.2 - 46.5 46.5
The liabilities of the joint-venture entities principally relate to the non-recourse debt within those businesses as part of funding the construction of the underlying asset.
15. INTERESTS IN ASSOCIATES AND JOINT‑VENTURE ENTITIES CONTINUED

135135
Governance
Financial Statements
Strategic Report
Overview
(ii) Movements in the year
Shares£million
Loans£million
Share ofreserves£million
Total£million
At 1 January 2017 0.1 40.3 1.2 41.6
Acquisitions and advances - 33.1 - 33.1
Repayments to the Group - (0.7) - (0.7)
Disposals - (3.2) (4.0) (7.2)
Fair value adjustment to financial instruments and derivatives - - 5.3 5.3
Share of retained profits - - (25.6) (25.6)
At 31 December 2017 0.1 69.5 (23.1) 46.5
Acquisitions and advances - 0.6 - 0.6
Disposals - (41.0) 9.1 (31.9)
Fair value adjustment to financial instruments and derivatives - - 0.8 0.8
Share of retained profits - - 17.2 17.2
At 31 December 2018 0.1 29.1 4.0 33.2
Further details of the Group’s investment in PPP/PFI schemes are included in note 31.
During the year the Group disposed of its investment in the Haymarket site in Edinburgh for £47.0 million, realising a gain on disposal of £17.0 million (see note 5) .
At 31 December 2018 the Group had no commitments for additional investment in joint-venture entities (2017: £nil) .
(c) Associated undertakings(i) Results and net assetsThe aggregate results of the Group’s various associated undertakings were as follows:
Year ended 31 December 2018 Year ended 31 December 2017
Construction£million
Support Services£million
Total£million
Construction£million
Support Services£million
Total£million
Revenues 499.6 100.5 600.1 628.9 141.9 770.8
Operating profit 33.1 5.0 38.1 43.4 6.2 49.6
Net interest receivable 0.6 (0.2) 0.4 0.7 (0.2) 0.5
Taxation (3.4) (0.2) (3.6) (3.1) (0.5) (3.6)
Profit after tax 30.3 4.6 34.9 41.0 5.5 46.5
Less: Profit after tax attributable to non-Group interests (16.0) (2.0) (18.0) (21.5) (4.8) (26.3)
Profit after tax attributable to the Group 14.3 2.6 16.9 19.5 0.7 20.2
Group amortisation of acquired intangible assets - - - - (0.1) (0.1)
Contribution to Group total operating profit 14.3 2.6 16.9 19.5 0.6 20.1
Dividends paid to the Group (10.8) (0.8) (11.6) (15.7) (1.2) (16.9)
Retained result for the period attributable to the Group 3.5 1.8 5.3 3.8 (0.6) 3.2
There are no significant restrictions on the ability of associates to pay dividends or repay loans if agreed by the shareholders.

136136
FINANCIAL STATEMENTS
Notes to the consolidated financial statements continuedfor the year ended 31 December 2018
Total net assets of the associated undertakings were as follows:
Year ended 31 December 2018 Year ended 31 December 2017
Construction£million
Support Services£million
Total£million
Construction£million
Support Services£million
Total£million
Non-current assets 48.2 1.9 50.1 55.7 2.7 58.4
Current assets 445.3 67.7 513.0 453.9 67.4 521.3
Current liabilities (298.0) (28.1) (326.1) (333.5) (32.9) (366.4)
Non-current liabilities (43.9) (3.5) (47.4) (39.6) (3.9) (43.5)
Net assets 151.6 38.0 189.6 136.5 33.3 169.8
Less: Net assets attributable to non-Group interests (71.0) (35.0) (106.0) (81.7) (14.4) (96.1)
Net assets attributable to the Group 80.6 3.0 83.6 54.8 18.9 73.7
Goodwill 1.2 3.5 4.7 1.2 3.5 4.7
Acquired intangible assets - - - - - -
Carrying value of net assets and goodwill 81.8 6.5 88.3 56.0 22.4 78.4
(ii) Movements in the year
Shares£million
Loans£million
Share ofreserves£million
Total£million
At 1 January 2017 5.9 8.9 70.5 85.3
Share of retained profits net of amortisation - - 3.2 3.2
Exchange differences - - (10.1) (10.1)
At 31 December 2017 5.9 8.9 63.6 78.4
Additions – 0.1 – 0.1
Share of retained profits net of amortisation – – 5.3 5.3
Exchange differences – – 4.5 4.5
At 31 December 2018 5.9 9.0 73.4 88.3
15. INTERESTS IN ASSOCIATES AND JOINT‑VENTURE ENTITIES CONTINUED(c) Associated undertakings continued

137137
Governance
Financial Statements
Strategic Report
Overview
16. DEFERRED TAXATIONThe following are the major deferred tax assets and (liabilities) recognised by the Group.
Retirement benefit
obligations£million
Acquired intangible
assets£million
Accelerated capital
allowances£million
Trading losses
£million
Other temporary
differences£million
Total£million
Deferred tax assets
£million
Deferred tax liabilities£million
At 1 January 2017 8.8 (9.0) 5.8 4.0 9.0 18.6 23.1 (4.5)
(Charge) /credit to income (2.5) 3.5 6.3 (1.6) (3.0) 2.7 2.7 -
(Charge) /credit to equity 1.8 - - - 0.2 2.0 2.0 -
Exchange differences - - 0.4 (0.1) (0.2) 0.1 0.1 -
At 31 December 2017 8.1 (5.5) 12.5 2.3 6.0 23.4 27.9 (4.5)
(Charge) /credit to income (14.9) 3.1 (1.4) 1.4 1.9 (9.9) - (9.9)
Disposal of subsidiary - - - - (1.3) (1.3) - (1.3)
(Charge) /credit to equity (9.2) - - - (1.8) (11.0) - (11.0)
Exchange differences - - 0.7 (0.8) 0.2 0.1 0.1 -
Total assets/(liabilities) before set-off (16.0) (2.4) 11.8 2.9 5.0 1.3 28.0 (26.7)
Set off tax (23.4) 23.4
At 31 December 2018 4.6 (3.3)
Certain deferred tax assets and liabilities, as shown below, have been offset on the consolidated balance sheet.
31 December 2018£million
31 December 2017£million
Deferred tax liabilities (3.3) (4.5)
Deferred tax assets 4.6 27.9
1.3 23.4
No deferred tax asset has been recognised in respect of certain unused tax losses available for offset against future profits due to the unpredictability of future profit streams in those businesses. The accumulated tax value of these losses is £99.3 million (2017: £80.0 million) on gross losses of £577.4 million (2017: £460.0 million) .
17. INVENTORIES31 December 2018
£million31 December 2017
£million
Goods held for resale 25.0 22.7
Materials 10.8 11.3
35.8 34.0
The cost of inventories recognised in cost of sales in the year was £18.5 million (2017: £27.0 million).

138138
FINANCIAL STATEMENTS
Notes to the consolidated financial statements continuedfor the year ended 31 December 2018
18. CONTRACT ASSETS AND LIABILITIES(a) Contract assets
31 December 2018
£million
Business related
changes£million
Exchange differences
£million
Disposal of subsidiary
£million
31 December 2017
£million
Amounts due from construction contract customers included in trade and other receivables (note 19) 80.8 (14.4) 0.2 (0.1) 95.1
Retentions included in trade and other receivables (note 19) 43.2 4.3 0.1 (1.0) 39.8
Accrued income included in trade and other receivables (note 19) 148.1 (23.7) 1.7 (8.2) 178.3
272.1 (33.8) 2.0 (9.3) 313.2
Contract assets related to the portion of performance obligations already fulfilled by the Group and for which the definitive right to receive cash was subject to completing further work under the relevant contracts. Contract assets are converted into trade receivables at the point that work delivered to the client is invoiced resulting in the Group’s unconditional right to receive cash. Contract assets therefore represent a portion of future payments receivable by the Group under existing contracts.
At 31 December 2018, contract assets amounted to £272.1 million, a decrease of 13% compared with 2017 (£313.2 million) . This is largely due to the Group providing fewer services ahead of the agreed payment schedules for fixed-price contracts.
(b) Contract liabilities
31 December 2018
£million
Business related
changes£million
Exchange differences
£million
Disposal of subsidiary
£million
31 December 2017
£million
Amounts due to contract customers included in trade and other payables (note 22) 29.9 0.4 - - 29.5
Deferred income included in trade and other payables (note 22) 64.0 11.6 1.0 (0.2) 51.6
93.9 12.0 1.0 (0.2) 81.1
These liabilities consist mainly of cash advances received from customers on account of orders received and the remaining liabilities relate to the amount of performance obligations still to be fulfilled and for which payment has already been received from the client.
At 31 December 2018, contract liabilities amounted to £93.9 million, an increase of 16% compared with 2017 (£81.1 million) . This is largely due to the Group receiving higher payments in advance from customers for equipment and services.
(c) Revenue recognised in relation to contract liabilitiesThe following table shows how much of the revenue recognised in 2018 relates to brought-forward contract liabilities.
31 December 2018£million
Revenue recognised in 2018 that was included in the contract liability balance at the beginning of 2018 47.9

139139
Governance
Financial Statements
Strategic Report
Overview
19. TRADE AND OTHER RECEIVABLES31 December 2018
£million31 December 2017
£million
Amounts recoverable from the sale of goods and services 354.2 384.4
Allowances for doubtful debts (38.5) (47.5)
315.7 336.9
Amounts due from construction contract customers 80.8 95.1
Retentions 43.2 39.8
Other receivables 27.1 39.8
Prepayments 26.4 32.1
Accrued income 148.1 178.3
641.3 722.0
Included in the above are the following amounts recoverable after more than one year:
31 December 2018£million
31 December 2017£million
Retentions 8.1 7.2
The directors consider that the carrying amount of trade and other receivables approximates their fair value. Trade and other receivables are included as part of the financial assets.
Average credit period taken on the sale of goods and services is 35 days (2017: 32 days) .
Ageing of trade receivables, not impaired but net of allowances for doubtful debt, is as follows:
31 December 2018£million
31 December 2017£million
Not more than one month past due 51.5 50.4
Between one and three months past due 34.9 34.5
Between three and six months past due 22.1 34.1
Greater than six months 49.2 12.7
Total past due but not impaired 157.7 131.7
Not past due 158.0 205.2
Total net receivables 315.7 336.9
The average age of the receivables past due but not impaired is 121 days (2017: 83 days) .
Movement in allowance for doubtful debt is as follows:
2018£million
2017£million
Balance at 1 January 47.5 54.3
Disposal of subsidiary (1.4) -
Amounts written off as uncollectable (7.8) (14.9)
Impairment losses recognised in the year 10.7 18.8
Amounts recovered during the year (11.6) (7.1)
Exchange differences 1.1 (3.6)
Balance at 31 December 38.5 47.5
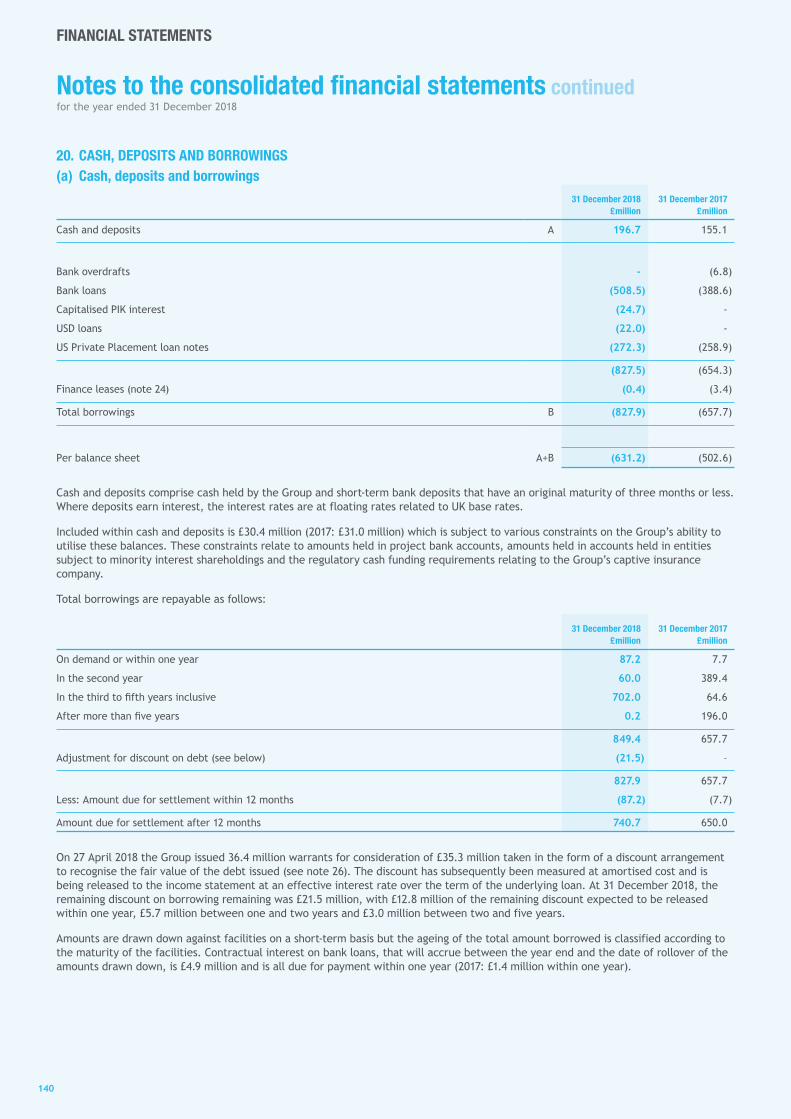
140140
FINANCIAL STATEMENTS
Notes to the consolidated financial statements continuedfor the year ended 31 December 2018
20. CASH, DEPOSITS AND BORROWINGS(a) Cash, deposits and borrowings
31 December 2018£million
31 December 2017£million
Cash and deposits A 196.7 155.1
Bank overdrafts - (6.8)
Bank loans (508.5) (388.6)
Capitalised PIK interest (24.7) -
USD loans (22.0) -
US Private Placement loan notes (272.3) (258.9)
(827.5) (654.3)
Finance leases (note 24) (0.4) (3.4)
Total borrowings B (827.9) (657.7)
Per balance sheet A+B (631.2) (502.6)
Cash and deposits comprise cash held by the Group and short-term bank deposits that have an original maturity of three months or less. Where deposits earn interest, the interest rates are at floating rates related to UK base rates.
Included within cash and deposits is £30.4 million (2017: £31.0 million) which is subject to various constraints on the Group’s ability to utilise these balances. These constraints relate to amounts held in project bank accounts, amounts held in accounts held in entities subject to minority interest shareholdings and the regulatory cash funding requirements relating to the Group’s captive insurance company.
Total borrowings are repayable as follows:
31 December 2018£million
31 December 2017£million
On demand or within one year 87.2 7.7
In the second year 60.0 389.4
In the third to fifth years inclusive 702.0 64.6
After more than five years 0.2 196.0
849.4 657.7
Adjustment for discount on debt (see below) (21.5) –
827.9 657.7
Less: Amount due for settlement within 12 months (87.2) (7.7)
Amount due for settlement after 12 months 740.7 650.0
On 27 April 2018 the Group issued 36.4 million warrants for consideration of £35.3 million taken in the form of a discount arrangement to recognise the fair value of the debt issued (see note 26) . The discount has subsequently been measured at amortised cost and is being released to the income statement at an effective interest rate over the term of the underlying loan. At 31 December 2018, the remaining discount on borrowing remaining was £21.5 million, with £12.8 million of the remaining discount expected to be released within one year, £5.7 million between one and two years and £3.0 million between two and five years.
Amounts are drawn down against facilities on a short-term basis but the ageing of the total amount borrowed is classified according to the maturity of the facilities. Contractual interest on bank loans, that will accrue between the year end and the date of rollover of the amounts drawn down, is £4.9 million and is all due for payment within one year (2017: £1.4 million within one year) .

141141
Governance
Financial Statements
Strategic Report
Overview
The analysis of utilisation of committed bank facilities is as follows:
31 December 2018£million
31 December 2017£million
Drawn facilities:
US Private Placement loan notes 272.3 258.9
Bank loans 552.0 388.6
Undrawn facilities maturing in less than one year - 37.5 – 135.0
Total committed borrowing facilities 824.3 685.0
(b) Committed borrowing facilities31 December 2018
£million31 December 2017
£million
US Private Placement loan notes 272.3 258.9
Bank facilities 552.0 426.1
Total committed borrowing facilities 824.3 685.0
The Group has a US$ 348.3 million (£272.3 million) issue of US Private Placement loan notes (“loan notes”) , which have a weighted average maturity length of 3.5 years. The loan notes attract a weighted average rate of interest of 5.61% and are repayable in September 2021.
The loan notes are in addition to £552.0 million of committed bank facilities as at the year end.
Following the successful conclusion of our bank negotiations in April 2018, and expiry of the £37.5 million of short-term facilities, the Group arranged access to committed borrowing facilities of £196 million.
These committed borrowing facilities, following partial repayments of the facilities during 2018, currently consist of a renewal of existing revolving credit facilities of £383.4 million, $348.3 million of US loan notes, £147.0 million new term loan and $28.3 million of new US dollar term loans. The term loan is repayable in instalments with £87.0 million of repayments due in 2019 and £60.0 million in 2020. The balance of funding is committed until September 2021 and is subject to a covenant to reduce gross borrowings to below £450 million by June 2020.
These facilities are subject to interest at the following rates:
Cash payment Payment in kind Total
Revolving credit facility LIBOR + 3.00%
1.43% + 2.00% until September 2019 if net leverage is above 3.0x and
then subject to a ratchet increase LIBOR + 6.43%
US$ loan notes Weighted average of 5.61%
2.00% until September 2019 if net leverage is above 3.0x and
then subject to a ratchet increase Weighted average of 7.61%
New term loan LIBOR + 3.25% 5.50% LIBOR + 8.75%
As part of the refinancing the Company has issued warrants to the providers of the new term loan and bonding facilities to buy shares at 10 pence per share (the nominal price of each share at the time). If exercised, this would provide the warrant holders with an interest of up to 20 per cent of the post-issue share capital. The warrants were initially recognised at their fair value of £35.3 million (note 26) , measured as the first £35.3 million of proceeds from new loans in the year. Consequently, the fair value of the underlying loan was initially measured at a £35.3 million discount to principal value, and subsequently measured at amortised cost, released to the income statement through finance costs at an effective interest rate. In the year to 31 December 2018, the total unwind of the discount on debt charged to the income statement was £13.8 million.
The Group also secured additional bonding facilities of up to £95 million as part of the arrangements which attract a cash margin of 2.00% with payment-in-kind charges of 5.50% whilst net leverage exceeds 3.0x. Bond instruments previously in existence which did not form part of the April 2018 refinancing attract a 0.50% uplift on existing pricing and 2.00% payment-in-kind charges until September 2019, when the pricing is subject to a ratchet mechanism assessed periodically, which is determined by the extent to which net leverage exceeds 3.0x. Payment-in-kind charges are capitalised to the balance sheet as a liability and become payable on a subsequent refinancing. The cash and bond payment-in-kind charges for the year, and the amount capitalised on the balance sheet, is £24.7 million.
It is anticipated that the total interest expense in 2019 will be approximately £86 million (including the amortisation of costs associated with the warrants) of which circa £36 million will be cash interest.

142142
FINANCIAL STATEMENTS
Notes to the consolidated financial statements continuedfor the year ended 31 December 2018
The borrowings are subject to a number of financial covenants including absolute EBITDA and cash flow available for debt servicing along with net leverage and cash interest cover. The calculation of EBITDA is subject to a cap on the level of non-underlying items that are excluded for covenant calculation purposes. Net leverage requirements for net debt relative to EBITDA start at a maximum of 6.5x and trend downwards to below 4.0x over the duration of the funding. Interest cover requirement is broadly for EBIT to cover interest by at least 3.5x. These covenants are measured quarterly on a rolling 12-month basis. There is also a minimum net worth covenant that is effective from December 2019.
The Group has granted security in respect of the new, and some of the existing debt, in the form of share pledges over material subsidiaries and floating charges over various intercompany funding arrangements.
21. FINANCIAL RISK MANAGEMENTFinancial assets comprise trade and other receivables (excluding prepayments and accrued income) , long-term debtors and cash and cash equivalents. Financial liabilities comprise trade and other payables (excluding accruals, deferred income and other tax and social security) , bank borrowings, overdrafts, loan notes and finance leases.
The Group has the following categories of financial assets and liabilities:
31 December 2018 31 December 2017
Other financial assets
£million
Other financial assets
£million
Financial assets at amortised cost:
Cash and cash equivalents 196.7 155.1
Trade and other receivables 466.8 511.6
Total financial assets 663.5 666.7
31 December 2018 31 December 2017
Otherfinancial liabilities
£million
Otherfinancial liabilities
£million
Financial liabilities at amortised cost:
Borrowings, overdrafts and finance leases 555.6 398.8
Loan notes 272.3 258.9
Trade and other payables 284.9 305.6
Total financial liabilities 1,112.8 963.3
Trade and other receivables are recognised initially at the amount of consideration that is unconditional. The Group holds these receivables with the objective of collecting contractual cash flows and therefore measures them subsequently at amortised cost using the effective interest method.
Trade and other payables are unsecured and are usually paid within 30 days of recognition. The carrying amounts of trade and other payables are considered to be the same as their fair values due to their short-term nature.
Exposure to credit risk on liquid funds and derivative financial instruments is managed by the Group’s requirement to trade with counterparties with strong credit ratings as determined by international credit rating agencies. The transactional banking requirements are met by local banks in each location with significant cash balances being remitted to Group treasury where short-term cash surpluses or cash not available for use by the Group is deposited with investment grade rated banks.
20. CASH, DEPOSITS AND BORROWINGS CONTINUED(b) Committed borrowing facilities continued

143143
Governance
Financial Statements
Strategic Report
Overview
(a) Currency exposuresWhere material trade is transacted in non-local currency, the Company hedges the currency exposure and ordinarily this will be achieved with forward contracts.
Analysis of financial assets, excluding derivatives used for hedging, by currency:
31 December 2018 31 December 2017
Floating rates
£million
Fixed rates
£million
Non–interest bearing£million
Total£million
Floating rates
£million
Fixedrates
£million
Non–interest bearing£million
Total£million
Sterling 162.5 - 307.1 469.6 102.5 - 384.9 487.4
US dollar 10.4 - 49.5 59.9 17.7 - 36.6 54.3
Euro 5.1 - 15.6 20.7 12.7 - 15.2 27.9
Australian dollar 1.5 - 3.9 5.4 1.5 - 4.7 6.2
Dirham 2.0 - 17.8 19.8 5.4 - 19.8 25.2
Other 15.2 - 72.9 88.1 15.3 - 50.4 65.7
196.7 - 466.8 663.5 155.1 - 511.6 666.7
Analysis of financial liabilities, excluding derivatives used for hedging, by currency:
31 December 2018 31 December 2017
Floating rates
£million
Fixed rates
£million
Non‑interest bearing£million
Total£million
Floating rates
£million
Fixedrates
£million
Non‑interest bearing£million
Total£million
Sterling 533.2 0.4 237.4 771.0 388.6 3.4 259.4 651.4
US dollar 22.0 272.3 24.4 318.7 - 258.9 22.3 281.2
Euro - - 4.7 4.7 4.2 - 2.0 6.2
Australian dollar - - 1.3 1.3 - - 1.5 1.5
Dirham - - 5.6 5.6 - - 10.7 10.7
Other - - 11.5 11.5 2.6 - 9.7 12.3
555.2 272.7 284.9 1,112.8 395.4 262.3 305.6 963.3
Weighted average interest rates excluding amortisation of arrangement fees and bank margin 0.8% 5.6% 0.5% 5.3%
Where the Group has overseas operations, the revenues and costs of the business will typically be denominated in local currency. Gains and losses arising on retranslation of monetary assets and liabilities that are not denominated in the functional currency of individual Group companies are recognised in the income statement.
Gains and losses arising on the retranslation of foreign operations’ net assets into the consolidation currency are recognised directly in equity. The Group does not hedge these translation differences.
The Group currently has a $348.3 million US Private Placement loan which is currently unhedged. After the previous hedging arrangements were terminated on 13 December 2017, the Group no longer has access to any derivative instrument bank facilities.
The Group’s exposure to fluctuations in exchange rates is shown below where a change in value of foreign currencies against sterling would have the following impact on the results of the Group:
31 December 2018£million
31 December 2017£million
A 1% change in exchange rates results in:
Change in profit 3.3 3.1
Change in reserves/net assets 5.7 4.9
A 1% change in the US dollar exchange rate would result in a £2.9 million change in profit and a £2.9 million change in reserves/net assets. A 1% change in the Qatari rial exchange rate would result in a £0.1 million change in profit and a £0.7 million change in reserves/net assets. A 1% change in the UAE dirham exchange rate would result in a £0.2 million change in profit and a £0.5 million change in reserves/net assets.

144144
FINANCIAL STATEMENTS
Notes to the consolidated financial statements continuedfor the year ended 31 December 2018
(b) Market price riskThe use of fixed-rate borrowings, where appropriate, diminishes the impact of an interest rate change. The impact of a 1% change in interest rate to the Group’s results is shown in the table below:
31 December 2018£million
31 December 2017£million
A 1% change in exchange rates results in:
Change in profit 5.5 3.9
(c) Credit riskThe Group’s principal financial assets are bank balances and cash, trade and other receivables and investments, which represent the Group’s maximum exposure to credit risk in relation to financial assets.
Credit risk in respect of cash balances and deposits held with banks is mitigated by the use of a number of highly-rated financial institutions.
The Group’s credit risk is primarily attributable to its trade receivables. Credit risk is managed at a divisional level within a set of overall Group risk management policy and procedures. More specifically the divisions monitor, where available, the external credit ratings of their major customers and obtain, where necessary, credit references on their financial standing to ensure that they only deal with credit worthy counterparties. Also, where considered appropriate, parent company guarantees and letters of credit are obtained.
A review of all bad debt history was carried out to evaluate whether this was indicative of any expected future credit exposures. These historical rates of credit loss were then looked at in the context of current and future factors affecting customers’ credit worthiness. Trade receivables are written off when there is considered to be very little likelihood of recovery of the debt.
The Group’s expected credit loss percentage is an immaterial amount despite the fact that that a significant allowance for doubtful debts of £38.5 million has been provided at 31 December 2018 (see note 19) . This is because a significant proportion of these allowances relate to business carried out in the Middle East region, in particular Saudi Arabia, Qatar and the UAE where provisions have been made for overdue payments despite the fact that the Group is confident that these outstanding amounts will ultimately be recovered once the economic blockade in Qatar is lifted and the overseas supplier payment mechanisms are normalised in Saudi Arabia.
Our current assessment is that no future credit losses will arise but the Group continues to monitor its exposure to expected credit losses and further disclosure will be provided in future periods if the assessed expected credit losses are considered significant.
Apart from receivables due from customers related to HM Government and some existing credit exposures to customers in Saudi Arabia (see note 1(b) ILE International Saudi debt) , the Group has no other significant concentration of credit risk, with exposure spread over a number of counterparties and customers.
(d) Liquidity riskThe Group seeks to maintain sufficient facilities to ensure that it has access to funding to meet current and anticipated future funding requirements determined from budgets and medium-term plans. Some of the facilities require us to comply with certain financial covenants, which are calculated excluding non-underlying items.
The maturity of financial assets and liabilities, with the exception of interest rate hedges above, are discussed in the specific asset and liability footnotes.
(e) Capital riskThe Group manages its capital to ensure that entities in the Group will be able to continue as going concerns, whilst seeking to optimise the debt and equity balance, in order to maximise the return to stakeholders. The capital structure of the Group consists of net debt, which includes cash, deposits and borrowings (note 20) , and equity attributable to equity holders of the parent.
The Group may adjust the capital structure of the Group by returning capital to shareholders, issue new shares or sell assets to reduce debt (see note 33 - Events after the balance sheet date) .
The Group is not subject to externally imposed capital requirements but is subject to covenants in its loan agreements which seek to maintain the level of debt and interest that the Group may take on at serviceable levels by reference to the Group’s earnings which ultimately limits the amount of debt that the Group can take on.
21. FINANCIAL RISK MANAGEMENT CONTINUED

145145
Governance
Financial Statements
Strategic Report
Overview
22. TRADE AND OTHER PAYABLES ‑ AMOUNTS FALLING DUE WITHIN ONE YEAR31 December 2018
£million31 December 2017
£million
Obligations under finance leases (note 24) 0.2 0.9
Trade payables 184.6 206.9
Advances received 29.9 29.5
Other taxation and social security 59.9 75.4
Other payables 57.9 57.2
Accruals 344.8 377.1
Deferred income 64.0 51.6
741.3 798.6
Accruals largely relate to contract costs, staff costs, building utilities and other overheads.
23. TRADE AND OTHER PAYABLES ‑ AMOUNTS FALLING DUE AFTER MORE THAN ONE YEAR31 December 2018
£million31 December 2017
£million
Obligations under finance leases (note 24) 0.2 2.5
Trade payables 0.3 0.3
Other payables 12.2 11.7
12.7 14.5
The carrying amount of trade and other payables approximates to their fair value.
The average credit period taken for trade purchases is 36 days (2017: 41 days) .
Ageing of amounts payable excluding advances, finance leases, accruals and deferred income is as follows:
31 December 2018£million
31 December 2017£million
Less than one year 302.4 339.5
Between one and two years 12.5 12.0
314.9 351.5

146146
FINANCIAL STATEMENTS
Notes to the consolidated financial statements continuedfor the year ended 31 December 2018
24. OBLIGATIONS UNDER FINANCE AND OPERATING LEASES(a) Finance leases
Minimum lease paymentsPresent value of minimum lease
payments
2018£million
2017£million
2018£million
2017£million
Amounts payable under finance leases:
Within one year 0.2 1.0 0.2 0.9
In the second to fifth years inclusive 0.2 2.5 0.2 2.5
After five years - 0.2 - - 4.7 2.4 4.4 2.2
0.4 3.7 0.4 3.4
Less: future finance charges - (0.3) n/a n/a 4.7 2.4 4.4 2.2
Present value of lease obligations 0.4 3.4 0.4 3.4
Certain of the Group’s plant and equipment is held under finance leases. The average lease term is four to five years. For the year ended 31 December 2018 the average effective borrowing rate was 1.6% (2017: 1.8%) . Interest rates are fixed at the contract date. All leases are on a fixed repayment basis and no arrangements have been entered into for contingent rental payments.
All finance lease obligations are denominated in sterling.
The carrying amount of the Group’s finance lease obligations approximate their fair value.
The Group’s obligations under finance leases are secured by the lessors’ charges over the leased assets.
(b) Operating leasesAt the balance sheet date, the Group had outstanding commitments for future minimum lease payments under non-cancellable operating leases, which fall due as follows:
31 December 2018 31 December 2017
Land and buildings£million
Other£million
Total£million
Land and buildings£million
Other£million
Total£million
Within one year 19.4 15.5 34.9 13.0 16.0 29.0
In the second to fifth years inclusive 47.9 22.1 70.0 30.3 18.0 48.3
After five years 85.2 - 85.2 104.5 - 104.5
152.5 37.6 190.1 147.8 34.0 181.8
The majority of leases of land and buildings are subject to rent reviews at periodic intervals of between three and five years and are based on market rates.
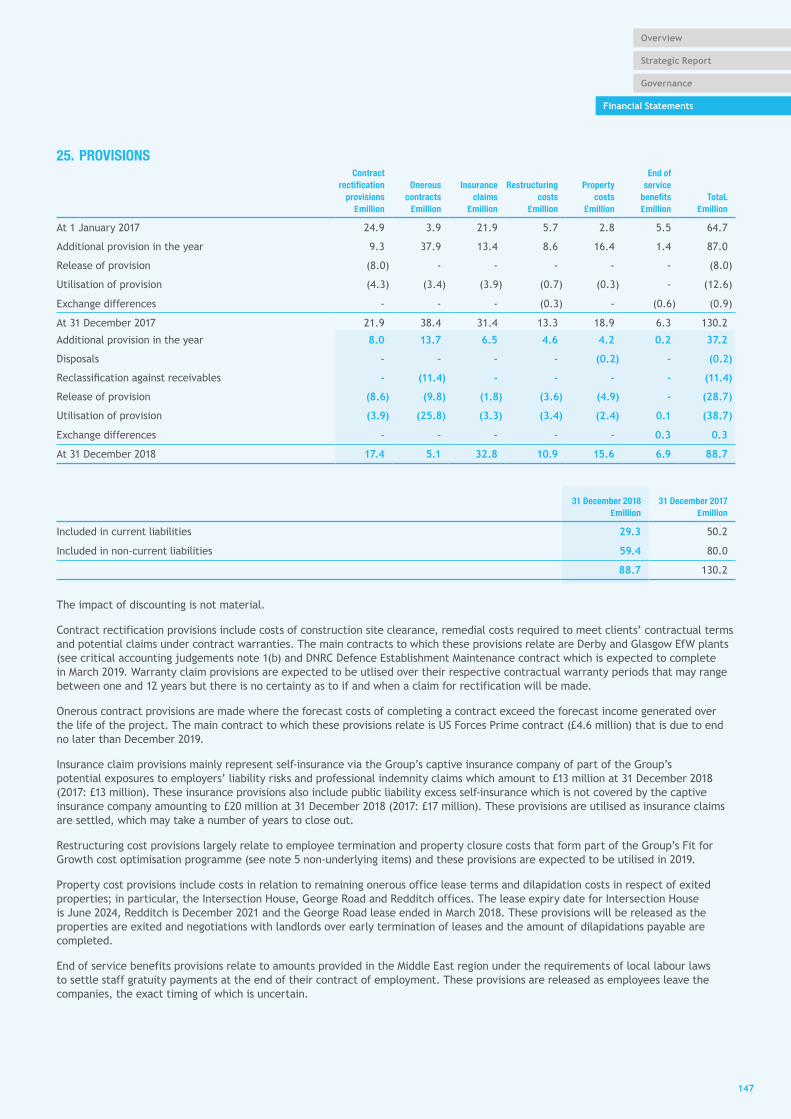
147147
Governance
Financial Statements
Strategic Report
Overview
25. PROVISIONSContract
rectification provisions
£million
Onerous contracts
£million
Insurance claims
£million
Restructuring costs
£million
Property costs
£million
End of service
benefits£million
TotaL£million
At 1 January 2017 24.9 3.9 21.9 5.7 2.8 5.5 64.7
Additional provision in the year 9.3 37.9 13.4 8.6 16.4 1.4 87.0
Release of provision (8.0) - - - - - (8.0)
Utilisation of provision (4.3) (3.4) (3.9) (0.7) (0.3) - (12.6)
Exchange differences - - - (0.3) - (0.6) (0.9)
At 31 December 2017 21.9 38.4 31.4 13.3 18.9 6.3 130.2
Additional provision in the year 8.0 13.7 6.5 4.6 4.2 0.2 37.2
Disposals - - - - (0.2) - (0.2)
Reclassification against receivables - (11.4) - - - - (11.4)
Release of provision (8.6) (9.8) (1.8) (3.6) (4.9) - (28.7)
Utilisation of provision (3.9) (25.8) (3.3) (3.4) (2.4) 0.1 (38.7)
Exchange differences - - - - - 0.3 0.3
At 31 December 2018 17.4 5.1 32.8 10.9 15.6 6.9 88.7
31 December 2018£million
31 December 2017£million
Included in current liabilities 29.3 50.2
Included in non-current liabilities 59.4 80.0
88.7 130.2
The impact of discounting is not material.
Contract rectification provisions include costs of construction site clearance, remedial costs required to meet clients’ contractual terms and potential claims under contract warranties. The main contracts to which these provisions relate are Derby and Glasgow EfW plants (see critical accounting judgements note 1(b) and DNRC Defence Establishment Maintenance contract which is expected to complete in March 2019. Warranty claim provisions are expected to be utlised over their respective contractual warranty periods that may range between one and 12 years but there is no certainty as to if and when a claim for rectification will be made.
Onerous contract provisions are made where the forecast costs of completing a contract exceed the forecast income generated over the life of the project. The main contract to which these provisions relate is US Forces Prime contract (£4.6 million) that is due to end no later than December 2019.
Insurance claim provisions mainly represent self-insurance via the Group’s captive insurance company of part of the Group’s potential exposures to employers’ liability risks and professional indemnity claims which amount to £13 million at 31 December 2018 (2017: £13 million) . These insurance provisions also include public liability excess self-insurance which is not covered by the captive insurance company amounting to £20 million at 31 December 2018 (2017: £17 million) . These provisions are utilised as insurance claims are settled, which may take a number of years to close out.
Restructuring cost provisions largely relate to employee termination and property closure costs that form part of the Group’s Fit for Growth cost optimisation programme (see note 5 non-underlying items) and these provisions are expected to be utilised in 2019.
Property cost provisions include costs in relation to remaining onerous office lease terms and dilapidation costs in respect of exited properties; in particular, the Intersection House, George Road and Redditch offices. The lease expiry date for Intersection House is June 2024, Redditch is December 2021 and the George Road lease ended in March 2018. These provisions will be released as the properties are exited and negotiations with landlords over early termination of leases and the amount of dilapidations payable are completed.
End of service benefits provisions relate to amounts provided in the Middle East region under the requirements of local labour laws to settle staff gratuity payments at the end of their contract of employment. These provisions are released as employees leave the companies, the exact timing of which is uncertain.

148148
FINANCIAL STATEMENTS
Notes to the consolidated financial statements continuedfor the year ended 31 December 2018
26. SHARE CAPITAL31 December 2018
£million31 December 2017
£million
Issued and fully paid:
149,719,938 ordinary shares of 0.1p each and 149,719,938 deferred shares of 9.9p each (2017: 145,714,120 ordinary shares of 10p each) 15.0 14.6
Sharesthousands
Share capital£million
At 1 January 2017 145,714.1 14.6
Share awards issued in 2017 - -
At 31 December 2017 145,714.1 14.6
Exercised warrants 4,005.8 0.4
Share awards issued in 2018 - -
At 31 December 2018 149,719.9 15.0
Following approval by shareholders at the AGM on 12 June 2018, our issued share capital of 149,719,938 ordinary 10p shares has been sub-divided into 149,719,938 ordinary shares of 0.1p and 149,719,938 deferred shares of 9.9p.
This sub-division was required to enable the exercise price of the share warrants to be reduced to less than 10p if necessary as a result of certain dilutive events. The economic and voting rights of the ordinary shares remain the same. The deferred shares have no value (economic or otherwise) and have been created to enable the Company to reduce the nominal value of the ordinary shares without going through a process that would require the approval of the Court. The deferred shares were issued to all persons on the Company’s register of members as at 12 June 2018 on the basis of one deferred share of 9.9p for each ordinary share held. The deferred shares are not transferable, do not carry any voting or dividend rights and are not expected to have any economic value.
WarrantsAs disclosed in our 2017 Annual Report, the Company issued 36,428,530 warrants during the period, for consideration of £35.3 million taken in the form of a discount adjustment to recognise the fair value of the debt issued, to the providers of the new term loan and bonding facilities to buy ordinary shares at 10p per share. The warrants are exercisable from the date of issue through the duration of the funding arrangements for which they were consideration (potentially up to September 2021) . 4,005,818 of these warrants were exercised during the period for cash consideration of £0.4 million and the equivalent number of new shares issued to the holders.

149149
Governance
Financial Statements
Strategic Report
Overview
Awards were granted during the year as indicated below (note 28) . Exercise and vesting details are stated in the Directors’ Remuneration Report on pages 74 to 77. Outstanding options and awards over shares in the Company at 31 December 2018 were as follows:
31 December 2018 31 December 2017
Date of grant
Subscription price per
share
Number of beneficiaries
including directors Number of shares
Number of beneficiaries
including directors Number of shares
(a) Performance Share Plan 9 April 2013 Nil - - 7 15,382
1 June 2015 Nil - - 120 1,695,314
5 April 2016 Nil 111 2,001,852 123 2,079,878
6 April 2017 Nil 98 3,741,674 112 4,006,741
11 September 2017 Nil 8 996,143 8 996,143
2 October 2017 Nil 1 526,840 1 526,840
3 May 2018 Nil 9 3,821,381 - -
4 June 2018 Nil 1 317,250 - -
11,405,140 9,320,298
(b) Restricted Stock Award 11 September 2017 Nil 1 1,416,741 1 1,897,899
1,416,741 1,897,899
(c) Sharesave Scheme 9 April 2014 511.0p - - 7 5,737
30 September 2014 529.0p - - 736 216,164
14 October 2015 467.0p 735 246,815 1,278 430,003
12 October 2016 317.0p 670 550,419 1,231 1,033,942
11 October 2017 91.0p 1,626 5,224,414 2,955 9,540,599
6,021,648 11,226,445
27. CONTINGENT LIABILITIESThe Company and its subsidiaries are, from time to time, parties to legal proceedings and claims which arise in the ordinary course of business. Appropriate provision has been made in these accounts for all material uninsured liabilities resulting from proceedings that are, in the opinion of the directors, likely to materialise.
The Company and certain subsidiary undertakings have, in the normal course of business, given performance guarantees and provided indemnities to third parties in relation to performance bonds and other contract-related guarantees. These relate to the Group’s own contracts and to the Group’s share of the contractual obligations of certain joint ventures and associated undertakings. The Group acts as guarantor for the following:
Maximum guarantee Amounts utilised
2018£million
2017£million
2018£million
2017£million
Joint ventures and associates
Borrowings 20.9 18.9 0.8 1.7
Bonds and guarantees 246.0 226.0 131.1 138.3 4.7 2.4 4.4 2.2
266.9 244.9 131.9 140.0

150150
FINANCIAL STATEMENTS
Notes to the consolidated financial statements continuedfor the year ended 31 December 2018
28. SHARE‑BASED PAYMENTSUnder the Group’s share-based incentive schemes the following expense was charged/(credited) :
31 December 2018£million
31 December 2017£million
Performance Share Plan 0.6 (1.3)
Restricted Stock Award - 3.1
Sharesave Scheme 1.9 0.3
Total charge 2.5 2.1
Cash settled - (0.3)
Equity settled 2.5 2.4
Total charge 2.5 2.1
The cash settled element of the charge relates to cash payments equivalent to the dividends which would have accrued to Performance Share Plan participants had their vested shares been awarded at the grant date.
(a) Performance Share PlanThe Performance Share Plan is a “free” share award with an effective exercise price of £nil. For all participants in the 2018 awards, one-third of their award is subject to a Total Shareholder Return (TSR) performance condition with performance compared to a comparator group, one-third is subject to a Cumulative Operating Profit (COP) performance condition and one-third is subject to a performance condition of achieving various strategic targets. For previous awards, various performance conditions applied, some only applicable to certain participants. The performance period on all awards is three years. Further details of these conditions are set out in the Directors’ Remuneration Report on pages 75 and 76. Awards are normally forfeited if the employee leaves the Group before the awards vest.
2018 2017Awardsnumber
Awardsnumber
Outstanding at beginning of period 9,320,298 5,387,106
Granted during the period 4,138,631 5,616,649
Exercised during the period - (26,562)
Lapsed during the period (2,053,789) (1,656,895)
Outstanding at the end of the period 11,405,140 9,320,298
Exercisable at the end of the period - 15,382
The remaining weighted average contractual life is 3.6 years (2017: 3.8 years) .
The Group engaged external consultants to calculate the fair value of these awards at the date of grant. The valuation model used to calculate the fair value of the awards granted under this plan was a stochastic valuation model, the inputs of which are detailed below:
2018 2017 2016grants grants grants
Weighted average share price 87.9p 202.4p 419.6p
Weighted average exercise price 0p 0p 0p
Expected volatility 79.1% 44.7% 26.2%
Expected life 3 years 3 years 3 years
Risk-free rate 0.8% 0.3% 0.5%
Expected dividend yield 0.0% 0.0% 0.0%
Average fair value of TSR award per share 65.5p 27.9p 134.6p
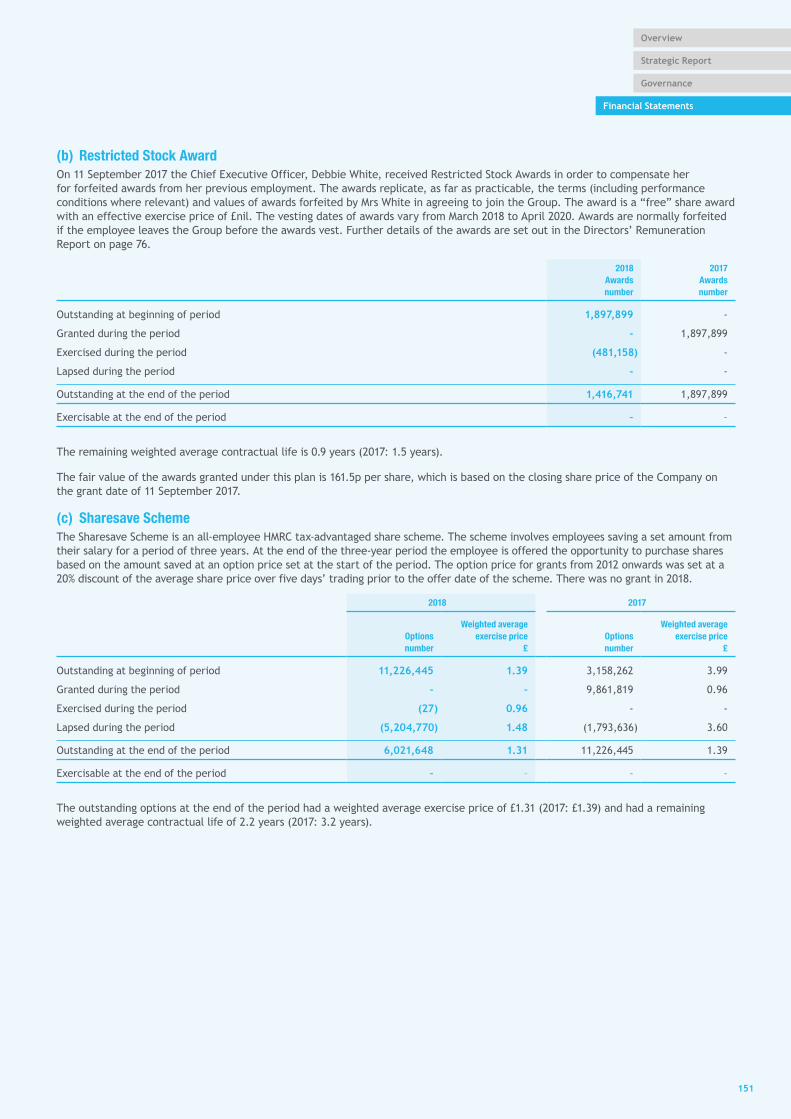
151151
Governance
Financial Statements
Strategic Report
Overview
(b) Restricted Stock AwardOn 11 September 2017 the Chief Executive Officer, Debbie White, received Restricted Stock Awards in order to compensate her for forfeited awards from her previous employment. The awards replicate, as far as practicable, the terms (including performance conditions where relevant) and values of awards forfeited by Mrs White in agreeing to join the Group. The award is a “free” share award with an effective exercise price of £nil. The vesting dates of awards vary from March 2018 to April 2020. Awards are normally forfeited if the employee leaves the Group before the awards vest. Further details of the awards are set out in the Directors’ Remuneration Report on page 76.
2018 Awards number
2017 Awards number
Outstanding at beginning of period 1,897,899 -
Granted during the period - 1,897,899
Exercised during the period (481,158) -
Lapsed during the period - - -
Outstanding at the end of the period 1,416,741 1,897,899
Exercisable at the end of the period – –
The remaining weighted average contractual life is 0.9 years (2017: 1.5 years) .
The fair value of the awards granted under this plan is 161.5p per share, which is based on the closing share price of the Company on the grant date of 11 September 2017.
(c) Sharesave Scheme The Sharesave Scheme is an all-employee HMRC tax-advantaged share scheme. The scheme involves employees saving a set amount from their salary for a period of three years. At the end of the three-year period the employee is offered the opportunity to purchase shares based on the amount saved at an option price set at the start of the period. The option price for grants from 2012 onwards was set at a 20% discount of the average share price over five days’ trading prior to the offer date of the scheme. There was no grant in 2018.
2018 2017
Optionsnumber
Weighted average exercise price
£Optionsnumber
Weighted average exercise price
£
Outstanding at beginning of period 11,226,445 1.39 3,158,262 3.99
Granted during the period - - 9,861,819 0.96
Exercised during the period (27) 0.96 - -
Lapsed during the period (5,204,770) 1.48 (1,793,636) 3.60 4.7 2.4 4.4 2.2
Outstanding at the end of the period 6,021,648 1.31 11,226,445 1.39 4.7 2.4 4.4 2.2
Exercisable at the end of the period – – – –
The outstanding options at the end of the period had a weighted average exercise price of £1.31 (2017: £1.39) and had a remaining weighted average contractual life of 2.2 years (2017: 3.2 years) .

152152
FINANCIAL STATEMENTS
Notes to the consolidated financial statements continuedfor the year ended 31 December 2018
The inputs into the Black-Scholes model are as follows:
2018 2017 2016grants grants grants
Share price at date of grant n/a 113.5p 348.0p
Exercise price n/a 91.0p 317.0p
Expected volatility n/a 41.3% 30.0%
Expected life n/a 3 years 3 years
Risk-free rate n/a 0.5% 0.8%
Expected dividend yield n/a 3.7% 4.1%
Fair value of award per share n/a 33.0p 62.3p
Expected volatility was determined by calculating the historical volatility of the Group’s share price over the previous two years. The expected life used in the model has been adjusted, based on management’s best estimate, for the effects of non-transferability, exercise restrictions, and behavioural considerations.
29. DEFINED BENEFIT RETIREMENT SCHEMESThe principal pension schemes within the Group have been valued for the purposes of IAS 19 Employee benefits. For each of these pension schemes valuation information has been updated by Lane Clark & Peacock LLP, qualified independent actuaries, to take account of the requirements of IAS 19 in order to assess the liabilities of the various schemes as at 31 December 2018.
Actuarial gains and losses are recognised in full in the period in which they occur. As permitted by IAS 19, actuarial gains and losses are recognised outside profit or loss and presented in other comprehensive income. The liability recognised in the balance sheet represents the present value of the various defined benefit obligations, as reduced by the fair value of plan assets. The cost of providing benefits is determined using the Projected Unit Credit Method.
The Group contributes to various defined benefit pension schemes in the UK and overseas. By far the most significant arrangement is the Interserve Pension Scheme in the UK, where benefits are generally related to service and final salary. The Interserve Pension Scheme comprises two segregated sections (referred to as the Interserve and Landmarc sections) , with assets and liabilities ring-fenced. The Group operates a defined contribution plan for new hires, with membership of the defined benefit arrangements only permitted when specific contract terms require defined benefit provision. Contributions to the defined contribution arrangements are in addition to those set out below and are charged directly to profit and loss.
The current funding target for the Group’s defined benefit schemes is to maintain assets equal to the value of the accrued benefits based on projected salaries (where relevant) . The regulatory framework in the UK requires the Trustees and Group to agree upon the assumptions underlying the funding target, and then to agree upon the necessary contributions required to recover any deficit at the valuation date. There is a risk to the Group that adverse experience could lead to a requirement for the Group to make considerable contributions to recover any deficit.
28. SHARE‑BASED PAYMENTS CONTINUED(c) Sharesave Scheme continued

153153
Governance
Financial Statements
Strategic Report
Overview
The following table sets out the key IAS 19 assumptions used to assess the present value of the defined benefit obligation. The discount rate and inflation assumptions shown below are the single equivalent rates for the full-yield curves assumed for the Interserve section of the Interserve Pension Scheme, which represents 90% of the total defined benefit obligation. The life expectancy assumptions shown relate to the vast majority of the membership of that scheme. The assumptions have been updated at 31 December 2018 to reflect the recent downward trend observed in projected future life expectancies issued by the Continuous Mortality Investigation. Alternative assumptions have been used for the less material arrangements where the specific nature of those schemes makes it appropriate to do so. The weighted average duration of the expected benefit payments for the schemes is around 15 years.
2018 2017
Significant actuarial assumptions
Retail price inflation (pa) 3.2% 3.2%
Discount rate (pa) 3.0% 2.5%
Post-retirement mortality (expectancy of life in years)
Male currently aged 65 86.3 87.7
Female currently aged 65 88.3 89.6
Male aged 65 in 20 years' time 87.3 89.5
Female aged 65 in 20 years' time 89.5 91.0
Other related actuarial assumptions
Consumer price index price inflation (pa) 2.1% 2.2%
Pension increase assumptions (pa)
RPI 3.2% 3.2%
RPI (minimum 0%, maximum 5%) 3.1% 3.1%
RPI (minimum 3%, maximum 5%) 3.7% 3.7%
CPI 2.1% 2.2%
CPI (minimum 0%, maximum 5%) 2.1% 2.2%
CPI (minimum 3%, maximum 5%) 3.2% n/a
Fixed 5% 5.0% 5.0%
General salary increases (pa) 2.6% 2.7%
The amount included in the balance sheet arising from the Group’s obligations in respect of the various pension schemes is as follows:
2018£million
2017£million
Present value of defined benefit obligation 844.8 1,064.1
Fair value of schemes' assets (938.7) (1,016.1)
(Asset) /liability recognised in the balance sheet (93.9) 48.0
The change in the net (asset) /liability recognised in the balance sheet is comprised as follows:
2018£million
2017£million
Opening net liability 48.0 52.4
(Income)/expense charged to profit and loss (65.3) 7.9
Amount recognised in other comprehensive income (54.0) 10.4
Employer contributions (22.6) (22.7)
Closing net (asset) /liability (93.9) 48.0

154154
FINANCIAL STATEMENTS
Notes to the consolidated financial statements continuedfor the year ended 31 December 2018
The Group has assessed that it is permissible under IFRIC 14 IAS 19 – The limit on a defined benefit asset, minimum funding requirements and their interaction to recognise a pension asset at 31 December 2018.
Indicative change in defined benefit obligation
Sensitivity2018
£million2017
£million
Sensitivity to significant actuarial assumptions
Price inflation +0.5% pa +48 +64
Discount rate +0.5% pa -60 -85
Post-retirement mortality (expectancy of life in years) 1 year increase +30 +35
The sensitivities shown above reflect only the change in the assessed defined benefit obligation. In practice any movement in assumptions is likely to be accompanied by similar (although not necessarily equal) change in asset values, and the corresponding overall impact on the net liability/(asset) is therefore likely to be different from than the amounts above.
The amounts recognised in the income statement are as follows:
2018£million
2017£million
Employer’s part of current service cost 3.4 5.2
Net interest (income)/expense on the net pension (asset) /liability (0.4) 1.1
Administration expenses 2.3 1.6
Past service cost/(credit) (70.6) -
Total (income) /expense recognised in the income statement (65.3) 7.9
The current service cost and administration expenses are included within operating profit. The interest cost is included within financing costs.
At the balance sheet date, the current allocation of the schemes’ assets is as follows:
31 December 2018 31 December 2017
Current allocation
Fair value £million
Current allocation
Fair value £million
Equities (quoted) 2% 24.0 28% 286.1
Alternative investments (primarily unquoted) 16% 153.1 19% 192.5
Property (unquoted) 0% 1.9 0% 3.9
Liability Driven Investment ("LDI") (unquoted) 43% 390.2 13% 132.7
Insurance policies (unquoted) 33% 310.8 34% 342.7
Government bonds (quoted) 0% - 0% -
Corporate bonds (quoted) 0% 2.7 0% 2.8
Infrastructure (unquoted) 5% 49.5 5% 49.0
Cash and other (primarily unquoted) 1% 6.5 1% 6.4
100% 938.7 100% 1,016.1
Alternative investments include diversified growth funds, fund of hedge funds and emerging market multi-asset funds (primarily unquoted) .
The Trustee of the Interserve Pension Scheme holds an insurance policy in the Interserve section of the scheme to protect the Group from certain risks associated with approximately 35% of that section’s defined benefit obligation. The policy aims to match the pension payments to the pensioner members who were above age 65 in July 2014. The policy is not an exact match for the benefits in certain areas, notably: pension increases if price inflation falls below 0%; differences between the increase in the Consumer Prices Index and the Retail Prices Index; and the eligibility criteria for dependants’ pensions. Due to the inexact nature of the match, the value of the asset (£288 million) can vary from the value of the corresponding defined benefit obligation (£249 million) , which is primarily due to different inflation measures being applicable to the benefits valued for the asset and the liability (RPI and CPI respectively) . Included within these values, essentially, is circa £4 million of the defined benefit obligation which precisely matches the benefits in respect of certain dependants in receipt of pension.
29. DEFINED BENEFIT RETIREMENT SCHEMES CONTINUED

155155
Governance
Financial Statements
Strategic Report
Overview
Except for the element of the policy which precisely matches the benefits (around 1% of the total policy value) , the policy has been valued as the estimated replacement cost at the accounting date by the Group’s actuarial advisers, LCP, in accordance with the fair value requirements of IFRS 13. The small matching element has been valued at the same amount as the defined benefit obligation in respect of the matched benefits.
During 2016 the Interserve Pension Scheme invested in a bespoke pooled LDI fund. The LDI portfolio provides a broad 45% hedge of the Interserve section’s interest rate and inflation exposure not covered by the insurance policy above. The LDI manager invests in a combination of gilts and swaps, depending on the relative attractiveness of each instrument at each maturity.
The schemes have not directly invested in any of the Group’s other financial instruments nor in other assets or properties used by the Group.
Following discussions in recent years between the Company and the Trustee of the Interserve Pension Scheme, the Trustee agreed to change the Scheme terms relating to the inflation reference index used to calculate increases to some members’ benefits in the scheme. The index previously used was RPI; with effect from 1 May 2018 this was changed to CPI for all affected members of the scheme who are not currently in service, and from 1 October 2018 this was changed to CPI for affected active members. The accounting treatment for the index changes is to allow for plan amendments as at 30 April and 30 September 2018 respectively. The corresponding past service gain amounts have been measured as at the effective dates of change, using assumptions updated for market conditions at the effective dates. As a result of this plan amendment, an exceptional gain of £70.6 million has been recognised as a non-underlying item (see note 5) . The reconciliation over 2018 allows for the remeasurement of the balance sheet at these dates and resetting of the financial assumptions for projections.
A reconciliation of the present value of the defined benefit obligation is as follows:
2018£million
2017£million
Opening defined benefit obligation 1,064.1 1,044.6
Employer’s part of current service cost 3.4 5.2
Interest on defined benefit obligation 25.0 28.6
Contributions by schemes' participants 0.3 0.3
Actuarial loss/(gain) due to:
Changes in financial assumptions (69.7) 39.7
Changes in demographic assumptions (48.0) (1.2)
Experience on defined benefit obligations 1.6 (8.4)
Benefits paid (61.3) (44.7)
Past service cost/(credit) (70.6) -
Closing defined benefit obligation 844.8 1,064.1
A reconciliation of the fair value of the schemes’ assets is as follows:
2018£million
2017£million
Opening fair value of the schemes' assets 1,016.1 992.2
Interest on schemes' assets 25.4 27.5
Actual return on schemes' assets less interest on schemes' assets (62.1) 19.7
Contributions by the employers 22.6 22.7
Contributions by schemes' participants 0.3 0.3
Administrative expenses (2.3) (1.6)
Benefits paid (61.3) (44.7)
Closing fair value of the schemes' assets 938.7 1,016.1
A triennial actuarial valuation of the Interserve Pension Scheme is underway, with an effective date of 31 December 2017. The future contribution rates will be determined in the light of this actuarial valuation. Based on current contribution rates and payroll, the Group expects to contribute £19.0 million to the various defined benefit arrangements during 2019 (including deficit contributions to the Interserve section of the Interserve Pension Scheme of £14.6 million) .
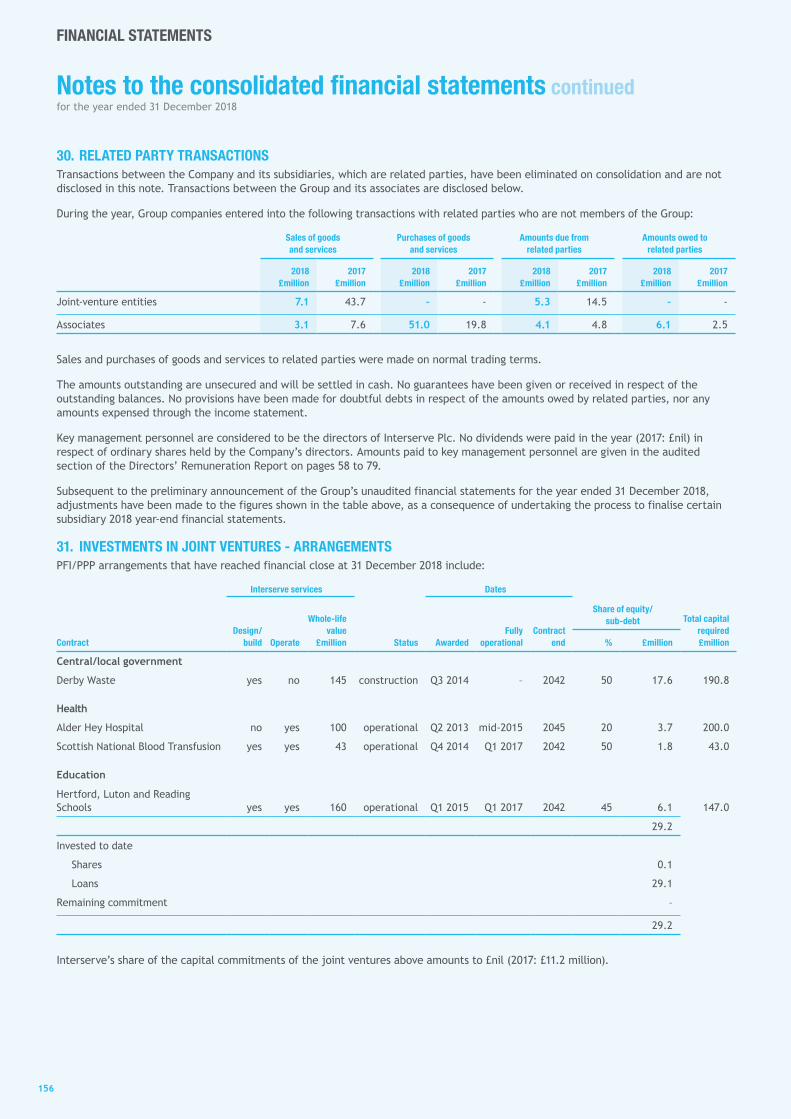
156156
FINANCIAL STATEMENTS
Notes to the consolidated financial statements continuedfor the year ended 31 December 2018
30. RELATED PARTY TRANSACTIONSTransactions between the Company and its subsidiaries, which are related parties, have been eliminated on consolidation and are not disclosed in this note. Transactions between the Group and its associates are disclosed below.
During the year, Group companies entered into the following transactions with related parties who are not members of the Group:
Sales of goodsand services
Purchases of goodsand services
Amounts due from related parties
Amounts owed to related parties
2018£million
2017£million
2018£million
2017£million
2018£million
2017£million
2018£million
2017£million
Joint-venture entities 7.1 43.7 - - 5.3 14.5 - -
Associates 3.1 7.6 51.0 19.8 4.1 4.8 6.1 2.5
Sales and purchases of goods and services to related parties were made on normal trading terms.
The amounts outstanding are unsecured and will be settled in cash. No guarantees have been given or received in respect of the outstanding balances. No provisions have been made for doubtful debts in respect of the amounts owed by related parties, nor any amounts expensed through the income statement.
Key management personnel are considered to be the directors of Interserve Plc. No dividends were paid in the year (2017: £nil) in respect of ordinary shares held by the Company’s directors. Amounts paid to key management personnel are given in the audited section of the Directors’ Remuneration Report on pages 58 to 79.
Subsequent to the preliminary announcement of the Group’s unaudited financial statements for the year ended 31 December 2018, adjustments have been made to the figures shown in the table above, as a consequence of undertaking the process to finalise certain subsidiary 2018 year-end financial statements.
31. INVESTMENTS IN JOINT VENTURES ‑ ARRANGEMENTSPFI/PPP arrangements that have reached financial close at 31 December 2018 include:
Interserve services Dates
ContractDesign/
build Operate
Whole‑life value
£million Status AwardedFully
operationalContract
end
Share of equity/ sub‑debt Total capital
required£million
% £million
Central/local government
Derby Waste yes no 145 construction Q3 2014 – 2042 50 17.6 190.8
Health
Alder Hey Hospital no yes 100 operational Q2 2013 mid-2015 2045 20 3.7 200.0
Scottish National Blood Transfusion yes yes 43 operational Q4 2014 Q1 2017 2042 50 1.8 43.0
Education
Hertford, Luton and Reading Schools yes yes 160 operational Q1 2015 Q1 2017 2042 45 6.1 147.0
29.2
Invested to date
Shares 0.1
Loans 29.1
Remaining commitment –
29.2
Interserve’s share of the capital commitments of the joint ventures above amounts to £nil (2017: £11.2 million) .
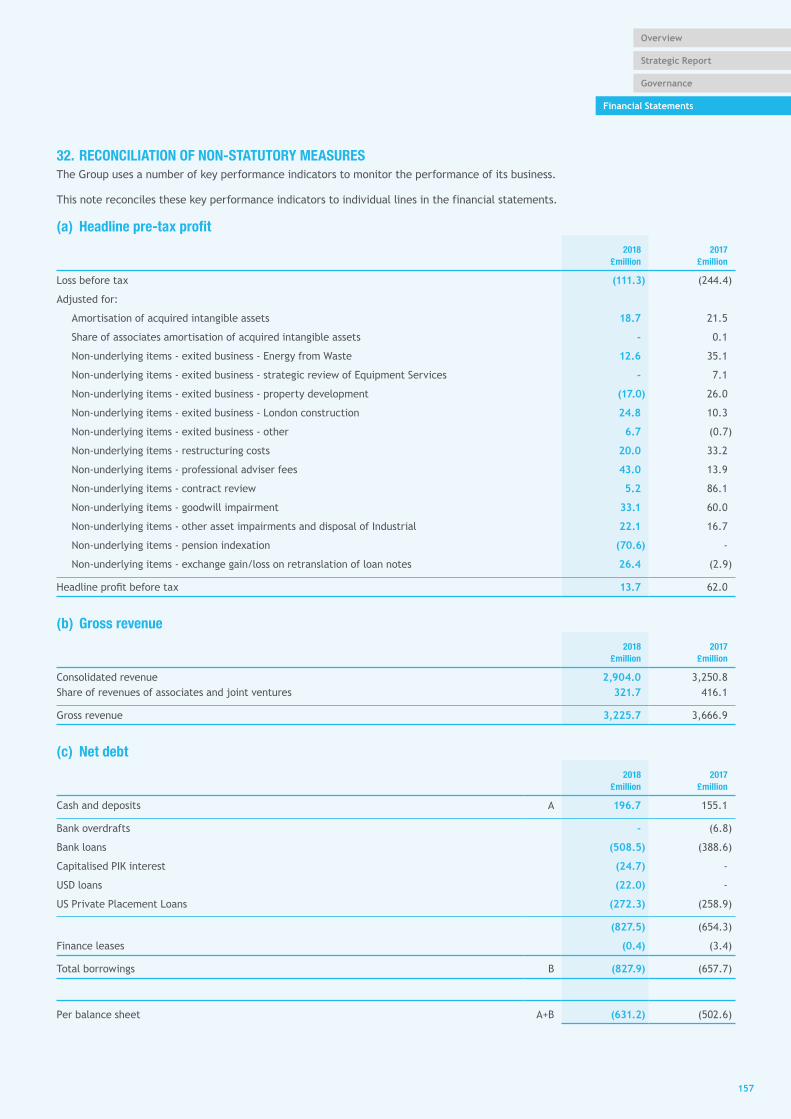
157157
Governance
Financial Statements
Strategic Report
Overview
32. RECONCILIATION OF NON‑STATUTORY MEASURESThe Group uses a number of key performance indicators to monitor the performance of its business.
This note reconciles these key performance indicators to individual lines in the financial statements.
(a) Headline pre‑tax profit2018
£million2017
£million
Loss before tax (111.3) (244.4)
Adjusted for:
Amortisation of acquired intangible assets 18.7 21.5
Share of associates amortisation of acquired intangible assets - 0.1
Non-underlying items - exited business - Energy from Waste 12.6 35.1
Non-underlying items - exited business - strategic review of Equipment Services - 7.1
Non-underlying items - exited business - property development (17.0) 26.0
Non-underlying items - exited business - London construction 24.8 10.3
Non-underlying items - exited business - other 6.7 (0.7)
Non-underlying items - restructuring costs 20.0 33.2
Non-underlying items - professional adviser fees 43.0 13.9
Non-underlying items - contract review 5.2 86.1
Non-underlying items - goodwill impairment 33.1 60.0
Non-underlying items - other asset impairments and disposal of Industrial 22.1 16.7
Non-underlying items - pension indexation (70.6) -
Non-underlying items - exchange gain/loss on retranslation of loan notes 26.4 (2.9)
Headline profit before tax 13.7 62.0
(b) Gross revenue2018
£million2017
£million
Consolidated revenue 2,904.0 3,250.8 Share of revenues of associates and joint ventures 321.7 416.1
Gross revenue 3,225.7 3,666.9
(c) Net debt2018
£million2017
£million
Cash and deposits A 196.7 155.1
Bank overdrafts - (6.8)
Bank loans (508.5) (388.6)
Capitalised PIK interest (24.7) -
USD loans (22.0) -
US Private Placement Loans (272.3) (258.9)
(827.5) (654.3)
Finance leases (0.4) (3.4)
Total borrowings B (827.9) (657.7)
Per balance sheet A+B (631.2) (502.6)

158158
FINANCIAL STATEMENTS
Notes to the consolidated financial statements continuedfor the year ended 31 December 2018
33. EVENTS AFTER THE BALANCE SHEET DATEOn 6 February 2019, Interserve announced a proposed Deleveraging Plan, which the directors believe will provide the Group with sufficient liquidity to service its short-term cash obligations, create a strong balance sheet and a fundamentally solid foundation from which the Group can improve its business and deliver on its long-term strategy.
The Deleveraging Plan is a consensual restructuring of Interserve, which is urgently required to avoid a default in the existing financing arrangements and to provide sufficient liquidity, cash and bonding facilities to allow the Group to service short term obligations and secure a stable platform. Such a default, were it to occur, would be expected to have material adverse consequences for stakeholders and, in particular, for existing shareholders.
The Deleveraging Plan preserves fully the pre-emption rights of existing shareholders. If they take up their entitlements in the equity raise their ownership will not be diluted and they will participate on the same terms as lenders.
The Deleveraging Plan will be subject to approval by Interserve’s shareholders.

159159
Financial Statements
Governance
Strategic Report
Overview
Company balance sheet at 31 December 2018
Notes2018
£million2017
£million
Non-current assets
Tangible assets E 2.3 13.7
Investments in subsidiaries F 462.9 462.9
Investment in associates G 2.7 2.7
Retirement benefit surplus L 98.8 -
Other investments H - 0.3
566.7 479.6
Current assets
Debtors:
Due within one year I 71.7 12.2
Due after one year I - 9.6
Cash at bank and in hand 28.0 166.8 166.8
99.7 188.6
Creditors: amounts falling due within one year J (65.8) (152.5) (152.5) (37.4)
Net current assets 33.9 36.1
Total assets less current liabilities 600.6 515.7
Creditors: amounts falling due after more than one year K (4.0) (3.9)
Retirement benefit obligation L - (38.5)
Provisions for liabilities M (45.1) (33.6)
Net assets 551.5 439.7
Capital and reserves
Called-up share capital O 15.0 14.6
Share premium account 116.5 116.5
Warrants in issue 31.4 -
Capital redemption reserve 0.1 0.1
Merger reserve 180.9 180.9
Profit and loss account 207.6 127.6
Total shareholders’ funds 551.5 439.7
Interserve Plc reported a profit after taxation for the financial year ended 31 December 2018 of £15.2 million (2017: loss after taxation of £69.3 million) .
The financial statements of Interserve Plc (registered number 00088456) were approved by the Board of Directors on 8 March 2019.
Signed on behalf of the Board of Directors
D J White M A WhitelingDirector Director

160160
FINANCIAL STATEMENTS
Company statement of changes in equity for the year ended 31 December 2018
Called–up share
capital£million
Profit and loss account£million
Warrants in issue
£million
Share premium account£million
Capital redemption
reserve£million
Merger reserve£million
Total£million
Balance as at 1 January 2017 14.6 193.7 – 116.5 0.1 180.9 505.8
Loss for the year – (69.3) – – – – (69.3)
Other comprehensive income for the year – 0.8 – – – – 0.8
Total comprehensive income for the year – (68.5) – – – – (68.5)
Share-based payments – 2.4 – – – – 2.4
Transactions with owners 0.1 2.4 – – – – 2.4
Balance as at 31 December 2017 14.6 127.6 – 116.5 0.1 180.9 439.7
Profit for the year – 15.2 – – – – 15.2
Other comprehensive income for the year – 58.4 – – – – 58.4
Total comprehensive income for the year – 73.6 – – – – 73.6
Issue of share capital 0.4 – – – – – 0.4
Warrants issued – – 35.3 – – – 35.3
Warrants exercised – 3.9 (3.9) – – – –
Investment in own shares – 1.9 – – – – 1.9
Company shares used to settle share-based payments – (1.9) – – – – (1.9)
Share-based payments – 2.5 – – – – 2.5Share-based payments
Transactions with owners 0.4 6.4 31.4 – – – 38.2
Balance as at 31 December 2018 15.0 207.6 31.4 116.5 0.1 180.9 551.5
The share premium reserve includes proceeds from share issues over and above the nominal value of the ordinary shares.
The merger reserve includes premium on the shares issued on acquisition of subsidiary companies.

161161
Governance
Financial Statements
Strategic Report
Overview
Notes to the Company financial statements for the year ended 31 December 2018
(A) ACCOUNTING POLICIESThe principal accounting policies are summarised below. They have all been applied consistently throughout the year and the preceding year.
(a) Basis of accountingThese financial statements have been prepared in accordance with Financial Reporting Standard 101 Reduced disclosure framework and the Companies Act 2006. These financial statements have therefore been prepared under the historical cost convention.
Interserve Plc is a company incorporated in the United Kingdom under the Companies Act. The address of the registered office is given on page 43 of the Group consolidated financial statements.
The Company meets the definition of qualifying entity under FRS 100 Application of financial reporting requirements. These financial statements were prepared in accordance with FRS 101 Reduced disclosure framework as issued by the Financial Reporting Council.
The Company’s financial statements are included in the Interserve Plc consolidated financial statements for the year ended 31 December 2018. As permitted by section 408 of the Companies Act 2006, the Company has not presented its own profit and loss account.
The Company has taken advantage of the following disclosure exemptions in preparing these financial statements, as permitted by FRS 101 Reduced disclosure framework:
• the requirements of paragraphs 45(b) and 46 to 52 of IFRS 2 Share-based payment;
• the requirements of IFRS 7 Financial Instruments: disclosures;
• the requirements of paragraphs 91 to 99 of IFRS 13 Fair value measurement;
• the requirement in paragraph 38 of IAS 1 Presentation of financial statements to present comparative information in respect of:
◦ paragraph 79(a) (iv) of IAS 1;
◦ paragraph 73(e) of IAS 16 Property, plant and equipment; and
◦ paragraph 118(e) of IAS 38 Intangible assets;
• the requirements of paragraphs 10(d) , 10) (f) , 16, 38A, 38B, 38C, 38D, 40A, 40B, 40C, 40D and 111 of IAS 1 Presentation of financial statements;
• the requirements of paragraphs 134 to 136 of IAS 1 Presentation of financial statements;
• the requirements of IAS 7 Statement of cash flows;
• the requirements of paragraphs 30 and 31 of IAS 8 Accounting policies, changes in accounting estimates and errors;
• the requirements of paragraphs 17 and 18A of IAS 24 Related party disclosures;
• the requirements in IAS 24 Related party disclosures to disclose related party transactions entered into between two or more members of a group; and
• the requirements of paragraphs 134(d) to 134(f) and 135(c) to 135(e) of IAS 36 Impairments of assets.
These financial statements are separate financial statements.
Where required, equivalent disclosures are given in the Annual Report and Financial Statements of the Group as shown in notes 1 to 33.
(b) Going concernThe directors have carried out a detailed review of the viability of the Company over the period to December 2021. This review has involved stress testing of the current strategic plan of the Company under a number of scenarios and has considered risks and uncertainties to both the near and medium term.
Based on this analysis and approval of the Deleveraging Plan by shareholders, the directors have a reasonable expectation that the Company has adequate resources to continue as a going concern for the foreseeable future, representing a period of at least a year from the date of this statement. The Board of Directors has considered the length of the going concern period for this assessment and, taking into account the terms of the replacement financing facilities and proposed Deleveraging Plan, has concluded that a going concern period of 12 months remains appropriate.
In making this assessment the directors recognise that there is a material uncertainty in relation to the approval of the Deleveraging Plan by shareholders and failure to secure shareholder approval represents a material uncertainty that may cast significant doubt over the Company’s ability to continue as a going concern.
Based on current expectations, and on the basis that the directors have every expectation of successful completion of the financial restructuring, the directors consider it appropriate to continue to adopt the going concern basis in preparing the financial statements.
A more detailed review of going concern can be found in the Annual Report and Financial Statements of the Company on page 41.

162162
FINANCIAL STATEMENTS
Notes to the Company financial statements continuedfor the year ended 31 December 2018
(c) LeasesOperating lease payments represent rentals payable by the Company for its office properties. Leases are negotiated for an average term of 10 years and rentals are fixed for an average of five years with a break option to extend at five years. Leases of land and buildings are typically subject to rent reviews at five-yearly intervals and provide for the lessee to pay all insurance, maintenance and repair costs. The payments made are charged to the statement of total comprehensive income on a straight-line basis over the lease term.
(d) Foreign currencyThe financial statements are presented in pounds sterling, which is the currency of the primary economic environment in which the Company operates (its functional currency) .
Transactions denominated in currencies other than the functional currency are translated at the rates ruling at the dates of the transaction. Monetary assets and liabilities denominated in foreign currencies at the balance sheet date are translated at the rates ruling at that date. Non-monetary items that are measured in terms of historical cost in foreign currency are not retranslated.
Exchange differences are recognised in profit and loss in the period in which they arise.
(e) Tangible assetsTangible assets are carried at cost less any accumulated depreciation and any impairment losses. Depreciation is provided on a straight-line basis, calculated to write off the cost or valuation over its expected useful life, at rates ranging between:
Freehold land Nil
Freehold buildings 2%
Leasehold property Over period of lease
Computer hardware and software 33.3%
Furniture, office and plant equipment 10% to 33.3%
Useful lives are reviewed at the end of every reporting period.
The costs of operating leases are charged to the profit and loss account as they accrue.
(f) Provisions and contingent liabilitiesProvisions are recognised when the Company has a present obligation (legal or constructive) as a result of a past event, it is probable that the Company will be required to settle the obligation and a reliable estimate can be made of the amount of the obligation. Where the Company expects some or all of a provision to be reimbursed, the reimbursement is recognised as a separate asset but only when the reimbursement is virtually certain. The expense relating to any provision is presented in the profit and loss net of any reimbursement. If the effect of the time value of money is material, provisions are discounted using an appropriate rate that takes into account the risks specific to the liability. Where discounting is used, the increase in the provision due to the passage of time is recognised as a finance cost.
Contingent liabilities are disclosed in the notes to the financial statements in respect of guarantees given to the Company’s subsidiaries, associated undertakings, joint ventures and pension scheme. Due to the nature of the guarantees it would be difficult to reliably measure the Company’s potential obligation and the Company considers it unlikely that there will be a requirement to make a financial settlement as a result of these guarantees.
(g) InvestmentsInvestments are stated at cost less any impairment at the balance sheet date.
(h) Impairment of investmentsInvestments are assessed for indicators of impairment at each balance sheet date. The investment is impaired where there is objective evidence that, as a result of one or more events that occurred after the initial recognition of the asset, the estimate future cash flows of the investment have been affected.
(i) PensionsThe Company participates in, and is the sponsoring employer of, both defined benefit and defined contribution pension schemes for the benefit of permanent members of staff. For the defined benefit schemes the cost of providing benefits is determined using the projected unit credit method, with actuarial valuations being carried out at each balance sheet date.
Actuarial gains and losses are recognised in full in the period in which they occur. They are recognised in the statement of other comprehensive income.
For defined contribution schemes, the amount recognised in the profit and loss is equal to the contributions payable to the schemes during the year.
(A) ACCOUNTING POLICIES CONTINUED
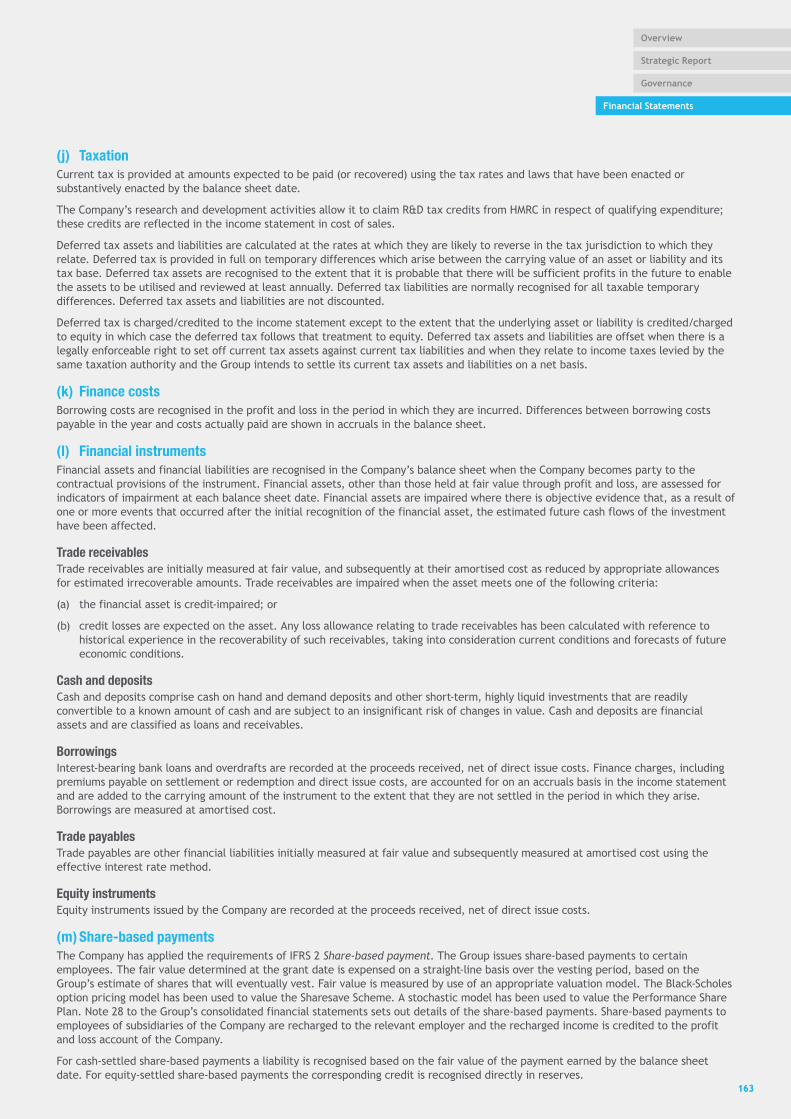
163163
Governance
Financial Statements
Strategic Report
Overview
(j) TaxationCurrent tax is provided at amounts expected to be paid (or recovered) using the tax rates and laws that have been enacted or substantively enacted by the balance sheet date.
The Company’s research and development activities allow it to claim R&D tax credits from HMRC in respect of qualifying expenditure; these credits are reflected in the income statement in cost of sales.
Deferred tax assets and liabilities are calculated at the rates at which they are likely to reverse in the tax jurisdiction to which they relate. Deferred tax is provided in full on temporary differences which arise between the carrying value of an asset or liability and its tax base. Deferred tax assets are recognised to the extent that it is probable that there will be sufficient profits in the future to enable the assets to be utilised and reviewed at least annually. Deferred tax liabilities are normally recognised for all taxable temporary differences. Deferred tax assets and liabilities are not discounted.
Deferred tax is charged/credited to the income statement except to the extent that the underlying asset or liability is credited/charged to equity in which case the deferred tax follows that treatment to equity. Deferred tax assets and liabilities are offset when there is a legally enforceable right to set off current tax assets against current tax liabilities and when they relate to income taxes levied by the same taxation authority and the Group intends to settle its current tax assets and liabilities on a net basis.
(k) Finance costsBorrowing costs are recognised in the profit and loss in the period in which they are incurred. Differences between borrowing costs payable in the year and costs actually paid are shown in accruals in the balance sheet.
(l) Financial instrumentsFinancial assets and financial liabilities are recognised in the Company’s balance sheet when the Company becomes party to the contractual provisions of the instrument. Financial assets, other than those held at fair value through profit and loss, are assessed for indicators of impairment at each balance sheet date. Financial assets are impaired where there is objective evidence that, as a result of one or more events that occurred after the initial recognition of the financial asset, the estimated future cash flows of the investment have been affected.
Trade receivablesTrade receivables are initially measured at fair value, and subsequently at their amortised cost as reduced by appropriate allowances for estimated irrecoverable amounts. Trade receivables are impaired when the asset meets one of the following criteria:
(a) the financial asset is credit-impaired; or
(b) credit losses are expected on the asset. Any loss allowance relating to trade receivables has been calculated with reference to historical experience in the recoverability of such receivables, taking into consideration current conditions and forecasts of future economic conditions.
Cash and depositsCash and deposits comprise cash on hand and demand deposits and other short-term, highly liquid investments that are readily convertible to a known amount of cash and are subject to an insignificant risk of changes in value. Cash and deposits are financial assets and are classified as loans and receivables.
BorrowingsInterest-bearing bank loans and overdrafts are recorded at the proceeds received, net of direct issue costs. Finance charges, including premiums payable on settlement or redemption and direct issue costs, are accounted for on an accruals basis in the income statement and are added to the carrying amount of the instrument to the extent that they are not settled in the period in which they arise. Borrowings are measured at amortised cost.
Trade payablesTrade payables are other financial liabilities initially measured at fair value and subsequently measured at amortised cost using the effective interest rate method.
Equity instrumentsEquity instruments issued by the Company are recorded at the proceeds received, net of direct issue costs.
(m) Share‑based paymentsThe Company has applied the requirements of IFRS 2 Share-based payment. The Group issues share-based payments to certain employees. The fair value determined at the grant date is expensed on a straight-line basis over the vesting period, based on the Group’s estimate of shares that will eventually vest. Fair value is measured by use of an appropriate valuation model. The Black-Scholes option pricing model has been used to value the Sharesave Scheme. A stochastic model has been used to value the Performance Share Plan. Note 28 to the Group’s consolidated financial statements sets out details of the share-based payments. Share-based payments to employees of subsidiaries of the Company are recharged to the relevant employer and the recharged income is credited to the profit and loss account of the Company.
For cash-settled share-based payments a liability is recognised based on the fair value of the payment earned by the balance sheet date. For equity-settled share-based payments the corresponding credit is recognised directly in reserves.
164164
FINANCIAL STATEMENTS
Notes to the Company financial statements continuedfor the year ended 31 December 2018
(n) Critical accounting judgements and key sources of estimation uncertaintyIn the application of the Company accounting policies, which are described above, the directors are required to make judgements, estimates and assumptions about the carrying amounts of assets and liabilities that are not readily apparent from other sources. The estimates and associated assumptions are based on historical experience and other factors that are considered to be relevant. Actual results may differ from these estimates.
The estimates and underlying assumptions are reviewed on an ongoing basis. Revisions to accounting estimates are recognised in the period in which the estimate is revised if the revisions affect only that period, or in the period of the revision and future periods if the revision affects both current and future periods.
There are no critical judgements, apart from those involving estimates (which are dealt with separately below) , that the directors have made in the process of applying the Company’s accounting policies and that have the most significant effect on the amounts recognised in the financial statements.
The key assumptions concerning the future, and other key sources of estimation uncertainty at the balance sheet date, that have a significant risk of causing a material adjustment to the carrying amounts of assets and liabilities within the next financial year, are discussed below.
Impairment of investments in subsidiariesDetermining whether the Company’s investments in subsidiaries have been impaired requires judgement. In making these judgements, net assets of subsidiaries at the balance sheet date and Board-approved budgets for the next three years are taken into consideration. The carrying amount of the investments in subsidiaries at the balance sheet date was £462.9 million (2017: £462.9 million) with £nil (2017: £nil) of impairment losses recognised in 2018.
Retirement benefit obligations In accordance with IAS 19 Employee benefits, the Company has disclosed in note L the assumptions used in calculating the defined benefit obligations. In the calculation a number of assumptions around future salary increases, increase in pension benefits, mortality rates, inflation and discount rates have been made. Small changes in these assumptions can lead to significant changes to the overall scheme liabilities, as disclosed in note L. Judgement is also exercised in establishing the fair value of retirement benefit assets, most notably the valuation of the buy-in contract to insure some of the benefits of a subset of the pension membership of the Scheme provided by the insurer.
(B) PROFIT ON ORDINARY ACTIVITIES AFTER TAXATIONInterserve Plc reported a profit after taxation for the financial year ended 31 December 2018 of £15.2 million (2017: loss after taxation of £69.3 million) .
The auditors’ remuneration for audit services to the Company was £0.3 million (2017: £0.4 million).
(A) ACCOUNTING POLICIES CONTINUED
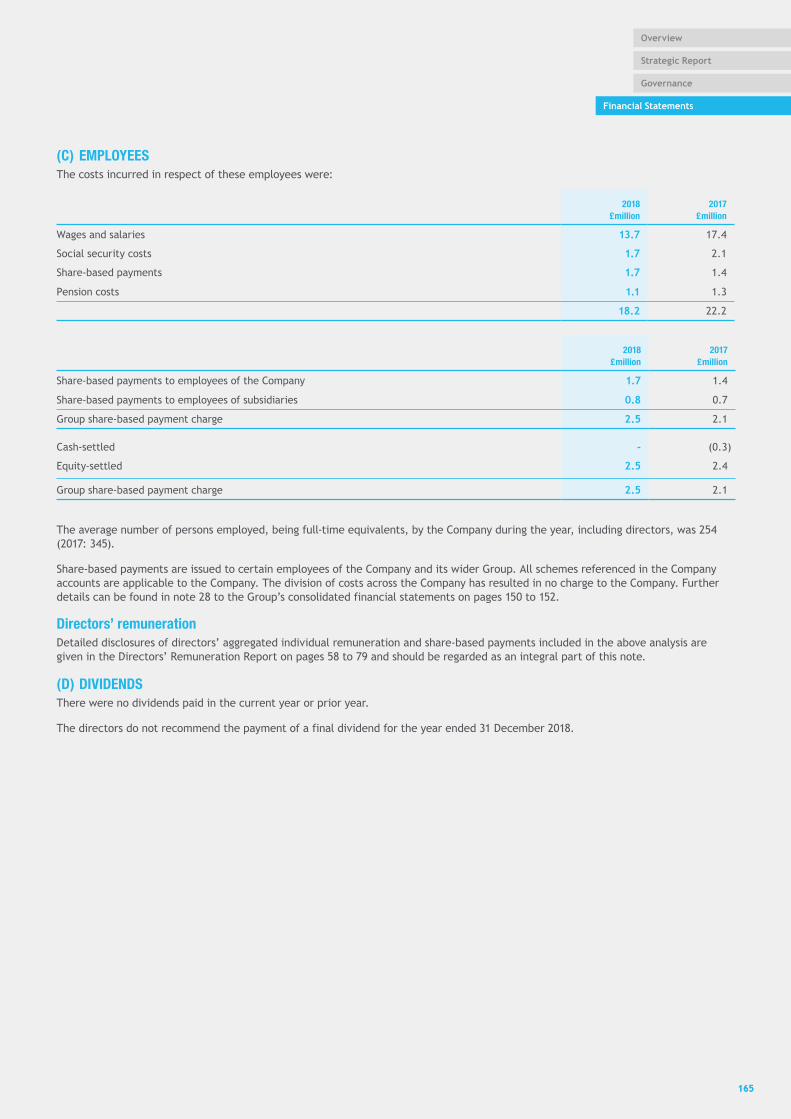
165165
Governance
Financial Statements
Strategic Report
Overview
(C) EMPLOYEESThe costs incurred in respect of these employees were:
2018£million
2017£million
Wages and salaries 13.7 17.4
Social security costs 1.7 2.1
Share-based payments 1.7 1.4
Pension costs 1.1 1.3
18.2 22.2
2018£million
2017£million
Share-based payments to employees of the Company 1.7 1.4
Share-based payments to employees of subsidiaries 0.8 0.7
Group share-based payment charge 2.5 2.1
Cash-settled - (0.3)
Equity-settled 2.5 2.4
Group share-based payment charge 2.5 2.1
The average number of persons employed, being full-time equivalents, by the Company during the year, including directors, was 254 (2017: 345) .
Share-based payments are issued to certain employees of the Company and its wider Group. All schemes referenced in the Company accounts are applicable to the Company. The division of costs across the Company has resulted in no charge to the Company. Further details can be found in note 28 to the Group’s consolidated financial statements on pages 150 to 152.
Directors’ remuneration Detailed disclosures of directors’ aggregated individual remuneration and share-based payments included in the above analysis are given in the Directors’ Remuneration Report on pages 58 to 79 and should be regarded as an integral part of this note.
(D) DIVIDENDSThere were no dividends paid in the current year or prior year.
The directors do not recommend the payment of a final dividend for the year ended 31 December 2018.

166166
FINANCIAL STATEMENTS
Notes to the Company financial statements continuedfor the year ended 31 December 2018
(E) TANGIBLE FIXED ASSETS(a) Movement during the year
Land and buildings£million
Computers£million
Other£million
Total£million
Cost
At 1 January 2018 12.6 4.7 1.0 18.3
Additions 2.4 0.7 0.1 3.2
Disposals (11.8) (3.0) (0.1) (14.9)
At 31 December 2018 3.2 2.4 1.0 6.6
Depreciation
At 1 January 2018 2.5 1.4 0.7 4.6
Charge in year 0.1 0.5 0.1 0.7
Disposals (1.0) - - (1.0)
At 31 December 2018 1.6 1.9 0.8 4.3
Net book value
At 31 December 2018 1.6 0.5 0.2 2.3
At 31 December 2017 10.1 3.3 0.3 13.7
(b) Land and buildings2018
£million2017
£million
Net book value of land and buildings
Freehold:
Land at cost 1.3 1.3
Buildings at cost less depreciation 0.2 0.2
1.5 1.5
Leaseholds over 50 years at cost less depreciation 0.1 8.6
1.6 10.1
(c) Operating leases
At the balance sheet date, the Company had outstanding commitments for future minimum lease payments under non-cancellable operating leases, which fall due as follows:
Land and buildings Other
2018 £million
2017 £million
2018 £million
2017 £million
Within one year 1.3 1.3 0.1 0.1
Between two to five years 3.6 3.7 – –
After five years 2.8 3.9 – – b
7.7 8.9 0.1 0.1b

167167
Governance
Financial Statements
Strategic Report
Overview
(F) INVESTMENTS IN SUBSIDIARIES£million
Cost
At 1 January 2018 477.4
Additions –
Disposals –
At 31 December 2018 477.4
Provisions
At 1 January 2018 14.5
Additions –
Disposals –
At 31 December 2018 14.5
Carrying value
At 31 December 2018 462.9
At 31 December 2017 462.9
The Company tests annually for impairment against investments held.
The Company prepares cash flow forecasts derived from the most recent financial budgets approved by management for the next three years, plus the net present value of cash flows extrapolated to perpetuity based on an estimated growth rate of 2% (2017: 2%) . This rate does not exceed the average long-term growth rate for the relevant markets. The rate used to discount the forecast cash flows is the Group weighted average cost of capital which varies per entity being reviewed, 11.8% to 12.8% (2017: 10.3% to 11.3%).
Details of the Company’s subsidiaries at 31 December 2018 are given on pages 175 to 180, which form part of these financial statements. Direct subsidiaries are annotated with a superscript note 2.

168168
FINANCIAL STATEMENTS
Notes to the Company financial statements continuedfor the year ended 31 December 2018
(G) INVESTMENTS IN ASSOCIATES£million
Cost
At 1 January 2018 2.7
Additions –
Disposals –
At 31 December 2018 2.7
Provisions
At 1 January 2018 –
Additions –
Disposals –
At 31 December 2018 –
Carrying value
At 31 December 2018 2.7
At 31 December 2017 2.7
The Company’s direct associate at 31 December 2018 is Al Binaa Contracting Company W.L.L. (incorporated in Qatar) . Both the proportion of ownership interest and proportion of voting power held is 49%. Of the total investment, £17,565 relates to investment in shares and the remainder is a loan.
(H) OTHER INVESTMENTS2018
£million2017
£million
Bonds – 0.3
(I) DEBTORS2018
£million2017
£million
Amounts falling due within one year:
Trade debtors 0.1 0.5
Amounts owed by Group undertakings 61.6 7.6
Corporation tax 6.9 0.9
Prepayments and accrued income 3.1 3.2 - (0.1)
71.7 12.2
Amounts falling due after more than one year:
Deferred taxation (note N) – 9.6
– 9.6

169169
Governance
Financial Statements
Strategic Report
Overview
(J) CREDITORS: AMOUNTS FALLING DUE WITHIN ONE YEAR2018
£million2017
£million
Trade creditors 1.3 2.2
Amounts owed to Group undertakings 25.6 99.7
Other taxation and social security 17.7 34.1
Other creditors 7.4 6.1
Accruals and deferred income 13.8 10.4
65.8 152.5
(K) CREDITORS: AMOUNTS FALLING DUE AFTER ONE YEAR2018
£million2017
£million
Other creditors 4.0 3.9
4.0 3.9
(L) RETIREMENT BENEFIT SCHEMESThe principal pension scheme the Company participates in and acts as sponsor for has been valued for the purposes of IAS 19 Employee benefits. The pension scheme valuation information has been updated by Lane Clark & Peacock LLP, qualified independent actuaries, to take account of the requirements of IAS 19 in order to assess the liabilities of the scheme as at 31 December 2018.
Actuarial gains and losses are recognised in full in the period in which they occur. As permitted by IAS 19, actuarial gains and losses are recognised outside profit and loss and presented in other comprehensive income. The liability recognised in the balance sheet represents the present value of the various defined benefit obligations, as reduced by the fair value of plan assets. The cost of providing benefits is determined using the Projected Unit Credit Method.
The Company contributes to a defined benefit pension scheme in the UK, the Interserve Pension Scheme, where benefits are generally related to service and final salary. The Interserve Pension Scheme comprises two segregated sections (referred to as the Interserve and Landmarc sections) , with assets and liabilities ring-fenced. The Company operates a defined contribution plan for new hires, with membership of the defined benefit arrangements only permitted when specific contract terms require defined benefit provision. Contributions to the defined contribution arrangements are in addition to those set out below and are charged directly to profit and loss.
The current funding target for the Company’s defined benefit scheme is to maintain assets equal to the value of the accrued benefits based on projected salaries (where relevant) . The regulatory framework in the UK requires the Trustees and the Company to agree upon the assumptions underlying the funding target, and then to agree upon the necessary contributions required to recover any deficit at the valuation date. There is a risk to the Company that adverse experience could lead to a requirement for the Company to make considerable contributions to recover any deficit.

170170
FINANCIAL STATEMENTS
Notes to the Company financial statements continuedfor the year ended 31 December 2018
The following table sets out the key IAS 19 assumptions used to assess the present value of the defined benefit obligation. The discount rate and inflation assumptions shown below are the single equivalent rates for the full-yield curves assumed for the Interserve section of the Interserve Pension Scheme, which represents 90% of the total defined benefit obligation. Alternative assumptions have been used for the less material sections where the specific nature of the schemes makes it appropriate to do so. The weighted average duration of the expected benefit payments for the schemes is around 15 years.
The amount included in the balance sheet arising from the Company’s obligations in respect of the pension scheme is as follows:
2018£million
2017£million
Present value of defined benefit obligation 757.7 967.2
Fair value of scheme’s assets (856.5) (928.7)
Net (asset) /liability in balance sheet (98.8) 38.5
The change in net liabilities recognised in the balance sheet is comprised as follows:
2018£million
2017£million
Opening net asset 38.5 39.5
Expense charged to profit and loss (66.9) 5.4
Amount recognised outside profit and loss (51.3) 13.4
Employer contributions (19.1) (19.8)
Closing net (asset) /liability (98.8) 38.5
Indicative change in defined benefit obligation
Sensitivity2018
£million2017
£million
Price inflation +0.5% pa +43 +58
Discount rate +0.5% pa -54 -76
Post-retirement mortality (expectancy of life in years) 1 year increase +27 +32
The sensitivities shown above reflect only the change in the assessed defined benefit obligation. In practice, any movement in assumptions is likely to be accompanied by a partially offsetting change in asset values, and the corresponding overall impact on the net liability/(asset) is therefore likely to be lower than the amounts above.
The amounts recognised in the profit and loss are as follows:
2018£million
2017£million
Employer’s part of current service cost 2.0 3.0
Net interest on the net pension liability/(asset) (0.5) 0.8
Administration costs 2.3 1.6
Past service cost/(credit) (70.7) -
Total (income) /expense recognised in the profit and loss (66.9) 5.4
The current service cost and administration costs are included within operating profit. The interest cost is included within financing costs.
(L) RETIREMENT BENEFIT SCHEMES CONTINUED

171171
Governance
Financial Statements
Strategic Report
Overview
The current allocation of the schemes’ assets is as follows:
2018 2017
Current allocation
Fair value £million
Current allocation
Fair value £million
Equities (quoted) 0% 1.0 28% 260.2
Alternative investments (primarily unquoted) 16% 140.2 19% 179.9
Liability driven investment (“LDI”) (unquoted) 44% 379.0 13% 124
Insurance policies (unquoted) 34% 288.2 34% 317.5
Infrastructure (unquoted) 5% 44.7 5% 44.2
Cash and other (primarily unquoted) 1% 3.4 1% 2.9
Total 100% 856.5 100% 928.7
Alternative investments include diversified growth funds, fund of hedge funds and emerging market multi-asset funds (primarily unquoted) .
The Trustee of the Interserve section of the Interserve Pension Scheme holds an insurance policy to protect the Company from certain risks associated with approximately 35% of that section’s defined benefit obligation. The policy aims to closely match the pension payments to the pensioner members who were above age 65 in July 2014. The policy is not an exact match for the benefits in certain areas, notably: pension increases if price inflation falls below 0%; differences between the increase in Consumer Prices Index and the Retail Prices Index; and the eligibility criteria for the dependants’ pensions. Due to the inexact nature of the match, the value of the asset (£288 million) can vary from the value of the corresponding defined benefit obligation (£246 million) , which is primarily due to different inflation measures being applicable to the benefits valued for the asset and liability (RPI and CPI respectively) . Included within these values, essentially, is circa £4 million of the defined benefit obligation which precisely matches the benefits in respect of certain dependants in receipt of pension.
Except for the element of the policy which precisely matches the benefits (around 1% of the total policy value) , the policy has been valued as the estimated replacement cost at the accounting date by the Company’s actuarial advisers, Lane, Clarke and Peacock, in accordance with the fair value requirements of IFRS 13. The small matching element has been valued at the same amount as the defined benefit obligation in respect of the matched benefits.
During 2016 the Interserve Pension Scheme invested in a bespoke pooled LDI fund. The LDI portfolio provides a broad 119% hedge of the Interserve section’s interest rate and inflation exposure not covered by the insurance policy above. The LDI manager invests in a combination of gilts and swaps, depending on the relative attractiveness of each instrument at each maturity.
The schemes have not directly invested in any of the Group’s other financial instruments nor in other assets or properties used by the Group.
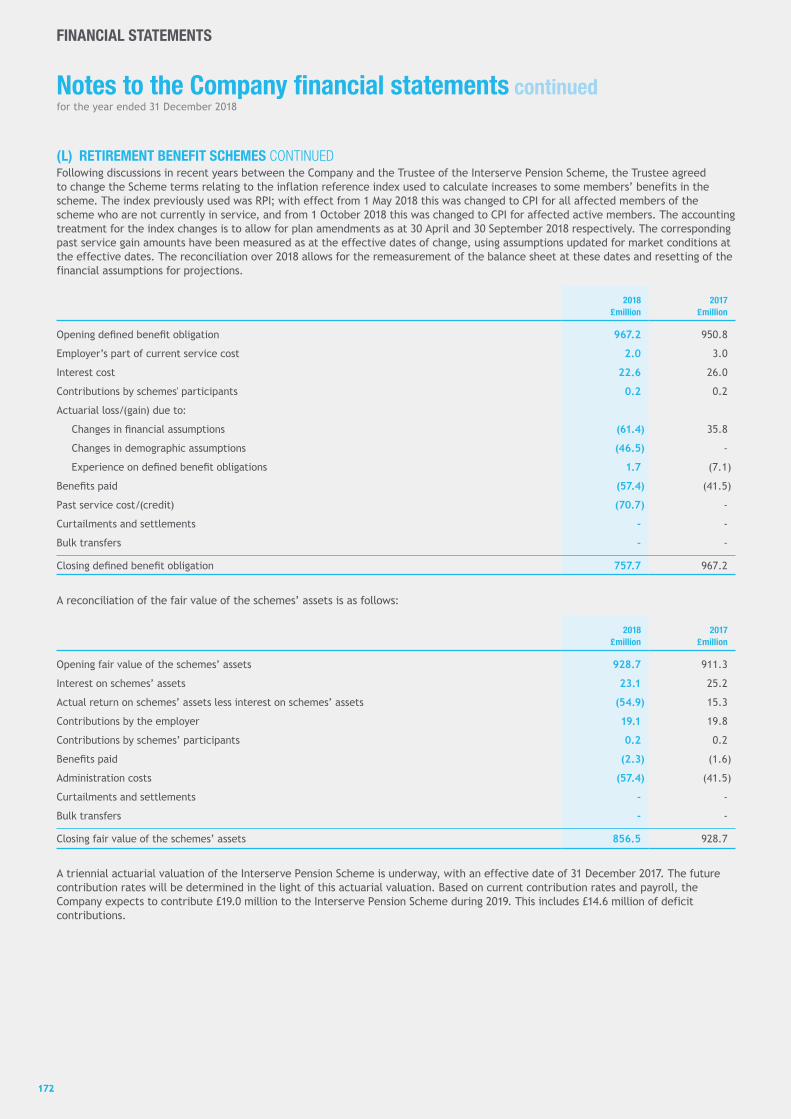
172172
FINANCIAL STATEMENTS
Notes to the Company financial statements continuedfor the year ended 31 December 2018
Following discussions in recent years between the Company and the Trustee of the Interserve Pension Scheme, the Trustee agreed to change the Scheme terms relating to the inflation reference index used to calculate increases to some members’ benefits in the scheme. The index previously used was RPI; with effect from 1 May 2018 this was changed to CPI for all affected members of the scheme who are not currently in service, and from 1 October 2018 this was changed to CPI for affected active members. The accounting treatment for the index changes is to allow for plan amendments as at 30 April and 30 September 2018 respectively. The corresponding past service gain amounts have been measured as at the effective dates of change, using assumptions updated for market conditions at the effective dates. The reconciliation over 2018 allows for the remeasurement of the balance sheet at these dates and resetting of the financial assumptions for projections.
2018£million
2017£million
Opening defined benefit obligation 967.2 950.8
Employer’s part of current service cost 2.0 3.0
Interest cost 22.6 26.0
Contributions by schemes' participants 0.2 0.2
Actuarial loss/(gain) due to:
Changes in financial assumptions (61.4) 35.8
Changes in demographic assumptions (46.5) -
Experience on defined benefit obligations 1.7 (7.1)
Benefits paid (57.4) (41.5)
Past service cost/(credit) (70.7) -
Curtailments and settlements - -
Bulk transfers - -
Closing defined benefit obligation 757.7 967.2
A reconciliation of the fair value of the schemes’ assets is as follows:
2018£million
2017£million
Opening fair value of the schemes’ assets 928.7 911.3
Interest on schemes’ assets 23.1 25.2
Actual return on schemes’ assets less interest on schemes’ assets (54.9) 15.3
Contributions by the employer 19.1 19.8
Contributions by schemes’ participants 0.2 0.2
Benefits paid (2.3) (1.6)
Administration costs (57.4) (41.5)
Curtailments and settlements - -
Bulk transfers - -
Closing fair value of the schemes’ assets 856.5 928.7
A triennial actuarial valuation of the Interserve Pension Scheme is underway, with an effective date of 31 December 2017. The future contribution rates will be determined in the light of this actuarial valuation. Based on current contribution rates and payroll, the Company expects to contribute £19.0 million to the Interserve Pension Scheme during 2019. This includes £14.6 million of deficit contributions.
(L) RETIREMENT BENEFIT SCHEMES CONTINUED

173173
Governance
Financial Statements
Strategic Report
Overview
(M) PROVISIONS FOR LIABILITIES2018
£million2017
£million
Insurance Deferred Tax Other Total Insurance Deferred Tax Other Total
At 1 January (17.3) 9.6 (16.3) (24.0) (15.9) - - (15.9)
Charged to the profit and loss account (1.4) (23.4) (0.5) (25.3) (1.4) - (16.3) (17.7)
Utilisation of provision - - 4.2 4.2 - - - –
At 31 December (18.7) (13.8) (12.6) (45.1) (17.3) - (16.3) (33.6)
Insurance provisions are made for claim events that have been incurred, but not reported based on claims history as a guide to best estimate the level of provision. The timing and outflow of these provisions will depend on when claims are settled. The Company aims to close out old insurance years on a regular basis if favourable pricing can be obtained from the market in order to avoid holding on to unnecessary provisions.
Other includes dilapidation and onerous lease costs for exiting a number of properties.
(N) DEFERRED TAXATION ASSET/(LIABILITY)Accelerated
tax depreciation
£million
Retirementbenefit
obligation£million
Share‑based payments
£millionOther
£millionTotal
£million
At 1 January 2017 0.5 6.7 0.1 0.2 7.5
Charge/(credit) to the profit and loss 2.1 0.9 (0.1) 0.3 3.2
Charge to other comprehensive income - (1.1) – – (1.1)
At 1 January 2018 2.6 6.5 0.0 0.5 9.6
Charge/(credit) to the profit and loss 0.1 (11.3) – (0.2) (11.4)
Charge to other comprehensive income - (12.0) – – (12.0)
At 31 December 2018 2.7 (16.8) – 0.3 (13.8)
2018£million
2017£million
Deferred tax liabilities (note M) (13.8) –
Deferred tax assets (note I) – 9.6
(13.8) 9.6
Deferred tax is calculated at 17% (2017: 17%) . A deferred tax rate of 17% has been used as the Company expects the value to predominantly reverse after April 2020 at which point the rate will be 17%.
(O) SHARE CAPITAL2018
£million2017
£million
Authorised
Ordinary shares of 0.1p each and deferred shares of 9.9p each (2017: ordinary shares of 10p each) Unlimited Unlimited
Allotted, called-up and fully paid
Ordinary shares of 0.1p each and deferred shares of 9.9p each (2017: ordinary shares of 10p each)
At 1 January 14.6 14.6
Issued on exercise of warrants 0.4 –
At 31 December 15.0 14.6
No share awards were issued during the year as indicated in note 26 to the Company’s consolidated financial statements.
Following approval by shareholders at the AGM on 12 June 2018, our issued share capital of 149,719,938 ordinary 10p shares has been sub-divided into 149,719,938 ordinary shares of 0.1p and 149,719,938 deferred shares of 9.9p.

174174
FINANCIAL STATEMENTS
Notes to the Company financial statements continuedfor the year ended 31 December 2018
This sub-division was required to enable the exercise price of the share warrants to be reduced to less than 10p if necessary as a result of certain dilutive events. The economic and voting rights of the ordinary shares remain the same. The deferred shares have no value (economic or otherwise) and have been created to enable the Company to reduce the nominal value of the ordinary shares without going through a process that would require the approval of the Court. The deferred shares were issued to all persons on the Company’s register of members as at 12 June 2018 on the basis of one deferred share of 9.9p for each ordinary share held. The deferred shares are not transferable, do not carry any voting or dividend rights and are not expected to have any economic value.
WarrantsAs disclosed in our 2017 Annual Report, the Company issued 36,428,530 warrants during the period, for consideration of £35.3 million taken in the form of a discount adjustment to recognise the fair value of the debt issued, to the providers of the new term loan and bonding facilities to buy ordinary shares at 10p per share. The warrants are exercisable from the date of issue through the duration of the funding arrangements for which they were consideration (potentially up to September 2021) . 4,005,818 of these warrants were exercised during the period for cash consideration of £0.4 million and the equivalent number of new shares issued to the holders.
(P) CONTINGENT LIABILITIESAt 31 December 2018, there were guarantees given in the ordinary course of business of the Company. The Company has given guarantees covering bank overdrafts in its subsidiary and associated undertakings. At 31 December 2018, these amounted to £4.3 million (2017: £4.3 million) . The Company has provided a guarantee to the Interserve Pension Scheme for future contributions due from subsidiary undertakings amounting to £250.0 million (2017: £250.0 million) in respect of the past funding deficit. In addition, contributions will also be payable in respect of future service benefits.
The Company has given guarantees in respect of borrowing and guarantee facilities made available to joint-venture and associated undertakings for sums not exceeding £20.9 million (2017: £18.8 million) in respect of borrowings and £205.2 million (2017: £187.5 million) in respect of guarantees. At 31 December 2018, £0.8 million (2017: £1.7 million) had been utilised in borrowings and £99.9 million (2017: £108.1 million) in guarantees.
(O) SHARE CAPITAL CONTINUED

175
Governance
Financial Statements
Strategic Report
Overview
In accordance with section 409 of the Companies Act 2006, a full list of the related undertakings of Interserve Plc, as at 31 December 2018, is disclosed below. Unless otherwise stated:(a) the principal operations of each related undertaking are conducted in its country of incorporation or registration;(b) the shareholding of each related undertaking relates to ordinary, common or unclassified share capital and is equivalent to the percentage of
voting rights held by the Group;(c) the equity capital of each related undertaking is held through an intermediate holding company rather than Interserve Plc; (d) the results of each related undertaking are consolidated within these financial statements; and(e) the consolidated financial statements include the results for the twelve months to 31 December even if the accounting reference date is different.
Subsidiary undertakings Principal activityGroup
holding
Incorporated in the United Kingdom
England and Wales: Interserve House, Ruscombe Park, Twyford, Reading, Berkshire RG10 9JUAdvantage Healthcare Ltd Dormant company 100.0%Advantage Healthcare Nursing and Care Ltd Dormant company 100.0%Advantage Healthcare Payroll Ltd Dormant company 100.0%Advantage Healthcare (QHRS) Ltd Dormant company 100.0%Advantage Healthcare (QHS) Ltd Dormant company 100.0%Bandt Holdings Ltd Holding company 100.0%Bandt P J H Ltd Dormant company 100.0%Bandt Properties Ltd Property management 100.0%Broomco (4110) Ltd1 Dormant company 100.0%ESG Holdings Ltd Holding company 100.0%ESG Intermediate Holdings Ltd Holding company 100.0%How Engineering Services Northern Ltd Dormant company 100.0%How Group Ltd Holding company 100.0%How Group Trust Company Ltd Corporate trustee of employee benefit trust 100.0%How Investments Ltd Dormant company 100.0%ILE Corporate Services Ltd Central support to fellow subsidiary companies 100.0%Interserve Building Ltd Dormant company 100.0%Interserve Developments No.1 Ltd Holding company 100.0%Interserve Developments No.2 Ltd Holding company 100.0%Interserve Developments No.3 Ltd Property development management 100.0%Interserve Developments No.4 Ltd Holding company 100.0%Interserve Developments No.6 Ltd Holding company 100.0%Interserve Energy Renewable Solutions Ltd Dormant company 100.0%Interserve Engineering Ltd Holding company 100.0%Interserve Finance Ltd Intra-group financing company 100.0%Interserve Finance (Switzerland) Holdings Ltd Holding company 100.0%Interserve Group Holdings Ltd2 Holding company 100.0%Interserve Group Holdings (Qatar) Ltd Dormant company 100.0%Interserve Healthcare Holdings Ltd3 Holding company 100.0%Interserve Healthcare Ltd Healthcare services 100.0%Interserve Holdings Ltd Holding company 100.0%Interserve International Ltd Holding company 100.0%Interserve Investments Ltd Operational and financial services to PFI/PPP projects 100.0%Interserve Learning & Employment (Services) Ltd Vocational training services 100.0%Interserve Service Futures Holdings Ltd Holding company 100.0%Interserve Service Futures Ltd Holding company 100.0%Interserve Strategic Partnerships Ltd Dormant company 100.0%Interserve Support Services Ltd Dormant company 100.0%Interserve Trustees Ltd1 2 4 Pension trustee company 33.0%Interserve Working Futures Ltd Welfare-to-work services 100.0%Kwikform Holdings Ltd5 Holding company 100.0%Kwikform UK Ltd2 Dormant company 100.0%Modus FM Ltd1 22 Dormant company 100.0%Montana BidCo Ltd23 Non-trading company 100.0%Montana FinCo Ltd23 Non-trading company 100.0%Montana HoldCo Ltd23 Holding company 100.0%Montpellier Health Care Ltd Dormant company 100.0%Orient Gold Ltd Vocational training services 100.0%Professional Healthcare Services Ltd Dormant company 100.0%Purple Futures LLP6 Management of five Community Rehabilitation Companies 80.0%RMD Kwikform Holdings Ltd Holding company 100.0%R M Douglas Construction Ltd Dormant company 100.0%Ruscombe Ltd2 Dormant company 100.0%Sencia Ltd5 Training and employment services 100.0%Strand Nurses Bureau Ltd Dormant company 100.0%T D Construction Ltd5 Dormant company 100.0%The Cheshire and Greater Manchester Community Rehabilitation Company Ltd Probation and rehabilitation services 80.0%The Courtyard (Bristol) Management Company Ltd2 7 Dormant company 33.3%The Hampshire and Isle of Wight Rehabilitation Company Ltd Probation and rehabilitation services 80.0%The Humberside, Lincolnshire and North Yorkshire Community Rehabilitation Company Ltd
Probation and rehabilitation services 80.0%
The Merseyside Community Rehabilitation Company Ltd Probation and rehabilitation services 80.0%The West Yorkshire Community Rehabilitation Company Ltd Probation and rehabilitation services 80.0%Tilbury Developments Ltd2 5 Dormant company 100.0%Tilbury Douglas Construction Ltd Dormant company 100.0%Tilbury Douglas Projects Ltd Property rental 100.0%
Related undertakings

176
Related undertakings continued
FINANCIAL STATEMENTS
Subsidiary undertakings Principal activityGroup
holding
Tilbury Estates Ltd2 Dormant company 100.0%Transcoast Ltd2 Dormant company 100.0%Triangle Training Holdings Ltd Holding company 100.0%Triangle Training Ltd Holding company 100.0%West’s Group International Ltd5 Holding company 100.0%
England and Wales: Capital Tower, 91 Waterloo Road, London SE1 8RTAxiam (UK) Ltd Dormant company 100.0%Baker Blythe & Company Ltd Dormant company 100.0%Bateman’s Cleaning Services Ltd Dormant company 100.0%Benchmark Carpet Care Ltd Dormant company 100.0%Broadreach Group Ltd5 Holding company 100.0%Building & Property (Holdings) Ltd Holding company 100.0%Building & Property Trustees Ltd Dormant company 100.0%Central Window Cleaning Company Ltd Dormant company 100.0%Clough Williams Power Ltd1 Dormant company 100.0%Euro AS Ltd Dormant company 100.0%Fincham Industrial Services Ltd8 Dormant company 100.0%First Security Group Ltd9 Dormant company 100.0%Global Protect Ltd Dormant company 100.0%Hi-Tech Cleaning Solutions Ltd Dormant company 100.0%How Engineering Services Ltd Dormant company 100.0%Industrial Services International Ltd Dormant company 100.0%Insitu Cleaning Company Ltd Contract cleaning 100.0%Interserve Building Services (UK) Ltd Dormant company 100.0%Interserve Catering Services Ltd1 Catering services 100.0%Interserve (Defence) Ltd Support services to defence sector 100.0%Interserve Environmental Services Ltd Asbestos services 100.0%Interserve (Facilities Management) Ltd Facilities management services 100.0%Interserve (Facilities Services) Ltd Non-trading company 100.0%Interserve (Facilities Services-Slough) Ltd8 Non-trading company 100.0%Interserve Fire Services Ltd Dormant company 100.0%Interservefm (Holdings) Ltd Holding company 100.0%Interservefm Ltd10 Holding company 100.0%Interserve FS (UK) Ltd Contract cleaning and related services 100.0%Interserve Hospital Services Ltd Dormant company 100.0%Interserve Integrated Services Ltd Support services 100.0%Interserve Project Services Ltd International contracting services and supplies 100.0%Interserve Security (Fire & Electronics) Ltd Dormant company 100.0%Interserve Security (First) Ltd11 Security manpower and associated support services 100.0%Interserve Security (Knightsbridge) Ltd Manned guarding security services 100.0%Interserve Security Ltd Dormant company 100.0%Interserve Specialist Services (Holdings) Ltd Holding company 100.0%Interserve Technical Services Ltd Mechanical and electrical engineering services 100.0%KGL Business Services Ltd Dormant company 100.0%Knightsbridge Guarding Holdings Ltd9 Holding company 100.0%Knightsbridge Guarding Ltd Dormant company 100.0%Lancaster Employment Business Ltd Dormant company 100.0%Lancaster Office Cleaning Company Ltd Dormant company 100.0%Lancaster Payroll Company Ltd Dormant company 100.0%Landmarc Solutions Ltd Share plan trustee 100.0%Landmarc Support Services Ltd12 Management/maintenance services for MoD Army Training Estate 51.0%MacLellan Group Ltd Holding company 100.0%MacLellan Integrated Services Ltd Dormant company 100.0%MacLellan International Airport Services Ltd Dormant company 100.0%MacLellan International Ltd Facilities management services 100.0%MacLellan Ltd Dormant company 100.0%MacLellan Management Services Ltd Personnel and management services 100.0%MSS Facilities Management Ltd Dormant company 100.0%Perception UK LLP6 Dormant company 100.0%Phoenix Fire Services Ltd Non-trading company 100.0%Phonotas Services Ltd Dormant company 100.0%R & D Holdings Ltd Dormant company 100.0%Ramoneur Cleaning and Support Services Ltd Dormant company 100.0%Retail Cleaning Services Ltd1 Dormant company 100.0%SSD UK Ltd Specialist window cleaning 100.0%St James Cleaning and Support Services Ltd Dormant company 100.0%TASS (Europe) Ltd Dormant company 100.0%The Ramoneur Company Ltd Dormant company 100.0%THK Insulation Ltd Dormant company 100.0%Tilbury (City) Ltd2 Dormant company 100.0%Unique Cleaning Services Ltd Dormant company 100.0%
England and Wales: Ingenuity House, Elmdon Trading Estate, Bickenhill Lane, Birmingham B37 7HQCI-ONE Construction Ltd Dormant company 100.0%Interserve Construction Ltd Sustainable solutions for building/infrastructure projects 100.0%Interserve Engineering Services Ltd Mechanical, electrical and engineering services 100.0%Interserve Piling Ltd Non-trading company 100.0%Interserve Rail Ltd2 5 Dormant company 100.0%Paragon Management UK Ltd Non-trading company 100.0%Tilbury Water Treatment Ltd Dormant company 100.0%Whittle Contracts Ltd2 Dormant company 100.0%
continued

177
Governance
Financial Statements
Strategic Report
Overview
Subsidiary undertakings Principal activityGroup
holding
England and Wales: Brickyard Road, Aldridge, Walsall, West Midlands WS9 8BWRapid Metal Developments Ltd Dormant company 100.0%RMD Kwikform Ltd Equipment hire and sales 100.0%
Scotland: Interserve House, Almondview Business Park, Livingston, West Lothian EH54 6SFBandt Ltd Holding company 100.0%Tilbury Homes (Glasgow) Ltd2 Dormant company 100.0%Tilbury Homes (Scotland) Ltd2 Dormant company 100.0%
Incorporated in the Rest of Europe
Channel Islands: Mill Court, La Charroterie, St Peter Port, Guernsey GY1 4ETInterserve Insurance Company Ltd Insurance 100.0%
Poland: Plac Konstytucji 6/55, 01-553 WarszawaTilbury Douglas Polska Sp zoo In liquidation 100.0%
Republic of Ireland: Ballyboggan Road, Finglas, Dublin 11, D11 AKW1Interserve Industrial Services (Ireland) Ltd Dormant company 100.0%RMD Kwikform Ireland Ltd Equipment hire and sales 100.0%
Spain: Calle San Miguel 25, Bajo 1, Azuqueca de Henares, Guadalajara 19200Interserve Centro Especial de Empleo, SL Support services for integration of disabled people into
cleaning contracts100.0%
Spain: Calle Juan Ignacio Luca de Tena 8, Madrid 28027Interserve Facilities Services, SA Holding company 100.0%Translimp Contract Services, SA Support services for transport sector 100.0%
Spain: Avenida de Europa, 19 – Ed 2 – 2o D, Pozuelo de Alarcon, Madrid 28224Tilbury Ibérica, SA2 Holding company 100.0%
Switzerland: Rue de la Serre 4, 2000 NeuchatelInterserve Finance (Switzerland) Sàrl, en liquidation In liquidation 100.0%
Incorporated in the Middle East & Africa
India: 407-A6, Ansal Chamber – II, Bhikaji Cama Place, New Delhi 110066RMD Kwikform India Private Ltd Equipment hire and sales 100.0%
Kingdom of Bahrain: Flat 34, Building 5, Road 3001, Block 330, ManamaRMD Kwikform Almoayed Bahrain WLL13 Equipment hire and sales 49.0%
Kingdom of Saudi Arabia: 7536, Unit No 39, AR Riyadh 12472-4304ESG (Saudi Arabia) LLC Education, training and employment services 100.0%
Kingdom of Saudi Arabia: PO Box 26982, Riyadh 11595Interserve Saudi Arabia LLC Building maintenance and cleaning 100.0%
Kingdom of Saudi Arabia: Office No.4A, Gulf Star Building, near Hotel Meridien, Prince Turkey Road, Al Khobar 31952RMD Kwikform Saudi Arabia LLC Equipment hire 74.9%
Mauritius: 2nd Floor, The Axis, 26 Cybercity, Ebene 72201Interserve International Equipment Ltd Rental of plant and machinery 85.0%
Republic of South Africa: 52 Jakaranda Street, Plot 22, Hennopspark, CenturionRMD Kwikform (South Africa) (Proprietary) Ltd Equipment hire and sales 100.0%
State of Qatar: Building No.148, Zone No.40, Al Muntazah Street (next to Qatar Chamber of Commerce), PO Box 405, DohaRMD Kwikform (Al Maha) Qatar WLL14 Equipment hire and sales 49.0%
Sultanate of Oman: PO Box 1639, Hay Al-Mina, Muscat, Postal Code 114Interserve Oman LLC15 Facilities management 70.0%
Sultanate of Oman: Post Box 152, Muscat, Postal Code 103RMD Kwikform Oman LLC Equipment hire and sales 70.0%
Sultanate of Oman: PO Box 142, Muscat, Postal Code 100The Oman Construction Company LLC16 Transport and maintenance services to oil and gas industry 70.0%
United Arab Emirates: PO Box 7604, Plot M10, Musaffah Industrial, Oil Services Area, Sector 10, MW2, Musaffah, Abu DhabiAdyard Abu Dhabi LLC17 Engineering, procurement and construction works and
maintenance services for oil and gas industry49.0%
United Arab Emirates: No.104, Arjan Emirates Real Estate – Branch 1, PO Box 129354, Al Hilal Building, Al Falah Road, Abu DhabiLandmarc Gulf Consultancy Management LLC18 Administrative consultancy 25.0%
United Arab Emirates: Office 102-103 Khansaheb Building, Jamal Abdul Nasser Street, Al Majaz, SharjahRMD Kwikform Middle East LLC19 Equipment hire and sales 49.0%
United Arab Emirates: Office No.W705, Level 7, West Tower, Trade Centre Towers, Abu DhabiRMD Kwikform Oil & Gas Services LLC20 Equipment hire and sales 49.0%
Incorporated in Australasia
Australia: PO Box 169, Melrose Park, South Australia 5039Rapid Metal Developments (Australia) Proprietary Ltd Equipment hire and sales 100.0%
New Zealand: PO Box 22.316, 101 Station Road, Otahuhu, Auckland 1640Rapid Metal Developments (NZ) Ltd Equipment hire and sales 100.0%
Incorporated in the Far East
Hong Kong: Suite 3806, Central Plaza, 18 Harbour Road, WanchaiRMD Kwikform Hong Kong Ltd2 Equipment hire and sales 100.0%
Republic of Indonesia: 2nd Floor, Suite 202B, Wisma Pondok Indah, Jl Sultan Iskandar Muda V-TA, Pondok Indah, JakartaPT Rapid Metal Development Indonesia Non-trading company 100.0%
Republic of the Philippines: Unit 2406-09 Raffles Corporate Center, F.Ortigas Jr. Ave., Ortigas Center, Pasig City, Metro ManilaRMD Kwikform Philippines, Inc2 Equipment hire and sales 100.0%
Republic of Singapore: 77 Robinson Road, #13-00 Robinson 77, Singapore 068896RMD Kwikform Singapore Pte Ltd Non-trading company 100.0%
continued

178
Related undertakings continued
FINANCIAL STATEMENTS
Subsidiary undertakings Principal activityGroup
holding
Incorporated in the Americas
Bermuda: PO Box HM 1022, Clarendon House, 2 Church Street, Hamilton, HM11Interserve Engineering & Construction (UAE) Ltd Oil-field maintenance, fabrication and construction services 100.0%
Canada: Suite 1001, 275 Slater Street, Ottawa, ON, K1P5H9Interserve Canada Ltd21 In liquidation 100.0%
Cayman Islands: 190 Elgin Avenue, George Town, Grand Cayman KY1-9005Interserve Engineering & Construction Ltd Holding company 100.0%
Guam: Suite 101, Orlean Pacific Plaza, 865 South Marine Corps Drive, Tamuning 96913RMD Kwikform Guam, LLC Equipment hire and sales 100.0%
Republic of Chile: La Estera 811, Valle Grande, Lampa, Santiago 9390433RMD Kwikform Chile SA Equipment hire and sales 100.0%
Republic of Colombia: Calle 98, No 18-71 of 805, BogotaRMD Kwikform Colombia SAS Non-trading company 100.0%
Republic of Peru: Calle Los Zorzales No.160, Distrito de San Isidro, LimaRMD Kwikform Peru SAC Equipment hire and sales 100.0%
United States of America: 251 Little Falls Drive, Wilmington, DE 19808RMD Kwikform North America Holdings Inc Holding company 100.0%RMD Kwikform North America Inc Equipment hire and sales 100.0%
Notes - subsidiary undertakings 1 Ownership held in ordinary A and ordinary B shares. 2 Shareholding directly held by Interserve Plc. 3 Ownership held in ordinary A, ordinary B, preference A, preference B and deferred shares. 4 The Group has the right to appoint the majority of the directors of Interserve Trustees Ltd by virtue of provisions contained in its Articles of Association and
is therefore deemed to be a subsidiary undertaking. 5 Ownership held in ordinary and preference shares. 6 No share capital. 7 The Group exercises dominant influence and control over The Courtyard (Bristol) Management Company Ltd by virtue of provisions contained in its Articles
of Association. It is therefore consolidated in the Group financial statements as a wholly-owned subsidiary undertaking. Ownership is held in ordinary and developer’s shares.
8 Ownership held in ordinary and deferred shares. 9 Ownership held in ordinary and ordinary A shares.10 Ownership held in ordinary, redeemable ordinary and deferred shares.11 Ownership held in ordinary, deferred A and deferred B shares.12 Ownership held in ordinary A and ordinary C shares.13 The Group has the right to appoint and remove the Board of Managers and therefore exercises dominant influence and control over RMD Kwikform Almoayed
Bahrain LLC. It is therefore consolidated in the Group financial statements as a wholly-owned subsidiary undertaking.14 The Group has the right to appoint and remove the General Manager and therefore exercises dominant influence and control over RMD Kwikform (Al Maha)
Qatar WLL. It is therefore consolidated in the Group financial statements as a wholly-owned subsidiary undertaking. 15 The Group has a 70% equity shareholding in Interserve Oman LLC. It is consolidated in the Group financial statements as an 85%-owned subsidiary undertaking
on the basis of contractual arrangements.16 The Group has a 70% equity shareholding in The Oman Construction Company LLC. It is consolidated in the Group financial statements as an 85%-owned
subsidiary undertaking on the basis of contractual arrangements.17 The Group exercises dominant influence and control over Adyard Abu Dhabi LLC by virtue of provisions contained in its Memorandum of Association. It is
therefore consolidated in the Group financial statements as a wholly-owned subsidiary undertaking.18 The Group has the right to appoint the majority of the directors of Landmarc Gulf Consultancy Management LLC by virtue of provisions contained in its
Memorandum of Association. It is therefore consolidated in the Group financial statements as a 51%-owned subsidiary undertaking.19 The Group has the right to appoint and remove the Manager and therefore exercises dominant influence and control over RMD Kwikform Middle East LLC. It is
therefore consolidated in the Group financial statements as a wholly-owned subsidiary undertaking. 20 The Group has the right to appoint and remove the Manager and therefore exercises dominant influence and control over RMD Kwikform Oil & Gas Services
LLC. It is therefore consolidated in the Group financial statements as a wholly-owned subsidiary undertaking. 21 Dissolved post-year-end.22 Name changed to Interserve Group Limited post-year-end.23 Incorporated post-year-end.
Associated undertakings1 Principal activityGroup
holding
Accounted for as Associates within the financial statements Incorporated in the Middle East & Africa
Kingdom of Saudi Arabia: Alsroor Building, Kilo 1, Mecca Road, JeddahAl-Esayi Saif Noman Douglas Ltd In liquidation 49.0%
Kingdom of Saudi Arabia: PO Box 245555, Riyadh 11312Interserve Rezayat Company LLC Building operation and maintenance, mechanical and
industrial works50.0%
State of Qatar: PO Box 1811, Building No.334, C Ring Road, Street 230, Zone 24, DohaAl Binaa Contracting Company WLL2 Contracting and investment 49.0%
State of Qatar: PO Box 3886, Building No.309, 230 C Ring Road, Area/Zone 40, DohaGulf Contracting Co WLL Civil engineering, building and maintenance services 49.0%
State of Qatar: Zone 39, Al Saad Street No.340, Building 55 United Tower, 2nd Floor, PO Box 24176, DohaHow United Services WLL Mechanical, engineering and plumbing services 49.0%
continued

179
Governance
Financial Statements
Strategic Report
Overview
Associated undertakings1 Principal activityGroup
holding
State of Qatar: PO Box 20459, DohaMadina Group WLL Mechanical engineering fabrication contractor 49.0%Qatar Inspection Services WLL Non-destructive testing and inspection services 49.0%Severn Glocon (Qatar) WLL Supply of valves and valve maintenance services 49.0%
State of Qatar: PO Box 23651, DohaQatar International Safety Centre WLL Safety training for oil, gas and petrochemical industries 49.0%
State of Qatar: PO Box 22715, DohaUnited Industrial Services WLL Holding company 49.0%
State of Qatar: Zone 40, New Salata, Building No.309, C Ring Road, DohaDarwish-Interserve Facility Management WLL Facilities management services 49.0%
Sultanate of Oman: PO Box 1639, Hay Al-Mina, Muscat, Postal Code 114Douglas OHI LLC Civil engineering and building 49.0%
Sultanate of Oman: PO Box 375, Muscat, Postal Code 114, JibrooOccupational Training Institute LLC Health & safety, environment and educational services 49.0%
United Arab Emirates: PO Box 2716, DubaiKhansaheb Civil Engineering LLC Civil engineering, building and maintenance services 45.0%Khansaheb Group LLC Facilities management and maintenance services 49.0%
United Arab Emirates: PO Box 259, Abu DhabiKhansaheb Hussain LLC Civil engineering, building and maintenance services 49.0%
Accounted for as Joint Ventures within the financial statements Incorporated in the United Kingdom
England and Wales: Interserve House, Ruscombe Park, Twyford, Reading, Berkshire RG10 9JUHarmondsworth Detention Services Ltd Dormant company 49.0%Rehab Jobfit LLP3 Employment-related support services 49.0%
England and Wales: Capital Tower, 91 Waterloo Road, London SE1 8RTAxiam Ltd Dormant company 50.0%PriDE (SERP) Ltd4 MoD estate management services 50.0%Sussex Estates and Facilities LLP3 Facilities management services 35.0%
England and Wales: 8 White Oak Square, London Road, Swanley, Kent BR8 7AGAlder Hey Holdco 1 Ltd Holding company 20.0%Alder Hey Holdco 2 Ltd Holding company 20.0%Alder Hey Holdco 3 Ltd Holding company 20.0%Alder Hey (Special Purpose Vehicle) Ltd Hospital construction/operation 20.0%
England and Wales: 55 Baker Street, London W1U 8EWHLR Schools Holding Ltd Holding company 45.0%HLR Schools Ltd School/college construction/operation 45.0%
England and Wales: 5 The Triangle, Wildwood Drive, Worcester WR5 2QXDCH Estates Partnership LLP3 6 Hospital construction/operation 25.0%DCH Estates Project Co Ltd6 Hospital construction/operation 25.0%Interserve Prime Solutions Ltd4 6 Holding company 50.0%Partnering Solutions (Dorset) Ltd6 Hospital construction/operation 50.0%Partnering Solutions (Southampton) Ltd6 Hospital construction/operation 50.0%Partnering Solutions (Yeovil) Ltd6 Hospital construction/operation 50.0%Southampton CEDP LLP3 6 Hospital construction/operation 25.0%Southampton CEDP Project Co Ltd6 Hospital construction/operation 25.0%Yeovil Estates Partnership LLP3 6 Hospital construction/operation 25.0%
England and Wales: Suite 3a, Queens Insurance Building, Dale Street, Liverpool L2 4TZPublic Services Lab LLP3 Public services lab to support charities, community groups
and social enterprises35.0%
England and Wales: Dunedin House, Auckland Park, Mount Farm, Milton Keynes, Buckinghamshire MK1 1BUResource Recovery Solutions (Derbyshire) Holdings Ltd5 Holding company 50.0%Resource Recovery Solutions (Derbyshire) Ltd Construction/operation of new waste treatment facility 50.0%
Scotland: Interserve House, Almondview Business Park, Almondview, Livingston EH54 6SFEdinburgh Haymarket Developments Ltd5 Non-trading company 50.0%Seacole National Centre (Holding) Ltd5 Holding company 50.0%
Seacole National Centre Ltd Construction/maintenance of new National Centre for Scottish National Blood Transfusion Service
49.5%
Notes - associated undertakings1 Accounted for using the equity method of consolidation.2 Shareholding directly held by Interserve Plc.3 No share capital.4 Ownership held in ordinary A shares.5 Ownership held in ordinary B shares.6 Sold post-year-end.
continued
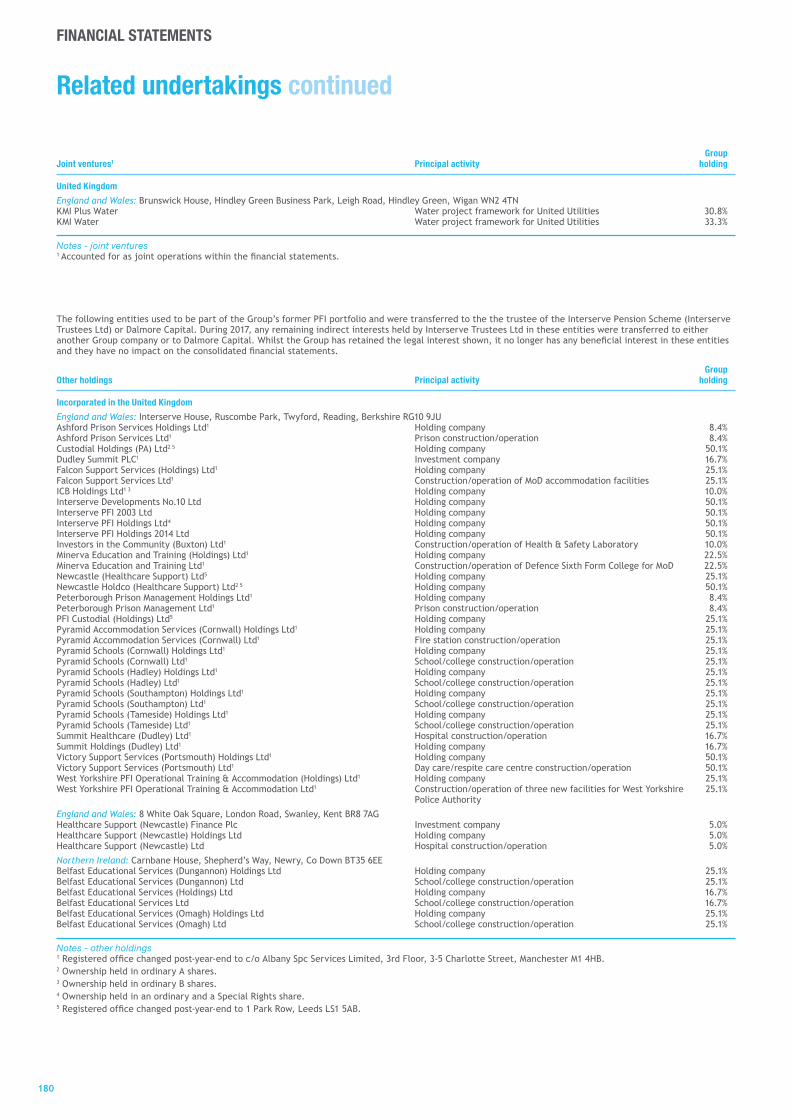
180
Related undertakings continued
FINANCIAL STATEMENTS
Joint ventures1 Principal activityGroup
holding
United Kingdom
England and Wales: Brunswick House, Hindley Green Business Park, Leigh Road, Hindley Green, Wigan WN2 4TNKMI Plus Water Water project framework for United Utilities 30.8%KMI Water Water project framework for United Utilities 33.3%
Notes - joint ventures1 Accounted for as joint operations within the financial statements.
The following entities used to be part of the Group’s former PFI portfolio and were transferred to the the trustee of the Interserve Pension Scheme (Interserve Trustees Ltd) or Dalmore Capital. During 2017, any remaining indirect interests held by Interserve Trustees Ltd in these entities were transferred to either another Group company or to Dalmore Capital. Whilst the Group has retained the legal interest shown, it no longer has any beneficial interest in these entities and they have no impact on the consolidated financial statements.
Other holdings Principal activityGroup
holding
Incorporated in the United Kingdom
England and Wales: Interserve House, Ruscombe Park, Twyford, Reading, Berkshire RG10 9JUAshford Prison Services Holdings Ltd1 Holding company 8.4%Ashford Prison Services Ltd1 Prison construction/operation 8.4%Custodial Holdings (PA) Ltd2 5 Holding company 50.1%Dudley Summit PLC1 Investment company 16.7%Falcon Support Services (Holdings) Ltd1 Holding company 25.1%Falcon Support Services Ltd1 Construction/operation of MoD accommodation facilities 25.1%ICB Holdings Ltd1 3 Holding company 10.0%Interserve Developments No.10 Ltd Holding company 50.1%Interserve PFI 2003 Ltd Holding company 50.1%Interserve PFI Holdings Ltd4 Holding company 50.1%Interserve PFI Holdings 2014 Ltd Holding company 50.1%Investors in the Community (Buxton) Ltd1 Construction/operation of Health & Safety Laboratory 10.0%Minerva Education and Training (Holdings) Ltd1 Holding company 22.5%Minerva Education and Training Ltd1 Construction/operation of Defence Sixth Form College for MoD 22.5%Newcastle (Healthcare Support) Ltd5 Holding company 25.1%Newcastle Holdco (Healthcare Support) Ltd2 5 Holding company 50.1%Peterborough Prison Management Holdings Ltd1 Holding company 8.4%Peterborough Prison Management Ltd1 Prison construction/operation 8.4%PFI Custodial (Holdings) Ltd5 Holding company 25.1%Pyramid Accommodation Services (Cornwall) Holdings Ltd1 Holding company 25.1%Pyramid Accommodation Services (Cornwall) Ltd1 Fire station construction/operation 25.1%Pyramid Schools (Cornwall) Holdings Ltd1 Holding company 25.1%Pyramid Schools (Cornwall) Ltd1 School/college construction/operation 25.1%Pyramid Schools (Hadley) Holdings Ltd1 Holding company 25.1%Pyramid Schools (Hadley) Ltd1 School/college construction/operation 25.1%Pyramid Schools (Southampton) Holdings Ltd1 Holding company 25.1%Pyramid Schools (Southampton) Ltd1 School/college construction/operation 25.1%Pyramid Schools (Tameside) Holdings Ltd1 Holding company 25.1%Pyramid Schools (Tameside) Ltd1 School/college construction/operation 25.1%Summit Healthcare (Dudley) Ltd1 Hospital construction/operation 16.7%Summit Holdings (Dudley) Ltd1 Holding company 16.7%Victory Support Services (Portsmouth) Holdings Ltd1 Holding company 50.1%Victory Support Services (Portsmouth) Ltd1 Day care/respite care centre construction/operation 50.1%West Yorkshire PFI Operational Training & Accommodation (Holdings) Ltd1 Holding company 25.1%West Yorkshire PFI Operational Training & Accommodation Ltd1 Construction/operation of three new facilities for West Yorkshire
Police Authority25.1%
England and Wales: 8 White Oak Square, London Road, Swanley, Kent BR8 7AGHealthcare Support (Newcastle) Finance Plc Investment company 5.0%Healthcare Support (Newcastle) Holdings Ltd Holding company 5.0%Healthcare Support (Newcastle) Ltd Hospital construction/operation 5.0%
Northern Ireland: Carnbane House, Shepherd’s Way, Newry, Co Down BT35 6EEBelfast Educational Services (Dungannon) Holdings Ltd Holding company 25.1%Belfast Educational Services (Dungannon) Ltd School/college construction/operation 25.1%Belfast Educational Services (Holdings) Ltd Holding company 16.7%Belfast Educational Services Ltd School/college construction/operation 16.7%Belfast Educational Services (Omagh) Holdings Ltd Holding company 25.1%Belfast Educational Services (Omagh) Ltd School/college construction/operation 25.1%
Notes - other holdings1 Registered office changed post-year-end to c/o Albany Spc Services Limited, 3rd Floor, 3-5 Charlotte Street, Manchester M1 4HB.2 Ownership held in ordinary A shares.3 Ownership held in ordinary B shares.4 Ownership held in an ordinary and a Special Rights share.5 Registered office changed post-year-end to 1 Park Row, Leeds LS1 5AB.

181181
Governance
Financial Statements
Strategic Report
Overview
2018 2017 2016 2015 2014£million £million £million £million £million
Revenue including share of associates and joint ventures
Support Services - UK 1,597.7 1,642.3 1,697.4 1,850.8 1,765.9Support Services - International 172.1 193.9 267.9 224.3 157.2 1,836.2 1,965.3 2,075.1
Support Services 1,769.8 1,836.2 1,965.3 2,075.1 1,923.1
Construction - UK 756.6 972.8 796.6 980.9 912.5Construction - International 246.6 290.5 296.9 279.0 207.9 229.0 224.1 211.0
Construction 1,003.2 1,263.3 1,093.5 1,259.9 1,120.4
Equipment Services 195.5 229.0 224.1 211.0 195.5Group Services 57.9 92.1 81.3 53.9 46.7Inter-segment elimination (7.2) (12.0) (50.1) (61.6) (58.7)
3,019.2 3,408.6 3,314.1 3,538.3 3,227.0
Consolidated revenue
Support Services - UK 1,584.3 1,625.5 1,674.0 1,803.7 1,659.8Support Services - International 138.0 142.2 211.9 170.4 117.5 1,722.3 1,767.7 1,767.7
Support Services 1,722.3 1,767.7 1,885.9 1,974.1 1,777.3
Construction - UK 756.6 972.8 796.6 980.9 912.5Construction - International 13.5 - - - - 195.5 229.0 1,767.7
Construction 770.1 972.8 796.6 980.9 912.5
Equipment Services 195.5 229.0 224.1 211.0 195.5Group Services 16.8 35.0 17.0 9.6 8.1Inter-segment elimination (7.2) (12.0) (50.1) (61.6) (58.7) 1,767.7
2,697.5 2,992.5 2,873.5 3,114.0 2,834.7
Headline profit
Support Services - UK 51.4 39.4 78.8 91.4 82.1Support Services - International 7.2 2.8 9.4 8.2 7.4
Support Services 58.6 42.2 88.2 99.6 89.5
Construction - UK 2.2 (10.3) 30.0 9.9 14.8Construction - International 13.3 19.2 16.9 13.0 10.8
Construction 15.5 8.9 46.9 22.9 25.6
Equipment Services 39.6 54.4 48.6 44.5 27.5Group Services (21.0) (21.0) (25.2) (23.6) (24.4)
Total operating profit 92.7 84.5 158.5 143.4 118.2
Investment revenue 3.5 5.9 5.6 4.7 5.0Finance costs (82.5) (28.4) (23.3) (21.1) (16.0)
13.7 62.0 140.8 127.0 107.2
Earnings per share, pence
Basic EPS (89.2) (176.0) (71.2) 47.5 32.2Headline EPS 1.1 35.6 86.9 74.5 59.5
Dividend per share, pence
Interim – - 8.1 7.9 6.8Final – - - 16.4 16.4
Five‑year analysis (unaudited)
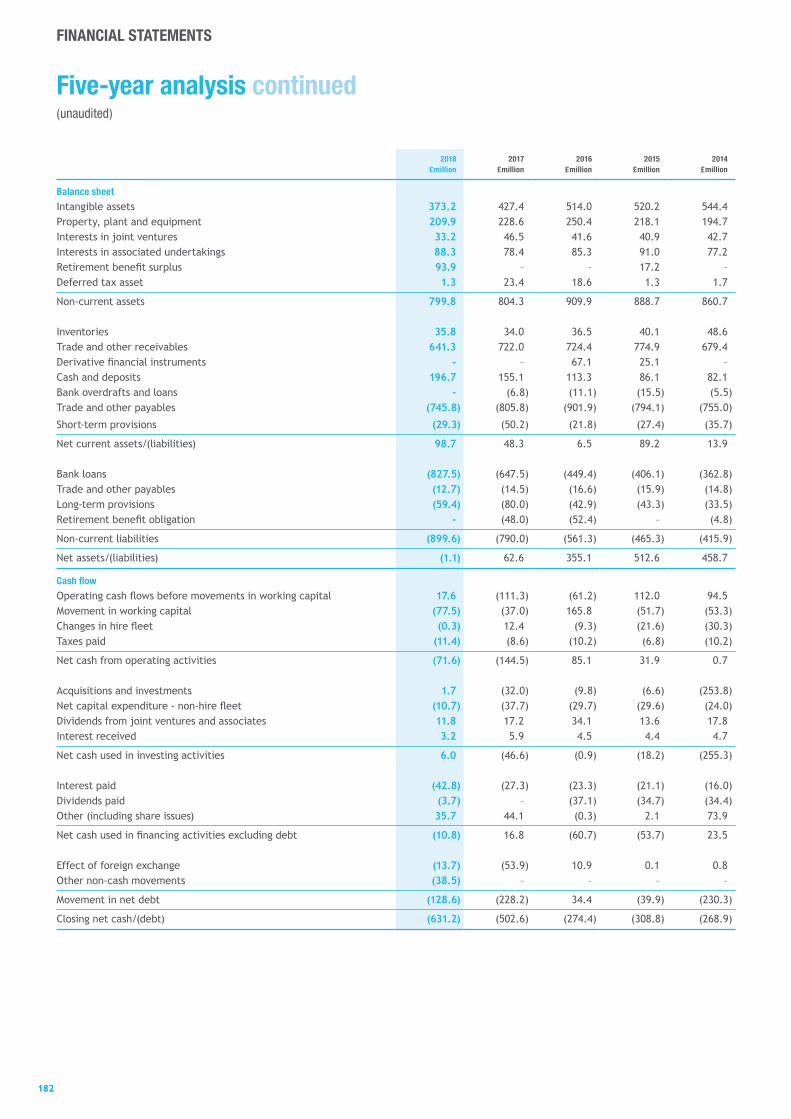
182182
FINANCIAL STATEMENTS
Five‑year analysis continued(unaudited)
FINANCIAL STATEMENTS
2018 2017 2016 2015 2014£million £million £million £million £million
Balance sheet
Intangible assets 373.2 427.4 514.0 520.2 544.4 Property, plant and equipment 209.9 228.6 250.4 218.1 194.7 Interests in joint ventures 33.2 46.5 41.6 40.9 42.7 Interests in associated undertakings 88.3 78.4 85.3 91.0 77.2 Retirement benefit surplus 93.9 – – 17.2 – Deferred tax asset 1.3 23.4 18.6 1.3 1.7
Non-current assets 799.8 804.3 909.9 888.7 860.7
Inventories 35.8 34.0 36.5 40.1 48.6 Trade and other receivables 641.3 722.0 724.4 774.9 679.4 Derivative financial instruments - – 67.1 25.1 – Cash and deposits 196.7 155.1 113.3 86.1 82.1 Bank overdrafts and loans - (6.8) (11.1) (15.5) (5.5) Trade and other payables (745.8) (805.8) (901.9) (794.1) (755.0)
Short-term provisions (29.3) (50.2) (21.8) (27.4) (35.7)
Net current assets/(liabilities) 98.7 48.3 6.5 89.2 13.9
Bank loans (827.5) (647.5) (449.4) (406.1) (362.8) Trade and other payables (12.7) (14.5) (16.6) (15.9) (14.8) Long-term provisions (59.4) (80.0) (42.9) (43.3) (33.5) Retirement benefit obligation - (48.0) (52.4) – (4.8)
Non-current liabilities (899.6) (790.0) (561.3) (465.3) (415.9)
Net assets/(liabilities) (1.1) 62.6 355.1 512.6 458.7
Cash flow
Operating cash flows before movements in working capital 17.6 (111.3) (61.2) 112.0 94.5 Movement in working capital (77.5) (37.0) 165.8 (51.7) (53.3) Changes in hire fleet (0.3) 12.4 (9.3) (21.6) (30.3) Taxes paid (11.4) (8.6) (10.2) (6.8) (10.2)
Net cash from operating activities (71.6) (144.5) 85.1 31.9 0.7
Acquisitions and investments 1.7 (32.0) (9.8) (6.6) (253.8) Net capital expenditure - non-hire fleet (10.7) (37.7) (29.7) (29.6) (24.0) Dividends from joint ventures and associates 11.8 17.2 34.1 13.6 17.8 Interest received 3.2 5.9 4.5 4.4 4.7
Net cash used in investing activities 6.0 (46.6) (0.9) (18.2) (255.3)
Interest paid (42.8) (27.3) (23.3) (21.1) (16.0) Dividends paid (3.7) – (37.1) (34.7) (34.4) Other (including share issues) 35.7 44.1 (0.3) 2.1 73.9
Net cash used in financing activities excluding debt (10.8) 16.8 (60.7) (53.7) 23.5
Effect of foreign exchange (13.7) (53.9) 10.9 0.1 0.8 Other non-cash movements (38.5) – – – –
Movement in net debt (128.6) (228.2) 34.4 (39.9) (230.3)
Closing net cash/(debt) (631.2) (502.6) (274.4) (308.8) (268.9)
FINANCIAL STATEMENTS

183183
Governance
Financial Statements
Strategic Report
Overview
Shareholder information
FINANCIAL CALENDAR 2019Preliminary unaudited financial results for the year ended 31 December 2018Approval of audited financial results for the year ended 31 December 2018Annual General MeetingHalf-year results for the six months ended 30 June 2019
27 February 20198 March 2019
May/June 2019August 2019
The Company will keep under review the appropriateness of issuing other trading updates to the market during the course of the year.
SHARE PRICEAs at 31 December 2018 10.62p
Lowest for the year ended 31 December 2018 10.40p
Highest for year ended 31 December 2018 123.50p
The current price of the Company’s shares is available on the Company’s website at www.interserve.com.
ANALYSIS OF REGISTERED SHAREHOLDINGSHolders Shares
Number % Number %
Notifiable interests 6 0.14 80,591,136 55.83
Banks, institutions and nominees 585 13.93 59,170,503 39.52
Private shareholders 3,609 85.93 9,958,299 6.65
Total as at 8 March 2019 4,200 100.00 149,719,938 100.00
SHAREHOLDER SERVICESLink Asset Services (Link) is our Registrar. Link offer many services to make managing your shareholding easier and more efficient:
(a) Share Portal
Signal Shares is a secure online site where you can manage your shareholding quickly and easily. You can:
• View your holding and get an indicative valuation
• Change your address
• Elect to receive shareholder communications by email rather than by post
• View your dividend payment history
• Make dividend payment choices
• Register your proxy voting instruction
Just visit www.signalshares.com. All you need is your investor code, which can be found on your share certificate or by contacting Link on +44 (0)371 664 0391.
(b) Shareholder Support Centre
Alternatively, you can contact Link’s Shareholder Support Centre which is available to answer any queries you have in relation to your shareholding:
By email: [email protected] phone: +44 (0)371 664 0300 (lines are open 9.00am to 5.30pm, Monday to Friday, excluding public holidays in England and Wales)By post: Shareholder Administration, Link Asset Services, 34 Beckenham Road, Beckenham, Kent BR3 4TU
(c) Sign up to electronic communications
By signing up to receive your shareholder communications by email, you will help us to save paper and receive your shareholder information quickly and securely. Registering for electronic communications is very straightforward. Just visit www.signalshares.com. All you need is your investor code, which can be found on your share certificate or by contacting Link on +44 (0)371 664 0300.

184184
FINANCIAL STATEMENTSFINANCIAL STATEMENTS
Shareholder information continued
(d) Buy and sell shares
A quick and easy way to buy and sell shares is provided by Link Asset Services Share Dealing. There is no need to pre-register and there are no complicated application forms to fill in. You can also access a wealth of stock market news and information free of charge. For further information on this service, or to buy and sell shares, visit www.linksharedeal.com or call +44 (0)371 664 0445 (calls are charged at the standard geographic rate and will vary by provider. Calls outside the United Kingdom will be charged at the applicable international rate. Lines are open 8.00am to 4.30pm, Monday to Friday, excluding public holidays in England and Wales).
This is not a recommendation to buy and sell shares and this service may not be suitable for all shareholders. The price of shares can go down as well as up and you are not guaranteed to get back the amount you originally invested. Terms, conditions and risks apply.
Link Asset Services is a trading name of Link Market Services Limited and Link Market Services Trustees Limited. Share registration and associated services are provided by Link Market Services Limited (registered in England and Wales, No.2605568). Regulated services are provided by Link Market Services Trustees Limited (registered in England and Wales No.2729260), which is authorised and regulated by the Financial Conduct Authority. Not all share plan activity is regulated. The registered office of each of these companies is The Registry, 34 Beckenham Road, Beckenham, Kent BR3 4TU.
DONATE YOUR SHARES TO CHARITYIf you have only a small number of shares which are uneconomical to sell, you may wish to donate them to charity free of charge through ShareGift (Registered Charity 1052686). Find out more at www.sharegift.org.uk or by telephoning +44 (0)20 7930 3737.
BENEFICIAL OWNERS OF SHARES WITH “INFORMATION RIGHTS”Please note that beneficial owners of shares who have been nominated by the registered holder of those shares to receive information rights under section 146 of the Companies Act 2006 are required to direct all communications to the registered holder of their shares rather than to the Company’s Registrar, Link Asset Services, or to the Company directly.
INVESTMENT SCAMS In recent years many companies have become aware that their shareholders have received unsolicited telephone calls or correspondence concerning investment matters. Shareholders are advised to be very wary of any unsolicited advice, offers to buy shares at a discount or offers of free reports into the Company. The Financial Conduct Authority (FCA) have provided the following advice with regard to avoiding investment scams:
• Reject unexpected offers Scammers usually cold call, but contact can also come by email, post, word of mouth or at a seminar. If you’ve been offered an investment out of the blue, chances are it’s a high risk investment or a scam.
• Check the FCA Warning List Use the FCA Warning List to check the risks of a potential investment – you can also search to see if the firm is known to be operating without FCA authorisation.
• Get impartial advice Get impartial advice before investing – don’t use an adviser from the firm that contacted you.
You can report a firm or scam to the FCA on 0800 111 6768 or through www.fca.org.uk/scamsmart. If you’ve lost money in a scam, contact Action Fraud on 0300 123 2040 or www.actionfraud.police.uk.
Please visit www.fca.org.uk/scamsmart for further information.
Details of all share dealing facilities that the Company endorses are detailed above.
Please note that any electronic address provided in this document to communicate with the Company may not be used for any purpose other than that expressly stated.
FINANCIAL STATEMENTS