annual report 2017 - smart parking strategy across managed services and ... such as britannia hotel...
TRANSCRIPT

Smart Parking Annual Report 2017 1
Building a smarter future.Annual Report 2017
ABN 45 119 327 169

Title
2
There are clear signs that growth has gathered momentum. Amidst a challenging environment, Smart Parking have emerged stronger and more resilient, achieving record financial results. Together with our strong strategic focus and operational performance, Smart Parking is well positioned for global growth.
Introduction
Contents03 Financial Highlights 04 Letter to shareholders06 Review of key divisions10 Directors’ Report28 Corporate Governance37 Auditor’s Independence Declaration38 Independent Auditor’s Report43 Financial Statements 48 Notes to Financial Statements 89 Director’s Declaration 90 ASX Additional Information91 Corporate Directory
To create a culture of excellence and be the global leader in the sensing, data solutions and managed parking services marketplace.
Our Vision
Smart Parking Annual Report 2017 3
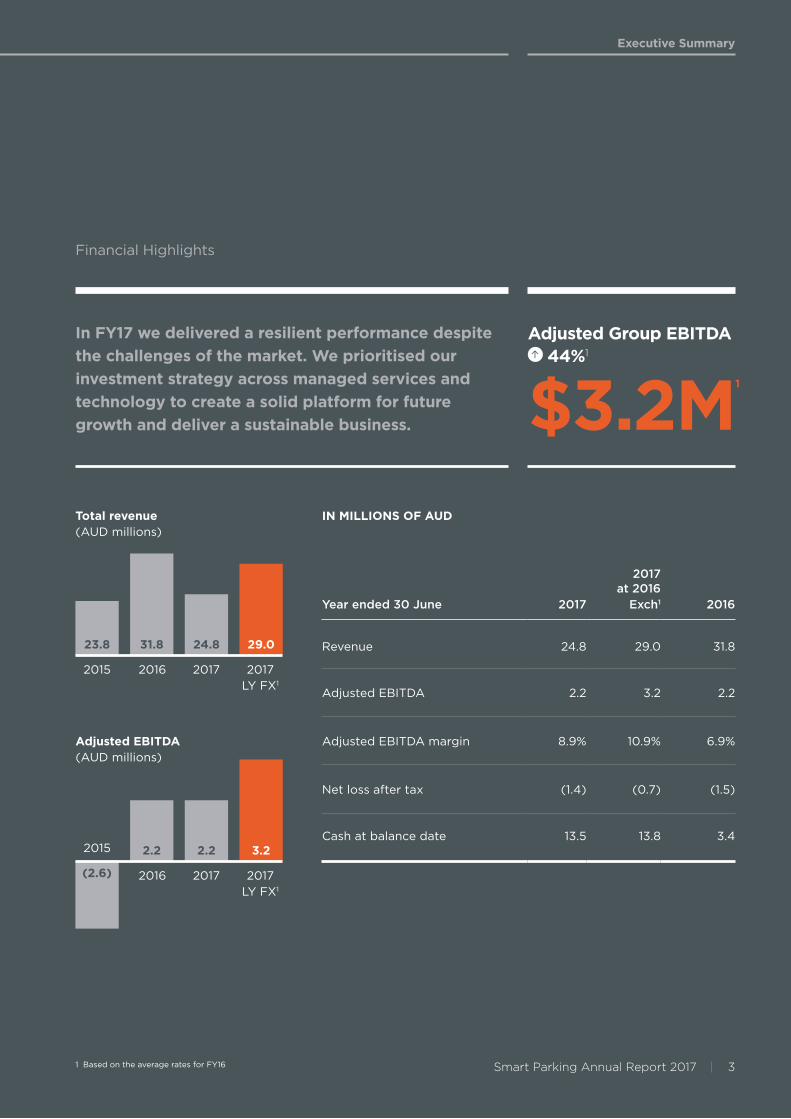
Financial Highlights
Executive Summary
Adjusted Group EBITDA 44%1
$3.2M1
Year ended 30 June 2017
2017 at 2016
Exch1 2016
Revenue 24.8 29.0 31.8
Adjusted EBITDA 2.2 3.2 2.2
Adjusted EBITDA margin 8.9% 10.9% 6.9%
Net loss after tax (1.4) (0.7) (1.5)
Cash at balance date 13.5 13.8 3.4
Adjusted EBITDA (AUD millions)
IN MILLIONS OF AUD
In FY17 we delivered a resilient performance despite the challenges of the market. We prioritised our investment strategy across managed services and technology to create a solid platform for future growth and deliver a sustainable business.
Total revenue (AUD millions)
2015 2016
23.8 31.8 24.8 29.0
2017 2017 LY FX1
1 Based on the average rates for FY16
2015
2016(2.6)
2.2 2.2 3.2
2017 2017 LY FX1
Smart Parking Annual Report 2017 3

Title
4
Letter to shareholders
Dear Fellow Shareholder,
We are pleased to present Smart Parking Limited‘s (“Smart Parking“, “the Group“) Annual Report and outline the initiatives we undertook in the 2017 financial year to build the Company’s capacity for future growth in the global parking technology industry.
The Company remains well funded following the successful completion of an underwritten capital raising of $11 million (net of costs) comprising a 1 for 7 accelerated non-renounceable pro-rata entitlement offer and share placement to fund capital expenditure, technology enhancements, strategic initiatives and working capital in the coming financial year.
Financial ResultsSmart Parking achieved a 44% Adjusted EBITDA improvement (in constant currency1) over the 2017 financial year. Adjusted EBITDA (in constant currency1) rose to $3.2 million, and the Group‘s Adjusted EBITDA margin1 rose 4% to 10.9% supported by growth in our Parking Management division.
Parking Management DivisionOperating in the United Kingdom, the Parking Management division continued with its strategy of targeting off-street car parks where there is a requirement for car park management services through the deployment of technology solutions. Despite the loss of the Asda contract in April 2016, which comprised 29% of the Group’s FY16 revenue, the Parking Management division’s Adjusted EBITDA
increased 47% to $7.9 million (in constant currency1). Smart Parking achieved this result through resizing the business and winning new higher margin business deploying technology on more profitable sites. Parking Management delivered growth through the installation of Automatic Number Plate Recognition (ANPR) and the FY18 pipeline is showing strong demand for the continued uptake of this system.
Technology DivisionThe Technology division focused on developing a new software platform ‘SmartCloud’ and developed a mobile phone application ‘SmartApp’. SmartCloud is a real time, global scale information platform that enables sophisticated and flexible services to be created using open web interfaces. SmartCloud is specifically designed for the new generation smart city and smart business intelligence requirements where interaction with vast networks of sensors, information equipment, and interconnection to other software or service systems is required. Smart App will provide guidance, payment and enforcement capabilities. Smart Parking expects these developments will lead to new revenue streams, reduced support costs and increased operating leverage. The division continued to win new business, securing
Christopher Morris Chairman ——
1 Based on the average rates for FY16

Letter to shareholders
Smart Parking Annual Report 2017 5
contracts in Wales (Cardiff City Council), New Zealand (Hamilton City Council and Wilson Parking NZ) and Australia (Hobart City Council and Coles Supermarkets). This division also continues to operate in several capital cities, installing its technology in Wellington, Canberra, London and Cardiff. Smart Parking has invested significant resources into the new Smart Cities platform which delivers breakthrough advantages for cities and businesses. Our position as a provider of Internet of Things and Smart Cities solutions is establishing us as a company well-equipped for the future.
Smart Cities Market Thanks to the evolution of Internet of Things (IoT) the potential of smart cities is nearly limitless, and the growth of these cities should only accelerate in the coming years. Research and Markets report that the global Smart Cities market accounted for US$773M in 2016 and is expected to grow at a CAGR of 19.1% during the forecast period from 2017-2025.
Increasing interest in the smart parking market has also been demonstrated by major players such as Google, Bosch, Siemens, Verizon, and Kapsch TrafficCom AG. These developments indicate that key suppliers see long-term value in smart parking market as part of a broader smart city and IoT strategy.
OutlookSmart Parking is well-positioned for ongoing earnings growth from both divisions through winning new business and increasing operating leverage.
The Parking Management division is ideally placed for continued earnings growth and focused on expanding its UK footprint as it continues with its proven strategy of deploying technology at new car parking sites.
The Technology division expects to have improved earnings in FY18 based on the firm orders it has already received and the increased level of enquiry it is experiencing. Initiatives such as our new software platform, migration to the cloud and new mobile phone application are future proofing the company and will enable Smart Parking to remain the world leader in technology-enhanced parking solutions.
We would like to take this opportunity to thank the team at Smart Parking for their efforts and our fellow shareholders for your continued support.
The business has enhanced its sales capability and is developing a strong pipeline of new opportunities. The Group is also reviewing corporate development opportunities on an ongoing basis and where appropriate is prepared to make suitable acquisitions where they are earnings accretive and subject to robust and disciplined due diligence analysis.
Christopher Morris Chairman
Paul Gillespie Chief Executive Officer
29 September 2017
Paul Gillespie CEO

6
Smart Parking’s Parking Management division has delivered growth throughout the 2017 financial year.
Accounting for 85% of the company’s revenue, this profitable division operates exclusively in the UK, specialising in the management of car parks on behalf of retail customers, land owners and managing agents.
Despite the loss of the Asda contract in 2016, our Parking Management division has delivered growth figures that place Smart Parking in a robust position, with an increase in the Adjusted EBITDA margin from 19% to 31%1, demonstrating the quality of new business. In addition, Parking Breach Notices are up 59% (excluding Asda) compared to the 2016 financial year, and this looks set to continue with the roll out of ANPR technology.
Our products & solutions• Automatic Number Plate
Recognition (ANPR)
• Pay & Display
• Site surveys
• Parking attendants
• Marshalling
FY17 at a glance
Pipeline continues to expand driving earnings growth
Adjusted EBITDA margin up 12% to 31%1
Adjusted EBITDA grew 47% in constant currency1
OutlookStrong growth factors already in motion
Seasonality and the deployment of technology on new sites should see strong growth for the remainder of 2017 and beyond.
With a robust pipeline of 100+ sites to install, new clients such as Britannia Hotel Group, Knight Frank, CBRE and more, Smart Parking is ideally placed to increase market share and revenue in the coming financial year.
Parking Management division
Review of key divisions
——
1 Based on the average rates for FY16
Letter to shareholders
Smart Parking Annual Report 2017 7
Executive Summary
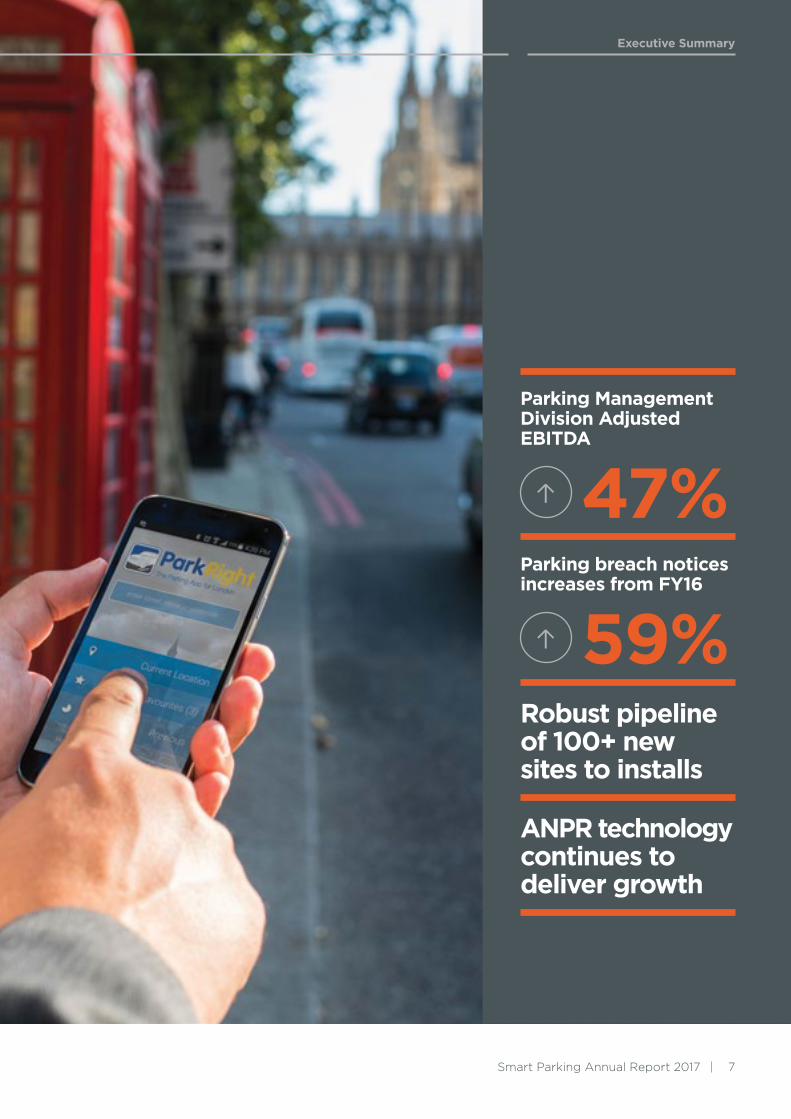
Parking ManagementDivision Adjusted EBITDA
47%Parking breach notices increases from FY16
59%Robust pipeline of 100+ new sites to installs
ANPR technology continues to deliver growth
8
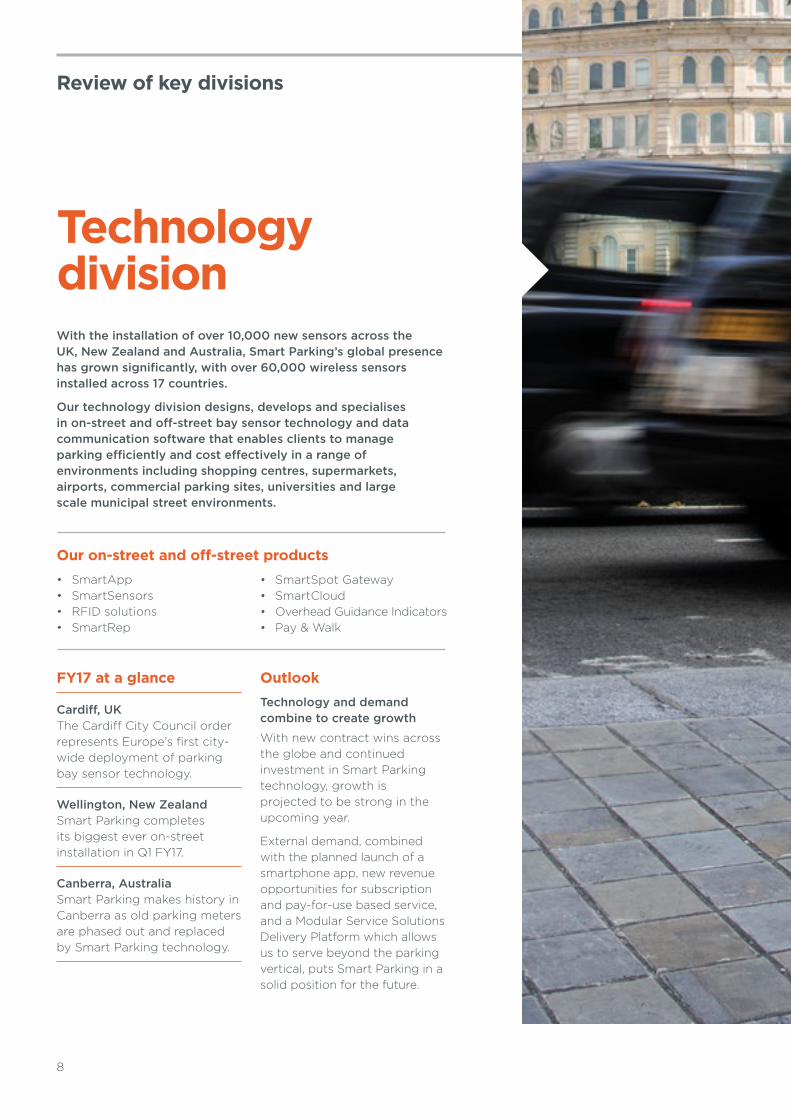
Technology division With the installation of over 10,000 new sensors across the UK, New Zealand and Australia, Smart Parking’s global presence has grown significantly, with over 60,000 wireless sensors installed across 17 countries.
Our technology division designs, develops and specialises in on-street and off-street bay sensor technology and data communication software that enables clients to manage parking efficiently and cost effectively in a range of environments including shopping centres, supermarkets, airports, commercial parking sites, universities and large scale municipal street environments.
FY17 at a glance
Cardiff, UK The Cardiff City Council order represents Europe’s first city-wide deployment of parking bay sensor technology.
Wellington, New Zealand Smart Parking completes its biggest ever on-street installation in Q1 FY17.
Canberra, Australia Smart Parking makes history in Canberra as old parking meters are phased out and replaced by Smart Parking technology.
OutlookTechnology and demand combine to create growth
With new contract wins across the globe and continued investment in Smart Parking technology, growth is projected to be strong in the upcoming year.
External demand, combined with the planned launch of a smartphone app, new revenue opportunities for subscription and pay-for-use based service, and a Modular Service Solutions Delivery Platform which allows us to serve beyond the parking vertical, puts Smart Parking in a solid position for the future.
Review of key divisions
Our on-street and off-street products• SmartApp• SmartSensors• RFID solutions• SmartRep
• SmartSpot Gateway• SmartCloud• Overhead Guidance Indicators• Pay & Walk

Letter to shareholders
Smart Parking Annual Report 2017 9
Executive Summary
Integrating Big Data, IoT capabilities & analytics
60,000+sensors across 17 nations
Subscription and pay-for-use revenue opportunities

10
11 Review of Operations 14 Information on Directors17 Remuneration Report
Directors’ Report
This Annual Report covers both Smart Parking Limited as an individual entity and the Consolidated entity comprising Smart Parking Limited and its subsidiaries. The Group’s functional and presentation currency is AUD ($).
A description of the Group’s operations and of its principal activities is included in the review of operations and activities in the Director’s report on page 11. The Directors’ report is not part of the financial report.

Director's Report
Smart Parking Annual Report 2017 11
Your Directors present their report on the consolidated entity (referred to hereafter as the Group) consisting of Smart Parking Limited and entities it controlled at the end of, or during the year ended 30 June 2017.
DirectorsThe names of the Directors in office during the financial year and until the date of this report are as follows. All Directors were in office for the entire period unless otherwise stated:
Mr Christopher Morris Non-Executive Chairman
Mr Paul Gillespie Managing Director
Ms Penelope Maclagan Non-Executive Director
Ms Tiffany Fuller Non-Executive Director
Mr Jeremy King Non-Executive Director
Principal activitiesThe Group operates two divisions:
• Technology: Sale of car parking technology hardware, software and associated products and services.
• Parking Management: provision of parking management solutions, predominantly servicing the retail sector in the United Kingdom.
Review of OperationsThe Group recorded a net loss after income tax of $1.4m (2016: loss of $1.5m) for the financial year ended 30 June 2017.
An analysis of underlying EBITDA for the period after excluding the effects of costs incurred in the current period but not expected to occur in the future is outlined below:
Directors’ Report
2017 $
2017 at 2016 Exch1
$2016
$
Revenue 24,841,220 29,045,012 31,805,151
Net loss for the year after tax (1,396,723) (657,594) (1,525,009)
Adjusted EBITDA2 1,314,050 2,070,794 1,351,215
Professional fees3 - - 831,073
Dispute settlement4 (338,696) (407,020) -
Onerous lease reversal5 (109,928) (132,282) -
VAT Provisions6 1,337,678 1,619,940 -
Adjusted EBITDA after non-recurring items7 2,203,140 3,151,432 2,182,288
Adjusted EBITDA after non-recurring items margin 8.9% 10.9% 6.9%
1 The exchange rates are based on the average rates for FY16 (Constant currency).
2 Adjusted EBITDA represents Earnings before interest, taxation, depreciation, amortisation and loss on disposal of plant and equipment.
3 The professional fees relate to a legal dispute which was settled during the previous period relating to the Group’s acquisition of Town and City Parking Limited which is not expected to occur in the future. Further details of the dispute are included in Note 31 in the Annual Report for the year ended 30 June 2016.
4 The dispute settlement relates to damages awarded to Smart Parking in the UK from a former customer in relation to a breach of contract.
5 The reversal relates to an onerous lease provision recognised in a previous period which was surrendered in June 2017.
6 The company is aware of an Upper Tier Tribunal Ruling in the UK impacting the treatment of input VAT incurred on expenditure relating to the administration of Parking Breach Notice activities for another company. As at 30 June 2017 the company has booked an appropriate provision of $1.3m for VAT. The ongoing impact of any changes related to the treatment of VAT is unknown. Refer to Note 29 for additional information.
7 The Board assesses the underlying performance of the Group based on a measure of adjusted EBITDA which takes into account costs incurred in the current period but not expected to occur in the future.
12
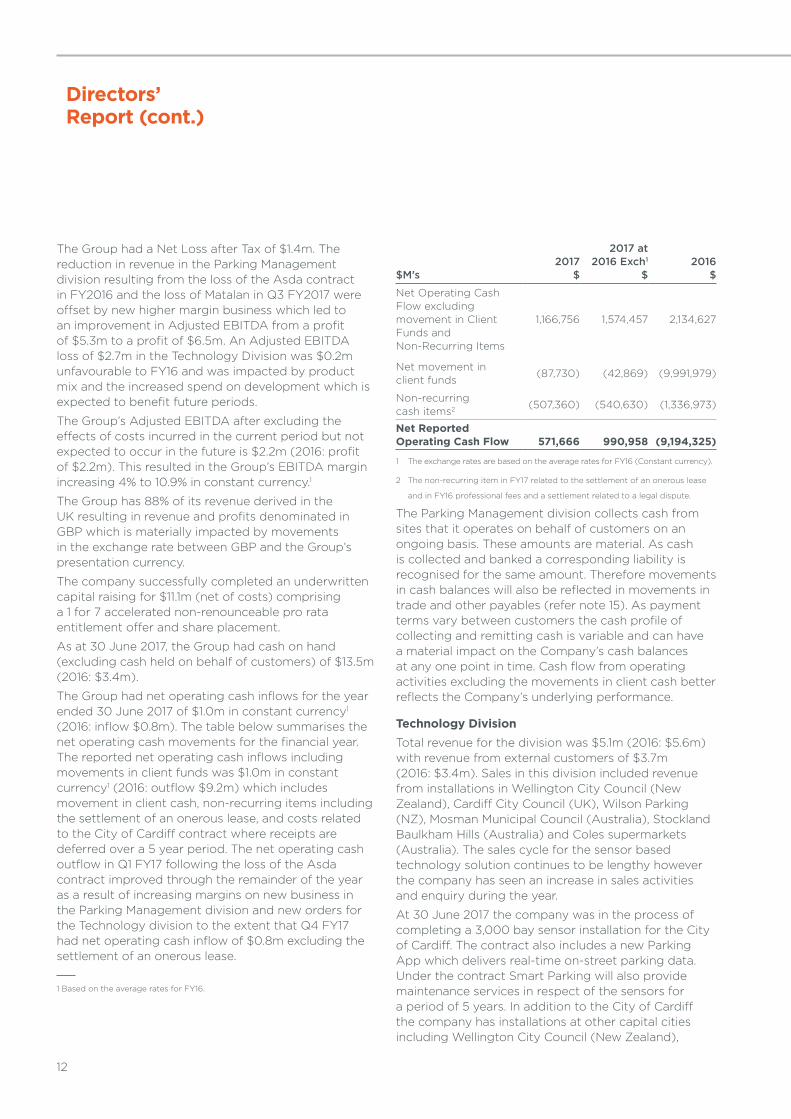
The Group had a Net Loss after Tax of $1.4m. The reduction in revenue in the Parking Management division resulting from the loss of the Asda contract in FY2016 and the loss of Matalan in Q3 FY2017 were offset by new higher margin business which led to an improvement in Adjusted EBITDA from a profit of $5.3m to a profit of $6.5m. An Adjusted EBITDA loss of $2.7m in the Technology Division was $0.2m unfavourable to FY16 and was impacted by product mix and the increased spend on development which is expected to benefit future periods.
The Group’s Adjusted EBITDA after excluding the effects of costs incurred in the current period but not expected to occur in the future is $2.2m (2016: profit of $2.2m). This resulted in the Group’s EBITDA margin increasing 4% to 10.9% in constant currency.1
The Group has 88% of its revenue derived in the UK resulting in revenue and profits denominated in GBP which is materially impacted by movements in the exchange rate between GBP and the Group’s presentation currency.
The company successfully completed an underwritten capital raising for $11.1m (net of costs) comprising a 1 for 7 accelerated non-renounceable pro rata entitlement offer and share placement.
As at 30 June 2017, the Group had cash on hand (excluding cash held on behalf of customers) of $13.5m (2016: $3.4m).
The Group had net operating cash inflows for the year ended 30 June 2017 of $1.0m in constant currency1 (2016: inflow $0.8m). The table below summarises the net operating cash movements for the financial year. The reported net operating cash inflows including movements in client funds was $1.0m in constant currency1 (2016: outflow $9.2m) which includes movement in client cash, non-recurring items including the settlement of an onerous lease, and costs related to the City of Cardiff contract where receipts are deferred over a 5 year period. The net operating cash outflow in Q1 FY17 following the loss of the Asda contract improved through the remainder of the year as a result of increasing margins on new business in the Parking Management division and new orders for the Technology division to the extent that Q4 FY17 had net operating cash inflow of $0.8m excluding the settlement of an onerous lease.
1 Based on the average rates for FY16.
$M’s2017
$
2017 at 2016 Exch1
$2016
$
Net Operating Cash Flow excluding movement in Client Funds and Non-Recurring Items
1,166,756 1,574,457 2,134,627
Net movement in client funds
(87,730) (42,869) (9,991,979)
Non-recurring cash items2 (507,360) (540,630) (1,336,973)
Net Reported Operating Cash Flow 571,666 990,958 (9,194,325)
1 The exchange rates are based on the average rates for FY16 (Constant currency).
2 The non-recurring item in FY17 related to the settlement of an onerous lease
and in FY16 professional fees and a settlement related to a legal dispute.
The Parking Management division collects cash from sites that it operates on behalf of customers on an ongoing basis. These amounts are material. As cash is collected and banked a corresponding liability is recognised for the same amount. Therefore movements in cash balances will also be reflected in movements in trade and other payables (refer note 15). As payment terms vary between customers the cash profile of collecting and remitting cash is variable and can have a material impact on the Company’s cash balances at any one point in time. Cash flow from operating activities excluding the movements in client cash better reflects the Company’s underlying performance.
Technology DivisionTotal revenue for the division was $5.1m (2016: $5.6m) with revenue from external customers of $3.7m (2016: $3.4m). Sales in this division included revenue from installations in Wellington City Council (New Zealand), Cardiff City Council (UK), Wilson Parking (NZ), Mosman Municipal Council (Australia), Stockland Baulkham Hills (Australia) and Coles supermarkets (Australia). The sales cycle for the sensor based technology solution continues to be lengthy however the company has seen an increase in sales activities and enquiry during the year.
At 30 June 2017 the company was in the process of completing a 3,000 bay sensor installation for the City of Cardiff. The contract also includes a new Parking App which delivers real-time on-street parking data. Under the contract Smart Parking will also provide maintenance services in respect of the sensors for a period of 5 years. In addition to the City of Cardiff the company has installations at other capital cities including Wellington City Council (New Zealand),
Directors’ Report (cont.)

Director's Report
Smart Parking Annual Report 2017 13
Canberra (Australia) and the City of Westminster (United Kingdom).
Recurring revenue from maintenance and data charges of $2.1m increased 9% on the prior year.
The operating costs (excluding foreign exchange gains and losses) for the year ended 30 June 2017 were $4.9m (2016: $5.1m).
The Technology division focused on developing a new software platform ‘SmartCloud’ and developed a mobile phone application ‘SmartApp’. SmartCloud is a real time, global scale information platform that enables sophisticated and flexible services to be created using open web interfaces. SmartCloud is specifically designed for the new generation smart city and smart business intelligence requirements where interaction with vast networks of sensors, information equipment, and interconnection to other software or service systems is required. These developments will lead to new revenue streams, reduced support costs and lead to increased operating leverage.
Consistent with previous periods the company’s policy is to treat all technology development expenses in the period in which it is incurred.
Parking Management DivisionSales of $21.0m (2016: $28.4m) were down 26% (down 11% in constant currency1) compared with the prior year. The UK parking management business has experienced improved returns during the year. This has been achieved by improving levels of customer service, deployment of technology on new and existing sites, and strong cost control.
Revenue was up 33% (in constant currency1 and excluding the loss of the Asda contract which was terminated in FY16) as the division continued with its strategy of deploying technology solutions on manually operated car parking sites in the UK. The division incurred capital expenditure of $1.2m on the technology rollout. The resizing of the business following the loss of the Asda contract combined with increasing margins on new business led to an improvement in EBITDA from $5.3m to $6.5m.
EBITDA before non-recurring items (in constant currency1) of $7.9 million was up 47% on FY16 ($5.3m). Excluding Asda, Parking Breach Notices increased 60% and receipts from Parking Breach Notices grew 83% (in constant currency1). Earnings growth in the third and fourth quarter was impacted by the cessation of the contract with Matalan.
The company is aware of an Upper Tier Tribunal Ruling in the UK impacting the treatment of input VAT incurred on expenditure relating to the administration
of Parking Breach Notice activities for another company. As at 30 June 2017 the company has booked an appropriate provision of $1.3m for VAT. The ongoing impact of any changes related to the treatment of VAT is unknown. Refer to Note 29 for additional information.
1 Based on the average rates for FY16.
DividendsNo dividend has been paid or recommended by the Directors since the commencement of the financial year.
Significant changes in state of affairsThere were no significant changes in the state of affairs of the Group during the financial year other than items noted elsewhere in this Director’s Report.
Matters subsequent to the end of the financial yearThere have been no matters subsequent to the end of the financial year that have significantly affected, or may significantly affect the operations of the group, the results of those operations or the state of affairs of the group in future years.
Likely developments and expected results of operationsGrowth in Technology revenues is expected leveraging the Company’s current footprint in New Zealand, Australia and the United Kingdom and ongoing investment in sales and marketing in major markets. The Technology division will continue to develop a ‘Smart Cities’ platform which allow flexible options for ongoing development, is scalable and which will lead to a reduction in support and maintenance costs.
The Parking Management division currently operates primarily in the retail market in the United Kingdom and the majority of the revenue for the group will continue to be derived from this division. The performance of the division improved during the year. The improved run rate is expected to continue in FY18 and further growth is anticipated through the deployment of technology and improved service across existing and new sites. The group will continue to diversify its client base.
Rounding of amounts
Smart Parking Limited is a type of Company referred to in ASIC Corporations (Rounding in Directors’ Reports) Instrument 2016/191 and therefore the amounts contained in this report and in the financial report have been rounded to the nearest $1,000, or in certain cases, to the nearest dollar.
14
Directors’ Report (cont.)
Information on Directors
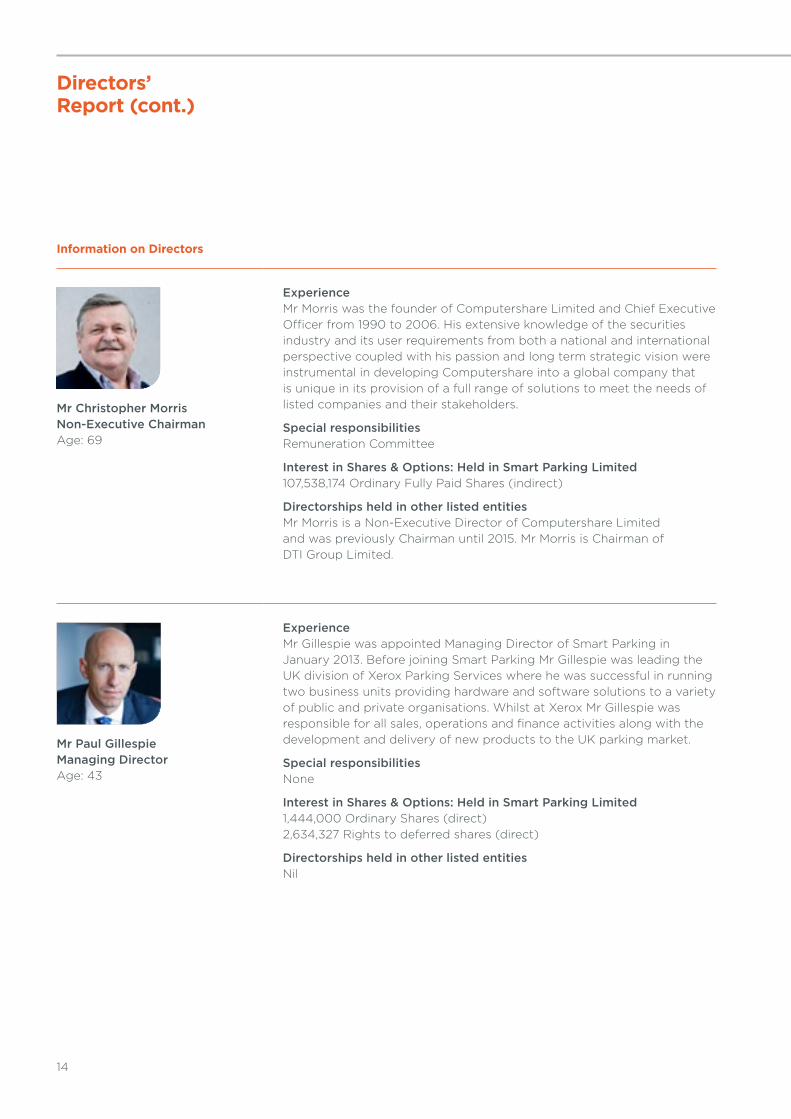
Mr Christopher Morris Non-Executive Chairman Age: 69
Experience Mr Morris was the founder of Computershare Limited and Chief Executive Officer from 1990 to 2006. His extensive knowledge of the securities industry and its user requirements from both a national and international perspective coupled with his passion and long term strategic vision were instrumental in developing Computershare into a global company that is unique in its provision of a full range of solutions to meet the needs of listed companies and their stakeholders.
Special responsibilities Remuneration Committee
Interest in Shares & Options: Held in Smart Parking Limited 107,538,174 Ordinary Fully Paid Shares (indirect)
Directorships held in other listed entities Mr Morris is a Non-Executive Director of Computershare Limited and was previously Chairman until 2015. Mr Morris is Chairman of DTI Group Limited.
Mr Paul Gillespie Managing Director Age: 43
Experience Mr Gillespie was appointed Managing Director of Smart Parking in January 2013. Before joining Smart Parking Mr Gillespie was leading the UK division of Xerox Parking Services where he was successful in running two business units providing hardware and software solutions to a variety of public and private organisations. Whilst at Xerox Mr Gillespie was responsible for all sales, operations and finance activities along with the development and delivery of new products to the UK parking market.
Special responsibilities None
Interest in Shares & Options: Held in Smart Parking Limited 1,444,000 Ordinary Shares (direct) 2,634,327 Rights to deferred shares (direct)
Directorships held in other listed entities Nil
Director's Report
Smart Parking Annual Report 2017 15
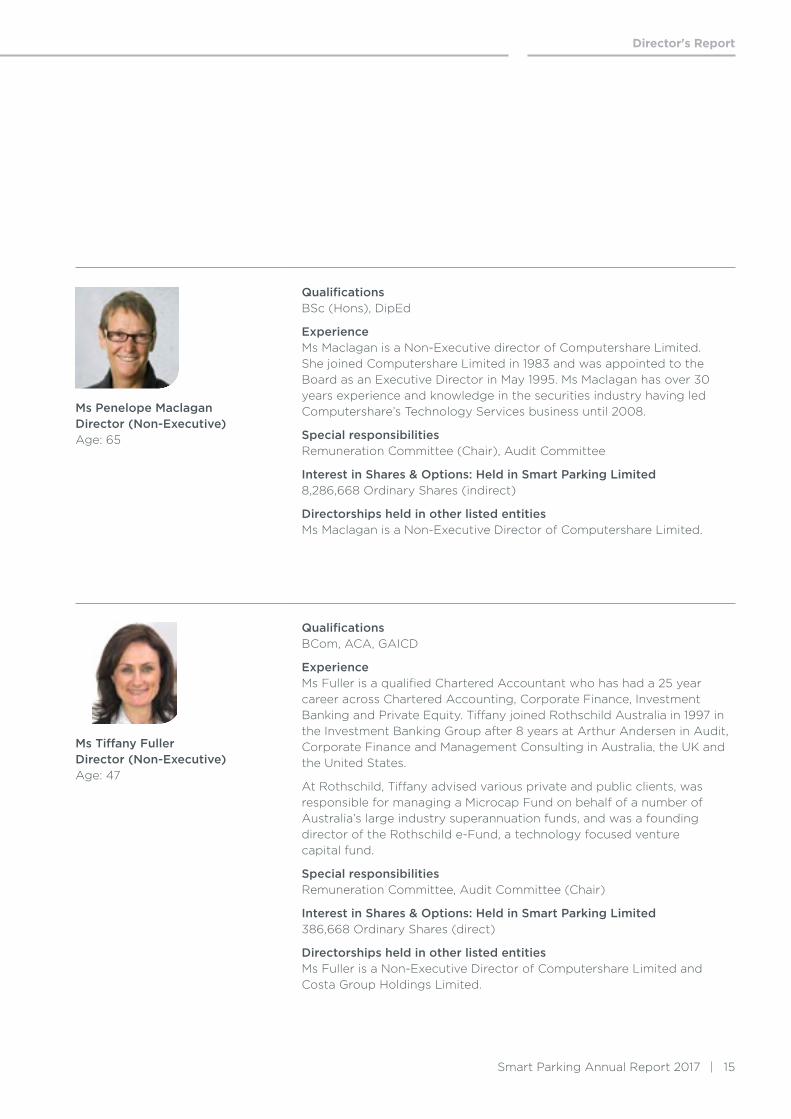
Ms Penelope Maclagan Director (Non-Executive) Age: 65
Qualifications BSc (Hons), DipEd
Experience Ms Maclagan is a Non-Executive director of Computershare Limited. She joined Computershare Limited in 1983 and was appointed to the Board as an Executive Director in May 1995. Ms Maclagan has over 30 years experience and knowledge in the securities industry having led Computershare’s Technology Services business until 2008.
Special responsibilities Remuneration Committee (Chair), Audit Committee
Interest in Shares & Options: Held in Smart Parking Limited 8,286,668 Ordinary Shares (indirect)
Directorships held in other listed entities Ms Maclagan is a Non-Executive Director of Computershare Limited.
Ms Tiffany Fuller Director (Non-Executive) Age: 47
Qualifications BCom, ACA, GAICD
Experience Ms Fuller is a qualified Chartered Accountant who has had a 25 year career across Chartered Accounting, Corporate Finance, Investment Banking and Private Equity. Tiffany joined Rothschild Australia in 1997 in the Investment Banking Group after 8 years at Arthur Andersen in Audit, Corporate Finance and Management Consulting in Australia, the UK and the United States.
At Rothschild, Tiffany advised various private and public clients, was responsible for managing a Microcap Fund on behalf of a number of Australia’s large industry superannuation funds, and was a founding director of the Rothschild e-Fund, a technology focused venture capital fund.
Special responsibilities Remuneration Committee, Audit Committee (Chair)
Interest in Shares & Options: Held in Smart Parking Limited 386,668 Ordinary Shares (direct)
Directorships held in other listed entities Ms Fuller is a Non-Executive Director of Computershare Limited and Costa Group Holdings Limited.

16
Directors’ Report (cont.)
Mr Jeremy King Director (Non-Executive) Age: 43
Qualifications LLB
Experience Mr King is a Director of Mirador Corporate Pty Ltd, where he specialises in corporate advisory matters. Mr King is a corporate lawyer with over 15 years’ experience in domestic and international legal, financial and corporate matters.
Special responsibilities Remuneration Committee, Audit Committee
Interest in Shares & Options: Held in Smart Parking Limited 640,000 Ordinary Shares (direct)
Directorships held in other listed entities Mr King is a Non-Executive Director of DTI Group Limited, Transcendence Technologies Limited, Red Mountain Mining Limited and EHR Resources Limited.
Directors meetings
The number of Directors’ meetings and the number of meetings attended by each of the Directors of the Company for the time the Director held office during the financial year are:
Director’s MeetingsAudit Committee
MeetingsRemuneration
Committee MeetingsA B A B A B
Mr Christopher Morris 5 5 - - 1 1
Mr Paul Gillespie 5 5 - - 1 1
Ms Penelope Maclagan 5 5 6 6 1 1
Ms Tiffany Fuller 5 5 6 6 1 1
Mr Jeremy King 5 4 6 6 1 1
A – Number of meetings held. B – Number of meetings attended.

Director's Report
Smart Parking Annual Report 2017 17
Remuneration Report
This remuneration report sets out remuneration information for Smart Parking Limited non-executive directors, executive directors and other key management personnel.
Directors and executives disclosed in this report
Non-executive and executive directors Mr Christopher Morris Non-executive Chairman
Mr Paul Gillespie Managing Director
Ms Penelope Maclagan Non-Executive Director
Ms Tiffany Fuller Non-Executive Director
Mr Jeremy King Non-Executive Director
Other key management personnelMr Richard Ludbrook Group Chief Financial
Officer and Company Secretary
Mr Ben Johnson UK Managing Director
The remuneration report is set out under the following main headings:
A Principles used to determine the nature and amount of remuneration
B Details of remuneration
C Service agreements
D Share-based compensation
E Other information
The information provided in this remuneration report has been audited as required by section 308 (3c) of the Corporations Act 2001.
A. Principles used to determine the nature and amount of remuneration
The Remuneration Committee is a committee of the Board. It is primarily responsible for making recommendations to the Board on:
• Non-Executive Directors fees
• Executive remuneration (directors and other executives), and
• The overarching executive remuneration framework and incentive plan policies.
Non-Executive Directors
Fees and payments to Non-Executive Directors reflect the demands which are made on them, and the responsibilities of, the Directors. Non-Executive Directors’ fees and payments are reviewed annually by the Board based on comparative roles in the external market. During the year Mr Morris, Ms Maclagan, Ms Fuller and Mr King have received Non-Executive Director fees for their services.
Directors’ fees
Non-Executive Directors’ fees are determined by the Board within an aggregate directors’ fee pool limit, which are periodically recommended for approval by shareholders. The maximum currently stands at $250,000 per annum as approved by Shareholders at the Annual General Meeting.
Non-executive Directors do not receive performance based pay. All directors receive a base fee of $40,000. Effective 1 October 2016, the Chairman received an additional $20,000 and the Chair of the Risk and Audit Committee received an additional $40,000 in recognition of the additional responsibilities which are commensurate with their respective roles.
The following fees have applied:
Base Fees2017
$2016
$Chairman1 55,000 40,000
Other non-executive directors2 150,000 120,000
1 The Chairman’s fees increased to $60,000 per annum effective 1 October 2016. 2 The Chair of the Audit and Risk Committee fees increased to $80,000 per
annum effective 1 October 2016.
18
Additional fees
A Director may also be paid fees or other amounts as the Directors determine if a Director performs special duties or otherwise performs services outside the scope of the ordinary duties of a Director. A Director may also be reimbursed for out of pocket expenses incurred as a result of their directorship or any special duties.
Executive remuneration
The executive remuneration and reward framework has three components:
• base pay and benefits;
• short-term incentives; and
• long-term incentives through the issue of share options and the Deferred Share and Incentive Plan.
The combination of these comprises the executive’s total remuneration.
Base remuneration and benefits
Structured as a total employment cost package which may be delivered as a combination of cash and prescribed non-financial benefits. Executives are offered a competitive base pay that comprises the fixed component of pay and rewards. Base remuneration for executives is reviewed annually to ensure the executive’s remuneration is competitive within the market. An executive’s total remuneration is also reviewed every 12 months.
Executives receive benefits including car allowances and reimbursement of business expenses.
Short term incentives
STI incentives for executives of Smart Parking for the year ended 30 June 2017 comprised of a cash bonus.
Executives are provided with an ‘on target package guide’ which is an amount equal to the value of the base salary and their STI assuming ‘on target’ performance. If an executive achieves ‘on target performance’ their total STI award could be approximately 21% of their base salary. The maximum entitlement that an executive could receive could be up to approximately 32% of their base salary.
The STI is based on Key Performance Indicators (KPI’s) with 70% relating to performance against budgeted EBITDA for the company and 30% related
to personal objectives tailored to the executive’s responsibilities and role. Matters typically covered include business expansion and service levels.
Long term incentives
The Group offers long term incentives to executives identified as key management personnel through an incentive plan.
Australian and United Kingdom based executives receive Smart Parking shares held in escrow for a period of 2-5 years. The shares are released from escrow at the end of the escrow period provided the executive remains employed at Smart Parking. New Zealand based executives receive deferred share rights which vest after 2 years provided the executive remains employed at Smart Parking after which the employee has 2 years to exercise their rights over Smart Parking shares.
Participation in the plan is at the Board’s discretion with 50% of the compensation based on the EPS performance compared to the prior year of the Group and 50% based on the Board’s assessment of an individual’s performance.
Voting and comments made at the Company’s last Annual General Meeting
Smart Parking Limited received more than 98% of ‘yes’ votes on its Remuneration Report for the financial year ended 30 June 2016. The Company received no specific feedback on its Remuneration Report at the Annual General Meeting.
Consequences of performance on shareholder wealth
In considering the Group’s performance and benefits for shareholder wealth, the Board have regard to the following indices in respect of the current financial year and the previous three financial years:
Item 2017 2016 2015 2014
EPS (cents per share)
(0.42) (0.51) (1.84) (3.43)
Net profit /(loss)
(1.4m) (1.5m) (5.4m) (7.0m)
Share price (30 June)
$0.27 $0.285 $0.093 $0.14
Remuneration Report (cont.)
Director's Report
Smart Parking Annual Report 2017 19
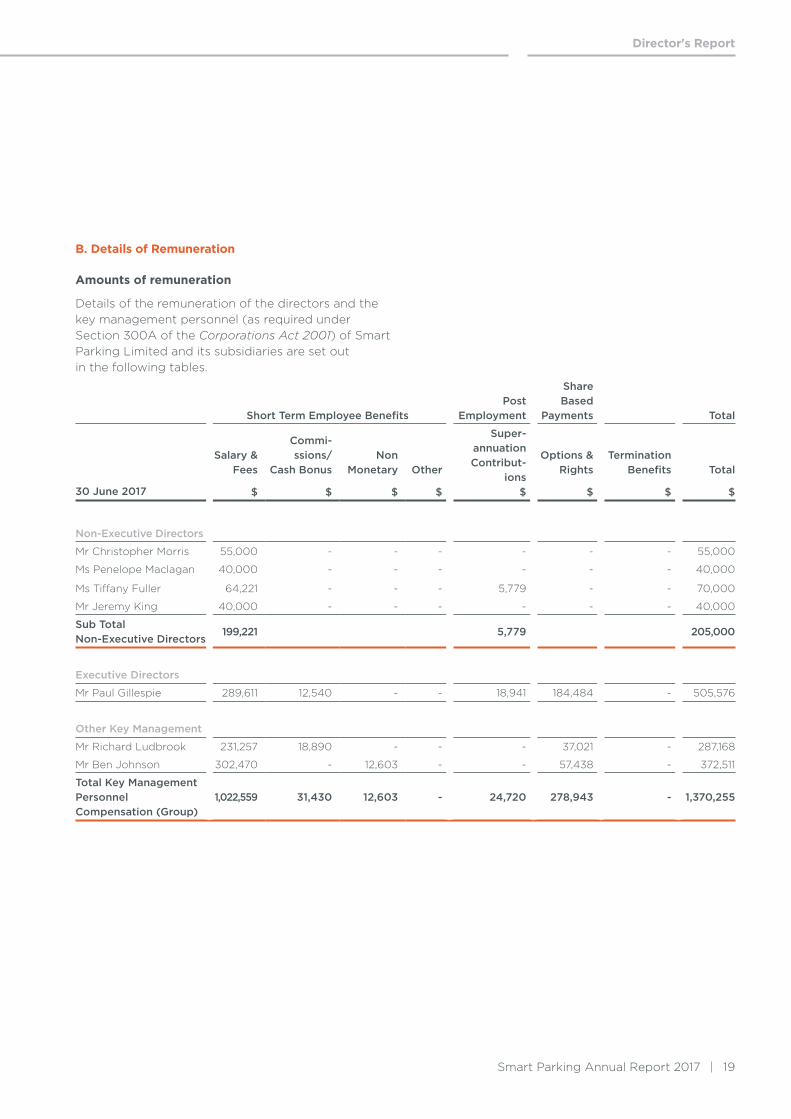
B. Details of Remuneration
Amounts of remuneration
Details of the remuneration of the directors and the key management personnel (as required under Section 300A of the Corporations Act 2001) of Smart Parking Limited and its subsidiaries are set out in the following tables.
Short Term Employee BenefitsPost
Employment
Share Based
Payments Total
30 June 2017
Salary & Fees
$
Commi-ssions/
Cash Bonus
$
Non Monetary
$
Other
$
Super-annuation Contribut-
ions $
Options & Rights
$
Termination Benefits
$
Total
$
Non-Executive Directors
Mr Christopher Morris 55,000 - - - - - - 55,000
Ms Penelope Maclagan 40,000 - - - - - - 40,000
Ms Tiffany Fuller 64,221 - - - 5,779 - - 70,000
Mr Jeremy King 40,000 - - - - - - 40,000
Sub Total Non-Executive Directors
199,221 5,779 205,000
Executive Directors
Mr Paul Gillespie 289,611 12,540 - - 18,941 184,484 - 505,576
Other Key Management
Mr Richard Ludbrook 231,257 18,890 - - - 37,021 - 287,168
Mr Ben Johnson 302,470 - 12,603 - - 57,438 - 372,511
Total Key Management Personnel Compensation (Group)
1,022,559 31,430 12,603 - 24,720 278,943 - 1,370,255

20
Remuneration Report (cont.)
Short Term Employee BenefitsPost
Employment
Share Based
Payments Total
30 June 2016
Salary & Fees
$
Commi-ssions/
Cash Bonus
$
Non Monetary
$
Other
$
Super-annuation Contribut-
ions $
Options & Rights
$
Termination Benefits
$
Total
$
Non-Executive Directors
Mr Christopher Morris 40,000 - - - - - - 40,000
Ms Penelope Maclagan 40,000 - - - - - - 40,000
Ms Tiffany Fuller 40,000 - - - - - - 40,000
Mr Jeremy King 40,000 - - - - - - 40,000
Sub Total Non-Executive Directors
160,000 160,000
Executive Directors
Mr Paul Gillespie 263,873 12,719 - - - 98,686 - 375,278
Other Key Management
Mr Richard Ludbrook 183,360 8,366 - - - 21,234 - 212,960
Mr Ben Johnson 366,300 - 15,263 - - 72,750 - 454,313
Total Key Management Personnel Compensation (Group)
973,533 21,085 15,263 - - 192,670 - 1,202,551
Director's Report
Smart Parking Annual Report 2017 21
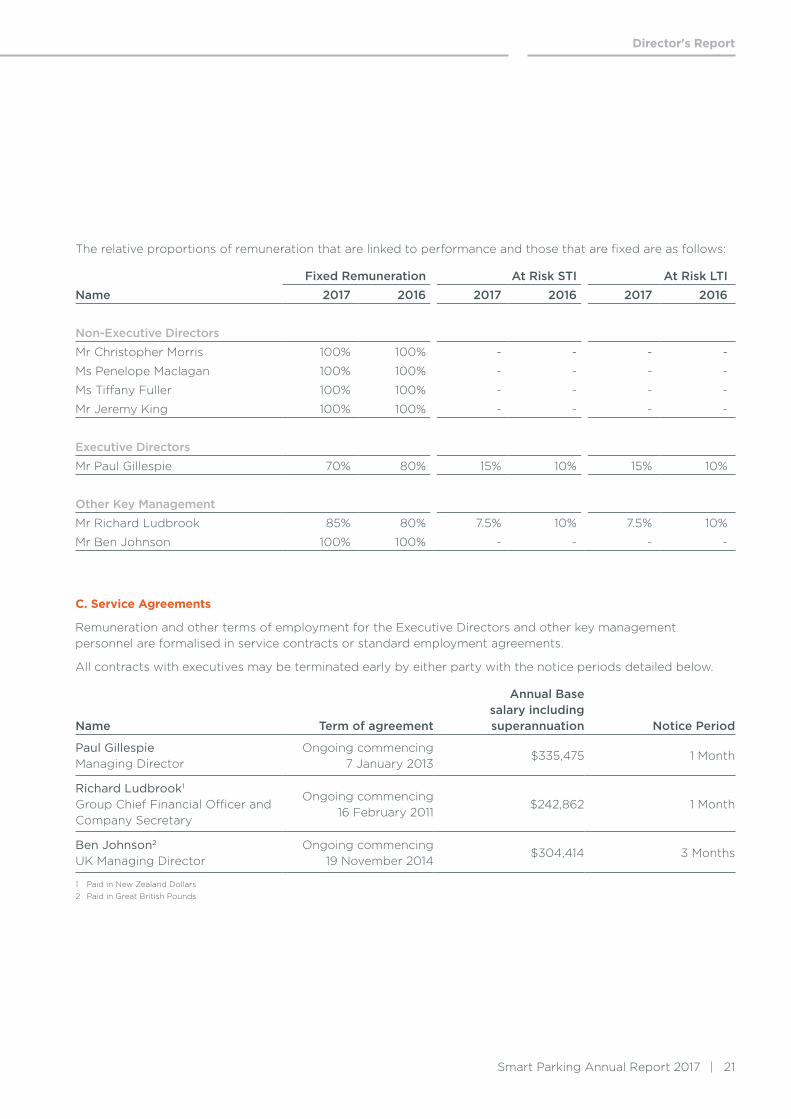
The relative proportions of remuneration that are linked to performance and those that are fixed are as follows:
Fixed Remuneration At Risk STI At Risk LTIName 2017 2016 2017 2016 2017 2016
Non-Executive DirectorsMr Christopher Morris 100% 100% - - - -
Ms Penelope Maclagan 100% 100% - - - -
Ms Tiffany Fuller 100% 100% - - - -
Mr Jeremy King 100% 100% - - - -
Executive DirectorsMr Paul Gillespie 70% 80% 15% 10% 15% 10%
Other Key ManagementMr Richard Ludbrook 85% 80% 7.5% 10% 7.5% 10%
Mr Ben Johnson 100% 100% - - - -
C. Service Agreements
Remuneration and other terms of employment for the Executive Directors and other key management personnel are formalised in service contracts or standard employment agreements.
All contracts with executives may be terminated early by either party with the notice periods detailed below.
Name Term of agreement
Annual Base salary including superannuation Notice Period
Paul Gillespie Managing Director
Ongoing commencing 7 January 2013
$335,475 1 Month
Richard Ludbrook1 Group Chief Financial Officer and Company Secretary
Ongoing commencing 16 February 2011
$242,862 1 Month
Ben Johnson2 UK Managing Director
Ongoing commencing 19 November 2014
$304,414 3 Months
1 Paid in New Zealand Dollars 2 Paid in Great British Pounds

22
D. Share-based compensation
Deferred Share and Incentive Plan
In January 2011 shareholders approved the establishment of a Deferred Share and Incentive Plan (Plan). The Plan was established to ensure that Smart Parking Limited has appropriate mechanisms in place to continue to attract and retain the services of employees of a high calibre and as compensation for past performance and incentive for future performance.
Under the Deferred Share and Incentive Plan Australian and United Kingdom based employees receive Smart Parking shares held in escrow for a period of 3 years. The shares are released from escrow at the end of the escrow period provided the employee remains employed at Smart Parking. New Zealand based employees receive deferred share rights which vest after 3 years provided the employee remains employed at Smart Parking after which the employee has 2 years to exercise their rights over Smart Parking shares. Participation in the plan is at the board’s discretion and no individual has a contractual right to participate in the plan or receive any guaranteed benefits.
At 30 June 2017 6,135,035 (2016: 5,592,283) deferred share rights or shares have been set aside under the Plan and 6,135,035 (2016: 5,592,283) deferred share rights or shares, depending on the relevant jurisdiction, have been allocated to employees.
The terms and conditions of each deferred share right affecting remuneration in the previous, this or future reporting periods are as follows:
Grant or Allocation Date
Date Vested or Date Released from Escrow Expiry Date
Exercise Price
Value Per Right /Share at Grant /Allocation Date % vested
1 October 2011 1 October 2014 1 October 2016 $0.00 $0.30 100%
20 February 2012 20 February 2015 20 February 2017 $0.00 $0.31 100%
1 July 2012 1 July 2015 1 July 2017 $0.00 $0.27 100%
29 August 2012 29 August 2015 29 August 2017 $0.00 $0.26 100%
1 December 2012 1 December 2015 1 December 2017 $0.00 $0.29 100%
1 January 2013 1 January 2016 1 January 2018 $0.00 $0.26 100%
6 January 2014 6 January 2017 6 January 2019 $0.00 $0.21 100%
10 February 2014 10 February 2016 10 February 2018 $0.00 $0.19 100%
1 July 2014 1 July 2017 1 July 2019 $0.00 $0.14 100%
1 August 2014 1 August 2017 1 August 2019 $0.00 $0.17 0%
16 September 2014 16 September 2016 16 September 2018 $0.00 $0.14 100%
28 November 2014 28 November 2016 28 November 2018 $0.00 $0.15 100%
2 March 2015 2 March 2016 2 March 2018 $0.00 $0.11 100%
2 March 2015 2 March 2017 2 March 2019 $0.00 $0.11 100%
2 March 2015 2 March 2018 2 March 2020 $0.00 $0.11 0%
1 July 2015 1 July 2018 21 August 2020 $0.00 $0.09 0%
21 August 2015 21 August 2017 21 August 2019 $0.00 $0.13 0%
1 November 2015 1 November 2018 1 November 2020 $0.00 $0.13 0%
1 September 2016 1 September 2019 1 September 2021 $0.00 $0.29 0%
22 September 2016 22 September 2018 22 September 2020 $0.00 $0.29 0%
7 November 2016 7 November 2018 7 November 2020 $0.00 $0.30 0%
7 November 2016 7 November 2019 7 November 2021 $0.00 $0.30 0%
7 November 2016 7 November 2020 7 November 2022 $0.00 $0.30 0%
7 November 2016 7 November 2021 7 November 2023 $0.00 $0.30 0%
Remuneration Report (cont.)

Director's Report
Smart Parking Annual Report 2017 23
Employee Options
There were no options granted for the year ending 30 June 2017.
Director Options
There were no options granted or vested to Directors or other key management personnel during the year ending 30 June 2017 other than 2,218,942 shares granted to Mr Gillespie and 148,810 deferred share rights granted to Mr Ludbrook as part of the long term incentives included in their remuneration.
The assessed fair value at grant date of options granted to the individuals is allocated over the period from grant date to vesting date, and the amount is included in the remuneration tables above. Fair values at grant date are independently determined using a Black-Scholes option pricing model that takes into account the exercise price, the term of the option, the impact of dilution, the share price at grant date and expected price volatility of the underlying share, the expected dividend yield and the risk-free interest rate for the term of the option.
Further information on the options is set out in note 23 to the financial statements.
Shares issued on the exercise of options
There were no share options exercised during the year ended 30 June 2017.
Shares under option
There were no unissued ordinary shares in Smart Parking Limited under option at the date of this report.
Bonuses included in remuneration
Details of the short term incentive cash bonuses awarded as remuneration to each Key Management Personnel, the percentage of the available bonus that was paid in the financial year, and the percentage that was forfeited because the person did not meet the service and performance criteria is set out below. No part of the bonus is payable in future years.
STI included in remuneration
($)
STI as percentage of
maximum
Mr Paul Gillespie 12,540 25%
Mr Richard Ludbrook 18,890 53%

24
E. Other information
Deferred shares and rights held by Key Management Personnel
The number of options to acquire shares in the Company held during the 2017 reporting period by each of the Key Management Personnel of the Group; including their related parties are set out below.
2017
Name
Balance at the start of the year
Granted as compensation
Exercised/Released
from Escrow
Balance at end
of the yearVested and exercisable Unvested
DirectorsMr Paul Gillespie 1,665,385 2,218,942 (1,250,000) 2,634,327 - 2,634,327
Other key management personnelMr Richard Ludbrook 226,140 148,810 - 374,950 - 374,950
Mr Ben Johnson 1,350,000 - (350,000) 1,000,000 - 1,000,000
Total 3,241,525 2,367,752 (1,600,000) 4,009,277 - 4,009,277
Shares held by key management personnel
The number of ordinary shares in the Company during the 2017 reporting period held by each of the Group’s Key Management Personnel, including their related parties, is set out below:
2017
Name
Balance at the start of the year
1 for 7 Entitlement
OfferGranted as
Remuneration Disposals
Balance at end
of the year
DirectorsMr Christopher Morris 94,095,902 13,442,272 - - 107,538,174
Mr Paul Gillespie 194,000 - 1,250,000 - 1,444,000
Ms Penelope Maclagan 7,250,834 1,035,834 - - 8,286,668
Mr Tiffany Fuller 338,334 48,334 - - 386,668
Mr Jeremy King 560,000 80,000 - - 640,000
Other key management personnelMr Richard Ludbrook 762,245 - - (75,000) 687,245
Mr Ben Johnson - - 350,000 - 350,000
Total 103,201,315 14,606,440 1,600,000 (75,000) 119,332,755
Remuneration Report (cont.)
Director's Report
Smart Parking Annual Report 2017 25
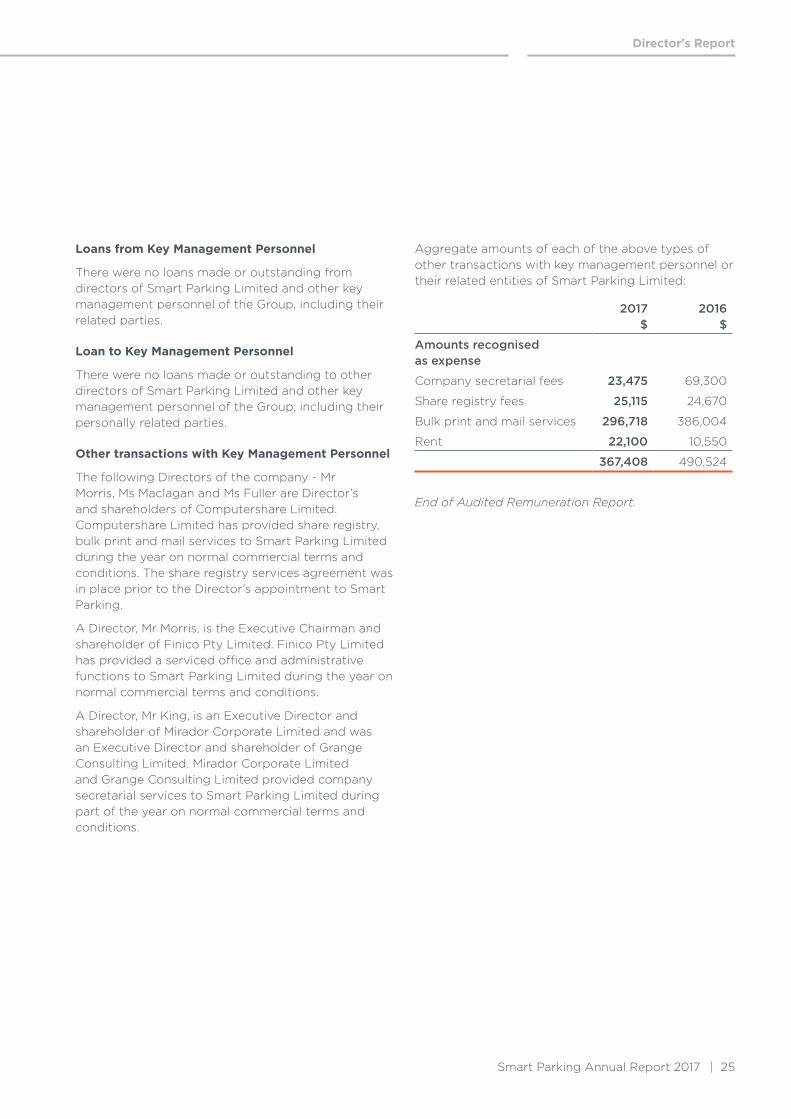
Loans from Key Management Personnel
There were no loans made or outstanding from directors of Smart Parking Limited and other key management personnel of the Group, including their related parties.
Loan to Key Management Personnel
There were no loans made or outstanding to other directors of Smart Parking Limited and other key management personnel of the Group, including their personally related parties.
Other transactions with Key Management Personnel
The following Directors of the company - Mr Morris, Ms Maclagan and Ms Fuller are Director’s and shareholders of Computershare Limited. Computershare Limited has provided share registry, bulk print and mail services to Smart Parking Limited during the year on normal commercial terms and conditions. The share registry services agreement was in place prior to the Director’s appointment to Smart Parking.
A Director, Mr Morris, is the Executive Chairman and shareholder of Finico Pty Limited. Finico Pty Limited has provided a serviced office and administrative functions to Smart Parking Limited during the year on normal commercial terms and conditions.
A Director, Mr King, is an Executive Director and shareholder of Mirador Corporate Limited and was an Executive Director and shareholder of Grange Consulting Limited. Mirador Corporate Limited and Grange Consulting Limited provided company secretarial services to Smart Parking Limited during part of the year on normal commercial terms and conditions.
Aggregate amounts of each of the above types of other transactions with key management personnel or their related entities of Smart Parking Limited:
2017 $
2016 $
Amounts recognised as expense
Company secretarial fees 23,475 69,300
Share registry fees 25,115 24,670
Bulk print and mail services 296,718 386,004
Rent 22,100 10,550
367,408 490,524
End of Audited Remuneration Report.

26
Indemnities given and insurance premiums paid to auditors and officers
During the financial year, Smart Parking Limited paid a premium of $10,577 to insure the directors and secretary of the Company and its controlled entities, and the general managers of each of the divisions of the Group.
The liabilities insured are legal costs that may be incurred in defending civil or criminal proceedings that may be brought against the officers in their capacity as officers of entities in the Group, and any other payments arising from liabilities incurred by the officers in connection with such proceedings. This does not include such liabilities that arise from conduct involving a wilful breach of duty by the officers or the improper use by the officers of their position or of information to gain advantage for them or someone else or to cause detriment to the Company. It is not possible to apportion the premium between amounts relating to the insurance against legal costs and those relating to other liabilities.
The Group has not otherwise, during or since the end of the financial year, except to the extent permitted by law indemnified or agreed to indemnify any current or former officer or auditor of the Group against a liability incurred by such an officer or auditor.
Proceedings on behalf of the Company
No person has applied to the Court under section 237 of the Corporations Act 2001 for leave to bring proceedings on behalf of the Company, or to intervene in any proceedings to which the Company is a party, for the purpose of taking responsibility on behalf of the Company for all or part of those proceedings.
No proceedings have been brought or intervened in on behalf of the Company with leave of the Court under section 237 of the Corporations Act 2001.
Non-audit services
The Company may decide to employ the auditor on assignments additional to their statutory audit duties where the auditor’s expertise and experience with the Company and/or the Group are important.
Details of the amounts paid or payable to the auditors (Grant Thornton) for audit and non-audit services provided during the year are set out below.
The board of directors has considered the position and, in accordance with advice received from the audit committee, is satisfied that the provision of the non-audit services is compatible with the general standard of independence for auditors imposed by the Corporations Act 2001. The directors are satisfied that the provision of non-audit services by the auditor, as set out below, did not compromise the auditor independence requirements of the Corporations Act 2001 for the following reasons:
• All non-audit services have been reviewed by the audit committee to ensure they do not impact the impartiality and objectivity of the auditor; and
• None of the services undermine the general principles relating to auditor independence as set out in APES 110 Code of Ethics for Professional Accountants.
During the year the following fees were paid or payable for services provided by the auditor of the parent entity, its related practices and non-related audit firms:
Consolidated2017 2016
Audit ServicesAudit and review of financial reports
Grant Thornton, Australia 63,000 70,500
Grant Thornton, United Kingdom 52,260 67,209
Total remuneration for audit services
115,260 137,709
Non-audit servicesGrant Thornton, United Kingdom
Corporate advisory services - 50,878
Total remuneration for non-audit related services
- 50,778
Directors’ Report (cont.)

Director's Report
Smart Parking Annual Report 2017 27
Auditor’s Independence Declaration
A copy of the Auditors’ Independence Declaration as required under section 307C of the Corporations Act 2001 is set out on page 37.
This report is signed in accordance with a resolution of Directors.
Corporate Governance StatementSmart Parking Limited and the board are committed to achieving and demonstrating the highest standards of corporate governance. Smart Parking Limited has reviewed its corporate governance practices against the Corporate Governance Principles and Recommendations (3rd edition) published by the ASX Corporate Governance Council.
The 2017 Corporate Governance Statement is dated as at 30 June 2017 and reflects the corporate governance practices in place throughout the 2017 year. The 2017 Corporate Governance Statement was approved by the Board on 29 September 2017. A description of the group’s current corporate governance practices is set out in the group’s Corporate Governance Statement which can viewed at www.smartparking.com/investors
Christopher Morris Non-Executive Chairman
29 September 2017
Paul Gillespie Managing Director

28
The Board of Directors of Smart Parking Limited (“SPZ”) is responsible for the corporate governance of the Company. The Board guides and monitors the business and affairs of the Company on behalf of the shareholders by whom they are elected and accountable. The Board continuously reviews its governance practices to ensure they remain consistent with the needs of the Company.
The Company complies with each of the recommendations set out in the Australian Securities Exchange Corporate Governance Council’s Corporate Governance Principles and Recommendations 3rdEdition (“the ASX Principles”) where considered appropriate for a company of SPZ’s size, nature and stage of development. This statement incorporates the disclosures required by the ASX Principles under the headings of the eight core principles as adopted by the Company.
Further details in respect to the Company’s corporate governance practises are summarised below and copies of Company’s corporate governance policies are available of the Company’s website at www.smartparking.com
Principle 1: Lay solid foundations for management and oversightA listed entity should establish and disclose the respective roles and responsibilities of its board and management and how their performance is monitored and evaluated.
Recommendation 1.1
A listed entity should disclose:
a) The respective roles and responsibilities of its board and management; and
b) Those matters expressly reserved to the board and those delegated to management.
The Company has established the functions reserved to the Board and has set out these functions in its Board Charter. The Board is responsible for oversight of management and the overall corporate governance of the Company including its strategic direction, establishing goals for management and monitoring the achievement of those goals, monitoring systems of risk management and internal control, codes of conduct and legal compliance.
The responsibility for the operation and administration of the Company is delegated by the Board to the Managing Director and management team. The Board ensures that both the Managing Director and the management team are appropriately qualified and experienced to discharge their responsibilities and have procedures in place to monitor and assess their performance. The management team are responsible for supporting and assisting the Managing Director to conduct the general operations and financial business of the Company in accordance with the delegated authority of the Board and to progress the strategic direction provided by the Board.
Recommendation 1.2
A listed entity should:
a) Undertake appropriate checks before appointing a person, or putting forward to security holders a candidate for election, as a director; and
b) Provide security holders with all material information in its possession relevant to a decision on whether or not to elect or re-elect a director.
The full Board carries out the role of the Nomination Committee.
Accordingly, the responsibility for the selection of potential directors lies with the full Board of the Company. A separate Nomination Committee has not been constituted because the Board considers that the size of the current full Board permits it to act as the Nomination Committee and to regularly review membership. This includes an assessment of the necessary and desirable competencies of Board members, Board succession plans and an evaluation of the Board’s performance and consideration of appointments and approvals.
When a Board vacancy occurs, the Board acting as the Nomination Committee, identifies the particular skills, experience and expertise that will best complement Board effectiveness, and then undertakes a process to identify candidates who can meet those criteria.
Directors are not appointed for specific terms, as their periods in office are regularly reviewed as part of annual performance evaluation processes and they are subject to re-election every three (3) years.
Corporate GovernanceFor the year ended 30 June 2017

Corporate Governance
Smart Parking Annual Report 2017 29
The Company undertakes appropriate checks before appointing a person, or putting forward to shareholders a candidate for election, as a Director. Candidates are assessed through interviews, meetings and/or background and reference checks (which may be conducted both by external consultants and by Directors) as appropriate.
The Company provides shareholders all material information in its possession relevant to the decision on whether or not to elect (or re-elect) a Director, either in the Notice of Meeting at which the election of the Director is to be held, or by including in the notice a clear reference to the location on the Company’s website, Annual Report or other document lodged with ASX where the information can be found.
Recommendation 1.3
A listed entity should have a written agreement with each director and senior executive setting out the terms of their appointment.
Appointment terms of the Company’s Directors and senior executives are summarised in written agreements.
Recommendation 1.4
The company secretary of a listed entity should be accountable to the board through the chair, on all matters to do with the proper functioning of the board.
The Company’s Secretary is accountable to the Company’s Board through the chair, ensuring the Company’s Board receives adequate support to function properly.
Recommendation 1.5
A listed entity should:
a) Have a diversity policy in place which includes requirements for the board or a relevant committee of the board to set measurable objectives for achieving gender diversity and to assess annually both the objectives and the entity’s progress in achieving them;
b) Disclose that policy or a summary of it; and
c) Disclose as at the end of each reporting period the measurable objectives for achieving gender diversity set by the board or a relevant
committee of the board in accordance with the entity’s diversity policy and its progress towards achieving them and either:
1) The respective proportions of men and women on the board, in senior executive positions and across the whole organisation (including how the entity has defined “senior executive” for these purposes; or
2) If the entity is a “relevant employer” under the Workplace Gender Equality Act, the entity’s most recent “Gender Equality Indicators,” as defined in and published under that Act.
The Company recognises that a talented and diverse workforce is a key competitive advantage and that an important contributor to the Company’s success is the quality, diversity and skills of its people. The Board does not consider that at this stage it is appropriate to adopt a policy specifically addressing diversity, but will consider adopting a policy as the company grows.
Other than as described above, the Company has not yet set measurable objectives for achieving gender diversity. The Company is currently not of a size that justifies the establishment of measurable diversity objectives. As the Company develops, the Board will seek to develop a reporting framework in the future to report the Company’s progress against the objectives and strategies for achieving a diverse workplace which can be used as a guide to be used by the Company to identify new Directors, senior executives and employees.
Ms Tiffany Fuller and Ms Penelope Maclagan are both women who hold Non-Executive board positions. The proportion of women employees in the Group is approximately 23% and 31% of salaried staff. A proportion of the work force is car parking attendants who due to the nature of the work tend to be male.
Recommendation 1.6
A listed entity should:
a) Have and disclose a process for periodically evaluating the performance of the board, its committees and individual Directors; and
b) Disclose, in relation to each reporting period, whether a performance evaluation was undertaken in the reporting period in accordance with that process.

30
Corporate Governance (cont.)
The Board as a whole has responsibility to review its own performance, the performance of individual directors and the performance of the Board Committees. The Chair of the Board may also meet individually with each Board member to discuss their performance. Non-executive Directors may also meet to discuss the performance of the Chair or the Managing Director.
The Managing Director’s performance is regularly assessed by the Chairman and the Non-Executive Directors and in addition, the Managing Director’s performance is formally assessed annually in the context of incentive remuneration assessment.
Recommendation 1.7
A listed entity should:
a) Have and disclose a process for periodically evaluating the performance of its senior executives; and
b) Disclose, in relation to each reporting period, whether a performance evaluation was undertaken in the reporting period in accordance with that process.
Each of the Group’s senior executives, including the Chief Executive Officer, has a service agreement that clearly sets out his or her role and the Group’s expectations in terms of performance.
Performance of senior management is reviewed by the Remuneration Committee annually or more frequently if required. The Board as a whole may then hold a facilitated discussion during which each Board member has the opportunity to raise any matter, suggestion for improvement or criticism with senior executives.
The Company monitors and assesses senior management via the Chief Executive Officer who reports on the progress of senior management at each Board meeting.
Principle 2: Structure the Board to add valueA listed entity should have a board of an appropriate size, composition, skills and commitment to enable it to discharge its duties effectively.
Recommendation 2.1
The board of a listed entity should:
a) Have a nomination committee which:
1) Has at least three members, a majority of whom are independent Directors; and
2) Is chaired by an independent director, and disclose:
3) The charter of the committee;
4) The members of the committee; and
5) As at the end of each reporting period, the number of times the committee met throughout the period and the individual attendances of the members at those meetings; or
b) If it does not have a nomination committee, disclose that fact and the processes it employs to address board succession issues and to ensure that the board has the appropriate balance of skills, knowledge, experience, independence and diversity to enable it to discharge its duties and responsibilities effectively.
The Board is currently not of a relevant size that justifies the formation of a separate Nomination Committee. The full Board also operates as the Nomination Committee.
The Board oversees the appointment and induction process for Directors and the selection, appointment and succession planning process of the Company’s Managing Director, where relevant. When a vacancy exists or there is a need for a particular skill, the Board, determines the selection criteria that will be applied. The Board will then identify suitable candidates with assistance from an external consultant if required, and will interview and assess the selected candidates.

Corporate Governance
Smart Parking Annual Report 2017 31
Directors are initially appointed by the Board and must stand for re-election at the Company’s next Annual General Meeting of shareholders. Directors must then retire from office and nominate for re-election at least once every three years with the exception of the Managing Director.
The Company’s succession plans are designed to maintain an appropriate balance of skills, knowledge, experience, independence and diversity on the Board. The Board continues to review its composition with a view to enhancing its base of skills and experience.
The Board is responsible for conducting new Director inductions. Professional development opportunities are considered on an individual Director basis, with opportunities provided to individual Directors where appropriate.
Recommendation 2.2
A listed entity should have and disclose a board skills matrix setting out the mix of skills and diversity that the board currently has or is looking to achieve in its membership.
The Board has developed a Board skills matrix which sets out the skills and experiences that the Board has or is looking to achieve. The following table summarises the key skills of the existing non-executive directors:
Leadership and Governance• Strategy• Innovation and Entrepreneurship• CEO level experience• Other non-executive director experience• Corporate governance
Financial and risk• Accounting, finance and Tax• Audit, risk and compliance
Business experience• M&A and capital markets experience• International business experience• Outsourced business services• Business development/access to networks• Parking business and related industry experience• Local government/councils and tender business• Listed company experience
Geographic experience• North America• UK and Europe• Asia• Australia
Other• Technology• HR/remuneration• Legal
Gaps in the collective skills of the Board are regularly reviewed by the Board as a whole, with the Board proposing candidates for directorships having regard to the desired skills and experience required by the Company as well as the proposed candidates’ diversity of background.
Recommendation 2.3
A listed entity should disclose:
a) The names of the Directors considered by the board to be Independent Directors;
b) If a Director has an interest, position, association or relationship that might cause doubts about their independence as a director but the board is of the opinion that their independence isn’t compromised, the nature of the interest, position, association or relationship in question and an explanation of why the board is of that opinion; and
c) The length of service of each Director.
The Board considers an independent director to be a Non-Executive Director who is not a member of the Company’s senior executive and who is free of any interest, position, association or relationship that might influence, or reasonably be perceived to influence, in a material respect his or her capacity to bring an independent judgement to bear on issues before the Board and to act in the best interest of the Company and its shareholders.
The current Board composition includes four Non-Executive Directors, two of which are considered independent.

32
Ms Tiffany Fuller is regarded as an Independent Director. The other Directors are satisfied that she brings an independent judgement to bear on all matters considered by the Board.
Mr Jeremy King is regarded as an Independent Director. The other Directors are satisfied that he brings an independent judgement to bear on all matters considered by the Board.
Mr Paul Gillespie is not regarded as an independent director as he is Managing Director of the Company.
Mr Chris Morris is not regarded as an independent director as he is a substantial shareholder of the Company.
Ms Penelope Maclagan is not regarded as an independent director as she is related to Mr Morris.
Details of each Director’s backgrounds including experience, knowledge and skills are set out in the Directors Report of this Annual Report.
Recommendation 2.4
A majority of the board of a listed entity should be Independent Directors.
See above, at 2.3.
Recommendation 2.5
The chair of the board of a listed entity should be an Independent Director and, in particular, should not be the same person as the CEO of the entity.
The Chairman, Mr Chris Morris, is not the CEO of the Company. He is not considered independent, for the reasons set out above. However, Mr Morris provides significant expertise and international business experience and the balance of the Board is collectively satisfied that Mr Morris exercises independent judgement in carrying out his duties as Chairman of the Company. To the extent that the Board views any Director to have a conflict or perceived conflict of interest in matters that come before the Board then such Directors will be required to excuse themselves from the relevant decision making process
Recommendation 2.6
A listed entity should have a program for inducting new Directors and provide appropriate professional development opportunities for Directors to develop and maintain the skills and knowledge needed to perform their role as Directors effectively.
The process for this is outlined in 2.1 above.
Principle 3: Act ethically and responsiblyA listed entity should act ethically and responsibly.
Recommendation 3.1
A listed entity should:
a) Have a code of conduct for its Directors, senior executives and employees; and
b) Disclose that code or a summary of it.
The Company recognises the importance of establishing and maintaining high ethical standards and decision making in conducting its business and is committed to increasing shareholder value in conjunction with fulfilling its responsibilities as a good corporate citizen. All Directors, managers and employees are expected to act with the utmost integrity, honesty and objectivity, striving at all times to enhance the reputation and performance of the Company.
The Company has established a Code of Conduct which can be viewed on its website. Unethical practices, including fraud, legal and regulatory breaches and policy breaches are required to be reported on a timely basis to management and will result in disciplinary action, including in some cases termination.
Principle 4: Safeguard integrity in corporate reporting A listed entity should have formal and rigorous processes that independently verify and safeguard the integrity of its corporate reporting.
Recommendation 4.1
The board of a listed entity should:
a) Have an audit committee which:
1) Has at least three members, all of whom are Non-executive Directors and a majority of whom are Independent Directors; and
Corporate Governance (cont.)

Corporate Governance
Smart Parking Annual Report 2017 33
2) Is chaired by an Independent Director, who is not the chair of the board, and disclose:
3) The charter of the committee;
4) The relevant qualifications and experience of the members of the committee; and
5) In relation to each reporting period, the number of times the committee met throughout the period and the individual attendances of the members at those meetings; or
b) If it does not have an audit committee, disclose that fact and the processes it employs that independently verify and safeguard the integrity of its corporate reporting, including the processes for the appointment and removal of the external auditor and the rotation of the audit engagement partner.
The Audit and Risk Committee is governed by a Board approved charter which is disclosed on the Company’s website.
The principal function of the Audit and Risk Committee is to provide assistance to the Board in fulfilling its corporate governance and oversight responsibilities in relation to the Company’s financial reporting, internal control structure, risk management systems and external audit functions.
The Audit and Risk Committee is chaired by Ms Tiffany Fuller who is not the Chair of the Company. The Committee currently has two other permanent non-executive director members being Ms Penelope Maclagan and Mr Jeremy King.
The Board considers that these members have the required financial expertise and an appropriate understanding of the markets in which the Group operates. The Managing Director, Chief Financial Officer and the Company’s external auditors are invited to meetings of the Audit and Risk Committee at the Committee’s discretion.
Meetings of the Audit & Risk Committee and member’s attendance is disclosed in full in the Directors Report.
Recommendation 4.2
The board of a listed entity should, before it approves the entity’s financial statements for a financial period, receive from its CEO and CFO a declaration that, in their opinion, the financial records of the entity have been properly maintained and that the financial statements comply with the appropriate accounting
standards and give a true and fair view of the financial position and performance of the entity and that the opinion has been formed on the basis of a sound system of risk management and internal control which is operating effectively.
In accordance with Recommendation 4.2 and Section 295A of the Corporations Act 2001 the Board receives a signed declaration from the CFO and Managing Director prior to the approval of the Company’s financial statements.
Recommendation 4.3
A listed entity that has an AGM should ensure that its external auditor attends its AGM and is available to answer any questions from security holders relevant to the audit.
The Company welcomes the attendance of its auditor at its Annual General Meeting.
Principle 5: Make timely and balanced disclosureA listed entity should make timely and balanced disclosure of all matters concerning it that a reasonable person would expect to have a material effect on the price or value of its securities.
Recommendation 5.1A listed entity should:
(a) Have a written policy for complying with its continuous disclosure obligations under the Listing Rules; and
(b) Disclose that policy or a summary of it.
The Company has established policies and procedures to ensure timely disclosure of all material matters and ensure that investors have access to information on the Company’s operating and financial performance. This ensures the Company is compliant with the information disclosure requirements under the ASX Listing Rules. The policies and procedures include a Market Disclosure Policy that includes identification of matters that may have a material impact on the price of the Company’s securities, notifying them to the ASX, posting relevant information on the Company’s website and issuing media releases.

34
Matters involving potential market sensitive information must first be reported to the Managing Director (or in the absence of a Managing Director, the Chair) either directly or via the Company Secretary. The Managing Director/Chair will advise the Board if the issue is important enough and if necessary seek external advice. In all cases, the appropriate action must be determined and carried out in a timely manner in order for the Company to comply with the Information Disclosure requirements of the ASX.
A copy of the Market Disclosure Policy is available on the Company’s website and outlines the processes that the Company implements to ensure compliance with its continuous disclosure obligations. The Board receives regular reports on the status of the Company’s activities. Continuous disclosure is reviewed as a routine agenda item at Board meetings.
Principle 6: Respect the rights of security holdersA listed entity should respect the rights of its security holders by providing them with appropriate information and facilities to allow them to exercise those rights effectively.
Recommendation 6.1A listed entity should provide information about itself and its governance to investors via its website.
In line with adherence to the continuous disclosure requirements of the ASX all shareholders are kept informed of major developments affecting the Company. This disclosure is through regular shareholder communications including the Annual Report, Half Yearly Report, the Company’s website and the distribution of specific releases covering major transactions and events or other price sensitive information in accordance with the ASX Continuous Disclosure guidelines.
The Company values its relationship with shareholders and understands the importance of timely communication with them. To keep shareholders informed, the Company releases announcements on its activities via the ASX website.
Comprehensive information regarding the Company’s activities, policies and procedures is also available on the Company’s website.
Recommendation 6.2A listed entity should design and implement an investor relations program to facilitate effective two-way communication with investors.
Smart Parking has an investor relations programme in place with the aim of facilitating effective communication between Smart Parking and its investors. A key feature of the programme is to ensure that shareholders are notified of, or are otherwise able to access information necessary to assess Smart Parking’s performance. Information is communicated to shareholders through the following means:
• The Annual Report, which is distributed to all shareholders who elect to receive it.
• The AGM and any other shareholder meetings called from time to time as required.
• The Investor Relations section of the Company’s website includes information released to the ASX and press releases.
• By email to those shareholders who have supplied their email address for the purpose of receiving communications from the Company electronically. Smart Parking actively encourages shareholders to provide an email address to facilitate more timely and effective communication.
• The Company’s investor relations programme includes scheduled interactions and briefings with institutional investors and analysts.
Recommendation 6.3A listed entity should disclose the policies and processes it has in place to facilitate and encourage participation at meetings of security holders.
The Company acknowledges that respecting shareholders rights is of fundamental importance and that communication with shareholders is a key element of this. Shareholders are encouraged to attend general meetings for the opportunity to meet the Board and senior management. The Company’s Shareholder Communication Policy addresses security holder attendance at Shareholder Meetings.
Recommendation 6.4A listed entity should give security holders the option to receive communications from, and send communications to, the entity and its security registry electronically.
Corporate Governance (cont.)

Corporate Governance
Smart Parking Annual Report 2017 35
The Company encourages the use of electronic communication and offers Security Holders the option to receive and send electronic communication to the Company and its share registry where possible.
Principle 7: Recognise and manage riskA listed entity should establish a sound risk management framework and periodically review the effectiveness of that framework.
Recommendation 7.1The board of a listed entity should:
a) Have a committee or committees to oversee risk, each of which:
1) Has at least three members, a majority of whom are Independent Directors; and
2) Is chaired by an Independent Director, and disclose:
3) The charter of the committee;
4) The members of the committee; and
5) As at the end of each reporting period, the number of times the committee met throughout the period and the individual attendances of the members at those meetings; or
b) If it does not have a risk committee or committees that satisfy (a) above, disclose that fact and the processes it employs for overseeing the entity’s risk management framework.
The Audit and Risk Committee is governed by a Board approved charter which is disclosed on the Company’s website. The Company’s Audit and Risk Committee is responsible for overseeing, monitoring and periodically reviewing the Company’s risk management system. The Company has a Risk Management Policy which can be found on the Company’s website. The Company’s management is responsible for managing operational risk and for implementing risk mitigation measurement within parameters set by the Board.
Recommendation 7.2The board or a committee of the board should:
a) Review the entity’s risk management framework at least annually to satisfy itself that it continues to be sound; and
b) Disclose, in relation to each reporting period, whether such a review has taken place.
The Audit and Risk Committee is responsible for reviewing the Company’s risk management framework. Risk framework reviews occur annually or more frequently as necessitated by changes in the Company and its operating environment.
A formal and detailed risk framework review has taken place during the financial year ended 30 June 2017.
Recommendation 7.3A listed entity should disclose:
a) If it has an internal audit function, how the function is structured and what role it performs; or
b) If it does not have an internal audit function, that fact and the processes it employs for evaluating and continually improving the effectiveness of its risk and internal control processes.
Given the Company’s size and current stage of development it does not have an internal audit function.
The Board and the Audit and Risk Committee are responsible for overseeing the establishment and implementation of effective risk management and internal control systems to manage the Company’s material business risks and for reviewing and monitoring the Company’s application of those systems. Monitoring procedures include:
• Annual budgeting and monthly reporting to monitor performance
• External financial audits
• Approved limits for matters requiring Board approval
• Annual review of the insurance programme
• Bi-annual review and assessment of risks facing the Company
Recommendation 7.4A listed entity should disclose whether it has any material exposure to economic, environmental and social sustainability risks and, if it does, how it manages or intends to manage those risks.
The Audit and Risk Committee and the Board assists management to determine whether the Company has any material exposure to economic, environmental and social sustainability risks, and, if it does, how it manages or intends to manage those risks. The Company discloses this information in its Annual Report.
36
Principle 8: Remunerate fairly and responsibly A listed entity should pay director remuneration sufficient to attract and retain high quality Directors and design its executive remuneration to attract, retain and motivate high quality senior executives and to align their interests with the creation of value for security holders.
Recommendation 8.1The board of a listed entity should:
a) Have a remuneration committee which:
1) Has at least three members, a majority of whom are Independent Directors; and
2) Is chaired by an Independent Director, and disclose:
3) The charter of the committee;
4) The members of the committee; and
5) As at the end of each reporting period, the number of times the committee met throughout the period and the individual attendances of the members at those meetings; or
b) If it does not have a remuneration committee, disclose that fact and the processes it employs for setting the level and composition of remuneration for Directors and senior executives and ensuring that such remuneration is appropriate and not excessive.
The Board has established a separate Remuneration Committee.
The principle function of the Remuneration Committee is to assist the Board in ensuring that the Group’s remuneration levels are appropriate and sufficient to attract and retain directors and key executives required to run the Group successfully.
The Remuneration Committee is chaired by Ms Penny Maclagan. The Committee currently has three other permanent non-executive members being Ms Tiffany Fuller, Mr Chris Morris and Mr Jeremy King with Mr Paul Gillespie (Managing Director) attending by invitation. Mr Jeremy King and Ms Tiffany Fuller are considered independent directors.
The Committee meets at least annually, with additional meetings being convened as required.
Recommendation 8.2A listed entity should separately disclose its policies and practices regarding the remuneration of Non-executive Directors and the remuneration of Executive Directors and other senior executives.
The Remuneration Report in the Company’s Annual Report sets out details of the Company’s policies and practices for remunerating directors and executives.
Recommendation 8.3A listed entity which has an equity-based compensation remuneration scheme should:
a) Have a policy on whether participants are permitted to enter into transactions (whether through the use of derivatives or otherwise) which limit the economic risk of participating in the scheme; and
b) Disclose that policy or a summary of it.
The Company has an equity based compensation scheme for senior executives. It has a formal policy restricting the entry into transactions which may limit the economic risk of participating in the scheme. The scheme involves employees being awarded equity in the Company at nil value. The award of such equity is based on individual and Company performance and is subject to milestones and vesting terms. As such, the economic risk to employees in participating in the scheme is very limited.
Corporate Governance (cont.)

Corporate Governance
Smart Parking Annual Report 2017 37
The Rialto, Level 30 525 Collins St Melbourne Victoria 3000 Correspondence to: GPO Box 4736 Melbourne Victoria 3001 T +61 3 8320 2222 F +61 3 8320 2200 E [email protected] W www.grantthornton.com.au
Grant Thornton Audit Pty Ltd ACN 130 913 594 a subsidiary or related entity of Grant Thornton Australia Ltd ABN 41 127 556 389 ‘Grant Thornton’ refers to the brand under which the Grant Thornton member firms provide assurance, tax and advisory services to their clients and/or refers to one or more member firms, as the context requires. Grant Thornton Australia Ltd is a member firm of Grant Thornton International Ltd (GTIL). GTIL and the member firms are not a worldwide partnership. GTIL and each member firm is a separate legal entity. Services are delivered by the member firms. GTIL does not provide services to clients. GTIL and its member firms are not agents of, and do not obligate one another and are not liable for one another’s acts or omissions. In the Australian context only, the use of the term ‘Grant Thornton’ may refer to Grant Thornton Australia Limited ABN 41 127 556 389 and its Australian subsidiaries and related entities. GTIL is not an Australian related entity to Grant Thornton Australia Limited. Liability limited by a scheme approved under Professional Standards Legislation.
AUDITOR’S INDEPENDENCE DECLARATION TO THE DIRECTORS OF SMART PARKING LIMITED In accordance with the requirements of section 307C of the Corporations Act 2001, as lead auditor for the audit of Smart Parking Limited for the year ended 30 June 2017, I declare that, to the best of my knowledge and belief, there have been:
a no contraventions of the auditor independence requirements of the Corporations Act 2001 in relation to the audit; and
b no contraventions of any applicable code of professional conduct in relation to the audit.
GRANT THORNTON AUDIT PTY LTD Chartered Accountants
M J Climpson Partner
Melbourne, 29 September 2017

38
The Rialto, Level 30 525 Collins St Melbourne Victoria 3000 Correspondence to: GPO Box 4736 Melbourne Victoria 3001 T +61 3 8320 2222 F +61 3 8320 2200 E [email protected] W www.grantthornton.com.au
Grant Thornton Audit Pty Ltd ACN 130 913 594 a subsidiary or related entity of Grant Thornton Australia Ltd ABN 41 127 556 389 ‘Grant Thornton’ refers to the brand under which the Grant Thornton member firms provide assurance, tax and advisory services to their clients and/or refers to one or more member firms, as the context requires. Grant Thornton Australia Ltd is a member firm of Grant Thornton International Ltd (GTIL). GTIL and the member firms are not a worldwide partnership. GTIL and each member firm is a separate legal entity. Services are delivered by the member firms. GTIL does not provide services to clients. GTIL and its member firms are not agents of, and do not obligate one another and are not liable for one another’s acts or omissions. In the Australian context only, the use of the term ‘Grant Thornton’ may refer to Grant Thornton Australia Limited ABN 41 127 556 389 and its Australian subsidiaries and related entities. GTIL is not an Australian related entity to Grant Thornton Australia Limited. Liability limited by a scheme approved under Professional Standards Legislation.
INDEPENDENT AUDITOR’S REPORT TO THE MEMBERS OF SMART PARKING LIMITED Report on the audit of the financial report
Opinion
We have audited the financial report of Smart Parking Limited (the Company) and its subsidiaries (the Group), which comprises the consolidated statement of financial position as at 30 June 2017, the consolidated statement of profit or loss and other comprehensive income, consolidated statement of changes in equity and consolidated statement of cash flows for the year then ended, and notes to the consolidated financial statements, including a summary of significant accounting policies, and the directors’ declaration.
In our opinion, the accompanying financial report of the Group, is in accordance with the Corporations Act 2001, including:
a Giving a true and fair view of the Group’s financial position as at 30 June 2017 and of its performance for the year ended on that date; and
b Complying with Australian Accounting Standards and the Corporations Regulations 2001.
Basis for Opinion
We conducted our audit in accordance with Australian Auditing Standards. Our responsibilities under those standards are further described in the Auditor’s Responsibilities for the Audit of the Financial Report section of our report. We are independent of the Group in accordance with the independence requirements of the Corporations Act 2001 and the ethical requirements of the Accounting Professional and Ethical Standards Board’s APES 110 Code of Ethics for Professional Accountants (the Code) that are relevant to our audit of the financial report in Australia. We have also fulfilled our other ethical responsibilities in accordance with the Code.
We believe that the audit evidence we have obtained is sufficient and appropriate to provide a basis for our opinion.

Independent Auditor’s Report
Smart Parking Annual Report 2017 39
Key Audit Matters
Key audit matters are those matters that, in our professional judgement, were of most significance in our audit of the financial report of the current period. These matters were addressed in the context of our audit of the financial report as a whole, and in forming our opinion thereon, and we do not provide a separate opinion on these matters.
Key audit matter How our audit addressed the key audit matter Revenue recognition (Note 10) In accordance with AASB 118 Revenues, revenues from services are recognised in the accounting period in which the services are rendered, by reference to the stage of completion of the specific transaction. The Group derives revenue through the sale of goods when the risks and rewards of ownership have been transferred to the buyer on either delivery or completion of installation. Revenue is also derived from services by reference to the stage of completion of the specific transaction. The Group recognises a year-end accrual for Parking Breach Notice (‘PBN’) infringements issued which have not yet been received. The determination of the appropriate timing of revenue recognition due to the nature of sales, transfer of risk and rewards upon delivery or installation and stage of completion can require significant judgement. The determination of the PBN accrual requires management to estimate various factors that can impact on the cash subsequently collected, including contractual terms with car park owners and the potential for cancellation or non-recovery. This area is a key audit matter due to the inherent audit risk pertaining to revenue recognition for a business with multiple revenue streams, and because of the high level of estimation and management judgement required to determine an appropriate value for accrued revenue.
Our procedures included, amongst others: assessing the revenue recognition policies for
appropriateness and compliance with AASB 118 Revenues, as well as considering consistency with the prior period;
selecting key controls in the revenue recognition process and verifying their operating effectiveness;
performing testing of a sample of revenue transactions for each material revenue stream by agreeing to supporting documentation and cash receipts and, where appropriate, to contracts to determine whether revenue was recognised in the appropriate period;
performing trend analysis procedures for revenue disaggregated by revenue stream and by month. Where movements were outside expectation an explanation was obtained along with corroborating evidence;
assessing management’s PBN accrual model for compliance with AASB 118 Revenues, as well as reviewing consistency of application with the prior period;
testing the mathematical accuracy of the model; evaluating the appropriateness of the methodology
used in the underlying model calculations; testing the reasonableness of monthly PBNs
having regard to the number of sites under management;
comparing the estimates adopted for cancellations and non-recovery to historical actual rates;
comparing estimated to actual collections subsequent to year-end; and
assessing the appropriateness of related financial statement disclosures.

40
Intangibles impairment (Note 13) AASB 136 Impairment of Assets requires an entity to assess at each reporting date whether there is any indication that an asset may be impaired. If any such indication exists, the entity shall estimate the recoverable amount of the asset. As at 30 June 2017 the Group holds $617,000 of intangible assets relating to the Technology cash generating unit (“CGU”) which are being amortised over a 7 year useful life. This CGU has historically operated at a loss and there may be indicators of possible impairment which require the Group to estimate the recoverable amount of these assets. This area is a key audit matter due to the judgement required by management in preparing a ‘value-in-use’ model to satisfy the impairment test. Forecasting cash flows and applying an appropriate discount rate inherently involves a high degree of estimation and judgement to be exercised by management.
Our procedures included, amongst others: reviewing management’s assessment as to the
existence of impairment indicators for finite life intangible assets;
reviewing value-in-use model for compliance with AASB 136 Impairment of Assets;
testing the mathematical accuracy of the model evaluating the appropriateness of the methodology
applied in the impairment calculations; evaluating the cash flow projections and the
process by which they were developed, and comparing to the latest Board approved budgets;
assessing the historical accuracy of the budgeting process;
assessing the key growth rate assumptions by comparing them to historical results, economic and industry forecasts, and assessing the discount rate with reference to the cost of capital of the Group;
performing a sensitivity analysis on the key assumptions of the model;
considering the likelihood that the fair value less costs to dispose of the developed technology would exceed its carrying value. The fair value was considered in the context of the historical investment in the asset, and evidence as to its operating effectiveness and ability to be commercialised; and
assessing the appropriateness of related financial statement disclosures.
Provision and contingent liability (Note 29) AASB 137 Provisions, Contingent Liabilities and Contingent Assets defines a contingent liability as a possible obligation that arises from past events and whose existence will be confirmed only by the occurrence or non-occurrence of one or more uncertain events not wholly within the control of the entity. The recognition and/or disclosure of a provision or contingent liability are dependent on the probability of, and the ability to reliably measure, any present obligation. The Group has become aware of an Upper Tier Tribunal ruling in the UK impacting the treatment of input VAT on expenses relating to the derivation of some PBN income. The Group has sought independent expert advice on the facts involved in this case and the potential implications of this tribunal decision on Smart Parking Limited (UK). A provision has been recognised at 30 June 2017 against recoverable VAT based on an assessment of probable adjusted outcomes at that time. As the matter is ongoing, the full potential financial impact of either settlement or litigation to resolve the matter is not currently capable of being reliably measured and there therefore remains a contingent liability associated with this matter. This area is a key audit matter due to the high level of uncertainty and estimation associated with the provision and contingent liability and also the significant value of the potential exposure to the Group.
Our procedures included, amongst others: obtaining information from management as to the
status of the issue and their assessment and reasoning of the probability and estimated value of the exposure relating to any HMRC assessment;
corroborating information and calculations provided by management by reviewing and assessing correspondence with third parties and work performed by experts;
assessing the treatment of the contingent liability for appropriateness and compliance with AASB 137 Provisions, Contingent Liabilities and Contingent Assets; and
assessing the appropriateness of related financial statement disclosures.
Independent Auditor’s Report
Smart Parking Annual Report 2017 41
Information Other than the Financial Report and Auditor’s Report Thereon
The Directors are responsible for the other information. The other information comprises the information included in the Group’s annual report for the year ended 30 June 2017, but does not include the financial report and our auditor’s report thereon.
Our opinion on the financial report does not cover the other information and we do not express any form of assurance conclusion thereon.
In connection with our audit of the financial report, our responsibility is to read the other information and, in doing so, consider whether the other information is materially inconsistent with the financial report or our knowledge obtained in the audit or otherwise appears to be materially misstated.
If, based on the work we have performed, we conclude that there is a material misstatement of this other information, we are required to report that fact. We have nothing to report in this regard.
Responsibilities of the Directors’ for the Financial Report
The Directors of the Company are responsible for the preparation of the financial report that gives a true and fair view in accordance with Australian Accounting Standards and the Corporations Act 2001 and for such internal control as the Directors determine is necessary to enable the preparation of the financial report that gives a true and fair view and is free from material misstatement, whether due to fraud or error.
In preparing the financial report, the Directors are responsible for assessing the Group’s ability to continue as a going concern, disclosing, as applicable, matters related to going concern and using the going concern basis of accounting unless the Directors either intend to liquidate the Group or to cease operations, or have no realistic alternative but to do so.
Auditor’s Responsibilities for the Audit of the Financial Report
Our objectives are to obtain reasonable assurance about whether the financial report as a whole is free from material misstatement, whether due to fraud or error, and to issue an auditor’s report that includes our opinion. Reasonable assurance is a high level of assurance, but is not a guarantee that an audit conducted in accordance with the Australian Auditing Standards will always detect a material misstatement when it exists. Misstatements can arise from fraud or error and are considered material if, individually or in the aggregate, they could reasonably be expected to influence the economic decisions of users taken on the basis of this financial report.
A further description of our responsibilities for the audit of the financial report is located at the Auditing and Assurance Standards Board website at: www.auasb.gov.au/auditors_responsibilities/ar1.pdf. This description forms part of our auditor’s report.

42
Report on the Remuneration Report
Opinion on the Remuneration Report
We have audited the Remuneration Report included in pages 17 to 25 of the directors’ report for the year ended 30 June 2017.
In our opinion, the Remuneration Report of Smart Parking Limited, for the year ended 30 June 2017, complies with section 300A of the Corporations Act 2001.
Responsibilities
The Directors of the Company are responsible for the preparation and presentation of the Remuneration Report in accordance with section 300A of the Corporations Act 2001. Our responsibility is to express an opinion on the Remuneration Report, based on our audit conducted in accordance with Australian Auditing Standards.
GRANT THORNTON AUDIT PTY LTD Chartered Accountants
M J Climpson Partner
Melbourne, 29 September 2017

Smart Parking Annual Report 2017 43
44 Consolidated Statement of Comprehensive Income 45 Consolidated Statement of Financial Position46 Consolidated Statement of Changes in Equity47 Consolidated Statement of Cash Flows48 Notes to the Financial Statements89 Directors’ Declaration
Financial Statements

44
Consolidated
Note 2017 2016
Revenue from operations 5 24,841,220 31,805,151
Raw materials and consumables used (2,332,703) (1,447,806)
Employee benefits expense (9,993,765) (14,203,993)
Depreciation and amortisation expense 6 (2,351,077) (2,659,817)
Rental and operating lease costs (2,803,875) (3,506,702)
Share-based payments expense 23 (411,426) (296,135)
Finance and interest expense 6 (87,143) (90,480)
Other expenses 6 (7,928,221) (11,810,025)
Loss before income tax (1,066,990) (2,209,807)
Income tax (expense)/benefit 7 (329,733) 684,798
Loss for the year from continuing operations (1,396,723) (1,525,009)
Other comprehensive income
Items that may be reclassified subsequently to profit or loss:
Exchange differences on translation of foreign operations 20(a) (582,887) (940,779)
Other comprehensive (loss)/income for the year, net of tax (582,887) (940,779)
Total comprehensive loss for the year (1,979,610) (2,465,788)
Total comprehensive loss for the year attributable to:
Owners of Smart Parking Limited (1,979,610) (2,465,788)
Earnings per share from continuing operations attributable to the ordinary equity holders of the company:
Basic earnings/(loss) per share (cents per share) 8 (0.42) (0.51)
Diluted earnings/(loss) per share (cents per share) 8 (0.42) (0.51)
The above consolidated statement of profit or loss and other comprehensive income is to be read in conjunction with the accompanying notes.
Consolidated Statement of Profit or Loss and Other Comprehensive IncomeFor the year ended 30 June 2017

Smart Parking Annual Report 2017 45
Financial Statements
Consolidated Statement of Financial PositionAs at 30 June 2017
Consolidated
Note 2017 2016
ASSETSCurrent AssetsCash and cash equivalents 9 14,225,598 4,140,820
Trade and other receivables 10 5,667,652 5,266,382
Inventories 11 1,491,628 1,641,847
Income tax receivable 911 1,107
Total Current Assets 21,385,789 11,050,156
Non-current AssetsReceivables 10 365,235 –
Property, plant and equipment 12 3,516,853 4,173,075
Intangible assets 13 2,366,974 3,169,905
Deferred tax assets 14 1,156,424 1,585,848
Total Non-current Assets 7,405,486 8,928,828
Total Assets 28,791,275 19,978,984
LIABILITIESCurrent LiabilitiesTrade and other payables 15 4,809,541 5,830,073
Borrowings 16 177,147 7,208
Deferred revenue 17 699,207 633,018
Provisions 18 689,603 719,189
Total Current Liabilities 6,375,498 7,189,488
Non-Current LIabilitiesBorrowings 16 79,948 –
Total Liabilities 6,455,446 7,189,488
Net Assets 22,335,829 12,789,496
EQUITYContributed Equity 19 68,865,719 57,751,202
Accumulated losses 20(b) (49,545,129) (48,148,406)
Reserves 20(a) 3,015,239 3,186,700
Total Equity 22,335,829 12,789,496
The above consolidated statement of financial position is to be read in conjunction with the accompanying notes.

46
NoteContributed
equity ReservesAccumulated
losses Total
$ $ $ $
Balance at 1 July 2016 57,751,202 3,186,700 (48,148,406) 12,789,496
Total comprehensive income for the year
Loss for the year - - (1,396,723) (1,396,723)
Other comprehensive loss - (582,887) - (582,887)
Total comprehensive loss for the year - (582,887) (1,396,723) (1,979,610)
Transactions with owners, recorded directly in equity
Contributions by owners
Contributions of equity net of transaction costs
11,114,517 - - 11,114,517
Share-based payment transactions - 411,426 - 411,426
Total transactions with owners 11,114,517 411,426 - 11,525,943
Balance at 30 June 2017 19, 20 68,865,719 3,015,239 (49,545,129) 22,335,829
NoteContributed
equity ReservesAccumulated
losses Total
$ $ $ $
Balance at 1 July 2015 57,751,202 3,831,344 (46,623,397) 14,959,149
Total comprehensive income for the year
Loss for the year - - (1,525,009) (1,525,009)
Other comprehensive income - (940,779) - (940,779)
Total comprehensive income for the year - (940,779) (1,525,009) (2,465,788)
Transactions with owners, recorded directly in equity
Contributions by owners
Contributions of equity net of transaction costs
- - - -
Share-based payment transactions - 296,135 - 296,135
Total transactions with owners - 296,135 - 296,135
Balance at 30 June 2016 19, 20 57,751,202 3,186,700 (48,148,406) 12,789,496
The above consolidated statement of changes in equity is to be read in conjunction with the accompanying notes.
Consolidated Statement of Changes in EquityFor the year ended 30 June 2017

Smart Parking Annual Report 2017 47
Financial Statements
Consolidated Statement of Cash FlowsFor the year ended 30 June 2017
Consolidated
Note 2017 2016
Cash flows from operating activities
Cash receipts in the course of operations 24,718,970 31,901,032
Cash payments in the course of operations (24,153,060) (31,149,751)
Interest and other finance costs paid (21,772) (1,380)
Interest received 115,453 48,860
Income taxes paid (195) (1,107)
Net cash flows inflow/(outflow) from operating activities before movement in client funds
659,396 797,654
Net (decrease)/increase in cash held on behalf of customers (87,730) (9,991,979)
Net cash flows inflow/(outflow) from operating activities 22 571,666 (9,194,325)
Cash flows from investing activities
Proceeds from disposal of assets - 20,453
Purchase of intangible assets (186,359) (62,149)
Purchase of plant and equipment (1,270,578) (2,355,934)
Net cash flows inflow/(outflow) from investing activities (1,456,937) (2,397,630)
Cash flows from financing activities
Proceeds from share issue 11,608,233 -
Share issue costs (493,716) -
Proceeds from borrowings 80,538 -
Hire purchase payments (108,538) (90,275)
Net cash flows inflow/(outflow) from financing activities 11,086,517 (90,275)
Net (decrease)/increase in cash and cash equivalents 10,201,246 (11,682,230)
Cash and cash equivalents at beginning of period 4,140,820 16,289,523
Effects of exchange rate changes on cash and cash equivalents (116,468) (466,473)
Cash and cash equivalents at end of period 9 14,225,598 4,140,820
Non-cash financing and investing activities 16 226,184 -
The above consolidated statement of cash flows is to be read in conjunction with the accompanying notes.
48
1. Summary of significant accounting policies
Corporate Information
The financial statements of Smart Parking Limited for the year ended 30 June 2017 were authorised for issue in accordance with a resolution of the directors on 29 September 2017 and covers the Group consisting of Smart Parking Limited and its subsidiaries as required by the Corporations Act 2001.
The financial statements are presented in the Australian currency.
Smart Parking Limited is a for-profit company limited by shares incorporated in Australia whose shares are publicly traded on the Australian Securities Exchange.
The address of the registered office is:
854 Lorimer Street Port Melbourne VIC 3207 Australia
The addresses of the principal places of business are:
854 Lorimer Street Port Melbourne VIC 3207 Australia
583 Great South Road Penrose Auckland 1061 New Zealand
Unit 43 Elmdon Trading Estate Birmingham B37 7HE United Kingdom
Accounting Policies
The principal accounting policies adopted in the preparation of these consolidated financial statements are set out below. These policies have been consistently applied to all the years presented, unless otherwise stated. The financial statements are for the Group consisting of Smart Parking Limited and its subsidiaries.
a) Basis of preparation
The financial statements are general purpose financial statements which have been prepared in accordance with Australian Accounting Standards, other authoritative pronouncements and interpretations of the Australian Accounting Standards Board, and the Corporations Act 2001.
Compliance with IFRS
The consolidated financial statements of Smart Parking Limited group comply with International Financial Reporting Standards (IFRS) as issued by the International Accounting Standards Board (IASB).
Historical cost convention
These financial statements have been prepared under the historical cost convention, as modified by the financial assets and liabilities at fair value through profit or loss.
Critical accounting estimates
The preparation of financial statements requires the use of certain critical accounting estimates. It also requires management to exercise its judgement in the process of applying the Group’s accounting policies. The areas involving a higher degree of judgement or complexity, or areas where assumptions and estimates are significant to the financial statements are disclosed in the notes as required (refer note 2).
The financial information for the parent entity, Smart Parking Limited, included in note 25, has been prepared on the same basis as the consolidated financial statements.
b) Principles of consolidation
The Group financial statements consolidate those of the Parent Company and all of its subsidiaries as of 30 June 2017. The Parent controls a subsidiary if it is exposed, or has rights, to variable returns from its involvement with the subsidiary and has the ability to affect those returns through its power over the subsidiary. All subsidiaries have a reporting date of 30 June.
All transactions and balances between Group companies are eliminated on consolidation, including unrealised gains and losses on transactions between Group companies.
Notes to the Financial Statements

Smart Parking Annual Report 2017 49
Financial Statements
Where unrealised losses on intra-group asset sales are reversed on consolidation, the underlying asset is also tested for impairment from a group perspective. Amounts reported in the financial statements of subsidiaries have been adjusted where necessary to ensure consistency with the accounting policies adopted by the Group.
Profit or loss and other comprehensive income of subsidiaries acquired or disposed of during the year are recognised from the effective date of acquisition, or up to the effective date of disposal, as applicable.
Non-controlling interests, presented as part of equity, represent the portion of a subsidiary’s profit or loss and net assets that is not held by the Group. The Group attributes total comprehensive income or loss of subsidiaries between the owners of the parent and the non-controlling interests based on their respective ownership interests.
c) Segment reporting
Operating segments are reported in a manner consistent with the internal reporting provided by the chief operation decision maker. The chief operating decision maker, who is responsible for allocating resources and assessing performance of the operating segments, has been identified as the Board of Directors.
d) Foreign currency translation
(i) Functional and presentation currency
Items included in the financial statements of each of the Group’s entities are measured using the currency of the primary economic environment in which the entity operates (‘the functional currency’). The consolidated financial statements are presented in Australian dollars, which is Smart Parking Limited’s presentation currency.
(ii) Transactions and balances
Foreign currency transactions are translated into the functional currency using the exchange rates prevailing at the dates of the transactions. Foreign exchange gains and losses resulting from the settlement of such transactions and from the translation at year end exchange rates of monetary assets and liabilities denominated in foreign currencies are recognised in profit or
loss, except when they are deferred in equity as qualifying cash flow hedges and qualifying net investment hedges or are attributable to part of the net investment in a foreign operation.
Foreign gains and losses that relate to borrowings are presented in the statement of profit or loss and other comprehensive income, within finance costs. All other foreign exchange gains and losses are presented in the statement of comprehensive income on a net basis within other income or other expenses.
(iii) Group companies
The results and financial position of foreign operations (none of which has the currency of hyperinflationary economy) that have a functional currency different from the presentation currency are translated into the presentation currency as follows:
• Assets and liabilities for each statement of financial position presented are translated at the closing rate at the date of the statement of financial position.
• Income and expenses for each statement of comprehensive income are translated at average exchange rates for the year (unless this is not a reasonable approximation of the cumulative effect of the rates prevailing on the transaction dates, in which case income and expenses are translated at the dates of the transactions), and
• All resulting exchange differences are recognised in other comprehensive income as a separate component of equity (foreign currency translation reserve).
On consolidation, exchange differences arising from the translation of any net investment in foreign entities and of borrowings and other financial instruments designated as hedges of such investments are recognised in other comprehensive income. When a foreign operation is sold any borrowings forming part of the net investment are repaid and a proportionate share of such exchange rate difference is reclassified to profit or loss as part of the gain or loss on sale where applicable.

50
Notes to the Financial Statements (cont.)
Goodwill and fair value adjustments arising from the acquisition of a foreign operation are treated as assets and liabilities of the foreign operation and translated at the closing rate.
e) Revenue recognition
Revenue is measured at the fair value of the consideration received or receivable. Amounts disclosed as revenue are net of returns, trade allowances, rebates and amounts collected on behalf of third parties.
The Group recognises revenue when the amount of revenue can be reliably measured, it is probable that future economic benefits will flow to the entity and specific criteria have been met for each of the Group’s activities as described below. The amount of revenue is not considered to be reliably measurable until all contingencies relating to the sale have been resolved. The Group bases its estimates on historical results, taking into consideration the type of customer, the type of transaction and the specifics of each arrangement.
Revenue is recognised for the major business activities as follows:
(i) Sale of Goods
Revenue from the sale of goods is recognised in profit or loss when the significant risks and rewards of ownership have been transferred to the buyer. No revenue is recognised if there are significant uncertainties regarding recovery of the consideration due, associated costs or the possible return of goods, or where there is continuing management involvement with the goods.
Transfer of the risks and rewards of ownership generally occur when the goods are delivered to the customer or on completion of installation.
Revenue from fixed price contracts to provide services and installation of goods is recognised by reference to the stage of completion of the contract.
Where the Group receives an advance payment prior to goods being supplied or an installation being completed this is treated as deferred revenue until the risks and rewards of ownership have transferred to the buyer.
(ii) Services
Revenue from services is recognised in the accounting period in which the services are rendered, by reference to the stage of completion of the specific transaction. The stage of completion is assessed on the basis of the actual service provided as a proportion of the total services to be provided.
Smart Parking Limited (UK) recognises Pay and Display revenue on an accruals basis including cash collected but not yet banked, and Parking Breach Notice revenue on an accruals basis by looking at cash banked and making an accrual for infringements issued but which have not been paid. Revenue is recognised net of cash collected on behalf of clients.
(iii) Interest income
Interest income is recognised on a proportional basis taking into account the interest rates applicable to the financial assets.
f) Government grants
Grants from the government are recognized at their fair value where there is a reasonable assurance that the grant will be received and the Group will comply with all attached conditions.
g) Income tax
The income tax expense or revenue for the period is the tax payable on the current period’s taxable income based on the national income tax rate for each jurisdiction adjusted by changes in deferred tax assets and liabilities attributable to temporary differences and to unused tax losses.
Deferred income tax is provided in full, using the liability method, on temporary differences arising between the tax bases of assets and liabilities and their carrying amounts in the consolidated financial statements. However, the deferred income tax is not accounted for if it arises from initial recognition of an asset or liability in a transaction other than a business combination that at the time of the transaction affects neither accounting nor taxable profit or loss. Deferred income tax is determined using tax rates (and laws) that have been enacted or substantially enacted by the reporting date and are expected to apply when the related deferred income tax asset is realised or the deferred income tax liability is settled.

Smart Parking Annual Report 2017 51
Financial Statements
Deferred tax assets are recognised for deductible temporary differences and unused tax losses only if it is probable that future taxable amounts will be available to utilise those temporary differences and losses. Deferred tax liabilities and assets are not recognised for temporary differences between the carrying amount and tax bases of investments in controlled entities where the parent entity is able to control the timing of the reversal of the temporary differences and it is probable that the differences will not reverse in the foreseeable future.
Deferred tax assets and liabilities are offset when there is a legally enforceable right to offset current tax assets and liabilities and when the deferred tax balances relate to the same taxation authority. Current tax assets and tax liabilities are offset where the entity has a legally enforceable right to offset and intends either to settle on a net basis, or to realise the asset and settle the liability simultaneously. Current and deferred tax balances attributable to amounts recognised directly in equity are also recognised directly in equity.
Tax consolidation legislation
Smart Parking Limited and its wholly owned Australian controlled entities have implemented the tax consolidation legislation.
The head entity, Smart Parking Limited, and the controlled entities in the tax consolidated group account for their own current and deferred tax amounts. These tax amounts are measured as if each entity in the tax consolidated group continues to be a stand alone payer in its own right.
In addition to its own current and deferred tax amounts, Smart Parking Limited also recognises the current tax liabilities (or assets) and the deferred tax assets arising from unused tax losses and unused tax credits assumed from controlled entities in the tax consolidated group.
Assets or liabilities arising under tax funding agreements with the tax consolidated entities are recognised as amounts receivable from or payable to other entities in the Group. Details about the tax funding agreement are disclosed in note 7.
Any difference between the amounts assumed and amounts receivable or payable under the tax funding agreement are recognised as a contribution (or distributions from) wholly-owned tax consolidated entities.
h) Leases
Leases of property, plant and equipment where the Group, as lessee, has substantially all the risks and rewards of ownership are classified as finance leases. Finance leases are capitalised at the lease’s inception at the fair value of the leased property or, if lower, the present value of the minimum lease payments. The corresponding rental obligations, net of finance charges, are included in other short-term and long-term payables. Each lease payment is allocated between the liability and finance cost. The finance cost is recognised in profit or loss over the lease period so as to produce a constant periodic rate of interest on the remaining balance of the liability for each period. The property, plant and equipment acquired under finance leases are depreciated over the shorter of the asset’s useful life and the lease term.
Leases in which a significant portion of the risks and rewards of ownership are not transferred to the Group as lessee are classified as operating leases. Payments made under operating leases (net of any incentives received from the lessor) are recognised in profit or loss on a straight-line basis over the period of the lease.
i) Business combinations
The acquisition method of accounting is used to account for all business combinations. Consideration is measured at the fair value of the assets transferred, liabilities incurred and equity interests issued by the Group on acquisition date. Consideration also includes the acquisition date fair values of any contingent consideration arrangements, any pre-existing equity interests in the acquiree and share-based payment awards of the acquiree that are required to be replaced in a business combination. The acquisition date is the date on which the Group obtains control of the acquiree. Where equity instruments are issued as part of the consideration, the value of the equity

52
Notes to the Financial Statements (cont.)
instruments is their published market price at the acquisition date unless, in rare circumstances it can be demonstrated that the published price at acquisition date is not fair value and that other evidence and valuation methods provide a more reliable measure of fair value.
Identifiable assets acquired and liabilities and contingent liabilities assumed in business combinations are, with limited exceptions, initially measured at their fair values at acquisition date. Goodwill represents the excess of the consideration transferred and the amount of the non-controlling interest in the acquiree over fair value of the identifiable net assets acquired. If the consideration and non-controlling interest of the acquiree is less than the fair value of the net identifiable assets acquired, the difference is recognised in profit or loss as a bargain purchase price, but only after a reassessment of the identification and measurement of the net assets acquired.
For each business combination, the Group measures non-controlling interests at either fair value or at the non-controlling interest’s proportionate share of the acquiree’s identifiable net assets.
Acquisition-related costs are expensed when incurred. Transaction costs arising on the issue of equity instruments are recognised directly in equity and transaction costs arising on the issue of debt as part of the consideration are accounted for in accordance with note 1(u).
Where the Group obtains control of a subsidiary that was previously accounted for as an equity accounted investment in associate or jointly controlled entity, the Group remeasures its previously held equity interest in the acquiree at its acquisition date fair value and the resulting gain or loss is recognised in profit or loss. Where the Group obtains control of a subsidiary that was previously accounted for as an available-for-sale investment, any balance on the available-for-sale reserve related to that investment is recognised in profit or loss as if the Group had disposed directly of the previously held interest.
Where settlement of any part of the cash consideration is deferred, the amounts payable in future are discounted to present value at the date of exchange using the entity’s incremental borrowing rate as the discount rate.
Assets and liabilities from business combinations involving entities or businesses under common control are accounted for at the carrying amounts recognised in the Group’s controlling shareholder’s consolidated financial statements.
j) Impairment of assets
Goodwill and intangible assets that have an indefinite useful life are not subject to amortisation and are tested annually for impairment, or more frequently if events or changes in circumstances indicate that they might be impaired. Other assets are reviewed for impairment whenever events or changes in circumstances indicate that the carrying amount may not be recoverable. An impairment loss is recognised for the amount by which the asset’s carrying amount exceeds its recoverable amount. The recoverable amount is the higher of an asset’s fair value less costs to sell and value in use. For the purposes of assessing impairment, assets are grouped at the lowest levels for which there are separately identifiable cash inflows which are largely independent of the cash inflows from other assets or groups of assets (cash-generating units). Non-financial assets other than goodwill that suffered an impairment are reviewed for possible reversal of the impairment at each reporting date.
k) Cash and cash equivalents
For cash flow statement presentation purposes, cash and cash equivalents includes cash on hand, deposits held at call with financial institutions, other short-term, highly liquid investments with original maturities of three months or less that are readily convertible to known amounts of cash and which are subject to an insignificant risk of changes in value, and bank overdrafts.
l) Trade receivables
Trade receivables are recognised initially at fair value and subsequently measured at amortised cost using the effective interest method, less provision for impairment. Trade receivables are generally due for settlement within 60 days.
Smart Parking Annual Report 2017 53
Financial Statements
Recoverability of trade receivables is reviewed on an ongoing basis. Debts which are known to be uncollectible are written off. A provision for impairment of trade receivables is established when there is objective evidence that the Group will not be able to collect all amounts due according to the original terms of the receivables. Significant financial difficulties of the debtor, probability that the debtor will enter bankruptcy or financial reorganisation, and default or delinquency in payments (more than 30 days overdue) are considered indicators that the trade receivable is impaired. The amount of the provision is the difference between the asset’s carrying amount and the present value of estimated future cash flows, discounted at the original effective interest rate. Cash flows relating to short-term receivables are not discounted if the effect of discounting is immaterial. The amount of the provision is recognised in the statement of comprehensive income in other expenses.
The amount of the impairment loss is recognised in the statement of profit or loss and other comprehensive income within other expenses. When a trade receivable for which an impairment allowance had been recognised becomes uncollectible in a subsequent period, it is written off against the allowance account. Subsequent recoveries of amounts previously written off are credited against other expenses in statement of profit or loss and other comprehensive income.
m) Inventories
Inventories are measured at the lower of cost and net realisable value. Net realisable value is the estimated selling price in the ordinary course of business, less the estimated costs of completion and selling expenses.
Cost is based on weighted average cost and includes expenditure incurred in acquiring the inventories and bringing them to their existing location and condition. In the case of manufactured inventories and work-in-progress, cost includes an appropriate share of overheads based on normal operating capacity. Goods in transit are recognised when the risks and rewards of ownership have passed to the Group.
n) Investments and other financial instruments
Classification
The Group classifies its investments in the following categories: loans and receivables and financial assets at fair value through profit or loss. The classification depends on the purpose for which the investments were acquired.
Loans and receivables
Loans and receivables are non-derivative financial assets with fixed or determinable payments that are not quoted in an active market. They are included in current assets, except for those with maturities greater than 12 months after the reporting date which are classified as non-current assets. Loans and receivables are included in trade and other receivables in the statement of financial position (note 10) and borrowings.
Financial assets at fair value-through profit or loss
Financial assets at fair value through profit or loss are financial assets held for trading. A financial asset is classified in this category if acquired principally for the purpose of selling in the short term. Assets in this category are classified as current assets.
Recognition and de-recognition
Regular purchases and sales of financial assets are recognised on trade-date being the date on which the Group commits to purchase or sell the asset. Financial assets are derecognised when the rights to receive cash flows from the financial assets have expired or have been transferred and the Group has transferred substantially all the risks and rewards of ownership.
Subsequent measurement
Loans and receivables are carried at amortised cost using the effective interest method.
Details on how the fair value of financial instruments is determined are disclosed in note 4.
Impairment
The Group assesses at each reporting date whether there is objective evidence that a financial asset or group of financial assets is impaired.

54
Notes to the Financial Statements (cont.)
o) Property, plant and equipment
Property, Plant and equipment is stated at cost less accumulated depreciation and any impairment. Cost includes expenditure that is directly attributable to the acquisition of the item.
Depreciation is recognised in profit or loss on a straight line basis over the estimated useful lives of each component of an item of property, plant and equipment:
Motor Vehicles 3-5 yearsOffice Equipment 1-6 yearsPlant and equipment 1-10 yearsLeasehold Improvements 3-10 years
The assets useful lives and residual values are reviewed, and adjusted if appropriate, at the end of each reporting period.
An asset’s carrying amount is written down immediately to its recoverable amount if the asset’s carrying amount is greater than its estimated recoverable amount (note 1 j)).
Gains and losses on disposals are determined by comparing proceeds with carrying amount. These are included in profit and loss.
p) Intangible assets
(i) Goodwill
Goodwill represents the excess of the cost of an acquisition over the fair value of the Group’s share of the net identifiable assets of the acquired subsidiary/associate at the date of acquisition. Goodwill on acquisitions of subsidiaries is included in intangible assets. Goodwill on acquisitions of associates is included in investments in associates. Goodwill is not amortised. Instead, goodwill is tested for impairment annually, or more frequently if events or changes in circumstances indicate that it might be impaired, and is carried at cost less accumulated impairment losses. Gains and losses on the disposal of an entity include the carrying amount of goodwill relating to the entity sold.
Goodwill is allocated to cash-generating units for the purpose of impairment testing. As at acquisition date, any goodwill acquired is allocated to each of the cash-generating units expected to benefit from the combination synergies.
(ii) Software development
Expenditure on research activities, undertaken with the prospect of gaining new technical knowledge and understanding, is recognised in profit or loss as incurred.
Software development activities involve a plan or design for the production of new or substantially improved products and processes. Software development expenditure is capitalised only if development costs can be measured reliably, the product or process is technically and commercially feasible, future economic benefits are probable, and the Company intends to and has sufficient resources to complete development and to use or sell the asset. The expenditure capitalised includes the cost of direct labour, overhead costs that are directly attributable to preparing the asset for its intended use, and capitalised borrowing costs. Other software development expenditure is recognised in profit or loss as incurred.
Capitalised software development expenditure is measured at cost less accumulated amortisation and accumulated impairment losses.
(iii) Developed technology
Developed technology comprises patented and unpatented technology, and computer software. These three items collectively represent an end to end solution and as such are not separable from each other.
(iv) Other intangible assets
Other intangible assets consisting of patents, which are acquired by the Company and have finite useful lives, are measured at cost less accumulated amortisation and accumulated impairment losses.
(v) Subsequent expenditure
Subsequent expenditure is capitalised only when it increases the future economic benefits embodied in the specific asset to which it relates. All other expenditure, including expenditure on internally generated goodwill and brands, is recognised in profit or loss as incurred.

Smart Parking Annual Report 2017 55
Financial Statements
(vi) Amortisation
Amortisation is based on the cost of the asset, less its residual value.
Amortisation is recognised in profit or loss on a straight line basis over the estimated useful lives of intangible assets, from the date that they are available for use, since this most closely reflects the expected pattern of consumption of the future economic benefits embodied in the asset. The estimated useful lives for the current and comparative periods are as follows:
Software 3 yearsDeveloped technology 7 years
Amortisation methods, useful lives and residual values are reviewed at each financial year-end and adjusted if appropriate.
q) Trade and other payables
These amounts represent liabilities for goods and services provided to the Group prior to the end of financial year which are unpaid. The amounts are unsecured and are usually paid within 30 days of recognition.
r) Borrowings
Borrowings are initially recognised at fair value, net of transaction costs incurred. Borrowings are subsequently measured at amortised cost. Any difference between the proceeds (net of transaction costs) and the redemption amount is recognised in the statement of profit or loss and other comprehensive income over the period of the borrowings using the effective interest method. Fees paid on the establishment of loan facilities, which are not an incremental cost relating to the actual draw-down of the facility, are recognised as prepayments and amortised on a straight-line basis over the term of the facility.
Borrowings are removed from the statement of financial position when the obligation specified in the contract is discharged, cancelled or expired. The difference between the carrying amount of a financial liability that has been extinguished or transferred to another party and the consideration paid, including any non-cash assets transferred or liabilities assumed, is recognised in other income or other expenses.
Borrowings are classified as current liabilities unless the Group has an unconditional right to defer settlement of the liability for at least 12 months after the end of the reporting period.
s) Provisions, contingent liabilities and contingent assets
Provisions for product warranties, legal disputes, onerous contracts or other claims are recognised when the Group has a present legal or constructive obligation as a result of a past event, it is probable that an outflow of economic resources will be required from the Group and amounts can be estimated reliably. Timing or amount of the outflow may still be uncertain.
Restructuring provisions are recognised only if a detailed formal plan for the restructuring has been developed and implemented, or management has at least announced the plan’s main features to those affected by it. Provisions are not recognised for future operating losses.
Provisions are measured at the estimated expenditure required to settle the present obligation, based on the most reliable evidence available at the reporting date, including the risks and uncertainties associated with the present obligation. Where there are a number of similar obligations, the likelihood that an outflow will be required in settlement is determined by considering the class of obligations as a whole. Provisions are discounted to their present values, where the time value of money is material.
Any reimbursement that the Group can be virtually certain to collect from a third party with respect to the obligation is recognised as a separate asset. However, this asset may not exceed the amount of the related provision.
In those cases where the possible outflow of economic resources as a result of present obligations is considered improbable or remote, no liability is recognised.
56
Notes to the Financial Statements (cont.)
t) Employee benefits
(i) Wages and salaries, annual leave and sick leave
Liabilities for wages and salaries, including non-monetary benefits, annual leave and accumulating sick leave expected to be settled wholly within 12 months of the reporting date are recognised in other payables in respect of employees’ services up to the reporting date and are measured at the amounts expected to be paid when the liabilities are settled.
(ii) Long service leave
The liability for long service leave is recognised in the provision for employee benefits and measured as the present value of expected future payments to be made in respect of services provided by employees up to the reporting date using the projected unit credit method. Consideration is given to expected future wage and salary levels, experience of employee departures and periods of service. Expected future payments are discounted using market yields at the reporting date on high quality corporate bonds with terms to maturity and currency that match, as closely as possible, the estimated future cash outflows.
(iii) Share-based payments
Share-based compensation benefits are provided to employees via the Smart Parking Employee Option Plan and the Deferred Share and Incentive Plan.
The fair value of options granted under the Smart Parking Employee Option Plan is recognised as an employee benefit expense with a corresponding increase in equity. The fair value is measured at grant date and recognised over the period during which the employees become unconditionally entitled to the options.
The fair value at grant date is independently determined using a Black-Scholes option pricing model that takes into account the exercise price, the term of the option, the impact of dilution, the share price at grant date and expected price volatility of the underlying share, the expected dividend yield and the risk free interest rate for the term of the option.
The fair value of the options granted is adjusted to reflect market vesting conditions, but excludes the impact of any non-market vesting conditions (for example, profitability and sales growth targets).
Non-market vesting conditions are included in assumptions about the number of options that are expected to become exercisable. At each reporting date, the entity revises its estimate of the number of options that are expected to become exercisable. The employee benefit expense recognised each period takes into account the most recent estimate. The impact of the revision to original estimates, if any, is recognised in the statement of profit or loss and other comprehensive income with a corresponding adjustment to equity.
Under the Deferred Share and Incentive Plan, deferred share rights are issued by Smart Parking to employees for no cash consideration which vest after a time based hurdle. At each reporting date, the entity revises its estimate of the number of deferred share rights that are expected to become exercisable. The employee benefit expense recognised each period takes into account the most recent estimate. The impact of the revision to original estimates, if any, is recognised in the statement of profit or loss and other comprehensive income with a corresponding adjustment to equity.
u) Contributed equity
Ordinary shares are classified as equity.
Incremental costs directly attributable to the issue of new shares or options are shown in equity as a deduction, net of tax, from the proceeds. Incremental costs directly attributable to the issue of new shares or options for the acquisition of a business are not included in the cost of the acquisition as part of the purchase consideration.

Smart Parking Annual Report 2017 57
Financial Statements
v) Earnings per share
(i) Basic earnings per share
Basic earnings per share is calculated by dividing the profit attributable to equity holders of the company, excluding any costs of servicing equity other than ordinary shares, by the weighted average number of ordinary shares outstanding during the financial year, adjusted for bonus elements in ordinary shares issued during the year.
(ii) Diluted earnings per share
Diluted earnings per share adjusts the figures used in the determination of basic earnings per share to take into account the after income tax effect of interest and other financing costs associated with dilutive potential ordinary shares and the weighted average number of shares assumed to have been issued for no consideration in relation to dilutive potential ordinary shares.
w) Goods and Services Tax (GST)
Revenues, expenses and assets are recognised net of the amount of associated GST, unless the GST incurred is not recoverable from the taxation authority. In this case it is recognised as part of the cost of acquisition of the asset or as part of the expense.
Receivables and payables are stated inclusive of the amount of GST receivable or payable. The net amount of GST recoverable from, or payable to, the taxation authority is included with other receivables or payables in the statement of financial position.
Cash flows are presented on a gross basis. The GST components of cash flows arising from investing or financing activities which are recoverable from, or payable to the taxation authority, are presented as operating cash flow.
x) New and revised standards that are effective for these financial statements
The Group has adopted, for the first time, certain standards and amendments to accounting standards. None of the changes have impacted on the Group’s accounting policies nor have they required any restatement.

58
Notes to the Financial Statements (cont.)
y) Accounting Standards issued but not yet effective and not been adopted early by the Group
Certain new and revised accounting standards and interpretations have been published that are not mandatory for the 30 June 2017 reporting period. The Group does not plan to adopt these standards early. An assessment of the impact of these new standards and interpretations is set out below:
New/revised pronouncement:
AASB 9 Financial Instruments (December 2014)
Superseded Announcement:
AASB 139 Financial Instruments: Recognition and Measurement
Nature of Change:
AASB 9 introduces new requirements for the classification and measurement of financial assets and liabilities.
These requirements improve and simplify the approach for classification and measurement of financial assets compared with the requirements of AASB 139. The main changes are:
a) Financial assets that are debt instruments will be classified based on:
(i) the objective of the entity’s business model formanaging the financial assets; and
(ii) the characteristics of the contractual cash flows.
b) Allows an irrevocable election on initial recognition to present gains and losses on investments in equity instruments that are not held for trading in other comprehensive income (instead of in profit or loss). Dividends in respect of these investments that are a return on investment can be recognised in profit or loss and there is no impairment or recycling on disposal of the instrument.
c) Introduces a ‘fair value through other comprehensive income’ measurement category for particular simple debt instruments.
d) Financial assets can be designated and measured at fair value through profit or loss at initial recognition if doing so eliminates or significantly reduces a measurement or recognition inconsistency that would arise from measuring assets or liabilities, or recognising the gains and losses on them, on different bases.
e) Where the fair value option is used for financial liabilities the change in fair value is to be accounted for as follows:
- the change attributable to changes in credit risk are presented in Other Comprehensive Income (OCI)
- the remaining change is presented in profit or loss If this approach creates or enlarges an accounting mismatch in the profit or loss, the effect of the changes in credit risk are also presented in profit or loss.
Otherwise, the following requirements have generally been carried forward unchanged from AASB 139 into AASB 9:
- classification and measurement of financial liabilities; and
- derecognition requirements for financial assets and liabilities.
AASB 9 requirements regarding hedge accounting represent a substantial overhaul of hedge accounting that enable entities to better reflect their risk management activities in the financial statements.
Effective date (annual reporting period beginning on or after):
1 January 2018
Impact on Initial Application:
The entity is yet to undertake a detailed assessment of the impact of AASB 9. However, based on the entity’s preliminary assessment, the Standard is not expected to have a material impact on the transactions and balances recognised in the financial statements when it is first adopted for the year ending 30 June 2019.
Smart Parking Annual Report 2017 59
Financial Statements
New/revised pronouncement:
AASB 15 Revenue from Contracts with Customers
Superseded Announcement:
AASB 118 Revenue AASB 111 Construction Contracts
Nature of Change:
AASB 15:
• establishes a new revenue recognition model
• changes the basis for deciding whether revenue is to be recognised over time or at a point in time
• provides new and more detailed guidance on specific topics (e.g., multiple element arrangements, variable pricing, rights of return, warranties and licensing)
• expands and improves disclosures about revenue.
Effective date (annual reporting period beginning on or after):
1 January 2018
Impact on Initial Application:
The entity is yet to undertake a detailed assessment of the impact of AASB 15. However, based on the entity’s preliminary assessment, the Standard is not expected to have a material impact on the transactions and balances recognised in the financial statements when it is first adopted for the year ending 30 June 2019.
New/revised pronouncement:
AASB 16 Leases
Superseded Announcement:
AASB 117 Leases
Nature of Change:
AASB 16:
• requires all leases to be accounted for ‘on-balance sheet’
• provides new guidance on the application of the definition of lease and on sale and lease back accounting
• largely retains existing lessor accounting requirements
• requires new and different disclosures about leases
Effective date (annual reporting period beginning on or after):
1 January 2019
Impact on Initial Application:
• Based on the entity’s assessment, it is expected that the first-time adoption of AASB 16 for the year ending 30 June 2020 will have a material impact on the transactions and balances recognised in the financial statements, in particular:
• lease assets and financial liabilities on the balance sheet will increase by $17,763,883 and $22,682,934 respectively (based on the facts at the date of the assessment)
• there will be a reduction in the reported equity as the carrying amount of lease assets will reduce more quickly than the carrying amount of lease liabilities
• EBIT in the statement of profit or loss and other comprehensive income will be higher as the implicit interest in lease payments for former operating leases will be presented as part of finance costs rather than being included in operating expenses
• operating cash outflows will be lower and financing cash flows will be higher in the statement of cash flows as principal repayments on all lease liabilities will now be included in financing activities rather than operating activities. Interest can also be included within financing activities
• Refer to Note 30 for details of operating lease commitments.

60
Notes to the Financial Statements (cont.)
2. Critical accounting estimates and judgementsThe Directors evaluate estimates and judgements incorporated into the financial report based on historical knowledge and best available current information. Estimates assume a reasonable expectation of future events and are based on current trends and economic data, obtained both externally and within the Group.
Estimated recoverable amount of goodwillThe Group tests annually whether goodwill has suffered any impairment, in accordance with the accounting policy in note 1 p) (i). The recoverable amounts of cash-generating units have been determined using value-in-use calculations. These calculations require the use of assumptions. Refer to note 13 for details of these assumptions and the potential impact of changes to the assumptions.
The carrying value of the goodwill is $1,507,236 (2016: $1,606,073). During the year there were no impairment losses.
Estimated recoverable amount of developed technologyThe Group annually assesses whether there are any indicators that the developed technology described in note p) (iii) may be impaired. As indicators were identified the recoverable amounts of technology cash-generating unit have been determined using value-in-use calculations and an estimate of the assets fair value less costs to sell. These calculations require the use of assumptions with the key driver of future cash flows being revenue. In the event that the technology division does not generate revenues as planned an impairment of the developed technology may result. Refer to note 13 for details of these assumptions and the potential impact of changes to the assumptions.
The carrying value of the developed technology is $616,637 (2016: $1,452,485) and there were no impairment losses.
Provision for net realisable value of inventoryThe Group annually reviews inventory on hand to determine whether there are any items which are obsolete or have a net realisable value less than cost. Judgement is involved in determining the future realisable value of slow moving items or technology items which may become obsolete with advancements in future technology.
Recognition of deferred tax assetAs disclosed in Note 7 the Group has available carry forward tax losses for utilisation against future taxable income. Tax losses are brought to account as a deferred tax asset where it is determined that it is probable that the tax losses will be utilised against future taxable income. Judgement is required in determining whether it is probable that the tax losses will be utilised against future taxable income and the quantum of the amount which is considered to be probable.
Parking Breach Notice RevenueThe Group recognises a year-end accrual for Parking Breach Notice infringements issued but which have not yet been received. The determination of the accrual requires management to estimate various factors that can impact on the cash subsequently collected, including the contractual terms with car park owners, and the potential for cancellation or non-recovery.
Provision for VATThe Company is aware of an Upper Tier Tribunal Ruling in the UK impacting the treatment of input VAT incurred on expenditure relating to the administration of Parking Breach Notice activities for another company. The company has sought independent expert advice on the facts involved in this case and the potential implications of this tribunal decision on Smart Parking Limited (UK). The expert advice has found strong arguments in favour of Smart Parking Limited (UK) if the company were to litigate. The company is currently seeking to clarify its position and the application of the facts to Smart Parking Limited (UK) directly with Her Majesty’s Revenue and Customs (HMRC), and is seeking to work collaboratively with HMRC to resolve its position amicably without litigation. Smart Parking intends to vigorously defend its position if an agreeable outcome cannot be reached. As at 30 June 2017 the company has booked an appropriate provision of $1.3m for VAT based on an assessment of probability adjusted outcomes as required under the accounting rules. If Smart Parking is unsuccessful in defending its position the maximum liability, net of the provision in FY17 is estimated to be $4.0m.

Smart Parking Annual Report 2017 61
Financial Statements
3. Segment information
a) Description of segments
Management has determined the operating segments based on the reports reviewed by the Board that are used to make strategic decisions.
The Board considers the business from a product perspective and has identified two reportable segments. Technology consists of car parking technology products sold globally and Parking Management consists of the business which operates in the United Kingdom and consists of the provision of car parking management services on behalf of third party car park owners and on sites leased by the Company and managed its own behalf.
Corporate functions are not considered an operating segment and includes activities that are not allocated to other operating segments.
From a geographical perspective technology revenue is reported from New Zealand, Australia, UK, and other, as revenues grow additional countries or regions will be reported.
b) Segment information provided to the board
The segment information provided to the Board for the reportable segments for the year ended 30 June 2017 is as follows:
Group – 2017 Technology
$
Parking Management
$Total
$
Total segment revenue 5,146,223 20,964,343 26,110,566
Inter-segment revenue (1,437,612) - (1,437,612)
Revenue from external customers 3,708,611 20,964,343 24,672,954Adjusted EBITDA (2,733,887) 6,485,154 3,751,267
Depreciation and amortisation 43,068 1,419,215 1,462,283
Income tax expense / (benefit) - 329,733 329,733
Total segment assets 3,148,148 16,398,152 19,546,300
Total assets includes:
Additions to non-current assets 208,325 1,216,489 1,424,814
Total segment liabilities 3,375,439 21,665,694 25,041,133

62
Notes to the Financial Statements (cont.)
3. Segment information (cont.)
The segment information provided to the Board for the reportable segments for the year ended 30 June 2016 was as follows:
Group – 2016 Technology
$
Parking Management
$Total
$
Total segment revenue 5,580,325 28,379,930 33,960,255
Inter-segment revenue (2,201,971) - (2,201,971)
Revenue from external customers 3,378,354 28,379,930 31,758,284Adjusted EBITDA (2,519,960) 5,347,259 2,827,299
Depreciation and amortisation 56,645 1,781,499 1,838,144
Income tax expense / (benefit) - (684,798) (684,798)
Total segment assets 4,152,694 16,743,722 20,896,416
Total assets includes:
Additions to non-current assets 82,325 2,489,304 2,571,629
Total segment liabilities 1,634,252 23,518,037 25,152,289
c) Other segment information
(i) Segment revenue
Sales between segments are carried out at arm’s length and are eliminated on consolidation. The revenue from external parties reported to the Board is measured in a manner consistent with that in the income statement.
Segment revenue reconciles to total revenue from continuing operations as follows:
Consolidated
2017 2016
Total segment revenue 26,110,566 33,960,255
Intersegment eliminations (1,437,612) (2,201,971)
Interest revenue 168,266 46,867
24,841,220 31,805,151

Smart Parking Annual Report 2017 63
Financial Statements
Revenue for the Group is analysed as follows:
Revenue Non-current assets
Group 2017 2016 2017 2016
New Zealand 1,204,752 1,391,528 934,070 1,609,521
Australia 1,577,220 1,302,641 2,326 5,217
United Kingdom 23,255,857 31,249,345 4,961,854 5,708,017
Other 72,737 16,741 - -
Totals prior to intercompany eliminations 26,110,566 33,960,255 5,898,250 7,322,755
Intercompany eliminations (1,437,612) (2,201,971) - -
Total 24,672,954 31,758,284 5,898,250 7,322,755
During the year the Group had no customers that contributed more than 10% of revenue from sales of good and services (2016: $9,229,156 (29%)).
(ii) Adjusted EBITDA
The Board assesses the performance of the operating segments based on a measure of adjusted EBITDA. This measurement excludes the effects of costs incurred in the current period but not expected to occur in the future from the operating segments such as restructuring costs, acquisition costs, legal costs and goodwill impairments which are non-cash in nature. Interest income and expenditure are not allocated to segments, as this type of activity is driven by the central treasury function, which manages the cash position of the group.
A reconciliation of adjusted EBITDA to operating profit before income tax is provided as follows:
Consolidated
2017 2016
Adjusted EBITDA 3,751,267 2,827,299
Intersegment eliminations 971,499 2,184,375
Interest revenue 168,266 46,867
Interest expense (21,772) (1,380)
Depreciation (1,465,097) (1,779,137)
Amortisation (885,980) (880,680)
Loss on disposal of fixed property, plant and equipment (176,456) (946,692)
Professional fees and settlement related to dispute - (831,073)
Provision for VAT (refer note 29) (1,337,678) -
Adjusted EBITDA for parent company (2,061,301) (2,795,898)
Other (9,738) (33,488)
Loss before income tax from operations (1,066,990) (2,209,807)

64
Notes to the Financial Statements (cont.)
3. Segment information (cont.)
(iii) Segment assets
The amounts provided to the Board with respect to total assets are measured in a manner consistent with that of the financial statements. These assets are allocated based on the operations of the segment and the physical location of the asset.
Reportable segments’ assets are reconciled to total assets as follows:
(iv) Segment liabilities
The amounts provided to the Board with respect to total liabilities are measured in a manner consistent with that of the financial statements. These liabilities are allocated based on the operations of the segment.
Reportable segments’ liabilities are reconciled to total liabilities as follows:
Consolidated
2017 2016
Segment assets 19,546,300 20,896,416
Intersegment eliminations (13,792,837) (15,161,158)
Unallocated:
Parent company assets 23,037,812 14,243,726
Total assets as per the balance sheet 28,791,275 19,978,984
Consolidated
2017 2016
Segment liabilities 25,041,133 25,152,289
Intersegment eliminations (19,417,168) (18,571,729)
Unallocated:
Parent company liabilities 831,481 608,928
Total liabilities as per the balance sheet 6,455,446 7,189,488

Smart Parking Annual Report 2017 65
Financial Statements
4. Financial risk managementThe Groups activities expose it to a variety of financial risks: market risk (including currency risk, interest rate risk and price risk), credit risk and liquidity risk. The Group’s overall risk management program focuses on the unpredictability of the financial markets and seeks to minimise potential adverse effects on the financial performance of the Group. The Group does not use derivative financial instruments, however the Group uses different methods to measure different types of risk to which it is exposed. These methods include sensitivity analysis in the case of interest rate, foreign exchange and other price risks, and aging analysis for credit risk.
Risk management is carried out by the Board of Directors with assistance from suitably qualified management. The Board provides written principles for overall risk management and further policies will evolve commensurate with the evolution and growth of the Group.
The group holds the following financial instruments:
a) Market risk
(i) Foreign Exchange Risk
The Group operates internationally (predominantly in the United Kingdom) and is exposed to foreign exchange rate risk arising from various currency exposures.
Foreign exchange risk arises from future commercial transactions and recognised assets and liabilities denominated in a currency that is not the entity’s functional currency.
The Group’s exposure to foreign currency risk (primarily the British Pound) at the end of the reporting period, expressed in Australian dollars was $4.9m (2016: $2.4m).
The Group’s exposure to foreign exchange movements from external trading is not material given that the majority of commercial transactions and recognised assets and liabilities are denominated in the same currency as the functional currency of each respective subsidiary. Any foreign exchange movements on these items are realised through Other Comprehensive Income for the Group. The Group is exposed to foreign currency risk on intercompany trading between the New Zealand and United Kingdom subsidiaries.
(ii) Price risk
The Group is not exposed to equity securities price risk as it does not hold securities that are subject to price fluctuations.
Consolidated
2017 2016
Financial assetsCash and cash equivalents 14,225,598 4,140,820
Trade and other receivables 4,720,993 3,944,903
18,946,591 8,085,723
Financial liabilitiesTrade and other payables 4,809,541 5,830,073
Borrowings 257,095 7,208
5,066,636 5,837,281

66
Notes to the Financial Statements (cont.)
4. Financial risk management (cont.)
(iii) Cash flow and fair value interest rate risk
Some of the Group’s cash balance is held in a high interest earning account. Sensitivity analysis is not disclosed as based on management’s calculations the amounts are considered immaterial.
The Group manages cash flow and interest rate risk by regularly reviewing cash facilities and ensuring we are attracting the highest and most suitable interest rate on our cash holdings. As at reporting date, the Group had the following variable rate cash and borrowings held at variable rates.
30 June 2017 30 June 2016
Weighted average
interest rate Balance
Weighted average
interest rate BalanceCash and cash equivalents 2.60% 14,225,598 2.90% 4,140,820
b) Credit risk
Credit risk is managed on a Group basis. Credit risk arises from cash and cash equivalents as well as credit exposure to trade and other receivables. The board manages credit risk by ensuring all cash balances held at banks are held at internationally and domestically recognised institutions.
The Group continuously monitors defaults of customers and incorporates this information into its credit risk controls. The Group’s policy is to deal only with credit worthy counterparties.
The maximum exposure to credit risk is the carrying amount of the financial assets of cash and other receivables to the value of $18,946,591 (2016: $8,085,723).
As of 30 June 2017, trade receivables of $213,077 (2016: $408,025) were past due but were not impaired. These relate to a number of customers for whom there is no recent history of default (Refer to note 10).
c) Liquidity risk
Prudent liquidity risk management implies maintaining sufficient cash and the availability of funding. The Group manages liquidity risk by continuously monitoring forecast and actual cash flows.
As at reporting date the Group had net working capital of $15,010,291 (2016: $3,860,668). The Group manages liquidity risk by continuously monitoring cash flow forecasts and actual cash flows on a monthly basis.
The financial liabilities of the Group at reporting date included:
• Trade payables incurred in the normal course of the business. These were non interest bearing and were due within the normal 30-60 days terms of creditor payments.
• Hire purchase liabilities.
Maturities of financial liabilities
The tables below analyse the Group’s and the parent entity’s financial liabilities into relevant maturity groupings based on the remaining period at the reporting date to the contractual maturity date. The amounts disclosed in the table are the contractual undiscounted cash flows.
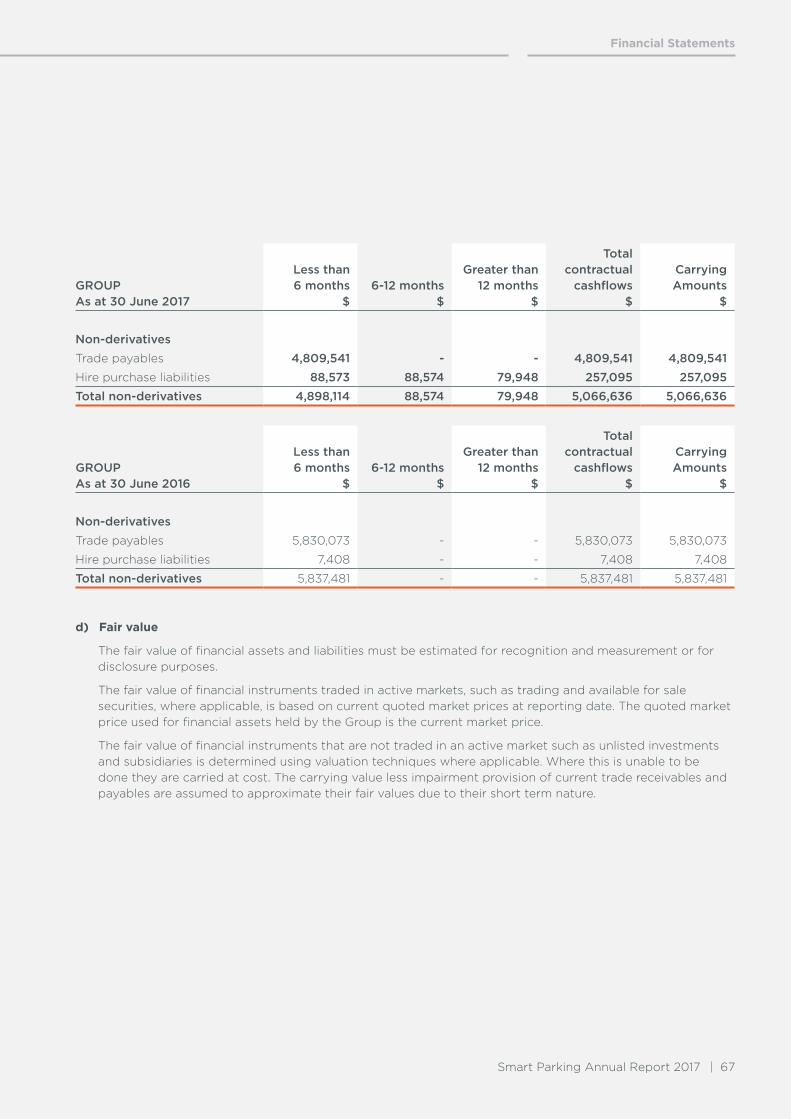
Smart Parking Annual Report 2017 67
Financial Statements
d) Fair value
The fair value of financial assets and liabilities must be estimated for recognition and measurement or for disclosure purposes.
The fair value of financial instruments traded in active markets, such as trading and available for sale securities, where applicable, is based on current quoted market prices at reporting date. The quoted market price used for financial assets held by the Group is the current market price.
The fair value of financial instruments that are not traded in an active market such as unlisted investments and subsidiaries is determined using valuation techniques where applicable. Where this is unable to be done they are carried at cost. The carrying value less impairment provision of current trade receivables and payables are assumed to approximate their fair values due to their short term nature.
GROUP As at 30 June 2017
Less than 6 months
$6-12 months
$
Greater than 12 months
$
Total contractual
cashflows $
Carrying Amounts
$
Non-derivativesTrade payables 4,809,541 - - 4,809,541 4,809,541Hire purchase liabilities 88,573 88,574 79,948 257,095 257,095Total non-derivatives 4,898,114 88,574 79,948 5,066,636 5,066,636
GROUP As at 30 June 2016
Less than 6 months
$6-12 months
$
Greater than 12 months
$
Total contractual
cashflows $
Carrying Amounts
$
Non-derivativesTrade payables 5,830,073 - - 5,830,073 5,830,073
Hire purchase liabilities 7,408 - - 7,408 7,408
Total non-derivatives 5,837,481 - - 5,837,481 5,837,481

68
Notes to the Financial Statements (cont.)
Consolidated
Note 2017 2016
5. Revenue and other incomeRevenue from operationsRevenue from sale of goods and services 24,672,954 31,758,284
Interest revenue 168,266 46,867
Total revenue from operations 24,841,220 31,805,151
6. ExpensesLoss before income tax includes the following specific expenses:
DepreciationMotor vehicles (24,164) (86,259)
Plant and equipment (1,379,023) (1,621,703)
Office equipment (27,663) (28,583)
Leasehold improvements (34,247) (42,592)
Total depreciation (1,465,097) (1,779,137)
Amortisation (885,980) (880,680)
Total depreciation and amortisation (2,351,077) (2,659,817)
Finance costsInterest expense (21,772) (1,380)
Bank fees and charges (65,371) (89,100)
Total finance costs (87,143) (90,480)
Other expensesAudit fees 24 (115,260) (137,709)
Consultants expense (34,057) (287,174)
Foreign exchange gain/(loss) (net) (45,007) (412,604)
Impairment of trade debtors (24,179) 39,189
Legal fees (187,623) (918,334)
Gain/(loss) on disposal of fixed property, plant and equipment (176,456) (946,692)
Motor vehicle expense (447,137) (538,383)
Travel and accommodation (755,153) (789,154)
Insurance (249,011) (335,551)
Telephone and communications (315,737) (473,145)
Cash collection fees (278,052) (748,474)
Licencing authority fees (1,667,389) (1,766,914)
Repairs and maintenance (414,882) (640,624)
IT Support (251,777) (450,209)
Staff recruitment (68,232) (167,323)
Notes to the Financial Statements (cont.)

Smart Parking Annual Report 2017 69
Financial Statements
Consolidated
2017 2016
7. Income tax expense a) Income tax expenseCurrent tax - -
Deferred tax (119,711) (207,459)
Benefits of tax losses 449,444 (477,339)
Income tax expense/(benefit) 329,733 (684,798)
Deferred income tax (revenue) expense included in income tax expense comprises:
Decrease/(increase) in deferred tax assets 329,733 (684,798)
(Decrease)/increase in deferred tax liabilities - -
b) Reconciliation of income tax expense to prima facie tax payableProfit/(loss) before income tax expense (1,066,990) (2,209,807)
Tax at the Australian rate of 30% (2016: 30%) (320,097) (662,942)
Tax effect of permanent differences:
Rate differences (100,604) 10,275
Intangible amortisation expense 252,932 250,191
Share-based payments expense 111,380 66,496
Deferred tax assets brought/not brought to account 386,122 (348,818)
Tax expense/(benefit) 329,733 (684,798)
c) Unrecognised temporary differencesDeferred tax assets and liabilities not recognised relate to the following:
Deferred tax assets
Tax losses 3,501,435 2,845,100
Other temporary differences 1,096,889 822,041
4,598,324 3,667,141
70
Notes to the Financial Statements (cont.)
7. Income tax expense (cont’d)A deferred tax asset has been recognised on tax losses in Smart Parking Limited (UK) which are expected to be utilised within the next 24 months. The Group has determined that it is probable that these tax losses will be utilised as a result of the improved financial performance of this division.
The group has the following tax losses available after recognition of the above deferred tax asset:
• Tax losses arising in Australia of $1,043,681 (2016: $1,343,799) giving rise to an unrecognised deferred tax asset of $313,104 (2016: $403,140);
• Tax losses arising in New Zealand $11,386,896 (2016: $8,721,284) giving rise to an unrecognised deferred tax asset of $3,188,331 (2016: $2,441,960).
At 30 June 2017, there is no recognised or unrecognised deferred income tax liability for taxes that would be payable on the unremitted earnings of the Group’s subsidiaries as the Group has no liability for additional taxation should such amounts be remitted.
d) Tax consolidation legislation
Smart Parking Limited and its wholly owned Australian controlled entities have elected to enter into the tax consolidation legislation from 9 January 2007. The accounting policy in relation to this legislation is set out in note 1(g). On adoption of the tax consolidation legislation, the entities in the tax consolidated group entered into a tax sharing agreement which, in the opinion of the directors, limits the joint and several liability of the wholly owned entities in the case of a default by the head entity, Smart Parking Limited.
The entities entered into a tax funding agreement under which the wholly owned entities fully compensate Smart Parking Limited for any current tax payable assumed and are compensated by Smart Parking Limited for any current tax receivable and deferred tax assets relating to unused tax losses or unused tax credits that are transferred to Smart Parking Limited under the tax consolidation legislation. The funding amounts are determined by reference to the amounts recognised in the wholly owned entities’ financial statements.
The amounts receivable/payable under the tax funding agreement are due upon receipt of the funding advice from the head entity, which is issued as soon as practicable after the end of each financial year. The head entity may also require payment of interim funding amounts to assist with its obligations to pay tax installments. The funding amounts are recognised as current intercompany receivables or payables, no amounts have been recognised.

Smart Parking Annual Report 2017 71
Financial Statements
Consolidated
2017 2016
8. Earnings/(loss) per shareBasic profit/(loss) per share (cents per share) (0.42) (0.51)
Diluted profit/(loss) per share (cents per share) (0.42) (0.51)
Profit/(loss) used in calculating EPS (1,396,723) (1,525,009)
Basic and diluted loss per share
Profit/(loss) used in calculating EPS
Weighted average number of ordinary shares outstanding during the year used in calculating basic EPS
No. 329,005,914
No. 296,174,197
Reconciliation of basic and diluted loss per shareProfit/(loss) attributable to the ordinary equity holders of the company used in calculating earnings/(loss) per share:
(1,396,723) (1,525,009)
The earnings per share calculation has not been adjusted for the 6,135,035 deferred share rights (2016: 5,592,283) as the company has made a loss in the current year and this would be considered antidilutive. These deferred share rights could potentially dilute basic earnings per share in the future.
Consolidated
2017 2016
9. Cash and cash equivalentsCash at bank and in hand 13,541,478 3,368,970
Cash held on behalf of customers 684,120 771,850
14,225,598 4,140,820
Cash at bank includes cash that Smart Parking Limited (UK) has collected and counted on behalf of customers, the associated liability for this is included in other payables.
The Parking Management division collects cash from sites that it operates on behalf of customers on an ongoing basis. These amounts are material. As cash is collected and banked a corresponding liability is recognised for the same amount. As payment terms vary between customers the cash profile of collecting and remitting cash is variable and can have a material impact on the company’s cash balances at any one point in time.
a) Interest rate risk exposure
The Group’s exposure to interest rate risk is discussed in note 4.

72
Notes to the Financial Statements (cont.)
Consolidated
2017 2016
10. Trade and other receivablesCurrentTrade receivables 1,433,493 1,415,713
Provision for impairment of receivables (a) (24,923) (45,053)
1,408,570 1,370,660
Prepayments 1,311,894 1,321,479
Other receivables (d) 2,947,188 2,574,243
5,667,652 5,266,382
Non-currentNon-current receivables (e) 365,235 -
6,032,887 5,266,382
a) Impaired trade receivables
As at 30 June 2017 current trade receivables of the group with a nominal value of $24,923 (2016: $45,053) were impaired. The amount of the provision was $24,923 (2016: $45,053).
The ageing analysis of these trade receivables is as follows:
1 to 3 months 11,948 4,415
3 to 6 months 1,113 34,024
Over 6 months 11,862 6,614
24,923 45,053
Movements in the provision for impairment of receivables are as follows:
At 1 July 45,053 92,120
Provision for impairment recognised during the year - 74,649
Receivables written off during the year as uncollectible (7,816) (26,286)
Unused amount reversed (9,431) (89,064)
Foreign exchange translation (2,883) (6,366)
At 30 June 24,923 45,053
The creation and release of the provision for impaired receivables has been included in ‘Other Expenses’ in the profit or loss. Amounts charged to the provision for impairment are generally written off when there is no expectation of recovering additional cash.

Smart Parking Annual Report 2017 73
Financial Statements
Consolidated
2017 2016
b) Past due but not impaired
As of 30 June 2017, trade receivables of $213,077 (2016: $408,025) were past due but were not impaired. These relate to a number of independent customers for whom there is no recent history of default. The ageing analysis of these trade receivables is as follows:
Up to 3 months 193,774 256,671
3 months and over 19,303 151,354
213,077 408,025
c) Fair values and credit risk
Due to the short term nature of these receivables the carrying values represent their respective fair values at 30 June 2017 and 30 June 2016.
The maximum exposure to credit risk at the reporting date is the carrying amount of each class of receivables mentioned above. Refer to note 4 for more information on the risk management policy of the Group and the credit quality of its receivables.
d) Other receivables
These amounts include accrued income for Pay and Display revenue including cash not collected or cash collected and in transit to the bank at reporting date, and Parking Breach Notice revenue for infringements issued which are expected to be paid subsequent to reporting date.
e) Non-current receivables
These amounts generally arise from transactions outside the usual operating activities of the Company. Interest may be charged at commercial rates where the terms of repayment exceed normal payment terms. Collateral is not normally obtained.
f) Foreign exchange and interest rate risk
Information about the Group’s exposure to foreign currency risk and interest rate risk in relation to trade and other receivables is provided in note 4.
Consolidated
2017 2016
11. InventoriesStock in transit 15,885 23,373
Work in progress 234,634 160,704
Finished goods 1,241,109 1,457,770
1,491,628 1,641,847

74
Notes to the Financial Statements (cont.)
Consolidated
Motor Vehicles
$
Office Equipment
$
Plant and Equipment
$
Leasehold Improvements
$Total
$
12. Property, plant and equipment (non-current)Year ended 30 June 2017 At 1 July 2016
Opening net book amount 47,813 80,034 3,621,087 424,141 4,173,075
Additions 42,270 31,319 1,158,163 6,646 1,238,398
Disposals - (1,221) (143,023) (35,220) (179,464)
Depreciation charge for the year (24,164) (27,663) (1,379,023) (34,247) (1,465,097)
Foreign exchange translation (691) (2,896) (220,535) (25,937) (250,059)
Closing net book amount 65,228 79,573 3,036,669 335,383 3,516,853
At 30 June 2017Cost or fair value 377,507 287,928 7,574,594 467,118 8,707,147
Accumulated depreciation & impairment
(312,279) (208,355) (4,537,925) (131,735) (5,190,294)
Net book amount 65,228 79,573 3,036,669 335,383 3,516,853
Consolidated
Motor Vehicles
$
Office Equipment
$
Plant and Equipment
$
Leasehold Improvements
$Total
$Year ended 30 June 2016 At 1 July 2015Opening net book amount 134,273 84,819 4,253,472 471,109 4,943,673
Additions 188 28,170 2,421,741 63,460 2,513,559
Disposals (1,282) - (954,063) (12,145) (967,490)
Depreciation charge for the year (86,259) (28,583) (1,621,703) (42,592) (1,779,137)
Foreign exchange translation 893 (4,372) (478,360) (55,691) (537,530)
Closing net book amount 47,813 80,034 3,621,087 424,141 4,173,075
At 30 June 2016Cost or fair value 449,809 408,644 8,239,070 546,605 9,644,128
Accumulated depreciation & impairment
(401,996) (328,610) (4,617,983) (122,464) (5,417,053)
Net book amount 47,813 80,034 3,621,087 424,141 4,173,075
(a) Assets in the course of constructionThe carrying amounts of assets disclosed above include the plant and equipment expenditure of $77,340 (2016: $112,181) recognised in relation to property, plant and equipment which is in the course of construction. The group has no capital expenditure contracted for at the reporting date (2016: nil).
(b) Depreciation policyDuring the year the company reassessed the useful lives of certain Property, plant and equipment which resulted in increased depreciation during the year of $302,490.
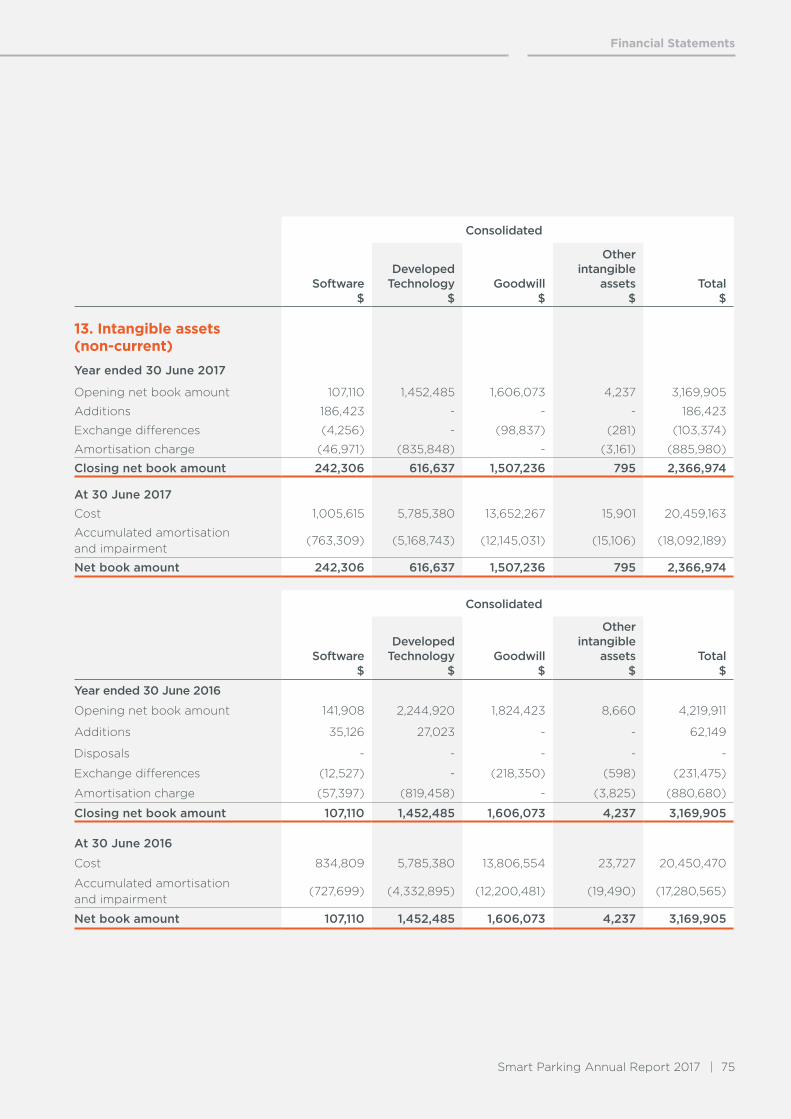
Smart Parking Annual Report 2017 75
Financial Statements
Consolidated
Software$
Developed Technology
$Goodwill
$
Other intangible
assets $
Total$
13. Intangible assets (non-current)Year ended 30 June 2017
Opening net book amount 107,110 1,452,485 1,606,073 4,237 3,169,905
Additions 186,423 - - - 186,423
Exchange differences (4,256) - (98,837) (281) (103,374)
Amortisation charge (46,971) (835,848) - (3,161) (885,980)
Closing net book amount 242,306 616,637 1,507,236 795 2,366,974
At 30 June 2017Cost 1,005,615 5,785,380 13,652,267 15,901 20,459,163
Accumulated amortisation and impairment
(763,309) (5,168,743) (12,145,031) (15,106) (18,092,189)
Net book amount 242,306 616,637 1,507,236 795 2,366,974
Consolidated
Software$
Developed Technology
$Goodwill
$
Other intangible
assets$
Total$
Year ended 30 June 2016
Opening net book amount 141,908 2,244,920 1,824,423 8,660 4,219,911
Additions 35,126 27,023 - - 62,149
Disposals - - - - -
Exchange differences (12,527) - (218,350) (598) (231,475)
Amortisation charge (57,397) (819,458) - (3,825) (880,680)
Closing net book amount 107,110 1,452,485 1,606,073 4,237 3,169,905
At 30 June 2016
Cost 834,809 5,785,380 13,806,554 23,727 20,450,470
Accumulated amortisation and impairment
(727,699) (4,332,895) (12,200,481) (19,490) (17,280,565)
Net book amount 107,110 1,452,485 1,606,073 4,237 3,169,905

76
Notes to the Financial Statements (cont.)
Consolidated
2017 2016
13. Intangible assets (non-current) (cont’d)(a) Impairment test for goodwill and developed technology
Goodwill and the developed technology are allocated to the Group’s CGUs at the lowest level for which there are separately identifiable cash inflows which are largely independent of cash flows from other CGUs.
A CGU level summary of the allocation is presented below.
CGU
Parking Management – goodwill 1,507,236 1,606,073
Technology – developed technology 616,637 1,452,485
2,123,873 3,058,558
The recoverable amount of the Parking Management and Technology CGU is determined on value-in-use calculations. These calculations use cash flow projections based on financial budgets prepared by management covering a one year period and expected short term growth rates for a further 4 years. Cash flows beyond the five year period are extrapolated using the estimated growth rates stated below.
The group annually assesses whether there are any indicators that the developed technology described in note 1 p) (iii) may be impaired. As indicators were identified the recoverable amounts of Technology cash-generating unit have been determined using value-in-use calculations as detailed above. In the event that the Technology division does not generate revenues as planned an impairment of the developed technology may result.
The Technology CGU is still in the early stages of its business cycle and thus management recognise that projecting cash flows for this CGU is inherently uncertain. Accordingly management have also considered the asset’s potential fair value less costs to sell as a secondary basis of valuation for impairment testing purposes. In considering the asset’s potential fair value less costs to sell, management had regard to a range of internal and external factors, and are satisfied the asset is not impaired.
(b) Key assumptions used for value-in-use calculations
The key assumptions below used for value-in-use calculations relate to the Parking Management and Technology CGU.
Parking Management CGUAverage annual growth rate over the budget period* 5.0% 5.0%
Growth rate to perpetuity ** 2.5% 2.5%
Discount rate *** 14.0% 13.5%
Technology CGUAverage annual growth rate over the budget period* 15.0% 20.0%
Growth rate to perpetuity ** 2.5% 2.5%
Discount rate *** 20.0% 25.0%
* Average revenue growth rate used to determine cash flows. **Weighted average growth rate used to extrapolate cash flows beyond the budget period to perpetuity.***Post-tax discount rate.

Smart Parking Annual Report 2017 77
Financial Statements
These assumptions have been used for the analysis of the Parking Management and Technology CGU. Management determined budgeted revenue and gross margin based on its expectations for the future. The weighted average growth rate is based on management projections for the future. The discount rate is the Group’s weighted average cost of capital adjusted for specific risks relating to the relevant CGU where appropriate.
Cash flow assumptions
Technology Division
The growth rate for the Technology CGU exceeds the overall long term average growth rates because this sector is expected to grow at above average rates over the forecast period. This is a result of:
• Market sources recently noted that the smart city market is one of the fastest growing segments of government. Smart Parking is seeing this transition and this is evidenced by previous wins and current and upcoming tenders. The technology and related solutions remain at the “early adopter” stage of market development.
• Expected growth in revenues leveraging off the back of previous wins in New Zealand, Australia and the United Kingdom.
• Increasing recurring revenue from maintenance and data charges.
• Release of the company’s next generation platform which will improve reliability, scalability and enable the company to generate new revenue streams.
The discount rate is high relative to the Group’s weighted average cost of capital to reflect the risk that is inherent in the division at its current stage of development and the difficulties associated with accurately forecasting future cash flows with limited historical information. It also reflects the sensitivity of the value-in-use calculations to revenue growth.
Parking Management Division
The assets were subject to an annual impairment test. The performance of the division improved during the year following improved yields on both managed and leased sites, growth in the number of sites under management and a strong focus on cost control.
(c) Impairment charge
There has been no impairment charge for the year ended 30 June 2017.
(d) Impact of possible changes in key assumptions
If the revenue forecast in the five year cash flow projections for the Parking Management CGU had been 5% lower than management’s estimates at 30 June 2017 the value-in-use would reduce by $6.6m but the goodwill would not be impaired.
If the revenue forecast in the five year cash flow projections for the Technology CGU had been 7.5% lower than management’s estimates at 30 June 2017 the developed technology would be fully impaired by $616,637.
If the discount rate used in the forecast in the five year cash flow projections for the Parking Management CGU had been 5% higher than management’s estimates at 30 June 2017 the value-in-use would reduce by $6.2m but the goodwill would not be impaired.
If the discount rate used in the forecast in the five year cash flow projections for the Technology CGU had been 5% higher than management’s estimates at 30 June 2017 the value-in-use would reduce by $1.7m but the developed technology would not be impaired.

78
Notes to the Financial Statements (cont.)
Consolidated
2017 2016
14. Deferred Tax AssetsThe balance comprises temporary differences attributable to:
Tax losses 829,254 1,378,389
Other temporary differences 327,170 207,459
1,156,424 1,585,848
MovementsTax losses
$
Other temporary
differences $
Total $
At 1 July 2015 1,023,550 - 1,023,550
(Charged)/credited
- to profit or loss 354,839 207,459 562,298
- directly to equity - - -
At 30 June 2016 1,378,389 207,459 1,585,848
(Charged)/credited
- to profit or loss (549,135) 119,711 (429,424)
- directly to equity - - -
At 30 June 2017 829,254 327,170 1,156,424
Refer to Note 7 for details of the recognition of this deferred tax asset.
Consolidated
2017 2016
15. Trade and other payablesCurrent
Trade payables 2,471,186 2,380,298
Related party payables 58,505 23,146
Other payables 2,279,850 3,426,629
4,809,541 5,830,073
(a) All trade and other payables are expected to be settled within 12 months. Other payables includes $684,120 (2016: $771,850) payable to customers for cash that Smart Parking UK has collected and counted on behalf of customers, the associated cash for this is included in cash at bank. Refer to note 9.
(b) Risk exposure
Details of the Group’s exposure to risks arising from trade and other payables are set out in note 4.

Smart Parking Annual Report 2017 79
Financial Statements
Consolidated
2017 2016
16. BorrowingsSecured
Current hire purchase liabilities 177,147 7,208
Non-current hire purchase liabilities 79,948 -
257,095 7,208
During the period Smart Parking Limited (UK) entered into a Hire Purchase facility repayable over 24 months to acquire parking equipment. A portion of the facility was paid directly to the equipment supplier with no funds flowing through the company’s bank account. Further information relating to hire purchase liabilities is set out in Note 30.
17. Deferred revenueCurrent
Revenue received in advance 699,207 633,018
Revenue received in advance relates to a number of customers which have paid in advance for the Group to provide parking technology solutions and parking management services.
18. ProvisionsCurrent
Employee benefits 689,603 719,189
The current provision for employee benefits includes accrued payroll costs, annual leave and payroll taxes. The entire amount is treated as current, since the Group does not have the unconditional right to defer settlement for any of these obligations.
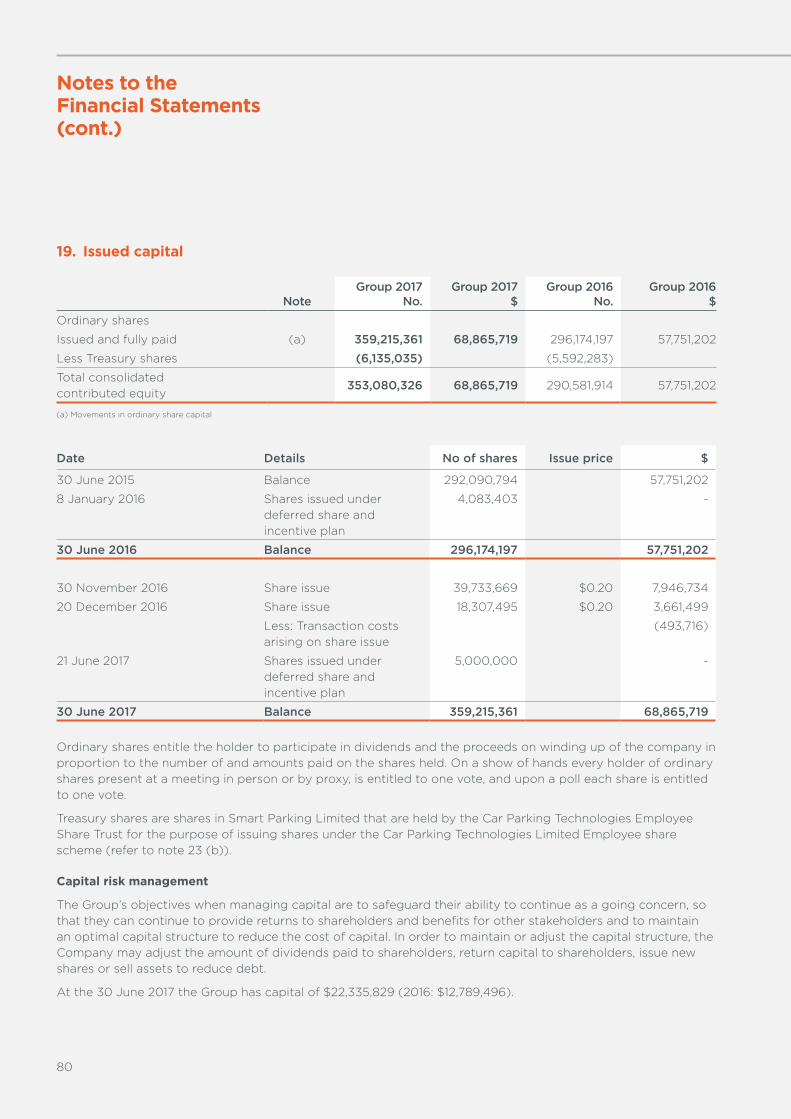
80
Notes to the Financial Statements (cont.)
19. Issued capital
NoteGroup 2017
No.Group 2017
$Group 2016
No.Group 2016
$Ordinary shares
Issued and fully paid (a) 359,215,361 68,865,719 296,174,197 57,751,202
Less Treasury shares (6,135,035) (5,592,283)
Total consolidated contributed equity
353,080,326 68,865,719 290,581,914 57,751,202
(a) Movements in ordinary share capital
Date Details No of shares Issue price $
30 June 2015 Balance 292,090,794 57,751,202
8 January 2016 Shares issued under deferred share and incentive plan
4,083,403 -
30 June 2016 Balance 296,174,197 57,751,202
30 November 2016 Share issue 39,733,669 $0.20 7,946,734
20 December 2016 Share issue 18,307,495 $0.20 3,661,499
Less: Transaction costs arising on share issue
(493,716)
21 June 2017 Shares issued under deferred share and incentive plan
5,000,000 -
30 June 2017 Balance 359,215,361 68,865,719
Ordinary shares entitle the holder to participate in dividends and the proceeds on winding up of the company in proportion to the number of and amounts paid on the shares held. On a show of hands every holder of ordinary shares present at a meeting in person or by proxy, is entitled to one vote, and upon a poll each share is entitled to one vote.
Treasury shares are shares in Smart Parking Limited that are held by the Car Parking Technologies Employee Share Trust for the purpose of issuing shares under the Car Parking Technologies Limited Employee share scheme (refer to note 23 (b)).
Capital risk management
The Group’s objectives when managing capital are to safeguard their ability to continue as a going concern, so that they can continue to provide returns to shareholders and benefits for other stakeholders and to maintain an optimal capital structure to reduce the cost of capital. In order to maintain or adjust the capital structure, the Company may adjust the amount of dividends paid to shareholders, return capital to shareholders, issue new shares or sell assets to reduce debt.
At the 30 June 2017 the Group has capital of $22,335,829 (2016: $12,789,496).

Smart Parking Annual Report 2017 81
Financial Statements
Consolidated
2017 2016
20. Reserves and accumulated losses(a) ReservesShare based payments 2,160,457 1,749,031
Foreign currency translation 854,782 1,437,669
3,015,239 3,186,700
Movements in share based payment reserve were as follows:Balance 1 July 1,749,031 1,452,896
Deferred share rights and option expense 411,426 296,135
Balance 30 June 2,160,457 1,749,031
Share based options
The Company has no unlisted options over ordinary shares on issue at 30 June 2017.
Shares and deferred share rights
The Company has 6,135,035 deferred share rights or shares on issue at 30 June 2017. Each right or share shall entitle the holder to acquire one share for nil consideration providing they are still employed by the Company and they have met the time hurdle.
Movements in foreign currency translation reserve were as follows:Balance 1 July 1,437,669 2,378,448
Currency translation differences arising during the year (582,887) (940,779)
Balance 30 June 854,782 1,437,669
Nature and purpose of reserves
Share-based payments reserve
The share-based payments reserve is used to record the value of equity benefits which may be provided:
• to directors on terms determined by the shareholders; and
• to employees, advisers and consultants as payments for services.
Foreign currency translation reserve
Exchange differences arising on translation of the foreign controlled entity are recognised in other comprehensive income as described in note 1 d) and accumulated within a separate reserve within equity. The cumulative amount is reclassified to profit or loss when the net investment is disposed of.
(b) Accumulated lossesBalance 1 July (48,148,406) (46,623,397)
Net profit/(loss) for the year (1,396,723) (1,525,009)
Balance 30 June (49,545,129) (48,148,406)

82
Notes to the Financial Statements (cont.)
21. Related party transactionsThe consolidated financial statements incorporate the assets, liabilities and results of subsidiaries in accordance with the accounting policy described in note 1(b).
(a) Parent entity
The parent entity of the Group is Smart Parking Limited which is the ultimate Australian parent.
(b) Director related entities
During the year the parent and its subsidiaries made payments to Directors and their related entities for services provided. Details are disclosed in the Director’s Report and note 26.
Consolidated
2017 2016
22. Reconciliation of cash flows from operating activitiesReconciliation of Cash Flow from Operations with Loss after Income TaxProfit/(Loss) after income tax for the period (1,396,723) (1,525,009)
Adjustments for:Loss on disposal of plant and equipment 176,456 946,692
Depreciation and amortisation expense 2,351,077 2,659,817
Impairment of trade receivables 24,179 (39,189)
Share-based payments expense 411,426 296,135
Change in operating assets and liabilities, net of effects from purchase of controlled entity:(Increase)/decrease in trade and term receivables (34,897) 1,146,017
(Increase)/decrease in inventories 150,219 (268,730)
(Increase)/decrease in other current assets (620,284) (903,423)
Increase/(decrease) in trade payables and accruals (916,407) (10,944,399)
Increase/(decrease) in tax payable and deferred tax 426,620 (562,236)
Net cash inflow/(outflow) from operations 571,666 (9,194,325)

Smart Parking Annual Report 2017 83
Financial Statements
23. Share based payments
(a) Options
There were no unissued ordinary shares under option at 30 June 2017.
Fair value of options granted
30 June 2017
There were no options granted during the year ended 30 June 2017.
Where options are issued to employees of subsidiaries within the Group, the subsidiaries compensate Smart Parking Limited for the amount recognised as expense in relation to these options.
(b) Deferred Share and Incentive Plan
In January 2011 shareholders approved the establishment of a Deferred Share and Incentive Plan (Plan). The Plan was established to ensure that Smart Parking Limited has appropriate mechanisms in place to continue to attract and retain the services of employees of a high calibre and as compensation for past performance and incentive for future performance.
Under the Deferred Share and Incentive Plan Australian and United Kingdom based employees receive Smart Parking shares held in escrow for a period of 3 years. The shares are released from escrow at the end of the escrow period provided the employee remains employed at Smart Parking. New Zealand based employees receive deferred share rights which vest after 3 years provided the employee remains employed at Smart Parking after which the employee has 2 years to exercise their rights over Smart Parking shares. Participation in the plan is at the board’s discretion and no individual has a contractual right to participate in the plan or receive any guaranteed benefits.
At 30 June 2017 6,135,035 (2016: 5,592,283) deferred share rights or shares have been set aside under the Plan and 6,135,035 (2016: 5,592,283) deferred share rights or shares, depending on the relevant jurisdiction, have been allocated to employees.
No deferred share rights were issued to Directors for the year ending 30 June 2017 other than 2,218,942 shares granted to Mr Gillespie as part of the long term incentives included in his remuneration (2016: 415,385).
Valuation is based on a number of factors including the share price at the date of issue, the exercise price and the years to maturity.

84
Notes to the Financial Statements (cont.)
23. Share based payments (cont)The terms and conditions of each deferred share right affecting remuneration in the previous, this or future reporting periods are as follows:
Grant or Allocation Date
Date Vested or Date Released from Escrow Expiry Date Exercise Price
Value Per Right/
Share at Grant/Allocation Date
% vested
1 October 2011 1 October 2014 1 October 2016 $0.00 $0.30 100%
20 February 2012 20 February 2015 20 February 2017 $0.00 $0.31 100%
1 July 2012 1 July 2015 1 July 2017 $0.00 $0.27 100%
29 August 2012 29 August 2015 29 August 2017 $0.00 $0.26 100%
1 December 2012 1 December 2015 1 December 2017 $0.00 $0.29 100%
1 January 2013 1 January 2016 1 January 2018 $0.00 $0.26 100%
6 January 2014 6 January 2017 6 January 2019 $0.00 $0.21 100%
10 February 2014 10 February 2016 10 February 2018 $0.00 $0.19 100%
1 July 2014 1 July 2017 1 July 2019 $0.00 $0.14 100%
1 August 2014 1 August 2017 1 August 2019 $0.00 $0.17 0%
16 September 2014 16 September 2016 16 September 2018 $0.00 $0.14 100%
28 November 2014 28 November 2016 28 November 2018 $0.00 $0.15 100%
2 March 2015 2 March 2016 2 March 2018 $0.00 $0.11 100%
2 March 2015 2 March 2017 2 March 2019 $0.00 $0.11 100%
2 March 2015 2 March 2018 2 March 2020 $0.00 $0.11 0%
1 July 2015 1 July 2018 21 August 2020 $0.00 $0.09 0%
21 August 2015 21 August 2017 21 August 2019 $0.00 $0.13 0%
1 November 2015 1 November 2018 1 November 2020 $0.00 $0.13 0%
1 September 2016 1 September 2019 1 September 2021 $0.00 $0.29 0%
22 September 2016 22 September 2018 22 September 2020 $0.00 $0.29 0%
7 November 2016 7 November 2018 7 November 2020 $0.00 $0.30 0%
7 November 2016 7 November 2019 7 November 2021 $0.00 $0.30 0%
7 November 2016 7 November 2020 7 November 2022 $0.00 $0.30 0%
7 November 2016 7 November 2021 7 November 2023 $0.00 $0.30 0%
Consolidated
2017 2016
Shares and deferred share rights issued under the plan to participating employees 6,135,035 5,592,283
(c) Expenses arising from share based payment transactionsShares and deferred share rights 411,426 296,135

Smart Parking Annual Report 2017 85
Financial Statements
Consolidated
2017 2016
24. Auditor’s RemunerationAudit ServicesAudit and review of financial reports
Grant Thornton, Australia 63,000 70,500
Grant Thornton, United Kingdom 52,260 67,209
Total remuneration for audit services 115,260 137,709
Non-audit servicesOther assurance services
Grant Thornton, United Kingdom - 50,878
Total remuneration for non-audit related services - 50,878
Parent
2017 2016
25. Parent Entity InformationThe following details information related to the parent entity, Smart Parking Limited, as at 30 June 2017. The information presented here has been prepared using consistent accounting policies as presented in Note 1.
Current assets 14,730,305 4,354,631
Non-current assets 8,307,507 9,889,095
Total assets 23,037,812 14,243,726
Current liabilities 831,481 608,928
Non-current liabilities - -
Total liabilities 831,481 608,928
Contributed equity 68,865,719 57,751,202
Retained earnings/ (accumulated losses) (48,819,845) (45,865,435)
Option reserve 2,160,457 1,749,031
Total equity 22,206,331 13,634,798
Profit/(Loss) for the year (2,954,410) (5,097,218)
Other comprehensive income/ (loss) for the year - -
Total comprehensive income/ (loss) for the year (2,954,410) (5,097,218)
The parent company has guaranteed the performance of Smart Parking Limited (UK) in relation to the contract with Westminster City Council.
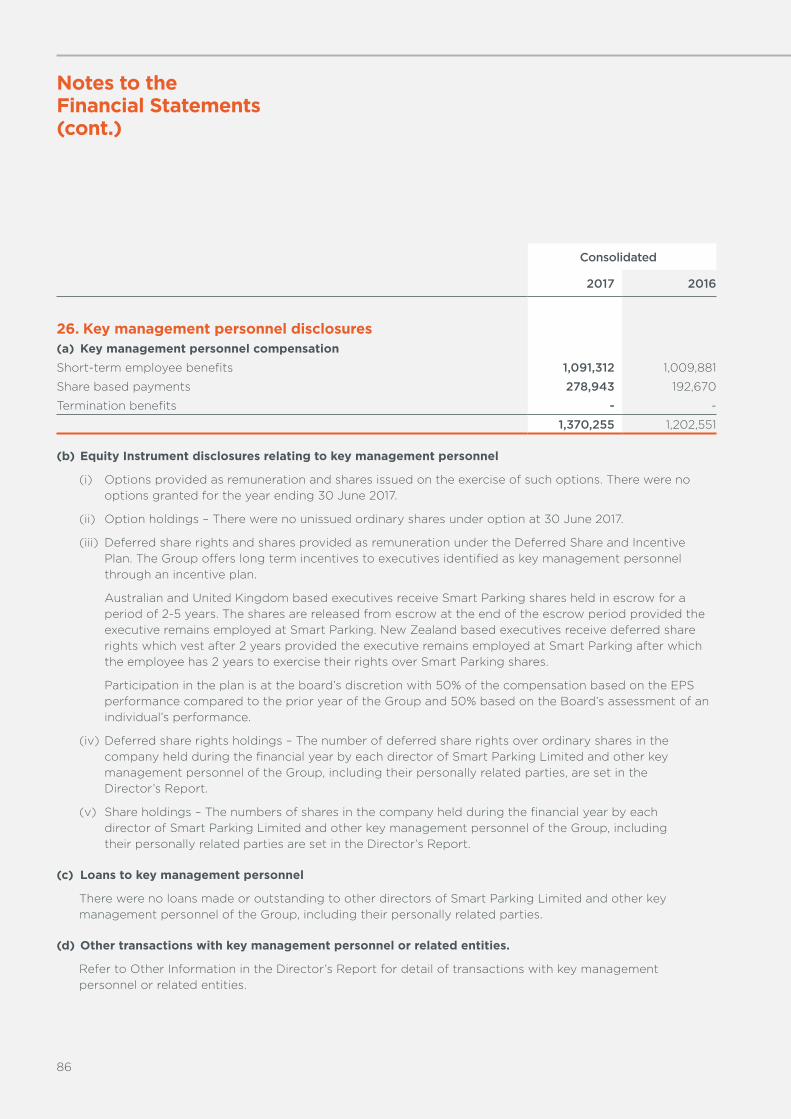
86
Notes to the Financial Statements (cont.)
Consolidated
2017 2016
26. Key management personnel disclosures(a) Key management personnel compensationShort-term employee benefits 1,091,312 1,009,881
Share based payments 278,943 192,670
Termination benefits - -
1,370,255 1,202,551
(b) Equity Instrument disclosures relating to key management personnel
(i) Options provided as remuneration and shares issued on the exercise of such options. There were no options granted for the year ending 30 June 2017.
(ii) Option holdings – There were no unissued ordinary shares under option at 30 June 2017.
(iii) Deferred share rights and shares provided as remuneration under the Deferred Share and Incentive Plan. The Group offers long term incentives to executives identified as key management personnel through an incentive plan.
Australian and United Kingdom based executives receive Smart Parking shares held in escrow for a period of 2-5 years. The shares are released from escrow at the end of the escrow period provided the executive remains employed at Smart Parking. New Zealand based executives receive deferred share rights which vest after 2 years provided the executive remains employed at Smart Parking after which the employee has 2 years to exercise their rights over Smart Parking shares.
Participation in the plan is at the board’s discretion with 50% of the compensation based on the EPS performance compared to the prior year of the Group and 50% based on the Board’s assessment of an individual’s performance.
(iv) Deferred share rights holdings – The number of deferred share rights over ordinary shares in the company held during the financial year by each director of Smart Parking Limited and other key management personnel of the Group, including their personally related parties, are set in the Director’s Report.
(v) Share holdings – The numbers of shares in the company held during the financial year by each director of Smart Parking Limited and other key management personnel of the Group, including their personally related parties are set in the Director’s Report.
(c) Loans to key management personnel
There were no loans made or outstanding to other directors of Smart Parking Limited and other key management personnel of the Group, including their personally related parties.
(d) Other transactions with key management personnel or related entities.
Refer to Other Information in the Director’s Report for detail of transactions with key management personnel or related entities.
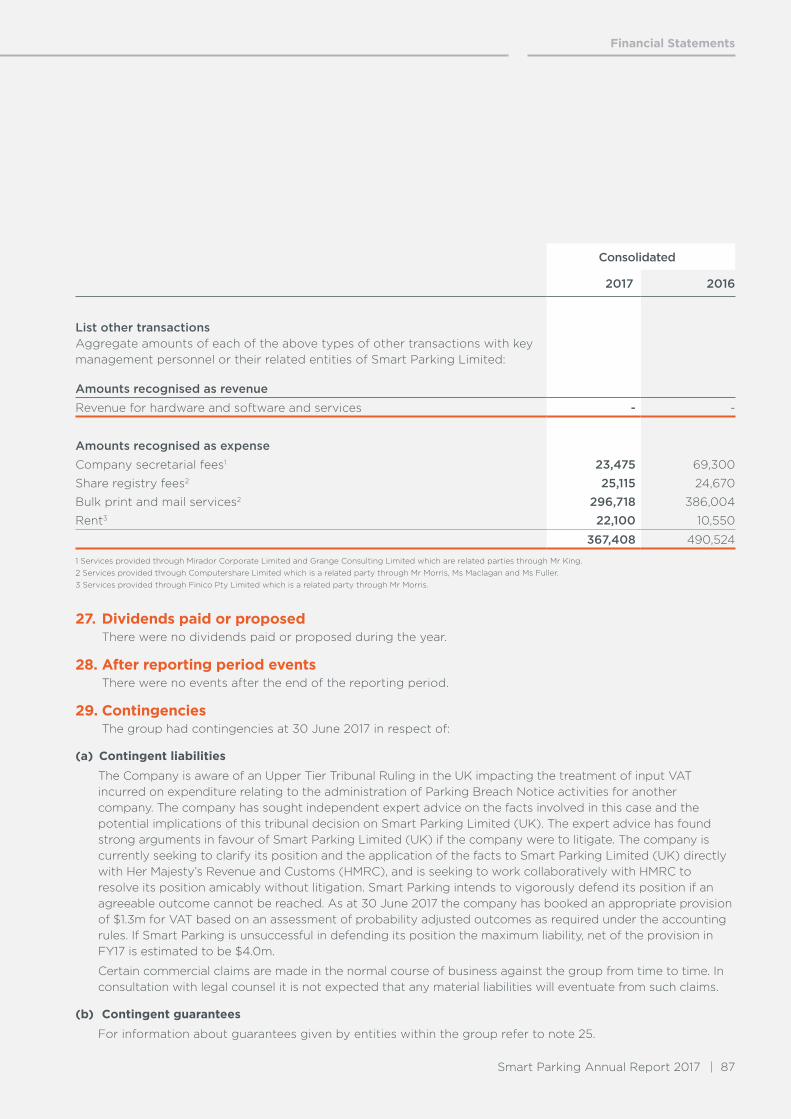
Smart Parking Annual Report 2017 87
Financial Statements
Consolidated
2017 2016
List other transactionsAggregate amounts of each of the above types of other transactions with key management personnel or their related entities of Smart Parking Limited:
Amounts recognised as revenueRevenue for hardware and software and services - -
Amounts recognised as expenseCompany secretarial fees1 23,475 69,300
Share registry fees2 25,115 24,670
Bulk print and mail services2 296,718 386,004
Rent3 22,100 10,550
367,408 490,524
1 Services provided through Mirador Corporate Limited and Grange Consulting Limited which are related parties through Mr King.2 Services provided through Computershare Limited which is a related party through Mr Morris, Ms Maclagan and Ms Fuller.3 Services provided through Finico Pty Limited which is a related party through Mr Morris.
27. Dividends paid or proposed There were no dividends paid or proposed during the year.
28. After reporting period events There were no events after the end of the reporting period.
29. Contingencies The group had contingencies at 30 June 2017 in respect of:
(a) Contingent liabilities
The Company is aware of an Upper Tier Tribunal Ruling in the UK impacting the treatment of input VAT incurred on expenditure relating to the administration of Parking Breach Notice activities for another company. The company has sought independent expert advice on the facts involved in this case and the potential implications of this tribunal decision on Smart Parking Limited (UK). The expert advice has found strong arguments in favour of Smart Parking Limited (UK) if the company were to litigate. The company is currently seeking to clarify its position and the application of the facts to Smart Parking Limited (UK) directly with Her Majesty’s Revenue and Customs (HMRC), and is seeking to work collaboratively with HMRC to resolve its position amicably without litigation. Smart Parking intends to vigorously defend its position if an agreeable outcome cannot be reached. As at 30 June 2017 the company has booked an appropriate provision of $1.3m for VAT based on an assessment of probability adjusted outcomes as required under the accounting rules. If Smart Parking is unsuccessful in defending its position the maximum liability, net of the provision in FY17 is estimated to be $4.0m.
Certain commercial claims are made in the normal course of business against the group from time to time. In consultation with legal counsel it is not expected that any material liabilities will eventuate from such claims.
(b) Contingent guarantees
For information about guarantees given by entities within the group refer to note 25.

88
Notes to the Financial Statements (cont.)
Consolidated
2017 2016
30. Commitments(a) Capital commitments
The group has no capital expenditure contracted for at the reporting date (2016: nil).
(b) Non-cancellable operating lease commitments
The Group leases office and warehouse space under non-cancellable operating leases and has non-cancellable operating leases or management contracts for car parks from which its generates income. The leases have varying terms, escalation clauses and renewal rights. On renewal, the terms of the leases or management contracts are renegotiated.
Commitments for minimum lease payments under non-cancellable operating leases and management contracts are payable as follows:
Within one year 2,241,161 2,480,493
Later than one year but not later than five years 5,605,781 7,049,787
Later than five years 6,177,019 7,009,728
14,023,961 16,540,008
(c) Hire purchase commitments
The Group hires motor vehicles and parking equipment under hire purchase agreements expiring within 3 years. The hire purchase agreements have an option to purchase at the end of the term.
Commitments in relation to hire purchase as follows:
Within one year 177,147 7,208
Later than one year but not later than five years 79,948 -
Later than five years - -
257,095 7,208

Smart Parking Annual Report 2017 89
Directors' Declaration
In the Directors’ opinion:
(a) the financial statements, comprising the statement of profit or loss and other comprehensive income, statement of financial position, statement of cash flows, statement of changes in equity, accompanying notes, are in accordance with the Corporations Act 2001, and:
(i) comply with Accounting Standards, the Corporations Regulations 2001 and other mandatory professional reporting requirements; and
(ii) give a true and fair view of the financial position as at 30 June 2017 and of the performance for the year ended on that date of the Group.
(b) there are reasonable grounds to believe that the company will be able to pay its debts as and when they become due and payable; and
(c) The remuneration disclosures included in the directors’ report (as part of the audited Remuneration Report), for the year ended 30 June 2017, comply with section 300A of the Corporations Act 2001.
(d) The Group has included in the notes to the financial statements an explicit and unreserved statement of compliance with International Financial Reporting Standards.
(e) The Directors have been given the declarations by the chief executive officer and chief financial officer required by section 295A.
This declaration is made in accordance with a resolution of the Board of Directors and is signed for and on behalf of the directors by:
Directors’ Declaration
Christopher Morris Non-Executive Chairman
29 September 2017
Paul Gillespie Managing Director

90
ASX Additional Information
Additional information required by the ASX Limited Listing Rules not disclosed elsewhere in this Annual Report is set out below.
1. ShareholdingsThe issued capital of the Company as at 19 September 2017 is 359,215,361 ordinary fully paid shares. All issued ordinary fully paid shares carry one vote per share.
Ordinary Shares
Shares Range Holders Units %
1-1,000 37 5,362 0.001,001-5,000 395 1,234,308 0.345,001-10,000 246 1,983,828 0.5510,001-100,000 747 21,172,253 7.57100,001 and over 217 328.819,610 91.54Total 1,642 359,215,361 100.00
Unmarketable parcels
There were 98 holders of less than a marketable parcel of ordinary shares.
2. Top 20 Shareholders as at 19 September 2017
NameNumber
of shares %
1 Invia Custodian Pty Limited 110,204,840 30.68
2 HSBC Custody Nominees (Australia) Limited 31,174,662 8.68
3 J P Morgan Nominees Australia Limited 19,290,406 5.37
4 Sagittarius Holdings Limited 17,146,837 4.77
5 Citicorp Nominees Pty Limited 14,102,102 3.93
6 National Nominees Limited 10,462,168 2.91
7 Mr Roland Rogers 9,262,600 2.58
8 Pennilane Investments Pty Ltd 8,286,668 2.31
9 Tamily Pty Ltd 7,176,467 2.00
10 Car Parking Technologies Employee Share Plan Pty Limited 7,152,650 1.99
11 Chouilly Pty Ltd 5,444,935 1.52
12 Mr Bart Engelsman 4,631,300 1.29
13 Custodial Services Limited 4,568,467 1.27
14 Lochinvar Securities Pty Limited 3,860,573 1.07
15 BNP Paribas Noms Pty Ltd 3,342,133 0.93
16 Mr David Oakley 3,000,000 0.84
17 Anancacia Pty Ltd 2,480,000 0.69
18 OLSP Pty Limited 2,267,407 0.63
19 Sanperez Pty Ltd 1,844,315 0.51
20 Bond Street Custodians Limited 1,822,583 0.51
Total 267,521,113 74.48
3. Substantial Shareholders as at 19 September 2017
NameNumber
of shares %
1 Invia Custodian Pty Limited 107,538,173 29.94
4. Unquoted Options as at 19 September 2017Nil.
5. Restricted Securities subject to escrow periodNil.
6. Voting RightsIn accordance with the Company’s Constitution, on a show of hands every shareholder present in person or by proxy, attorney or representative of a shareholder has one vote and on a poll every shareholder present in person or by proxy, attorney or representative of a shareholder has in respect of fully paid shares, one vote for every share held. No class of option holder has a right to vote, however the shares issued upon exercise of options will rank pari passu with the existing fully paid ordinary shares.
7. Company cash and assetsIn accordance with Listing Rule 4.10.19, the company confirms that it has been using the cash and assets it had acquired at the time of admission and for the year ended 30 June 2017 in a way that is consistent with its business objective and strategy.

Company Directory
DirectorsMr Christopher Morris, Non -Executive Chairman
Mr Paul Gillespie, Managing Director
Ms Penelope Maclagan, Non-Executive Director
Ms Tiffany Fuller, Non-Executive Director
Mr Jeremy King, Non-Executive Director
Company SecretaryMr Richard Ludbrook
Registered Office845 Lorimer Street Port Melbourne, Victoria 3207 T: +61 3 8644 4021
Share RegistryComputershare Investor Services Pty Ltd Yarra Falls 452 Johnston Street Abbotsford VIC 3067 T: +61 3 9415 4000 F: +61 3 9473 2500
AuditorsGrant Thornton The Rialto, Level 30 525 Collins Street Melbourne VIC 3000
BankersNational Australia Bank 500 Bourke Street Melbourne VIC 3000
SolicitorsHive Legal Level 4 50 Market Street Melbourne VIC 3000
Stock ExchangeAustralian Securities Exchange Limited Rialto Tower 525 Collins Street Melbourne VIC 3000
ASX CodeSPZ

ABN 45 119 327 169
smartparking.com