annual report 2017 - danske bank · danske bank / annual report 2017 05 in 2018, we will continue...
TRANSCRIPT

Annual Report 2017 Danske Bank Group


Contents
Management’s report4 Letter to our shareholders
6 Financial highlights - Danske Bank Group 7 Executive summary 8 Strategy execution 12 Financial review 17 Capital and liquidity management 20 Investor Relations 21 Corporate responsibility 22 Organisation and management
Business units 24 Personal Banking 28 Business Banking 31 Corporates & Institutions 35 Wealth Management 39 Northern Ireland 42 Non-core 44 Other Activities 45 Definition of alternative performance measures
Financial statements 47 Contents 48 Income statement49 Statement of comprehensive income 50 Balance sheet 51 Statement of capital 55 Cash flow statement 56 Notes
Statements 188 Statement by the management 189 Independent Auditor’s report
Management and directorships 194 Board of Directors 198 Executive Board
201 Supplementary information

Danske Bank / Annual Report 201704
Letter to our shareholdersDear shareholders,
We are pleased to report that 2017 saw good progress for Danske Bank. The positive macroeconomic developments in the Nordic economies and our ongoing efforts to become a more customer-driven, simple and efficient bank helped us deliver a set of strong financial results. Net profit was DKK 20.9 billion and return on shareholders’ equity was 13.6%.
Based on our very solid capital position with a CET1 capital ratio of 17.6% – which is well above our target – we propose a dividend of DKK 10.0 per share, equivalent to 45% of net profit, and to initiate a new share buy-back programme of DKK 10 billion.
We are satisfied with the results, as they provide a good foundation for continued investments in the future. For the second consecutive year, and ahead of plan, we have delivered on our long-term ambition of a return on shareholders’ equity of at least 12.5%. Thus, in alignment with our ambition to be a solid, balanced and predictable bank, we are introducing a new financial target: Going forward, our long-term ambition is to rank in the
top three among our Nordic peers in terms of return on shareholders’ equity. This ambitious and relative target accommodates the changing environment we operate in and will be valid throughout the economic cycle. We have also revised our dividend policy to a pay-out ratio of 40-60% of net profits rather than 40-50%.
On customer satisfaction – one of our other important targets – we maintained the strengthened positions we have built in recent years. In most markets and units, we hold strong positions in line with our ambition of being in the top two, and we remain committed to achieving that position in all markets through continued improvement.
We succeeded in growing our business volumes across business units, while at the same time maintaining a sound credit quality and keeping impairments at a low level. We saw a high level of customer activity in all our markets and welcomed a good number of new customers, particularly through our strategic partnerships in our designated growth markets, Norway and Sweden. At the same time, we invested further in the development of our business and
launched a number of new and innovative products and solutions aimed at making both daily banking and important financial decisions easier for our customers. To further strengthen our offerings within pensions and life insurance, Danica Pension acquired SEB Pension Danmark in December 2017. The transaction is pending approval from the relevant authorities.
During the year, serious questions were raised regarding events that took place in our Estonian branch in the now terminated non-resident portfolio in the period between 2007 and 2015. It appears that our Estonian branch may have been used for money laundering. Both the Board of Directors and the Executive Board take this very seriously. Consequently, in collaboration with independent experts, we have launched thorough investigations into the matter. Danske Bank has a major responsibility and a large role to play in combatting financial crime, and, today more than 900 employees are engaged in preventing money laundering and other types of financial crime. The continued development of a strong compliance culture will remain a priority in the years to come.

Danske Bank / Annual Report 2017 05
In 2018, we will continue to execute our strategy and adapt to the changes in the marketplace driven largely by technology and constantly changing customer expectations. We will do so by continuing to invest in customer-centric products and solutions in our quest to deliver the best customer experience. Satisfied customers is the only way to achieving long-term profitable growth and a prerequisite for turning our vision of becoming the most trusted financial partner into reality.
None of the progress made or the results created in 2017 would have been possible without the dedicated efforts of our employees, and we want to extend our gratitude for their hard work.
Ole AndersenChairman of the Board of Directors
Thomas F. BorgenChief Executive Officer

Danske Bank / Annual Report 201706
Income statement(DKK millions)
2017 2016 Index17/16
2015 2014 2013
Net interest income 23,430 22,028 106 21,402 22,198 22,077
Net fee income 15,304 14,183 108 15,018 14,482 9,468
Net trading income 7,823 8,607 91 6,848 6,895 5,799
Other income 1,591 3,140 51 2,343 1,755 1,308
Net income from insurance business - - - - - 1,088
Total income 48,149 47,959 100 45,611 45,330 39,740
Operating expenses 22,722 22,642 100 23,237 23,972 23,794
Goodwill impairment charges - - - 4,601 9,098 -
Profit before loan impairment charges 25,427 25,317 100 17,773 12,260 15,947
Loan impairment charges -873 -3 - 57 2,788 4,111
Profit before tax, core 26,300 25,320 104 17,716 9,472 11,836
Profit before tax, Non-core -12 37 - 46 -1,503 -1,777
Profit before tax 26,288 25,357 104 17,762 7,969 10,059
Tax 5,388 5,500 98 4,639 4,020 2,944
Net profit for the year 20,900 19,858 105 13,123 3,948 7,115
Attributable to additional tier 1 etc. 786 663 119 607 261 -
Balance sheet (end of year)(DKK millions)
Due from credit institutions and central banks 277,631 200,544 138 75,221 63,786 53,714
Repo loans 228,538 244,474 93 216,303 290,095 316,079
Loans 1,723,025 1,689,155 102 1,609,384 1,563,729 1,536,773
Trading portfolio assets 449,292 509,678 88 547,019 742,512 695,722
Investment securities 324,618 343,337 95 343,304 330,994 161,917
Assets under insurance contracts 296,867 285,398 104 265,572 268,450 246,484
Total assets in Non-core 4,886 19,039 26 27,645 32,329 41,837
Other assets 234,672 192,046 122 208,431 161,120 174,531
Total assets 3,539,528 3,483,670 102 3,292,878 3,453,015 3,227,057
Due to credit institutions and central banks 155,528 155,085 100 137,068 126,800 132,253
Repo deposits 220,371 199,724 110 177,456 400,618 331,091
Deposits 911,852 859,435 106 816,762 763,441 776,412
Bonds issued by Realkredit Danmark 758,375 726,732 104 694,519 655,965 614,196
Other issued bonds 405,080 392,512 103 363,931 330,207 310,178
Trading portfolio liabilities 400,596 478,301 84 471,131 550,629 435,183
Liabilities under insurance contracts 322,726 314,977 102 285,030 288,352 262,468
Total liabilities in Non-core 3,094 2,816 110 5,520 4,950 17,476
Other liabilities 164,531 149,641 110 140,640 138,642 135,924
Subordinated debt 29,120 37,831 77 39,991 41,028 66,219
Additional tier 1 etc. 14,339 14,343 100 11,317 5,675 -
Shareholders' equity 153,917 152,272 101 149,513 146,708 145,657
Total liabilities and equity 3,539,528 3,483,670 102 3,292,878 3,453,015 3,227,057
Ratios and key figuresDividend per share (DKK) 10.0 9.0 8.0 5.5 2.0
Earnings per share (DKK) 22.2 20.2 12.8 3.8 7.1
Return on avg. shareholders' equity (%) 13.6 13.1 8.5 2.5 5.0
Return before goodwill impairment charges on avg. shareholders' equity (%) 13.6 13.1 11.6 8.6 5.0
Return on avg. tangible equity (%) 14.6 14.0 12.9 10.5 6.4
Net interest income as % p.a. of loans and deposits 0.89 0.86 0.88 0.95 0.95
Cost/income ratio (%) 47.2 47.2 61.0 73.0 59.9
Cost/income ratio before goodwill impairment charges (%) 47.2 47.2 50.9 52.9 59.9
Total capital ratio (%) 22.6 21.8 21.0 19.3 21.4
Common equity tier 1 capital ratio (%) 17.6 16.3 16.1 15.1 14.7
Share price (end of year) (DKK) 241.6 214.2 185.2 167.4 124.4
Book value per share (DKK) 172.2 162.8 153.2 146.8 145.6
Full-time-equivalent staff (end of year) 19,768 19,303 102 19,049 18,603 19,122
Financial highlights – Danske Bank Group
The financial highlights represent alternative performance measures that are non-IFRS measures. Note 3 provides an explanation of differences in the presentation between IFRS and the financial highlights. For a description of the alternative performance measures used and definition of ratios, see Definition of Alternative Performance Measures on page 45.

Danske Bank / Annual Report 2017 07
Executive summary“We delivered a strong financial result for 2017,” says Thomas F. Borgen, Chief Executive Officer. “The result reflects continued progress in the Nordic economies, a high level of customer activity throughout the year and our business initiatives aimed at creating a more simple, efficient and customer-centric bank. We experienced a positive development across our business units, which in many areas led to good increases in the number of customers and lending. We continuously strive to improve the custo-mer experience and we have generally maintained the positive trend in customer satisfaction across our markets. Digitalisation increasingly creates new possibilities, and the result for 2017 gives us a good basis for continuing to invest in the development of new solutions for the benefit of our customers.”
2017 was a satisfactory year for Danske Bank, and we posted a net profit of DKK 20.9 billion, against DKK 19.9 billion in 2016. The return on shareholders’ equity after tax was 13.6%, against 13.1% in 2016. The result reflects a positive macroeconomic environment and higher customer activity. Improved customer solutions and a number of product launches supported the result.
The results show that our strategy of becoming an even more customer-focused, simple and efficient bank continued to yield results. Customer satisfaction is a key priority for us, and we are in a good position in most markets. We are working hard to constantly improve the customer experience.
In 2017, we continued to progress in terms of realising our Nordic potential. At Personal Banking, we saw further growth driven mainly by our partnership agreements in Sweden and Norway, and we had stable positions in Denmark and Finland. At Business Banking, we grew lending across markets and maintained our position as a leading bank for small and medium-sized businesses in the Nordic region. Corporates & Institutions and Wealth Management benefited from good customer activity and the positive development in the financial markets. Assets under management were 8% higher than in 2016.
In December 2017, Danica Pension announced the acquisition of SEB Pension in Denmark. Through economies of scale, the transaction will make Danica Pension even more competitive and strengthen its innovation capacity to the benefit of our pension customers. The acquisition is subject to approval by relevant authorities, which is expected in the first half of 2018.
Total income was at the same level in 2017 as in 2016. Net interest income increased from the level in 2016, driven mainly by lending growth of 2% in 2017. Net fee income increased, driven by customer activity and positive market developments. Trading income and other income decreased from the 2016 level, which included several large one-off items.
Operating expenses were broadly flat in 2017. Expenses were affected by higher costs related to compliance, regulation and digitalisation. We invested significant resources in implementing regulatory requirements regarding, for example, financial instruments (MiFID II), data protection (GDPR), payment services (PSD2) and anti-money laundering. Higher activity-related costs were for a large part mitigated by efficiency measures.
Credit quality remained strong, and we saw net impairment reversals driven by improving macroeconomic conditions and higher collateral values in 2017.
With a return on shareholders’ equity of 13.6% in 2017, we delivered ahead of plan on our ambition of at least 12.5% in 2018 at the latest.
Capital, funding and liquidityOur capital position is very strong, with a total capital ratio of 22.6% and a CET1 capital ratio of 17.6%. On the basis of fully phased-in CRR and CRD IV rules and requirements, our CET1 capital ratio stood at 17.5%, versus our current, fully phased-in regulatory CET1 capital requirement of 12.0% and our target range of 14-15% in the short to medium term.
At 31 January 2018, the DKK 10.0 billion share buy-back programme initiated in February 2017 was completed.
On the basis of our strong capital position, the Board of Directors is proposing a dividend for 2017 of DKK 10.0 per share, or 45% of net profit. Danske Bank’s dividend policy has been revised and, going forward, the payout ratio will be 40-60% of net profits rather than 40-50%. Widening the dividend policy range will allow flexibility in capital distributions, while still offering us the possibility of handling profitable growth as well as the effects of pending regulation. We intend to return excess capital to our shareholders if capital is available after we have met our capital targets and paid out ordinary dividends. The Board has decided to initiate a new share buy-back programme of DKK 10.0 billion that will start on 5 February 2018 and run for no more than 12 months.
In 2017, issuance of covered bonds, senior bonds and additional tier 1 capital totalled DKK 67 billion, against the funding plan of DKK 55-70 billion. In Sweden, we started our new domestic mortgage company, Danske Hypotek AB, with issuance of SEK 19 billion.
At 31 December 2017, our liquidity coverage ratio stood at 171%.
Outlook for 2018 and financial targetWe expect net interest income to be higher than in 2017, as we will benefit mainly from volume growth.
Net fee income is expected to remain strong, subject to customer activity.
Expenses are expected to be slightly higher than in 2017.
Loan impairments are expected to be higher but still at a low level. Loan impairments will be based on the new expected credit loss impairment model in IFRS 9.
We expect net profit to be in the range of DKK 18-20 billion.
The outlook is subject to uncertainty and macroeconomic developments.
We have met our longer-term ambition for a return on shareholders’ equity of at least 12.5% in 2018 at the latest. We therefore introduce a new target based on relative performance. Our longer-term ambition is to rank in the top three among major Nordic peers in terms of return on shareholders’ equity.

Strategy execution
Danske Bank / Annual Report 201708
Danske Bank is a Nordic universal bank with strong local roots and bridges to the rest of the world. For 146 years, we have provided banking services to people and businesses by building on our deep financial competence and developing leading, innovative solutions. The universal banking model provides a strong, diversified platform, delivering considerable synergies across our core markets. We have attractive market positions and strong capabilities that hold potential for solid future growth. Our vision is to become the most trusted financial partner by creating long-term value for all our stakeholders.
We see five strong forces driving rapid change in the financial industry: macroeconomic conditions with low interest rates, changed and increased customer expectations, digitalisation, intensified competition and increased regulation. These factors drive our strategic agenda.
The four strategic themes We must adapt to the changes in the market, which also offer us many opportunities to strengthen our relations with our customers and our position in the market, in order to stay competitive.
In 2017, we therefore continued to focus on our four strategic themes:• Nordic potential• Innovation and digitalisation• Customer experience• People and culture
Nordic potentialIn 2017, we took further steps to realise our Nordic potential. In doing so, we maintained a strict focus on customer satisfaction, risk and profitability.
To diversify our business and strengthen our footprint, we continued our growth strategy in Norway and Sweden, where we remain in challenger positions.
At Business Banking, we grew further, attracting profitable business from both new and existing customers. We maintained our position as a leading bank for small and medium-sized businesses in the Nordic region. At Corporates & Institutions, the shift to a customer-driven business model in FICC proved its worth in the low-volatility environment. Capital Markets continued to realise its potential further.
At Personal Banking in Sweden and Norway, we continued to attract new customers through the
strategic partnerships with Akademikerne, Saco and TCO. Our new partnership agreement with TCO, comprising 14 affiliated trade unions with 1.3 million members, took effect in April 2017.
The partnership agreements have enabled us to grow while maintaining high customer satisfaction and sound credit quality. We monitor developments in the property markets closely and maintain a cautious approach in our credit activities. Our digital solutions enable us to manage the significant customer inflow and provide a good customer experience.
To support our growth ambitions in Sweden and to secure more funding directly in local currency, our new domestic funding company, Danske Hypotek AB, became operational in 2017, allowing us to fund in local currency by issuing AAA-rated covered bonds. At year-end, the total outstanding volume was SEK 19 billion.
In Finland, Personal Banking focuses on being a frontrunner in digitalisation in order to attract and on-board new customers. Our agreement with many affiliates of Akava (the Confederation of Unions for Professional and Managerial Staff in Finland) to collaborate on customer life cycle and service development is a strong platform for expanding our business in Finland.
With total market shares of around 6% in Sweden and Norway and 10% in Finland, our Nordic strategy holds considerable potential for future growth.
Loan growth 2017, local currency (%)
Denmark Finland Sweden Norway
0
2
46
8
10
12
1416
18
Business BankingPersonal Banking
Defined as total loans net of impairments. All figures are stated at the nominal value of the loans.

Danske Bank / Annual Report 2017 09
As part of our efforts to simplify the organisation and improve efficiency, we completed the merger between our Finnish subsidiary, Danske Bank Plc, and Danske Bank A/S on 31 December 2017. We now offer all our banking services in Finland through our Finnish branch, which we have renamed to Danske Bank A/S, Finland Branch. Through this merger, we have achieved a uniform organisational structure across the Nordic markets.
In Denmark, where our total market share of lending is around 27%, loan growth was 1% at Personal Banking in 2017, composed of an increase in Danish mortgage lending and a decrease in non-mortgage lending. Loan growth at Business Banking in Denmark was 2%.
In December 2017, Danica Pension announced that it will acquire SEB Pension in Denmark, adding around DKK 100 billion in assets under management to the DKK 380 billion already managed by Danica Pension. SEB Pension in Denmark and Danica Pension are a strategically good fit, and the acquisition will increase scale at Danica Pension and strengthen its innovation capacity to the benefit of our customers.
The acquisition is subject to approval by relevant authorities, which is expected in the first half of 2018.
Innovation and digitalisationDigitalisation continues to transform the financial sector, driven by customer expectations, competition and new regulations. This offers opportunities for Danske Bank to deliver on our strategy of becoming a more customer-driven, simple and efficient bank.
To improve both the customer experience and efficiency, we continue to simplify existing processes.
An example of the significant potential of digitalising end-to-end processes is the re-engineering of our mortgage process. Since 2015, we have halved the processing time per case, and we are able to process new loans even faster through customer self-service solutions.
We also introduced a new financing solution for our small business customers in Denmark, which reduces both the processing time and the time to money from weeks to hours. The solution was very well received among customers, and it now covers around half of all credit applications in selected segments and product areas. We will introduce the solution in our other markets in early 2018, and it will be expanded to more segments and product areas throughout the year.
Digitalisation is also accelerating our efforts to realise our Nordic potential. In Sweden, we welcomed the vast majority of new customers digitally, which enhances the customer experience and increases the scaleability of our business model.
Furthermore, we continue to invest substantial resources in innovation, as ongoing, high-paced innovation is a pre-requisite for staying competitive and relevant to our customers and responding to new competitive forces. As part of this, we keep exploring partnerships to accelerate our efforts, for example MobilePay and GateTu. GateTu is a partnership with A.P. Møller-Mærsk established to develop new business-to-business solutions and services.
Increased regulation means we are investing significant resources in implementing regulatory requirements regarding, for example, financial instruments (MiFID II), data protection (GDPR), payment services (PSD2) and anti-money laundering. To a large extent, we implement these in a digital way, viewing them as business enablers. New regulation provides opportunities to engage customers and learn more about their needs and how we can help them.
June is Danske Bank’s first initiative within digital investment management and was created to offer an easy-to-use and affordable investment platform. June makes investing more accessible, and investors can start with as little as DKK 100, set up monthly deposits and make withdrawals at their convenience at no extra cost. Since the launch in Denmark, around 14,000 Danes have become customers of June.
In 2017, Danske Bank’s mobile payment platform, MobilePay, became a separate entity. This follows the launch of the new partnership model in 2016, with almost all Danish banks joining the MobilePay partnership. MobilePay remains the most popular mobile payment solution in Denmark and Finland and is an important part of our customer offering. New features were added over the year to the benefit of both consumers and businesses, and consumers can use MobilePay in a steadily growing number of shops. Currently, 200 new stores and webshops are added every day to the list of places where consumers can use MobilePay.
Customer experienceCustomer expectations are rising constantly. Our strategy is to become an even more customer-focused, simple and efficient bank. Engaged and competent

Danske Bank / Annual Report 201710
employees are key to delivering a good customer experience. To improve the customer experience further, we introduced new initiatives and launched new products in 2017.
Our ambition is to be ranked among the top two on customer satisfaction in all our markets.
Personal Banking’s ambition is to help our customers be financially confident and achieve their ambitions by making daily banking and important financial decisions easy.
In 2017, in addition to introducing a new type of flexible mortgage product – FlexLife® – we also launched the next generation of the Sunday universe in Denmark, enabling homeowners to get a full overview of their finances, mortgage loans and the value of their current and future homes.
At Business Banking, our ambition is to deliver the best customer experience on the basis of a strong value proposition and an increasingly digitalised service and delivery model.
In the small business segment, we are increasingly combining a lower cost to serve with a higher service level by delivering our offerings online and through self-service solutions. The increase in digitalisation is also making it much easier for customers to interact with us whenever it suits them.
Our large corporate customers with complex needs expect us to deliver tailor-made solutions that match their individual needs. Hence, we have improved our concepts and capabilities to enable us to engage in a strategic dialogue based on ambitions and deciding moments in their life cycle, such as expanding into or trading on new markets and selling or buying a company.
Corporates & Institutions continued to launch new initiatives that focus on delivering the best customer experience through relevant and competitive offerings and by making banking with us easier, for example via new digital solutions to support a smoother working day.
At Wealth Management, we continued to work to improve the customer experience, create innovative
digital solutions and support Nordic growth In 2017, Danica Pension proactively reached out to 170,000 Danish customers regarding their pensions. This resulted in a doubling of customers following our recommendations and an improvement in customer satisfaction.
Our vision in Northern Ireland is to be recognised as the best bank for customers. In a challenging environment, we continue to execute our strategy to transform both the customer experience and our internal operations. In 2017, we introduced a digital system for the third-party mortgage broker network. The investment supports a shift in customer behaviour towards broker channels in recent years. We also moved our small-business advisers closer to customers following feedback from customers. Enhancements to our corporate customer proposition included the introduction of a new digital invoice finance system.
People and cultureOur engaged and competent employees are a pre-requisite for delivering best-in-class customer experiences and for achieving our vision of being recognised as the most trusted financial partner.
High engagement across the organisationFulfilling our customer promise starts with engaged employees. In 2017, we maintained a high employee engagement level, indicated by the number of employees willing to recommend Danske Bank as an employer.1 We remain committed to continuously raising the engagement level through long-term focused efforts.
Building the right capabilitiesOur capabilities training aims to deliver the best customer experience through increased compliance training for all employees. Furthermore, employees participated in 3,000 training sessions in agile ways of working to develop services for our customers faster and increase our end-to-end customer journey focus. More than 2,000 leaders have completed extensive leadership training to build and maintain a strong pipeline of leaders.
Hiring for successIn 2017, we hired some 2,700 new employees, with more than 25% of hires being for IT positions. These hires will put us in a position to further enhance our digital capabilities. We also focused on hiring staff within
1 The employees’ willingness to recommend Danske Bank as an employer is measured as net promotor scores. Danske Bank’s score is 31 compared with the Nordic Banking & Insurance benchmark of 13 from Ennova’s GELx survey (Global Employee and Leadership Index) conducted in January 2017. The survey is conducted across industries in Denmark, Norway, Sweden and Finland.

11Danske Bank / Annual Report 2017
risk management and regulatory compliance, with the workforce growing by about 10%, to address the complexity of being a financial services provider.
Preparing the organisation for long-term successWe are building our workforce to adapt to changing customer behaviour and expectations. We expect this to continue over the coming years. In 2017, we therefore significantly strengthened our efforts to develop a workforce that matches the future needs of our customers and society.
For 146 years, Danske Bank’s domicile has been located at Holmens Kanal. However, to strengthen the platform for operating a modern, efficient and customer-centric bank, Danske Bank’s domicile will relocate in 2023 to new offices constructed for Danske Bank next to Copenhagen central station. The new domicile is part of our strategy to create the best possible setting for improving the customer experience while ensuring our employees up-to-date office spaces. The relocation is part of our strategy of consolidating our activities at two main sites in the greater Copenhagen area.
ComplianceDanske Bank continues to focus on having a strong compliance culture to ensure that compliance is embedded at all levels of the Group and that we act with integrity. The objective is for regulatory requirements to form a natural part of our interaction with all stakeholders. Customers are to be treated fairly throughout their journey with Danske Bank.
In 2017, the compliance organisation was further strengthened by the establishment of a Compliance Incident Management unit that is responsible for control and coordination in respect of material compliance incidents across the Group. The compliance setup enables us to ensure proper awareness and understanding of compliance throughout the Group.
The Group has made, and will continue to make, substantial investments to prevent criminals from abusing its platforms to commit financial crime. In 2017, we focused on enhancing our processes for onboarding and ongoing due diligence of customers, on transaction monitoring and on improving the training of employees.
On the basis of suspicions that Danske Bank in Estonia may have been used for money laundering, the Group launched investigations into the non-resident portfolio at our Estonian branch between 2007 and 2015. The conclusion of a root cause analysis was that several deficiencies in the period from 2007 to 2015 led to the Estonian branch not being sufficiently effective in preventing it from potentially being used for money laundering. As a result, the Group chose to expand its investigation to cover all customers and transactions in the non-resident portfolio at the Estonian branch in that period. The purpose is to report any previously unreported suspicious activity to the authorities and to get a full understanding of historical activity in the portfolio. Moreover, it is essential for us to get full insight into the matter and use this to prevent something similar from happening in the future. The investigation is expected to be completed in the course of 2018.
In October 2017, Danske Bank A/S was placed under formal investigation by the French authorities in relation to suspicions of money laundering concerning transactions carried out by customers of Danske Bank Estonia between 2008 and 2011. In January 2018, the French court Tribunal de Grande Instance de Paris changed the status of Danske Bank in the investigation to that of an assisted witness. This means that Danske Bank is no longer placed under formal investigation, but still forms part of the investigation as an assisted witness.
In December, Danske Bank A/S was charged by the Danish Public Prosecutor for Serious Economic and International Crime (SØIK) with having violated the stipulations of Danish anti-money laundering (AML) legislation on the monitoring of transactions to and from correspondent banks. In this connection, Danske Bank accepted a fine of DKK 12.5 million. The charge and the fine were the result of the inspection made by the Danish FSA at Danske Bank in 2015.

12 Danske Bank / Annual Report 2017
Financial review
In 2017, Danske Bank Group delivered a profit before tax from core activities of DKK 26.3 billion, an increase of 4% from the level in 2016.
IncomeTotal income amounted to DKK 48.1 billion and was on par with the level in 2016. Total income in 2016 benefited, however, from one-off gains, including the sale of our domicile properties.
Net interest income totalled DKK 23.4 billion, with the increase of 6% being driven by higher volumes and lower funding costs.
Net fee income amounted to DKK 15.3 billion and was up 8% from the level in 2016. Net fee income benefited from an increase in assets under management driven by positive customer sales and strong markets, as well as high customer activity, especially at Corporates & Institutions. Net trading income totalled DKK 7.8 billion, a decrease of 9% from the level in 2016, which benefited from the gain on the sale of VISA Europe and the sale of
our shares in Danmarks Skibskredit A/S. Net trading income was driven especially by high customer trading activity in the financial markets, especially early in the year.
Other income amounted to DKK 1.6 billion, a decrease of 49% from the level in 2016, which benefited from the sale of domicile properties.
ExpensesOperating expenses amounted to DKK 22.7 billion and were on par with the level in 2016. Operating expenses were affected by higher costs related primarily to compliance, new regulation and digitalisation. Higher activity-related costs were for a large part mitigated by efficiency measures. Operating expenses also benefited from a one-off gain relating to the amended pension liability in Northern Ireland.
Loan impairments Loan impairment charges remained low, with net reversals in 2017 of DKK 873 million due to solid credit quality driven by higher property prices in most geographical areas, and improving macroeconomic
Income statement(DKK millions)
2017 2016 Index17/16
Q4 2017
Q3 2017
IndexQ4/Q3
Q22017
Q12017
Net interest income 23,430 22,028 106 6,039 5,961 101 5,692 5,739
Net fee income 15,304 14,183 108 4,217 3,494 121 3,743 3,850
Net trading income 7,823 8,607 91 1,543 1,762 88 1,814 2,705
Other income 1,591 3,140 51 420 328 128 487 356
Total income 48,149 47,959 100 12,219 11,544 106 11,736 12,649
Operating expenses 22,722 22,642 100 5,757 5,480 105 5,760 5,724
Profit before loan impairment charges 25,427 25,317 100 6,462 6,064 107 5,976 6,925
Loan impairment charges -873 -3 - -241 -166 - -231 -235
Profit before tax, core 26,300 25,320 104 6,703 6,230 108 6,208 7,160
Profit before tax, Non-core -12 37 - 27 6 - -25 -19
Profit before tax 26,288 25,357 104 6,729 6,236 108 6,182 7,140
Tax 5,388 5,500 98 1,081 1,305 83 1,392 1,610
Net profit for the year 20,900 19,858 105 5,649 4,931 115 4,790 5,530
Attributable to additional tier 1 etc. 786 663 119 197 198 99 197 194

13Danske Bank / Annual Report 2017
conditions. In 2016, loan impairments amounted to a minor net income. At Business Banking, the high reversals related primarily to facilities in Denmark, where property prices rose. However, some impairment charges were made in Norway for a few individual customers. Similarly, Corporates & Institutions continued to book impairments against exposures to the shipping and offshore sectors, although at a much lower level than in 2016, reflecting a more stable situation for offshore companies active on the Norwegian continental shelf.
Loan impairment charges(DKK millions)
2017 2016
Charges
% of credit
exposure* Charges
% of credit
exposure*
Personal Banking -62 -0.01 -477 -0.07
Business Banking -824 -0.12 -235 -0.04
Corporates & Institutions 354 0.08 1,071 0.27
Wealth Management -93 -0.12 -137 -0.20
Northern Ireland -247 -0.55 -234 -0.47
Other Activities 1 0.02 9 0.24
Total -873 -0.04 -3 0.00
* Defined as net credit exposure from lending activities in core segments excluding exposures related to credit institutions and central banks and loan commitments.
TaxTax on the profit for the year amounted to DKK 5.4 billion, or 20.5% of profit before tax. The low tax rate is mainly due to positive adjustments for tax paid in previous years.
Q4 2017 vs Q3 2017
In the fourth quarter of 2017, Danske Bank posted a net profit of DKK 5.6 billion, against DKK 4.9 billion in the third quarter.
Net interest income amounted to DKK 6.0 billion, up 1% from the level in the third quarter. Lending volume growth and stable margins were somewhat offset by foreign exchange movements.
Net fee income amounted to DKK 4.2 billion, up 21% from the level in the third quarter. An increase in performance fees at Wealth Management, and a general increase in activity from the level in the third quarter, were the main drivers.
Net trading income amounted to DKK 1.5 billion, down 12% from the level in the third quarter. The decrease was due primarily to lower customer activity in FICC. Other income amounted to DKK 0.4 billion, up 28% from the level in the third quarter. The increase was driven primarily by a higher risk result and higher income from market-based products at Danica Pension, and by fair value adjustments of investment properties.
Operating expenses amounted to DKK 5.8 billion and were up 5% from the level in the third quarter, owing mainly to seasonality and higher performance-based compensation. Operating expenses benefited from a one-off gain relating to the amended pension liability in Northern Ireland.
Loan impairments showed net reversals of DKK 0.2 billion, continuing the stable trend from the level in the third quarter and reflecting consistently strong credit quality supported by higher collateral values.

14 Danske Bank / Annual Report 2017
Balance sheet
Lending (end of period)(DKK billions)
2017 2016 Index17/16
Q42017
Q32017
IndexQ4/Q3
Q22017
Q12017
Personal Banking 757.9 741.7 102 757.9 759.0 100 747.6 745.9
Business Banking 688.0 662.1 104 688.0 690.8 100 678.2 671.8
Corporates & Institutions 184.6 197.2 94 184.6 187.1 99 192.2 199.0
Wealth Management 75.0 72.5 103 75.0 74.8 100 73.7 73.4
Northern Ireland 46.3 45.6 102 46.3 46.2 100 46.1 46.5
Other Activities incl. elimina-tions -9.4 -7.1 132 -9.4 -11.4 82 -9.9 -9.6
Allowance account, lending 19.4 22.8 85 19.4 20.1 97 20.6 21.6
Total lending 1,723.0 1,689.2 102 1,723.0 1,726.4 100 1,707.3 1,705.5
Deposits (end of period)(DKK billions)
2017 2016 Index17/16
Q42017
Q32017
IndexQ4/Q3
Q22017
Q12017
Personal Banking 273.5 267.1 102 273.5 274.4 100 275.1 267.3
Business Banking 242.3 230.1 105 242.3 240.1 101 245.6 232.2
Corporates & Institutions 273.8 233.3 117 273.8 282.8 97 265.0 256.8
Wealth Management 65.8 62.9 105 65.8 66.3 99 66.7 61.9
Northern Ireland 59.0 59.2 100 59.0 59.5 99 59.0 58.9
Other Activities incl. eliminations -2.5 6.8 - -2.5 0.4 - 2.2 6.4
Total deposits 911.9 859.4 106 911.9 923.4 99 913.6 883.5
Covered bonds(DKK billions)
2017 2016 Index17/16
Q42017
Q32017
IndexQ4/Q3
Q22017
Q12017
Bonds issued by Realkredit Danmark 758.4 726.7 104 758.4 749.4 101 733.2 734.3
Own holdings of bonds 33.6 44.6 75 33.6 40.0 84 44.2 41.2
Total Realkredit Danmark bonds 792.0 771.3 103 792.0 789.4 100 777.4 775.4
Other covered bonds issued 194.2 154.3 126 194.2 187.4 104 187.5 158.6
Own holdings of bonds 7.4 63.1 12 7.4 10.0 74 23.1 62.5
Total other covered bonds 201.7 217.4 93 201.7 197.4 102 210.6 221.1
Total deposits and issued mortgage bonds etc. 1,905.5 1,848.1 103 1,905.5 1,910.2 100 1,901.6 1,880.0
Lending as % of deposits and issued mortgage bonds etc. 90.4 91.4 90.4 90.4 89.8 90.7

15Danske Bank / Annual Report 2017
LendingAt the end of 2017, total lending was up 2% from the level at the end of 2016. Lending increased primarily at Personal Banking and Business Banking.
In Denmark, new gross lending, excluding repo loans, amounted to DKK 94.1 billion. Lending to personal customers accounted for DKK 40.1 billion of this amount.
Our market share of total lending in Denmark, excluding repo loans, was stable at 26.6% at the end of December 2017. In Sweden and Norway, our market shares of lending rose. In Finland, our market share was stable.
Market shares of lending(%)
31 December2017
31 December 2016
Denmark incl. RD (excl. repo) 26.6 26.6
Finland* 9.6 9.6
Sweden (excl. repo)* 5.6 5.2
Norway* 5.9 5.8
Source: Market shares are based on data from the central banks.*The market shares for Finland, Sweden and Norway are based on data at 30 November 2017.
Lending equalled 90.4% of the total amount of deposits, mortgage bonds and other covered bonds, against 91.4% at the end of 2016.
DepositsAt the end of December 2017, total deposits were up 6% from the level at the end of 2016, with increases in most markets. The Group maintained its strong funding position.
Market shares of deposits(%)
31 December2017
31 December 2016
Denmark (excl. repo) 27.9 28.7
Finland* 12.8 12.3
Sweden (excl. repo)* 4.1 3.7
Norway* 6.5 5.5
Source: Market shares are based on data from the central banks. *The market shares for Finland, Sweden and Norway are based on data at 30 November 2017.
Credit exposure Credit exposure from lending activities in core segments totalled DKK 2,688 billion, against DKK 2,534 billion at the end of 2016. Corporates & Institutions showed the largest increase, and growth at Personal Banking and Business Banking also continued in 2017.
Section 4 of Risk Management 2017, which is available at danskebank.com/ir, provides details on Danske Bank’s credit risks.
Credit quality Credit quality remains solid in the light of good credit conditions. Total gross non-performing loans (NPL) decreased owing to continued reversals and work-outs of large customers. The coverage ratio remained high.
The risk management notes on pp. 138-163 provide more information about non-performing loans.
Non-performing loans (NPL) in core segments(DKK millions)
31 December 2017
31 December 2016
Gross NPL 33,255 40,406
Individual allowance account 15,965 18,505
Net NPL 17,290 21,900
Collateral (after haircut) 14,703 18,033
NPL coverage ratio (%) 86.1 82.7
NPL coverage ratio of which is in default (%) 96.8 94.7
NPL as a percentage of total gross exposure 1.2 1.6
The NPL coverage ratio is calculated as individual impairment (allowance account) amounts relative to gross NPL net of collateral (after haircuts).
Accumulated individual impairments amounted to DKK 16.0 billion, or 0.8% of lending and guarantees. Accumulated collective impairments amounted to DKK 4.1 billion, or 0.2% of lending and guarantees. The corresponding figures at 31 December 2016 were DKK 18.5 billion and DKK 5.0 billion, respectively.

Danske Bank / Annual Report 201716
Allowance account by business units (DKK millions)
2017 2016
Accum.impairm. charges*
% of lending
and gua-rantees
Accum.impairm. charges*
% of lending
and gua-rantees
Personal Banking 5,200 0.69 5,584 0.77
Business Banking 11,427 1.68 13,324 2.05
Corporates & Institutions 2,214 0.51 2,762 0.69
Wealth Manage-ment 460 0.60 534 0.75
Northern Ireland 764 1.67 1,273 2.48
Other Activities incl. eliminations 3 0.01 1 -
Total 20,069 1.01 23,479 1.23
* Relating to lending activities in core segments.
Recognised losses amounted to DKK 3.1 billion. Of these losses, DKK 0.2 billion was attributable to facilities not already subject to impairment.
Trading and investment activities Credit exposure from trading and investment activities amounted to DKK 774 billion at 31 December 2017, against DKK 854 billion at 31 December 2016.
Danske Bank has made netting agreements with most of its counterparties concerning positive and negative market values of derivatives. The net exposure was DKK 74.7 billion, against DKK 84.8 billion at the end of 2016, and it was mostly secured through collateral management agreements.
The value of the bond portfolio was DKK 497 billion. Of the total bond portfolio, 70% was recognised at fair value and 30 % at amortised cost.
Bond portfolio(%)
31 December2017
31 December2016
Government bonds and bonds guaranteed by central or local governments 34 33
Bonds issued by quasi- government institutions 1 -
Danish mortgage bonds 49 50
Swedish covered bonds 12 12
Other covered bonds 3 3
Corporate bonds 1 2
Total holdings 100 100
Hold-to-maturity bonds included in total holdings 30 26
Available-for-sale bonds included in total holdings 16 14
Other balance sheet items The financial highlights on page 6 provide information about our balance sheet.
The net position towards central banks, credit institutions and repo counterparties rose DKK 40.1 billion from an asset of DKK 90.2 billion at the end of 2016 to an asset of DKK 130.3 billion at the end of December 2017 due primarily to higher deposits with central banks.
Trading portfolio assets and trading portfolio liabilities increased from net assets of DKK 31.4 billion at the end of 2016 to net assets of DKK 48.7 billion at the end of December 2017 as a result of fluctuations in the market value of the derivatives portfolio.
As a consequence of the continued winding-up of the Non-core portfolios, total assets in Non-core were reduced by DKK 14.1 billion from the level at the end of 2016 and amounted to DKK 4.9 billion at the end of December 2017.
Other assets is the sum of several small line items. The increase of DKK 42.3 billion from the end of 2016 to the end of December 2017 was caused by higher on-demand deposits with central banks and an increase in assets under pooled schemes and unit-linked investment contracts.
Danske Bank / Annual Report 2017 17
Our capital management policies support our business strategy and ensure that we are sufficiently capitalised to withstand severe macroeconomic downturns.
In order to position the Group for our ambitions and to absorb potentially adverse effects under stress as well as the inherent regulatory uncertainty, we have set prudent capital targets. For the common equity tier 1 (CET1) capital ratio, the target is set in the range of 14-15% in the short to medium term and for the total capital ratio, the target is set around 19%.
In December 2017, the Danish Systemic Risk Council recommended the activation of a countercyclical buffer requirement in Denmark of 0.5% from 31 March 2019. The possible introduction of a countercyclical buffer requirement in Denmark will increase the Group’s fully phased-in CET1 requirement by around 0.2%.
The Group’s capital targets are relatively robust to cyclical changes in capital buffer requirements. A possible countercyclical buffer requirement in Denmark will be managed within the Group’s existing capital targets as has been the case with the implementation of countercyclical buffer requirements in other markets where the Group operates.
We will reassess the capital targets when future regulatory initiatives have been further clarified, especially in relation to the implementation into EU legislation of the Basel Committee’s revised standards for REA calculations published in December 2017.
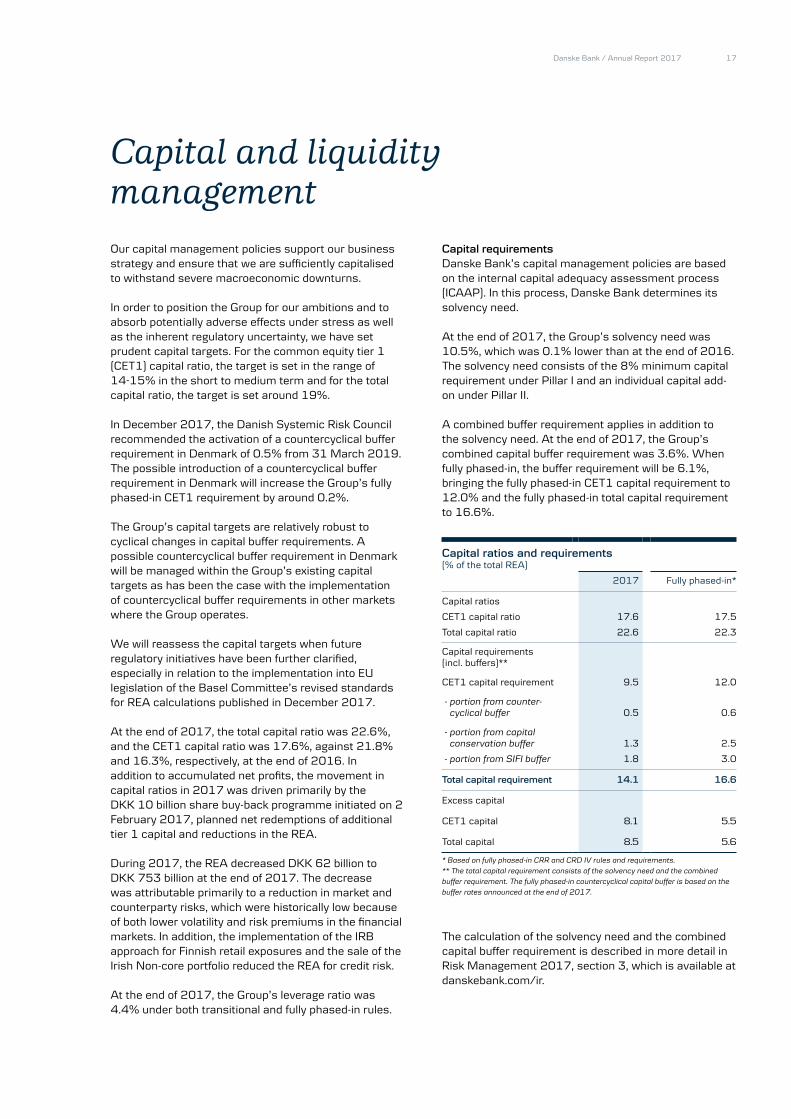
At the end of 2017, the total capital ratio was 22.6%, and the CET1 capital ratio was 17.6%, against 21.8% and 16.3%, respectively, at the end of 2016. In addition to accumulated net profits, the movement in capital ratios in 2017 was driven primarily by the DKK 10 billion share buy-back programme initiated on 2 February 2017, planned net redemptions of additional tier 1 capital and reductions in the REA. During 2017, the REA decreased DKK 62 billion to DKK 753 billion at the end of 2017. The decrease was attributable primarily to a reduction in market and counterparty risks, which were historically low because of both lower volatility and risk premiums in the financial markets. In addition, the implementation of the IRB approach for Finnish retail exposures and the sale of the Irish Non-core portfolio reduced the REA for credit risk.
At the end of 2017, the Group’s leverage ratio was 4.4% under both transitional and fully phased-in rules.
Capital requirementsDanske Bank’s capital management policies are based on the internal capital adequacy assessment process (ICAAP). In this process, Danske Bank determines its solvency need.
At the end of 2017, the Group’s solvency need was 10.5%, which was 0.1% lower than at the end of 2016. The solvency need consists of the 8% minimum capital requirement under Pillar I and an individual capital add-on under Pillar II.
A combined buffer requirement applies in addition to the solvency need. At the end of 2017, the Group’s combined capital buffer requirement was 3.6%. When fully phased-in, the buffer requirement will be 6.1%, bringing the fully phased-in CET1 capital requirement to 12.0% and the fully phased-in total capital requirement to 16.6%.
Capital ratios and requirements (% of the total REA)
2017 Fully phased-in*
Capital ratios
CET1 capital ratio 17.6 17.5
Total capital ratio 22.6 22.3
Capital requirements (incl. buffers)**
CET1 capital requirement 9.5 12.0
- portion from counter- cyclical buffer 0.5 0.6
- portion from capital conservation buffer 1.3 2.5
- portion from SIFI buffer 1.8 3.0
Total capital requirement 14.1 16.6
Excess capital
CET1 capital 8.1 5.5
Total capital 8.5 5.6
* Based on fully phased-in CRR and CRD IV rules and requirements. ** The total capital requirement consists of the solvency need and the combined buffer requirement. The fully phased-in countercyclical capital buffer is based on the buffer rates announced at the end of 2017.
The calculation of the solvency need and the combined capital buffer requirement is described in more detail in Risk Management 2017, section 3, which is available at danskebank.com/ir.
Capital and liquidity management
18 Danske Bank / Annual Report 2017
Capital distribution policyDanske Bank’s long-term ambition is to provide shareholders with a competitive return through share price appreciation and ordinary dividend payments.
Danske Bank’s dividend policy has been revised, and going forward the payout ratio will be 40-60% of net profits rather than 40-50%. Widening the dividend policy range will allow flexibility in capital distributions, while still offering us the possibility of handling profitable growth as well as the effects of pending regulation. We believe the wider dividend policy range underlines our ambition of remaining solid, balanced and predictable.
We intend to return excess capital to our shareholders if capital is available after we have met our capital targets and paid out ordinary dividends.
At 31 December 2017, we had bought back 37.5 million shares for a total purchase amount of DKK 9.2 billion (figures at trade date) of our planned DKK 10.0 billion share buy-back programme.
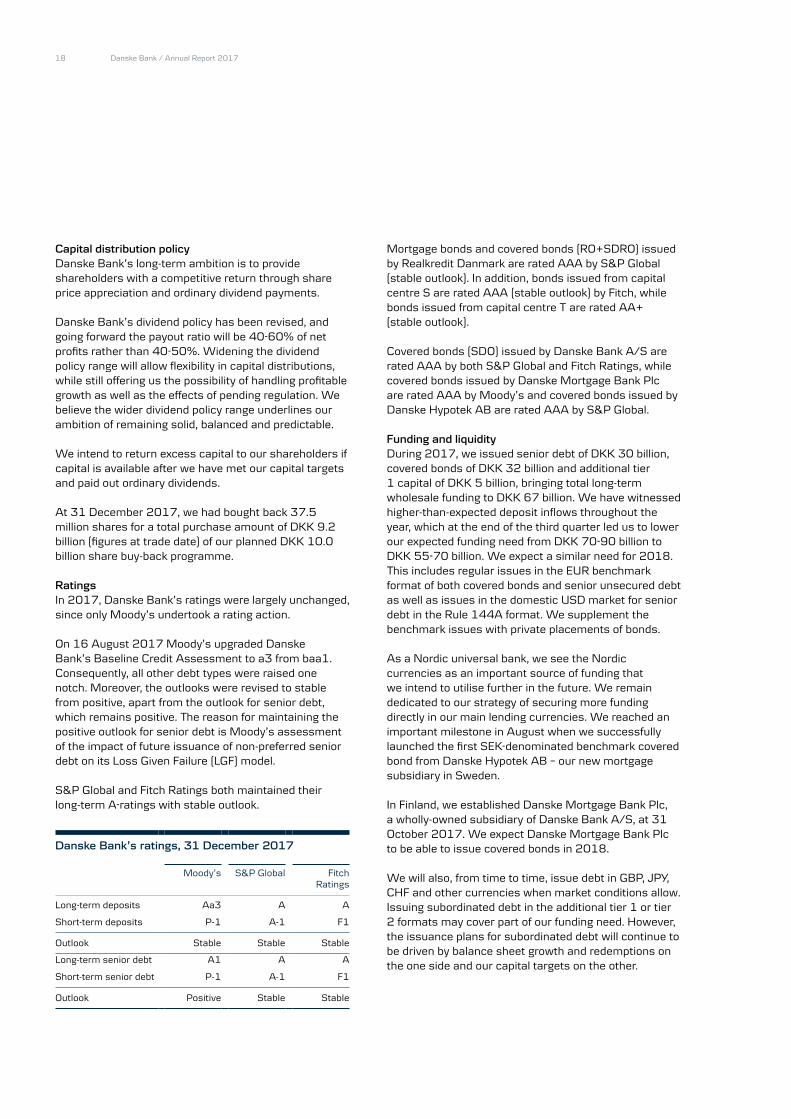
RatingsIn 2017, Danske Bank’s ratings were largely unchanged, since only Moody’s undertook a rating action.
On 16 August 2017 Moody’s upgraded Danske Bank’s Baseline Credit Assessment to a3 from baa1. Consequently, all other debt types were raised one notch. Moreover, the outlooks were revised to stable from positive, apart from the outlook for senior debt, which remains positive. The reason for maintaining the positive outlook for senior debt is Moody’s assessment of the impact of future issuance of non-preferred senior debt on its Loss Given Failure (LGF) model.
S&P Global and Fitch Ratings both maintained their long-term A-ratings with stable outlook.
Danske Bank’s ratings, 31 December 2017
Moody’s S&P Global Fitch Ratings
Long-term deposits Aa3 A A
Short-term deposits P-1 A-1 F1
Outlook Stable Stable Stable
Long-term senior debt A1 A A
Short-term senior debt P-1 A-1 F1
Outlook Positive Stable Stable
Mortgage bonds and covered bonds (RO+SDRO) issued by Realkredit Danmark are rated AAA by S&P Global (stable outlook). In addition, bonds issued from capital centre S are rated AAA (stable outlook) by Fitch, while bonds issued from capital centre T are rated AA+ (stable outlook).
Covered bonds (SDO) issued by Danske Bank A/S are rated AAA by both S&P Global and Fitch Ratings, while covered bonds issued by Danske Mortgage Bank Plc are rated AAA by Moody’s and covered bonds issued by Danske Hypotek AB are rated AAA by S&P Global.
Funding and liquidity During 2017, we issued senior debt of DKK 30 billion, covered bonds of DKK 32 billion and additional tier 1 capital of DKK 5 billion, bringing total long-term wholesale funding to DKK 67 billion. We have witnessed higher-than-expected deposit inflows throughout the year, which at the end of the third quarter led us to lower our expected funding need from DKK 70-90 billion to DKK 55-70 billion. We expect a similar need for 2018. This includes regular issues in the EUR benchmark format of both covered bonds and senior unsecured debt as well as issues in the domestic USD market for senior debt in the Rule 144A format. We supplement the benchmark issues with private placements of bonds.
As a Nordic universal bank, we see the Nordic currencies as an important source of funding that we intend to utilise further in the future. We remain dedicated to our strategy of securing more funding directly in our main lending currencies. We reached an important milestone in August when we successfully launched the first SEK-denominated benchmark covered bond from Danske Hypotek AB – our new mortgage subsidiary in Sweden.
In Finland, we established Danske Mortgage Bank Plc, a wholly-owned subsidiary of Danske Bank A/S, at 31 October 2017. We expect Danske Mortgage Bank Plc to be able to issue covered bonds in 2018.
We will also, from time to time, issue debt in GBP, JPY, CHF and other currencies when market conditions allow. Issuing subordinated debt in the additional tier 1 or tier 2 formats may cover part of our funding need. However, the issuance plans for subordinated debt will continue to be driven by balance sheet growth and redemptions on the one side and our capital targets on the other.

Danske Bank / Annual Report 2017 19
Danske Bank’s liquidity position remained robust. Stress tests show that we have a sufficient liquidity buffer well beyond 12 months. At the end of 2017, our liquidity coverage ratio stood at 171%, with an LCR liquidity buffer of DKK 618 billion.
The total nominal value of outstanding long-term funding, excluding equity-accounted additional tier 1 capital and debt issued by Realkredit Danmark, was DKK 327 billion, against DKK 337 billion at the end of 2016. Danske Bank excluding Realkredit Danmark (DKK billions)
31 December 2017
31 December 2016
Covered bonds 168.1 154.3
Senior unsecured debt 129.9 144.5
Subordinated debt 29.1 37.8
Total 327.1 336.6
The Supervisory DiamondThe Danish FSA has identified a number of specific risk indicators for banks and mortgage credit institutions and has set threshold values with which all Danish banks must comply. The requirements are known as the Supervisory Diamond.
At the end of 2017, Danske Bank was in compliance with all threshold values. A separate report is available at danskebank.com/ir.
Realkredit Danmark also complies with all threshold values.
New regulation Beginning on 1 January 2018, the Group will implement IFRS 9, the new accounting standard for financial instruments.
We expect the implementation of IFRS 9 to result in an increase in the allowance account of around DKK 2.5 billion as a result of the introduction of the new expected credit loss impairment model. The effect of DKK 2.0 billion, net of tax, including other changes because of the implementation of IFRS 9, will reduce shareholders’ equity at 1 January 2018. Note 39 to the financial statements provides more information.
The implementation of the new IFRS 9 model for expected credit loss impairment charges will be subject to a five-year phase-in period in accordance with EU capital requirements regulation adopted in 2017. We expect IFRS 9 to reduce the CET1 capital ratio at 1 January 2018 by 0.1 percentage points (fully phased in: 0.2 percentage points).
In December 2017, the Basel Committee on Banking Supervision (BCBS) published the final revised standards for REA calculations, also known as Basel IV. The revisions include enhancing the robustness and risk sensitivity of the standardised approaches, constraining the use of internal model approaches, and introducing a REA floor of 72.5% of the REA measured by the revised standardised approaches.
BCBS recommends that the revised standards apply from 2022 and that the REA floor will be phased in gradually from 2022 to 2027. The political process to implement the recommendations in the EU has not yet been initiated, and the final outcome is subject to substantial uncertainty. The stipulations of EU legislation are not expected to be fully known until 2021 at the earliest.
On the basis of our strong earnings capacity and capitalisation, we are confident that we will be able to adapt smoothly to the future changes in EU regulatory requirements in relation to Basel IV.
With the implementation of the Bank Recovery and Resolution Directive (BRRD), EU banks are required to have sufficient bail-in-able resources to fulfil the minimum requirement for own funds and eligible liabilities (MREL). The Danish FSA is expected to set the MREL for the Group during 2018 with effect from 1 January 2019.
A more detailed description of the new regulation is provided in section 3 of Risk Management 2017, which is available at danskebank.com/ir.
Danske Bank / Annual Report 201720
Investor Relations at Danske Bank contributes to the Group’s pursuit of its strategic goals by ensuring that stakeholders receive correct and adequate information according to best practice in proactive investor communications and consultation.
To maintain and build stakeholder relations, we hold roadshows after the release of our financial reports as well as roadshows on major transactions and other topics for debt investors.
Together with executive management, Investor Relations has an ongoing dialogue with analysts, shareholders, debt investors and prospective investors that includes presenting and discussing current topics relevant to Danske Bank at seminars and conferences.
Through regular shareholder identification studies, Investor Relations proactively targets institutional investors in order to achieve a stable and diversified investor base and to support high liquidity in and fair pricing of Danske Bank shares. Investor Relations also aims to ensure that there is a broad level of coverage by relevant analysts.
In 2017, investor events were held in the Nordic countries, other European countries, Asia and the US, with close to 600 investors attending.
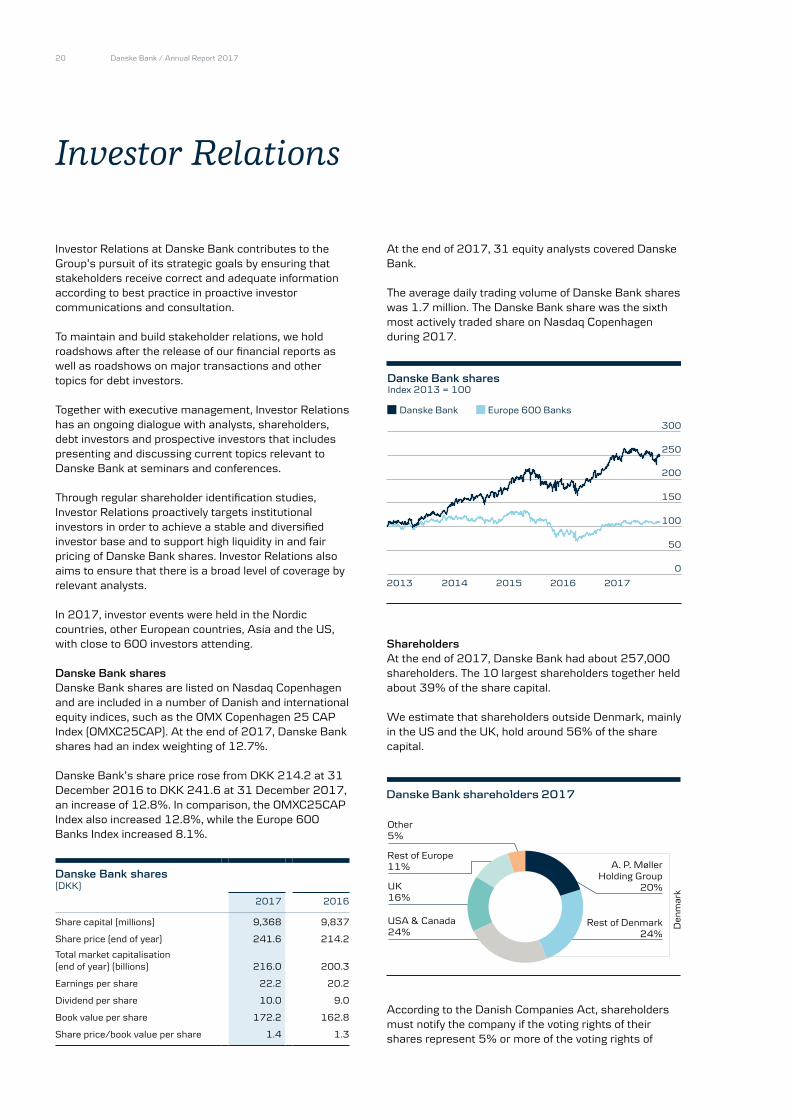
Danske Bank shares Danske Bank shares are listed on Nasdaq Copenhagen and are included in a number of Danish and international equity indices, such as the OMX Copenhagen 25 CAP Index (OMXC25CAP). At the end of 2017, Danske Bank shares had an index weighting of 12.7%.
Danske Bank’s share price rose from DKK 214.2 at 31 December 2016 to DKK 241.6 at 31 December 2017, an increase of 12.8%. In comparison, the OMXC25CAP Index also increased 12.8%, while the Europe 600 Banks Index increased 8.1%.
At the end of 2017, 31 equity analysts covered Danske Bank.
The average daily trading volume of Danske Bank shares was 1.7 million. The Danske Bank share was the sixth most actively traded share on Nasdaq Copenhagen during 2017.
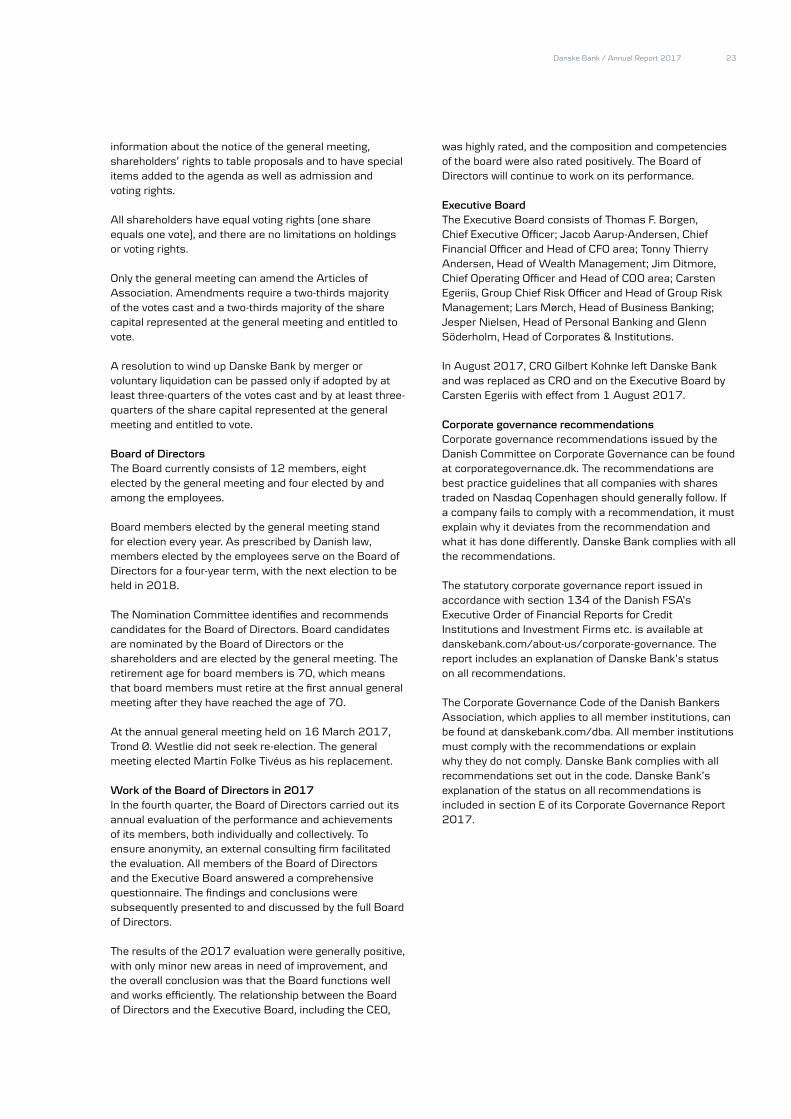
Shareholders At the end of 2017, Danske Bank had about 257,000 shareholders. The 10 largest shareholders together held about 39% of the share capital.
We estimate that shareholders outside Denmark, mainly in the US and the UK, hold around 56% of the share capital.
According to the Danish Companies Act, shareholders must notify the company if the voting rights of their shares represent 5% or more of the voting rights of
Investor Relations
Danske Bank sharesIndex 2013 = 100
Danske Bank Europe 600 Banks
0
50
100
150
200
250
300
20172016201520142013
Rest of Denmark 24%
Den
mar
k
A. P. Møller Holding Group
20%
Rest of Europe 11%
UK 16%
USA & Canada 24%
Other5%
Danske Bank shareholders 2017
Danske Bank shares (DKK)
2017 2016
Share capital (millions) 9,368 9,837
Share price (end of year) 241.6 214.2
Total market capitalisation (end of year) (billions) 216.0 200.3
Earnings per share 22.2 20.2
Dividend per share 10.0 9.0
Book value per share 172.2 162.8
Share price/book value per share 1.4 1.3

Danske Bank / Annual Report 2017 21
the company’s share capital or if the nominal value of their shares represents 5% or more of the share capital. Shareholders must also disclose changes in shareholdings if they exceed or fall below specified percentage thresholds.
Two shareholders have notified Danske Bank of holding 5% or more of the share capital:
• The A.P. Møller Holding Group holds 20.0% of the share capital.
• BlackRock, Inc. holds more than 5.0% of the share capital.
In addition, on 30 January 2018, Danske Bank A/S announced that at 29 January 2018 it held, through direct and indirect holdings, shares in Danske Bank A/S corresponding to 5.01% of the total number of shares in Danske Bank A/S. The holding of own shares is attributable mainly to the DKK 10.0 billion share buy-back programme launched by Danske Bank on 3 February 2017.
The Board of Directors intends to propose to the general meeting in 2018 that these shares be cancelled.
The holding also includes shares held to compensate employees in the form of conditional shares granted under share programmes in previous years and for investments on behalf of Danica Pension policyholders and under pooled investment schemes.
Each share entitles the holder to one vote, and all shares carry the same rights.
Corporate responsibilityWe recognise that we have a special responsibility because of our size and impact on the Nordic economies. Part of our role and responsibility is to be a solid, balanced and predictable bank that contributes to financial stability and economic growth. We believe that integrating ethical, social, environmental and economic considerations in our daily operations creates the best long-term value for all stakeholders.
We focus our corporate responsibility work on two strategic themes and five focus areas to integrate corporate responsibility in our core business.
Focus area: Responsible customer relationshipsWe focus on building responsible customer relationships through our engagement and compliance practices, efforts to fight financial crime and cybercrime, and through the provision of sustainable financing.
In 2017, several initiatives were taken to ensure that our products and services meet our customers’ needs and to strengthen our compliance processes and culture even further. We have stepped up our efforts regarding IT security and cybercrime and the integration of environmental, social and governance (ESG) perspectives in our investment and lending decisions.
Focus area: Responsible employerWe believe that engaged employees are key to delivering the best customer experience. That is why we focus strategically on improving employee engagement, developing our employees’ skills, ensuring an inclusive culture and a diverse workforce, and on creating a healthy, safe and inspiring workplace.
In 2017, our average employee engagement score was 85.4%. We are thus on the right track towards achieving our target of 90% in 2020.
We work strategically with workforce diversity, including gender balance. We have reached our target of 25% of the Board of Directors members elected by the annual general meeting being women. 35% of all management positions are held by women, which brings us close to meeting our target of 38% for women in management. The gender target of 12.5% for the Executive Board has not been met. We have set new targets for 2020. Our 2017 performance and targets for 2020 are shown in the table below.
Gender targets & performance (%)
Targets 2017
Performance 2017
Targets 2020
Share of AGM elected Board of Directors members being women 25 25 38
Share of women on the Executive Board 12.5 0 12.5
Share of women in management positions 38 35 38-40
In 2017, we focused on reducing stress factors and increasing employee well-being. Frequent dialogue between employees and managers is key in achieving this. Our employee engagement tool, Team Talk, engages managers and employees in dialogue at a local level. Our monthly PULSE survey provides management insights on themes such as empowerment, collaboration and our core values. Results from the tools are used to create new initiatives to strengthen engagement and well-being.
Focus area: Contributing to societyThe way we employ the capital we have at our disposal represents our most important impact on society. We also create economic value in society through the payment of salaries and social security costs for our employees, procurement and tax payments, for example.

Danske Bank / Annual Report 201722
We have a wide range of stakeholders, all of whom are important to our business, and we welcome dialogue with all of them, whatever their views. In 2017, our engagement was based on sharing knowledge, on engaging in dialogue and on maintaining partnerships of mutual value.
We participate in local charitable work and corporate volunteering to support children in need, among other things. One example is our collaboration with NGO Need Base India that involves financing the rehabilitation and education of underprivileged children and orphans in India.
Focus area: Environmental footprintWe have an environmental management system in place to minimise our CO2 emissions and manage our environmental impact as effectively as possible. We assess the environmental risks of our business activities and monitor our consumption of energy and paper as well as our use of transport.
Danske Bank has been carbon neutral since 2009. We achieve this by limiting our CO2 emissions and by purchasing renewable electricity and CO2 credits.
Focus area: Responsible supplier relationshipsWe work with responsible sourcing in collaboration with our suppliers to raise corporate responsibility standards in our supply chain. We have a responsible sourcing process, and our target for 2018 is to get 80% of all tenders involving Group Procurement through the process.
Strategic theme: Financial confidenceWe make our expertise available by helping to build financial confidence in the younger generations and at start ups and growth companies.
We develop educational programmes, tools and online platforms that enable parents and teachers to build this financial confidence in children and young adults and help them develop a sound understanding of money and personal finances.
In 2017, a new digital solution, Pocket Money, was developed to enable parents to digitally transfer pocket money to their children, and parents and children to monitor the savings. The solution makes it easier for children to receive pocket money, while improving their understanding of savings and the value of money.
Entrepreneurs and small businesses are essential for innovation, productivity and economic growth in society. We make it easier for Nordic startups and growth companies to accelerate their expansion and reach their ambitions.
In 2017, we established a specialist function for startups, expanded the Hub, our online platform for Nordic startups, supported female entrepreneurs,
helped startups gain a foothold in China and established a partnership with SingularityU Denmark, among other things.
Strategic theme: Accessible financeDigitalisation is transforming the financial infrastructure, and it is important for us to contribute to a responsible transition. We do so by ensuring that our services are easy to use and accessible for all our customers and by developing customised solutions for customers with special needs.
In 2017, we expanded our collaboration with Hus Forbi, the Danish organisation for homeless and socially disadvantaged people, and thus enabled vendors of the organisation’s magazine to receive payment by MobilePay. The money is automatically transferred to a cash card which is not linked to a personal bank account. This represents a vital option for the homeless in an increasingly cashless society.
Corporate Responsibility strategyOur Corporate Responsibility (CR) strategy sets the direction for our work on integrating corporate responsibility in our core business, making our expertise available for the benefit of all stakeholders, increasing transparency and strengthening our role in society.
More informationMore information is available in the independently assured Corporate Responsibility Report 2017. The report serves as our Communication on Progress as required by the UN Global Compact and ensures compliance with the requirements of the Danish FSA’s Executive Order on Financial Reports for Credit Institutions and Investment Firms etc. (subsections 135a and 135b) on corporate responsibility reporting. The report is supplemented by our Corporate Responsibility Fact Book 2017. These reports and further information about our CR initiatives and projects are available at danskebank.com/responsibility.
Organisation and managementGeneral meetingThe general meeting is Danske Bank’s highest decision-making authority.
In 2017, the annual general meeting was held on 16 March.
Danske Bank’s Articles of Association, available at danskebank.com/about-us/corporate-governance, contain
Danske Bank / Annual Report 2017 23
information about the notice of the general meeting, shareholders’ rights to table proposals and to have special items added to the agenda as well as admission and voting rights.
All shareholders have equal voting rights (one share equals one vote), and there are no limitations on holdings or voting rights.
Only the general meeting can amend the Articles of Association. Amendments require a two-thirds majority of the votes cast and a two-thirds majority of the share capital represented at the general meeting and entitled to vote.
A resolution to wind up Danske Bank by merger or voluntary liquidation can be passed only if adopted by at least three-quarters of the votes cast and by at least three-quarters of the share capital represented at the general meeting and entitled to vote.
Board of DirectorsThe Board currently consists of 12 members, eight elected by the general meeting and four elected by and among the employees.
Board members elected by the general meeting stand for election every year. As prescribed by Danish law, members elected by the employees serve on the Board of Directors for a four-year term, with the next election to be held in 2018.
The Nomination Committee identifies and recommends candidates for the Board of Directors. Board candidates are nominated by the Board of Directors or the shareholders and are elected by the general meeting. The retirement age for board members is 70, which means that board members must retire at the first annual general meeting after they have reached the age of 70.
At the annual general meeting held on 16 March 2017, Trond Ø. Westlie did not seek re-election. The general meeting elected Martin Folke Tivéus as his replacement.
Work of the Board of Directors in 2017In the fourth quarter, the Board of Directors carried out its annual evaluation of the performance and achievements of its members, both individually and collectively. To ensure anonymity, an external consulting firm facilitated the evaluation. All members of the Board of Directors and the Executive Board answered a comprehensive questionnaire. The findings and conclusions were subsequently presented to and discussed by the full Board of Directors.
The results of the 2017 evaluation were generally positive, with only minor new areas in need of improvement, and the overall conclusion was that the Board functions well and works efficiently. The relationship between the Board of Directors and the Executive Board, including the CEO,
was highly rated, and the composition and competencies of the board were also rated positively. The Board of Directors will continue to work on its performance.
Executive BoardThe Executive Board consists of Thomas F. Borgen, Chief Executive Officer; Jacob Aarup-Andersen, Chief Financial Officer and Head of CFO area; Tonny Thierry Andersen, Head of Wealth Management; Jim Ditmore, Chief Operating Officer and Head of COO area; Carsten Egeriis, Group Chief Risk Officer and Head of Group Risk Management; Lars Mørch, Head of Business Banking; Jesper Nielsen, Head of Personal Banking and Glenn Söderholm, Head of Corporates & Institutions.
In August 2017, CRO Gilbert Kohnke left Danske Bank and was replaced as CRO and on the Executive Board by Carsten Egeriis with effect from 1 August 2017.
Corporate governance recommendationsCorporate governance recommendations issued by the Danish Committee on Corporate Governance can be found at corporategovernance.dk. The recommendations are best practice guidelines that all companies with shares traded on Nasdaq Copenhagen should generally follow. If a company fails to comply with a recommendation, it must explain why it deviates from the recommendation and what it has done differently. Danske Bank complies with all the recommendations.
The statutory corporate governance report issued in accordance with section 134 of the Danish FSA’s Executive Order of Financial Reports for Credit Institutions and Investment Firms etc. is available at danskebank.com/about-us/corporate-governance. The report includes an explanation of Danske Bank’s status on all recommendations.
The Corporate Governance Code of the Danish Bankers Association, which applies to all member institutions, can be found at danskebank.com/dba. All member institutions must comply with the recommendations or explain why they do not comply. Danske Bank complies with all recommendations set out in the code. Danske Bank’s explanation of the status on all recommendations is included in section E of its Corporate Governance Report 2017.

Danske Bank / Annual Report 201724
Personal Banking
Personal Banking delivered a good result in 2017. Profit before tax rose 5%, driven by higher income and lower operating expenses, which more than offset lower net impairment reversals. Income benefited from continued business volume growth in Sweden and Norway and generally high activity levels within financing and investment.
Personal Banking(DKK millions)
2017 2016 Index17/16
Q42017
Q32017
IndexQ4/Q3
Q22017
Q12017
Net interest income 7,911 7,660 103 1,978 2,007 99 1,963 1,963
Net fee income 3,419 3,306 103 855 833 103 891 841
Net trading income 614 562 109 179 126 142 110 200
Other income 736 613 120 177 176 101 205 178
Total income 12,681 12,141 104 3,189 3,141 102 3,169 3,182
Operating expenses 7,533 7,654 98 1,917 1,819 105 1,900 1,896
Profit before loan impairment charges 5,148 4,486 115 1,271 1,322 96 1,269 1,286
Loan impairment charges -62 -477 - -41 -25 - -53 56
Profit before tax 5,211 4,963 105 1,312 1,347 97 1,322 1,230
Loans, excluding reverse transactions before impairments 757,937 741,651 102 757,937 758,976 100 747,647 745,903
Allowance account, loans 4,876 5,133 95 4,876 4,978 98 5,067 5,170
Deposits, excluding repo deposits 273,478 267,067 102 273,478 274,368 100 275,137 267,266
Bonds issued by Realkredit Danmark 409,363 398,766 103 409,363 409,520 100 405,127 400,681
Allowance account, guarantees 324 450 72 324 346 94 376 379
Allocated capital (average) 24,450 22,759 107 25,350 25,360 100 23,224 23,838
Net interest income as % p.a. of loans and deposits 0.77 0.76 0.77 0.78 0.77 0.78
Profit before tax as % p.a. of allocated capital (ROAC) 21.3 21.8 20.7 21.2 22.8 20.6
Cost/income ratio (%) 59.4 63.0 60.1 57.9 60.0 59.6
Full-time-equivalent staff 4,517 4,623 98 4,517 4,571 99 4,640 4,558
Fact Book Q4 2017 provides financial highlights at country level for Personal Banking. Fact Book Q4 2017 is available at danskebank.com/ir.

Danske Bank / Annual Report 2017 25
2017 vs 2016 Personal Banking delivered a good result in 2017. Profit before tax increased 5% to DKK 5.2 billion, driven by higher income and lower operating expenses. The positive development in income and expenses more than offset lower net reversals of loan impairment charges. Profit before loan impairment charges was up 15%.
Total income was 4% higher than last year, driven by growing business volumes and generally high activity levels within investment and financing.
Net interest income rose 3%, benefiting from growing lending volumes and good business momentum, which more than offset the pressure on deposit margins resulting from the persistently low interest rates.
Total lending rose 2% on the back of our strategic partnerships with Akademikerne in Norway and with Saco and TCO in Sweden.
The higher investment and financing activity lifted net fee income 3% and net trading income 9% relative to 2016.
Operating expenses decreased 2% despite increasing costs for regulatory compliance. The decrease was the result of cost efficiencies across market areas.
Credit quality Credit quality was generally stable. Most of our markets continued to benefit from favourable macroeconomic conditions and low interest rate levels.
Loan impairment charges for the year amounted to a net reversal of DKK 62 million, reflecting strong and stable portfolio credit quality and increased collateral values in particularly in Denmark.
The declining house prices in Norway and Sweden are monitored closely, and we maintain a cautious approach in our credit activities, while maintaining growth, for example, through strategic partnerships.
Overall, the loan-to-value (LTV) level fell slightly throughout the year.
Loan-to-value ratio, home loans
31 December 2017 31 December 2016
LTV (%)
Net credit
exposure (DKK bn) LTV (%)
Net credit
exposure (DKK bn)
Denmark 64.2 465 65.5 459
Finland 61.2 85 60.7 83
Sweden 60.6 80 59.0 70
Norway 62.8 93 62.5 93
Total 63.3 723 63.9 706
Credit exposure Credit exposure increased to DKK 789 billion at the end of 2017, driven by growth in Denmark and strategic partnerships in Sweden and Norway.
Net credit exposure Impairments(%)
(DKK millions)31 December
201731 December
201631 December
2017
Denmark 496,776 489,455 -0.01%
Finland 91,566 90,514 0.03%
Sweden 88,048 77,955 -0.01%
Norway 112,678 113,432 -0.01%
Total 789,068 771,357 -0.01%
Business initiativesPersonal Banking’s ambition is to help our customers be financially confident and achieve their ambitions by making daily banking and important financial decisions easy. Throughout the year, we continued our efforts to create the best customer experiences by providing seamless banking across touch points and proactive advice that matches our customers’ lives.
Nordic growth potentialWe continued to grow our personal banking business in Sweden and Norway on the back of a good inflow of new customers from our partnership agreements.

Danske Bank / Annual Report 201726
In Norway, we continued to welcome new Akademikerne customers, and in Sweden both the start of the partnership with TCO in April and the existing partnership with Saco generated a good inflow of new customers, leading to new business and growing income. In the fourth quarter, we further expanded our agreement with Saco to offer its 50,000 business members to join us on attractive terms.
Denmark and Finland also contributed to the good performance. Over the year, we saw a positive trend in the number of customers who gather their business with us in Denmark. In Finland, we saw good demand for mortgage loans, especially among first-time home buyers, and a small increase in the number of new registrations for our customer programme.
Customer experienceWe continued to develop solutions to meet our customers’ expectations and financial needs:
In Denmark, we introduced a brand new type of variable-rate mortgage loan named FlexLife®. The product is unique because it allows customers to adjust the loan to their life situation throughout the term of the loan. Under certain circumstances, customers can choose an interest-only period of up to 30 years to free up funds for other purposes of their choice. Since its launch in September, FlexLife® has been successful among existing customers as well as customers coming to us from other mortgage institutions.
In Finland, we continued to develop our offering to members of our two partners, Akava and Frank Students. We offer Akava customers a competitive mortgage loan, and Frank Students customers have the convenience of a combined payment and student card. Furthermore, potential customers have easy access to online consultation services, and with the expanded cooperation with Akava, launched in early 2018, we have a solid foundation for growing our Finnish business.
In Sweden, customers’ demand for home financing is growing, and new customers show their trust in us by increasing the number of products they have with us. To further improve our offering to homeowners, we acquired a licence to issue covered bonds in Sweden through Danske Hypotek AB, and in the second half of the year, we launched two Swedish benchmark covered bonds that were well received by the market.
In Norway, customers looking for attractive pension savings now have the option of depositing money in a new individual pension savings solution. For customers
looking for an easy way to invest in shares, we introduced a share investment savings account, which quickly became very popular with our customers.
Innovation and digitalisationOur customers’ expectations of instant, round-the-clock advice and service are rising. In Sweden, for instance, almost all new customers now join us online, about 80% of home purchase certificates are created online, and one in three meetings are held online. To meet our customers’ expectations, we continue to co-create new features and dialogue options with them.
By the end of the year, we had launched the third generation of our Mobile Banking app across all four market areas. With the app, customers have easy access to doing their day-to-day banking business, to cards and investments plus a range of new options, such as setting their own savings goals, getting proactive loan advice and getting an overview of their loans. Furthermore, we introduced the option of quickly and conveniently applying for a consumer loan directly in the app. Initially, the option is available to customers in Denmark, but it will be introduced in other market areas later on.
In Denmark, we launched the next generation of the Sunday universe for our customers, and the dialogue at customer advisory meetings is now based on Sunday. We thus offer homebuyers an easy overview and seamless adviser support throughout the search and buying process, including the option of online loan approval. Homeowners get a full overview of their finances, mortgage loans and the value of their home, and thus a clear indication of the financial potential of their home. With Sunday as a shared platform for customers and advisers, we also have a strong foundation for streamlining the home financing advisory process and freeing up more time to the benefit of our customers.
On our new life-event-based websites, customers can quickly get advice relevant to their life situation and dreams, and it is easy for them to continue the dialogue by calling or chatting with us directly on the sites. In Denmark, customers can also book advisory meetings on our website and in the Mobile Banking app. This option has become popular with customers and has led to increasing demand for online advisory meetings.
The year also saw the introduction across markets of a brand new Pocket Money app for our youngest customers and their parents. With the app parents have a hassle-free alternative to cash payment of pocket

27Danske Bank / Annual Report 2017
money, and for their children, it is a safe way to learn about how to manage their own money.
In 2017, MobilePay became a separate entity. MobilePay remains the most popular mobile payment solution in Denmark and Finland and, every day, 200 new stores and web shops are added to the list of places where consumers can use MobilePay. The app is an important part of our customer offering, and new functionality, such as Myshop, Checkout and payment from a locked screen, was added over the year to the benefit of both consumers and businesses.
In Norway, we decided to terminate MobilePay and enter into a local distribution agreement with market leader Vipps to ensure customers a strong mobile payment solution also in the future.
In the coming years, we expect to see a wealth of new ways to execute payments, and we continue to explore this market. Towards the end of 2017, we launched a new and easy payment option for customers with a Fitbit tracker
Customer satisfaction Our ambition is to be ranked among the top two on customer satisfaction. At the end of 2017, we ranked number two in Finland, Norway and Sweden, and number four in Denmark. Our ranking in Denmark reflects high customer expectations and a close race with competitors. This only strengthens our focus on developing new competitive solutions and advisory services to meet the individual customer’s expectations, because our goal – across market areas – is to ensure that our customers are satisfied and have the best experience every time they are in touch with us.
On targetBelow target
125 34
On targetBelow target
1267 35 4
I målUnder mål
1267 35 4
Source: PB Strategy & Insights, Customer Insights
T5
T2
T3
T1
T4
C1
B1
B2
B3
Q4 2017 vs Q3 2017
Profit before tax decreased 3% to DKK 1.3 billion in the fourth quarter of 2017, owing to increased operating expenses.
Total income rose 2% as fee and trading income more than compensated for lower net interest income.
Total lending was at the same level as in the third quarter, as exchange rates had an adverse effect. Excluding the effect of exchange rates, lending continued to rise.
Net trading income increased 42%, primarily as a result of seasonal mortgage refinancing in Denmark.
Operating expenses increased, owing, among other things, to seasonality in marketing expenses.
The fourth quarter saw a net reversal of loan impairment charges of DKK 41 million, against a net reversal of DKK 25 million in the third quarter. The continuation of net reversals reflects strong and improved credit quality.

Danske Bank / Annual Report 201728
Business Banking
Business Banking generated a strong result for 2017. Profit before tax increased 20% from the level in 2016, owing to a combination of improving income, lower operating expenses and higher net impairment reversals. Total income rose 5% due to continually good business momentum in our Nordic markets, which resulted in rising net interest income and net fee income.
Business Banking(DKK millions)
2017 2016 Index17/16
Q42017
Q32017
IndexQ4/Q3
Q22017
Q12017
Net interest income 8,828 8,427 105 2,290 2,227 103 2,176 2,135
Net fee income 1,806 1,629 111 457 443 103 451 455
Net trading income 548 568 96 163 123 133 115 146
Other income 551 588 94 146 131 111 134 141
Total income 11,733 11,212 105 3,056 2,924 105 2,876 2,877
Operating expenses 4,601 4,791 96 1,224 1,100 111 1,164 1,112
Profit before loan impairment charges 7,133 6,421 111 1,832 1,824 100 1,711 1,765
Loan impairment charges -824 -235 - -52 -226 - -261 -285
Profit before tax 7,957 6,657 120 1,885 2,050 92 1,972 2,049
Loans, excluding reverse transactions before impairments 687,975 662,130 104 687,975 690,763 100 678,232 671,823
Allowance account, loans 10,990 12,996 85 10,990 11,287 97 11,707 12,307
Deposits, excluding repo deposits 242,278 230,096 105 242,278 240,088 101 245,588 232,210
Bonds issued by Realkredit Danmark 335,944 323,469 104 335,944 328,193 102 318,051 323,903
Allowance account, guarantees 436 327 133 436 387 113 421 408
Allocated capital (average) 44,591 41,380 108 44,075 44,383 99 44,990 44,928
Net interest income as % p.a. of loans and deposits 0.96 0.96 1.00 0.97 0.95 0.96
Profit before tax as % p.a. of allocated capital (ROAC) 17.8 16.1 17.1 18.5 17.5 18.2
Cost/income ratio (%) 39.2 42.7 40.1 37.6 40.5 38.7
Full-time-equivalent staff 2,625 2,662 99 2,625 2,611 101 2,621 2,639
Fact Book Q4 2017 provides financial highlights at country level for Business Banking. Fact Book Q3 2017 is available at danskebank.com/ir.
2017 vs 2016Business Banking achieved a strong result for 2017, with an increase in profit before tax of 20%. The rise was the result of an improvement in income, lower operating expenses and higher net impairment reversals than in the year before. Profit before tax amounted to DKK 8.0 billion.
Total income was 5% higher than last year, driven by a continuation of good business momentum and activity in our Nordic markets.
Net interest income rose 5%. Good business momentum and increasing lending volumes were the main drivers of the improvement and offset the pressure on deposit margins resulting from persistently low interest rates.
Total lending rose 4% from the level at the end of 2016 as a result of good activity in our Nordic markets.

Danske Bank / Annual Report 2017 29
Net fee income was up 11%, driven mainly by the increase in activity, but increased lending volumes also had a positive effect. Net trading income decreased 4% from the level last year as a result of slightly lower mortgage refinancing activity.
Although regulatory costs increased, operating expenses were down 4% from the level in 2016. The fall was the result mainly of efficiency improvements and lower severance pay than in 2016.
Credit qualityFavourable macroeconomic conditions, particularly in Denmark, and a continued improvement of credit quality within several main industries resulted in net impairment reversals of DKK 824 million in 2017, against DKK 235 million in 2016. We recorded net impairment reversals in each quarter of 2017. The significant level of reversals was attributable mainly to facilities in Denmark, but facilities in Sweden, Finland and the Baltics also contributed to net reversals in 2017. Impairment charges were made in Norway on a few individual facilities.
In Denmark, the development was driven primarily by an improvement in our customers’ earnings and increasing property values. Agricultural customers also contributed to the positive development in 2017, but the latest figures indicate that the earnings on our agricultural portfolio could again come under pressure, especially within dairy and pork production.
Credit exposureCredit exposure increased DKK 50 billion from the level at the end of 2016, amounting to a total of DKK 818 billion at the end of 2017.
Net credit exposure Impairments (%)
(DKK millions)31 December
201731 December
201631 December
2017
Denmark 475,436 448,533 -0.25%
Finland 79,412 71,337 -0.05%
Sweden 162,600 150,276 -0.06%
Norway 80,796 77,840 0.51%
Baltics 19,893 19,801 -0.28%
Other 9 7 -
Total 818,146 767,794 -0.12%
Business initiativesAt Business Banking, we worked diligently throughout 2017 on becoming even more customer-focused, with the aim of making banking with us easier and more efficient across the Nordics. Our ambition is to deliver the best customer experience on the basis of a strong value proposition and an increasingly digitalised service and delivery model.
Nordic growth potentialOur customer-centric approach resulted in strong business momentum across our Nordic markets, attracting profitable business from both new and existing customers. We saw a rise in business volumes, which grew slightly more than the market average, and we thus consolidated our position as a leading bank for SMEs in the Nordic region.
Large customers with complex needs generated a solid inflow of business across the Nordic markets. Our strong value proposition and strategic advice based on deciding moments in the business lifecycle have proven to fit the needs of this market very well. Moreover, our increased focus on creating a digital service and delivery model continued to free up time for customer interaction and enabled us to increase efficiency in all markets.
In the small-business segment, we are increasingly combining a lower cost to serve with a higher service level by selling and delivering our offerings online and through self-service solutions. The increase in digitalisation is also making it easier for customers to interact with us whenever it suits them.
Customer experienceCustomer expectations are rising continuously, and our large customers with complex needs expect us to deliver tailor-made solutions that match their individual needs and make their working day easy and efficient. To fulfil the expectations of these customers, we have improved our concepts and capabilities to enable us to engage in a strategic dialogue based on ambitions and deciding moments in their life cycle, such as entering new markets or selling or buying a company.
Regarding small customers with growth ambitions, we saw good traction on our “The Hub” platform in all the Nordic countries. The Hub supports ambitious growth companies with recruitment, funding and best-practice tools. The objective is to support and strengthen the ecosystem around small growth companies and for us to build relations with this important segment in the start-

30 Danske Bank / Annual Report 2017
up phase, earning the right to do business with them when they mature and their banking needs increase.
To further support the most ambitious and promising businesses, we have introduced a new value proposition and trained 20 advisers to help them scale faster than they would otherwise have been able to. Most recently, we have formed a partnership with nHack to help Nordic companies in China.
Innovation and digitalisationWith the EU’s Payment Services Directive 2 coming into effect, banking is becoming more transparent and open. To embrace the resulting opportunities, we introduced a new digital platform for large customers across our Nordic markets in cooperation with Corporates & Institutions. The new solution is much more intuitive in relation to conventional banking needs, and it opens up for partners and third-party vendors who want to integrate their systems with ours to the benefit of the customers. In addition, this new solution offers a wide range of features that are important for treasurers in their day-to-day work, making their working day easier.
We also introduced a new financing solution for our small customers in Denmark, with the aim of consistently improving quality and the customer experience. The solution reduces both the processing time and the time to money from weeks to hours, and it was very well received among customers. It now covers around half of all credit applications in selected segments and product areas. We will introduce the solution in our other markets in early 2018, and it will be expanded to more segments and product areas throughout the year.
Customer satisfaction Our goal is to be number one or two among customers in our core segments in all our Nordic markets. Generally, 2017 was a year with tough competition, but we succeeded in being on target on customer satisfaction in all markets at the end of 2017. In addition, we were number one or two on satisfaction among customers in most of our segments at the end of the year.
Particularly in Denmark, we saw a good trend in customer satisfaction, with scores among customers in our core segments rising throughout 2017. At the end of the year, we had the highest scores ever.
Source: BD Sales & Customer Engagement, Customer Insights
On targetBelow target
125 34
On targetBelow target
1267 35 4
I målUnder mål
1267 35 4
T5
T2
T3
T1
T4
C1
B1
B2
B3
Q4 2017 vs Q3 2017
Total income was up 5%, driven by higher net interest income and net trading income. Profit before tax decreased 8%, however, due to higher operating expenses and lower net impairment reversals.
Net interest income rose as a result of good business momentum and a healthy development in lending margins.
Total lending was at the same level as in the third quarter, as exchange rates had an adverse effect. Excluding the effect of exchange rates, lending continued to rise, however.
Net fee income was up 3% and net trading income rose 33%, due mainly to higher refinancing activity at Realkredit Danmark in the fourth quarter.
Operating expenses rose 11%, primarily as a result of seasonality.
We continued to record net impairment reversals. However, the level was higher in the third quarter than in the fourth quarter of 2017, when net impairment reversals amounted to DKK 52 million.

31Danske Bank / Annual Report 2017
Corporates & Institutions
Corporates & Institutions delivered a strong performance in 2017. Profit before tax amounted to DKK 6.4 billion, an increase of DKK 1.5 billion from the level in 2016. The increase was based primarily on high customer activity in the financial markets, which drove both fee and trading income. Furthermore, the result benefited from decreased impairments owing to the stabilisation in the offshore sector. Operating expenses increased due to increased activity.
Corporates & Institutions(DKK millions)
2017 2016 Index17/16
Q42017
Q32017
IndexQ4/Q3
Q22017
Q12017
Net interest income 3,207 3,061 105 883 781 113 785 758
Net fee income 2,651 2,221 119 744 552 135 632 722
Net trading income 5,668 5,263 108 1,065 1,179 90 1,349 2,075
Other income 2 16 13 1 - - 1 -
Total income 11,528 10,561 109 2,693 2,513 107 2,767 3,556
Operating expenses 4,799 4,648 103 1,267 1,128 112 1,187 1,217
Profit before loan impairment charges 6,729 5,913 114 1,426 1,385 103 1,580 2,338
Loan impairment charges 354 1,071 33 -32 138 - 168 80
Profit before tax 6,375 4,842 132 1,457 1,248 117 1,411 2,259
Loans, excluding reverse trans. before impairments 184,573 197,212 94 184,573 187,108 99 192,201 198,999
Allowance account, loans 2,068 2,466 84 2,068 2,138 97 2,058 2,159
Allowance account, credit institutions 10 40 25 10 10 100 12 13
Deposits, excluding repo deposits 273,811 233,315 117 273,811 282,791 97 265,045 256,832
Bonds issued by Realkredit Danmark 14,373 17,722 81 14,373 17,765 81 19,455 18,620
Allowance account, guarantees 135 256 53 135 127 106 453 289
Allocated capital (average) 35,790 38,024 94 33,102 33,990 97 37,141 39,011
Net interest income as % p.a. of loans and deposits 0.70 0.72 0.77 0.67 0.69 0.67
Profit before tax as % p.a. of allocated capital (ROAC) 17.8 12.7 17.6 14.7 15.2 23.2
Cost/income ratio (%) 41.6 44.0 47.0 44.9 42.9 34.2
Full-time-equivalent staff 1,808 1,796 101 1,808 1,786 101 1,774 1,781
Total income (DKK millions)
FICC 4,879 4,525 108 900 997 90 1,129 1,853
Capital Markets 1,956 1,670 117 543 368 148 505 540
General Banking 4,693 4,366 107 1,250 1,148 109 1,133 1,162
Total income 11,528 10,561 109 2,693 2,513 107 2,767 3,556

Danske Bank / Annual Report 201732
2017 vs 2016Corporates & Institutions saw high customer activity in most areas in 2017. Activity was fuelled especially by geopolitical events early in the year, such as concerns ahead of the French election, which led investors to look towards our core markets in the Nordics. This gave rise to high trading income especially in Fixed Income, Currencies and Commodities (FICC).
The persistently low interest rate environment in 2017 and customers’ pursuit of yield resulted in high activity within Debt Capital Markets (DCM) and Equity Capital Markets (ECM) from both investors and issuers. In addition, Corporates & Institutions experienced strong customer demand for advisory-related services, especially within mergers and acquisitions (M&A).
Overall, total income increased 9% from 2016 to DKK 11.5 billion.
Net interest income rose 5%, primarily due to increased volumes during the year (average) as well as refinancing activity.
Loans, excluding reverse transactions, decreased 6% from year-end 2016 to year-end 2017 due to changes in collateral management. Excluding reverse transactions (repos) and collateral management, lending volumes were flat from year-end 2016 to year-end 2017.
Net fee income increased 19% owing to increased customer activity, mainly in Debt Capital Markets (DCM), Equity Capital Markets (ECM), Equities and Corporate Finance, as well as a number of large customer transactions in General Banking.
Net trading income rose 8% to DKK 5.7 billion. The improvement was driven by high customer trading activity in the financial markets, especially early in the year. The increase was also influenced by changes in 2016 to the credit value adjustments model (cVA) which affected trading income negatively in 2016.
Total income from FICC amounted to DKK 4.9 billion, an increase of 8% from the level in 2016. The increase was driven by a combination of high daily customer activity and event-driven transactions caused especially by geopolitical events, but was also the result of the above-mentioned cVA changes in 2016.
Capital Markets income amounted to DKK 2.0 billion, an increase of 17% from 2016. Corporate Finance and ECM saw high activity, especially within the area of mergers and acquisitions (M&A) and Initial Public Offerings (IPO).
DCM had a large number of new bond issues, assisting customers in entering the debt capital markets while also facilitating investor interest in better yields in a low interest rate environment. During 2017, there was specific focus on improving the Swedish position further, which resulted in a strong performance for the year.
Income from General Banking was up 7% from 2016, owing to higher volumes and increased transaction banking services.
Operating expenses were up 3% following increasing activity in 2017. The cost/income ratio fell from 44% to 42%, however, due to both higher income and a continued focus on cost efficiency gains.
Credit quality Total loan impairments at Corporates & Institutions stood at DKK 354 million in 2017, down from DKK 1,071 million in 2016, reflecting a more stable situation for offshore companies active on the Norwegian continental shelf. At the end of 2017, total credit exposure from lending activities, including reverse transactions, amounted to DKK 909 billion, an increase of 11% from the level at the end of 2016. The portfolio grew mainly as a result of increased cash deposits with central banks.
Net credit exposure Impairments (%)
(DKK millions)31 December
201731 December
201631 December
2017
Sovereign 350,984 248,195 0.00%
Financial institutions 179,442 197,811 -0.01%
Corporate 378,654 370,988 0.16%
Other 302 145 -
Total 909,383 817,139 0.08%
The sovereign portfolio consists primarily of exposures to the stable, highly rated Nordic sovereigns and to central banks. Most of the exposure to financial

Danske Bank / Annual Report 2017 33
institutions consists of reverse transactions (repo lending facilities). The corporate portfolio is diverse and consists mainly of large companies based in the Nordic countries and large international customers with activities in the Nordic region.
Business initiatives Corporates & Institutions continued to launch new initiatives that focus on delivering the best customer experience through relevant and competitive offerings and by making banking with us easier.
In FICC, our customer-driven business model continued to generate more stable trading income. In addition, we extended the reach of our advisory services and tools, and supported customers with, for example, risk management strategy in connection with mergers and acquisitions. We introduced a 24-hour service in foreign exchange trading and signed the FX Global Code in May. The FX Global Code is a set of global principles of good practice to promote the integrity and efficient functioning of the foreign exchange market.
We continued to invest in our capital markets platform and expanded the offering across our markets. A number of IPOs were won across markets, including the online retailer Boozt.com and the gaming provider First Next Games. In Denmark, the market for small cap IPOs was reopened by two new deals for which Danske Bank acted as Global Coordinator and attracted significant investor participation. The strong position in the loan capital markets was maintained, and Danske Bank was mandated for a number of large leveraged buyouts such as Færch, Nets and Altor’s public bid for Transcom, as well as the YIT and Lemminkäinen merger.
General Banking continued to develop its offering to seamlessly help customers perform their daily financial transactions. We customised and rolled out our award-winning cash management and trade finance solutions to a number of new customers. Our post-trade services offering, designed to help institutional customers optimise administration in connection with post-trade activities and regulatory compliance requirements, continued to see strong growth.
In Sweden, we continued to execute on our strategy and won a number of new cash management mandates, besides assisting in a number of key IPOs and bond issues. We also won new export financing and custody business and expanded our business volume with the
Swedish state, including all foreign currencies, due to a newly developed state-of-the-art technical solution.
The market for green and social bonds saw further issuance and investor acceptance in 2017, and we broadened our capabilities to accommodate customer interest. Some new mandates were won, such as a role as Green Bond Structuring Advisor and Sole Bookrunner for Sveaskog in connection with the company’s first green bond issue.
Innovation and digitalisationWe continued our efforts to create digital, value-adding solutions designed to make our customers’ working day easier.
Following a successful pilot test with a number of customers, we launched our new, customisable one-point-of-entry financial portal towards the end of the year in cooperation with Business Banking. The portal is a large-scale initiative, aiming at enabling corporates to gain a more comprehensive, real-time overview of their financial situation.
In May, we introduced SEPA (Single Euro Payments Area) same day payments. We were also a frontrunner in the global payments innovation (GPI) initiative, which will provide faster, cheaper and more transparent international money transfers. The solution has been implemented in our customer interface.
Mid-2017, we entered into a new partnership with A.P. Møller-Mærsk (GateTu) with the purpose of developing new business-to-business solutions and services built on the two companies’ existing digital platforms.
Customer satisfactionCustomer satisfaction remained high. In 2017, Danske Bank obtained the number one position in Corporate and Institutional Banking in the Nordics on the basis of a shared number one position in corporate banking and a number one position in institutional banking.
The overall high performance was driven primarily by strong customer relations and a solid product palette, with Danske Bank achieving number one positions across the Nordics in important product areas such as Foreign Exchange and Interest Rate Swaps for the second and third consecutive year, respectively. Furthermore, customers continued to rank Danske Bank as the best Nordic financial provider of Cash

Danske Bank / Annual Report 201734
Management and Trade Finance solutions. In the Capital Markets area, we experienced good progress and obtained a number two position in the Nordics within domestic equities, DCM issuers and corporate finance.
Danske Bank continued to hold a solid number one position in the Danish and Finnish markets and a number two position in Sweden. Danske Bank holds a number four position in the Norwegian market and continues to work on improving the customer experience. In 2017, we saw a positive development in Norway within Foreign Exchange, improving from a number four to a number one position, and in Interest Rate Swaps, improving from a number three to a number one position.
Q4 2017 vs Q3 2017
Profit before tax increased 17%, owing mainly to higher net fee income as a consequence of seasonality and lower impairments.
Net interest income increased 13% due to high activity in the fourth quarter within renewal and termination of lending facilities.
At FICC, income fell 10%, primarily due to lower rates in the fourth quarter than expected by most market participants.
At Capital Markets, total income rose 48%, owing mainly to an increase in activity within Corporate Finance from a slow third quarter.
Operating expenses were up 12% from the level in the preceding quarter, owing mainly to seasonality and higher performance-based compensation.
12345
Market position, all (rolling year)
12345
Markedsposition, alle (rullende år)
T5
T2
T3
T1
T4
C1
B1
B2
B3
The chart shows current average ranking over a full set of reports for all Prospera surveys to which Corporates & Institutions subscribes (106) in comparison with the main competitors in each geographical market. A number 1 ranking in a market indicates best average ranking in that market.

Danske Bank / Annual Report 2017 35
Wealth Management
Profit before tax amounted to DKK 4.6 billion, a decrease of 5% from the level in 2016. The financial performance was driven by a good net inflow of customers, improved premium growth in Danica Pension and improving net sales in Asset Management. Operating expenses were higher in 2017 due to increased activity, regulatory costs (for example for MiFID II) and costs for the transformation of the asset management organisation.
Wealth Management(DKK millions)
2017 2016 Index17/16
Q42017
Q32017
IndexQ4/Q3
Q22017
Q12017
Net interest income 709 675 105 176 176 100 174 182
Net fee income 7,281 6,732 108 2,149 1,621 133 1,761 1,749
Net trading income 403 591 68 55 144 38 101 103
Other income 174 574 30 53 24 221 69 28
Total income 8,567 8,572 100 2,433 1,966 124 2,106 2,062
Operating expenses 4,082 3,887 105 1,107 940 118 1,019 1,016
Profit before loan impairment charges 4,485 4,685 96 1,326 1,027 129 1,087 1,046
Loan impairment charges -93 -137 - -23 -25 - -20 -25
Profit before tax 4,579 4,823 95 1,350 1,052 128 1,107 1,070
Loans, excluding reverse trans. before impairments 75,028 72,473 104 75,028 74,790 100 73,652 73,399
Allowance account, loans 434 532 82 434 444 98 438 475
Deposits, excluding repo deposits 65,849 62,881 105 65,849 66,280 99 66,707 61,911
Bonds issued by Realkredit Danmark 32,278 31,341 103 32,278 33,938 95 34,750 32,226
Allowance account, guarantees 26 2 - 26 20 130 42 38
Allocated capital (average) 13,894 14,047 99 13,610 14,030 97 14,403 13,529
Net interest income as % p.a. of loans and deposits 0.50 0.50 0.50 0.50 0.50 0.54
Profit before tax as % p.a. of allocated capital (ROAC) 33.0 34.3 39.7 30.0 30.7 31.6
Cost/income ratio (%) 47.6 45.3 45.5 47.8 48.4 49.3
Full-time-equivalent staff 1,851 1,948 95 1,851 1,870 99 1,906 1,946
Breakdown of assets under management*(DKK millions)
Life conventional 155 161 96 155 155 100 155 158
Asset management 911 848 107 911 894 102 878 875
Assets under advice 464 412 113 464 467 99 460 429
Total assets under management 1,530 1,420 108 1,530 1,515 101 1,493 1,463
*Assets under management consists of our life conventional business (Danica Traditionel), asset management (Danica unit-linked and Asset Management) and assets under advice (the investment decision is made by the customer) from personal, business and private banking customers.

Danske Bank / Annual Report 201736
2017 vs 2016 Profit before tax amounted to DKK 4.6 billion, a decrease of 5% from the level in 2016. The financial performance was driven by a good net inflow of customers and strong premium growth in Danica Pension and improving net sales in Asset Management.
Net interest income was up 5% to DKK 0.7 billion as a result of a 5% increase in lending volumes.
Net fee income benefited from an increase in assets under management and new product launches. Net fee income thus amounted to DKK 7.3 billion and was 8% above the level in 2016, despite the fact that 2016 benefited significantly from the booking of an amount from the shadow account in Danica Pension under risk allowance fees.
Net trading income decreased 32% to DKK 0.4 billion, both due to lower income relating to insurance contracts in the health and accident business in 2017 and the fact that net trading income in 2016 benefited from a one-off income of DKK 0.2 billion relating to insurance contracts.
Other income decreased 70% to DKK 0.2 billion due to a change in the profit policy for Danica Pension’s life conventional business, which affects the buffer used for allocation to policyholders’ savings.
Operating expenses were up 5% as a consequence of increased activity, regulatory implementation, costs for the transformation of the asset management organisation in the beginning of the year and costs related to the acquisition of SEB Pension in Denmark.
Credit quality Credit quality was generally stable. Our markets are supported by generally favourable macroeconomic conditions and a low level of interest rates.
Loan impairment charges amounted to net reversals of DKK 93 million in 2017.
Overall, the loan-to-value (LTV) level was stable throughout 2017.
Loan-to-value ratio, home loans
31 December 2017 31 December 2016
LTV (%)
Net credit
exposure (DKK bn) LTV (%)
Net credit
exposure (DKK bn)
Denmark 60.0 40 60.7 38
Finland 65.5 2 65.5 2
Sweden 58.9 4 59.4 3
Norway 59.3 7 59.7 7
Luxembourg - - - -
Total 60.0 53 60.6 50
Credit exposure Credit exposure increased to DKK 85 billion in 2017, driven by growth in all markets. Growth in Norway was partly off-set by the weakening of the Norwegian krone during 2017.
Net credit exposure Impairments(%)
(DKK millions)31 December
201731 December
201631 December
2017
Denmark 56,818 56,086 -0.16%
Finland 3,415 3,380 0.07%
Sweden 6,292 5,821 0.01%
Norway 10,628 10,599 0.14%
Luxembourg 8,028 6,411 -0.32%
Total 85,180 82,297 -0.12%
Assets under management Assets under management consist of our life conventional business (Danica Traditionel), asset management (Danica unit-linked and Asset
Breakdown of net fee income (DKK millions)
2017 2016 Index17/16
Q42017
Q32017
IndexQ4/Q3
Q22017
Q12017
Management fees 5,737 4,825 119 1,440 1,356 106 1,475 1,466
Performance fees 415 501 83 368 8 - 24 16
Risk allowance fees 1,130 1,405 80 342 258 133 262 268
Total net fee income 7,281 6,732 108 2,149 1,621 133 1,761 1,749

Danske Bank / Annual Report 2017 37
Management) as well as assets under advice, where the customer makes the investment decision. At the end of December 2017, assets under management totalled DKK 1,530 billion.
Assets under management increased 8%, or DKK 110 billion, from the level at the end of 2016, driven by a positive inflow from net sales, premiums and higher market values. For Asset Management, net sales in 2017 amounted to DKK 20.9 billion, which came from institutional and retail customers, against DKK 8.9 billion in 2016. Net premiums for Danica Pension amounted to DKK 39.7 billion, against DKK 33.8 billion in 2016.
Investment return on customer fundsThe strengthened investment team continued to deliver satisfactory returns to our customers. For our asset management business, 70% of all investment products generated above-benchmark results, against 65% in 2016. On a 3-year horizon, 81% were above benchmark.
% of investment products (GIPS composites) with above-benchmark returns (pre-costs)*
2017 3-year
All funds 70 81
Equity funds 56 77
Fixed-income funds 86 85
Balanced funds etc. 78 83
*Source: Investment Performance, based on results from Global Investment Performance Standard
Customers with Danica Balance Mix achieved returns on investments of 5.2% to 12.3%. The return for customers with Danica Balance (medium risk profile with 15 years to retirement) was 8.4%.
Business initiativesWealth Management combines our competencies within investments, pensions and insurance with the aspiration of making our customers’ lives better. Our services and solutions are a key part of our financial offering to all our customers across the Group and, through a number of business initiatives in 2017, we worked to improve the customer experience, create digital, innovative solutions and support Nordic growth.
Acquiring SEB Pension in DenmarkPension, insurance and long-term savings are becoming more and more important to our customers. At the end of 2017, Danica Pension acquired SEB Pension in
Denmark. Through economies of scale, the acquisition will make Danica Pension even more competitive and strengthen its innovation capacity to develop new and relevant pension and insurance solutions for our pension customers. By taking over SEB Pension in Denmark, Danica Pension will be welcoming around 200,000 new pension customers and will add DKK 100 billion to assets under management. The acquisition has been referred to the relevant authorities for approval, and their response is expected during the first half of 2018.
Helping our customers be one step ahead on their pension schemeIt is our ambition to help customers be one step ahead regarding their pension schemes with Danica Pension. We use data insights to proactively contact our customers with clear recommendations about their pension and insurance matters at important life events, such as marriage, change in salary or buying a new home. We thus help our customers feel more financially secure and prepared for a longer and more active life. Since the beginning of 2017, we have reached out to more than 170,000 Danish customers with positive results. For instance, Danica Pension’s net promoter score was 55 (weighted average) in 2017, which shows that customers’ satisfaction improves significantly when we are in contact with them. Also, we saw a doubling of customers following our recommendations during 2017. In 2018, we will expand the initiative to cover the business-to-business segment.
Innovating our investment offering As part of our response to changing customer demands and MiFID II regulation, we developed a new investment offering, which was launched in Finland in 2017. Traditionally, investment solutions have been somewhat one-size-fits-all, with services depending on how much the customer invested. With the new offering, customers are now able to choose investment services based on their individual goals and needs – and not the amount they invested. The new offering goes beyond the requirements from MiFID II by removing retrocessions from all product categories to create higher transparency. We expect to launch investment solutions that apply the same principles in our other markets.
Democratising investments through new digital investment solution June is Danske Bank’s first initiative within digital investment management and was created to offer an easy-to-use and affordable investment platform.

Danske Bank / Annual Report 201738
Since the launch in Denmark, around 14,000 Danes have become customers of June, many of whom are first-time investors. The total amount invested is around DKK 300 million. In December, we also made June available to SMEs. We are looking into the opportunity of launching June in the other Nordic markets as well.
Successful launches of private equity funds in Private Banking In 2017, we launched three private equity funds for our Private Banking customers in Denmark. With an undertaking of DKK 2.6 billion, the funds have been some of the most successful private equity launches so far and have enabled our Private Banking customers to tap into the attractive alternative offerings in this market.
Strengthening our asset management capabilities to provide customers with new opportunitiesIn the first half of 2017, Asset Management and Danica Pension established a joint CIO function in order for us to leverage our investment capabilities across Wealth Management and to create a platform for future development. This enables us to provide even more value and new investment opportunities to our customers by developing our solutions further. Our core focus is to further strengthen our solutions, business and offerings within alternative and ESG investments. These are all areas, which we believe are important to successfully navigate in a dynamic market space influenced by numerous factors.
Increasing our efforts within sustainabilityWe continued our sustainability work during 2017. Initiatives included sustainability labelling of Danske Bank funds and a revision of our responsible investment policy – including disclosing voting records during 2018 and expansion of our exclusion policies. Developments during 2018 will focus on ESG engagement as well as developing a strong centre of excellence.
Customer satisfaction Private Wealth ManagementFor the second year in a row, Danske Bank was ranked the best provider of Private Banking services in the Nordic countries in the annual Prospera survey based on interviews with more than two thousand private banking customers. Danske Forvaltning is still ranked number one by their customers.
Private Wealth Management maintained second place in Norway and Sweden and sixth place in Finland. However, in Denmark, Private Wealth Management went from first to second place.
Asset ManagementAmong our institutional clients, Asset Management
maintained its strong position as number one in Denmark for the second year in a row. In the other Nordic markets, our customer satisfaction scores have developed in line with market averages, however, due to stronger developments at close competitors, our ranking has weakened . In Norway, our ranking is down from number three to number four, in Finland from number four to number six, and in Sweden from number nine to number twelve.
Danske InvestIn the first half of 2017, Danske Invest received the Morningstar Award for best equity fund manager in Denmark for the ninth consecutive year.
Also, Danske Bank won the award for best Danish fund selector for the seventh year in a row.
Danica Pension According to Aalund Research, Danica Pension’s customer satisfaction is still number four in Denmark and Norway. There are no rankings for the remaining markets.
Q4 2017 vs Q3 2017
In the fourth quarter of 2017, profit before tax increased to DKK 1.4 billion, up 28% from the level in the third quarter of 2017.
Total income increased 24%. The increase was owing partly to higher management fees in Private Wealth Management as a result of higher activity in the fourth quarter and higher performance fees as well as income from the shadow account in Danica Pension.
Net trading income decreased 62% from the third quarter due to a lower investment result for the health and accident business in Danica Pension. Net sales for Asset Management, excluding Danica Pension, amounted to DKK 9.9 billion, against a negative DKK 1.8 billion in the third quarter. The increase was due to a positive inflow in the fourth quarter from the Danish business as well as business outside the Nordic region and to the third quarter being affected by some investors insourcing asset management services.
Net premiums in Danica Pension amounted to DKK 10.4 billion, against DKK 8.9 billion in the third quarter.
Operating expenses were 18% higher in the fourth quarter due to higher activity and consultancy costs for legislative projects and costs relating to the acquisition of SEB Pension in Denmark.

Danske Bank / Annual Report 2017 39
Northern Ireland
Profit before tax increased 18% to DKK 1,251 million despite adverse movements in the GBP/DKK exchange rate (7%). The increase was the result of lower operating expenses, which included a one-off benefit following a change in pension liabilities. The underlying performance was strong, with growth in lending and deposits offsetting the impact of lower interest rates on income.
Northern Ireland(DKK millions)
2017 2016 Index17/16
Q42017
Q32017
IndexQ4/Q3
Q22017
Q12017
Net interest income 1,374 1,458 94 347 334 104 350 342
Net fee income 429 471 91 101 100 101 113 115
Net trading income 111 126 88 56 10 - 20 24
Other income 48 18 267 40 2 - 3 3
Total income 1,961 2,072 95 544 447 122 486 484
Operating expenses 957 1,243 77 46 298 15 304 309
Profit before loan impairment charges 1,004 829 121 499 148 - 181 176
Loan impairment charges -247 -234 - -93 -24 - -69 -61
Profit before tax 1,251 1,063 118 591 173 - 250 237
Loans, excluding reverse transactions before impairments 46,272 45,575 102 46,272 46,241 100 46,078 46,541
Allowance account, loans 757 1,262 60 757 914 83 980 1,164
Deposits, excluding repo deposits 58,971 59,244 100 58,971 59,460 99 58,965 58,912
Allowance account, guarantees 7 11 64 7 9 78 9 9
Allocated capital (average)* 6,215 7,326 85 6,684 6,081 110 6,107 5,980
Net interest income as % p.a. of loans and deposits 1.32 1.41 1.33 1.27 1.35 1.31
Profit before tax as % p.a. of allocated capital (ROE) 20.1 14.5 35.4 11.4 16.4 15.9
Cost/income ratio (%) 48.8 60.0 8.5 66.7 62.6 63.8
Full-time-equivalent staff 1,260 1,289 98 1,260 1,318 96 1,323 1,306
* Allocated capital equals the legal entity’s capital.

Danske Bank / Annual Report 201740
2017 vs 2016 Profit before loan impairment charges increased 21% to DKK 1,004 million. The increase was the result of lower operating expenses.
Total income stood at DKK 1,961 million, down 5%, with ongoing macroeconomic uncertainty resulting in a continuation of low GDP growth, low interest rates and a weak GBP. The effect was partly offset by growth in lending and deposits as customer activity levels were high.
Operating expenses primarily reflect a one-off benefit from a change in pension liabilities following derisking of the current pension arrangements for staff. This was partially offset by increased investment in new technology, improved customer solutions and investment in new skills, which combined with other restructuring initiatives are designed to ensure that we continue to fully meet customer needs and expectations in the future.
2017 vs 2016 in local currency In local currency, profit before tax increased 26%.
Despite the uncertain macroeconomic environment, income increased 1% in local currency with lending growth of 9% and deposit growth of 5% more than offsetting the negative impact of the lower interest rate environment that we operated in for most of the year.
Operating expenses fell 18% driven by the change in pension liabilities that was partially offset by investment and restructuring initiatives introduced to drive competitiveness, efficiency and the delivery of new solutions for customers.
Credit quality Loan impairment charges continued to show a net reversal as improvements in property values and in the trading results of our business customers mean that provisions made in previous years against potential, distressed lending are no longer required.
Net credit exposure Impairments (%)
(DKK millions)31 December
201731 December
201631 December
2017
Personal customers 19,312 18,022 0.02%
Public institutions
13,163 15,992 0.02%
Financial customers 189 194 -0.02%
Commercial customers
30,356 29,348 -1.04%
Total 63,019 63,555 -0.55%
Business initiativesOur vision in Northern Ireland is to be recognised as the best bank for customers, employees, stakeholders and society. In a challenging environment, we continue to execute our strategy to transform both the customer experience and our internal operations.
Customer activityThe year 2017 was a strong year for our mortgage business as new mortgage lending was up 28% on 2016. With our market activity share having doubled since 2015, this brings us in line with our market share of personal current accounts.
We assisted the mortgage business through the introduction of a digital system for the third-party broker network. The investment supports a shift in customer behaviour towards broker channels in recent years at the same time as we kept our risk appetite unchanged.
We completed a programme of decentralising our small-business advisers and locating them in key branches throughout Northern Ireland. The decision to do so was taken as a result of strong feedback from small businesses, and the new setup will allow our advisers to be more accessible and closer to customers. The changes have already had a tangible impact, with 37 new small-business relationships being established every week.
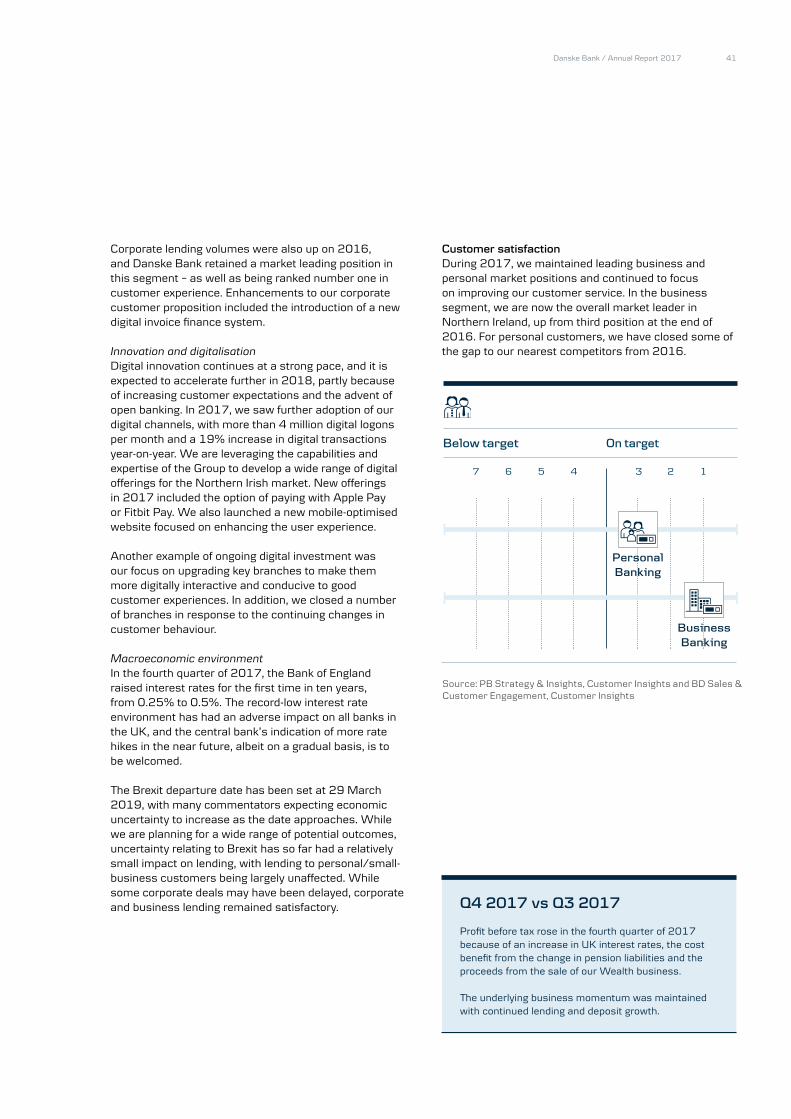
Danske Bank / Annual Report 2017 41
Corporate lending volumes were also up on 2016, and Danske Bank retained a market leading position in this segment – as well as being ranked number one in customer experience. Enhancements to our corporate customer proposition included the introduction of a new digital invoice finance system.
Innovation and digitalisationDigital innovation continues at a strong pace, and it is expected to accelerate further in 2018, partly because of increasing customer expectations and the advent of open banking. In 2017, we saw further adoption of our digital channels, with more than 4 million digital logons per month and a 19% increase in digital transactions year-on-year. We are leveraging the capabilities and expertise of the Group to develop a wide range of digital offerings for the Northern Irish market. New offerings in 2017 included the option of paying with Apple Pay or Fitbit Pay. We also launched a new mobile-optimised website focused on enhancing the user experience.
Another example of ongoing digital investment was our focus on upgrading key branches to make them more digitally interactive and conducive to good customer experiences. In addition, we closed a number of branches in response to the continuing changes in customer behaviour.
Macroeconomic environmentIn the fourth quarter of 2017, the Bank of England raised interest rates for the first time in ten years, from 0.25% to 0.5%. The record-low interest rate environment has had an adverse impact on all banks in the UK, and the central bank’s indication of more rate hikes in the near future, albeit on a gradual basis, is to be welcomed.
The Brexit departure date has been set at 29 March 2019, with many commentators expecting economic uncertainty to increase as the date approaches. While we are planning for a wide range of potential outcomes, uncertainty relating to Brexit has so far had a relatively small impact on lending, with lending to personal/small-business customers being largely unaffected. While some corporate deals may have been delayed, corporate and business lending remained satisfactory.
Customer satisfaction During 2017, we maintained leading business and personal market positions and continued to focus on improving our customer service. In the business segment, we are now the overall market leader in Northern Ireland, up from third position at the end of 2016. For personal customers, we have closed some of the gap to our nearest competitors from 2016.
Q4 2017 vs Q3 2017
Profit before tax rose in the fourth quarter of 2017 because of an increase in UK interest rates, the cost benefit from the change in pension liabilities and the proceeds from the sale of our Wealth business.
The underlying business momentum was maintained with continued lending and deposit growth.
On targetBelow target
125 34
On targetBelow target
1267 35 4
I målUnder mål
1267 35 4
Source: PB Strategy & Insights, Customer Insights and BD Sales & Customer Engagement, Customer Insights
T5
T2
T3
T1
T4
C1
B1
B2
B3
T5
T2
T3
T1
T4
C1
B1
B2
B3
Personal Banking
Business Banking

Danske Bank / Annual Report 201742
Non-core
Profit before tax for 2017 was a negative DKK 12 million. The winding-up of the Non-core portfolios is proceeding according to plan. Total lending has thus decreased 75% since the end of 2016 and stood at DKK 5.4 billion at the end of 2017. In October 2017, the Group entered into a binding agreement on the sale of a portfolio of Irish residential mortgage loans, which had a gross value of DKK 13 billion. The transaction was settled in December 2017.
Non-core(DKK millions)
2017 2016 Index17/16
Q42017
Q32017
IndexQ4/Q3
Q22017
Q12017
Total income 169 235 72 41 41 100 42 44
Operating expenses 890 363 245 484 268 181 76 62
Profit before loan impairment charges -722 -128 - -443 -227 - -34 -18
Loan impairment charges -710 -165 - -470 -233 - -9 1
Profit before tax -12 37 - 27 6 - -25 -19
Loans, excluding reverse transactions before impairments 5,380 21,504 25 5,380 18,817 29 19,517 20,723
Allowance account, loans 653 2,644 25 653 1,781 37 2,192 2,405
Deposits, excluding repo deposits 1,925 2,365 81 1,925 1,958 98 1,978 2,241
Allowance account, guarantees 27 33 82 27 29 93 31 28
Allocated capital (average) 2,604 2,878 90 2,382 2,768 86 2,714 2,776
Net interest income as % p.a. of loans and deposits 2.63 1.13 2.35 0.88 0.95 0.92
Profit before tax as % p.a. of allocated capital (ROAC) -0.5 1.3 4.5 0.9 -3.7 -2.8
Cost/income ratio (%) - 154.5 - - 181.0 140.9
Full-time-equivalent staff 122 153 80 122 124 98 131 143
Loan impairment charges (DKK millions)
Non-core banking* -796 -164 - -556 -233 - -9 1
Non-core conduits etc. 86 -1 - 86 - - - -
Total -710 -165 - -470 -233 - -9 1
* Non-core banking encompasses Non-core Baltics (personal customers in Estonia) and Non-core Ireland

Danske Bank / Annual Report 2017 43
2017 vs 2016Profit before tax was a loss of DKK 12 million, against a profit of DKK 37 million in 2016.
Operating expenses increased from DKK 363 million to DKK 898 million in 2017 owing primarily to various activities and costs related to portfolio sales, severance pay and write-downs. Total lending, which amounted to DKK 5.4 billion, consisted mainly of exposure to personal mortgages in Estonia and conduits. In the fourth quarter of 2017, the Group sold a portfolio of Irish residential mortgage loans which had a gross value of DKK 13 billion. Personal mortgages in Estonia and the remaining personal mortgages in Ireland mature according to contractual terms.
The Non-core conduits portfolio amounted to DKK 4.6 billion, against DKK 6.3 billion at the end of 2016. The portfolio consists primarily of liquidity facilities for conduits and continues to amortise in line with expectations.
Total impairments amounted to a net reversal of DKK 710 million, against a net reversal of DKK 165 million in 2016. Most of the reversals were of charges against Non-core banking facilities including the Irish portfolio. Additional loan impairment charges were made against the Non-core conduits portfolio.
The winding-up of the Non-core portfolios is proceeding according to plan.
Q4 2017 vs Q3 2017
Profit before tax amounted to DKK 27 million, against DKK 6 million in the third quarter. The increase was owing mainly to higher net reversal.
Operating expenses amounted to DKK 484 million, against DKK 268 million in the third quarter. The increase was owing primarily to various activities and costs related to portfolio sales, severance pay and write-downs in the fourth quarter.
Loan impairment charges amounted to a net reversal of DKK 470 million, against a net reversal of DKK 233 million in the third quarter. Most of the reversals were of charges against Non-core banking facilities including the Irish portfolio.
Net credit exposure
Accumulated impairment charges
31 Dec. 2017
31 Dec. 2016
31 Dec. 2017
31 Dec. 2016
Non-core banking 3,610 17,103 201 2,437
- of which personal customers 3,610 16,966 31 1,791
Non-core conduits etc. 4,583 6,343 479 239
Total 8,193 23,446 680 2,676

Danske Bank / Annual Report 201744
Q4 2017 vs Q3 2017
Profit before tax was DKK 107 million, against DKK 360 million in the third quarter.
Net interest income amounted to DKK 364 million and was down 16% from the level in the third quarter. Net interest income fell due to higher liquidity costs and slightly lower allocated funding costs.
Net trading income amounted to DKK 24 million, against DKK 179 million in the third quarter, which benefited from positive fair value adjustments related to Group Treasury activities.
Other Activities
Other Activities includes Group Treasury and Group support functions as well as eliminations. Group Treasury is responsible for the Group’s internal bank, liquidity management and funding.
Other Activites(DKK millions)
2017 2016 Index17/16
Q42017
Q32017
IndexQ4/Q3
Q22017
Q12017
Net interest income 1,402 747 188 364 435 84 244 358
Net fee income -282 -175 - -89 -56 - -105 -33
Net trading income 479 1,498 32 24 179 13 118 157
Other income 80 1,331 6 4 -6 - 75 6
Total income 1,678 3,401 49 304 553 55 334 488
Operating expenses 750 419 179 196 195 101 185 174
Profit before loan impairment charges 928 2,982 31 108 357 30 149 314
Loan impairment charges 1 9 11 1 -3 - 3 -
Profit before tax 927 2,973 31 107 360 30 146 314
Profit before tax (DKK millions)
Group Treasury 1,283 2,005 64 177 404 44 274 427
Own shares -127 -135 - 34 -6 - -43 -112
Additional tier 1 capital 786 663 119 197 198 99 197 194
Group support functions -1,016 440 - -301 -237 - -283 -195
Total Other Activities 927 2,973 31 107 360 30 146 314
2017 vs 2016Other Activities posted a profit before tax of DKK 927 million, against DKK 2,973 million in 2016, which benefited from a gain related to the sale of domicile properties in Copenhagen.
Net interest income amounted to DKK 1,402 million, against DKK 747 million in 2016. The result primarily reflects elimination of the interest expense on additional tier 1 capital (reported as an interest expense in the business segments), differences at the internal bank between actual and allocated funding costs using the Group’s funds transfer pricing model, as well as income related to the Group’s liquidity portfolio. In 2017, the Group’s liquidity costs fell, and income from the liquidity portfolio increased, driven by lower funding costs.
Net trading income amounted to DKK 479 million, against DKK 1,498 million the year before. Income in 2016 benefited from a one-off gain on the sale of VISA Europe and positive fair value adjustments of the liquidity portfolio and the private equity portfolio.
Other income amounted to DKK 80 million, against DKK 1,331 million in the year before. The figure for 2016
included a gain related to the sale of domicile properties in Copenhagen.
Operating expenses amounted to DKK 750 million, against DKK 419 million in 2016. The increase was due to an increase in rent expenses, higher costs for compliance and payroll taxes on pension plans.
Danske Bank / Annual Report 2017 45
Definition of alternative performance measures
Danske Bank’s management believes that the alternative performance measures (APMs) used in the Management’s report provide valuable information to readers of the financial statements. The APMs provide a more consistent basis for comparing the results of financial periods and for assessing the performance of the Group and each individual business unit. They are also an important aspect of the way in which Danske Bank’s management defines operating targets and monitors performance. Throughout the Management’s report, performance is assessed on the basis of the financial highlights and segment reporting, which represent the financial information regularly provided to management. The differences between the financial highlights and the IFRS financial statements relate only to certain changes in the presentation. There are no adjusting items, which means that net profit is the same in the financial highlights and in the IFRS income statement. Notes 1 (c) and 3 to the financial statements describe the difference in the presentation, and each line item is reconciled with the consolidated financial statements prepared under IFRS.
Definitions of additional ratios presented on page 4 and in other sections of the Management’s report:
Dividend per share (DKK)
The dividend is the dividend related to net profit for the current year and paid to shareholders the subsequent year. Accordingly, for 2017, it is the dividend to be paid in 2018.
Return on average shareholders’ equity (%)
Net profit divided by quarterly average shareholders’ equity. Net profit and shareholders’ equity are stated as if the equity-accounted additional tier 1 capital was classified as a liability. In the nominator, net profit is reduced by interest expenses of DKK 786 million and tax thereon (2016: DKK 663 million before tax), and the denominator represents equity excluding additional tier 1 capital and other non-controlling interests equal to a reduction in the quarterly average of equity of DKK 14,375 million (2016: DKK 11,758 million).
Return on average tangible equity (%)
As above, but with shareholders’ equity reduced by intangible assets and net profit adjusted for amortisation of intangible assets.
Net interest income as % p.a. of loans and deposits
Net interest income in the financial highlights divided by the sum of loans and deposits. All amounts are from the financial highlights.
Cost/income ratio (%)
Operating expenses divided by total income. All amounts are from the financial highlights.
Book value per share
Shareholders’ equity (that is, excluding equity-accounted additional tier 1 capital) divided by the number of shares outstanding at the end of the period.
Loan impairment charges as % of credit exposure
This ratio is calculated on the basis of loan impairment charges and credit exposure from lending activities in core segments. The nominator is the loan impairment charges from the financial highlights. The denominator is the net credit exposure from lending activities in core segments at the beginning of the year of DKK 2,533.8 billion, as disclosed in the “Breakdown of credit exposure” table in the notes to the financial statements, reduced by credit exposure related to credit institutions and central banks of DKK 289.3 billion and loan commitments of DKK 275.5 billion. The ratio is calculated for each business unit.

Danske Bank / Annual Report 201746

Danske Bank / Annual Report 2017 47
48 Income statement 49 Statement of comprehensive income 50 Balance sheet 51 Statement of capital 55 Cash flow statement
56 Notes 56 1. Basis of preparation
62 2. Changes and forthcoming changes to accounting policies and presentation
63 3. Business model and business segmentation 69 4. Activities by country 71 5. Net interest and net trading income 73 6. Fee income and expenses 74 7. Income from holdings in associates and
Other income 75 8. Insurance contracts 76 9. Operating expenses 78 10. Audit fees 78 11. Loan impairment charges 79 12. Trading portfolio assets and liabilities 82 13. Investment securities 84 14. Due from credit institutions and central
banks and Loans at amortised cost 86 15. Loans at fair value and bonds issued by
Realkredit Danmark 87 16. Assets and deposits under pooled schemes
and unit-linked investment contracts 88 17. Assets and liabilities under insurance
contracts 91 18. Intangible assets 94 19. Due to credit institutions and central banks
and Deposits 94 20. Tax 98 21. Issued bonds 102 22. Other assets and Other liabilities 104 23. Equity 106 24. Contingent liabilities 108 25. Balance sheet items broken down by
expected due date
109 26. Contractual due dates of financial liabilities 110 27. Transferred financial assets that are not
derecognised 111 28. Assets provided or received as collateral 112 29. Offsetting of financial assets and liabilities 113 30. Fair value information for financial
instruments119 31. Non-financial assets recognised at fair value 120 32. Related parties 121 33. Remuneration of management and material
risk takers126 34. Danske Bank shares held by the Board of
Directors and the Executive Board 127 35. Group holdings and undertakings 129 36. Interests in associates and joint
arrangements 130 37. Interests in unconsolidated structured
entities 130 38. Note to the cash flow statement 131 39. Implementation of IFRS 9 Financial
Instruments and IFRS 15 Revenue from Contracts with Customers
137 40. Changes to financial highlights and segment reporting
138 Risk management 138 Risk exposure 138 Total capital 139 Credit risk 155 Market risk 157 Liquidity risk 160 Insurance risk 164 Highlights, ratios and key figures 165 Definitions of ratios and key figures 166 Financial statements - Danske Bank A/S
Financial statements

Danske Bank / Annual Report 201748
Danske Bank / Annual Report 2017 48
Income statement – Danske Bank Group
Note (DKK millions) 2017 2016
5 Interest income 58,495 59,618
5 Interest expense 28,631 27,289
Net interest income 29,863 32,329
6 Fee income 17,572 15,883
6 Fee expenses 6,749 5,736
5 Net trading income 19,332 13,396
7 Other income 5,181 6,006
7 Income from holdings in associates 566 941
8 Net premiums 25,935 24,686
8 Net insurance benefits 41,119 37,669
9 Operating expenses 25,877 24,647
Profit before loan impairment charges 24,705 25,189
11 Loan impairment charges -1,582 -168
Profit before tax 26,288 25,357
20 Tax 5,388 5,500
Net profit for the year 20,900 19,858
Portion attributable to
shareholders of Danske Bank A/S (the Parent Company) 20,114 19,195
additional tier 1 capital holders 786 663
Net profit for the year 20,900 19,858
Earnings per share (DKK) 22.2 20.2
Diluted earnings per share (DKK) 22.1 20.2
Proposed dividend per share (DKK) 10.0 9.0

Danske Bank / Annual Report 2017 49
Danske Bank / Annual Report 2017 49
Statement of comprehensive income – Danske Bank Group Note (DKK millions) 2017 2016
Net profit for the year 20,900 19,858
Other comprehensive income
Items that will not be reclassified to profit or loss
Remeasurement of defined benefit plans 14 -972
20 Tax -92 234
Items that will not be reclassified to profit or loss -78 -738
Items that are or may be reclassified subsequently to profit or loss
Translation of units outside Denmark -473 -1,274
Hedging of units outside Denmark 425 1,234
Unrealised value adjustments of available-for-sale financial assets 17 309
Realised value adjustments of available-for-sale financial assets -74 -10
20 Tax -82 -257
Items that are or may be reclassified subsequently to profit or loss -187 2
Total other comprehensive income -265 -736
Total comprehensive income for the year 20,635 19,122
Portion attributable to
shareholders of Danske Bank A/S (the Parent Company) 19,849 18,459
additional tier 1 capital holders 786 663
Total comprehensive income for the year 20,635 19,122

Danske Bank / Annual Report 201750
50 Danske Bank / Annual Report 2017
Balance sheet – Danske Bank Group
Note (DKK millions) 2017 2016
Assets
Cash in hand and demand deposits with central banks 82,818 53,211
14 Due from credit institutions and central banks 333,975 245,479
12 Trading portfolio assets 449,292 509,679
13 Investment securities 324,618 343,337
14 Loans at amortised cost 1,112,752 1,141,567
15 Loans at fair value 787,223 766,003
16 Assets under pooled schemes and unit-linked investment contracts 112,065 99,848
17 Assets under insurance contracts 296,867 285,398
18 Intangible assets 7,177 6,790
20 Tax assets 1,419 1,283
22 Others assets 31,324 31,075
Total assets 3,539,528 3,483,670
Liabilities
19 Due to credit institutions and central banks 242,887 272,883
12 Trading portfolio liabilities 400,596 478,301
19 Deposits 1,046,858 943,865
15 Bonds issued by Realkredit Danmark 758,375 726,732
16 Deposits under pooled schemes and unit-linked investment contracts 119,901 106,418
17 Liabilities under insurance contracts 322,726 314,977
21 Other issued bonds 405,080 392,512
20 Tax liabilities 8,634 8,151
22 Other liabilities 37,097 35,385
21 Subordinated debt 29,120 37,831
Total liabilities 3,371,272 3,317,055
Equity
Share capital 9,368 9,837
Foreign currency translation reserve -681 -633
Reserve for available-for-sale- financial assets 130 187
Retained earnings 135,731 134,028
Proposed dividends 9,368 8,853
Shareholders of Danske Bank A/S (the Parent Company) 153,916 152,272
Additional tier 1 capital holders 14,339 14,343
23 Total equity 168,256 166,615
Total liabilities and equity 3,539,528 3,483,670

Danske Bank / Annual Report 2017 51
Danske Bank / Annual Report 2017 51
Statement of capital – Danske Bank Group
Changes in equity
Shareholders of Danske Bank A/S (the Parent Company)
(DKK millions) Share
capital
Foreign currency
translation reserve
Reserve for available-
for-sale assets
Retained earnings
Proposed dividends Total
Additional tier 1
capital Total
Total equity at 1 January 2017 9,837 -633 187 134,028 8,853 152,272 14,343 166,615
Net profit for the year - - - 20,114 - 20,114 786 20,900
Other comprehensive income Remeasurement of defined benefit plans - - - 14 - 14 - 14
Translation of units outside Denmark - -473 - - - -473 - -473
Hedging of units outside Denmark - 425 - - - 425 - 425
Unrealised value adjustments - - 17 - - 17 - 17
Realised value adjustments - - -74 - - -74 - -74
Tax - - - -174 - -174 - -174
Total other comprehensive income - -48 -57 -160 - -265 - -265
Total comprehensive income for the year - -48 -57 19,954 - 19,849 786 20,635
Transactions with owners Paid interest on additional tier 1 capital - - - - - - -786 -786
Dividends paid - - - 521 -8,853 -8,332 - -8,332
Dividends proposed - - - -9,368 9,368 - - -
Share capital reduction -469 - - 469 - - - -
Acquisition of own shares and additional tier 1 capital - - - -51,642 - -51,642 -176 -51,818
Sale of own shares and additional tier 1 capital - - - 41,447 - 41,447 173 41,620
Share-based payments - - - 150 - 150 - 150
Tax - - - 172 - 172 - 172
Total equity at 31 December 2017 9,368 -681 130 135,731 9,368 153,916 14,339 168,256
On 3 February 2017, the Group initiated a share buy-back programme of DKK 10 billion. The programme was completed on 31 January 2018. At the end of 2017, the Group had acquired 39,632,505 shares for a total amount of DKK 9,173 million under the share buy-back programme based on trade date.
On 24 April 2017, the share capital was reduced by DKK 468,851,130 through cancellation of 46,885,113 shares from Danske Bank’s holding of own shares acquired under the share buy-back programme for 2016.

Danske Bank / Annual Report 201752
52 Danske Bank / Annual Report 2017
Statement of capital – Danske Bank Group
Changes in equity
Shareholders of Danske Bank A/S (the Parent Company)
(DKK millions) Share
capital
Foreign currency
translation reserve
Reserve for available-
for-sale assets
Retained earnings
Proposed dividends Total
Additional tier 1
capital Total
Total equity at 1 January 2016 10,086 -593 -401 132,147 8,069 149,308 11,317 160,625
Net profit for the year - - - 19,195 - 19,195 663 19,858
Other comprehensive income Remeasurement of defined benefit plans - - - -972 - -972 - -972
Translation of units outside Denmark - -1,274 - - - -1,274 - -1,274
Hedging of units outside Denmark - 1,234 - - - 1,234 - 1,234
Unrealised value adjustments - - 309 - - 309 - 309
Realised value adjustments - - -10 - - -10 - -10
Transfer between reserves - 289 -289 - - - -
Tax - - - -23 - -23 - -23
Total other comprehensive income - -40 588 -1,284 - -736 - -736
Total comprehensive income for the year - -40 588 17,911 - 18,459 663 19,122
Transactions with owners Paid interest on additional tier 1 capital - - - - - - -649 -649
Dividends paid - - - 311 -8,069 -7,758 - -7,758
Dividends proposed - - - -8,853 8,853 - - -
Share capital reduction -249 - - 249 - - - -
Acquisition of own shares and additional tier 1 capital - - - -38,121 - -38,121 -57 -38,178
Sale of own shares and additional tier 1 capital - - - 30,089 - 30,089 69 30,158
Share-based payments - - - 171 - 171 - 171
Tax - - - 154 - 154 - 154
Total equity at 31 December 2016 9,837 -633 187 134,028 8,853 152,272 14,343 166,615

Danske Bank / Annual Report 2017 53
Danske Bank / Annual Report 2017 53
Statement of capital – Danske Bank Group
Dividend
The Board of Directors is proposing a dividend of DKK 10.0 per share (2016: DKK 9.00), or a total of DKK 9,368 million (2016: DKK 8,853 million) of which DKK 409 million relates to shares acquired under the share buy-back programme for 2017, to be paid out of the net profit for the Parent Company of DKK 20,829 million (2016: DKK 19,581 million).
Earnings per share (DKK millions) 2017 2016
Net profit for the year attributable to the shareholders of the parent company 20,114 19,195
Number of shares issued at 1 January 983,712,835 1,008,620,000
Share capital reduction (share buy-back programme) 46,885,113 24,907,165
Average number of own shares held by the Group (including share buy-back programme) 21,403,800 26,499,400
Average number of shares outstanding 915,423,922 957,213,435
Number of dilutive shares issued for share-based payments 557,291 524,146
Adjusted average number of shares outstanding after capital decrease, including dilutive shares 915,981,212 957,737,581
Earnings per share (DKK) 22.2 20.2
Diluted earnings per share (DKK) 22.1 20.2
The share capital consists of shares of a nominal value of DKK 10 each. All shares carry the same rights; there is thus only one class of shares.
Number of shares outstanding 2017 2016
Issued at 31 December 936,827,722 983,712,835
Holding of own shares 42,776,900 48,453,042
Shares outstanding at 31 December 894,050,822 935,259,793
Number Number Value Value Holding of own shares 2017 2016 2017 2016
Share buy-back programme 37,498,000 43,063,213 9,060 9,224
Trading portfolio 1,848,110 1,742,846 447 373
Investment on behalf of customers 3,430,790 3,646,983 829 781
Total 42,776,900 48,453,042 10,336 10,378
Danske Bank Group accounts for all shares issued by Danske Bank A/S and held by Danske Bank Group as own shares that are eliminated in the statement of changes in shareholders' equity. The disclosures above clarify the purpose of the acquisitions made by Danske Bank Group of its own shares.
Investment Share buy-back Trading on behalf Total Total
(DKK millions) programme portfolio of customers 2017 2016
Holding as 1 January 9,224 373 781 10,378 6,037
Acquisition of own shares 10,026 41,300 315 51,642 38,121
Sale of own shares - 41,086 361 41,447 30,089
Value adjustment 1,147 -141 94 1,100 708
Cancellation of own shares 11,337 - - 11,337 4,399
Holding at 31 December 9,060 447 829 10,336 10,378
The Board of Directors is authorised to let Danske Bank acquire own shares up to a total nominal amount of 10% of the share capital. The shares may be held for ownership or provided as collateral. If shares are acquired for ownership, the acquisition price may not deviate by more than 10% from the price quoted at the time of acquisition. Danske Bank A/S has obtained permission from the Danish Financial Supervisory Authority to acquire own shares for market-making purposes etc. and this amount is deducted from common equity tier 1 capital.
On 3 February 2017, the Group initiated a share buy-back programme of DKK 10 billion. The programme was completed on 31 January 2018.

Danske Bank / Annual Report 201754
54 Danske Bank / Annual Report 2017
Statement of capital – Danske Bank Group
(DKK millions) 2017 2016
Total capital and total capital ratio
168,256 166,615 Total equity Revaluation of domicile property at fair value 267 306
Tax effect of revaluation of domicile property at fair value -32 -36
Total equity calculated in accordance with the rules of the Danish FSA 168,491 166,885
Additional tier 1 capital instruments included in total equity -14,158 -14,133
Accrued interest on additional tier 1 capital instruments -169 -169
Tax on accrued interest on additional tier 1 capital instruments 37 37
Common equity tier 1 capital instruments 154,202 152,621
Adjustment to eligible capital instruments -1,060 -1,102
Prudent valuation -759 -1,153
Prudential filters -211 -397
Proposed dividends -9,368 -8,853
Intangible assets of banking operations -7,100 -6,707
Deferred tax on intangible assets 377 322
Deferred tax assets that rely on future profitability excluding temporary differences -335 -397
Defined benefit pension fund assets -1,343 -828
Statutory deduction for insurance subsidiaries -1,349 -626
Other statutory deductions -308 -186
Common equity tier 1 capital 132,744 132,694
Additional tier 1 capital instruments 18,574 23,623
Statutory deduction for insurance subsidiaries -169 -209
Tier 1 capital 151,150 156,108
Tier 2 capital instruments 19,343 22,141
Statutory deduction for insurance subsidiaries -169 -209
Total capital 170,324 178,041
Total risk exposure amount 753,409 815,249
Common equity tier 1 capital ratio (%) 17.6 16.3
Tier 1 capital ratio (%) 20.1 19.1
Total capital ratio (%) 22.6 21.8
Total capital and the total risk exposure amount are calculated in accordance with the rules applicable under CRR, taking transitional rules into account
as stipulated by the Danish Financial Supervisory Authority.
The risk exposure amount calculated under the Basel I rules amounted to DKK 1,513,899 million at 31 December 2017 (31 December 2016: DKK 1,487,896 million). The capital need under the transitional rules was DKK 96,890 million, equal to 12.9% of the reported risk exposure amount (31 December 2016: DKK 95,225 million).
Risk Management 2017 provides more details about the Group’s total capital and total risk exposure amount. Risk Management 2017 is not covered by the statutory audit.

Danske Bank / Annual Report 2017 55
Danske Bank / Annual Report 2017 55
Cash flow statement – Danske Bank Group
Note (DKK millions) 2017 2016
Cash flow from operations
Profit before tax 26,288 25,358
Tax paid -5,482 -4,961
Adjustment for non-cash operating items -1,093 477
Total 19,713 20,874
Changes in operating capital
Amounts due to/from credit institutions and central banks -31,337 1,543
Trading portfolio -17,318 44,510
Acquisition/sale of own shares and additional tier 1 capital -241 62
Other financial instruments 26,854 23,925
Loans at amortised cost 30,397 -62,141
Loans at fair value -21,220 -24,343
Deposits 102,993 80,391
Bonds issued by Realkredit Danmark 31,643 32,213
Assets/liabilities under insurance contracts -3,720 10,122
Other assets/liabilities 10,628 5,608
Cash flow from operations 148,392 132,764
Cash flow from investing activities
Acquisition/sale of businesses 291 1,226
Acquisition of intangible assets -1,022 -756
Acquisition of tangible assets -623 -288
Sale of tangible assets 74 2,988
Cash flow from investing activities -1,280 3,170
Cash flow from financing activities
38 Issues of subordinated debt 5,087 -
38 Redemption of subordinated debt -12,577 -
Dividends -8,332 -7,758
Share buy back programme* -9,958 -8,083
Issued additional tier 1 capital - 2,970
Paid interest on additional tier 1 capital -786 -649
Change in non-controlling interests - -
Cash flow from financing activities -26,566 -13,520
14 Cash and cash equivalents at 1 January 297,078 178,835
Foreign currency translation -4,031 -4,171
Change in cash and cash equivalents 120,546 122,414
Cash and cash equivalents, end of period 413,593 297,078
Cash and cash equivalents, end of period
Cash in hand 9,051 9,332
Demand deposits with central banks 73,766 43,879
Amounts due from credit institutions and central banks within three months 330,776 243,867
Total 413,593 297,078
* Shares acquired under the share buy-back programme are recognised at settlement date.
The list of Group holdings and undertakings in note 35 provides information about restrictions on the use of cash flows from Group undertakings.
Note 38 provides further information on the cash flow statement.

Danske Bank / Annual Report 201756
56 Danske Bank / Annual Report 2017
Notes – Danske Bank Group
1. Basis of preparation
Danske Bank Group prepares its consolidated financial statements in accordance with the International Financial Reporting Standards (IFRSs) and with applicable interpretations (IFRIC), issued by the International Accounting Standards Board (IASB), as adopted by the EU. Furthermore, the consolidated financial statements comply with the Danish FSA’s Executive Order No. 1306 dated 16 December 2008 on the use of IFRSs by undertakings subject to the Danish Financial Business Act.
Financial statement figures are stated in Danish kroner and whole millions, unless otherwise stated. As a result, rounding discrepancies may occur because totals have been rounded off and the underlying decimals are not presented to financial statement users.
Monetary assets and liabilities in foreign currency are translated at the exchange rates at the balance sheet date. Exchange rate adjustments of monetary assets and liabilities arising as a result of differences in the exchange rates at the transaction date and at the balance sheet date are recognised in the income statement. Non-monetary assets and liabilities in foreign currency that are subsequently revalued at fair value are translated at the exchange rates at the date of revaluation. Exchange rate adjustments are included in the fair value adjustment of an asset or liability. Other non-monetary items in foreign currency are translated at the exchange rates at the transaction date. The accounting treatment of foreign currency translation of units outside Denmark is described in note 23.
For the purpose of clarity, the primary financial statements and the notes to the financial statements are prepared using the concepts of materiality and relevance. This means that line items not considered material in terms of quantitative and qualitative measures or relevant to financial statement users are aggregated and presented together with other items in the primary financial statements. Similarly, information not considered material is not presented in the notes.
The significant accounting policies are incorporated into the notes to which they relate. Danske Bank Group has not changed its significant accounting policies from those applied in Annual Report 2016.
(a) Significant accounting estimates
Management’s estimates and assumptions of future events that will significantly affect the carrying amounts of assets and liabilities underlie the preparation of the consolidated financial statements. Those estimates and assumptions are presented in the following sections.
The estimates and assumptions are based on premises that management finds reasonable but which are inherently uncertain and unpredictable. The premises may be incomplete, unexpected future events or situations may occur, and other parties may arrive at other estimated values.
Fair value measurement of financial instruments Measurements of financial instruments that are only to a limited extent based on observable market data, such as the measurement of unlisted shares and certain bonds for which there is no active market, are subject to significant estimates. The estimated fair value of illiquid bonds significantly depends on the credit spread estimate. A credit spread widening of 50bp would have caused the fair value of the bonds to decrease DKK 80 million (31 December 2016: DKK 85 million). The Group makes fair value adjustments to cover changes in counterparty risk (CVA and DVA) and to cover expected funding costs (FVA) on derivatives, bid-offer spreads on the net open position of the portfolio of assets and liabilities with offsetting market risk recognised at mid-market prices, and model risk on level 3 derivatives. At 31 December 2017, the adjustments totalled DKK 0.9 billion (31 December 2016: DKK 1.8 billion), including the adjustment for credit risk on derivatives with customers subject to objective evidence of impairment. The decrease mainly relates to the narrowing of credit spreads and slightly reduced exposures.
Measurement of loans The Group makes impairment charges to account for any impairment of loans that occurs after initial recognition. Impairment charges consist of individual and collective charges and rely on a number of estimates, including identification of loans or portfolios of loans with objective evidence of impairment, expected future cash flows and the value of collateral. The Group determines the need for impairment charges on the basis of a customer’s expected ability to repay debt. This ability depends on a number of factors, including the customer’s earnings capacity and trends in the general economic environment and unemployment. Expectations of deteriorating repayment ability reduce credit quality and lead to downgrading of the customer.
The losses incurred under non-performing loan agreements depend, among other factors, on the value of collateral received. If the value of collateral decreased 10%, individual impairment charges would increase by about DKK 2.1 billion (31 December 2016: DKK 2.4 billion). The collective impairment charges are sensitive to the credit rating of customers. If all business customers were downgraded one rating category, collective impairment charges would increase by about DKK 1.6 billion (31 December 2016: DKK 1.2 billion). Further, a collective impairment charge of DKK 2.8 billion (2016: 3.3 billion) has been recognised on the basis of management’s judgement to reflect market conditions at the balance sheet date that are not fully reflected in the Group’s models. Note 14 and the section on credit risk in the risk management notes provide more details on impairment charges for loans. At 31 December 2017, loans accounted for about 54% of total assets (31 December 2016: 55%).

Danske Bank / Annual Report 2017 57
Danske Bank / Annual Report 2017 57
Notes – Danske Bank Group
1. Basis of preparation continued
(a) Significant accounting estimates
Measurement of goodwill Goodwill is tested for impairment once a year or more frequently if indications of impairment exist. Impairment testing requires management to estimate the future cash flows. A number of factors affect the value of such cash flows, including discount rates, changes in the economic outlook, customer behaviour and competition. At 31 December 2017, goodwill amounted to DKK 5.3 billion (31 December 2016: DKK 5.3 billion). For Wealth Management, Danske Capital, the carrying amount of goodwill is DKK 1.8 billion (31 December 2016: DKK 1.8 billion) and relates to the activities in Finland. The excess value (the amount by which the cash-generating unit’s recoverable amount exceeds the carrying amount) in the impairment test for Wealth Management, Danske Capital amounted to DKK 0.3 billion (2016: DKK 0.1 billion). Note 18 provides information on changes in key assumptions that would cause the excess value to be zero. The remaining goodwill of DKK 3.5 billion (2016: DKK 3.5 billion) relates to Corporates & Institutions and the excess value is DKK 26.8 billion. Note 18 provides more information on impairment testing and sensitivity to changes in assumptions.
Measurement of liabilities under insurance contracts Measurement of liabilities under insurance contracts is based on actuarial computations that rely on assumptions about a number of variables, including mortality and disability rates, and on the discount rate. Assumptions about future mortality rates are based on the Danish FSA’s benchmark, while other assumptions are based on data from the Group’s own portfolio of insurance contracts. Notes 1(b) and 17 provide further information on the measurement of insurance liabilities. The risk management notes contain a sensitivity analysis for life insurance.
Recognition of deferred tax assets and liabilitiesRecognition of deferred tax requires management to assess the probability and amount of future profit. Deferred tax assets arising from unused tax losses are recognised to the extent that such losses can be offset against tax on future profit over the next five years. At 31 December 2017, deferred tax assets from recognised tax loss carry-forwards amounted to DKK 0.3 billion (31 December 2016: DKK 0.3 billion). The tax base of unrecognised tax loss carry-forwards, relating primarily to the Group’s banking operations in Ireland, amounted to DKK 2.9 billion (31 December 2016: DKK 3.0 billion). The full deferred tax liability arising from international joint taxation was recognised and amounted to DKK 5.8 billion (31 December 2016: DKK 6.0 billion). Note 20 provides more information on deferred tax.
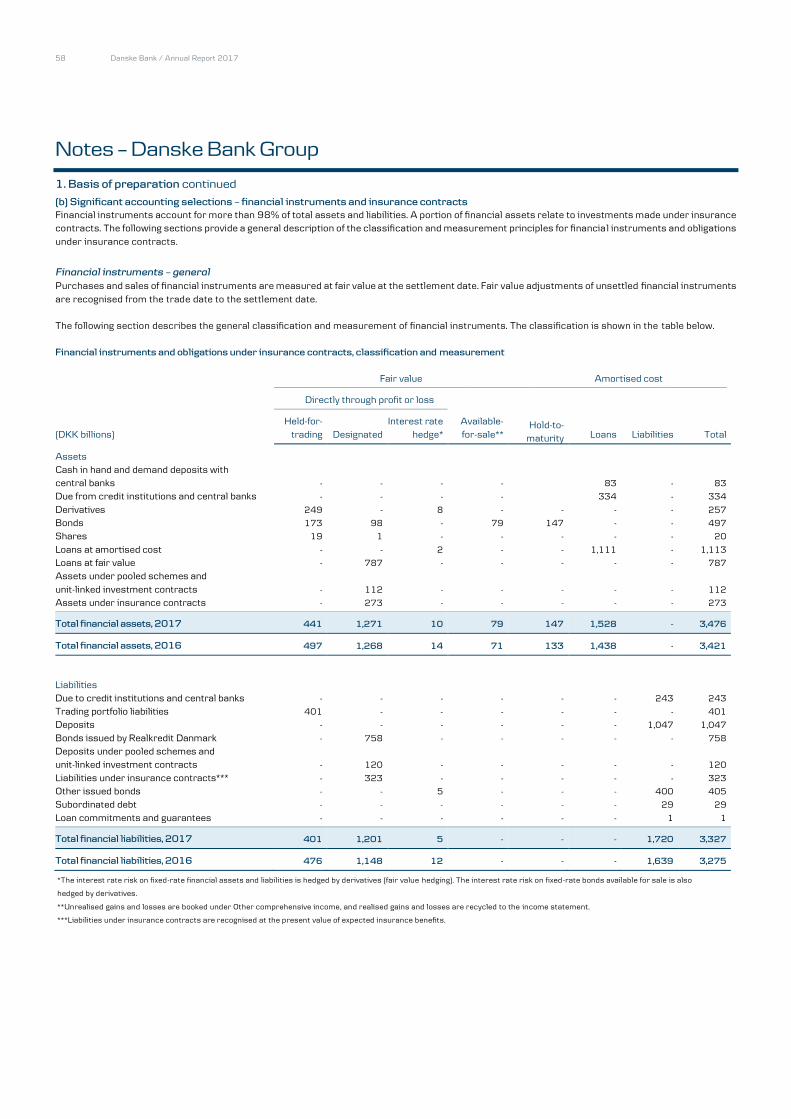
Danske Bank / Annual Report 201758
58 Danske Bank / Annual Report 2017
Notes – Danske Bank Group
1. Basis of preparation continued
(b) Significant accounting selections – financial instruments and insurance contracts
Financial instruments account for more than 98% of total assets and liabilities. A portion of financial assets relate to investments made under insurance contracts. The following sections provide a general description of the classification and measurement principles for financial instruments and obligations under insurance contracts.
Financial instruments – general Purchases and sales of financial instruments are measured at fair value at the settlement date. Fair value adjustments of unsettled financial instruments are recognised from the trade date to the settlement date.
The following section describes the general classification and measurement of financial instruments. The classification is shown in the table below.
Financial instruments and obligations under insurance contracts, classification and measurement
Fair value Amortised cost
Directly through profit or loss
(DKK billions) Held-for-
trading Designated Interest rate
hedge*
Available-for-sale**
Hold-to-maturity Loans Liabilities Total
Assets Cash in hand and demand deposits with central banks - - - - 83 - 83
Due from credit institutions and central banks - - - - 334 - 334
Derivatives 249 - 8 - - - - 257
Bonds 173 98 - 79 147 - - 497
Shares 19 1 - - - - - 20
Loans at amortised cost - - 2 - - 1,111 - 1,113
Loans at fair value - 787 - - - - - 787
Assets under pooled schemes and unit-linked investment contracts - 112 - - - - - 112
Assets under insurance contracts - 273 - - - - - 273
Total financial assets, 2017 441 1,271 10 79 147 1,528 - 3,476
Total financial assets, 2016 497 1,268 14 71 133 1,438 - 3,421
Liabilities Due to credit institutions and central banks - - - - - - 243 243
Trading portfolio liabilities 401 - - - - - - 401
Deposits - - - - - - 1,047 1,047
Bonds issued by Realkredit Danmark - 758 - - - - - 758
Deposits under pooled schemes and unit-linked investment contracts - 120 - - - - - 120
Liabilities under insurance contracts*** - 323 - - - - - 323
Other issued bonds - - 5 - - - 400 405
Subordinated debt - - - - - - 29 29
Loan commitments and guarantees - - - - - - 1 1
Total financial liabilities, 2017 401 1,201 5 - - - 1,720 3,327
Total financial liabilities, 2016 476 1,148 12 - - - 1,639 3,275
*The interest rate risk on fixed-rate financial assets and liabilities is hedged by derivatives (fair value hedging). The interest rate risk on fixed-rate bonds available for sale is also
hedged by derivatives.
**Unrealised gains and losses are booked under Other comprehensive income, and realised gains and losses are recycled to the income statement.
***Liabilities under insurance contracts are recognised at the present value of expected insurance benefits.

Danske Bank / Annual Report 2017 59
Danske Bank / Annual Report 2017 59
Notes – Danske Bank Group
1. Basis of preparation continued
(b) Significant accounting selections – financial instruments and insurance contracts
Loans and financial liabilities Loans and non-derivative financial liabilities are generally measured at amortised cost. Loans granted under Danish mortgage finance law and the issued mortgage bonds funding these loans are measured using the fair value option, however.
Loans granted under Danish mortgage finance law are funded by issuing listed mortgage bonds with matching terms. Borrowers may repay such loans by delivering the underlying bonds. Such loans and bonds are granted and issued by the Realkredit Danmark subsidiary only.
The Group buys and sells own bonds issued by Realkredit Danmark on an ongoing basis because the bonds play an important role in the Danish money market. If the loans and bonds were measured at amortised cost, the purchase and sale of own mortgage bonds would create timing differences in the recognition of gains and losses.
Consequently, the Group measures loans and issued bonds at fair value in accordance with the fair value option offered by IAS 39 to ensure that neither gain nor loss will occur on the purchase of own bonds. The fair value of bonds issued by Realkredit Danmark is normally equal to their market value. A small number of the issued bonds are illiquid, however, and the fair value of these bonds is calculated on the basis of a discounted cash flow valuation technique.
The fair value of the loans is based on the fair value of the underlying bonds adjusted for changes in the fair value of the credit risk on borrowers. Changes in the fair value of issued bonds cause corresponding changes to be made to the fair value of the loans. Consequently, changes to the fair value of issued bonds, including as a result of changes to own credit risk, do not affect net profit or loss. Changes to the fair value of lo ans as a result of changes to the credit risk on borrowers are reflected in Loan impairment charges in the income statement.
Securities Securities are generally measured at fair value through profit or loss and are classified as either trading portfolio assets or securities designated at fair value, using the fair value option. Certain bond portfolios are held for the purpose of generating a return until maturity and are recognised as hold-to-maturity financial assets.
Trading portfolio assets and liabilitiesThe trading portfolio includes financial assets acquired for sale in the near term. The trading portfolio also contains collectively managed financial assets for which a pattern of short-term profit taking exists. Trading portfolio liabilities consist of derivatives and obligations to repurchase securities. All derivatives, including bifurcated embedded derivatives and derivatives used for hedging, are measured at fair value and recog nised under the trading portfolio.
Securities designated at fair value Other financial assets designated at fair value include securities that are managed on a fair value basis with no short-term profit taking. This category consists mainly of securities purchased as part of the investment of insurance customer funds and recognised in the balance sheet under Assets under insurance contracts as well as part of the liquidity portfolio managed by Group Treasury. Other securities portfolios managed on a fair value basis are recognised in the balance sheet under Investment securities.
For both trading portfolio assets and securities designated at fair value, realised and unrealised capital gains and losses and dividends are recognised in the income statement under Net trading income.
Hold-to-maturity financial assets This category consists of bonds not managed on a fair value basis and held for the purpose of generating a return until maturity. The bonds are measured at amortised cost. The Group has increased its use of this category since 2013.
Available-for-sale financial assets This category consists of bonds recognised at fair value with unrealised fair value adjustments recognised under Other comprehensive income, whereas impairment charges, if any, are recognised in the income statement. In 2016, Group Treasury started to use the available-for-sale category for some bond holdings.
Hedge accounting The Group uses derivatives to hedge the interest rate risk on most fixed-rate assets and fixed-rate liabilities measured at amortised cost and on the available-for-sale portfolio reclassified in 2008. Hedged risks that meet the criteria for fair value hedge accounting are treated accordingly. The interest rate risk on the hedged assets and liabilities is measured at fair value through profit or loss. At end-2017, hedging derivatives measured at fair value accounted for about 0.2% of total assets and about 0.03% of total liabilities (31 December 2016: 0.3% and 0.1%, respectively).

Danske Bank / Annual Report 201760
60 Danske Bank / Annual Report 2017
Notes – Danske Bank Group
1. Basis of preparation continued(b) Significant accounting selections – financial instruments and insurance contracts
Insurance activities – general The Group issues life insurance policies, which are divided into insurance and investment contracts. Insurance contracts are contracts that entail significant insurance risk or entitle policyholders to bonuses. Investment contracts are contracts that entail no significant insurance risk and comprise unit-linked contracts under which the investment risk lies with the policyholder.
Insurance contracts Insurance contracts comprise both an investment element and an insurance element, which are recognised as aggregate figures.
IFRS 4, Insurance Contracts, includes an option to continue the accounting treatment of insurance contracts under local GAAP. The Group’s life insurance provisions are therefore recognised at their present value in accordance with the Danish FSA’s Executive Order on Financial Reports for Insurance Companies etc. The life insurance provisions are presented under Liabilities under insurance contracts.
Assets earmarked for insurance contracts are recognised under Assets under insurance contracts if most of the return on the assets accrues to the policyholders. Most of these assets are measured at fair value.
Investment contracts Investment contracts are recognised as financial liabilities, and, consequently, contributions and benefits under such contracts are recognised directly in the balance sheet. Deposits are measured at the value of the savings under Deposits under pooled schemes and unit-linked investment contracts.
Savings under unit-linked investment contracts are measured at fair value under Assets under pooled schemes and unit-linked investment contracts. The return on the assets and the crediting of the amounts to policyholders’ accounts are recognised under Net trading income.
Assets funded by shareholders’ equity The separate pool of assets equal to shareholders’ equity is recognised at fair value and consolidated with other similar assets.
Income from insurance business Insurance activities are consolidated in the various income statement items. Insurance premiums are recognised under Net premiums. Net insurance benefits in the income statement consists of benefits disbursed under insurance contracts and the annual change in insurance obligations not deriving from additional provisions for benefit guarantees and changes to the collective bonus potential. The return on earmarked assets is allocated to the relevant items in the income statement. The return to policyholders is recognised under Net trading income as are changes to additional provisions for benefit guarantees. Note 5 provides more information.
The sources of the Group’s net income from insurance business comprise the return on assets funded by Danica Pension’s shareholders’ equity, income from unit-linked business and health and accident business, and income from conventional life insurance business, the so-called risk allowance.
The risk allowance is determined in accordance with the Danish FSA’s executive order on the contribution principle. The contr ibution principle regulates how earnings are allocated between policyholders and the life insurance company’s shareholders’ equity and defines the maximum payment to shareholders’ equity (the risk allowance). The contribution principle was changed on 1 January 2016. If the contribution rules do not allow recognition of the full risk allowance, the amount that cannot be recognised can no longer be recovered in subsequent periods through the use of the shadow account. The risk allowance included in the shadow account at 31 December 2015 may be recovered over the five years following 2015.
Insurance contracts guarantee a certain long-term return on policyholders’ funds. If the technical basis exceeds the interest accrual to policyholders and the risk allowance, the difference is allocated to the bonus potential. The bonus potential serves as a risk buffer. If the technical basis is insufficient to cover the risk allowance, the shortfall can be covered by the bonus potential. If the bonus potential is insufficient to cover the shortfall, the difference can be covered by the individual bonus potentials or the profit margin; otherwise, the risk allowance that cannot be recognised will be lost. If the technical basis is insufficient to cover the interest accrual to policyholders, the shortfall is covered by the bonus potentials or the profit margin. Any remaining shortfall is paid by the Group in the form of an outlay. If the Group has made such an outlay, the outlay may be recovered the following year.
Danske Bank / Annual Report 2017 61
Danske Bank / Annual Report 2017 61
Notes – Danske Bank Group
1. Basis of preparation continued
(c) Financial highlights
The financial highlights and reporting for each segment shown in note 3 are used in the Management’s report and represent the financial information regularly provided to management. The Reclassification column in note 3 shows the reconciliation between the presentation in the financial highlights and the presentation in the consolidated financial statements prepared under IFRS and includes the following:
For operating leases under which the Group acts as a lessor, the gains or losses on the sale of lease assets at the end of the lease agreement are presented on a net basis under Other income in the financial highlights to better reflect the development in the cost base. In the consolidated income statement, gains or losses on the sale of operating lease assets, excluding properties, are recognised on a gross basis (i.e. the revenue from the sale of the assets is recognised under Other income and the carrying amount of the lease assets is recognised under Expenses).
In the financial highlights, income contributed by Fixed Income, Currencies and Commodities (FICC) and trading-related income at Capital Markets (both part of Corporates & Institutions) are recognised as net trading income. Income contributed by Equity Finance (also part of Corporates & Institutions, Capital Markets) is presented as net fee income. In the IFRS income statement, this income is presented as net interest income, net fee income, net trading income and other income. Similarly, income at Group Treasury (part of Other Activities), except income at the internal bank, and income on the hold-to-maturity portfolio are presented as net trading income in the financial highlights and as net interest income, net fee income, net trading income etc. in the IFRS income statement. As the distribution of income between the various income line items can vary considerably from one year to the next, depending on the underlying transactions and market conditions, the presentation in the financial highlights is considered to better reflect income in those areas.
For the Wealth Management business unit, the presentation of Danica Pension in the financial highlights differs from the presentation in the IFRS income statement. In the financial highlights, the risk allowance and income from the unit-link business are presented as net fee income. The return on assets related to the health and accident business is presented as net trading income. The risk and guarantee result, net income from the health and accident business and income from recharge to customers of certain expenses are presented as Other income. All costs, except external investment costs in Danica Pension, are presented under Operating expenses. In the IFRS income statement, income and expenses in Danica Pension are consolidated on a line-by-line basis.
The Non-core segment includes certain customer segments that are no longer considered part of the Group’s core business. The profit or loss is therefore presented as a separate line item in the financial highlights Profit before tax, Non-core, whereas the individual income and expense items are included in the various line items in the IFRS income statement.

Danske Bank / Annual Report 201762
62 Danske Bank / Annual Report 2017
Notes – Danske Bank Group
2. Changes and forthcoming changes to accounting policies and presentation(a) Changes to significant accounting policies and presentation during the year
No new standards were applied during 2017. The Group has applied the amendments to the standards adopted in the EU during 2017. These amendments relate to IAS 7, IAS 12 and to IFRS 12 included in the Annual Improvements to IFRS standards 2014-2016 cycle. The amendments to IAS 7 added a requirement to provide disclosures on changes to liabilities arising from financing activities, including changes arising from both cash flows and non-cash flows. The Group has implemented the disclosure requirement in a new note 38. The application of the amendments to IAS 12 and IFRS 12 had no effect on the financial statements.
(b) Standards and interpretations not yet in force
The IASB has issued four new IFRSs (IFRS 9, IFRS 15, IFRS 16 and IFRS 17) and some amendments to IFRSs that have not yet come into force. Similarly, the IFRIC has issued a new interpretation that has not yet come into force. Danske Bank Group has not early adopted any of these changes. The sections below explain the IFRS changes that are likely to affect the Group’s future financial reporting. For the changes not described below, no significant impact is expected.
IFRS 9, Financial Instruments In July 2014, the IASB issued IFRS 9 Financial Instruments that will replace IAS 39. The standard provides revised principles for classification and measurement of financial instruments and introduces the expected credit losses impairment model and the new general hedge accounting model. The general hedge accounting model will later be supplemented by a new macro hedge accounting model, which the IASB is working on.
IFRS 9 will be effective from 1 January 2018, at which date the Group will implement the standard. The expected credit losses impairment model in IFRS 9 will result in an increase in the allowance account of approximately DKK 2.5 billion, of which DKK 2.1 billion relates to loans at amortised cost and DKK 0.4 billion relates to loans at fair value through the income statement (loans granted by Realkredit Danmark). The impact on loans at amortised cost will be recognised as a reduction in shareholders’ equity, while the impact on loans at fair value will be recognised as a change in an accounting estimate in the IFRS income statement in the first quarter of 2018.
The total impact from the implementation of IFRS 9, including other measurement changes and net of tax, is expected to reduce shareholders’ equity by approximately DKK 2.0 billion.
Note 39 shows the expected impact from the application of IFRS 9 at 1 January 2018, including changes to the Group’s accounting policy.
IFRS 15, Revenue from Contracts with Customers In May 2014, the IASB issued IFRS 15, Revenue from Contracts with Customers. IFRS 15 replaces IAS 18, Revenue, and other existing IFRSs on revenue recognition. Under IFRS 15, revenue is recognised when the performance obligations inherent in the contract with a customer are satisfied.
IFRS 15 will be effective from 1 January 2018, at which date the Group will implement the standard. The implementation will have no impact on shareholders’ equity. Note 39 shows the changes to the Group’s accounting policy.
IFRS 16, Leases In January 2016, the IASB issued IFRS 16, Leases. IFRS 16 that replaces IAS 17, Leases, will only imply insignificant changes to the accounting for lessors. For lessees, the accounting will change significantly, as all leases (except short-term leases and small asset leases) will be recognised in the balance sheet as a right-of-use asset. Initially, the lease liability and the right-of-use asset are measured at the present value of future lease payments (defined as economically unavoidable payments). The right-of-use asset is subsequently depreciated in a way similar to depreciation of other assets, such as tangible assets, i.e. typically on a straight-line basis over the lease term.
IFRS 16, will be effective from 1 January 2019, at which date the Group will implement the standard. The Group is currently a ssessing the impact from IFRS 16 on the Group’s financial statements. It is not yet possible to give an estimate of the effect on the financial statem ents of the changes to the accounting treatment when the Group acts as lessee. However, we do not expect any significant impact on shareholders’ equity.
IFRS 17, Insurance Contracts In May 2017, the IASB issued IFRS 17, Insurance Contracts. IFRS 17 replaces IFRS 4, Insurance Contracts, which was an interim standard that did not prescribe the measurement of insurance contracts but relied on existing accounting practices. IFRS 17 is a comprehensive standard with principles for, for example, the measurement of insurance contracts at a current (fulfilment) value in the balance sheet, the recognition of insurance contract revenue in the income statement and the presentation of information on the performance in relation to insurance contracts.
IFRS 17, which is yet to be adopted by the EU, will be effective from 1 January 2021. The standard may have significant impact on the financial statements due to the new principles for calculating insurance provisions and for the presentation in the income statement and balance sheet. The Group has initiated an analysis to map the effect on the Group’s financial statements.

Danske Bank / Annual Report 2017 63
Danske Bank / Annual Report 2017 63
Notes – Danske Bank Group
3. Business model and business segmentation
Danske Bank is a Nordic universal bank with bridges to the rest of the world. The Group offers customers a wide range of services in the fields of banking, mortgage finance, insurance, pension, real-estate brokerage, asset management and trading in fixed income products, foreign exchange and equities.
The Group consists of a number of business units and support functions. The business units are segmented according to customers, products and services characteristics. From 2016, the Group has five business units, a Non-core unit and Other Activities, and these constitute the Group’s reportable segments under IFRS 8.
Personal Banking serves personal customers. The unit focuses on providing proactive advice to customers and making day-to-day banking simple and efficient through innovative digital solutions.
Business Banking serves small and medium-sized businesses through a large network of national finance centres, branches, contact centres and online channels. The unit offers leading solutions within financing, investing, cash management and risk management.
Corporates & Institutions serves large Nordic corporate and institutional customers in the Nordic countries and beyond. This wholesale division of Corporates & Institutions carries out banking activities within General Banking and provides strategic advice, financial solutions and products within Capital Markets, Fixed Income, Currencies and Commodities, and Transaction Banking. Each customer of Corporates & Institutions is served by a key relationship manager supported by Corporates & Institutions’ product specialists to ensure proactive advice on the various wholesale banking services offered.
Wealth Management serves the Group’s entire customer base and encompasses expertise from Danica Pension, Danske Capital and Private Banking.
Northern Ireland serves personal and business customers through a network of branches in Northern Ireland and leading digital channels.
Non-core includes certain customer segments that are no longer considered part of the core business. The Non-core unit is responsible for the controlled winding-up and divestment of this part of the loan portfolio. The portfolio consists of loans to customers in Ireland, personal banking customers in the Baltics and liquidity facilities for Special Purpose Vehicles (SPVs) and conduit structures.
Other Activities encompasses Group Treasury, Group support functions and eliminations, including the elimination of returns on own shares. Group Treasury is responsible for the Group’s liquidity management and funding.
Accounting policy
Segment reporting complies with the significant accounting policies. The ‘Reclassification’ column shows adjustments made to the IFRS statements in the calculation of the financial highlights.
Internal income and expenses are allocated to the individual segments on an arm’s-length basis. Expenses incurred centrally, including expenses incurred by support, administrative and back-office functions, are charged to the business units according to consumption and activity. Funding costs for lending and deposit activities (FTP) are allocated on the basis of a maturity analysis of loans and deposits, interbank rates and funding spreads, and depend on market trends.
Segment assets and liabilities are assets and liabilities that are used for maintaining the operating activities of a segment or have come into existence as a result of such activities and which are either directly attributable or may be reasonably allocated to a segment. A calculated share of shareholders’ equity is allocated to each segment. Other assets and liabilities are recognised under Other Activities.
Capital (shareholders’ equity) is allocated to the business units based on the Group’s capital allocation framework, with goodwill allocated directly to the relevant business units. The framework is based on a regulatory approach and is calibrated to the Group’s CET1 capital ratio target. Therefore, the capital consumption of the individual business units is closely aligned with the Group’s total capital consumption. However, for the Northern Ireland business unit, the capital allocated equals the legal entity’s capital .
A calculated interest income equal to the risk-free return on its allocated capital is apportioned to each business unit and offset by a corresponding interest expense at Other Activities. This income is calculated on the basis of the short-term money market rate. The interest expense on equity accounted additional tier 1 capital is charged to the business units on the basis of the capital allocated to each unit and offset at Other Activities.
The financial highlights and the reporting for each segment shown in the tables below are similar to the information provided in the Management’s report and
represent the financial information regularly provided to management. For further information on the differences between the presentation in the financial
highlights and segment reporting and the presentation in the IFRS financial statements, see note 1(c). The reconciliation between the two different presentations is shown in the ‘Reclassification’ column in the tables below.

Danske Bank / Annual Report 201764
64 Danske Bank / Annual Report 2017
Notes – Danske Bank Group
3. Business model and business segmentation continued
Business segments 2017
(DKK millions) Personal Banking
Business Banking C&I
Wealth Man.
Northern Ireland
Non-core
Other Activities
Elimina-
tions Financial
highlights
Reclassifi-
cation
IFRS financial
statements
Net interest income 7,911 8,828 3,207 709 1,374 - 1,353 49 23,430 6,433 29,863
Net fee income 3,419 1,806 2,651 7,281 429 - -275 -7 15,304 -4,480 10,824
Net trading income 614 548 5,668 403 111 - 667 -188 7,823 11,509 19,332
Other income 736 551 2 174 48 - 770 -690 1,591 4,156 5,747
Net premiums - - - - - - - - - 25,935 25,935
Net insurance benefits - - - - - - - - - 41,119 41,119
Total income 12,681 11,733 11,528 8,567 1,961 - 2,514 -836 48,149 2,434 50,582
Operating expenses 7,533 4,601 4,799 4,082 957 - 917 -167 22,722 3,155 25,877
Profit before loan impairment charges 5,148 7,133 6,729 4,485 1,004 - 1,598 -670 25,427 -722 24,705
Loan impairment charges -62 -824 354 -93 -247 - 1 - -873 -710 -1,582
Profit before tax, core 5,211 7,957 6,375 4,579 1,251 - 1,597 -670 26,300 -12 26,288
Profit before tax, Non-core - - - - - -12 - - -12 12 -
Profit before tax 5,211 7,957 6,375 4,579 1,251 -12 1,597 -670 26,288 - 26,288
Loans, excluding reverse transactions 753,060 676,986 182,504 74,595 45,514 - 15,509 -25,143 1,723,025 4,726 1,727,751
Other assets 197,145 167,520 3,389,288 482,214 27,091 - 3,134,553 -5,586,193 1,811,617 159 1,811,776
Total assets in Non-core - - - - - 4,886 - - 4,886 -4,886 -
Total assets 950,205 844,505 3,571,792 556,809 72,605 4,886 3,150,062 -5,611,336 3,539,528 - 3,539,528
Deposits, excluding repo deposits 273,478 242,278 273,811 65,849 58,971 - 12,173 -14,708 911,852 1,925 913,777
Other liabilities 651,534 558,538 3,265,081 477,382 6,779 - 3,107,979 -5,596,628 2,470,665 1,169 2,471,834
Allocated capital 25,193 43,690 32,901 13,578 6,856 - 31,700 - 153,917 - 153,917
Total liabilities in Non-core - - - - - 3,094 - - 3,094 -3,094 -
Total liabilities and equity 950,205 844,505 3,571,792 556,809 72,605 3,094 3,151,853 -5,611,336 3,539,528 - 3,539,528
Profit before tax as % of allocated capital (avg.) 21.3 17.8 17.8 33.0 20.1 - 5.7 - 17.2 - 17.2
Cost/income ratio (%) 59.4 39.2 41.6 47.6 48.8 - 36.5 - 47.2 - 51.2
Full-time-equivalent staff, end of period 4,517 2,625 1,808 1,851 1,260 122 7,586 - 19,768 - 19,768
The ‘Reclassification’ column shows the reconciliation between the presentation in the financial highlights and the presentation in the IFRS statements. The reclassifications are explained in note 1 (c).
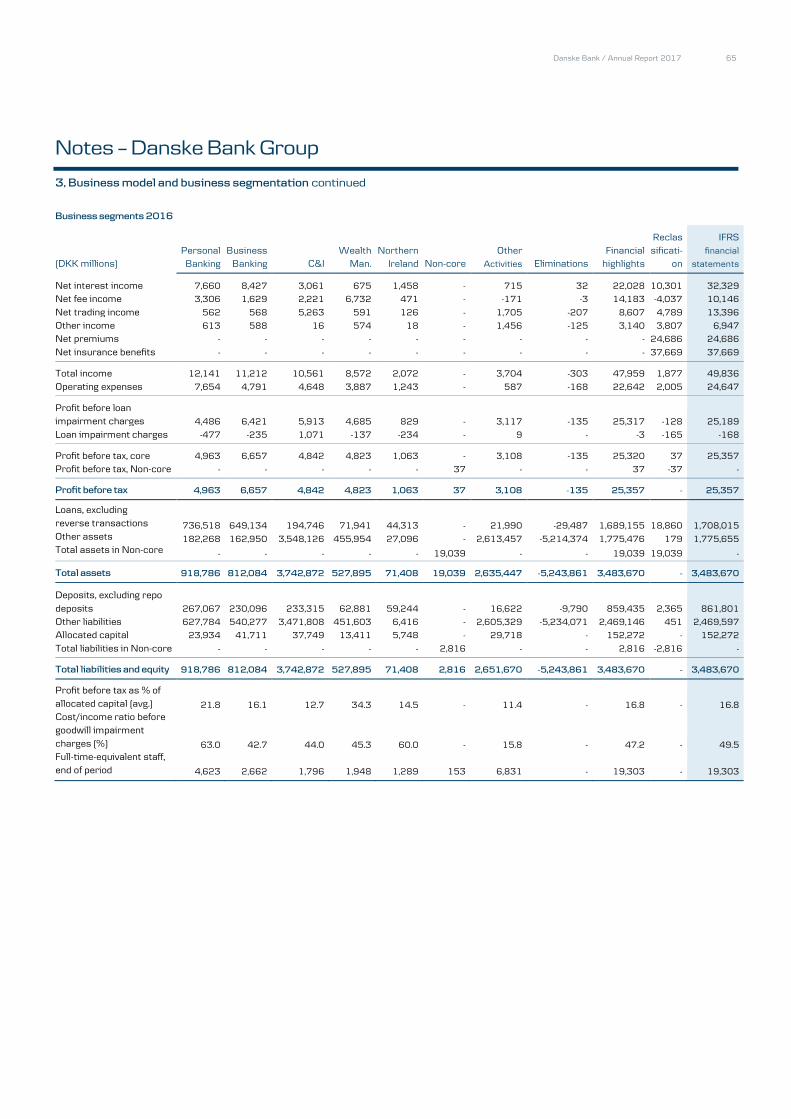
Danske Bank / Annual Report 2017 65
Danske Bank / Annual Report 2017 65
Notes – Danske Bank Group
3, Business model and business segmentation continued
Business segments 2016
(DKK millions) Personal Banking
Business Banking C&I
Wealth Man.
Northern Ireland Non-core
Other Activities Eliminations
Financial highlights
Reclassificati-
on
IFRS financial
statements
Net interest income 7,660 8,427 3,061 675 1,458 - 715 32 22,028 10,301 32,329
Net fee income 3,306 1,629 2,221 6,732 471 - -171 -3 14,183 -4,037 10,146
Net trading income 562 568 5,263 591 126 - 1,705 -207 8,607 4,789 13,396
Other income 613 588 16 574 18 - 1,456 -125 3,140 3,807 6,947
Net premiums - - - - - - - - - 24,686 24,686
Net insurance benefits - - - - - - - - - 37,669 37,669
Total income 12,141 11,212 10,561 8,572 2,072 - 3,704 -303 47,959 1,877 49,836
Operating expenses 7,654 4,791 4,648 3,887 1,243 - 587 -168 22,642 2,005 24,647
Profit before loan impairment charges 4,486 6,421 5,913 4,685 829 - 3,117 -135 25,317 -128 25,189
Loan impairment charges -477 -235 1,071 -137 -234 - 9 - -3 -165 -168
Profit before tax, core 4,963 6,657 4,842 4,823 1,063 - 3,108 -135 25,320 37 25,357
Profit before tax, Non-core - - - - - 37 - - 37 -37 -
Profit before tax 4,963 6,657 4,842 4,823 1,063 37 3,108 -135 25,357 - 25,357
736,518 649,134 194,746 71,941 44,313 - 21,990 -29,487 1,689,155 18,860 1,708,015
182,268 162,950 3,548,126 455,954 27,096 - 2,613,457 -5,214,374 1,775,476 179 1,775,655
Loans, excluding reverse transactions Other assets Total assets in Non-core - - - - - 19,039 - - 19,039 19,039 -
Total assets 918,786 812,084 3,742,872 527,895 71,408 19,039 2,635,447 -5,243,861 3,483,670 - 3,483,670
Deposits, excluding repo deposits 267,067 230,096 233,315 62,881 59,244 - 16,622 -9,790 859,435 2,365 861,801
Other liabilities 627,784 540,277 3,471,808 451,603 6,416 - 2,605,329 -5,234,071 2,469,146 451 2,469,597
Allocated capital 23,934 41,711 37,749 13,411 5,748 - 29,718 - 152,272 - 152,272
Total liabilities in Non-core - - - - - 2,816 - - 2,816 -2,816 -
Total liabilities and equity 918,786 812,084 3,742,872 527,895 71,408 2,816 2,651,670 -5,243,861 3,483,670 - 3,483,670
21.8 16.1 12.7 34.3 14.5 - 11.4 - 16.8 - 16.8
63.0 42.7 44.0 45.3 60.0 - 15.8 - 47.2 - 49.5
Profit before tax as % of allocated capital (avg.) Cost/income ratio before goodwill impairment charges (%) Full-time-equivalent staff, end of period 4,623 2,662 1,796 1,948 1,289 153 6,831 - 19,303 - 19,303

Danske Bank / Annual Report 201766
66 Danske Bank / Annual Report 2017
Notes – Danske Bank Group
3, Business model and business segmentation continued
Personal Banking by country, 2017
(DKK millions) Denmark Finland Sweden Norway Other* Total
Net interest income 5,073 872 899 1,031 36 7,911
Net fee income 2,331 778 208 101 1 3,419
Net trading income 543 16 8 48 - 614
Other income 331 95 - 387 -77 736
Total income 8,278 1,761 1,116 1,567 -39 12,681
Operating expenses 4,504 1,148 622 1,083 177 7,533
Profit before loan impairment charges 3,774 612 494 484 -216 5,148
Loan impairment charges -72 28 -10 -8 - -62
Profit before tax 3,846 584 504 493 -216 5,211
Loans, excluding reverse transactions 480,061 90,417 84,385 98,197 - 753,060
Deposits, excluding repo deposits 182,758 46,090 24,370 20,260 - 273,478
Net interest income as % p.a. of loans and deposits 0.77 0.64 0.83 0.87 - 0.77
Cost/income ratio before goodwill impairment charges (%) 54.4 65.2 55.7 69.1 - 59.4
Personal Banking by country, 2016
(DKK millions) Denmark Finland Sweden Norway Other* Total
Net interest income 5,193 831 713 938 -15 7,660
Net fee income 2,163 837 194 115 -4 3,306
Net trading income 502 16 12 32 - 562
Other income 139 47 - 403 24 613
Total income 7,996 1,732 919 1,488 6 12,141
Operating expenses 4,473 1,175 592 1,068 346 7,654
Profit before loan impairment charges 3,523 557 327 420 -340 4,486
Loan impairment charges -526 71 -1 -20 - -477
Profit before tax 4,050 486 328 440 -340 4,963
Loans, excluding reverse transactions 474,227 89,567 74,439 98,286 - 736,518
Deposits, excluding repo deposits 178,082 45,016 23,363 20,607 - 267,067
Net interest income as % p.a. of loans and deposits 0.80 0.62 0.73 0.79 - 0.76
Cost/income ratio before goodwill impairment charges (%) 55.9 67.8 64.4 71.8 - 63.0
*Other includes staff functions and other non-country specific costs.

Danske Bank / Annual Report 2017 67
Danske Bank / Annual Report 2017 67
Notes – Danske Bank Group
3. Business model and business segmentation continued
Business Banking by country, 2017
(DKK millions) Denmark Finland Sweden Norway Baltics Other* Total
Net interest income 4,325 816 2,095 1,355 252 -15 8,828
Net fee income 759 412 340 219 77 -1 1,806
Net trading income 319 32 105 68 24 - 548
Other income 490 21 6 33 1 - 551
Total income 5,893 1,281 2,547 1,675 354 -16 11,733
Operating expenses 2,253 640 893 559 245 11 4,601
Profit before loan impairment charges 3,640 641 1,654 1,116 109 -28 7,133
Loan impairment charges -1,026 -28 -73 345 -42 -1 -824
Profit before tax 4,666 669 1,727 771 151 -27 7,957
Loans, excluding reverse transactions 396,464 59,992 137,867 67,874 14,789 - 676,986
Deposits, excluding repo deposits 94,773 37,935 43,251 53,113 13,206 - 242,278
Net interest income as % p.a. of loans and deposits 0.88 0.83 1.16 1.12 0.90 - 0.96
Cost/income ratio before goodwill impairment charges (%) 38.2 50.0 35.0 33.4 69.2 - 39.2
Business Banking by country, 2016
(DKK millions) Denmark Finland Sweden Norway Baltics Other* Total
Net interest income 4,354 792 1,840 1,207 257 -22 8,427
Net fee income 633 408 307 199 83 -1 1,629
Net trading income 346 35 95 65 27 - 568
Other income 512 28 9 38 1 - 588
Total income 5,845 1,263 2,251 1,508 368 -23 11,212
Operating expenses 2,409 682 892 554 233 20 4,791
Profit before loan impairment charges 3,436 581 1,359 954 135 -43 6,421
Loan impairment charges -286 -62 21 118 -26 - -235
Profit before tax 3,722 643 1,338 836 160 -43 6,657
Loans, excluding reverse transactions 387,831 54,382 127,393 65,354 14,174 - 649,134
Deposits, excluding repo deposits 93,280 35,919 42,980 44,397 13,520 - 230,096
Net interest income as % p.a. of loans and deposits 0.90 0.88 1.08 1.10 0.93 - 0.96
Cost/income ratio before goodwill impairment charges (%) 41.2 54.0 39.6 36.7 63.4 - 42.7
*Other includes staff functions and other non-country specific costs.

Danske Bank / Annual Report 201768
68 Danske Bank / Annual Report 2017
Notes – Danske Bank Group
2017 2016
13,226 12,030
11,590 10,836
8,476 8,010
3,777 4,145
6,793 6,512
3,845 3,380
804 1,175
3. Business model and business segmentation continued
(b) Total income broken down by type of product (DKK millions)
Business banking Home finance and savings Trading Day-to-day banking Asset management Leasing Life conventional Other 2,071 3,748
Total 50,582 49,836
Business banking comprises interest and fee income from transactions with business customers. Home finance and savings comprises interest and fee income from financing and savings products. Trading comprises income from fixed-income and foreign exchange products, including brokerage. Day-to-day banking comprises income from personal banking products in the form of personal loans, cards and deposits. Asset management comprises income from the management of assets at Danske Capital and unit-linked contracts at Danica. Leasing encompasses income from both finance and operating leases sold by the Group’s leasing operations. Life conventional comprises income in Danica Pension from conventional life insurance contracts (Danica
Traditionel).
Danske Bank Group does not have any single customer that generates 10% or more of the Group’s total income.
(c) Geographical segmentation
The geographical segmentation of income from external customers is shown in compliance with IFRSs and does not reflect the Group’s management structure. The geographical segmentation below reflects the customer’s country of residence, except trading income, which is broken down by the country in which the activities are carried out. Management believes that the business segmentation provides a more informative description of the Group’s activities.
Total income from external customers (DKK millions) 2017 2016
Denmark 27,204 28,023
Finland 4,654 4,650
Sweden 8,428 7,159
Norway 5,966 5,569
Ireland 417 600
UK 2,498 2,547
Other 1,415 1,288
Total 50,582 49,836

Danske Bank / Annual Report 2017 69
Danske Bank / Annual Report 2017 69
Notes – Danske Bank Group
4. Activities by country
Under CRD IV, a financial institution must disclose, by country in which it operates through a subsidiary or a branch, information about income, number of employees, profit before tax, tax and public subsidies received. This information is not comparable to the geographical segmentation presented in note 3(c), in which segmentation is based on the customer’s country of residence. The Group has not received any public subsidies that relate to the Group’s activities as a financial institution.
Income* Full-time- Profit before
tax Tax on profit 2017 (DKK millions) equivalent staff (DKK millions) (DKK millions)
Denmark 53,156 9,857 13,234 -2,809
Finland 5,515 1,706 2,071 -414
Sweden 4,447 1,406 5,402 -1,128
Norway 7,595 1,446 2,717 -589
United Kingdom 2,836 1,365 1,419 -267
Ireland 448 54 916 -15
Estonia 197 317 52 -9
Latvia 84 72 20 -13
Lithuania 130 2,381 -14 -11
Luxembourg 808 81 170 -47
Russia 188 63 70 -15
Germany 116 33 56 -18
Poland 107 57 59 -12
USA 576 24 69 -31
India 1 907 48 -12
Total 76,203 19,768 26,288 -5,388
*Income is defined as interest income (including negative interest income), fee and commission income and other operating income (including income from holdings in associates).
Income* Full-time- Profit before
tax Tax on profit 2016 (DKK millions) equivalent staff (DKK millions) (DKK millions)
Denmark 55,612 9,767 15,866 -3,437
Finland 5,699 1,877 1,790 -338
Sweden 5,104 1,368 4,332 -899
Norway 7,134 1,426 1,629 -389
United Kingdom 2,828 1,389 1,304 -419
Ireland 472 59 254 94
Estonia 286 347 120 -4
Latvia 74 74 -72 8
Lithuania 159 1,931 -311 1
Luxembourg 739 93 113 -33
Russia 178 54 67 -13
Germany 166 31 128 -39
Poland 94 40 57 -11
USA 403 23 43 -14
India 1 824 38 -7
Total 78,949 19,303 25,357 -5,500
*Income is defined as interest income (including negative interest income), fee and commission income and other operating income (including income from holdings in associates).

Danske Bank / Annual Report 201770
70 Danske Bank / Annual Report 2017
Notes – Danske Bank Group
4. Activities by country continuedDanske Bank carries out its activities in the countries listed below under a variety of names, of which the main ones are: Danske Bank (banking, trading and wealth management activities carried out in all countries, except for mortgage finance activities in Denmark, which are carried out under the Realkredit Danmark A/S name), Danica Pension (life insurance), and Danske Leasing A/S (leasing). Note 35 discloses the company names of the Group’s significant subsidiaries.
Activities in the individual countries Activities in Denmark include: Banking, trading, wealth management, life insurance, leasing and other activities. Activities in Finland include: Banking, trading, wealth management and leasing. Activities in Sweden include: Banking, trading, wealth management, life insurance and leasing. Activities in Norway include: Banking, trading, wealth management, leasing, life insurance and other activities. Activities in the United Kingdom include: Banking, trading and leasing. Activities in Ireland include: Banking. Activities in Estonia include: Banking, wealth management and leasing. Activities in Latvia include: Banking. Activities in Lithuania include: Banking, wealth management, leasing and other activities. Activities in Luxembourg include: Banking and wealth management. Activities in Russia include: Banking. Activities in Germany include: Banking. Activities in Poland include: Banking. Activities in the USA include: Trading. Activities in India include: Other activities.
Other activities include: Group support functions, real-estate brokerage and activities taken over by the Group under non-performing-loan agreements.

Danske Bank / Annual Report 2017 71
Danske Bank / Annual Report 2017 71
Notes – Danske Bank Group
5. Net interest and net trading income
This note shows interest income, interest expense and net trading income broken down by balance sheet item and by portfolios of financial instruments measured at amortised cost or fair value.
Accounting policy
Interest income and expenses
Interest income and expenses arising from interest-bearing financial instruments measured at amortised cost are recognised according to the effective interest rate method on the basis of the cost of the individual financial instrument. Interest includes amortised amounts of fees that are an integral part of the effective yield on a financial instrument, such as origination fees, and amortised differences between cost and redemption price, if any. Interest on loans subject to individual impairment is recognised on the basis of the impaired value. The interest rate risk on most financial portfolios recognised at amortised cost is hedged by derivatives using fair value hedge accounting. Note 12 provides more information on hedge accounting.
Net trading income
Net trading income includes realised and unrealised capital gains and losses on trading portfolio assets and other securities recognised at fair value as well as exchange rate adjustments and dividends. Further, the fair value adjustments of loans at fair value and bonds issued by Realkredit Danmark are recognised under net trading income except for the fair value adjustments of the credit risk on loans that are recognised under Loan impairment charges. Moreover, the item includes the change in insurance obligations during the year due to additional provisions for benefit guarantees and the tax on pension returns.
Returns (interest income and fair value changes) on assets under pooled schemes and unit-linked investment contracts and the crediting of these returns to customer accounts are recognised under Net trading income.
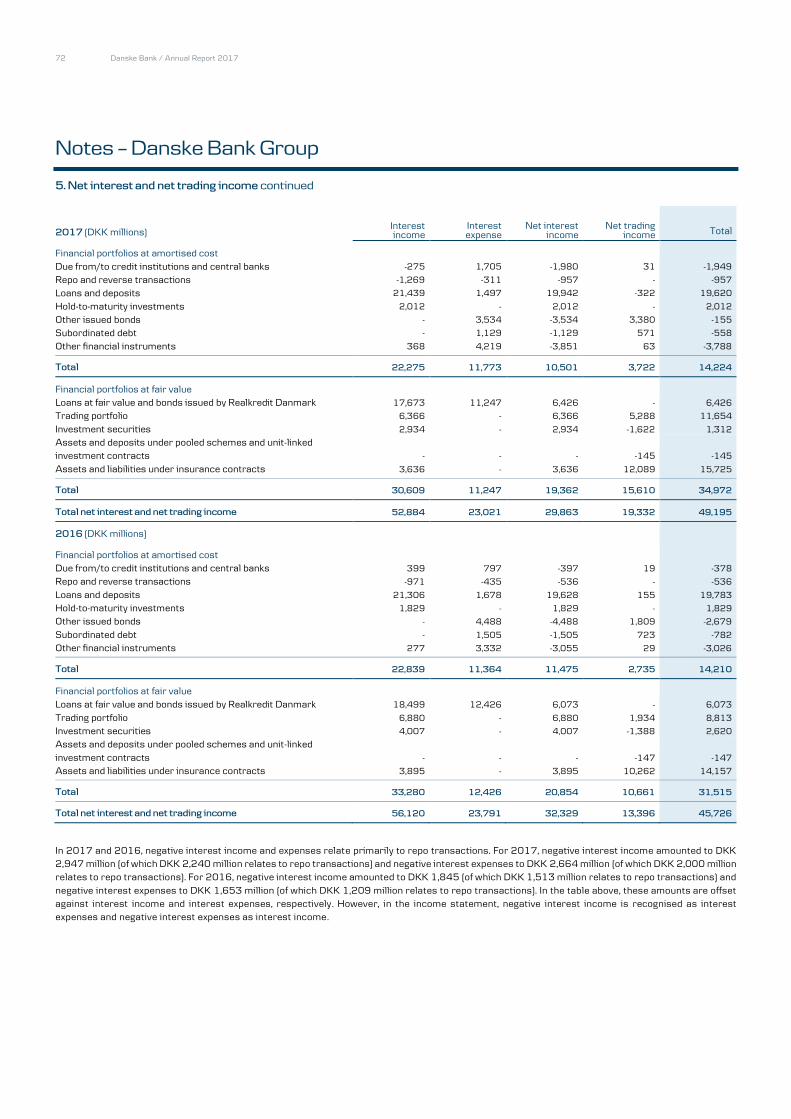
Danske Bank / Annual Report 201772
72 Danske Bank / Annual Report 2017
Notes – Danske Bank Group
Interest income
Interest expense
Net interest income
Net trading income Total
-275 1,705 -1,980 31 -1,949
-1,269 -311 -957 - -957
21,439 1,497 19,942 -322 19,620
2,012 - 2,012 - 2,012
- 3,534 -3,534 3,380 -155
- 1,129 -1,129 571 -558
5. Net interest and net trading income continued
2017 (DKK millions)
Financial portfolios at amortised cost Due from/to credit institutions and central banks Repo and reverse transactions Loans and deposits Hold-to-maturity investments Other issued bonds Subordinated debt Other financial instruments 368 4,219 -3,851 63 -3,788
Total 22,275 11,773 10,501 3,722 14,224
Financial portfolios at fair value Loans at fair value and bonds issued by Realkredit Danmark 17,673 11,247 6,426 - 6,426
Trading portfolio 6,366 - 6,366 5,288 11,654
Investment securities 2,934 - 2,934 -1,622 1,312
Assets and deposits under pooled schemes and unit-linked investment contracts - - - -145 -145
Assets and liabilities under insurance contracts 3,636 - 3,636 12,089 15,725
Total 30,609 11,247 19,362 15,610 34,972
Total net interest and net trading income 52,884 23,021 29,863 19,332 49,195
2016 (DKK millions)
Financial portfolios at amortised cost Due from/to credit institutions and central banks 399 797 -397 19 -378
Repo and reverse transactions -971 -435 -536 - -536
Loans and deposits 21,306 1,678 19,628 155 19,783
Hold-to-maturity investments 1,829 - 1,829 - 1,829
Other issued bonds - 4,488 -4,488 1,809 -2,679
Subordinated debt - 1,505 -1,505 723 -782
Other financial instruments 277 3,332 -3,055 29 -3,026
Total 22,839 11,364 11,475 2,735 14,210
Financial portfolios at fair value Loans at fair value and bonds issued by Realkredit Danmark 18,499 12,426 6,073 - 6,073
Trading portfolio 6,880 - 6,880 1,934 8,813
Investment securities 4,007 - 4,007 -1,388 2,620
Assets and deposits under pooled schemes and unit-linked investment contracts - - - -147 -147
Assets and liabilities under insurance contracts 3,895 - 3,895 10,262 14,157
Total 33,280 12,426 20,854 10,661 31,515
Total net interest and net trading income 56,120 23,791 32,329 13,396 45,726
In 2017 and 2016, negative interest income and expenses relate primarily to repo transactions. For 2017, negative interest income amounted to DKK 2,947 million (of which DKK 2,240 million relates to repo transactions) and negative interest expenses to DKK 2,664 million (of which DKK 2,000 million relates to repo transactions). For 2016, negative interest income amounted to DKK 1,845 (of which DKK 1,513 million relates to repo transactions) and negative interest expenses to DKK 1,653 million (of which DKK 1,209 million relates to repo transactions). In the table above, these amounts are offset against interest income and interest expenses, respectively. However, in the income statement, negative interest income is recognised as interest expenses and negative interest expenses as interest income.

Danske Bank / Annual Report 2017 73
Danske Bank / Annual Report 2017 73
Notes – Danske Bank Group
5. Net interest and net trading income continued
Changes to the hedged interest rate risk are recognised under net trading income and shown under the hedged balance sheet items in the table above, whereas value adjustments of hedging derivatives are recognised under net trading income under the trading portfolio. Net trading income includes dividends from shares of DKK 2,302 million (2016: DKK 2,401 million) and foreign exchange adjustments of DKK 1,742 million (2016: DKK 1,710 million).
Net trading income from insurance contracts includes the return on assets of DKK 13,994 million (2016: DKK 15,239 million), adjustment of additional provisions of DKK -59 million (2016: DKK -2,100 million), adjustment of the collective bonus potential of DKK 158 million (2016: DKK -588 million) and tax on pension returns of DKK -2,004 million (2016: DKK -2,289 million).
Interest on financial assets subject to individual impairment is recognised on the basis of the impaired value and amounted to DKK 982 million (2016: DKK 1,053 million).
6. Fee income and expenses
Fee income and expenses are broken down into fees generated by activities and fees generated by portfolios. Fees generated by activities comprises fees for the execution of one-off transactions. Fees generated by portfolios comprises recurring fees from the product portfolio.
Accounting policy
Income from and expenses for services provided over a period of time, such as guarantee commissions and investment management fees, are accrued over the period. Transaction fees, such as brokerage and custody fees, are recognised on settlement of the individual transaction. Fees that form an integral part of the effective rates of interest on loans and deposits recognised at amortised cost, such as origination fees, are carried under Interest income and Interest expenses. However, similar fees related to Loans at fair value are recognised when the loan is established and are carried under Fee income.
2017 2016
1,939 1,801
2,764 2,411
(a) Fee income (DKK millions)
Financing (loans and guarantees) Investment (securities trading and advisory services) Services (insurance and foreign exchange trading) 585 528
Fees generated by activities 5,288 4,740
Financing (guarantees) 670 643
Investment (asset management and custody services) 7,655 7,012
Services (payment services and cards) 3,959 3,488
Fees generated by portfolios 12,284 11,143
Total 17,572 15,883
(b) Fee expenses (DKK millions) 2017 2016
Financing (property valuation) 173 210
Investment (securities trading and advisory services) 844 701
Services (referrals) 75 62
Fees generated by activities 1,093 973
Financing (guarantees) 20 21
Investment (asset management and custody services) 2,684 2,283
Services (payment services and cards) 2,952 2,459
Fees generated by portfolios 5,655 4,763
Total 6,749 5,736
Fees for financial instruments not recognised at fair value, such as loans and issued bonds, are recognised as financing fee income or expenses. Such income amounted to DKK 2,007 million (2016: DKK 1,979 million), whereas expenses amounted to DKK 24 million (2016: DKK 21 million).

Danske Bank / Annual Report 201774
74 Danske Bank / Annual Report 2017
Notes – Danske Bank Group
7. Income from holdings in associates and Other income
Income from associates includes the Group’s proportionate share of the net profit or loss of and any gain or loss on the sale of associated companies. Other income includes rental income and lease payments under operating leases, fair value adjustments of investment property, amounts received on the sale of lease assets and gains and losses on the sale of other tangible assets, such as domicile and investment properties.
Accounting policy
Income from lease assets and investment property
Income from lease assets and investment property includes income from assets let under operating leases. Income is recognised on a straight line basis over the period of the lease term. The accounting policy for lease assets and investment property is further described in note 22.
Income from real-estate brokerage
Income from real-estate brokerage consists of real estate agent fees that are recognised as income when the real estate is sold, and franchise fees received from real-estate brokers that are recognised on a straight line basis over the term of the franchise agreement.
Income from associates
Income from associates is described under the relevant balance sheet line item and notes 22 and 36 provide more information. The gain or loss on the sale of associates is the difference between the selling price and the carrying amount, including goodwill , if any, of such sale.
(a) Income from holdings in associates
Fair value adjustment of associates held by the Group’s insurance business (which is treated as a venture capital organisatio n) is recognised under Net trading income. In 2016, income from holdings in associates included a realised gain of DKK 0.4 billion from the sale of the holding in Danmarks Skibskredit A/S.
2017 2016
3,834 3,481
669 574
(b) Other income (DKK millions)
Income from lease assets and investment property Income from real-estate brokerage Other income 678 1,951
Total 5,181 6,006
In 2016, other income of DKK 2.0 billion included a gain of DKK 1.1 billion on the sale of domicile properties.

Danske Bank / Annual Report 2017 75
Danske Bank / Annual Report 2017 75
Notes – Danske Bank Group
8. Insurance contracts
Insurance contracts are contracts entered into by Danica Pension that entail significant insurance risks or entitle policyholders to bonus (discretionary participation features). The deposit component of insurance contracts is not unbundled but recognised together with the insurance component. Hence, premiums and insurance benefits related to the deposit component are recognised in the income statement rather than directly in the balance sheet.
Contracts that do not entail significant insurance risk are recognised as investment contracts with premiums recognised directly in the balance sheet. Note 16 provides more information on the accounting for investment contracts.
Accounting policy
Net premiums
Net premiums includes regular and single premiums on insurance contracts, which are recognised in the income statement at their due dates. Reinsurance premiums paid are deducted from premiums received,
Net insurance benefits
Net insurance benefits includes benefits disbursed to policyholders. The item also includes adjustments to outstanding claims provisions, life insurance provisions and the profit margin, including the attribution of regular and single premiums to the individual insurance contracts. Additional provisions for benefit guarantees are recognised under Net trading income, however, the benefits are recognised net of reinsurance.
2017 2016
1,883 1,871
560 1,203
10,246 9,596
12,004 10,692
1,391 1,387
-96 -117
(a) Net premiums (DKK millions)
Regular premiums, life insurance Single premiums, life insurance Regular premiums, unit-linked products Single premiums, unit-linked products Premiums, health and accident insurance Reinsurance premiums paid Change in unearned premiums provisions -53 54
Total 25,935 24,686
2017 2016
21,310 21,000
-68 -119
1,645 1,570
-134 -53
18,330 14,876
(b) Net insurance benefits (DKK millions)
Benefits paid Reinsurers' share received Claims and bonuses paid Change in outstanding claims provisions Change in life insurance provisions Change in profit margin 36 395
Total 41,119 37,669
(c) Further explanation
Insurance premiums received are carried under Net premiums, whereas benefits paid and changes to insurance obligations, including an increase in provisions due to premiums received during the year, are carried under Net insurance benefits. Net premiums and insurance benefits do not include the entire income stream related to insurance contracts. Changes to provisions caused by fair value adjustment of expected payments are carried under Net trading income. The return on assets earmarked for insurance contracts is carried under Net interest income and Net trading income. The net interest income and trading income disclosed in note 5 contains DKK 15,725 million relating to insurance contracts (2016: DKK 14,157 million). A further DKK 1,811 million (2016: DKK 1,459 million) relate to net interest income on deposits and own issued bonds and fair value adjustments that are eliminated in the consolidated financial statements.

Danske Bank / Annual Report 201776
76 Danske Bank / Annual Report 2017
Notes – Danske Bank Group
9. Operating expenses
Operating expenses includes staff costs, administrative expenses, depreciation, amortisation and impairment charges on tangible and intangible assets. Note 18 provides more information on intangible assets.
Accounting policy
Staff costs
This item includes salaries, performance-based pay, expenses for share-based payments, holiday allowances, anniversary bonuses, pension costs and other remuneration. Salaries and other remuneration that the Group expects to pay are expensed when the employees render the services. Performance-based remuneration is expensed as it is earned.
Share-based payment
Part of the performance-based remuneration for the year is paid in the form of conditional shares. Rights to conditional shares vest up to four years after the grant date, provided that the employee, with the exception of retirement, has not resigned from the Group. In addition to this requirement, the vesting of rights is conditional on certain targets being met. The fair value of share-based payments at the grant date is expensed over the vesting period with the intrinsic value expensed in the year in which the share-based payments are earned, and the time value (if any) accrued over the remaining service period. Expenses are set off against shareholders’ equity. Subsequent fair value adjustments are not recognised in the income statement.
Pension obligations
The Group’s contributions to defined contribution pension plans are recognised in the income statement as they are earned by the employees. For defined benefit pension plans, the Group expenses the standard cost. Actuarial gains or losses as a result of the difference between expected trends in pension assets and benefits and actual trends are recognised under Other comprehensive income.
Amortisation, depreciation and impairment charges
In addition to amortisation, depreciation and impairment charges for intangible and tangible assets, the Group expenses the carrying amount of lease assets sold at the expiry of a lease agreement.
2017 2016
13,706 13,769
8,489 7,909
(a) Staff costs, administrative expenses, depreciations and impairment charges (DKK millions)
Staff costs Administrative expenses Amortisation/depreciation of intangible and tangible assets 3,681 2,969
Total 25,877 24,647
Staff costs 2017 2016
Salaries 10,357 10,305
Share-based payments 150 171
Pension, defined contribution plans 878 1,215
Pension, defined benefit plans 228 137
Severance payments 292 282
Financial services employer tax and social security costs 1,802 1,659
Total 13,706 13,769
Remuneration Report 2017, which is expected to be published on 8 March 2018 at danskebank.com/remuneration, provides a detailed description of remuneration paid.
Total salary costs amounted to DKK 11.9 billion (2016: DKK 12.1 billion), with variable remuneration accounting for 8.0% of this amount (2016: 7.0%). Note 33 provides more information on share-based payments.

Danske Bank / Annual Report 2017 77
Danske Bank / Annual Report 2017 77
Notes – Danske Bank Group
9. Operating expenses continued
(b) Pension plans
Most of the Group’s pension plans are defined contribution plans under which the Group pays contributions to insurance companies, including Danica Pension. Such payments are expensed regularly. The Group has, to a minor extent, entered into defined benefit pension plans. Under defined benefit pension plans, the Group is under an obligation to pay defined future benefits from the time of retirement. Defined benefit plans are typically funded by ordinary contributions made by employers and employees to separate pension funds investing the contributions on behalf of the members to fund future pension obligations. Defined benefit plans in Northern Ireland and Ireland account for most of the Group’s obligations under such plans, but the Group also has a small number of defined benefit plans in Denmark and Sweden. The plans in these countries do not accept new members and, for most of the plans, contributions payable by existing members have been discontinued.
At 31 December 2017, the net present value of pension obligations was DKK 16,821 million (31 December 2016: DKK 18,246 million), and the fair value of plan assets was DKK 18,025 million (31 December 2016: DKK 18,791 million). The present value of obligations under defined benefit plans less the fair value of pension assets is recognised for each plan under Other assets and Other liabilities. Pension plan net assets amounted to DKK 1,905 million (2016: DKK 1,350 million) and pension plan net liabilities amounted to DKK 701 million (2016: DKK 805).
During 2017, the defined benefit plan at the Northern Ireland unit was amended to the effect that no benefits will accrue from the third quarter of 2018. Going forward, staff covered by the current plan will be able to participate in a defined contribution plan (master trust) to which Danske Bank pays fixed cash contributions. The amendment led to a curtailment gain of DKK 339 million, which is recognised in the income statement as a past service cost. In addition, the Group purchased a bulk annuity buy-in policy covering pension liabilities of DKK 1,992 million in relation to the defined benefit plan in Ireland. This led to a loss on plan assets of DKK 435 million, which is recognised in Other comprehensive income, as the liabilities under IFRS were lower than the premium paid. During 2016, part of the pension risk was transferred to Danica Pension in the form of a qualifying annuity covering pension liabilities of DKK 773 million (2016: DKK 804 million). The annuity represents a plan asset and is eliminated in the financial statements of Danske Bank Group. The Group recognises the service cost and interest on the net defined benefit asset/liability in the income statement, whereas actuarial gains or losses are recognised under Other comprehensive income.
The calculation of the net obligation is based on valuations made by external actuaries. These valuations rely on assumptions about a number of variables, including discount and mortality rates and salary increases. The measurement of the net obligation is particularly sensitive to changes in the discount rate. The discount rate is determined by reference to yields on high-quality corporate bonds with terms matching the terms of the pension obligations. If the discount rate was lowered half a percentage point, the gross pension obligation would increase DKK 1.6 billion (2016: DKK 1.8 billion). The amount would be recognised under Other comprehensive income.

Danske Bank / Annual Report 201778
78 Danske Bank / Annual Report 2017
Notes – Danske Bank Group
2017 2016
18 17
5 6
- -
10. Audit fees
Audit fees (DKK millions)
Audit firms appointed by the general meeting Fees for statutory audit of the consolidated and parent company financial statements Fees for other assurance engagements Fees for tax advisory services Fees for other services 5 15
Total 28 38
Fees for non-audit services provided by Deloitte Statsautoriseret Revisionspartnerselskab for the Group amounted to DKK 5 million and cover various
assurance reports, review procedures with respect to recognition of profit in core capital, and other general accounting and tax advisory services, including
due diligence service.
11. Loan impairment charges
Loan impairment charges include losses on and impairment charges against loans, provisions for loan commitments and guarantees as well as fair value adjustments of the credit risk on loans measured at fair value.
The item also includes impairment charges and realised gains and losses on assets (such as tangible assets and group undertakings) taken over by the Group under non-performing loan agreements. Further, the item includes external costs directly attributable to the collection of amounts due under non-performing loans, such as legal costs.
Accounting policy
The accounting policy for when a loan impairment charge is recognised and how the charge is determined is described under the relevant balance sheet line items, Notes 14, 15 and 22 provide more information.
2017 2016
148 182
-1,802 -318
-27 13
Loan Impairment charges
(DKK millions)
Due from credit institutions and central banks Loans at amortised cost Loans at fair value Loan commitments and guarantees etc, 99 -45
Total -1,582 -168
2017 2016
4,745 6,783
5,654 6,269
334 892
706 1,378
(DKK millions)
New and increased impairment charges Reversals of impairment charges Write-offs charged directly to income statement Received on claims previously written off Interest income, effective interest method -301 -196
Total -1,582 -168

Danske Bank / Annual Report 2017 79
Danske Bank / Annual Report 2017 79
Notes – Danske Bank Group
12. Trading portfolio assets and liabilities
Trading portfolio assets comprises the equities and bonds held by the Group’s trading departments at Corporates & Institutions and all derivatives with positive fair value. Trading portfolio liabilities consists of derivatives with negative fair value and obligations to deliver securities (obligations to repurchase securities).
Accounting policy
The trading portfolio is recognised at fair value through profit or loss. Realised and unrealised capital gains and losses and dividends are recognised in the income statement under Net trading income. Fair value is the amount for which a financial asset can be sold or a financial liability be transferred to a knowledgeable, willing third party. Note 30 provides information about fair value measurement and fair value adjustments.
The Group uses fair value hedge accounting when the criteria in IAS 39 are fulfilled. The derivatives used as hedging instruments are presented in the balance sheet together with other derivatives.
2017 2016
256,891 326,433
173,580 161,698
- 182
18,624 20,934
(a) Trading portfolio assets (DKK millions)
Derivatives with positive fair value Listed bonds Unlisted bonds Listed shares Unlisted shares 197 432
Total 449,292 509,679
(b )Trading portfolio liabilities (DKK millions)
244,688 328,080 Derivatives with negative fair value Obligations to repurchase securities 155,908 150,221
Total 400,596 478,301
2017 2016

Danske Bank / Annual Report 201780
80 Danske Bank / Annual Report 2017
Notes – Danske Bank Group
12. Trading portfolio assets and liabilities continued
(c) Explanation of derivatives
The Group’s activities in the financial markets include trading in derivatives. Derivatives are financial instruments whose value depends on the value of an underlying instrument or index etc. Derivatives can be used to manage market risk exposure, for example. The Group trades a considerable volume of the most commonly used interest rate, currency and equity derivatives, including
swaps forwards and futures options
Furthermore, the Group trades a limited number of swaps whose value depends on developments in specific credit or commodity risks, or inflation indices.
The Group trades derivatives as part of servicing customers’ needs as individual transactions or as integral parts of other services, such as the issuance of bonds with yields that depend on developments in equity or currency indices. The Group also uses derivatives to manage the Group’s own exposure to foreign exchange, interest rate, equity market and credit risks. The risk management notes provide additional information about the Group’s risk management policy, Corporates & Institutions is responsible for the day-to-day management and hedging of the Group’s market risks.
Derivatives are recognised and measured at fair value. Some of the Group’s bank loans, deposits, issued bonds, etc, carry fixed rates. Generally, such fixed-rate items are recognised at amortised cost. Further, the Group classifies certain bonds as available-for-sale financial assets. Unrealised value adjustments of such bonds are recognised under Other comprehensive income. The Group uses fair value hedge accounting, if the interest rate risk on fixed-rate financial assets and liabilities or bonds available for sale is hedged by derivatives.
Derivatives 2017 2016 2016
(DKK millions) Notional amount
Positive fair value
Negative fair value
Notional amount
Positive fair value
Negative fair value
Currency contracts Forwards and swaps 9,675,821 85,366 87,229 6,565,673 105,878 124,587
Options 147,021 719 863 192,096 1,132 1,083
Interest rate contracts Forwards/swaps/FRAs 19,275,318 123,957 117,609 10,585,473 164,474 159,944
Options 2,336,200 28,099 26,841 2,121,485 35,164 32,344
Equity contracts Forwards 161,671 2,872 2,938 131,551 864 798
Options 205,845 4,830 5,335 171,465 4,390 4,752
Other contracts Commodity contracts 32,225 1,728 1,683 41,075 2,106 2,057
Credit derivatives bought 23,990 201 1,126 20,832 133 752
Credit derivatives sold 10,825 669 156 10,605 518 117
Total derivatives held for trading purposes 248,441 243,779 314,659 326,433
Hedging derivatives Currency contracts 59,851 16 38 98,460 453 56
Interest rate contracts 407,770 8,434 871 494,432 11,320 1,590
Total derivatives 256,891 244,688 326,433 328,080
Notional amounts and positive and negative fair values of derivatives are offset if certain criteria are fulfilled. Note 29 provides more information.

Danske Bank / Annual Report 2017 81
Danske Bank / Annual Report 2017 81
Notes – Danske Bank Group
12. Trading portfolio assets and liabilities continued
(d) Explanation of hedge accounting
Hedge of interest rate risk
The interest rate risk on bonds classified as hold-to-maturity and some fixed-rate loans extended by the Group is designated as a hedge of the interest rate risk on liabilities. The remaining interest rate risk on fixed-rate assets and liabilities is generally hedged by derivatives.
For hedged assets and liabilities to which a fixed rate of interest applies for a specified period of time starting at the commencement date of the agreement, future interest payments are divided into basic interest and a profit margin and into periods of time. By entering into swaps or forwards with matching payment profiles in the same currencies and for the same periods, the Group hedges the risk at portfolio level from the commencement date of the hedged items. The fair values of the hedged interest rate risk and the hedging derivatives are measured at frequent intervals to ensure that changes in the fair value of the hedged interest rate risk lie within a band of 80-125% of the changes in the fair value of the hedging derivatives. Portfolios of hedging derivatives are adjusted if necessary.
With effective hedging, the hedged interest rate risk on hedged assets and liabilities is measured at fair value and recognised as a value adjustment of the hedged items. Value adjustments are carried in the income statement under Net trading income. Any ineffective portion of a hedge that lies within the range for effective hedging is therefore also included under Net trading income.
At the end of 2017, the carrying amounts of effectively hedged fixed-rate financial assets and liabilities were DKK 57,288 million (31 December 2016: DKK 57,131 million) and DKK 384,045 million (31 December 2016: DKK 495,970 million), respectively. The table below shows the value adjustments of these assets and liabilities and the hedging derivatives. The value adjustments have been recognised in the income statement under Net trading income.
2017 2016
-2 -11
-360 115
-43 8
Effect of interest rate hedging on profit (DKK millions)
Effect of fixed-rate asset hedging on profit Hedged amounts due from credit institutions Hedged loans Hedged bonds available for sale Hedging derivatives 407 -107
Total 1 5
Effect of fixed-rate liability hedging on profit Hedged amounts due to credit institutions 32 30
Hedged deposits 38 40
Hedged issued bonds 3,380 1,809
Hedged subordinated debt 571 723
Hedging derivatives -4,015 -2,604
Total 6 -1
Hedge of foreign exchange risk of net investments in foreign entities
The Group hedges the foreign exchange risk of net investments in branches and subsidiaries outside Denmark by establishing financing arrangements in the matching currencies. The Group does not hedge the expected financial results of units outside Denmark or other future transactions. The foreign exchange adjustments of the investments are recognised under Other comprehensive income together with the foreign exchange adjustments of the financing arrangements designated as hedging of exchange rate fluctuations. The statement of comprehensive income shows the translation amounts. At the end of 2017, the carrying amount of financing arrangements in foreign currency used to hedge net investments in units outside Denmark amounted to DKK 39,818 million (31 December 2016: DKK 38,404 million).

Danske Bank / Annual Report 201782
82 Danske Bank / Annual Report 2017
Notes – Danske Bank Group
13. Investment securities
Investment securities consists of financial assets which, under the fair value option, are designated at fair value through profit or loss, available-for-sale financial assets and hold-to-maturity financial assets.
Investment securities includes the liquidity portfolio managed by Group Treasury. The liquidity portfolio is recognised at fair value through the use of the fair value option or is part of the hold-to-maturity portfolio or the available-for-sale portfolio.
Accounting policy
Financial assets designated at fair value
Financial assets designated at fair value include securities that are managed on a fair value basis with no short-term profit taking. Realised and unrealised capital gains and losses and dividends are carried in the income statement under Net trading income.
Available-for-sale financial assets
This category comprises bonds only. The bonds are measured at fair value under Other comprehensive income. Unrealised value adjustments of hedged interest rate risks that qualify for fair value hedge accounting and impairment charges are, however, recognised under Net trading income. The impairment charge equals the difference between the fair value at the time of calculation and amortised cost. If the fair value subsequently rises, and the increase is attributable to one or more events that have occurred after the impairment charge was recognised, the Group reverses the charge in the income statement. The Group recognises interest income according to the effective interest method, including amortisation of the difference between cost and the redemption value over the term to maturity of the bonds. When bonds are sold, the Group reclassifies unrealised value adjustments recognised under Other comprehensive income under Net trading income in the income statement.
Hold-to-maturity financial assets
Hold-to-maturity financial assets consists of bonds with quoted prices in an active market held for the purpose of generating a return until maturity. The bonds are measured at amortised cost. Interest income is recognised according to the effective interest method, including amortisation of the difference between cost and the redemption value over the term to maturity of the bonds. Fixed-rate bonds are not hedged.
2017 2016
97,599 137,490
- -
63 67
(a) Investment securities (DKK millions)
Financial assets at fair value through profit or loss Listed bonds Unlisted bonds Listed shares Unlisted shares 1,396 1,673
Total financial assets designated at fair value through profit or loss 99,058 139,230
Available-for-sale financial assets Listed bonds 78,863 70,727
Total available-for-sale financial assets 78,863 70,727
Total at fair value 177,921 209,957
Hold-to-maturity financial assets Listed bonds 146,697 133,379
Unlisted bonds - -
Total investment securities 324,618 343,337

Danske Bank / Annual Report 2017 83
Danske Bank / Annual Report 2017 83
Notes – Danske Bank Group
13. Investment securities continued
(b) Further explanation
Investment securities consists of the liquidity portfolio held by Group Treasury. The liquidity portfolio is incorporated into balance sheet management to optimise the balance sheet composition.
Financial assets designated at fair value through profit or loss
These include the part of the liquidity portfolio that is actively traded although less frequently than what is required to be classified as a held-for-trading portfolio. These bonds are designated at fair value. The portfolio comprises primarily Danish mortgage bonds.
Available-for-sale financial assets During 2016, Group Treasury acquired bonds for an available-for-sale portfolio. The interest rate risk on this portfolio has not been hedged. The portfolio comprises primarily highly rated covered, sovereign, supranational and agency bonds.
Further, the Group has an available-for-sale bond portfolio that was reclassified from the held-for-trading category in 2008 when the IASB changed the reclassification provisions of IAS 39 in response to the significant distortion of the pricing of bonds at the time. For the part of the portfolio sold in 2016, the Group realised value adjustments of DKK 74 million (2016: DKK 10 million) that were reclassified from Other comprehensive income to the income statement. The portfolio comprises primarily Danish mortgage bonds. Some 99% of the portfolio is rated AA or higher (2016: 99%), while the remaining portfolio has investment grade ratings. In 2017, the Group recognised unrealised value adjustments of the reclassified bonds in the amount of DKK -42 million in the income statement, corresponding to the part of the interest rate risk that is hedged by derivatives (2016: DKK -28 million). The Group also recognised unrealised value adjustments of DKK 17 million (2016: DKK 259 million) under Other comprehensive income that would have been recognised in the income statement if reclassification had not taken place. The Group recognised interest income of DKK 10 million (2016: DKK 125 million) on the reclassified bonds.
Hold-to-maturity financial assets Hold-to-maturity financial assets consists of bonds with quoted prices in an active market held for the purpose of generating a return until maturity.
The bonds are primarily Danish mortgage bonds, government bonds and government-guaranteed bonds. Some 98% of the portfolio is rated AA or higher (2016: 98%), while the remaining portfolio has investment grade ratings.
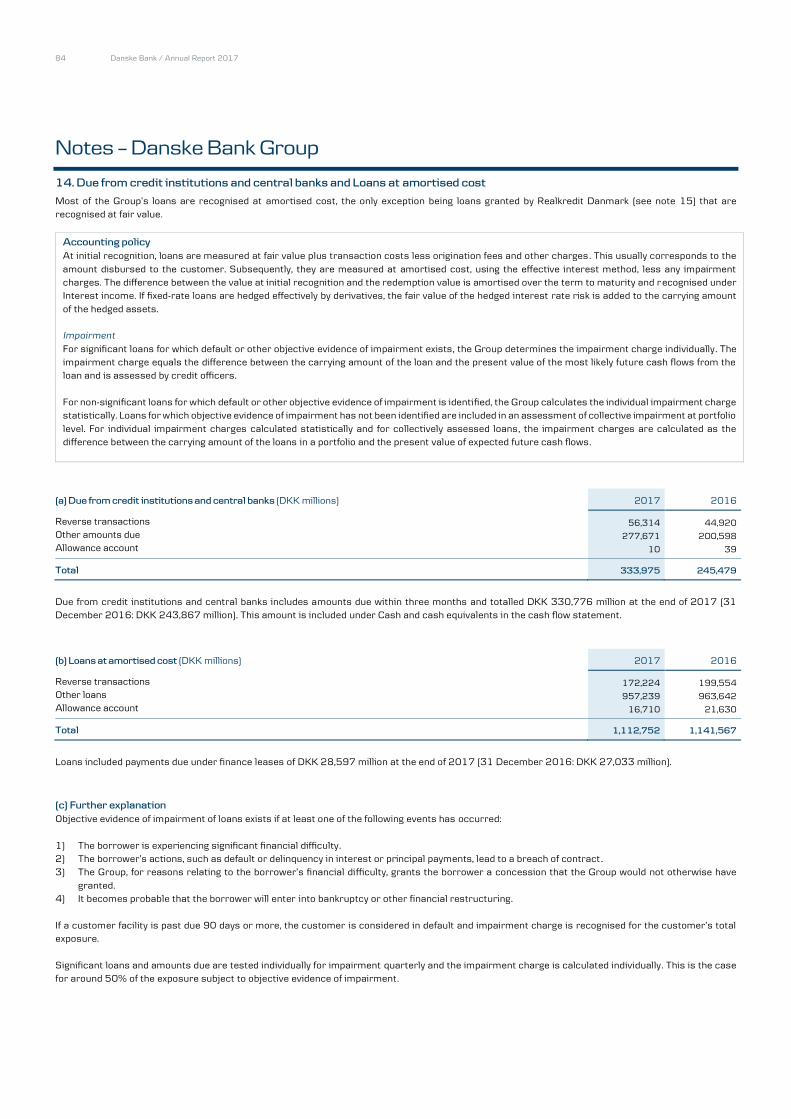
Danske Bank / Annual Report 201784
84 Danske Bank / Annual Report 2017
Notes – Danske Bank Group
14. Due from credit institutions and central banks and Loans at amortised cost
Most of the Group’s loans are recognised at amortised cost, the only exception being loans granted by Realkredit Danmark (see note 15) that are recognised at fair value.
Accounting policy
At initial recognition, loans are measured at fair value plus transaction costs less origination fees and other charges. This usually corresponds to the amount disbursed to the customer. Subsequently, they are measured at amortised cost, using the effective interest method, less any impairment charges. The difference between the value at initial recognition and the redemption value is amortised over the term to maturity and recognised under Interest income. If fixed-rate loans are hedged effectively by derivatives, the fair value of the hedged interest rate risk is added to the carrying amount of the hedged assets.
Impairment
For significant loans for which default or other objective evidence of impairment exists, the Group determines the impairment charge individually. The impairment charge equals the difference between the carrying amount of the loan and the present value of the most likely future cash flows from the loan and is assessed by credit officers.
For non-significant loans for which default or other objective evidence of impairment is identified, the Group calculates the individual impairment charge statistically. Loans for which objective evidence of impairment has not been identified are included in an assessment of collective impairment at portfolio level. For individual impairment charges calculated statistically and for collectively assessed loans, the impairment charges are calculated as the difference between the carrying amount of the loans in a portfolio and the present value of expected future cash flows.
2017 2016
56,314 44,920
277,671 200,598
(a) Due from credit institutions and central banks (DKK millions)
Reverse transactions Other amounts due Allowance account 10 39
Total 333,975 245,479
Due from credit institutions and central banks includes amounts due within three months and totalled DKK 330,776 million at the end of 2017 (31 December 2016: DKK 243,867 million). This amount is included under Cash and cash equivalents in the cash flow statement.
2017 2016
172,224 199,554
957,239 963,642
(b) Loans at amortised cost (DKK millions)
Reverse transactions Other loans Allowance account 16,710 21,630
Total 1,112,752 1,141,567
Loans included payments due under finance leases of DKK 28,597 million at the end of 2017 (31 December 2016: DKK 27,033 million).
(c) Further explanation
Objective evidence of impairment of loans exists if at least one of the following events has occurred:
1) The borrower is experiencing significant financial difficulty. 2) The borrower’s actions, such as default or delinquency in interest or principal payments, lead to a breach of contract . 3) The Group, for reasons relating to the borrower’s financial difficulty, grants the borrower a concession that the Group would not otherwise have
granted. 4) It becomes probable that the borrower will enter into bankruptcy or other financial restructuring.
If a customer facility is past due 90 days or more, the customer is considered in default and impairment charge is recognised for the customer’s total exposure.
Significant loans and amounts due are tested individually for impairment quarterly and the impairment charge is calculated individually. This is the case for around 50% of the exposure subject to objective evidence of impairment.

Danske Bank / Annual Report 2017 85
Danske Bank / Annual Report 2017 85
Notes – Danske Bank Group
14. Due from credit institutions and central banks and Loans at amortised cost continuedThe impairment charge equals the difference between the carrying amount of the loan and the present value of the most likely future cash flows from the loan and is assessed by credit officers. The present value of fixed-rate loans is calculated at the original effective interest rate, whereas the present value of loans with a variable rate of interest is calculated at the current effective interest rate.
The customer’s debt is written down to the amount that the borrower is expected to be able to repay after financial restructuring. If financial restructuring is not possible, the debt is written down to the estimated recoverable amount in the event of bankruptcy, which depends, among other factors, on the value of the collateral received by the Group. If the borrower’s ability to repay depends significantly on the assets that have been provided as collateral (asset financing), the customer’s debt is written down to the fair value of the collateral . The impairment charges are therefore sensitive to changes to the estimated value of collateral received. If the value of collateral decreased 10%, individual impairment charges would increase by about DKK 2.1 billion (2016: DKK 2.4 billion).
Loans without objective evidence of impairment are included in a collective assessment of the need for impairment charges. The collective assessment also includes customers with objective evidence of impairment, but without a need for impairment.
Collective impairment charges are calculated for loans with similar credit risk characteristics to recognise the losses that occur when the expected cash flow from a group of customers deteriorates, i,e, when an increase in credit risk is not accompanied by adjustments to the interest rate charged to the customer to reflect the increase in credit risk. A charge is therefore recognised for customers that have been downgraded without changes being made to the credit margin. Charges are based on expectations of future changes in customers’ rating classifications (which is called “migration”) over time, represented by the emergence period. If all business customers were downgraded one rating category, the collective impairment charge would increase about DKK 1.6 billion (2016: DKK 1.2 billion). The emergence period is assumed to be two years. If the emergence period is increased to three years, the collective impairment charge would increase DKK 0.1 billion (2016: DKK 0.1 billion).
When external market information indicates that an impairment event has occurred, even though it has not yet caused a change in rating, the Group registers an “early event” impairment charge. Early events represent an expected rating change because of deteriorating market conditions in an industry. If a rating downgrade does not occur as expected, the charge is reversed. A management judgement is therefore applied to adjust the collective impairment charge if the Group becomes aware of market conditions at the balance sheet date that are not fully reflected in the Group’s models. At end- 2017, such collective impairment charges amounted to DKK 2.8 billion (2016: DKK 3.3 billion).
Collective impairment charges are calculated as the difference between the carrying amount of the loans in the portfolio and the present value of expected future cash flows. The cash flows used to determine the present value of future cash flows are specified by means of parameters used for solvency calculations and historical loss data adjusted for use in the financial statements, for example. The adjustment reflects the loss identification period shown by the Group’s empirical data. This period is the period from the first significant downgrade to the determination of a loss at customer level.
Impairment charges for loans and guarantees are booked in an allowance account and set off against loans or recognised as provisions for guarantees. Impairment charges for loans are recognised under Loan impairment charges in the income statement. If subsequent events show that impairment is not permanent, charges are reversed.
Loans that are considered uncollectible are written off. Write-offs are debited to the allowance account. Loans are written off once the usual collection procedure has been completed and the loss on the individual loan can be calculated. If the full loss is not expected to be realised until after a number of years, for example in the event of administration of complex estates, a partial write-off is recognised, reflecting the Group’s claim less collateral, estimated dividend and other cash flows.
In accordance with the effective interest method, interest is recognised on the basis of the value of the loans less impairment charges. Consequently, part of the allowance account balance is set aside for future interest income.
(d) Reconciliation of total allowance account
The total allowance account below relates to the Due from credit institutions and central bank, Loans at amortised cost, Loans at fair value, and Loan commitments and guarantees balance sheet items.
2017 2016
26,156 31,413
4,745 6,783
5,654 6,269
3,589 4,870
-390 -326
(DKK millions)
Balance at 1 January New and increased impairment charges Reversals of impairment charges Write-offs debited to the allowance account Foreign currency translation Other items -519 -574
Balance at end of period 20,749 26,156

Danske Bank / Annual Report 201786
86 Danske Bank / Annual Report 2017
Notes – Danske Bank Group
15. Loans at fair value and bonds issued by Realkredit Danmark
Loans at fair value consists of loans granted by Realkredit Danmark under Danish mortgage finance law. The loans are funded by issuing listed mortgage bonds with matching terms. Borrowers may repay such loans by delivering the underlying bonds to Realkredit Danmark. The Group buys and sells bonds issued by Realkredit Danmark on an ongoing basis because such securities play a role in the Danish money market. If these loans and issued mortgage bonds were measured at amortised cost, the purchase and sale of own mortgage bonds would result in timing differences in the recognition of gains and losses, leading to an accounting mismatch. This is avoided by measuring both loans granted by Realkredit Danmark and bonds issued by Realkredit Danmark at fair value using the fair value option. Significant accounting choices in note 1(b) provide additional information.
Accounting policy
Loans granted and bonds issued are initially recognised at fair value and subsequently at fair value through profit or loss.
The fair value of the bonds issued by Realkredit Danmark is normally defined as their quoted market value. A small number of the issued bonds are illiquid, however, and the fair value of these bonds is calculated on the basis of a discounted cash flow valuation technique. The fair value of the loans is based on the fair value of the underlying bonds adjusted for changes in the fair value of the credit risk on borrowers.
Changes in fair value of credit risk
For loans granted to customers with objective evidence of impairment, such adjustment is made in accordance with principles similar to the principles for calculating individual impairment charges for loans at amortised cost. Note 14 provides more information. However, for discounting purposes, the current effective interest rate is used instead of the original effective interest rate.
A collective assessment also determines the need for adjustment to reflect changes in the fair value of the credit risk on the remaining portion of the portfolio of loans at fair value. No changes are made if it is possible to raise the administration margin on loans (credit margin) sufficiently to compensate for the higher credit risk and market risk premium on mortgage loans. If it is not possible to raise the administration margin sufficiently, or at all, a collective adjustment is made, reflecting trends in expected losses, unexpected losses (volatility) and the possibility of raising administration margins in the future. The expected future cash flows are discounted at the current market rate with the addition of a risk premium.
(a) Loans at fair value (DKK millions) 2017 2016
Nominal value 767,621 752,993
Fair value adjustment of underlying bonds 22,948 16,840
Adjustment for credit risk 3,347 3,830
Total 787,223 766,003
(b) Bonds issued by Realkredit Danmark (DKK millions)
855,232 887,737 Nominal value Fair value adjustment of funding of current loans 24,661 18,953
Holding of own mortgage bonds 121,519 179,958
Total 758,375 726,732
(c) Further explanation
The measurement of loans at fair value is based on the quoted price of the underlying Realkredit Danmark bonds that borrowers use to repay the loans. Changes in the market value of the bonds will therefore result in a corresponding change in the value of loans, and profit or loss will therefore not be affected by current market value changes in respect of the interest rate and the credit risk on the issued bonds. The value of the loans is affected by changes in the credit risk on the loans. In 2017, the Group reversed DKK 331 million regarding changes in the credit risk on loans at fair value (2016: expensed DKK 423 million). At the end of 2017, the accumulated changes in the credit risk amounted to DKK 3,347 million (31 December 2016: DKK 3,830 million).
The holding of own mortgage bonds includes pre-issued bonds of DKK 45 billion (2016: DKK 79 billion) used for FlexLån® refinancing in January 2018 and bonds of DKK 27 billion (2016: DKK 34 billion) that relate to investments under insurance contracts, pooled schemes and unit-linked investment contracts where most of the risk is assumed by customers and most of the return on the assets accrues to customers. The nominal value of bonds issued by Realkredit Danmark equals the amount to be redeemed on maturity.
Fair value adjustment for the credit risk on issued mortgage bonds is calculated on the basis of the option-adjusted spread (OAS) to government bond yields or, for variable-rate loans, the swap rate. The calculation incorporates maturity, nominal holdings and OAS sensitivity. As a number of estimates are made, the calculation is subject to uncertainty.

Danske Bank / Annual Report 2017 87
Danske Bank / Annual Report 2017 87
Notes – Danske Bank Group
15. Loans at fair value and bonds issued by Realkredit Danmark continued
In 2017, the Danish mortgage bond yield spread narrowed, and the fair value of issued mortgage bonds thus increased about DKK 7.1 billion. In 2016, the Danish mortgage bond yield spread narrowed, and the fair value of issued mortgage bonds thus increased about DKK 5.6 billion. In comparison with the fair value measured at the time of issue of the bonds, the fair value had decreased about DKK 9 billion at the end of 2017 (31 December 2016: a decrease of about DKK 2 billion). Net profit and equity remain unaffected because the spread narrowing increased the fair value of mortgage loans correspondingly.
Fair value adjustment for the credit risk on issued mortgage bonds may also be calculated on the basis of changes in similar AAA-rated mortgage bonds offered by other Danish issuers. The market for such bonds is characterised by an absence of measurable price differences between bonds with similar characteristics from different issuers. Using this method, no fair value adjustment for credit risk in 2017 or the period since issuance has been required.
16. Assets and deposits under pooled schemes and unit-linked investment contracts
Assets and deposits under pooled schemes and unit-linked investment contracts comprises contributions to pooled schemes and unit-linked contracts defined as investment contracts. Assets include shares and bonds issued by the Group. Holdings of those assets are deducted from equity or eliminated. Consequently, the value of Deposits under pooled schemes and unit-linked investment contracts exceeds that of Assets under pooled schemes and unit-linked investment contracts.
Accounting policy
Assets earmarked for customer savings are measured at fair value and recognised under Assets under pooled schemes and unit-linked investment contracts. Deposits made by customers are recognised under Deposits under pooled schemes and unit-linked investment contracts. These deposits are measured at the value of savings, corresponding to the fair value of the assets.
Pooled schemes Unit-linked contracts Total
(DKK millions) 2017 2016 2017 2016 2017 2016
(a) Assets Bonds 25,322 19,319 3,140 2,654 28,462 21,973
Shares 13,684 8,347 27,617 3,958 41,301 12,305
Unit trust certificates 15,346 25,118 31,131 46,156 46,477 71,274
Other 664 528 2,997 338 3,661 866
Total 55,016 53,312 64,885 53,106 119,901 106,418
including own bonds 5,981 4,717 496 302 6,477 5,019
own shares 354 418 35 51 389 469
other intra-group balances 455 542 515 540 970 1,082
Total assets recognised in balance
sheet 48,226 47,635 63,839 52,213 112,065 99,848
(b) Deposits 55,016 53,312 64,885 53,106 119,901 106,418

Danske Bank / Annual Report 201788
88 Danske Bank / Annual Report 2017
Notes – Danske Bank Group
17. Assets and liabilities under insurance contracts
Assets under insurance contracts comprise assets earmarked for policyholders because most of the return accrues to policyholders. As the assets can be used only for payment of insurance liabilities, they are presented as a single line in the balance sheet. Liabilities under insurance contracts comprise primarily life insurance provisions regarding average rate insurance contracts and obligations for guaranteed benefits under unit-linked insurance contracts. Assets include shares and bonds issued by the Group. The holding of those assets are deducted from equity or eliminated. Consequently, the value of Liabilities under insurance contracts exceeds Assets under insurance contracts.
Accounting policy
Assets include financial assets, investment property, tangible assets and associates. The valuation technique used matches the Group’s accounting policy for similar assets with the exception of holdings in associates. Such holdings are treated as held by a venture capital organisation and measured at fair value.
Recognition of life insurance provisions is based on actuarial computations of the present value of expected benefits for each insurance contract. The accounting for insurance liabilities follows the requirements of the Danish FSA’s executive order on financial reports for insurance companies etc.
Life insurance provisions includes guaranteed benefits, a risk margin and individual bonus potentials.
Guaranteed benefits comprise obligations to pay guaranteed benefits to policyholders. These obligations are calculated as the present value of current guaranteed benefits plus the present value of expected future administrative expenses less the present value of future premiums. The actuarial computations rely on assumptions about a number of variables, including mortality and disability rates, and expected frequency of surrenders and conversions into paid-up policies. The risk margin is the expected market payment to an acquirer of a policy in return for assuming the risk that the payment obligations under the policy deviate from the present value of the best estimate of the cash flows. The risk margin is determined using a margin on mortality intensity and intensity relating to conversions into paid-up policies and surrenders.
Policyholders’ share of the technical basis for insurance policies with a bonus entitlement not yet allocated to the individual policyholder is recognised in the collective bonus potential. Individual bonus potentials are calculated for the portfolio of insurance policies with bonus entitlement as the difference between the value of a policyholder’s savings and the present value of guaranteed benefits under the policy.
Liabilities also depend on the discount yield curve, which is fixed on the basis of an EIOPA yield curve and a volatility adjustment, also set by EIOPA.
Provisions for unit-linked insurance contracts are measured at fair value on the basis of each contract’s share of the earmarked assets and of the benefits guaranteed in the contract.

Danske Bank / Annual Report 2017 89
Danske Bank / Annual Report 2017 89
Notes – Danske Bank Group
17. Assets and liabilities under insurance contracts continued
(a) Assets under insurance contracts (DKK millions) 2017 2016
Due from credit institutions 8,729 1,760
Investment securities 299,863 296,165
Holdings in associates 3,736 2,907
Investment property 23,069 22,915
Tangible assets 39 422
Reinsurers' share of provisions 117 149
Other assets 4,245 4,190
Total 339,798 328,508
including own bonds 27,463 28,884
own shares 440 312
other intra-group balances 15,028 13,914
Total assets 296,867 285,398
Investment securities under insurance contracts (DKK millions) 2017 2016
Listed bonds 128,303 125,636
Unlisted bonds 4,007 4,589
Listed shares 8,507 11,278
Unlisted shares 17,831 23,636
Unit trust certificates 125,467 115,511
Other securities 15,748 15,515
Total 299,863 296,165
2017 2016
135,888 142,633
6,197 6,352
144,692 126,490
1,873 2,028
(b) Liabilities under insurance contracts (DKK millions)
Life insurance provisions without collective bonus potential Collective bonus potential Provisions for unit-linked insurance contracts Profit margin Other technical provisions 10,244 10,177
Total provisions for insurance contracts 298,894 287,680
Other liabilities 39,363 39,544
Intra-group balances -15,531 -12,247
Total 322,726 314,977
Provisions for insurance contracts (DKK millions) 2017 2016
Balance at 1 January 287,680 275,289
Premiums paid 24,692 23,362
Benefits paid -21,310 -21,000
Interest added to policyholders' savings 11,057 5,143
Fair value adjustment 56 1,076
Foreign currency translation -2,730 -155
Change in collective bonus potential -158 588
Change in profit margin -155 395
Other changes -238 2,982
Balance at 31 December 298,893 287,680

Danske Bank / Annual Report 201790
90 Danske Bank / Annual Report 2017
Notes – Danske Bank Group
17. Assets and liabilities under insurance contracts continued
(c) Further explanation
The measurement of insurance liabilities is based on the requirements in the Danish FSA’s executive order on financial reports for insurance companies etc. and is harmonised to the measurement under the Solvency II framework.
Below the different components of liabilities related to insurance contracts are explained in detail.
Life insurance provisions
Life insurance provisions comprise obligations towards policyholders to pay guaranteed benefits pay bonuses over time on agreed premiums not yet due pay bonuses on premiums and other payments due include a risk margin
Recognition of life insurance provisions is based on actuarial computations of the present value of expected future benefits for each insurance contract using the discount rate at the balance sheet date. These computations rely on assumptions about a number of variables, including mortality and disability rates and the expected frequency of surrenders and conversions into paid-up policies. Estimates of future mortality rates are based on Danish FSA benchmarks, while other estimates are based on empirical data from Danica Pension’s own portfolio of insurance contracts. Estimates are updated regularly. The life insurance provisions also include a risk margin. Obligations for guaranteed benefits are calculated as the present value of current guaranteed benefits plus the present value of expected future administrative expenses less the present value of future premiums.
Insurance obligations are calculated by discounting the expected cash flows using a discount yield curve and a volatility adjustment, both defined by EIOPA as part of the Solvency II rules.
Collective bonus potential
Provisions for the collective bonus potential is the policyholders’ part of the value of the bonus entitlement not yet allocated to the individual policyholders.
Provisions for unit-linked insurance contracts
Provisions are measured at fair value on the basis of each contract’s share of the earmarked assets and of the benefits guaranteed in the contract.
Profit margin
The profit margin is the present value of the future profit on contracts expected to be recognised in the income statement concurrently with the provision of insurance cover and any other benefits under the contract.
Other technical provisions
Other technical provisions includes outstanding claims provisions for non-life insurance contracts, unearned premiums provisions, a risk margin for non-life insurance contracts and provisions for bonuses and premium discounts.
Other liabilities
Other liabilities includes the portion of Danica Pension’s other liabilities assumed by customers. Other types of liabilities are measured in accordance with the Group’s accounting policies for such liability types.

Danske Bank / Annual Report 2017 91
Danske Bank / Annual Report 2017 91
Notes – Danske Bank Group
18. Intangible assets
Intangible assets consist of goodwill taken over on the acquisition of undertakings. Further, acquired and internally developed software is recognised as an asset if certain criteria are fulfilled.
In 2017 and 2016, the Group did not make any acquisitions of undertakings, and no impairment charges on goodwill have been recognised.
Accounting policy
Goodwill
Goodwill arises on the acquisition of an undertaking and is calculated as the difference between the cost (until 1 January 2010 including direct transaction costs) of the undertaking and the fair value of its net assets, including contingent liabilities, at the time of acquisition. Goodwill is allocated to cash-generating units at the level at which management monitors the investment.
Goodwill is not amortised; instead, each cash-generating unit is tested for impairment once a year, or more frequently if indications of impairment exist. Goodwill is written down to its recoverable amount through profit and loss if the carrying amount of the net assets of the cash-generating unit exceeds the higher of the assets’ fair value less costs to sell and their value in use, which equals the present value of the future cash flows expected from the unit.
Goodwill on associates is recognised under Holdings in associates.
Software
Identifiable intangible assets taken over on the acquisition of undertakings, such as customer relations, are measured at their fair value at the time of acquisition. Software acquired is measured at cost, including expenses incurred to make a software application ready for use. Software acquired is amortised over its expected useful life, usually three years, according to the straight-line method.
Software developed by the Group is recognised as an asset if the cost of development is reliably measurable and analysis show that future earnings from using the individual software applications exceed the cost. Cost includes expenses incurred to make a software application ready for use. Once a software application has been developed, the cost is amortised over its expected useful life, usually three years, according to the straight-line method. The cost of development consists primarily of direct remuneration and other directly attributable development costs. Costs incurred in the planning phase are not included but are expensed when incurred.
Software is tested for impairment if indications of impairment exist and is written down to its value in use.
(a) Intangible assets (DKK millions) 2017 2016
Goodwill 5,347 5,349
Software, acquired or internally developed 1,830 1,441
Total 7,177 6,790
In 2017, the Group recognised software development costs of DKK 878 million as an asset (2016: DKK 673 million) and expensed DKK 2,220 million (2016: DKK 1,776 million).
(b) Further explanation of impairment testing of goodwill
The Group’s goodwill is tested for impairment at least once a year by testing at the level of identifiable cash-generating units to which goodwill have been allocated. Further, if goodwill in a cash-generating unit is fully impaired a further impairment loss is recognised as an impairment loss on intangible or tangible assets, if any.
The impairment tests conducted in 2017 and 2016 did not reveal any impairment loss.

Danske Bank / Annual Report 201792
92 Danske Bank / Annual Report 2017
Notes – Danske Bank Group
18. Intangible assets continued
1 January 2016 31 December
2016 31 December
2017
(DKK millions) Goodwill
Foreign currency
translation Goodwill
Foreign currency
translation Goodwill
C&I, General Banking 507 - 507 1 508
C&I, FICC and Capital Markets 2,905 -12 2,893 4 2,897
Wealth Management, Danske Capital 1,813 -7 1,806 3 1,809
Others 138 5 143 -10 133
Total 5,363 -14 5,349 -2 5,347
Model applied in the goodwill impairment tests for 2017 and 2016 The impairment test compares the recoverable amount and the carrying amount for each cash-generating unit. The recoverable amount is represented by the present value of expected future cash flows (value in use). The special debt structure of financial institutions requires the use of a discounted dividend (equity) model to calculate the present value of expected future cash flows, as the interest on lending and borrowings are included as part of the cash flows.
The carrying amount for each cash-generating unit is the aggregate of the cash-generating unit’s goodwill and allocated capital. The cash-generating unit’s allocated capital is derived using the Group’s capital allocation framework. The capital framework is based on a regulatory approach to identify the individual business unit’s capital consumption and is in accordance with the Group’s capital targets.
For each cash generating unit, the expected future cash flow is based on approved strategies and earnings estimates for the budget period representing the first five years. For the terminal period, the steady state normalised level of earnings (expected dividend) is expected to grow at a constant growth rate equal to expected real GDP growth. Cash flow estimates are post-tax, and the risks of the individual cash-generating units are reflected in the estimated earnings. Hence, the risk-adjusted cash flows carry a similar risk profile. The estimated cash flows are discounted at the Group’s risk-adjusted required rates of return post-tax.
Cash generating units with goodwill
Corporates & Institutions, General Banking
General Banking (formerly Corporate & Institutional Banking (CIB)) was established as a separate unit at the beginning of 2011, resulting in reallocation of goodwill to the unit. As a result of the new organisational structure in 2012, General Banking became part of Corporates & Institutions.
Corporates & Institutions, FICC and Capital Markets
The trading activities of Sampo Bank were incorporated into the business structure of Danske Bank Markets. With the acquisition, the Group strengthened its competitive position within trading activities. The integration process and the budgets and business plans confirmed the financial assumptions on which the Group based its acquisition. As a result of the new organisational structure in 2012, Danske Bank Markets became part of Corporates & Institutions.
Wealth Management, Danske Capital
The wealth management activities of Sampo Bank were incorporated into the business structure of Danske Capital in 2007. In addition to the acquisition of Sampo Bank, goodwill recognised by Danske Capital is attributable to a number of minor acquisitions. With the acquisition of Sampo Bank, the Group strengthened its competitive position within asset management in Finland. As a result of the new organisational structure implemented in 2016, Danske Capital became part of Wealth Management.
Key assumptions for goodwill impairment tests Discount rate
The discount rate used to calculate the present value of expected future cash flows is unchanged from the test in 2016 and is 9% after tax. The discount rate has been determined on the basis of the Capital Asset Pricing Model and comprises a risk-free interest rate, the market risk premium and a factor covering the systematic market risk (beta factor). The values for the risk-free interest rate, the market risk premium and the beta factor are determined using external sources of information. The Group applies the same discount rate to all cash-generating units as the risks of the individual cash-generating units are reflected in their estimated cash flows.

Danske Bank / Annual Report 2017 93
Danske Bank / Annual Report 2017 93
Notes – Danske Bank Group
18. Intangible assets continued
Cash flows in the terminal period
Cash flows in the terminal period reflect net earnings (dividend) in the preceding year growing at a constant rate. The growth estimates are determined on the basis of Danske Research’s forecasts of real GDP growth for the relevant markets. For Danske Capital, the assumed growth rate in the terminal period is 1.7% (2016: 1.7%) and for General Banking as well as for FICC and Capital Market, the rate is 1.7% (2016: 1.5%). Around 74% of the net present value of future cash flows is expected to be generated in the terminal period (2016: 75%).
Corporates & Institutions General Banking
Earnings are primarily affected by expectations for the interest level through the resulting effect on net interest income and net fee income and by expectations for credit losses.
The interest rate levels used in the impairment test are based on Danske Research’s expectations for developments in overnight money market interest rates. The interest rates are expected to be positive from 2020 and rising over the following years. When interest rate levels increase, the return on allocated capital will increase. Earnings on lending and deposits depend on the growth in lending and deposits and on changes in lending and deposit margins. Expectations for growth in lending and deposits reflect Danske Bank’s estimates/budgets for the first year and subsequently Danske Research’s forecasts for real GDP growth. As lending and deposit margins are assumed to be constant regardless of the interest rate level, earnings from lending and deposits are not particularly sensitive to changes in the interest rate level.
Fee income is expected to increase from the budget for 2018 with the growth in GDP over the following years.
The expectations for credit losses are for the budget period based on Danske Bank’s estimates/budgets for each year, reflecting historical data adjusted to reflect the current situation. Subsequently, expected credit losses are kept constant and reflect historical data for long-term annual credit losses.
C&I FICC and Capital Market
Earnings in FICC and Capital Market are expected to grow at a rate equal to Danske Research’s forecasts for real GDP growth.
Wealth Management, Danske Capital
Earnings at Danske Capital depend primarily on the management fee on assets under management. Expected cash flows therefore depend on expectations for changes in assets under management and the average margin on those assets. For the period until the terminal period, changes in assets under management depend on net sales and on the accumulation of market returns on the assets. The average margin on assets under management is expected to be 0.25% (2016: 0.28%). All assumptions reflect management’s expectations.
Sensitivity analysis
For General Banking, the excess value (the amount by which the recoverable amount exceeds the carrying amount of goodwill) amounts to DKK 10,456 million. If the growth in the terminal period is reduced from 1.7% to -9.4%, or the discount rate is increased from 9% to 15.4%, the excess value would be zero.
For FICC and Capital Market, the excess value amounts to DKK 16,297 million. A few years’ earnings exceed the carrying amount of goodwill allocated to the cash-generating unit. If the growth in the terminal period is reduced from 1.7% to -4.4%, or the discount rate is increased from 9% to 12.9%, the excess value would be zero.
For Danske Capital, the excess value amounts to DKK 324 million (2016: DKK 149 million). The excess value is particularly sensitive to the assumption of the average margin on assets under management, as a decrease from 0.25% to 0.22% would imply that the excess value is zero. For the other assumptions, the excess value would be zero if the discount rate was increased by 1.2 percentage points to 10.2% (2016: 0.6 percentage points to 9.6%), or the growth rate in the terminal period is lowered from 1.7% to -0.1% (2016: from 1.7% to 0.8%).

Danske Bank / Annual Report 201794
94 Danske Bank / Annual Report 2017
Notes – Danske Bank Group
19. Due to credit institutions and central banks and Deposits
Amounts due to credit institutions and central banks and Deposits also include amounts received under repo transactions (sales of securities which the Group agrees to repurchase at a later date). Such transactions are presented as collateralised borrowings.
Accounting policy
Amounts due to credit institutions and central banks and Deposits are measured at amortised cost. If fixed-rate deposits are hedged effectively by derivatives, the fair value of the hedged interest rate risk is added to the amortised cost of the liabilities.
(a) Due to credit institutions and central banks (DKK millions) 2017 2016
Repo transactions 87,291 117,660
Other amounts due 155,596 155,223
Total 242,887 272,883
(b) Deposits (DKK millions) 2017 2016
Repo transactions 133,081 82,064
Transaction accounts 791,628 727,668
Time deposits 107,245 118,423
Pension savings etc. 14,904 15,710
Total 1,046,858 943,865
c) Wholesale deposits ranking pari passu with senior creditors
Total deposits in sections (a) and (b) above, excluding repo transactions, amount to DKK 1,069,373 million (2016: 1,017,024 million). Of those deposits, 34% (31 December 2016: 32%) are wholesale deposits ranking pari passu with senior creditors. These wholesale deposits exclude deposits from other credit institutions with an original maturity of less than seven days. If deposits from other credit institutions are excluded, the percentage is 27% (31 December 2016: 27%).
20. Tax
Tax assets and liabilities are divided into current and deferred tax in this note. Current tax relates to expected tax to be paid on the profit for the year, whereas deferred tax relates to temporary differences between the tax base of assets and liabilities and their carrying amount in the balance sheet. Further, this note gives an overview of the Group’s tax expense for the year and the effective tax rate broken down by country. The Group is subject to international joint taxation.
Accounting policy
Current tax
Current tax assets and liabilities are recognised in the balance sheet as the estimated tax payable on the profit for the year adjusted for prepaid tax and prior-year tax payables and receivables. Tax assets and liabilities are offset if the Group has a legally enforceable right to set off such assets and liabilities and intends either to settle the assets and liabilities on a net basis or to realise the assets and settle the liabilities simultaneously.
Deferred tax
Deferred tax on all temporary differences between the tax base of assets and liabilities and their carrying amounts is accounted for in accordance with the balance sheet liability method. Deferred tax is measured on the basis of the tax regulations and rates that, according to the rules in force at the balance sheet date, are applicable in the relevant countries at the time the deferred tax is expected to crystallise as current tax. Changes in deferred tax as a result of adopted changes in tax rates are recognised in the income statement on the basis of expected cash flows.The Group does not recognise deferred tax on temporary differences between the tax base and the carrying amounts of goodwill not subject to amortisation for tax purposes and other items if the temporary differences arose at the time of acquisition without effect on net profit or taxable income. If the tax base may be calculated according to several sets of tax regulations, deferred tax is measured in accordance with the regulations that apply to the use of the asset or settlement of the liability as planned by management. Tax assets arising from unused tax losses are only recognised if it is expected that such tax losses can be offset against tax on future profit in the next five years. Deferred tax assets and liabilities are offset when they relate to the same tax jurisdiction.
Current and deferred tax is calculated on the profit for the year, and adjustments of prior-year tax charges are recognised in the income statement. Tax on items recognised under Other comprehensive income is recognised under Other comprehensive income. Similarly, tax on items recognised in equity is recognised in equity.

Danske Bank / Annual Report 2017 95
Danske Bank / Annual Report 2017 95
Notes – Danske Bank Group
20. Tax continued
(a) Tax assets and liabilities (DKK millions) Tax assets Tax liabilities 2017 2016 2017 2016
Current tax charge 971 617 1,040 476
Deferred tax 448 666 7,594 7,675
Total tax 1,419 1,283 8,634 8,151
1 Jan.
Foreign currency
translation
Included in profit for the
year
Included in shareholders'
equity 31 Dec.
-147 11 52 -117 -201
1,957 -14 223 10 2,176
9 1 3 - 13
124 -3 -56 92 157
-397 12 50 - -335
5,954 - -121 - 5,833
(b) Change in deferred tax (DKK millions)
2017
Intangible assets Tangible assets Securities Provisions for obligations Tax loss carry forwards Recapture of tax loss Other -492 5 -9 - -496
Total 7,008 12 140 -15 7,145
Adjustment of prior-year tax charges included in above item -49
2016
Intangible assets 15 - -162 - -147
Tangible assets 1,881 9 67 - 1,957
Securities -2 - 11 - 9
Provisions for obligations 235 -28 151 -234 124
Tax loss carry forwards -343 40 -94 - -397
Recapture of tax loss 5,943 - 11 - 5,954
Other -561 -4 73 - -492
Total 7,168 17 57 -234 7,008
Adjustment of prior-year tax charges included in above item -78
Recognition of deferred tax requires management to assess the probability and amount of future profit. Deferred tax assets arising from unused tax losses are recognised to the extent that such losses can be offset against tax on future profit in the next five years. The tax base of unrecognised tax loss carry-forwards, relating primarily to the Group’s banking operations in Ireland, amounted to DKK 2.9 billion (31 December 2016: DKK 3.0 billion).
Recapture of tax loss consists of the full deferred tax liability arising from international joint taxation. Danske Bank A/S has been a part of international joint taxation since 2009.

Danske Bank / Annual Report 201796
96 Danske Bank / Annual Report 2017
Notes – Danske Bank Group
Denmark Finland Sweden Norway UK Ireland Other Total
2,832 414 1,132 589 271 15 135 5,388
-76 - 19 - -117 - - -174
20. Tax continued
(c) Tax expense
Tax 2017 (DKK millions)
Tax on profit for the year Tax on other comprehensive income Tax on changes in shareholders' equity -172 - - - - - - -172
Tax on profit for the year Current tax charge 3,098 361 1,179 665 236 - 116 5,655
Transferred to other comprehensive income 82 - - - - - - 82
Change in deferred tax -120 53 24 -29 134 116 11 189
Adjustment recognised tax loss - - - - -101 -100 - -201
Adjustment of prior-year tax charges -229 - -71 -47 2 -1 8 -337
Change in deferred tax charge as a result of lowered tax rate - - - - - - - -
Total 2,832 414 1,132 589 271 15 135 5,388
Effective tax rate % Tax rate 22.0 20.0 22.0 25.0 26.5 12.5 25.6 22.1
Non-recognised tax loss - - - - - -12.6 - -
Non-taxable income and non-deductible expenses 1.4 -1.7 0.2 -1.6 -0.5 0.1 2.3 0.4
Tax on profit for the year 23.4 18.3 22.2 23.4 26.0 - 27.9 22.5
Adjustment of prior-year tax charges -1.7 - -1.3 -1.7 - - 1.7 -0.7
Adjustment recognised tax loss - - - - -6.9 1.7 - -1.3
Change in deferred tax charge as a result of lowered tax rate - - - - - - - -
Effective tax rate 21.7 18.3 20.9 21.7 19.1 1.7 29.6 20.5
Tax on other comprehensive income Remeasurement of defined benefit plans 6 - 19 - -117 - - -92
Hedging of units outside Denmark -93 - - - - - - -93
Unrealised value adjustments of available-
for-sale financial assets -5 - - - - - - -5
Realised value adjustments of available-
for-sale financial assets 16 - - - - - - 16
Total -76 - 19 - -117 - - -174

Danske Bank / Annual Report 2017 97
Danske Bank / Annual Report 2017 97
Notes – Danske Bank Group
20. Tax continued
Tax 2016 (DKK millions) Denmark Finland Sweden Norway UK Ireland Other Total
Tax on profit for the year 3,451 338 899 389 419 -94 98 5,500
Tax on other comprehensive income 228 - -41 - -164 - - 23
Tax on changes in shareholders' equity -154 - - - - - - -154
Tax on profit for the year Current tax charge 3,249 388 869 341 270 - 104 5,221
Transferred to other comprehensive income 257 - - - - - - 257
Change in deferred tax -35 -31 61 44 104 - -17 126
Adjustment recognised tax loss - - - - 43 -100 - -57
Adjustment of prior-year tax charges -20 -19 -31 4 -7 6 11 -56
Change in deferred tax charge as a result of lowered tax rate - - - - 9 - - 9
Total 3,451 338 899 389 419 -94 98 5,500
Effective tax rate % Tax rate 22.0 20.0 22.0 25.0 28.0 12.5 56.0 22.5
Non-recognised tax loss - - - - - -12.5 - -0.1
Non-taxable income and non-deductible expenses -0.2 -0.1 -0.6 -1.3 0.5 - 12.3 -0.3
Tax on profit for the year 21.8 19.9 21.4 23.7 28.5 - 68.3 22.1
Adjustment of prior-year tax charges -0.1 -1.1 -0.7 0.3 0.1 3.0 2.8 -0.2
Adjustment recognised tax loss - - - - 2.6 -40.0 - -0.2
Change in deferred tax charge as a result of lowered tax rate - - - - 0.7 - - -
Effective tax rate 21.7 18.8 20.7 24.0 31.9 -37.0 71.1 21.7
Tax on other comprehensive income Remeasurement of defined benefit plans -29 - -41 - -164 - - -234
Hedging of units outside Denmark 203 - - - - - - 203
Unrealised value adjustments of available- for-sale financial assets 56 - - - - - - 56
Realised value adjustments of available- for-sale financial assets -2 - - - - - - -2
Total 228 - -41 - -164 - - 23

Danske Bank / Annual Report 201798
98 Danske Bank / Annual Report 2017
Notes – Danske Bank Group
21. Issued bonds
The issued bonds presented in this note consist of senior and senior secured and subordinated bonds issued by the Group, with the exception of bonds issued by Realkredit Danmark and additional tier 1 capital accounted for as equity. Note 15 provides more information about bonds issued by Realkredit Danmark and note 23 about additional tier 1 capital accounted for as equity.
Senior and senior secured bonds are presented under Other issued bonds, while subordinated bonds are presented as a separate line item. Subordinated bonds are liabilities in the form of subordinated loan capital and other capital instruments which, in case of the Group’s voluntary or compulsory winding-up, will not be repaid until the claims of its ordinary creditors have been met. During 2017, the Group issued additional tier 1 capital that converts into a variable number of ordinary shares under certain circumstances. This additional tier 1 capital is accounted for as liabilities and included under subordinated bonds.
Accounting policy
Issued bonds, both senior and senior secured and subordinated bonds, are at initial recognition measured at fair value less transaction cost and subsequently measured at amortised cost plus the fair value of the hedged interest rate risk. Interest income is recognised according to the effective interest rate method, including amortisation of any difference between the amount received on issue and the redemption amount. However, a small part of the issued commercial paper and certificates of deposit is recognised at fair value through profit or loss using the fair value option. Those issues are presented together with other issued bonds.
The Group issues perpetual bonds with discretionary interest payments that fulfil the requirements for additional tier 1 capital under the Capital Requirements Regulation. If a trigger event occurs, those bonds must be either written down temporarily or converted into a variable number of ordinary shares, depending on the terms of the individual bond issue. Bonds that convert into a variable number of ordinary shares are accounted for as liabilities, while bonds that are temporarily written down are accounted for as equity.
The yield on some issued bonds depends on an index that is not closely linked to the bonds’ financial characteristics, for example an equity or commodity index. Such embedded derivatives are bifurcated and measured at fair value in the trading portfolio.
2017 2016
101,326 75,047
123,457 128,323
(a) Other issued bonds (DKK millions)
Commercial papers and certificates of deposit Other unsecured bonds Covered bonds 180,297 189,143
Total 405,080 392,513
Commercial paper and certificates of deposit include DKK 4.5 billion (2016: DKK 6.6 billion) recognised at fair value.
The issuance and redemption of other issued bonds during the year and the maturity of the outstanding bonds are presented in the tables below.
1 January Foreign
currency 31 December Nominal value (DKK millions) 2017 Issued Redeemed translation 2017
Commercial paper and certificates of deposit 75,036 287,057 252,945 -7,829 101,319
Other unsecured bonds 142,270 29,320 37,345 -6,615 127,630
Covered bonds 234,683 31,946 41,994 -1,887 222,748
Other issued bonds 451,989 348,323 332,284 -16,332 451,696
Foreign 1 January currency 31 December
Nominal value (DKK millions) 2016 Issued Redeemed translation 2016
Commercial paper and certificates of deposit 60,836 195,936 180,226 -1,510 75,036
Other 350,780 99,787 73,860 245 376,953
Other issued bonds 411,616 295,723 254,086 -1,265 451,989
The nominal values disclosed are before elimination of own holdings of issued bonds. In the Funding and liquidity section of Management’s report, issued junior covered bonds in Realkredit Danmark A/S of DKK 6.6 billion (2016: DKK 17.3 billion) are excluded. Retained and repurchased bonds held by Group Treasury amounting to DKK 47.8 billion (2016: 63.1 billion) have been also excluded.

Danske Bank / Annual Report 2017 99
Danske Bank / Annual Report 2017 99
Notes – Danske Bank Group
21. Issued bonds continued
Broken down by maturity 2017 2016
(DKK millions) DKK Other currency Total Total
Redeemed bonds 2017 151,448
2018 15,063 158,327 173,391 71,837
2019 12,098 50,475 62,573 51,785
2020 or later 14,454 201,279 215,733 176,919
Nominal value of other issued bonds 41,616 410,081 451,696 451,989
Fair value hedging of interest rate risk 5,584 8,757
Premium/discount -729 -863
Own holding of bonds issued 14,250 37,222 51,472 67,370
Total other issued bonds 27,366 372,859 405,079 392,513

Danske Bank / Annual Report 2017100
100 Danske Bank / Annual Report 2017
Notes – Danske Bank Group
21. Issued bonds continued
(b) Subordinated debt
Subordinated debt consists of liabilities in the form of issued subordinated bonds. Some of these bonds (presented as liability accounted additional tier 1 capital below) rank below other subordinated bonds. Early redemption of subordinated debt must be approved by the Danish FSA. Subordinated debt is included in total capital in accordance with the Capital Requirements Regulation (CRR), including the provisions on grandfathering of instruments that, prior to the CRR, fulfilled the requirements in section 128 of the Danish Financial Business Act and applicable orders.
The issuance and redemption of subordinated debt during the year and the maturity of the outstanding debt are presented in the tables below.
1 Jan. 2017 Issued Redeemed
Foreign currency
translation Other
changes
31 Dec.
2017
24,319 - - -267 - 24,052
Nominal value (DKK millions)
Subordinated debt, excluding liability accounted additional tier 1 capital Liability accounted additional tier 1 capital 12,556 4,655 12,556 - 4,665
Total subordinated debt 36,875 4,655 12,556 -267 - 28,707
Nominal value (DKK millions) 1 Jan. 2016 Issued Redeemed
Foreign currency
translation Other
changes
31 Dec. 2016
Subordinated debt, excluding liability accounted additional tier 1 capital 24,923 - - -604 - 24,319
Liability accounted additional tier 1 capital 13,584 - - -1,028 - 12,556
Total subordinated debt 38,507 - - -1,632 - 36,875
Nominal Interest Year of Redemption 2017 2016 Currency Borrower Note (millions) rate issue Maturity price (DKK m) (DKK m)
Subordinated debt, excluding liability accounted additional tier 1 capital Redeemed loans 2017 -
GBP Danske Bank A/S a 350 5.375 2003 29.09.2021 100 2,936 3,043
EUR Danske Bank A/S b 1,000 3.875 2013 04.10.2023 100 7,445 7,434
SEK Danske Bank A/S c 900 4.750 2013 05.06.2024 100 681 701
SEK Danske Bank A/S d 1,600 var. 2013 05.06.2024 100 1,211 1,246
NOK Danske Bank A/S e 700 var. 2013 06.12.2023 100 530 573
DKK Danske Bank A/S f 1,700 var. 2013 06.06.2024 100 1,700 1,700
DKK Danske Bank A/S g 1,150 4.125 2013 09.12.2025 100 1,150 1,150
CHF Danske Bank A/S h 150 3.125 2013 18.12.2025 100 954 1,038
EUR Danske Bank A/S i 500 2.750 2014 19.05.2026 100 3,723 3,717
EUR Danica Pension j 500 4.375 2015 29.09.2045 100 3,723 3,717
Subordinated debt, excluding liability accounted additional tier 1 capital 24,052 24,319
Liability accounted additional tier 1 capital Redeemed loans 2017 12,556
USD Danske Bank A/S k 750 6.125 2017 Perpetual 100 4,655 -
Liability accounted additional tier 1 capital 4,655 12,556
28,707 36,875
-74 -54
509 1,076
Nominal subordinated debt Discount Fair value hedging of interest rate risk Own holding of subordinated debt -22 -66
Total subordinated debt 29,120 37,831
Portion included in Total capital as additional tier 1 or tier 2 capital instrument 23,759 31,631
Total capital further includes DKK 14.2 billion from the additional tier 1 bond issues accounted for as equity (see note 23).

Danske Bank / Annual Report 2017 101
Danske Bank / Annual Report 2017 101
Notes – Danske Bank Group
21. Issued bonds continued
a Optional redemption from September 2018. If the loan is not redeemed, the annual interest rate will be 1.94 percentage points above 3-month GBP LIBOR.
b Optional redemption in October 2018. If the loan is not redeemed, the annual interest rate will be reset at 2.63 percentage points above the 5-year EUR swap rate for the remaining five years until maturity. CRR compliant Tier 2 capital.
c Optional redemption in June 2019. If the loan is not redeemed, the annual interest rate will be reset at 2.70 percentage points above the 5-year SEK swap rate for the remaining five years until maturity. CRR compliant Tier 2 capital.
d Interest is paid at an annual rate of 2.70 percentage points above 3-month STIBOR. Optional redemption from June 2019. CRR compliant Tier 2 capital.
e Interest is paid at an annual rate of 2.60 percentage points above 3-month NIBOR. Optional redemption from December 2018. CRR compliant Tier 2 capital.
f Interest is paid at an annual rate of 2.35 percentage points above 3-month CIBOR. Optional redemption from June 2019. CRR compliant Tier 2 capital.
g Optional redemption in December 2020. If the loan is not redeemed, the annual interest rate will be reset at 2.45 percentage points above the 5-year DKK swap rate for the remaining five years until maturity. CRR compliant Tier 2 capital.
h Optional redemption in December 2020. If the loan is not redeemed, the annual interest rate will be reset at 2.15 percentage points above the 5-year CHF swap rate for the remaining five years until maturity. CRR compliant Tier 2 capital.
i Optional redemption in May 2021. If the loan is not redeemed, the annual interest rate will be reset at 1.52 percentage points above the 5-year EUR swap rate for the remaining five years until maturity. CRR compliant Tier 2 capital.
j Optional redemption from September 2025. If the loan is not redeemed, the annual interest rate will be reset at 4.38 percentage points above the 10-year EUR swap rate every tenth year until maturity. Solvency II compliant Tier 2 capital and included in Danica’s capital base.
k Optional redemption from 28 March 2024. If the loan is not redeemed, the annual interest rate will be reset at 3.896 percentage points above the 7-year USD swap rate. CRR compliant Tier 1 capital.

Danske Bank / Annual Report 2017102
102 Danske Bank / Annual Report 2017
Notes – Danske Bank Group
22. Other assets and Other liabilities
The Group uses quantitative and qualitative materiality considerations when aggregating line items in the balance sheet that are not considered individually material. Such line items are presented under Other assets or Other liabilities and consist of net assets or net liabilities in defined benefit pension plans, investment property, tangible assets, holdings in associates and assets held for sale.
The Group uses clean pricing of financial instruments, and accrued interest is therefore included in Other assets and Other liabilities. Further, prepayments and accrued income and expenses are included under Other assets and Other liabilities. Other staff commitments includes provisions for holiday payments, variable remuneration, severance pay etc. The provisions recognised represents the compensation that the employee has earned and that is expected to be paid to the employee.
Accounting policy
Defined benefit pension plans
When the Group has entered into defined benefit pension plans, the amounts payable are recognised on the basis of an actuarial computation of the present value of expected benefits. The present value is calculated on the basis of expected future trends in salaries and interest rates, the time of retirement, mortality rates and other factors. The present value of pension benefits less the fair value of pension assets is recognised as a pension obligation for each plan under Other liabilities. If the net amount of a defined benefit pension plan is positive and may be repaid to the Group or reduce its future contributions to the plan, the net amount is recognised under Other assets. The discount rate is determined by reference to yields on high-quality corporate bonds with terms matching the terms of the pension obligations.
Investment property
Investment property is real property, including real property let under operating leases, which the Group owns for the purpose of receiving rent and/or obtaining capital gains. Real property with both domicile (occupied by the Group’s support, administrative and back-office functions) and investment property elements is allocated proportionately to the two categories if the elements are separately sellable. If that is not the case, such real property is classified as investment property if the Group occupies less than 10% of the total floorage.
Investment property is recognised at fair value. Fair value adjustments and rental income are recognised under Other income. Real property taken over by the Group under non-performing loan agreements that is expected to be sold within 12 months of classification is valued in accordance with the principles used for investment property but presented as Assets held for sale.
Tangible assets
Tangible assets include domicile property and plant and equipment. Plant and equipment cover equipment, vehicles, furniture, fixtures and leasehold improvements. Tangible assets also include lease assets, i.e. assets let under operating leases, except real property. Tangible assets are measured at cost and depreciated over the estimated useful life. The estimated useful life is 20-50 years for domicile property, 3-10 years for plant and equipment and 3 years for lease assets. Depreciation charges are recognised under Operating expenses.
Tangible assets are tested for impairment if indications of impairment exist. An impaired asset is written down to its recoverable amount, which is the higher of its fair value less costs to sell and its value in use.
Assets held for sale
Assets held for sale are tangible assets and assets of group undertakings actively marketed for sale within 12 months, for example assets and businesses taken over under non-performing loan agreements.
Such assets are measured at the lower of their carrying amount at the time of reclassification and their fair value less expected costs to sell and are no longer depreciated. Liabilities of group undertakings are initially measured at fair value and subsequently in accordance with the Group’s general accounting policies.
Further, loans that are marketed for sale are transferred to Assets held for sale. The loans are written down to their expected selling price. The difference is recognised under Loan impairment charges.
Loan commitments and guarantees
The Group issues a number of loan commitments and guarantees. Such exposures are valued at the higher of the received premium amortised over the life of the individual obligation and the provision made, if any. Provisions are made if it is likely that drawings will be made under a loan commitment or claims will be made under a guarantee and the amount payable can be reliably measured. The liability is measured at the present value of expected payments. Loan commitments are discounted in accordance with the interest terms.
Other obligations
Provisions for other obligations, such as lawsuits, are recognised if the obligation is likely to result in a payment obligation and the amount can be measured reliably. Liabilities are recognised at the present value of expected payments.
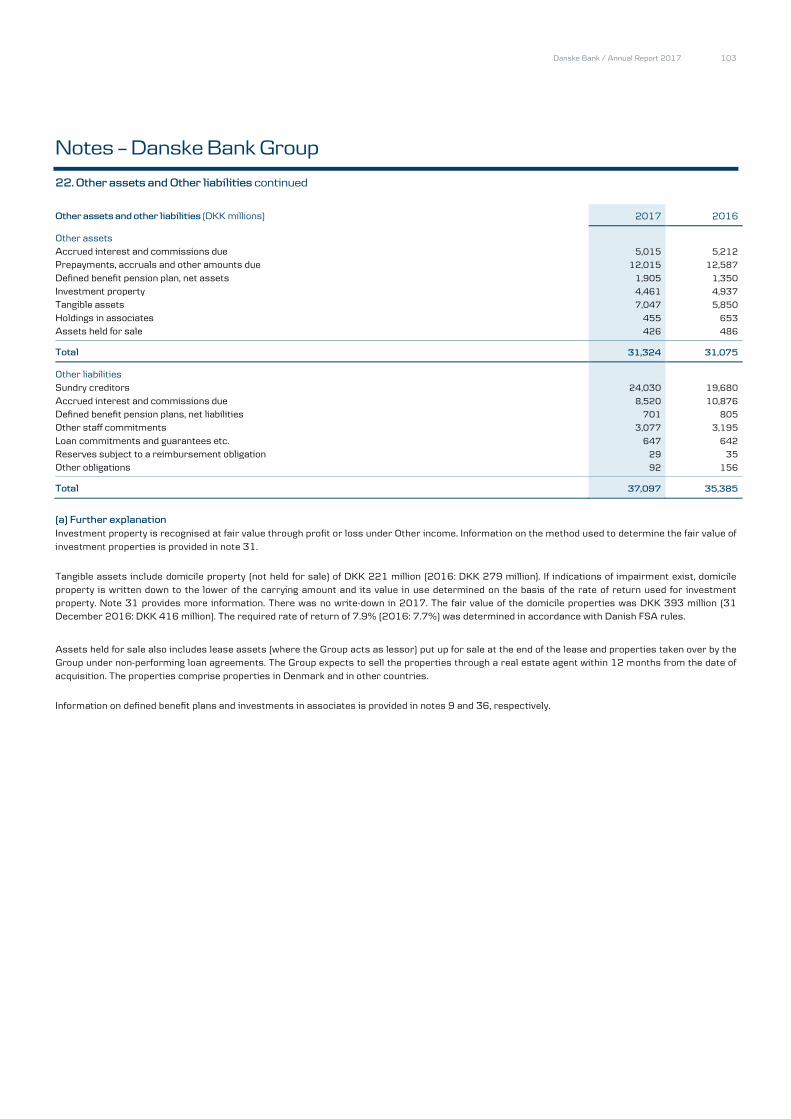
Danske Bank / Annual Report 2017 103
Danske Bank / Annual Report 2017 103
Notes – Danske Bank Group
22. Other assets and Other liabilities continued
Other assets and other liabilities (DKK millions) 2017 2016
Other assets Accrued interest and commissions due 5,015 5,212
Prepayments, accruals and other amounts due 12,015 12,587
Defined benefit pension plan, net assets 1,905 1,350
Investment property 4,461 4,937
Tangible assets 7,047 5,850
Holdings in associates 455 653
Assets held for sale 426 486
Total 31,324 31,075
Other liabilities Sundry creditors 24,030 19,680
Accrued interest and commissions due 8,520 10,876
Defined benefit pension plans, net liabilities 701 805
Other staff commitments 3,077 3,195
Loan commitments and guarantees etc. 647 642
Reserves subject to a reimbursement obligation 29 35
Other obligations 92 156
Total 37,097 35,385
(a) Further explanation
Investment property is recognised at fair value through profit or loss under Other income. Information on the method used to determine the fair value of investment properties is provided in note 31.
Tangible assets include domicile property (not held for sale) of DKK 221 million (2016: DKK 279 million). If indications of impairment exist, domicile property is written down to the lower of the carrying amount and its value in use determined on the basis of the rate of return used for investment property. Note 31 provides more information. There was no write-down in 2017. The fair value of the domicile properties was DKK 393 million (31 December 2016: DKK 416 million). The required rate of return of 7.9% (2016: 7.7%) was determined in accordance with Danish FSA rules.
Assets held for sale also includes lease assets (where the Group acts as lessor) put up for sale at the end of the lease and properties taken over by the Group under non-performing loan agreements. The Group expects to sell the properties through a real estate agent within 12 months from the date of acquisition. The properties comprise properties in Denmark and in other countries.
Information on defined benefit plans and investments in associates is provided in notes 9 and 36, respectively.

Danske Bank / Annual Report 2017104
104 Danske Bank / Annual Report 2017
Notes – Danske Bank Group
23. Equity
Equity is the residual interest in the assets after deducting all liabilities recognised in the balance sheet. Equity is divided between capital and reserves that are attributable to holders of shares issued by the Group (owners of Danske Bank A/S) and other parties holding an interest in the net assets of the Group. At the end of 2017, the nominal value of issued additional tier 1 capital amounted to DKK 14,148 million (2016: DKK 14,151 million). Danske Bank A/S may, at its sole discretion, omit interest and principal payments to bondholders. The issues are included in equity as a non-controlling interest. This means that equity was increased at the time of issue by the net proceeds received. When interest is paid, the amount paid to investors reduces equity at the time of payment and does not affect net profit. If the Group decides to repay the capital, equity will be reduced by the redemption amount at the time of redemption. The capital issued is included in tier 1 capital instruments in the statement of capital as it meets the criteria of the Capital Requirements Regulation for such instruments.
Accounting policy
Equity is the residual interest in recognised assets after deduction of recognised liabilities. In this context, the following items are of special interest:
Own shares
Amounts received or paid for the Group’s sale or purchase of Danske Bank shares are recognised directly in equity under transactions with owners. The same applies to premiums received or paid for derivatives entailing settlement in own shares. A capital reduction by cancellation of own shares will lower the share capital by an amount equal to the nominal value of the shares at the time of registration of the capital reduction. Additional tier 1 capital
The capital instruments include no contractual obligation to deliver cash or another financial asset to the holders, as Danske Bank A/S may, at its sole discretion, omit payment of interest and principal payments to the bondholders. Therefore, the issue does not qualify as a financial liability according to IAS 32. The net amount received at the time of issue is recognised as an increase in equity. Interest payments are accounted for as dividends, which are recognised directly in equity at the time the payment obligation arises. If Danske Bank A/S chooses to redeem the bonds, equity will be reduced by the redemption amount at the time of redemption. Amounts received or paid for the sale or acquisition of own holdings of additional tier 1 capital instruments are recognised directly in equity, similarly to holdings of own shares.
(a) Further explanation
Equity consists of various components, including the accumulated balance of each class of other comprehensive income, retained earnings and issued
additional tier 1 capital. The various components of equity are described below. Tax on items recognised directly in equity is recognised under Retained
earnings.
Foreign currency translation reserve
Assets and liabilities of units outside Denmark are translated into Danish kroner at the exchange rates at the balance sheet date. Income and expenses are translated at the exchange rates at the transaction date. Gains and losses arising at the translation of net investments in units outside Denmark are recognised under Other comprehensive income and recognised in the foreign currency translation reserve in equity. Net investments include the net assets and goodwill of the units as well as holdings in the form of subordinated loan capital. Exchange rate adjustments of financial liabilities used for hedging the Group’s net investments are also recognised under Other comprehensive income and in the foreign currency translation reserve.
If the net investment in a unit outside Denmark is fully or partly realised, translation differences are recognised in the income statement. Reserve for available-for-sale financial assets
The reserve covers unrealised value adjustments of bonds treated as available-for-sale financial assets recognised under Other comprehensive income. Unrealised value adjustments of hedged interest rate risks that qualify for fair value hedge accounting are recognised in the income statement and are not included in the reserve. If objective evidence of impairment exists, the Group reclassifies accumulated unrealised capital losses from the reserve to the income statement. When bonds are sold, the Group also reclassifies unrealised value adjustments from the reserve to the income statement. Proposed dividends
The Board of Directors’ proposal for dividends for the year submitted to the general meeting is included as a separate reserve in equity. The dividends are recognised as a liability when the general meeting has adopted the proposal.

Danske Bank / Annual Report 2017 105
Danske Bank / Annual Report 2017 105
Notes – Danske Bank Group
23. Equity continued
Share-based payments
Share-based payments by the Group are settled in Danske Bank shares. The fair value at the grant date is expensed over the vesting period and set off against equity. At the time of exercise, payments by employees are recognised as an increase in equity. As with other purchases of Danske Bank shares, shares acquired for hedging purposes reduce equity by the amount paid. Non-controlling interests
Non-controlling interests’ share of equity equals the carrying amounts of the net assets in group undertakings not owned directly or indirectly by Danske Bank A/S. Additional tier 1 capital holders
This reserve includes the net proceed received at the time of issuance and accrued interest not yet paid to the holders of the capital. As described above, Danske Bank A/S may, at its sole discretion, cancel interest payments to bond holders. Any interest payments must be paid out of distributable items, which primarily consist of retained earnings at Danske Bank A/S and Danske Bank Group (see section 3.4.3 of Risk Management 2017 for further information). The additional tier 1 capital will be written down temporarily if the common equity tier 1 ratio falls below 7% for Danske Bank A/S or Danske Bank Group. The ratio at year-end is disclosed in the statement of capital. Outstanding equity accounted additional tier 1 capital
Norminal Interest Year of 2017 2016 Currency Borrower Note (million) rate issue Maturity (DKK m) (DKK m)
Equity accounted additional tier 1 capital
EUR Danske Bank A/S a 750 5.750 2014 Perpetual 5,584 5,576
EUR Danske Bank A/S b 750 5.875 2015 Perpetual 5,584 5,576
DKK Danske Bank A/S c 3,000 var. 2016 Perpetual 3,000 3,000
Equity accounted additional tier 1 capital 14,168 14,151
The amounts shown in the two last columns represent the nominal value translated into Danish kroner at the exchange rates at 31 December and equal the amounts included as tier 1 capital in the statement of capital.
a. Interest is paid semi-annually at an annual rate of 5.750. If certain criteria are fulfilled, including approval by the Danish FSA, the bonds may be
redeemed at par from April 2020. If the bonds are not redeemed, the annual interest rate will be reset at 4.64 percentage points above the 6-year EUR swap rate every sixth year. The instrument is included as a CRR compliant additional tier 1 capital instrument in the statement of capital.
b. Interest is paid semi-annually at an annual rate of 5.875. If certain criteria are fulfilled, including approval by the Danish FSA, the bonds may be
redeemed at par from April 2022. If the bonds are not redeemed, the annual interest rate will be reset at 5.471 percentage points above the 7-year EUR swap rate every seventh year. The instrument is included as a CRR compliant additional tier 1 capital instrument in the statement of capital.
c. Interest is paid quarterly at a variable rate of 3M CIBOR + 4.75% p.a. If certain criteria are fulfilled, including approval by the Danish FSA, the bonds
may be redeemed at par from November 2021. If the bonds are not redeemed, the margin remains unchanged. The instrument is included as a CRR-compliant additional tier 1 capital instrument in the statement of capital.

Danske Bank / Annual Report 2017106
106 Danske Bank / Annual Report 2017
Notes – Danske Bank Group
24. Contingent liabilities
Contingent liabilities consist of possible liabilities arising from past events. The existence of such liabilities will be confirmed only by the occurrence or non-occurrence of one or more uncertain future events not wholly within the Group’s control. Contingent liabilities that can, but are not likely to, result in an outflow of financial resources are disclosed.
The Group uses a variety of loan-related financial instruments to meet customers’ financial requirements. Instruments include loan offers and other credit facilities, guarantees and instruments not recognised in the balance sheet. If an instrument is likely to result in a payment obligation, a liability is recognised under Other liabilities corresponding to the present value of expected payments.
(a) Guarantees (DKK millions) 2017 2016
Financial guarantees 8,534 8,778
Mortgage finance guarantees 1,050 1,218
Other guarantees 74,902 70,381
Total 84,487 80,377
(b) Other contingent liabilities (DKK millions) 2017 2016
Loan commitments shorter than 1 year 142,147 117,355
Loan commitments longer than 1 year 161,824 162,620
Other unutilised loan commitments 351 484
Total 304,322 280,459
In addition to credit exposure from lending activities, loan offers made and uncommitted lines of credit granted by the Group amounted to DKK 269 billion (31 December 2016: DKK 287 billion). These items are included in the calculation of the total risk exposure amount in accordance with the Capital Requirements Directive.
(c) Further explanation
Owing to its business volume, Danske Bank is continually a party to various lawsuits and disputes and has an ongoing dialogue with public authorities, such as the Danish FSA. In view of its size, Danske Bank does not expect the outcomes of pending lawsuits and disputes or its dialogue with public authorities to have any material effect on its financial position. The supervisory authorities conduct ongoing inspections of Danske Bank’s compliance with anti-money laundering legislation. As announced on 21 March 2016, the Danish FSA has reported Danske Bank to the Danish Public Prosecutor for Serious Economic and International Crime for investigation into non-compliance with the provisions of Danish anti-money laundering legislation with regard to identification of the purpose and expected business volume of the individual business relationships at and monitoring procedures for correspondent banks. On 21 December 2017, the case was settled and Danske Bank accepted to pay a fine of DKK 12.5 million. As announced on 11 October 2017, Danske Bank has been placed under investigation by the French Tribunal de Grande Instance de Paris court in relation to suspicions of money laundering concerning transfers to France carried out by former customers of Danske Bank Estonia from 2008 to 2011. In January 2018, the French court Tribunal de Grande Instance de Paris changed the status of Danske Bank in the investigation to that of an assisted witness. This means that Danske Bank is no longer placed under formal investigation, but still forms part of the investigation as an assisted witness.
In connection with the acquisition of Sampo Bank (now Danske Bank Plc) in 2007, Danske Bank Plc and Sampo Life (now Mandatum Life) signed an agency agreement that guaranteed Mandatum Life the exclusive right to sell life and pension insurance products through Danske Bank Plc’s branch network in Finland. The agency agreement expired at the end of 2016. As part of the agreement, Mandatum Life had a right to sell all or part of the insurance portfolio sold under the agreement to Danske Bank Group. On 27 October 2016, Mandatum Life exercised this right. The parties have agreed on a fair value of the insurance portfolio of DKK 2.5 billion, which will be recognised at the time of transfer of the portfolio. The transfer of the portfolio is expected to take place during 2018. Danske Bank is exploring the possibilities of selling the Mandatum Life Finland portfolio on to a third party.
A limited number of employees are employed under terms which, if they are dismissed before reaching their normal retirement age, grant them a severance and/or pension payment in excess of their entitlement under ordinary terms of employment. As the sponsoring employer, the Group is also liable for the pension obligations of a number of company pension funds.
The Group participates in the Danish Guarantee Fund and the Danish Resolution Fund. The funds’ capital must amount to at least 0.8% and 1%, respectively, of the covered deposits of all Danish credit institutions by 31 December 2024. The Guarantee Fund is currently fully funded, but if the fund subsequently does not have sufficient means to make the required payments, extraordinary contributions of up to 0.5% of the individual institution’s covered deposits may be required. Extraordinary contributions above this percentage require the consent of the Danish FSA. The first contribution to the Resolution Fund was made in December 2015. Danske Bank A/S and Realkredit Danmark A/S make contributions to the fund on the basis of their size and risk relative to other credit institutions in Denmark. The contribution for 2017 of DKK 0.4 billion accrued over the year as operating expenses. If the Resolution Fund does not have sufficient means to make the required payments, extraordinary contributions of up to three times the latest annual contributions may be required. Further, Danish banks participate in the Danish Restructuring Fund, which reimburses creditors if the final dividend is lower than the interim dividend in respect of banks that were in distress before 1 June 2015. Similarly, Danish banks have made payment commitments (totalling DKK 1 billion) to cover losses incurred by the Danish Restructuring Fund for the withdrawal of distressed banks from data centres etc. Payments to the Restructuring Fund are calculated on the basis of the individual credit institution’s share of covered deposits relative to other credit institutions in Denmark. However, each institution’s contribution to the Restructuring Fund may not exceed 0.2% of its covered deposits.

Danske Bank / Annual Report 2017 107
Danske Bank / Annual Report 2017 107
Notes – Danske Bank Group
24. Contingent liabilities continued
The Group is a member of deposit guarantee schemes and other compensation schemes in Norway, the UK and Luxembourg. As in Denmark, the contributions to the schemes in the other countries are annual contributions combined with extraordinary contributions if the means of the schemes are not sufficient to cover the required payments. The Group is the lessee in a number of non-cancellable operating leases, involving mainly leasing of real property, equipment, furniture and fixtures. The Group recognises lease payments as an expense over the lease term but does not recognise the operating lease assets in its balance sheet. Such assets are recognised by lessors. At 31 December 2017, minimum lease payments under non-cancellable operating leases amounted to DKK 3,522 million (31 December 2016: DKK 4,117 million), with DKK 710 million (2016: DKK 765 million) relating to operating leases expiring within one year. Danske Bank A/S is taxed jointly with all entities of Danske Bank Group and is jointly and severally liable with these for payment of Danish corporation tax and withholding tax, etc. Danske Bank A/S is registered jointly with all significant Danish entities of Danske Bank Group for financial services employer tax and VAT, for which Danske Bank A/S and the entities are jointly and severally liable.

Danske Bank / Annual Report 2017108
108 Danske Bank / Annual Report 2017
Notes – Danske Bank Group
25. Balance sheet items broken down by expected due date
The Group presents the balance sheet items in order of liquidity instead of distinguishing between current and non-current items. The table below shows the balance sheet items expected to mature within one year (current) and after more than one year (non-current).
2017 2016 (DKK millions) Within 1 year After 1 year Within 1 year After 1 year
Assets
Cash in hand and demand deposits with central banks 82,818 - 53,211 -
Due from credit institutions and central banks 333,463 512 244,767 712
Trading portfolio assets 254,221 195,071 264,535 245,144
Investment securities 92,013 232,605 66,123 277,214
Loans at amortised cost 459,627 653,126 523,629 617,937
Loans at fair value* 20,086 767,136 23,130 742,873
Assets under pooled schemes and unit-linked investment contracts - 112,065 - 99,848
Assets under insurance contracts 7,456 289,411 7,308 278,090
Intangible assets - 7,177 - 6,790
Tax assets 971 448 617 667
Other assets 17,234 14,090 18,287 12,788
Total 1,267,889 2,271,639 1,201,607 2,282,064
Liabilities
Due to credit institutions and central banks 226,736 16,150 258,132 14,751
Trading portfolio liabilities 73,588 327,008 100,299 378,001
Deposits 238,640 808,217 154,077 789,788
Bonds issued by Realkredit Danmark 160,747 597,628 146,438 580,293
Deposits under pooled schemes and unit-linked investment contracts 9,523 110,378 9,353 97,065
Liabilities under insurance contracts 57,350 265,376 61,692 253,285
Other issued bonds 161,377 243,703 140,860 251,652
Tax liabilities 1,040 7,594 476 7,675
Other liabilities 36,314 783 34,548 837
Subordinated debt 4,722 24,398 12,882 24,950
Total 970,037 2,401,235 918,757 2,398,299
* From 2017 the break down is calculated according to the loans at fair value amortisation. The comparison figures have been adjusted.
Deposits include fixed-term deposits and demand deposits. Fixed-term deposits are recognised according to maturity. Demand deposits have short contractual maturities but are considered a stable funding source with an expected maturity of more than one year.
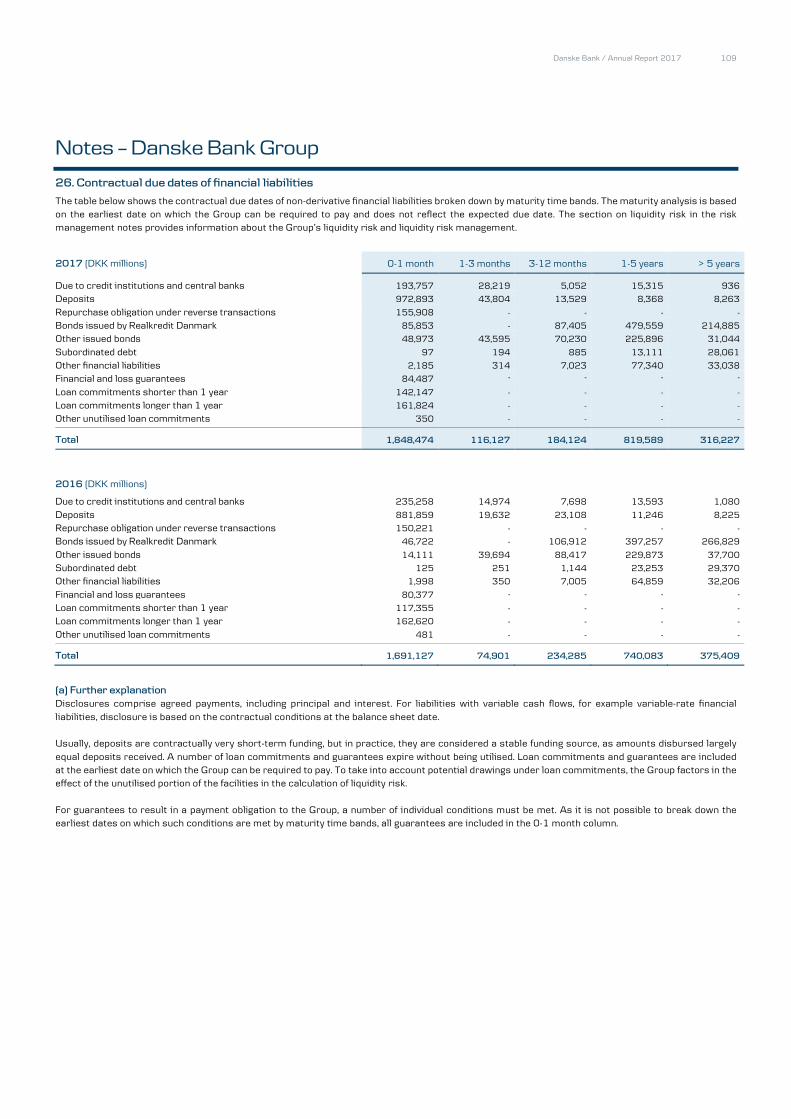
Danske Bank / Annual Report 2017 109
Danske Bank / Annual Report 2017 109
Notes – Danske Bank Group
26. Contractual due dates of financial liabilities
The table below shows the contractual due dates of non-derivative financial liabilities broken down by maturity time bands. The maturity analysis is based on the earliest date on which the Group can be required to pay and does not reflect the expected due date. The section on liquidity risk in the risk management notes provides information about the Group’s liquidity risk and liquidity risk management.
2017 (DKK millions) 0-1 month 1-3 months 3-12 months 1-5 years > 5 years
Due to credit institutions and central banks 193,757 28,219 5,052 15,315 936
Deposits 972,893 43,804 13,529 8,368 8,263
Repurchase obligation under reverse transactions 155,908 - - -
Bonds issued by Realkredit Danmark 85,853 - 87,405 479,559 214,885
Other issued bonds 48,973 43,595 70,230 225,896 31,044
Subordinated debt 97 194 885 13,111 28,061
Other financial liabilities 2,185 314 7,023 77,340 33,038
Financial and loss guarantees 84,487
Loan commitments shorter than 1 year 142,147 - - - -
Loan commitments longer than 1 year 161,824 - - - -
Other unutilised loan commitments 350 - - - -
Total 1,848,474 116,127 184,124 819,589 316,227
2016 (DKK millions)
Due to credit institutions and central banks 235,258 14,974 7,698 13,593 1,080
Deposits 881,859 19,632 23,108 11,246 8,225
Repurchase obligation under reverse transactions 150,221 - - - -
Bonds issued by Realkredit Danmark 46,722 - 106,912 397,257 266,829
Other issued bonds 14,111 39,694 88,417 229,873 37,700
Subordinated debt 125 251 1,144 23,253 29,370
Other financial liabilities 1,998 350 7,005 64,859 32,206
Financial and loss guarantees 80,377
Loan commitments shorter than 1 year 117,355 - - - -
Loan commitments longer than 1 year 162,620 - - - -
Other unutilised loan commitments 481 - - - -
Total 1,691,127 74,901 234,285 740,083 375,409
(a) Further explanation
Disclosures comprise agreed payments, including principal and interest. For liabilities with variable cash flows, for example variable-rate financial liabilities, disclosure is based on the contractual conditions at the balance sheet date.
Usually, deposits are contractually very short-term funding, but in practice, they are considered a stable funding source, as amounts disbursed largely equal deposits received. A number of loan commitments and guarantees expire without being utilised. Loan commitments and guarantees are included at the earliest date on which the Group can be required to pay. To take into account potential drawings under loan commitments, the Group factors in the effect of the unutilised portion of the facilities in the calculation of liquidity risk.
For guarantees to result in a payment obligation to the Group, a number of individual conditions must be met. As it is not possible to break down the earliest dates on which such conditions are met by maturity time bands, all guarantees are included in the 0-1 month column.
- - - -
- - - -
-

Danske Bank / Annual Report 2017110
110 Danske Bank / Annual Report 2017
Notes – Danske Bank Group
27. Transferred financial assets that are not derecognised
The Group enters into transactions that transfer ownership of financial assets, such as bonds and shares, to a counterparty, while the Group retains the risks associated with the holding of the assets. If the Group retains all significant risks, the securities remain in the balance sheet, and the transactions are accounted for as loans received against collateral. Such transactions are repo transactions and securities lending. The transactions involve selling the securities to be repurchased at a fixed price at a later date. Counterparties are entitled to sell the securities or deposit them as collateral for loans.
Trading portfolio 2017 2016 (DKK millions) Bonds Shares Bonds Shares
Carrying amount of transferred assets Repo transactions 206,227 - 189,494 -
Securities lending - 7,978 - 5,625
Total transferred assets 206,227 7,978 189,494 5,625
Repo transactions, own issued bonds 12,675 - 9,931 -
Carrying amount of associated liabilities 220,371 8,377 199,724 5,906
Net positions 1,469 399 299 281
The Group has not entered into any agreements on the sale of assets that entail the Group’s continuing involvement in derecognised financial assets.

Danske Bank / Annual Report 2017 111
Danske Bank / Annual Report 2017 111
Notes – Danske Bank Group
28. Assets provided or received as collateral
At the end of 2017, the Group had deposited DKK 11.4 billion worth of securities as collateral with Danish and international clearing centres and other institutions (31 December 2016: DKK 7.2 billion).
At the end of 2017, the Group had provided DKK 71.7 billion worth of cash and securities as collateral for derivatives transactions (31 December 2016: DKK 102.4 billion).
At the end of 2017, the Group had registered DKK 449.0 billion worth of assets (including bonds and shares issued by the Group) under insurance contracts (31 December 2016: DKK 344.2 billion) as collateral for policyholders’ savings of DKK 363.8 billion (31 December 2016: DKK 340.8 billion).
At the end of 2017, the Group had registered loans at fair value and securities worth a total of DKK 788.1 billion (31 December 2016 DKK 767.1 billion) as collateral for bonds issued by Realkredit Danmark, including mortgage-covered bonds, worth a total of DKK 758,4 billion (31 December 2016: DKK 726.7 billion). Note 15 provides additional information. Similarly, the Group had registered DKK 268,7 billion worth of loans and other assets (31 December 2016: DKK 261.1 billion) as collateral for covered bonds issued under Danish and Finnish law.
The table below shows assets provided as collateral for obligations, including obligations under repo transactions and securities lending:
2017 2016 (DKK millions) Repo Other Total Repo Other Total
Due from credit institutions - 24,832 24,832 - 41,409 41,409
Trading portfolio securities 206,227 69,614 275,841 189,494 63,751 253,245
Loans at fair value - 787,223 787,223 - 766,003 766,003
Loans at amortised cost - 269,162 269,162 - 277,635 277,635
Assets under insurance contracts - 323,289 323,289 - 273,760 273,760
Other assets - 90 90 - 119 119
Total 206,227 1,474,210 1,680,437 189,494 1,422,677 1,612,171
Own issued bonds 12,675 81,102 93,777 9,931 99,063 108,994
Total, including own issued bonds 218,902 1,555,312 1,774,214 199,425 1,521,740 1,721,165
Securities provided as collateral under agreements that entitle the counterparty to sell the securities or provide them as collateral for other loans amounted to DKK 206.2 billion at the end of 2017 (31 December 2016: DKK 189.5 billion).
At the end of 2017, the Group had received DKK 252.5 billion worth of securities (31 December 2016: DKK 267.4 billion) as collateral for reverse repo transactions, securities lending, derivatives transactions and other transactions entered into on the standard terms for such transactions. As the party receiving the collateral, the Group is entitled in many cases to sell the securities or provide the securities as collateral for other loans in exchange for returning similar securities to the counterparty at the expiry of the transactions. At the end of 2017, the Group had sold securities or provided securities as collateral worth DKK 155.9 billion (31 December 2016: DKK 150.2 billion).
The Group also receives many other types of assets as collateral in connection with its ordinary lending activities. The Group has not transferred the ownership of these assets. The risk management notes provide more details on assets received as collateral.

Danske Bank / Annual Report 2017112
112 Danske Bank / Annual Report 2017
Notes – Danske Bank Group
29. Offsetting of financial assets and liabilities
Offsetting of financial assets and liabilities in the financial statements requires some criteria to be fulfilled. In the event that the counterparty or the Group defaults, further offsetting will take place. This note shows the offsetting in the financial statements, further netting according to enforceable master netting agreements and similar agreements (i.e. in the event of default) and collateral provided or received under such agreements.
Accounting policy
Assets and liabilities are offset when the Group and the counterparty have a legally enforceable right to offset recognised amounts and have agreed to settle the balances on a net basis or to realise the asset and settle the liability simultaneously. Positive and negative fair values of derivatives with the same counterparty are offset if the Group has agreed with the counterparty to settle contractual cash flows net and to make cash payments or provide collateral on a daily basis to cover changes in the fair value of the derivative position. Master netting agreements or similar agreements give the right to additional offsetting in the event of default. Such agreements reduce the exposure further in the event of default, but do not qualify for offsetting in accordance with IFRS.
Gross amount Offsetting
Net amount presented in
balance sheet
Further offsetting, master netting
agreements Collateral Net amount
399,452 142,561 256,891 182,071 45,032 29,788
470,435 241,897 228,538 - 228,538 -
2017 (DKK millions)
Financial assets Derivatives with positive market value Reverse transactions Other financial assets 11,724 6,222 5,502 - - 5,502
Total 881,611 390,680 490,931 182,071 273,570 35,290
Financial liabilities Derivatives with negative market value 387,249 142,561 244,688 182,071 51,441 11,176
Repo transactions 462,268 241,897 220,371 - 218,902 1,469
Other financial liabilities 25,145 6,222 18,923 - - 18,923
Total 874,662 390,680 483,982 182,071 270,343 31,568
2016 (DKK millions)
Financial assets Derivatives with positive market value 520,722 194,290 326,433 241,600 43,886 40,946
Reverse transactions 426,480 182,006 244,474 - 244,474 -
Other financial assets 9,946 5,253 4,693 - - 4,693
Total 957,148 381,549 575,599 241,600 288,360 45,639
Financial liabilities Derivatives with negative market value 522,369 194,290 328,080 241,600 70,752 15,727
Repo transactions 381,730 182,006 199,724 - 199,425 299
Other financial liabilities 18,288 5,253 13,035 - - 13,035
Total 922,387 381,549 540,838 241,600 270,177 29,061

Danske Bank / Annual Report 2017 113
Danske Bank / Annual Report 2017 113
Notes – Danske Bank Group
30. Fair value information for financial instrumentsFinancial instruments are carried in the balance sheet at fair value or amortised cost. The Group breaks down its financial instruments according to the valuation method (note 1 provides additional information).
(a) Financial instruments at fair value
The fair value is the amount for which a financial asset or a financial liability can be exchanged between knowledgeable, willing parties. Fair value is measured on the basis of the following hierarchy:
The fair value hierarchy
Quoted price (level 1) consists of financial instruments that are quoted in an active market. The Group uses the price quoted in the principal market. Valuation based on observable input (level 2) consists of financial instruments valued substantially on the basis of observable input other than a
quoted price for the instrument itself. If a financial instrument is quoted in a market that is not active, the Group bases its measurement on the mostrecent transaction price. Adjustment is made for subsequent changes to market conditions, for instance, by including transactions in similarfinancial instruments that are assumed to be motivated by normal business considerations. For a number of financial assets and liabilities, nomarket exists. In such cases, the Group uses recent transactions in similar instruments and discounted cash flows or other generally acceptedestimation and valuation techniques based on market conditions at the balance sheet date to calculate an estimated value. This category coversinstruments such as derivatives valued on the basis of observable yield curves and exchange rates and illiquid mortgage bonds valued by referenceto the value of similar liquid bonds.
Valuation based on significant non-observable input (level 3): The valuation of certain financial instruments is based substantially on non-observableinput. Such instruments include unlisted shares, some unlisted bonds and a limited portion of the derivatives portfolio (2%).
If, at the balance sheet date, a financial instrument’s classification differs from its classification at the beginning of the year, the classification of the instrument changes. Changes are considered to have taken place at the balance sheet date. Developments in the financial markets have resulted in reclassifications between the categories. Some bonds have become illiquid and have therefore been moved from the Quoted prices to the Observable input category, while other bonds have become liquid and have been moved from the Observable input to the Quoted prices category.
Valuation techniques The most frequently used valuation techniques include the pricing of transactions with future settlement and swap models that apply present value calculations, credit pricing models and options models, such as Black & Scholes models. As part of the Group’s control environment, valuation models are validated by units that are independent of the business units that develop the models and trade in the products covered by the models. Validation is made to test the implementation, quality and operating stability of models to ensure that the models can be used for pricing and risk management of financial products.
Loans at fair value (mortgage loans) and bonds issued by Realkredit Danmark are recognised at the fair value of the issued bonds (the quoted price in an active market). The Group adjusts for changes to the fair value of the credit risk on borrowers. For loans granted to customers with objective evidence of impairment, such adjustment is made on the basis of an assessment of the expected cash flows from the loans. For the remaining portion of the portfolio, adjustments depend on the possibility of raising the administration margin on loans (credit margin) sufficiently to offset higher credit risk and market risk premiums on mortgage loans. No changes are made if the administration margin can be raised sufficiently. If it is not possible to raise the administration margin sufficiently or at all, a collective adjustment is made, reflecting trends in expected losses, unexpected losses (volatility) and the possibility of raising the administration margin in the future. The expected future cash flows are discounted at the current market rate with the addition of a risk premium. The adjustment is described further in note 15.
The value of derivatives, primarily long-term contracts, is determined on observable yields extrapolated to yield curves for the full duration of the contracts. Moreover, the very limited portfolio of credit derivatives is valued on the basis of observable input as well as assumptions about the probability of default (recovery rate). Unlisted shares are measured at fair value in accordance with the International Private Equity and Venture Capital Valuation Guidelines (IPEV) which are compliant with IFRS. IPEV guides the calculation of estimated fair value of unlisted shares as the price that would be received to sell an asset or paid to transfer a liability in an orderly transaction between market participants at the measurement date. Valuation methods include discounted cash flow models and pricing based on a multiple of earnings or equity.
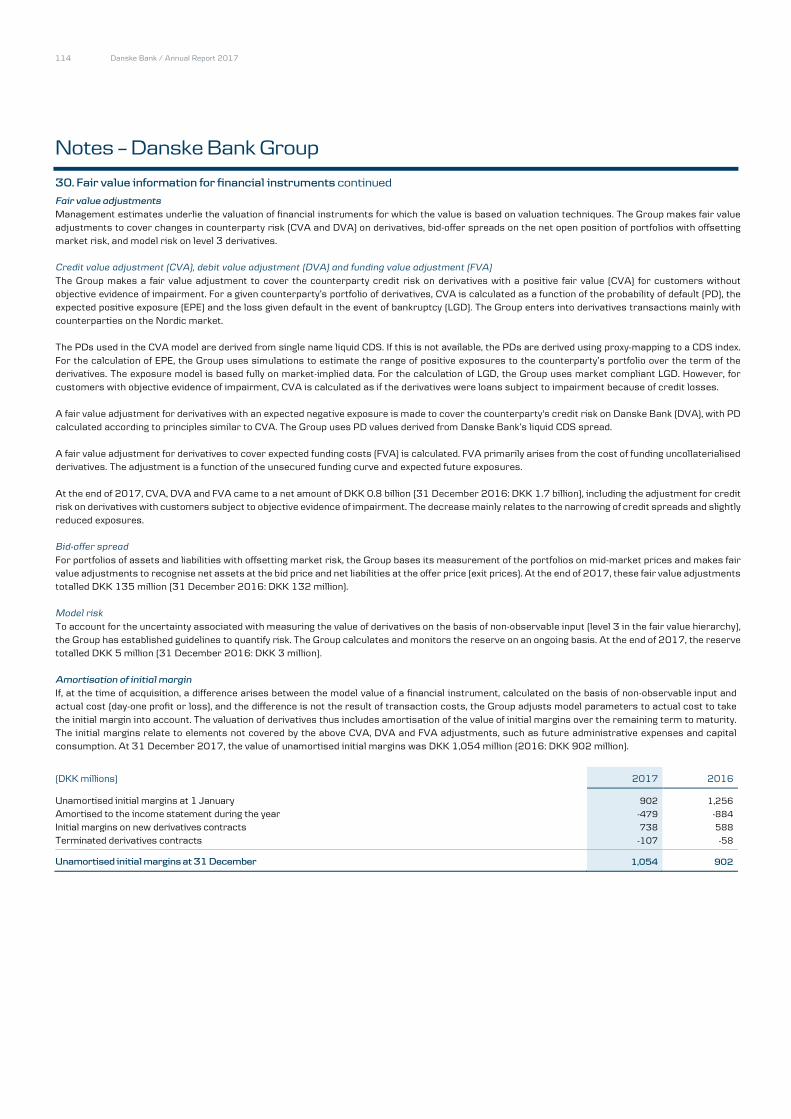
Danske Bank / Annual Report 2017114
114 Danske Bank / Annual Report 2017
Notes – Danske Bank Group
30. Fair value information for financial instruments continued
Fair value adjustments Management estimates underlie the valuation of financial instruments for which the value is based on valuation techniques. The Group makes fair value adjustments to cover changes in counterparty risk (CVA and DVA) on derivatives, bid-offer spreads on the net open position of portfolios with offsetting market risk, and model risk on level 3 derivatives.
Credit value adjustment (CVA), debit value adjustment (DVA) and funding value adjustment (FVA)
The Group makes a fair value adjustment to cover the counterparty credit risk on derivatives with a positive fair value (CVA) for customers without objective evidence of impairment. For a given counterparty’s portfolio of derivatives, CVA is calculated as a function of the probability of default (PD), the expected positive exposure (EPE) and the loss given default in the event of bankruptcy (LGD). The Group enters into derivatives transactions mainly with counterparties on the Nordic market.
The PDs used in the CVA model are derived from single name liquid CDS. If this is not available, the PDs are derived using proxy-mapping to a CDS index. For the calculation of EPE, the Group uses simulations to estimate the range of positive exposures to the counterparty’s portfolio over the term of the derivatives. The exposure model is based fully on market-implied data. For the calculation of LGD, the Group uses market compliant LGD. However, for customers with objective evidence of impairment, CVA is calculated as if the derivatives were loans subject to impairment because of credit losses.
A fair value adjustment for derivatives with an expected negative exposure is made to cover the counterparty's credit risk on Danske Bank (DVA), with PD calculated according to principles similar to CVA. The Group uses PD values derived from Danske Bank’s liquid CDS spread.
A fair value adjustment for derivatives to cover expected funding costs (FVA) is calculated. FVA primarily arises from the cost of funding uncollaterialised derivatives. The adjustment is a function of the unsecured funding curve and expected future exposures.
At the end of 2017, CVA, DVA and FVA came to a net amount of DKK 0.8 billion (31 December 2016: DKK 1.7 billion), including the adjustment for credit risk on derivatives with customers subject to objective evidence of impairment. The decrease mainly relates to the narrowing of credit spreads and slightly reduced exposures.
Bid-offer spread
For portfolios of assets and liabilities with offsetting market risk, the Group bases its measurement of the portfolios on mid-market prices and makes fair value adjustments to recognise net assets at the bid price and net liabilities at the offer price (exit prices). At the end of 2017, these fair value adjustments totalled DKK 135 million (31 December 2016: DKK 132 million).
Model risk
To account for the uncertainty associated with measuring the value of derivatives on the basis of non-observable input (level 3 in the fair value hierarchy), the Group has established guidelines to quantify risk. The Group calculates and monitors the reserve on an ongoing basis. At the end of 2017, the reserve totalled DKK 5 million (31 December 2016: DKK 3 million).
Amortisation of initial margin If, at the time of acquisition, a difference arises between the model value of a financial instrument, calculated on the basis of non-observable input and actual cost (day-one profit or loss), and the difference is not the result of transaction costs, the Group adjusts model parameters to actual cost to take the initial margin into account. The valuation of derivatives thus includes amortisation of the value of initial margins over the remaining term to maturity. The initial margins relate to elements not covered by the above CVA, DVA and FVA adjustments, such as future administrative expenses and capital consumption. At 31 December 2017, the value of unamortised initial margins was DKK 1,054 million (2016: DKK 902 million).
(DKK millions) 2017 2016
Unamortised initial margins at 1 January 902 1,256
Amortised to the income statement during the year -479 -884
Initial margins on new derivatives contracts 738 588
Terminated derivatives contracts -107 -58
Unamortised initial margins at 31 December 1,054 902

Danske Bank / Annual Report 2017 115
Danske Bank / Annual Report 2017 115
Notes – Danske Bank Group
30. Fair value information for financial instruments continued
(DKK millions) Quoted prices Observable
input Non-observable
input Total
31 December 2017
Financial assets Derivatives Interest rate contracts 5,431 157,871 4,203 167,505
Currency contracts etc. 800 87,330 1,255 89,385
Trading portfolio bonds Government bonds and other bonds 64,540 4,305 - 68,845
Danish mortgage bonds 29,383 5,132 - 34,515
Other covered bonds 52,074 1,064 - 53,138
Other bonds 13,336 3,747 - 17,083
Trading portfolio shares 18,624 - 197 18,821
Investment securities, bonds 156,298 20,164 - 176,462
Investment securities, shares 63 - 1,396 1,459
Loans at fair value - 787,223 - 787,223
Assets under pooled schemes and unit-linked investment contracts 112,065 - - 112,065
Assets under insurance contracts, bonds Danish mortgage bonds 37,251 6,264 - 43,515
Other bonds 114,191 1,989 4,016 120,196
Assets under insurance contracts, shares 81,496 - 17,842 99,338
Assets under insurance contracts, derivatives 428 9,944 4 10,376
Total 685,980 1,085,033 28,913 1,799,925
Financial liabilities Derivatives Interest rate contracts 5,606 142,724 4,798 153,128
Currency contracts etc. 732 89,773 1,054 91,559
Obligations to repurchase securities 153,975 1,858 76 155,909
Bonds issued by Realkredit Danmark 758,375 - - 758,375
Deposits under pooled schemes and unit-linked investment contracts - 119,901 - 119,901
Other issued bonds - 4,549 - 4,549
Total 918,688 358,805 5,928 1,283,420

Danske Bank / Annual Report 2017116
116 Danske Bank / Annual Report 2017
Notes – Danske Bank Group
30. Fair value information for financial instruments continued
(DKK millions) Quoted prices Observable
input Non-observable
input Total
31 December 2016
Financial assets Derivatives Interest rate contracts 3,582 200,720 6,657 210,958
Currency contracts etc. 997 113,569 907 115,475
Trading portfolio bonds Government bonds and other bonds 58,059 27 - 58,086
Danish mortgage bonds 25,062 7,064 - 32,126
Other covered bonds 51,353 1,601 - 52,954
Other bonds 14,251 4,463 - 18,714
Trading portfolio shares 20,934 - 432 21,366
Investment securities, bonds 154,740 53,477 - 208,217
Investment securities, shares 67 - 1,673 1,740
Loans at fair value - 766,003 - 766,003
Assets under pooled schemes and unit-linked investment contracts 99,848 - - 99,848
Assets under insurance contracts, bonds Danish mortgage bonds 38,893 4,252 - 43,145
Other bonds 109,158 830 4,803 114,791
Assets under insurance contracts, shares 74,676 - 18,843 93,519
Assets under insurance contracts, derivatives 612 10,615 3 11,230
Total 652,232 1,162,621 33,318 1,848,171
Financial liabilities Derivatives Interest rate contracts 3,710 182,527 7,641 193,878
Currency contracts etc. 998 131,285 1,919 134,202
Obligations to repurchase securities 146,694 3,523 5 150,221
Bonds issued by Realkredit Danmark 726,732 - - 726,732
Deposits under pooled schemes and unit-linked investment contracts - 106,418 - 106,418
Other issued bonds - 6,553 - 6,553
Total 878,134 430,306 9,565 1,318,005
At 31 December 2017, financial instruments valued on the basis of non-observable input comprised unlisted shares of DKK 19,359 million (2016: DKK 20,943 million), illiquid bonds of DKK 4,016 million (2016: DKK 4,803 million) and derivatives with a net market value of DKK -390 million (2016: DKK -1,993 million).
Unlisted shares of DKK 17,842 million (2016: DKK 18,843 million) are allocated to insurance contract policyholders, and the policyholders assume most of the risk on the shares. Changes in the fair value of these shares will only to a limited extent affect the Group’s net profit. The remaining portfolio of unlisted shares of DKK 1,517 million (2016: DKK 2,100 million) consists primarily of banking-related investments and holdings in private equity funds. A 10% increase or decrease in the fair value would amount to DKK 152 million (2016: DKK 210 million). Under the current market conditions, a 10% decrease in the fair value is considered to be below a possible alternative estimate of the fair value at the end of the year. In 2017, the Group recognised DKK 88 million in unrealised losses (2016: unrealised gains of DKK 15 million) and DKK 57 million in realised gains (2016: realised gains of DKK 386 million) on the shares. The unrealised adjustments in 2017 and 2016 were attributable to various unlisted shares. For shares allocated to insurance contract policyholders, the unrealised losses in 2017 amounted to DKK 218 million (2016: unrealised gains of DKK 383 million) and the realised gains to DKK 1,629 million (2016: DKK 1,798 million).
The estimated fair value of illiquid bonds depends significantly on the estimated credit spread. If the credit spread widens 50bp, fair value will decrease DKK 80 million (2016: DKK 85 million). If the credit spread narrows 50bp, fair value will increase DKK 83 million (2016: DKK 87 million).
A substantial number of derivatives valued on the basis of non-observable input are hedged by similar derivatives or are used for hedging the credit risk on bonds also valued on the basis of non-observable input. Changing one or more of the non-observable inputs to reflect reasonably possible alternative assumptions would not change the fair value of the derivatives significantly above what is already covered by the reserve related to fair value adjustment for model risk.

Danske Bank / Annual Report 2017 117
Danske Bank / Annual Report 2017 117
Notes – Danske Bank Group
30. Fair value information for financial instruments continued
Shares, bonds and derivatives valued on the basis of non-observable input
2017 2016
(DKK millions) Shares Bonds Derivatives Shares Bonds Derivatives
Fair value at 1 January 20,943 4,803 -1,993 18,516 3,170 -1,062
Value adjustment through profit or loss 1,556 -85 -345 2,552 95 -146
Acquisitions 3,073 1,445 251 25,940 3,851 -1,098
Sale and redemption -6,213 -2,147 1,196 -25,758 -2,313 438
Transferred from quoted prices and observable input - - - - - 22
Transferred to quoted prices and observable input - - 502 -307 - -146
Fair value end of period 19,359 4,016 -389 20,943 4,803 -1,993
The value adjustment through profit or loss is recognised under Net trading income. The transfer of derivatives to the Observable input category consists primarily of maturity reductions, implying that the yield curves have become observable.
(b) Financial instruments at amortised cost
In this section, the fair value of financial instruments recognised at amortised cost is presented. The fair value is based on quoted market prices, if available. If quoted prices are not available, the value is approximated to reflect the price that would have been fixed, had the terms been agreed at the balance sheet date.
The fair values disclosed below are determined on the basis of the following principles:
Investment securities (bonds classified as held-to-maturity), other issued bonds and subordinated debt
Quoted prices in an active market exist for a significant part of these financial instruments. If quoted prices in an active market do not exist, the Group uses an estimate of the current return required by the market to estimate the fair value.
Other financial instruments
The determination of the fair value of financial instruments recognised at amortised cost is based on the following preconditions relating to interest rate risk:
For a significant number of the Group’s deposits and loans, the interest rate depends on the standard variable rate fixed by the Group. The rate isadjusted only upon certain changes in market conditions. Such deposits and loans are considered to carry interest at a variable rate, as the standardvariable rate fixed by the Group at any time applies to both new and existing arrangements.
The interest rate risk on some fixed-rate loans extended by the Group is designated as a hedge of the interest rate risk on liabilities. Interest rate risk not hedging the interest rate risk on liabilities is hedged by derivatives. Such hedges are accounted for as fair value hedges, and the fair value of the hedged interest risk is adjusted in the carrying amount of the hedged financial instruments. Consequently, only fair value changes related to fixed-rate loans not hedged by derivatives are adjusted in the fair values presented in the table below.
For financial instruments that are only to a limited extent influenced by changes in credit risk, the amortised cost, including the adjustment for the fair value hedge accounting of the interest rate risk, is a reasonable approximation of fair value. This is the case for Due from/to credit institutions and central banks and Deposits.
For loans, the following adjustments are made to reach a fair value of the credit risk: The fair value of the Group’s syndicated loans etc. is estimated on the basis of the Group’s current required rate of return on similar transactions. As regards other loans, impairment charges are assumed to equal the fair value of the credit risk with the following adjustments:
The calculation of impairment charges for loans subject to individual impairment is based on the most likely outcome, and loans that are considered asset finance are written down to the fair value of collateral provided, i.e. assuming that restructuring is not possible. The fair value is adjusted by weighting all possible outcomes. For other loans, impairment charges are recognised if a customer is downgraded to reflect a change in the probability of default.
The credit margins on individual risks are accounted for by adjusting the fair value for the difference between the current credit premiumand the credit premium demanded at the balance sheet date.

Danske Bank / Annual Report 2017118
118 Danske Bank / Annual Report 2017
Notes – Danske Bank Group
30. Fair value information for financial instruments continued
In the table below, fair value is presented for classes of financial financial instruments for which the carrying amount is not a reasonable approximation of fair value.
2017 (DKK millions) Carrying amount Fair value Quoted prices
Observable input
Non-observable input
Financial assets Investment securities 146,697 148,585 127,361 21,224 -
Loans at amortised cost 1,112,752 1,109,259 - 19,144 1,090,115
Financial liabilities Other issued bonds 400,531 403,934 239,610 136,429 27,895
Subordinated debt 29,120 29,958 27,895 2,064 -
2016 (DKK millions)
Financial assets Investment securities 133,379 135,985 128,477 7,508 -
Loans at amortised cost 1,141,567 1,137,699 - 54,770 1,082,930
Financial liabilities Other issued bonds 385,960 388,800 217,868 139,983 30,949
Subordinated debt 37,831 37,971 26,247 11,646 78

Danske Bank / Annual Report 2017 119
Danske Bank / Annual Report 2017 119
Notes – Danske Bank Group
31. Non-financial assets recognised at fair value
Non-financial assets are recognised at fair value on a recurring or non-recurring basis after initial recognition. Investment property is measured at fair value on a recurring basis, and assets that are marketed for sale and expected to be sold within one year are written down to fair value less expected costs to sell, i.e. measured at fair value on a non-recurring basis.
Accounting policy
Investment property (fair value on recurring basis)
Investment property is recognised at fair value through profit or loss. Property investments are made for own investment purposes and recognised under Other assets, or on behalf of insurance customers and recognised under Assets under insurance contracts and Assets under pooled schemes and unit-linked investment contracts. Value adjustments of investment property are recognised under Other income.
The fair value is assessed by the Group’s valuers at least once a year on the basis of a discounted cash flow model.
Assets held for sale (fair value on non-recurring basis)
Assets held for sale are measured at the lower of cost and fair value less expected costs to sell and are no longer depreciated.
2017 2016
4,937 4,681
155 175
693 311
(a) Investment property (DKK millions)
Fair value at 1 January Value adjustment through profit or loss Acquisitions and improvements Sale 1,324 230
Fair value at 31 December 4,461 4,937
The investment properties included in the table above consist of investments made for own investment purposes. The valuations rely substantially on non-observable input. Valuations are based on cash flow estimates and on the required rate of return calculated for each property that reflects the price at which the property can be exchanged between knowledgeable, willing parties under current market conditions. The cash flow estimates are determined on the basis of the market rent for each property. The required rate of return on a property is determined on the basis of its location, type, possible uses, layout and condition as well as on the terms of lease agreements, rent adjustment and the credit quality of lessees. The required rate of return ranged between 2.5-10.0% (2016: 3.0-10.0%) and averaged 5.1% (2016: 5.8%). An increase in the required rate of return of 1.0 percentage point would reduce fair value at end-2017 by DKK 606 million (2016: 582 million).
Investment properties held on behalf of insurance customers amount to DKK 23,069 million (2016: 23,223 million), including DKK 604 million (2016: DKK 308 million) related to unit-linked investment contracts. Changes in the fair value of these will only to a limited extent affect the Group’s net profit. The valuation is based on the same principles as investements made for own investment purposes. The required rate of return ranged between 2.5-10.0% (2016: 3.7-10.0%) and averaged 4.8% (2016: 5.3%). An increase in the required rate of return of 1.0 percentage point would reduce fair value at end-2017 by DKK 4.302 million (2016: DKK 3,803 million).
(b) Assets held for sale
Assets held for sale are measured at the lower of cost and fair value less expected costs to sell. Assets held for sale are recognised under Other assets. Assets held for sale include domicile properties in Denmark. At the end of 2017, the remaining Danish domicile properties held for sale amounted to DKK 131 million (2016: 162 million). Note 22 provides more information. No significant changes in the fair value of non-financial assets held for sale occured during 2017.

Danske Bank / Annual Report 2017120
120 Danske Bank / Annual Report 2017
Notes – Danske Bank Group
32. Related parties
Danske Bank A/S acts as the bank of a number of its related parties. Payment services, trading in securities and other instruments, depositing of surplus liquidity and provision of short- and long-term financing are the primary services provided by Danske Bank A/S.
Danica Pension manages the pension plans of a number of related parties, and Danske Bank manages the assets of a number of the Group’s pension funds.
Accounting policy
A related party to the Group is either a party over which the Group has control or significant influence or a party that has control or significant influence over the Group. All entities over which the Group has control are consolidated and are therefore not considered a related party to the Group.
Entities that are related parties to the Group are shareholders that have a significant holding of shares (significant influence over the Group), associates, joint venture partners or defined benefit pension plan providers (the Group has significant influence over the entity). Further, key management personnel is defined members of the Board of Directors and the Executive Board and are related parties to the Group.
Transactions with related parties are settled on an arm’s-length basis and recognised in the financial statements according to the same accounting policy as for similar transactions with unrelated parties.
Parties with significant influence
Board of Directors
(a) Related parties Associates Executive Board
(DKK millions) 2017 2016 2017 2016 2017 2016 2017 2016
Loans and loan commitments 10,310 7,318 1,956 2,227 21 33 52 32
Securities and derivatives 1,020 1,655 7,246 6,513 - - - -
Deposits 1,403 415 205 432 24 55 14 12
Derivatives 197 167 - - - - - -
Pension obligation - - - - - - - -
Guarantees issued 615 758 2 2 - - - -
Guarantees and collateral received 524 681 423 138 20 31 49 33
Interest income 94 50 78 74 - - 1 1
Interest expense 14 25 - 6 - - - -
Fee income 17 10 3 2 1 - - -
Dividend income 5 19 93 323 - - - -
Other income 6 15 1 1 - - - -
Loan impairment charges - - -1 6 - - - -
Trade in Danske Bank shares Acquisitions - - - - - 1 - 1
Sales 2,348 4,143 - - - - 8 5
The Group is a listed company, with no shareholder having control over the Group. Related parties with significant influence include shareholders with holdings exceeding 20% of Danske Bank A/S’s share capital. The A.P. Møller and Chastine Mc-Kinney Møller Foundation and companies of A.P. Møller Holding Group, Copenhagen, hold 20.0% of the share capital. Note 35 lists significant holdings in associates. The Board of Directors and Executive Board columns list the personal facilities, deposits, etc. held by members of the Board of Directors and the Executive Board and their dependants, and facilities with businesses in which these parties have a controlling or significant influence.
In 2017, the average interest rates on credit facilities granted to members of the Board of Directors and the Executive Board were 2.3% (2016: 1.7%) and 1.8% (2016: 2.0%), respectively. Notes 33 and 34 specify the remuneration and shareholdings of management.
Pension funds set up for the purpose of paying out pension benefits to employees of Danske Bank Group are also considered related parties. Danske Bank Group has entered into transactions with these funds. Such transactions are not eliminated in the consolidated financial statements. Transactions with pension funds comprised loans in the amount of DKK 6 million (2016: DKK 9 million), deposits in the amount of DKK 137 million (2016: DKK 128 million), DKK 27 million worth of bonds issued (2016: DKK 167 million), derivatives with a positive fair value of DKK 0 million (2016: DKK 0 million), derivatives with a negative fair value of DKK 868 million (2016: DKK 1,045 million), interest expenses of DKK 3 million (2016: DKK 6 million), fee income of DKK 0 million (2016: DKK 1 million) and pension contributions of DKK 295 million (2016: DKK 399 million).
The figures above do not include debt to related parties in the form of issued notes or bonds. Such notes or bonds are bearer securities, which means that Danske Bank does not know the identity of the holders. Danske Bank shares may be registered by name. Related parties’ holdings of Danske Bank shares equalling 5% or more of Danske Bank’s share capital are determined on the basis of the most recent reporting of holdings to Danske Bank.
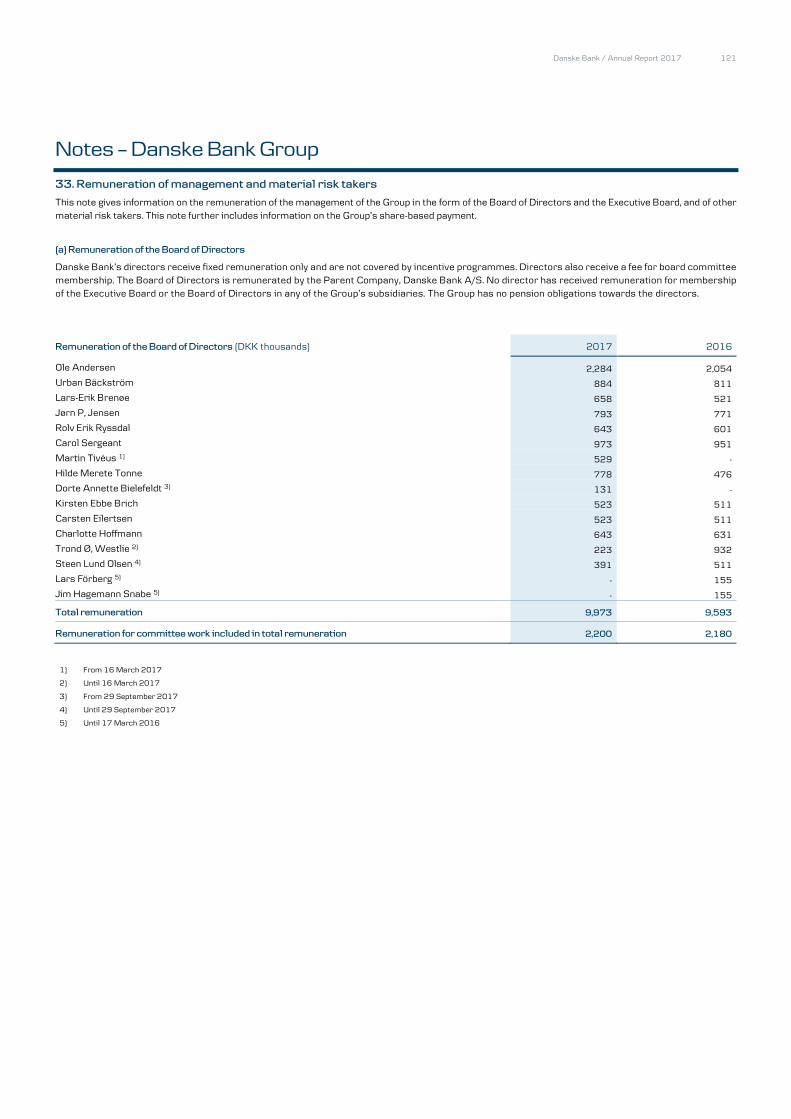
Danske Bank / Annual Report 2017 121
Danske Bank / Annual Report 2017 121
Notes – Danske Bank Group
33. Remuneration of management and material risk takers
This note gives information on the remuneration of the management of the Group in the form of the Board of Directors and the Executive Board, and of other material risk takers. This note further includes information on the Group’s share-based payment.
(a) Remuneration of the Board of Directors
Danske Bank’s directors receive fixed remuneration only and are not covered by incentive programmes. Directors also receive a fee for board committee membership. The Board of Directors is remunerated by the Parent Company, Danske Bank A/S. No director has received remuneration for membership of the Executive Board or the Board of Directors in any of the Group’s subsidiaries. The Group has no pension obligations towards the directors.
2017 2016
2,284 2,054
884 811
658 521
793 771
643 601
973 951
529 -
778 476
131 -
523 511
523 511
643 631
223 932
391 511
- 155
Remuneration of the Board of Directors (DKK thousands)
Ole Andersen
Urban Bäckström
Lars-Erik Brenøe
Jørn P, Jensen
Rolv Erik Ryssdal
Carol Sergeant
Martin Tivéus 1)
Hilde Merete Tonne
Dorte Annette Bielefeldt 3)
Kirsten Ebbe Brich
Carsten Eilertsen
Charlotte Hoffmann
Trond Ø, Westlie 2)
Steen Lund Olsen 4)
Lars Förberg 5)
Jim Hagemann Snabe 5) - 155
Total remuneration 9,973 9,593
Remuneration for committee work included in total remuneration 2,200 2,180
1) From 16 March 2017
2) Until 16 March 2017
3) From 29 September 2017
4) Until 29 September 2017
5) Until 17 March 2016

Danske Bank / Annual Report 2017122
122 Danske Bank / Annual Report 2017
Notes – Danske Bank Group
33. Remuneration of management and material risk takers continued
(b) Remuneration of the Executive Board
For the Executive Board, a total remuneration of DKK 86.2 million for 2017 (2016: DKK 77.7 million) has been expensed, with fixed remuneration amounting to DKK 65.8 million (2016: DKK 60.5 million) and variable remuneration amounting to DKK 20.4 million (2016: DKK 17.2 million). Part of the fixed salary of the Executive Board is paid as shares (fixed salary shares). Variable remuneration cannot exceed 50% of the fixed salary. Part of the variable remuneration of the Executive Board is provided as a share-based Long-term Incentive Programme as described in section (d). The variable share-based payment for 2017 includes deferred variable payments from the Short-term Incentive Programme to be paid in future financial years, in accordance with EBA regulations, and prorated provisions for the Long-term Incentive Programme. “Total paid” remuneration comprises fixed salary, 2017 payments to pension plans, variable cash payments for 2016, pay-out of deferred cash payments for previous financial years and exercised rights to conditional shares for previous financial years.
Membership of the Board of Directors in one or more of the Group’s subsidiaries is not remunerated separately but considered part of the Executive Board responsibilities and hence part of the remuneration of the Executive Board.
Remuneration of the Executive Board
Thomas F. Jacob Tonny Thierry James Carsten Lars Jesper Glenn 2017 (DKK millions) Borgen Aarup-Andersen Andersen Ditmore Rasch Egeriis Mørch Nielsen Söderholm
Fixed salary* 11.5 6.8 7.0 7.6 3.3 6.5 5.0 6.6
Pension 2.2 0.3 1.3 - - 1.3 1.0 1.3
Variable cash payment** 0.8 0.4 0.3 0.5 5.4 0.4 0.3 0.5
Variable share-based payment 2.9 1.1 1.5 1.6 0.3 1.6 0.7 1.6
Total expensed 17.4 8.6 10.1 9.7 9.0 9.8 7.0 10.0
Total paid 15.4 8.0 9.3 9.4 8.6 8.6 6.4 9.5
* Fixed salary includes fixed cash salary, fixed salary shares and other benefits.
** Variable cash payment includes sign-on fees.
Carsten Rasch Egeriis joined the Executive Board on 1 August 2017. Gilbert Kohnke resigned from his position as member of the Executive Board on 31 July 2017. In the period from 1 January 2017 to 31 July 2017, the remuneration earned by Gilbert Kohnke was DKK 4.6 million, which consists of fixed salary of DKK 4.1 million, pension of DKK 0.0 million, variable cash payment of DKK 0.2 million and variable share-based payment of DKK 0.3 million. Paid remuneration amounts to DKK 4.5 million. Gilbert Kohnke’s employment with Danske Bank Group ended on 31 August 2017. From 1 August 2017 to 31 August 2017, Gilbert Kohnke earned a further DKK 0.7 million, which is included as remuneration to other material risk takers.
Thomas F. Jacob Tonny Thierry James Gilbert Lars Jesper Glenn 2016 (DKK millions) Borgen Aarup-Andersen Andersen Ditmore Kohnke Mørch Nielsen Söderholm
Fixed salary* 11.5 4.9 7.0 7.6 7.0 6.4 1.3 6.6
Pension 2.2 - 1.3 - - 1.1 0.2 1.4
Variable cash payment 1.2 0.5 0.7 0.6 0.5 0.6 0.1 0.5 Variable share-based payment 3.1 0.9 1.8 1.7 1.3 1.6 0.2 1.5
Total expensed 18.0 6.3 10.8 9.9 8.8 9.7 1.8 10.0
Total paid 14.7 5.0 9.0 8.1 7.4 8.0 1.5 8.2
*Fixed salary includes fixed cash salary, fixed salary shares and other benefits.
Jacob Aarup-Andersen joined the Executive Board on 1 April 2016. Jesper Nielsen joined the Executive Board on 1 October 2016. Henrik Ramlau-Hansen resigned from his position as member of the Executive Board on 31 March 2016 (during this period the remuneration earned was DKK 2.4 million, which consists of fixed salary of DKK 1.6 million, pension of DKK 0.4 million, variable cash payment of DKK 0.1 million and variable share-based payment of DKK 0.3 million).
Pension and termination (end of 2017)
Thomas F. Jacob Tonny Thierry James Carsten Lars Jesper Glenn Borgen Aarup-Andersen Andersen Ditmore Rasch Egeriis Mørch Nielsen Söderholm
Annual contribution Bank contributes
20% of salary p.a.
Bank contributes
20% of salary p.a.
Bank contributes
20% of salary p.a. - -
Bank contributes
20% of salary p.a.
Bank contributes
20% of salary p.a.
Bank contributes
20% of salary p.a.
Notice of termination by Danske Bank 18 months 18 months 18 months 18 months 18 months 18 months 18 months 18 months
Notice of termination by the board member 12 months 9 months 9 months 9 months 9 months 9 months 9 months 9 months
Non-competition clause 24 months 12 months 12 months 12 months 12 months 12 months 12 months 12 months

Danske Bank / Annual Report 2017 123
Danske Bank / Annual Report 2017 123
Notes – Danske Bank Group
33. Remuneration of management and material risk takers continued
(c) Remuneration of other material risk takers
Danske Bank Group is required to identify all employees whose professional activities could have a material impact on the risk profile of Danske Bank in accordance with current legislation. Other material risk takers do not include members of the Board of Directors or the Executive Board.
At the end of 2017, 726 other material risk takers were designated (end of 2016: 838 FTEs). During 2017, 752 full-time-equivalents were designated as other material risk takers (2016: 835 FTEs). The reduction in the number of material risk takers is due mainly to changes to the designation criteria for material risk takers. The 752 FTEs designated as other material risk takers earned remuneration of DKK 1,446 million (2016: 835 FTEs earned remuneration of DKK 1,585 million), with fixed remuneration amounting to DKK 1,103 million and variable remuneration amounting to DKK 343 million (2016: DKK 1,224 million and DKK 361 million, respectively). Variable pay for 2017 is estimated, as the final figure is determined at the end of February 2018. The final variable pay will be published in the Danske Bank Group Remuneration Report 2017, which provides additional quantitative information on the remuneration of material risk takers. Remuneration Report 2017 will be available at danskebank.com/remuneration and is expected to be published on 8 March 2018.
Of the above remuneration for 2017, 396 FTEs designated as other material risk takers at the Parent Company, Danske Bank A/S, earned remuneration of DKK 995 million (2016: DKK 1,133 million to 470 FTEs), with fixed remuneration amounting to DKK 734 million and variable remuneration amounting to DKK 261 million (2016: DKK 836 million and DKK 297 million, respectively).
The Group’s pension obligations towards other material risk takers amounted to DKK 846 million to 128 employees at year-end 2017 (31 December 2016: DKK 951 million and 144 employees).
Variable payment for other material risk takers is split into cash and shares according to EBA regulations. Further, 40-60% of variable payments are deferred for a minimum of three years. All variable payments are subject to claw back provisions if granted on the basis of data which has subsequently proven to be inaccurate.
(d) Share-based payment
The total expense recognised under Operating expenses in 2017 arising from share-based payments was DKK 150 million (2016: DKK 171 million). All share-based payments are equity-settled. The exact number of shares granted for 2017 will be determined at the end of February 2018.
Effective from 2010, the Group has granted rights to conditional shares under the bonus structure for material risk takers and other employees as part of their variable remuneration. Such employees have a performance agreement based on the performance of the Group, the business unit and the individual employee. Part of the Danske Bank shares granted to material risk takers are, as required by the EBA, deferred (see section (c) above on variable payment). The fair value at the grant date is measured at the expected monetary value of the underlying agreement.
Part of the fixed salary to the Executive Board is paid in shares (fixed salary shares). The amount of shares is determined on the basis of the share price each month. There are no vesting requirements attached to the fixed salary shares, and the shares are fully acquired by the Executive Board member each month. The variable remuneration of the Executive Board is provided as part of a Short-term Incentive Programme and a Long-term Incentive Programme. The Short-term Incentive Programme is structured as the programme for other material risk takers, as described above, with the exception that, according to EBA regulation, the rights to Danske Bank shares are deferred for five years, followed by a one-year retention period before the shares are available to trade. The Long-term Incentive Programme is based on total shareholder return performance relative to peers over a three-year performance period. The first pay-out will be in 2018, based on the performance in 2015, 2016 and 2017. The current 2017 Long-term Incentive Programme vests over three years (2017-2019). After the vesting period, part of the shares will be paid out. The remaining shares are deferred for five years, followed by a one-year retention period before the shares are available to trade. The deferred remuneration is subject to back-testing and claw-back. The fair value of the Long-term Incentive Programmes at the grant date was DKK 5.8 million for the 2017 programme and DKK 7.5 million for the 2016 programme. The fair value of the shares is calculated at the grant date, which includes valuing market conditions. The estimated fair value is based on relevant assumptions, which relate to the expected return on equity and volatility relative to peers. The fair value at grant date is expensed over the three-year vesting period.
From 2017, the Short-term Incentive Programme and the Long-term Incentive Programme apply to Group management, that is, the Executive Board and the Group heads of Human Resources and Marketing & Communications.

Danske Bank / Annual Report 2017124
124 Danske Bank / Annual Report 2017
Notes – Danske Bank Group
33. Remuneration of management and material risk takers continued
Conditional shares Number Fair value (FV)
Executive Other Employee payment At issue End of year
Board staff Total price (DKK) (DKK m) (DKK m)
Granted in 2013 1 January 2016 25,648 1,765,830 1,791,478 0.0-1.1 191.3 430.9
Vested 2016 -18,096 -1,351,868 -1,369,964 0.0-1.1 - -
Forfeited 2016 - -1,589 -1,589 - - -
Other changes 2016 -1,486 -193,352 -194,838 - - -
31 December 2016 6,066 219,021 225,087 0.0-1.1 24.0 54.1
Vested 2017 -6,066 -16,771 -22,837 0.0-1.1 - -
Forfeited 2017 - -12,845 -12,845 - - -
Other changes 2017 - - - - - -
31 December 2017 - 189,405 189,405 0.0-1.1 20.2 45.6
Granted in 2014 1 January 2016 45,977 804,438 850,415 0.0-1.4 115.3 204.4
Vested 2016 -8,674 -4,412 -13,086 0.0-1.4 - -
Forfeited 2016 - -30,329 -30,329 - - -
Other changes 2016 2,639 -2,639 - - - -
31 December 2016 39,942 767,058 807,000 0.0-1.4 109.4 193.9
Vested 2017 -19,845 -766,288 -786,133 0.0-1.4 - -
Forfeited 2017 - 6,788 6,788 - - -
Other changes 2017 - - - - - -
31 December 2017 20,097 7,558 27,655 0.0-1.4 3.8 6.7
Granted in 2015 1 January 2016 12,697 649,764 662,461 0.0-1.7 111.3 158.9
Vested 2016 - -5,424 -5,424 0.0-1.7 - -
Forfeited 2016 - -19,412 -19,412 - - -
Other changes 2016 -1,295 -1,822 -3,117 - - -
31 December 2016 11,402 623,106 634,508 0.0-1.7 106.6 152.2
Vested 2017 - - - - - -
Forfeited 2017 - -17,019 -17,019 - - -
Other changes 2017 - - - - - -
31 December 2017 11,402 606,087 617,489 0.0-1.7 103.7 148.2
Granted in 2016 1 January 2016 21,985 973,081 995,066 - 181.3 240.4
Vested 2016 - -334,841 -334,841 - - -
Forfeited 2016 - -34,419 -34,419 - - -
Other changes 2016 - - - - - -
31 December 2016 21,985 603,821 625,806 - 114.0 151.2
Vested 2017 - -1,683 -1,683 - - -
Forfeited 2017 - -17,292 -17,292 - - -
Other changes 2017 -2,562 4,655 2,093 - - -
31 December 2017 19,423 589,501 608,924 - 110.9 147.1
Granted in 2017 1 January 2017 27,464 827,251 854,715 - 203.0 206.5
Vested 2017 -505 -295,002 -295,507 - - -
Forfeited 2017 - -20,529 -20,529 - - -
Other changes 2017 - - - - - -
31 December 2017 26,959 511,720 538,679 - 127.9 130.1
Other staff includes material risk takers and other employees eligible for share-based payment.

Danske Bank / Annual Report 2017 125
Danske Bank / Annual Report 2017 125
Notes – Danske Bank Group
33. Remuneration of management and material risk takers continued
Holdings of the Executive Board and fair value at 31 December 2017 Grant year 2013-2017 FV Number (DKK m)
Thomas F. Borgen 18,121 4.4 Jacob Aarup-Andersen 3,596 0.9 Tonny Thierry Andersen 10,278 2.5 James Ditmore 27,250 6.6 Carsten Egeriis - - Lars Mørch 9,988 2.4 Jesper Nielsen 1,449 0.4 Glenn Söderholm 7,199 1.7
Holdings of the Executive Board and fair value at 31 December 2016 Grant year 2012-2016 FV
Number (DKK m)
Thomas F. Borgen 13,270 2.8
Jacob Aarup-Andersen 3,952 0.8
Tonny Thierry Andersen 8,261 1.8
James Ditmore 31,937 6.8
Gilbert Kohnke 2,562 0.5
Lars Mørch 7,691 1.6
Jesper Nielsen - -
Glenn Söderholm 11,722 2.5
In 2017, the average price at the vesting date for rights to conditional shares was DKK 240.6 (2016: DKK 191.4).

Danske Bank / Annual Report 2017126
126 Danske Bank / Annual Report 2017
Notes – Danske Bank Group
34. Danske Bank shares held by the Board of Directors and the Executive Board
Upon appointment/ (Number) Beginning of 2017 retirement Additions Disposals End of 2017
Board of Directors
Ole Andersen 53,199 - - - 53,199
Urban Bäckström 11,000 - - - 11,000
Lars-Erik Brenøe 14,302 - - - 14,302
Jørn P, Jensen 2,098 - - - 2,098
Rolv Erik Ryssdal 1,250 - - - 1,250
Carol Sergeant 5,073 - - - 5,073
Martin Tivéus - - - - -
Hilde Merete Tonne - - 1,000 - 1,000
Dorte Annette Bielefeldt - 2,286 - - 2,286
Kirsten Ebbe Brich 2,208 - - - 2,208
Carsten Eilertsen 120 - - - 120
Charlotte Hoffmann 2,175 - - - 2,175
Trond Ø Westlie 7,000 -7,000 - - -
Steen Lund Olsen 788 -788 - - -
Total 99,213 -5,502 1,000 - 94,711
Executive Board
Thomas F. Borgen 34,147 - 6,755 - 40,902
Jacob Aarup-Andersen 6,081 - 5,508 - 11,589
Tonny Thierry Andersen 25,769 - 4,685 2,201 28,253
James Ditmore 16,820 - 10,982 5,700 22,102
Carsten Rasch Egeriis - - 1,144 - 1,144
Lars Mørch 28,523 - 3,727 6,675 25,575
Jesper Nielsen 10,473 - 2,319 - 12,792
Glenn Söderholm 34,954 - 10,206 17,814 27,346
Gilbert Kohnke 4,949 -6,201 1,252 - -
Total 161,716 -6,201 46,578 32,390 169,703
Under the Danish Securities Trading Act, the acquisition and sale of Danske Bank shares by members of the Board of Directors and the Executive Board and related parties must be reported to the Danish FSA and be publicly disclosed when transactions exceed EUR 5,000 per calendar year. Danske Bank discloses all additions, disposals and total holdings of members of the Board of Directors and the Executive Board and related parties. Holdings of conditional shares of the members of the Executive Board are disclosed in note 33.

Danske Bank / Annual Report 2017 127
Danske Bank / Annual Report 2017 127
Notes – Danske Bank Group
35. Group holdings and undertakings
This note provides information on subsidiaries.
Accounting policy
The financial statements consolidate Danske Bank A/S and group undertakings in which the Group has control over financial and operating policy decisions. Control is said to exist if Danske Bank A/S, directly or indirectly, is exposed, or has rights, to variable returns from the involvement with the entity and has the ability to affect these returns through the power over the entity. Power exists if Danske Bank A/S, directly or indirectly, holds more than half of the voting rights in an undertaking or otherwise has power to control management and operating policy decisions. Operating policy control may be exercised through agreements about the undertaking’s activities. In the rare situations where potential voting rights exist, these are taken into account if Danske Bank has the practical ability to exercise these rights.
When assessing whether to consolidate investment funds, the Group reviews all facts and circumstances to determine whether the Group, as fund manager, is acting as agent or principal. The Group is deemed to be a principal, and hence controls and consolidates a fund, when the Group acts as fund manager and cannot be removed without cause (i.e. when kick-out rights are weak), has variable returns through significant holdings, and is able to influence the returns of the funds by exercising its power. Holdings where all returns belong to customers (pooled schemes and unit-linked investment contracts) are not considered as exposure to variable returns, whereas holdings where the majority of the returns belong to customers (holdings related to insurance contracts) are considered only limited exposure to variable returns.
The consolidated financial statements are prepared by consolidating items of the same nature and eliminating intra-group transactions, balances and trading profits and losses.
Undertakings acquired are included in the financial statements at the time of acquisition. The net assets of such undertakings (assets, including identifiable intangible assets, less liabilities and contingent liabilities) are measured at fair value at the date of acquisition according to the acquisition method.
If the cost of acquisition (until 1 January 2010 including direct transaction costs) exceeds the fair value of the net assets acquired, the excess amount is recognised as goodwill. Goodwill is recognised in the functional currency of the undertaking acquired. The portion of the acquisition that is attributable to non-controlling interests does not include goodwill.
Divested undertakings are included in the financial statements until the transfer date. Changes in the ownership share in a subsidiary that do not result in loss of control are accounted for as equity transactions. This implies that the carrying amounts of the controlling and non-controlling interests are adjusted to reflect the changes in the relative interest in the subsidiary, and any difference between the fair value of the consideration paid/received and the adjustment made to non-controlling interests is attributed to the shareholders of Danske Bank A/S. If changes in the ownership share in a subsidiary result in the loss of control, any investment retained in the former subsidiary is recognised at fair value and amounts recognised under Other comprehensive income are reclassified to the income statement or transferred directly to retained earnings if so required by other IFRSs. The difference between the fair value of the consideration received plus any investment retained in the former subisidiary and the carrying amount of the net assets in the subsidiary less the carrying amounts of any non-controlling interests is recognised in the income statement.
Held-for-sale group undertakings
Companies taken over by the Group under non-performing loan agreements and actively marketed for sale and expected to be sold within 12 months of classification are recognised as held-for-sale. Assets and liabilities in such companies are presented under Other assets and Other liabilities. The assets are recognised at the lower of cost and fair value less expected costs to sell.
(a) Further explanation
All credit institutions and insurance companies supervised by national FSAs are subject to local statutory capital requirements. These requirements restrict intra-group facilities and dividend payouts.
Danica Pension has an obligation to allocate part of the margin by which Danica Pension’s equity exceeds the statutory solvency requirement to certain policyholders who were previously policyholders of Statsanstalten for Livsforsikring (now part of Danica Pension). This applies only if the margin exceeds the margin in Statsanstalten for Livsforsikring before the privatisation in 1990 and relates to any excess included in the shareholders’ equity or paid out as dividend. Such special allotments are expensed and recognised under Net insurance benefits.
Restrictions impacting the Group’s ability to use assets are disclosed in note 28 and include, among others, assets pledged as collateral under repo transactions, loans behind covered bonds and assets held by insurance subsidiaries that are primarily held to satisfy obligations to policyholders’ savings.
The Group has established a number of investment funds in which the Group acts as fund manager. The Group has consolidated investment funds of DKK 11,306 million (2016: DKK 11,695 million) as the Group is deemed to be acting as principal rather than agent in its role as fund manager and as the Group is the sole investor. The investments are held to satisfy obligations towards insurance policyholders and are recognised under Assets under insurance contracts. The Group does not have consolidated structured entities in the form of securitisation vehicles or asset-backed financing vehicles.

Danske Bank / Annual Report 2017128
128 Danske Bank / Annual Report 2017
Notes – Danske Bank Group
35. Group holdings and undertakings continued
Share capital Net profit Shareholders' equity Share capital (thousands) (DKK m) (DKK m) (%)
Danske Bank A/S, Copenhagen DKK 9,368,277 20,900 168,256
Credit institutions
Realkredit Danmark A/S, Copenhagen DKK 630,000 4,181 49,347 100
Northern Bank Limited, Belfast GBP 218,170 389 6,225 100
Danske Mortgage Bank Plc, Helsinki EUR 70,000 27 1,813 100
Danske Hypotek AB (publ), Stockholm SEK 50,000 -5 33 100
Danske Bank International S.A., Luxembourg EUR 90,625 68 1,386 100
Danske Bank, St. Petersborg RUB 2,775,404 52 483 100
Insurance operations
Forsikringsselskabet Danica, Skadeforsikringsaktieselskab af 1999, Copenhagen DKK 1,000,000 1,609 17,122 100
Danica Pension, Livsforsikringsaktieselskab, Copenhagen DKK 1,100,000 1,225 17,947 100
Danica Pension Försäkringsaktiebolag, Stockholm SEK 100,000 72 397 100
Danica Pensjonsforsikring AS, Trondheim NOK 106,344 94 463 100
Investment and real property operations etc.
Danica Ejendomsselskab ApS, Copenhagen DKK 2,793,700 1,178 27,011 100
Danske Capital AS, Trondheim NOK 6,000 30 129 100
DDB Invest AB, Stockholm SEK 100,000 28 420 100
Danske Corporation, Delaware USD 4 - 2 100
Danske Invest Management A/S, Copenhagen DKK 118,000 108 377 100
Danske IT and Support services India Private Limited, Bangalore INR 3,278 33 62 100
Danske Leasing A/S, Copenhagen DKK 10,000 215 2,354 100
Danske Markets Inc., Delaware USD 1 26 159 100
Danske Private Equity A/S, Copenhagen DKK 5,000 35 50 100
Eiendomsmegler Krogsveen AS, Trondheim NOK 25,000 27 103 100
home a/s, Åbyhøj DKK 15,000 30 134 100
MobilePay Denmark A/S, Copenhagen DKK 10,500 - - 100
National Irish Asset Finance Ltd., Dublin EUR 32,383 - 174 100
UAB Danske Lizingas, Vilnius EUR 1,158 - 87 100
The list above includes significant active subsidiary operations only. In 2017, the subsidiaries Danske Mortgage Bank plc (Helsinki), Danske Hypotek AB (Stockholm) and MobilePay Denmark A/S were established or began activities. As of 31 December 2017, Danske Bank plc (Helsinki) no longer exists as it has been merged with Danske Bank A/S. The Group’s ownership share of the other subsidiaries is unchanged from 2016 to 2017. The financial information above is extracted from the companies’ most recent annual reports prior to 2 February 2018. MobilePay Denmark A/S has not yet published its first annual report.

Danske Bank / Annual Report 2017 129
Danske Bank / Annual Report 2017 129
Notes – Danske Bank Group
36. Interests in associates and joint arrangements
This note provides information about the Group’s interests in associates and joint arrangements.
Accounting policy Joint ventures and associates are entities other than group undertakings in which the Group has holdings and joint control with one or more parties or significant but not controlling influence, respectively. The Group generally classifies entities as joint ventures/associates if Danske Bank A/S, directly or indirectly, holds 20-50% of the share capital and has influence over management and operating policy decisions. Holdings in joint ventures and associates are recognised at cost at the date of acquisition and are subsequently measured according to the equity method. The proportionate share of the net profit or loss of the individual entity is included under Income from holdings in associates. The share is calculated on the basis of data from financial statements with balance sheet dates no earlier than three months before the Group’s balance sheet date. If objective evidence of impairment exists, the investment is recognised at the lower of carrying amount and present value of future cash flows.
The proportionate share of the profit or loss on transactions between associates/joint ventures and group undertakings is eliminated.
Ownership shares held by the Group’s insurance business are treated as held by a venture capital organisation and measured at fair value.
Share capital Net profit
Shareholders' equity
Share capital
Significant associates (thousands) (DKK m) (DKK m) (%)
LR Realkredit A/S, Copenhagen DKK 70,000 99 3,373 31
Sanistål A/S, Ålborg DKK 11,924 77 917 43
The total carrying amount of holdings in associates amounted to DKK 455 million (2016: DKK 653 million) and is presented under Other assets in note 22. The list above includes significant associates held at end-2017. The information is extracted from the companies’ most recent annual reports. LR Realkredit A/S is a credit institution engaged in industry-specific financing. The Group’s ownership share of the entity is the result of the conversion from a fund-owned entity into a limited company. Danske Bank’s shares in the entity can be sold subject to certain conditions. Sanistål, which was taken over by the Group under a non-performing loan agreement, is the only listed company. The investment had a market value of DKK 376 million at 31 December 2017 (2016: DKK 474 million).
The Group does not have any significant holdings in joint ventures or joint operations.
Apart from the fact that LR Realkredit A/S as a credit institution is supervised by the national FSA and subject to local statutory capital requirements, there are no other significant restrictions on the ability of associates to transfer funds to Danske Bank Group in the form of dividends or to repay loans granted.

Danske Bank / Annual Report 2017130
130 Danske Bank / Annual Report 2017
Notes – Danske Bank Group
37. Interests in unconsolidated structured entities
The Group has established a number of investment funds in which the Group act as fund manager. The Group is entitled to receive management fees based on the assets under management. The Group may also retain units in these funds. The assets in unconsolidated investment funds managed by the Group totalled DKK 705.1 billion (2016: DKK 662.4 billion). The Group retained holdings of DKK 110.2 billion (2016: DKK 99.6 billion) in these funds. Substantially all of these holdings are related to pooled schemes, unit-linked investment contracts and insurance contracts. Income generated to the Group in the form of management fees amounted to DKK 4.2 billion (2016: DKK 4.2 billion). Further, the Group has holdings in private equity investment funds of DKK 0.3 billion (2016: DKK 0.5 billion).
The Group has limited exposure to structured securitisation entities. The exposure dates back to the period between 2001-2007 when the Group acted as an investor. This involved the purchase of bonds and entering into facilities for securitisation assets that were either structurally senior or triple A-rated by at least one of the major rating agencies. The Group has not acted as a sponsor or an orginator, and none of the assets of the structured entities were previously held on the Group's balance sheet. The remaining exposure consists mainly of liquidity facilities and is reported as part of the credit exposure in the Non-core segment. At end-2017, the exposure amounted to DKK 4.9 billion (2016: DKK 6.6 billion). During the year, the Group did not provide any non-contractual financial or other support to any of the structural entities. The key risk on the portfolio relates to the underlying securitisation transactions, which consist mainly of commercial and residential mortgage loans originated in the UK and Germany.
38. Note to the cash flow statement
This note provides further information on the cash flow statement, including a reconciliation of the cash flows arising from financing activities.
Accounting policy The cash flow statement is prepared according to the indirect method. The statement is based on pre-tax profit for the year and shows the cash flows from operating, investing and financing activities as well as the increase or decrease in cash and cash equivalents during the year. Cash and cash equivalents consists of cash in hand and demand deposits with central banks as well as amounts due from credit institutions and central banks with an original maturity shorter than three months.
In the cash flow statement, cash flows are divided into cash flows from operations, investing activities and financing activities. Investing activities include cash flows from the sale or acquisition of tangible and intangible assets as well as businesses. Financing activities include cash flows from the Group’s issued subordinated debt, additional tier 1 capital (both liability- and equity-accounted bonds) and share capital.
Reconciliation of liabilities from financing activities Cash flows Non-cash changes
(DKK millions)
1 Jan.
2017 Issued Redeemed Foreign exchange
movement
Fair value changes
31 Dec. 2017
Subordinated debt 37,831 5,087 12,577 -633 -588 29,120
Fair value changes include the impact from fair value hedge accounting and amortisation of transaction costs. The cash flows from debt issued and redee-med are based on the applicable foreign exchange rate at the transaction date. In note 21, which shows changes in the nominal value of subordinated debt, issue and redemption amounts are based on the exchange rate at the balance sheet date.

Danske Bank / Annual Report 2017 131
Danske Bank / Annual Report 2017 131
Notes – Danske Bank Group
39. Implementation of IFRS 9 Financial Instruments and IFRS 15 Revenue from Contracts with Customers
Changes and impact on the Group’s financial statements of IFRS 9
On 1 January 2018, the Group will adopt IFRS 9 Financial Instruments issued by the IASB in July 2014. The standard provides revised principles for classification and measurement of financial instruments, introduces the expected credit loss impairment model and the new general hedge accounting model.
In accordance with the transition requirements of IFRS 9, comparative figures are not restated as retrospective application of the impairment requirements is not possible without the use of hindsight. Further, the Group has decided to use the option in IFRS 9 to continue to apply the hedge accounting requirements of IAS 39.
At Danske Bank Group, the IFRS 9 project has been driven centrally by the parent company, Danske Bank A/S. The project has been organised around different working groups covering the different aspects of IFRS 9 (Classification and Measurement, Impairment and Hedge accounting). Joint working groups, which all work under the same steering committee with members from Finance, Risk and Credit and of the significant legal entities of the Group, have been set up. The Audit Committee and the Risk Committee have received presentations during the project and are responsible for the final approval of the Group’s implementation of IFRS 9.
The Group has assessed the impact of IFRS 9 on the Group’s financial statements, including financial instruments related to the Group’s insurance activities in Danica Pension.
The table below shows the impact of the reclassification between amortised cost and fair value due to the implementation of IFRS 9. All reclassifications relate to the reclassification from amortised cost to fair value. The column ‘Impact of the remeasurement’ includes only remeasurement to fair value, i.e. it excludes the impact from the expected credit loss impairment model.
IAS 39 carrying amount at
31 Dec 2017 Reclassification Impact of
remeasurement
IFRS 9 carrying amount at 1 January
2018*
Due from credit institutions 334.0 -48.9 - 285.1
Loans at amortised cost 1,112.8 -173.2 - 939.5
Loans at fair value 787.2 222.2 -0.1 1009.3
Impact financial assets - - -0.1 -
Due to credit institutions 242.9 -156.5 - 86.4
Deposits 1,046.9 -153.2 - 893.7
Issued bonds and deposits at fair value - 398.9 -0.2 398.7
Other issued bonds 405.1 -89.2 - 315.9
Impact financial liabilities - - -0.2 -
Net impact on financial instruments from remeasurement* - - 0.1 -
* excluding impact from expected credit loss impairments
When IFRS 9 has been implemented, the allowance account will increase as expected credit losses are to be recognised for all financial assets at amortised cost. Impairments will be made for at least 12 months’ expected credit losses and the portfolio of financial assets for which lifetime expected credit losses are recognised will increase. Currently, impairments are made only for incurred losses. The measurement of the credit risk of loans recognised at fair value (primarily mortgage loans granted by Realkredit Danmark) will continue to be based on the same approach as that used for impairment of loans at amortised cost. Hence, the fair value of the credit risk on loans at fair value will, from 2018, be based on the expected credit loss approach of IFRS 9 with some adjustments made to reflect the measurement basis being fair value instead of amortised cost. The allowance account is expected to increase by approximately DKK 2.5 billion, including the impact on loans at fair value of approximately DKK 0.4 billion.
The total impact on shareholders’ equity, net of tax, of the implementation of IFRS 9 is expected to be approximately DKK 2.0 billion.
Below, the changes due to the implementation of IFRS 9, including the new accounting policy, is further explained.
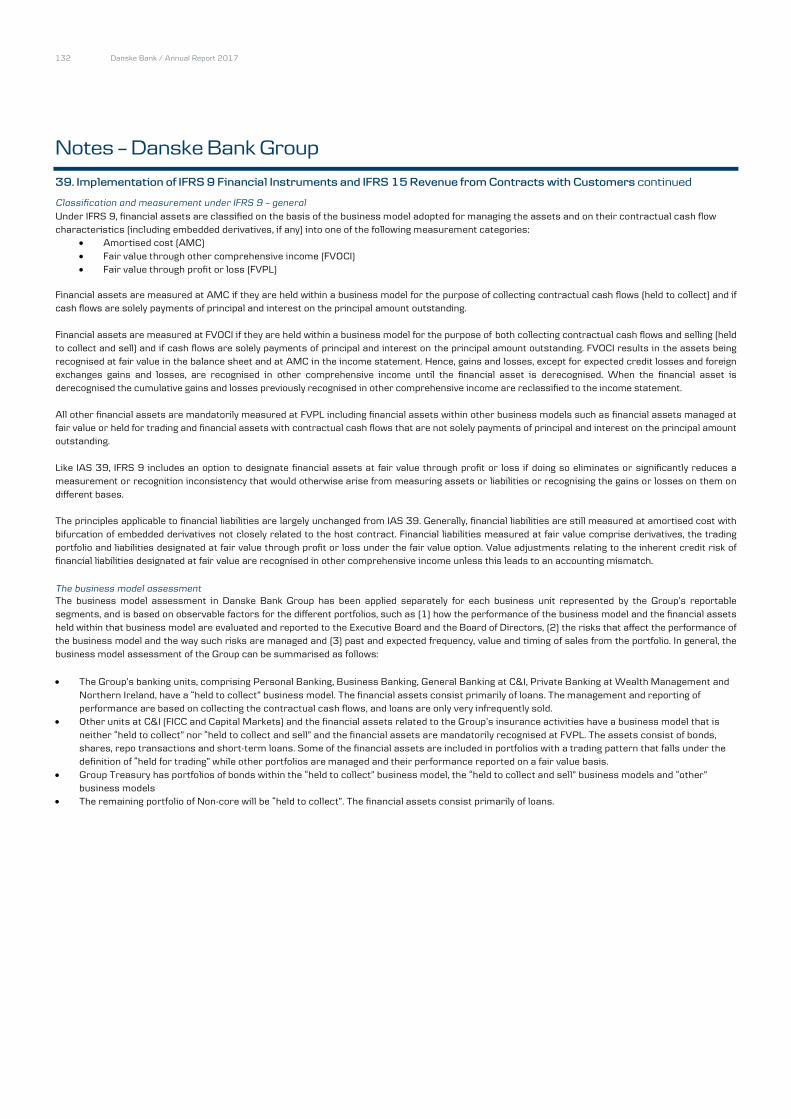
Danske Bank / Annual Report 2017132
132 Danske Bank / Annual Report 2017
Notes – Danske Bank Group
39. Implementation of IFRS 9 Financial Instruments and IFRS 15 Revenue from Contracts with Customers continued
Classification and measurement under IFRS 9 – general
Under IFRS 9, financial assets are classified on the basis of the business model adopted for managing the assets and on their contractual cash flow characteristics (including embedded derivatives, if any) into one of the following measurement categories:
Amortised cost (AMC) Fair value through other comprehensive income (FVOCI) Fair value through profit or loss (FVPL)
Financial assets are measured at AMC if they are held within a business model for the purpose of collecting contractual cash flows (held to collect) and if cash flows are solely payments of principal and interest on the principal amount outstanding.
Financial assets are measured at FVOCI if they are held within a business model for the purpose of both collecting contractual cash flows and selling (held to collect and sell) and if cash flows are solely payments of principal and interest on the principal amount outstanding. FVOCI results in the assets being recognised at fair value in the balance sheet and at AMC in the income statement. Hence, gains and losses, except for expected credit losses and foreign exchanges gains and losses, are recognised in other comprehensive income until the financial asset is derecognised. When the financial asset is derecognised the cumulative gains and losses previously recognised in other comprehensive income are reclassified to the income statement.
All other financial assets are mandatorily measured at FVPL including financial assets within other business models such as financial assets managed at fair value or held for trading and financial assets with contractual cash flows that are not solely payments of principal and interest on the principal amount outstanding.
Like IAS 39, IFRS 9 includes an option to designate financial assets at fair value through profit or loss if doing so eliminates or significantly reduces a measurement or recognition inconsistency that would otherwise arise from measuring assets or liabilities or recognising the gains or losses on them on different bases.
The principles applicable to financial liabilities are largely unchanged from IAS 39. Generally, financial liabilities are still measured at amortised cost with bifurcation of embedded derivatives not closely related to the host contract. Financial liabilities measured at fair value comprise derivatives, the trading portfolio and liabilities designated at fair value through profit or loss under the fair value option. Value adjustments relating to the inherent credit risk of financial liabilities designated at fair value are recognised in other comprehensive income unless this leads to an accounting mismatch.
The business model assessment
The business model assessment in Danske Bank Group has been applied separately for each business unit represented by the Group’s reportable segments, and is based on observable factors for the different portfolios, such as (1) how the performance of the business model and the financial assets held within that business model are evaluated and reported to the Executive Board and the Board of Directors, (2) the risks that affect the performance of the business model and the way such risks are managed and (3) past and expected frequency, value and timing of sales from the portfolio. In general, the business model assessment of the Group can be summarised as follows:
The Group’s banking units, comprising Personal Banking, Business Banking, General Banking at C&I, Private Banking at Wealth Management andNorthern Ireland, have a “held to collect” business model. The financial assets consist primarily of loans. The management and reporting of performance are based on collecting the contractual cash flows, and loans are only very infrequently sold.
Other units at C&I (FICC and Capital Markets) and the financial assets related to the Group’s insurance activities have a business model that is neither “held to collect” nor “held to collect and sell” and the financial assets are mandatorily recognised at FVPL. The assets consist of bonds, shares, repo transactions and short-term loans. Some of the financial assets are included in portfolios with a trading pattern that falls under thedefinition of “held for trading” while other portfolios are managed and their performance reported on a fair value basis.
Group Treasury has portfolios of bonds within the “held to collect” business model, the “held to collect and sell” business models and “other”business models
The remaining portfolio of Non-core will be “held to collect”. The financial assets consist primarily of loans.
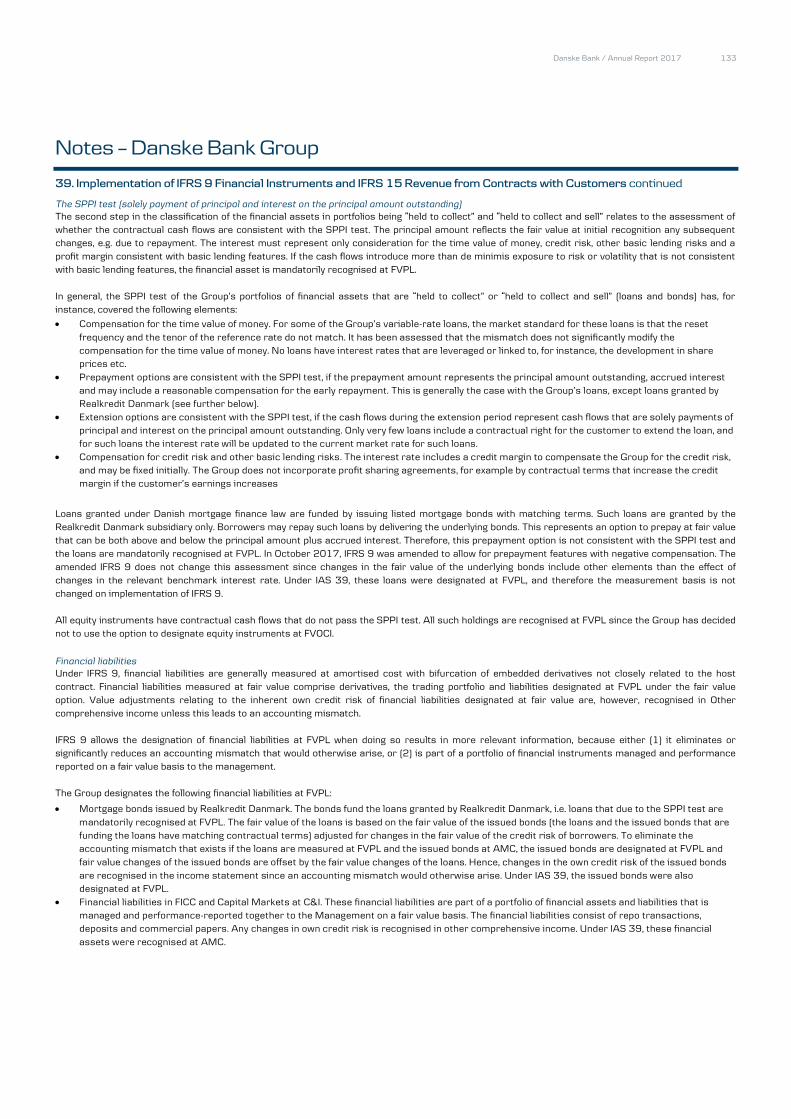
Danske Bank / Annual Report 2017 133
Danske Bank / Annual Report 2017 133
Notes – Danske Bank Group
39. Implementation of IFRS 9 Financial Instruments and IFRS 15 Revenue from Contracts with Customers continued
The SPPI test (solely payment of principal and interest on the principal amount outstanding)
The second step in the classification of the financial assets in portfolios being “held to collect” and “held to collect and sell” relates to the assessment of whether the contractual cash flows are consistent with the SPPI test. The principal amount reflects the fair value at initial recognition any subsequent changes, e.g. due to repayment. The interest must represent only consideration for the time value of money, credit risk, other basic lending risks and a profit margin consistent with basic lending features. If the cash flows introduce more than de minimis exposure to risk or volatility that is not consistent with basic lending features, the financial asset is mandatorily recognised at FVPL.
In general, the SPPI test of the Group’s portfolios of financial assets that are “held to collect” or “held to collect and sell” (loans and bonds) has, for instance, covered the following elements:
Compensation for the time value of money. For some of the Group’s variable-rate loans, the market standard for these loans is that the reset frequency and the tenor of the reference rate do not match. It has been assessed that the mismatch does not significantly modify the compensation for the time value of money. No loans have interest rates that are leveraged or linked to, for instance, the development in shareprices etc.
Prepayment options are consistent with the SPPI test, if the prepayment amount represents the principal amount outstanding, accrued interestand may include a reasonable compensation for the early repayment. This is generally the case with the Group’s loans, except loans granted by Realkredit Danmark (see further below).
Extension options are consistent with the SPPI test, if the cash flows during the extension period represent cash flows that are solely payments of principal and interest on the principal amount outstanding. Only very few loans include a contractual right for the customer to extend the loan, andfor such loans the interest rate will be updated to the current market rate for such loans.
Compensation for credit risk and other basic lending risks. The interest rate includes a credit margin to compensate the Group for the credit risk,and may be fixed initially. The Group does not incorporate profit sharing agreements, for example by contractual terms that increase the credit margin if the customer’s earnings increases
Loans granted under Danish mortgage finance law are funded by issuing listed mortgage bonds with matching terms. Such loans are granted by the Realkredit Danmark subsidiary only. Borrowers may repay such loans by delivering the underlying bonds. This represents an option to prepay at fair value that can be both above and below the principal amount plus accrued interest. Therefore, this prepayment option is not consistent with the SPPI test and the loans are mandatorily recognised at FVPL. In October 2017, IFRS 9 was amended to allow for prepayment features with negative compensation. The amended IFRS 9 does not change this assessment since changes in the fair value of the underlying bonds include other elements than the effect of changes in the relevant benchmark interest rate. Under IAS 39, these loans were designated at FVPL, and therefore the measurement basis is not changed on implementation of IFRS 9.
All equity instruments have contractual cash flows that do not pass the SPPI test. All such holdings are recognised at FVPL since the Group has decided not to use the option to designate equity instruments at FVOCI.
Financial liabilities
Under IFRS 9, financial liabilities are generally measured at amortised cost with bifurcation of embedded derivatives not closely related to the host contract. Financial liabilities measured at fair value comprise derivatives, the trading portfolio and liabilities designated at FVPL under the fair value option. Value adjustments relating to the inherent own credit risk of financial liabilities designated at fair value are, however, recognised in Other comprehensive income unless this leads to an accounting mismatch.
IFRS 9 allows the designation of financial liabilities at FVPL when doing so results in more relevant information, because either (1) it eliminates or significantly reduces an accounting mismatch that would otherwise arise, or (2) is part of a portfolio of financial instruments managed and performance reported on a fair value basis to the management.
The Group designates the following financial liabilities at FVPL:
Mortgage bonds issued by Realkredit Danmark. The bonds fund the loans granted by Realkredit Danmark, i.e. loans that due to the SPPI test are mandatorily recognised at FVPL. The fair value of the loans is based on the fair value of the issued bonds (the loans and the issued bonds that arefunding the loans have matching contractual terms) adjusted for changes in the fair value of the credit risk of borrowers. To eliminate the accounting mismatch that exists if the loans are measured at FVPL and the issued bonds at AMC, the issued bonds are designated at FVPL and fair value changes of the issued bonds are offset by the fair value changes of the loans. Hence, changes in the own credit risk of the issued bonds are recognised in the income statement since an accounting mismatch would otherwise arise. Under IAS 39, the issued bonds were also designated at FVPL.
Financial liabilities in FICC and Capital Markets at C&I. These financial liabilities are part of a portfolio of financial assets and liabilities that is managed and performance-reported together to the Management on a fair value basis. The financial liabilities consist of repo transactions, deposits and commercial papers. Any changes in own credit risk is recognised in other comprehensive income. Under IAS 39, these financialassets were recognised at AMC.

Danske Bank / Annual Report 2017134
134 Danske Bank / Annual Report 2017
Notes – Danske Bank Group
39. Implementation of IFRS 9 Financial Instruments and IFRS 15 Revenue from Contracts with Customers continued
The measurement basis for financial instruments at 1 January 2018 after the implementation of IFRS 9 but based on the carrying amount under IAS 39 (i.e. excluding remeasurement on the implementation) is summarised in the table below:
Amortised cost Fair value
OCI Fair value through profit or loss
(DKK billions)
Held to collect
financial assets Liabilities
Held to collect and
sell financial assets
Held for trading
Managed at fair value
FVPL due to SPPI
test Designated
Interest rate
hedge Total
Assets Cash in hand and demand deposits with central banks 83 - - - - - - - 83
Due from credit institutions and central banks 285 - - - 49 - - - 334
Derivatives - - - 249 - - - 8 257
Bonds 147 - 79 191 80 - - - 497
Shares - - - 19 1 - - - 20
Loans 938 - - - 173 787 - 2 1,900
Assets under pooled schemes and unit-linked investment contracts - - - - 112 - - - 112
Assets under insurance contracts - - - - 273 - - - 273
Total financial assets, 2017 1,453 - 79 459 688 787 10 10 3,476
Liabilities
Due to credit institutions and central banks - 86 - - - - 157 - 243
Trading portfolio liabilities - - - 401 - - - - 401
Deposits - 894 - - - - 153 - 1,047
Bonds issued by Realkredit Danmark - - - - - - 758 - 758
Deposits under pooled schemes and unit-linked investment contracts - - - - - - 120 - 120
Liabilities under insurance contracts - - - - - - 323 - 323
Other issued bonds - 311 - - - - 89 5 405
Subordinated debt - 29 - - - - - - 29
Loan commitments and guarantees - 1 - - - - - - 1
Total financial liabilities, 2017 - 1,321 - 401 - - 1,600 5 3,327
The expected credit loss impairment model
Impairments for expected credit losses apply to financial assets recognised at amortised cost or at fair value through other comprehensive income, lease receivables and certain loan commitments and financial guarantee contracts. For financial assets recognised at amortised cost, expected credit losses are recognised in the income statement and set off against the asset in the balance sheet. However, on loan commitments and financial guarantee contracts expected credit losses are recognised as a liability. For financial assets recognised at fair value through other comprehensive income, the expected credit losses are recognised in the income statement and set off against other comprehensive income since such assets are recognised at fair value in the balance sheet.
The impairment for expected credit losses depends on whether the credit risk has increased significantly since initial recognition and follows a three-stage model: Stage 1: If the credit risk has not increased significantly, the impairment equals the expected credit losses resulting from default events that are
possible within the next 12 months. Stage 2: If the credit risk has increased significantly, the financial assets are transferred to stage 2 and an impairment equal to the lifetime
expected credit losses is recognised. Stage 3: If a financial asset is in default or otherwise credit-impaired, it is transferred to stage 3, which is the same as stage 2, except that interest
income is recognised on the net carrying amount.

Danske Bank / Annual Report 2017 135
135 Danske Bank / Annual Report 2017
Notes – Danske Bank Group
39. Implementation of IFRS 9 Financial Instruments and IFRS 15 Revenue from Contracts with Customers continued
During 2015, the Group started to analyse the changes that will have to be implemented in the Group’s modelling framework and IT systems to handle the expected credit loss impairment model. The design of and changes to the Group’s modelling framework and IT systems started in the first quarter of 2016 and continued in 2017. The first version of the expected credit loss impairment model was finalised in the first quarter, and a parallel run has been undertaken during the remainder of 2017 to identify issues for refinement in the model. In the third quarter of 2017 the model was finalised.
The assessment of whether credit risk has increased significantly since initial recognition is performed by considering the change in the risk of default occurring over the remaining life of the instrument rather than by considering the increase in expected credit losses. A financial asset is transferred from stage 1 to stage 2 based on observed increases in the probability of default: For facilities originated below 1% in PD: An increase in the facility’s 12-month PD of at least 0.5 percentage points since origination and a
doubling of the facility’s lifetime PD since origination For facilities originated above 1% in PD: An increase in the facility’s 12-month PD of 2 percentage points since origination or a doubling of the
facility’s lifetime PD since origination
Further, financial assets that are more than 30 days past due are moved to stage 2. Finally, customers subject to forbearance measures are placed at stage 2, if the bank, in the most likely outcome, expects no loss or the customers are in the 2-year probation period for performing forborne exposures.
The major change from IAS 39 is the calculation of expected credit losses (either as 12 months expected credit losses or lifetime expected credit losses depending on whether facilities are at stage 1, 2 or 3) and the inclusion of forward-looking elements.
The expected credit loss is calculated for all individual facilities as a function of the probability of default (PD), the exposure at default (EaD) and the loss given default (LGD). In general, the Group’s IFRS 9 impairment models and parameters draw on the bank’s existing internal models in order to ensure alignment of models across the Group. New models and calculations have been developed especially for IFRS 9 purposes, including models for lifetime PD, prepayment and forward-looking LGD.
The lifetime expected credit losses cover the expected remaining lifetime of an instrument. For most instruments, the expected lifetime is limited to the remaining contractual maturity and adjusted for expected prepayment. For exposures with weak credit quality, the likelihood of prepayment is not included. For instruments that include both a loan and an undrawn commitment and where a contractual ability to demand prepayment and cancellation of the undrawn commitment do not limit the Group’s exposure to credit losses to the contractual notice period, the expected lifetime is the period during which the Group expects to be exposed to credit losses. This period is estimated on the basis of the normal credit risk management actions. Products identified as in scope of an expected lifetime longer than the remaining contractual maturity include credit cards, overdraft balances and certain revolving credit facilities.
The forward-looking elements of the calculation reflect the current unbiased expectations of the bank’s senior management. The process consists of the creation of macroeconomic scenarios (base case, upside and downside), including an assessment of the probability for each scenario, by the Group’s independent macroeconomic research unit in FICC, the review and sign-off of the scenarios (throughout the organisation) and a process for adjusting scenarios given new information during the quarter. Management’s approval of scenarios can include adjustments to the scenarios, probability weighting and management overlays to cover the outlook for particular high-risk portfolios, which are not provided by the Group’s macroeconomists. The approved scenarios are used to calculate the impairment levels. Technically, the forward-looking information is used directly in the PDs through an estimate of general changes to the PDs and the LGDs in the expected credit loss calculation. However, for significant exposures at stage 3, an individual assessment of the scenarios, changes to expected credit losses and the related probabilities are performed by senior credit officers.
The definition of default used in the measurement of expected credit losses and the assessment to determine movements between stages will be consistent with the definition of default used for internal credit risk management purposes and is aligned with CRR. Hence, exposures which are considered to be in default for regulatory purposes will always be considered stage 3 under IFRS 9. This applies to both 90-days-past-due considerations and unlikely-to-pay factors leading to a regulatory default.
All impairments will be allocated to individual impairments and the Group will cease to recognise collective impairments under IFRS 9. Existing collective impairments aimed at capturing specific high-risk areas are incorporated as forward-looking elements into the individual expected credit loss calculation
Expected credit losses on loans granted by Realkredit Danmark – change in estimates due to IFRS 9
For loans granted by Realkredit Danmark and recognised at FVPL, the fair value of the loans is based on the quoted and liquid price of the underlying Realkredit Danmark bonds that have similar terms to the loans and that the borrowers can use to repay the loans. On top of this, separate fair value adjustments are made to incorporate into the valuation of the loans the fact that the counterparties to the loans are borrowers/customers and not Realkredit Danmark.. The most important component is the credit risk on the borrower. The measurement of the fair value of the credit risk will continue to be based on the same approach as that used for impairment of loans at amortised cost. Hence, from 2018, the fair value of this credit risk will be measured on the basis of the expected credit loss approach of IFRS 9 as described above and including the allocation of the loans between stage 1, stage 2 and stage 3. On top of this, some adjustments are made to reflect the measurement basis being fair value and not amortised cost. The recognition of 12 months’ expected credit losses at initial recognition is inconsistent with fair value and is therefore not recognised. On the other hand, increases in lifetime credit losses are considered for the purpose of fair value even if an increase in credit risk is insignificant
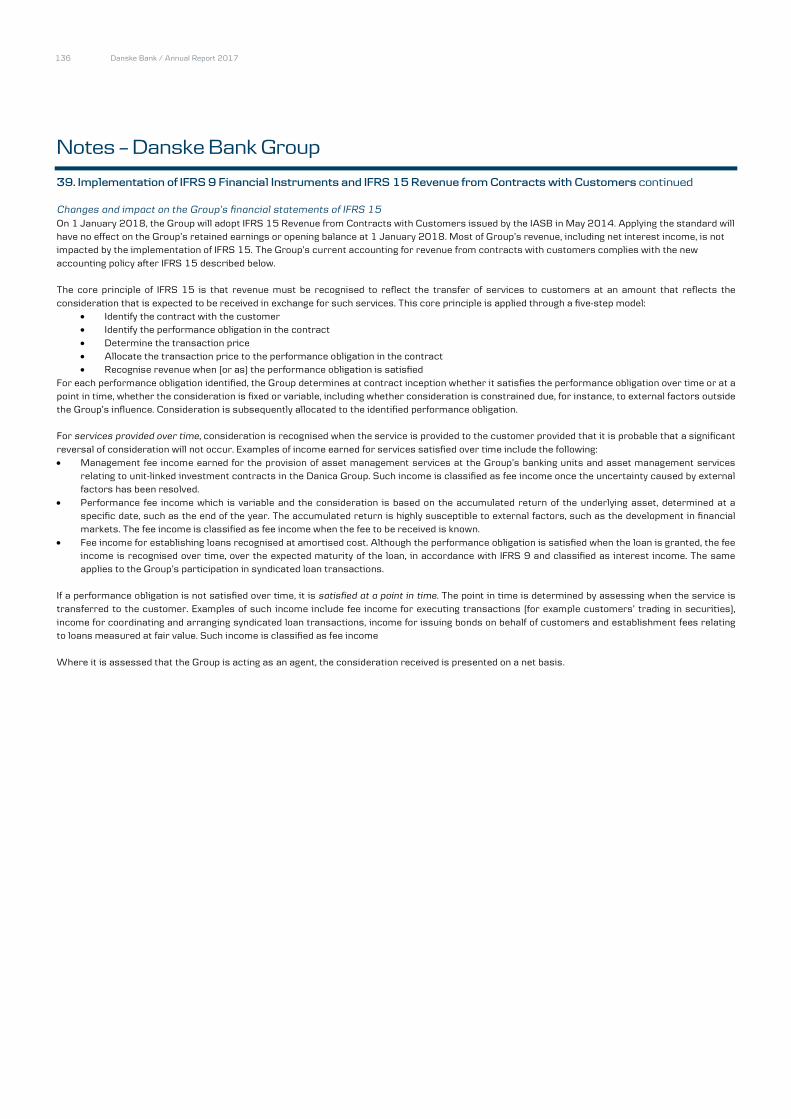
Danske Bank / Annual Report 2017136
136 Danske Bank / Annual Report 2017
Notes – Danske Bank Group
39. Implementation of IFRS 9 Financial Instruments and IFRS 15 Revenue from Contracts with Customers continued
Changes and impact on the Group’s financial statements of IFRS 15
On 1 January 2018, the Group will adopt IFRS 15 Revenue from Contracts with Customers issued by the IASB in May 2014. Applying the standard will have no effect on the Group’s retained earnings or opening balance at 1 January 2018. Most of Group’s revenue, including net interest income, is not impacted by the implementation of IFRS 15. The Group’s current accounting for revenue from contracts with customers complies with the new accounting policy after IFRS 15 described below.
The core principle of IFRS 15 is that revenue must be recognised to reflect the transfer of services to customers at an amount that reflects the consideration that is expected to be received in exchange for such services. This core principle is applied through a five-step model:
Identify the contract with the customer Identify the performance obligation in the contract Determine the transaction price Allocate the transaction price to the performance obligation in the contract Recognise revenue when (or as) the performance obligation is satisfied
For each performance obligation identified, the Group determines at contract inception whether it satisfies the performance obligation over time or at a point in time, whether the consideration is fixed or variable, including whether consideration is constrained due, for instance, to external factors outside the Group’s influence. Consideration is subsequently allocated to the identified performance obligation.
For services provided over time, consideration is recognised when the service is provided to the customer provided that it is probable that a significant reversal of consideration will not occur. Examples of income earned for services satisfied over time include the following: Management fee income earned for the provision of asset management services at the Group’s banking units and asset management services
relating to unit-linked investment contracts in the Danica Group. Such income is classified as fee income once the uncertainty caused by externalfactors has been resolved.
Performance fee income which is variable and the consideration is based on the accumulated return of the underlying asset, determined at aspecific date, such as the end of the year. The accumulated return is highly susceptible to external factors, such as the development in financialmarkets. The fee income is classified as fee income when the fee to be received is known.
Fee income for establishing loans recognised at amortised cost. Although the performance obligation is satisfied when the loan is granted, the feeincome is recognised over time, over the expected maturity of the loan, in accordance with IFRS 9 and classified as interest income. The sameapplies to the Group’s participation in syndicated loan transactions.
If a performance obligation is not satisfied over time, it is satisfied at a point in time. The point in time is determined by assessing when the service is transferred to the customer. Examples of such income include fee income for executing transactions (for example customers’ trading in securities), income for coordinating and arranging syndicated loan transactions, income for issuing bonds on behalf of customers and establishment fees relating to loans measured at fair value. Such income is classified as fee income
Where it is assessed that the Group is acting as an agent, the consideration received is presented on a net basis.

Danske Bank / Annual Report 2017 137
Danske Bank / Annual Report 2017 137
Notes – Danske Bank Group
40. Changes to financial highlights and segment reporting
From the first quarter of 2018, the following changes will be made to the financial highlights:
1. We have decided to integrate International banking into the business units in order to further ensure a seamless and value-creating experiencefor our international customers. In this process, we move our business in Germany, Poland and Russia from C&I to Business Banking effectivefrom 1 January 2018.
2. Income on derivatives with customers is split between the business segment to which the customer belongs and FICC (part of C&I) as payment for performing the trade. Historically, this income has been presented as Net trading income in FICC, and as Net interest income, Net fee income or Net trading income, depending on the type of derivative, in all other business segments. Effective from 1 January 2018, the presentation of customer income on derivatives in FICC will be aligned with the presentation in the other business segments as this better reflects the type of income and the fact that the income is customer-driven.
The table below shows the estimated effect of these changes on the financial highlights for 2017. Comparative figures for 2017 will be restated as from the interim financial statements for the first quarter of 2018.
(DKK Millions)
Highlights
2017
Transfer of Russia, Poland and Germany to
Business Banking
Profit share
derivatives in FICC Adjusted
highlights
2017C&I
Business
Banking
Net interest income 23,430 -145 145 376 23,806
Net fee income 15,304 -82 82 360 15,664
Net trading income 7,823 -90 90 -736 7,087
Other income 1,591 -1 1 - 1,591
Total income 48,149 -318 318 - 48,149
Operating expenses 22,722 -135 135 - 22,722
Profit before loan impairment charges 25,427 -183 183 - 25,427
Loan impairment charges -873 -1 1 - -873
Profit before tax, core 26,300 -182 182 - 26,300
Profit before tax, non-core -12 - - - -12
Profit before tax 26,288 -182 182 - 26,288

Danske Bank / Annual Report 2017138
138 Danske Bank / Annual Report 2017
Notes – Danske Bank Group – Risk management
Risk exposure
Danske Bank Group is exposed to a number of risks and manages them at various organisational levels.
The main categories of risk are the following: Credit risk: The risk of losses because debtors or counterparties fail to meet all or part of their payment obligations to the Group. Market risk: The risk of losses because the fair value of the Group’s assets, liabilities and off-balance-sheet items varies with changes in market
conditions. Liquidity risk: The risk of losses because funding costs become excessive, lack of funding prevents the Group from maintaining its business
model, or lack of funding prevents the Group from fulfilling its payment obligations. Insurance risk: All types of risk at Danica Pension, including market risk, life insurance risk and operational risk.
Danica Pension is a wholly-owned subsidiary of Danske Bank A/S. As required by Danish law and the Danish Executive Order on the Contribution Principle, Danica Pension has notified the Danish Financial Supervisory Authority (the Danish FSA) of its profit policy. The contribution principle and the profit policy mean that policyholders assume the risks and receive the returns on assets allocated to them. Assets are allocated to policyholders to secure their guaranteed benefits. Market risk and other risks on assets and liabilities allocated to policyholders are therefore not consolidated in the tables of this section, but are treated in the section on insurance risk.
The Management’s report and Risk Management 2017 provide a detailed description of Danske Bank Group’s risk management practices. Risk Management 2017 is available at danskebank.com/ir. The publication is not covered by the statutory audit.
Total capital
The Group’s capital management and practices support its business strategy and ensure that it is sufficiently capitalised to withstand even severe macroeconomic downturns.
Danske Bank Group has licences to provide financial services and must therefore comply with the capital requirements of the Capital Requirements Regulation (CRR) and the Danish Financial Business Act. The Danish rules are based on the EU Capital Requirements Directive (CRD IV) and apply to both Danske Bank A/S (the Parent Company) and the Group. Similarly, the Group’s financial subsidiaries in and outside Denmark must comply with local capital requirements. The regulatory requirements stipulate a minimum capital level of 8% of the total risk exposure amount (REA) under Pillar I (including risk exposure amounts for credit risk (including counterparty credit risk), market risk and operational risk). In addition, financial institutions are required to calculate their solvency need under Pillar II to reflect all relevant risks. Danske Bank A/S was designated a systemically important financial institution (SIFI) in Denmark in 2014. This means that the Group is subject to stricter requirements than non-SIFIs. Danske Bank Group’s SIFI buffer requirement is set at an additional 3% above the regulatory requirements for common equity tier 1 (CET1) capital. The SIFI buffer requirement phase-in began on 1 January 2015 and will be completed by 2019. The Group’s SIFI buffer requirement is currently 1.8%.
The Group’s total capital consists of tier 1 capital (share capital and additional tier 1 capital after deductions) and tier 2 capital (subordinated loan capital after deductions).
The Group’s CET1 capital is based on the carrying amount of shareholders’ equity with the following main adjustments: Domicile property revalued at its estimated fair value Adjustment for equity-accounted additional tier 1 capital Proposed dividends Intangible assets of banking operations, including goodwill Deferred tax assets that rely on future profitability Defined benefit pension fund assets Statutory deductions for insurance subsidiaries etc. Prudential filters Adjustments to eligible capital instruments (e.g. the remaining share buy-back programme)
The presentation of the Group’s total capital in the statement of capital shows the difference between the carrying amount of shareholders’ equity and CET1 capital. At the end of 2017, the Group’s CET1 capital amounted to DKK 132.7 billion (2016: DKK 132.7 billion), and its CET1 capital ra tio was 17.6% (2016: 16.3%)
The Group’s additional tier 1 capital and tier 2 capital may, subject to certain conditions, be included in total capital. The conditions are described in the CRR. Until the CRR is fully phased in, transitional rules apply to instruments that do not qualify for inclusion according to the CRR. Notes 21 and 23(b) show additional tier 1 capital and tier 2 capital. At the end of 2017, the Group’s total capital was DKK 170.3 billion (2016: DKK 178.0 billion), and its total capital ratio was 22.6% (2016: 21.8%). Tier 1 capital was DKK 151.1 billion (2016: DKK 156.1 billion), and the tier 1 capital ratio was 20.1% (2016: 19.1%).
Risk Management 2017 provides a description of the Group’s solvency need.
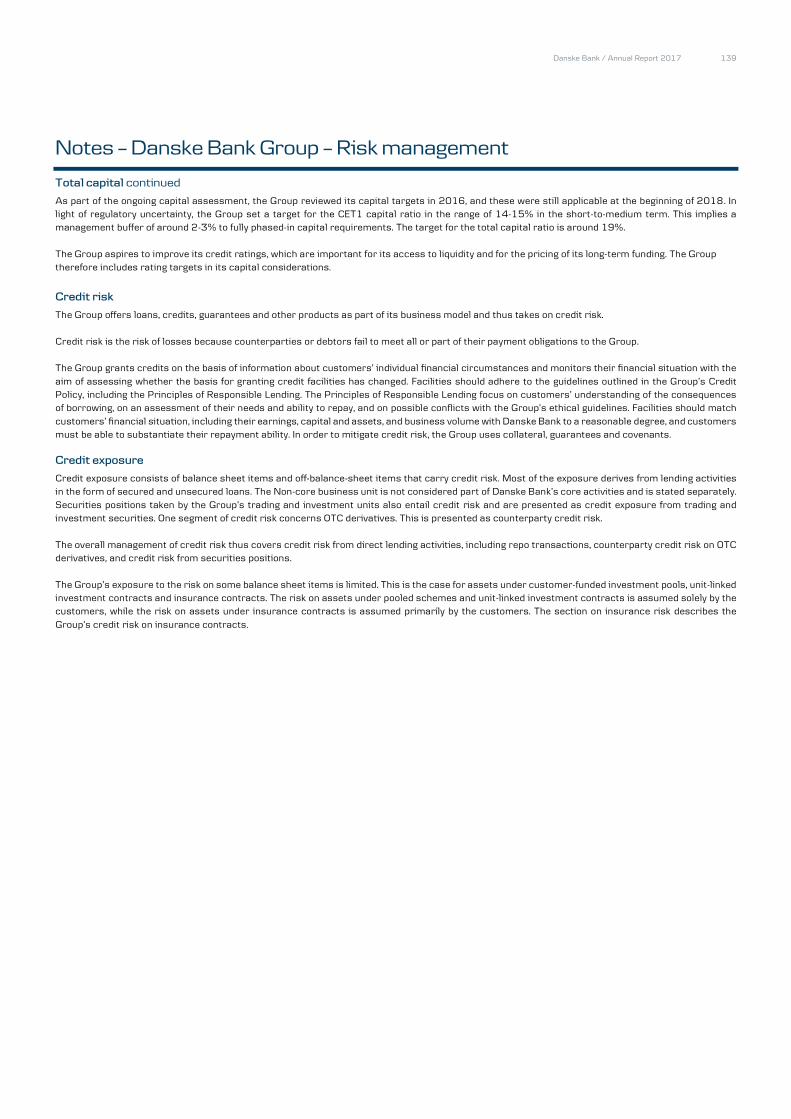
Danske Bank / Annual Report 2017 139
Danske Bank / Annual Report 2017 139
Notes – Danske Bank Group – Risk management
Total capital continued
As part of the ongoing capital assessment, the Group reviewed its capital targets in 2016, and these were still applicable at the beginning of 2018. In light of regulatory uncertainty, the Group set a target for the CET1 capital ratio in the range of 14-15% in the short-to-medium term. This implies a management buffer of around 2-3% to fully phased-in capital requirements. The target for the total capital ratio is around 19%.
The Group aspires to improve its credit ratings, which are important for its access to liquidity and for the pricing of its long-term funding. The Group therefore includes rating targets in its capital considerations.
Credit risk
The Group offers loans, credits, guarantees and other products as part of its business model and thus takes on credit risk.
Credit risk is the risk of losses because counterparties or debtors fail to meet all or part of their payment obligations to the Group.
The Group grants credits on the basis of information about customers’ individual financial circumstances and monitors their financial situation with the aim of assessing whether the basis for granting credit facilities has changed. Facilities should adhere to the guidelines outlined in the Group’s Credit Policy, including the Principles of Responsible Lending. The Principles of Responsible Lending focus on customers’ understanding of the consequences of borrowing, on an assessment of their needs and ability to repay, and on possible conflicts with the Group’s ethical guidelines. Facilities should match customers’ financial situation, including their earnings, capital and assets, and business volume with Danske Bank to a reasonable degree, and customers must be able to substantiate their repayment ability. In order to mitigate credit risk, the Group uses collateral, guarantees and covenants.
Credit exposure
Credit exposure consists of balance sheet items and off-balance-sheet items that carry credit risk. Most of the exposure derives from lending activities in the form of secured and unsecured loans. The Non-core business unit is not considered part of Danske Bank’s core activities and is stated separately. Securities positions taken by the Group’s trading and investment units also entail credit risk and are presented as credit exposure from trading and investment securities. One segment of credit risk concerns OTC derivatives. This is presented as counterparty credit risk.
The overall management of credit risk thus covers credit risk from direct lending activities, including repo transactions, counterparty credit risk on OTC derivatives, and credit risk from securities positions.
The Group’s exposure to the risk on some balance sheet items is limited. This is the case for assets under customer-funded investment pools, unit-linked investment contracts and insurance contracts. The risk on assets under pooled schemes and unit-linked investment contracts is assumed solely by the customers, while the risk on assets under insurance contracts is assumed primarily by the customers. The section on insurance risk describes the Group’s credit risk on insurance contracts.

Danske Bank / Annual Report 2017140140 Danske Bank / Annual Report 2017
Notes – Danske Bank Group – Risk management
Credit exposure continued
Breakdown of net credit exposure Lending activities
(DKK billions) 31 December 2017 Total Core Non-core
Counterpartycredit risk
(derivatives)
Trading and investment
securities Customer-funded
investments
Balance sheet items Demand deposits with central banks 73.8 73.8 - - - -
Due from credit institutions and central banks 277.7 277.7 - - - -
Repo loans with credit institutions and central banks 56.3 56.3 - - - -
Trading portfolio assets 449.3 - - 256.9 192.4 -
Investment securities 324.6 - - - 324.6 -
Loans at amortised cost 940.5 935.8 4.7 - - -
Repo loans 172.2 172.2 - - - -
Loans at fair value 787.2 787.2 - - - -
Assets under pooled schemes and unit-linked investment contracts 112.1 - - - - 112.1
Assets under insurance contracts 296.9 - - - - 296.9
Off-balance-sheet items Guarantees 84.5 84.5 - - - -
Loan commitments shorter than 1 year 142.1 139.4 2.8 - - -
Loan commitments longer than 1 year 161.8 161.2 0.6 - - -
Other unutilised commitments 0.4 - - - 0.4 -
Total 3,879.4 2,688.0 8.2 256.9 517.4 408.9
31 December 2016 Balance sheet items Demand deposits with central banks 43.9 43.9 - - - -
Due from credit institutions and central banks 200.6 200.5 - - - -
Repo loans with credit institutions and central banks 44.9 44.9 - - - -
Trading portfolio assets 509.7 - - 326.4 183.2 -
Investment securities 343.3 - - - 343.3 -
Loans at amortised cost 942.0 923.2 18.9 - - -
Repo loans 199.6 199.6 - - - -
Loans at fair value 766.0 766.0 - - - -
Assets under pooled schemes and unit-linked investment contracts 99.8 - - - - 99.8
Assets under insurance contracts 285.4 - - - - 285.4
Off-balance-sheet items Guarantees 80.4 80.3 - - - -
Loan commitments shorter than 1 year 117.4 113.7 3.7 - - -
Loan commitments longer than 1 year 162.6 161.8 0.9 - - -
Other unutilised commitments 0.5 - - - 0.5 -
Total 3,796.0 2,533.8 23.4 326.4 527.1 385.2
In addition to credit exposure from lending activities, the Group had made loan offers and granted uncommitted lines of credit of DKK 269 billion at 31 December 2017 (2016: DKK 287 billion).These items are included in the calculation of the total risk exposure amount in accordance with the Capital Requirements Directive.
.

Danske Bank / Annual Report 2017 141
Danske Bank / Annual Report 2017 141
Notes – Danske Bank Group – Risk management
Credit exposure continued
Credit exposure from core lending activities
Credit exposure from lending activities in the Group’s core banking business includes loans, amounts due from credit institutions and central banks, guarantees and irrevocable loan commitments. The exposure is measured net of accumulated impairment charges and includes repo loans. For reporting purposes, all collateral values are net of haircuts and capped at the exposure amount. The credit exposure from Non-core lending activities is disclosed later in these notes.
Classification of customers
The main objectives of risk classification are to rank the Group’s customers according to risk and to estimate each customer’s probability of default (PD). As part of the credit process, the Group classifies customers according to risk and updates their classifications upon receipt of new information. Risk classification comprises rating and credit scoring of customers.
The Group has developed a number of classification models to assess customer PD and to classify customers in various segments. Large business and financial customers are classified on the basis of rating models, while small business and personal customers are classified by means of scoring models.
In its credit risk management, the Group uses point-in-time (PIT) PD estimates for risk classification. These PIT PD estimates express a customer’s probability of default in the current economic situation. The Group’s classification scale consists of 11 main rating categories with fixed PD bands. During a downturn, a customer’s PIT PD may increase, and the customer may migrate to a lower rating category. The effect from a downturn is thus larger when PIT PD is used than if the classification were based on through-the-cycle (TTC) PD, which the Group uses to calculate the risk exposure amount for credit risk.
Customers with loans for which objective evidence of impairment exists are placed in rating category 10 or 11. This includes customers with loans for which no impairment charges have been recognised, for example because adequate collateral has been provided.
At the end of 2017, the exposure-weighted average PD was 0.64%, against 0.73% in 2016.
Credit portfolio in core activities broken down by rating category
2017 2016
PD level Gross
exposure
Acc. individual
impairment charges
Net exposure
Net exposure, ex collateral
Gross exposure
Acc. individual
impairment charges
Net exposure
Net exposure, ex collateral
(DKK billions) Upper Lower a b =a-b a b =a-b
1 - 0.01 323.8 - 323.8 291.1 251.3 - 251.3 224.9
2 0.01 0.03 268.6 - 268.6 124.2 252.9 - 252.9 102.9
3 0.03 0.06 436.6 - 436.6 139.3 414.1 - 414.1 127.5
4 0.06 0.14 586.7 - 586.7 227.6 544.3 - 544.3 217.6
5 0.14 0.31 489.1 - 489.1 157.6 460.7 - 460.7 144.2
6 0.31 0.63 297.7 - 297.7 82.2 302.1 - 302.1 79.7
7 0.63 1.90 170.3 - 170.3 44.7 178.7 - 178.7 47.6
8 1.90 7.98 56.5 - 56.5 15.9 64.2 - 64.2 17.3
9 7.98 25.70 11.2 - 11.2 3.7 14.2 - 14.2 4.8
10 25.70 99.99 37.2 6.0 31.3 9.2 40.9 6.0 35.0 10.4
11 (default) 100.00 100.00 26.1 10.0 16.1 2.1 28.9 12.5 16.3 1.2
Total before collective impairment charges 2,703.9 16.0 2,688.0 1,097.5 2,552.3 18.5 2,533.8 978.1
Collective impairment charges 4.1 5.0
Total gross exposure 2,708.0 2,557.3

Danske Bank / Annual Report 2017142
142 Danske Bank / Annual Report 2017
Notes – Danske Bank Group – Risk management
Credit exposure continued
Credit portfolio in core activities broken down by industry (NACE)
The table below breaks down credit exposure by industry. The industry segmentation follows the classification principles of the Statistical Classification of Economic Activities in the European Community (NACE) standard.
2017 2016
Gross exposure
Acc. individual impairment
charges Net
exposure
Net exposure, ex collateral
Gross
exposure
Acc. individual impairment
charges Net
exposure
Net exposure, ex collateral
(DKK billions) a b =a-b a b =a-b
Public institutions 414.4 - 414.4 369.3 330.0 - 330.0 274.9
Banks 53.2 0.1 53.1 40.4 70.2 0.1 70.0 59.6
Credit institutions 9.4 - 9.4 3.9 10.7 - 10.7 3.5
Insurance 38.2 - 38.2 4.8 47.4 - 47.4 8.0
Investment funds 24.9 0.2 24.7 10.7 40.8 0.2 40.6 8.8
Other financials 92.8 - 92.8 19.6 61.0 - 61.0 14.0
Agriculture 65.1 2.5 62.5 11.3 65.7 3.0 62.7 11.3
Commercial property 299.4 2.5 296.9 55.3 301.8 3.1 298.7 57.1
Construction, engineering and building products 45.1 0.5 44.6 33.4 39.5 1.0 38.5 28.9
Consumer discretionary 107.1 1.3 105.8 59.5 98.3 1.5 96.8 56.6
Consumer staples 57.8 0.2 57.6 41.0 55.1 0.2 54.9 37.6
Energy and utilities 51.1 0.4 50.7 41.0 50.0 0.2 49.8 37.3
Health care 34.9 0.1 34.8 29.0 36.7 0.1 36.6 24.7
Industrial services, supplies and machinery 96.7 1.1 95.6 77.6 103.8 1.2 102.6 81.2
IT and telecommunication services 30.6 0.1 30.5 28.1 29.9 0.1 29.8 26.1
Materials 50.5 0.5 49.9 38.1 45.7 0.8 45.0 33.5
Non-profits and other associations 170.3 0.7 169.6 39.4 152.5 0.8 151.7 28.7
Other commercials 85.8 0.2 85.6 37.9 58.1 0.3 57.8 25.6
Shipping 36.7 0.7 36.0 13.1 39.7 0.7 39.0 14.1
Transportation 24.6 0.1 24.5 13.1 22.0 0.1 21.9 12.1
Personal customers 915.5 4.8 910.6 131.1 893.5 5.1 888.4 134.4
Total before collective impairment charges 2,703.9 16.0 2,688.0 1,097.5 2,552.3 18.5 2,533.8 978.1
Collective impairment charges 4.1 5.0
Total gross exposure 2,708.0 2,557.3

Danske Bank / Annual Report 2017 143
Danske Bank / Annual Report 2017 143
Notes – Danske Bank Group – Risk management
Credit exposure continued
Credit portfolio in core activities broken down by business unit
The table below breaks down credit exposure by core business unit and underlying segment.
2017 2016
Gross exposure
Acc. individual impairment
charges Net
exposure Net exposure,
ex collateral Gross
exposure
Acc. individual impairment
charges Net
exposure Net exposure,
ex collateral (DKK billions) a b =a-b a b =a-b
Denmark 500.2 3.4 496.8 62.1 493.0 3.6 489.5 64.9
Finland 92.1 0.5 91.6 6.1 91.0 0.5 90.5 6.2
Sweden 88.2 0.1 88.0 14.6 78.1 0.1 78.0 14.4
Norway 112.8 0.1 112.7 24.4 113.5 0.1 113.4 25.4
Other - - - - - - - -
Personal Banking 793.2 4.2 789.1 107.2 775.6 4.3 771.4 110.9
Denmark 482.7 7.3 475.4 134.2 457.2 8.7 448.5 113.3
Finland 80.1 0.7 79.4 35.6 72.2 0.9 71.3 32.6
Sweden 163.0 0.4 162.6 68.4 150.8 0.6 150.3 59.5
Norway 81.9 1.1 80.8 35.4 78.5 0.7 77.8 33.8
Baltics 20.1 0.2 19.9 9.8 20.1 0.3 19.8 10.6
Other - - - - - - - -
Business Banking 827.7 9.6 818.1 283.3 778.8 11.0 767.8 249.8
Corporates & Institutions 910.5 1.1 909.4 634.6 818.7 1.6 817.1 537.5
Wealth Management 85.6 0.4 85.2 21.9 82.7 0.4 82.3 20.0
Northern Ireland 63.7 0.7 63.0 29.5 64.7 1.2 63.6 31.3
Other 23.2 - 23.2 21.0 31.7 - 31.7 28.6
Total before collective impairment charges 2,703.9 16.0 2,688.0 1,097.6 2,552.3 18.5 2,533.8 978.1
Collective impairment charges 4.1 5.0
Total gross exposure 2,708.0 2,557.3
*The Corporates & Institutions (C&I) segment comprises large corporate customers and financial institutions. As these customers typically have business activities in multiple countries, ageographical split is not applicable.

Danske Bank / Annual Report 2017144
144 Danske Bank / Annual Report 2017
Notes – Danske Bank Group – Risk management
Concentration risk
The Group has implemented a set of frameworks to manage the concentration risk to which the Group is exposed. These frameworks cover single-name concentrations, industry concentrations and geographical concentrations.
Industry concentrations
The Group manages industry concentrations as part of its credit risk appetite framework by setting exposure limits on selected industries.
Geographical concentrations
Credit reporting includes a breakdown by region. Limits are set on exposures outside the Group’s home markets (sovereigns, financial institutions and counterparties in derivatives trading). Limits are approved by the Group Credit Committee on the basis of expected business volume and an assessment of the specific country risk.
Single-name concentrations
Single-name concentrations are managed according to two frameworks:
Single-name concentration framework: This risk-sensitive internal framework specifies limits on exposure, expected loss (EL) and loss given default (LGD) in order to limit potential losses on single-name exposures. Single-name concentrations are monitored and reported to the All Risk Committee and the Risk Committee.
Large exposures framework: This framework is based on the regulatory definition of large exposures as specified in article 395 of the CRR (Regulation (EU) No. 575/2013).
The Group has also defined stricter internal limits for managing single-name concentrations, including the following:
- absolute limit on single-name exposures- the sum of single-name exposures larger than 10% of the total adjusted capital may not exceed a portfolio limit of 95% of the total adjusted
capital - the sum of single-name exposures equal to 5% to 10% of the total adjusted capital may not exceed 150% of the total adjusted capital
The largest exposures are monitored daily under the large exposures framework. Large exposures are reported on a quarterly basis to the All Risk Committee, the Risk Committee and the Board of Directors. At the end of 2017, the Group was well within the regulatory limits for large exposures.
Single-name concentration is monitored monthly and reported on a quarterly basis to the All Risk Committee, the Risk Committee and the Board of Directors. The Group has reduced single-name exposures substantially in recent years.
Collateral The Group uses a number of measures to mitigate credit risk, including collateral, guarantees and covenants. The main method is obtaining collateral.
The market value of collateral is monitored and reassessed by advisers, internal or external assessors, or automatic valuation models. Automatic valuation models are validated annually and monitored quarterly. The Group regularly evaluates the validity of external inputs on which the valuation models are based. The Collateral System supports the process of reassessing the market value to ensure that the Group complies with regulatory requirements.
The market value of collateral is subject to a haircut. The haircut reflects the risk that the Group will not be able to obtain the estimated market value upon the sale of the individual asset in a distressed situation and thus includes forced sale reduction, price volatility during the sales period, realisation costs and maintenance costs. The haircut applied depends on the type of collateral. For regulatory purposes, the Group also applies a downturn haircut.
The composition of the Group’s collateral base reflects the product composition of the credit portfolio. The most important collateral types, measured by volume, are real property and financial assets in the form of shares and bonds. For reporting purposes, all collateral values are net of haircuts and capped by the exposure amount at the facility level.

Danske Bank / Annual Report 2017 145
Danske Bank / Annual Report 2017 145
Notes – Danske Bank Group – Risk management
Collateral continued
Type of collateral in core activities (after haircuts)
Personal Banking Business Banking C&I Wealth
Management Northern Ireland Other Total
(DKK billions) 2017 2016 2017 2016 2017 2016 2017 2016 2017 2016 2017 2016 2017 2016
Real property 674.6 653.5 454.1 438.2 26.5 27.0 53.4 50.4 29.1 28.1 0.3 0.1 1,238.0 1,197.2
Personal 673.8 653.0 14.6 14.9 - - 52.4 49.6 16.1 14.9 0.1 - 757.0 732.5
Commercial 0.7 0.4 396.1 379.8 24.6 24.9 1.0 0.8 10.1 9.9 0.2 - 432.6 415.9
Agricultural 0.1 - 43.4 43.4 1.9 2.1 - - 2.9 3.3 - - 48.4 48.8
Bank accounts 0.3 0.4 0.7 0.6 0.2 - 0.3 0.2 - - - - 1.5 1.1
Custody accounts and securities 0.3 0.4 5.1 6.1 216.3 211.1 7.5 9.9 - - 1.9 2.9 231.2 230.4
Vehicles 2.2 2.3 18.2 16.4 0.5 0.5 - - - - - - 20.9 19.2
Equipment - - 16.7 17.3 0.8 1.9 - - 2.5 2.4 - - 19.9 21.5
Vessels and aircraft - 0.1 3.7 3.2 22.8 27.4 - - - - - - 26.6 30.7
Guarantees 4.1 3.6 2.8 2.7 3.3 4.9 2.0 1.6 - - - - 12.3 12.9
Amounts due 0.2 0.2 3.5 3.6 - 0.2 - - 0.4 0.3 - - 4.1 4.4
Other assets 0.1 0.1 30.1 30.0 4.2 6.7 0.1 0.1 1.5 1.4 - - 36.0 38.3
Total collateral 681.9 660.5 534.8 518.0 274.7 279.7 63.3 62.3 33.5 32.3 2.2 3.0 1,590.5 1,555.7
Total unsecured
credit exposure 107.2 110.9 283.3 249.8 634.6 537.5 21.9 20.0 29.5 31.3 21.0 28.6 1,097.5 978.1
Unsecured portion of
credit exposure (%) 13.6 14.4 34.6 32.5 69.8 65.8 25.7 24.3 46.8 49.2 90.7 90.4 40.8 38.6

Danske Bank / Annual Report 2017146
146 Danske Bank / Annual Report 2017
Notes – Danske Bank Group – Risk management
Past due amounts in core activities (no objective evidence of individual impairment)
Past due amounts (no evidence of impairment)
Personal Banking
Business Banking C&I
Wealth Management
Northern Ireland Other
Total past due amount
Total due under loans
(DKK millions) 2017 2016 2017 2016 2017 2016 2017 2016 2017 2016 2017 2016 2017 2016 2017 2016
6-30 days 30 35 62 74 2 1 9 7 5 2 - - 107 120 2,161 1,671
31-60 days 17 16 17 13 - 8 10 3 1 3 - - 45 43 629 800
> 60 days 28 27 8 13 - - 1 2 6 10 - - 43 52 399 449
Total past due amounts 75 77 87 99 3 10 20 12 11 15 - - 195 214 - -
Total due under loans 1,805 1,906 1,138 786 6 12 162 116 77 100 - 1 - - 3,188 2,921
The average unsecured portion of the past due amounts with no evidence of impairment was 30.0% at the end of 2017 (2016: 37.7%). Real property accounted for 64.0% of collateral provided (2016: 76.7%).
Forbearance practices and repossessed assets
The Group adopts forbearance plans to assist customers in financial difficulty. Concessions granted to customers include interest-reduction schedules, interest-only schedules, temporary payment holidays, term extensions, cancellation of outstanding fees, waiver of covenant enforcement and settlements.
Forbearance plans must comply with the Group’s Credit Policy. They are used as an instrument to retain long-term customer relationships during economic downturns if there is a realistic possibility that customers will be able to meet obligations again. The purpose of the plans is therefore to minimise loss in the event of default.
If it proves impossible to improve a customer’s financial situation by forbearance measures, the Group will consider whether to subject the customer’s assets to a forced sale or whether the assets could be realised later at higher net proceeds. At the end of 2017, the Group recognised properties taken over in Denmark at a carrying amount of DKK 38 million (31 December 2016: DKK 79 million) and properties taken over in other countries at DKK 44 million (31 December 2016: DKK 62 million). The properties are held for sale and included under Other assets in the balance sheet.
Forbearance leads to objective evidence of impairment, and impairments relating to forborne exposures are handled according to the principles described in Note 1, Basis of preparation – Measurement of loans.
The Group has implemented the European Banking Authority’s (the EBA’s) definition of loans subject to forbearance measures. The table below is based on the EBA’s definition, which states that a minimum two-year probation period must pass from the date when forborne exposures are considered to be performing again. Such exposures are included in the Under Probation category in the table below. Exposures with forbearance measures are divided into performing and non-performing loans. The Group’s definition of non-performing loans is described in the next section. The increase in forborne exposures to the refinancing segment relates to proactive forbearance measures taken by the Group to improve the financial position of weak customers.
Exposures subject to forbearance measures
2017 2016
(DKK millions) Performing Non-performing* Performing Non-performing*
Modification 2,170 1,462 433 1,713
Refinancing 6,084 11,255 1,730 12,079
Under probation 6,472 - 8,682 -
Total 14,727 12,718 10,844 13,793
*These loans are part of the total non-performing loan amount. For more details, see the “Non-performing loans in core activities” table.

Danske Bank / Annual Report 2017 147
Danske Bank / Annual Report 2017 147
Notes – Danske Bank Group – Risk management
Non-performing loans
The Group defines non-performing loans as facilities with objective evidence of impairment and for which individual impairment charges have been booked. For non-retail exposures with one or more non-performing loans, the entire amount of the customer’s exposure is considered to be non-performing. For retail exposures, only impaired facilities are included in non-performing loans. The Group’s definition of non-performing loans differs from the EBA’s definition by excluding fully covered exposures to customers in default and previously forborne exposures that are now performing and are under probation.
Non-performing loans in core activities
(DKK millions) 2017 2016
Total non-performing loans 17,290 21,900
- Portion from customers in default* 6,049 8,828
Coverage ratio (default) (%) 97 95
Coverage ratio (non-default) (%) 73 65
Coverage ratio (total non-performing loans) (%) 86 83
Non-performing loans as a percentage of total gross exposure (%) 1.2 1.6
* Part of which is also shown in the “Exposures subject to forbearance measures” table.
Non-performing loans in core activities broken down by industry (NACE)
2017 2016
Gross exposure
Acc. individual impairment
charges Net exposure Net exposure,
ex collateral Gross
exposure
Acc. individual impairment
charges Net exposure Net exposure,
ex collateral (DKK millions) a b =a-b a b =a-b
Public institutions 6 1 6 2 1 - - -
Banks 127 128 - - 149 149 - -
Credit institutions - - - - - - - -
Insurance 14 8 6 - 16 8 8 -
Investment funds 248 162 86 36 320 205 115 33
Other financials - - - - - - - -
Agriculture 4,306 2,540 1,766 285 5,335 2,994 2,341 187
Commercial property 6,033 2,451 3,583 184 7,887 3,091 4,797 260
Construction, engineering and building products 852 542 310 150 1,513 1,010 503 127
Consumer discretionary 2,208 1,305 902 272 2,684 1,526 1,157 581
Consumer staples 342 163 179 - 345 161 184 22
Energy and utilities 1,354 408 946 - 484 180 304 -
Health care 85 51 35 10 103 64 40 4
Industrial services, supplies and machinery 1,915 1,089 827 64 2,173 1,238 934 96
IT and telecommunication services 146 88 58 33 209 146 63 25
Materials 846 522 324 76 1,011 768 243 -
Non-profits and other associations 1,808 680 1,128 85 1,929 814 1,115 139
Other commercials 195 191 5 - 275 269 7 -
Shipping 2,037 681 1,356 68 3,504 719 2,785 52
Transportation 173 117 56 - 163 110 53 7
Personal customers 10,558 4,841 5,717 1,323 12,303 5,054 7,248 2,334
Total non-performing
loans 33,255 15,965 17,290 2,587 40,406 18,505 21,900 3,868
The average unsecured portion of non-performing exposures was 15.0% at the end of 2017 (31 December 2016: 17.7%). Real property accounted for 74.9% of collateral provided (31 December 2016: 83.6%).

Danske Bank / Annual Report 2017148
148 Danske Bank / Annual Report 2017
Notes – Danske Bank Group – Risk management
Non-performing loans continuedNon-performing loans in core activities broken down by business unit
2017 2016
Gross exposure
Acc. individual impairment
charges Net exposure Net exposure,
ex collateral Gross
exposure
Acc. individual impairment
charges Net exposure Net exposure,
ex collateral (DKK millions) a b =a-b a b =a-b
Denmark 6,782 3,431 3,351 1,377 8,082 3,552 4,531 2,235
Finland 1,736 520 1,216 31 1,835 512 1,322 46
Sweden 312 102 209 34 367 121 246 38
Norway 345 111 234 51 309 98 211 53
Other - - - - - - - -
Personal Banking 9,174 4,164 5,010 1,493 10,593 4,283 6,310 2,372
Denmark 14,072 7,256 6,815 394 17,140 8,651 8,490 699
Finland 1,351 683 668 193 1,580 904 677 155
Sweden 616 376 240 37 928 556 372 66
Norway 2,475 1,068 1,407 10 1,431 664 767 118
Baltics 404 164 240 25 632 267 366 42
Other 5 4 1 1 6 6 - -
Business Banking 18,922 9,551 9,371 660 21,719 11,047 10,672 1,080
Corporates & Institutions 2,964 1,120 1,844 128 4,845 1,554 3,290 104
Wealth Management 778 401 378 143 955 447 508 147
Northern Ireland 1,412 727 685 162 2,269 1,173 1,096 163
Other 4 3 2 1 25 1 24 2
Total non-performing loans 33,255 15,965 17,290 2,587 40,406 18,505 21,900 3,868
*The Corporates & Institutions (C&I) segment comprises large corporate customers and financial institutions. As these customers typically have business activities in multiple countries, ageographical split is not applicable.
Impairment charges Rating categories 10 (non-default) and 11 (default) include customers with exposures for which objective evidence of impairment exists. Exposure to customers in the other rating categories is subject to collective impairment testing. Note 14 in the consolidated financial statements for 2017 provides more details.

Danske Bank / Annual Report 2017 149
Danske Bank / Annual Report 2017 149
Notes – Danske Bank Group – Risk management
Allowance account in core activities
Allowance account in core activities broken down by segment
Personal Business Wealth Northern Allowance
account Impairment (DKK millions) Banking Banking C&I Management Ireland Other total Individual Collective
1 January 2016 6,614 15,091 2,369 606 2,814 2 27,496 23,151 4,346
New and increased impairment charges 1,496 2,587 1,650 77 171 - 5,981 4,558 1,423
Reversals of impairment charges from previous periods 1,743 2,559 562 215 430 1 5,510 4,588 922
Write-offs debited to allowance account 805 2,078 530 32 875 - 4,320 4,320 -
Foreign currency translation 3 21 20 1 -363 - -319 -324 5
Other items 20 262 -185 98 -45 -1 150 28 122
31 December 2016 5,584 13,324 2,762 534 1,273 1 23,479 18,506 4,974
New and increased impairment charges 1,295 2,227 759 83 95 4 4,462 4,222 239
Reversals of impairment charges from previous periods 1,098 2,803 345 152 334 - 4,732 3,739 993
Write-offs debited to allowance account 535 1,321 763 4 207 - 2,831 2,831 -
Foreign currency translation -16 -98 -205 -3 -38 - -361 -244 -117
Other items -29 98 7 2 -25 -2 51 51 -
31 December 2017 5,200 11,427 2,214 460 764 2 20,069 15,965 4,104
Collective impairment charges include charges that reflect the migration of customers from one rating category to another without changes being made to the credit margin to reflect the increase in credit risk. If all business customers were downgraded one rating category with no corresponding change in the rate of interest charged to customers, collective impairment charges would increase by about DKK 1.6 billion (31 December 2016: about DKK 1.2 billion). The increase in the effect of the downgrade since last year is a reflection of weak credit quality in high-risk sectors such as agriculture and oil & gas support industries. A further downgrade of such customers would lead to a significant collective impairment charge. A number of impaired agricultural customers no longer show objective evidence of impairment. They are now part of the collective impairment model, and explain part of the increase.
If the value of collateral provided by customers in rating categories 10 and 11 decreased 10%, individual impairment charges would increase by about DKK 2.1 billion (31 December 2016: about DKK 2.3 billion).
Allowance account in core activities broken down by balance sheet items
(DKK millions) 2017 2016
Due from credit institutions and central banks 10 40
Loans at amortised cost 16,057 18,986
Loans at fair value 3,347 3,830
Loan commitments and guarantees 655 623
Total 20,069 23,479

Danske Bank / Annual Report 2017150
150 Danske Bank / Annual Report 2017
Notes – Danske Bank Group – Risk management
Credit exposure from Non-core lending activities
The Non-core business unit is responsible for the controlled winding-up and divestment of exposures that are no longer considered part of the Group’s core activities. The portfolio consists of the Non-core exposures in Ireland, the Baltics and conduits etc.
In October 2017, the Group entered into a binding agreement on the sale of a portfolio of Irish residential mortgage loans in the Non-core segment with a face value of DKK 13 billion. The transaction was settled in December 2017.
Credit portfolio in Non-core activities broken down by industry (NACE)
2017 2016
Gross exposure
Acc. individual impairment
charges Net exposure Net exposure,
ex collateral Gross
exposure
Acc. individual impairment
charges Net exposure Net exposure,
ex collateral (DKK millions) a b =a-b a b =a-b
Personal customers 3,787 177 3,610 70 18,446 1,479 16,966 1,765
Consumer discretionary 20 20 - - 82 65 17 1
Commercial property 35 36 - - 226 213 13 -
Other 48 48 - - 376 269 107 -
Non-core banking 3,890 280 3,610 70 19,131 2,027 17,103 1,766
Non-core conduits etc. 4,882 299 4,583 1,262 6,582 239 6,343 1,309
Total Non-core before collective
impairment charges 8,772 579 8,193 1,332 25,713 2,266 23,446 3,075
Collective impairment charges 101 410
Total gross Non-core exposure 8,873 26,123
Credit portfolio in Non-core activities broken down by rating category
2017 2016
PD level Gross
exposure
Acc. individual
impairment charges
Net exposure
Net exposure,
ex collateral Gross
exposure
Acc. individual
impairmentcharges
Net exposure
Net exposure,
ex collateral (DKK millions) Upper Lower a b =a-b a b =a-b
1 - 0.01 287 - 287 - 162 - 162 -
2 0.01 0.03 1,054 - 1,054 - 1,903 - 1,903 -
3 0.03 0.06 1,762 - 1,762 461 1,544 - 1,544 541
4 0.06 0.14 639 - 639 298 1,832 - 1,832 488
5 0.14 0.31 61 - 61 - 17 - 17 -
6 0.31 0.63 339 - 339 17 434 - 434 24
7 0.63 1.90 2,177 - 2,177 5 1,918 - 1,918 -
8 1.90 7.98 765 - 765 105 11,507 - 11,507 1,438
9 7.98 25.70 315 - 315 25 424 - 424 32
10 25.70 99.99 832 303 530 418 3,003 686 2,317 552
11 (default) 100.00 100.00 539 277 262 - 2,968 1,580 1,388 -
Total Non-core before collective impairment charges 8,771 579 8,192 1,331 25,713 2,266 23,446 3,075
Collective impairment charges 101 410
Total Non-core exposure 8,872 26,123

Danske Bank / Annual Report 2017 151
Danske Bank / Annual Report 2017 151
Notes – Danske Bank Group – Risk management
Credit exposure from Non-core lending activities continued
Non-performing loans in Non-core activities broken down by industry (NACE)
2017 2016
Gross exposure
Acc. individual impairment
charges Net exposure Net exposure,
ex collateral Gross
exposure
Acc. individual impairment
charges Net exposure Net exposure,
ex collateral (DKK millions) =a+b b a =a+b b a
Personal customers 319 177 142 9 3,946 1,479 2,467 326
Consumer discretionary 20 20 - - 82 65 16 1
Commercial property 36 36 - - 227 213 13 -
Other 48 48 - - 377 269 107 -
Non-core banking 422 280 142 9 4,631 2,027 2,604 328
Non-core conduits etc. 802 299 503 503 917 239 678 281
Total non-performing
loans in Non-core 1,224 579 645 512 5,548 2,266 3,282 609
The average unsecured portion of non-performing loans was 79.4% at the end of 2017 (2016: 18.5%). Real property accounted for 99.9% of collateral provided (2016: 99.9%).
Counterparty credit risk
Exposure to counterparty credit risk (derivatives) and credit exposure from trading and investment securities
(DKK billions) 2017 2016
Counterparty credit risk Derivatives with positive fair value 256.9 326.4
Credit exposure from other trading and investment securities Bonds 496.7 503.5
Shares 20.3 23.1
Other unutilised commitments 0.4 0.5
Total 774.3 853.5
Other unutilised commitments comprised private equity investment commitments and other obligations.

Danske Bank / Annual Report 2017152
152 Danske Bank / Annual Report 2017
Notes – Danske Bank Group – Risk management
Counterparty credit risk continuedCounterparty credit risk (derivatives)
Derivatives are subject to credit risk. Positive and negative fair values of derivatives with the same counterparty are offset in the balance sheet if certain conditions are fulfilled. The Group has entered into master netting or similar agreements that include rights to additional set-off in the event of default by a counterparty. Such agreements reduce the exposure further, but they do not qualify for offsetting under IFRSs. The net current exposure to derivatives with positive market value after offsetting under master netting agreements amounted to DKK 74.8 billion (2016: DKK 84.8 billion) (see note 29). The exposure is broken down by rating category in the table below.
Net current exposure broken down by category (DKK millions) 2017 2016
1 16,979 8,291
2 23,441 13,309
3 12,988 26,118
4 9,851 17,706
5 8,551 13,786
6 1,905 3,317
7 660 1,045
8 118 798
9 111 157
10 134 169
11 83 136
Total 74,820 84,833
The counterparty credit risk on derivatives is managed by PFE (potential future exposure) lines on a set of maturity buckets. Line checks are performed prior to trading. The Group carries out counterparty credit risk measurement and monitoring as well as intraday line utilisation monitoring on a daily basis. Consolidated counterparty credit risk exposure is reported to senior management. The Group uses a simulation model to calculate counterparty credit risk exposure for the majority of its portfolio.
The Group makes fair value adjustments to cover the credit risk on derivatives with positive fair value (CVA) that are recognised in the financial statements.
For more information, see note 30.
Bond portfolio
Central and Quasi- Danish Swedish Other local govern- government mortgage covered covered Corporate
(DKK millions) ment bonds bonds bonds bonds bonds bonds Total
2017 Held-for-trading 74,424 1,499 40,195 47,825 3,696 5,941 173,581
Designated at fair value 31,029 649 54,585 5,240 5,819 276 97,598
Available-for-sale 2,858 939 73,490 473 1,103 - 78,863
Hold-to-maturity 62,414 1,319 73,260 6,822 2,462 420 146,697
Total 170,725 4,406 241,530 60,360 13,080 6,637 496,739
2016 Held-for-trading 70,779 667 32,928 46,657 5,822 5,027 161,880
Designated at fair value 29,597 537 86,838 11,344 5,578 3,596 137,490
Available-for-sale 599 - 69,424 - 703 - 70,727
Hold-to-maturity 66,913 1,319 60,859 1,815 2,054 420 133,379
Total 167,888 2,523 250,050 59,816 14,157 9,043 503,477
At 31 December 2017, the Group had an additional bond portfolio, including bond-based unit trust certificates, worth DKK 158,061 million (31 December 2016: DKK 157,936 million) recognised as assets under insurance contracts and investment contracts and thus not included in the table above. The section on insurance risk provides more information. For bonds classified as hold-to-maturity, fair value exceeded amortised cost at the end of 31 December 2017 and 31 December 2016.

Danske Bank / Annual Report 2017 153
Danske Bank / Annual Report 2017 153
Notes – Danske Bank Group – Risk management
Bond portfolio continued
Bond portfolio broken down by geographical area
Central and Quasi- Danish Swedish Other local govern- government mortgage covered covered Corporate
(DKK millions) ment bonds bonds bonds bonds bonds bonds Total
2017
Denmark 22,830 - 241,527 - 406 2,220 266,983
Sweden 25,882 - - 60,360 - 1,855 88,097
UK 5,899 - - - 1,787 196 7,883
Norway 4,577 - 3 - 5,781 495 10,855
USA 11,014 158 - - - 12 11,184
Spain 12,387 - - - 132 - 12,519
France 20,234 - - - 955 613 21,802
Luxembourg - 3,194 - - - 4 3,198
Finland 16,390 1,054 - - 1,685 698 19,827
Ireland 3,252 - - - 3 7 3,262
Italy 8,194 - - - - 7 8,201
Portugal 256 - - - - - 256
Austria 9,070 - - - 227 3 9,299
Netherlands 7,457 - - - 224 342 8,024
Germany 15,752 - - - 1,351 62 17,165
Belgium 7,297 - - - 116 4 7,418
Other 234 - - - 414 119 768
Total 170,725 4,406 241,530 60,360 13,080 6,637 496,739
2016
Denmark 21,663 - 250,050 - - 3,587 275,301
Sweden 19,253 - - 59,816 3 1,542 80,614
UK 8,669 1 - - 2,214 225 11,109
Norway 4,450 - - - 6,436 792 11,678
USA 8,638 169 - - - 38 8,845
Spain 12,201 - - - 210 - 12,411
France 21,311 - - - 1,138 448 22,897
Luxembourg - 2,353 - - - - 2,353
Finland 16,811 - - - 2,510 1,076 20,398
Ireland 4,393 - - - 32 10 4,435
Italy 7,296 - - - - - 7,296
Portugal 84 - - - - - 84
Austria 8,560 - - - 227 435 9,222
Netherlands 8,561 - - - 271 491 9,323
Germany 17,061 - - - 653 58 17,772
Belgium 8,480 - - - 128 - 8,608
Other 458 - - - 335 340 1,133
Total 167,888 2,523 250,050 59,816 14,157 9,043 503,477
Risk Management 2017 provides additional details about the risk on the Group’s bond portfolio. The publication is not covered by the statutory audit.
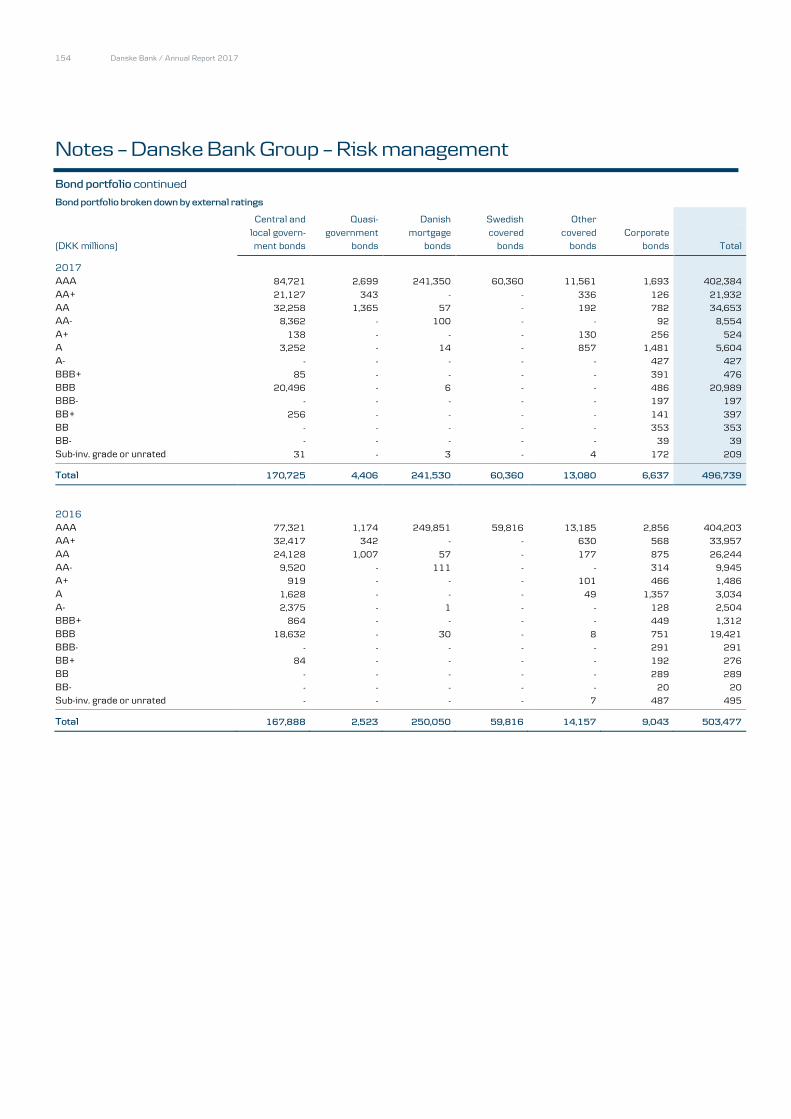
Danske Bank / Annual Report 2017154
154 Danske Bank / Annual Report 2017
Notes – Danske Bank Group – Risk management
Bond portfolio continued
Bond portfolio broken down by external ratings
Central and Quasi- Danish Swedish Other local govern- government mortgage covered covered Corporate
(DKK millions) ment bonds bonds bonds bonds bonds bonds Total
2017 AAA 84,721 2,699 241,350 60,360 11,561 1,693 402,384
AA+ 21,127 343 - - 336 126 21,932
AA 32,258 1,365 57 - 192 782 34,653
AA- 8,362 - 100 - - 92 8,554
A+ 138 - - - 130 256 524
A 3,252 - 14 - 857 1,481 5,604
A- - - - - - 427 427
BBB+ 85 - - - - 391 476
BBB 20,496 - 6 - - 486 20,989
BBB- - - - - - 197 197
BB+ 256 - - - - 141 397
BB - - - - - 353 353
BB- - - - - - 39 39
Sub-inv. grade or unrated 31 - 3 - 4 172 209
Total 170,725 4,406 241,530 60,360 13,080 6,637 496,739
2016 AAA 77,321 1,174 249,851 59,816 13,185 2,856 404,203
AA+ 32,417 342 - - 630 568 33,957
AA 24,128 1,007 57 - 177 875 26,244
AA- 9,520 - 111 - - 314 9,945
A+ 919 - - - 101 466 1,486
A 1,628 - - - 49 1,357 3,034
A- 2,375 - 1 - - 128 2,504
BBB+ 864 - - - - 449 1,312
BBB 18,632 - 30 - 8 751 19,421
BBB- - - - - - 291 291
BB+ 84 - - - - 192 276
BB - - - - - 289 289
BB- - - - - - 20 20
Sub-inv. grade or unrated - - - - 7 487 495
Total 167,888 2,523 250,050 59,816 14,157 9,043 503,477

Danske Bank / Annual Report 2017 155
Danske Bank / Annual Report 2017 155
Notes – Danske Bank Group – Risk management
Market risk Market risk is the risk of losses or gains caused by changes in the market values of the Group’s financial assets, liabilities and off-balance-sheet items resulting
from changes in market prices or rates. Market risk affects the Group’s financial statements through the valuation of on-balance-sheet and off-balance-sheet
items; some of the Group’s financial instruments, assets and liabilities are valued on the basis of market prices, while others are valued on the basis of market
prices and valuation models developed by the Group. In addition, net interest income at Personal Banking, Wealth Management and Business Banking is
affected by the level of interest rates.
The Market Risk Policy set by the Board of Directors lays out the overall framework for market risk management and identifies the boundaries within which the Group’s market risk profile and business strategy are defined. The Market Risk Policy is supported by the Market Risk Instructions, which defines the overall limits for various market risk factors and additional boundaries within which the trading activities operate. The Market Risk Policy and the Market Risk Instructions form the basis of written business procedures and daily control procedures for the Group’s market risk management.
The Group’s market risk management is intended to ensure proper oversight of all market risks, including both trading-related market risk and non-trading-related market risk as well as market risk in relation to fair value adjustments. The market risk framework is designed to systematically identify, assess, monitor and report market risk. The Group manages its market risk by means of three separate frameworks for the following areas:
Trading at Corporates & Institutions Fair value adjustments (xVA) at Corporates & Institutions Asset and liability management at Group Treasury
Market risk associated with activities at Personal Banking, Wealth Management and Business Banking is either hedged by Corporates & Institutions or managed as part of Group Treasury’s market risk positions. The market risk on assets in which the shareholders’ equity of Danica Pension is invested and on assets allocated to Danica Pension’s policyholders is treated as an insurance risk. The market risk on defined benefit pension plans is treated as a pension risk.
Trading-related market risk at Corporates & Institutions
The trading-related activities at Corporates & Institutions cover trading in fixed income products, derivatives, foreign exchange, money markets, debt capital markets and equities. Corporates & Institutions acts mainly as a market maker processing large client flows.
The table below shows the VaR for the trading-related activities at Corporates & Institutions.
Value-at-Risk for trading-related activities at C&I
2017 2016 (DKK millions) Average End of year Average End of year
Total 46 37 44 67
The Group continued to maintain a low risk in its trading operations in 2017, only marginally increasing its average trading-related market risk from DKK 44 million in 2016 to DKK 46 million in 2017.
Market risk in relation to fair value adjustments The Group’s fair value adjustments (xVA) cover funding value adjustments (FVA), credit value adjustments (CVA) and debit value adjustments (DVA). The
Group applies a market-implied approach that is in line with industry best practice. The Group’s strategy is to continue developing the xVA model so that
it remains in line with best practices in the market.
In order to reduce P/L volatility caused by xVA, the Group pursues a strategy to hedge the risk in financial markets to increase income stability and
predictability under this framework. In practice, the Group buys a hedge of offsetting interest rate swaps and CDS contracts in the financial markets. The
Group hedges open foreign exchange risk under this framework.
Market risk in relation to asset and liability management The Group’s exposure to non-trading-related market risk originates from interest rate risk in the banking book (IRRBB), which derives mainly from
providing the Group’s core banking customers with conventional banking products and from the Group’s funding and liquidity management activities
at Group Treasury. In addition, the Group holds a portfolio of unlisted shares relating mainly to private equity funds and banking-related investments.

Danske Bank / Annual Report 2017156
156 Danske Bank / Annual Report 2017
Notes – Danske Bank Group – Risk management
Market risk continued
Interest rate risk in the banking book (IRRBB) The Group applies an IRRBB limit framework dedicated specifically to measuring the changes in the economic-value-based metric. The limit framework is completely separate from the framework governing trading-related market risk. This supports Group Treasury’s focus on managing the risk arising from the banking book, including the liquidity buffer and banking book hedge transactions.
The Group’s total interest rate sensitivity in the banking book (value-based measure) is shown below.
Interest rate risk in the banking book under the new limit framework
2017 2016
At last business day (DKK millions) +100bp -100bp +100bp -100bp
Total 3,932 -2,637 4,241 -3,546
The sensitivity to falling interest rates decreased from DKK 3,546 million in 2016 to DKK 2,637 million in 2017, while the sensitivity to rising interest rates
decreased from DKK 4,241 million in 2016 to DKK 3,932 million in 2017.
Value-at-Risk for capital requirement purposes
The Group uses its internal VaR model to measure the regulatory capital requirement for market risk in its trading book. The trading book covers trading-related market risk at Corporates & Institutions and hedging in relation to fair value adjustments of interest rate risk and the part of the CDS spread risk hedging that is not eligible under regulatory capital calculations for CVA risk.
The Group also uses the internal VaR model for calculating the stressed VaR capital charge. Incremental risks, such as default and rating migration risks on
bond issuers and CDS names, are estimated in the incremental risk model.
Regulatory capital for the Group’s minor exposures to commodity risk and collective investment undertakings are calculated according to the standardised
approach.
The table below shows the VaR figures calculated at a confidence level of 99% and on a 10-day horizon used for calculating the capital requirement for market risk.
2017 Daily VaR Stressed VaR
Avg. Minimum Maximum Avg. Minimum Maximum (DKK millions) VaR VaR VaR End of year VaR VaR VaR End of year
Total VaR 238 120 402 242 571 397 873 545
2016 Daily VaR Stressed VaR
Avg. Minimum Maximum Avg. Minimum Maximum (DKK millions) VaR VaR VaR End of year VaR VaR VaR End of year
Total VaR 312 146 489 388 584 388 857 739

Danske Bank / Annual Report 2017 157
Danske Bank / Annual Report 2017 157
Notes – Danske Bank Group – Risk management
Liquidity risk Liquidity risk is the risk of losses because funding costs become excessive, lack of funding prevents the Group from maintaining its business model, or lack of funding prevents the Group from fulfilling its payment obligations.
Taking on liquidity risk is an integral part of the Group’s business strategy. Realkredit Danmark and Danica Pension each manage their liquidity separately and are not included in the Group’s general liquidity reporting. At Realkredit Danmark, the financing of mortgage loans through the issuance of listed mortgage bonds with matching conditions has eliminated liquidity risk in all material respects. Danica Pension’s balance sheet contains long-term life insurance liabilities and assets, most of which are invested in easily marketable bonds and shares. Both companies are subject to statutory limits on their exposures to Danske Bank A/S. In the following, references to the Group’s liquidity thus exclude Realkredit Danmark and Danica Pension with the exception of the Group’s liquidity coverage ratio, which includes Realkredit Danmark data.
Although economic activity gained pace in 2017, signs of monetary tightening remain relatively weak. A slowdown in the ECB’s quantitative easing programme has been announced for January 2018, and its complete discontinuation is planned for September 2018. For a while to come, liquidity will therefore continue to be abundant. This applies to both the euro area and to Sweden and Denmark. In Denmark, the currency peg against the euro means that the central bank has increased liquidity on demand in order to maintain the peg. Demand for DKK deposits may to some extent still be driven by expectations of an exchange rate alignment.
The additional central bank liquidity must be held on the balance sheets of the banking sector, and LCR levels have therefore been relatively high. At the end of 2017, the Group’s LCR was 171% when calculated in accordance with the relevant regulatory standards.
Liquidity risk management At the group level, liquidity management is based on the monitoring and management of short- and long-term liquidity risks. Liquidity triggers make up a vital part of daily liquidity management since they are used as early warnings of a potential liquidity crisis. The triggers are monitored by various functions across the Group, depending on the type of trigger. Liquidity management is organised according to the framework described in the following sections, although it is not limited to that framework.
Distance to default The principal aim of the Group’s short-term risk management is to ensure that, in the short term, the liquidity reserve is always sufficient to absorb the net effects of known future receipts and payments from current transactions. Bond holdings that can be used in repo agreements with central banks are considered liquid assets. To take account of the potential risk of drawings under loan commitments, the Group factors in the unutilised portion of facilities in the calculation of liquidity risk.
For liquidity management purposes, the Group distinguishes between liquidity in DKK and liquidity in other currencies. This is because of the Group’s strong position in the Danish market and because the Group has a net deposit surplus in DKK (deposits exceed lending) and a net deposit shortfall in SEK and NOK. Other currencies such as USD and GBP roughly balance out. The net deposit surplus in Danish kroner is a valuable, stable funding source for the Group. In addition to limits set by the Board of Directors and the All Risk Committee, the Group Liquidity Risk Committee sets overnight targets for each key currency.
Distance to default under stress The Group conducts stress tests to measure its immediate liquidity risk and to ensure that it has sufficient time to respond to potential crises. The stress tests estimate liquidity risk in various scenarios, including three standard scenarios: a scenario specific to the Group, a general market crisis scenario and a combination of the two. It also conducts a reverse stress test.
All stress tests are based on the assumption that the Group does not reduce its lending activities. This means that existing lending activities are maintained and require funding. The degree of possible refinancing varies, depending on the scenario in question and the specific funding source. To assess the stability of the funding, the Group considers maturity as well as behavioural assumptions.
Liquidity coverage ratio, aggregated and by currency
The liquidity coverage ratio (LCR) requirement has been in effect since 1 October 2015. The LCR requirement stipulates that financial institutions must have a liquidity reserve in excess of projected net outflows during a severe stress scenario lasting 30 calendar days. In 2016, executive orders issued to Danish SIFIs introduced currency-specific liquidity requirements. The requirements were imposed individually and only for currencies that are significant to the individual bank. For Danske Bank, these currencies are USD and EUR. NOK and SEK are excluded and the currency-specific LCR requirement therefore applies to USD and EUR. As of October 2017, the requirement was fully phased in at100%.

Danske Bank / Annual Report 2017158
158 Danske Bank / Annual Report 2017
Notes – Danske Bank Group – Risk management
Liquidity risk continued
Market reliance Managing reliance on wholesale funding is considered a key concern for the Group. Wholesale funding is less stable than retail funding, especially when the markets are strained. Refinancing large amounts of wholesale funding can make the Group vulnerable to investor sentiments, market stress and market dysfunctionalities. The size and maturity profile of wholesale funding and the maturity mismatch profile must therefore be prudent. Retail deposits, which constitute the largest funding source, are a valuable, stable funding source for the Group. Most of the retail deposits are covered by a deposit insurance scheme, and analyses indicate that they are indeed stable over time. Stress tests show that the Group’s liquidity reserve is sufficient to close any liquidity gap if all capital markets are closed and refinancing is impossible. The liquidity reserve is monitored continuously to ensure a minimum survival period of 12 months in such a scenario.
Funding sources
The Group monitors its funding mix to ensure that it is well-diversified in terms of funding sources, maturities and currencies. A well-balanced portfolio of liabilities is intended to generate a stable flow of funding and provides protection against market disruptions. The tables below break down funding sources by type of liability and currency, excluding funding in the form of bonds issued by Realkredit Danmark.
Funding sources by type of liability (%) 2017 2016
Central banks/credit institutions 7 8
Repo transactions 12 10
Short-term bonds 5 4
Long-term bonds 7 8
Other covered bonds 11 11
Deposits (business) 28 27
Deposits (personal) 21 21
Subordinated debt 1 2
Shareholders' equity 8 9
Total 100 100
Funding sources by currency (%) 2017 2016
DKK 31 30
EUR 32 35
USD 16 15
SEK 6 4
GBP 7 7
CHF - 1
NOK 7 7
Other 1 1
Total 100 100

Danske Bank / Annual Report 2017 159
Danske Bank / Annual Report 2017 159
Notes – Danske Bank Group – Risk management
Liquidity risk continued
Liquidity reserve
The minimum size and the composition of the liquidity reserve are determined on the basis of the Group’s capacity to meet its obligations in case of a stressed liquidity situation. The LCR and internal stress tests determine the minimum size.
The Group’s liquidity reserve is defined as all unencumbered liquid assets that are available to the Group (Group Treasury) in a stressed situation. Assets received as collateral are included in the reserve, while assets used as collateral are excluded. The table below shows the nominal value of the Group’s liquidity reserve without haircuts. The haircuts applied to determine liquidity values for regulatory purposes are defined by regulators, while the haircuts used for internal stress testing purposes are defined on the basis of a set of parameters specific to each scenario. The Group’s bond holdings are considered to be highly liquid, not least because most of them can be used in repo agreements with central banks. Central bank eligibility is vital for intra-day liquidity management and overnight liquidity facilities and also for determining liquidity in markets during stressed periods. Central bank eligibility is a positive indicator as is external credit rating.
Nominal value of the liquidity buffer available to the Group (DKK billions) 2017 2016
Cash and holdings at central banks 289 171
Securities issued or guaranteed by sovereigns 99 65
Covered bonds (including mortgage bonds) 215 272
Issued by other institutions 187 232
Own issued 28 41
Other 15 30
Total 618 538
Other regulatory measures
In addition to the LCR, the Basel Committee has issued new liquidity standards in the form of the net stable funding ratio (NSFR). They are not directly binding on financial institutions until implemented in the relevant jurisdictions. For Danske Bank Group, the relevant jurisdiction is the EU, in which the relevant legislative acts have not yet been passed. The main elements are known, while others are still being discussed in the legislative institutions of the EU.
The NSFR is intended to ensure a sound funding structure by requiring sufficient long-dated funding. It uses a scoring mechanism for assets and liabilities and calculates an aggregate ‘stability score’ for liabilities (maturities over 1 year and equity are preferred) and a ‘liquidity score’ for assets. The less liquid the assets are, the more stable the funding must be. With the introduction of the LCR, the former, less stringent, liquidity requirement in section 152 of the Danish Financial Business Act no longer applies. The so-called Supervisory Diamond provides guidelines to financial institutions on what the authorities consider prudent policy. In practice, these guidelines are binding. In the liquidity area, reference has been made to the old requirement in section 152. After its replacement by the LCR requirement, the authorities have revised the guidance, and at 30 June 2018, the section 152 reference will be replaced by an LCR-style requirement covering 90 days.

Danske Bank / Annual Report 2017160
160 Danske Bank / Annual Report 2017
Notes – Danske Bank Group – Risk management
Insurance risk
The Group’s insurance risk consists of all risks related to its investment in Danica Pension, including market risk and life insurance risks. Net income from insurance business is derived primarily from
the risk allowance from conventional life insurance business with guaranteed benefits unit-linked business health and accident business return on assets in which the shareholders’ equity of Danica Pension is invested
The risk allowance is the annual return that Danica Pension may book from its conventional life insurance business (Danica Traditionel). The booking of the risk allowance is governed by the Danish FSA’s Executive Order on the Contribution Principle (revised in 2016). Under the present rules, Danica Pension may book a risk allowance of 0.60-0.90% of the technical provisions (depending on the individual interest rate group) as long as any difference between the technical basis and the risk allowance can be covered by the bonus potentials or the profit margin. According to the Danish FSA’s Executive Order on the Contribution Principle, policyholders’ funds in Danica Traditionel must be ring-fenced in groups with generally the same technical rate of interest, insurance risk and expenses. Danica Pension has individual investment and hedging strategies for each group. Furthermore, the collective bonus potential, the risk allowance, etc., are also determined for each group individually. Towards the end of 2017, Danica Pension acquired SEB Pension, the Danish life insurance arm of SEB Group. The acquisition is subject to appro val by the relevant Danish authorities and is expected to take effect during 2018. In terms of product offerings and risk management, SEB Pension is very similar to Danica Pension’s existing Danish operations, but enjoys strong bonus potentials in the conventional life insurance business. As such, the acquired business adds a stable and capital efficient cash flow to Danica Pension. Financial risks Market risk involves the risk of losses on assets in which the shareholders’ equity of Danica Pension is invested and the risk of losses on policies with guaranteed benefits because of changes in the fair value of assets and liabilities allocated to these contracts. Such changes in fair value can be caused by changes in interest rates, exchange rates, equity prices, property prices, credit spreads and market liquidity and also by issuer or counterparty defaults. Insurance obligations carry interest rate risk owing to the guarantees issued. For example, if market interest rates drop, the fair value of insurance obligations increases. The Group monitors the market risk on an ongoing basis and has set maximum risk targets for each asset class. Danica Pension conducts internal stress tests to ensure that it can withstand significant losses on its equity and credit exposure and substantial changes in interest rates. The risk relating to the relationship between investment assets and guaranteed benefits is managed by keeping the interest rate sensitivity of the bond and derivatives portfolios at a suitable level. The bond spread risk is limited since, at end-2017, 63% (2016: 65%) of the portfolio consisted of government and mortgage bonds of high quality (AA-AAA ratings from the international rating agencies) or unrated mortgage bonds issued by institutions with similarly high ratings, and only 21% (2016: 15%) of the portfolio was invested in sub-investment grade bonds.

Danske Bank / Annual Report 2017 161
Danske Bank / Annual Report 2017 161
Notes – Danske Bank Group – Risk management
Insurance risk continued Bond portfolio (insurance business) broken down by geographical area
Central and Quasi- Danish Swedish Other (DKK millions) local govern- government mortgage covered covered Corporate 2017 ment bonds bonds bonds bonds bonds bonds Total
Denmark 9,636 65,155 543 3,439 78,773
Sweden 1,197 2,812 4,009
UK 9 7 2,406 2,422
Norway 18 5 633 1,087 1,743
USA 11,434 5,981 17,415
Spain 2,548 746 3,294
France 1,866 1,866
Luxembourg 11 1,021 1,032
Canada 1 240 241
Finland 155 155
Ireland 1,139 547 1,686
Italy 5,103 9 984 6,096
Portugal 18 18
Austria 37 37
Netherlands 54 1,878 1,932
Germany 16,252 2,789 19,041
Other 3,855 235 11 14,200 18,301
Total 50,049 251 65,155 1,197 1,203 40,206 158,061
2016
Denmark 9,729 63,439 543 783 74,494
Sweden 851 492 6,585 7,928
UK 235 42 1,150 1,427
Norway 274 160 386 1,244 2,064
USA 10,557 5,469 16,026
Spain 1,729 565 2,294
France 3,018 2,261 5,279
Luxembourg 153 868 1,021
Canada 23 2 138 163
Finland 126 126
Ireland 2,798 732 3,530
Italy 5,739 16 654 6,409
Portugal 337 1 338
Austria 30 30
Netherlands 57 2,142 2,199
Germany 12,802 5 2,479 15,286
Other 3,547 117
17 15,641 19,322
Total 50,845 430 63,439 851 1,503 40,868 157,936
Concentration risk and counterparty credit risk are limited because of internal investing restrictions and the use of collateral management agreements for derivatives. Danica Pension hedges most of its foreign exchange risk. At the end of 2017, 62% was hedged (2016: 90%). Early surrender by policyholders may force Danica Pension to sell some of its investment assets at a low price. Danica Pension reduces this liquidity risk by investing a substantial portion of funds in liquid bonds and shares. The liquidity risk is also modest since Danica Pension can, to some extent, adapt the timing of payment upon surrender of pension schemes to the situation in the financial markets.
-
-
-
-
-
-
-
-
-
-
-
-
-
-
-
-
-
-
-
-
-
-
-
-
-
-
-
-
-
-
-
-
-
-
-
-
-
-
-
-
-
-
-
-
-
-
-
-
-
-
-
-
-
-
-
-
-
-
-
-
-
-
-
-
-
-
-
-
-
-
-
-
-
-
-
-
-
-
-
-
-
-
-
-
-
-
-
-
-
-
-
-
-
-
-
-
-
-
-
-
-
-
-
-
-
-
-
-
-
-
-
-
-

Danske Bank / Annual Report 2017162
162 Danske Bank / Annual Report 2017
Notes – Danske Bank Group – Risk management
Insurance risk continued Bond portfolio (insurance business) broken down by external ratings
Central and Quasi- Danish Swedish Other (DKK millions) local govern- government mortgage covered covered Corporate 2017 ment bonds bonds bonds bonds bonds bonds Total
AAA 37,395 52,952 405 1,171 4,797 96,720
AA+ 6 4 12 22
AA 1 6 165 172
AA- 170 11 417 598
A+ 1,152 25 3 1,352 2,532
A 193 1,329 955 2,477
A- 370 20 1,334 1,724
BBB+ 2,580 1,532 4,112
BBB 5,921 42 2,099 8,062
BBB- 456 1,840 2,296
Sub-inv. grade or unrated 1,805 185 10,874 767 12 25,703 39,346
Total 50,049 251 65,155 1,197 1,203 40,206 158,061
2016
AAA 33,518 152 52,308 826 1,448 9,177 97,429
AA+ 135 19 9 163
AA 3,629 609 4,238
AA- 916 11 487 1,414
A+ 2,813 25 883 3,721
A 236 1,110 1,247 2,593
A- 185 24 1,116 1,325
BBB+ 6,820 1,441 8,261
BBB 956 46 5 1,507 2,514
BBB- 475 1,478 1,953
Sub-inv. grade or unrated 1,162 208 10,021
20 22,914 34,325
Total 50,845 430 63,439 851 1,503 40,868 157,936
Policyholders assume the risk on investment assets under unit-linked contracts (Danica Link, Danica Balance and Danica Select) with the exception of policies with investment guarantees. At the end of 2017, about 16% (2016: 17%) of policyholders had investment guarantees, mainly related to Danica
Balance. The guarantees cannot be exercised until the time of retirement and are paid for by an annual fee. Danica Pension manages the risk on Danica
Link guarantees with derivatives, for example, and by adjusting the investment allocation over the last five years before disbursement. It manages the risk on Danica Balance guarantees by adjusting the investment allocation for the individual policies. Because of these hedging and risk management strategies, Danica Pension considers the investment risk on guarantees in unit-linked products to be minor.
Danica Pension has set a separate investment strategy for assets in which its shareholders’ equity is invested.
-
-
-
-
-
-
-
-
-
-
-
-
-
-
-
-
-
-
-
-
-
-
-
-
-
-
-
-
-
-
-
-
-
-
-
-
-
-
-
-
-
-
-
-
-
-
-
-
-
-
-
-
-
-
-
-
-
-
-
-
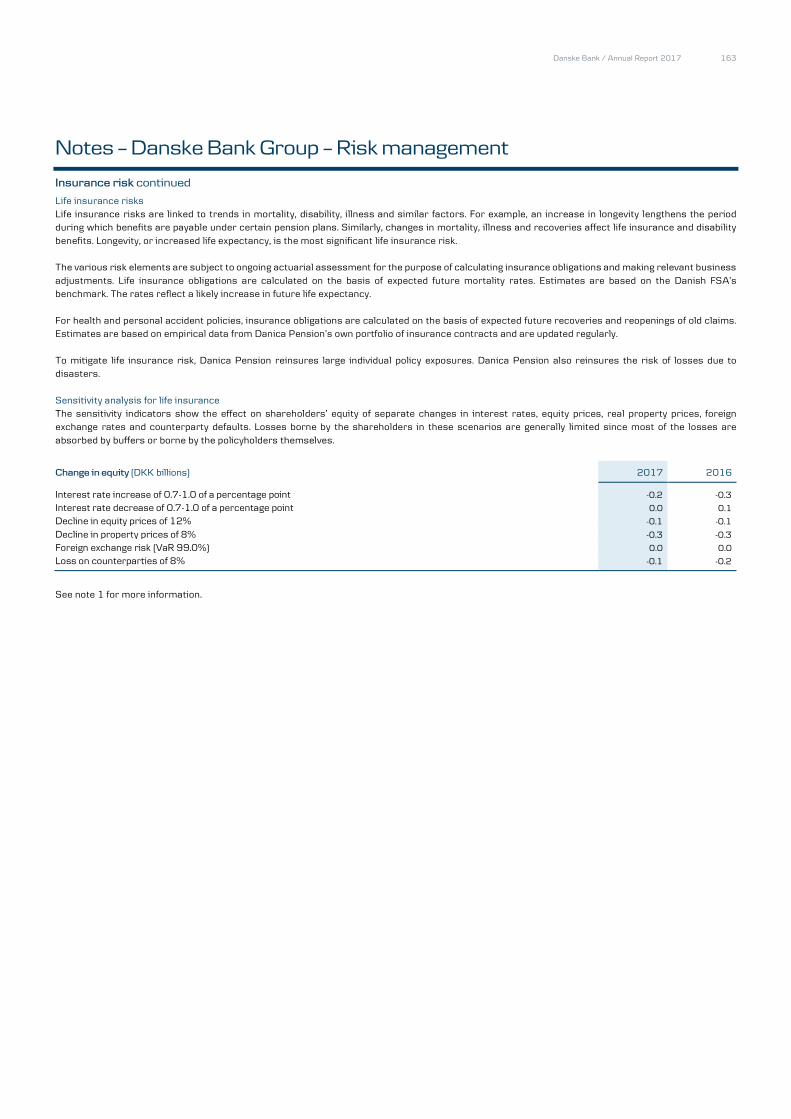
Danske Bank / Annual Report 2017 163
Danske Bank / Annual Report 2017 163
Notes – Danske Bank Group – Risk management
Insurance risk continued
Life insurance risks Life insurance risks are linked to trends in mortality, disability, illness and similar factors. For example, an increase in longevity lengthens the period during which benefits are payable under certain pension plans. Similarly, changes in mortality, illness and recoveries affect life insurance and disability benefits. Longevity, or increased life expectancy, is the most significant life insurance risk. The various risk elements are subject to ongoing actuarial assessment for the purpose of calculating insurance obligations and making relevant business adjustments. Life insurance obligations are calculated on the basis of expected future mortality rates. Estimates are based on the Danish FSA’s benchmark. The rates reflect a likely increase in future life expectancy. For health and personal accident policies, insurance obligations are calculated on the basis of expected future recoveries and reopenings of old claims. Estimates are based on empirical data from Danica Pension’s own portfolio of insurance contracts and are updated regularly. To mitigate life insurance risk, Danica Pension reinsures large individual policy exposures. Danica Pension also reinsures the risk of losses due to disasters. Sensitivity analysis for life insurance The sensitivity indicators show the effect on shareholders’ equity of separate changes in interest rates, equity prices, real property prices, foreign exchange rates and counterparty defaults. Losses borne by the shareholders in these scenarios are generally limited since most of the losses are absorbed by buffers or borne by the policyholders themselves. Change in equity (DKK billions) 2017 2016
Interest rate increase of 0.7-1.0 of a percentage point -0.2 -0.3
Interest rate decrease of 0.7-1.0 of a percentage point 0.0 0.1
Decline in equity prices of 12% -0.1 -0.1
Decline in property prices of 8% -0.3 -0.3
Foreign exchange risk (VaR 99.0%) 0.0 0.0
Loss on counterparties of 8% -0.1 -0.2
See note 1 for more information.

Danske Bank / Annual Report 2017164
Danske Bank / Annual Report 2017 164
Notes – Danske Bank Group
(DKK millions) 2017 2016 2015 2014 2013
Highlights
Net interest and fee income 40,885 41,976 45,090 45,713 43,650
Value adjustments 19,134 12,947 5,831 8,563 6,718
Staff costs and administrative expenses 22,192 21,742 22,093 23,001 23,997
Loan impairment charges -1,582 -168 -61 3,718 5,420
Income from associates and group undertakings 566 1,009 502 107 358
Net profit for the year 20,900 19,858 13,123 3,948 7,115
Loans 1,899,975 1,907,569 1,820,918 1,834,511 1,816,809
Total equity 168,256 166,615 160,830 152,384 145,657
Total assets 3,539,528 3,483,670 3,292,878 3,453,015 3,227,057
Ratios and key figures Total capital ratio (%)* 22.6 21.8 21.0 19.3 21.4
Tier 1 capital ratio (%)* 20.1 19.1 18.5 16.7 19.0
Return on equity before tax (%) 15.7 15.5 11.3 5.2 7.1
Return on equity after tax (%) 12.5 12.1 8.4 2.6 5.0
Income/Cost ratio (%) 208.2 203.7 160.7 120.4 130.0
Interest rate risk (%)* 2.3 2.4 2.2 2.2 1.7
Foreign exchange position (%)* 0.4 2.5 0.3 3.2 5.5
Foreign exchange risk (%)* - - - - -
Loans plus impairment charges as % of deposits 173.7 193.3 204.1 178.1 181.6
Gearing of loans 11.3 11.4 11.3 12.0 12.5
Growth in loans (%) 1.1 4.4 2.4 0.9 -5.7
Surplus liquidity in relation to statutory liquidity requirement (%)* 174.1 160.7 151.9 117.8 156.1
Sum of large exposures as % of total capital* 12.6 11.4 - - -
Impairment ratio (%) -0.1 - - 0.2 0.3
Return on assets (%) 0.6 0.6 0.4 0.1 0.3
Earnings per share (DKK)** 22.2 20.2 12.8 3.8 7.1
Book value per share (DKK)** 172.2 162.8 153.2 146.8 145.6
Proposed dividend per share (DKK) 10.0 9.00 8.00 5.50 2.00
Share price/earnings per share (DKK)** 10.9 10.6 14.5 44.6 17.5
Share price/book value per share (DKK)** 1.40 1.32 1.21 1.14 0.85
The ratios and key figures are calculated in accordance with the requirements in the Danish FSA’s Executive Order on Financial Reports for Credit Institutions and Investment Companies, etc., and on the basis of IFRS figures with the exception of ratios and key figures marked with an asterisk (*). These are calculated in accordance with Danish FSA rules. Ratios marked with two asterisks (**) are calculated on the assumption that additional tier I capital is classified as a liability.

Danske Bank / Annual Report 2017 165
165 Danske Bank / Annual Report 2017
Notes – Danske Bank Group
Definitions of ratios and key figures
Ratios and key figures Definition
Earnings per share (DKK) Net profit for the year divided by the average number of shares outstanding during the year. Net profit is stated
after the deduction of interest net of tax on equity-accounted additional tier 1 capital. Diluted earnings per share (DKK) Net profit for the year divided by the average number of shares outstanding during the year, including the dilutive
effect of share options and conditional shares granted as share-based payments. Net profit is stated after the deduction of interest net of tax on equity-accounted additional tier 1 capital.
Return on equity (%) Net profit for the year divided by average equity (average equity at beginning and end of year), including equity-
accounted additional tier 1 capital. For the definition used in the management report see page 46 on Alternative Performance Measures.
Income/cost ratio (%) Total income divided by expenses, including goodwill impairment charges. Common equity tier 1 capital Primarily paid-up share capital and retained earnings. Additional tier 1 capital Loans that form part of tier 1 capital. This means that additional tier 1 capital is used for covering losses if equity
is lost. Tier 1 capital Common equity tier 1 capital plus additional tier 1 capital, less certain deductions, such as intangible assets. Tier 2 capital Subordinated loan capital subject to certain restrictions. For example, if the Group defaults on its payment
obligations, lenders cannot claim early redemption of the loan capital. Total capital Tier 1 capital plus tier 2 capital, less certain deductions. Risk exposure amount Total risk exposure amount and off-balance-sheet items that involve credit risk, market risk and operational risk
as calculated in accordance with the Capital Requirements Regulation (CRR). Common equity tier 1 capital ratio Common equity tier 1 capital divided by the total risk exposure amount. Tier 1 capital ratio Tier 1 capital divided by the total risk exposure amount. Total capital ratio Total capital divided by the total risk exposure amount. Dividend per share (DKK) Proposed dividend on the net profit for the year divided by the number of shares issued at the end of the year. Share price at 31 December Closing price of Danske Bank shares at the end of the year. Book value per share (DKK) Shareholders’ equity at 31 December divided by the number of shares outstanding at the end of the year. Number of full-time-equivalent staff Number of full-time-equivalent staff (part-time staff translated into full-time staff) at the end of the at 31 December year. The figure does not include the staff of businesses held for sale. Funding ratio Lending divided by working capital less bond issues with a term to maturity shorter than one year. Working
capital comprises deposits, issued bonds, subordinated debt and shareholders’ equity. Lending and deposit figures do not include repo transactions.
Lending growth Growth in lending from the beginning to the end of the year, excluding repo transactions. Real property exposure Share of total lending and guarantees to the Real property and Building projects industry segments as defined
by Statistics Denmark.

Danske Bank / Annual Report 2017166
166 Danske Bank / Annual Report 2017
Financial statements – Danske Bank A/S
The financial statements of the Parent Company, Danske Bank A/S, are prepared in accordance with the Danish Financial Business Act and the Danish FSA’s Executive Order No. 281 of 26 March 2014 on Financial Reports for Credit Institutions and Investment Companies, etc. as amended by Executive Order No. 707 of 1 June 2016. The rules are identical to the Group’s IFRS-compliant valuation and measurement principles with the following exceptions: Domicile property is measured (revalued) at its estimated fair value through Other comprehensive income. The available-for-sale financial assets category is not used. On the implementation of the amendments made by the Danish FSA to the Executive Order on Financial Reports for Insurance Companies, the
impact from the change of the discount yield curve for insurance liabilities is recognised directly in shareholders’ equity at 1 January 2016, as required by the executive order. In the IFRS financial statements for Danske Bank Group, the change is treated as a change in accounting estimates and is included in the income statement.
The estimated fair value of domicile property is determined in accordance with the Danish FSA’s Executive Order on Financial Reports for Credit Institutions and Investment Companies, etc. Available-for-sale financial assets are measured at fair value through profit or loss. Holdings in subsidiaries are measured on the basis of the equity method, and tax payable by these undertakings is expensed under Income from associates and group undertakings.
Group internal reorganisations (including business combinations under joint control) are generally accounted for according to the book value method.
The acquirer accounts for the assets and liabilities of the acquiree at the carrying amounts at the acquisition date. Comparative information is not
restated. As of 31 December 2017, Danske Bank plc in Helsinki has been merged with Danske Bank A/S. The format of the Parent Company’s financial statements is not identical to the format of the consolidated financial statements prepared in accordance with IFRS. The table below shows the differences in net profit and shareholders’ equity between the IFRS consolidated financial statements and the Parent Company’s financial statements presented in accordance with Danish FSA rules.
Net profit Net profit Total equity Total equity
(DKK millions) 2017 2016 2017 2016
Consolidated financial statements (IFRSs) 20,900 19,858 168,256 166,615
Domicile property -46 -557 267 306
Available-for-sale financial assets -51 299 - -
Change in discount yield curve - -99 - -
Tax effect 25 80 -32 -36
Parent Company financial statements (Danish FSA rules) 20,829 19,581 168,491 166,885
Note 35 to the consolidated financial statements lists the Group’s holdings and undertakings.
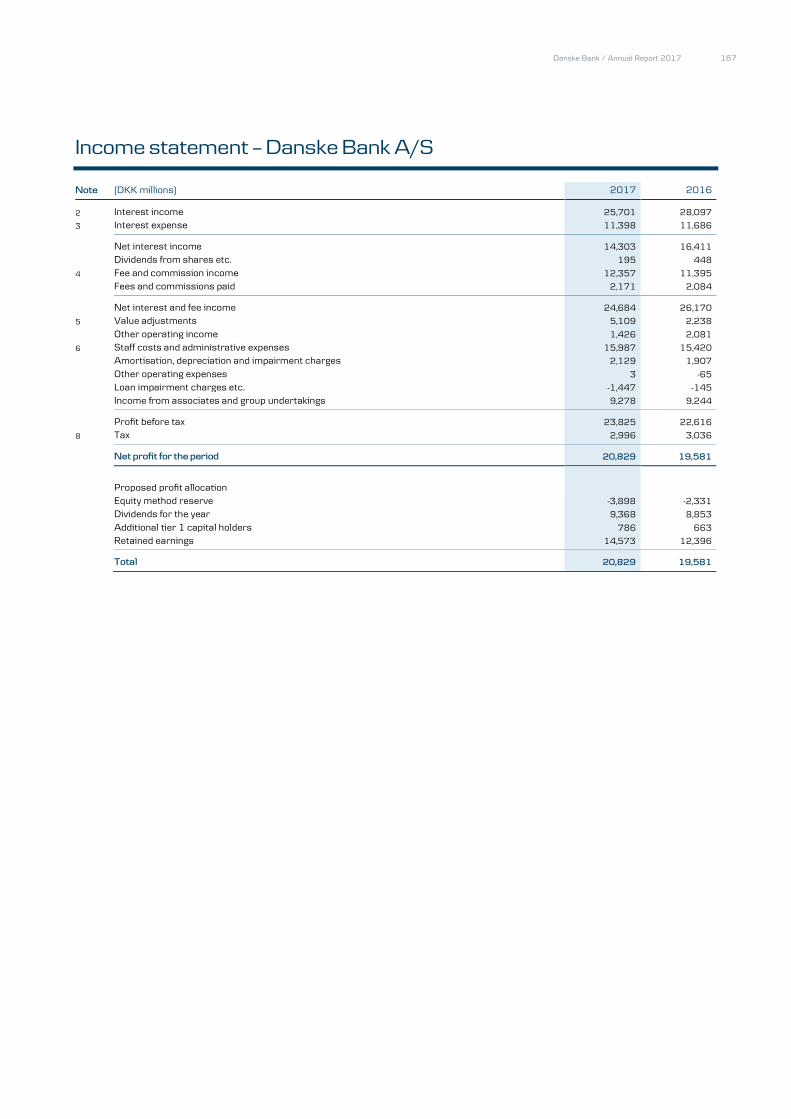
Danske Bank / Annual Report 2017 167
167 Danske Bank / Annual Report 2017
Income statement – Danske Bank A/S
Note (DKK millions) 2017 2016
2 Interest income 25,701 28,097
3 Interest expense 11,398 11,686
Net interest income 14,303 16,411
Dividends from shares etc. 195 448
4 Fee and commission income 12,357 11,395
Fees and commissions paid 2,171 2,084
Net interest and fee income 24,684 26,170
5 Value adjustments 5,109 2,238
Other operating income 1,426 2,081
6 Staff costs and administrative expenses 15,987 15,420
Amortisation, depreciation and impairment charges 2,129 1,907
Other operating expenses 3 -65
Loan impairment charges etc. -1,447 -145
Income from associates and group undertakings 9,278 9,244
Profit before tax 23,825 22,616
8 Tax 2,996 3,036
Net profit for the period 20,829 19,581
Proposed profit allocation Equity method reserve -3,898 -2,331
Dividends for the year 9,368 8,853
Additional tier 1 capital holders 786 663
Retained earnings 14,573 12,396
Total 20,829 19,581

Danske Bank / Annual Report 2017168
168 Danske Bank / Annual Report 2017
Statement of comprehensive income – Danske Bank A/S
Note (DKK millions) 2017 2016
Net profit for the year 20,829 19,581
Other comprehensive income
Items that will not be reclassified to profit or loss
Remeasurement of defined benefit plans 14 -972
8 Tax -92 234
Items that will not be reclassified to profit or loss -78 -738
Items that are or may be reclassified subsequently to profit or loss
Translation of units outside Denmark -473 -1,272
Hedging of units outside Denmark 425 1,234
8 Tax -94 -203
Items that are or may be reclassified subsequently to profit or loss -142 -241
Total other comprehensive income -220 -979
Total comprehensive income for the year 20,608 18,602
Portion attributable to
Shareholders of Danske Bank A/S (the Parent Company) 19,822 17,939
Additional tier 1 capital holders 786 663
Total comprehensive income for the year 20,608 18,602

Danske Bank / Annual Report 2017 169
Danske Bank / Annual Report 2017 169
Balance sheet – Danske Bank A/S
Note (DKK millions) 2017 2016
Assets
Cash in hand and demand deposits with central banks 64,574 20,757
9 Due from credit institutions and central banks 335,404 242,997
10 Loans and other amounts due at amortised costs 1,001,711 940,381
Bonds at fair value 332,211 337,049
12 Bonds at amortised cost 110,128 91,055
Shares etc. 20,062 22,517
Holdings in associates 451 327
Holdings in group undertakings 88,021 101,107
13 Assets under pooled schemes 54,207 52,352
Intangible assets 6,943 6,654
Land and buildings 308 369
14 Investment property 232 277
14 Domicile property 76 92
15 Other tangible assets 3,765 3,429
Current tax assets 960 860
16 Deferred tax assets 613 272
17 Assets held for sale 131 131
18 Other assets 272,856 346,757
Prepayments 1,278 1,225
Total assets 2,293,624 2,168,239
Liabilities and equity
Amounts due
19 Due to credit institutions and central banks 252,924 290,707
20 Deposits and other amounts due 992,544 760,877
Deposits under pooled schemes 55,016 53,312
21 Issued bonds at amortised cost 361,568 345,395
Current tax liabilities 878 726
22 Other liabilities 429,041 508,888
Deferred income 858 1,123
Total amounts due 2,092,828 1,961,028
Provisions for liabilities
Provisions and pensions and similar obligations 201 307
16 Provisions for deferred tax 5,845 5,851
Provisions for losses on guarantees 915 1,031
Other provisions for liabilities 26 46
Total provisions for liabilities 6,986 7,235
Subordinated debt
23 Subordinated debt
25,319 33,091
Equity
Share capital 9,368 9,837
Accumulated value adjustments -677 -629
Equity method reserve 24,115 28,013
Retained earnings 111,978 106,468
Proposed dividends 9,368 8,853
Shareholders of Danske Bank A/S (the Parent Company) 154,152 152,543
Additional tier 1 etc. 14,339 14,342
Total equity 168,491 166,885
Total liabilities and equity 2,293,624 2,168,239

Danske Bank / Annual Report 2017170
170 Danske Bank / Annual Report 2017
Statement of capital – Danske Bank A/S
Change in equity Foreign currency Equity Additional
Share translation Revaluation method Retained Proposed tier 1 (DKK millions) capital reserve reserve reserve earnings dividends Total capital Total
Total equity at 1 January 2017 9,837 -631 2 28,013 106,469 8,853 152,543 14,343 166,885
Net profit for the year - - - -3,898 23,940 - 20,042 786 20,829
Other comprehensive income Remeasurement of defined benefit plans - - - - 14 - 14 - 14
Translation of units outside Denmark - -473 - - - - -473 - -473
Hedging of units outside Denmark - 425 - - - - 425 - 425
Tax - - - - -186 - -186 - -186
Total other comprehensive income - -48 - - -172 - -220 - -220
Total comprehensive income for the year - -48 - -3,898 23,768 - 19,822 786 20,608
Transactions with owners Paid interest on additional tier 1 capital - - - - - - - -786 -786
Dividends paid - - - - 521 -8,853 -8,332 - -8,332
Dividends proposed - - - - -9,368 9,368 - - -
Share capital reduction -469 - - - 469 - - - -
Acquisition of own shares and additional tier 1 capital - - - - -51,642 - -51,642 -176 -51,819
Sale of own shares and additional tier 1 capital - - - - 41,447 - 41,447 173 41,620
Share-based payments - - - - 150 - 150 - 150
Tax - - - - 163 - 163 - 163
Total equity at 31 December 2017 9,368 -679 2 24,115 111,978 9,368 154,152 14,339 168,491
At the end of 2017, the share capital consisted of 936,827,722 shares of a nominal value of DKK 10 each. All shares carry the same rights; there is thus only one class of shares.

Danske Bank / Annual Report 2017 171
Danske Bank / Annual Report 2017 171
Statement of capital – Danske Bank A/S
Changes in equity Foreign currency Equity Additional Share translation Revaluation method Retained Proposed tier 1 (DKK millions) capital reserve reserve reserve earnings dividends Total capital Total
Total equity at 1 January 2016 10,086 -593 424 30,344 101,764 8,069 150,094 11,317 161,411
Net profit for the year - - - -2,331 21,249 - 18,918 663 19,581
Other comprehensive income Remeasurement of defined benefit plans - - - - -972 - -972 - -972
Translation of units outside Denmark - -1,272 - - - - -1,272 - -1,272
Hedging of units outside Denmark - 1,234 - - - - 1,234 - 1,234
Fair value adjustment of domicile property - - - - - - - - -
Sale of domicile property - - -542 - 542 - - - -
Tax - - 120 - -89 - 31 - 31
Total other comprehensive income - -38 -422 - -519 - -979 - -979
Total comprehensive income for the year - -38 -422 -2,331 20,730 - 17,939 663 18,602
Transactions with owners Issuance of additional tier 1 capital, net of transaction costs - - - - -30 - -30 3,000 2,970
Paid interest on additional tier 1 capital - - - - - - - -649 -649
Dividends paid - - - - 311 -8,069 -7,758 - -7,758
Dividends proposed - - - - -8,853 8,853 - - -
Share capital reduction -249 - - - 249 - - - -
Acquisition of own shares and additional tier 1 capital - - - - -38,121 - -38,121 -57 -38,178
Sale of own shares and additional tier 1 capital - - - - 30,089 - 30,089 67 30,156
Share-based payments - - - - 171 - 171 - 171
Tax - - - - 159 - 159 - 159
Total equity at 31 December 2016 9,837 -631 2 28,013 106,469 8,853 152,543 14,341 166,885
At the end of 2016, the share capital consisted of 983,712,835 shares of a nominal value of DKK 10 each. All shares carry the same rights; there is thus only one class of shares.
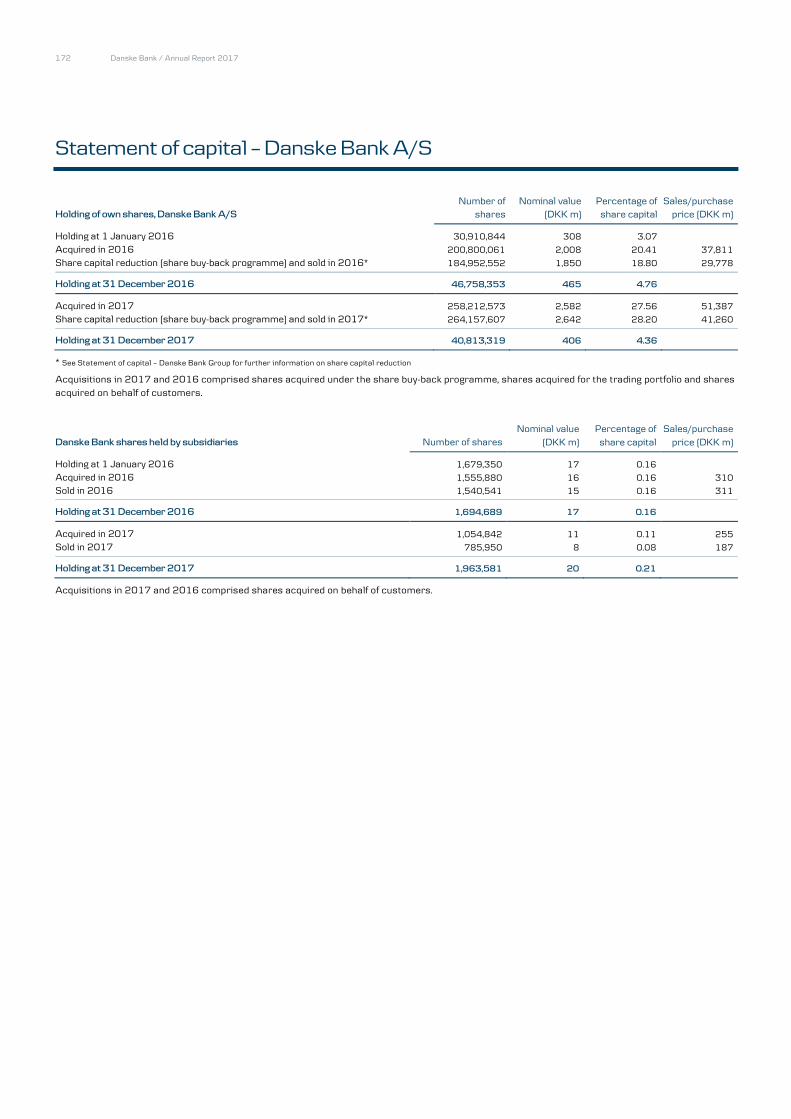
Danske Bank / Annual Report 2017172
172 Danske Bank / Annual Report 2017
Statement of capital – Danske Bank A/S
Holding of own shares, Danske Bank A/S
Number of shares
Nominal value (DKK m)
Percentage of share capital
Sales/purchase price (DKK m)
Holding at 1 January 2016 30,910,844 308 3.07 Acquired in 2016 200,800,061 2,008 20.41 37,811
Share capital reduction (share buy-back programme) and sold in 2016* 184,952,552 1,850 18.80 29,778
Holding at 31 December 2016 46,758,353 465 4.76
Acquired in 2017 258,212,573 2,582 27.56 51,387
Share capital reduction (share buy-back programme) and sold in 2017* 264,157,607 2,642 28.20 41,260
Holding at 31 December 2017 40,813,319 406 4.36
* See Statement of capital – Danske Bank Group for further information on share capital reduction
Acquisitions in 2017 and 2016 comprised shares acquired under the share buy-back programme, shares acquired for the trading portfolio and shares acquired on behalf of customers.
Danske Bank shares held by subsidiaries Number of shares Nominal value
(DKK m) Percentage of share capital
Sales/purchase price (DKK m)
Holding at 1 January 2016 1,679,350 17 0.16 Acquired in 2016 1,555,880 16 0.16 310
Sold in 2016 1,540,541 15 0.16 311
Holding at 31 December 2016 1,694,689 17 0.16
Acquired in 2017 1,054,842 11 0.11 255
Sold in 2017 785,950 8 0.08 187
Holding at 31 December 2017 1,963,581 20 0.21
Acquisitions in 2017 and 2016 comprised shares acquired on behalf of customers.

Danske Bank / Annual Report 2017 173
Danske Bank / Annual Report 2017 173
Statement of capital – Danske Bank A/S
2017 2016
168,491 166,885
-14,158 -14,133
-169 -169
(DKK millions)
Total capital and total capital ratio
Total equity Additional tier 1 capital instruments included in total equity Accrued interest on additional tier 1 capital instruments Tax on accrued interest on additional tier 1 capital instruments 37 37
Common equity tier 1 capital instruments 154,201 152,621
Adjustment to eligible capital instruments -1,060 -1,102
Prudential filters -960 -1,480
Proposed dividends -9,368 -8,853
Intangible assets of banking operations -6,943 -6,654
Deferred tax assets on intangible assets 377 315
Deferred tax assets that rely on future profitability, excluding temporary differences -125 -49
Defined benefit pension fund assets -451 -570
Statutory deduction for insurance subsidiaries -1,349 -626
Other statutory deductions -308 -186
Common equity tier 1 capital 134,012 133,415
Additional tier 1 capital instruments 18,574 23,623
Statutory deduction for insurance subsidiaries -169 -209
Other statutory deductions - -
Tier 1 capital 152,418 156,830
Tier 2 capital instruments 19,343 21,557
Statutory deduction for insurance subsidiaries -169 -209
Other statutory deductions - -
Total capital 171,592 178,178
Total risk exposure amount 661,884 647,597
Common equity tier 1 capital ratio (%) 20.2 20.6
Tier 1 capital ratio (%) 23.0 24.2
Total capital ratio (%) 25.9 27.5
The total capital and tier 1 capital ratios are calculated in accordance with the Danish Financial Business Act and applicable executive orders.
Internal Capital Adequacy Assessment 2017 (not covered by the statutory audit) provides more details on the solvency need of Danske Bank A/S. The section on risk exposure for Danske Bank Group in the risk management notes provides information about the Group’s financial risks and financial risk management.

Danske Bank / Annual Report 2017174
174 Danske Bank / Annual Report 2017
Notes – Danske Bank A/S
2017 2016
7,558 7,360
6,970 6,504
10,472 9,659
3,614 3,371
1. Net interest and fee income and value adjustments broken down by business segment
(DKK millions)
Personal Banking Business Banking C&I Wealth Management Other Activities 1,184 1,515
Total 29,798 28,408
Geographical segmentation Denmark 14,922 14,503
Finland 503 483
Ireland 425 502
Norway 5,276 4,899
UK 485 408
Sweden 7,540 6,945
Baltics 415 439
Germany 125 133
Poland 107 97
Total 29,798 28,408
Geographical segmentation is based on the location in which the individual transaction is recorded. The figures for Denmark include financing costs related to investments in activities outside Denmark.
2017 2016
-184 -155
-440 564
-1,156 -827
17,054 16,791
1,069 3,254
5,585 4,895
3,389 849
2,212 4,060
-16 -14
2. Interest income
(DKK millions)
Reverse transactions with credit institutions and central banks Other transactions with credit institutions and central banks Reverse loans Loans and other amounts due Bonds Derivatives, total Currency contracts Interest rate contracts Equity contracts Other interest income 179 78
Total 22,107 24,599
Negative interest income amounts to DKK 1,824 million (2016: DKK 1,845 million) and relates primarily to Repo transactions. In the table above, negative interest income is offset against interest income. In the Income statement, negative interest income is presented as interest expenses and negative interest expenses as interest income.
3. Interest expense
2017 2016
-185 -295
1,759 1,520
-234 -173
1,364 1,457
3,587 3,968
1,126 1,319
(DKK millions)
Repo transactions with credit institutions and central banks Other transactions with credit institutions and central banks Repo deposits Deposits and other amounts due Issued bonds Subordinated debt Other interest expenses 388 391
Total 7,804 8,188
Negative interest expenses amount to DKK 1,770 million (2016: DKK 1,653 million) and relates primarily to Repo transactions. In the table above, negative interest expenses are offset against interest expenses. In the Income statement, negative interest expenses are pres ented as interest income and negative interest income as interest expenses.

Danske Bank / Annual Report 2017 175
Danske Bank / Annual Report 2017 175
Notes – Danske Bank A/S
2017 2016
6,601 6,082
1,877 1,657
1,673 1,556
925 899
4. Fee and commission income
(DKK millions)
Securities trading and custody account fees Payment services fees Origination fees Guarantee commissions Other fees and commissions 1,282 1,201
Total 12,357 11,395
2017 2016
-274 247
950 177
1,155 -393
- -
498 1,921
-507 -1,899
-68 1,890
- -1,964
5. Value adjustments
(DKK millions)
Loans at fair value Bonds Shares etc. Investment property Currency Derivatives Assets under pooled schemes Deposits under pooled schemes Other liabilities 3,354 2,260
Total 5,109 2,238
2017 2016
86 78
6. Staff costs and administrative expenses
(DKK millions)
Remuneration of the Executive Board and the Board of Directors Executive Board Board of Directors 10 10
Total 96 87
See note 33 of the consolidated financial statements for Remuneration of material risk takers of Danske Bank Group and Danske Bank A/S.
2017 2016
8,357 8,242
1,037 977
Staff costs (DKK millions)
Salaries Pensions Financial services employer tax and social security costs 1,572 1,425
Total 10,966 10,645
Other administrative expenses 4,925 4,688
Total staff costs and administrative expenses 15,987 15,420
Number of full-time-equivalent staff (avg.) 14,307 14,092
Note 33 of the consolidated financial statements contains additional information about the remuneration of the Board of Directors, the Executive Board, and other material risk takers.

Danske Bank / Annual Report 2017176
176 Danske Bank / Annual Report 2017
Notes – Danske Bank A/S
2017 2016
8 8
3 3
- -
7. Audit fees
(DKK millions)
Audit firms appointed by the general meeting Fees for statutory audit of the parent company financial statements Fees for other assurance engagements Fees for tax advisory services Fees for other services 1 15
Total 12 26
2017 2016
3,381 3,082
-44 25
-341 -71
8. Tax
(DKK millions)
Calculated tax charge for the year Deferred tax Adjustment of prior-year tax charges Lowering of tax rate - -
Total 2,996 3,036
Effective tax rate (%) (%)
Danish tax rate 22.0 22.0
Non-taxable income and non-deductible expenses 1.2 0.9
Difference between tax rates of units outside Denmark and Danish tax rate -0.2 0.5
Adjustment of prior-year tax charges -2.4 -0.5
Lowering of tax rate - -
Effective tax rate 20.6 22.9
Portion included under Income from associates and group undertakings -8.0 -9.4
Total 12.6 13.5
Tax on other comprehensive income Remeasurement of defined benefit plans -92 -234
Hedging of units outside Denmark -93 203
Fair value adjustment of domicile property - -
Total -185 -31

Danske Bank / Annual Report 2017 177
177 Danske Bank / Annual Report 2017
Notes – Danske Bank A/S
2017 2016
43,081 25,709
267,138 214,551
21,185 904
2,403 715
9. Due from credit institutions and central banks
(DKK millions)
On demand Up to 3 months From 3 months to 1 year From 1 to 5 years Over 5 years 1,597 1,117
Total 335,404 242,997
Due from credit institutions 82,408 82,193
Term deposits with central banks 252,996 160,804
Total 335,404 242,997
Reverse transactions included in above item 60,649 51,328
2017 2016
67,733 69,506
239,116 376,946
143,643 108,745
228,893 140,265
10. Loans and other amounts due at amortised cost
(DKK millions)
On demand Up to 3 months From 3 months to 1 year From 1 to 5 years Over 5 years 322,326 244,919
Total 1,001,711 940,381
Revers transactions included in above item 181,785 204,271
Loans and guarantees broken down by sector and industry (%) 2017 2016
Public sector 4.2 8.5
Business customers Agriculture, hunting, forestry and fisheries 1.5 1.6
Manufacturing industries and extraction of raw materials 9.3 8.8
Energy and utilities 1.5 1.3
Building and construction 2.1 1.5
Trade 4.8 4.3
Transport, hotels and restaurants 3.8 4.3
Information and communication 1.1 0.9
Finance and insurance 23.8 24.7
Property administration 14.3 12.0
Other 3.6 3.2
Total Busines customers 65.7 62.7
Personal customers 30.1 28.8
Total 100.0 100.0

Danske Bank / Annual Report 2017178
178 Danske Bank / Annual Report 2017
Notes – Danske Bank A/S
Loans, advances Loans, advances Other Other and guarantees, and guarantees, amounts due, amounts due,
individual collective individual collective impairment impairment impairment impairment Total
15,362 4,163 7 8 19,540
3,695 121 - - 3,816
3,284 1,336 24 3 4,646
1,116 108 12 5 1,241
11. Impairment charges for loans and guarantees
(DKK millions)
Impairment charges at 1 January 2017 Impairment charges during the year Reversals of impairment charges from previous years Addition from merger Other changes -3,673 115 10 -5 -3,553
Impairment charges at 31 December 2017 13,216 3,171 5 6 16,398
Value adjustment of assets taken over - - - - -
Impairment charges at 1 January 2016 18,803 3,718 7 18 22,545
Impairment charges during the year 3,761 1,410 24 - 5,195
Reversals of impairment charges from previous years 3,554 1,005 - 8 4,567
Other changes -3,648 40 -24 -2 -3,634
Impairment charges at 31 December 2016 15,362 4,163 7 8 19,540
Value adjustment of assets taken over - - - - -
2017 2016 (DKK millions) Individual Collective Individual Collective
Total loans and other amounts due, with objective evidence of impairment, before impairment charges. The amount does not include loans and otheramounts recognised at nil. 33,974 1,537,203 31,472 1,439,342
Carrying amount net of impairment charges. 26,093 1,533,670 22,032 1,435,171
2017 2016
111,519 92,992
12. Bonds at amortised cost
(DKK millions)
Fair value of hold-to-maturity assets Carrying amount of hold-to-maturity assets 110,128 91,055
2017 2016
25,322 19,319
13,684 8,347
15,346 25,118
13. Assets under pooled schemes
(DKK millions)
Bonds at fair value Shares Unit trust certificates Cash deposits etc. 664 528
Total assets before elimination 55,016 53,312
Own shares 354 418
Other internal balances 455 542
Total 54,207 52,352

Danske Bank / Annual Report 2017 179
Danske Bank / Annual Report 2017 179
Notes – Danske Bank A/S
14. Investment and domicile property
2017 2016
(DKK millions) Investment
property Domicile property
Investment property
Domicile property
Fair value/revaluation at 1 January 277 92 301 74
Additions, including property improvement expenditure 5 - 5 17
Disposals 36 17 41 2
Depreciation charges - 2 - 2
Value adjustment recognised through other comprehensive income - - - -
Value adjustment recognised through profit or loss 2 3 1 5
Other changes including properties moved to Assets held for sale -16 - 11 -
Fair value/revaluation at 31 December 232 76 277 92
Required rate of return for calculation of fair value/revaluation (% p.a.) 5.0 - 6.0 5.0 - 8.0 5.0 - 6.0 5.0 - 8.3
Fair value and revaluations are assessed by the Group’s valuers.
2017 2016
7,382 7,087
-63 7
1,882 1,529
1,398 1,241
15. Other tangible assets
(DKK millions)
Cost at 1 January Foreign currency translation Additions, including leasehold improvements Disposals Addition from merger 434 -
Cost at 31 December 8,237 7,382
Depreciation and impairment charges at 1 January 3,953 3,873
Foreign currency translation -31 -9
Depreciation charges 1,159 946
Depreciation and impairment charges for assets sold 1,009 857 Addition from merger 399 -
Depreciation and impairment charges at 31 December 4,472 3,953
Carrying amount at 31 December 3,765 3,429

Danske Bank / Annual Report 2017180
180 Danske Bank / Annual Report 2017
Notes – Danske Bank A/S
At 1 Jan.
Foreign currency
translation
Recognised in profit for the
year
Recognised in shareholders'
equity
Addition from
merger At 31 Dec.
-149 11 65 -152 -225
173 -14 177 - 2 338
-5 1 1 - -3
- -1 -190 -18 -209
-242 7 110 - -125
5,954 - -121 - 5,833
16. Change in deferred tax
2017 (DKK millions)
Intangible assets Tangible assets Securities Provisions for obligations Tax loss carry forwards Recapture of tax loss Other -153 - -40 - -184 -377
Total 5,579 4 2 -170 -182 5,232
Adj. of prior-year tax charges included in above item 46
8 - -157 - - -149
153 7 13 - - 173
-8 -1 4 - - -5
-17 -2 66 -47 - -
-40 - -202 - - -242
5,943 - 11 - - 5,954
Intangible assets Tangible assets Securities Provisions for obligations Tax loss carry forwards Recapture of tax loss Other -360 -13 220 - - -153
Total 5,680 -9 -45 -47 - 5,579
Adj. of prior-year tax charges included in above item -70
2017 2016
613 272
Unrecognised tax loss carryforwards amounted to DKK 2.9 billion at the end of 2017 (31 December 2016: DKK 3.0 billion).
Deferred tax (DKK millions)
Deferred tax assets Provisions for deferred tax 5,845 5,851
Deferred tax, net 5,232 5,579
17. Assets held for sale and liabilities in disposal groups held for sale
Assets held for sale also includes domicile properties amounting to DKK 131 million classified as held for sale (2016: 131 million).
2017 2016
261,918 334,516
18. Other assets
(DKK millions)
Positive fair value of derivatives Other assets 10,939 12,241
Total 272,856 346,757
2016 (DKK millions)
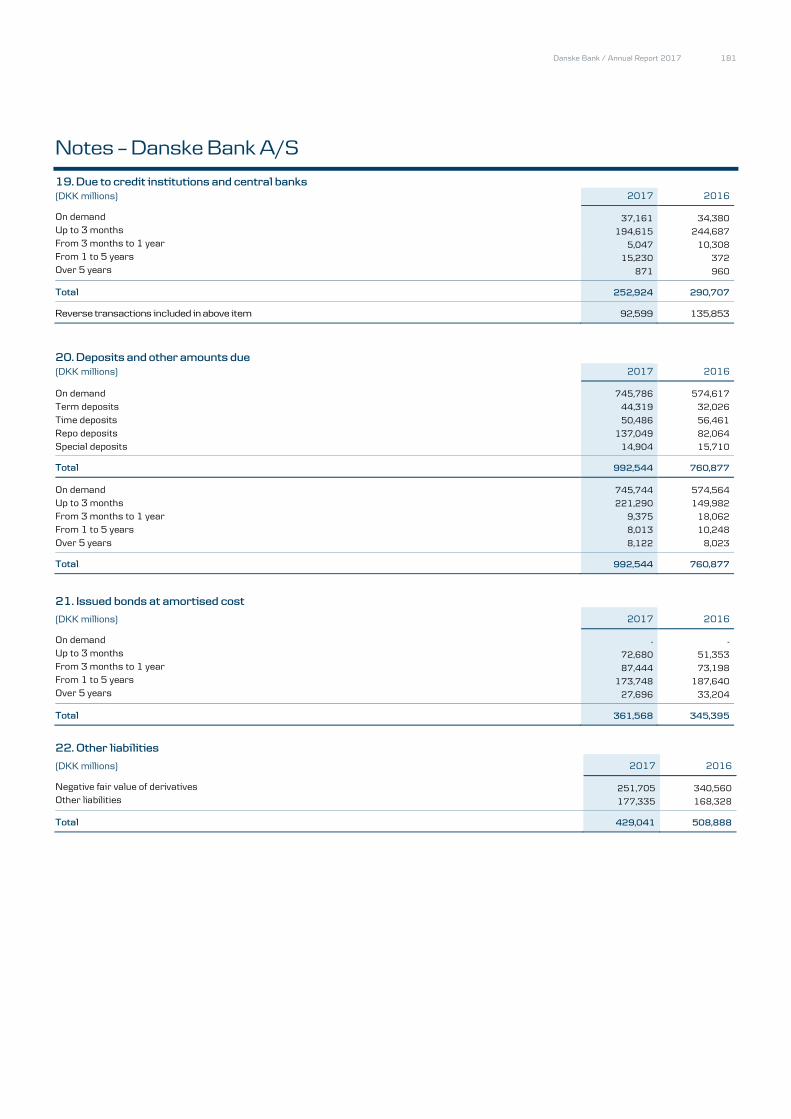
Danske Bank / Annual Report 2017 181
Danske Bank / Annual Report 2017 181
Notes – Danske Bank A/S
2017 2016
37,161 34,380
194,615 244,687
5,047 10,308
15,230 372
19. Due to credit institutions and central banks
(DKK millions)
On demand Up to 3 months From 3 months to 1 year From 1 to 5 years Over 5 years 871 960
Total 252,924 290,707
Reverse transactions included in above item 92,599 135,853
20. Deposits and other amounts due
(DKK millions) 2017 2016
On demand 745,786 574,617
Term deposits 44,319 32,026
Time deposits 50,486 56,461
Repo deposits 137,049 82,064
Special deposits 14,904 15,710
Total 992,544 760,877
On demand 745,744 574,564
Up to 3 months 221,290 149,982
From 3 months to 1 year 9,375 18,062
From 1 to 5 years 8,013 10,248
Over 5 years 8,122 8,023
Total 992,544 760,877
2017 2016
- -
72,680 51,353
87,444 73,198
173,748 187,640
21. Issued bonds at amortised cost
(DKK millions)
On demand Up to 3 months From 3 months to 1 year From 1 to 5 years Over 5 years 27,696 33,204
Total 361,568 345,395
2017 2016
251,705 340,560
22. Other liabilities
(DKK millions)
Negative fair value of derivatives Other liabilities 177,335 168,328
Total 429,041 508,888

Danske Bank / Annual Report 2017182
182 Danske Bank / Annual Report 2017
Notes – Danske Bank A/S
23. Subordinated debt
Subordinated debt consists of liabilities in the form of subordinated loan capital and hybrid capital, which, in the event of Danske Bank’s voluntary or compulsory winding-up, will not be repaid until the claims of ordinary creditors have been met. Hybrid capital ranks below subordinated loan capital. Early redemption of subordinated debt must be approved by the Danish FSA.
Subordinated debt is included in the capital base in accordance with section 128 of the Danish Financial Business Act.
Currency
Nominal (millions)
Interest rate
Year of issue Maturity
Redemption price
2017 (DKK millions)
2016 (DKK millions)
Subordinated debt, excluding liability accounted additional tier 1 capital Redeemed loans -
GBP 350 5.375 2003 29.09.2021 100 2,936 3,043
EUR 1.000 3.875 2013 04.10.2023 100 7,445 7,434
SEK 900 4.75 2013 05.06.2024 100 681 701
SEK 1.600 var. 2013 05.06.2024 100 1,211 1,246
NOK 700 var. 2013 06.12.2023 100 530 573
DKK 1.700 var. 2013 06.06.2024 100 1,700 1,700
DKK 1.150 4.125 2013 09.12.2025 100 1,150 1,150
CHF 150 3.125 2013 18.12.2025 100 954 1,038
EUR 500 2.75 2014 19.05.2026 100 3,723 3,717
Subordinated debt, excluding liability accounted additional tier 1 capital 20,330 20,602
Liability accounted additional tier 1 capital Redeemed loans 11,669
USD 750 6,125 2017 Perpetual 100 4,655 -
Liability accounted additional tier 1 capital 4,655 11,669
Nominal subordinated debt 24,985 32,271
Fair value hedging of interest rate risk and discount 356 877
Own holding of subordinated debt -22 -57
Total subordinated debt 25,319 33,091
Portion included in Total capital as additional tier 1 or tier 2
capital instruments 23,759 31,048
Interest on subordinated debt and related items Interest 1,126 1,319
Origination and redemption costs 8 -
Extraordinary repayments 11,669 -
In addition, total capital includes DKK 14.2 billion of additional tier I bonds accounted for as equity.
Note 21 to the consolidated financial statements contains additional information about subordinated debt and contractual terms.

Danske Bank / Annual Report 2017 183
Danske Bank / Annual Report 2017 183
Notes – Danske Bank A/S
24. Assets deposited as collateral
At the end of 2017, Danske Bank A/S had deposited DKK 17,253 million worth of securities as collateral with Danish and international clearing centres and other institutions (31 December 2016: DKK 12,277 million). In addition, the Group had deposited DKK 0 million worth of own bonds (31 December 2016: DKK 0 million). The amount has been eliminated in the balance sheet.
In repo transactions, which involve selling securities to be repurchased at a later date, the securities remain in the balance sheet, and the amounts received are recognised as deposits. Repo transaction securities are treated as assets provided as collateral for liabilities. Counterparties are entitled to sell the securities or deposit them as collateral for other loans.
Assets sold in repo transactions (DKK millions) 2017 2016
Bonds at fair value 215,262 217,551
Shares etc. - -
Total 215,262 217,551
Total collateral deposited for subsidiaries - -
In addition, the Group had deposited DKK 12,903 million worth of own bonds as collateral for repo transactions and securities lending (31 December 2016: DKK 55 million). The amount has been eliminated in the balance sheet.
At the end of 2017, Danske Bank A/S had provided DKK 71,184 million worth of cash and securities as collateral for derivatives transactions (31 December 2016: DKK 104,098 million).
Danske Bank A/S had registered DKK 233,116 million worth of loans and advances and DKK 10,474 million worth of other assets as collateral for covered bonds at the end of 2017 (31 December 2016: DKK 210,387 million and DKK 7,960 million, respectively).

Danske Bank / Annual Report 2017184
184 Danske Bank / Annual Report 2017
Notes – Danske Bank A/S
25. Contingent liabilities
The Group uses a variety of loan-related financial instruments to meet the financial requirements of its customers. These include loan offers and other credit facilities, guarantees and instruments that are not recognised in the balance sheet.
2017 2016
10,036 7,055
60,387 59,713
33,406 9,546
Guarantees and other liabilities (DKK millions)
Guarantees etc. Financial guarantees Mortgage finance guarantees Registration and remortgaging guarantees Other guarantees 111,698 88,426
Total 215,527 164,740
Other liabilities Loan commitments shorter than 1 year 125,563 72,847
Loan commitments longer than 1 year 162,855 151,181
Other obligations 100 100
Total 288,518 224,128
Owing to its business volume, Danske Bank is continually a party to various lawsuits and disputes and has an ongoing dialogue with public authoritie, such as the Danish FSA. In view of its size, Danske Bank does not expect the outcomes of pending lawsuits and disputes or its dialogue with public authorities to have any material effect on its financial position. The supervisory authorities conduct ongoing inspections of Danske Bank’s compliance with anti-money laundering legislation. As announced on 21 March 2016, the Danish FSA has reported Danske Bank to the Danish Public Prosecutor for Serious Economic and International Crime for investigation into non-compliance with the provisions of Danish anti-money laundering legislation with regard to identification of and monitoring procedures for correspondent banks. On 21 December 2017, the case was settled with a fine in the amount of DKK 12.5 million. As announced on 11 October 2017, Danske Bank has been placed under investigation by the French Tribunal de Grande Instance de Paris court in relation to suspicions of money laundering concerning transfers to France carried out by former customers of Danske Bank Estonia from 2008 to 2011. In January 2018, the French court Tribunal de Grande Instance de Paris changed the status of Danske Bank in the investigation to that of an assisted witness. This means that Danske Bank is no longer placed under formal investigation, but still forms part of the investigation as an assisted witness.
A limited number of employees are employed under terms which, if they are dismissed before reaching their normal retirement age, grant them an extraordinary severance and/or pension payment in excess of their entitlement under ordinary terms of employment. As the sponsoring employer, Danske Bank is also liable for the pension obligations of a number of company pension funds.
Danske Bank A/S is taxed jointly with all Danish entities of Danske Bank Group and is jointly and severally liable with these for payment of Danish
corporation tax and withholding tax, etc.
Danske Bank A/S is registered jointly with all significant Danish entities of Danske Bank Group for financial services employer tax and VAT, for which Danske Bank A/S and the entities are jointly and severally liable.
Note 24 of the consolidated financial statements contains additional information about contingent liabilities.

Danske Bank / Annual Report 2017 185
Danske Bank / Annual Report 2017 185
Notes – Danske Bank A/S
26. Related parties
Parties with
significant influence Associates Group undertakings Board of
Directors Executive Board (DKK millions) 2017 2016 2017 2016 2017 2016 2017 2016 2017 2016
Loans and loan commitments 10,306 7,314 1,222 1,737 33,643 36,144 7 29 5 4
Securities and derivatives 631 1,293 835 870 114,510 136,245 - - - -
Deposits 1,403 415 80 352 22,701 43,957 24 55 14 12
Derivatives 197 167 - - 9,157 20,821 - - - -
Issued bonds - - - - 36,303 23,413 - - - -
Pension obligation
Guarantees issued 615 758 2 2 96,439 82,093 - -18 - -
Guarantees and collateral received 520 676 581 96 3,055 2,830 7 28 2 2
Interest income 85 50 29 34 765 819 - - - -
Interest expense 5 25 - 6 -41 - - - - -
Fee income 17 10 2 1 330 1,028 1 - - -
Dividend income 4 14 115 115 7,642 10,229 - - - -
Other income 6 15 - - 16 21 - - - -
Loan impairment charges - - -1 3 - - - - - -
Trade in Danske Bank shares Acquisitions - - - - - - - 1 - 1
Sales 2,348 4143 - - - - - - 6 5
Related parties with significant influence include shareholders with holdings exceeding 20% of Danske Bank A/S’s share capital. The A.P. Møller and Chastine Mc-Kinney Møller Foundation and companies of A.P. Møller Holding Group, Copenhagen, hold 20.0% of the share capital. The consolidated financial statements specify significant group holdings and holdings in associates under Group holdings and undertakings. The Board of Directors and Executive Board columns list the personal facilities, deposits, etc. held by members of the Board of Directors and the Executive Board and their dependants, and facilities with businesses in which these parties have a controlling or significant influence. In 2017, the average interest rates on credit facilities granted to members of the Board of Directors and the Executive Board were 2.1% (2016: 0.7%) and 2.3% (2016: 2.1%), respectively. Notes 33 and 34 of the consolidated financial statements specify the remuneration and shareholdings of management. Pension funds set up for the purpose of paying out pension benefits to employees of Danske Bank A/S are also considered related parties. In 2017, transactions with these funds comprised loans and advances in the amount of DKK 1 million (2016: DKK 3 million), deposits in the amount of DKK 89 million (2016: DKK 96 million), derivatives with a positive fair value of DKK 0 million (2016: DKK 0 million), derivatives with a negative fair value of DKK 308 million (2016: DKK 446 million), interest expenses of DKK 2 million (2016: DKK 2 million) and pension contributions of DKK 17 million (2016: DKK 303 million).
Danske Bank A/S acts as the bank of a number of its related parties. Payment services, trading in securities and other instruments, depositing of surplus
liquidity and provision of short- and long-term financing are the primary services provided by Danske Bank A/S. Danske Bank A/S sells Finnish and
Swedish housing loans at fair value to the subsidiaries Danske Mortgage Bank Plc and Danske Hypotek AB, which issue covered bonds on those loans.
Loans are sold when the subsidiaries issue new covered bonds. In addition, Danske Bank A/S and group undertakings receive interest on holdings, if any,
of listed bonds issued by companies within the Group. Note 15 of the consolidated financial statements specifies the Group’s holdings of own mortgage
bonds. Danske Bank A/S handles a number of administrative functions, such as IT operations and development, HR management, procurement and marketing activities for group undertakings. Danske Bank A/S received a total fee of DKK 2,025 million for services provided in 2017 (2016: DKK 1,746 million). The figures above do not include debt to related parties in the form of issued notes or bonds. Such notes or bonds are bearer securities, which means that Danske Bank does not know the identity of the holders. Danske Bank shares may be registered by name. Related parties’ holdings of Danske Bank shares equalling 5% or more of Danske Bank’s share capital are determined on the basis of the most recent reporting of holdings to Danske Bank.
In 2017, Danske Bank A/S acquired all activities, assets and liabilities of the subsidiary Danske Capital AB at market price. Transactions with related parties are settled on an arm’s-length basis, whereas transactions with group undertakings are settled on a cost-reimbursement basis.

Danske Bank / Annual Report 2017186
186 Danske Bank / Annual Report 2017
Notes – Danske Bank A/S
27. Hedging of risk 2017 2016
(DKK millions) Carrying amount
Amortised/ notional value
Carrying amount
Amortised/ notional value
Assets Due from credit institutions 765 763 1,289 1,285
Loans 51,423 49,783 48,157 46,221
Total 52,188 50,546 49,446 47,506
Financial instruments hedging interest rate risk
Derivatives -3,680 63,691 -4,639 64,002
Liabilities
Deposits 2,094 2,087 19,045 18,999
Due to credit institutions 15,026 15,063 5,734 5,721
Issued bonds 261,196 256,820 322,269 315,031
Subordinated debt 20,759 20,330 33,091 32,169
Total 299,076 294,300 380,138 371,920
Financial instruments hedging interest rate risk
Derivatives 10,005 343,467 13,110 440,542
Note 12 of the consolidated financial statements includes additional information about hedge accounting.
28. Group holdings and undertakings
Note 35 of the consolidated financial statements lists the Group’s major holdings and undertakings as well as associates.

Danske Bank / Annual Report 2017 187
Danske Bank / Annual Report 2017 187
Notes – Danske Bank A/S (DKK millions) 2017 2016 2015 2014 2013
Highlights Net interest and fee income 24,684 26,170 27,549 27,945 25,259
Value adjustments 5,109 2,238 -880 -653 254
Staff costs and administrative expenses 15,987 15,420 15,562 16,386 17,186
Loan impairment charges etc. -1,447 -145 -50 2,745 3,545
Income from associates and group undertakings 9,278 9,244 8,018 7,301 4,957
Net profit for the period 20,829 19,581 12,933 4,034 7,802
Loans 1,001,711 940,381 878,321 901,168 899,572
Total equity 168,491 166,885 161,542 153,921 146,603
Total assets 2,293,624 2,168,239 2,037,190 2,276,448 2,126,382
2017 2016 2015 2014 2013
Ratios and key figures Total capital ratio (%) 25.9 27.5 25.5 24.4 27.2
Tier 1 capital ratio (%) 23.0 24.2 22.5 21.2 24.3
Return on equity before tax (%) 14.2 13.8 9.6 3.9 6.4
Return on equity after tax (%) 12.4 11.9 8.2 2.6 5.5
Income/Cost ratio (%) 242.9 232.0 171.5 119.0 141.0
Interest rate risk (%) 3.2 3.6 1.5 1.6 1.1
Foreign exchange position (%) 0.5 2.0 1.2 3.4 5.9
Foreign exchange risk (%) - - - - -
Loans plus impairment charges as % of deposits 97.1 117.8 125.6 110.3 113.7
Gearing of loans 5.9 5.6 5.4 5.9 6.1
Growth in loans (%) -2.6 7.7 4.7 - -10.7
Surplus liquidity in relation to statutory liquidity requirement (%) 213.4 201.9 192.8 141.0 199.6
Sum of large exposures as % of total capital 12.5 11.4 - - -
Funding ratio 0.6 0.6 0.6 0.6 0.6
Real property exposure 14 12 12 10 10
Impairment ratio (%) -0.1 - - 0.3 0.3
Return on assets (%) 0.9 0.9 0.6 0.4 0.4
Earnings per share (DKK) 21.7 19.7 12.8 3.8 7.7
Book value per share (DKK) 188.0 178.1 165.2 153.6 146.2
Proposed dividend per share (DKK) 10.0 9.0 8.0 5.50 2.00
Share price end of period/earnings per share (DKK) 11.1 10.9 14.4 43.0 16.1
Share price end of period/book value per share (DKK) 1.30 1.20 1.12 1.09 0.85
The ratios are defined by the Danish FSA in, for example, its Executive Order on Financial Reports for Credit Institutions and Investment Companies, etc.

Danske Bank / Annual Report 2017188
The Board of Directors and the Executive Board (the management) have considered and approved the annual report of Danske Bank A/S for the financial year 2017.
The consolidated financial statements have been prepared in accordance with the International Financial Reporting Standards as adopted by the EU, and the Parent Company financial statements have been prepared in accordance with the Danish Financial Business Act. Furthermore, the annual report has been prepared in accordance with Danish disclosure requirements for annual reports of listed financial institutions.
In our opinion, the consolidated financial statements and the Parent Company financial statements give a true and fair view of the Group’s and the Parent Company’s assets, liabilities, shareholders’ equity and financial position at 31 December 2017 and of the results of the Group’s and the Parent Company’s operations and the consolidated cash flows for the financial year 2017. Moreover, in our opinion, the management’s report includes a fair review of developments in the Group’s and the Parent Company’s operations and financial position and describes the significant risks and uncertainty factors that may affect the Group and the Parent Company.
The management will submit the annual report to the general meeting for approval.
Copenhagen, 2 February 2018
Executive Board
Thomas F. BorgenCEO
Jacob Aarup-Andersen Tonny Thierry Andersen
James Ditmore Carsten Rasch Egeriis Lars Mørch
Jesper Nielsen Glenn Söderholm
Board of Directors
Ole Andersen Urban Bäckström Lars-Erik Brenøe Chairman Vice Chairman
Jørn P. Jensen Rolv Erik Ryssdal Carol Sergeant
Martin Tivéus Hilde Tonne Dorte Annette Bielefeldt Elected by the employees Kirsten Ebbe Brich Carsten Eilertsen Charlotte Hoffmann Elected by the employees Elected by the employees Elected by the employees
Statement by the management

Danske Bank / Annual Report 2017 189
To the shareholders of Danske Bank A/S
OpinionWe have audited the consolidated financial statements and the parent financial statements of Danske Bank A/S for the financial year 1 January 2017 to 31 December 2017, pages 48-187, which comprise the income statement, statement of comprehensive income, balance sheet, statement of capital and notes, including the summary of significant accounting policies, for the Group as well as for the Parent, and the cash flow statement of the Group. The consolidated financial statements are prepared in accordance with International Financial Reporting Standards as adopted by the EU and additional Danish disclosure requirements for listed financial companies, and the parent financial statements are prepared in accordance with the Danish Financial Business Act.
In our opinion, the consolidated financial statements give a true and fair view of the Group’s financial position at 31 December 2017, and of its financial performance and cash flows for the financial year 1 January 2017 to 31 December 2017 in accordance with International Financial Reporting Standards as adopted by the EU and additional Danish disclosure requirements for listed financial companies.
Also, in our opinion, the parent financial statements give a true and fair view of the Parent’s financial position at 31 December 2017, and of its financial performance for the financial year 1 January 2017 to 31 December 2017 in accordance with the Danish Financial Business Act.
Our opinion is consistent with our Audit book comments issued to the Audit Committee and the Board of Directors.
Basis for opinionWe conducted our audit in accordance with International Standards on Auditing (ISAs) and additional requirements applicable in Denmark. Our responsibilities under those standards and requirements are further described in the Auditor’s responsibilities for the audit of the consolidated financial statements and the parent financial statements section of this auditor’s report. We are independent of the Group in accordance with the International Ethics Standards Board of Accountants’ Code of Ethics for Professional Accountants (IESBA Code) and the additional requirements applicable in Denmark, and we have fulfilled our other ethical responsibilities in accordance with these requirements. We believe that the audit evidence we have obtained is sufficient and appropriate to provide a basis for our opinion.
To the best of our knowledge and belief, we have not provided any prohibited non-audit services as referred to in Article 5(1) of Regulation (EU) No 537/2014.
We were appointed auditors of Danske Bank A/S for the first time on 18 March 2015 for the financial year 2015. We have been reappointed annually by decision of the general meeting for a total contiguous engagement period of 3 years up to and including the financial year 2017.
Key audit mattersKey audit matters are those matters that, in our professional judgement, were of most significance in our audit of the consolidated financial statements and the parent financial statements for the financial year 1 January 2017 to 31 December 2017. These matters were addressed in the context of our audit of the consolidated financial statements and the parent financial statements as a whole, and in forming our opinion thereon, and we do not provide a separate opinion on these matters.
Independent auditor’s report

Danske Bank / Annual Report 2017190
Key audit matters How the matters were addressed in our audit
Loan impairment charges
Loans amount to DKK 1,899,975 million at 31 December 2017 (DKK 1,907,570 million at 31 December 2016) and loan impairment charges amounted to a net reversal of DKK 1,582 million in 2017 (net reversal of DKK 168 million in 2016).
Measurement of loan impairment charges is deemed a key audit matter as the determination of assumptions for impairment charges is highly subjective due to the level of judgement applied by Management.
The most significant judgements are:
• Timely identification of impairment events;• Valuation of collateral and assumptions of future cash
flows• Management judgements, including determining any
impairment charges.
Management has provided further information about the principles for determining the impairment charge, management of credit risks and the review for impairment in notes 1(a), 11, 14 and 15 to the consolidated financial statements.
From 1 January 2018, the Group will adopt IFRS 9, resulting in provisions being recognised when losses are expected rather than when they have been incurred. Management has disclosed information regarding the estimated transition effect of IFRS 9 in notes 2(b) and 39, including the impact on shareholders’ equity and income statement at 1 January 2018.
In determining expectations of future credit losses, Management is required to make additional judgements not previously required under an incurred loss model.
Based on our risk assessment and industry knowledge, we have examined the impairment charges and evaluated the methodology applied as well as the assumptions made according to the description of the key audit matter.
Our examination included the following elements:
• Testing of key controls over models and manual processes for impairment events identification.
• Performing a risk-based audit of loans to test timely identification of impairment events.
• Testing of key controls over models and manual processes for valuation of collateral and assumptions of future cash flows.
• Performing a risk-based audit of impaired loans to test appropriate determination of assumptions for impairment charges including valuation of collateral and assumptions of future cash flows.
• Testing of key controls over management judgements applied to adjust the collective impairment charge.
• Obtaining audit evidence of management judgements with particular focus on the methodology applied, evidence of assumptions-setting processes and the consistency thereof by:
- Assessing the key changes since last year in the assumptions against industry standards and historical data.
- Challenging the methodologies applied by using our industry knowledge and experience.
We have audited the estimated transition effect of IFRS 9 with particular focus on the methodology and principles applied.
We have tested key controls over the calculation of the transition effect and challenged Management on the methodology, principles and assumptions applied to determine their expectations for future credit losses by using our industry knowledge and credit model experts.
Measurement of liabilities under insurance contacts
Liabilities under insurance contracts for the Group amounted to DKK 322,726 million at 31 December 2017 (DKK 314,977 million at 31 December 2016).
Measurement of liabilities under insurance contracts is deemed a key audit matter as the determination of assumptions for the measurement of life insurance contract liabilities requires Management to apply judgements about future events.
Changes in assumptions and the methodology applied may have a material impact on the measurement of liabilities under insurance contracts.
The most significant judgements are:
• Determining disability rates, mortality rates and surrender probabilities.
• Assumptions related to regulatory and reporting requirements, including risk and interest.
Management has provided further information about liabilities under insurance contracts in notes 1(a) and 17 to the consolidated financial statements.
Based on our risk assessment, we have examined the valuation of liabilities under insurance contracts and evaluated the methodology applied and the assumptions made.
Our examination included the following elements, where we also made use of our internationally qualified actuaries:
• Testing of key controls over the actuarial models, data collection and analysis and the assumptions-setting processes.
• Evaluating the disability and mortality rates and surrender probabilities used in the calculation against historical data and market practice.
• Assessing the key changes in the assumptions against regulatory and reporting requirements and industry standards.
• Analysing developments, particularly within risk, interest and cost results by using our industry knowledge and experience.

Danske Bank / Annual Report 2017 191
Key audit matters How the matters were addressed in our audit
Fair value measurement of derivatives
Derivatives classified as assets amounted to DKK 256,891 million (DKK 326,433 million at 31 December 2016) and derivatives classified as liabilities amounted to DKK 244,688 million (DKK 328,080 million at 31 December 2016) for the Group.
Of the derivative assets and liabilities held by the Group respectively, those with non-observable inputs held at 31 December 2017 amounted to DKK 5,458 million (DKK 7,564 million at 31 December 2016) and DKK 5,852 million (DKK 9,560 million at 31 December 2016).
Valuation adjustments on derivatives and measurement of derivatives with non-observable inputs are deemed key audit matters, as they require Management to apply significant judgements in:
• Choosing the models to be used to calculate and validate the market values and value adjustments.
• Identifying the most relevant market data for the models.• Determining the adjustments to be made to the risk-free
market value, including counterparty risk and expected funding cost.
Changes in the models and adjustments may have a significant impact on the measurement of derivatives.
Management has provided further information about derivatives and value adjustments in notes 1(a), 12 and 30 to the consolidated financial statements.
Based on our risk assessment, we have examined the valuation carried out by Management and evaluated the methodology applied and the assumptions made.
Our examination included the following elements:
• Testing of the independent pricing controls over derivatives with non-observable inputs.
• Using our own internationally qualified valuation experts, re-calculating the carrying amounts on a sample basis by using independent data for derivatives with limited observable market data.
• Challenging the choice of models and relevant market data used to calculate and validate the fair value of derivatives with non-observable inputs by:
- Using our industry knowledge and experience, focusing on changes in the models since last year.
- Assessing key changes in the assumptions against industry standards and historical data.
• Testing of key controls over the calculation of the risk-free market value, and the adjustments to be made on a sample basis.
• Re-calculating on a sample basis the value adjustments using both Danske Bank’s data and independently obtained market data for counterparties by using our internationally qualified valuation experts.
• Challenging the choice of models and relevant market data used to calculate and validate valuation adjustments on derivatives by:
- Assessing assumptions and mapping the probability of default and the calculation of expected exposure used to calculate valuation adjustments.
- Using our industry knowledge and experience, focusing on changes in the valuation adjustments models since last year.
- Assessing key changes in the assumptions applied in the models against industry standards.
Measurement of deferred tax assets and liabilities
The Group has recognised deferred tax assets of DKK 448 million (DKK 666 million in 2016), of which DKK 335 million (DKK 397 million at 31 December 2016) is the tax base of unused tax losses at 31 December 2017. The losses primarily relate to the Group’s banking operations in Ireland.
At 31 December 2017, the Group has recognised a deferred tax liability of DKK 7,594 million (DKK 7,675 million at 31 December 2016), of which the tax base of international joint taxation accounts for DKK 5,833 million (DKK 5,954 million at 31 December 2016). Recapture of tax loss consists of the full deferred tax liability arising from joint taxation.
Measurement of deferred tax assets and liabilities is deemed a key audit matter as it is highly judgemental in:
• Assumptions and forecasts on future earnings.• Assessment of payable tax at exit of international joint
taxation.
Management has provided further information about tax assets and liabilities in notes 1(a) and 20 to the consolidated financial statements.
Based on our risk assessment, we have examined the forecasts prepared by Management and evaluated the method used to determine the amount of tax assets and liabilities recognised.
Our examination included the following elements:
• Testing of key controls over the assumptions-setting processes and forecasts on future earnings.
• Challenging the reasonableness of Management’s assumptions and forecasts of future profits in light of the historical accuracy of such forecasts and the current earnings.
• Evaluating compliance with current tax regulation using our tax experts.
• Assessing Management’s judgements in relation to the calculation of payable tax at exit of the international joint taxation.

Danske Bank / Annual Report 2017192
Statement on the Management’s reportManagement is responsible for the Management’s report. Our opinion on the consolidated financial statements and the parent financial statements does not cover the Management’s report, and we do not express any form of assurance conclusion thereon.
In connection with our audit of the consolidated financial statements and the parent financial statements, our responsibility is to read the Management’s report and, in doing so, consider whether the Management’s report is materially inconsistent with the consolidated financial statements and the parent financial statements or our knowledge obtained in the course of the audit or otherwise appears to be materially misstated.
Moreover, it is our responsibility to consider whether the Management’s report provides the information required under the Danish Financial Business Act.
Based on the work we have performed, we conclude that the Management’s report is in accordance with the consolidated financial statements and the parent financial statements and has been prepared in accordance with the requirements of the Danish Financial Business Act. We did not identify any material misstatement of the Management’s report.
Management’s responsibilities for the consolidated financial statements and the parent financial statementsManagement is responsible for the preparation of consolidated financial statements that give a true and fair view in accordance with International Financial Reporting Standards as adopted by the EU and additional Danish disclosure requirements for listed financial companies, as well as for the preparation of parent financial statements that give a true and fair view in accordance with the Danish Financial Business Act, and for such internal control as Management determines is necessary to enable the preparation of consolidated financial statements and parent financial statements that are free from material misstatement, whether due to fraud or error.
In preparing the consolidated financial statements and the parent financial statements, Management is responsible for assessing the Group’s and the Parent’s ability to continue as a going concern, for disclosing, as applicable, matters related to going concern, and for using the going concern basis of accounting in the preparation of the consolidated financial statements and the parent financial statements unless Management either intends to liquidate the Group or the Parent or to cease operations, or has no realistic alternative but to do so.
Auditor’s responsibilities for the audit of the consolidated financial statements and the parent financial statementsOur objectives are to obtain reasonable assurance about whether the consolidated financial statements and the parent financial statements as a whole are free from material misstatement, whether due to fraud or error, and to issue an auditor’s report that includes our opinion. Reasonable assurance is a high level of assurance, but is not a guarantee that an audit conducted in accordance with ISAs and the additional requirements applicable in Denmark will always detect a material misstatement when it exists. Misstatements can arise from fraud or error and are considered material if, individually or in the aggregate, they could reasonably be expected to influence the economic decisions of users taken on the basis of these consolidated financial statements and these parent financial statements.
As part of an audit in accordance with ISAs and the additional requirements applicable in Denmark, we exercise professional judgement and maintain professional scepticism throughout the audit. We also:
• Identify and assess the risks of material misstatement of the consolidated financial statements and the parent financial statements, whether due to fraud or error, design and perform audit procedures responsive to those risks, and obtain audit evidence that is sufficient and appropriate to provide a basis for our opinion. The risk of not detecting a material misstatement resulting from fraud is higher than for one resulting from error, as fraud may involve collusion, forgery, intentional omissions, misrepresentations, or the override of internal control.
• Obtain an understanding of internal control relevant to the audit in order to design audit procedures that are appropriate in the circumstances, but not for the purpose of expressing an opinion on the effectiveness of the Group’s and the Parent’s internal control.

Danske Bank / Annual Report 2017 193
• Evaluate the appropriateness of accounting policies used and the reasonableness of accounting estimates and related disclosures made by Management.
• Conclude on the appropriateness of Management’s use of the going concern basis of accounting in preparing the consolidated financial statements and the parent financial statements, and, based on the audit evidence obtained, whether a material uncertainty exists related to events or conditions that may cast significant doubt on the Group’s and the Parent’s ability to continue as a going concern. If we conclude that a material uncertainty exists, we are required to draw attention in our auditor’s report to the related disclosures in the consolidated financial statements and the parent financial statements or, if such disclosures are inadequate, to modify our opinion. Our conclusions are based on the audit evidence obtained up to the date of our auditor’s report. However, future events or conditions may cause the Group and the Parent to cease to continue as a going concern.
• Evaluate the overall presentation, structure and content of the consolidated financial statements and the parent financial statements, including the disclosures in the notes, and whether the consolidated financial statements and the parent financial statements represent the underlying transactions and events in a manner that gives a true and fair view.
• Obtain sufficient appropriate audit evidence regarding the financial information of the entities or business activities within the Group to express an opinion on the consolidated financial statements. We are responsible for the direction, supervision and performance of the group audit. We remain solely responsible for our audit opinion.
We communicate with those charged with governance regarding, among other matters, the planned scope and timing of the audit and significant audit findings, including any significant deficiencies in internal control that we identify during our audit.
We also provide those charged with governance with a statement that we have complied with relevant ethical requirements regarding independence, and to communicate with them all relationships and other matters that may reasonably be thought to bear on our independence, and, where applicable, related safeguards.
From the matters communicated with those charged with governance, we determine those matters that were of most significance in the audit of the consolidated financial statements and the parent financial statements of the current period and are therefore the key audit matters. We describe these matters in our auditor’s report unless law or regulation precludes public disclosure about the matter or when, in extremely rare circumstances, we determine that a matter should not be communicated in our report because the adverse consequences of doing so would reasonably be expected to outweigh the public interest benefits of such communication.
Copenhagen, 2 February 2018Deloitte
Statsautoriseret RevisionspartnerselskabBusiness Registration No 33 96 35 56
Erik Holst Jørgensen Jens Ringbæk State-Authorised State-Authorised Public Accountant Public Accountant MNE no 9943 MNE no 27735

Danske Bank / Annual Report 2017194
Ole AndersenChairmanElected by the general meeting
Born on 11 July 1956Nationality: DanishGender: MaleJoined the Board on 23 March 2010 andwas appointed Chairman in December 2011Most recently re-elected in 2017Term expires in 2018Independent
Chairman of the Remuneration Committee and the Nomination Committee and member of the Risk Committee
Competencies:• Professional experience in leading and developing
large financial and non-financial international companies
• Setting of corporate strategy, budgets and targets• Financial and economic expertise• General risk management experience
Directorships and other offices:Private-sector directorships:Bang & Olufsen A/S (chairman) Chr. Hansen Holding A/S (chairman)NASDAQ Nordic Ltd. (member of the nomination committee)
Entities which do not pursue predominantly commercial objectives:The Danish Committee on Corporate Governance (member)Copenhagen Business School (adjunct professor)DenmarkBridge (member of the board of directors)The Human Practice Foundation (member of the board of directors)
Urban BäckströmVice ChairmanElected by the general meeting
Born on 25 May 1954Nationality: SwedishGender: MaleJoined the Board on 27 March 2012Most recently re-elected in 2017Term expires in 2018Independent
Member of the Nomination Committee
Competencies:• Broad and in-depth experience with economics and
finance• Leading major financial companies and not-for-profit
institutions• Insight into the Swedish business sectors and
international influence on these• Experience with and knowledge of sophisticated risk
models
Directorships and other offices:Private-sector directorships:Rederiaktiebolaget Gotland and a subsidiary (chairman)Lancelot Holding AB and a subsidiary (member of the board of directors)
Entities which do not pursue predominantly commercial objectives:Stiftelsen Fritt Näringsliv/Timbro (chairman)Jönköping University (honorary doctor)
Lars-Erik BrenøeElected by the general meeting
Executive Vice President, Head of Chairman’s Office, A.P. Møller-Mærsk A/S
Born on 22 March 1961Nationality: Danish Gender: MaleJoined the Board on 17 March 2016Most recently re-elected in 2017Term expires in 2018Independent
Management and directorships – Board of Directors

Danske Bank / Annual Report 2017 195
Member of the Nomination Committee
Competencies:• Broad and in-depth experience with board work and
corporate governance• Financially literate• Knowledge of relevant legal/regulatory issues• Knowledge of stakeholder management• Experience with international business and the
markets/regions in which Danske Bank operates
Directorships and other offices:Private-sector directorships:The A.P. Møller and Hustru Chastine Mc-Kinney Møller Foundation (member of the boards of directors or the executive boards of seven affiliated undertakings)Maersk Broker K/S (member of the board of directors and chairman of four affiliated undertakings)LINDØ port of Odense A/S (member of the board of directors)
Entities which do not pursue predominantly commercial objectives:A.P. Møller og Hustru Chastine Mc-Kinney Møllers Familiefond (The A.P. Moller Family Foundation) (member of the board of directors)The Danish Committee on Foundation Governance (vice chairman)The Confederation of Danish Industry (member of the council)
Jørn P. JensenElected by the general meeting
Born on 2 January 1964Nationality: DanishGender: MaleJoined the Board on 27 March 2012Most recently re-elected in 2017Term expires in 2018Independent
Chairman of the Audit Committee
The Board of Directors considers Jørn P. Jensen to be the independent member of the Audit Committee with qualifications in accounting and auditing. Jørn P. Jensen has a Master of Science in Economics and Business Administration and has had a long career as Chief
Financial Officer of Carlsberg A/S, Carlsberg Breweries A/S and other Danish companies.
Moreover, as Chairman of the Audit Committee since 2012, Jørn P. Jensen has proven his ability to make independent assessments of Danske Bank Group’s financial reporting, internal controls, risk management and statutory audit.
Competencies:• Broad experience in international business operations
and solid understanding of Danish and international financial reporting practices
• Funding of international companies requiring significant investments through debt and equity markets
• Knowledge of cultures and economic/political conditions in Danske Bank’s markets
• General risk management experience
Directorships and other offices:Private-sector directorships:Dyson James Group Limited (member of the boards of directors of several affiliated undertakings)VEON Ltd. (member of the board of directors and chairman of the audit committee)GreenMobility A/S (member of the board of directors)
Rolv Erik RyssdalElected by the general meeting
CEO, Schibsted ASA
Born on 7 November 1962Nationality: NorwegianGender: MaleJoined the Board on 18 March 2014Most recent re-elected in 2017Term expires in 2018Independent
Member of the Remuneration Committee
Competencies:• Extensive consumer business experience, including
experience with communication strategies• In-depth knowledge of digital business models and
transformation processes

Danske Bank / Annual Report 2017196
Directorships and other offices:Private-sector directorships:Schibsted Media Group (chairman of the boards of directors of several subsidiaries)
Carol SergeantElected by the general meeting
Born on 7 August 1952Nationality: BritishGender: FemaleJoined the Board on 18 March 2013Most recently re-elected in 2017Term expires in 2018Independent
Chairman of the Risk Committee and member of the Audit Committee
Competencies:• Senior management experience in the public, private
and charity sectors • Broad and in-depth knowledge of financial services
business, credit and risk management and regulatory issues in the UK and Europe
• Significant change management experience
Directorships and other offices:Private-sector directorships:TP ICAP plc. (member of the board of directors, chairman of the risk committee, member of the audit and nomination committees)BNY Mellon SA/NV (member of the board of directors, chairman of the risk committee and member of the audit committee)Threadneedle Solutions Ltd. (company director)
Entities which do not pursue predominantly commercial objectives:British Standards Institute, Standards Policy and Strategy Committee (chairman)Lloyds Register Foundation (trustee and member of the audit and investment committee)The Governing Council of the Centre for the Study of Financial Innovation (CSFI) (trustee)
Martin TivéusElected by the general meeting
Born on 18 November 1970Nationality: SwedishGender: MaleJoined the Board on 16 March 2017Term expires in 2018Independent
Member of the Risk Committee
Competencies:• Extensive executive management experience from
large international companies• Significant board experience• Financially literate• In-depth knowledge of digital banking, the consumer
market, customer needs and change management• Strong grasp of IT and digitalisation
Directorships and other offices:Private-sector directorships:Alexia Invest AB (member of the board of directors)Alexia AB (member of the board of directors)
Hilde TonneElected by the general meeting
Executive Director and Chief Innovtion Officer, Ramboll Group
Born on 16 September 1965Nationality: NorwegianGender: FemaleJoined the Board on 17 March 2016Most recently re-elected in 2017Term expires in 2018Independent
Member of the Audit Committee and the Remuneration Committee
Competencies:• Extensive executive management experience from
large international companies

Danske Bank / Annual Report 2017 197
• Significant board experience• Financially literate• In-depth knowledge of consumer business, customer
needs and change management• People and culture expertise• Strong grasp of IT and digitalisation
Directorships and other offices:Private-sector directorships:Hafslund AS (chairman)
Dorte Annette BielefeldtElected by the employees
Member of the board of directors of Danske Kreds
Born on 18 February 1967Nationality: DanishGender: FemaleJoined the Board on 29 September 2017Term expires in 2018
Directorships and other offices:Danske Kreds’ Jubilæumsfond (member of the board of directors)Bikubens Personaleforening (member of the board of directors)
Kirsten Ebbe BrichElected by the employees
Chairman of Danske Kreds
Born on 15 July 1973Nationality: DanishGender: FemaleJoined the Board on 18 March 2014Term expires in 2018
Directorships and other offices:Danske Kreds’ Jubilæumsfond (chairman)Danske Unions (transnational association of local Danske Bank Group staff unions)(chairman)Danske Banks Pensionskasse for førtidspensionister (member of the board of directors)
Danske Banks Velfærdsfond (member of the board of directors)Finansforbundet (Financial Services Union Denmark) (member of the executive committee)
Carsten EilertsenElected by the employees
Vice Chairman of Danske Kreds
Born on 17 September 1949Nationality: DanishGender: MaleJoined the Board on 23 March 2010Most recently re-elected in 2014Term expires in 2018
Directorships and other offices:Danske Unions (transnational association of local Danske Bank Group staff unions) (member of the executive committee)Danske Banks Pensionskasse for medarbejdere med tilsagnsordning i Danica (member of the board of directors)
Charlotte HoffmannElected by the employees
Senior Personal Adviser
Born on 8 October 1966Nationality: DanishGender: FemaleJoined the Board on 14 March 2006Most recently re-elected in 2014Term expires in 2018
Member of the Remuneration Committee

Danske Bank / Annual Report 2017198
Thomas F. BorgenChief Executive Officer
Born on 27 March 1964Joined the Board on 1 September 2009
Directorships and other offices:Entities which do not pursue predominantly commercial objectives:The Association of 31 December 2016 (vice chairman)Finance Denmark (vice chairman)Kong Olav V’s Fond (member of the board of directors)
Jacob Aarup-AndersenChief Financial Officer
Born on 6 December 1977Joined the Board on 1 April 2016
Directorships and other offices:Danske Hypotek AB (chairman) Danske Mortgage Bank Plc (chairman)Kreditforeningen Danmarks Pensionsafviklingskasse (chairman)Danica Pension, Livsforsikringsaktieselskab (vice chairman)Forsikringsselskabet Danica, Skadeforsikrings- aktieselskab af 1999 (vice chairman)Realkredit Danmark A/S (member of the board of directors)
Management and directorships – Executive Board
Tonny Thierry AndersenHead of Wealth Management
Born on 30 September 1964Joined the Board on 1 September 2006
Directorships and other offices:Danske Bank International S.A. (chairman)Danske Bank Oyj (chairman)Danske Invest Management A/S (chairman)Forsikringsselskabet Danica, Skadeforsikringsaktie- selskab af 1999 (chairman)Danica Pension, Livsforsikringsaktieselskab (chairman)MobilePay A/S (vice chairman)MobilePay Denmark A/S (vice chairman)FR I af 16. september 2015 A/S (member of the board of directors)
Entities which do not pursue predominantly commercial objectives:ICC Danmark
James DitmoreHead of Group Services & Group IT (COO)
Born on 10 July 1960Joined the Board on 21 April 2014
Directorships and other offices:ITPeopleNetwork (member of the customer advisory board)Northern Bank Limited (member of the board of directors)MobilePay A/S (member of the board of directors)MobilePay Denmark A/S (member of the board of directors)

Danske Bank / Annual Report 2017 199
Carsten Rasch EgeriisHead of Group Risk
Born on 18 June 1976Joined the Board on 1 August 2017
Lars MørchHead of Business Banking
Born on 11 May 1972Joined the Board on 1 June 2012
Directorships and other offices:Northern Bank Limited (chairman)Danske Leasing A/S (chairman)Realkredit Danmark A/S (chairman)
Entities which do not pursue predominantly commercial objectives:Grænsefonden (member of the board of directors)Dagmar Marshalls Fond (member of the board of directors)
Jesper NielsenHead of Personal Banking
Born on 20 October 1968Joined the Board on 1 October 2016
Directorships and other offices:e-nettet (chairman)Realkredit Danmark A/S (vice chairman)MobilePay A/S (chairman)MobilePay Denmark A/S (chairman)
Glenn SöderholmHead of Corporates & Institutions
Born on 26 July 1964Joined the Board on 1 November 2013
Directorships and other offices:NASDAQ Nordic Ltd. (member of the board of directors)

Danske Bank / Annual Report 2017200

Danske Bank / Annual Report 2017 201
Supplementary information
Financial calendar
15 March 2018 Annual general meeting
26 April 2018 Interim report – first quarter 2018
18 July 2018 Interim report – first half 2018
1 November 2018 Interim report – first nine months 2018
Links
Danske Bank
Denmark
Finland
Sweden
Norway
Northern Ireland
Ireland
Realkredit Danmark
Danske Capital
Danica Pension
danskebank.com
danskebank.dk
danskebank.fi
danskebank.se
danskebank.no
danskebank.co.uk
danskebank.ie
rd.dk
danskecapital.com
danicapension.dk
Contacts
Jacob Aarup-AndersenChief Financial Officer +45 45 14 06 02
Claus Ingar Jensen Head of Investor Relations +45 45 12 84 83
Danske Bank’s financial statements are available online at danskebank.com/reports.

Danske Bank / Annual Report 2017202

Danske Bank / Annual Report 2017 203
Corporate Responsibility 2017
Other Danske Bank Group publications, available at danskebank.com/ir:
Risk Management 2017

Danske Bank / Annual Report 2017204
Danske Bank A/SHolmens Kanal 2-12DK-1092 København K
Tel. +45 33 44 00 00CVR No. 611262 28-Københavndanskebank.com