annual report 2017 — 2018 - refrigerant reclaim · 2019-09-18 · refrigerant reclaim australia...
TRANSCRIPT

ANNUAL REPORT 2017 — 2018
REFRIGERANT RECLAIM AUSTRALIA� —
PAGE 2� 2016–2017 ANNUAL REPORT
FROM THE CHAIRMAN
Financial�year�2018�has�seen�Refrigerant�Reclaim�Australia�deliver�another�very�successful�year�for�Australia’s�refrigerant�product�stewardship�program.�RRA’s�ongoing�success�is�due�to�an�industry-wide�commitment�to�the�recovery�and�return�of�contaminated�and�unwanted�refrigerant,�the�prevention�of�emissions�and�compliance�with�environmental�protection�regulations.
The�volume�of�refrigerant�being�returned�continues�to�grow.�Including�reclaimed�material,�collections�for�2017/18�totalled�471�tonnes�compared�with�496�last�year�and�463�the�year�before�that.
A�reduction�in�the�quantity�of�collected�recovered�refrigerant�being�reclaimed�caused�the�decline�in�volume�over�last�year.�In�particular,�the�amount�of�HCFC-22�being�received�into�the�program�has�declined�markedly,�indicating�that�it�is�being�retained�and�reused�in�the�market.�Collections�of�HCFC-22�peaked�at�274�tonnes�per�annum�and�have�now�fallen�to�less�than�30�tonnes.�Of�the�refrigerant�that�was�recovered�and�entered�the�RRA�program,�only�around�eight�tonnes�were�reclaimed�to�new�specification�and�sold�back�into�the�market.�
The�major�internal�IT�project�RRA�commenced�in�FY17�was�successfully�completed�this�year.�The�new�systems�streamline�reporting,�with�increased�accuracy�and�substantial�improvements�for�our�contributors.�The�modules�allowing�online�access�to�ordering�and�collections�have�now�been�successfully�installed�and�are�operating�to�the�satisfaction�of�our�nationwide�collection�network.�
RRA�commenced�a�new�major�project�with�TAFE�this�year.�At�the�regular�national�head�teachers’�meetings,�it�was�identified�there�was�a�funding�shortfall�preventing�some�TAFEs�from�acquiring�the�latest�and�more�expensive�refrigerants�for�training�apprentices.�New�refrigerants�have�lower�global�warming�potentials�than�those�they�replace,�thereby�leading�to�a�reduction�in�climate�forcing�carbon�dioxide�equivalent�emissions.�
In�conjunction�with�TAFE�colleges�around�Australia,�RRA�has�established�a�program�to�supply�lower�GWP�refrigerants,�at�no�cost�to�TAFE,�so�Australia’s�RAC�apprentices�may�be�taught�with�the�latest�available�refrigerant�technologies.
RRA�has�contributed�to�the�industry�in�many�other�ways�during�the�year.�Our�commitment�to�the�CSIRO�atmospheric�research�program�and�the�Cape�Grim�research�station�remains�strong.�Similarly,�our�continuing�role�as�a�major�sponsor�of�the�World�Skills�apprenticeship�competition�supports�widespread�involvement�while�promoting�improved�training�and�higher�standards.�Our�initiative�to�promote�and�improve�national�communication�and�cooperation�by�TAFE�colleges�and�teachers�is�also�ongoing,�with�two�national�meetings�held�during�the�year.
Beyond�these�major�initiatives,�RRA’s�input�and�support�for�industry�is�even�broader�and�we�will�continue�to�meet�demands�and�expectations�in�accordance�with�our�industry’s�objectives.�Of�course,�our�success�and�these�industry�improvement�projects�are�only�possible�due�to�the�widespread�commitment�of�industry�and,�particularly,�the�voluntary�members�of�the�RRA�Board�that�guide�this�organisation�forward.
�
John�McCormackRRA�Chairman

REFRIGERANT RECLAIM AUSTRALIA� PERFORMANCE 2017/18
PAGE 3� 2016–2017 ANNUAL REPORT
�Refrigerants
�Finances
PERFORMANCE 2017/18
The�amount�of�refrigerant�entering�the�RRA�program�reduced�in�2017/18�as�the�market�retained�additional�quantities�for�reuse.
Quantities�of�refrigerant�being�reclaimed�retraced�the�steep�incline�of�last�year�as�HCFC-22�in�particular�was�held�back.�The�increased�level�of�reuse�of�this�scarce�and�therefore�high-value�product�is�described�in�the�chart�below�titled Refrigerant Recovery by Type 2004-2017.
Demand�for�HCFC-22�will�be�relatively�short-lived�as�installed�equipment�reaches�end-of-life,�as�lower�GWP�non-ozone�depleting�replacements�reduce�in�price�and�as�contractors�and�technicians�become�more�proficient�with�the�use�of�these�new�products.
While�some�recovered�refrigerant�was�reclaimed,�we�note�that�all�contaminated,�unwanted,�and�unusable�refrigerant�received�at�our�processing�centre�was�safely�destroyed�to�prevent�its�emission�to�the�atmosphere.�
All�refrigerant�wholesalers�participate�and�take�back�recovered�refrigerant.�This�means�the�collection�network�for�recovered�refrigerant�stretches�around�and�across�Australia,�making�it�easy�to�send�contaminated�and�unwanted�refrigerant�for�safe�disposal.
→��Total�refrigerant�recovery�amounted�to�471�tonnes�(8�tonnes�reclaimed)�compared�with�496�tonnes�(171�tonnes�reclaimed)�last�year.
→��A�total�of�824�companies�now�contribute�to�the�RRA�product�stewardship�program:
−��800�importers�of�refrigerant�contained�in�products
−��24�importers�of�refrigerant�in�cylinders�and�ISO�containers
→��The�quantity�of�refrigerant�recovered�since�the�program�commenced�stands�at�6,901�tonnes,�most�of�which�has�been�destroyed.�
−��A�total�of�416�tonnes�have�been�reclaimed�(purified�to�new�specification).�In�the�very�early�days�of�the�program,�115�tonnes�were�used�as�feedstock�for�the�production�of�new�refrigerants.
→��Bulk�importer�contributions�were�55�per�cent�of�total�levy�revenue�and�equipment�importers�contributed�45�per�cent
→��Contractor�rebates�this�year�totalled�$1.2�million�and�wholesaler�rebates�totalled�$3.4�million,�meaning�$4.6�million�was�provided�back�directly�to�the�industry
→��RRA�finished�the�year�with�a�surplus�of�$7.5�million,�which�leaves�the�program�well�placed�to�meet�future�challenges�and�growing�recovery�in�the�years�ahead
→��Levy�revenue�provided�89%�of�total�revenue�with�the�balance�11%�provided�by�investment�income
→��Total�equity�in�the�RRA�Environment�Trust�has�grown�to�$79.2�million.

REFRIGERANT RECLAIM AUSTRALIA� LONG-TERM PERFORMANCE
PAGE 4� 2016–2017 ANNUAL REPORT
LONG-TERM PERFORMANCE
The�graph�Refrigerant Recovery�plots�monthly�collections�since�2007,�with�the�trendline�a�moving�12-month�average.
Industry�activity�was�impacted�by�the�global�financial�crisis,�resulting�in�greater�refrigerant�reuse�and�lower�collections.�As�the�economy�recovered,�collections�improved�to�a�higher�peak,�followed�by�a�rapid�and�deep�decline�caused�by�the�introduction�of�the�carbon�tax.
Since�the�carbon�tax�was�repealed,�the�quantity�of�refrigerant�recovered�and�returned�for�safe�disposal�has�grown�strongly,�although�recent�years�have�seen�increasing�quantities�of�refrigerant�being�retained�and�reclaimed.
A�shown�in�the�graph�titled�Cumulative Recovery,�RRA�has�taken�back�and�safely�disposed�of�6,901�tonnes�of�waste�and�unwanted�ozone�depleting�and�synthetic�greenhouse�gas�refrigerants�since�commencement�in�1993.
Refrigerant�Recovery��2007-2008.�
60000
70000
80000
50000
40000
30000
20000
10000
0
KILO
GRAM
S R
ECOV
ERED
Kilograms�per�Month�-�12�Month�Trendline
Cumulative�Recovery�1993-2017
0
7000000
1000000
2000000
3000000
4000000
5000000
6000000
TONN
ES

REFRIGERANT RECLAIM AUSTRALIA� LONG-TERM PERFORMANCE
PAGE 5� 2016–2017 ANNUAL REPORT
The�types�of�refrigerant�being�collected�have�changed�over�time.�In�the�early�years,�CFCs�dominated�recovery�until�HCFCs,�mainly�HCFC-22,�became�the�most�returned�refrigerant�in�the�2000s.�The�phase-out�of�HCFC-22�has�resulted�in�greater�retention�by�the�market�in�recent�years.
Volumes�of�HFC�recovery�have�grown�consistently�since�collections�began�in�2002/03�will�continue�to�grow�strongly.
Note:�The�amount�of�HCFC-22�reclaimed�and�reissued�to�the�market�is�not�included.
Refrigerant�Recovered�and�Destroyed�in�Tonnes
0 100 200 300 400 500 600
2009
2010
2011
2012
2013
2014
2015
2016
2008
2007
2006
2005
2004
TONNES RECOVERED AND DESTROYED
2017
�CFC��HCFC��HFC

REFRIGERANT RECLAIM AUSTRALIA� LONG-TERM PERFORMANCE
PAGE 6� 2016–2017 ANNUAL REPORT
Abatement�of�Carbon�Dioxide�Equivalent�Megatonnes�CO2e
0.00 0.20 0.40 0.60 0.80 1.00 1.20
2009
2010
2011
2012
2013
2014
2015
2016
2008
2017
2007
2006
2005
2004
EQUIVALENT MEGATONNES CO2e
�CFC��HCFC��HFC
Remarkable�efforts�by�the�whole�industry�have�been�achieved�kilogram�by�kilogram�and�year�after�year,�with�spectacular�results.�More�than�10�million�tonnes�of�stratospheric�ozone�has�been�saved�from�destruction�and�the�emission�of�more�than�12�million�tonnes�of�carbon�dioxide�equivalent�has�been�prevented.�
Note:�Chart�displays�calendar�years.

REFRIGERANT RECLAIM AUSTRALIA� LONG-TERM PERFORMANCE
PAGE 7� 2016–2017 ANNUAL REPORT
Refrigerant�Recovery��By�Type�2004-2017
2004 2005 2006 2007 2008 2009 2010 2011 2012 2013 2014 2015 2016 2017
350
300
250
200
150
100
50
0
TONN
ES
�CFC��HCFC��HFC
Impacts�of�the�carbon�tax,�followed�by�growing�scarcity�due�to�the�phase-out�of�ozone�depleting�refrigerants�contributed�to�the�decline�in�HCFC-22�returns.�Now,�HFCs�make�up�the�main�part�of�the�recovered�refrigerant�stream�and�will�increase�strongly�over�time.
Note:�Chart�displays�calendar�years.

REFRIGERANT RECLAIM AUSTRALIA� —
PAGE 8� 2016–2017 ANNUAL REPORT
RECOVERY FROM END-OF-LIFE AIR-CONDITIONING UNITSAustralia�has�poor�regulations�covering�the�recycling�and�proper�disposal�of�consumer�durables�such�as�refrigerators�and�air-conditioning�systems.�The�potential�for�losses�from�decommissioned�split�air-conditioning�systems�is�a�particular�concern�as�approximately�half�the�installed�bank�of�refrigerant�in�Australia�is�contained�within�this�type�of�system.
With�around�one�million�new�systems�being�installed�every�year,�the�volume�in�the�bank�will�continue�to�grow.�As�the�systems�have�low�leakage�rates�it�is�highly�likely�that�a�large�proportion�of�the�initial�charge�will�remain�the�system�at�end-of-life.�Our�challenge�is�to�ensure�the�refrigerant�is�recovered�and�safely�disposed�rather�than�emitted�when�the�system�is�uninstalled.
RECOVERY FROM END-OF-LIFE MOTOR VEHICLESAlthough�the�volume�of�refrigerant�contained�in�automotive�air-conditioning�systems�is�much�smaller�than�for�stationary�units,�the�same�problem�of�being�unable�to�properly�capture�refrigerant�at�end-of-life�exists.�Without�end-of-life�recovery,�the�leakage�rate�from�systems�is�100�per�cent.�RRA�continues�working�with�governments,�ARC,�and�industry�to�improve�recovery�from�this�sector.
LICENSING AND COMPLIANCE Australia�has�a�comprehensive�licensing�system,�but�it�falls�short�of�the�ideal�of�being�a�full�national�trade�skills�competency�based�program�because�it�is�based�on�environmental�legislation�that�prescribes�certain�refrigerants�rather�than�being�wholly�based�on�trade�skills.�This�leads�to�the�strange�situation�where�licences�
and�authorisations�are�required�to�work�with�and�purchase�some�refrigerants�but�not�others,�despite�the�required�work�and�competencies�being�identical.�RRA�strongly�supports�the�expansion�of�the�current�licensing�initiative�to�become�a�true�trade�licence�that�incorporates�all�work�with�all�refrigerants�throughout�Australia.
GROWING USE OF FLAMMABLE REFRIGERANTSA�major�challenge�is�the�transition�to�increased�use�of�flammable�refrigerants.�The�introduction�of�Class�A2L�mildly�flammable�refrigerants�will�require�profound�changes�to�the�way�refrigerant�is�managed�and�handled.�Refrigerants�such�as�HFO-1234yf�and�HFC-32�will�be�used�in�increasing�quantities�and�are�projected�to�make�up�more�than�half�the�refrigerant�bank�by�2030.�Over�the�next�few�years,�a�number�of�upgrades�will�be�required�to�handle�increasing�volumes�of�flammable�refrigerants,�including�the�systems�and�equipment�for�their�collection,�transport,�handling�and�destruction.�All�actors�in�the�recovery�chain�will�be�impacted.�
GROWING VOLUME OF REDUNDANT REFRIGERANT Another�imposing�challenge�is�the�potential�for�rapidly�increasing�amounts�of�refrigerant�requiring�destruction�as�some�refrigerants�may�become�redundant.�While�the�transition�from�HFC-134a�to�HFO-1234yf�in�the�automotive�sector�may�not�result�in�large�volumes�of�unwanted�refrigerant,�it�is�quite�likely�that�the�change�away�from�HFC-410A�to�HFC-32�will.�Currently,�about�20,000�tonnes�of�HFC-410A�exists�in�split�air-conditioning�systems�in�Australia.�As�these�systems�reach�end-of-life�in�the�2020s,�substantial�volumes�of�refrigerant�will�likely�become�available�for�recovery�and�safe�disposal.
ONGOING CHALLENGES

REFRIGERANT RECLAIM AUSTRALIA� THE ATMOSPHERE
PAGE 9� 2016–2017 ANNUAL REPORT
THE ATMOSPHERE
OZONE DEPLETIONThe�World�Meteorological�Association’s�latest�scientific�report�on�ozone�depletion�has�confirmed�that�the�ozone�layer�has�continued�to�recover�and�that�atmospheric�concentrations�of�ozone�depleting�substances�(ODS)�have�continued�to�decline.�At�this�rate�of�progress,�it�is�predicted�that�that�the�Antarctic�ozone�hole�will�have�healed�by�2060,�reducing�harmful�UV�radiation.
This�will�be�a�direct�result�of�successful�worldwide�action�to�phase�out�CFCs�under�the�Montreal�Protocol,�supported�by�the�diligence�of�those�working�in�the�refrigeration�and�air-conditioning�industry�who�not�only�ensure�the�safe�recovery�and�destruction�of�contaminated�and�unwanted�refrigerants�but�also�work�to�reduce�leakage�rates�through�improved�equipment�and�installations.
The�Antarctic�ozone�hole�usually�peaks�in�early-mid�September�as�weather�conditions�in�the�southern�winter�cause�concentrations�of�chlorine�and�other�ODS�in�the�stratosphere�to�increase�at�these�latitudes.
Unusually�low�temperatures�and�a�stable�Antarctic�vortex�contributed�to�the�2018�ozone�hole�being�the�13th�largest�in�40�years�of�NASA�satellite�observations,�although�it�would�have�been�even�larger�if�atmospheric�chlorine�had�not�reduced�by�11�per�cent�since�it�peaked�in�2000.
The�CSIRO�operates�a�world-class�atmospheric�research�facility�at�Cape�Grim�on�the�northwest�tip�of�Tasmania�provides�the�world’s�most�comprehensive�list�of�measured�ozone�depleting�substances�anywhere�in�the�world.
In�addition�to�12�CFCs�and�eight�HCFCs,�Cape�Grim�can�detect�and�measure�all�HFCs.
Antarctic�ozone�hole�on�October�12,�2017�(left)�compared�with�October�12,�2018�(right)
Source:�NASA’s�Goddard�Space�Flight�Center.

REFRIGERANT RECLAIM AUSTRALIA� THE ATMOSPHERE
PAGE 10� 2016–2017 ANNUAL REPORT
TOTAL CHLORINEApart�from�slow�growth�in�CFC‐13�and�CFC‐115,�most�CFCs�measured�in�the�atmosphere�at�Cape�Grim�in�2016�have�stopped�growing�or�are�in�decline.
Total�CFCs�in�the�background�atmosphere�declined�by�0.5�per�cent�between�2015�and�2016,�as�did�chlorine�from�CFCs,�which�decreased�by�10�ppt�compared�with�11�ppt�(0.6�per�cent)�in�2014-2015.
Chlorine�from�all�ODS�decreased�by�5ppt�(or�0.15�per�cent)�between�2015�and�2016,�to�3172�ppt.�In�the�same�period,�chlorine�from�HCFCs�increased�by�4�ppt,�continuing�a�trend�that�started�in�the�mid�1990s.
Total�chlorine�from�CFCs,�HCFCs,�CTC:�CCl4,�MC:�CH3CCl3�and�other�chlorine-containing�ODSs�as�measured�at�Cape�Grim.
3000
4000
2000
1000
0
1980 1985 1990 1995 2000 2005 2010 2015
TOTA
L Cl (
PPT)
��Other�Chlorine�OD5s
�CCl4,�CH3CCl3�
�HCFCs�
�CFCs

REFRIGERANT RECLAIM AUSTRALIA� THE ATMOSPHERE
PAGE 11� 2016–2017 ANNUAL REPORT
Levels�of�major�HCFCs�measured�at�Cape�Grim�are�growing�but�more�slowly�than�in�2015,�while�minor�HCFCs�are�declining�slowly.�Total�HCFCs�increased�by�1.4�percent�between�2015�and�2016,�with�chlorine�from�HCFCs�up�also�up�by�1.4�in�the�same�period�largely�due�to�HCFC-22�growth.
Total�column�ozone�(DU)�changes�at�Halley�Station,�Antarctica�(76oS),�and�Melbourne,�Australia�(38oS)�and�Equivalent�Effective�Stratospheric�Chlorine�(EESC,�ppb)�changes�at�polar�and�mid-latitudes.�The�Melbourne�ozone�data�are�11-year�running�means�to�minimize�impacts�of�solar�variability.
1960 1980 2000 2020 2040
300
350
250
200
150
100
1
2
3
4
TOTA
L COL
UMN
OZON
E (D
U)
CHLO
RINE
(PPB
)
TOTA
L COL
UMN
OZON
E (D
U)
1980 1990 2000 2010 2020 2030 2040
304
302
306
300
298
296
294
1.4
1.6
1.8
2.0
CHLO
RINE
(PPB
)Top�
�Halley�October��Mean��Antarctic��chlorine��WMO�2014�A1� ��scenario
Bottom�
�Melbourne���(11-yr�avg.)��Mid-latitude� ��chlorine��WMO�2014�A1� ��scenario

REFRIGERANT RECLAIM AUSTRALIA� THE ATMOSPHERE
PAGE 12� 2016–2017 ANNUAL REPORT
DECLINING CONCENTRATIONS OF CFC-12The�second-largest�largest�annual�global�declines�in�CFC-12�emissions�were�recorded�in�both�2014-2015�and�2015-2016,�each�bringing�annual�reductions�of�11,000�tonnes�compared�with�the�record�of�14,000�tonnes�in�2005-2006.
Global�CFC-12�emissions�in�2016�were�33,000�tonnes,�reflecting�a�consistent�annual�decline�that�started�in�the�late�1980s.
GROWING CFC-11 EMISSIONSRecently,�the�National�Oceanic�and�Atmospheric�Administration�revealed�that�emissions�of�CFC-11�had�increased�by�25�per�cent�compared�with�the�average�measured�between�2002�and�2012.�Although�concentrations�of�CFC-11�are�still�in�decline,�it�is�happening�more�slowly�than�if�there�were�no�new�emissions.
Global�annual�emissions�(M�tonnes)�of�ODSs 1.0
0.8
0.6
0.4
0.2
GLOB
AL E
MISS
ION
ESTI
MATE
S(M
TON
NES)
�minor�CFCs��CFC-113��CFC-12��CFC-11

REFRIGERANT RECLAIM AUSTRALIA� THE ATMOSPHERE
PAGE 13� 2016–2017 ANNUAL REPORT
HFC EMISSIONS STILL RISINGIncreasing�concentrations�of�all�HFCs�were�detected�in�the�background�atmosphere�at�Cape�Grim�between�2015�and�2016,�including�significant�increases�of�HFC-134a�(up�5.6�ppt),�HFC-125�(+2.3�ppt),�HFC-143a�(+1.5�ppt),�HFC-32�(+1.7�ppt)�and�HFC-23�(+0.93�ppt).�Most�of�these�products�are�used�heavily�in�Australia,�which�imported�approximately�24�per�cent�more�HFCs�in�2016�than�in�2015.
Global�HFC,�emissions�
GLOB
AL E
MISS
ION
(K T
ONNE
S)GL
OBAL
EMI
SSIO
N(M
TON
NES
CO2-e
)
500
400
300
200
100
0
1500
1200
900
600
300
0
1980 1985 1990 1995 2000 2005 2010 2015
1980 1985 1990 1995 2000 2005 2010 2015
Top:�k�tonnes;�Bottom:�M�tonnes�CO2-e)�from�global�AGAGE�atmospheric�measurements��HFCs

REFRIGERANT RECLAIM AUSTRALIA� THE ATMOSPHERE
PAGE 14� 2016–2017 ANNUAL REPORT
Cape�Grim�data�suggests�that�Australian�HFC�emissions�can�vary�from�year�to�year,�with�peaks�in�2009�and�2014�of�around�3500�tonnes,�while�in�2015�emissions�reached�4000�tonnes.
As�Australia�began�to�phase�down�HFCs�from�January�1�2018�under�the�Kigali�Amendment�to�the�Montreal�Protocol,�emissions�of�HFCs�including�HFC-134a�will�start�to�decrease.
Trace�levels�of�HFC�replacement�refrigerants�HFO-1234yf�and�HFO-1234ze�have�already�been�detected�in�urban�and�background�air�in�Europe�and�detection�at�Cape�Grim�is�expected�in�the�near�future�as�adoption�of�these�products�grows.
Australian�emissions�of�HFCs�-125,�-134a,�-143a,�-32)�and�other�HFCs�(-23,�-152a,�-227ea,�-236fa,�-365mfc)�estimated�from�atmospheric�data�(ISC/NAME)�measured�at�Cape�Grim,�and�in�the�Inventory�(DoEE,�2017),�expressed�in�units�of�M�tonne�CO2-e.
2005 2006 2007 2008 2009 2010 2011 2012 2013 2014 2015
AUSTRALI
AN HFC I
NVENTORY
12
10
8
6
4
2
0
AUST
RALIA
N EM
ISSI
ONS
(M T
ONNE
S C0
2-e)
�Other�HFCs��HFC-23��HFC-125�HFC-143a�HFC-134a
REFRIGERANT RECLAIM AUSTRALIA� THE FUTURE
PAGE 15� 2016–2017 ANNUAL REPORT
THE FUTURE
Two�far-reaching�milestones�were�achieved�recently,�setting�the�scene�for�the�next�decade,�from�both�national�and�international�perspectives.�In�late�2016,�signatories�to�the�Montreal�Protocol�agreed�to�extend�this�highly�successful�global�initiative�to�include�the�phase-down�of�high�global�warming�potential�synthetic�greenhouse�gas�refrigerants.�Locally,�the�completed�review�of�the�Ozone�Protection�and�Synthetic�Greenhouse�Gas�Management�Act�led�to�a�raft�of�amendments�passing�parliament,�including�incorporating�the�HFC�phase-down.
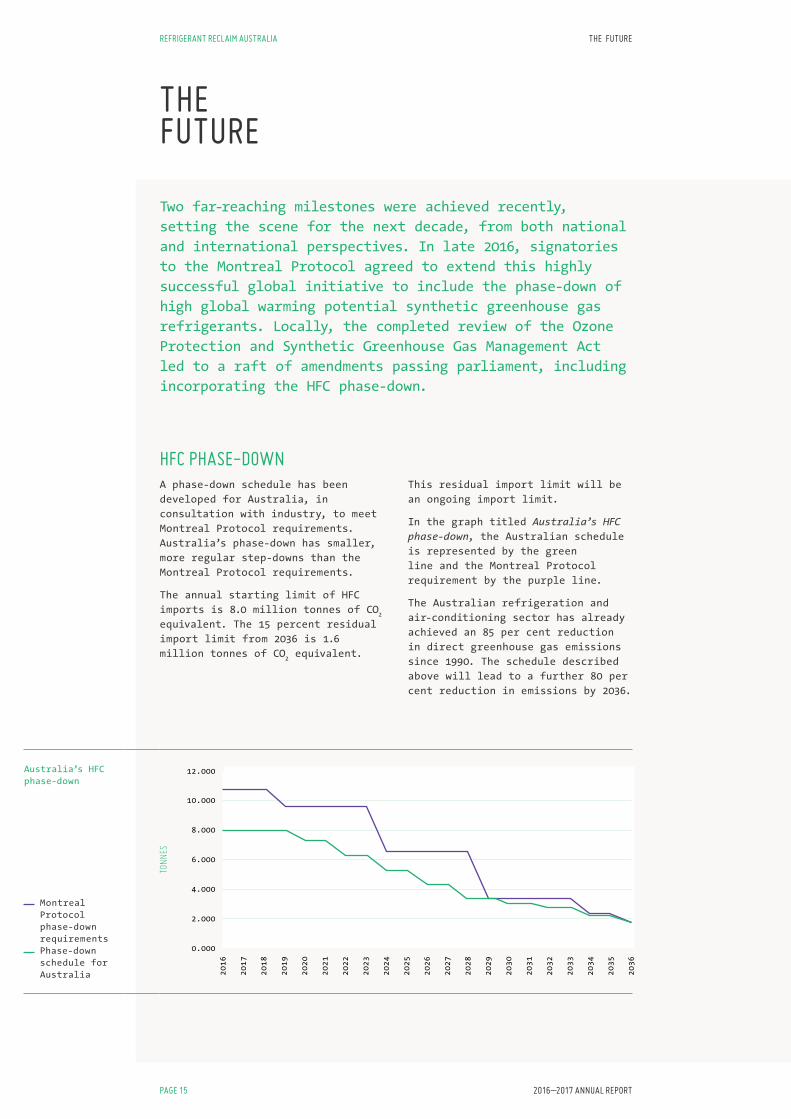
HFC PHASE-DOWNA�phase-down�schedule�has�been�developed�for�Australia,�in�consultation�with�industry,�to�meet�Montreal�Protocol�requirements.�Australia’s�phase-down�has�smaller,�more�regular�step-downs�than�the�Montreal�Protocol�requirements.
The�annual�starting�limit�of�HFC�imports�is�8.0�million�tonnes�of�CO2�equivalent.�The�15�percent�residual�import�limit�from�2036�is�1.6�million�tonnes�of�CO2�equivalent.�
This�residual�import�limit�will�be�an�ongoing�import�limit.
In�the�graph�titled�Australia’s HFC phase-down,�the�Australian�schedule�is�represented�by�the�green�line�and�the�Montreal�Protocol�requirement�by�the�purple�line.
The�Australian�refrigeration�and�air-conditioning�sector�has�already�achieved�an�85�per�cent�reduction�in�direct�greenhouse�gas�emissions�since�1990.�The�schedule�described�above�will�lead�to�a�further�80�per�cent�reduction�in�emissions�by�2036.
Australia’s�HFC�phase-down
0.000
2.000
4.000
6.000
8.000
10.000
12.000
2016
2017
2018
2019
2020
2021
2022
2023
2024
2025
2026
2027
2028
2029
2030
2031
2032
2033
2034
2035
2036
TONN
ES
��Montreal�Protocol�phase-down�requirements
��Phase-down�schedule�for�Australia

REFRIGERANT RECLAIM AUSTRALIA� THE FUTURE
CONTINGENT LIABILITYThe�volume�of�refrigerant�installed�in�Australia�continues�to�grow�and�has�now�surpassed�50,000�tonnes.�This�bank�of�refrigerant�is�the�liability�that�RRA�must�manage.�Many�years�into�the�future,�when�revenue�from�imported�refrigerants�has�declined,�RRA�must�continue�to�collect�and�safely�dispose�of�unwanted�and�contaminated�recovered�refrigerant.�For�this�purpose,�funds�have�been�accumulated�in�a�Trust.�Based�on�the�installed�bank�of�refrigerant�and�current�costs,�RRA’s�contingent�liability�is�calculated�to�be�in�the�order�of�$350�million.
INDUSTRY DEVELOPMENTRRA�will�continue�to�provide�strong�support�to�the�CSIRO,�TAFE,�World�Skills�and�industry�associations.�Additionally,�we�will�seek�to�undertake�research�in�areas�that�are�of�benefit�to�the�industry,�the�broader�community�and�the�environment.�Projects�already�underway�include�the�development�of�a�flammable�refrigerant�safety�guide�for�the�automotive�sector,�review�and�approval�of�an�A3-rated�flammable�refrigerant�recovery�unit,�improving�the�supply�of�refrigerants�to�TAFE�and�research�into�split�air-conditioning�systems�when�they�reach�end-of-life.
PAGE 16� 2016–2017 ANNUAL REPORT

REFRIGERANT RECLAIM AUSTRALIA� FINANCIAL REPORT 2017/18
PAGE 17� 2016–2017 ANNUAL REPORT
FINANCIAL REPORT 2017/18
The Directors of:
Refrigerant Reclaim Australia Limited, as trustee forR.R.A. Environment Trust
Cc: General Manager, Refrigerant Reclaim Australia
Compilation report to the directors of the Refrigerant Reclaim Australiagroup
Using information you provided, we have compiled the special purpose financial statements for theRefrigerant Reclaim Australia (RRA) group, consisting of Refrigerant Reclaim Australia Limited and the R.R.A. Environment Trust for the year ended 30 June 2018. The financial statements for theRRA group are an aggregation of the audited financial data for each of the entities listed above,after eliminating any inter-entity transactions and balances. The report comprises a combinedincome statement, combined balance sheet, and related notes.
The responsibility of the directors
The directors are solely responsible for the information contained in the report and have determined that the financial reporting framework used, as set out in Note 1 to the financial statements, is appropriate to your specific purposes.
Our responsibility
On the basis of information provided by you, we have compiled the accompanying financial statements in accordance with the financial reporting framework described in Note 1 to the financial statements.
Our procedures use accounting expertise to collect, classify and summarise the financial information, which you provided, in compiling the financial statements. Our procedures do not include verification or validation procedures. No audit or review has been performed and accordingly no assurance is expressed.
The financial statements were compiled exclusively for the benefit of the proprietor. We do not accept responsibility to any other person for the contents of the financial statements.
PricewaterhouseCoopers
Eugene KalenjukPartner
CanberraOctober 2018
PricewaterhouseCoopers, ABN 52 780 433 757 28 Sydney Avenue, Forrest ACT 2600, GPO BOX 447,CANBERRA ACT 2601 DX 77 Canberra, Australia T +61 2 6271 3000, F +61 2 6271 3999, www.pwc.com.au
Liability limited by a scheme approved under Professional Standards Legislation.

REFRIGERANT RECLAIM AUSTRALIA� FINANCIAL REPORT 2017/18
PAGE 18� 2016–2017 ANNUAL REPORT
Refrigerant Reclaim Australia Group Income Statement
for the year ended 30 June 2018
2018 2017$ $
Income
Levies- Bulk importers 8,734,171 7,451,905 - Charged equipment importers 7,226,854 6,546,266
Total Income 15,961,025 13,998,171
Operational Costs
Cost of destruction- Destruction costs 3,508,544 2,393,707 - Rebates to contractors and wholesalers 4,611,438 3,659,927 - Other 1,024,555 893,250
Total Operational Costs 9,144,536 6,946,884
Gross Surplus/(Deficit) from Trading 6,816,489 7,051,287
Other Income
Interest income 1,924,071 1,898,354 Other income 72,742 272,962
Total Other Income 1,996,814 2,171,316
Total Trading Overheads 1,315,208 954,446
Operating Surplus 7,498,095 8,268,157
Net Surplus/(Deficit) 7,498,095 8,268,157

REFRIGERANT RECLAIM AUSTRALIA� FINANCIAL REPORT 2017/18
PAGE 19� 2016–2017 ANNUAL REPORT
Refrigerant Reclaim Australia Group Balance Sheet
for the year ended 30 June 20182018 2017
$ $
ASSETSCurrent AssetsFundsPetty Cash 200 200 General Cheque Account 254,648 3,529,167 Term Deposits 30,214,786 22,810,000 Investments 11,525,522 6,707,666
41,995,156 33,047,033 DebtorsTrade Debtors 3,033,367 3,007,457 Other Debtors 66,353 68,109
3,099,720 3,075,566 OtherPrepayments 35,822 36,053 Accrued Interest 437,936 367,622
473,758 403,675
Total Current Assets 45,568,635 36,526,274
Non-Current AssetsFundsTerm Deposits - 2,244,000 Investments 35,472,477 33,580,706 Property Plant and Equipment 14,801 84,871 Less Accumulated Depreciation (14,801) (68,848)Cylinders 1,043,470 1,043,470 Less Accumulated Depreciation (619,782) (502,104)
35,896,165 36,382,095
Total Non-Current Assets 35,896,165 36,382,095
Total Assets 81,464,800 72,908,369
LIABILITIESCurrent LiabilitiesCreditorsTrade Creditors 954,528 725,624 Accrued Expenses 88,511 35,424 Other Payables 27,725 86,775
1,070,764 847,823 ProvisionsProvision for annual leave 37,080 34,633 Provision for long service leave 126,061 118,716 Provision - Destruction Costs 1,047,840 222,247
1,210,982 375,596
Total Current Liabilities 2,281,746 1,223,419
Total Liabilities 2,281,746 1,223,419
Net Assets 79,183,054 71,684,950
EQUITYSettled Sum 10 10 Retained Earnings 71,684,950 63,416,783 Current Year Earnings 7,498,095 8,268,157 Total Equity 79,183,054 71,684,950
REFRIGERANT RECLAIM AUSTRALIA� FINANCIAL REPORT 2017/18
PAGE 20� 2016–2017 ANNUAL REPORT
Refrigerant Reclaim Australia Group Consolidated Financial Statements
Notes to the financial statements for the year ended 30 June 2018
1 Summary of significant accounting policies
The principal accounting policies adopted in the preparation of these financial statements are set out below. These policies have been consistently applied to all the years presented, unless otherwise stated.
The Trust is a not for profit entity.
(a) Basis of preparation
This is a special purpose financial report that has been prepared based on the 2018 financial reports of Refrigerant Reclaim Australia Limited and the Refrigerant Reclaim Australia Environment Trust, each of which were individually audited. As the consolidated Refrigerant Reclaim Australia entity presented in this report is not recognised as a consolidated entity under Australian Accounting Standards, management have determined the accounting policies outlined below are appropriate and sufficient to meet the needs of the intended users of this report
(i) New and amended standards adopted by the Group
None of the new standards and amendments to standards that are mandatory for the first time for the financial year beginning 1 July 2017 affected any of the amounts recognised in the current period or any prior period and are not likely to affect future periods.
(ii) Historical cost convention
These financial statements have been prepared under the historical cost convention.
(b) Revenue recognition
Revenue is measured at the fair value of the consideration received or receivable. Amounts disclosed as revenue are net of returns, trade allowances, rebates and amounts collected on behalf of third parties.
Revenue is recognised for the major business activities as follows:
(i) Levy on imported refrigerant
Revenue is recognised when certain types of refrigerant are imported and sold in Australia.
(ii) Interest revenue
Interest revenue is recognised when interest is derived on cash at bank.
(iii) Government revenue
Government revenue is recognised when it is invoiced.
(c) Income tax
Income tax is not brought to account as the trust has exempt status under Division 50 Subdivisions 5 & 10 of the Income Tax Assessment Act 1997.

REFRIGERANT RECLAIM AUSTRALIA� FINANCIAL REPORT 2017/18
PAGE 21� 2016–2017 ANNUAL REPORT
Refrigerant Reclaim Australia Group Consolidated Financial Statements
Notes to the financial statements for the year ended 30 June 2018
(continued)
1 Summary of significant accounting policies (continued)
(d) Cash and cash equivalents
For the purpose of presentation in the statement of cash flows, cash and cash equivalents includes cash on hand, deposits held at call with financial institutions, other short-term, highly liquid investments with original maturities of up to three months that are readily convertible to known amounts of cash and which are subject to an insignificant risk of changes in value, and bank overdrafts.
(e) Trade receivables
Trade receivables are recognised initially at fair value and subsequently measured at amortised cost using the effective interest method, less provision for impairment. Trade receivables are due for settlement within 60 days.
Collectability of trade receivables is reviewed on an ongoing basis. Debts which are known to be uncollectible are written off by reducing the carrying amount directly. An allowance account (provision for impairment of trade receivables) is used when there is objective evidence that the Trust will not be able to collect all amounts due according to the original terms of the receivables. Significant financial difficulties of the debtor, probability that the debtor will enter bankruptcy or financial reorganisation, and default or delinquency in payments (more than 120 days overdue) are considered indicators that the trade receivable is impaired. The amount of the impairment allowance is the difference between the asset's carrying amount and the present value of estimated future cash flows, discounted at the original effective interest rate. Cash flows relating to short-term receivables are not discounted if the effect of discounting is immaterial.
The amount of the impairment loss is recognised in profit or loss within other expenses. When a trade receivable for which an impairment allowance had been recognised becomes uncollectible in a subsequent period, it is written off against the allowance account. Subsequent recoveries of amounts previously written off are credited against other expenses in profit or loss.
(f) Property, plant and equipment
Property, plant and equipment are initially recorded at cost and are depreciated over their estimated useful lives using the diminishing value method. New assets are depreciated from the date of their commissioning.
Depreciation rates and methods are reviewed annually for appropriateness. The useful lives used for each class of assets are as follows:
- Cylinders 7.5 years - Other property, plant and equipment 3-5 years
(g) Trade and other payables
These amounts represent liabilities for goods and services provided to the Trust prior to the end of financial year which are unpaid. The amounts are unsecured and are usually paid within 30 days of recognition.
(h) Employee benefits
(i) Short-term obligations
Liabilities for wages and salaries, including non-monetary benefits and annual leave are recognised in respect of employees' services up to the reporting date and are measured at the amounts expected to be paid when the liabilities are settled.
(ii) Other long-term employee benefit obligations
The liability for long service leave which is not expected to be settled within 12 months after the end of the period in which the employees render the related service is recognised in the provision for employee benefits and measured as the present value of expected future payments to be made in respect of services provided by employees up to the end of the reporting period using the projected unit credit method. Consideration is given to expected future wage and salary levels, experience of employee departures and periods of service. Expected future payments are discounted using market yields at the end of the reporting period on national government bonds with terms to maturity and currency that match, as closely as possible, the estimated future cash outflows.
REFRIGERANT RECLAIM AUSTRALIA� FINANCIAL REPORT 2017/18
PAGE 22� 2016–2017 ANNUAL REPORT
Refrigerant Reclaim Australia Group Consolidated Financial Statements
Notes to the financial statements for the year ended 30 June 2018
(continued)
1 Summary of significant accounting policies (continued)
(i) Goods and Services Tax (GST)
Revenues, expenses and assets are recognised net of the amount of associated GST, unless the GST incurred is not recoverable from the taxation authority. In this case it is recognised as part of the cost of acquisition of the asset or as part of the expense.
Receivables and payables are stated inclusive of the amount of GST receivable or payable. The net amount of GST recoverable from, or payable to, the taxation authority is included with other receivables or payables in the balance sheet.
Cash flows are presented on a gross basis. The GST components of cash flows arising from investing or financing activities which are recoverable from, or payable to the taxation authority, are presented as operating cash flows.

For�more�information,�please��contact�Refrigerant�Reclaim�Australia
Phone� (02)�6230�5244Fax� (02)�6230�4533Email�� [email protected]