annual report 2017 - asx2017/10/04 · silver chef (nz) originations including advantage $14.8m...
TRANSCRIPT

ANNUAL REPORT 2017
For
per
sona
l use
onl
y

For
per
sona
l use
onl
y

2FY17
Highlights
5 Chairman’s
Report
11A purpose
driven business
17Senior
Management
23Directors’ report including the remuneration report
49Consolidated financial
statements
50Contents to the
consolidated financial statements
51Consolidated statement
of profit or loss and other comprehensive income
52Consolidated statement
of changes in equity
53Consolidated statement
of financial position
54Consolidated statement
of cash flows
55Notes to the consolidated
financial statements
84Directors’
Declaration
85Independent Auditor’s Report to members of
Silver Chef Limited
90Lead Auditor’s Independence
Declaration
91ASX Additional
Information
Inside back coverCompany directory
CONTENTS
For
per
sona
l use
onl
y

*Asset base consists of rental assets at written down value, lease receivables at amortised cost and capitalised upfront costs of lease origination
FY17 HIGHLIGHTS
Net profit after tax of
$20.2 million
Consistent strong performance from the Hospitality business with the rental asset base* up 34% on 30 June 2016
Strong growth in the New Zealand and Canadian asset bases
Improved second half performance from GoGetta as predicted
GoGetta business continues to be refined with focus on improving return on capital through customer quality measures
Dividend payout ratio increased to
68.7% of full year earnings
Implementation of securitisation funding facility on target
SILV
ER C
HEF
LIM
ITED
AN
NUA
L R
EPO
RT
2017
2
For
per
sona
l use
onl
y

STRATEGY AND OUTLOOK
Maintain key relationships within domestic hospitality sector and continue to deliver above industry growth rates
Continue international expansion in Canada with a focus on establishing our presence in the Eastern Provinces
Focus on improved financial returns on capital invested in GoGetta, through improved credit quality and management of asset repossessions and outstanding arrears
Deliver improved technology solutions to improve customer experience and create better overhead leverage
Diversify funding sources through securitisation
The Company expects full year after tax earnings for FY18 in the range of $24 million to $26 million
REVENUE
FY17
$286.0 million
FY16
$221.1 million
29%
change
RENTAL ASSETS AT COST AND LEASE RECEIVABLES
FY17
$657.3 million
FY16
$539.2 million
22%
change
NPAT
FY17
$20.2 million
FY16
$22.4 million
(10%)change
NET OPERATING CASH FLOWS
FY17
$152.9 million
FY16
$119.7 million
28%
change
BASIC EARNINGS PER SHARE
FY17
55.3 cents per share
FY16
68.6 cents per share
(19%)change
DIVIDEND FULLY FRANKED
FY17
38.0 cents per share
FY16
42.0 cents per share
(10%)change
SILV
ER C
HEF
LIM
ITED
AN
NUA
L R
EPO
RT
2017
3
HIG
HLI
GH
TS
For
per
sona
l use
onl
y

Hospitality New Zealand (FY16: 4%) 4%
Hospitality Canada (FY16: 3%) 5%
BOOK VALUE OF RENTAL ASSETS AND LEASE RECEIVABLES ($M)
Silver Chef GoGetta
Silver Chef GoGetta Other revenue
REVENUE BY SEGMENT
44% GoGetta (FY16: 46%)
47% Hospitality Australia (FY16: 47%)
ASSETS BY SEGMENT
111.1 62.4FY13
74.7 2.337.3FY13
131.1 68.4FY14
94.6 2.943.9FY14
146.2 100.4FY15
110.1 3.557.4FY15
204.6 193.3FY16273.6 200.4FY17
125.5 6.189.5FY16155.3 5.6125.1FY17
SILV
ER C
HEF
LIM
ITED
AN
NUA
L R
EPO
RT
2017
4
For
per
sona
l use
onl
y

CHAIRMAN’S REPORT
5
SILV
ER C
HEF
LIM
ITED
AN
NUA
L R
EPO
RT
2017
CHAI
RMAN
’S R
EPO
RT
For
per
sona
l use
onl
y

GLOBAL PORTFOLIO ($AUD)
SILVER CHEF (AU)
Originations including Advantage $150.3mRental assets $259.6mLease receivables $64.3m
SILVER CHEF (NZ)
Originations including Advantage $14.8mRental assets $25.0mLease receivables $4.5m
SILVER CHEF (CA)
Originations including Advantage $18.6mRental assets $25.3mLease receivables $3.4m
GOGETTA
Originations including Advantage $140.1mRental assets $247.8mLease receivables $27.2m
SILV
ER C
HEF
LIM
ITED
AN
NUA
L R
EPO
RT
2017
6
For
per
sona
l use
onl
y

During the year ended 30 June 2017, Silver Chef (“the Company”) continued to execute its strategy of expanding its flexible rental product offering under both the Silver Chef and GoGetta brands. The Company reported a net profit after tax of $20.2 million, which was down 9.8% on the previous corresponding period. Overall, the Company delivered good growth in its rental asset base, but year on year financial returns were down on the back of poor customer contract performance in the GoGetta business, particularly in the light commercial channel. The Company is focused on improving return on capital and has implemented a number of changes to improve credit quality and average contract life of the GoGetta portfolio.
Under the long established Silver Chef brand focused on the hospitality sector, growth and financial performance from the Australian, New Zealand and Canadian markets was excellent. Under the domestically focused GoGetta brand, similar to other rapidly growing businesses, execution of that strategy came with its challenges during the year. The transport and construction sectors in which GoGetta operates have differing customer and credit dynamics and action has been taken to refine our definition of what constitutes a quality customer in that part of the business. During the year, the Company implemented a variety of business improvement initiatives in GoGetta and the significantly improved economic performance in the second half of the year is an early indicator that the portfolio is of better average quality.
THE BUSINESS MODELThe Company has two brands which operate as separate divisions: Hospitality (Silver Chef) which provides funding to businesses in the hospitality sector, and GoGetta, which provides equipment funding for
The Company is focused on improving return on capital and has implemented a number of changes to improve credit quality and average contract life of the GoGetta portfolio
small to medium sized businesses across a range of sectors. Both divisions offer a tried and tested equipment funding solution through the Rent.Try.Buy. and Rent.Grow.Own solutions.
HOSPITALITY – AUSTRALIA AND NEW ZEALANDThe Silver Chef business in Australia and New Zealand exceeded expectations for the twelve-month period to 30 June 2017, with strong growth in both profitability and the rental asset base in both jurisdictions. New Zealand delivered exceptional growth increasing its rental asset base at cost 49% year on year. The Australian hospitality business continues to grow at
Silver Chef Group FY17 Highlights
Net profit after tax of $20.2M
Consistent strong performance from the Hospitality business with the rental asset base* up 34% on 30 June 2016
Strong growth in the New Zealand and Canadian asset bases
Improved second half performance from GoGetta as predicted
GoGetta business continues to be refined with focus on improving return on capital through customer quality measures
Dividend payout ratio increased to 68.7% of full year earnings
Implementation of securitisation funding facility on target
*Asset base consists of rental assets at written down value, lease receivables at amortised cost and capitalised upfront costs of lease origination
SILV
ER C
HEF
LIM
ITED
AN
NUA
L R
EPO
RT
2017
7
CHAI
RMAN
’S R
EPO
RT
For
per
sona
l use
onl
y

SUCCESSThe success of the Company has been built around a number of factors which provide sustainable competitive advantages.
EXPERIENCEThe Company has been providing its core business equipment funding model for over 30 years.
CUSTOMERSA robust and flexible equipment rental for business critical assets for small businesses who recognise that it is the use of the equipment and not the ownership that produces profit.
PEOPLEWe have a strong focus on acquiring and developing high quality staff who are aligned to our core values and purpose which builds long term value for shareholders.
RISK MANAGEMENTCredit and asset management processes are evolving to manage risks associated with customer defaults.
ASSET REMARKETINGThe Company has developed specific know-how around the re-conditioning and remarketing of used assets, particularly in the Hospitality sector.
PARTNERSHIPSWe continue to strengthen our relationships with the Hospitality dealer and GoGetta broker networks by growing sales and marketing support.
SILV
ER C
HEF
LIM
ITED
AN
NUA
L R
EPO
RT
2017
8
For
per
sona
l use
onl
y

substantially higher rates than the industry average, closing 24% higher than 30 June 2016. The Company remains focused on maintaining key relationships with its dealer network. We also made significant investment during the year in our digital marketing strategy and this has generated excellent results through more targeted engagement with our existing customer base and new markets.
Growth in the Company’s key channels of restaurants, cafes and bars remains strong. The coffee channel also performed strongly during the year as we continued to generate good market penetration with our free on loan program in partnership with coffee roasters. We also generated good growth in the franchise space, particularly with emerging franchise systems where our flexible asset rental solutions have been viewed positively by early stage franchisors. The outlook for the hospitality sector in Australia and New Zealand remains strong and we anticipate ongoing growth in originations well above underlying industry growth.
HOSPITALITY – CANADAThe Canadian hospitality business performed well for the year delivering $18.6 million of originations and a closing rental asset base at cost of $25.3 million. This growing business continues to be well supported by suppliers, equipment dealers and industry bodies in the local market and we have set ambitious origination growth targets for FY18. Expansion into the eastern provinces provides a strong platform for future growth and our flexible rental solution continues to resonate with small hospitality businesses, particularly in the coffee sector, that are looking to expand.
GOGETTA – AUSTRALIAIt has been a difficult year for the GoGetta business with firstly the fraud event announced in November 2016 and then ongoing challenges of dealing with improving average credit quality of the portfolio. The Company has taken significant steps to improve its fraud risk management
controls, particularly in the area of digital identity fraud. This is an ongoing challenge for the entire financial services sector and will always be an inherent risk to our business. We also continue to refine our approach to customer credit evaluation for the GoGetta business and this resulted in an improvement in the second half of FY17. Management has a comprehensive plan for how we will continue to improve return on capital in the GoGetta business with a focus on shaping the customer portfolio so it reflects both appropriate average credit quality and contract longevity. Critical to this strategy has been the alignment of internal sales staff and our broker partners who are now rewarded for achieving pre-agreed targets on origination volume, credit quality and average contract tenor.
We believe the general outlook for small business operators in the transport and construction channels remains positive, and our finance broker channel partners are now more aligned with both the Company’s value based objectives and its lending criteria. In this regard FY18 is expected to be a better year. However, there will be a cost burden on the business as it works through the repossession and remarketing of assets, particularly in the light commercial channel, for which underlying customer quality did not meet our standards. This is a finite problem, linked to originations written prior to March 2016, but will create a drag on FY18 earnings.
CAPITAL MANAGEMENTThe Company continues to enjoy the support of its senior lenders and continuously reviews its capital requirements to ensure an appropriate mix and diversity of funding sources.
During the year the Company extended available capacity in its senior syndicated banking facility by $100 million. The Company successfully completed equity capital raisings in October 2016 and April 2017, placing shares to existing and new shareholders. The funds raised from these initiatives are used entirely to fund growth in the Company’s rental asset base and were in line with Silver Chef’s ongoing capital management strategy. SI
LVER
CH
EF L
IMIT
ED A
NN
UAL
REP
OR
T 20
17
9
CHAI
RMAN
’S R
EPO
RT
For
per
sona
l use
onl
y

Pleasingly, the Company is close to executing documentation which will allow it to access an initial tranche of securitisation debt finance. This is an important milestone for the business as it further diversifies the Group’s funding base and is the first application of structured debt finance against the Company’s short term rental contracts. Demonstrating the effectiveness and efficiency of this funding model is an important part of the Company’s longer term capital management strategy both in Australia and in overseas markets.
SYSTEMSDuring the year, the Company completed the development and testing of phase one of a new application management system. The system will generate internal efficiencies through reduced application processing times and also allows direct importing of application information from equipment dealers and finance brokers. The Company continues to invest in improving its systems and processes to ensure it is well positioned to deliver ongoing high levels of customer service in a cost competitive manner.
KEY MANAGEMENT APPOINTMENTSDamien Guivarra transitioned to the role of Chief Executive Officer effective from 3 November 2016. This allowed me to return to the Non-Executive Chairman role, permitting me more time to focus on the English Family Foundation’s philanthropic activities.
Mr Guivarra was appointed to the role of Chief Operating Officer in October 2015 and prior to that played an integral role in the growth of the Company, holding a variety of sales focused and operational management roles. Mr Guivarra spent the last three years managing the Northern Region business across both the Silver Chef and GoGetta brands. Prior to joining Silver Chef, he held a variety of national sales and marketing roles.
FY17 has been a challenging year, and I congratulate Damien on both his appointment to the CEO role but also on his management of these issues and the decisive and effective actions which have been taken to protect and improve the business. I remain of the view that we have the right management team in place and investors can be assured of my ongoing support for the Company including maintaining the English family’s existing shareholding position.
I would like to thank the leadership team and our wonderful staff for their contribution to the excellent result this year. My thanks also to our Board of Directors for their ongoing support and wise counsel. The business is in excellent shape and I am confident that we have the platform in place to continue to deliver outstanding shareholder value.
Allan English Non-Executive Chairman
28 August 2017
SILV
ER C
HEF
LIM
ITED
AN
NUA
L R
EPO
RT
2017
10
For
per
sona
l use
onl
y

A PURPOSE DRIVEN BUSINESS
A PU
RPO
SE D
RIVE
N B
USIN
ESS
SILV
ER C
HEF
LIM
ITED
AN
NUA
L R
EPO
RT
2017
11
For
per
sona
l use
onl
y

OUR PURPOSE
The Company has always had a strong culture focused on its purpose of helping people achieve their dreams through its contribution to the community and its customers.
We firmly believe that successful, sustainable commercial enterprises require alignment of their activities around a values driven framework and a desire to make a wider contribution to the world. This approach has enabled Silver Chef to attract and retain high quality staff, create deeper and more meaningful engagement with our customers and demonstrate to investors and other stakeholders that their capital is invested in a business that is doing well and doing good.
The B Corporation certification is a validation of Silver Chef’s purpose of helping others achieve their dreams, by formally committing to social and environmental responsibility. It reinforces that as a business, our core values and purpose are the foundation of our conduct with our employees, partners, customers and the community, and are as much of a focus as bottom line profitability. This approach will enable us to continue to create and deliver strategies that will ensure our social impact can be shared and expanded.
Silver Chef became a Certified B Corporation in June 2015. B Corps use the power of business to solve social and environmental problems, and are formally certified by the non-profit B Lab. The B Lab certification is a third party rigorous assessment that explores a company’s governance, transparency, environmental and social
impact. By being a B Corp, Silver Chef voluntarily holds itself to a high level of accountability in those areas.
We focus on four key pillars to drive our purposeful business model: Staff, Community, Environment and Customers. We have dedicated B Corp committees across our offices in Australia, New Zealand and Canada. One of the recent initiatives rolled out was our Work Welcome Program. This program has allowed us to employ refugees through a 12-week internship to help provide them with work experience and support in the cultural changes they may be facing. We also recently rolled out a program to reduce our environmental footprint through committing to green goals and a number of initiatives to reduce our environmental impact.
B Lab certification applies to the whole company across all product lines and issue areas. Today, there is a growing community of over 2,220 Certified B Corps from more than 50 countries and 130 industries working together toward one unifying goal: to redefine success in business.
By voluntarily meeting higher standards of transparency, accountability, and performance, Certified B Corps are distinguishing themselves in a cluttered marketplace by offering a positive vision of a better way to do business.
More information on B Corporation and the meaning of Silver Chef’s B Corporation’s accreditation can be found at bcorporation.com.au.
PURPOSE DRIVEN
CUSTOMERS STAFF COMMUNITY
CONTINUED GROWTH
HELPING PEOPLE ACHIEVE THEIR DREAMS
SILV
ER C
HEF
LIM
ITED
AN
NUA
L R
EPO
RT
2017
12
For
per
sona
l use
onl
y

1. OUR PEOPLEOur people are what drive our business and our investment in them is fundamental to our success and theirs. We ensure we have the right staff by recruiting people who identify with and personify our core values of Teamwork, Attitude, Wellbeing, Respect, Integrity, Flexibility and Communication. We are passionate about diversity and inclusion and recognise that without diversity in thought and experience we cannot evolve and grow our business.
We have invested in an internal training and development system that allows our people to formulate personalised development plans and provides a framework for further education and support. This is partnered with a mentoring program that enables our people to leverage the skills and experience of other staff members.
We promote cross departmental training and secondments, and promote from within the organisation where possible in order to help people achieve their career goals and dreams while capitalising on the experience and knowledge of our staff.
The Company values its staff and their feedback and uses the results of regular staff engagement surveys to improve its culture and work environment. SI
LVER
CH
EF L
IMIT
ED A
NN
UAL
REP
OR
T 20
17
13
A PU
RPO
SE D
RIVE
N B
USIN
ESS
For
per
sona
l use
onl
y

2. OUR CUSTOMERSOur customers are at the forefront of our business and we recognise that in order to succeed we must develop a deep understanding of them and their changing needs. We have dedicated resources who regularly meet with customers to try to understand their journeys and challenges and who in turn, empower all other staff to support our customers with empathy and understanding. This strategy allows us to remain a global leader in customer experience.
We constantly achieve industry leading Net Promoter Scores (NPS) and strive to better our scores year on year.
In order to remain competitive and continue to meet the changing needs of our customers, the Company maintains a strong focus on innovation.
The Company strongly believes that innovation is best driven from within the organisation and provides a number of forums in which its employees can participate in design thinking, customer journey mapping and ideation sessions. Through innovation we have been able to evolve our business, not just internally through process improvement and new efficient ways of working, but also by enhancing our business model to include value add services for our customers, such as those provided by our Profitable Hospitality business.
NET PROMOTER SCORE GROWTH 2014–2017
63Average NPS
2014/15 68Average NPS
2015/16 72Average NPS
2016/17
27
16
35
37
32
72
UTILITIESTELECOM
RETAILAIRLINE
FINANCIAL SERVICESSILVER CHEF
Source: Temkin Group 2016 Consumer Benchmark SurveySILV
ER C
HEF
LIM
ITED
AN
NUA
L R
EPO
RT
2017
14
For
per
sona
l use
onl
y

In order to remaIn competitive and continue to meet the changing needs of our customers,
the company maintains a strong
focus on innovation
15
SILV
ER C
HEF
LIM
ITED
AN
NUA
L R
EPO
RT
2017
A PU
RPO
SE D
RIVE
N B
USIN
ESS
For
per
sona
l use
onl
y

3. OUR COMMUNITYWe are incredibly passionate about our local and global community. We pride ourselves on not only creating wealth and opportunity for our customers, partners, staff and shareholders, but also for those in need and less fortunate.
During FY17 the Company established the Silver Chef Foundation, to formalise its giving program. We have pledged to donate 1% of net profit after tax to locally and internationally registered charities that align with Silver Chef’s vision of helping people achieve their dreams. This is coupled with workplace giving arrangements and the commitment of Silver Chef to shoulder all costs associated with the Foundation, ensuring that 100% of funds are distributed to charities.
Silver Chef also encourages staff to participate in two volunteer days each year to give back to the community and a cause in which they may have a personal interest.
Silver Chef’s corporate social responsibility continues to be fulfilled through the Company’s association with Opportunity International Australia. The Company and its people support Opportunity International directly and indirectly. Indirectly through the provision of office space and communication services and directly through numerous fundraising and awareness enhancing initiatives.
To date, the Silver Chef Group has helped 1,000,000 people out of poverty through its workplace giving, customer and company donations and fundraising activities.
Allan English, Silver Chef Limited’s Founder and Non-Executive Chairman, through his personal participation, and that of the English Family Foundation (which continues
to be the largest beneficial shareholder in the Company), is a major supporter of Opportunity International.
Opportunity International provides small loans to families living in poverty, predominantly to mothers. Silver Chef on the other hand provides equipment funding to small business operators across many sectors in Australia, New Zealand and Canada. Silver Chef and Opportunity International are aligned in purpose and share many values. Silver Chef’s success, in part, benefits Opportunity International and in turn Opportunity International provides Silver Chef with a sense of purpose far greater than just a corporate purpose. This purpose is an essential component of Silver Chef’s success and in turn provides our people with a purpose to achieve what they do.
Opportunity International is a not-for-profit organisation that uses a sustainable approach to solve the problem of poverty. Rather than a hand-out, they provide people living in poverty with a hand up in the form of small loans (microfinance) to help them start or grow their own small businesses. This enables them to earn regular incomes so they no longer have to struggle to afford food, clean water, proper shelter, or an education for their children.
With more than 40 years’ experience working with families in poverty, Opportunity International is a leading provider and pioneer of socially focused microfinance and support services. Part of the global Opportunity International Network (with support partners in the United States, United Kingdom, Canada, Singapore, Hong Kong and Germany), they currently provide a way out of poverty for millions of people in 22 developing countries around the world.
More information about Opportunity International Australia’s international development programs can be found at opportunity.org.au.
SILV
ER C
HEF
LIM
ITED
AN
NUA
L R
EPO
RT
2017
16
For
per
sona
l use
onl
y

SENIOR MANAGEMENT
17
SILV
ER C
HEF
LIM
ITED
AN
NUA
L R
EPO
RT
2017
SEN
IOR
MAN
AGEM
ENT
For
per
sona
l use
onl
y

DOUG MCALPINECHIEF FINANCIAL OFFICERDoug is a Chartered Accountant and commenced as Silver Chef’s Chief Financial Officer in August 2014. He brings to the company 15 years of accounting and finance experience, including Chief Financial Officer and Company Secretary of public companies in Australia. His previous experience includes Chief Financial Officer of Stanmore Coal Limited and prior to that Chief Financial Officer of Watpac Limited and Ariadne Limited. Doug has strong competencies in the areas of accounting, capital management, corporate governance and risk management.
DAMIEN GUIVARRA CHIEF EXECUTIVE OFFICERDamien was appointed to the role of Chief Executive Officer in November 2016. Over the last ten years Damien has played an integral role in the growth of the Company holding a variety of sales focused and operational management roles. He spent the last three years managing the Northern Region business across both the Silver Chef and GoGetta brands. Prior to joining Silver Chef, he held a variety of national sales and marketing roles.
SILV
ER C
HEF
LIM
ITED
AN
NUA
L R
EPO
RT
2017
18
For
per
sona
l use
onl
y

We ensure we have the right
staff by recruiting people Who identify with and personIfy
our core values
19
SEN
IOR
MAN
AGEM
ENT
SILV
ER C
HEF
LIM
ITED
AN
NUA
L R
EPO
RT
2017
For
per
sona
l use
onl
y

KRISTIAN THANASEXECUTIVE GENERAL MANAGER, CANADAKristian joined Silver Chef in 2012 as part of a new business development role in the hospitality sector in NSW. With a significant history of starting and selling his own businesses in the hospitality sector, he was an integral member of the Canadian start up team in late 2013. Kristian has historically been a Silver Chef customer and vendor providing him with a unique insight into the Silver Chef business. Kristian is now Executive General Manager of the Canadian business overseeing the growth within that rapidly growing market and is also a member of the company’s Executive Management team.
ROBERT PHELPSEXECUTIVE GENERAL MANAGER, NORTHERN REGIONRobert has more than 25 years of experience in the financial sector, including executive positions with RemServ, St George Banking Group and National Australia Bank. Robert has a track record of achieving industry leading customer satisfaction levels and high performance sales cultures. As Executive General Manager he is passionate and dedicated to delivering superior customer service and building strong and mutually rewarding relationships with partners and clients.
SILV
ER C
HEF
LIM
ITED
AN
NUA
L R
EPO
RT
2017
20
For
per
sona
l use
onl
y

MIKE CONNELL EXECUTIVE GENERAL MANAGER, SOUTHERN REGIONMike Connell joined the company in January 2016. Mike has over 25 years in Human Resources with a broad range industries and markets both within Australia and Asia. His experience includes senior executive roles with Wesfarmers, Downer Mining, Ansaldo STS and Thiess. Mike has completed his PhD in Management, the focus of which is achievement of effectiveness by corporations through the alignment of their financial and moral-based goals.
SIMONE SMITH-HENRYGROUP PROJECT MANAGERSimone is responsible for Project Management and Project Execution across the group. Simone joined Silver Chef in 2007, and has extensive experience across all aspects of the Groups operations. A PRINCE2 certified Project Manager, Simone uses her qualifications along with the groups Gazelle and Argenti methodologies to drive executional excellence. Prior to her time at Silver Chef Simone had operational roles in a range of manufacturing and professional services firms.
21
SEN
IOR
MAN
AGEM
ENT
SILV
ER C
HEF
LIM
ITED
AN
NUA
L R
EPO
RT
2017
For
per
sona
l use
onl
y

VINNIE D’ALESSANDROHEAD OF TECHNOLOGYVinnie D’Alessandro joined Silver Chef in June 2015 as IT Manager. He has 18 years of technology experience across various operational, architecture, strategy and management roles. After a decade in the energy and construction industries, Vinnie joined the ASX listed Tatts Group where he led the award winning infrastructure architecture team. Since joining Silver Chef he has developed the Group IT strategy and set about building a team of solution focused technology professionals.
SILV
ER C
HEF
LIM
ITED
AN
NUA
L R
EPO
RT
2017
22
For
per
sona
l use
onl
y

DIRECTORS’ REPORT
DIR
ECTO
RS’ R
EPO
RT
23
SILV
ER C
HEF
LIM
ITED
AN
NUA
L R
EPO
RT
2017
For
per
sona
l use
onl
y

The Directors present their report together with the consolidated financial statements of the Group comprising of Silver Chef Limited (“the Company”) and its controlled entities, for the year ended 30 June 2017 and the Auditor’s Report thereon.
1. DIRECTORSThe Directors of the Company at any time during or since the end of the financial year are:
ANDREW KEMPAGE 66, B.COMM, CAAppointed a Director and Chairman in February 2005 at the time of listing, and resigned as Chairman on 30 June 2010. Andrew heads Huntington Group Pty Limited, a Brisbane-based corporate advisory company. His experience includes chartered accounting with KPMG and Littlewoods, merchant banking and corporate advisory services with AIFC (an affiliate of ANZ Banking Group) and since 1987 with Huntington Group. He is also a director of PTB Group Limited (appointed August 2006) and was a director of G8 Education Limited (from March 2011 to March 2015). Andrew is an independent Non-Executive Director, Chairman of the Audit & Risk Management Committee and a member of the Remuneration Committee and Finance Committee.
ALLAN ENGLISHAGE 62, NON-EXECUTIVE CHAIRMANThe founder of Silver Chef Limited, Allan has had extensive experience in the hospitality and rental industry with over 30 years in equipment sales, service and rental sectors. Allan was the Managing Director from 1986 to June 2010 after which he was appointed Non-Executive Chairman. Allan was re-appointed Executive Chairman on 13 February 2014, and then resumed his non-executive role from 3 November 2016. He is also active in the not for profit sector and acts as a Director for the English Family Foundation and is a council member for Philanthropy Australia.
SILV
ER C
HEF
LIM
ITED
AN
NUA
L R
EPO
RT
2017
24
For
per
sona
l use
onl
y
BEDE KINGAGE 61Appointed a Director in March 2005. Bede is the senior partner at Tobin King Lateef, Solicitors & Notaries. Bede is a Trustee of the Board of Trustees of the State Public Sector Superannuation Scheme (QSuper) and is a director of QSuper Limited and QInvest Limited. Bede is a fellow of the Financial Services Institute of Australasia, a Director of several non-listed companies and a member of various compliance committees for property, infrastructure and equity investment funds. He is the former National Chairman of YHA Australia, having occupied that position for over 10 years and a former Board Member of St. Aidan’s Foundation Limited, a not-for-profit organisation. Bede is an independent Non-Executive Director, Chairman of the Remuneration Committee and a member of the Audit & Risk Management Committee and Finance Committee.
SOPHIE MITCHELLAGE 50, B ECON, GAICD, SF FIN.Appointed a Director in September 2011. Sophie’s career has been in the financial sector and is currently a Director of Morgans Financial Limited. Previous roles have included Head of Research and Senior Analyst with Morgans’ predecessor company ABN AMRO Morgans and Portfolio Manager for Seymour Wealth Management. Sophie is a Member of the Takeovers Panel and the Queensland Advisory Board for Australian Super, a board member of the Australia Council for the Arts, and a Director of the Morgans Foundation. In addition she is Non-Executive director of ASX-listed entities Flagship Investments Limited (appointed June 2008) and Apollo Tourism & Leisure Limited (appointed September 2016), and a Trust Member of the Queensland Performing Arts Trust. Sophie is an independent Non-Executive Director and Chairman of the Finance Committee and is a member of the Audit & Risk Management Committee and Remuneration Committee.
SILV
ER C
HEF
LIM
ITED
AN
NUA
L R
EPO
RT
2017
25
DIR
ECTO
RS’ R
EPO
RT
For
per
sona
l use
onl
y

PATRICK TAPPERAGE 55, FAICDAppointed in July 2015, Patrick is also a Non-Executive Director of the Silver Chef Foundation Pty Ltd (the Trustee for the Silver Chef Foundation). He has had over 25 years’ experience in the telecommunications, technology, media, and entertainment industries, most notably as Executive Director and Chief Executive Officer of national broadband company, Internode. He commenced with Internode in 1998 when it was a small business and was appointed Chief Executive Officer in 2008. Patrick currently serves as Non-Executive Director of Redflow Limited (appointed March 2016), an ASX listed company. He is also a Non-Executive Director of Service to Youth Council Limited (SYC), a non-government, not-for-profit community service organization. Patrick sits on a number of SYC’s Board committees - as Chairman of their Digital Transformation committee, and as a member of their Audit and Risk committee. He is also Chairman of Acurus Pty Ltd, a leading Australian IT consulting and solutions provider based in Melbourne. Patrick is a former Governor of the American Chamber of Commerce (Amcham) in South Australia, and a former Chairman at Executive Boards Australia, which provides advisory board facilitation, leadership, HR & marketing services.
He is also a member of the Remuneration Committee.
DON MACKENZIEAGE 72Appointed Company Secretary in November 2010, and acts in a part time capacity. He commenced his professional career with a Chartered Accounting firm, and in 1976 commenced employment in a senior accounting role with a Queensland based ASX listed company. In 1993 he commenced practice as a Chartered Accountant providing corporate services predominantly to public companies until 2008 after which he acted in a personal capacity. He also acts or has acted as Company Secretary and/or Director for several listed and unlisted public companies. He is also the Secretary to all Board Committees.
2. COMPANY SECRETARY
SILV
ER C
HEF
LIM
ITED
AN
NUA
L R
EPO
RT
2017
26
For
per
sona
l use
onl
y
3. DIRECTORS’ MEETINGSThe number of Directors’ meetings (including meetings of Committees) and number of meetings attended during the financial year are:
DirectorBoard
meetings
Audit and risk management
committee meetingsRemuneration
committee meetingsFinance committee
meetings
A B A B A B A B
Allan English 14 14 - - - - - -
Andrew Kemp 14 14 4 4 2 2 2 2
Bede King 13 14 3 4 2 2 2 2
Sophie Mitchell 14 14 4 4 2 2 2 2
Patrick Tapper 13 14 - - 2 2 - -
A: Number of meetings attended B: Number of meetings held during the year
4. CORPORATE GOVERNANCE STATEMENTThis statement outlines the main corporate governance practices in place throughout the financial year, which comply with the ASX Corporate Governance Council (Recommendations), unless otherwise stated.
The Company’s Corporate Governance Charter which provides detailed information about governance is available on the Company’s website at www.silverchefgroup.com.au.
Silver Chef does not comply with ASX Corporate Governance Council’s Recommendations that require a chair person to be an independent Director. Allan English cannot be regarded as independent by virtue of his shareholding interests, however the Board has processes in place to manage any potential conflicts arising from this issue.
With effect from 13 February 2014, Allan English returned to the Company in a full time role as Executive Chairman, until Damien Guivarra’s appointment as Chief Executive Officer on 3 November 2016. From this date, Allan English was reappointed Non-Executive Chairman.
Silver Chef has not established a nominations committee but the full Board deals with nomination matters in accordance with the Nomination Committee’s charter.
4.1 BOARD OF DIRECTORS
Role of the Board
The Board Charter outlines the roles and responsibilities of the Board. Key responsibilities in summary include:
• determining Silver Chef’s strategic direction;
• evaluating Board performance and determining Board size and composition;
• appointing and determining the duration, remuneration and other terms of appointment of the Chief Executive Officer;
• evaluating the performance of the Chief Executive Officer;
• establishing goals for management and monitoring the achievement of these goals;
• reviewing and approving the Group’s Business Plan;
• approving all significant business transactions including acquisitions, divestments;
• monitoring business risk exposures and risk management systems;
• approving and monitoring financial and other external reporting;
• approving changes to the Group’s capital structure;
• reporting to shareholders; and
• promoting ethical conduct.
Delegated authority
The Constitution and the Board Charter enable the Board to delegate their responsibilities to Committees and management.
The roles and responsibilities delegated to Board Committees are captured in the Charters of each established committee which includes the Audit & Risk Management Committee, Remuneration Committee and Finance Committee and a summary of their activities is included in this report. SI
LVER
CH
EF L
IMIT
ED A
NN
UAL
REP
OR
T 20
17
27
DIR
ECTO
RS’ R
EPO
RT
For
per
sona
l use
onl
y

4.1 BOARD OF DIRECTORS (CONTINUED)
The Board Charter also provides for the Board to delegate to the Chief Executive Officer, who is responsible for the day to day management of the business and the following:
• strategy – implementing corporate strategies and making recommendations on significant strategic initiatives;
• senior management selection – the appointment of senior management, determining their terms of appointment, evaluating performance and maintaining succession plans for senior management roles;
• financial performance – developing the annual budget and managing day to day operations within the budget;
• risk management – maintaining effective risk management frameworks;
• continuous disclosure – keeping the Board fully informed about material developments to enable the Company to keep the market informed; and
• corporate and social responsibility – including compliance with social, ethical and environmental practices.
Board meetings
Meetings are normally held monthly but will number not less than ten in any year, with meeting papers being circulated prior to the meeting. Minutes of meetings are circulated within ten days of the Board meeting.
The Company’s Non-Executive directors only receive fees for their services and the reimbursement of reasonable expenses. The fees are competitively set to attract and retain appropriately qualified and experienced directors.
The directors’ fees available to Non-Executive directors were approved by shareholders at a maximum of $455,000 per annum in the aggregate on the 3 November 2016.
Skills and independence
The Board ensures, in the selection and appointment of proposed Board members, that a diverse range of candidates is considered and may involve professional intermediaries to identify and/or assess candidates.
Together, the Board members have a broad range of relevant financial and other skills and knowledge combined with the extensive experience necessary to guide Silver Chef’s business. Details of their skills and knowledge are set out in section 1 of this report.
The Board assesses the independence of Directors on appointment and at least annually. Each Director provides a regular attestation of their interests and independence. Directors are considered independent if they are independent of management and free from any business or other relationship that could materially interfere with, or reasonably be perceived to materially interfere with, the exercise of unfettered and independent judgment.
At the date of this annual report all Non-Executive directors are considered to be independent except for Mr Allan English, founder and substantial shareholder.
Education
On appointment, Directors are offered an induction program appropriate to their experience to familiarise them with the business, strategy and any current issues before the Board. The Company also promotes continuing education.
Access to information and advice
With the prior approval of the Non-Executive Chairman, which may not be unreasonably withheld or delayed, each Director has the right to seek independent legal and other professional advice concerning any aspect of the Company’s operations or undertakings in order to fulfil their duties and responsibilities as Directors. Any costs incurred are to be borne by the Company.SI
LVER
CH
EF L
IMIT
ED A
NN
UAL
REP
OR
T 20
17
28
For
per
sona
l use
onl
y

4.1 BOARD OF DIRECTORS (CONTINUED)
Composition of the Board
The Company’s Constitution provides that the number of Directors shall not be less than three or more than ten and currently there are five Directors on the Board.
Silver Chef’s Constitution states that at each Annual General Meeting one third of the Directors and any other Director who has held office for three or more years since their last election, must retire. The Constitution also provides that where a Director is appointed by the Board to fill a casual vacancy, that person will stand for election at the Annual General Meeting following their appointment.
The Board is empowered to establish committees of the Board to support it in carrying out its function effectively and where practical, will comprise Board members.
4.2 REMUNERATION COMMITTEE
On behalf of the Board, the Remuneration Committee (Committee) oversees the remuneration of Non-Executive Directors and key management personnel. The Committee has no authority independent of the function delegated to it by the Board, and is to report its findings and recommendations to the Board.
The Charter states that the Committee is to comprise at least three Non-Executive Directors. In the period under review the Committee members were Bede King, Andrew Kemp, Patrick Tapper and Sophie Mitchell. The Company Secretary serves as Secretary to the Committee.
The Charter provides that the Chief Executive Officer attends all Committee meetings except at times where his own arrangements are considered.
In addition to matters dealing with remuneration, the Committee has a broader role including oversight of diversity objectives and succession planning.
External advisors
In performing its role, the Board and the Committee directly commission and receive information, advice and recommendations from independent external advisors to ensure the appropriateness of remuneration packages and contracts of employment for the key management personnel so as to reflect trends in employment markets, and to achieve the objectives of the Group’s remuneration strategy.
4.3 REMUNERATION REPORT – AUDITED
This Remuneration Report sets out the remuneration information relating to the Company’s Directors and Senior Executives who comprise the key management personnel of the Group for the year ended 30 June 2017.
The Board members have a broad range of relevant financial and other skills and knowledge combined with the extensive experience to guide Silver Chef’s business
Non-Executive Directors
Allan English Chairman
Andrew Kemp
Bede King
Sophie Mitchell
Patrick Tapper
Senior Executives
Damien Guivarra Chief Executive Officer (appointed 3 November 2016)
Doug McAlpine Chief Financial Officer
Principles of compensation
Key management personnel (who comprise the Directors and Senior Executives for the Group) have the authority and responsibility for planning, directing and controlling the activities of the Group.
Remuneration levels for key management personnel of the Group are competitively set to attract and retain appropriately qualified and experienced Directors and Senior Executives. The remuneration structures explained below are designed to attract suitably qualified candidates, reward the achievement of strategic objectives, and achieve the broader outcome of creation of value for shareholders. The remuneration structures take into account:
• the capability and experience of the key management personnel; and
• the key management personnel’s ability to control the Group’s performance including:
- the Group’s profit before tax; and
- the growth in earnings per share.
Remuneration packages include a mix of fixed and variable remuneration, and short-term and long-term performance-based incentives.
Fixed remuneration
Fixed remuneration consists of base remuneration (which is calculated on a total cost basis and includes employer contributions to superannuation funds). SI
LVER
CH
EF L
IMIT
ED A
NN
UAL
REP
OR
T 20
17
29
DIR
ECTO
RS’ R
EPO
RT
For
per
sona
l use
onl
y

4.3 REMUNERATION REPORT – AUDITED (CONTINUED)
Remuneration levels are reviewed annually by the Remuneration Committee through a process that considers individual, segment and overall performance of the Group. In addition, external consultants (where appropriate) provide analysis and advice to ensure the Directors’ and Senior Executives’ remuneration is competitive in the market place.
Performance linked remuneration
Performance linked remuneration includes both short-term and long-term incentives, and is designed to reward Senior Executives for meeting or exceeding corporate financial and personal performance objectives and to create alignment with the creation of shareholder value. The short-term incentive (STI) is an ‘at risk’ bonus provided in the form of cash and the long-term incentive (LTI) is also provided in the form of cash.
Short-term incentive bonus
Each year the Remuneration Committee reviews key performance indicators (KPIs) for the broader leadership team. The KPIs generally include measures relating to the Group, the relevant segment, and the individual and include financial, people, customer, strategy and risk which the measures chosen align the individual’s reward to the KPIs of the Group and to its strategy and performance.
The financial performance objectives are ‘profit after tax’ compared to budgeted amounts and earnings per share. The non-financial objectives vary with position and responsibility and include measures such as achieving strategic outcomes, safety performance, customer satisfaction and staff development. In respect of financial years ending 30 June 2016 and 30 June 2017, no discretionary STI was accrued to the Senior Executives.
Also included in the STI is the annual payment of approximately half of any bonus earned under the long-term incentive scheme.
Long-term incentive
Incentives under the LTI are payable based on achieving growth in earnings per share (EPS) in excess of 10% per annum. The level of bonus attainable by members of the scheme increases in steps between the minimum at 10% per annum and is capped at maximum of 20% EPS growth. If greater than 20% compound EPS growth is achieved over a four year period, an eligible employee will earn a maximum LTI bonus equal to 40% of their base remuneration.
50% of any benefit earned is payable each year with the remainder held back to be paid based on achieving compound growth in EPS over a four year period of greater than 10% per annum. The Remuneration Committee recommends the cash incentive to be paid to the individuals for approval by the Board. This method of assessment was chosen as it provides the Committee with an objective assessment of the individual’s performance which is linked directly to shareholder value.
No LTI bonus has been accrued under the LTI scheme for the 2017 financial year and none of the 50% held back in respect of the four year period will be payable as year on year growth in EPS did not exceed 10%.
Short-term and long-term incentive structure
The Remuneration Committee considers that the above performance-linked remuneration structure generates the desired outcome of aligning management’s intentions with shareholders while offering competitive compensation arrangements to attract and retain key staff. The evidence for this is the growth in profits and earnings per share over an extended period.
The financial year ending 30 June 2018 will be the final year of the existing four year LTI scheme. In the coming year the Remuneration Committee intends to review both the short-term and long-term compensation structure for the Company’s Senior Executives and Leadership Team, including whether return on assets is a more appropriate assessment measure.SI
LVER
CH
EF L
IMIT
ED A
NN
UAL
REP
OR
T 20
17
30
For
per
sona
l use
onl
y

Share based incentive
Subject to Board discretion on a year on year basis, a share based incentive scheme is in place for all eligible employees of the Group where employees are gifted shares in Silver Chef subject to meeting profit targets set by the Board. In the FY17 year, the value of the shares gifted in respect of the FY16 financial year was $1,000 (FY15: $1,000) per eligible employee, resulting in the issue of 18,966 shares (FY16: 22,444 shares).
All full-time and permanent part-time employees, including the Senior Executives, who are employed by Silver Chef or its subsidiaries at the date set by the Board in respect of each share offer may participate in the Plan subject to minimum service requirements including twelve months employment with the Company.
Shares issued under the incentive scheme are allotted for a price equal to the volume weighted average price of shares on ASX on the five trading days up to and including the day of issue. The number of shares issued is rounded down to the nearest whole number.
No share based incentive has been earned in respect to the 2017 financial year.
Employment contracts – Senior Executives
On 3 November 2016, Mr Damien Guivarra (previously Chief Operating Officer) commenced in the role of Chief Executive Officer. The Chief Executive Officer has a service agreement which can be terminated with six months’ notice by either party. In the event of termination or resignation, he is entitled to be paid any statutory entitlements to annual and long service leave, if applicable.
The Chief Financial Officer has a service agreement which can be terminated with six months’ notice by either party. In the event of termination or resignation, he is entitled to be paid any statutory entitlements to annual and long service leave, if applicable.
Both the Chief Executive Officer and the Chief Financial Officer are members of the LTI scheme.
A performance-linked remuneration structure generates the desired outcome of aligning management’s intentions with shareholders
Non-Executive Chairman
At the time of the appointment of Mr Guivarra as Chief Executive Officer on 3 November 2016, Mr English’s remuneration returned to that applicable to the Non-Executive Chairman’s position.
In accordance with the terms agreed in March 2015 when his executive role was extended, Mr English was paid 100 per cent of his LTI entitlement each year. The amount in respect of the June 2016 year comprised his entitlement to tier 1 LTI pro rata until he moved to three days per week on 27 January 2016 and tier 2 LTI for the remaining months of the 2016 financial year. No LTI entitlement was earned for the 2017 financial year.
Non-Executive Directors
4.3 REMUNERATION REPORT – AUDITED (CONTINUED)
Consequences of performance on shareholder wealth
In considering the Group’s performance and benefits for shareholder wealth, the Board reviewed the following data in respect of the current financial year and the previous four financial years.
2017 2016 2015 2014 2013
Net profit after tax $’000 20,245 22,356 15,531 12,701 11,449
Basic earnings per share (EPS) (cents) 55.3 68.6 51.4 43.4 41.5
Dividends paid $’000 13,437 11,566 9,458 8,286 7,704
Closing share price at year end $7.47 $10.72 $8.03 $5.07 $7.38
Total remuneration for Non-Executive Directors has been set at a maximum of $455,000 in the aggregate, which was approved at the Annual General Meeting held on 3 November 2016.
Directors’ fees cover all Board activities including attendance at committee meetings of the Board.
SILV
ER C
HEF
LIM
ITED
AN
NUA
L R
EPO
RT
2017
31
DIR
ECTO
RS’ R
EPO
RT
For
per
sona
l use
onl
y

4.3 REMUNERATION REPORT – AUDITED (CONTINUED)
Remuneration of key management personnel
Details of the nature and amount of each major element of remuneration for each of the key management personnel are:
In dollars
Short-term Long-term Post employment Share based
Total
Proportion of remuneration performance
related
S300A Value of options as proportion
of remuneration %Salary &
fees
Non-monetary benefits
STI cash bonus
Long service leave
LTI cash bonus Superannuation
Termination benefits
Options, rights, shares and units
Non-Executive Chairman
Allan English1 2017 192,297 - - - - 20,770 - - 213,067 0% -
2016 495,726 - 55,000 - - 34,999 - - 585,725 9% -
Non-Executive Directors
Andrew Kemp 2017 62,500 - - - - - - - 62,500 - -
2016 50,000 - - - - - - - 50,000 - -
Bede King 2017 62,500 - - - - - - - 62,500 - -
2016 50,000 - - - - - - - 50,000 - -
Sophie Mitchell 2017 57,078 - - - - 5,422 - - 62,500 - -
2016 45,662 - - - - 4,338 - - 50,000 - -
Patrick Tapper 2017 57,078 - - - - 5,422 - - 62,500 - -
2016 41,974 - - - - 3,987 - - 45,961 - -
Non-Executive Chairman 2017 192,297 - - - - 20,770 - - 213,067 - -
2016 495,726 - 55,000 - - 34,999 - - 585,725 - -
Non-Executive Directors 2017 239,156 - - - - 10,844 - - 250,000 - -
2016 187,636 - - - - 8,325 - - 195,961 - -
Senior Executives
Damien Guivarra CEO (appointed 3 November 2016)
2017 470,341 - - (46,000)2 36,899 - - 461,240 0% -
2016 280,384 - 50,000 - 46,000 26,636 - - 403,020 24% -
Doug McAlpine CFO 2017 374,260 - - - (34,000)2 26,981 - - 367,241 0% -
2016 336,550 - 36,000 - 34,000 37,130 - - 443,680 16% -
Total Senior Executives Remuneration
2017 844,601 - - - (80,000) 63,880 - - 828,481 - -
2016 616,934 - 86,000 - 80,000 63,766 - - 846,700 - -
1 Reported remuneration for Allan English includes salaries paid in his capacity as Executive Chairman up to 3 November 2016.2 The prior year LTI accrual was reversed in FY17 as Management have assessed it unlikely that any held back amounts will be payable due to year
on year EPS growth of 10% not being achieved.
Analysis of bonuses included in remuneration – audited
Short-term incentive bonus
Long-term incentive bonus Total
Vested in year Deferred
Damien Guivarra - - -
Doug McAlpine - - -
Due to the financial performance of the Company for the year ended 30 June 2017, no Senior Executives earned incentives under either the STI or LTI schemes described above.
SILV
ER C
HEF
LIM
ITED
AN
NUA
L R
EPO
RT
2017
32
For
per
sona
l use
onl
y

4.3 REMUNERATION REPORT – AUDITED (CONTINUED)
Remuneration of key management personnel
Details of the nature and amount of each major element of remuneration for each of the key management personnel are:
In dollars
Short-term Long-term Post employment Share based
Total
Proportion of remuneration performance
related
S300A Value of options as proportion
of remuneration %Salary &
fees
Non-monetary benefits
STI cash bonus
Long service leave
LTI cash bonus Superannuation
Termination benefits
Options, rights, shares and units
Non-Executive Chairman
Allan English1 2017 192,297 - - - - 20,770 - - 213,067 0% -
2016 495,726 - 55,000 - - 34,999 - - 585,725 9% -
Non-Executive Directors
Andrew Kemp 2017 62,500 - - - - - - - 62,500 - -
2016 50,000 - - - - - - - 50,000 - -
Bede King 2017 62,500 - - - - - - - 62,500 - -
2016 50,000 - - - - - - - 50,000 - -
Sophie Mitchell 2017 57,078 - - - - 5,422 - - 62,500 - -
2016 45,662 - - - - 4,338 - - 50,000 - -
Patrick Tapper 2017 57,078 - - - - 5,422 - - 62,500 - -
2016 41,974 - - - - 3,987 - - 45,961 - -
Non-Executive Chairman 2017 192,297 - - - - 20,770 - - 213,067 - -
2016 495,726 - 55,000 - - 34,999 - - 585,725 - -
Non-Executive Directors 2017 239,156 - - - - 10,844 - - 250,000 - -
2016 187,636 - - - - 8,325 - - 195,961 - -
Senior Executives
Damien Guivarra CEO (appointed 3 November 2016)
2017 470,341 - - (46,000)2 36,899 - - 461,240 0% -
2016 280,384 - 50,000 - 46,000 26,636 - - 403,020 24% -
Doug McAlpine CFO 2017 374,260 - - - (34,000)2 26,981 - - 367,241 0% -
2016 336,550 - 36,000 - 34,000 37,130 - - 443,680 16% -
Total Senior Executives Remuneration
2017 844,601 - - - (80,000) 63,880 - - 828,481 - -
2016 616,934 - 86,000 - 80,000 63,766 - - 846,700 - -
1 Reported remuneration for Allan English includes salaries paid in his capacity as Executive Chairman up to 3 November 2016.2 The prior year LTI accrual was reversed in FY17 as Management have assessed it unlikely that any held back amounts will be payable due to year
on year EPS growth of 10% not being achieved.
Analysis of bonuses included in remuneration – audited
Short-term incentive bonus
Long-term incentive bonus Total
Vested in year Deferred
Damien Guivarra - - -
Doug McAlpine - - -
Due to the financial performance of the Company for the year ended 30 June 2017, no Senior Executives earned incentives under either the STI or LTI schemes described above.
SILV
ER C
HEF
LIM
ITED
AN
NUA
L R
EPO
RT
2017
33
DIR
ECTO
RS’ R
EPO
RT
For
per
sona
l use
onl
y

4.3 REMUNERATION REPORT – AUDITED (CONTINUED)
Movements in shares
The movement during the reporting period in the number of ordinary shares in Silver Chef Limited held, directly, indirectly or beneficially, by each key management person, included their related parties, is as follows:
2017
Held 1 July 2016 Purchased
Options exercised
Employee share
scheme Sold
Dividend reinvestment
planRights Issue
Held 30 June
2017
Directors
Allan English 8,941,341 - - - (100,000) - - 8,841,341
Andrew Kemp 1,008,672 - - - (122,374) - 10,711 897,009
Bede King 93,300 5,000 - - - 2,303 8,384 108,987
Sophie Mitchell 25,792 - - - - 637 2,203 28,632
Patrick Tapper 10,183 - - - - - 849 11,032
Senior Executives
Damien Guivarra 31,391* - - 87 - 757 - 32,235
Doug McAlpine 124 - - 87 - - - 211
*Opening balance restated to reflect share registry records
In the view of the Company, these transactions do not compromise the independence of the named directors.
The aggregate amount recognised during the year relating to Directors and their personally-related entities, amounted to $621,753 (2016: $768,882). Details of the transactions are as follows:
Transaction2017
$2016
$
Bede King
Legal advice
96,8221 102,3231
Sophie Mitchell
Management and underwriting fees
524,9312 666,5592
621,753 768,882
1. Legal fees paid to Tobin King Lateef, a law firm in which Bede King is a partner. Services provided were on commercial terms as one of the Company’s panel of legal firms.
2. Fees paid to Morgans, a company in which Sophie Mitchell is a director, for services provided jointly with Wilsons Corporate Finance Ltd, arising from capital raising and on commercial terms.
4.4 AUDIT AND RISK MANAGEMENT COMMITTEE
The Board delegates oversight responsibility for risk management to the Audit and Risk Management Committee (“ARM Committee”).
Individual Directors and Executives compensation disclosures
Apart from the details disclosed in this report, no Director has entered into a material contract with the Group since the end of the previous financial year and there were no material contracts involving Directors’ interests existing at year-end.
During FY17, the Group sold a number of assets to an entity associated with Mr Allan English that had been returned from a cancelled rental contract. The returned assets were sold by the Company at their written down value at the time of sale and an independent valuation report was sought to ensure the transaction was considered at arm’s length.
Key management personnel and Director transactions
Directors, or their related entities, hold or held positions in other entities that result in them having control or significant influence over the financial or operating policies of those entities. These entities transacted with the Group in the reporting period in relation to legal advice and capital raising in the normal course of business and reflect long standing relationships between the Group and those entities. The terms and conditions of those transactions were no more favourable than those available, or which might reasonably be expected to be available, on similar transactions to unrelated entities on an arm’s length basis. SI
LVER
CH
EF L
IMIT
ED A
NN
UAL
REP
OR
T 20
17
34
For
per
sona
l use
onl
y

our people are what drive our business and our
investment in them is fundamental to our success and theirs
35
DIR
ECTO
RS’ R
EPO
RTSI
LVER
CH
EF L
IMIT
ED A
NN
UAL
REP
OR
T 20
17
For
per
sona
l use
onl
y

4.4 AUDIT AND RISK MANAGEMENT COMMITTEE (CONTINUED)
The purpose of the ARM Committee is to advise on the establishment and maintenance of a framework of internal control and appropriate ethical standards for the management of Silver Chef. The ARM Committee operates with the primary objective to assist the Board of Directors in fulfilling the Board’s responsibilities relating to the accounting, reporting and financial risk management practices of the Company.
The specific recommendation issued by the ASX Corporate Governance Council specifies that an ARM Committee comprise at least three Directors, all of whom are Non-Executive Directors, and a majority of whom are independent.
At the date of this report, the members of the Company’s ARM Committee were Andrew Kemp, Bede King and Sophie Mitchell. The Company Secretary serves as Secretary to the Committee. In fulfilling their objectives, the ARM Committee meets at least four times each year. The main duties and responsibilities of the committee include:
• internal control framework including management information systems including oversight of the internal audit function;
• assessing corporate risk compliance with internal controls;
• management processes supporting external reporting;
• review of financial statements and other financial information distributed externally;
• review of the effectiveness of the external audit function;
• review of the performance and independence of the external auditors;
• review of the external audit function to ensure prompt remedial action by management, where
appropriate, in relation to any deficiency in or breakdown of controls;
• assessing the adequacy of external reporting for the needs of shareholders;
• monitoring compliance with the Company’s code of ethics;
• monitoring the procedures to ensure compliance with the Corporations Act 2001, the ASX Listing Rules and all other regulatory requirements; and
• addressing any matters outstanding with auditors, Australian Tax Office, Australian Securities Exchange, Australian Securities and Investments Commission and other regulators.
Operating and reporting
Meetings of the ARM Committee are held quarterly with two meetings being focused on financial reporting to coincide with annual and half year financial reporting and the other two meetings are dedicated to matters relating to risk management.
The Charter provides that the Chief Executive Officer and the Chief Financial Officer attend the ARM Committee meetings in an ex-officio capacity and external auditors are invited to attend all meetings. All Directors receive Committee papers and may also attend meetings on an ad hoc basis.
Prior to signing the Group’s 2017 annual financial statements, Silver Chef’s Chief Executive Officer and Chief Financial Officer report in writing to the ARM Committee that:
• the statement given in accordance with ASX Corporate Governance Council’s principles 7.2 and 7.3 and Section 295 of the Corporations Act 2001 is founded on a sound system of risk management and internal compliance and control which implements the policies adopted by the Board; and
• the Company’s risk management and internal compliance and control framework is operating efficiently and effectively in relation to financial risks.SI
LVER
CH
EF L
IMIT
ED A
NN
UAL
REP
OR
T 20
17
36
For
per
sona
l use
onl
y

4.5 FINANCE COMMITTEE
At the date of this report, the members of the Company’s Finance Committee are Sophie Mitchell, Bede King and Andrew Kemp. Other Directors attend on an ad hoc basis. Members are required to be financially literate and include at least one, and preferably two, member(s) with past employment experience in finance.
The Charter provides that the Chief Executive Officer and the Chief Financial Officer attend all meetings of the Committee together with such other executives and management as may be invited by the Committee. The Company Secretary serves as Secretary to the Committee.
The Finance Committee has responsibility for the following in respect of Silver Chef and its subsidiaries from time to time, or as required:
(a) considering and making recommendations to the Board concerning the formulation and monitoring of the Company’s capital management strategy, including dividend payment strategies;
(b) considering the Company’s funding requirements and making recommendations to the Board concerning specific funding proposals;
(c) monitoring borrowings from financial institutions and compliance with borrowing covenants;
(d) formulating, approving and monitoring policies in relation to capital structure, treasury practices (cash management, payments processing and bank account administration) and the management of credit, debt structure, liquidity and market risks (interest rates, currency and commodity) assumed by the Company in the course of carrying on its business;
(e) reviewing and making recommendations to the Board in relation to financial risks and exposure resulting from movements in interest rates and exchange rates, including the extent and methods of financial risk mitigation through hedging;
(f) considering and reporting to the Board on such other matters as the Board may refer to the Committee from time to time; and
(g) reviewing all ASX releases, broker presentations and releases containing any financial results or indicative forecasts.
4.6 RISK MANAGEMENT
Quantitative disclosures are included throughout these consolidated financial statements in relation to the Group’s exposure to risks, their objectives, policies and processes for measuring and managing risk and their management of capital.
Risk management approach
The approach to assessing risk is by identifying and managing risks that affect the business and enables
the risks to be balanced against appropriate rewards and reflects our values, objectives and strategies. The Company has established policies for the oversight and management of our material business risks.
Risk management framework
The Board of Directors has overall responsibility for the establishment and oversight of the risk management framework. The Board has established the ARM Committee, which is responsible for developing and monitoring risk management policies and the committee reports regularly to the Board of Directors on its activities.
Risk management policies are established to identify and analyse the risks faced by the Group, set appropriate risk limits and controls, and monitor risks and adherence to limits which are reviewed regularly to reflect changes in market conditions and the Group’s activities. The Group, through their training and management standards and procedures, aim to develop a disciplined and constructive control environment in which all employees understand their roles and obligations.
The ARM Committee oversees how management monitors compliance with the Group’s risk management policies and procedures and reviews the adequacy of the risk management framework in relation to the risks faced by the Group.
Responsibility for control and risk management is delegated to the appropriate level of management within the Group with the Chief Executive Officer and Chief Financial Officer having ultimate responsibility to the Board for the Group’s risk management and internal control activities.
Arrangements put in place by the Board to monitor risk management include:
Regular reporting to the Board in respect of operations and the financial position of the Group
Reports by the Chairman of the ARM Committee and circulation to the Board of the minutes of each meeting held by the ARM Committee
Reports to the Board from the internal auditor on internal controls
Presentations made to the Board throughout the year by appropriate members of the Group’s Leadership Team (and/or independent advisers, where necessary) on the nature of particular risks and details of the measures which are either in place or can be adopted to manage or mitigate the risk
Any Director may request that operational and project audits be undertaken by management
SILV
ER C
HEF
LIM
ITED
AN
NUA
L R
EPO
RT
2017
37
DIR
ECTO
RS’ R
EPO
RT
For
per
sona
l use
onl
y
4.6 RISK MANAGEMENT (CONTINUED)
The Group’s financial instruments comprise receivables, payables, bank loans, finance leases, cash and interest rate swaps. Further details of the Group’s policies relating to interest rate management, liquidity risk management, market risk management and credit risk management are included in note 5.0 to the consolidated financial statements.
Operational risk
Operational risk arises from direct or indirect loss from a wide variety of causes associated with the Group’s processes, personnel, technology and infrastructure, external factors other than credit, and market and liquidity risks such as those arising from legal and regulatory requirements and generally accepted standards of corporate behaviour. Operational risks can arise from all of the Group’s operations.
The Group’s objective is to manage operational risk to balance the avoidance of financial losses and damage to the Group’s reputation with overall cost effectiveness and to minimise control procedures that restrict initiative and creativity.
The primary responsibility for the development and implementation of controls to address operational risk is assigned to senior management and is supported by the development of overall Group standards for the management of operational risk in the following areas:
• requirements for appropriate segregation of duties, including the independent authorisation of transactions;
• requirements for the reconciliation and monitoring of transactions;
• compliance with regulatory and other legal requirements in all jurisdictions;
• documentation of controls and procedures;
• requirements for the periodic assessment of operational risks faced, and the adequacy of
controls and procedures to address the risks identified;
• requirements for the reporting of operational losses and proposed remedial action;
• development of contingency plans;
• training and professional development;
• ethical and business standards; and
• risk mitigation, including insurance.
4.7 ETHICAL STANDARDS
Code of conduct and principles for doing business
The Board encourages the highest standards of ethical conduct by all Directors and employees of the Group and has adopted a Code of Ethics that sets out the principles and standards with which all Group officers and employees are expected to comply in the performance of their respective functions and which include:
• comply with the law;
• act honestly and with integrity;
• reduce the opportunity for situations to arise which result in divided loyalties or conflicts of interest;
• ensure there is responsibility and accountability for individuals for reporting and investigating reports of unethical practices;
• use Silver Chef’s assets responsibly and in the best interests of Silver Chef shareholders; and
• be responsible and accountable for their actions.
Policies for reporting unethical practices and legal obligations are contained in the Company’s Corporate Governance Charter. SI
LVER
CH
EF L
IMIT
ED A
NN
UAL
REP
OR
T 20
17
38
For
per
sona
l use
onl
y

4.8 DIVERSITY
The Board is committed to having an appropriate blend of diversity in all levels of the organisation including for its Key Management Personnel. The Board has established a policy regarding gender, age, ethnic and cultural diversity. The key elements of the diversity policy are to work towards:
• ensuring that the most suitable candidate for the role is appointed whilst ensuring that no gender or other bias influences the appointment of any candidate to any role; and
• an annual assessment by the Board of performance against the objectives.
The Board has established a policy regarding gender, age, ethnic and cultural diversity
Gender representation June 2017 June 2016
Female % Male % Female % Male %
Board representation 20% 80% 20% 80%
Leadership Team representation 17% 83% 20% 80%
Group representation 54% 46% 53% 47%
4.9 TRADING IN SILVER CHEF SHARES
Under the Company’s Securities Trading Policy all employees (including Directors) may only buy and sell Silver Chef shares in accordance with the Policy which specifically states that Silver Chef employees are prohibited from buying and selling Silver Chef shares at any time if they are aware of any price sensitive information that has not been made public and during periods when a trading blackout applies.
4.10 COMMUNICATION WITH SHAREHOLDERS
Silver Chef has in place procedures to ensure a level of disclosure that provides all investors with equal, timely, balanced and meaningful information.
The Company Secretary is accountable for the compliance with ASX Listing Rules and the Chief Executive Officer and Chief Financial Officer are responsible for monitoring the Company’s activities in light of its continuous disclosure policy and where necessary discussing disclosure obligations with the Company Secretary and the Board.
The Group encourages communication with shareholders and other stakeholders in an open, regular and timely manner so that the market has sufficient information to make informed investment decisions on the operations and results of the Group.
Shareholders are encouraged to attend and actively participate in Silver Chef’s Annual General Meeting, and at the time of receipt of the Notice of Meeting, shareholders are invited to put forward questions that they would like addressed at that meeting.
5. PRINCIPAL ACTIVITIESThe principal activity of the Group is the rental and financing of commercial equipment. There have been no changes in the nature of those activities during the year.
Mechanisms employed to ensure open and timely communications include:
Regular shareholder communications such as half-yearly reports and the full financial report
Financial results presentations at the Company’s Annual General Meeting
Shareholder access to communications through Silver Chef’s website
Utilising Boardroom Pty Limited, the Group’s share registry service provider
SILV
ER C
HEF
LIM
ITED
AN
NUA
L R
EPO
RT
2017
39
DIR
ECTO
RS’ R
EPO
RT
For
per
sona
l use
onl
y

Growth in the New Zealand and Canadian rental asset bases during the year was encouraging given their relatively small starting positions. Domestic growth in the hospitality business exceeded expectations on the back of strong industry level expansion in the Company’s key channels of restaurants, cafes and bars. The coffee channel and the franchise customer base also performed strongly during the year.
EBITDA contribution as a percentage of asset cost improved slightly year on year reflecting improved utilisation of the Company’s asset base and rental yield pick-up in GoGetta. Encouragingly the EBITDA improvement is calculated after increased bad debt and asset loss provisioning in the GoGetta business. The Company also benefitted from more efficient leveraging of the Company’s overhead structure arising from system efficiencies.
GoGetta revenue grew 40% from $89.5 million to $125.1 million. The rate of revenue growth slowed in response to a more sustainable rate of origination growth when compared with FY16. Net growth in the rental asset base for the year was 14%. The Company deliberately moderated growth in the GoGetta book as it implemented actions to improve average credit quality and contract length. The majority of the growth reduction came from significantly reduced participation in the light commercial channel where we experienced very poor average credit quality.
Bad debts and asset impairment costs increased in FY17 largely as a consequence of growth in the GoGetta book, but also reflecting the need for additional provisioning against aged arrears positions in the GoGetta business. The GoGetta arrears position has grown substantially, but generally in line with growth in the underlying rental asset base. The Company has taken a more conservative position in respect of provisioning for bad debts and impairment of suspended assets in the GoGetta business. From a credit perspective, the hospitality business performed in line with historical trends.
Pleasingly, operating expense growth including personnel expenses was lower than both asset base and revenue growth, reflecting improvement in overhead leverage. This is after taking into account overhead investment in Canada in advance of asset base growth.
6. OPERATING AND FINANCIAL REVIEWSilver Chef Limited (referred to in this report as either “the Company” or “the Group”) is a commercial equipment rental and financing company which provides flexible equipment funding solutions to small and medium sized businesses. The Group operates through two main segments:
• Silver Chef (Hospitality) which provides commercial equipment rental and financing solutions to small and medium sized businesses in the hospitality industry. Customer sectors in the Hospitality business include coffee shops, takeaway stores, independently owned restaurants and franchises. Silver Chef operates in Australia, New Zealand and Canada.
• GoGetta which provides commercial equipment rental and financing solutions to small and medium sized businesses in industries other than the hospitality industry. GoGetta was formed in 2007 to diversify the Group’s industry exposure. GoGetta provides flexible funding solutions to a range of industry sectors. The majority of the Group’s customers operate in the transport and construction sectors. GoGetta operates only in Australia.
FINANCIAL PERFORMANCE
The Group delivered net profit after tax of $20.2 million. The result includes a $2.3m after tax asset write off in relation to a co-ordinated fraud incident as reported in the half year result. After adjusting for this one-off expense item the net profit after tax for the year is $22.5 million, being in line with the previous corresponding period.
Group revenue for the 2017 financial year increased by 29% on the previous corresponding period, driven by a 22% growth in the group’s average rental asset base, including long term finance leases and an increase in the effective yield of the GoGetta portfolio as a consequence of a rental rate increase. The Group continued to realise high utilisation of its rental asset base with assets subject to the reconditioning process constituting less than 10% of the total rental asset base.
Hospitality revenue grew 24% from $125.5 million to $155.3 million. Of this revenue, $22.0 million was generated by contracts in New Zealand and Canada.
SILV
ER C
HEF
LIM
ITED
AN
NUA
L R
EPO
RT
2017
40
For
per
sona
l use
onl
y

groUp revenue for the
2017 financIal year increased by 29% on the previous
corresponding period
41
DIR
ECTO
RS’ R
EPO
RTSI
LVER
CH
EF L
IMIT
ED A
NN
UAL
REP
OR
T 20
17
For
per
sona
l use
onl
y

FINANCIAL PERFORMANCE (CONTINUED)
Key financial performance information2017
$000’s2016
$000’s2015
$000’s2014
$000’s
Rental income 263,259 203,608 162,952 138,631
Lease interest 22,614 17,393 8,028 2,586
Other income 152 81 35 109
Total revenue 286,025 221,082 171,015 141,326
Depreciation and amortisation expense (134,223) (94,914) (70,194) (62,189)
Loss on sale of rental assets (9,181) (9,128) (6,089) (5,405)
Impairment of rental assets (16,290) (8,807) (6,716) (6,274)
Bad debt expense (12,623) (6,248) (4,504) (1,564)
Expenses from ordinary activities (34,049) (26,779) (27,974) (22,754)
Employee expenses (38,063) (32,211) (25,470) (18,258)
Finance costs (13,254) (11,155) (7,779) (6,950)
Profit before income tax expense 28,342 31,840 22,289 17,932
Income tax expense (8,097) (9,484) (6,758) (5,231)
Profit for the year 20,245 22,356 15,531 12,701
Basic earnings per share 55.3 cents 68.6 cents 51.4 cents 43.4 cents
RENTAL ASSET BASE
The key drivers of the Group’s revenue are the growth and high utilisation of its rental assets and the growth of its long term rental contracts, recognised as finance leases, as illustrated below:
Rental assets and lease receivables2017
$000’s2016
$000’s2015
$000’s2014
$000’s
Hospitality rental assets at cost*
Australia 259,605 219,185 191,543 187,672
New Zealand 24,996 18,105 12,063 8,863
Canada 25,340 14,544 6,601 894
Hospitality lease receivables 72,316 46,205 18,677 5,376
Total Hospitality rental assets and lease receivables 382,257 298,039 228,884 202,805
GoGetta rental assets at cost* 247,798 222,110 117,619 90,094
GoGetta lease receivables 27,210 19,096 12,390 6,083
Total GoGetta rental assets and lease receivables 275,008 241,206 130,009 96,177
Total Group rental assets and lease receivables 657,265 539,245 358,893 298,982
*Rental assets at costs include capitalised upfront costs of lease origination.
Growth in the Hospitality rental asset base and lease receivables were above expectations and in total represent an increase of 28% since 30 June 2016. This growth has in part been achieved by growth in the Company’s New Zealand and Canadian operations, but also improvement in average contract durations as a consequence of successfully converting customers to longer term finance lease arrangements after their initial twelve-month rental contract.
As noted above, GoGetta growth was strong, even after deliberate moderation through increased credit criteria.
CASH FLOWS AND WORKING CAPITAL
The Group continues to generate strong operating cash flow which is primarily reinvested in the Group’s asset base. Asset funding is supplemented through debt and new equity raisings. Net operating cash flow grew by 28% to $152.9 million in line with growth in revenue and EBITDA. SI
LVER
CH
EF L
IMIT
ED A
NN
UAL
REP
OR
T 20
17
42
For
per
sona
l use
onl
y

CASH FLOWS AND WORKING CAPITAL (CONTINUED)
Working capital deteriorated slightly year on year as a consequence of growth in the Company’s arrears position linked to GoGetta. The working capital cycle associated with our customers in the transport and construction channels is inherently more volatile than that historically experienced in the hospitality business
resulting in a higher level of arrears. At 30 June 2017 these arrears are appropriately provisioned in respect of our expectations of credit related losses. The Company continues to work with its customers to ensure we are providing them with the appropriate support during the critical early stages of their small businesses without exposing Silver Chef to an unsustainable level of credit losses.
Key cash flow information2017
$000’s2016
$000’s2015
$000’s2014
$000’s
Net operating cash flow 152,870 119,741 103,290 89,402
Cash from the sale of rental assets 78,732 58,272 48,287 35,064
Cash paid for new rental assets (309,472) (305,003) (175,367) (137,675)
Dividends paid (12,128) (10,877) (7,606) (6,891)
Net proceeds from borrowings 65,474 110,636 32,000 17,457
Proceeds from the issue of shares 28,508 35,358 9,000 3,658
CAPITAL MANAGEMENT
Gross assets at 30 June 2017 totalled $540.2 million, with gearing at 65%. The Company extended its senior syndicated banking facility by $100 million to a total of $398 million of which there was $81.2 million of headroom at year end. This provides the Company with significant funding headroom as it transitions to a securitised funding model in FY18.
The Company is now in advanced stages of documentation and senior syndicate approval for the implementation of a $200 million securitisation warehouse facility. All parties are working toward execution of relevant documentation. Successful performance of the securitisation structure will see a significant reduction to senior debt gearing levels during FY18 and a lower level of reliance on new equity to finance the Company’s growth targets over the coming years.
The facility permits funding of new originations of Silver Chef and GoGetta rental contracts, and will also be used to purchase the Company’s existing book of finance leases in the first instance, allowing a significant reduction to senior debt levels on first draw. Once implemented, the securitisation facility will enable the business to finance eligible contract originations to an initial maximum gearing of 80% on asset cost on a limited recourse basis. Final pricing for the securitisation warehouse structure will be established closer to financial close on the transaction.
A share placement was made on 16 September 2016 to existing and new shareholders, which raised an additional $7.5 million of equity capital. An entitlement offer announced on 21 March 2017 raised a further $21 million of equity capital.
The Company is now in advanced stages of documentation and senior syndicate approval for the implementation of a $200 million securitisation warehouse facility
Funds from these placements were used to fund growth in the Company’s rental asset base, and to maintain gearing at a conservative level as the Company transitions to securitisation funding.
RISKS
The Company is subject to the risks of operating in the rental finance industry including general economic conditions, competitive pressures, credit risk, residual asset equipment risk and capital availability.
Credit risk is the risk that customers will not pay amounts due on time and will default. The Group uses a combination of product design and business process to manage this risk. These include:
• Receiving rental payments weekly in advance, by direct debit. This allows the credit teams to identify issues early if a customer begins to default
SILV
ER C
HEF
LIM
ITED
AN
NUA
L R
EPO
RT
2017
43
DIR
ECTO
RS’ R
EPO
RT
For
per
sona
l use
onl
y

RISKS (CONTINUED)
• Receiving a security bond from the majority of customers at the beginning of the contract. This bond is used to offset any overdue amounts owed if the customer defaults
• The Group seeks to work with small business and their cash flow commitments. However if a contract remains in arrears for over six weeks, appropriate recovery action is implemented
• The Group tendered its outsourced collection arrangements during the year and now has more effective service agreements and key performance indicators in place with higher quality counterparties which will result in better collection performance moving forward.
Residual asset risk is the risk that assets cannot be recovered from defaulting contracts and written off or where the assets are returned from contracts and are not to be effectively remarketed. The Group uses a number of means to manage this risk including:
• Retaining title over its rental assets and registering its rental assets on the Personal Property Securities Register
• Managing any returned hospitality assets through one of the Group’s service facilities, where assets are cleaned, serviced and remarketed through direct sale or placing the asset back onto a new rental contract
• The Group tendered its outsourced asset repossession arrangements during the year and now has more effective service agreements and key performance indicators in place with higher quality counterparties which will result in better asset recovery performance moving forward
• GoGetta assets which are returned or repossessed are managed through established relationships in the vendor network.
FRAUD AND CYBER CRIME
Similar to other participants in the financial services sector, the Company is subject to the risk of identity and credit application fraud with such events leading to the Company’s ability to realise its rights under rental contracts and may impact the recoverability of capital. To mitigate this risk, the Company:
• Uses third party customer evaluation software to give insight into financial behaviour and to verify customer identity information against an existing bank account
• Conducts a comprehensive assessment of equipment vendor partners prior to settling transactions documents with customers
• Uses internal audit and risk resources to review and make regular recommendations to improve risk control processes
• Works with underwriters on an ongoing basis to improve responsiveness of fraud/crime insurance coverage.
ACCESS TO CAPITAL
Silver Chef’s growth plans are dependent upon access to debt and equity capital. Such capital may not be available to Silver Chef on reasonable terms which could adversely affect Silver Chef’s profitability or have a dilutive effect on shareholders. To mitigate against this risk, the Company:
• Has significant headroom in its senior secured debt facility
• Is generating substantial internal operating cash-flow which is reinvested into the Company’s rental asset base
• Is advanced in delivering a long term wholesale debt funding solution (securitisation warehouse) as part of its wider capital diversification strategy.SI
LVER
CH
EF L
IMIT
ED A
NN
UAL
REP
OR
T 20
17
44
For
per
sona
l use
onl
y

COMPLIANCE WITH REGULATORY OBLIGATIONS
Silver Chef is committed to acting ethically and applying responsible lending practices as part of its business to business lending model so that it continues to successfully support its customers. The regulatory environment for financial services businesses changes rapidly and with the assistance of its advisors, the Company assesses the relevance of those changes to the Company’s business model, contracts and work processes. Silver Chef must also monitor the wider legal and regulatory frameworks applicable to its people, taxation, workplace health and safety and the environment, in all of the geographic jurisdictions in which the business operates. Accountability for mitigation of this risk rests with the senior leadership team and the Company’s risk management function.
STRATEGY AND OUTLOOK
Management believes that the long-term outlook for domestic growth for both the Silver Chef and GoGetta brands remains positive. Expansion in Canada will continue and strong growth is forecast in its rental asset base again in FY18. In the short term, improvement to yield and average credit quality in GoGetta will create a continued improvement to both return on capital and underlying accounting earnings.
Management believes that the long-term outlook for domestic growth for both the Silver Chef and GoGetta brands remains positive
The Company is conscious that there are ongoing challenges associated with managing the existing portfolio of GoGetta contracts. As previously noted, this portfolio is comprised of a mixture of credit qualities that improved significantly after March 2016. The portion of the Company’s asset base in the GoGetta business which is underperforming from a credit perspective is being actively managed with a view to contracts either being paid out or assets being returned and re-deployed as a matter of priority. However, due to the volume of assets subject to this exercise, particularly in the light commercial channel, there is a significant cost burden associated with managing accelerated repossessions and redeployment of that capital. The financial impact of this activity is difficult to estimate, as it is dependent on the timing and condition of assets which are returned.
7. DIVIDENDSDividends paid or declared by the Company to members since the end of the previous year were:
TypeCents
per shareTotal amount
$Date of
payment
Declared and paid during the yearFinal dividend – 2016 25.0 8,787,916 16 September 2016Interim dividend – 2017 12.9 4,648,908 31 March 2017
13,436,824Proposed payment
Dividend declared – after year-end 25.1 9,799,793 2 October 2017
8. EVENTS SUBSEQUENT TO REPORTING DATEA dividend of 25.1 cents per share, fully franked was declared by the Directors on 28 August 2017. The dividend has not been provided for in the 30 June 2017 financial report. The Dividend Reinvestment Plan has been reinstated.
SILV
ER C
HEF
LIM
ITED
AN
NUA
L R
EPO
RT
2017
45
DIR
ECTO
RS’ R
EPO
RT
For
per
sona
l use
onl
y

9. DIRECTORS’ INTERESTSThe relevant interests of each Director in the shares issued by the Company as notified by the Directors to Australian Securities Exchange in accordance with section 205G (1) of the Corporations Act 2001, at the date of this report is:
Name Ordinary sharesAllan English English Family Foundation Pty Ltd <English Family Foundation A/C> 4,550,000Tessana Pty Ltd <A English Family A/C> 3,999,956Tessana Pty Ltd < Tessana Superannuation Fund > 291,385
8,841,341Andrew Kemp Huntington Group Pty Ltd 132,130Huntington Group Pty Ltd <S Account> 432,167Huntington Investment Services Pty Ltd 227,159Manco (Aust) Pty Ltd 7,068A P & A Kemp 98,485
897,009Bede King BF King & HJ King <King Superannuation Plan> 108,987Sophie Mitchell Mitchelldangar Pty Ltd 28,632Patrick TapperTapper Super Fund Pty Ltd <Tapper SMSF A/C> 11,032
Each of the persons listed above has a beneficial interest or an interest through an association in the shares registered in entities associated with each of the Directors.
10. SHARE OPTIONS
OPTIONS GRANTED BY SILVER CHEF LIMITED TO DIRECTORS AND OFFICERS OF THE COMPANY
During the financial year, no options on ordinary shares were granted by the Company.
UNISSUED ORDINARY SHARES UNDER OPTION ISSUED BY SILVER CHEF LIMITED
At the date of this report there were no unissued shares of the Company under option.
11. INDEMNIFICATION AND INSURANCE OF OFFICERS AND AUDITORSThe Company has agreed to indemnify the Directors and Senior Executives of the Company and its controlled entities against all liabilities to another person (other than the Company or a related body corporate) that may
arise from their positions as Directors and Officers of the Company and its controlled entities, except where the liability arises out of conduct involving a lack of good faith. The agreement stipulates that the Company will meet the full amount of any such liabilities, including costs and expenses.
INSURANCE PREMIUMS
Company pays insurance premiums in respect of Directors’ and Officers’ liability and legal expense insurance contracts, for current and former Directors and Officers, including Senior Executives of the Company and Directors of its controlled entities. The premium and level of cover of this policy is deemed to be confidential and not disclosed in this report.
The insurance premiums relate to:
• Costs and expenses incurred by the relevant Officers in defending proceedings, whether civil or criminal and whatever their outcome; and
• Other liabilities that may arise from their position, with the exception of conduct involving willful breach of duty or improper use of information or position to gain a personal advantage.SI
LVER
CH
EF L
IMIT
ED A
NN
UAL
REP
OR
T 20
17
46
For
per
sona
l use
onl
y

eXpAnsIon in canada wIll
continue and strong growth Is forecAst in its rental asset base
again in Fy18
47
DIR
ECTO
RS’ R
EPO
RTSI
LVER
CH
EF L
IMIT
ED A
NN
UAL
REP
OR
T 20
17
For
per
sona
l use
onl
y

12. NON-AUDIT SERVICESDuring the year KPMG, the Company’s auditor, has performed certain other services in addition to their statutory duties.
The Board has considered the non-audit services during the year by the auditor and is satisfied that the provision of those non-audit services during the year by the auditor is compatible with, and did not compromise, the auditor independence requirements of the Corporations Act 2001 for the following reasons:
• All non-audit services were subject to the corporate governance procedures adopted by the Group and have been reviewed by the Audit and Risk Management Committee to ensure they do not impact the integrity and objectivity of the auditor; and
• The non-audit services provided do not undermine the general principles relating to auditor independence as set out in APES 110 Code of Ethics for Professional Accountants, as they did not involve reviewing or auditing the auditor’s own work, acting in a management or decision making capacity for the Group, acting as an advocate for the Group or jointly sharing risks and rewards.
Details of the amounts paid to the auditor of the Group, KPMG, and its related practices for audit and non-audit services provided during the year are set out in Note 7.3 to the financial statements.
13. LEAD AUDITOR’S INDEPENDENCE DECLARATIONA copy of the lead auditor’s independence declaration as required under Section 307C of the Corporations Act is included on page 90.
14. ROUNDING OFFThe Company is of a kind referred to in ASIC Corporations (Rounding in Financial/Director’s Reports) Instrument 2016/191, issued by the Australian Securities and Investments Commission, relating to the ‘rounding off’ of amounts in financial statements. Amounts in the financial statements have been rounded off in accordance with that instrument to the nearest thousand dollars, or in certain cases, the nearest dollar.
Signed in accordance with a resolution of Directors
Allan English Non-Executive Chairman Brisbane
28 August 2017
SILV
ER C
HEF
LIM
ITED
AN
NUA
L R
EPO
RT
2017
48
For
per
sona
l use
onl
y

CONSOLIDATED FINANCIAL STATEMENTS
FIN
ANCI
AL S
TATE
MEN
TS
49
SILV
ER C
HEF
LIM
ITED
AN
NUA
L R
EPO
RT
2017
For
per
sona
l use
onl
y

FINANCIAL STATEMENTS51
Statement of Profit or Loss and Other
Comprehensive Income
52Statement of
Changes in Equity
53Statement of
Financial Position
54Statement of Cash Flows
NOTES TO THE FINANCIAL STATEMENTS
551.0 Introduction to
the report
572.0 Business result
for the year
572.1 Segment information
582.2 Revenue
582.3 Expenses from ordinary activities
592.4 Earnings per share
602.5 Taxes
633.0 Operating assets
and liabilities
633.1 Property, plant
and equipment
653.2 Intangible assets
653.3 Trade and other
receivables
673.4 Other assets
673.5 Trade and other
payables
674.0 Capital management
684.1 Capital and reserves
704.2 Dividends
704.3 Loans and borrowings
715.0 Financial instruments
786.0 Employee
remuneration and benefits
786.1 Employee benefits
797.0 Other
797.1 Cash and cash
equivalents
797.2 Reconciliation of
cash flows from operating activities
797.3 Auditor remuneration
807.4 Commitments and
contingencies
807.5 Parent entity
information
817.6 Controlled entities
817.7 Deed of cross
guarantee
837.8 Related parties
837.9 Events subsequent to
balance date
CONTENTS TO THE CONSOLIDATED FINANCIAL STATEMENTS
SILV
ER C
HEF
LIM
ITED
AN
NUA
L R
EPO
RT
2017
50
For
per
sona
l use
onl
y
CONSOLIDATED STATEMENT OF PROFIT OR LOSS AND OTHER COMPREHENSIVE INCOME FOR THE YEAR ENDED 30 JUNE 2017
Note2017
$000’s2016
$000’s
Revenue 2.2 286,025 221,082
Depreciation and amortisation expense (134,223) (94,914)
Loss on sale of rental assets (9,181) (9,128)
Impairment of rental assets 3.1 (16,290) (8,807)
Bad debt expense (12,623) (6,248)
Employee expenses 2.3 (38,063) (32,211)
Expenses from ordinary activities 2.3 (34,049) (26,779)
Finance costs 2.3 (13,254) (11,155)
Profit before income tax 28,342 31,840
Income tax expense 2.5 (8,097) (9,484)
Profit after income tax 20,245 22,356
Other comprehensive income (net of tax)
Items that may be reclassified subsequently to profit or loss
Cash flow hedge revaluation 4.1 525 (983)
Foreign currency translation differences – foreign operations 4.1 (278) 596
Total comprehensive income for the year attributable to owners of the Company 20,492 21,969
Dividend paid per share 4.2 37.9 cents 37.0 cents
Earnings per share
Basic earnings per share 2.4 55.3 cents 68.6 cents
Diluted earnings per share 2.4 55.3 cents 68.6 cents
The above consolidated statement of profit or loss and other comprehensive income is to be read in conjunction with the attached notes.
SILV
ER C
HEF
LIM
ITED
AN
NUA
L R
EPO
RT
2017
51
FIN
ANCI
AL S
TATE
MEN
TS
For
per
sona
l use
onl
y

CONSOLIDATED STATEMENT OF CHANGES IN EQUITY FOR THE YEAR ENDED 30 JUNE 2017
Number of shares on issue
000’s
Share capital $000’s
Retained earnings
$000’sReserves
$000’s
Total equity
$000’s
Balance at 1 July 2016 35,152 90,556 39,160 (473) 129,243
Total comprehensive income for the year
Profit for the year - - 20,245 - 20,245
Foreign currency translation differences - - - (278) (278)
Cash flow hedge reserve - - - 525 525
Total comprehensive income for the year - - 20,245 247 20,492
Transactions with owners of the Company
Dividends recognised and paid during the year - - (13,437) - (13,437)
Share issue costs - (1,261) - - (1,261)
Shares issued under employee share scheme 19 219 - - 219
Shares issued under dividend reinvestment plan 130 1,308 - - 1,308
Shares issued via placement 3,742 28,508 - - 28,508
Total contributions by and distributions to owners of the Company 3,891 28,774 (13,437) - 15,337
Balance at 30 June 2017 39,043 119,330 45,968 (226) 165,072
Balance at 1 July 2015 30,918 55,739 28,370 (86) 84,023
Total comprehensive income for the year
Profit for the year - - 22,356 - 22,356
Foreign currency translation differences - - - 596 596
Cash flow hedge reserve - - - (983) (983)
Total comprehensive income for the year - - 22,356 (387) 21,969
Transactions with owners of the Company
Dividends recognised and paid during the year - - (11,566) - (11,566)
Share issue costs - (1,410) - - (1,410)
Shares issued under employee share scheme 22 180 - - 180
Shares issued under dividend reinvestment plan 84 689 - - 689
Shares issued via placement 4,128 35,358 - - 35,358
Total contributions by and distributions to owners of the Company
4,234
34,817
(11,566)
-
23,251
Balance at 30 June 2016 35,152 90,556 39,160 (473) 129,243
The above consolidated statement of changes in equity is to be read in conjunction with the attached notes.
SILV
ER C
HEF
LIM
ITED
AN
NUA
L R
EPO
RT
2017
52
For
per
sona
l use
onl
y

CONSOLIDATED STATEMENT OF FINANCIAL POSITION AS AT 30 JUNE 2017
Note2017
$000’s2016
$000’sAssetsCurrent assetsCash and cash equivalents 7.1 7,307 5,676
Trade and other receivables 3.3 74,860 36,777
Current tax assets 2.5 - 1,404
Other assets 3.4 2,929 1,770
Total current assets 85,096 45,627Non-current assetsTrade and other receivables 3.3 60,906 43,678Property, plant and equipment 3.1 377,526 335,355Intangibles assets 3.2 3,834 3,141Deferred tax assets 2.5 12,831 5,238Total non-current assets 455,097 387,412Total assets 540,193 433,039LiabilitiesCurrent liabilitiesTrade and other payables 3.5 13,138 9,319Current tax payable 2.5 7,654 -Customer security bonds payable 29,666 32,867Loans and borrowings 4.3 - 467Employee benefits 6.1 2,203 2,205Total current liabilities 52,661 44,858Non-current liabilitiesTrade and other payables 32 68Customer security bonds payable 5,730 6,069Loans and borrowings 4.3 315,046 249,584Employee benefits 6.1 397 1,276Other liabilities 601 537Derivatives 5.0 654 1,404Total non-current liabilities 322,460 258,938Total liabilities 375,121 303,796Net assets 165,072 129,243EquityShare capital 119,330 90,556Retained earnings 45,968 39,160Reserves 4.1 (226) (473)Total equity 165,072 129,243
The above consolidated statement of financial position is to be read in conjunction with the attached notes. SILV
ER C
HEF
LIM
ITED
AN
NUA
L R
EPO
RT
2017
53
FIN
ANCI
AL S
TATE
MEN
TS
For
per
sona
l use
onl
y

CONSOLIDATED STATEMENT OF CASH FLOWS FOR THE YEAR ENDED 30 JUNE 2017
Note2017
$000’s2016
$000’s
Cash flows from operating activities
Receipts from customers 312,892 252,632
Payments to suppliers and employees (141,635) (119,656)
Finance costs paid (12,643) (10,278)
Interest received 49 49
Income taxes paid (6,855) (6,746)
GST recovered 1,062 3,740
Net cash from operating activities 7.2 152,870 119,741
Cash flows from investing activities
Payments for plant and equipment (309,472) (305,003)
Proceeds from sale of plant and equipment 78,732 58,272
Net cash used in investing activities (230,740) (246,731)
Cash flows from financing activities
Proceeds from borrowings 83,474 265,336
Repayment of borrowings (18,000) (154,700)
Repayment of finance leases (468) (475)
Transaction costs paid in relation to loans and borrowings (624) (2,136)
Proceeds from issue of shares 28,508 35,358
Transaction costs paid in relation to issue of shares (1,261) (1,410)
Dividends paid (12,128) (10,877)
Net cash from financing activities 79,501 131,096
Net increase in cash held 1,631 4,106
Cash at beginning of year 5,676 1,570
Cash and cash equivalents at end of year 7.1 7,307 5,676
The above consolidated statement of cash flows is to be read in conjunction with the attached notes.
SILV
ER C
HEF
LIM
ITED
AN
NUA
L R
EPO
RT
2017
54
For
per
sona
l use
onl
y

NOTES TO THE CONSOLIDATED FINANCIAL STATEMENTS FOR THE YEAR ENDED 30 JUNE 2017
1.0 INTRODUCTION TO THE REPORT
REPORTING ENTITY
Silver Chef Limited (the “Company”) is a company domiciled in Australia. The address of the Company’s registered office is Park Tower, 20 Pidgeon Close West End Qld 4101. The consolidated financial statements of the Company as at and for the year ended 30 June 2017 comprise the Company and its subsidiaries (together referred to as the “Group” and individually as “Group entities”). The Group is a for-profit entity and is primarily involved in the rental of commercial equipment.
STATEMENT OF COMPLIANCE
The consolidated financial statements are general purpose financial statements which have been prepared in accordance with Australian Accounting Standards (AASBs) adopted by the Australian Accounting Standards Board (AASB) and the Corporations Act 2001. The consolidated financial statements comply with International Financial Reporting Standards (IFRSs) adopted by the International Accounting Standards Board (IASB).
The consolidated financial statements were authorised for issue by the Board of Directors on 28 August 2017.
BASIS OF MEASUREMENT
The consolidated financial statements have been prepared on the historical cost basis except for derivative financial instruments that have been measured at fair value.
ROUNDING OF AMOUNTS
The Company is of a kind referred to in ASIC Corporations (Rounding in Financial/Directors’ Reports) Instrument 2016/191, issued by the Australian Securities and Investments Commission, relating to the ‘rounding off’ of amounts in financial statements. Amounts in the financial statements have been rounded off in accordance with that instrument to the nearest thousand dollars, or in certain cases, the nearest dollar.
FUNCTIONAL AND PRESENTATION CURRENCY
The financial report is presented in Australian dollars, which is the Company’s functional currency.
USE OF ESTIMATES AND JUDGEMENTS
In preparing these consolidated financial statements, management has made judgements, estimates and assumptions that affect the application of accounting policies and the reported amounts of assets, liabilities, income and expenses. Actual results may differ from these estimates.
Estimates and underlying assumptions are reviewed on an ongoing basis. Revisions to accounting estimates are recognised in the period in which the estimates are revised and in any future periods affected.
Assumptions and estimation uncertainties that have a significant risk of resulting in a material adjustment in the year ending 30 June 2017 relate primarily to potential impairment against financial and non-financial assets. Information about these risks is in notes 3.1 and 3.3.
SILV
ER C
HEF
LIM
ITED
AN
NUA
L R
EPO
RT
2017
55
NOT
ES T
O T
HE
FIN
ANCI
AL S
TATE
MEN
TS
For
per
sona
l use
onl
y
1.0 INTRODUCTION TO THE REPORT (CONTINUED)SIGNIFICANT ACCOUNTING POLICIES
The significant accounting policies adopted in the preparation of the financial report are set out below. Other significant accounting policies are contained in the notes to the financial report to which they relate to.
(a) Basis of consolidation
(i) Subsidiaries
Subsidiaries are entities controlled by the Group. The Group controls an entity when it is exposed to, or has rights to, variable returns from its involvement with the entity and has the ability to affect those returns through its power over the entity. The financial statements of subsidiaries are included in the consolidated financial statements from the date that control commences until the date that control ceases.
(ii) Transactions eliminated on consolidation
Intra-group balances and transactions, and any unrealised income and expenses arising from intra-group transactions, are eliminated in preparing the consolidated financial statements.
(b) Foreign currency
(i) Foreign currency transactions
Transactions in foreign currencies are translated to the respective functional currencies of Group entities at exchange rates at the dates of the transactions.
Monetary assets and liabilities denominated in foreign currencies are translated to the functional currency at the exchange rate at the reporting date.
Foreign currency translation differences arising on re-translation are recognised in profit or loss.
(ii) Foreign operations
The assets and liabilities of foreign operations are translated to the functional currency at exchange rates at the reporting date. The income and expenses of foreign operations are translated to Australian dollars at exchange rates at the dates of the transactions.
Foreign currency differences are recognised in other comprehensive income, and presented in the foreign currency translation reserve in equity.
When the settlement of a monetary item receivable from or payable to a foreign operation is neither planned nor likely in the foreseeable future, foreign exchange gains and losses arising from such a monetary item are considered to form part of a net investment in a foreign operation and are recognised in other comprehensive income, and are presented in the foreign currency translation reserve in equity.
(c) Provisions
A provision is recognised if, as a result of a past event, the Group has a present legal or constructive obligation that can be estimated reliably and it is probable that an outflow of economic benefits will be required to settle the obligation. Provisions are determined by discounting the expected future cash flows at a pre-tax rate that reflects current market assessments of the time value of money and the risks specific to the liability.
(d) New standards and interpretations not yet adopted
A number of new standards, amendments to standards and interpretations are effective for annual periods beginning after 1 July 2017, and have not been applied in preparing these consolidated financial statements. Those which may be relevant to the Group are set out below. The Group does not plan to adopt these standards early.
AASB 9 Financial Instruments
AASB 9, published July 2014, replaces existing guidance in AASB 139 Financial Instruments: Recognition and Measurement. AASB 9 includes revised guidance on the classification and measurement of financial instruments, including a new expected loss model for calculating impairment on financial assets and the new general hedge accounting requirements. It also carries forward the guidance on recognition and de-recognition of financial instruments from AASB 139.SI
LVER
CH
EF L
IMIT
ED A
NN
UAL
REP
OR
T 20
17
56
For
per
sona
l use
onl
y

1.0 INTRODUCTION TO THE REPORT (CONTINUED)AASB 9 is effective for annual periods beginning on or after 1 January 2018 with early adoption permitted. The adoption of this standard is expected to have an impact on the Group’s financial assets and the impairment of its trade receivables, but no impact on the Group’s financial liabilities.
AASB 15 Revenue from Contracts with Customers
AASB 15 establishes principles for reporting the nature, amount, timing and uncertainty of revenue and cash flows arising from an entity’s contracts with customers. The new revenue standard will be mandatory for the Group’s 30 June 2018 financial statements. The new standard is currently being assessed for the impact, if any, on the Group’s future financial results.
AASB 16 Leases
AASB 16 was released by the AASB in early March 2016 and applies to financial reporting periods beginning on or after 1 January 2019 with early adoption permitted if an entity is applying, or has already applied IFRS 15 Revenue from Contracts with Customers at the same time.
The new standard does away with the current operating/finance lease distinction, requiring entities to recognise all but the lowest value leases on the balance sheet. The new standard is currently being assessed for impact on the future financial results of the Group.
2.0 BUSINESS RESULT FOR THE YEAR
2.1 SEGMENT INFORMATION
The Group has two reportable segments based on the strategic management of the Group’s underlying brands, being Hospitality and GoGetta. The brands are managed separately because they target distinctly different markets. For each of the strategic divisions, the Group’s Chief Executive Officer (the chief operating decision maker) and other Executive Managers review internal management reports on a monthly basis. The following summary describes the operations in each of the Group’s reportable segments:
• Hospitality – providing equipment rental finance predominantly to the hospitality industry; and
• GoGetta – Providing equipment rental finance to other industries.
Hospitality GoGetta Unallocated Total
2017 $000’s
2016 $000’s
2017 $000’s
2016 $000’s
2017 $000’s
2016 $000’s
2017 $000’s
2016 $000’s
External revenue 155,285 125,546 125,111 89,476 5,629 6,060 286,025 221,082
Depreciation and amortisation (67,719) (52,766) (63,765) (40,120) (2,739) (2,028) (134,223) (94,914)
Interest expense (7,802) (6,234) (5,452) (4,872) - (49) (13,254) (11,155)
Loss on sale of property, plant and equipment (2,530) (4,018) (6,651) (5,110) - - (9,181) (9,128)
Bad and doubtful debt expense (4,854) (1,716) (7,729) (4,532) (40) - (12,623) (6,248)
Impairment on property, plant and equipment (3,932) (2,262) (12,358) (6,545) - - (16,290) (8,807)
Reportable segment profit before tax 41,883 37,187 12,815 16,270 (26,356) (21,617) 28,342 31,840
Reportable segment assets 288,664 213,720 234,658 202,069 16,871 17,250 540,193 433,039
Rental equipment acquired during year 146,600 122,788 128,279 160,091 - - 274,879 282,879
Reportable segment liabilities (228,844) (172,248) (149,647) (124,570) 3,370 (6,978) (375,121) (303,796)
SILV
ER C
HEF
LIM
ITED
AN
NUA
L R
EPO
RT
2017
57
NOT
ES T
O T
HE
FIN
ANCI
AL S
TATE
MEN
TS
For
per
sona
l use
onl
y

2.1 SEGMENT INFORMATION (CONTINUED)
The geographic information below analyses the Group’s revenue and non-current assets based on their geographical location.
2017 $000’s
2016 $000’s
RevenueNon-current
assets RevenueNon-current
assets
Australia 263,982 411,290 206,754 359,640
New Zealand 11,127 20,488 7,744 13,825
Canada 10,916 23,319 6,584 13,947
Total 286,025 455,097 221,082 387,412
2.2 REVENUE
(i) Contract rental income
The Group recognises revenue from its Rent.Try.Buy and Rent.Grow.Own contracts as rental income. Rental income from operating leases is recognised in profit or loss on a straight-line basis over the lease term as it falls due.
Operating leases arise where substantially all of the risks and benefits incidental to ownership of the leased asset remain with the Group. Receipts from operating leases are due and payable by the lessee on a weekly, or in some cases monthly, basis in advance.
(ii) Finance lease interest
The Group recognises finance lease interest by applying discount rates implicit in the lease balances receivable at the beginning of each payment period.
(iii) Finance income
Finance income comprises interest income on funds invested. Interest income is recognised in profit or loss as it accrues.
Foreign currency gains are reported on a net basis as finance income when a foreign currency movement is in a net gain position.
(iv) Other income
Other income comprises subscription and consulting revenue earned through its Profitable Hospitality business.
2017 $000’s
2016 $000’s
Rental income 263,259 203,608
Lease interest 22,614 17,393
Other income 152 81
Total revenue 286,025 221,082
2.3 EXPENSES FROM ORDINARY ACTIVITIES
2017 $000’s
2016 $000’s
Cost of rental services 13,697 10,636
Other administrative expenses 16,048 13,140
Sales and marketing 4,304 3,003
Total expenses from ordinary activities 34,049 26,779
SILV
ER C
HEF
LIM
ITED
AN
NUA
L R
EPO
RT
2017
58
For
per
sona
l use
onl
y

2.3 EXPENSES FROM ORDINARY ACTIVITIES (CONTINUED)
Employee benefits expense
2017 $000’s
2016 $000’s
Wages and salaries 31,938 26,743
Other associated personnel expenses 3,132 2,569
Superannuation expense 2,913 2,719
Long service leave 80 180
Total employee benefits expense 38,063 32,211
Finance costs
Finance costs comprise interest expense on borrowings and are recognised in profit or loss using the effective interest method. Borrowing costs that are not directly attributable to the acquisition, construction or production of a qualifying asset are recognised in profit or loss using the effective interest method.
Foreign currency losses are reported as finance costs if foreign currency movements are in a net loss position.
2017 $000’s
2016 $000’s
Interest expense on financial liabilities measured at amortised cost 12,643 9,378
Amortisation of capitalised borrowing costs 611 1,777
Total finance costs 13,254 11,155
2.4 EARNINGS PER SHARE
Basic earnings per share
The calculation of basic earnings per share at 30 June 2017 was based on the following profit attributable to ordinary shareholders and weighted average number of ordinary shares outstanding. Both the current and prior year’s earnings per shares calculations have been adjusted for the bonus component of the rights issue which occurred in March 2017.
Profit attributable to ordinary shareholders
2017 $000’s
2016 $000’s
Profit for the year 20,245 22,356
000’s 000’s
Weighted average number of ordinary shares
Issued ordinary shares at 1 July 35,152 30,918
Effect of shares issued under the dividend reinvestment plan 102 65
Effect of shares issued under the employee share scheme 13 18
Effect of shares issued under placement 1,190 1,170
Effect of rights issue bonus shares 144 429
Weighted average number of ordinary shares at 30 June 36,601 32,600
SILV
ER C
HEF
LIM
ITED
AN
NUA
L R
EPO
RT
2017
59
NOT
ES T
O T
HE
FIN
ANCI
AL S
TATE
MEN
TS
For
per
sona
l use
onl
y

2.4 EARNINGS PER SHARE (CONTINUED)
Diluted earnings per share
The calculation of diluted earnings per share at 30 June 2017 was based on the following profit attributable to ordinary shareholders and weighted average number of ordinary shares outstanding after adjustment for the effects of all dilutive potential ordinary shares:
Profit attributable to ordinary shareholders (diluted)
2017 $000’s
2016 $000’s
Profit for the year 20,245 22,356
000’s 000’s
Weighted average number of ordinary shares (diluted)
Weighted average number of ordinary shares (basic) 36,601 32,600
Effect of employee share based payment transactions - -
Weighted average number of ordinary shares at 30 June 36,601 32,600
2.5 TAXES
Recognition and measurement
Tax expense comprises current and deferred tax. Current tax and deferred tax is recognised in profit or loss except to the extent that it relates to a business combination, or items recognised directly in equity or in other comprehensive income.
Current tax
Current tax is the expected tax payable or receivable on the taxable income or loss for the year, using tax rates enacted or substantively enacted at the reporting date, and any adjustment to tax payable in respect of previous years. Current tax payable also includes any tax liability arising from the declaration of dividends.
Deferred tax
Deferred tax is recognised in respect of temporary differences between the carrying amounts of assets and liabilities for financial reporting purposes and the amounts used for taxation purposes. The measurement of deferred tax reflects the tax consequences that would follow the manner in which the Group expects, at the end of the reporting period, to recover or settle the carrying amount of its assets and liabilities. Deferred tax is measured at the tax rates that are expected to be applied to temporary differences when they reverse, using tax rates enacted or substantively enacted at the reporting date.
In determining the amount of current and deferred tax the Group takes into account the impact of uncertain tax positions and whether additional taxes and interest may be due. The Group believes that its accruals for tax liabilities are adequate for all open tax years based on its assessment of many factors, including interpretations of tax law and prior experience. This assessment relies on estimates and assumptions and may involve a series of judgments about future events. New information may become available that causes the Group to change its judgment regarding the adequacy of existing tax liabilities; such changes to tax liabilities will impact tax expense in the period that such a determination is made.
Deferred tax assets and liabilities are offset if there is a legally enforceable right to offset current tax liabilities and assets, and they relate to income taxes levied by the same tax authority on the same taxable entity.
A deferred tax asset is recognised for unused tax losses relating to the Canadian operations, tax credits and deductible temporary differences, to the extent that it is probable that future taxable profits will be available against which they can be utilised. Although Canada is not currently in a tax paying position, we expect to be able to utilise these carried forward tax losses to offset taxable income in the near future. SI
LVER
CH
EF L
IMIT
ED A
NN
UAL
REP
OR
T 20
17
60
For
per
sona
l use
onl
y
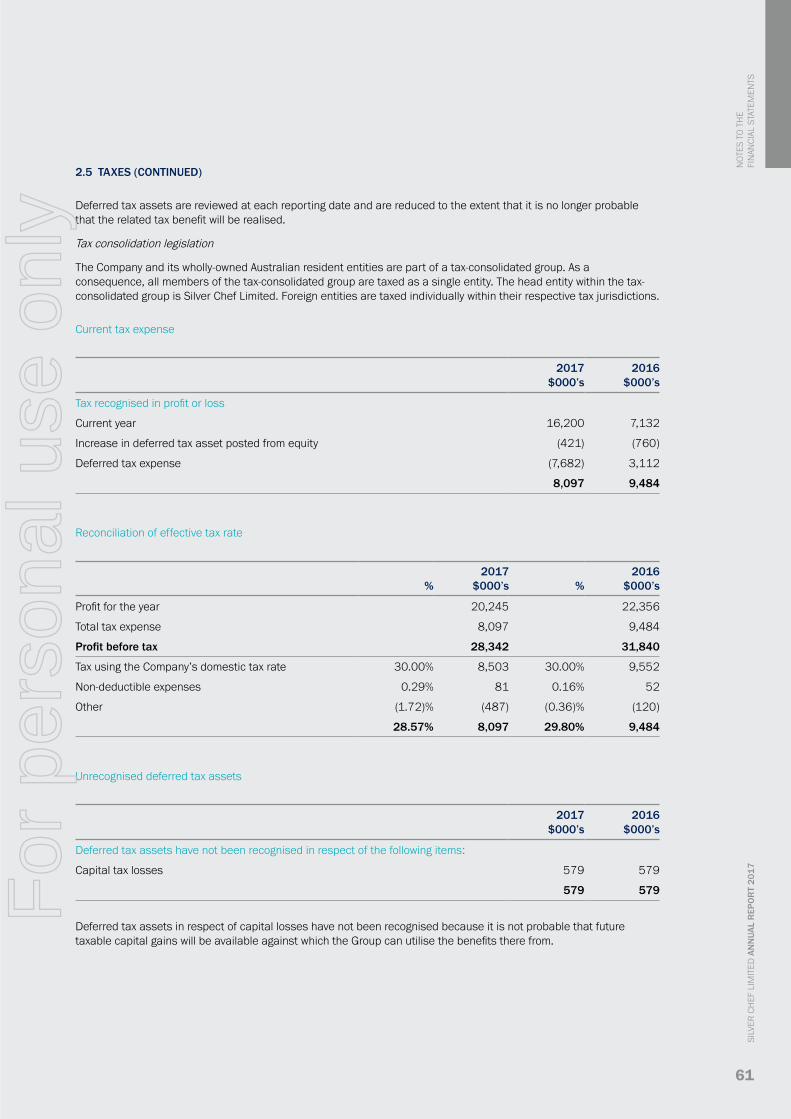
2.5 TAXES (CONTINUED)
Deferred tax assets are reviewed at each reporting date and are reduced to the extent that it is no longer probable that the related tax benefit will be realised.
Tax consolidation legislation
The Company and its wholly-owned Australian resident entities are part of a tax-consolidated group. As a consequence, all members of the tax-consolidated group are taxed as a single entity. The head entity within the tax-consolidated group is Silver Chef Limited. Foreign entities are taxed individually within their respective tax jurisdictions.
Current tax expense
2017 $000’s
2016 $000’s
Tax recognised in profit or loss
Current year 16,200 7,132
Increase in deferred tax asset posted from equity (421) (760)
Deferred tax expense (7,682) 3,112
8,097 9,484
Reconciliation of effective tax rate
%2017
$000’s %2016
$000’s
Profit for the year 20,245 22,356
Total tax expense 8,097 9,484
Profit before tax 28,342 31,840
Tax using the Company’s domestic tax rate 30.00% 8,503 30.00% 9,552
Non-deductible expenses 0.29% 81 0.16% 52
Other (1.72)% (487) (0.36)% (120)
28.57% 8,097 29.80% 9,484
Unrecognised deferred tax assets
2017 $000’s
2016 $000’s
Deferred tax assets have not been recognised in respect of the following items:
Capital tax losses 579 579
579 579
Deferred tax assets in respect of capital losses have not been recognised because it is not probable that future taxable capital gains will be available against which the Group can utilise the benefits there from.
SILV
ER C
HEF
LIM
ITED
AN
NUA
L R
EPO
RT
2017
61
NOT
ES T
O T
HE
FIN
ANCI
AL S
TATE
MEN
TS
For
per
sona
l use
onl
y

2.5 TAXES (CONTINUED)
Recognised deferred tax assets and liabilities
2017 $000’s
2016 $000’s
Deferred tax liabilities
Lease receivables 12,991 10,753
Deferred upfront costs 2,658 3,670
Plant and equipment 2 4
Intangibles - 21
Other - 22
Total deferred tax liabilities (temporary differences) 15,651 14,470
Deferred tax assets
Rental assets 17,290 12,337
Allowance for impairment of receivables 4,207 1,759
Employee entitlements 854 1,125
Rental asset impairment 3,493 1,903
Other 1,673 1,741
Total deferred tax assets (temporary differences) 27,517 18,865
Deferred tax asset relating to tax losses carried forward 965 843
Total net deferred tax assets 12,831 5,238
Movement in deferred tax balances during the year
2017 $000’s
2016 $000’s
Deferred tax liabilities
Lease receivables 2,237 3,297
Intangibles (30) (22)
Deferred upfront costs (1,012) 3,670
Other 412 -
Deferred tax assets
Rental assets (5,454) (1,185)
Plant and equipment (128) (113)
Allowance for impairment of receivables (2,448) (639)
Employee entitlements 284 (439)
Rental asset impairment (1,590) (657)
Tax losses - (553)
Accrued expenses 47 (247)
Deferred tax expense (7,682) 3,112
Movement in deferred tax asset recognised directly in equity 89 (760)
Net movement in deferred tax balances during the year (7,593) 2,352
SILV
ER C
HEF
LIM
ITED
AN
NUA
L R
EPO
RT
2017
62
For
per
sona
l use
onl
y

3.0 OPERATING ASSETS AND LIABILITIES
3.1 PROPERTY, PLANT AND EQUIPMENT
(i) Recognition and measurement
Items of property, plant and equipment are measured at cost less accumulated depreciation and accumulated impairment losses. Cost includes expenditure that is directly attributable to the acquisition of the asset.
Any gain or loss on disposal of an item of property, plant and equipment (calculated as the difference between the net proceeds from disposal and the carrying amount of the item) is recognised in profit or loss.
(ii) Subsequent costs
Subsequent expenditure is capitalised only when it is probable that the future economic benefits associated with the expenditure will flow to the Group. Ongoing repairs and maintenance is expensed as incurred.
(iii) Depreciation
Items of property, plant and equipment are depreciated on a straight-line basis in profit or loss over the estimated useful lives of each component. Leased assets are depreciated over the period of time that management estimates it can utilise the leased assets to generate income.
Items of property, plant and equipment are depreciated from the date that they are installed and ready for use.
The estimated useful lives for the current and comparative years of significant items of property, plant and equipment are as follows:
• rental assets: 1 to 5 years
• fixtures and fittings: 5 to 10 years
• computer equipment: 2 to 4 years
Depreciation methods, useful lives and residual values are reviewed at each reporting date and adjusted if appropriate. Refer note 2(d).
(iv) Deferral of upfront costs
Under AASB 117 Leases, a lessor shall recognise in the carrying amount of an asset subject to an operating lease the initial direct costs incurred in negotiating and arranging the operating lease and amortise such upfront costs as an expense over the lease term on the same basis as the lease income.
(v) Assets held for sale
Non-current assets are classified as held-for-sale if it is highly probable that they will be recovered primarily through sale rather than through continuing use.
Such assets are generally measured at the lower of their carrying amount and fair value less costs to sell. Any impairment losses on initial classification as held-for-sale and subsequent gains and losses on re-measurement are recognised in profit or loss.
Once classified as held-for-sale, property, plant and equipment are no longer depreciated.
(vi) Impairment
Rental and idle assets
The carrying amounts of the Group’s rental and idle assets are reviewed at each reporting date to determine whether there is any indication of impairment. If any such indication exists, then the asset’s recoverable amount is estimated. An impairment loss is recognised if the carrying amount of an asset exceeds its recoverable amount.
Idle assets have been returned to the Group and have been warehoused for reconditioning or are being held by external vendors. The recoverable amount for each asset is estimated by management based on expected re-leasing rates and historical sales information. SI
LVER
CH
EF L
IMIT
ED A
NN
UAL
REP
OR
T 20
17
63
NOT
ES T
O T
HE
FIN
ANCI
AL S
TATE
MEN
TS
For
per
sona
l use
onl
y

3.1 PROPERTY, PLANT AND EQUIPMENT (CONTINUED)
Impairment assessments are made on assets linked to rental contracts where there is significant doubt on the ability of the customer to meet rental payments and the asset has been flagged for recovery.
The assets are grouped by risk profile and assigned an expected loss rate reflective of historical experience and management estimates.
Impairment losses are recognised in profit or loss and reversed only to the extent that the asset’s carrying amount does not exceed the carrying amount that would have been determined, net of depreciation or amortisation, if no impairment loss had been recognised.
2017 $000’s
2016 $000’s
Plant and equipment
At cost 10,360 8,456
Less accumulated depreciation (7,378) (5,732)
Carrying amount of property, plant and equipment 2,982 2,724
Movements during the year
Balance at 1 July 2,724 3,502
Additions 1,969 735
Depreciation expense (1,673) (1,519)
Disposals (34) -
Effect of movement in exchange rates (4) 6
Balance at 30 June 2,982 2,724
Rental assets
At cost 557,739 473,944
Less accumulated depreciation (171,276) (134,765)
Less provision for impairment (11,919) (6,548)
Carrying amount of rental assets 374,544 332,631
Movements during the year
Balance at 1 July 332,631 216,042
Additions 274,879 282,879
Capitalised upfront costs of lease origination 19,472 23,663
Depreciation and amortisation expense (131,616) (92,897)
Impairment loss* (16,290) (8,807)
Effect of movement in exchange rates (501) 547
Assets converted to lease receivables (28,379) (30,892)
Disposals (75,652) (57,904)
Balance at 30 June 374,544 332,631
Total property, plant and equipment 377,526 335,355
*Impairment of rental assets: assessments are made monthly on the recoverable amount of returned assets and assets on contracts which have defaulted. No impairment losses have been reversed (2016: Nil). Recoverable amount is determined on a value in use basis and assumes that the estimated cash flows will be received within twelve months.
Assets leased out under operating leases and included in rental assets above
At cost 507,062 450,943
Less accumulated depreciation and amortisation (154,004) (126,801)
Less provision for impairment (10,289) (4,641)
Balance at 30 June 342,769 319,501
Depreciation and amortisation expense recognised in year 125,118 89,257
SILV
ER C
HEF
LIM
ITED
AN
NUA
L R
EPO
RT
2017
64
For
per
sona
l use
onl
y

3.2 INTANGIBLE ASSETS
(i) Recognition and measurement
Intangible assets that are acquired or internally developed by the Group and have finite useful lives are measured at cost less accumulated amortisation and accumulated impairment losses. Cost includes expenditure that is directly attributable to the acquisition or development of the asset.
(ii) Subsequent costs
Subsequent expenditure is capitalised only when it is probable that the future economic benefits associated with the expenditure will flow to the Group. All other expenditure is recognised in profit or loss as incurred.
(iii) Amortisation
Intangible assets are amortised on a straight-line basis in profit or loss over their estimated useful lives from the date that they are available for use.
The estimated useful lives for the current and comparative years of significant intangible assets are as follows:
• software 4 to 5 years
• intellectual property 3 years
Amortisation methods, useful lives and residual values are reviewed at each reporting date and adjusted if appropriate.
2017 $000’s
2016 $000’s
Intangible assets
Intangible assets at cost 7,576 5,971
Less accumulated amortisation (3,742) (2,830)
Carrying amount of intangible assets 3,834 3,141
Movements during the year
Balance at 1 July 3,141 1,724
Additions 1,681 1,915
Disposals (54) -
Amortisation expense (934) (498)
Balance at 30 June 3,834 3,141
3.3 TRADE AND OTHER RECEIVABLES
2017 $000’s
2016 $000’s
Included in current receivables
Trade receivables 50,200 20,602
Finance lease receivables 38,620 21,623
Other receivables 112 438
Allowance for impairment losses (14,072) (5,886)
Current receivables 74,860 36,777
Included in non-current receivables
Finance lease receivables 60,906 43,678
Non-current receivables 60,906 43,678
Total receivables 135,766 80,455
SILV
ER C
HEF
LIM
ITED
AN
NUA
L R
EPO
RT
2017
65
NOT
ES T
O T
HE
FIN
ANCI
AL S
TATE
MEN
TS
For
per
sona
l use
onl
y

3.3 TRADE AND OTHER RECEIVABLES (CONTINUED)
Impairment – Trade and other receivables
Financial assets not carried at fair value through profit or loss are assessed at each reporting date to determine whether there is objective evidence that they are impaired. The main non-derivative financial assets held by the Group are contract debtors and lease receivables.
Objective evidence that financial assets are impaired includes:
• default or delinquency by a debtor;
• indications that a debtor will enter bankruptcy; or
• adverse changes in the payment status of customers.
The Group considers evidence of impairment for their rental contract debtors at a collective level. Contracts in arrears are assessed and grouped together depending on their risk characteristics.
In assessing collective impairment, the Group uses historical information on the likelihood of recoveries, the total amount of security bonds held against the delinquent contracts and impairs the debtor ledger accordingly. Losses are recognised in profit or loss and reflected in an allowance account. When the Group has exhausted all reasonable efforts of recovery, the net book debt of the contract is written off.
If the amount of impairment loss subsequently decreases and the decrease can be related objectively to an event occurring after the impairment was recognised, then the previously recognised impairment loss is reversed through profit or loss.
Operating leases – Group is lessor
2017 $000’s
2016 $000’s
Plant and equipment is leased to various industries
Included in current receivables
Lease commitments receivable 46,717 18,519
Less provision for impairment (11,930) (5,264)
Net operating lease commitments receivable 34,787 13,255
Future minimum lease receipts in respect of non-cancellable operating leases according to the time expected to elapse to the expected date of receipt:
Rental equipment
Not later than one year 117,265 125,058
Total future minimum lease receipts 117,265 125,058
Rental contracts are normally for a minimum of twelve months duration.
Finance leases – Group is lessor
The Group has classified its long term contracts as finance leases for accounting purposes. Under a finance lease, substantially all the risks and benefits incidental to the ownership of the leased asset are transferred by the Group to the lessees. The Group recognises at the beginning of the lease term an asset at an amount equal to the aggregate of the present value (discounted at the interest rate implicit in the lease) of the minimum lease payments and an estimate of any unguaranteed residual value expected to accrue to the Group at the end of the lease term.
SILV
ER C
HEF
LIM
ITED
AN
NUA
L R
EPO
RT
2017
66
For
per
sona
l use
onl
y

3.3 TRADE AND OTHER RECEIVABLES (CONTINUED)
2017 $000’s
2016 $000’s
Finance leases – Group is lessor
Less than one year 60,089 37,897
Between one and five years 77,039 56,944
137,128 94,841
Unearned interest income (37,602) (29,540)
Net finance lease receivables 99,526 65,301
The net investment in finance leases comprise:
Less than one year 38,620 21,623
Between one and five years 60,906 43,678
Total net finance lease receivables 99,526 65,301
3.4 OTHER ASSETS
2017 $000’s
2016 $000’s
Current
Prepayments 2,929 1,770
2,929 1,770
3.5 TRADE AND OTHER PAYABLES
2017 $000’s
2016 $000’s
Current
Creditors and accruals (unsecured) 10,298 7,475
Deferred rental revenue 2,840 1,844
13,138 9,319
4.0 CAPITAL MANAGEMENTThe Board’s policy is to maintain a strong capital base (which includes reserves and ordinary shares) so as to maintain investor, creditor and market confidence and to sustain future development of the business. The Board of Directors monitors the return on capital, which the Group defines as net profit after income tax over average shareholders’ equity. In 2017, return on capital was 14% (2016: 21%).
The Board seeks to maintain a balance between the higher returns that might be possible with higher levels of borrowings and the advantages and security afforded by a sound capital position.
• The Group’s gearing target is to fund no more than 70% of the carrying amount of the Group’s rental assets and lease receivables by interest bearing debt. At 30 June 2017 this was calculated as follows:
SILV
ER C
HEF
LIM
ITED
AN
NUA
L R
EPO
RT
2017
67
NOT
ES T
O T
HE
FIN
ANCI
AL S
TATE
MEN
TS
For
per
sona
l use
onl
y
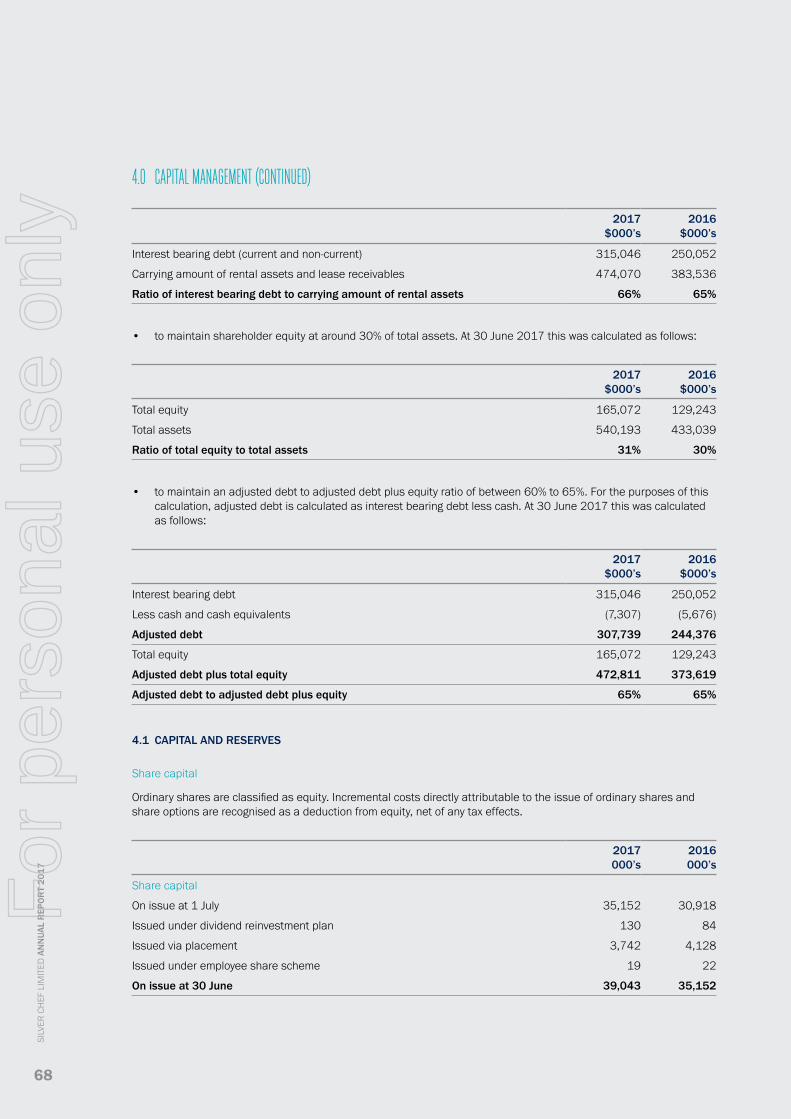
4.0 CAPITAL MANAGEMENT (CONTINUED)
2017 $000’s
2016 $000’s
Interest bearing debt (current and non-current) 315,046 250,052
Carrying amount of rental assets and lease receivables 474,070 383,536
Ratio of interest bearing debt to carrying amount of rental assets 66% 65%
• to maintain shareholder equity at around 30% of total assets. At 30 June 2017 this was calculated as follows:
2017 $000’s
2016 $000’s
Total equity 165,072 129,243
Total assets 540,193 433,039
Ratio of total equity to total assets 31% 30%
• to maintain an adjusted debt to adjusted debt plus equity ratio of between 60% to 65%. For the purposes of this calculation, adjusted debt is calculated as interest bearing debt less cash. At 30 June 2017 this was calculated as follows:
2017 $000’s
2016 $000’s
Interest bearing debt 315,046 250,052
Less cash and cash equivalents (7,307) (5,676)
Adjusted debt 307,739 244,376
Total equity 165,072 129,243
Adjusted debt plus total equity 472,811 373,619
Adjusted debt to adjusted debt plus equity 65% 65%
4.1 CAPITAL AND RESERVES
Share capital
Ordinary shares are classified as equity. Incremental costs directly attributable to the issue of ordinary shares and share options are recognised as a deduction from equity, net of any tax effects.
2017 000’s
2016 000’s
Share capital
On issue at 1 July 35,152 30,918
Issued under dividend reinvestment plan 130 84
Issued via placement 3,742 4,128
Issued under employee share scheme 19 22
On issue at 30 June 39,043 35,152
SILV
ER C
HEF
LIM
ITED
AN
NUA
L R
EPO
RT
2017
68
For
per
sona
l use
onl
y
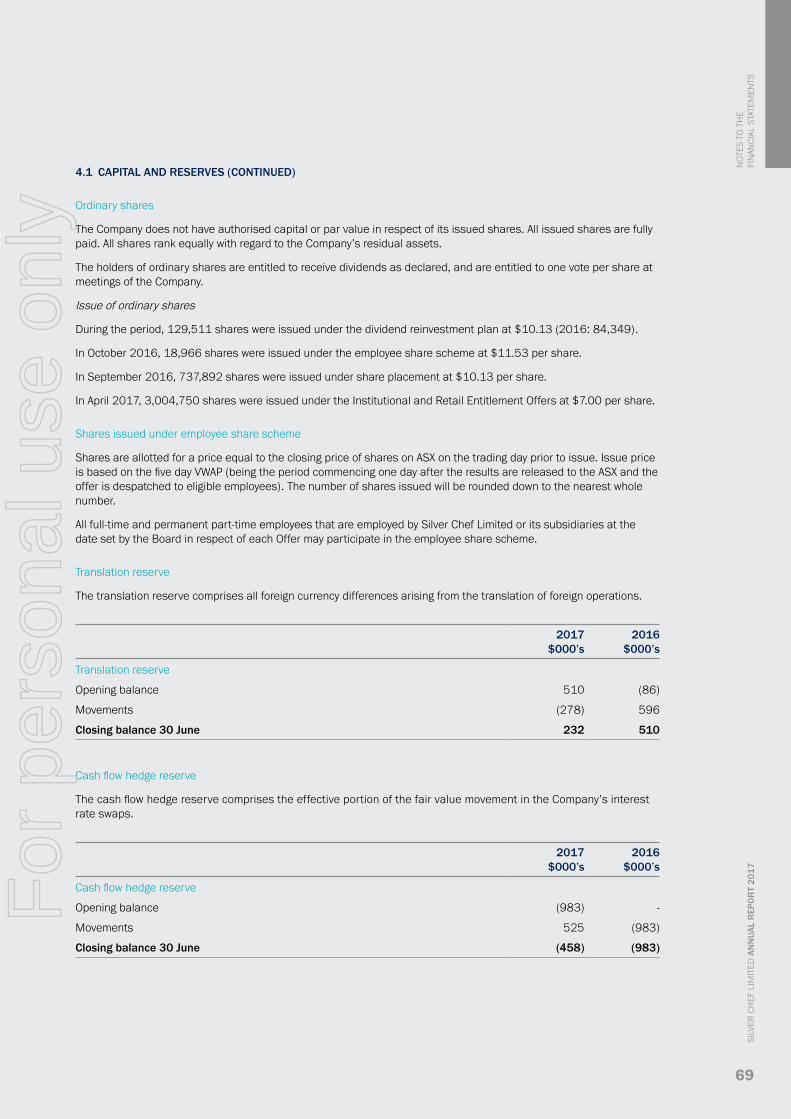
4.1 CAPITAL AND RESERVES (CONTINUED)
Ordinary shares
The Company does not have authorised capital or par value in respect of its issued shares. All issued shares are fully paid. All shares rank equally with regard to the Company’s residual assets.
The holders of ordinary shares are entitled to receive dividends as declared, and are entitled to one vote per share at meetings of the Company.
Issue of ordinary shares
During the period, 129,511 shares were issued under the dividend reinvestment plan at $10.13 (2016: 84,349).
In October 2016, 18,966 shares were issued under the employee share scheme at $11.53 per share.
In September 2016, 737,892 shares were issued under share placement at $10.13 per share.
In April 2017, 3,004,750 shares were issued under the Institutional and Retail Entitlement Offers at $7.00 per share.
Shares issued under employee share scheme
Shares are allotted for a price equal to the closing price of shares on ASX on the trading day prior to issue. Issue price is based on the five day VWAP (being the period commencing one day after the results are released to the ASX and the offer is despatched to eligible employees). The number of shares issued will be rounded down to the nearest whole number.
All full-time and permanent part-time employees that are employed by Silver Chef Limited or its subsidiaries at the date set by the Board in respect of each Offer may participate in the employee share scheme.
Translation reserve
The translation reserve comprises all foreign currency differences arising from the translation of foreign operations.
2017 $000’s
2016 $000’s
Translation reserve
Opening balance 510 (86)
Movements (278) 596
Closing balance 30 June 232 510
Cash flow hedge reserve
The cash flow hedge reserve comprises the effective portion of the fair value movement in the Company’s interest rate swaps.
2017 $000’s
2016 $000’s
Cash flow hedge reserve
Opening balance (983) -
Movements 525 (983)
Closing balance 30 June (458) (983)
SILV
ER C
HEF
LIM
ITED
AN
NUA
L R
EPO
RT
2017
69
NOT
ES T
O T
HE
FIN
ANCI
AL S
TATE
MEN
TS
For
per
sona
l use
onl
y

4.2 DIVIDENDS
The following dividends were declared and paid by the Group:
Cents per share
Total amount $000’s
Franked/ unfranked
Date of payment
2017
Final dividend – 2016 25.0 8,788 Fully franked 16 September 2016
Interim dividend – 2017 12.9 4,649 Fully franked 31 March 2017
37.9 13,437
2016
Final dividend – 2015 20.0 6,188 Fully franked 17 September 2015
Interim dividend – 2016 17.0 5,378 Fully franked 22 April 2016
37.0 11,566
Subsequent event
After 30 June 2017, the following dividends were declared by the Directors and have not been provided for:
Cents per share
Total amount $000’s
Date of payment
Final dividend 2017 25.1 $9,800 2 October 2017
Franking account balance
The ability to utilise the franking credits is dependent upon the ability to declare dividends. In accordance with the tax consolidation legislation, the Company as head entity in the tax consolidated group has also assumed the benefit of $22,761,000 (2016: $21,207,000) franking credits. The amount of franking credits available to shareholders for subsequent financial years is as follows:
2017 $000’s
2016 $000’s
Franking account balance as at the end of the financial year at 30% (2016: 30%) 22,761 21,207
Franking (debits)/credits that will arise from the refund/payment of income tax payable as at the end of the financial year
7,654 (1,404)
30,415 19,803
4.3 LOANS AND BORROWINGS
2017 $000’s
2016 $000’s
Current
Finance lease liabilities (secured) - 467
- 467
Non-current
Secured:
Bank loans* 315,046 249,584
315,046 249,584
*In August 2015 the Group entered into a $300 million syndicated banking facility which significantly improved the key terms and conditions of Silver Chef’s debt funding arrangements, including reducing pricing and increasing capacity to fund future growth. The syndicated facility created a staggered debt maturity profile over three years to August 2018 ($175 million limit) and five years to August 2020 ($125.0 million limit). The syndicate arrangements also provide the flexibility for the Group to borrow directly in New Zealand and Canadian dollars from overseas branches of the syndicate banks. In July 2016, the syndicated facility was increased by $100 million to allow the Company further head room and to fund acquisition growth. Maturity of this debt extension is three years to July 2019.SI
LVER
CH
EF L
IMIT
ED A
NN
UAL
REP
OR
T 20
17
70
For
per
sona
l use
onl
y

4.3 LOANS AND BORROWINGS (CONTINUED)
2017 $000’s
2016 $000’s
Summary of available facilities
Opening available syndicated debt facility 48,664 -
Facility extension during year 98,087 300,000
Debt drawn during the year (83,474) (265,336)
Debt repaid during the year 18,000 14,000
Closing available syndicated debt facility 81,277 48,664
5.0 FINANCIAL INSTRUMENTS
FINANCIAL INSTRUMENTS
(i) Non-derivative financial assets and financial liabilities – recognition and de-recognition
The Group initially recognises finance leases and receivables on the date when they are originated. All other financial assets and financial liabilities are initially recognised on the trade date.
The Group derecognises a financial asset when the contractual rights to the cash flows from the asset expire, or it transfers the rights to receive the contractual cash flows in a transaction in which substantially all of the risks and rewards of ownership of the financial asset are transferred, or it neither transfers nor retains substantially all of the risks and rewards of ownership and does not retain control over the transferred asset. Any interest in such derecognised financial assets that is created or retained by the Group is recognised as a separate asset or liability.
The Group derecognises a financial liability when its contractual obligations are discharged or cancelled, or expire.
Financial assets and liabilities are offset and the net amount presented in the statement of financial position when, and only when, the Group has a legal right to offset the amounts and intends either to settle them on a net basis or to realise the asset and settle the liability simultaneously.
(ii) Non-derivative financial assets - measurement
Loans and receivables
These assets are initially recognised at fair value plus any directly attributable transaction costs. Subsequent to initial recognition, they are measured at amortised cost using the effective interest method.
Cash and cash equivalents
Cash and cash equivalents comprise cash balances and call deposits with maturities of three months or less from the acquisition date that are subject to an insignificant risk of changes in their fair value, and are used by the Group in the management of its short-term commitments.
(iii) Non-derivative financial liabilities - measurement
Non-derivative financial liabilities are initially recognised at fair value less any directly attributable transaction costs. Subsequent to initial recognition, these liabilities are measured at amortised cost using the effective interest method.
(iv) Derivative financial instruments and hedge accounting
The Group holds derivative financial instruments to hedge its interest rate risk exposure.
Derivatives (including interest rate swaps) are recognised initially at fair value. Any directly attributable transaction costs are recognised in profit or loss as they are incurred. Subsequent to initial recognition, derivatives are remeasured to their fair value at each reporting date. SI
LVER
CH
EF L
IMIT
ED A
NN
UAL
REP
OR
T 20
17
71
NOT
ES T
O T
HE
FIN
ANCI
AL S
TATE
MEN
TS
For
per
sona
l use
onl
y

5.0 FINANCIAL INSTRUMENTS (CONTINUED)The Group documents at the inception of the hedging transaction the relationship between the hedging instrument and hedged item, as well as its risk management objective and strategy for undertaking the hedge transaction. The Group also documents its assessment, both at hedge inception and on an ongoing basis, of whether the derivatives that are used in hedging transactions have been and will continue to be highly effective in offsetting changes in fair values or cash flows of hedged items.
The Group’s interest rate swaps are designated as a cash flow hedging instrument. When a derivative is designated as a cash flow hedging instrument, the effective portion of changes in the fair value of the interest rate swap derivative is recognised in other comprehensive income and accumulated in the cash flow hedge reserve. Any ineffective portion of changes in the fair value of the derivative is recognised immediately in profit or loss.
A. FINANCIAL RISK MANAGEMENT
(i) Overview
The Group’s principal financial instruments comprise receivables, payables, loans, interest rate swap, borrowings, cash and cash equivalents.
The Group has exposure to the following risks from its use of financial instruments:
• credit risk;
• liquidity risk; and
• market risk.
This note presents information about the Group’s exposure to each of the above risks, the Group’s objectives, policies and processes for measuring and managing risk and the Group’s management of capital.
(ii) Risk management framework
The Board has overall responsibility for the establishment and oversight of the Group’s risk management framework. The Board has established the Audit and Risk Management Committee (“ARM Committee”), which is responsible for developing and monitoring the Group’s risk management policies. The ARM Committee reports regularly to the Board on its activities.
The Group’s risk management policies are established to identify and analyse the risks faced by the Group, to set appropriate risk limits and controls, and to monitor risks and adherence to limits. Risk management policies and systems are reviewed regularly to reflect changes in market conditions and the Group’s activities. The Group, through its training and management standards and procedures, aims to develop a disciplined and constructive control environment in which all employees understand their roles and obligations.
The ARM Committee oversees how management monitors compliance with the Group’s risk management policies and procedures and reviews the adequacy of the risk management framework in relation to the risks faced by the Group.
Responsibility for control and risk management is delegated to the appropriate level of management within the Group with the Chief Executive Officer and Chief Financial Officer having ultimate responsibility to the Board for the Group’s risk management and internal control activities. Arrangements put in place by the Board to monitor risk management include:
• regular monthly reporting to the Board in respect of operations and the financial position of the Group;
• reports by the Chairman of the ARM Committee and circulation to the Board of the minutes of each meeting held by the ARM Committee;
• reports to the Board from the internal auditor on internal controls;
• presentations made to the Board throughout the year by appropriate members of the Group’s leadership team (and/or independent advisers, where necessary) on the nature of particular risks and details of the measures which are either in place or can be adopted to manage or mitigate the risk; and
• any Director may request that operational and project audits be undertaken by management.
SILV
ER C
HEF
LIM
ITED
AN
NUA
L R
EPO
RT
2017
72
For
per
sona
l use
onl
y

5.0 FINANCIAL INSTRUMENTS (CONTINUED)
B. CREDIT RISK
Credit risk is the risk of financial loss to the Group if a customer or counterparty to a financial instrument fails to meet its contractual obligations, and arises principally from the Group’s receivables from customers.
(i) Exposure to credit risk
The carrying amount of financial assets represents the maximum exposure. The maximum exposure to credit risk at the reporting date was as follows:
2017 $000’s
2016 $000’s
Cash and cash equivalents 7,307 5,676
Trade and other receivables 50,312 21,040
Finance lease receivables 99,526 65,301
157,145 92,017
(ii) Trade and other receivables
The Group’s exposure to credit risk is influenced mainly by the individual characteristics of each customer. Each customer is assessed for creditworthiness and on their potential to service their rental agreement. The credit approval process is tiered depending on the total contract exposure of each customer.
The Group’s exposure to credit risk is minimised through the nature of its business model. Rental payments are received in advance by direct debit which provides opportunities to identify delinquent customers early. Security is held against most contracts by a security bond paid by the customer at the beginning of the contract and the Group maintains title over the rental assets. In some cases, where the individual client exposure is higher than the average contract, personal guarantees or other collateral may be obtained.
In monitoring customer credit risk, customers who are in arrears are grouped together according to the likelihood of successful repayment or recovery. An estimate for incurred losses is then made after taking into account the bond held to offset any losses.
The Group has established an allowance for impairment that represents the estimate of incurred losses in respect of trade and other receivables.
The ageing of trade receivables at 30 June is detailed below:
2017 $000’s
2016 $000’s
Gross Allowance Gross Allowance
Not past due 2,500 - 1,228 -
Past due 1–4 weeks 5,278 (284) 4,287 (239)
Past due 5–7 weeks 2,922 (238) 1,723 (230)
Past due 8–12 weeks 4,038 (516) 2,110 (444)
Past due + 12 weeks 35,462 (11,316) 11,254 (4,752)
Total trade receivables 50,200 (12,354) 20,602 (5,665)
Receivables past due but not considered impaired in the Group is $35,346,000 (2016: $13,709,000). Management is satisfied that payment will be received in full or holds sufficient bond to offset amounts owed. There are bonds available of $7,965,000 (2016: $4,960,000) to be applied against the operating lease arrears position.
Other balances within trade and other receivables do not contain impaired assets and are not past due. It is expected that these other balances will be received in full. SI
LVER
CH
EF L
IMIT
ED A
NN
UAL
REP
OR
T 20
17
73
NOT
ES T
O T
HE
FIN
ANCI
AL S
TATE
MEN
TS
For
per
sona
l use
onl
y

5.0 FINANCIAL INSTRUMENTS (CONTINUED)The movement in the allowance for impairment in respect of trade receivables during the year was as follows:
2017 $000’s
2016 $000’s
Balance at 1 July 5,665 3,636
Impairment loss recognised 10,703 6,095
Amounts written off (4,014) (4,066)
Balance at 30 June 12,354 5,665
(iii) Bonds
Included in the consolidated current liabilities at 30 June 2017 is an amount of $29,666,000 of customer security bonds (30 June 2016: $32,867,000). The security bonds are an important part of the Group’s business model and in commercial terms, perform as follows:
• The bonds are taken as a cash deposit from the customer at the inception of the contract;
• The bonds are used by the Group as security over any defaults, excessive repatriation costs or damaged assets;
• The Group retains control over the bonds and they form a part of the Group’s operating cash flows;
• Bond refunds occur in two instances: when the customer returns the asset at the completion of the contract (after deducting any amounts for arrears and repatriation expenses), or when the customer purchases the asset from the Group (after deducting any amounts for arrears). In the majority of cases where the customer purchases the asset, their bond will be refunded once the Group has received payment for the asset, making the transaction net cash flow positive; and
• Those bonds attached to a long term contract remain payable until the maturity date of the contract. If the customer takes the option to purchase the asset it will form part of the purchase price.
Except for those security bonds which are attached to a rental contract with a maturity date greater than 12 months, customer security bonds are classified as current as the Group does not have the unconditional right to defer repayment of the bonds for a period greater than 12 months in the majority of cases. In practice, not all customer security bonds are refunded within 12 months.
The balance of the bond liability is affected by movements in the rental asset base. Any decrease in the bond liability will usually be timed with the disposal of rental assets.
(iv) Finance lease receivables
The Group also provides longer term asset rentals which are recognised as finance leases. To qualify for one of the long term rental arrangements, a customer must have rented their assets for a period of 12 months on an operating lease with a good payment history before converting to a long term rental contract, or be eligible for a long term franchise finance lease. The Group has recourse to the underlying asset which provides additional credit risk protection in the event of customer default.
The ageing of finance lease receivables at 30 June is detailed below:
2017 $000’s
2016 $000’s
Gross Allowance Gross Allowance
Not past due 73,028 - 53,299 -
Past due 1–4 weeks 8,476 (67) 5,501 (12)
Past due 5–7 weeks 3,574 (87) 1,594 (7)
Past due 8–12 weeks 2,531 (85) 1,617 (15)
Past due + 12 weeks 11,917 (1,479) 3,290 (187)
Total finance lease receivables 99,526 (1,718) 65,301 (221)
SILV
ER C
HEF
LIM
ITED
AN
NUA
L R
EPO
RT
2017
74
For
per
sona
l use
onl
y

5.0 FINANCIAL INSTRUMENTS (CONTINUED)Finance lease receivables past due but not considered impaired in the Group is $24,780,000 (2016: $11,781,000). There are bonds available of $861,000 (FY16: $596,000) to be applied against the finance lease arrears position.
The movement in the allowance for impairment in respect of finance lease receivables during the year was as follows:
2017 $000’s
2016 $000’s
Balance at 1 July 221 124
Impairment loss recognised 1,920 153
Amounts written off (423) (56)
Balance at 30 June 1,718 221
(v) Cash and cash equivalents
The Group held cash and cash equivalents of $7,307,000 at 30 June 2017 (2016: $5,676,000), which represents its maximum credit exposure on these assets. The cash and cash equivalents are held with bank counterparties with a credit rating of AA- or better.
C. LIQUIDITY RISK
Liquidity risk is the risk that the Group will encounter difficulty in meeting the obligations associated with its financial liabilities that are settled by delivering cash or another financial asset. The Group’s approach to managing liquidity is to ensure, as far as possible, that it will always have sufficient liquidity to meet its liabilities when due, under both normal and stressed conditions, without incurring unacceptable losses or risking damage to the Group’s reputation.
The Group aims to maintain the level of its cash and cash equivalents at an amount in excess of expected net cash outflows over the succeeding 30 days. In addition, the Group maintains a level of undrawn finance facilities which are detailed in note 4.3.
The following are the contractual maturities of financial liabilities, including estimated interest payments:
30 June 2017
Less than 6 months
$000’s
6–12 months $000’s
More than 1 and less
than 5 years $000’s
More than 5 years $000’s
Total $000’s
Non-derivative financial instruments
Trade accounts payable 10,298 - - - 10,298
Customer security bonds 21,671 7,996 5,730 - 35,397
Secured bank facilities 6,148 6,148 332,006 - 344,302
Finance lease liabilities - - - - -
38,117 14,144 337,736 - 389,997
30 June 2016
Non-derivative financial instruments
Trade accounts payable 7,475 - - - 7,475
Customer security bonds 20,151 12,716 6,069 - 38,936
Secured bank facilities 5,072 5,072 272,764 - 282,908
Finance lease liabilities 265 221 - - 486
32,963 18,009 278,833 - 329,805
SILV
ER C
HEF
LIM
ITED
AN
NUA
L R
EPO
RT
2017
75
NOT
ES T
O T
HE
FIN
ANCI
AL S
TATE
MEN
TS
For
per
sona
l use
onl
y

5.0 FINANCIAL INSTRUMENTS (CONTINUED)The Group’s secured bank facilities contain debt covenants, a breach of which may require the Group to repay the facility earlier than indicated in the above table. The interest payments on variable interest rate loans in the table above reflect market forward interest rates at the period end and these amounts may change as market interest rates change. Except for these financial liabilities, it is not expected that the cash flows included in the maturity analysis could occur significantly earlier, or by significantly different amounts.
As disclosed in Note 5.0 B. (iii), the Group holds customer security bonds as part of its business model. The repayment of these security bonds will normally be timed with the paying out of a contract and/or the return of rental assets.
D. MARKET RISK
Market risk is the risk that changes in market prices, such as interest rates, will affect the Group’s income or the value of its holdings of financial instruments. The objective of market risk management is to manage and control market risk exposures within acceptable parameters, while optimising the return.
At balance date, the Group had the following mix of financial assets and liabilities exposed to Australian variable interest rate risk:
2017 $000’s
2016 $000’s
Financial assets – current
Cash and cash equivalents 7,307 5,676
Financial liabilities – non current
Secured bank facilities 316,810 251,336
At 30 June 2017, if interest rates had moved, as illustrated in the table below, with all other variables held constant, post tax profit and equity would have been affected as follows:
Post tax profit Higher/(lower)
Equity Higher/(lower)
2017 $000’s
2016 $000’s
2017 $000’s
2016 $000’s
+0.5% (50 basis points) (721) (510) - -
-0.5% (50 basis points) 721 510 - -
(i) Derivatives
2017 $000’s
2016 $000’s
Interest rate swap at fair value 654 1,404
Total derivatives 654 1,404
The Company commenced using an interest rate swap as a derivative financial instrument effective from 7 December 2015 to manage its interest rate risk as permitted under the Group’s risk management policy. It is being used exclusively for hedging purposes and not for trading or speculative purposes.
Silver Chef has an interest rate swap agreement to fix the floating interest rate component for $100 million of its debt facility for three years maturing December 2018. The interest rate swap agreement entitles the Company to receive monthly interest at a floating rate on the notional value of $100 million and obligates it to pay monthly interest at a fixed rate.
The interest rate swap is designated as a cash flow hedging instrument. Accordingly, the effective portion of changes in the fair value of the interest rate swap is recognised in other comprehensive income and accumulated in the cash flow hedge reserve. Any ineffective portion of changes in the fair value of the derivative is recognised immediately in profit or loss. SI
LVER
CH
EF L
IMIT
ED A
NN
UAL
REP
OR
T 20
17
76
For
per
sona
l use
onl
y

5.0 FINANCIAL INSTRUMENTS (CONTINUED)
(ii) Fair value hierarchy
A number of the Group’s accounting policies and disclosures require the determination of fair value, for both financial and non-financial assets and liabilities. When measuring the fair value of an asset or a liability, the Group uses observable market data as far as possible. Fair values are categorised into different levels in a fair value hierarchy based on the inputs used in the valuation techniques as follows:
• Level 1: quoted prices (unadjusted) in active markets for identical assets or liabilities
• Level 2: inputs other than quoted prices included in Level 1 that are observable for the asset or liability, either directly (ie. as prices) or indirectly (ie. derived from prices)
• Level 3: inputs for the asset or liability that are not based on observable market data (unobservable inputs)
When applicable, further information about the assumptions made in determining fair values is disclosed in the notes specific to that asset or liability.
Non-derivative financial liabilities
Other non-derivative financial liabilities are measured at fair value, at initial recognition and for disclosure purposes, at each annual reporting date. Fair value is calculated based on the present value of future principal and interest cash flows, discounted at the market rate of interest at the measurement date. In respect of the liability component of finance leases, the market rate of interest is determined by reference to similar lease agreements.
Derivative financial instruments
Derivatives such as interest rate swaps, are initially recognised at fair value on the date on which a derivative contract is entered into and are subsequently remeasured at fair value. Derivatives are carried as financial assets when the fair value is positive and as financial liabilities when the fair value is negative.
The table below analyses recurring fair value measurements for financial assets and financial liabilities.
Level 1 $000’s
Level 2 $000’s
Level 3 $000’s
Total $000’s
Derivatives
Interest rate swap used for hedging – 30 June 2016 - 1,404 - 1,404
Interest rate swap used for hedging – 30 June 2017 - 654 - 654
Total financial liabilities carried at fair value - 654 - 654
The interest rate swap is measured at fair value based on the mark to market value quoted for forward interest rate swaps. These quotes are tested for reasonableness by discounting expected future cash flows using forward market interest rates for a similar instrument at the measurement date.
Cash and cash equivalents
The carrying amount is an approximation of fair value as they are short term in nature or are receivable on demand.
Lease and trade receivables
The fair value of lease receivables is estimated by recalculating the receivable at the current effective rental rate as if the contract were entered into as at 30 June 2017.
The carrying value of trade receivables is an approximation of fair values as they are short term in nature.
Payables
The carrying amount of payables is an approximation of fair values as they are short term in nature.
Borrowings
The fair value of borrowings is estimated by discounting the future contractual cash flows at the current market interest rate that is available to the Group. SI
LVER
CH
EF L
IMIT
ED A
NN
UAL
REP
OR
T 20
17
77
NOT
ES T
O T
HE
FIN
ANCI
AL S
TATE
MEN
TS
For
per
sona
l use
onl
y

5.0 FINANCIAL INSTRUMENTS (CONTINUED)Set out below is a comparison of the carrying amounts and fair values of financial assets and liabilities as at 30 June 2017 and 30 June 2016.
30 June 2017 30 June 2016
Carrying amount $000’s
Fair value $000’s
Carrying amount $000’s
Fair value $000’s
Financial assets
Cash and cash equivalents 7,307 7,307 5,676 5,676
Trade and other receivables 37,956 37,956 15,375 15,375
Lease receivables 97,807 97,807 65,080 65,080
Financial liabilities
Payables 13,138 13,138 9,319 9,319
Borrowings 316,810 316,810 251,336 251,336
Derivatives 654 654 1,404 1,404
(iii) Currency risk
The Group’s exposure to currency risk was minimised by setting up facility limits to be drawn in all three functional currencies of the Group under its syndicated debt facility – Australian dollars (AUD), New Zealand dollars (NZD) and Canadian dollars (CAD). The existing limits are comprised of AUD$348 million, AUD$20 million drawable in either NZD or AUD, and a limit of CAD$30 million. The currency of borrowings can now be matched to the cash flows underlying the operations of the Group but the currency in which borrowings are primarily denominated is the AUD.
The Group monitors its exposure to currency risk and considers existing positions, obtaining loans in currencies that match the cash flows generated by the operations of the Group and alternate hedging positions.
6.0 EMPLOYEE REMUNERATION AND BENEFITS
6.1 EMPLOYEE BENEFITS
(i) Long-term employee benefits
The Group’s net obligation in respect of long-term employee benefits is the amount of future benefit that employees have earned in return for their service in the current and prior periods. That benefit is discounted to determine its present value.
(ii) Short-term employee benefits
Short-term employee benefit obligations are expensed as the related service is provided. A liability is recognised for the amount expected to be paid if the Group has a present legal or constructive obligation to pay this amount as a result of past service provided by the employee and the obligation can be estimated reliably.
2017 $000’s
2016 $000’s
Current
Annual leave payable 1,995 1,651
Long service leave payable 191 193
Other employee benefits payable 17 361
2,203 2,205
Non-current
Long service leave payable 397 412
Other employee benefits payable - 864
397 1,276SILV
ER C
HEF
LIM
ITED
AN
NUA
L R
EPO
RT
2017
78
For
per
sona
l use
onl
y

7.0 OTHER
7.1 CASH AND CASH EQUIVALENTS
For the purpose of presentation in the statement of cash flows, cash and cash equivalents includes cash on hand and deposits held at call with financial institutions. Cash is held in operating bank accounts with financial institutions with a credit rating of AA- or better.
2017 $000’s
2016 $000’s
Bank balances 7,307 5,676
Cash and cash equivalents in the statement of cash flows 7,307 5,676
7.2 RECONCILIATION OF CASH FLOWS FROM OPERATING ACTIVITIES
2017 $000’s
2016 $000’s
Profit for the year 20,245 22,356
Adjustments for:
Depreciation 110,457 82,988
Amortisation of deferred upfront costs 22,832 11,428
Amortisation of borrowing costs 611 877
Amortisation of intangible assets 934 498
Impairment loss on receivables 8,186 2,126
Impairment provision on rental assets 16,289 9,006
Loss on sale of fixed assets 9,183 9,128
Deferral of commissions (19,472) (23,662)
Change in tax assets and liabilities 1,241 2,738
Change in trade receivables (34,017) (14,700)
Change in lease receivables 17,041 8,366
Change in other current assets (1,151) (810)
Change in creditors and accruals 3,698 3,910
Change in deferred revenue, advances and bonds (2,544) 3,935
Change in provision for employee benefits (663) 1,557
Net cash from operating activities 152,870 119,741
7.3 AUDITOR REMUNERATION
2017 $000’s
2016 $000’s
Audit and review of financial reports 164,500 129,000
Services other than audit work
Taxation services 136,763 89,472
Other services 3,912 15,000
305,175 233,472
SILV
ER C
HEF
LIM
ITED
AN
NUA
L R
EPO
RT
2017
79
NOT
ES T
O T
HE
FIN
ANCI
AL S
TATE
MEN
TS
For
per
sona
l use
onl
y

7.4 COMMITMENTS AND CONTINGENCIES
Bank guarantees totalling $775,810 exist at 30 June 2017 (2016: $593,000)
Leases – Group is lessee
Lease payments
Payments made under operating leases are recognised in profit or loss on a straight-line basis over the term of the lease. Lease incentives received are recognised as an integral part of the total lease expense, over the term of the lease.
Minimum lease payments made under finance leases are apportioned between the finance expense and the reduction of the outstanding liability. The finance expense is allocated to each period during the lease term so as to produce a constant periodic rate of interest on the remaining balance of the liability.
Operating leases – Group is lessee
2017 $000’s
2016 $000’s
Leases as lessee
Not later than one year 1,772 1,234
Later than one year not later than five years 4,867 4,630
More than five years - -
6,639 5,864
The Group leases its office and warehouse facilities under operating leases. The leases run for up to 10 years, with an option to renew after the expiry date. The total operating lease expense recognised in profit or loss for the year ended 30 June 2017 was $1,949,000 (2016: $1,405,000).
7.5 PARENT ENTITY INFORMATION
As at, and throughout the financial year ended 30 June 2017, the parent company of the Group was Silver Chef Limited.
2017 $000’s
2016 $000’s
Result of the parent entity
Profit for the year 10,335 9,728
Other comprehensive income 525 (983)
Total comprehensive income for the period 10,860 8,745
Financial position of the parent entity at year end
Current assets 65,137 54,268
Total assets 456,604 372,429
Current liabilities 2,226 3,840
Total liabilities 309,398 260,823
Total equity of the parent entity comprising of:
Share capital 119,328 90,556
Retained earnings 28,336 22,033
Cash flow hedge reserve (458) (983)
Total equity 147,206 111,606
Parent entity guarantees in respect of debts of its subsidiaries
The parent entity is part of the Group loan arrangement for the syndicated banking facility which secures the Group’s assets against that facility. SI
LVER
CH
EF L
IMIT
ED A
NN
UAL
REP
OR
T 20
17
80
For
per
sona
l use
onl
y

7.5 PARENT ENTITY INFORMATION (CONTINUED)
The parent entity has entered into a Deed of Cross Guarantee with the effect that the Company guarantees debts in respect of certain subsidiaries.
Further details of the Deed of Cross Guarantee and the subsidiaries subject to the deed are disclosed in note 7.6.
7.6 CONTROLLED ENTITIES
Balance date
Country of incorporation % of Shares held
2017 2016
Silver Chef Finance Company Limited 30 June Australia 100 100
Silver Chef Rentals Pty Ltd 30 June Australia 100 100
GoGetta Equipment Funding Pty Ltd 30 June Australia 100 100
Silver Chef Rentals Limited 30 June New Zealand 100 100
Launch Point Pty Ltd 30 June Australia 100 100
Silver Chef Rentals Inc 30 June Canada 100 100
Silver Chef Foundation Pty Ltd (Trustee for Silver Chef Foundation)
30 June Australia 100 -
7.7 DEED OF CROSS GUARANTEE
Pursuant to ASIC Class Order 98/1418 (as amended) dated 13 August 1998, the wholly-owned subsidiaries listed above are relieved from the Corporations Act 2001 requirements for preparation, audit and lodgement of financial reports, and Directors’ reports.
It is a condition of the Class Order that the Company and the Australian subsidiaries (excluding Silver Chef Foundation Pty Ltd) enter into a Deed of Cross Guarantee. The effect of the Deed is that the Company guarantees to each creditor payment in full of any debt in the event of winding up of the subsidiaries under certain provisions of the Corporations Act 2001. If a winding up occurs under other provisions of the Act, the Company will only be liable in the event that after six months any creditor has not been paid in full. The subsidiaries have also given similar guarantees in the event that the Company is wound up.
In 2017, the subsidiaries subject to the Deed were Silver Chef Finance Company Limited, Silver Chef Rentals Pty Ltd and GoGetta Equipment Funding Pty Ltd.
A consolidated statement of profit or loss and other comprehensive income and consolidated statement of financial position, comprising the Company and controlled entities which are a party to the Deed, after eliminating all transactions between parties to the Deed of Cross Guarantee, at 30 June 2017 is set out as follows:
Statement of profit or loss and other comprehensive income
2017 $000’s
2016 $000’s
Revenue 263,982 206,754
Expenses from ordinary activities (217,007) (156,565)
Finance costs (12,415) (10,730)
Loss on sale of plant and equipment (8,529) (8,401)
Profit before income tax 26,031 31,058
Tax expense (7,293) (9,221)
Profit after income tax 18,738 21,837
Other comprehensive income 458 (983)
Total comprehensive income attributable to members of the parent 19,196 20,854
SILV
ER C
HEF
LIM
ITED
AN
NUA
L R
EPO
RT
2017
81
NOT
ES T
O T
HE
FIN
ANCI
AL S
TATE
MEN
TS
For
per
sona
l use
onl
y

7.7 DEED OF CROSS GUARANTEE (CONTINUED)
Statement of financial position
2017 $000’s
2016 $000’s
Assets
Cash and cash equivalents 5,639 3,320
Trade and other receivables 70,765 35,399
Current tax receivable - 1,583
Other assets 2,551 1,568
Total current assets 78,955 41,870
Trade and other receivables 75,183 58,734
Property plant and equipment 341,343 311,278
Intangibles 3,738 3,025
Deferred tax assets 11,153 4,184
Total non-current assets 431,417 377,221
Total assets 510,372 419,091
Liabilities
Trade and other payables 37,730 37,825
Loans and borrowings - 467
Current tax payable 7,299 -
Employee benefits 2,095 2,145
Total current liabilities 47,124 40,437
Non-current liabilities
Trade and other payables 5,760 6,126
Loans and other borrowings 292,837 240,974
Employee benefits 397 1,276
Derivative financial instruments 654 1,404
Total non-current liabilities 299,648 249,780
Total liabilities 346,772 290,217
Net assets 163,600 128,874
Equity
Share capital 119,330 90,556
Retained earnings 44,728 39,301
Reserves (458) (983)
Total equity 163,600 128,874
SILV
ER C
HEF
LIM
ITED
AN
NUA
L R
EPO
RT
2017
82
For
per
sona
l use
onl
y

7.8 RELATED PARTIES
(a) Key management personnel compensation
The key management personnel compensation comprised:
2017 $
2016 $
Short-term employee benefits 1,276,054 1,441,296
Other long-term benefits (80,000) 80,000
Post-employment benefits 95,494 107,090
1,291,548 1,628,386
(b) Individual Directors and executives compensation disclosures
Information regarding individual Directors and executives’ compensation and some equity instruments disclosures as required by Corporations Regulation 2M.3.03 is provided in the remuneration report section of the Directors’ report.
Apart from the details disclosed in this note, no Director has entered into a material contract with the Group since the end of the previous financial year and there were no material contracts involving Directors’ interests existing at year-end.
The aggregate amount recognised during the year relating to Directors and their personally-related entities, amounted to $621,753 (2016: $768,882). Details of the transactions are as follows:
Director Transaction Note2017
$2016
$
Bede King Legal advice (i) 96,822 102,323
Sophie Mitchell Management and underwriting fees (ii) 524,931 666,559
621,753 768,882
(i) Legal fees paid to Tobin King Lateef, a law firm in which Bede King is a partner. Services provided were on commercial terms as one of the Company’s panel of legal firms.
(ii) Fees paid to Morgans, a company in which Sophie Mitchell is a director, for services provided jointly with Wilsons Corporate Finance Ltd, arising from capital raising on commercial terms.
During FY17, the Group sold a number of assets to an entity associated with Mr Allan English that had been returned from a cancelled rental contract. The returned assets were sold by the Company at their written down value at the time of sale and an independent valuation report was sought to ensure the transaction was considered at arm’s length.
7.9 EVENTS SUBSEQUENT TO BALANCE DATE
A dividend of 25.1 cents per share, fully franked was declared by the Directors on 28 August 2017. The dividend has not been provided for in the 30 June 2017 financial report. The Dividend Reinvestment Plan has been reinstated.
SILV
ER C
HEF
LIM
ITED
AN
NUA
L R
EPO
RT
2017
83
NOT
ES T
O T
HE
FIN
ANCI
AL S
TATE
MEN
TS
For
per
sona
l use
onl
y

DIRECTORS’ DECLARATION
1. In the opinion of the directors of Silver Chef Limited (the Company):
(a) the consolidated financial statements and notes that are set out on pages 51 to 83 and the Remuneration report in section 4.3 in the Directors’ report, are in accordance with the Corporations Act 2001, including:
(i) giving a true and fair view of the Group’s financial position as at 30 June 2017 and of its performance, for the financial year ended on that date; and
(ii) complying with Australian Accounting Standards and the Corporations Regulations 2001; and
(b) there are reasonable grounds to believe that the Company will be able to pay its debts as and when they become due and payable.
2. There are reasonable grounds to believe that the Company and the group entities identified in note 7.6 will be able to meet any obligations or liabilities to which they are or may become subject to by
virtue of the Deed of Cross Guarantee between the Company and those group entities pursuant to ASIC Class Order 98/1418.
3. The directors have been given the declarations required by Section 295A of the Corporations Act 2001 from the Executive Chairman and Chief Financial Officer for the financial year ended 30 June 2017.
4. The directors draw attention to note 1.0 to the consolidated financial statements, which includes a statement of compliance with International Financial Reporting Standards.
Signed in accordance with a resolution of the directors.
Allan English Non-Executive Chairman
28 August 2017
SILV
ER C
HEF
LIM
ITED
AN
NUA
L R
EPO
RT
2017
84
For
per
sona
l use
onl
y

KPMG, an Australian partnership and a member firm of the KPMG network of independent member firms affiliated with KPMG International Cooperative (“KPMG International”), a Swiss entity.
Liability limited by a scheme approved under Professional Standards Legislation.
Independent Auditor’s Report
To the shareholders of Silver Chef Limited
Report on the audit of the Financial Report
Opinion
We have audited the Financial Report of Silver Chef Limited (the Company).
In our opinion, the accompanying Financial Report of the Company is in accordance with the Corporations Act 2001, including:
• giving a true and fair view of theGroup’s financial position as at 30June 2017 and of its financialperformance for the year ended onthat date; and
• complying with Australian AccountingStandards and the CorporationsRegulations 2001.
The Financial Report comprises:
• Consolidated statement of financial position as at 30June 2017;
• Consolidated statement of profit or loss and othercomprehensive income, consolidated statement ofchanges in equity, and consolidated statement ofcash flows for the year then ended;
• Notes including a summary of significant accountingpolicies; and
• The Directors’ Declaration.
The Group consists of the Company and the entities it controlled at the year-end or from time to time during the financial year.
Basis for opinion
We conducted our audit in accordance with Australian Auditing Standards. We believe that the audit evidence we have obtained is sufficient and appropriate to provide a basis for our opinion.
Our responsibilities under those standards are further described in the Auditor’s responsibilities for the audit of the Financial Report section of our report.
We are independent of the Company and Group in accordance with the Corporations Act 2001 and the ethical requirements of the Accounting Professional and Ethical Standards Board’s APES 110 Code of Ethics for Professional Accountants (the Code) that are relevant to our audit of the Financial Report in Australia. We have fulfilled our other ethical responsibilities in accordance with the Code.
SILV
ER C
HEF
LIM
ITED
AN
NUA
L R
EPO
RT
2017
85
DEC
LAR
ATIO
NS
AND
REP
ORT
S
For
per
sona
l use
onl
y

Key Audit Matters
The Key Audit Matters we identified are:
• Impairment of trade and finance leasereceivables; and
• Impairment of rental assets.
Key Audit Matters are those matters that, in our professional judgement, were of most significance in our audit of the Financial Report of the current period.
These matters were addressed in the context of our audit of the Financial Report as a whole, and in forming our opinion thereon, and we do not provide a separate opinion on these matters.
Provision for impairment of trade and finance lease receivables (AUD $ 14.1m)
Refer to Note 3.3 and 5(b) to the financial report
The key audit matter How the matter was addressed in our audit
Our audit attention focussed on impairment of trade and lease receivables as a key audit matter as these balances represent a significant source of credit risk to the Group.
The Group segments overdue receivables into risk profiles through the assignment of a credit code. The impairment provision is determined based on an expected loss rate assigned for each credit code which reflects historical experience and management estimates.
The assignment of credit codes and the expected loss rates present challenges from an audit perspective given the nature of the receivables portfolio being a large number of relatively low value contracts and the estimates that have been applied.
Our procedures included:
• Testing key internal controls that are designedto identify contracts where a scheduledpayment has not been received and that thecredit code has been assigned in accordancewith the Group’s policy;
• Assessing the adequacy of the impairmentprovision relating to a sample of receivablesselected on the basis of the amountoutstanding net of the impairment provision.Our testing included challenging the assignedcredit code through inspection of the latestcorrespondence with the lessee, enquirieswith the collection team and forming our ownview as to the likelihood of recovery from anysecurity held;
• We assessed the expected loss rate for asample of credit codes through comparison tocurrent recovery action and investigatedsignificant differences;
• Identifying lease receivables over twelveweeks in arrears that have been assigned acredit code with a low expected loss rate. Ourtesting investigated whether the assignedcredit codes results in a provision estimate thatappropriately reflects the increased credit riskprofile of this pool of receivables; and
• Recalculating the impairment provision basedon the value of lease contracts in the creditcode category.
SILV
ER C
HEF
LIM
ITED
AN
NUA
L R
EPO
RT
2017
86
For
per
sona
l use
onl
y

Provision for impairment of rental assets (AUD $11.9m)
Refer to Note 3.1 to the financial report
The key audit matter How the matter was addressed in our audit
Impairment assessments relating to rental assets are a key audit matter due to the significant value of these assets, being 69% of the Group’s total assets and the estimates applied by management to assess the assets’ recoverable amounts. Our audit focussed on the recoverable amount estimates for idle assets and suspended assets due to the increased risk of impairment associated with these assets and the external fraud that occurred in the financial year.
Idle assets are those assets that have been returned to the Group and have been warehoused for reconditioning or are being held on consignment by external vendors. The recoverable amount for each asset is estimated by management based on expected re-leasing rates and historical sales information for that portion of the asset pool which is proposed to be sold.
Suspended assets represent equipment currently leased to customers where there is significant doubt on the ability of the customer to meet rental payments and the asset is in the process of recovery. The impairment assessments relating to suspended assets are challenging to audit as the assets are still in the possession of the customer and therefore the location and physical condition of the asset is in the process of being determined. The Group segments suspended assets into risk profiles through the assignment of a credit codes similar to those used in assessing the impairment of lease receivables. The recoverable amount is based on an expected loss rate assigned for each credit code which reflects historical experience and management estimates.
Our procedures included:
• Testing key internal controls that identifycontracts where a scheduled payment has notbeen received and the assignment of a creditcode to rental asset balances in accordancewith the Group’s policy;
• Inspecting the existence and condition of asample of idle assets held by external vendors;
• Attending counts of equipment at the Group’swarehouse facilities. We tested a sample ofequipment for physical existence and assetcondition. We considered whether therecoverable amount reflected the age,condition and recovery strategy assigned tothe equipment;
• Assessing the recoverable amount againsthistorical sales information and re-leasingrates for idle assets;
• Identifying suspended assets where apayment has not been received for over twelveweeks that have been assigned a credit codewith a low expected loss rate. Our testingchallenged whether the assessed recoverableamount results in an impairment estimate thatappropriately reflects the increased risk profilefor this pool of rental assets;
• Identifying equipment subject to external fraudand evaluating the level of provision allocated;and
• Recalculating the impairment provision basedon the impairment percentage and the value ofidle and suspended contract assets.
SILV
ER C
HEF
LIM
ITED
AN
NUA
L R
EPO
RT
2017
87
DEC
LAR
ATIO
NS
AND
REP
ORT
S
For
per
sona
l use
onl
y

Other Information
Other Information is financial and non-financial information in the Company’s annual reporting which is provided in addition to the Financial Report and the Auditor’s Report thereon. The Directors are responsible for the Other Information.
Our opinion on the Financial Report does not cover the Other Information and, accordingly, we do not express an audit opinion or any form of assurance conclusion thereon, with the exception of the Remuneration Report and our related assurance opinion.
In connection with our audit of the Financial Report, our responsibility is to read the Other Information. In doing so, we consider whether the Other Information is materially inconsistent with the Financial Report or our knowledge obtained in the audit, or otherwise appears to be materially misstated.
We are required to report if we conclude that there is a material misstatement of this Other Information, and based on the work we have performed on the Other Information that we obtained prior to the date of this Auditor’s Report we have nothing to report.
Responsibilities of the Directors for the Financial Report
The Directors are responsible for:
• preparing the Financial Report that gives a true and fair view in accordance with AustralianAccounting Standards and the Corporations Act 2001;
• implementing necessary internal control to enable the preparation of a Financial Report that givesa true and fair view and is free from material misstatement, whether due to fraud or error; and
• assessing the Group’s ability to continue as a going concern. This includes disclosing, asapplicable, matters related to going concern and using the going concern basis of accountingunless they either intend to liquidate the Group or to cease operations, or have no realisticalternative but to do so.
Auditor’s responsibilities for the audit of the Financial Report
Our objective is:
• to obtain reasonable assurance about whether the Financial Report as a whole is free frommaterial misstatement, whether due to fraud or error; and
• to issue an Auditor’s Report that includes our opinion.
Reasonable assurance is a high level of assurance, but is not a guarantee that an audit conducted in accordance with Australian Auditing Standards will always detect a material misstatement when it exists.
Misstatements can arise from fraud or error. They are considered material if, individually or in the aggregate, they could reasonably be expected to influence the economic decisions of users taken on the basis of this Financial Report.
A further description of our responsibilities for the Audit of the Financial Report is located at the Auditing and Assurance Standards Board website at: http://www.auasb.gov.au/auditors_files/ar2.pdf. This description forms part of our Auditor’s Report.
SILV
ER C
HEF
LIM
ITED
AN
NUA
L R
EPO
RT
2017
88
For
per
sona
l use
onl
y

Report on the Remuneration Report
Opinion
In our opinion, the Remuneration Report of Silver Chef Limited for the year ended 30 June 2017, complies with Section 300A of the Corporations Act 2001.
Directors’ responsibilities
The Directors of the Company are responsible for the preparation and presentation of the Remuneration Report in accordance with Section 300A of the Corporations Act 2001.
Our responsibilities
We have audited the Remuneration Report included in Section 4.3 of the Directors’ Report for the year ended 30 June 2017.
Our responsibility is to express an opinion on the Remuneration Report, based on our Audit conducted in accordance with Australian Auditing Standards.
KPMG Jillian Richards Partner
Brisbane 28 August 2017
SILV
ER C
HEF
LIM
ITED
AN
NUA
L R
EPO
RT
2017
89
DEC
LAR
ATIO
NS
AND
REP
ORT
S
For
per
sona
l use
onl
y

KPMG, an Australian partnership and a member firm of the KPMG network of independent member firms affiliated with KPMG International Cooperative (“KPMG International”), a Swiss entity.
Liability limited by a scheme approved under Professional Standards Legislation.
Lead Auditor’s Independence Declaration under Section
307C of the Corporations Act 2001
To: the Directors of Silver Chef Limited
I declare that, to the best of my knowledge and belief, in relation to the audit of Silver Chef Limited for the financial year ended 30 June 2017 there have been:
i. no contraventions of the auditor independence requirements as set out in theCorporations Act 2001 in relation to the audit; and
ii. no contraventions of any applicable code of professional conduct in relation to the audit.
KPMG Jillian Richards Partner
Brisbane 28 August 2017
PAR_SIG_01 PAR_NAM_01 PAR_POS_01 PAR_DAT_01 PAR_CIT_01
SILV
ER C
HEF
LIM
ITED
AN
NUA
L R
EPO
RT
2017
90
For
per
sona
l use
onl
y
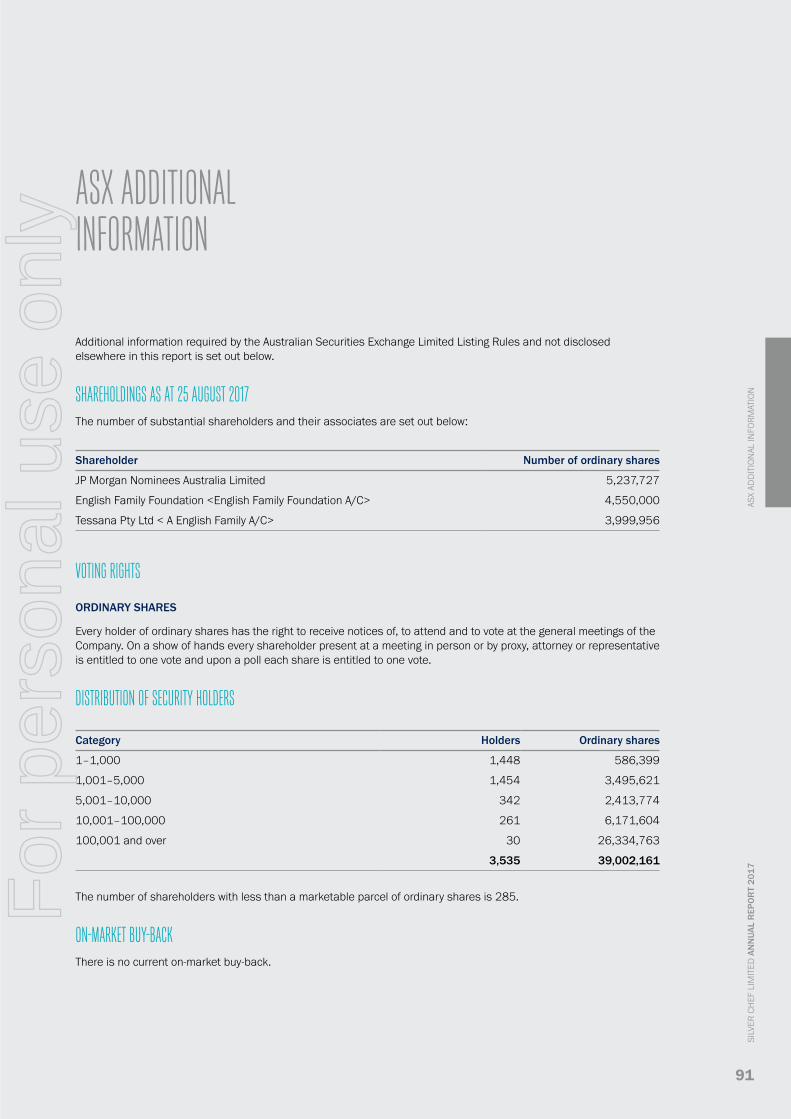
ASX ADDITIONAL INFORMATION
Additional information required by the Australian Securities Exchange Limited Listing Rules and not disclosed elsewhere in this report is set out below.
SHAREHOLDINGS AS AT 25 AUGUST 2017The number of substantial shareholders and their associates are set out below:
Shareholder Number of ordinary shares
JP Morgan Nominees Australia Limited 5,237,727
English Family Foundation <English Family Foundation A/C> 4,550,000
Tessana Pty Ltd < A English Family A/C> 3,999,956
VOTING RIGHTS
ORDINARY SHARES
Every holder of ordinary shares has the right to receive notices of, to attend and to vote at the general meetings of the Company. On a show of hands every shareholder present at a meeting in person or by proxy, attorney or representative is entitled to one vote and upon a poll each share is entitled to one vote.
DISTRIBUTION OF SECURITY HOLDERS
Category Holders Ordinary shares
1–1,000 1,448 586,399
1,001–5,000 1,454 3,495,621
5,001–10,000 342 2,413,774
10,001–100,000 261 6,171,604
100,001 and over 30 26,334,763
3,535 39,002,161
The number of shareholders with less than a marketable parcel of ordinary shares is 285.
ON-MARKET BUY-BACKThere is no current on-market buy-back.
SILV
ER C
HEF
LIM
ITED
AN
NUA
L R
EPO
RT
2017
91
ASX
ADD
ITIO
NAL
INFO
RMAT
ION
For
per
sona
l use
onl
y

ASX ADDITIONAL INFORMATION (CONTINUED)
TWENTY LARGEST SHAREHOLDERS AS AT 25 AUGUST 2017
Name
Number of ordinary
shares heldPercentage
of capital held
J P Morgan Nominees Australia Limited 5,237,727 13.429
English Family Foundation Pty Ltd <English Fam Foundation A/C> 4,550,000 11.666
Tessana Pty Ltd <A English Family A/C> 3,999,956 10.256
HSBC Custody Nominees (Australia) Limited 1,934,018 4.959
National Nominees Limited 1,535,726 3.938
BNP Paribas Noms Pty Ltd <Drp> 1,519,221 3.895
Citicorp Nominees Pty Limited 1,031,187 2.644
Blue Stamp Company Pty Ltd <Blue Stamp A/C> 771,158 1.977
Contemplator Pty Ltd <Arg Pension Fund A/C> 750,000 1.923
Ruminator Pty Ltd 750,000 1.923
HSBC Custody Nominees (Australia) Limited - A/C 2 518,153 1.329
Huntington Group Pty Limited 432,167 1.108
Australian Executor Trustees Limited <No 1 Account> 338,046 0.867
Tessana Super Fund 291,385 0.747
Mr Peter Mervyn Moon & Mrs Vicki Ann Moon <The Moon Super Fund A/C> 281,667 0.722
Huntington Investment Services Pty Ltd 227,159 0.582
Berkopy Holdings Pty Ltd 215,000 0.551
CS Third Nominess Pty Ltd 213,583 0.548
BNP Paribas Nominees Pty Ltd 212,969 0.546
Paraway Pty Ltd 201,121 0.516
25,010,243 64.125
SILV
ER C
HEF
LIM
ITED
AN
NUA
L R
EPO
RT
2017
92
For
per
sona
l use
onl
y

COMPANY DIRECTORYACN 011 045 828
NON-EXECUTIVE CHAIRMANAllan English
NON-EXECUTIVE DIRECTORSAndrew Kemp Bede King Sophie Mitchell Patrick Tapper
CHIEF EXECUTIVE OFFICERDamien Guivarra
CHIEF FINANCIAL OFFICERDoug McAlpine
COMPANY SECRETARYDon Mackenzie
REGISTERED OFFICE AND PRINCIPAL PLACE OF BUSINESS20 Pidgeon Close West End Qld 4101 Phone: 07 3335 3300 Fax: 07 3335 3399
WEBSITEsilverchefgroup.com.au
AUDITORSKPMG
SOLICITORSMcCullough Robertson
SHARE REGISTERBoardroom Pty Limited GPO Box 3993 Sydney NSW 2001
Phone: 1300 737 760 Fax: 1300 653 459 Website: boardroomlimited.com.au
SECURITIES EXCHANGEThe Company is listed on the Australian Securities Exchange
Code: Shares – SIV
OTHER INFORMATIONSilver Chef Limited, incorporated and domiciled in Australia, is a publicly listed company limited by shares
For
per
sona
l use
onl
y

For
per
sona
l use
onl
y