annual report 2017-18 - mospi.nic.in2018-6-1 · 3 of reliable and timely statistics to planners...
TRANSCRIPT

Annual Report2017-18
Government of IndiaMinistry of Statistics and Programme ImplementationSardar Patel Bhawan, Sansad Marg, New Delhi-110001
http://www.mospi.gov.in


TABLE OF CONTENTS
Sl. No. Chapters Page No.
I Introduction 1-4
II Developments & Highlights 5-12
III National Statistical Commission (NSC) 13
IV Central Statistics Office 14-53
V National Sample Survey Office 54-63
VI Statistical Services 64-66
VII Indian Statistical Institute 67-73
VIII Twenty Point Programme 74-83
IX Infrastructure and Project Monitoring 84-102
X Members of Parliament Local Area Development Scheme 103-109
XI Progressive Use of Official Language Hindi 110-111
XII Other Activities 112-116
AnnexuresIA Organisation Chart of Ministry of Statistics & Programme
Implementation117
IB Organisation Chart of National Statistical Commission 118
IC Abbreviations used 119
II Allocation of Business to the Ministry of Statistics & Programme Implementation
120-121
III Project, Seminar/Conference/Workshop and Travel Grant Assistance sanctioned during 2016-17
122
IVA Statement of Budget Estimate (SBE) -2017-18 123
IVB Total Plan Gross Budgetary Support (GBS) for 2016-17 (BE and RE) for North-Eastern Region
124
IVC Total Plan Gross Budgetary Support (GBS) for 2017-18 (BE and RE) for North-Eastern Region
125
V Performance of Monthly Monitored Items under TPP-2006 (April 2016 to March 2017)
126-127
VI Performance of Monthly Monitored Items under TPP-2006 (April 2017 to June 2017)
128-129
VII Infrastructure Sector Performance (April to September 2017) 130
VIII Month wise List of Projects completed in 2017-18 131-134
IX List of publications being brought out by various Divisions of CSO/NSSO 135-137
X Position of Action Taken Note (ATN) For the Year 2016-17 138


1
CHAPTER – I
INTRODUCTION1.1 The Ministry of Statistics and Programme Implementation (MoSPI) came into existence as an independent Ministry on 15th October 1999 after the merger of the Department of Statistics and the Department of Programme Implementation. The Ministry has two wings, one relating to Statistics and the other relating to Programme Implementation. The Statistics Wing re-designated as National Statistics Office (NSO) consists of the Central Statistics Office (CSO) and National Sample Survey Office (NSSO). CSO is an attached Office and NSSO is subordinate Office under the control of Ministry of S&PI. The Programme Implementation Wing has three Divisions, namely, (i) Twenty Point Programme (ii) Infrastructure and Project Monitoring and (iii) Member of Parliament Local Area Development Scheme. Besides these two wings, there is a National Statistical Commission (NSC) created through a Resolution of Government of India (MoSPI) and one autonomous institute viz. Indian Statistical Institute (ISI) declared as an institute of national importance by an Act of Parliament. The organisation chart of the Ministry is at Annexure–IA to IB. Abbreviations used in this report are at Annexure –IC.
1.2 The Ministry of Statistics and Programme Implementation attaches considerable importance to coverage and quality aspects of statistics released in the country. The statistics released are based on administrative sources, surveys and censuses conducted by the Central and State Governments and non-official sources and studies. The surveys conducted by the Ministry are based on scientific sampling methods and are supervised by the National Statistical Commission. Data is collected through dedicated field staff who are regularly trained in the concepts and definitions of the items and the scope of the survey. In line with the emphasis on the quality of statistics released by the Ministry, the methodological issues concerning the compilation of national accounts are overseen by an Advisory Committee on National Accounts, industrial statistics by a Standing Committee on Industrial Statistics and price and cost of living indices by a Technical Advisory Committee on Price Indices. The Ministry compiles datasets based on current data, after applying standard statistical techniques and extensive scrutiny and supervision.
1.3 India is a subscriber to the International Monetary Fund’s (IMF) Special Data Dissemination Standards (SDDS) and is currently fulfilling the Standards. The Ministry maintains an ‘Advance Release Calendar’ for its data categories covered under the SDDS, which is disseminated on the Ministry’s website as well as on the Dissemination Standards Bulletin Board (DSBB) of the IMF. The Ministry releases the datasets covered under the Real Sector of SDDS through press notes and its web-site simultaneously. The Ministry has been designated as the Nodal Ministry to facilitate the implementation of the SAARC Social Charter in India. The Ministry is entrusted with the Statistical tracking of Millennium Development Goals in India. The Ministry organises technical meetings on a

2
regular basis on various topics to assess the data-gaps in the system and the quality of statistics currently released. The CSO staff participates in meetings and seminars organised by international and regional organisations such as the United Nations Economic and Social Commission for Asia and the Pacific (UNESCAP), on statistical compilations and international practices. India has a strong system of official statistics and is among the leading countries in the area of official statistics. The Ministry’s officials have been associated with international agencies on the development of methodologies, particularly in the areas of national accounts, informal sector statistics, large-scale sample surveys, conduct of censuses, service sector statistics, non-observed economy, social sector statistics, environmental statistics and classifications. The contribution of the Ministry’s officials in international meetings on these subjects is highly appreciated.
1.4 Statistics Day: In recognition of the notable contributions made by (Late) Professor Prasanta Chandra Mahalanobis in the field of economic planning and statistical development, the Government of India has designated 29th June every year, coinciding with his birth anniversary, as the Statistics Day in the category of Special Day to be celebrated at the national level. The objective of celebrating this Special Day is to create public awareness, among the people, especially the younger generation, for drawing inspiration from (Late) Prof. Mahalanobis about the role of statistics in socio-economic planning and policy formulation.
1.5 The 11th Statistics Day was celebrated on 29th June 2017 all over India by the Ministry of Statistics and Programme Implementation, State Governments, Office of National Sample Survey Offices spread throughout the country, Indian Statistical Institute (ISI), Universities/Departments, etc. by organizing Seminars, Conferences, Debates, Quiz Programmes, Lecture Series, Essay Competitions, etc. The main function was organized in ISI, Kolkata which was presided over by Shri D.V. Sadananda Gowda, Hon’ble Minister(S&PI). Shri Pranab Mukherjee, Hon’ble President of India was the chief guest. Among the dignitaries, who participated in the event, included Shri Keshari Nath Tripathi, Hon’ble Governor of West Bengal, Dr T.C.A. Anant, Chief Statistician of India and Secretary, MoSPI, Dr R.B. Barman, Chairman, National Statistical Commission (NSC), Dr Vijay Kelkar, President, ISI and Prof. Govardhan Mehta, Chairman, ISI Council. The theme of the 11th Statistics Day was ‘Administrative Statistics’. Concerted efforts will be made throughout the year to bring about improvements in the quality of data in this area for objective planning, policy formulation and good governance.
1.6 As a part of the mechanism set up by the Government for coordinating the activities in the field of statistics in different States/UTs and Central Ministries/Departments, the Ministry organizes Conference of Central and State Statistical Organizations (COCSSO) every year. This is a major forum for discussing important statistical issues by the Central and State statistical agencies with the objective of putting in coordinated efforts for availability

3
of reliable and timely statistics to planners and policy makers for informed decision making and good governance. 24th COCSSO was organized during 19th-20th January 2017 at Nagpur, Maharashtra. The 25th COCSSO has been held at Bengaluru during 18th-19th January 2018.
1.7 The Statistics Wing of the Ministry is mandated with the following responsibilities:-
(i) acts as the nodal agency for planned development of the statistical system in the country, lays down and maintains norms and standards in the field of statistics, involving concepts and definitions, methodology of data collection, processing of data and dissemination of results;
(ii) coordinates the statistical work in respect of the Ministries/Departments of the Government of India and State Statistical Bureaus (SSBs), advises the Ministries/Departments of the Government of India on statistical methodology and on statistical analysis of data;
(iii) prepares national accounts as well as publishes annual estimates of national product, government and private consumption expenditure, capital formation, savings, estimates of capital stock and consumption of fixed capital, as also the state level gross capital formation of supra-regional sectors and prepares comparable estimates of State Domestic Product (SDP) at current prices;
(iv) maintains liaison with international statistical organisations, such as, the United Nations Statistical Division (UNSD), the Economic and Social Commission for Asia and the Pacific (ESCAP), the Statistical Institute for Asia and the Pacific (SIAP), the International Monetary Fund (IMF), the Asian Development Bank (ADB), the Food and Agriculture Organisation (FAO), the International Labour Organisation (ILO), etc;
(v) compiles and releases the Index of Industrial Production (IIP) every month in the form of ‘quick estimates’, conducts the Annual Survey of Industries (ASI), and provides statistical information to assess and evaluate the changes in the growth, composition and structure of the organised manufacturing sector;
(vi) organises and conducts periodic all-India Economic Censuses and follow-up enterprise surveys, provides an in-house facility to process the data collected through various socio-economic surveys and follow-up enterprise surveys of Economic Censuses;
(vii) conducts large scale all-India sample surveys for creating the database needed for studying the impact of specific problems for the benefit of different population groups in diverse socio-economic areas, such as employment, consumer expenditure, housing conditions and environment, literacy levels, health, nutrition, family welfare, etc;
(viii) examines the survey reports from the technical angle and evaluates the sampling design including survey feasibility studies in respect of surveys conducted by the National Sample Survey Office and other

4
Central Ministries and Departments;
(ix) disseminates statistical information on various aspects through a number of publications distributed to Government, Semi-Government, or Private data users/ agencies, and disseminates data, on request, to the United Nations agencies like the UNSD, ESCAP, ILO and other international agencies;
(x) releases grants-in-aid to registered Non-Governmental Organisations and Research Institutions of repute for undertaking special studies or surveys, printing of statistical reports, and financing seminars, workshops and conferences relating to different subject areas of official statistics.
1.8 The Programme Implementation Wing of the Ministry has the following responsibilities:-
(i) monitoring of the Twenty Point Programme (TPP);
(ii) monitoring the performance of the country’s eleven key infrastructure sectors, viz., Power, Coal, Steel, Railways, Telecommunications, Ports, Fertilizers, Cement, Petroleum & Natural Gas, Roads and Civil Aviation;
(iii) monitoring of all Central Sector Projects costing ̀ 150 crore and above; and
(iv) implementation of Member of Parliament Local Area Development Scheme (MPLADS).
1.9 The Administration Division of the Ministry:
functions as the Cadre Controlling Authority to manage the Indian Statistical Service (ISS) and Subordinate Statistical Service (SSS) including matters like training, career and manpower planning.
1.10 This Ministry acts as the nodal Ministry for the Indian Statistical Institute (ISI) and ensures its functioning in accordance with the provisions of the Indian Statistical Institute Act, 1959 (57 of 1959).
1.11 The Allocation of Business to the Ministry of Statistics and Programme Implementation is placed at Annexure-II. A website (http://www.mospi.gov.in) of the Ministry has been designed, created and is being maintained by the Computer Centre of the Ministry. A large number of reports of the Ministry are available on the website for access/use by various stakeholders. System of on-line registration has also been introduced for downloading/viewing the reports.
1.12 The total budget allocation of the Ministry for the year 2017-18 was ` 4795.74 crore (Scheme and Non- Scheme), out of which ` 3950.00 crore was for MPLADS, ` 4118.28 crore for Scheme (including MPLADS) and ` 677.46 crore was for Non- Scheme. The requirements and priorities of its attached and subordinate offices were kept in view while making budgetary allocations to them by this Ministry.

5
CHAPTER – II
DEVELOPMENT AND HIGHLIGHTS Highlights of achievements of the Ministry during 2017-18 (till 31st December 2017) are as follows:
2. Central Statistics Office (CSO)2.1 National Accounts Division
• The National Accounts Division (NAD) of the CSO is responsible for preparation of national accounts. The NAD brings out annually a publication titled “National Accounts Statistics”.
• NAD releases annual and quarterly estimates of GDP from time to time as per pre-specified schedule given in Advance Release Calendar.
• The NAD’s publications, data releases and reports issued during the year 2017-18 (till 30th November 2017) are eight (8) in number.
2.2 Price Statistics Division• Consumer Price Index (Rural, Urban, Combined): The Central Statistics
Office (CSO), Ministry of Statistics and Programme Implementation (MoSPI) started compiling Consumer Price Index (CPI) with Base Year (2010=100) for all India and States/UTs with effect from January 2011. It revised the Base Year of the CPI from 2010=100 to 2012=100, incorporating many methodological improvements in consonance with the international practices. During November 2016 to November 2017(provisional), the all India year-on-year inflation rate based on CPI (General) for the combined sector (i.e. current month over same month of last year) was reported highest at 4.88 % in November 2017(provisional) and the lowest at 1.46 % in June 2017.
• International Comparison Programme: India has been participating in International Comparison Programme (ICP) since 1970. ICP-2017 benchmark round has started from April 2017 and the price collection is being carried out by National Sample Survey Office (NSSO) for Household sector. Price data collected under ICP surveys are used to compute Purchasing Power Parity (PPP). This indicator helps in comparing the Gross Domestic Product (GDP) of different countries / economies across the world.
2.3 Economic Statistics Division
Index of industrial Production: The monthly Index of Industrial Production (IIP) which is a unit free number based on data of fixed items from a fixed panel of factories that reflects short term changes in the manufacturing sector was released on a monthly basis with a lime lag of 6 weeks. During the year 2017-18 several initiatives were taken.

6
• The base year for all India IIP was revised from 2004-05 to 2011-12 on 12th May 2017. Several key improvements have been brought in the new series namely, updation of item basket & weighing structure, adoption of latest National Industrial Classification 2008, increased number of establishments, inclusion of electricity generation through renewable energy sources, new use based classification, review mechanism etc.
• Data Users Workshops on IIP was held on 30th August 2017 to sensitise user about the salient features of new series of IIP as well as to generate awareness about its usage by major government organizations. Also, user’s requirements were assessed through survey. The proceeding of the workshop and result of the survey were made available in public domain.
• To ensure generation of State level IIP with base year 2011-12, technical assistance have been provided to states. In this direction, first Regional Conference with states of south zone was held on 17.08.2017 in Visakhapatnam to deliberate on various issues faced by states and approach needed for compilation and release of State IIP with new base year.
• Voorburg Group meeting on Services sector: Ministry of Statistics & P.I. hosted the 32nd Voorburg Group meeting in the Ashok, Delhi during 23rd – 27th October 2017. Various topics related to services sector statistics and its good practices across several countries were discussed in the weeklong meeting.
2.4 Social Statistics Division The Social Statistics Division is responsible for coordinating development of social, environment and multi-domain statistics. The ambit of Social Statistics covers population, human development including health and education, employment, social justice and time use, while that of multi-domain statistics includes poverty, gender, persons with disabilities indicators related to Millennium Development Goals, Sustainable Development Goals, SAARC Development Goals and SAARC Social Charter. One of the SSD is to disseminate SSD has brought out 8 publications during 2017. In order to coordinate with various stakeholders and to address the issues related to requirement of gender disaggregated data and data for monitoring of SDGs, 6 workshops were organized during 2017.
2.5 Training Division
Details of Training Programmes at National Statistical Systems Training Academy (NSSTA):
(i) Probationary Training for the direct recruits of the Indian Statistical Service (ISS) ISS probationary training curriculum has, over the past few years, undergone a significant shift, with more emphasis now being laid on on-the-job

7
training, project and field work. Accordingly, the two years ISS Probationary Training Programme has been reduced to one and half year training from the year 2011-12 and the remaining period of six months of probation is devoted to on-the-job training at the place of posting. The ISS Officers of the 38th batch have completed two years probationary training on 30th November 2017. Presently, one batch of ISS Probationers i.e. 39th batch is undergoing a module on “Foundation Course” at Dr MCRHRD, Hyderabad. 40th batch of ISS probationers joined on 18th December 2017 at NSSTA.
(ii) Refresher Training for In-service Indian Statistical Service (ISS) Officers Refresher training courses for in-service Indian statistical officers are conducted as per the recommendations of Training Programmes Approval Committee (TPAC). The objective of the in-service refresher programmes is to provide an exposure to the officers on the latest / recent developments in the field of official statistics and related methodology and also, at the same time, to help them refresh their knowledge of various subjects of official statistics. The entire set of such training programmes is classified into two groups:
i) Mandatory Training; and
ii) Domain Specific Optional Refresher Training
The mandatory refresher training Programmes are exclusively meant for in-service ISS officers, whereas domain specific optional training programmes are meant for statistical officers from ISS Cadre, State Governments, and Union Territory Administrations. As per approval accorded by Hon’ble Minister of State for MoSPI 10 Mid-Career Mandatory Training Programme (MCTP) for different levels of ISS officers viz. Deputy Director, Joint Director/Director, Deputy/Additional Director General are to be conducted during FY 2017-18. During 2017-18, the NSSTA had planned to organize at least 14 (10 Mandatory + 4 Domain subjects suggested by TPAC) Refresher training programmes for a batch of 15-20 officers for each programme. Out of these 14, NSSTA has so far i.e. up to 21st December 2017 organized seven refresher training programmes, including 5 MCTP.
(iii) Induction training programmes for the Subordinate Statistical Service (SSS) Officials: NSSTA has been entrusted with the task of conducting training programme for in-service Subordinate Statistical Service (SSS) officials, JTS officers promoted from SSS Cadre and new recruits of SSS officers every year. Approximately, 500-600 SSS officers are recruited every year. Induction training for the newly recruited SSS Officials is of six weeks for FOD participants and of seven weeks for non FOD participants. Out of which, three weeks programme is at NSSTA covering Official Statistics and Basic Statistics. The remaining three/four weeks programme is conducted at respective FOD Zonal Offices. Induction training programmes are designed to facilitate the transition of new recruits from that of student’s background to that of working in a typical

8
government environment. The induction programme is also designed to make them aware of the rules and procedures of Government; enhancing the technical knowledge to orient them to specific job requirement, team work and leadership. Keeping in view the time and pace of recruitment, NSSTA planned to conduct 6 training programmes for SSS newly recruited SSS officers during 2017-18. Out of these, four induction training programmes for newly recruited SSS officers have already been organized by NSSTA up to November 2017 and 5th Induction training commenced on 18th December 2017 will be complete on 5th January 2018.
(iv) In-service training programmes for the Subordinate Statistical Service (SSS) Officials:
(a) NSSTA also organizes a two-week Refresher Training Programmes for the in-service SSS officials, working in various Central Ministries/Departments, including NSSO (FOD). The objective of these programmes is to expose the officers to the latest developments in the field of official statistics and also at the same time refresh their knowledge with regard to the basics of the domain areas. These programmes are conducted at the NSSTA itself. During the year 2017-18, the Academy is scheduled to organize five such programmes on “Official Statistics” and “Computer Applications”. Out of these, three programmes have been organized so far viz., up to 21st December 2017.
(b) NSSTA also conducts 6 weeks training programmes for Junior Time Scale (JTS) Officers, promoted from the Subordinate Statistical Service (SSS). JTS induction training prepares the officers for effective managerial & decision making roles required of them in future. During the training, the officers are provided adequate exposure to the existing set up and also opportunities to upgrade and sharpen their knowledge and skills in Statistics and Computer & Data Processing related topics. During 2017-18, NSSTA had planned to organize two such programmes for JTS officers and both have been organized successfully.
(v) Training Programmes for State DESs and line Departments NSSTA also conducts domain specific training exclusively for officers/officials working in the Directorates of Economics & Statistics as well as Line Departments of the State/UT Governments. The major subject areas covered in these training programmes include Computer Training, Agriculture, National Accounts, Social Statistics, Industrial, Trade and Services Statistics, Index Numbers & Price Statistics, Basic Statistics, Sample Surveys and organizing large sample surveys. Keeping in view the State Governments’ financial constraints and to enhance participation from the States/UTs, NSSTA has also started conducting 6 or 7 State Training Programmes for the State Governments Officials free of cost since 2011-12. Through this measure, more participation

9
from the States/UTs Government to undergo State Training Programmes at NSSTA is being encouraged and facilitated. During the year 2017-18, NSSTA had planned to conduct (a) Five Refresher Training Programmes for officials of state DESs, out of which, three training programmes have been completed (b) Two Training of Trainers(TOT) programmes for senior officials of DES and faculty of State Training Institutes, out of which, one programme on ‘National Account Statistics’ has been conducted; and (c) Ten demand/request based trainings for officials of DES/Line Ministries/Departments, out of which, five request/demand based programme on “Selected topics of Official Statistics” for DES of Delhi, Jammu & Kashmir and Maharastra have already so been organized.
(vi) Training Programmes for M. Stat Students of ISI:Training programme on official Statistics for M. Stat Students of ISI
during 5th -15th December 2017 was successfully conducted at ISI, Kolkata for students of Kolkata, Chennai and Delhi Centres of ISI.
(vii) International Training Programmes/Activities for SAARC and Other Developing Countries:-
One four weeks training programme on “Official Statistics and Related Methodology” for selected participants from countries in the Middle-East, South and South –East Asia and from Commonwealth countries in Africa started from 4th December 2017 at NSSTA in collaboration with International Statistical Education Centre (ISEC), Kolkata, under the aegis of Indian Statistical Institute (ISI), Kolkata and completed on 29th December 2017.
(viii) Awareness programmes about Official Statistics among University faculty and students: The awareness of Official and Applied Statistics among students and faculty members of Universities in India has been found to be somewhat inadequate, as most of the faculty Members have been found to be primarily focusing on theoretical statistics. During the last few years, NSSTA has made substantial efforts to increase the participation of University faculty through organizing programmes at NSSTA for faculty and students from Department of Statistics of various Universities. Besides conducting such one week training programmes, the Academy has also started organizing one-day workshops/seminars at the selected Universities. These efforts have yielded some encouraging results as now the intake of students who take part in the ISS Examination has increased and the number of candidates qualifying in the ISS & SSS examinations has also increased. During 2017-18, one programme on ‘Official Statistics’ for PG students has been conducted. One day workshop on “Official Statistics and Design of Large Scale Sample Survey” was conducted at Manipal University in September 2017.
10
(ix) Internship Scheme for Post-Graduate Students and Research Scholars:- The Training Division has been implementing a scheme for internship for post-graduate students/research scholars of recognized universities/institutes with the objective to create awareness amongst the students about statistical system of India. During 2017-18 also the Ministry continued implementation of the scheme under which 209 internship slots in various offices of the Ministry, other line Ministries and DES were offered. In all, 121 interns completed their internship successfully.
(x) Awards, Fellowships and Research Studies in Statistics
(a) Prof P C Mahalanobis International Award in Statistics: The Ministry of Statistics & Programme Implementation has instituted an International award in Statistics in the memory of eminent Indian Statistician Prof. P. C. Mahalanobis. The award carries a cash prize of USD 10,000/-, a citation and memento and round trip economy class air fare for winner. The award is given on biennial basis. The award is conferred upto selected Statistician of developing country (as defined by United Nations) for life time contribution in Statistics. The selection of awardee is done by the International Statistical Institute (ISI) of the Netherland and is given during the ISI World Statistics Congress (ISI-WSC) which takes place once in two years in different countries. The 8th Prof. P. C. Mahalanobis International Award in Statistics-2017 was given to Prof. Rahul Mukherjee, Indian Institute of Management, Calcutta during the 61st ISI-WSC held in Marrakech, Morocco during 16th -21st July 2017.
(b) National Awards in Statistics The Ministry of Statistics and Programme Implementation has also instituted two National Awards for Outstanding and Meritorious Research Work in Statistics. One in the memory of Prof. P.V. Sukhatme and other in honour of Prof. C.R. Rao. These awards are given alternate years. The Prof. P.V. Sukhatme award is given to a senior Indian statisticians for his/her life time contribution. The award carries a cash prize of ̀ 5 lakh, along with a citation and a Memento. The Prof. C.R. Rao award is for young statisticians for significant work in the field of statistics and carries a cash prize of `2 lakh, a citation and a memento. During the year 2017, Prof. C.R. Rao award for young statisticians was not conferred as none of the applicants was found suitable.
(C) Research Studies in Statistics The Ministry of Statistics and Programme Implementation is implementing Grant-in-Aid scheme to promote research studies and seminars in the area of Official Statistics by way of providing financial assistance. Under this scheme, funds are provided to the eligible institutions/organizations for conducting research study/ organizing seminars/conferences/workshops and as Travel Grant Assistance etc. on topics relevant to official statistics and also to provide financial assistance to present papers in international conferences/workshops etc. abroad. During the year 2017-18 (up to 30th November 2017), total 18

11
eligible proposals seeking financial assistance for conducting research study/organizing Seminars/Workshops/Conferences and for Travel Grant Assistance have been received which are under process.
(xi) On the spot essay writing competition The Ministry organizes an “On the spot essay writing competition” on subjects relevant to Statistics for Post Graduate Students to celebrate the birth anniversary of Prof. P.C. Mahalanobis, every year at all India level. The following prizes are given to the best selected essays at national level:
First Prize (one) : ` 15,000/-
Second Prize (2 numbers) : ` 12,000/- (each)
Third Prize (3 numbers) : ` 10,000/- (each)
Consolation prizes (5 numbers) : ` 5,000/- (each)
The competition is generally held at various regional / zonal offices of NSSO (FOD) and the centers for the examination depend upon the choice of the candidates/applicants. On the spot essay writing competition 2017 was held on Sunday, 12th February 2017 in 11 centres all over India, in which, 25 candidates participated. The winners of the on the spot essay competition 2017 were felicitated on the occasion of the Statistics Day celebration function on 29th June 2017 organized by the Ministry at Indian Statistical Institute, Kolkata.
2.6 National Sample Survey Office (NSSO)• The nationwide Labour Force Survey, namely, Periodic Labour Force
Survey (PLFS) was launched from 1st April 2017. The main objective of the PLFS is to measure quarterly changes of various indicators of the labour market in urban areas as well as to generate the annual estimates of different labour force indicators both in rural and urban areas. The first results of the PLFS would be made available by December 2018 and regular basis thereafter.
• NSSO is conducting a Swachh Bharat Survey alongside its 75th Round (July 2017-June 2018) Survey. The Swachh Bharat Survey is being conducted during the first two Sub-Rounds of the 75th Round and, accordingly, the data collection work will be completed by December 2017. The survey report is likely to be released by April 2018. The report will provide indicators on the use of toilets by the households and disposal of solid and liquid wastes. This will be second such report after the release of the first in April 2016.
• The next phase of UFS (2017-2020) has commenced since November 2017. This Phase of UFS has been digitized. Different UFS operations will be carried out using mobile/web applications developed in collaboration with National Remote Sensing Centre (NRSC), Hyderabad. Boundaries of blocks/wards/IV units/towns will be drawn on satellite imagery obtained from Bhuvan portal using QGIS software.

12
2.7 Twenty point Programme During the year 2016-17 the performance in respect of 16 parameters of the total 21 quarterly monitored parameters of Twenty Point Programme (TPP-2006) has been “Very Good” (i.e. over 90% achievement). The parameter of “Seedlings planted (Public and Forest Lands)” has achieved the highest performance rate of 198% followed by the parameter “Area Covered under Plantation (Public and Forest Lands)” 183%.
2.8 Members of Parliament Local Area Development (MPLAD) Scheme.
• ` 45,225.25 crore has been released since the inception of the scheme up to 30th November 2017.
• As reported from the Districts, an expenditure of ` 42,537.09 crore has been incurred under the scheme up to 30th November 2017. The percentage of expenditure over release is 94.06 as on 30th November 2017, since inception of the Scheme.
• ` 2216.50 crore has been released in the current financial year up to 30th November 2017 and an expenditure of ̀ 2622.08 crore has been made (including unspent amounts of previous years).
• Annual Review Meetings with the Secretaries of State Nodal Departments are being regularly held regarding monitoring of release of funds and taking stock of the implementation of the scheme in the States/UTs.
• Financial and technical assistance is being provided to States/UTs to conduct training programmes for State/District officials to facilitate better implementation of the scheme. Ministry is providing training to the States/UTs for operationalising the newly developed integrated MPLADS website.
2.9 Annual Survey of Industries Now data is collected directly from the manufacturing units for compilation of result of the Annual Survey of Industries through a web-based system of data collection.

13
CHAPTER – III
NATIONAL STATISTICAL COMMISSION (NSC)3.1 The Government of India through a Resolution dated 1st June 2005 decided to set up the National Statistical Commission (NSC). The setting up of the NSC followed the decision of the Cabinet to accept a recommendation of the Rangarajan Commission, which reviewed the Indian Statistical System in 2001. The NSC was initially constituted on 12th July 2006 and it has been functioning since then. The NSC has a part-time Chairperson and four part-time Members, each having specialization and experience in specified statistical fields. Besides, Chief Executive Officer of the NITI Aayog is the ex-officio member of the NSC. The maximum tenure of a part-time Chairperson/Member is three years. The Chief Statistician of India is the Secretary to the NSC. He is also the Secretary to the Government of India in the Ministry of Statistics & Programme Implementation.
3.2 The names of the part-time Chairperson and part-time Members of the NSC during the period under report are as follows:
I. Dr R.B. Barman, Chairperson
II. Dr Rajiv Mehta, Member
III. Dr Manoj Panda, Member
IV. Mr. P.C. Mohanan, Member since 21st June 2017
V. Dr J.V. Meenakshi, Member since 28th June 2017
3.3 The functions of the NSC are laid down in the Government of India Resolution dated 1st June 2005. The Resolution provides for submission of Annual Report of the NSC for each financial year and its laying in both the Houses of the Parliament or concerned State Legislature(s), as the case may be, along with memorandum of action taken on the recommendations contained therein. Hence, the reports of the Commission would be laid before both the Houses of the Parliament, separately.

14
CHAPTER – IV
CENTRAL STATISTICS OFFICE4.1 The Central Statistics Office (CSO), an attached office of the Ministry, coordinates the statistical activities in the country and evolves statistical standards. Its activities inter-alia include compilation of National Accounts, Index of Industrial Production, Consumer Price Indices for Urban/Rural/ Combined, Human Development Statistics including Gender Statistics, conduct of Annual Survey of Industries and Economic Census and imparting training in Official Statistics. The CSO also assists in the development of statistics in the States and Union Territories and disseminates Energy Statistics, Social and Environment Statistics and prepares the National Industrial Classification.
National Accounts Division
4.2 The National Accounts Division (NAD) of the CSO is responsible for preparation of national accounts, which include the estimates of Gross Domestic Product (GDP), National Income, Government/Private Final Consumption Expenditure, Capital Formation and Savings along with details of transactions of institutional sectors. The NAD brings out annually a publication titled “National Accounts Statistics”, containing these statistics.
The NAD is also responsible for preparation and release of Supply-Use Tables (SUT) and Input-Output Transaction Tables (IOTT) from time to time.
The NAD maintains liaison with international organizations on statistical matters.
4.3 The NAD provides technical guidance and support to the State/ UT Directorates of Economics & Statistics (DESs) on compilation of estimates of State Income and related aggregates, including estimates of State Domestic Product. State level estimates of Gross Value Added (GVA) and Gross Fixed Capital Formation (GFCF) in respect of supra-regional sectors, namely, Railways, Communication, Services related to broadcasting, Financial Services and Central Government Administration are furnished by the NAD for the purpose.
4.4 In order to ensure comparability between the National and State level estimates, the NAD compiles comparable estimates of Gross and Net State Domestic Product (GSDP/NSDP) by economic activity and Per Capita Income estimates, in consultation with the DESs.
4.5 In compliance with the Special Data Dissemination Standards of the International Monetary Fund (IMF) and as per its own policy, the NAD releases annual and quarterly estimates of GDP from time to time as per pre-specified schedule given in Advance Release Calendar. Details are given below:
15
Calendar for Quarterly estimates of GDP
(1) Q3 OF 2017-18 : 28th February 2018 (2) Q4 OF 2017-18 : 31st May 2018 (3) Q1 OF 2018-19 : 31st August 2018 (4) Q2 OF 2018-19 : 30th November 2018
Q1: April-June, Q2: July-September, Q3: October-December, Q4; January-March
Calendar for Annual estimates of GDP
(1) FIRST ADVANCE ESTIMATES FOR 2017-18 : 05th January 2018(2) FIRST REVISED ESTIMATES FOR 2016-17 : 31st January 2018(3) SECOND ADVANCE ESTIMATES FOR 2017-18 : 28th February 2018(4) PROVISIONAL ESTIMATES FOR 2017-18 : 31st May 2018
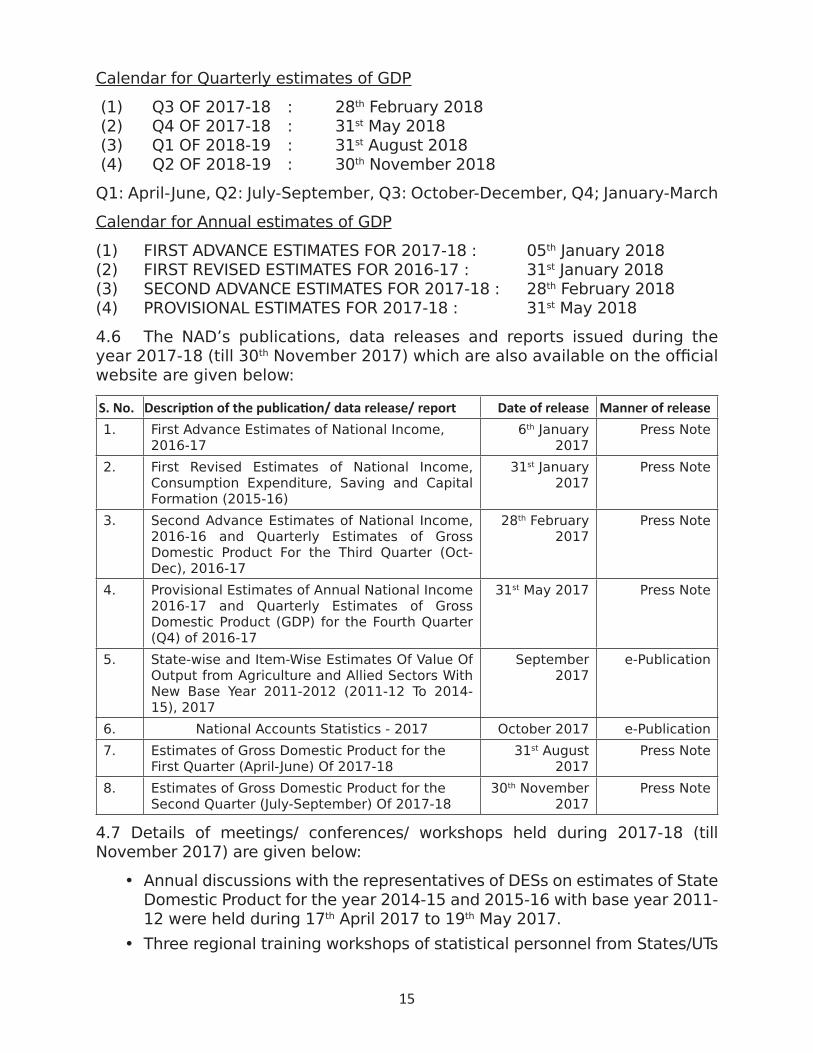
4.6 The NAD’s publications, data releases and reports issued during the year 2017-18 (till 30th November 2017) which are also available on the official website are given below:
S. No. Description of the publication/ data release/ report Date of release Manner of release1. First Advance Estimates of National Income,
2016-176th January
2017Press Note
2. First Revised Estimates of National Income, Consumption Expenditure, Saving and Capital Formation (2015-16)
31st January 2017
Press Note
3. Second Advance Estimates of National Income, 2016-16 and Quarterly Estimates of Gross Domestic Product For the Third Quarter (Oct-Dec), 2016-17
28th February 2017
Press Note
4. Provisional Estimates of Annual National Income 2016-17 and Quarterly Estimates of Gross Domestic Product (GDP) for the Fourth Quarter (Q4) of 2016-17
31st May 2017 Press Note
5. State-wise and Item-Wise Estimates Of Value Of Output from Agriculture and Allied Sectors With New Base Year 2011-2012 (2011-12 To 2014-15), 2017
September 2017
e-Publication
6. National Accounts Statistics - 2017 October 2017 e-Publication
7. Estimates of Gross Domestic Product for the First Quarter (April-June) Of 2017-18
31st August 2017
Press Note
8. Estimates of Gross Domestic Product for the Second Quarter (July-September) Of 2017-18
30th November 2017
Press Note
4.7 Details of meetings/ conferences/ workshops held during 2017-18 (till November 2017) are given below:
• Annual discussions with the representatives of DESs on estimates of State Domestic Product for the year 2014-15 and 2015-16 with base year 2011-12 were held during 17th April 2017 to 19th May 2017.
• Three regional training workshops of statistical personnel from States/UTs

16
on compilation of State Domestic Product and other related aggregates were organized at Thiruvananthapuram, Kerala during 6th to 10th February 2017 covering seven States; at Jaipur, Rajasthan during 3rd to 7th April 2017 covering six States and at Manali, Himachal Pradesh during 13th to 17th November 2017 covering ten States.
• An Expert Group constituted to look into ‘Estimation of Saving & Investment through Household Survey’ has had 6 meetings so far. The Group worked out methodological details for conducting a pilot study through household survey to provide a basis for conducting a nation-wide integrated income-consumption-saving survey. The methodology will be useful for NSSO to take up the study, subject to availability of resources. Pilot survey is scheduled to be launched during 2017-18.
• A team of officers of the National Accounts Division visited Office for National Statistics (ONS) of UK to study the development of a time-series database for GDP compilation system during 14th-18th August 2017 at Newport, UK.
• As a part of implementation phase of SDMX pilot project for India-EU cooperation on ICT standardization 2016 for dissemination of quarterly data in the first phase, SDMX basic training was conducted for officials of National Accounts Division in March and October 2017. Also, first Annual Steering Committee Meeting of India EU ICT Standards on SDMX Project was held on 5th September 2017 in New Delhi where the focus was on IT tools based on the SDMX standard involving capacity building and support to the CSO.
• Two Meetings of Advisory Committee on National Accounts Statistics (ACNAS) were held on 21st March 2017 and 20th November 2017 at New Delhi, to look into and advise on all methodological aspects for compilation and presentation of national accounts.
• Discussions with the MoSPI-IMF-SARTTAC National Accounts Statistics Technical Assistance Mission were held during 23rdOctober-3rd November 2017.
• Two meetings of Sub-Committee of ACNAS to examine data from GST framework were held on 7th August 2017 and 14thNovember 2017 at New Delhi to look into the methodology of introduction of GST on the National Accounting.
• Two meetings of the Committee on Real Sector Statistics were held on 10th March 2017 and 22nd May 2017.
4.8 The NAD received ISO certification of ISO 9001:2008 in the year 2015, which was monitored through internal audits during the period under report.
Price Statistics4.9 The Central Statistics Office (CSO) started compiling Consumer Price Index (CPI) separately for rural, urban, and combined sectors on monthly basis with Base Year (2010=100) for all India and States/UTs with effect

17
from January 2011. It revised the Base Year of the CPI from 2010=100 to 2012=100, incorporating many methodological improvements in consonance with the international practices. The basket of items and weighing diagrams for the revised series has been prepared using the Modified Mixed Reference Period (MMRP) data of the Consumer Expenditure Survey (CES), 2011-12 of the 68th Round of National Sample Survey (NSS). In addition, Consumer Food Price Index (CFPI) is also being released as weighted average of the indices of ten subgroups: ‘Cereals and products’; ‘Meat and fish’; ‘Egg’; ‘Milk and products’; ‘Oils and fats’; ‘Fruits’; ‘Vegetables’; ‘Pulses and products’; ‘Sugar and confectionery’; and ‘Spices’. It does not include ‘Non-alcoholic beverages’ and ‘Prepared meals, snacks, sweets etc.’
Trend in CPI based inflation4.10 All India year on year inflation rates (i.e. current month over same month of last year), in percentage, based on CPI (General) for combined sector, given in Table- 1, crossed 4.00% once, only in November 2017 during the period November 2016 to November 2017. The said rate for November 2017 was 4.88%. The minimum rate was registered at 1.46 % in June 2017 during the aforementioned period.
All India year on year inflation rates (%) based on General CPI (combined) sector
Table 1
Month& Year
Nov-16
Dec -16
Jan-17
Feb -17
Mar -17
Apr -17
May-17
Jun -17
July -17
Aug-17
Sep -17
Oct -17
Nov-17
Inflation Rate
3.63 3.41 3.17 3.65 3.89 2.99 2.18 1.46 2.36 3.28 3.28 3.58 4.88
Chart 1: All India year on year inflation rates (%) based on General CPI (combined)

18
4.11 All India year on year inflation rates (%) based on CFPI for the combined sector, given in Table-2, shows that average inflation rate of food items during November 2016 to November 2017(Provisional) was 1.09 % only. CFPI inflation touched highest level at 4.42% in November 2017, and lowest of -2.12 in June 2017.
All India year on year inflation rates (%) based on CFPI (combined)
Table 2
Month& Year
Nov-16
Dec-16
Jan-17
Feb -17
Mar -17
Apr -17
May -17
Jun -17
July -17
Aug-17
Sep -17
Oct -17
Nov-17
Inflation Rate
2.03 1.37 0.61 2.01 2.01 0.61 -1.05 -2.12 -0.36 1.52 1.25 1.90 4.42
Chart 2: All India year on year inflation rates (%) based on CFPI for the combined sector
4.12 CSO releases Consumer Price Indices for Rural, Urban and Combined sectors also at group and sub-group levels. It is to be stated that ‘Food and beverages’ as a whole has 45.86% share, which includes 39.06% share of CFPI in CPI basket of combined sector. Therefore, food items are generally the major drivers of overall inflation rate based on CPI. In order to know the reasons for such movement of overall inflation rate during last one year, analysis of sub-group level inflation rate is required. Sub-group/Group wise inflation rates and their respective shares (in terms of weight) have been combined together to know their contribution to overall inflation rate during each month of November 2016 to November 2017(provisional). These contributions are given in Table 3.

19
Break-up of Overall inflation into Group/sub-group-wise inflation rates, based on CPI (General) for combined sector
Table 3
Group Code
Sub-group Code Description Weight Nov-
16Dec-16
Jan-17
Feb-17
Mar-17
Apr-17
May-17
Jun-17
Jul-17
Aug-17
Sep-17
Oct-17
Nov-17 (Prov.)
1
1.1.01Cereals and products 9.67 0.46 0.51 0.52 0.52 0.53 0.47 0.46 0.41 0.39 0.36 0.35 0.35 0.32
1.1.02 Meat and fish 3.61 0.21 0.18 0.12 0.13 0.11 0.07 0.07 0.14 0.13 0.11 0.12 0.12 0.12
1.1.03 Egg 0.43 0.04 0.03 0.01 0.00 0.01 0.01 0.00 0.00 -0.01 -0.01 0.00 0.00 0.03
1.1.04Milk and products 6.61 0.30 0.30 0.29 0.29 0.33 0.32 0.31 0.28 0.26 0.24 0.26 0.29 0.31
1.1.05 Oils and fats 3.56 0.09 0.09 0.10 0.12 0.12 0.10 0.09 0.07 0.05 0.03 0.03 0.03 0.04
1.1.06 Fruits 2.89 0.13 0.14 0.17 0.24 0.28 0.11 0.04 0.06 0.09 0.16 0.15 0.15 0.18
1.1.07 Vegetables 6.04 -0.78 -1.02 -1.06 -0.52 -0.46 -0.54 -0.91 -1.22 -0.28 0.43 0.27 0.52 1.47
1.1.08Pulses and products 2.38 0.01 -0.05 -0.21 -0.29 -0.39 -0.48 -0.61 -0.69 -0.82 -0.77 -0.70 -0.72 -0.74
1.1.09Sugar and confectionery 1.36 0.22 0.21 0.20 0.20 0.19 0.13 0.11 0.10 0.10 0.09 0.08 0.08 0.09
1.1.10 Spices 2.5 0.17 0.16 0.13 0.10 0.08 0.04 0.01 -0.02 -0.05 -0.05 -0.06 -0.06 -0.06
1.2.11Non-alcoholic beverages 1.26 0.04 0.05 0.04 0.04 0.04 0.04 0.03 0.03 0.03 0.03 0.03 0.02 0.03
1.1.12
Prepared meals, snacks, sweets etc.
5.55 0.34 0.33 0.33 0.33 0.35 0.32 0.30 0.29 0.31 0.31 0.30 0.30 0.30
Food and beverages 45.86 1.23 0.92 0.63 1.16 1.21 0.59 -0.10 -0.55 0.20 0.94 0.83 1.09 2.11
2
Pan, tobacco, and intoxicants 2.38 0.16 0.16 0.16 0.16 0.17 0.15 0.16 0.14 0.17 0.17 0.18 0.18 0.20
3.1.01 Clothing 5.58 0.28 0.29 0.28 0.26 0.27 0.26 0.26 0.24 0.26 0.26 0.27 0.28 0.30
3.1.02 Footwear 0.95 0.04 0.04 0.04 0.03 0.03 0.03 0.03 0.03 0.03 0.03 0.03 0.04 0.04
3 Clothing and footwear 6.53 0.32 0.33 0.32 0.30 0.31 0.30 0.29 0.27 0.29 0.30 0.31 0.31 0.34
4 Housing 10.07 0.49 0.49 0.50 0.49 0.51 0.47 0.47 0.45 0.49 0.54 0.60 0.66 0.73
5
Fuel and light 6.84 0.18 0.25 0.22 0.26 0.37 0.39 0.35 0.29 0.32 0.32 0.36 0.41 0.52
6.1.01Household goods and services 3.8 0.16 0.17 0.16 0.15 0.15 0.14 0.14 0.14 0.15 0.15 0.16 0.15 0.17
6.1.02 Health 5.89 0.25 0.26 0.24 0.23 0.23 0.22 0.21 0.20 0.23 0.24 0.23 0.23 0.26
6.1.03Transport and communication 8.59 0.28 0.31 0.40 0.41 0.47 0.30 0.26 0.15 0.14 0.27 0.26 0.17 0.16
6.1.04Recreation and amusement 1.68 0.06 0.06 0.06 0.06 0.06 0.05 0.05 0.05 0.06 0.06 0.06 0.06 0.06
6.1.05 Education 4.46 0.23 0.24 0.25 0.24 0.25 0.23 0.22 0.19 0.21 0.20 0.19 0.19 0.20
6.1.06Personal care and effects 3.89 0.27 0.23 0.22 0.19 0.17 0.15 0.11 0.12 0.10 0.09 0.11 0.12 0.12
6 Miscellaneous 28.32 1.25 1.26 1.33 1.28 1.33 1.09 1.00 0.85 0.88 1.01 1.01 0.92 0.97
General Index (All Groups) 100.00 3.63 3.41 3.17 3.65 3.89 2.99 2.18 1.46 2.36 3.28 3.28 3.58 4.88
4.13 From Figure 3 (where contribution of significant sub-groups have been shown separately, and others’ contribution have been clubbed together as

20
‘other sub-groups’), it is clear that the contribution to overall inflation rates for all the months during November 2016 to November 2017 were attributed by ‘Cereals and products’ & ‘Housing’. ‘Housing’ has consistently registered higher contribution in the overall inflation rate throughout the period because of its significant weight in the CPI basket. ‘Vegetables’ had shown consistent deflation from November 2016 to July 2017, after which inflation was taken up and touched the peak in November 2017. ‘Pulses and products’ had shown continuous contribution in deflation from December 2016 to November 2017, except for November 2016 (where the contribution towards inflation was 0.01). The contribution by the ‘Prepared meals, snacks, sweets etc.’ to overall inflation rate was hovering around 0.30 % for all the months during November 2016 to November 2017.
Chart 3: Contribution of various sub-groups/groups to overall inflation rate
-3
-2
-1
0
1
2
3
4
5
6 OtherSubgroups(Positive)Housing
Preparedmeals; snacks;sweets etc.Sugar andconfectionery
Pulses andproducts
Vegetables
Cereals andproducts
International Comparison Programme
4.14 International Comparison Programme (ICP): International Comparison Programme is a Global Statistical Initiative under the aegis of United Nations Statistical Commission (UNSC), coordinated by the World Bank at Global level and Asian Development Bank (ADB) at regional level for participating countries of Asia-pacific region.
4.15 As per decision of the 47th session of UNSC, ICP has become a permanent element of the global statistical work programme. Further, India is co-chair along with Austria for ICP-2017.India is participating in the current rolling benchmark round of ICP 2017. The price collection period for ICP 2017 is April

21
2017 to March 2018. Under this cycle of ICP, 928 products/items are being priced for different categories of consumption under Household sector. At present, prices are being collected from 577 urban markets in the first phase for items pertaining to ‘Food, Clothing & Footwear’ and Education, and from 108 urban markets in the second phase of the survey period for items other than ‘Food, Clothing and Footwear’.
Annual Survey of Industries (ASI)
4.16 The Annual Survey of Industries (ASI) is the principal source of industrial statistics in India. It provides statistical information to assess and evaluate, objectively and realistically, the changes in the growth, composition and structure of the organized manufacturing sector comprising activities related to manufacturing processes, repair services, generation, transmission, etc. of electricity, gas and water supply and cold storage. The survey is statutory under the Collection of Statistics Act, 2008 (as amended in 2017) and the rules framed there under.
4.17 The ASI extends to the entire country. The survey covers all factories registered under sections 2m (i) and 2m (ii) of the Factories Act, 1948. The survey also covers bidi and cigar manufacturing establishments registered under the Bidi and Cigar Workers (Conditions of Employment) Act, 1966. All the electricity undertakings engaged in the generation, transmission and distribution of electricity registered with the Central Electricity Authorities (CEA) were covered under ASI up to 1997-98 irrespective of their employment size. Certain services and activities like cold storage, water supply, repair of motor vehicles and of other consumer durables like watches, etc. are covered under the survey. Defence establishments, oil storage and distribution depots, restaurants, hotels, café and computer services and also the technical training institutes are excluded from the purview of the survey. The electricity undertakings registered with the CEA are not being covered under ASI w.e.f. 1998-99. However, captive units not registered with CEA continue to be covered under ASI.
4.18 In addition to the above, now the coverage of ASI has been extended beyond the purview of the section 2m (i) and 2m (ii) of the Factories Act, 1948 and the Bidi & Cigar Workers (Conditions of Employment) Act, 1966 as recommended by the Sub-Group on Sampling Design of ASI. For this purpose, Business Register of Enterprises (BRE) prepared for the respective states and Directory of Establishments based on Sixth Economic Census would be used by Industrial Statistics Wing (IS Wing).
4.19 To start with the implementation of the augmented frame, units with 100 or more employees not registered under section 2m (i) and 2m (ii) of the

22
Factories Act, 1948 but included in the BRE of the respective states would be included in ASI frame. For this, BRE of Andhra Pradesh (AP) was included in the frame of Andhra Pradesh for ASI 2014-15 and BRE of Manipur, Chhattisgarh, Himachal Pradesh, Punjab, Uttar Pradesh, Tamil Nadu and Rajasthan were included in the frame of respective states for ASI 2015-16 after verification of such units by Field Operation Division (FOD). This is a significant departure from past practices and it is an improvement in coverage of registered manufacturing sector.
4.20 The data collected through ASI relates to capital, employment and emoluments, consumption of fuel and lubricants, raw materials and other input/output, value added, labour turnover and other characteristics of factories/industrial establishments. Fieldwork is carried out by the Field Operations Division of NSSO. The IS Wing processes the data and publishes the results.
State Participation in ASI
4.21 The State Directorates of Economics and Statistics (DESs) have been given necessary technical assistance and training for the purposes of participation in ASI. The participating states along with other desiring States have been provided with state sample list to take part in ASI survey work. IS Wing provided all the survey and data processing instruments (sample list, schedule, instruction manual, data entry package (e-schedule), validation rules, pooling methodology, etc.) to the states. The Central sample unit level data for respective states were also shared with the State DESs so as to enable them to generate district/micro level estimates, if necessary, by augmenting samples.
4.22 The major objectives in respect of ASI in the present plan scheme named Capacity Development are:
• To improve the quality of ASI data processing.
• Up-gradation of computer hardware and software of IS Wing, Kolkata for ASI data processing and implementation of e-governance in phased manner as an extension of complete on line data processing.
• Assistance to state DESs for participating in ASI survey.
• Assistance to state DESs for construction of state IIP with changed base year 2011-12.
In the recent past many changes have been made for improvements in the collection, processing and dissemination of ASI data.
4.23 Over the last few decades, there has been a spurt in the growth of the number of registered factories and consequently in the number of units from

23
which data are to be collected and analyzed annually. Considering operational constraints of NSSO (FOD), the sample sizes in ASI were kept 61,866, 65,972, 66,283, 70,943 and 73,481 units during ASI 2011-12, ASI 2012-13, ASI 2013-14 ASI 2014-15 and ASI 2015-16 respectively. In ASI 2016-17, 76,977 units have been selected for the survey. All the schedules from ASI 2012-13 onwards have been canvassed through ASI web portal.
4.24 The Gross Allotment for ASI 2015-16 was 73,481 units, comprising 47,905 census units and 25,576 sample units. The survey of ASI 2015-16 was closed in the web-portal in the month of November 2017.
4.25 The field work of ASI 2016-17 has been initiated. The gross allotment for ASI 2016-17 is 76,977 units comprising of 47,831 census units and 29,146 sample units. ASI 2016-17 is expected to be completed by August 2018.
4.26 An action plan has been drawn to reduce the time lag in releasing the ASI results. From ASI 1998-99, detailed results (in two volumes) are being released satisfactorily. Final results of ASI 2014-15 have been released in two volumes (Vol-I in e-media and Vol-II in CD). Since ASI 2009-10, Vol-I results are freely available to users in electronic media and can be downloaded from Ministry’s website (www.mospi.gov.in) and Vol-II on payment basis. Final results of ASI 2015-16 for Vol-I are expected to be released in March 2018.
Glimpses of the ASI Results
4.27 The final results of ASI 2014-15 were released in March 2017. ASI 2014-15 covered the entire country. The field work for ASI 2014-15 was carried out during 2015-16 throughout the country with reference period coinciding with the fiscal year 2014-15.
Altogether 70,943 factories (including joint returns) were approached for data collection. All the schedules in ASI 2014-15 have been canvassed through ASI web-portal.
4.28 Some of the highlights of ASI 2014-15 are given below:
• During 2014-15, an estimated 2,30,435 factories were found to be in operation.
• Nearly 138 lakh persons were engaged by these factories.
• All the factories together had an invested capital worth ` 35,13,964 crores.
• Total net value added by the factories was ` 9,75,162 crores.

24
4.29 The comparative statements regarding the Principal Characteristics of Industries as covered under ASI are given below:
Table-4
Characteristics Unit 2010-11 2011-12 (revised)
2012-13 2013-14 2014-15
Factories Number 211660 217554 222120 224576 230435
Fixed Capital ` Lakh 160700652 194955088 218026022 237371903 247445461
Productive Capital ` Lakh 222736937 254062947 278367129 303640480 311529492
Invested Capital ` Lakh 239358002 284114733 314411215 338455535 351396431
Workers Number 9901970 10438156 10051626 10444404 10755288
Employees Number 12617691 13346243 12873853 13462061 13808327
Wages to Workers ` Lakh 8564552 10001913 11089620 12649644 14048488
Emoluments ` Lakh 18329574 21509846 23805727 27241503 30741306
Total input ` Lakh 385108361 479846038 501866586 549013952 571910956
Output ` Lakh 467621696 570366932 602594536 655525116 688381205
Depreciation ` Lakh 12055754 14065505 15533081 16976977 18954077
Net value added ` Lakh 70457581 76455389 85194869 89534187 97516172
NFCF ` Lakh 16309792 20316875 20219540 18396832 13405511
Net Income ` Lakh 60306166 62770228 71928627 75152048 81228119
Rent paid ` Lakh 1349336 1619529 1642164 1527272 1709361
Interest paid ` Lakh 8802079 12065632 13807327 15485061 17286008
Profit ` Lakh 39016161 37911551 44426292 43956552 46028299
4.30 The final results of ASI 2014-15 have been released in e-media in the month of March 2017. Since ASI 2009-10, Vol-I results are freely available to users in the Ministry’s website (www.mospi.gov.in) while Vol- II results are available on payment basis in CD.
ASI Web-Portal4.31 Annual Survey of Industries Web-Portal is developed by Central Statistics Office (IS Wing), Kolkata, with the support of NIC for collection and compilation of ASI schedules. The main objective of the portal is collection of ASI data at the source with built-in validation which leads to data accuracy and time saving. The 24×7 availability in a secured environment is an added advantage. The vision is to deliver ASI data in a timely, transparent and reliable manner in a secured environment without any physical movement of the schedules. The ASI web-portal has been successfully launched for frame updation, sample selection and e-compilation of ASI schedule from ASI 2012-13.

25
4.32 An All India Training of Trainers (AITOT) on ASI for the statistical personnel from the State DESs was organised during 27th -28th November 2017 at Delhi. Concepts and definitions of ASI, recent changes in ASI schedule and related concepts, filling up of ASI return through e-schedule, pooling of central and state sample data, and ASI frame related issues was discussed in the said workshop.
The Journal of Industrial Statistics4.33 The bi-annual journal - “The Journal of Industrial Statistics” is being brought out regularly to provide a platform for the experts, researchers and data-users to publish research and analytical articles, and also to bring out important national and international indicators on industrial statistics. The journal has been published by IS Wing, Kolkata since 2012. The March 2017 issue of the journal has already been brought out and the soft copies of the Journal are also available on Ministry’s website. The journal is registered with the Controller of Publications, RNI and ISSN.
National Seminar on Industrial Statistics4.34 Eighth national seminar on Industrial Statistics was organised on 15th December 2017 in Kolkata which was attended by Senior Officers of MoSPI, eminent economists, statisticians, researchers, and paper presenters from academia, industry, government and non-government organisations.
Index of Industrial Production (IIP)4.35 CSO compiles the Index of Industrial Production (IIP) using secondary data received from 14 source agencies in various Ministries/ Departments or their attached/ subordinate offices. The base year for all India IIP was revised from 2004-05 to 2011-12 on 12th May 2017.
4.36 The new series of IIP continues to cover three sectors (i) Mining, (ii) Manufacturing and (iii) Electricity as in the old series. In the new base year (i.e. 2011-12), the index covers 407 item groups under three sectors i.e. Mining (1 item group), Manufacturing (405 item groups) and Electricity (1 item) with weights of 14.37%, 77.63% and 7.99% respectively. Several changes have been brought in the new series of IIP which are mentioned below:
• Item basket and weighting structure are updated conforming to the structure of economy in 2011-12.
• National Industrial Classification (NIC) 2008 has been adopted in the new series of IIP against the NIC 2004 followed in IIP with base 2004-05.
• Items in the item basket are selected at NIC 3 digit level to increase representativeness.
• Number of item groups has increased from 399 to 407out of which 149 are new/ emerging items.
• Electricity generation from renewable energy sources has been included under the ‘Electricity’ sector.

26
• Weights are rationalised to appropriately reflect the actual value addition of each sector incorporating effects of subsidies.
• Respondent establishments from which data are to be collected for the items in the new series, have been increased.
• New use-based classification has been introduced with the categories namely, (i) Primary goods, (ii) Capital goods, (iii) Infrastructure/ construction goods, (iv) Intermediate goods, (v) Consumer durables, and (vi) Consumer non-durables.
• A review mechanism has been introduced through a Technical Review Committee till the next revision of base year.
4.37 IIP is released every month in the form of Quick Estimates with a time-lag of 6 weeks as per the Special Data Dissemination Standard (SDDS) norms of IMF. Apart from breakup of the index for mining, manufacturing and electricity sectors, the estimates are also simultaneously being released as per Use-based classification viz., Primary Goods, Capital Goods, Intermediate Goods, Infrastructure/ Construction goods, Consumer durables and Consumer non-durables. These estimates are revised subsequently on receipt of updated production data from the 14 source agencies. The major source of data for IIP is, however, the Department of Industrial Policy and Promotion that supplies data for 322 out of 407 item groups with a weight of 47.54% in overall IIP.
4.38 IIP released up to the month of November 2017 the sector-wise annual indices of industrial production from 2012-13 to 2017-18 (till November 2017), monthly indices from January 2017 to November 2017 and the annual growth rates from 2012-13 to 2016-17 are given below. The patterns of changes in the indices over time are also depicted in the charts.
Chart 4: Index of Industrial Production (a-Annual): 2012-13 to 2016-17- Sector-wise
2012-2013 2013-2014 2014-2015 2015-2016 2016-17Mining 94.7 94.6 93.3 97.3 102.5Manf. 104.8 108.6 112.7 115.9 121.0Elect. 104.0 110.3 126.6 133.8 141.6General 103.3 106.7 111.0 114.7 120.0
90.0
100.0
110.0
120.0
130.0
140.0
150.0

27
Chart 5: Comparison of Sector-wise Annual Growth Rates (w.r.t. previous year) as depicted by IIP: 2012-13 to 2016-17
2012-2013 2013-2014 2014-2015 2015-2016 2016-17Mining -5.3 -0.1 -1.4 4.3 5.3Manf. 4.8 3.6 3.8 2.8 4.4Elect. 4.0 6.1 14.8 5.7 5.8General 3.3 3.3 4.0 3.3 4.6
-6.0
-1.0
4.0
9.0
14.0
19.0
Note: Manf. – Manufacturing; Elect. – Electricity
Chart 6: Index of Industrial Production (Monthly): January 2017 to November 2017 – Sectoral Indices
Jan'17 Feb'17 Mar'17 Apr'17 May'17 Jun'17 Jul'17 Aug'17 Sep'17*
Oct'17*
Nov'17*
Mining 114.4 110.5 127.7 98.8 101.7 98.5 92.4 92.6 94.5 100.9 107.4Manf. 123.1 119.7 132.7 117.3 125.6 120.3 119.3 124.1 125.6 124.0 127.5Elect. 138.9 130.2 147.9 150.6 158.1 147.4 151.9 155.4 150.5 149.8 140.1General 123.1 119.2 133.2 117.3 124.8 119.3 118.0 122.1 123.1 122.7 125.6
90.0100.0110.0120.0130.0140.0150.0160.0170.0
* Provisional

28
Chart 7: Sector-wise IIP Growth Rates (w.r.t previous year): January 2017 to November 2017
Jan'17 Feb'17 Mar'17 Apr'17 May'17 Jun'17 Jul'17 Aug'17 Sep'17*
Oct'17*
Nov'17*
Mining 8.6 4.6 10.1 3.0 0.3 0.1 4.5 9.3 7.8 -0.1 1.1Manf. 2.5 0.7 3.3 2.9 2.6 -0.7 -0.1 3.8 3.8 2.2 10.2Elect. 5.1 1.2 6.2 5.4 8.3 2.1 6.6 8.3 3.4 3.2 3.9General 3.5 1.2 4.4 3.2 2.9 -0.3 1.0 4.8 4.1 2.0 8.4
-2.0
0.0
2.0
4.0
6.0
8.0
10.0
12.0
* Provisional
Note: Manf. – Manufacturing; Elect. – Electricity
Chart 8: Index of Industrial Production (Cumulative Indices April-November): 2012-13 to 2017-18 - Sector-wise
2012-13 2013-14 2014-15 2015-16 2016-17 2017-18*Mining 91.8 89.1 89.0 92.3 95.5 98.4Manf. 102.6 106.3 110.6 112.9 119.3 123.0Elect. 103.9 109.3 128.5 134.6 143.1 150.5General 101.1 104.0 108.9 111.7 117.8 121.6
80.0
90.0
100.0
110.0
120.0
130.0
140.0
150.0
160.0
* Provisional

29
Chart 9: Comparison of Sector-wise Growth Rates (w.r.t. previous year) for the period April to November as depicted by IIP: 2012-13 to 2017-18
2012-13 2013-14 2014-15 2015-16 2016-17 2017-18*Mining -8.2 -2.9 -0.1 3.7 3.5 3.0Manf. 2.6 3.6 4.0 2.1 5.7 3.1Elect. 3.9 5.2 17.6 4.7 6.3 5.2General 1.1 2.9 4.7 2.6 5.5 3.2
-10.0
-5.0
0.0
5.0
10.0
15.0
20.0
* Provisional
Note: Manf. – Manufacturing; Elect. – Electricity
Regional Conference for States of Southern Zone on State IIP
4.39 To facilitate compilation of State level IIP in line with the compilation of All-India IIP with base 2011-12, CSO conducted Regional Conference with States of South Zone on State IIP on 17.08.2017 in Visakhapatnam. This was the first Regional Conference in the series of conferences planned for various regions. The Conference was organized in collaboration with the Directorate of Economics & Statistics, Govt. of Andhra Pradesh. Representatives of six States/ UTs in the Southern Zone, viz. Andhra Pradesh, Karnataka, Kerala, Puducherry, Tamil Nadu and Telangana, participated in the deliberations.
Several issues related to base revision of State IIP to the year 2011-12 was discussed, and recommendations were made to improve data collection, compilation and dissemination of State IIP.

30
Regional Conference of States/ UTs of South Zone on State IIP, Vishakhapatnam
Workshop with Data users of All-India Index of Industrial Production
4.40 In the new series of Index of Industrial Production (IIP) with base 2011-12, launched on 12th May 2017, several methodological changes were introduced by the Central Statistics Office (CSO). In order to sensitize the users of IIP about the new aspects of IIP and generate awareness about its usage by major Government Organizations, a half day Data Users’ Workshop was organized by Economic Statistics Division (ESD), CSO at Vigyan Bhawan on 30th August 2017 under the Chairmanship of Chief Statistician of India.
The users were invited to participate in the workshop through an open advertisement in the leading financial dailies and also on the MoSPI website. 106 participants attended the workshop from the government, private sector, research and financial institutions and the media. A survey was also conducted to assess the requirement of users and the need for improvement in data. The proceedings of the workshop and the results of the survey are available on the MoSPI website at http://mospi.gov.in/sites/default/files/iip/IIP_circular_datausers_workshop.pdf.

31
Secretary, MoSPI addressing users in Data Users Workshop on IIP
32nd meeting of the Voorburg Group on Service Sector Statistics
4.41 Voorburg Group (VG) on Service Sector Statistics is one of the city groups instituted at the behest of United Nations Statistics Division to establish an internationally comparable methodology for measuring the output of the services industries. Aim of the Group is to develop concepts, methods and best practices in the Service Sector. The scope of the Group covers Services Producer Price Indices (SPPIs), Output by Products and Services classification. The Central Statistics Office, Ministry of Statistics and PI, Government of India hosted its 32nd meeting, during 23rd to 27th October 2017 in New Delhi, India.
About 40 international participants from 21 countries and 50 participants from various Ministries/ Departments of Government of India attended the weeklong meeting.
The discussions during the course of the meeting included emerging topics such as E-Commerce, Communication and Media Services, Investment Banking, Globalization and Quality Indicators for Service Sector Statistics.
One of the sessions during the meeting was dedicated to the host of the meeting – India for showcasing the status as well as progress made by different agencies involved in compilation of service sector statistics in India. During the host country session, representatives of Department of Industrial Policy and Promotion, Telecom Regulatory Authority of India, National Accounts Division of Central Statistics Office, Reserve Bank of India and National Sample Survey Office made presentations on “Overview of Compilation of Business Service Price Index”, “Measuring Telecommunication Services”, “Measurement of services in National Accounts”, “Index of Service Production for Banking Sector in India” and “Measurement of Services through Survey”, respectively.

32
All the presentations and documents presented in the meeting are accessible through the dedicated website (www.voorburg2017-delhi.gov.in). The website was designed also to assist foreign participants for online registration, booking of accommodation etc.
Secretary, MoSPI inaugurating the 32nd Voorburg Group Meeting on 23rd August 2017
Energy Statistics
4.42 The publication titled Energy Statistics is annually brought out by CSO and the “Energy Statistics 2017” (24th Edition) is the latest in the series released in March 2017. It is an integrated and updated database of reserves, installed capacity, production, consumption, import, export and wholesale prices of different sources viz. coal, crude petroleum, natural gas and electricity. Energy Balance and Sankey Diagram (Energy Flow Diagram) further aims to enhance its utility. Energy Indicators (Economic Dimension) were incorporated in this edition of the publication for the first time. This publication caters to the needs of the Planners, Policy-makers and Researchers by making available the energy data at single place.
Social Statistics
4.43 The Social Statistics Division is responsible for coordinating development of social, environment and multi-domain statistics. The ambit of Social Statistics covers population, human development including health and education, employment, social justice and time use, while that of multi-domain statistics includes poverty, gender, persons with disabilities, disability, indicators related to Millennium Development Goals, Sustainable Development Goals, SAARC Development Goals and SAARC Social Charter.

33
Gender Statistics 4.44 The Social Statistics Division provides technical guidance to other Ministries/Departments on issues related to collection, compilation of Gender Statistics in the Country.
4.45 India is a member in the Inter-Agency and Expert Group on Gender Statistics and other International forum on Gender Statistics. The Ministry participates in Conferences/Forums on Gender Statistics to understand its development in international scenario and to put forth the India’s view points. A senior officer from Social Statistics Division (SSD) of the Ministry participated in the 11th meeting of Inter-Agency Expert Group on Gender Statistics (IAEGS) and the 6th Global Forum on Gender Statistics during 30th -31st October 2017 and the EDGE project Seminar during 1st – 2nd November 2017 at Rome, Italy.
4.46 The Ministry had organized a 2-day National Consultation in collaboration with UN Women on Data Generation for Gender Indicators of SDGs during 21st-22nd August 2017 in New Delhi aiming to address the issues related to requirement of gender disaggregated data and to emphasise on the valid and measurable indicators that can effectively capture the gender related issues and assist the Government in bridging the differences.
4.47 The workshop had the objective of sensitizing all the stakeholders in improving the availability, timeliness and quality of data for gender indicators so as to enable monitoring of National SDG indicators in a realistic manner, thereby leading to holistic achievements of SDGs. The workshop was inaugurated by Shri D.V. Sadananda Gowda, Hon’ble Union Minister for Statistics and Implementation. Representatives from 31 Central Ministries / Departments and 28 States/UTs participated in the event.
Shri D.V. Sadananda Gowda, Hon’ble Minister, MoSPI addressing the Workshop on Data Generation for Gender Indicators of SDGs

34
4.48 In order to present a compilation of Gender Statistics on various aspects, SSD brings out an annual publication “Women and Men in India” since 1995. The publication focuses on gender perspective related to socio-economic indicators. It highlights the status of gender equity in the society, in the economy; share of health and education facilities for both the genders. The publication attempts to collate and portray gender-disaggregated data from various source agencies on various aspects.
Monitoring of Millennium Development Goals
4.49 The Ministry of Statistics and Programme Implementation is the nodal agency for statistical tracking of the Millennium Development Goals (MDGs) in India. The Social Statistics Division of the Ministry brought out India Country reports from time to time on the basis of official statistics available at national level generated by various Ministries/ Departments. The “Millennium Development Goals- Final Country Report of India” is the latest report which was published in October 2017. The Report is available in the web site of the Ministry. The report gives Goal wise progress under the MDGs and details of programmes and policies addressing the MDGs. A booklet “Achieving Millennium Development Goals Target Year Factsheet – India” was also published in August 2017. The booklet provides Goal wise achievements under the MDGs on Target Year.
SAARC Development Goals and SAARC Social Charter
4.50 The Ministry of Statistics and Programme Implementation is the designated nodal Ministry for statistical coordination and statistical monitoring of implementation of the SAARC Social Charter in the country. The SAARC Development Goals and SAARC Social Charter measures the extent of achievements of the Government policies for poverty alleviation, enhancement of income levels, providing better healthcare facilities, raising the literacy levels and thereby raising the standards of living of its citizens. The publications on SAARC Development Goals and SAARC Social Charter, are published in alternate years. The latest publication “SAARC Development Goals-India Country report– 2017” has been electronically published. The publication provides achievements made on SAARC development goals by presenting data on mutually agreed and some additional indicators for 22 goals.
Establishing a system of food and nutrition security analysis, research and monitoring performance towards Zero Hunger
4.51 Establishing a system of food and nutrition security analysis, research and monitoring performance towards Zero Hunger, a Country Strategic Plan (CSP) 2015-18 has been signed between Government of India (GOI) and UN World Food Program (WFP) in August 2015, through which WFP intends to focus on supporting the GOI to make significant and measurable progress in respect of the following two objectives:

35
• Ensuring access to safe, nutritious and sufficient food for all people all year round; and
• Ensuring ending malnutrition according to internationally agreed targets, with a focus on curtailing stunting and wasting for children under five years of age, and addressing the nutritional needs of adolescent girls, pregnant and lactating women, and older persons.
4.52 Under these overall objectives, Ministry of Statistics and Programme Implementation (MoSPI) is the nodal agency for supporting establishment of an effective system of food and nutrition security analysis, research and monitoring performance towards Zero Hunger. To institutionalize the food security analysis within the government data systems and to strengthen the performance monitoring of the food schemes, with the help of World Food Programme (WFP), India country office, this Ministry has the following national level joint activities under the overall framework of CSP:
• Preparation of a Food and Nutrition Security (Zero Hunger) Atlas with states as the unit of analysis; and
• Installation of capacity for food and nutrition security analysis within the Ministry.
Time Use Survey
4.53 Time Use Survey (TUS) is a multi-purpose survey which provides an overview on people’s time use (paid work, housekeeping, leisure time, etc.) by recording each sampled individual’s activities on a daily or weekly basis. Time-use data are the basis for obtaining statistics related to several topics - time allocation patterns; unpaid work; participation in all forms of paid work; working time, work locations and the scheduling of economic activities; work-family balance; the investment of time in education and health; welfare and quality of life; and intra-household inequality – each of which can be further disaggregated by other classifications like gender, age, geographical areas, etc. as per the requirements of the users and stakeholders.
4.54 Based on the recommendations of the “Task Force on Improving Employment Data” headed by Dr Arvind Panagariya, Vice Chairman, NITI Aayog, Ministry of Statistics and Programme Implementation (MoSPI) has been requested to undertake a regular Time Use Survey at three-year intervals. In the report, it has been noted that “the survey will be useful for determining the extent to which individuals engage in multiple occupations and the share of their time spent in performing productive but non-market activities and time spent on leisure activities. The survey will also help us track how time spent by households has been changing and measure women’s participation in unpaid work. The survey can also be useful for assessing the reasons for shifts in labour participation rates and the effects of policy changes on the pattern of activities”.

36
4.55 The matter was discussed in the 97th meeting of the National Statistical Commission (NSC) meeting held on 22nd September 2017, wherein the Commission considered the report submitted by the Group of Officers constituted under the chairmanship of Director General, CSO on the different aspects of a Nation-Wide Time Use Survey (TUS) and approved the survey instruments as described in the report. The TUS instruments have since been finalized and have been forwarded to NSSO for consideration and implementation.
Environment Statistics
4.56 Environmental concerns, such as climate change, natural resources, biodiversity, water quality, land degradation, air quality, waste management, natural resources and biodiversity, have increasingly become the subject of all policies both at national and state levels. Growing pressures on the environment and increasing environmental awareness have generated the need for countries to appropriately account for their environmental and natural resources as a means of developing suitable policies, and hence the need for timely and reliable environment statistics is now greater than ever before.
4.57 The Social Statistics Division is publishing ‘Compendium of Environment Statistics- India’ every year since 1997. The contents of the publication is broadly based on the International ‘Framework for Development of Environment Statistics (FDES)’ of United Nations Statistical Division (UNSD) covering Bio-diversity, Atmosphere, Land and Soil, Water and Human Settlements. This publication has been useful in understanding various aspects of environment and the impact of development on environment like emissions and discharges, as also their sources and health hazards. The Compendium of Environment Statistics – India 2016 is the latest in this series which was released in March 2017.
Environmental-Economic Accounting
4.58 Environmental accounts help incorporate the value of natural capital into the national accounting framework alongside other forms of capital. Integrated environmental-economic accounts will highlight to policy makers the relationship between the environment and the economy and help ensure that natural capital is used in a sustainable way to support the economy over the long term. In the Indian context, it has been decided to develop a framework for these accounts in consonance with System of Environmental Economic Accounting – Central Framework (SEEA-CF) adopted by UN Statistical Commission in 2012 in a phased manner. However, the demands for data for such accounts are high since they embrace many different domains. Several of these are clearly linked to statistics already available in other fields like agriculture, transport, energy, business, production, and trade statistics. Many on the other hand, are complex (e.g. ecosystems and biodiversity) and linked to fields not covered by the traditional statistics. Also, several of these fields do not follow the traditional paths for collecting and processing data.

37
For example, remote sensing or specific counts (number of species) would be required to collect the relevant information. Different networks for collecting and processing these data need to be established for sourcing the information. The consultative process with the data sources is underway in the form of an Inter-Ministerial Group, which has been formed by drawing members from the Ministries of Environment, Forest & Climate Change, Agriculture & Farmer Welfare’s, Petroleum & Natural Gas, Water Resources, River Development & Ganga Rejuvenation, etc. It is envisaged that the accounts for some of the components would be released in the next financial year.
Ecosystem Accounting
4.59 United Nations Statistics Division (UNSD) has launched a pilot project on “Natural Capital Accounting and Valuation of Ecosystem Services”, in five countries - India, Brazil, China, South Africa and Mexico for a period of three years. The project is proposed to be implemented jointly by United Nations Statistics Division (UNSD), the United Nations Environment Programme (UNEP) and the Secretariat of the Convention of Biological Diversity. UNSD would be the overall in-charge of the project.
4.60 The project aims at assisting participating countries to advance their knowledge on environmental and ecosystem accounting, ecosystem valuation and macro-economic analysis with a view to improving management of natural biotic resources ecosystem and their services at the national level. SSD is in the process of finalising the detailed project proposal outlining the activities and case studies to be taken up under the project.
Disaster statistics
4.61 The CSO had developed a framework for compilation of disaster statistics at district level to be aggregated at the state level and further consolidated at the Centre level in order to regularize compilation of disaster statistics. Formats for the data collection were also prepared and finalized in consultation with Ministry of Home Affairs (MHA). The matter is being pursued with the MHA in view of the acceptance of the Sendai framework for Disaster Statistics for systematic compilation of disaster related data.
Development of Global Indicator Framework for Sustainable Development Goals (SDGs)
4.62 On 25th September 2015, the Heads of State and Government and High Representatives meeting at United Nations Headquarters in New York adopted the document titled Transforming Our World: the 2030 Agenda for Sustainable Development adopting a new set of global Sustainable Development Goals which will transform the world in the next 15 years. These are universal goals and targets which involve the entire world, developed and developing countries alike. They are integrated and indivisible and balance the three dimensions of sustainable development viz; Economic, Social and Environmental.

38
4.63 The Ministry of Statistics and Programme Implementation (MoSPI) is involved in the global efforts by the UN Statistical Commission to develop an indicator framework for global monitoring of SDGs. India is a member of the Inter-Agency and Expert Group on Sustainable Development Goal Indicators (IAEG-SDG).The fourth meeting of the IAEG-SDG has finalized a list of Global indicators of SDGs which was adopted by the General Assembly on 6 July 2017.
4.64 In India, the National Institution for Transforming India (NITI) Aayog has been entrusted with the responsibility for identification of national targets and assigning them to the Ministries / Departments concerned for implementation. The Ministry of Statistics and Programme Implementation is responsible for developing the National Indicator Framework (NIF) for measuring the progress of the SDGs and associated targets. Statistical indicators will be the backbone of monitoring of SDGs at the national and state level.
4.65 Based on a national consultation process involving Ministries/Departments of the Government, State Governments, UN agencies and other stakeholders, a draft national indicator framework was prepared. The indicator list was uploaded in the Ministry’s website for public responses. The Ministry has received about 70 responses from various organizations including UN organizations, NGOs, Civil Society and individuals. After detailed discussion and deliberation, a comprehensive list of national indicators with periodicity and data source Ministries / Departments has been proposed.
4.66 To strengthen and sensitize the States Governments and UT Administration on development of Monitoring Framework at State level in line with National Indicator Framework on SDGs, Ministry of Statistics and Programme Implementation has successfully conducted five regional Workshops covering all States & UTs.
• Regional Workshop for Western States/UTs comprising Rajasthan, Gujarat, Goa, Maharashtra, Madhya Pradesh, Daman and Diu, Dadra & Nagar Haveli was held during 27th – 28th September 2017 at Ahmedabad, Gujarat.
• Regional Workshop for Northern States/UTs comprising Jammu and Kashmir, Himachal Pradesh, Punjab, Uttarakhand, Uttar Pradesh, Haryana, Chandigarh and Delhi was held during 16th – 17th October 2017 at Lucknow, Uttar Pradesh.
• Regional Workshop for Southern States/UTs comprising Andhra Pradesh, Telangana, Karnataka, Kerala, Tamil Nadu, Puducherry, and Lakshadweep Island was held during 20th – 21st October 2017 at Chennai, Tamil Nadu.

39
• Regional Workshop for North-Eastern States/UTs comprising Assam, Sikkim, Nagaland, Meghalaya, Manipur, Mizoram, Tripura and Arunachal Pradesh was held during 2nd – 3rd November 2017 at Guwahati, Assam.
• Regional Workshop for Eastern States/UTs comprising Bihar, Orissa, Jharkhand, West Bengal, Chhattisgarh and Andaman & Nicobar Islands was held during 6-7 November 2017 at Bhubaneswar, Odisha.
Human Resource Development
4.67 National Statistical Systems Training Academy (NSSTA) located at Greater Noida along with the Training Unit located at Pushpa Bhawan, Madangir Road, New Delhi functions as the Training Division of the Central Statistics Office.
4.68 National Statistical Systems Training Academy (NSSTA), earlier known as the National Academy of Statistical Administration (NASA), which came into existence on 13th February 2009, is a premier Institute primarily fostering human resource development in official statistics at national and state level. The Academy is actively engaged in building capacities in the area of Official Statistics and related disciplines at the National / Sub- National as also at the international level, particularly amongst developing & SAARC countries. The Academy confronted with the challenge of keeping the statistical workforce abreast with and updated on the dynamics of the socio-economic environment and technological and methodological advances, has been continuously striving not only to develop updated course material, revise course curriculum etc; but also to implement effective delivery mechanisms by focusing on pedagogy, all encompassed in its focused training strategy directed at both newly inducted as well as in-service statistical personnel of Central and State/ UT Governments. The main aims and objectives of the Academy are as under:

40
• To create a pool of trained manpower in theoretical and applied statistics to effectively manage both the current and emerging challenges of data collection, collation, analysis and dissemination for better formulation of policies and plans for the country;
• To train statistical as well as non-statistical manpower in undertaking monitoring and evaluation of large scale programmes/ projects, through specialized short/ medium term training programmes; and
• To create a pool of trainers and develop training material via course-ware in consultation and collaboration with academicians, researchers and professionals from universities, external professional institutions and UN/ bilateral agencies.
4.69 The training strategy adopted entails conducting both induction and refresher training programmes at the NSSTA and outsourcing some trainings to several other identified reputed and specialized institutions. The programmes cater to the need based training of the statistical personnel working in the Central Government, namely, the Indian Statistical Service (ISS) officers, Sub-ordinate Statistical Service (SSS) officials of the Central Government, Statistical Officers from State/UT Governments and Public Sector Undertakings, in the identified subject areas.
4.70 The NSSTA also regularly provides technical support in terms of capacity development of the statistical personnel of the friendly and neighbouring Asian and African countries. As a result, request based training programmes are regularly conducted and organized at NSSTA.
4.71 The NSSTA has also been making efforts to sensitize the potential human resources through awareness programmes in official statistics, both at its campus and at various universities. These programmes also include training of faculty and students from various Universities at NSSTA as well as organizing awareness programmes at selected Universities by the officers of the Academy and Central Statistics Office. NSSTA continues to organize this activity every year, as it has been found very useful by the community of users of official statistics.
Amenities: 4.72 The NSSTA is equipped with the modern state-of-the art facilities for training and board & lodging of the trainees. The complex of the Academy comprises three well organized building blocks, namely, the Academic and Administrative Block, Hostel Block and the Residential Block, surrounded by well-maintained landscapes. The facilities available in the Academic and Administrative Blocks, also include a conference hall, with a seating capacity of around 60 persons; a centrally air conditioned auditorium, namely, the ‘Mahalanobis Auditorium’, with a seating capacity for around 160 persons; five lecture/training /seminar halls, fitted with latest computerized teaching aids; a library, namely the Sukhatme Library; IT teaching computer laboratory

41
equipped with adequate infrastructure to conduct training for about 30 trainees at any point of time, in terms of hands-on- training and lodging facilities for 100 trainees, with the aid of 40 Single Bed and 30 Double Bed air-conditioned rooms. The recreational facilities available in the campus include those for indoor games like Billiards, Table tennis etc. & outdoor games like Volleyball and Badminton.
4.73 In order to keep pace with the emerging new technologies, especially in the domain of Information and Communication Technology (ICT), the NSSTA has taken various steps towards office automation. For this, a significant IT infrastructure in terms of servers such as blade server, database server, exchange server etc., along with requisite software has been put in place within the premises of the Academy, in order to make available all the necessary IT facilities not only to the NSSTA officials but more importantly, also to the trainees.
Training Programme Approval Committee (TPAC)4.74 In order to look after and guide NSSTA on various training programmes, a High Level Committee namely, “Training Programme Approval Committee” (TPAC) has been constituted with senior officers of the Government of India and a few subject experts from reputed Institutes as members. The Committee assesses and approves the need-based training calendar on an annual basis, besides reviewing the syllabi, duration and training methodology for all the modules. Most of the courses are conducted at NSSTA while some of the specialized courses are outsourced to reputed institutes/ organizations in Delhi or outside, with proven credentials. Subjects covered in the various programmes conducted by NSSTA mainly include those in the areas of Official Statistical Systems, Theoretical & Applied Statistics, Large Scale Sample Surveys, SNA 1993 & 2008, Data Management Techniques, Information Technology, Management, Financial Management, Micro and Macro Economics, Econometrics etc.
Regular Training Scheduled at NSSTA4.75 The training programmes conducted or organized by NSSTA are as follows:
• Two year Induction Training for the officers of the Indian Statistical Service (ISS), including 6 months of “On- the- Job Training”.
• Induction and integrated training programmes for the Subordinate Statistical Service (SSS) Officers, including Training of Trainers (TOT’s) for these courses;
• Refresher Training Courses/Seminars/Workshops for the in-service ISS Officers and senior Officers of Central Ministries/Departments, State/UT-Directorates of Economics & Statistics & other Line Departments;
• Request- Based Refresher Training Programmes for officers from Central/ State/ UTs Govts;

42
• 8 days exposure programme on Official Statistical System to the M. Stat. Students from the Indian Statistical Institute (ISI), Kolkata and other centres;
• Awareness programmes in official statistics for students and faculty members of universities; and
• Internship Programmes for post graduate students in Statistics of Indian Universities.
4.76 For the purpose of specialized training, NSSTA collaborates with various reputed/specialized Institutes of Managements viz. Indian Institute of Management (IIM); Indian Institute of Remote Sensing (IIRS), Dehradun; Administrative Staff Collage of India (ASCI), Hyderabad; Labour Bureau, shimla; Indian Institute of Public Administration (IIPA), Delhi; International Institute for Population Science (IIPS), Mumbai; Institute for Secretariat Training and Management (ISTM) Delhi; Delhi School of Economics Delhi; Indian Agriculture Statistical Research Institute (IASRI), Delhi; Institute for Social and Economic Change (ISEC), Bangalore, etc.
4.77 Training of State Statistical Personnel: Regular as also demand based Training Programmes are conducted from time to time for State/UTs Governments in certain specified subjects and areas of their interest. Besides these, tailor-made training courses, based on specific requests received from the States and UTs, are also conducted at NSSTA.
4.78 International Training Programmes:• NSSTA in collaboration with International Statistical Education Centre
(ISEC), Kolkata, under the aegis of Indian Statistical Institute (ISI), Kolkata conducts a 4 Weeks’ Training on “Official Statistics & Related Methodology” out of the total 10 month duration of International Statistical Education Centre (ISEC) course for the international participants, conducted by ISI, Kolkata;
• Short term i.e. one-two week training programmes and study visits for the statistical personnel/ participants from countries in the South Asian region, Asia & Pacific require and Africa are conducted at the request of Statistical Institute for Asia and the Pacific (SIAP), United Nations Economic and Social Commission for Asia and the Pacific (UNESCAP), Food and Agriculture Organization (FAO), World Bank or the National Statistical Offices (NSOs) of the countries; and
• International Conferences, Seminars and Workshops on emerging areas of Official Statistics are also conducted by NSSTA.
Data Storage and Dissemination Division (DSDD)4.79 Data Storage and Dissemination Division (DSDD) formerly known as Computer Center was set up in 1967 with 3 Honey-well-400 2nd generation Computer Systems to meet the data processing needs of various Government Ministries/Departments/Organizations and Public Sector Undertakings located

43
in and around Delhi. These Systems were replaced in 1981 by Burrroughs-3845 mainframe Computer System, later by 7000/240. The Division is now equipped with sophisticated state-of-the-art technology computer devices and servers. The Data Center of the Ministry is operational round the clock to facilitate the data requirements of the national and international users. DSDD is headed by Add. Director General level officer of ISS cadre.
The division is also harnessing the benefits of cloud computing through Government of India (GOI) Cloud Services wherein several web applications of the Ministry such as Consumer Price Index (CPI), International Household Survey Network (IHSN) and Computer-Assisted Personal Interviewing (CAPI) etc. have been hosted for better utilization of the infrastructure and speed.
Main Projects of the DSDD:4.80 Data Preparation, Processing and Dissemination:
As per the “National Policy on Dissemination of Data” approved by the Cabinet in September 1999, the DSDD has been entrusted with the responsibility of creation and maintenance of the National Data Warehouse on Official Statistics and dissemination of unit level data to users.
Division is the repository of a large volume of micro data generated through various Socio-economic Surveys, Economic Censuses, Enterprise Surveys and the Annual Survey of Industries conducted by the NSSO and the CSO. These data are being disseminated regularly to a large number of national and international users on demand and nominal cost.
Consumer Price Index: 4.81 Consumer Price Indices (CPI) measure changes over time in general level of prices of goods and services that households acquire for the purpose of consumption. CPI is widely used as a macroeconomic indicator of inflation, as a tool by governments and central banks for inflation targeting and for monitoring price stability, and as deflators in the national accounts. CPI is also used for indexing dearness allowance payable to the employees to offset the effect of increase in prices.
4.82 Monthly Indices are processed for Rural 1181 villages and Urban 1114 markets in 310 towns, up to maximum 11th of every month and released by Price Statistics Division (PSD), CSO on 12th of the month at 5.30 pm. Though the major work is being performed by PSD, this Division also plays following key roles in compilation of CPI.
• e-Price Collection Management System –Urban, developed and maintained by Computer Centre : used by the FOD to enter the prices on monthly based across the country;
• Price Data is downloaded in American Standard Code for Information Interchange (ASCII) format from Rural and Urban websites;

44
• Data is processed in readable format which is called the Dump of the raw data and the dump is sent PSD on demand;
• After scrutiny of the Price data, separate for CPI(O), CPI(®), CPI(H) are complied;
• After press release following indices are uploaded on CPI Web Portal to show the time-series indices, visualization, inflation rates, press releases, weights which can be downloaded in different formats;
• State/All India/Group-Subgroup Indices
a) All India Item Index
b) Annual Inflation Rates
c) All India Item Inflation Rates
d) Press Release
Cloud Services:
4.83 Cloud Computing, Government of India has embarked upon an ambitious initiative - “GI Cloud” which has been named as ‘MeghRaj’. GI Cloud is a new project launched by the Government of India to harness the benefits of Cloud Computing. The GI Cloud ensure optimum utilization of the infrastructure and speed up the development and deployment of e-Governance applications. It also help the departments to procure ICT services on demand. The National Informatics Centre (NIC) is providing Cloud services under the MeghRaj initiative.
• DSDD being a nodal office, perform key activities in the services are being Booking resources for the various projects of NSSO and CSO at NIC Data Centre;
• Installation of prerequisite tools/software and making the machine ready for hosting the software application;
• Hosting of the software application on NIC Cloud Machine;
• Liasioning with NIC/Vendors and Cloud Server authorities for requirement of resources;
• Coordination with Domain Name Registrar for acquisition of Domain name with NIC for Direct Benefit Transfer (DBT), Voorburg project etc;
• Processing and Implementation of the Secure Sockets Layer (SSL) Certificate;
• Acquisition of Public IP for NIC Cloud Server;
• Mapping of Public Internet Protocol (IP) with Domain name provided by the NIC; and

45
• CAPI (https://mospi-capi.gov.in) & Devinfo (http://devinfiindia.gov.in) Web Portal were made Go Live. CPI and IHSN web applications are under process.
Web Site of the Ministry4.84 The DSDD is the Nodal Agency to develop, update and maintain the Website of Ministry. The new Website of the Ministry was launched and inaugurated by the Hon’ble Minister for Statistics and PI. The address of the website of the Ministry of Statistics and Programme Implementation is http://www.mospi.gov.in.
Economic Census (EC): 4.85 EC is the census of the Indian economy through counting all entrepreneurial units in the country which are involved in any economic activities of either agricultural or non-agricultural sector or engaged in production and/or distribution of goods and/or services not for the sole purpose of own consumption. The 6th Economic Census was conducted during 2013-14 by Directorate of Economics & Statistics of the States/UTs under the supervision of Economic Statistics Division (ESD) of the Ministry. The unit level data of 4th, 5th & 6th Economic census are being disseminated by the DSDD.
National Fact Sheet on Indian Economy4.86 In pursuance of recommendation of the National Statistical Commission (NSC) and follow-up meeting on the subject under reference, DSDD has to develop web portal/dashboard for National Fact sheet on Indian Economy (NFIE) using SAS BI tool and/or DevInfo.
• The Division has designed a prototype using DevInfo on various economic indicator of the Indian economy using sample data provided by ESD, CSO.
• The actual project will be designed using Business Analytical tool to depict the indicators of the Indian economy in various forms. The data will be collected/coordinated by ESD, CSO from different Ministries/Departments in different forms.
Survey Data cataloguing using IHSN Tool kit software4.87 This Ministry has been disseminating microdata from its surveys and censuses since long. This web-based survey cataloging system is powered by the National Data Archive (NADA) software developed by the International Household Survey Network (IHSN). This system serves as a portal for researchers to browse, search, and download relevant census or survey documents and metadata.
The Microdata Archive provides web based access to the complete metadata of over 142 surveys and censuses conducted under the National Sample Survey (NSS) programme, Annual Survey of Industries (ASI) and the

46
Economic Censuses currently available with the Ministry. Efforts are on to include metadata of surveys conducted by the State/UT Governments and other line Departments/Ministries of the Central Govt. Every month more than one lakh users viewed/downloaded the metadata in 2017 that has enabled the users to access/download the complete data from one source having international standard.
Training Activities:-
4.88 DSDD provides faculty services to NSSTA for conducting IT courses for officers/ officials of States/UTs and Central Government Ministries/Departments. The Division is also providing internship to the students sponsored by various Universities/ Institutions for developing IT related projects for two to six month duration under the guidance of officers of the Centre. Four interns have successfully completed two months internship programme in scheme for the “Internship for Post Graduate/ Researchers Scholars’ of the Ministry in the Computer using NSS data of different rounds for study and Analysis with Analytical R Software.
Data Centre:
4.89 The servers of the Data Center is operating on 24x7x365 basis and troubleshooting of Network setup, Desktops and Printers made available as per user requirement. The Division has also procured hardware and software for upgrading and maintaining the Data Center. The IT equipments are being upgraded to meet the current requirements of Ministry.
Progressive use of official language Hindi:
4.90 In accordance with the Official Language policy of the Union, concerted efforts are being made for promotion of progressive use of Hindi as Official Language. Official Language Implementation Committee under the chairmanship of Additional Director General, DSDD reviews the progress of Hindi and compliance of Official Language Act and rules there under. Four Hindi workshops were organized in the Centre to impart knowledge of Hindi to Officers and Officials. Hindi Pakhwara was observed in the centre in September 2017. During this period competitions were organized and cash prizes and certificates were given to the participants.
Coordination and Publication (CAP)
4.91 The Coordination and Publication (CAP) Division is mainly responsible for coordinating the statistical activities of various Divisions of the Ministry and maintaining a liaison with the Central Government Ministries/Departments and also with State Governments and other Statistical Agencies. The Division is responsible for Plan Coordination for the Ministry as a whole. The Division is also responsible for preparation of the Annual Action Plan and Outcome Budget of the Ministry. The Division is also entrusted with the responsibility of

47
administering the Sub-Scheme “Support for Statistical Strengthening (SSS)”, coordination work of implementation of the Collection of Statistics Act, 2008 and follow-up of National Statistical Commission (NSC) recommendations.
Conference of Central and State Statistical Organizations (COCSSO)4.92 In order to enhance coordination amongst different States/UTs and Central Ministries/Departments for the activities in the field of statistics, the Ministry organizes Conference of Central and State Statistical Organizations (COCSSO) every year. This forum is used for discussing important statistical issues by the Central and State statistical agencies with an objective to ensure the availability of reliable and timely statistics to planners and policy makers for informed decision making and good governance.
4.93 The 24th COCSSO was organized during 18th-19th January 2017 in Nagpur, Maharashtra. During the conference, the following topics were discussed:
• Discussion papers/talks on the theme “Agriculture & Farmers Welfare”, presented by Ministry of Agriculture & Farmers Welfare, National Bank for Agriculture and Rural Development (NABARD), Field Operations Division (FOD) of NSSO, Ministry of Environment, Forest and Climate Change (EFCC), ICAR, RBI, ISI, NITI Aayog and Food and Agriculture Organisation (FAO);
• Progress of the Support for Statistical Strengthening Scheme; and
• Success stories/innovations by States on data availability and gaps in agriculture sector.
Dr G.C. Manna, Ex Director General, MoSPI, Dr T.C.A. Anant, Chief Statistician of India and Secretary, MoSPI, Shri D.V. Sadananda Gowda, Hon’ble Minister for Statistics & Programme Implementation,Shri S.S. Mungantiwar, Hon’ble Minister for Finance & Planning, Forest, Govt. of Maharashtra and Dr R. B. Barman, Chairman, National Statistical Commission (NSC) on 24th COCSSO
during 18th-19th January 2017 at Nagpur, Maharashtra.
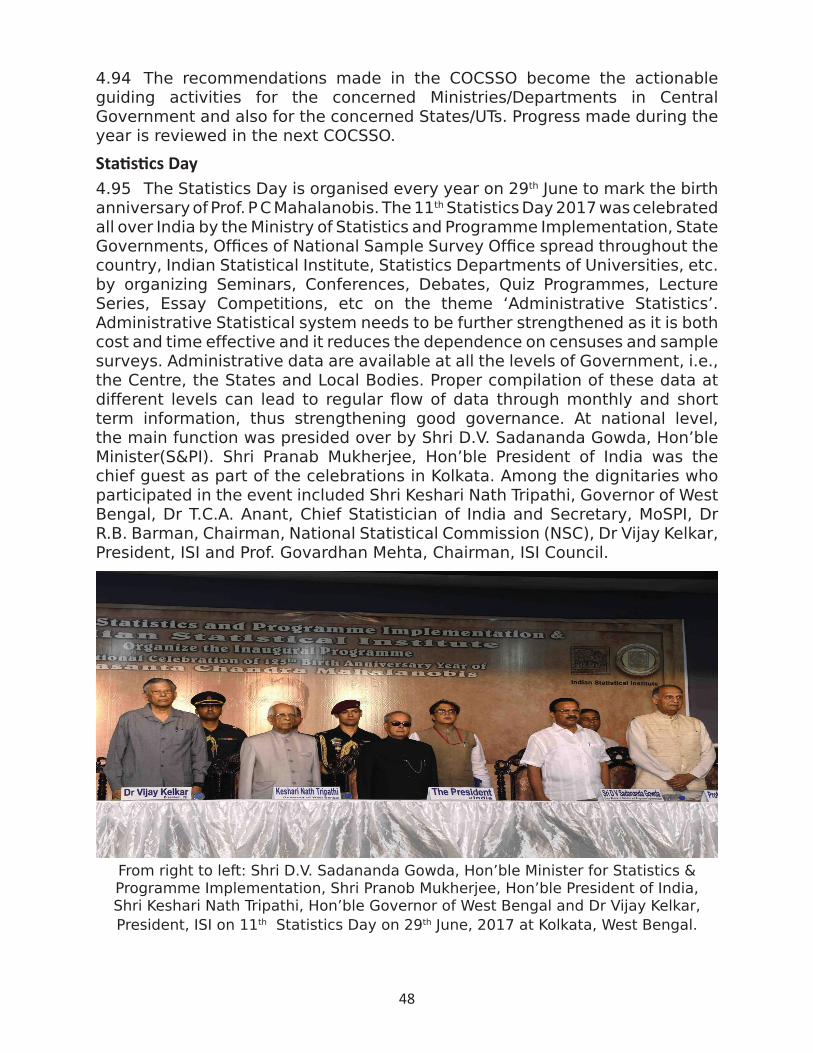
48
4.94 The recommendations made in the COCSSO become the actionable guiding activities for the concerned Ministries/Departments in Central Government and also for the concerned States/UTs. Progress made during the year is reviewed in the next COCSSO.
Statistics Day4.95 The Statistics Day is organised every year on 29th June to mark the birth anniversary of Prof. P C Mahalanobis. The 11th Statistics Day 2017 was celebrated all over India by the Ministry of Statistics and Programme Implementation, State Governments, Offices of National Sample Survey Office spread throughout the country, Indian Statistical Institute, Statistics Departments of Universities, etc. by organizing Seminars, Conferences, Debates, Quiz Programmes, Lecture Series, Essay Competitions, etc on the theme ‘Administrative Statistics’. Administrative Statistical system needs to be further strengthened as it is both cost and time effective and it reduces the dependence on censuses and sample surveys. Administrative data are available at all the levels of Government, i.e., the Centre, the States and Local Bodies. Proper compilation of these data at different levels can lead to regular flow of data through monthly and short term information, thus strengthening good governance. At national level, the main function was presided over by Shri D.V. Sadananda Gowda, Hon’ble Minister(S&PI). Shri Pranab Mukherjee, Hon’ble President of India was the chief guest as part of the celebrations in Kolkata. Among the dignitaries who participated in the event included Shri Keshari Nath Tripathi, Governor of West Bengal, Dr T.C.A. Anant, Chief Statistician of India and Secretary, MoSPI, Dr R.B. Barman, Chairman, National Statistical Commission (NSC), Dr Vijay Kelkar, President, ISI and Prof. Govardhan Mehta, Chairman, ISI Council.
From right to left: Shri D.V. Sadananda Gowda, Hon’ble Minister for Statistics & Programme Implementation, Shri Pranob Mukherjee, Hon’ble President of India, Shri Keshari Nath Tripathi, Hon’ble Governor of West Bengal and Dr Vijay Kelkar, President, ISI on 11th Statistics Day on 29th June, 2017 at Kolkata, West Bengal.

49
4.96 A Brochure on 11th Statistics Day and Key Indicators of Unincorporated Non-agricultural Enterprises (excluding construction) in India were released by Chairman, NSC; Secretary (S&PI) and Director, ISI. Winners of “On the Spot Essay Writing Competition” for Post Graduate Students in Statistics of recognized universities/institutions at all India level, to celebrate the birth anniversary of Prof. P.C. Mahalanobis were also felicitated.
4.97 CAP Division coordinates with the Central Subject Ministries through the Statistical Coordinators designated by the concerned Central Ministries for the matters related to recommendations of Rangarajan Commission and other statistical matters. This Division also coordinates with the Directorate of Economics & Statistics (DESs) of all States/UTs through the Deputy Director Generals of NSSO, FOD posted in the State Headquarters, designated as State Coordinators by the Ministry of Statistics and Programme Implementation (MoSPI) to coordinate with the State/UT DESs on critical issues.
Outcome Budget
4.98 The Division is also responsible for bringing out the Outcome Budget of the Ministry. This Division prepares the Outcome Budget based on inputs from different Divisions/ Units of the Ministry. The Outcome Budget 2017-18 of the Ministry was brought out on time and copies of the same were laid on the tables of both the Houses of Parliament.
Annual Action Plan
4.99 The Annual Action Plan (AAP) of the Ministry of Statistics and Programme Implementation is prepared by each Division every year at the beginning, and monitored quarterly after obtaining inputs from all the Divisions of the Ministry. The objectives of the AAP are:
• To reflect on the manner and time frame of action in respect of various activities and functions to be performed during the course of the year;
• To indicate the milestones and targets to be achieved in each quarter; and
• To serve as an instrument for timely and efficient implementation of all the programmes and activities.
4.100 Annual Action Plan 2017-18 was prepared during the year which contained the continuing/pending activities of previous year to be undertaken during the year and new initiatives proposed to be taken in 2017-18, besides routine items of the respective Divisions. In the Annual Action Plan 2017-18,

50
each activity is enumerated quarter-wise along with physical targets giving the total workload to facilitate effective monitoring.
Research and Publication
4.101 Research and Publication Unit (RPU) of CAP Division compiles publications that provide structured information and dissemination of information to users as per their requirement. The publications of the Unit aim at providing diverse data at one place, necessitating regular collection, compilation and updation of socio-economic data on various aspects. The publications regularly brought out by the Unit are:
• Statistical Year Book, India-Annual.
• India in Figures, A Ready Reference-Annual.
4.102 The Unit also regularly supplies information to International agencies various National agencies and other user groups. During 2017-18, RPU provided information to Asian Development Bank and United Nation Monthly Bulletin of Statistics.
4.103 The Unit also coordinates Joint Statistical Publication of the BRICS (Brazil, Russia, India, China and South Africa) which is released in BRICS Summit each year. This year, Joint Statistical Publication 2017 of BRICS countries was prepared and released by China in September 2017. In the year 2016, this publication was prepared and released by India in the BRICS countries Summit held during 15th & 16th October 2016 in Goa. The Graphics Unit of the RPU provides design support for different publications, advertisements, logos, etc. as per the requirements of various Divisions/Wings of the Ministry.
4.104 RPU has been now merged with Data Storage & Data Dissemination Division of the Ministry and the Statistical Year Book will be electronically released with user friendly search criteria.
Support for Statistical Strengthening Project (SSSP)
4.105 ‘Support for Statistical Strengthening’ (SSS) is an ongoing scheme which aims to improve the statistical capacity and operations of State Statistical Systems for collecting, compiling and disseminating reliable official statistics. A total of ` 650.43 crores has been approved for the scheme. The Scheme is being implemented through the State Directorates of Economics & Statistics, as per the approved activities/targets/outputs detailed out in the State specific MoUs signed between the Govt. of India and the respective States/UTs.
4.106 Since 2016-17, the Scheme has become a Central Sector sub-Scheme

51
under the umbrella scheme of Capacity Development with 100% funding from the Centre. It is presently being implemented in 14 States and is proposed to be extended to 19 remaining States/UTs during 2017-18 to 2019-20.
4.107 In the currently implementing States, implementation of the Scheme has resulted in improvements in the compilation of core indicators, creation of databases for policy planning at State and sub-State levels, and improved capacity building. For the new States joining the scheme, there will be no financial assistance for physical infrastructure and procurement of IT hardware. The thrust of the Scheme is now on achieving tangible statistical outcomes/products for improving the States Statistical Systems.
4.108 Some Major Outcomes/Achievements in 2017
• All India Review meeting of all 33 States [14 old and 19 new] was conducted in Vigyan Bhawan Annexe on 6th March 2017, in which the implementation in the old States was reviewed and new States were advised on preparation of State Programmes. Public Finance Management System (PFMS) workshop was also conducted.
• In order to facilitate preparation of State Programmes of new States, two Regional workshops, one for 8 Northern/North Western States at Lucknow during 24th -25th April 2017, and one for 5 North-Eastern States at Shillong during 5th -6th May 2017 were conducted.
• The Draft State Programme of Himachal Pradesh, Assam and Tripura have been approved by their respective State High Level Steering Committees (SHLSC), chaired by Chief Secretary.
• Steps have been taken to operationalize the PFMS System for releases under the scheme. A workshop on PFMS for Southern States was conducted in Kerala in September 2017.
• The status of implementation of States of the Eastern Zone, i.e. West Bengal, Bihar, Jharkhand and Odisha (all current implementing States) were discussed in the meeting of the Standing Committee of the Eastern Zonal Council, chaired by Chief Secretary, West Bengal.
• The Hon’ble Minister of Statistics & P.I, reviewed the status of implementation in Kerala on 11th January 2018.
• The status of implementation in current states was reviewed by Secretary and DG, ES (CSO), in the recently held 25th Conference of Central and State Statistical Organization (COCSSO), at Bengaluru on

52
19th January 2018. The states were advised to speed up the completion of pending works in a time bound manner.
The Collection of Statistics Act, 2008 (COS Act, 2008)
4.109 The Additional Director General of the CAP Division has been designated as a Nodal Officer under the Collection of Statistics Act, 2008 for exercising powers and performing duties under the Collection of Statistics Rules, 2011 made thereunder. The new Act was basically enacted to overcome the limitations of the 1953 Act and strengthening the administration of statistical activities. The data for the Annual Survey of Industries, 2010-11 to 2013-14 and 6th Economic Census have been collected under this Act. The Annual Reports 2015 & 2016 on working of the Collection of Statistics Act, 2008 are under finalization.
The Collection of Statistics (Amendment) Act, 2017
4.110 The Collection of Statistics (Amendment) Act, 2017 was notified in the Gazette by the Legislative Department for general information on 5th August 2017. The said Amendment is mainly to extend the jurisdiction of the Collection of Statistics Act, 2008 to the State of Jammu & Kashmir in respect of statistical subjects falling in the Union List and the Concurrent list as applicable to the State. This Ministry, vide Notification dated 29th September 2017, brought the Act into force on 3rd October 2017.
Coordination and follow up of NSC Recommendations
4.111 The CAP Division is also responsible for coordination and follow up of recommendations of Rangarajan Commission. The Commission chaired by Dr C. Rangarajan in its comprehensive report (August 2001) made 623 recommendations for the improvement of the Indian Statistical System. During a review in its 60th Meeting held on September 2013, Out of 623 recommendations in all, 147 recommendations have been taken as implemented, 09 Recommendations have been Rejected/Dropped and 467 recommendations are still pending. NSC observed that it requires a thorough review to prepare a fresh list of recommendations that need to be pursued in the present context. The Committee has reviewed the recommendations of the Rangarajan Commission under the Chairmanship of ADG (CAP) in its 8th meeting. Based on the meeting, 478 recommendations are taken as implemented, 17 Recommendations are Rejected/Dropped and 116 recommendations are still pending.
4.112 The National Statistical Commission in its 88th meeting held during 22nd -23rd September 2016 at Ahmedabad under the Chairmanship of Dr R.B. Barman, Chairperson, NSC, while reviewing the status of recommendations of
53
Rangarajan Commission had advised the CAP Division to circulate the point wise recommendations and its current status to the Chairman and Members of the NSC for their update. The same has been provided on 7th November 2016.
4.113 So far, 97 meetings of the National Statistical Commission have been held, the last being on 22nd September 2017.
4.114 Annual Reports of the National Statistical Commission (NSC) along with ATRs for the years 2011-12, 2012-13, 2013-14, 2014-15 and 2015-16 have been laid in Lok Sabha and Rajya Sabha on 2nd August 2017 & 3rd August 2017 respectively.

54
CHAPTER V
NATIONAL SAMPLE SURVEY OFFICEOrganisation and Functions:
5.1 The National Sample Survey Office (NSSO) in Ministry of Statistics & Programme Implementation is responsible for conduct of large scale sample surveys in diverse fields on All India basis. Primary data is collected regularly through nation-wide household surveys on various Socio Economic subjects, Annual Survey of Industries (ASI) under the Collection of Statistics Act and Enterprise Surveys as a follow up of the Economic Census. Besides these surveys, NSSO collects data on rural and urban prices and plays a significant role in the improvement of crop statistics through supervision of the area enumeration and crop estimation surveys of the state agencies. It also maintains a frame of urban area units for drawing samples for Socio-Economic Surveys in urban areas.
5.2 NSSO functions, with requisite autonomy in matters relating to data collection, processing and publication/dissemination of results/data based on its surveys, under overall guidance and supervision of National Statistical Commission (NSC) which appoints Working Groups/Technical Committees, comprising both official and non-official members, on different subjects for finalisation of survey instruments for its surveys. Director General (Survey) is responsible for overall coordination and supervision of all activities of NSSO who is assisted by four Additional Director Generals, each one being in-charge of a separate Division responsible for four distinct aspects of such large-scale surveys relating to their designing & planning, field work/ data collection, data processing and coordination between different Divisions of NSSO.
5.3 Divisions of NSSO:
• The Survey Design and Research Division (SDRD), located at Kolkata, is responsible for technical planning of surveys, formulation of sample design, designing of enquiry schedules, formulation of concepts and definitions, drawing of tabulation plan, analysis and presentation of results and preparation of survey reports.
• The Field Operations Division (FOD) with its headquarters at Delhi/Faridabad and a network of 6 Zonal Offices, 51 Regional Offices and 116 Sub-Regional Offices spread throughout the country, is responsible for the collection of primary data for the surveys undertaken by NSSO.
• The Data Processing Division (DPD) has its headquarters at Kolkata. It has six Data Processing Centers at Ahmedabad, Bangalore, Kolkata,

55
Delhi, Giridih and Nagpur. It is responsible for sample selection, software development and processing tabulation of the data collected through surveys. It undertakes the job of software development for data entry, data verification, computer editing, other data validations, tabulation, etc. It also assists the States by providing IT solutions in all their data processing related activities as also through periodic training/workshop and other interactive methods. Industrial Statistics (IS) Wing also works under this Division. The main function of IS Wing is conceiving, designing, validating research regarding Annual Survey of Industries (ASI) which is the principal source of industrial statistics in India. The ASI data is collected and maintained through dedicated ASI Web Portal which leads to data accuracy and time saving. The vision is to deliver ASI data in a timely, transparent and reliable manner in a secured environment without any physical movement of the schedules.
• The Coordination and Publication Division (CPD) headquartered at Delhi coordinates all the activities of different Divisions. Besides, CPD is also responsible for organising National Seminars to discuss the survey results of various socio-economic surveys conducted by the NSSO. It publishes the technical journal of NSSO, named ‘Sarvekshana’ which includes research papers on various socio-economic surveys of NSSO.
Working Groups for recent rounds of NSS
5.4 Sixth meeting of the sub-group of the Working Group of NSS 73rd round was held on 23rd May 2017, under the Chairmanship of Dr A. C. Kulshrestha to discuss the final layout of tables to be presented in the Key Indicators document for NSS 73rd round survey.
5.5 Fourth meeting of the Working Group on NSS 73rd round on the subject of “Unincorporated Non-agricultural Enterprises in Manufacturing, Trade and Other Services (Excluding Construction)” was held on 24th May 2017 under the Chairmanship of Prof K. L. Krishna (Retd), Delhi School of Economics. The Working Group inter-alia finalized the layout of the Key Indicators document to be released based on the survey.
5.6 The Working Group of NSS 76thRound (July-December 2018) held its first and second meeting on 3rd November 2017 and 8th December 2017 at Delhi and Kolkata respectively under the Chairmanship of Dr Partha Mukhopadhyay, Senior Fellow, Centre for Policy Research, New Delhi to discuss the survey instruments for survey on (i) ‘Drinking Water, Sanitation, Hygiene and Housing Condition’ and (ii) ‘Persons with Disability’.

56
Standing Committee on Labour Force Statistics
5.7 Standing Committee on Labour Force Statistics (SCLFS) was constituted on 12th November 2014 under the Chairmanship of Dr S.P. Mukherjee, Emeritus Professor, University of Calcutta to oversee the conduct of surveys and system of collection, compilation and dissemination of Labour Force Statistics emanating from various surveys and census, besides suggesting mechanism for coordination and integration of Labour Force Surveys being conducted by the Central and State Governments.
5.8 During its meeting held on 23rd March 2017, the Standing Committee on Labour Force Statistics (SCLFS) recommended constituting a Sub-Committee to identify the issues to be considered and resolved, before and during a Pilot Survey to study the feasibility of implementing some of the recommendations made by the 19th International Conference of Labour Statisticians (ICLS).
5.9 The first meeting of the Sub-Committee on SCLFS entrusted with the tasks to identify the specific recommendations of the 19th ICLS which will be considered for inclusion in the Pilot Survey, was held under the Chairmanship of Dr S.P. Mukherjee at New Delhi on 14.07.2017.
5.10 The Sub-Committee in its second meeting held at New Delhi on 8th September 2017 approved the draft Schedule for the Pilot Labour Force Survey and the code structure for the activity status so that the requirements of 19th ICLS are met. The aspect of collection of information on various forms of work with appropriate reference period as per 19th ICLS through the Schedule was also discussed during this meeting.
5.11 The Sub-Committee during its third meeting held at New Delhi on 10th
November 2017 finalised the Draft Report of the Sub Committee to identify the recommendations of 19th ICLS for conducting pilot study and it was decided to present the finalized report in the next meeting of the SCLFS.
Activities related to various other NSS Rounds of Socio-economic surveys
5.12 NSS 72nd round (July 2014–June 2015) was devoted to the subject ‘Domestic Tourism Expenditure and Household Consumption on Services and Durable Goods’. The NSS Report No. 580 titled ‘Domestic Tourism in India’, based on the results of NSS 72nd round was released during July 2017.
5.13 A state tabulation workshop for NSS 72nd round (July 2014–June 2015) was organized at Data Processing Center, Delhi during 9th and 10th August 2017 under the Chairmanship of DG, NSSO. The workshop was attended by 62 participants of 30 States along with officers from DPD(HQ) and Data Processing Centres.
57
5.14 NSS 73rd round (July 2015-June 2016) was devoted to the subject of “Unincorporated Non-agricultural Enterprises (Excluding Construction)”. The Unit Level Data and Key Indicators document titled ‘Key Indicators of Unincorporated Non-Agricultural Enterprises (Excluding Construction) in India’ based on NSS 73rd round (July 2015-June 2016) was released during June 2017. The Key Indicators document on Unincorporated Non-Agricultural Enterprises (Excluding Construction) in India, based on the results of the NSS 73rd round was released during 2017-18.
5.15 NSS 74th round (July 2016 - June 2017) was devoted to ‘Focussed Survey on Services Sector’. It is a list frame based enterprise survey on the Services sector. The total number of central sample allocation in this survey from a combined frame of Ministry of Corporate Affairs(MCA), Economic Census(EC) and Business Registers(BR) is 63,659 enterprises. Data collection work has already been completed. Presently, data validation job of the said round is in progress in DPD.
5.16 The All India Workshop of Trainers (AIWOT) for the NSS 75th round was held at Udaipur during 13th- 14th April 2017. Review Regional Training Camps (RTCs) for 75th Round of NSS were organized in all Regional Offices during the month of August 2017 to discuss experiences of the fieldwork at the end of first month of the survey. All India Data Processing Conference (AIDPC) for NSS 75th round was held at Nagpur in September 2017. This was followed by a series of workshops at each of the individual Data Processing Centers where officials of Directorates of Economics & Statistics of various States/UTs also participated.
5.17 The ongoing NSS 75th round (July 2017-June 2018) is devoted to the subjects of i) Household Consumer Expenditure and ii) Household Social Consumption on Health and Education. The survey commenced on 1st July 2017.
5.18 The 76th Round of NSS (July-December 2018) is devoted to the subjects of (i) Disability and (ii) Drinking Water, Sanitation, Hygiene and House Condition.
State Assistance for Socio-Economic Surveys
5.19 With an objective to generate sub-state level estimates for different socio-economic parameters, states also participate in NSS surveys. As such, there is need for development of capacity at state levels also in respect of data processing. DPD provides all kind of technical guidance to the States by supplying data processing instruments (including sample list, software for data entry, validation and tabulation) which helps in processing the state sample data and pooling of central and state sample data. Thereafter, State level reports on the pooled estimate are published by the States.
58
5.20 During 2017-18, DPD organized data processing workshops on NSS 75th round for processing of central sample data. During this period DPD also organised Tabulation workshop on NSS 72nd round and Pooling Workshop on central and state sample data of NSS 69th round for the officials of Directorate of Economics and Statistics. In these workshops theoretical and hands on trainings were also imparted. Specialized need-based training for States, have been also arranged by DPD as and when requested by the State DES, depending on the availability of officers to impart the training.
National Seminar on the results of NSS 70th and 71st Rounds
5.21 NSS 70th round (January 2013-December 2013) was dedicated to the subjects on “Land & Livestock Holdings, Debt & Investment and Situation Assessment Survey of Agricultural Households” and NSS 71st round (January-June 2014) was devoted to the subject “Social Consumption: Health and Education”. National Seminar based on the results of NSS 70th round and NSS 71st round was held at Goa University, Goa during 11th-12th September 2017. During the aforesaid seminar, a total of 20 technical papers including divisional papers on the above rounds were presented.
Agricultural Statistics
5.22 NSSO has the responsibility of guiding the States in developing suitable techniques for obtaining reliable and timely estimates of area and yield as also to ensure adoption of uniform concepts, definition and procedures in the collection of crop area and yield related statistics. It keeps a constant watch on the quality of Crop Statistics through the scheme of Improvement of Crop Statistics (ICS). Under the scheme, sample check on the primary field work relating to area enumeration in approximately 5000 villages in an agriculture season and supervision of about 16000 crop cutting experiments in each agricultural year are undertaken by the Field Operations Division (FOD) of NSSO. The States are also participating in this programme of sample check on equal matching basis. The data collected through the supervision of crop cutting experiments at harvest stage are also utilized to compute 186 estimates of yield rate of specified crops under the ICS scheme.
5.23 The work relating to sample checks on area enumeration was carried out in 1270, 4939, 4639 and 3042 villages for Early Kharif, Kharif, Rabi and Summer seasons respectively during Agriculture Year 2016-17. The work for 15,662 crop cutting experiments was also supervised during Agriculture Year 2016-17.
5.24 As on 30th October 2017, sample check on area enumeration has been completed in 1017 villages during Early Kharif and 4111 villages during Kharif during Agricultural Year 2017-18. A total of 706, 3597 and 99 crop cutting

59
experiments have been completed during Early Kharif, Kharif and Summer season’s crop respectively that includes annual and perennial crops of Kerala state.
Urban Frame Survey (UFS)
5.25 Urban Frame Survey (UFS) is a regular scheme being conducted in phased manner over a period of 5 years. The objective of the survey is formation and updation of UFS blocks for providing frame for selection of first stage sampling units in urban sector to conduct various Socio-Economic surveys of NSSO.
5.26 The last phase of UFS, i.e. UFS phase 2012-17 has been completed during November 2017. During 2012-2017 phase, a total of 632057 UFS blocks in 7651 towns have been formed/updated, paper schedules filled and hand drawn maps were prepared. The UFS maps and records are supplied on demand to Government agencies free of cost and to the private institutions and research scholars on payment basis.
5.27 The next phase of UFS (2017-2020) has commenced since November 2017. During this phase, Geo-coordinates (latitudes and longitudes) of a given location, structure and associated attributes will be captured through the mobile application and embedded on satellite imagery.
Periodic Labour Force Survey (PLFS)
5.28 The nationwide Labour Force Survey, namely, Periodic Labour Force Survey (PLFS) was launched from 1st April 2017. The main objective of the PLFS is to measure quarterly changes of various indicators of the labour market in urban areas as well as to generate the annual estimates of different labour force indicators both in rural and urban areas.
5.29 A meeting with senior officers of NSSO and Dr Rajiv Mehta, Member, NSC was held on 27th April 2017 under the Chairmanship of the Secretary, MoSPI to discuss the release calendar of Periodic Labour Force Survey (PLFS) survey.
5.30 A meeting with the officers of NSSO and Computer Centre was held on 9th June 2017 at Delhi under the Chairmanship of Secretary, MoSPI to review the progress of PLFS. A meeting was held under the Chairmanship of Secretary, MoSPI on 24th August 2017 to review the latest progress of PLFS and other emergent issues.
5.31 A meeting for stabilization of PLFS templates was organized at DPD (Hq.), Kolkata on 18th September 2017 under the Chairmanship of DDG (Software Group), DPD. Further, re-visit templates of PLFS of quarter-3 are being tested with the modified structure by the members of Core Team for Stabilization of PLFS templates. Review RTCs on PLFS were conducted during 9th -13th October 2017.

60
Computer Assisted Personal Interviewing (CAPI) Solutions
5.32 NSSO has developed a Computer Assisted Personnel Interviewing (CAPI) Solution with technical assistance from the World Bank for use in data collection for surveys conducted by NSSO by using handheld IT device in place of paper schedule. The data collection for PLFS in the field is being done through CAPI Solution.
5.33 The World Bank team held different meetings at Delhi and Kolkata with the officers of Computer Centre, NSSO and NIC during their visit to India from 19th June 2017 to 23rd June 2017 to discuss the implementation of the CAPI Solution and problems.
5.34 The field experiences of two quarters of PLFS survey using CAPI Solution, up-gradation of CAPI version and other related issues, etc. were discussed with the World Bank team during 23rd October 2017 to 25th October 2017.
Price Data
5.35 Rural Retail Price Collection [RPC, 3.01(R)]: NSSO collects regular monthly rural price data for the compilation of consumer price index (CPI) for agricultural and rural laboures. Along with the price data, the daily wage rates of 25 major agricultural and non-agricultural occupations are also being collected in the Schedule 3.01(R). The Labour Bureau, Ministry of Labour and Employment compiles and publishes the CPI (AR). The base year for RPC is 1986=100. Data on daily wage rates of important agricultural operations are reported by the State Governments on monthly basis.
5.36 Data collection from 603 villages per month from 26 States/UTs is collected every month for RPC. The market survey work for Base Year updation of RPC is expected to start shortly. There would be around 700-800 villages spread throughout the country for the proposed market survey.
5.37 The RPC bulletin called the ‘Prices and Wages in Rural India’ which is published for each quarter, provides price data only at national level in respect of 260 commodities and wage data at national and state level for twenty five major states. The RPC bulletin till the quarter April-June 2017 has been published during September 2017 and the RPC bulletin for the quarter July-September 2017 has been released in December 2017.
5.38 Consumer Price Index (Urban): Consumer Price Indices (CPI) measure changes over time in general level of prices of goods and services that households acquire for the purpose of consumption. The price collection of CPI (U) started from May 2008 by Field Operations Division (FOD) on behalf of Central Statistics Office (CSO), Price Statistics Division (PSD). The base year for CPI (U) is 2012=100. Price data collection is done for 1078 quotations per

61
month from 310 towns. Collection/transmission of monthly price in the web portal of CPI (U) is being done regularly by regular staff of FOD. The market survey work for Base Year updation of CPI (U) is expected to start from January 2018.
5.39 Wholesale Price Index (WPI) (Ongoing): WPI is used as an important measure of inflation in India. Fiscal and Monetary policy changes are greatly influenced by changes in WPI. This survey is conducted by FOD on behalf of Department of Industrial Policy and Promotion (DIPP), M/o Commerce & Industries. The base year for WPI is 2011-12=100. Data collection/transmission activities for 6765 quotations on monthly basis covering 5648 manufacturing units/factories from organized sector is performed regularly by engaging contractual manpower.
5.40 International Comparison Programme (ICP) – 2017 (Ongoing):- India is participating in the current phase of International Comparison Programme (ICP) with reference year 2017. It is a global statistical initiative under the guidance of the United Nations Statistical Commission (UNSC) which supports inter-country comparisons of Gross Domestic Product (GDP) and its components using Purchasing Power Parity (PPP). Apart from PPP, ICP survey is also used to generate PLI (Price Level Index), which is used to reflect the price level across the country. This survey is conducted by FOD on behalf of Price Statistics Division (PSD) of Central Statistics Office (CSO). The survey would continue up to 31st March 2018.
5.41 Data collection from 577 urban markets comprising of 163 Affluent markets, 314 middle market and 100 poor markets has already commenced from 01st July 2017 along with backlog data from the month of April 2017 to June 2017. The prices of 907 items pertaining to different groups viz. Food, Clothing and Footwear, Fruits, Vegetables, Meat and Fish, Medicines, Postal charges, Railway fares and other consumption items are required to be collected at different frequencies viz, monthly, quarterly and twice in a year for some specific items. The field work of ICP 2017 (Rural) would also commence shortly.
Plan Scheme
5.42 The NSSO is responsible for implementing one of the sub components of Ministry’s Plan Scheme ‘Capacity Development’, namely, ‘Strengthening of Survey Capabilities of NSSO’. Under this component, a total sum of ` 597.35 lakhs as Grant-in Aid has been released to the North Eastern States of Arunachal Pradesh, Mizoram, Manipur, Tripura and Sikkim as first installment for undertaking NSS surveys during the year 2017-18.
5.43 Under ‘Strengthening of Data Processing Capabilities of NSSO’, apart from building of infrastructure, technology up-gradation and human resources

62
development, two Plan Centres, namely, the DP Centre Bangalore and DP Centre, Ahmadabad were established during the 10th Plan. These two DP Centres have contributed significantly in achieving timeliness of data processing and release of results, and their continuation during 12th five year plan enabled NSSO to achieve the target of release of its results within one year of conduct of survey.
5.44 Purchase of land/construction of accommodation for field offices: The infrastructure in the field offices of the FOD was further developed and strengthened. Construction of SRO, Mysore and RO, Hubli has been completed during the reporting year. Further, the proposal for purchase for construction of office building of RO, Jalandhar is under process.
5.45 Strengthening of Training facilities: NSSO organizes regular in-service training for its staff through its Zonal Training Centres (ZTCs) and AS Wing, Faridabad. During 2017-18 (April-November 2017), 583 Officers/Officials were trained on various technical schemes like Socio-Economic Survey, ASI/ ASI Web Portal, Agriculture Statistics, UFS, etc., besides training on general administrative matters and Right to Information Act.
5.46 Publicity of NSSO: The following measures have been taken up in 2017-18 for creating a brand name for NSSO and for increasing co-operation from respondents with a view to improving the quality of data:
• Appeal seeking co-operation of people in the data collection work has been released in the National and Regional newspapers.
• Telecast of video spot on Lok Sabha TV is going on.
Sarvekshana
5.47 Effective secretarial assistance was rendered to the Editorial Advisory Board of ‘Sarvekshana’, an in-house technical journal of NSSO to finalise the content of its different issues. The meeting of the Editorial Advisory Board (EAB) of ‘Sarvekshna’ a technical journal of NSSO was held on 15th September 2017 under the Chairmanship of Prof. U. Sankar to finalize the manuscript of 103rd issue of the “Sarvekshna”.
5.48 The 102nd issue of ‘Sarvekshana’ was published and also uploaded on the website of the Ministry during March 2017 and the 103rd issue of ‘Sarvekshana’ has been uploaded on the website of the Ministry during September 2017.
Use of Modern Technology/New Initiatives
5.49 The ensuing 76th Round NSS will cover the subjects “Disability, Drinking Water, Sanitation, Hygiene & Housing Conditions”. The survey will start in July 2018 and end in December 2018. In this Round, while the data collection in

63
the field will be done with usual paper schedules, data entry will be done in the field office itself using in-house developed MS Access based e-schedule. Field offices would e-mail the data files to the Data Processing Division for further processing. This will help enhance quality of data by way of validation checks introduced in the e-schedule and obviate the need for data entry by Data Processing Centres thereby reducing the time lag in the release of reports.
5.50 Moving a step further, complete digitization of Socio-Economic Survey is envisaged from the 77th Round NSS, starting from 1st January 2019. This will entail digitization of paper schedules into digital schedules. Data in the field will be captured directly in digital mode using tablets. While improving the quality of field data, it will further reduce the time lag in the release of reports.
5.51 The next phase of UFS (2017-2020) has commenced since November 2017. This Phase of UFS has been digitized. Different UFS operations will be carried out using mobile/web applications developed in collaboration with National Remote Sensing Centre (NRSC), Hyderabad. Boundaries of blocks/wards/Investigator units/towns will be drawn on satellite imagery obtained from ‘Bhuvan’ portal using Quantum Geographic Information System (QGIS) software. Geo-coordinates (latitudes and longitudes) of a given location, structure and associated attributes will be captured through the mobile application and embedded on satellite imagery. The maps drawn in this way alongwith associated attributes will be saved on Bhuvan portal for its ultimate use as sampling frame for conducting of Socio-Economic surveys.
5.52 DPD has developed Quarter 1, 2 & 3 templates of Schedule 0.0PL & 10.4 using CAPI designer and FOD collected the data using tablets in the field. DPD is developing the data processing software and helping PLFS Centre to conduct the survey and process the data.

64
CHAPTER – VI
STATISTICAL SERVICESIndian Statistical Service6.1 The Indian Statistical Service (ISS) was constituted on 1st November 1961 as a cadre of qualified professionals with core discipline of Statistics to control, coordinate, monitor and steer the diversified statistical system to render the crucial statistical needs of planning, policy formulation and decision making by the Government and to consolidate and disseminate these statistics at National and International level.
6.2 The posts of ISS at various Grades are distributed among various Ministries, Departments and Organisations with the aim to have an appropriate statistical set-up in the Ministries/Departments to provide a real time objective data and to analyze it for: (a) policy formulation, implementation and monitoring (including concurrent monitoring and evaluation and outcome/endline assessment) and (b) decision making.
6.3 Ministry of Statistics & Programme Implementation acts as the Cadre Controlling Authority of Indian Statistical Service. The Ministry is concerned with all matters pertaining to the service including recruitment, promotion, training, career and manpower planning, etc. However, day-to-day administrative matters of ISS officers are looked after by the Ministries/Departments in which the officers are posted.
6.4 Recruitment to the service is made through Indian Statistical Service Examination conducted by UPSC annually, promotion from the feeder grade i.e. Subordinate Statistical Service (SSS) and through absorption of Statistical Officers working in other Ministries/Departments. The service has grown over the years in terms of relevancy and number of posts. The allocation of posts in various grades, at the time of initial constitution and at present is given in Table - 1.
Table - 1
Grade Sanctioned Strength
As on 01.04.2017In-
positionVacancy
Higher Administrative Grade plus (HAG+) 05 ----- 05
Higher Administrative Grade (HAG) 18 15 03
Senior Administrative Grade (SAG) 136 115 21
Junior Administrative Grade (JAG) & NFSG 176 # 121 55
Senior Time Scale (STS) 179 172 07
Junior Time Scale (JTS) 300* 226 74
Total 814 649 165# Out of these, 30% of senior duty posts are operated in NFSG
* Including 50 posts of leave, deputation and training reserve.
65
6.5 The first examination for direct recruitment to the service was held in the year 1967 and the first batch of the service was appointed in the year 1968. Till date, 39 batches of direct recruits have joined the service. The latest batch of 27 officers has already joined in the month of December 2017.
6.6 The ISS Rules, 2016 provide for 50 per cent of the posts in JTS to be filled up by direct recruitment and 50 per cent by promotion from Subordinate Statistical Service (SSS) cadre. There is no direct recruitment at any level except in JTS of the service. All the vacancies in other grades are filled up by promotion.
Subordinate Statistical Service (SSS)
6.7 The Subordinate Statistical Service (SSS) was constituted on 12th February 2002 as a cadre of qualified personnel with core discipline of Statistics to assist in building crucial statistical database covering various aspects of Indian Economy for planning, policy formulation and to facilitate decision making by the Government.
6.8 The Subordinate Statistical Service (SSS) is a Group-B Central Civil Service of statistical function posts which constitutes feeder cadre for Indian Statistical Service (ISS). It comprises Senior Statistical Officer (SSO) (Group-B Gazetted) having Grade Pay of ̀ 4600 and Junior Statistical Officer (JSO) having Grade Pay of ̀ 4200 in the Pay Band-2: ̀ 9300-34800 of the Sixth Central Pay Commission (6 CPC). As per 7th CPC, the Pay Scale of Senior Statistical Officer correspond to Level-7 and that of Junior Statistical Officer to Level-6 in the Pay Matrix. The officers of the SSS cadre are posted in various Ministries/Departments/Organizations of the Government of India across the country.
6.9 This Ministry is the Cadre Controlling Authority of Subordinate Statistical Service. The Ministry is concerned with all matters pertaining to the service including recruitment, promotion, training, career and manpower planning, etc. However, day-to-day administrative matters of SSS officers are taken care of by the respective Ministries/Departments/Organisations in which these officers are posted.
6.10 The SSS Rules, 2013 provide for 90 per cent of the posts of Junior Statistical Officer to be filled up by direct recruitment through open competitive examination viz. Combined Graduate Level Examination (CGLE) conducted by the Staff Selection Commission while 10 per cent by promotion from the feeder post holders. There is no direct recruitment at the level of SSO of the service.
6.11 The sanctioned strength and number of incumbents in position as on 1ST December 2017 are, as follows:

66
Sl. No. Name of the Post Sanctioned Strength In Position
1. Senior Statistical Officer 1781 1629
2. Junior Statistical Officer 2172 1402
Total Strength 3953 3031
6.12 The following are the important areas of activities in the Year of 2017.
• Induction Training Program (ITP) for newly recruited JSOs of SSS Cadre has been conducted through NSSTA, Greater Noida, whereby 245 candidates have been trained by the end of November, 2017. To address the issue of mismatch between language known and language required for statistical surveys in the field, this Ministry has incorporated a course on language of the allocated states to newly recruited JSOs in Induction Training at National Statistical System Training Academy (NSSTA), Greater Noida.
• Process for online reporting of APAR for SSS officers on Smart Performance Appraisal Report Recording Online Window (SPARROW) has been implemented and is operational. Around 3000 officers of SSS cadre has been registered on SPARROW portal for filing APAR online. Out of total 3000 registered officers, around 1700 APAR have been generated online for the year 2016-17.
• The Modified Assured Career Progression (MACP)/Assured Career Progression (ACP) scheme has been implemented in the SSS cadre in accordance with DOPT guidelines and is being monitored regularly. During the year, around 250 officers of SSS have been granted 1st, 2nd and 3rd MACP in the corresponding Level 7,8,9 and 11.
• On Successful completion of probation period, services of 241 Junior Statistical Officers have been confirmed on 9th June 2017.

67
CHAPTER – VII
INDIAN STATISTICAL INSTITUTE7.1 In the early thirties, realizing the necessity for advancement of theoretical and applied statistics in India, the Indian Statistical Institute came into being following the pioneering initiative and efforts of Professor P.C. Mahalanobis. The Indian Statistical Institute was registered on 28th April 1932 as a non-profit learned society under the West Bengal Societies Registration Act, 1860. From the beginning, the Institute started showing its excellence in its own way. As the Institute expanded its research, teaching, training and project activities, it started earning national/international recognitions. The outstanding contributions made by the Institute in theoretical and applied statistical work culminated in the recognition of the Institute as an “Institute of National Importance” by an Act of the Parliament, known as “Indian Statistical Institute Act No. 57 of 1959”, which conferred on the Institute the right to hold examinations and award degrees/diplomas in Statistics. Significantly, Pandit Jawaharlal Nehru, the then Prime Minister of India, himself piloted the bill in the Parliament in 1959. As a result, degree courses leading to Bachelor of Statistics (B. Stat.) and Master of Statistics (M. Stat.) and Post Graduate Diplomas in Statistical Quality Control & Operations Research (SQC & OR) and Computer Science were started from June 1960. The Institute was also empowered to award the Ph.D. / D.Sc. Degree from the same year.
7.2 Subsequently, Master of Technology (M. Tech) courses in Computer Science (CS) and in Quality, Reliability & Operations Research (QROR) were also introduced. Scope was further enlarged as the Institute was empowered to award degrees/diplomas not only in Statistics but also in Mathematics, Quantitative Economics, Computer Science and such other subjects related to Statistics by virtue of “Indian Statistical Institute (Amendment) Act, 1995, No. 38 of 1995” by the Parliament, which gave greater encouragement to research activities not only in Statistics/Mathematics but also in various branches of Computer and Communication Sciences, Natural and Social Sciences, Physics and Earth Sciences, Biological Sciences, Statistical Quality Control & Operations Research, Library and Information Sciences in a broader way. Over the years, the Institute has been playing a key role in the development of statistical theory and methods by promoting research and practical applications in different areas of natural and social sciences.
7.3 “Sankhya – The Indian Journal of Statistics”, being published by the Institute since 1933, is still considered as one of the leading statistical journals of the world. Pioneering research activities were carried out in many areas of statistical theory, especially in the core areas of multivariate analysis, sample surveys and design of experiments. Such activities were strengthened and new directions were opened up by Professor C.R. Rao and many others who joined the Institute in nineteen forties and the tradition continues. Research in economics was greatly stimulated when the then Prime Minister of India, Pandit Jawaharlal Nehru entrusted the preparation of the draft Second Five-

68
Year-Plan of the country to Professor Mahalanobis and the Institute in the year 1954. The “Draft” submitted by the Institute under the leadership of Professor Mahalanobis with the planning models have since been regarded as major contributions to economic planning in India.
7.4 In the field of Computer Science, the Institute has a rich tradition. In 1953, a small analog computer was designed and built in the Institute. In 1956, the Institute acquired a HEC-2M machine from the U.K., which was the first digital computer in India. In early sixties, the Institute, in collaboration with the Jadavpur University, undertook the design, development and fabrication of a fully transistorized digital computer, called ISIJU-1, which was commissioned in 1966 by Shri M.C. Chagla, the then Minister of Education, Government of India. High quality research, publication and development in the different branches of computer sciences had been carried out by the internationally acclaimed computer scientists of the Institute over the last six decades and their concerted efforts have placed the Institute in the forefront in national and international scenario.
7.5 The ISI also played a pioneering role in starting the Statistical Quality Control (SQC) movement in India by organizing a visit of Professor W.A. Shewhart, the father of SQC, to India in November 1947 and later by inviting other experts like Dr W.E. Deming, Dr Ellis R. Ott, Dr H.C. Tippet and Genichi Taguchi for the same purpose. SQC promotional work of the Institute then gradually spread all over the industrial centres in India under a comprehensive programme covering education and training, applied research and consultancy services. The Institute also became a permanent member of “Quality Council” of India.
7.6 From the early days, the Institute has been interacting with many internationally reputed scientists in different disciplines from the world over. Some of these scientists have worked in the Institute for several months or even longer. Sir Ronald A. Fisher, a pioneer of modern statistics, was a regular visitor and lent considerable support to the Institute. Professor J.B.S. Haldane, a genecist of international repute, was a member of the faculty for several years beginning from 1957. The celebrated mathematician, Norbert Wiener visited the Institute twice in 1954 and again in 1955-56. The other academic personalities whose longer visits influenced the development of the Institute include the Statisticians like Harold Hotelling, Frank Yates, Herman Wold, Edwin Harper (Jr.) and H. Cramer; the Mathematicians like A.N. Kolmogorov, Yu, V. Linnik, J.L. Doob and there after Vaughan F.R. Jones; Statistical Quality Control experts like Walter Shewhart and G. Taguchi; Economists like Simon Kuznets, Paul A. Baran, Joan Robinson, Jan Tinbergen, Nicholas Kaldor, R.M. Goodwin, David and Ruth Glass and J.K. Galbraith and more recently Amartya K. Sen, Robert Aumann, Lotfi A. Zadeh, Joseph E. Stieglitz, James A. Mirrlees, Eric Stark Maskin, Ei-ichi Negishi, Ada Yonath; Geologist like Pamela Robinson; Biochemists like N.W. Pirie and Linguists like D. Kostic. All along the Institute has tried to live up to Ronald Fisher’s dictum that Statistics is a “Key Technology” in view of its intimate relevance to all scientific endeavours, which involve experimentation, measurement and inference from sample to aggregate.

69
Teaching and Training Division7.7 During the academic session 2017-2018, a total of 23,975 candidates applied for admission and were called for written selection tests for various programmes offered by the Institute, viz., B. Stat. (Hons.), B. Math. (Hons.), M. Stat., M. Math., Master of Science (M.S.) in Quantitative Economics, Master of Science (M.S.) in Quality Management Science, Master of Science (M.S.) in Library and Information Science, M. Tech. in Computer Science, M. Tech. in Quality, Reliability and Operations Research, Post Graduate Diploma in Statistical Methods and Analytics, Post Graduate Diploma in Computer Applications, Post Graduate Diploma in Business Analytics, Research Fellowships in Statistics, Mathematics, Quantitative Economics, Computer Science, Quality, Reliability and Operations Research, Physics, Agricultural Chemistry and Soil Science, Geology, Library and Information Science, Linguistics, Sociology and Psychology. Admission tests were conducted at 49 different centres. A total of 16,071 candidates finally appeared for admission tests and a total of 1440 candidates qualified in the written tests and were called for interviews. Based on performance in the written tests, interview and the academic records, 397 candidates were offered admission to various courses during the academic session. The annual examinations for all the regular courses during 2016-2017 academic session were held during May 2017. The 2017-18 academic session commenced from July 2017. Fifty-second Annual Convocation of the Institute is to be held in 2018.
7.8 Till 23rd November 2017, 124 trainees in Mathematics, Statistics, Engineering and Technology from various Universities/Institutions received four weeks/six weeks/two months/three months/four months and six months Project Trainings in different Units of the Institute, viz., Advanced Computing and Micro Electronics Unit (ACMU), Agricultural and Ecological Research Unit (AERU), Computer Vision Pattern Recognition Unit (CVPRU), Geological Study Unit (GSU), Human Genetics Unit (HGU), Machine Intelligence Unit (MIU), Physics and Applied Mathematics Unit (PAMU), Statistics and Mathematics Unit (SMU) and Statistical Quality Control & Operations Research (SQC & OR) Unit under the guidance of different faculty members of the Institute.
International Statistical Education Centre (ISEC)7.9 The International Statistical Education Centre (ISEC) was founded in 1950 at the initiative of Professor P.C. Mahalanobis. The Centre opened at Kolkata through an agreement between the International Statistical Institute and the Indian Statistical Institute (ISI). At present, the Centre is run by the Indian Statistical Institute under the auspices of the Government of India. The Centre functions under a joint Board of Director In its history of more than 60 years, Prof. P.C. Mahalanobis was the Chairman of the Board of Directors since the inception of the Centre in 1950 until his death in 1972. Subsequently, Professor C.R. Rao had been the Chairman of the Board till 2015. Currently, Prof. S. P. Mukherjee is the Chairman of the Board. The Centre aims to provide training in theoretical and applied statistics at various levels to selected participants from

70
countries of the Middle East, the South and the South-East Asia, the Far-East and the Commonwealth countries of Africa. The primary training programme is a 10-month regular course in Statistics leading to a Statistical Training Diploma. In addition, special courses on different topics of varying duration are also organized. The commencement date of the 71st Term of the ISEC Regular Course (2017-2018) was 1st August 2017. This year 25 trainees from 11 different countries, namely Bhutan, Cambodia, Sri Lanka, Fiji, Mongolia, Myanmar Niger, Nepal, South Africa, South Sudan, Tanzania attended. Nineteen trainees were supported by fellowships under the ITEC/SCAAP programme of the Government of India, while three trainees were supported by fellowships of the Central Bank of Sri Lanka, and three (3) trainees are supported by fellowships of the TCS Colombo Plan. They will be awarded the Statistical Training Diploma in the Convocation, tentatively scheduled on 31st May 2018. Till now, more than 1653 trainees from about 84 countries have received the Statistical Training Diploma from ISEC.
Research Work7.10 The research activities of the Institute were grouped in the following Divisions:
Theoretical Statistics and Mathematics; Applied Statistics; Computer and Communication Sciences; Physics and Earth Sciences; Biological Sciences; Social Sciences; Statistical Quality Control & Operations Research; and Library, Documentation & Information Sciences.
There are three centres i.e. Computer & Statistical Services Centre, Soft Computing Research: A National Facility and R.C. Bose Centre for Cryptology and Security. The Computer & Statistical Services Centre has the responsibilities of the management of in-house computer system of the Institute and providing computing and statistical services to scientific workers. The “Centre for Soft Computing Research: A National Facility” is functioning as an associated body of the Institute. R.C. Bose Centre for Cryptology and Security provides facility for training and research activities on Cryptology and Data Security to the nation.
Externally Funded Projects 7.11 Apart from theoretical and experimental plan research, the Institute also undertook a variety of about 137 externally funded projects from different Government and non-Government organizations.
Seminars, Workshops, Conferences, Symposia etc. organized during 2017-18 (up to 31st December 2017)7.12 During the year, the Institute organized several seminars, workshops, conferences, symposia with the participation of leading academicians/scientists from India and abroad. A few of them are highlighted below:
• One-Day Workshop on “Satellite Remote Sensing and Image Analysis Activities at the Bangalore Section IEEE GRSS Chapter”, SSIU, Bangalore, 12th June 2017.

71
• Seminar on “0”, Economics Analysis Unit, Bangalore, 27th June 2017.
• Workshop on “Introduction to Algorithms and Optimization”, Advanced Computing and Microelectronics Unit, Kolkata, 4th -12th July 2017.
• Seminar on “Globalization and the Tribes of India: Issues of Tradition and Transition”, Sociological Research Unit, 5th July 2017.
• Seminar on “Analytic New Vector Theory over Archimedean Local Fields”, Stat-Math Unit, Kolkata, 20th July 2017.
• Workshop on “Introduction to Discriminant Function Analysis”, Psychology Research Unit, Kolkata, 4th -8th August 2017.
• Training Programme on “Summer School on use and application of SPSS”, Biological Anthropology Unit, Kolkata, 22nd -25th August 2017.
• North-East Autumn School on “Human Genetics”, Human Genetics Unit, Kolkata, 5th -6th September 2017.
• Conference on “Population and Development in Eastern and North-Eastern Regions of India”, Population Studies Unit, Kolkata, 14th -15th September 2017.
• IEEE CIS Summer School on “Recent Advances in Computational Intelligence (RACI 2017)”, Machine Intelligence Unit, Kolkata, 18th -22nd September 2017.
• On System of National Accounts in the Training Programme on “Economic Statistics, Sampling, and Inequality and Poverty Measures”, Sociological Research Unit, Kolkata, for Government Officials of North-East States, 9th -13th October 2017.
• Seminar on “An Evolutionary Analysis of Growth and Fluctuations with Negative Externalities”, Economics Research Unit, Kolkata, 16th October 2017.
• Half day workshop “Knowledge Management and the Role of Libraries”, Library, ISI North-East Centre, Tezpur, 31st October 2017.
• International Conferences on “Condensed Matter Physics”, Physics and Applied Mathematics Unit, Kolkata, 14th -16th November 2017.
• Workshop on “Reliability Theory and Survival Analysis”, Applied Statistics Unit, Kolkata, 20th -22nd November 2017.
• 13th Annual Conference on “Economic Growth and Development”, Economics and Planning Unit, Delhi, will be held on 18th -20th December 2017.
• Workshop NCM “Connections across disciplines in Mathematics”, Stat-Math Unit, Delhi, 18th -23rd December 2017.
Publication7.13 The internationally renowned journal Sankhyā, an official publication of the Indian Statistical Institute, was founded by Professor P.C. Mahalanobis in 1932 and began publication under his editorship. It is devoted to original

72
research articles in Probability, Mathematical Statistics and Applied Statistics. Reviews and discussion articles on current research activity in the above areas are also published. A rigorous peer review process is followed for all articles submitted to Sankhyā for publication. Many seminal articles in Probability, Theoretical Statistics and Applied Statistics have appeared in Sankhyā. The journal is published in two separate series – Series A and Series B. Series A with two issues per year, one in February and the other in August, covers Probability and Theoretical Statistics, while Series B with two issues per year, one in May and the other in November, covers Applied and Interdisciplinary Statistics.
Scientific Papers and Publication7.14 During the year, about six hundred scientific papers were published in different national and international journals.
Scientific Assignments Abroad7.15 Eighty-eight scientists of the Institute visited a number of foreign countries either on invitation or under cultural exchange programme to attend international seminars and conferences. Most of them presented scientific papers and delivered lectures in those seminars and conferences. Countries visited by ISI faculty members were Australia, Bangladesh, Brazil, Chile, Canada, China, Czech Republic, Estonia, Ethiopia, Finland, France, Germany, Greece, Hungary, Hong Kong, Italy, Israel, Japan, Malaysia, Mexico, Morocco, Myanmar, Nepal, New Zealand, The Netherland, Oman, Poland, Russia, Romania, Sri Lanka, Singapore, South Korea, Slovenia, South Africa, Switzerland, Sweden, Spain, Thailand, Tunisia, Taiwan, UAE, UK, USA and Vietnam.
Visiting Scientists7.16 Two hundred and ten scientists from Australia, Brazil, China, Canada, France, Italy, Israel, Istanbul, Japan, Malaysia, The Netherlands, New Zealand, Oman, Spain, South Africa, Singapore, Slovenia, Turkey, UAE, UK, USA and also from India visited the Institute to attend various Workshops, Conferences, Seminars etc. and also to participate in collaborative research, teaching and other scientific activities of the Institute.
Recognition to ISI Scientists7.17 In appreciation and recognition to the high standard of research and scientific excellence maintained by the researchers of the Institute, several faculty members received laurels in the forms of awards, fellowship from organizations of national and international importance like International Association of Pattern Recognition (IAPR), The World Academy of Sciences (TWAS), International Rough Set Society (IRSS), etc. Several faculty members served as visiting scientist, honorary professor, visiting professor, in various universities in US and Europe; Indian Council of Social Sciences Research (ICSSR); Indian National Science Academy etc. Besides, many faculty members were invited by national and international Institutes/bodies to act as chairman, members, chief editor, editor in their several committees/editorial boards. Among those, some of the most notable recognitions earned by the faculty
73
members are indicated below: -
• Prof. Ritabrata Munshi awarded Infosys Prize for Mathematical Sciences in 2017.
• Dr Neena Gupta awarded BM Birla Science Prize for Mathematics in 2017.
• Prof. Arup Bose awarded J.C. Bose Fellowship for 2014-2018.
• Dr D. Yogeshwaran awarded INSA Young Scientist Award from Indian National Science Academy.
• Dr Darpa Saurav Jyethi awarded JESSE Young Investigator Meeting Award from International Society of Exposure Science in 2017.
• Prof. Bhargab B. Bhattacharya awarded Indian National Academy of Engineering Chair Professorship from Indian National Academy of Engineering for Professional Achievements in 2017.
• Prof. Sanghamitra Bandyopadhyay, Director of the Institute awarded Distinguished Alumnus Award from IIT Kharagpur, West Bengal for achieving expertise in respective domains and reaching to the pinnacle of excellence and Infosys Prize for Engineering and Computer Science in 2017.
• Prof. Probal Dasgupta selected Chair, Public Session of Akademio de Esperanto at 102nd World Congress of Esperanto in 2017.
• Dr Niladri Sekhar Dash selected Linguistic Expert of Consolidation of Report at Office of the Registrar General-India, Language Division, Ministry of Home Affairs, Government of India in 2017.
• Dr Sandip Mitra selected Visiting Fellow of Manchester University, UK in 2017.
• Dr Hari Charan Behera selected Fellow of Royal Asiatic Society, London in 2017.
• Dr Molly Chattopadhyay awarded (jointly) Dr Srinivasan Award from Indian Association for the Study of Population in 2017.
• Prof. V.K. Ramachandran selected Vice Chairman of Kerala State Planning Board in 2017.
• Prof. Arup K Das selected Reviewer of Mathematical Reviews/MathSciNet.
• Prof. Sankar Kumar Pal selected IEEE Tencent Rhino-Bird International Academic Expert from IEEE, USA for 2017-18.
• Prof. Arunava Sen selected for the TWAS-Siwei Cheng Prize in Economic Sciences in 2017.

74
CHAPTER – VIII
TWENTY POINT PROGRAMME8.1 The Twenty Point Programme (TPP) initiated in the year 1975 was restructured in the years 1982, 1986 and 2006. The thrust of the programme restructured in 2006 is to eradicate poverty and improve the quality of life of the poor and the under-privileged people all over the country. The Programme covers various socio-economic aspects like poverty, employment, education, housing, agriculture, drinking water, afforestation and environment protection, energy to rural areas, welfare of weaker sections of the society, etc. The structured Programme is called Twenty Point Programme (TPP)–2006 and its monitoring mechanism became operational with effect from 1stApril 2007.
8.2 TPP-2006 has now completed more than ten years of its operationalisation. TPP – 2006 originally contained 20 points and 66 items monitored individually by different Central Nodal Ministries/Departments concerned. One of the 66 items viz. “Sampoorna Grameen Rojgar Yojana (SGRY)” has since been subsumed into another item namely “National Rural Employment Guarantee Act” with effect from 1stApril 2008 and has been renamed as Mahatma Gandhi National Rural Employment Generation Act w.e.f.31stDecember 2009. Out of the remaining 65 items, 19 items are now being monitored on quarterly basis.
Monitoring Mechanism
8.3 The primary responsibility of implementation and monitoring of the programme lies with the agencies entrusted with the execution of the programme, which in this case are the State Governments/UTs Administrations and the Central Nodal Ministries. The Ministry of Statistics and Programme Implementation monitors the programmes/schemes covered under TPP-2006 on the basis of performance reports received from State/UT Governments and Central Nodal Ministries. The Ministry has developed a web based Management Information System to expeditiously collect information from the State Governments and the Central Nodal Ministries.
Monitoring Committees
8.4 The monitoring mechanism for TPP–2006 has now been widened by including Block level monitoring in addition to the existing Central, State and District level monitoring. Monitoring Committees at State, District and Block Level, for monitoring the progress of implementation of all schemes/items covered under the Twenty Point Programme - 2006, have been constituted by most of the States/UTs as per the provisions of TPP-2006 Guidelines.

75
The Management Information System for TPP-2006 consists of the following:
8.5 Quarterly Progress Report (QPR) with information on 19 items is prepared by this Ministry. The QPR provides information on the Annual Physical Targets, Cumulative Targets and Achievements for the period under report. Coverage is based on the data furnished by the State Governments/UT Administrations on their performance for 15 items and by the Central Nodal Ministries in respect of 4 items. A detailed analysis is made in the QPR to assess the relative performance of quarterly monitored items/parameters against the set targets. The QPR is sent to different users and to State/UT Governments and Nodal Ministries concerned for taking appropriate measures in the areas of concern.
8.6 The Annual Report on TPP - 2006 covers information on all the items (except the items which are not yet operational) under the programme. The information on these items is provided by the respective Central Nodal Ministries and State/UT Governments. The Annual Report for 2015-16 has been released and Annual Report for 2016-17 is under preparation.
Monitoring and Impact Assessment of Twenty Point Programme-2006
8.7 The Ministry is mandated to undertake Monitoring and Impact Assessment Studies on selected programmes/schemes covered under TPP-2006. The Ministry has so far undertaken two Impact Assessment Studies. First relates to impact of MGNREGA in 3 selected districts of North Eastern States and the second on Rehabilitation of Disabled Persons under Deendayal Disability Rehabilitation Scheme (DDRS) in the States of Delhi, Karnataka, Madhya Pradesh and West Bengal. The concerned Nodal Ministries have been apprised of the findings of these studies. The Ministry has also undertaken the task of critically examining the reports of evaluations undertaken by the Central Nodal Ministries of the schemes implemented by them.
National Review Meeting of Twenty Point Programme-2006
8.8 This Ministry has been organising National Review Meeting of TPP – 2006 on annual basis as part of its monitoring mechanism and also to have consultations with States/UT’s and Central Nodal Ministries, in order to improve the implementation of schemes/programmes covered under TPP by State/UT Governments, especially the schemes/programmes where the performance of States/UTs has been rather poor. So far, four annual review meetings have been held by this Ministry. The last meeting held on 18th March 2014 considered the status of action taken/ compliance of the earlier review meetings. Thereafter, a decision has been taken by the Ministry to keep National Review Meeting of TPP in abeyance.
Performance of quarterly monitored items under TPP-2006 during 2016-17
8.9 Based on the data received from the Central Nodal Ministries and State

76
Governments/UT Administrations, an analysis of the overall performance of quarterly monitored items for the year 2016-17 is given in the following paragraphs and in Annexure V. During 2016-17, 19 items were monitored on quarterly basis, out of which 13 items consisting of 21 parameters were monitored against targets fixed by concerned Nodal Ministries.
8.10 The analysis for the period April 2016 – March 2017 shows that the performance under sixteen items/parameters has been ‘Very Good’ (90% or above the targets).These items/parameters are:
(i) Seedlings planted ( Public and Forest Lands)
(ii) Area Covered under Plantation ( Public and Forest Lands)
(iii) SC families assisted - under Special Central Assistance (SCA) to Scheduled Caste Sub Plan (SCSP) & National Scheduled Caste Finance and Development Corporation (NSFDC)
(iv) Pumps sets energized
(v) Number of Self Help Groups (SHGs) promoted (new and revived) during the financial year – National Rural Liveihood Mission (NRLM)
(vi) Number of SHGs provided Community Investment Fund (CIF) during the financial year - NRLM
(vii) Food security-Targeted Public Distribution system [only Antyodaya Anna Yojana (AAY)]
(viii) Food Security - Targeted Public Distribution System [only Below Poverty Line (BPL)]
(ix) Integrated Child Development Service (ICDS) Blocks Operational (Cum.)
(x) Supply of Electricity
(xi) Road constructed- Pradhan Mantri Gram Sadak Yojna (PMGSY)
(xii) Anganwadis Functional (Cum.)
(xiii) Food Security: National Food Security Act(Tide Over)-NFSA
(xiv) Number of SHGs provided Revolving Fund (RF) during the financial year - NRLM
(xv) Food security-Targeted Public Distribution system (APL+BPL+AAY)
(xvi) Food Security: National Food Security Act(Normal)-NFSA

77
8.11 There is one item/parameter in the category of ‘Good’ (80% or above but less than 90%).
(i) Partially Covered Habitations – National Rural Drinking Water Programme (NRDWP)
8.12 The performance of four items/parameters has been ‘Poor’ (below 80% of target). These items/parameters are:
(i) Rural Housing – Pradhan Mantri Awaas Yojana-Grameen (PMAY-G)
(ii) Houses constructed – Economically Weaker Sections (EWS)/ Low Income Group (LIG)
(iii) Villages electrified – Deendayal Upadhyaya Gram Joyti Yojana (DDUGJY)
(iv) Coverage of quality affected habitations - NRDWP
Specific Achievements under Quarterly Monitored Items/Parameters
Mahatma Gandhi National Rural Employment Guarantee Scheme (MGNREGS)
8.13 Providing gainful employment is the most important method of eradicating poverty in the country. Many employment generation programmes are being implemented in the rural areas. The National Rural Employment Guarantee Scheme (NREGS), now renamed as Mahatma Gandhi National Rural Employment Guarantee Scheme came into existence for the enhancement of livelihood security of the households in the rural areas of the country by providing at least one hundred days of guaranteed wage employment in every financial year to every household whose adult members volunteer to do unskilled manual work. During 2016-17, 95.61 lakh job cards were issued, 210 crore man days of employment was generated and ` 39,506 crore were paid as wages under the Scheme.
National Rural Livelihood Mission (NRLM)
8.14 From 2014-15 NRLM has replaced the scheme of Swarnajayanti Grameen Swarozgar Yojana (SGSY). NRLM is monitored under three parameters (i) Number of SHGs promoted (New and Revived) (ii) Number of SHGs provided Revolving Fund and (iii) Number of SHGs provided Community Investment Fund. During the period 2016-17, 5.07 lakh SHGs were promoted as against target of 4.26 lakh which is 119 % of the target and 2.27 lakh SHGs were provided Revolving Fund as against a target of 2.35 lakh which is 96 % of the target. The target for Number of SHGs provided Community Investment Fund (CIF) was 1.26 lakh and against it, 1.49 lakh SHGs were provided Community Investment Fund which is 119% of the target.
Distribution of waste land to landless
8.15 Agrarian reforms have been a core issue for rural reconstruction as a means of ensuring social justice to actual tillers and the landless rural poor.

78
Increasing the access of landless rural poor to land is considered an important component of the effort aimed at poverty alleviation. The main objective of land reforms has been the re-ordering of agrarian relations in order to achieve an egalitarian social structure, elimination of exploitation in land relations, realizing the age old goal of land to the tiller, enlarging the land base of the rural poor, increasing agricultural productivity and infusing an element of equality in local institutions. During the year 2016-17, 37961 hectares of wasteland was developed and distributed among the landless.
Minimum Wages Enforcement (including Farm Labour)
8.16 In a labour surplus economy like India, fixation and enforcement of minimum wages can save labourers, particularly unorganised rural labourers, from exploitation. The Minimum Wages Act, 1948 empowers both the Central and the State Governments to fix, review, revise and enforce minimum wages in scheduled employments falling under their respective jurisdictions. The establishments violating the Minimum Wages Act, 1948 are prosecuted with fine or imprisonment or both. During the year 2016-17, 1,05,546 inspections were carried out by the officials of Central and State Governments and 4344 irregularities were detected. The number of prosecution cases pending, filed and decided during the year 2016-17 were 8897, 1046 and 616 respectively.
Food Security
Targeted Public Distribution System (TPDS)
8.17 Under the Targeted Public Distribution System (TPDS) each poor family is entitled for essential commodities at subsidised prices. The emphasis is on inclusion of only the really poor and vulnerable sections of society such as landless agricultural labourers, marginal farmers, artisans/craftsmen (potters, tappers, weavers, blacksmiths, carpenters, etc.) in the rural areas and slum dwellers and daily wagers in the informal sector (porters, rickshaw pullers and hand cart pullers, fruit and flower sellers on the pavements, etc.) in the urban areas. During the year 2016-17, the target was to allocate 543.32 lakh tonnes of food grains to States. However, the off-take by States against this allocation was 521.02 lakh tonnes of food grains which was 96% of the allocation.
Targeted Public Distribution System (TPDS) for Antyodaya Anna Yojana (AAY)
8.18 This Scheme aims to make PDS benefits more substantial in terms of both quantity and nutrition, for the poorest section of the Below Poverty Line (BPL) population. Detailed guidelines have been issued to the States/UTs for identification of the Antyodaya beneficiary families and implementation of the scheme. All the States/UTs have implemented AAY. The Antyodaya Anna Scheme contemplates identification of one crore poorest families out of a total of 6.52 crore BPL families covered under TPDS. These identified families are being provided food grains at rates below the rate charged for the BPL families. During the year 2016-17, the actual off-take of food grains by States/UTs under

79
AAY was 7.05 lakh tonnes against the allocated quantity of 6.09 lakh tonnes, which is 116% of the allocated quantity.
Targeted Public Distribution System (TPDS) for Below Poverty Line (BPL) population
8.19 This parameter has been included in the quarterly monitored parameters since April, 2009. During 2016-17 as against the target allocation of 9.78 lakh tonnes of food grains for BPL families, the actual off take has been 10.92 lakh tonnes which was 112% of the target.
National Food Security Act (Normal)
8.20 This parameter has been included in the quarterly monitored parameters since 2015-16. During 2016-17 as against the target allocation of 495.28 lakh tonnes of food grains, the actual off take has been 471.70 lakh tonnes which was 95% of the target.
National Food Security Act (Tide Over)
8.21 This parameter has also been included in the quarterly monitored parameters since 2015-16. During 2016-17 as against the target allocation of 18.15 lakh tonnes of food grains, the actual off take has been 17.46 lakh tonnes which was 96% of the target.
Rural Housing-Indira Awaas Yojana (IAY)/ Pradhan Mantri Awaas Yojana (Gramin)
8.22 Indira Awaas Yojana (IAY) was a flagship scheme implemented by the Ministry of Rural Development. The scheme provided houses to the poor in rural areas. The objective of IAY scheme was primarily to help construction/upgradation of dwelling units of members of scheduled castes/scheduled tribes, freed bonded labourers, minorities in the below poverty line category and other below poverty line non-SC/ST rural households by providing them a lump sum financial assistance. Under the scheme a shelter less BPL family was given assistance of ̀ 70,000/- in plain areas and ̀ 75,000/- in hilly/ difficult areas/ IAP districts for construction of dwelling. IAY, being a Centrally Sponsored Scheme, was funded on cost-sharing basis between the Government of India and the State Governments in the ratio of 75:25. However, in case of North-Eastern States and Sikkim, funding was shared between Government of India and these States in the ratio of 90:10 and in case of Union Territories, the entire funds under this scheme were provided by the Government of India. From 2016-17 Indira Awaas Yojana has been revamped to Pradhan Mantri Awaas Yojana (Gramin). Under the scheme PMAY, 27,79,473 houses were constructed during 2016-17 as against the target of construction of 43,60,996 houses which is 64% of the target.
EWS/LIG Houses in Urban Areas
8.23 The Ministry of Housing and Urban Poverty Alleviation (M/o HUPA), Government of India has designed an interest subsidy scheme as an additional

80
instrument for addressing the housing needs of the Economically Weaker Sections/ Low Income Groups segments in urban areas. The Scheme envisages the provision of interest subsidy to EWS and LIG segments to enable them to buy or construct houses. The Scheme will provide home loan with Central Government subsidy to EWS/LIG persons for acquisition of house as also for construction of house to such beneficiary, who does not own a house in his/her name or in the name of his/her spouse or any dependent child. Such beneficiaries who own land in any urban area but do not have any pucca house in their name or in the name of their spouse or any dependent child will also be covered under the Scheme. As against the target of construction of 2,38,024 EWS/LIG houses during 2016-17, 1,39,897 houses were constructed and the achievement was 59%.
National Rural Drinking Water Programme- Rural Areas
8.24 A separate Ministry namely ‘Ministry of Drinking Water & Sanitation’ has been created in July 2011. The Accelerated Rural Water Supply Programme (ARWSP) scheme has also been changed as “National Rural Drinking Water Programme” (NRDWP), the monitoring parameters under TPP-2006 have also been changed to ‘Habitations covered (Partially covered)’ and ‘Coverage of water quality affected habitations’ with effect from April 2011. During 2016-17, as against the target to cover 44,023 habitations (Partially Covered) 37,230 habitations have been covered under the programme. This is 85% of the target. Also, during this period as against the target to cover 12,812 habitations with water quality problems, 5,175 habitations have been addressed which is only 40% of the target.
Sanitation Programme in Rural Areas
8.25 Rural Sanitation is a State subject. The efforts of the States are supplemented by the Central Government through technical and financial assistance under the Central Rural Sanitation Programme (CRSP). The Programme was launched in the year 1986 with the objective of improving the quality of life of the rural people and providing privacy and dignity to women. The components of the Programme include construction of individual sanitary toilets for households below the poverty-line (BPL), conversion of dry latrines to flush toilets, construction of village sanitary complexes for women, setting up of sanitary marts and production centres, intensive campaign for creating awareness, health education, etc. School Sanitation has been introduced as a major component to encourage wider acceptance of sanitation among the rural masses. During the year 2016-17, 1,54,80,104 individual household latrines were constructed.
Institutional Delivery
8.26 The Hon’ble Prime Minister of India launched ‘Janani Suraksha Yojana’ under the National Rural Health Mission (NRHM) on 12th April 2005. The scheme

81
has the dual objectives of reducing maternal and infant mortality by promoting institutional delivery among poor women. Cash benefits are provided to the beneficiaries belonging to below poverty line (BPL) families and also to the village link worker/ASHA for coming to the institution for delivery, the cost of transportation, etc. Benefits are graded in nature and vary from high performing to low performing States and also from rural to urban areas. The scheme is 100% centrally sponsored. It is funded through the RCH flexi pool mechanism. Monitoring parameter under this scheme is number of deliveries that took place in specialised institutions. During the year 2016-17, 1,54,22,023 deliveries were conducted in institutions all over the country.
Scheduled Caste Families Assisted
8.27 The SC (Scheduled Caste) population, according to 2011 Census, accounts for 16.6% of the country’s total population. The strategy evolved for their upliftment includes: (i) special component plan of the States and central ministries, (ii) special central assistance, and (iii) assistance through the Scheduled Castes Corporations in the States.
8.28 From 2015-16 the item “Scheduled Caste Families Assisted” is monitored under two parameters, namely (i) SC Families assisted under SCA to SCSP & NSFDC and (ii) SC Students assisted under Post-Matric Scholarship. During the period 2016-17, 318411SC Families were assisted under SCA to SCSP & NSFDC as against the target of 181000 which is 176 % of the target and 36,49,707 SC Students were assisted under Post-Matric Scholarship.
Universalisation of ICDS Scheme
8.29 Integrated Child Development Services (ICDS) was conceived as the most viable vehicle for achieving holistic development with a focus on mother and child. The intended development of women and children, as a national priority, is being guided and pursued through the National Policy for Children - 1974 and the National Plan of Action for Children. The target population includes pregnant women, nursing mothers, children upto 6 years of age and adolescent girls. Supplementary Nutrition, Pre-school Education, Immunization, Health Check-up, Referral Services and Nutrition and Health Education are the main intervention packages offered under the scheme. In addition, the scheme envisages effective convergence of inter-sectoral services in the Anganwadi centres. The beneficiaries under ICDS scheme are drawn from the poorest families. During the year 2016-17, as against the target of making 7075 ICDS Blocks (cumulative) operational, 7050 Block (cumulative) were made operational which is almost 100% of the target.
Functional Anganwadis
8.30 Under Integrated Child Development Services (ICDS), the Anganwadi is the primary unit which extends services such as supplementary feeding to bridge the calorie gap between the national recommended standards

82
and average intake of children and women. In order to promote improved behavioural actions for the care of pregnant women and young children, the Anganwadi also provides an important contact opportunity with pregnant women and mothers of infants, who are 4 to 6 months of age. Throughout the country, the Anganwadi Worker and Helper have been utilized for various programmes/ schemes related to health and family welfare. The target for the year 2016-17 was to make 14 lakh Anganwadis (cumulative) functional and the achievement against it was 13.53 lakh which is 97 % of the target.
Urban poor families assisted under seven point charter viz. land tenure, housing at affordable cost, water, sanitation, health, education and social security
8.31 Urban slums, particularly in the big cities of our country, are the picture of human misery and degradation. Urbanization is an inevitable phenomenon of modernization and economic development. Slums grow as a result of structural inequities in the development of the urban sector. Due to the high price of land and housing and low purchasing power, the urban poor are forced to join the existing slums for cheap shelter or to occupy any vacant land/areas wherever available in the city. With a view to paying particular attention to the needs of slum dwellers, urban poor families are assisted under the seven point charter viz. (i) land tenure, (ii) housing at affordable cost, (iii) water, (iv) sanitation, (v) health, (vi) education and (vii) social security. W.e.f April 2015 the parameter has become non-targetable. For the year 2016-17, 15.69 lakh poor families were assisted.
Afforestation:
(i) Area covered under plantation (Public & Forest Land)
(ii) Seedlings Planted (Public & Forest Land)
8.32 This programme has been conceived to increase the green cover of the country. Under this programme, two major items are being monitored on monthly basis i.e. (i) area covered under plantations in respect of public lands including forest lands and (ii) seedlings planted on public and forest lands. During the year 2016-17, as against the target to cover 10.90 lakh hectares of public and forest land under plantations, 19.90 lakh hectares of land was covered, showing 183% of achievement. Similarly, the target for seedling plantation during the year was to plant 7082.15 lakh seedlings on public and forest land and against it the planting of 14042.89 lakh seedlings was achieved, which is 198% of the target.
Rural Roads – Pradhan Mantri Gram Sadak Yojana (PMGSY)
8.33 The President of India, in his address to Parliament on 25th February, 2005, announced a major plan for rebuilding rural India called Bharat Nirman. The Government had identified Rural Roads as one of the six components of Bharat Nirman and set a goal to provide connectivity to all villages with a

83
population of 1000 (500 in the case of hilly or tribal areas) with an all-weather road by 2009 through the Pradhan Mantri Gram Sadak Yojana (PMGSY). Grameen Sadak (Rural Roads) has been added to give highest priority to the development and expansion of Rural Roads as through connectivity, the fruits of development can reach the rural areas. The target for the year 2016-17 was for construction of 48,623 Km of road in rural areas whereas the achievement was 47,450 Km of road constructed, which is 98% of the target.
Deendayal Upadhyaya Gram Jyoti Yojana (DDUGJY)
8.34 This scheme of Rural Electricity Infrastructure and Household Electrification has been introduced in April, 2005 for achieving the National Common Minimum Programme objectives of providing access to electricity to all Rural Household in a period of four years. The Rural Electricity Corporation (REC) is the nodal agency for implementing the programme. The target for the year 2016-17 was electrification of 8360 villages and against it, 4,767 villages electrified which is 57% of the target.
Energization of Pump Sets
8.35 Electric power in rural areas is not only required for domestic and agricultural purposes, but also for irrigation. Pump sets are energized to provide irrigation facilities for agriculture. During the year 2016-17, 6,86,902 pump sets were energized against the target of energization of 4,44,097 pump sets which is 155% of the target.
Supply of Electricity
8.36 Government has notified the National Electricity Policy, which inter-alia aims at accelerated development of the power sector, providing supply of electricity to all areas and protecting interests of consumers and other stakeholders. The salient features of the policy are access to electricity and availability of power. During the year 2016-17, as against demand of 11,24,287 million units (MUs) of electricity, 11,16,771 MUs of electricity could be supplied which is 99% of the demand.

84
CHAPTER IX
INFRASTRUCTURE AND PROJECT MONITORING9.1 The Infrastructure & Project Monitoring Division (IPMD) monitors the implementation status of Central Sector Infrastructure Projects costing more than `150 crore taken up by the respective Ministry/Department and their Central Sector Public Enterprises (CPSEs) in 16 infrastructure sectors. Successful Implementation of various projects and schemes constitutes the most significant conditions for development. Effective coordination judiciously matched with regular monitoring becomes an important element in ensuring their successful completion with improved efficiency at a greater speed and at a lesser cost.
Objectives of Project Monitoring
• To enhance effectiveness of project implementation;
• To facilitate information flow for effective decision making;
• To resolve outstanding implementation issues;
• To bring about system i.e. improvement; and
• To promote best management practices.
System of Monitoring:
9.2 The IPMD monitors the implementation of the Central Sector Projects above ` 150 crore through the mechanism of Online Computerized Monitoring System (OCMS).
• It provides linkages to Cabinet Secretariat, PMO, NITI Aayog and all Administrative Ministries to view the projects reports and query results.
• It enables the various project executing agencies to enter and view project progress data through a web-based interface on a periodic basis.
• The data submission process undergoes three-level authentication and authorization.
• Any number of milestones can be created and maintained in OCMS.
• Project agencies can select the reasons of delays from certain pre-structured reasons or/additionally project agencies can write the new reasons of delay or their experience.
• The data submitted for a period is then analysed and published thereby providing a detailed overview of the latest status of all ongoing Central Sector Infrastructure projects.
85
• Any type of file (picture, map, excel sheets, pdf, PERT/CPM charts etc.) can be uploaded on OCMS.
• It also provides the monitoring of MoU targets/parameters.
• It also provides a communication channel between Administrative Ministry and the Project implementing agencies.
• Most of the Ministries like Power, Coal, Telecom, and Petroleum etc have taken the OCMS.
• The physical performances are measured in terms of milestones
• The constant persuasion of the IPMD has resulted in improved reporting and now majority of the Public Sector Enterprises are reporting on-line. However, data pertaining to milestones and the reasons for time and cost overruns are still not being reported to the fullest extent.
9.3 The IPMD has been making improvements in the OCMS as per the feedback received from the PSUs and also ironing out their difficulties through OCMS training and clarifications during interactions. The focus is now more on persuading the PSUs to forward the information online.
9.4 Facilitator in better implementation of Projects
One of the important contributions of the IPMD has been bringing in systemic improvements to facilitate better implementation of projects, from time to time.
The IPMD, of this Ministry has been instrumental in flagging the projects lagging behind the schedule or facing cost overruns in the periodical review meetings of the projects by the concerned Administrative Ministries. This enables the Administrative Ministries in identifying the constraints for each project and take corrective measures for removal of such bottlenecks.
9.5 Project Implementation Status during 2017-18
As on 1st October 2017, 1263 projects with an anticipated cost of ` 17,49,427.56 crore were on the monitor of the Ministry. For the purpose of monitoring, the projects have been grouped into two categories, viz (I) Mega projects, each costing ` 1000 crore and above and (II) Major projects, costing ` 150 crore and above but less than ` 1,000 crore. The sectoral break up of on-going 1263 central sector projects are shown in the pie-chart given below:-

86
38.16
27.95
9.82
8.23
7.28
2.852.69
1.03
0.630.32
0.24
0.240.16
0.16
0.160.08
ROAD TRANSPORT AND HIGHWAYS
RAILWAYS
POWER
PETROLEUM
COAL
URBAN DEVELOPMENT
STEEL
HEALTH AND FAMILY WELFARE
SHIPPING AND PORTS
MINES
ATOMIC ENERGY
TELECOMMUNICATIONS
CIVIL AVIATION
FERTILISERS
DEFENCE PRODUCTION
HEAVY INDUSTRY
The details of projects in each category as on 1st October 2017 are given in Table 1 below:

87
Frequency Distribution of Projects as on 1st October 2017Table-1
Sl. No. SECTOR
No. of MEGA
PROJECTS
ORIGINAL COST
(` In crore)
ANTICIPATED COST
(` In crore)
No. of MAJOR
PROJECTS
ORIGINAL COST
(` In crore)
ANTICIPATED COST
(` In crore)
1 ATOMIC ENERGY 3 27,271.00 29,779.00 0 0.00 0.00
2 CIVIL AVIATION 0 0.00 0.00 2 624.07 994.86
3 COAL 12 55,807.73 55,808.53 80 32317.26 32501.83
4 FERTILISERS 0 0.00 0.00 2 680.64 703.44
5 MINES 1 5,540.00 5,540.00 3 1233.63 1233.63
6 STEEL 9 48,164.22 48,150.68 25 9185.27 9412.49
7 PETROCHEMICALS 0 0.00 0.00 0 0.00 0.00
8 PETROLEUM 42 1,65,237.15 1,66,989.32 62 24905.50 24532.73
9 POWER 66 3,16,296.60 3,72,500.82 58 23248.64 24801.29
10 HEAVY INDUSTRY 1 1,718.00 3,827.30 0 0.00 0.00
11HEALTH AND FAMILY WELFARE
0 0.00 0.00 13 3637.08 3649.38
12 RAILWAYS 130 2,70,626.64 3,45,927.66 223 83436.53 108245.79
13ROAD TRANSPORT AND HIGHWAYS
102 1,48,606.06 1,54,042.12 380 168767.82 169703.96
14 SHIPPING AND PORTS 1 2,427.40 2,427.40 7 1690.35 2657.62
15 TELECOMMUNICATIONS 2 15,445.17 26,675.17 1 418.26 418.26
16 URBAN DEVELOPMENT 11 1,39,164.14 1,51,298.94 25 6781.09 7136.30
17 DEFENCE PRODUCTION 0 0.00 0.00 2 453.64 469.04
Total 380 11,96,304.11 13,62,966.94 883 3,57,379.78 3,86,460.62
• As on 1st October 2017, 1263 projects with anticipated completion cost of ` 17,49,427.56 crore were on the monitor of the Ministry. For the purpose of monitoring, these projects have been categorised into two categories:
S.No. CATEGORY No. of Projects
Anticipated Cost
(` In crore)
1 Mega (` 1000 crore and above) 380 13,62,966.94
2Major (` 150 crore to less than ` 1000 crore) 883 3,86,460.62
Total 1263 17,49,427.56

88
The projects are monitored on sectoral and geo-physical basis. The key financial parameters of the monitored projects have been highlighted in the Table 2:
Investment Scenario in Central Sector Projects across the States
Table-2
STATE -WISE STATUS OF CENTRAL SECTOR PROJECTS COSTING ` 150 CRORE AND ABOVE
(All Cost /Expenditure in ` crore)
S.NO STATE NO OF PROJECTS
COST ORIGINAL
COST ANTICIPATED
CUMULATIVE EXPENDITURE
1ANDAMAN & NICOBAR ISLANDS
1 314.61 441.33 24.13
2 ANDHRA PRADESH 59 97268.72 101271.75 11857.273 ARUNACHAL PRADESH 31 16602.41 33555.84 17205.44 ASSAM 50 33769.6 47399.82 29960.55 BIHAR 77 64823.58 81651.84 38464.486 CHHATISGARH 38 82769.79 84975.67 48572.547 D & N HAVELI 1 6086.08 5479.75 2081.128 DELHI 17 50925.07 51204.68 35407.229 GOA 9 4043.51 4058.91 133.3810 GUJARAT 41 38827.45 41398.82 25532.9611 HARYANA 21 14081.22 15967.45 10913.5312 HIMACHAL PRADESH 12 14659.32 22591.6 8869.8813 JAMMU AND KASHMIR 10 27408.66 47277.79 19743.2514 JHARKHAND 48 46724.53 50436.69 18263.6415 KARNATAKA 46 78727.9 96951.71 43753.2616 KERALA 20 20650.14 26747.71 2793.1817 MADHYA PRADESH 54 57610.99 62057.28 23820.0518 MAHARASHTRA 112 169907.76 179607.21 57223.4719 MANIPUR 2 944.25 9874.69 5470.6320 MEGHALAYA 6 7108.02 9025 935.4121 MIZORAM 5 2001.2 6942.57 3060.6622 MULTI STATE 183 301037.13 297706.42 97758.123 NAGALAND 7 8126.79 10276.79 362.7124 ODISHA 66 72116.99 79785.64 17124.2125 PUNJAB 28 15555.77 15561.5 3396.2826 RAJASTHAN 62 44007.1 46296.19 17970.2927 SIKKIM 6 2537.08 5585.45 893.0428 TAMIL NADU 56 63625.39 77115.53 46019.5429 TELANGANA 35 24832.84 27489.74 6378.5430 TRIPURA 11 4400.64 9067.42 5643.0431 UTTAR PRADESH 83 109253.66 112943.92 35553.5632 UTTARAKHAND 13 16833.35 17673.56 8248.8733 WEST BENGAL 53 56102.34 71007.29 36367.24
Total 1263 15,53,683.89 17,49,427.56 6,79,801.38

89
Project completed during 2017-189.6 27 projects reported completion during the year 2017-18 (up to 1st October 2017). List of completed projects is given at Annexure-VIII.
Project implementation status during the 12th Plan9.7 During the Twelfth Plan (April 2012 to March 2017) 378 projects reported completion. Of these, 73 projects completed in 2012-13, 69 projects completed in 2013-14, 72 projects completed in 2014-15, 61 projects completed in 2015-16 and 103 projects completed in 2016-17. Sector-wise break-up of these projects is given in Table 3.
SUMMARY OF PROJECTS COMPLETED DURING 12 TH PLANTable-3
S.No SECTOR NO OF PROJECTS
COST ORIGINAL
(` in crore)
COST ANTICIPATED
(` in crore)
CUMMULATIVE EXPENDITURE
(` in crore)
1 ATOMIC ENERGY 1 1106.29 1106.29 1084.24
2 CIVIL AVIATION 5 5172.79 6066.90 5526.66
3 COAL 10 12952.23 16786.43 15718.10
4 FERTILISERS 6 5317.41 5317.41 3826.59
5 PETROLEUM 77 151484.55 171042.73 130255.86
6 POWER 78 132228.46 147711.82 111627.30
7 RAILWAYS 34 12577.06 27552.19 24614.22
8 ROAD TRANSPORT AND HIGHWAYS
100 48531.55 48738.87 61157.46
9 SHIPPING AND PORTS 21 15080.47 15319.80 11685.85
10 STEEL 22 50879.61 56753.51 52942.31
11 TELECOMMUNICATIONS 18 7426.58 6950.75 3235.58
12 URBAN DEVELOPMENT 6 5994.83 6082.63 4591.50
TOTAL 378 4,48,751.83 5,09,429.33 4,26,265.67
9.8 Sector-wise analysis of the time overrun of projects under implementation on OCMS (excluding completed projects) is indicated in Table 4

90
Table- 4
Extent of time overrun in projects with respect to original schedule ` 150 Crore and above (All Cost/ Expenditure in ` crore)
Projects with time overruns$SI. No Sector No. of
ProjectsOriginal
CostAnticipated
CostCost
Overrun^(%)
No. Original Cost
AnticipatedCost
Range of T.O.R
(in months)
1 ATOMIC ENERGY 3 27,271.00 29,779.00 9.20 3 27,271.00 29,779.00 47-89
2 CIVIL AVIATION 2 624.07 994.86 59.41 2 624.07 994.86 21-80
3 COAL 92 88,124.99 88,310.36 0.21 39 20,618.90 20,758.14 4-132
4 FERTILISERS 2 680.64 703.44 3.35 1 197.79 209.44 29- 29
5 MINES 4 6,773.63 6,773.63 0.00 0 0.00 0.00 -
6 STEEL 34 57,349.49 57,563.17 0.37 17 46,224.80 46,036.59 5-72
7 PETROLEUM 104 1,90,142.65 1,91,522.05 0.73 35 59,790.32 63,010.99 1-93
8 POWER 124 3,39,545.24 3,97,302.11 17.01 61 1,99,151.68 2,36,516.58 3-136
9 HEAVY INDUSTRY 1 1,718.00 3,827.30 122.78 1 1,718.00 3,827.30 75-75
10 HEALTH AND FAMILY WELFARE
13 3,637.08 3,649.38 0.34 5 1,183.93 1,183.93 6-15
11 RAILWAYS 353 3,54,063.17 4,54,173.45 28.27 36 44,219.60 1,13,147.29 12-261
12 ROAD TRANSPORT AND HIGHWAYS
482 3,17,373.88 3,23,746.08 2.01 74 64,849.16 68,524.01 5-116
13 SHIPPING AND PORTS 8 4,117.75 5,085.02 23.49 2 516.39 1,269.46 96-141
14 TELECOMMUNICATIONS 3 15,863.43 27,093.43 70.79 1 13,334.00 24,664.00 47-47
15 URBAN DEVELOPMENT 36 1,45,945.23 1,58,435.24 8.56 20 60,054.80 65,110.95 2-72
16 DEFENCE PRODUCTION 2 453.64 469.04 3.39 0 0.00 0.00 -
Total 1263 15,53,683.89 17,49,427.56 12.60 297 5,39,754.44 6,75,032.54
9.9 Reasons for Time Overrun• Delay in land acquisition
• Delay in obtaining forest/environment clearances
• Lack of infrastructure support and linkages
• Delay in tie-up of project financing
• Delay in finalization of detailed engineering
• Changes in scope
• Delay in tendering, ordering and equipment supply
• Law & Order problems
• Geological surprises.
• Pre-commissioning teething troubles
• Contractual issues

91
9.10 Sector-wise analysis of the cost overrun of projects under implementation on OCMS (excluding completed projects) is indicated in Table 5:
Table-5
Extent of cost overrun in projects with respect to original schedule (` 150 Crore and above) (All Cost/ Expenditure in ` crore)
Projects with time overruns$SI. No
Sector No. ofProjects
OriginalCost
AnticipatedCost
CostOverrun^
(%)
No. Original Cost
AnticipatedCost
Range of T.O.R
(in months)
1 ATOMIC ENERGY 3 27,271.00 29,779.00 9.20 1 3,492.00 6,000.00 71.82
2 CIVIL AVIATION 2 624.07 994.86 59.41 2 624.07 994.86 59.41
3 COAL 92 88,124.99 88,310.36 0.21 7 18,876.68 19,914.04 5.50
4 FERTILISERS 2 680.64 703.44 3.35 2 680.64 703.44 3.35
5 MINES 4 6,773.63 6,773.63 0.00 0 0.00 0.00 0.00
6 STEEL 34 57,349.49 57,563.17 0.37 5 1,639.71 2,211.39 34.86
7 PETROLEUM 104 1,90,142.65 1,91,522.05 0.73 17 24,522.27 30,950.70 26.21
8 POWER 124 3,39,545.24 3,97,302.11 17.01 44 1,05,404.62 1,63,161.49 54.80
9 HEAVY INDUSTRY 1 1,718.00 3,827.30 122.78 1 1,718.00 3,827.30 122.78
10 HEALTH AND FAMILY WELFARE
13 3,637.08 3,649.38 0.34 1 196.70 209.00 6.25
11 RAILWAYS 353 3,54,063.17 4,54,173.45 28.27 213 1,21,595.36 2,83,482.35 133.14
12 ROAD TRANSPORT AND HIGHWAYS
482 3,17,373.88 3,23,746.08 2.01 43 25,598.69 32,656.93 27.57
13 SHIPPING AND PORTS 8 4,117.75 5,085.02 23.49 5 1,205.50 2,172.77 80.24
14 TELECOMMUNICATIONS 3 15,863.43 27,093.43 70.79 1 13,334.00 24,664.00 84.97
15 URBAN DEVELOPMENT 36 1,45,945.23 1,58,435.24 8.56 6 22,919.82 35,590.21 55.28
16 DEFENCE PRODUCTION 2 453.64 469.04 3.39 2 453.64 469.04 3.39
Total 1263 15,53,683.89 17,49,427.56 12.60 350 3,42,261.70 6,07,007.52 77.35
9.11 Causes of Cost Escalation:• Under-estimation of original cost• Changes in rates of foreign exchange and statutory duties• High cost of environmental safeguards and rehabilitation measures• Spiralling land acquisition costs• Changes in scope of projects• Monopolistic pricing by vendors of equipment services• General price rise / inflation• Disturbed conditions • Time Overrun
Time and cost overruns in projects – Trend analysis9.12 An analysis of Time overrun in the last 18 years with respect to the original schedule shows that the time overrun has come down from 44.99% in March 2000 to 23.52% in September 2017. The time overrun has come down on account of various policies and control measures taken by the Government. The trend of time overrun over the years may be seen in the following graph:

92
44.99
37.66
31.72
39.44 37.15
39.02
38.80
34.13
41.9148.11
48.21
47.33
47.65 51.08
29.44
43.68
31.88
26.56
25.42
25.08
23.24
21.80
23.27
23.52
0.00
10.00
20.00
30.00
40.00
50.00
60.00
70.00
80.00
Mar
200
0
Mar
200
1
Mar
200
2
Mar
200
3
Mar
200
4
Mar
200
5
Mar
200
6
Mar
200
7
Mar
200
8
Mar
200
9
Mar
201
0
Mar
201
1
Mar
201
2
Mar
201
3
Mar
201
4
Mar
201
5
Mar
201
6
Mar
201
7
Apr
201
7
May
201
7
Jun
2017
Jul 2
017
Aug
201
7
Sep
201
7
Per
cent
age
of p
roje
cts
Year(s)
Trend of projects running behind schedule w.r.t original schedule
overall % time overruns
9.13 An analysis of cost overrun in the last 18 years with respect to the originally approved costs shows that the cost overrun has come down from 36% in March, 2000 to 12.60% in September 2017. The cost overrun has come down on account of various policies and control measures taken by the Government. The trend of cost overrun over the years may be seen in the following graph:
36
3626
22.3
22.4
17.7
17.4
14.51
12.06
13.45
14.72
18.69
18.08
17.7
19.4 20.03
12.5211.00
10.71
10.82
10.7
10.93
11.4
12.6
0
5
10
15
20
25
30
35
40
Mar
200
0
Mar
200
1
Mar
200
2
Mar
200
3
Mar
200
4
Mar
200
5
Mar
200
6
Mar
200
7
Mar
200
8
Mar
200
9
Mar
201
0
Mar
201
1
Mar
201
2
Mar
201
3
Mar
201
4
Mar
201
5
Mar
201
6
Mar
201
7
Ap
r 201
7
May
201
7
Jun
201
7
Jul 2
017
Aug
201
7
Sep
201
7
% o
f cos
t ove
rrun
Year(s)
Trend of cost overrun w.r.t original cost
Overall % cost overun

93
Remedial measures/systemic improvements9.14 The IPMD from time to time has brought in systemic improvements to reduce delays in project implementation, which inter-alia includes:
• Regular monitoring of time & cost overruns in projects costing ` 150 crore and above,
• Detailed review of projects on quarterly basis.
• Setting up of Standing Committees by the Govt. in the respective Ministries/Department headed by Addl. Secretaries to fix responsibility for time & cost overruns.
• Stricter appraisal of projects.
• Adoption of computer network based monitoring,
• Emphasis on project management and imparting training to project managers of CPSUs.
• Setting up of Central Sector Projects Coordination Committees (CSPCCs) in the States under the Chief Secretaries for removal of bottlenecks and for facilitating the speedy implementation of major projects.
Initiatives taken during the year9.14.1 Central Sector Projects Coordination Committees (CSPCC):- The Ministry had advised all the State Governments to constitute a Central Sector Projects Coordination Committees (CSPCC) under the chairmanship of Chief Secretary to resolve project related issues faced by CPSUs in their States. So far, twenty seven States have constituted such CSPCCs. The mechanism of CSPCC has been very effective in resolving issues related with the State Governments like land acquisition, shifting of utilities, resettlement & rehabilitation and law & order problems.
9.14.2 Taking up of issues with Ministries for review of sectors:- During the year the progress of implementation of projects in various sectors and highlighting of delayed projects, were taken up at the different level with the Ministry of Railways and Road Transport & Highways.
9.14.3 Active participation in MOU/Review/EBR Meetings:- The IPMD is actively raising the issues of time & cost over runs in the project implementation item of the draft MOUs in the meetings of the MOU Task Forces conducted by the Department of Public Enterprises for assessing the performance of the CPSEs.
9.14.4 Support to Project Management Initiatives:- The IPMD supported the “Global Symposium on Vision to Delivery- The Project Management Way ” organized by International Institute of Projects & Programme Management (I2P2M) at New Delhi during the year.
9.14.5 Re-designing and redevelopment of OCMS: The Ministry is in the process of re-designing and redeveloping the OCMS. The existing OCMS is

94
now being upgraded in .NET and SQL under the supervision of NIC to cater to the requirement of various stakeholders. The new software will be more user friendly and will have updated features like dashboards, graphics etc.
9.14.6.1 The Ministry, on the direction of Committee of Secretaries (CoS) has decided to offer the OCMS of this Ministry to the State Governments for use in monitoring the progress of State Sector Infrastructure Projects at their level. The Ministry will also extend training and handholding to the concerned officers of the State Governments in the use of the project-monitoring software/mechanism. The State Governments will be free to decide whether they would like to use the OCMS or some other package for the purpose of project-monitoring of the State Sector Infrastructure Projects.
9.14.6.2 In this regard, this Ministry had organized three residential workshops for two days on the technical and functional aspects of OCMS. In these workshops 75 participants from various States/UTs had participated.
Trainings under Project Management9.15 With a view to promote project management and improve the implementation of central sector projects, the IPMD have been conducting five days residential training programs in Project Management at National Statistical Systems Training Academy (NSSTA) for the employees of the Public Sector Undertakings. During 2017-18 one such training has so far been conducted wherein 65 participants from various PSUs participated.
INFRASTRUCTURE PERFORMANCE MONITORINGInfrastructure Monitoring9.16 The monitoring of important infrastructure sectors in the country aims to provide an overview of the performance and highlight slippages, if any, before the decision making authorities. This Ministry monitors the performance of the country’s eleven key infrastructure sectors, viz., Power, Coal, Steel, Cement, Fertilizers, Petroleum & Natural Gas, Roads, Railways, Shipping, Civil Aviation and Telecommunications. The performance of these sectors is analyzed with reference to the pre-set targets for the month and the cumulative period vis-a-vis achievements during the corresponding month and cumulative period of the last year.
9.17 Infrastructure performance is reported through the Review Report on Infrastructure Sector Performance.
Overall Performance of Infrastructure Sector9.18 The production performance of the infrastructure sector during the last three years and 2017-2018 (April- September) is at Annexure - VII.
Infrastructure Performance during 2017-18 (April-September)9.19 The overall infrastructure performance during 2017-18 (April - September) has shown positive trend of growth. All sectors except crude oil, natural gas,

95
revenue earning goods traffic, coal handled at major ports, net addition in switching capacity in the telephone exchanges and new net mobile phone connection provided recorded a positive growth over the performance during the corresponding period of the previous year. However, as compared to the targets set for the period April-September 2017, most of the sectors except power generation, production of coal, refinery, upgradation of highways by State PWD & Border Road Organisation (BRO), export & import cargo handled at airports and passengers handled at domestic terminals of the airports have lagged behind their targets for the period. The growth trend in the overall infrastructure performance during last three years and 2017-18 (April - September) is at Annexure-VII. Sector-wise details are given in the following paragraphs.
Power9.20 The overall power generation scenario during past five years has shown continuous growth as indicated in the adjoining chart. During (April - March) 2016-17 the power generation at 1242.01 Billion Units (BU) recorded a growth of 5.83% over the power generation for the year 2015-16. The growth of 5.83% was higher than the 5.69% growth achieved during the corresponding period of previous year (2015-16). The All India Plant Load Factor (PLF) of the Thermal Power Stations (TPS) during 2016-17 was 59.88%, which was lower than the PLF of 62.24% achieved during 2015-16.
9.21 During 2017-18 (April - September) the power generation in the country at 667.95 Billion Units (BU) was 6.06% higher than the target of 629.78 BU for the period and it recorded a growth of 5.73% over the power generation during the corresponding period of the previous year. The adjoining chart shows the position of power generation vis-a-vis target and the achievement of the previous year. The thermal generation at 509.01 BU recorded a growth of 5.20% but it was 1.31% lower than the target of 515.75 BU for the period. The PLF of 59.81% was higher than the PLF of 58.79% achieved during the corresponding period of last year. So far as sector-wise thermal power generation is concerned, the generation in the state sector was lower than the target for the period by 8.37% but generation in the central & private sector were higher by 3.76% and 0.60% respectively. The
600700800900
1000110012001300
2012-13 2013-14 2014-15 2015-16 2016-17 2017-18 (April-Sept.)
Bill
ion
Un
its
Annual trend in Power generation
0
200
400
600
800
Bill
ion
Uni
ts
Power generation 2016-17 and 2017-18( April-September)
2016-17 Actual 2017-18 Target 2017-18 Actual

96
hydro power generation at 81.38 BU was lower than the target for the period but higher than the generation during the corresponding period of the previous year by 8.20% and 4.79% respectively. The nuclear power generation at 17.06 BU was lower than the target for the period as well as the generation during the corresponding period of the previous year by 23.47% and 10.15% respectively.
Coal
9.22 The coal production during 2016-17 at 659.27 Million Tonnes (MT) was 3.14% higher than the production of 639.23 MT during 2015-16. The trend of coal production during past five years is brought out in the adjoining graph.
9.23 The overall coal production during 2017-18 (April – September) at 282.64 MT was 3.40% higher than the target for the period, and it recorded a growth of 1.63% over the production of 278.11 MT during the corresponding period of the last year. The production of coking coal at 17.59 MT registered a negative growth of 31.69%, but the production of washed coal at 0.84 MT was 17.04% lower than the production during the corresponding period of previous year. The overall coal despatches during 2017-18 (April-September) at 322.02 MT was higher than the target of 310.62 MT for the period as well as the despatches during the corresponding period of previous year by 3.67% & 8.26% respectively.
Steel
9.24 The overall production of finished steel during the year 2016-17 was 110.74 MT, which recorded a growth of 7.62% over the production of 102.90 MT during the year 2015-16. The production of finished steel during past five years indicates the trend as brought out in the adjoining chart.
9.25 During 2017-18 (April - September), the production of finished steel at 57.14 MT recorded a positive growth of 1.45% over the production of 56.32 MT during the corresponding period of last year.
200
300
400
500
600
700
800
2012-13 2013-14 2014-15 2015-16 2016-17 2017-18 (April-Sept.)
Mill
ion
Tonn
es
Annual trend in Coal production
40
60
80
100
120
2012-13 2013-14 2014-15 2015-16 2016-17 2017-18 (April-Sept.)
Mill
ion
Tonn
es
Annual trend in production of Finished Steel

97
Cement
9.26 The production of cement during 2016-17 at 279.72 MT was 1.22% lower than the production of 283.18 MT during the previous year. The growth rate has decreased to 1.22% compared to 4.53% during 2015-16. The trend in cement production during past five years is indicated in the side chart.
9.27 The production of cement during 2017-18 (April – September) at 143.53 MT was 0.18% lower than the production of 143.79 MT during the corresponding period of last year.
Fertilizers9.28 The overall production of fertilizers (nitrogen and phosphate) during 2016-17 at 17.90 MT was 0.90% higher than the production during the year 2015-16. During the year, the overall capacity utilization (Nitrogen + Phosphate) was 97.40%, which was higher than the capacity utilized of 96.50%
during 2015-16.The production trend during the past five years is given in the side chart.
9.29 During 2017-18 (April - September) the production of fertilizers at 8.87 MT was lower than the target for the period as well as the production during the corresponding period of the last year by 11.26% & 0.97% respectively. The overall capacity utilization of 93.70% was lower than the capacity (94.60%) utilized during the corresponding period of the previous year. The production of nitrogen at 6.48 MT was lower than the target for the period as well as the production during the corresponding period of previous year by 3.39% & 2.77% respectively. The production of phosphate fertilizers at 2.39 MT was 27.27% lower than the target for the period but it was 4.24% higher than the production during the corresponding period of the last year. The production of fertilizer (nitrogen & phosphate) during 2016-17 & 2017-18 (April-September) is given in the side graph.
100140180220260300340
2012-13 2013-14 2014-15 2015-16 2016-17 2017-18 (April-Sept.)
Mill
ion
Tonn
es
Annual trend in Cement production
8
10
12
14
16
18
20
2012-13 2013-14 2014-15 2015-16 2016-17 2017-18 (April-Sept.)
Millio
n Ton
nes
Annual trend in Fertilizers production
02468
1012
Nitrogen Phosphate Total
(Mill
ion
Tonn
es)
Fertilizer production during 2016-17 and 2017-18 (April - September)
2016-17 Actual 2017-18 Target 2017-18 Actual

98
Petroleum9.30.1 Crude Oil: The production of crude oil during 2016-17 at 36.01 million tonnes (MT) was lower than the target of 37.09 MT as well as the production of 36.94 MT during the year 2015-16 by 2.90% and 2.53% respectively. The trend in crude oil & refinery production during last five years is indicated in the side chart.
9.30.2 The production of crude oil during 2017-18 (April - September) at 18.03 MT was lower than the target of 18.67 MT for the period and the production of 18.06 MT during the corresponding period of last year by 3.44% and 0.22% respectively.
9.31.1 Refinery Production: The refinery production (in terms of crude throughput) during 2016-17 at 245.37 MT was higher than the target of 240.42 MT as well as the production of 232.87 MT during the year 2015-16 by 2.06% and 5.37% respectively. The overall capacity utilization at 106.65% during 2016-17 was lower than 108.28% achieved in the previous year.
9.31.2 The refinery production during 2017-18 (April-September) at 122.39 MT was 3.94% higher than the target of 117.74 MT, it was also 0.73% higher than the production of 121.50 MT during corresponding period of the last year. The overall capacity utilization was 104.30% for the period which was lower than 105.3% capacity utilized during the corresponding period of the previous year. The above graph shows the target and the achievement of crude oil and refinery production.
9.32.1 Natural Gas: The overall natural gas production during 2016-17 at 31,897 Million Cubic Meters (MCM) was lower than the target of 34,119 MCM and the production of 32,249 MCM during 2015-16 by 6.51% and 1.09% respectively.
9.32.2 The natural gas production during 2017-18 (April - September) at 16,413 Million Cubic Meters (MCM) was 5.42% lower than the target of 17,353 MCM but it was 4.38% higher than the production of 15,724 MCM during the corresponding period of the previous year.
Roads9.33 The National Highway Authority of India (NHAI) and State PWD & Border Road Organisation (BRO) are engaged in construction and up-gradation of
-252575
125175225275
2012-13 2013-14 2014-15 2015-16 2016-17 2017-18 (April-Sept.)
Mill
ion
Tonn
es
Trend in Petroleum production
Crude Oil Prod. Refinery Prod.
0
50
100
150
Crude Oil Refinery prod.
Mill
ion
Tonn
es
Crude oil and Refinery production 2016-17 and 2017-18 (April-September)
2016-17 Actual 2017-18 Target 2017-18 Actual

99
highways. During 2016-17, the NHAI has constructed/ strengthened 2628.00 Kms national highways to four/six/eight lanes against the target of 4600.00 Kms and the achievement of 1988.00 Kms during 2015-16. The State PWD and Border Road Organisation (BRO) have widened / strengthened 65.69 Kms to four/six/eight lanes, 1792.46 Kms to two lanes and strengthened 1387.64 Kms of existing weak pavement. In addition they have improved 1387.64 Kms of low-grade sections and riding quality of 1497.77 Kms highways. As part of up-gradation of highways 56 bridges were also rehabilitated/ constructed.
9.34 During 2017-18 (April - September) the NHAI has widened/strengthened 1110.00 Kms highways against the target of 1640.00 Kms and the achievement of 985.00 Kms during the corresponding period of the last year. The trend in up-gradation of highways is indicated in the side graph. The State PWD and Border Road Organisation (BRO) widened 65.30 Kms to four/six/eight lanes, 677.12 Kms to two lanes and strengthened 760.52 Kms of existing weak pavement. They have also improved 1936.19 Kms of riding quality of highways. As part of the up-gradation, during this period 35 bridges were also reinforced /constructed against the target of 30 bridges for the period.
Railways9.35 The revenue earning freight traffic carried by the railways during 2016-17 at 1108.79 MT recorded a growth of 0.42% over the freight traffic movement for the year 2015-16 and it was also 1.17% higher than the target of 1096.00 MT for the year. The annual trend in freight traffic during last five years is
indicated in the side chart.
9.36 During 2017-18 (April - September) the freight traffic moved by the railways at 559.16 MT was 2.46% higher than the target of 545.76 MT and it recorded a positive growth of 5.04% over the freight movement of 532.32 MT during the corresponding period of the previous year. The growth rate was higher compared to (-)1.60%
0300600900
120015001800
Km
s.
Upgradation of National Highways (NHAI) 2016-17 & 2017-18 (April-September)
2016-17 Actual 2017-18 Target 2017-18 Actual
500
600
700
800
900
1000
1100
1200
2012-13 2013-14 2014-15 2015-16 2016-17 2017-18 (April-Sept.)
Mill
ion
Tonn
es
Annual trend in Railway freight traffic
0
200
400
600
Millio
n Ton
nes
Revenue earning freight traffic 2016-17 & 2017-18 (April-September)
2016-17 Actual 2017-18 Target 2017-18 Actual

100
during the corresponding period of the previous year. The adjoining graph indicates the performance of railways vis-a-vis target for the period and achievement during the corresponding period of the previous year.
Shipping and Ports
9.37 The major ports in the country handled 647.63 MT cargo during 2016-17, which was 6.79% higher than the achievement of the previous year. The trend in cargo handled at major ports is indicated in the side chart.
9.38 During 2017-18 (April – September) the major ports handled 326.38 MT cargo which recorded a growth of 3.24% over the handling of 316.14 MT cargo during the corresponding period of previous year.
9.39 The coal handled at major ports (thermal and coking) during 2016-17 at 139.85 MT was 9.87% lower than 155.17 MT coal handled during the previous year. During 2017-18 (April - September) the overall coal handled at major ports was 66.10 MT which was 9.93% lower than the shipment of 73.39 MT during the corresponding period of the previous year.
Civil Aviation
9.40 During 2016-17 all airports handled 10,95,079 tonnes of export cargo, which was higher than the targets for the period as well as cargo handled during 2015-16 by 6.29% and 11.34% respectively. During the period, airports handled 7,59,982 tonnes of import cargo, which was higher than the targets for the period as well as cargo handled during 2015-16 by 8.73% and 12.73% respectively. The side graph shows the target and the achievements of cargo handled at Airports.
9.41.1 During 2017-18 (April - September) all airports handled 6,29,821 tonnes of export cargo, which was higher than the target of 5,54,635 tonnes as well as 5,41,993 tonnes of export cargo handled during the corresponding period of the previous year by 13.56% and 16.20% respectively. Further the airports handled 4,41,535 tonnes of import cargo during this period, which was higher than the target for the period as well as the cargo handled during the corresponding period of the previous year by 20.48% and 23.29% respectively.
250
325
400
475
550
625
700
2012-13 2013-14 2014-15 2015-16 2016-17 2017-18 (April-Sept.)
Mill
ion
Tonn
es
Annual trend in Cargo handled at major ports
0100200300400500600700
Export Cargo Import Cargo
(Tho
usan
d To
nnes
)
Cargo handled at Airports during 2016-17 and 2017-18 (April - September)
2016-17 Actual 2017-18 Target 2017-18 Actual

101
9.41.2 During 2016-17 all airports handled 592.75 lakh passengers at international terminals, which was higher than the target as well as the passengers handled during 2015-16 by 0.09% & 8.42% respectively. The domestic terminals of the airports handled 2057.13 lakh passengers during 2016-17, which was higher than the targets as well as the passengers handled during 2015-16 by 16.64% and 22.14% respectively.
9.42 During 2017-18 (April - September) the international terminals of the airports handled 313.97 lakh passengers, which was 3.27% lower than the targets but 9.26% higher than the passengers handled during the corresponding period of the previous year. The domestic terminal of the airports handled 1138.78 lakh passengers, which was higher than the targets for the period as well as the passengers handled during the corresponding period of the last year by 2.42% and 16.07% respectively. The side graph shows the target and the achievements of passengers handled at Airports.
Telecommunications
9.43 During 2016-17, at the national level 51.48 lakh lines were added/connected to the switching capacity of telephone exchanges and 36.03 lakh lines were also added/connected during 2015-16. During 2016-17, private sectors provided 2.91 lakh new net fixed (wired) telephone connections and 3.28 lakh connections were also provided during 2015-16, while the public sector surrendered 11.15 lakh connections during 2016-17. During the year 2016-17, the public sector provided/connected 146.43 lakh new (net) cell phone (Mobile) connections, and 100.07 lakh cell phone connections were also provided/connected during 2015-16. While the private sector provided/connected 1218.36 lakh connections and 545.66 lakh cell phone connections were also provided during 2015-16. Total 1356.55 lakh connections (fixed + cell phones) were provided during 2016-17 and 632.03 lakh phones connections were also provided during 2015-16. Annual trend in provision of landline and Cell phone connections during last five years is indicated in the above chart.
0200400600800
10001200
International Domestic
( Lak
h N
o.)
Passengers handled at Airports during 2016-17 and 2017-18 (April - September)
2016-17 Actual 2017-18 Target 2017-18 Actual
-1000
-500
0
500
1000
1500
2000
2500
2012-13 2013-14 2014-15 2015-16 2016-17 2017-18 (April-Sept.)
Lakh
Nos
.
Trend in provision of Telephone connections
Land Lines Cell Phones

102
9.44 During 2017-18 (April -
September) 7.60 lakh lines were
deleted in the switching capacity of
telephone exchanges at the national
level while 20.40 lakh lines were
added during the corresponding
period of the previous year. During
2017-18 (April – September), private
sectors provided 2.21 lakh new net
fixed (wired) telephone connections
and 1.84 lakh connections were also
provided during the corresponding period of the previous year. The public
sector surrendered 9.51 lakh connections during the period, as well as 8.85
lakh connections were also surrendered during the corresponding period of
the previous year. The side graph shows trend in the achievements of wireline
(fixed) phone connections.
9.45 During (April – September) 2017-18,
the private sector provided 80.12 lakh
new (net) cell phone connections while
73.40 lakh cell phone connections were
surrendered during the corresponding
period of the previous year. During
this period 47.74 lakh cell phone were
provided in the public sector as well as
74.70 lakh connections provided during
the corresponding period of the previous year. The side graph shows trend in
the achievements of wireless (cell) phone connections.
9.46 During (April – September) 2017-18 total 120.56 lakh telephones
connections were provided while 5.72 lakh connections were surrendered
during the corresponding period of the previous year.
0
50
100
150
1
(Lak
h N
o.)
Wireless (Cell) phones provided during 2016-17 and 2017-18 (April - September)
2016-17 Actual 2017-18 Actual
-7.4-7.3-7.2-7.1
-7-6.9-6.8
1
(Lak
h N
o.)
Wireline (Fixed) phone surrendred/ Disconnected during 2016-17 and 2017-18
(April - September)
2016-17 Actual 2017-18 Actual

103
CHAPTER – X
MEMBERS OF PARLIAMENT LOCAL AREA DEVELOPMENT SCHEMEThe Members of Parliament Local Area Development Scheme (MPLADS)
was launched by the Govt. of India on 23rd December 1993 to provide a mechanism for Members of Parliament to recommend works of developmental nature for creation of durable community assets and for provision of basic facilities including community infrastructure, based on locally felt needs to be taken up in their Constituencies/States. Initially, the MPLADS was under the control of Ministry of Rural Development. The subject relating to the MPLADS was transferred to the Ministry of Statistics and Programme Implementation in October 1994. The scheme is governed by a set of Guidelines, which have been comprehensively revised from time to time. The present Guidelines were issued in June 2016.
10.1 The salient features of the MPLAD Scheme:a) MPLADS is a Central Plan Scheme fully funded by the Government
of India under which funds are released in the form of Grants-in-aid directly to the District Authorities.
b) The funds released under the Scheme are non-lapsable, i.e. the entitlement of funds not released in a particular year is carried forward to the subsequent years, subject to eligibility. At present, the annual entitlement per MP/Constituency is ` 5 crore.
c) Under MPLADS, the role of the Members of Parliament is limited to recommend works. Thereafter, it is the responsibility of the District Authority to sanction, execute and complete the works recommended by Members of Parliament within the stipulated time period.
d) The elected Lok Sabha Members can recommend works in their respective constituencies. The elected members of the Rajya Sabha can recommend works anywhere in the State from which they are elected. Nominated Members of the Lok Sabha and Rajya Sabha can recommend works, anywhere in the country.
e) There is no limit for works to be executed for the Government. However, for the works meant for trust/society there is a ceiling of ` 50 lakh for the lifetime of each trust/society. An MP can recommend funds only upto ` 100 lakh in all in a financial year, from MPLADS funds for works to trusts/societies.
f) MPLADS works can be implemented in areas affected by natural calamities like flood, cyclone, hailstorm, avalanche, cloudburst, pest attack, landslides, tornado, earthquake, drought, tsunami, fire and biological, chemical, radiological hazards, etc. MPs from the non-affected areas of the State/UT can also recommend permissible works upto a maximum of ` 25 lakh per annum in the affected area(s) in

104
that State/UT.
g) In the event of “Calamity of severe nature” (which is decided and declared by the Government of India) in any part of the country, an MP can recommend works up to a maximum of ` 1 crore for the affected district. The funds in this regard will be released by the Nodal District Authority of the MP concerned to the District Authority of the affected district to execute permissible works.
h) In order to accord special attention to the development of areas inhabited by Scheduled Castes (SCs) and Scheduled Tribes (STs), 15% of MPLADS funds are to be utilized for areas inhabited by SC population and 7.5% for areas inhabited by ST population.
i) If an elected Member of Parliament finds the need, to contribute MPLADS funds, to a place outside that State/UT or outside the constituency within the State or both, the MP can recommend eligible works, under these Guidelines upto a maximum of ` 25 lakh in a financial year. Such a gesture on the part of an MP will promote national unity, harmony, and fraternity among the people, at the grass roots level.
j) The MP may recommend maximum of ` 20 lakh per year for giving assistance to Differently Abled Citizens for purchase of tri-cycles (including motorized tri-cycles), battery operated motorized wheel chair and artificial limbs; and aids for visually and hearing impaired.
k) MPs may recommend their MPLADS funds to aided educational institutions which are receiving financial assistance from state government and are recognized by a State/UT/Central Board of Secondary Education in case of schools and by State/Central University in case of colleges and are not charging commercial fee from students. Such aided educational institutions are eligible for receiving MPLADS funds for all permissible items under the Guidelines with no ceiling. Both aided and un-aided educational institutions which are recognized by a Board of Secondary Education/University and are run by trusts/societies are eligible for receiving MPLADS funds for all permissible items under the Guidelines; the particular trust/society which runs the concerned educational institution will be governed by the maximum ceiling i.e. ` 50 lakh imposed on trusts/societies under the Guidelines (para 3.21).
l) Energy efficient Community Gobar Gas plants, Crematoria and structures on burial/ cremation grounds and Non-conventional energy systems/devices for Community use are interalia included in sector VI & VII of Annexure-IV(E) of the Guidelines.
m) MPs may recommend MPLADS Funds for augmentation of funds for Scheme such as ‘Swachh Bharat Abhiyan’ which provides for

105
construction of individual toilets, subject to provisions contained in para 3.17 and 3.18 of the Guidelines on MPLADS.
n) MPs may recommend MPLADS Funds for the installation of Wi-Fi system in educational institution, village and selected location.
o) Funds released by the Government of India are deposited by the District Administrations in Nationalized Banks (including IDBI Banks)/Regional Rural Banks (Gramin Banks) which are on Core Banking Platform with the Nationalized Bank as their sponsor, for each MP for the purpose of MPLAD Scheme.
p) The roles of Central Government, State Government, District Authorities and Implementing Agencies have been clearly defined in the Guidelines on MPLADS for implementation of MPLAD Scheme.
10.2 Impact Since inception, the Scheme has benefited the local community
by meeting various developmental needs such as drinking water facility, education, electricity, health and family welfare, irrigation, non-conventional energy, community centers, public libraries, bus stands/stops, roads, pathways and bridges, sports, etc. These works are sanctioned, executed and monitored as per the provisions of the MPLADS Guidelines.
10.3 Scheme Performance10.3.1 Physical Performance (as on 30th November 2017)
As compiled from reports received from the Districts, since inception of the scheme:-
• 21,60,680 works have been recommended since inception of the Scheme.
• 19,10,030 works have been sanctioned since inception of the Scheme.
• 17,12,352 works have been completed since inception of the Scheme.
• The percentage of works completed over sanctioned is 89.65 since inception of the Scheme.
• In the current financial year (as on 30th November 2017) 59,220 works have been recommended, 61,962 works have been sanctioned (including works recommended during previous years) and 61,664 works have been completed (including works sanctioned during previous years).
10.3.2 Financial Performance (as on 30th November 2017)
• ` 45,225.25 crore has been released since inception of the Scheme.

106
• Expenditure of ` 42,537.09 crore has been incurred since inception of the Scheme
• The percentage of expenditure over release is 94.06 as on 30th November 2017 since inception of the Scheme.
• ` 2216.50 crore has been released in 2017-18 (as on 30th November 2017) and an expenditure of ` 2,622.08 crore has been incurred (includes brought forward unspent amounts of previous years) during this period.
10.3.3 The funds released year-wise under the scheme, since inception is furnished below:
Year Funds Released (In ` Crore)
Cumulative Release (In ` Crore)
1993-1994 37.80 37.80
1994-1995 771.00 808.80
1995-1996 763.00 1571.80
1996-1997 778.00 2349.80
1997-1998 488.00 2837.80
1998-1999 789.50 3627.30
1999-2000 1390.50 5017.80
2000-2001 2080.00 7097.80
2001-2002 1800.00 8897.80
2002-2003 1600.00 10497.80
2003-2004 1682.00 12179.80
2004-2005 1310.00 13489.80
2005-2006 1433.90 14923.70
2006-2007 1451.50 16375.20
2007-2008 1470.55 17845.75
2008-2009 1580.00 19425.75
2009-2010 1531.50 20957.25
2010-2011 1533.32 22490.57
2011-2012 2507.68 24998.25
2012-2013 3722.00 28720.25
2013-2014 3937.00 32657.25
2014-2015 3350.00 36007.25
2015-2016 3502.00 39509.25
2016-2017 3499.50 43008.752017-18
(as on 30th November 2017)
2216.50 45225.25

107
10.3.4 Comparative performance of the Scheme:The comparative position at different time periods is given as under:-
Year
2016-17 2017-18(As on 30th November 2017)
Fund released during the period(In ` crore)
3499.50 2216.50
Fund expenditure during period (In ` crore)
3903.12 2622.08
Utilization of funds over release (In %)
111.53 118.30
Sanction of works(In numbers)
1,01,896 61,962
Completion of works (In numbers)
86,558 61,664
10.4 Integrated Software on MPLAD SchemeThe Integrated MPLADS website is developed on the state-of-the-art
technology platform with built in security features. This new website will help the State and District officials in monitoring and supervising the MPLADS scheme effectively and efficiently.
The new Integrated MPLADS Portal also enforces greater transparency and accountability in scheme implementation and promotes e-governance. The MPLADS website www.mplads.gov.in provides the following reports/features:
• Funds Release Statements (Detailed and Summary)
• Ministry Expenditure Report (Detailed and Summary)
• Priority Sector Reports
• State and District Profile
• Citizen Suggestion
• MPLADS Guidelines and Circulars
• Work Monitoring System(WMS) Report
• Annual Reports
• eBook
• News & Events

108
New Integrated MPLADS Portal has also been providing the following features:
• The Intergovernmental G2G solution ensures Micro / Macro (Works, Release and Expenditure) level reporting and monitoring for timely utilization of funds at Districts and Ministry including automatic incorporation of Member details from Lok Sabha and Rajya Sabha portal.
• The Citizen centric C2G solution provides transformation of public suggestions to on-line recommendations from Members of Parliament and will also provide messaging/blog, offline communication between Members and District Authorities.
• A single point of reference for all stakeholders – Members of Parliament, Districts, States, Ministry and Public.
• Captured the total available balances in Nodal Districts and Implementing Districts, thus resulting in timely monitoring of funds lying unutilized in the districts.

109
• Provide necessary alerts/ intimation with the help of e-mails on all important milestones of any project such as project sanction, fund release etc.
Through this portal, workflow system at Districts (Nodal Authorities) has been established and is integrated with the Government of India Release System. On being updated regularly on real time basis, the Sanction Order and MPR can be generated automatically as well as manually. Further, on-line availability of MPR has facilitated timely release of funds subject to the availability of other requisite eligible document(s).
10.5 Monitoring
• Implementation of MPLADS has improved due to intensive reviews and visits made by senior officers in the States.
• Annual Review Meetings with the Secretaries of State Nodal Departments are being regularly held regarding monitoring of release of funds and taking stock of the implementation of the scheme in the States/UTs.
• Financial and technical assistance is being provided to States/UTs to conduct training programmes for State/District officials to facilitate better implementation of the scheme. Ministry is providing training to the States/UTs for operationalising the newly developed integrated MPLADS website.
The physical monitoring by the external agencies has helped in bringing systemic changes for improved implementation of the Scheme. The overall improvement in the implementation of MPLAD Scheme is attributed to the synergy attained by the cooperation of different stakeholders and operational experience gained over years, community participation and monitoring.

110
CHAPTER – XI
PROGRESSIVE USE OF OFFICIAL LANGUAGE/HINDI11.1 In accordance with the Official Language Policy of the Union and in pursuance of the Annual Programme issued by the Department of Official Language, Ministry of Statistics & Programme Implementation has been making continuous and concerted efforts for promotion and propagation of Hindi as official language in the Ministry and in its attached & subordinate offices. Official Language wing of the Ministry is responsible for monitoring and overseeing the implementation of various statutory provisions and policies laid down in the Official Languages Act, 1963 and the Official Language Rules, 1976. As per the information provided by the Administration section of the Ministry, as on 30th November 2017, all officers/employees are either proficient in Hindi or having its working knowledge. All 32 Stenographers are trained in Hindi Shorthand/Typing.
Official Language Implementation Committee
11.2 An Official Language Implementation Committee under the Chairmanship of Joint Secretary (Admn.) undertakes quarterly review of the progressive use of Hindi as well as the compliance of provisions of the Official Languages Act, 1963 & Official Languages Rules, 1976 in the Ministry and in its attached/subordinate offices. During the period under report, the meetings of this Committee were organized successfully. Quarterly and Annual Reports regarding progressive use of Official Language in the Ministry are forwarded to the Department of Official Language, Ministry of Home Affairs regularly.
The reconstitution process of the Official Language Implementation Committee of the Ministry has been completed on 15th November 2017.
Inspections
11.3 The officers of the Ministry conduct inspections of the attached/subordinate offices as well as sections of the Ministry time and again to assess and speed up progressive use of Hindi and give necessary instructions on the lapses found therein.
Inspections of following attached/subordinate offices of the Ministry have been carried out this year:
• NSSTA, Greater Noida
• DSDD (Computer Centre), R.K. Puram, New Delhi

111
The divisions/sections of the Ministry inspected this year are as follows:-
• APAR
• MPLADS
• Twenty Point Programme (TPP)
• Coordination and Publication(CAP)
Awards and Incentives
11.4 As in the previous years the incentive scheme for original noting/drafting in Hindi continued during this year also. In the month September 2017, Hindi Month/Pakhwara was observed in the Ministry and in its attached as well as subordinate offices. In the Ministry, the period from 14th September 2017 to 28th September 2017 was observed as “Hindi Pakhwara”. This Pakhwara was marked with greater participation with a number of officers and officials in various competitions organized by Hindi Section of the ministry. After evaluating the performances in these competitions, total 29 winner participants of the ministry were awarded cash prizes in different categories.
In order to promote use of Hindi, different Hindi competitions were organized for Data Entry Operators and Daily Wages Employees also in the ministry this year and 12 deserving participants were awarded cash prizes.
Hindi Training and Workshops
11.5 As all Stenographers/A.S.Os in the Ministry are trained in Hindi stenography/typing, so during the year 2017-18 no one has been nominated under the Hindi Teaching Scheme of the Department of Official Language.
Inspections by Parliamentary Committee on Official Language
11.6 The Inspections of the following subordinate offices of the Ministry were carried out by the 3rd sub-committee of Parliamentary Committee on Official Language till November, 2017:
• FOD, NSSO, Almora, Dated: 6th May 2017
• FOD, NSSO, Kozhikode, Dated: 12th October 2017
Publication of In-House Journal “Paridrishya”
11.7 During the reporting year, essays, poems and other text materials in Hindi for 9th issue of the In-house Hindi Journal “Paridrishya” have already been invited and after receiving the required articles it will be published shortly.

112
CHAPTER XII
OTHER ACTIVITIES 12.1 The Vigilance Section in the Ministry headed by Joint Secretary & Chief Vigilance Officer, deals with the following work:
• Vigilance cases i.e., cases of corruption, malpractices and lack of integrity in respect of Group ‘A’, ‘B’ and ‘C’ officers;
• Processing/issuing of vigilance clearance in respect of officers of various grades for various purposes;
• Implementation of CCS(Conduct) rules, 1964;
• Furnishing of monthly report of vigilance cases to the Department of Personnel & Training on Probity Portal;
12.2 Vigilance Section also handles the following activities:-
• Reviewing and streamlining of procedures, which appear to afford scope for corruption or misconduct and for initiating other measures for the prevention, detection of corruption and other malpractices and punishment to the corrupt in the Ministry as well as its attached and subordinate offices;
• Preparation of list of officers of “Doubtful Integrity”/Agreed list and their postings to non-sensitive areas;
• Appointment of Vigilance Officers in the attached/subordinate offices.
12.3 The complaints received from individuals and Organisations like CBI/CVC/PMO/Cabinet Secretariat/UPSC etc. are examined on the basis of the factual report obtained from the concerned Administrative Divisions, Attached and Subordinate Offices. The preliminary inquiries are made to look into the merit of the complaint and if the complaints have any substance then a regular departmental action is initiated.
12.4 During the year 2017-18 (April 2017-November 2017), Eighteen (18) new cases/complaints were received. Further, Forty-four (44) disciplinary proceedings in different Divisions of the Ministry were processed which are at various stages of investigation/examination.
12.5 During the period (April 2017-November 2017), one (1) Minor Penalty Charge sheets and One (1) Major Penalty Charge sheets have been issued.
12.6 In addition to the above, in consultation with UPSC/CVC, Major/Minor penalties were imposed in Two (2) disciplinary cases.

113
12.7 During the period (April 2017-November 2017) more than 700 vigilance clearance were processed/ issued and 7 RTI applications/3 Appeals under the RTI Act, 2005 were received and disposed of within stipulated time.
12.8 Vigilance Awareness Week was observed during the period 30th October 2017 to 4th November 2017 to create awareness amongst officers and staff of the Ministry. It began with pledge taking ceremony. The theme of this year’s Vigilance Awareness Week was “My Vision-Corruption Free India”(
Banners regarding observance of Vigilance Awareness Week were placed at vantage locations in the Ministry.
Redressal of Public Grievances
12.9 The Ministry of Statistics & Programme Implementation and its attached/subordinate offices have negligible public interaction. However, a grievance redressal machinery is functioning in this Ministry under the supervision of Nodal Officer (Public Grievances). The particulars of the Nodal Officer have also been displayed at the Reception Office of S.P. Bhawan for the convenience of public including serving and retired persons of MoSPI so as to enable them to visit Nodal Officer without any difficulty. The grievances are received through P.G. Portal of MoSPI or through Department Of Administrative Reforms and Public Grievances. The P.G. Portal of MoSPI and Department Of A.R. and P.G. are regularly monitored by the Nodal Officer of MoSPI. There were 47 grievances pending as on 01st December 2016. During the year 2016-17 (Upto 01st December upto 30th November 2017), a total number of 516 grievances have been received and 519 grievances have been settled. All the aforesaid cases are being followed up on priority basis by reminding the concerned subordinate offices/divisions of MoSPI for early disposal.
Court Cases
12.10 The number of court cases pending in various courts during 2016-17 is as under:-
Month Dec.16 Jan.17 Feb.17 Mar.17 April 17 May 17 June17 July 17 Aug. 17 Sep. 17 Oct.17 Nov.17
Number 215 221 206 210 208 209 215 227 232 233 233 232
RTI Matters
12.11 RTI applications/appeals are normally received in PIGR Section and then forwarded to concerned CPIOs for their disposal. Ministry of Statistics and Programme Implementation has designated 26 First Appellate Authorities and one RTI Nodal Officer of the level of Deputy Secretary under the RTI Act. The Ministry has also designated 73 Central Public Information Officers (CPIOs) for Ministry and its attached/subordinate offices. Besides, one First Appellate Authority and one CPIO have been designated for Indian Statistical Institute

114
(ISI), an Autonomous body under the control of this Ministry. The number of requests and appeals received in 2017 under our RTI Act, 2005 is given as under:
No. of Requests/Appeals/Notices of CIC received during-2017 Under the RTI Act 2005
Sl. No.
Name of Month
Requests/Applications Appeals Noticesreceived
fromCIC
Cf Recd. Disp. Pending Cf Recd. Disp. Pending
1 Dec.-16 40 62 60 42 34 6 4 36 -
2 Jan.-17 42 85 84 43 36 4 6 34 -
3 Feb.-17 43 75 72 46 34 3 6 31 -
4 March-17 46 118 102 62 31 3 5 29 -
5 April-17 62 116 103 75 29 5 8 26 1
6 May-17 75 71 97 49 26 8 6 28 1
7 June-17 49 78 82 45 28 8 7 29 -
8 July-17 45 76 88 33 29 5 4 30 1
9 Aug.-17 33 85 89 29 30 13 24 19 5
10 Sept.-17 29 96 99 26 19 10 16 13 -
11 Oct.-17 26 77 89 14 13 11 15 9 -
11 Nov.-17 14 83 60 37 9 7 10 6 -
TOTAL 40* 1022 1025 37** 34* 83 111 6** 8
Cf= Carry forward from prev. month pendingRecd.= Received during the monthDisp.= Dispose off during the month* = Carry forward pendency as on 1st December 2016**= Pendency as on 30th November 2017
Information and facilitation Counter: 12.12 The Ministry has an Information and Facilitation Counter (IFC) situated at the main gate of Sardar Patel Bhawan. The Information pertaining to the functions of the Ministry is available at the counter. In addition to this, the Statistical data for use by the Research Scholars, Economists, Financial Institutions, Educational Institutions, Universities, etc. is available at the Information and Facilitation Counter and the Citizen’ s Charter of this Ministry is also on display at the counter. A person conversant with the work has been placed at IFC for handling the queries of visitors.
International Coordination & Training 12.13 International Coordination and Training unit maintains liaison with International Agencies such as the United Nations Statistical Division (UNSD),

115
United Nations Economic & Social Commission for Asia and the Pacific (UNESCAP), International Monetary Fund (IMF), World Bank, Asian Development Bank (ADB), Food and Agricultural Organization (FAO), Statistical Institute for Asia and the Pacific (SIAP) and the International Labour Office (ILO) in different statistical matters which cover interchange of statistical intelligence, participation in international conferences, seminars, workshops and trainings for the development of statistical system capabilities and serving as clearing house for statistical matte ` India is also ex-officio member of International Statistical Organization, Voorburg, Netherlands.
12.14 45 Officers of this Ministry have attended 37 International Meetings/Conferences/Seminars and 36 Officers of this Ministry have attended 27 International Workshops/Training Programmes/Courses during the period from 1st December 2016 to 30th November 2017.
12.15 Swachh Bharat Mission:-
(A) The Swachh Bharat Mission is the most significant cleanliness campaign by the Govt. of India. In order to achieve the vision of clean India, Ministry of SPI have been making all effort and carrying out special cleanliness drive from time to time. Ministry of SPI has carried out a special cleanliness drive from 16th –30th June 2017 during Swachhta Pakhwadato make each and every building of the Ministry in the country spick and span during the special cleanliness drive.
(E) Special cleanliness drive “Swachhta Hi Sewa” campaign was undertaken from 15th September to 2nd October 2017.
The salient points earmarked in these drives are as under:-
• Upkeep and cleaning of the office premises including the common areas like toilets, common corridors, and stair, lifts etc.
• Upkeep and cleaning of the area around the office premises or the Office complex, including the parking areas, pathways etc.
• The Ministry endeavors for regular and continuous cleanliness activities to ensure tidy workspaces.
• Ministry has nominated the officers to watch the overall cleanliness activities in all the offices of the Ministry. The campaign has been vigorously driven in the Ministry.
• The Ministry has also been issuing instructions as suggested by Ministry of Urban Development, Housing & Urban Poverty Alleviation, Ministry of Drinking Water and Sanitation time to time to all offices to carry out the activities as part of this cleanliness drive.

116
• Steps have been taken to weed out old records and remove almirahs and furnitures from all the corridors and common places, stair cases have been cleared of all obstructions. The Officers have been asked to keep their files and records in a neat and tidy manner in their rooms and keep the environment spic and span. These measures would be taken on a continuous basis.
• Necessary measures are taken by General Administration as per the suggestions received from the nominated officers for cleanliness of all the offices of MoSPI located at Sardar Patel Bhawan, J.P. Building and R.K.Puram.
12.16 Shifting of the offices:- The Ministry had vacated the Jeevan Prakash Building and the offices housed at Jeevan Prakash Building have been shifted to East Block-6, Level 4-7, R.K. Puram and Pushpa Bhawan, New Delhi. The ESD Division, ISSP Division have been shifted at East Block-6, Level 4-7 R.K. Puram, New Delhi and the offices of Training Division has been shifted at Pushpa Bhawan.
Consequent the vacation of 2nd Floor of Sardar Patel Bhawan, the offices housed at Sardar Patel Bhawan i.e. PI Wing, IFD and PAO have been shifted at East Block-6, Level-4-7, R.K. Puram, New Delhi and the National Statistical Commission have been shifted at Pushpa Bhawan, New Delhi.
12.17. E-procurement:-The E-procurement and E-publishing mode of tender have been fully functional in the Ministry and all its attached/ subordinate offices. The Nodal officer of the E-procurement portal is Director (A)/ HOD of the Ministry.
12.18 Government E-Market Place:- The Ministry of Statistics & Programme Implementation has been registered under GeM portal for the procurement of products and services which are available under GeM. The procurement of products & services have been fully operational and indentors, consignees, DDOs have been nominated for procurement of items available under GeM.
12.19 E-office project:- The Ministry had set target date of 31st March 2017 for implementation of E-office project in the Ministry. However due to shifting the offices of the Ministry to various locations, the DARPG (the nodal Ministry for E-Governance) was requested for extending the target date for implementing e-office project by 31st December 2017. For implementation of E-office project, the Ministry has setup E-office Help desk with manpower support from NICSI. The Digitization agency hired by the Ministry for scanning of physical files. All efforts are being made for timely implementation of E-office project.

117
Annexure-IA
DDG (PI)
NSO
MOS(IC)
MINISTRY OF STATISTICS & PROGRAMME IMPLEMENTATION ORGANISATION CHART
CSI & SECRETARY
AS
CONTROLLER
OF
ACCOUNTS
AS &FA
DIRECTOR
FINANCE
DG, NSSO
DG,ES PI WING
JS (ADMN)
ADMN.
-
DG, SS

118
Annexure-IB
NATIONALSTATISTICAL COMMISSION
CHAIRMAN
DIRECTOR
Member 1 Member 2 CSI and Ex-Officio Secretary to NSC
Member 4 Ex-Officio Member (Secretary, Planning Commission)
Member 3
NSC NATIONAL STATISTICAL CO MMISSION
CSI CHIEF STATISTICIAN OF INDIA
MINISTRY OF STATISTICS & PROGRAMME IMPLEMENTATION
ORGANISTION CHART -
DDG (NSC SECRETERIAT)

119
AS&FA ADDITIONAL SECRETARY & FINANCIAL ADVISER ASI ANNUAL SURVEY OF INDUSTRIES ASTT.DIR ASSISTANT DIRECTOR CSI CHIEF STATISTIAN OF INDIA CSO CENTRAL STATISTICAL OFFICE CPD COORDINATION & PUBLICATION DIVISION C&A COORDINATION & AMINISTRATION CORD. COORDINATION DG& CEO DIRECTOR GENERAL & CHIEF EXECUTIVE OFFICER DIR DIRECTOR DDG DEPUTY DIRECTOR GENERAL DO DESK OFFICER DPD DATA PROCESSING DIVISION DS DEPUTY SECRETARY DY.SECY. DEPUTY SECRETARY DY.ADV DEPUTY ADVISER DY.C.A. DEPUTY CONTROLLER OF ACCOUNTS DY. DIR DEPUTY DIRECTOR DY.F.A. DEPUTY FINANCIAL ADVISER ESD ENVIRONMENT STATISTICS DIVISION FOD FIELD OPERATIONS DIVISION HOD HEAD OF DEPARTMENT HOO HEAD OF OFFICE JT. ADV JOINT ADVISER JT. DIR. JOINT DIRECTOR JCM JOINT CONSULTATIVE MACHINERY JD JOINT DIRECTOR ICT INTERNATIONAL COORDINATION & TRAINING IPMD INFRASTRUCTURE AND PROJECT MONITORING DIVISION ISD INDUSTRIAL STATISTICS DIVISION ISI INDIAN STATISTICAL INSTITUTE ISS INDIAN STATISTICAL SERVICE IS WING INDIAN STATISTICAL WING IWSU INTERNAL WORK STUDY UNIT MDG MILLENNIUM DEVELOPMENT GOALS MPLADS MEMBER OF PARLIAMENT LOCAL AREA
DEVELOPMENT SCHEME NAD NATIONAL ACCOUNTS DIVISION NCMP NATIONAL COMMON MINIMUM PROGRA MME NSC NATIONAL STATISTICAL COMMISSION NSSO NATIONAL SAMPLE SURVEY OFFICE OL OFFICIAL LANGUAGE O & M ORGANISATION & METHOD PAO PAY & ACCOUNTS OFFICE PCL PRICE & COST OF LIVING PG PUBLIC GRIENVANCES R&P RESEARCH & PUBLICATION RTI RIGHT TO INFORMATION SC/ST SCHEDULED CASTE/TRIBE SDRD SURVEY DESIGN AND RESEARCH DIVISION SSD SOCIAL STATISTICS DIVISION TPP TWENTY POINT PROGRAMME TRG. TRAINING US UNDER SECRETARY SSS SUBORDINATE STATISTICAL OFFICER
ABBRVIATIONS USED
Annexure -IC

120
Annexure –IIAllocation of Business to the Ministry of Statistics and Programme
ImplementationI STATISTICS WING1. Acts as the nodal agency for planning integrated development of the
statistical system in the country.
2. Coordination of statistical work with a view to identify gaps in data availability or duplication of statistical work in respect of Departments of the Government of India and the State Statistical Bureaus (SSBs) and to suggest necessary remedial measures.
3. Laying down and maintenance of norms and standards in the field of statistics, evolving concepts, definitions and methodology of data collection, processing of data and dissemination of results.
4. Advising the Departments of the Government of India on statistical methodology and on statistical analysis of data.
5. Preparation of National Accounts as well as publication of Annual Estimates of National Income, Gross/ Net Domestic Product, Government and private final consumption expenditure, capital formation, savings, capital stock and consumption fixed capital, quarterly estimates of Gross Domestic Product, preparation of National Input-Output Transactions Table, State level estimates of Domestic Product and fixed capital formation of supra-regional sectors, preparation of comparable estimates of State Domestic Product (SDP) at current prices.
6. Compilation and release of the Index of Industrial Production (IIP) every month in the form of Quick Estimates, conducting Annual Survey of Industries (ASI) and providing statistical information, to assess and evaluate the changes in the growth, composition and structure of the organised manufacturing (factories) sector.
7. Development of Environment Statistics, development of methodology, concepts and preparation of National Resource Accounts for India.
8. Organisation and conduct of periodic All India Economic Census and follow-up sample surveys.
9. Conducting nation-wide sample surveys on various socio-economic aspects, such as, employment, consumer expenditure, housing conditions, debt and investment, land and livestock holdings, literacy, education, health, family welfare, un-organised manufacturing and services etc, to provide the database needed for development, research, policy formulation and economic planning.
10. Conducting quality checks and auditing of statistical surveys and data sets through technical scrutiny and sample checks and generate

121
correction factors and alternative estimates, if required.
11. Undertaking the processing of survey data collected through various socio-economic surveys and follow up surveys of Economic Census and Annual Survey of Industries by the National Sample Survey Organisation and the Central Statistical Organisation.
12. Dissemination of statistical information through a number of regular or adhoc publications to Government, semi-Government or private data users/agencies and dissemination of data, on request, to United Nations Agencies like United Nations Statistics Division, Economic and Social Commission for Asia and the Pacific, International Labour Organisation and other relevant international agencies.
13. Giving grants-in-aid to registered non-governmental organisations and research institutions of repute for undertaking special studies or surveys, printing of statistical reports and finance seminars, workshops or conferences relating to different subject areas of official statistics.
14. Functioning as the Cadre Controlling Authority and dealing with all aspects of managing the Indian Statistical Service including all matters pertaining to training, career planning and manpower planning.
15. The Indian Statistical Institute and ensuring its functioning in accordance with the provisions of the Indian Statistical Institute Act, 1959 (57 of 1959).
16. Compilation and release of monthly Consumer Price Index Numbers for Urban Non-Manual Employees.
17. Undertaking methodological studies and pilot surveys for evolving better sampling techniques and estimation procedures including small area estimates.
II PROGRAMME IMPLEMENTATION WING18. Monitoring of Twenty Point Programme.
19. Monitoring of projects of `150 crores and above.
20. Monitoring of the performance of Infrastructure Sector.
21. Member of Parliament Local Area Development Scheme (MPLADS).
22. Coordination and policy issues relating to National Common Minimum Programme excluding sectoral policies allocated to other Ministries / Departments.

122
Annexure III
Project, Seminar/Conference/Workshop and Travel Grant Assistance sanctioned during 2016-17.
S. No.
Name of the Organisation/
BeneficiaryEvent
Amount Sanctioned
(in `)1 University of Lucknow,
Lucknow, UPInternational Conference on Statistics and Related Areas for Equity, Sustainability and Development during 28th – 30th November 2015
5,00,000/-
2 Indian Association for Productivity, Quality and Reliability (IAPQR), Kolkata
Conference for Statistics for National Development and Indian Statistical System during 09th – 10thOctober 2015
75,500/-
3 Indian Development Foundation, Gurgaon
Indian Database and their uses 2,99,850/-
4 Kerala Statistical Institute, (KSI), Trivandrum
A multi-dimensional approach for examining the validity of poverty estimates of Kerala
1,69,575/-
5 Gandhigram Rural Institute, Tamil Nadu
Determinants of women’s empowerment and its impact on Standard of Living
3,22,505/-
6 Council for Social D e v e l o p m e n t , Hyderabad
Valuation of Health Cost of the people affected from Mahanadi Coal field Limited, Angul, Orissa- A cost of illness approach
1,08,675/-
Note: During the year 2017-18 (upto 30th November, 2017), total 18 eligible proposals seeking financial assistance for conducting research study/organizing seminar/workshops/conferences and for Travel Grant Assistance have been received which are under process.

123
Annexure-IV-A
Statement of Budget Estimate (SBE) –Annual Plan 2017-18
Ministry/Department: Ministry of Statistics and Programme Implementation
(`. Crore)
Sl.No Scheme
Annual Plan 2017-18 (BE) OutlayEarmarkedfor NorthEast 2017-18 BE
GBS IEBR Total
1 2 3 4 5 6
(A) Central Sector Schemes (CS)
1 Capacity Development168.28
0.00168.28 16.80
2 Grants-in-Aid to Indian Statistical Institute, Kolkata
282.15 0.00 282.15 8.00
Total (A) 451.43 0.00 451.43 24.80
(B) Block Grants
1 Members of Parliament Local Area Development Scheme
3950.00 3950.00 0.00

124
Annexure-IV-B
A. Total Plan Gross Budgetary Support (GBS) for 2016-17 (BE and RE) for North-Eastern Region.
` in lakh
Name of Plan SchemeProvision for NE during 2016-17
NE States RemarksBE RE Actual
Expenditure
1 2 3 4 5 6
1. Capacity Development (Total)
1400.00 1400.00 1183.19
(a) Capacity Development (Capacity Development of NSSO - Grant-in-aid to the states for carrying out central NSS sample work in NER region)
900.00 900.00 683.19
AP 251.46
Manipur 173.27
Mizoram 50.07
Sikkim 30.90
Tripura 177.49
(b) Support for Statistical Strengthening
500.00 500.00 500.00
Manipur
Sikkim 100.00
Megh
Mizoram 400.00
Nagaland
2. Grant-in-aid to ISI, Kolkata (*)
1600.00 1600.00 950.00 950.00
GRAND TOTAL 3000.00 3000.00 2183.19 (*) State wise details not received

125
Annexure-IV-C
Total Plan Gross Budgetary Support (GBS) for 2017-18 (BE and RE) for North-Eastern Region.
` in lakh
Name of Plan Scheme
Provision for NE during 2017-18
NE States ExpenditureBE RE
Actual Expenditure
1 2 3 4 5 6
1. Capacity Development (Total)
1680.00 1680.00 782.28
(a)Capacity Development (Capacity Development of NSSO - Grant-in-aid to the states for carrying out central NSS sample work in NER region)
1480.00 1480.00 606.53
AP 222.55
Manipur 153.34
Mizoram 46.23
Sikkim 27.33
Tripura 157.08
(b) Support for Statistical Strengthening
200.00 200.00 175.75
Manipur -
Sikkim 100.00
Megh -
Mizoram 75.75
Nagaland -
2. Grant-in-aid to ISI, Kolkata (*)
800.00 200.00
GRAND TOTAL 2480.00 1880.00 782.28
(*) State wise details not receivedActual Expenditure figures are upto December 2017.

126
Annexure-V
Performance of Monthly Monitored Items under Twenty Point Programme – 2006 during the period April 2016 to March 2017
S.No Item Name Units
Targets Achievements Percent
Achievements w.r.t the targets
April 2016 - March 2017
April 2016 - March
2017
1 2 3 4 5 6
Employment genenrated under MGNREGS
1 No. of job cards issued 000 Number @ 9560.590 -
2 Employment generated 000 Mandays @ 2097352.617 -
3 Wages given Lakh Rupees @ 3950587.487 -
National Rural Livelihoods Mission (NRLM)
4 Number of SHGs promoted (New and Revived) during the financial year Number 425993 507098 119
5 Number of SHGs provided Revolving Fund (RF) during the financial year Number 235387 226674 96
6 Number of SHGs provided Community Investment Fund (CIF) during the financial year Number 125520 149151 119
Distribution of Wasteland to Landless
7 Land Distributed Hectares @ 37961 -
Minimum Wages Enforcement (Including Farm Labour)
8 No. of Inspections made Number @ 105546 -
9 No. of Irregularities detected Number @ 4344 -
10 No. of Irregularities rectified Number @ 8929 -
11 No. of Claims filed Number @ 1629 -
12 No. of Claims settled Number @ 1384 -
13 No. of Prosecution cases pending Number @ 8897 -
14 No. of Prosecution cases filed Number @ 1046 -
15 No. of Prosecution cases decided Number @ 616 -
Food Security : Targeted Public Distribution System (TPDS)
16 Food Security: TPDS (APL+BPL+AAY) Tonnes 54332254 52102912 96
17 Food Security: TPDS (BPL) Tonnes 978059 1092743 112
18 Food Security: TPDS (AAY) Tonnes 609083 705798 116
Food Security: National Food Security Act (NFSA)
19 Food Security under NFSA - Normal Tonnes 49528873 47170543 95
20 Food Security under NFSA - Tide Over Tonnes 1814689 1746340 96
Rural Housing - Indira Awaas Yojana (IAY)
21 No. of Houses constructed Number 4360996 2779473 64
EWS/LIG Houses Constructed in Urban Areas
22 No. of Houses constructed Number 238024 139897 59
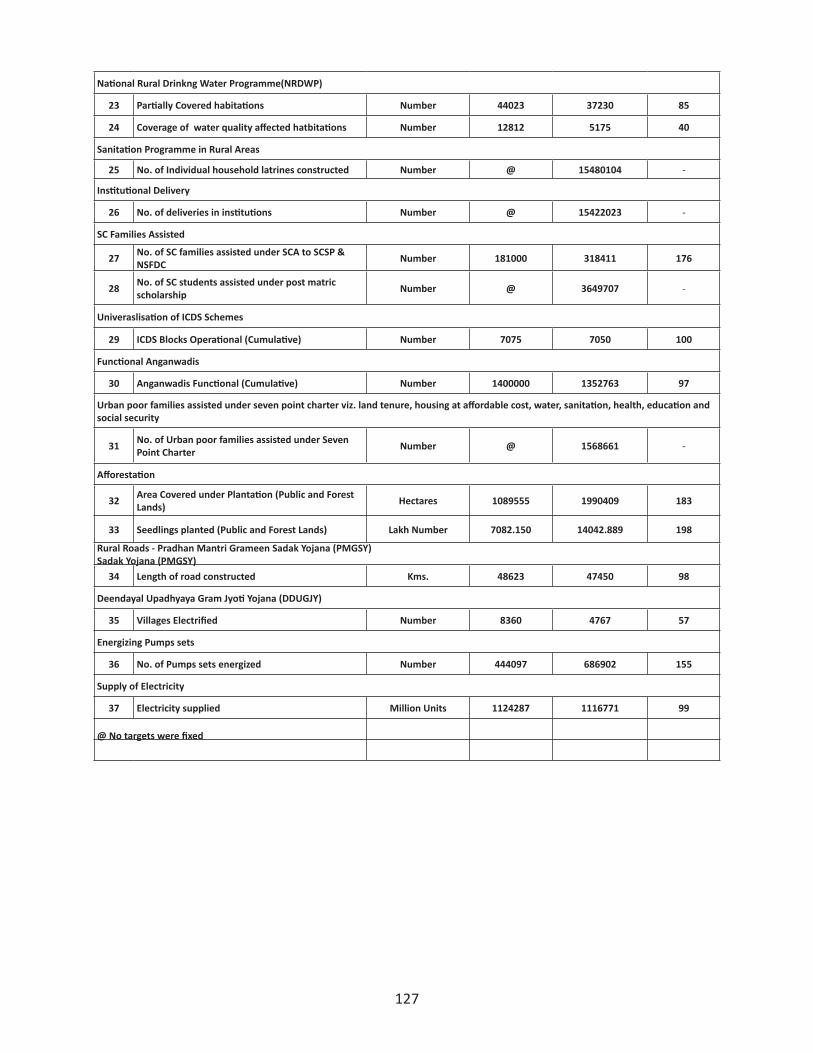
127
National Rural Drinkng Water Programme(NRDWP)
23 Partially Covered habitations Number 44023 37230 85
24 Coverage of water quality affected hatbitations Number 12812 5175 40
Sanitation Programme in Rural Areas
25 No. of Individual household latrines constructed Number @ 15480104 -
Institutional Delivery
26 No. of deliveries in institutions Number @ 15422023 -
SC Families Assisted
27 No. of SC families assisted under SCA to SCSP & NSFDC Number 181000 318411 176
28 No. of SC students assisted under post matric scholarship Number @ 3649707 -
Univeraslisation of ICDS Schemes
29 ICDS Blocks Operational (Cumulative) Number 7075 7050 100
Functional Anganwadis
30 Anganwadis Functional (Cumulative) Number 1400000 1352763 97
Urban poor families assisted under seven point charter viz. land tenure, housing at affordable cost, water, sanitation, health, education and social security
31 No. of Urban poor families assisted under Seven Point Charter Number @ 1568661 -
Afforestation
32 Area Covered under Plantation (Public and Forest Lands) Hectares 1089555 1990409 183
33 Seedlings planted (Public and Forest Lands) Lakh Number 7082.150 14042.889 198
Rural Roads - Pradhan Mantri Grameen Sadak Yojana (PMGSY) Sadak Yojana (PMGSY)
34 Length of road constructed Kms. 48623 47450 98
Deendayal Upadhyaya Gram Jyoti Yojana (DDUGJY)
35 Villages Electrified Number 8360 4767 57
Energizing Pumps sets
36 No. of Pumps sets energized Number 444097 686902 155
Supply of Electricity
37 Electricity supplied Million Units 1124287 1116771 99
@ No targets were fixed

128
Annexure-VI
Performance of Monthly Monitored Items under Twenty Point Programme – 2006 during the period April 2017 to June 2017
S.No Item Name Units
Targets Achievements Percent Achievements
w.r.t. the targets
April 2017 - June 2017
April 2017 - June 2017
1 2 3 4 5 6Employment genenrated under MGNREGS
1 No. of job cards issued 000 Number @ 53,610 -2 Employment generated 000 Mandays @ 75,507,821 -3 Wages given Lakh Rupees @ 1,335,273 -
National Rural Livelihoods Mission (NRLM)
4Number of SHGs promoted (New and Revived) during the financial year Number 172,980 73,995 43
5Number of SHGs provided Revolving Fund (RF) during the financial year Number 112,552 26,604 24
6Number of SHGs provided Community Investment Fund (CIF) during the financial year
Number 68,995 13,656 20
Distribution of Wasteland to Landless7 Land Distributed Hectares @ 985 -
Minimum Wages Enforcement (Including Farm Labour)8 No. of Inspections made Number @ 57,391 -9 No. of Irregularities detected Number @ 1,786 -
10 No. of Irregularities rectified Number @ 484 -11 No. of Claims filed Number @ 192 -12 No. of Claims settled Number @ 165 -13 No. of Prosecution cases pending Number @ 3,962 -14 No. of Prosecution cases filed Number @ 184 -15 No. of Prosecution cases decided Number @ 153 -
Food Security : Targeted Public Distribution System (TPDS)16 Food Security: TPDS (APL+BPL+AAY) Tonnes 13,786,402 13,879,974 101
Food Security: National Food Security Act (NFSA)
17 Food Security under NFSA - Normal Tonnes 13,089,187 13,200,370 10118 Food Security under NFSA - Tide Over Tonnes 697,215 679,604 97
Rural Housing - Pradhan Mnatri Awaas Yojana - Grameen (PMAY-G)
19 No. of Houses constructed Number 807,561 183,678 23EWS/LIG Houses Constructed in Urban Areas
20 No. of Houses constructed Number 59,512 60,705 102
National Rural Drinkng Water Programme(NRDWP)
21 Partially Covered Habitations Number 11,008 3,063 28
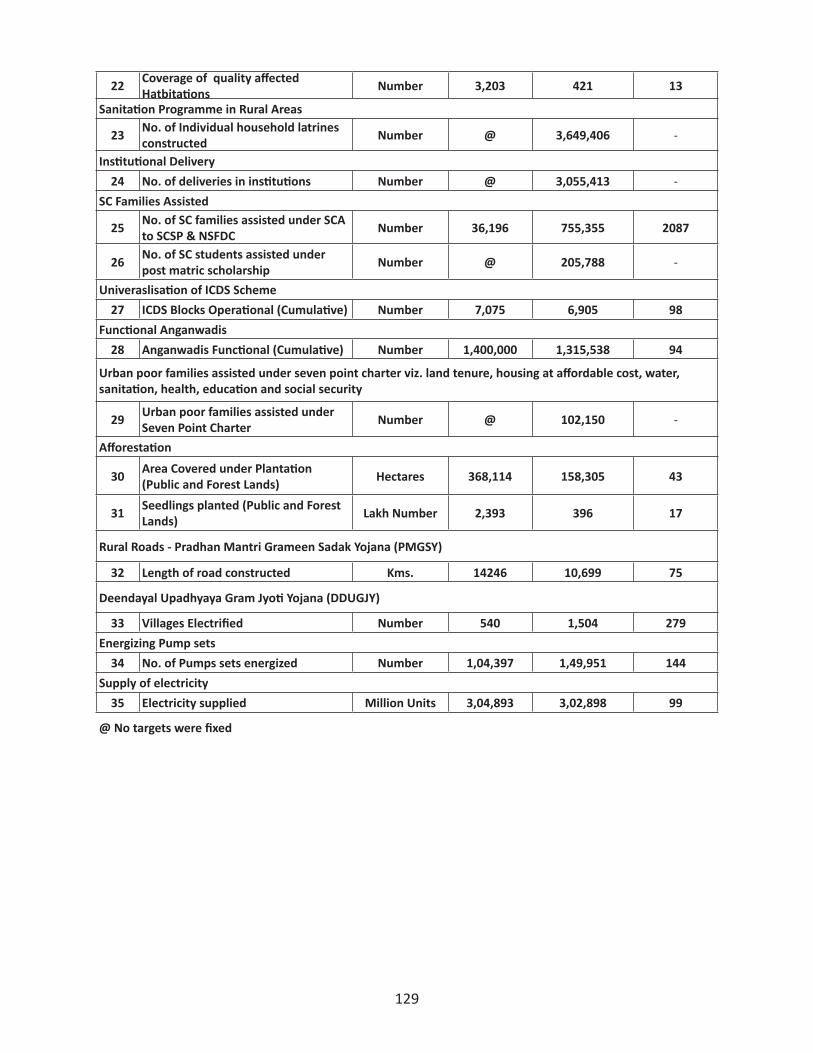
129
22 Coverage of quality affected Hatbitations Number 3,203 421 13
Sanitation Programme in Rural Areas
23 No. of Individual household latrines constructed Number @ 3,649,406 -
Institutional Delivery24 No. of deliveries in institutions Number @ 3,055,413 -
SC Families Assisted
25 No. of SC families assisted under SCA to SCSP & NSFDC Number 36,196 755,355 2087
26 No. of SC students assisted under post matric scholarship Number @ 205,788 -
Univeraslisation of ICDS Scheme27 ICDS Blocks Operational (Cumulative) Number 7,075 6,905 98
Functional Anganwadis28 Anganwadis Functional (Cumulative) Number 1,400,000 1,315,538 94
Urban poor families assisted under seven point charter viz. land tenure, housing at affordable cost, water, sanitation, health, education and social security
29 Urban poor families assisted under Seven Point Charter Number @ 102,150 -
Afforestation
30 Area Covered under Plantation (Public and Forest Lands) Hectares 368,114 158,305 43
31 Seedlings planted (Public and Forest Lands) Lakh Number 2,393 396 17
Rural Roads - Pradhan Mantri Grameen Sadak Yojana (PMGSY)
32 Length of road constructed Kms. 14246 10,699 75
Deendayal Upadhyaya Gram Jyoti Yojana (DDUGJY)
33 Villages Electrified Number 540 1,504 279Energizing Pump sets
34 No. of Pumps sets energized Number 1,04,397 1,49,951 144Supply of electricity
35 Electricity supplied Million Units 3,04,893 3,02,898 99
@ No targets were fixed
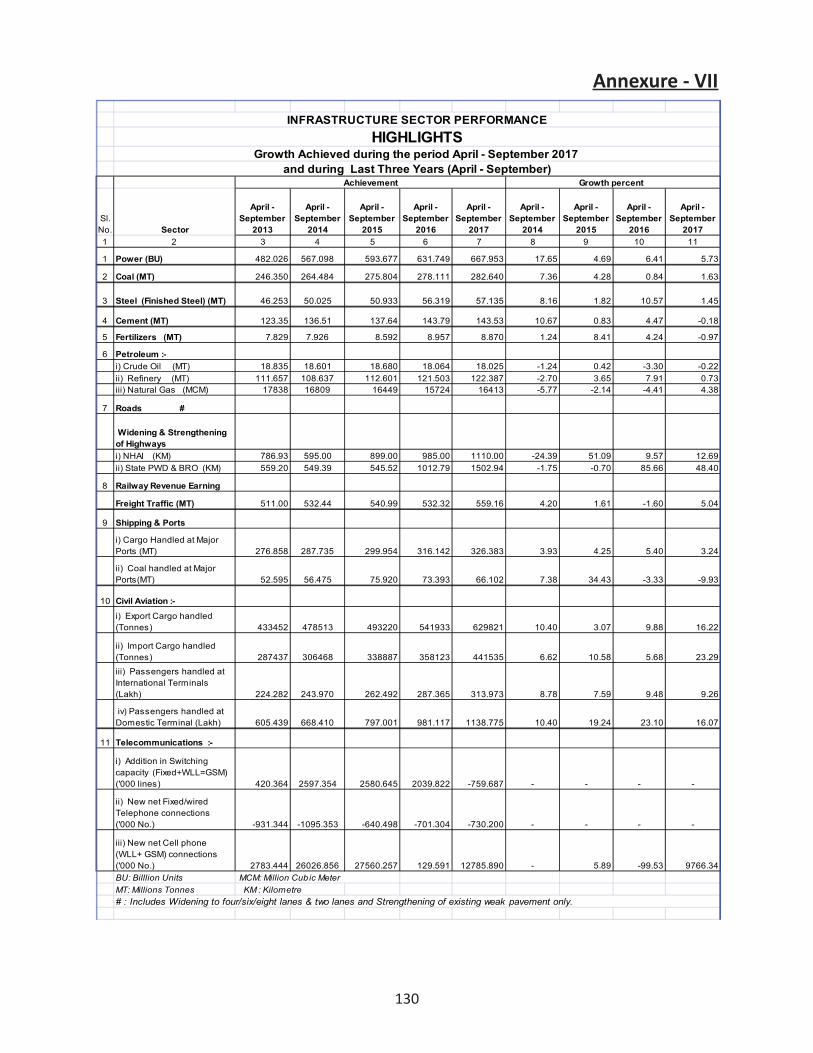
130
Annexure - VII
Sl.No. Sector
April - September
2013
April - September
2014
April - September
2015
April - September
2016
April - September
2017
April - September
2014
April -September
2015
April -September
2016
April - September
20171 2 3 4 5 6 7 8 9 10 11
1 Power (BU) 482.026 567.098 593.677 631.749 667.953 17.65 4.69 6.41 5.73
2 Coal (MT) 246.350 264.484 275.804 278.111 282.640 7.36 4.28 0.84 1.6319.64
3 Steel (Finished Steel) (MT) 46.253 50.025 50.933 56.319 57.135 8.16 1.82 10.57 1.45#DIV/0!
4 Cement (MT) 123.35 136.51 137.64 143.79 143.53 10.67 0.83 4.47 -0.18
5 Fertilizers (MT) 7.829 7.926 8.592 8.957 8.870 1.24 8.41 4.24 -0.97
6 Petroleum :-i) Crude Oil (MT) 18.835 18.601 18.680 18.064 18.025 -1.24 0.42 -3.30 -0.22ii) Refinery (MT) 111.657 108.637 112.601 121.503 122.387 -2.70 3.65 7.91 0.73iii) Natural Gas (MCM) 17838 16809 16449 15724 16413 -5.77 -2.14 -4.41 4.38
7 Roads #
Widening & Strengthening of Highways i) NHAI (KM) 786.93 595.00 899.00 985.00 1110.00 -24.39 51.09 9.57 12.69ii) State PWD & BRO (KM) 559.20 549.39 545.52 1012.79 1502.94 -1.75 -0.70 85.66 48.40
8 Railway Revenue Earning
Freight Traffic (MT) 511.00 532.44 540.99 532.32 559.16 4.20 1.61 -1.60 5.04
9 Shipping & Ports
i) Cargo Handled at Major Ports (MT) 276.858 287.735 299.954 316.142 326.383 3.93 4.25 5.40 3.24
ii) Coal handled at Major Ports(MT) 52.595 56.475 75.920 73.393 66.102 7.38 34.43 -3.33 -9.93
10 Civil Aviation :-
i) Export Cargo handled (Tonnes) 433452 478513 493220 541933 629821 10.40 3.07 9.88 16.22
ii) Import Cargo handled (Tonnes) 287437 306468 338887 358123 441535 6.62 10.58 5.68 23.29
iii) Passengers handled at International Terminals (Lakh) 224.282 243.970 262.492 287.365 313.973 8.78 7.59 9.48 9.26
iv) Passengers handled at Domestic Terminal (Lakh) 605.439 668.410 797.001 981.117 1138.775 10.40 19.24 23.10 16.07
11 Telecommunications :-
i) Addition in Switching capacity (Fixed+WLL=GSM) ('000 lines) 420.364 2597.354 2580.645 2039.822 -759.687 - - - -
ii) New net Fixed/wired Telephone connections ('000 No.) -931.344 -1095.353 -640.498 -701.304 -730.200 - - - -
iii) New net Cell phone (WLL+ GSM) connections ('000 No.) 2783.444 26026.856 27560.257 129.591 12785.890 - 5.89 -99.53 9766.34BU: Billlion UnitsMT: Millions Tonnes KM : Kilometre# : Includes Widening to four/six/eight lanes & two lanes and Strengthening of existing weak pavement only.
MCM: Million Cubic Meter
INFRASTRUCTURE SECTOR PERFORMANCE
and during Last Three Years (April - September)Achievement Growth percent
HIGHLIGHTSGrowth Achieved during the period April - September 2017
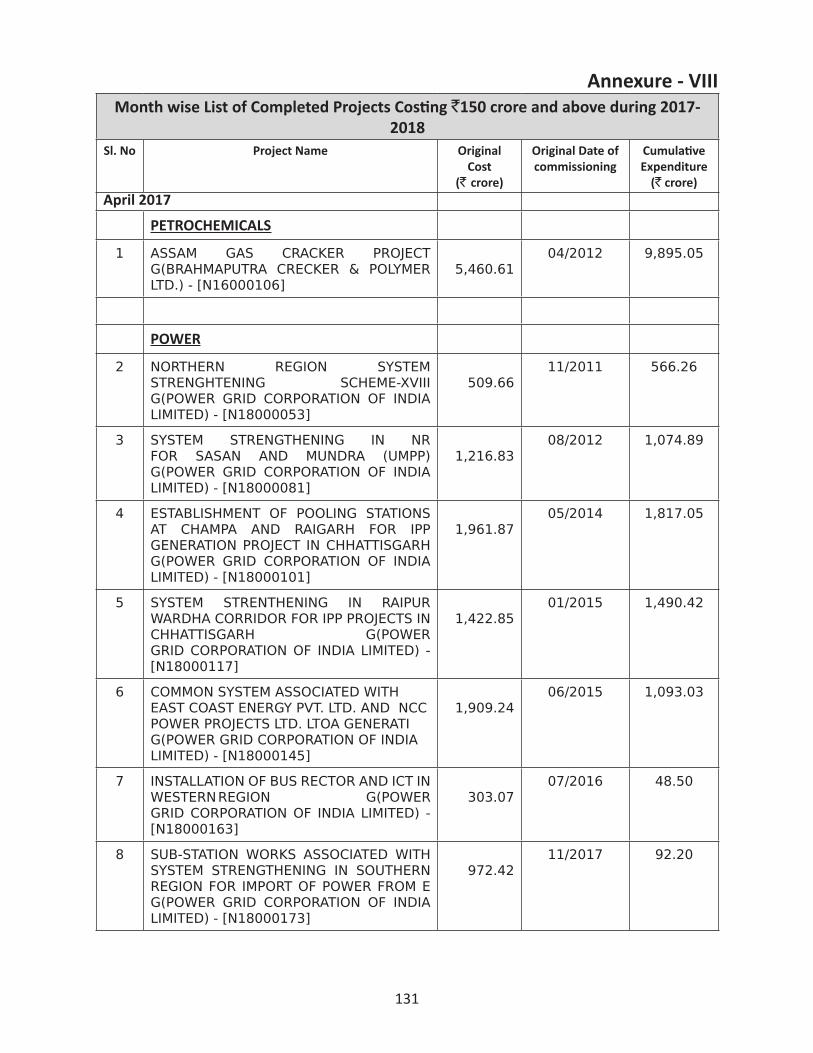
131
Annexure - VIIIMonth wise List of Completed Projects Costing `150 crore and above during 2017-
2018Sl. No Project Name Original
Cost(` crore)
Original Date of commissioning
Cumulative Expenditure
(` crore)April 2017
PETROCHEMICALS
1 ASSAM GAS CRACKER PROJECT G(BRAHMAPUTRA CRECKER & POLYMER LTD.) - [N16000106]
5,460.61
04/2012 9,895.05
POWER
2 NORTHERN REGION SYSTEM STRENGHTENING SCHEME-XVIII G(POWER GRID CORPORATION OF INDIA LIMITED) - [N18000053]
509.66
11/2011 566.26
3 SYSTEM STRENGTHENING IN NR FOR SASAN AND MUNDRA (UMPP) G(POWER GRID CORPORATION OF INDIA LIMITED) - [N18000081]
1,216.83
08/2012 1,074.89
4 ESTABLISHMENT OF POOLING STATIONS AT CHAMPA AND RAIGARH FOR IPP GENERATION PROJECT IN CHHATTISGARH G(POWER GRID CORPORATION OF INDIA LIMITED) - [N18000101]
1,961.87
05/2014 1,817.05
5 SYSTEM STRENTHENING IN RAIPUR WARDHA CORRIDOR FOR IPP PROJECTS IN CHHATTISGARH G(POWER GRID CORPORATION OF INDIA LIMITED) - [N18000117]
1,422.85
01/2015 1,490.42
6 COMMON SYSTEM ASSOCIATED WITH EAST COAST ENERGY PVT. LTD. AND NCC POWER PROJECTS LTD. LTOA GENERATI G(POWER GRID CORPORATION OF INDIA LIMITED) - [N18000145]
1,909.24
06/2015 1,093.03
7 INSTALLATION OF BUS RECTOR AND ICT IN WESTERN REGION G(POWER GRID CORPORATION OF INDIA LIMITED) - [N18000163]
303.07
07/2016 48.50
8 SUB-STATION WORKS ASSOCIATED WITH SYSTEM STRENGTHENING IN SOUTHERN REGION FOR IMPORT OF POWER FROM E G(POWER GRID CORPORATION OF INDIA LIMITED) - [N18000173]
972.42
11/2017 92.20

132
Month wise List of Completed Projects Costing `150 crore and above during 2017-2018
Sl. No Project Name Original Cost
(` crore)
Original Date of commissioning
Cumulative Expenditure
(` crore)
May2017
CIVIL AVIATION
9 SUPPLY OF 56 NOS AIRFIELD FIRE TENDERS AT VARIOUS AIRPORTS G(AIRPORT AUTHORITY OF INDIA LIMITED) - [N04000071]
217.60
03/2015 196.94
June 2017
STEEL
10 SMS-1 CONVERTERS REVAMPING G(RASTRIYA ISPAT NIGAM LIMITED) - [N12000090]
404.16
07/2015 394.74
POWER
11 TRANSMISSION SYSTEM ASSOCIATED WITH KAKRAPAR ATOMIC POWER PROJECT - 3 AND 4 G(POWER GRID CORPORATION OF INDIA LIMITED) - [N18000166]
378.71
10/2016 257.90
12 TRANSMISSION SYSTEM ASSOCIATED WITH LARA STPS-I (2X800) GEN. PROJECT OF NTPC G(POWER GRID CORPORATION OF INDIA LIMITED) - [N18000167]
400.47
04/2017 265.20
13 TRANSMISSION SYSTEM ASSOCIATED WITH DARLIPALLI TPS G(POWER GRID CORPORATION OF INDIA LIMITED) - [N18000211]
187.04
06/2018 54.60
July 2017
14 NORTHERN REGION SYSTEM STRENGHENING SCHEME XVI G(POWER GRID CORPORATION OF INDIA LIMITED) - [N18000094]
752.64
07/2013 633.62
15 WARDHA-HYDERABAD 765 KV LINK G(POWER GRID CORPORATION OF INDIA LIMITED) - [N18000183]
3,662.02
05/2018 2,302.40

133
Month wise List of Completed Projects Costing `150 crore and above during 2017-2018
Sl. No Project Name Original Cost
(` crore)
Original Date of commissioning
Cumulative Expenditure
(` crore)
August,2017
16 TRANSMISSION SYSTEM ASSOCIATED WITH MAUDA STAGE-II G(POWER GRID CORPORATION OF INDIA LIMITED) - [N18000153]
1,575.30
05/2016 1,328.51
September 2017
ATOMIC ENERGY
17 KUDANKULAM APP (NPCIL) G(NUCLEAR POWER CORPORATION OF INDIA LIMITED) - [020100040]
13,171.00
12/2008 22,340.00
CIVIL AVIATION
18 CONSTRUCTION OF NEW INTERNATIONAL TERMINAL BUILDING(GOA) G(AIRPORT AUTHORITY OF INDIA LIMITED) - [N04000069]
335.61
05/2012 305.59
PETROLEUM
19 DE-BOTTLENECKING OF SMPL G(INDIAN OIL CORPORATION LIMITED) - [N16000089]
1,584.00
03/2017 1,355.45
20 INTEGRATED REFINERY EXPANSION PROJECT G(BHARAT PETROLEUM CORPORATION LIMITED) - [N16000143]
16,504.00
03/2017 15,090.99
21 MANGALORE HASSAN MYSORE SOLUR LPG PIPELINE (MHMSLPL) G(HINDUSTAN PETROLEUM CORPORATION LIMITED) - [N16000146]
666.00
11/2015 606.13
22 AUGMENTATION OF PARADIP HALDIA BARAUNI PIPELINE G(INDIAN OIL CORPORATION LIMITED) - [N16000149]
586.00
08/2015 440.20
23 MARKETING TOP AT KORBA G(INDIAN OIL CORPORATION LIMITED) - [N16000186]
141.86
09/2016 174.37

134
Month wise List of Completed Projects Costing `150 crore and above during 2017-2018
Sl. No Project Name Original Cost
(` crore)
Original Date of commissioning
Cumulative Expenditure
(` crore)
24 INSTALLATION OF DIESEL HYDROTREATMENT UNIT (DHT) AND ASSOCIATED FACILITIES G(BHARAT PETROLEUM CORPORATION LIMITED) - [N16000205]
1,714.00
06/2017 1,067.89
POWER
25 TRANSMISSION SYSTEM STRENGTHENING IN WESTERN PART OF WR FOR IPPS GENERATION PROJECTS IN CHATTISGARH G(POWER GRID CORPORATION OF INDIA LIMITED) - [N18000112]
2,127.51
07/2014 2,582.69
26 WR-NR HVDC INTERCONNECTOR FOR IPP PROJECTS IN CHHATTISGARH G(POWER GRID CORPORATION OF INDIA LIMITED) - [N18000125]
9,569.76
06/2015 7,311.17
27 KBUNL-MUZAFFARPUR TPP STAGE-II- SUBSIDIARY (2X195 MW) G(NATIONAL THERMAL POWER CORPORATION) - [N18000191]
3,984.03
01/2013 3,290.44

135
Annexure IX
List of publications being brought out by various Divisions of CSO/NSSO & PI. Wing
A. Twenty Point Programme Division
Sl. No.
Publications Periodicity Month/Year
1 Annual Report on Twenty Point Programme-2006
Yearly 2015-16
2 Quarterly Progress Report on Twenty Point Programme-2006
Quarterly Four Progress Reports(2016-17)
B. I. National Sample Survey Office
NSS Report No. 580 based on 72nd round
Domestic Tourism in India
KI document based on NSS 73rd round
Key Indicators of Unincorporated, Non-agricultural Enterprises (Excluding Construction).
II. Sarvekshana• The 102nd and 103rd issue of ‘Sarvekshana’ was published and also
uploaded on the website of the Ministry.
III. A Manual covering all methodological aspects on Pooling Central and State sample data has been released.
IV. RPC Bulletin (Prices and wages in Rural India) for the quarters January -March 2017, April –June 2017 and July-September 2017 were released respectively during June, September and October 2017.
C. List of Publications of SSD in 2017-18 (Released upto 30th November 2017)
1 Women and Men in India
Annual February 2017
Gender disaggregated data on various socio-economic aspects including health, education, participation in economy, decision making, social obstacles on women empowerment etc
2 Compendium of Environment Statistics- India
Annual M a r c h 2017
Environment statistics covering the areas of bio-diversity, atmosphere, land& soil, water and human settlement

136
3 Achieving Millennium Development Goals Target Year Factsheet – India
Adhoc A u g u s t 2017
The booklet provides Goal wise achievements under the MDGs on Target Year.
4 Millennium Development Goals- Final India Country Report
As per data
updation
O c t o b e r 2017
Goal wise progress under the MDGs and details of programmes and policies addressing the MDGs.
5 SAARC Development Goals- India Country Report
Biennial O c t o b e r 2017
Achievements made on SAARC development goals by presenting data on mutually agreed and some additional indicators for 22 goals
6 Disabled Persons in India- A Statistical Profile
Adhoc J a n u a r y 2017
Data on actual counts of disabled persons, their educational status, employment status and marital status etc. along with State / UT wise comparison
7 Youth in India Adhoc M a r c h 2017
Vital and Socio-economic Statistics of youth in India covering a wide range of subjects.
8 Selected Socio-Economic Statistics India
Adhoc O c t o b e r 2017
Vital and Socio-economic Statistics of India covering a wide range of subjects
D. Research and Publication Unit
The Research and Publication Unit regularly brings out the following publications:
1. Statistical Year Book, India-Annual
2. India in Figures, A Ready Reference-Annual
E. National Account Division
S.No. Description of the publication/ data release/ report
Date of release Manner of release
First Advance Estimates of national Income, 2017-18
6-1-2017 Press Note

137
First Revised Estimates of National Income, Consumption Expenditure, Saving and Capital Formation
31-01-2017 Press Note
Second Advance Estimates of national Income, 2017-18 and Quarterly Estimates of Gross Domestic Product For the Third Quarter (Oct-Dec), 2016-17
28-02-2017 Press Note
Provisional Estimates of Annual National Income 2016-17 and Quarterly Estimates of Gross Domestic Product (GDP) for the Fourth Quarter (Q4) of 2016-17
31-05-2017 Press Note
State-wise and Item-Wise Estimates Of Value Of Output From Agriculture And Allied Sectors With New Base Year 2011-2012 (2011-12 To 2014-15), 2017
September2017 e-Publication
National Accounts Statistics - 2017 October 2017 e-Publication
Estimates of Gross Domestic Product for the First Quarter (April-June) Of 2017-18
31-08-2017 Press Note
Estimates of Gross Domestic Product for the Second Quarter (July-September) Of 2017-18
30-11-2017 Press Note

138
Annexure-X
POSITION OF ACTION TAKEN NOTE (ATN) FOR THE YEAR 2016-17
S. No
YearNo. of Paras /PA reports on which ATNs have been
submitted to PAC after vetting by Audit
Details of the Paras/PA reports on which ATNs are pending
No. of ATNs not sent by the Ministry even for the first time
No. of ATNs sent but returned with observations and Audit is awaiting their resubmission by the Ministry
No. of ATNs which have been finally vetted by audit but have not been submitted by the Ministry to PAC.
1
C & A G ’ s Performance Audit No.31 (civil) of 2010-11 on MPLADS
NoneFirst ATN submitted on 20th Dec,2011 and second ATN on 16th May 2012 and Third ATN on 24th July 2014 (In the ATNs complete replies on 46 paras and part replies on 13 paras have been submitted).
Nil Nil
2
PAC report No.55 (15th Lok Sabha) on MPLADS
Vetted comments against all 33 paras has been submitted
ATN on all the 33 paras was submitted on 13th
September 2013
ATN on all the 33 paras were submitted to PAC. Ministry was asked to submit ATNs on 03 additional points.
Comments of MoSPI vetted by DG, Audit in respect of all the 33 Paras were sent to PAC Branch on 13th September and ATNs on additional points were also sent to PAC on 20th April2015.
3
C&AG report No.18 of 2015 ATN on all 2 paras yet to be submitted
Nil
Two draft ATNs uploaded thrice on APMS portal in 5/4/2016, 10/2/2017 and 19/4/2017.
Office of the Principal Director of Audit Central, Kolkata had vetted the 2 ATNs and as per their suggestion ATNs incorporating the vetted comments have been sent to Monitoring cell, Ministry of Finance on 17th April 2017
Nil