annual report 2016 - taikisha-group.com · 2012/3 2013/3 2014/3 2015/3 2016/3 4,372 8,325 9,815...
TRANSCRIPT

Annual Report 2016APR. 2015 - MAR. 2016

Corporate Philosophy : Manage ment Objectives1. Establish a company which can continuously grow
and contribute to the society:
1) We strive to grow continuously by enhancing our added values; thereby, bringing prosperity to our customers and business partners as well as to our employees.
2) We strive to create rich environment and evolve the industrial society through our engineering expertise that meets the needs of the society, in order to achieve our ultimate objective to contribute to the society.
Sales & Overseas Sales Ratio Operating Income & Net Income Basic Earning per Share & Dividends per Share ROE ROAOperating Income Net Income Basic Earning per Share Dividends per ShareSales Overseas Sales Ratio
194,000
51.5
2017/3(Estimate)
189,716
216,051
185,421 183,648
212,424
51.3
57.4
61.6
55.2 55.5
2012/3 2013/3 2014/3 2015/3 2016/3 2017/3(Estimate)
2017/3(Estimate)
11,100
6,900
2012/3 2013/3 2014/3 2015/3 2016/3
4,372
8,325
9,815
8,0838,669
12,734
6,200
4,155
6,0847,084
199.03
2012/3 2013/3 2014/3 2015/3
35.0
119.52
170.99
116.08
172.64
50.0 45.052.0
70.0
2016/3
204.35
67.0
6.6
8.7
5.3
6.9
7.6
3.0
2.5
3.4
3.73.9
2012/3 2013/3 2014/3 2015/3 2016/3 2012/3 2013/3 2014/3 2015/3 2016/3
(Millions of yen, %) (Millions of yen) (¥) (%) (%)
Financial Highlights
Philosophy and Vision
Cautionary statement regarding forward-looking statements : Data and forward-looking statements disclosed herein are based on current information available at the time of publication, and may change depending upon various factors. The data and judgments do not guarantee accomplishment of goals and projections, and may be changed at any time without notice. Consequently, we ask you to use this information at your discretion based upon your own judgment and information you may obtain through other sources. Taikisha Ltd. will not be responsible for any damages that result from the use of this information.
Mission Statement “Customers First”Customers are defined as Overall Society in a broad sense. Spirit of “Customers first”
is to win persistent trust from the customer.
To achieve this goal, we have to follow our own conscience and make the utmost
efforts in every doing based on the belief that the behavior of individuals or the
company will bring benefit and happiness to one's counterpart.

Corporate Philosophy : Manage ment Objectives2. Establish an attractive company:
1) We aim to be a motivation-oriented company where the employees can demonstrate creativity and vitality through their work responsibilities.
2) We aim to be a company having the corporate culture in which all employees work in close cooperation to achieve the goals of the company, with the spirits of mutual trust, collaboration and rationality.
3) Through the expansion of our expertise in “Energy, Air, and Water”, we aim to become a unique company in all aspects of corporate management, including engineering, marketing, and human resource development.
C O N T E N T S
Sales & Overseas Sales Ratio Operating Income & Net Income Basic Earning per Share & Dividends per Share ROE ROAOperating Income Net Income Basic Earning per Share Dividends per ShareSales Overseas Sales Ratio
194,000
51.5
2017/3(Estimate)
189,716
216,051
185,421 183,648
212,424
51.3
57.4
61.6
55.2 55.5
2012/3 2013/3 2014/3 2015/3 2016/3 2017/3(Estimate)
2017/3(Estimate)
11,100
6,900
2012/3 2013/3 2014/3 2015/3 2016/3
4,372
8,325
9,815
8,0838,669
12,734
6,200
4,155
6,0847,084
199.03
2012/3 2013/3 2014/3 2015/3
35.0
119.52
170.99
116.08
172.64
50.0 45.052.0
70.0
2016/3
204.35
67.0
6.6
8.7
5.3
6.9
7.6
3.0
2.5
3.4
3.73.9
2012/3 2013/3 2014/3 2015/3 2016/3 2012/3 2013/3 2014/3 2015/3 2016/3
(Millions of yen, %) (Millions of yen) (¥) (%) (%)
Financial Sections
Corporate Data
4
2
Corporate SocialResponsibility 12
14
46
8
10
To Our Stakeholders
Green TechnologySystem Division
Paint FinishingSystem Division
Review of Operations
Interview withthe President
Ogasawara (japan)
To Our Stakeholders
2 Taikisha Ltd. Annual Report 2016
We aim to grow perpetually by promoting the Mid-Term Business Plan.
First of all, I'd like to describe the business environment surrounding us and our business results in the fiscal year ended March 31, 2016. For the Green Technology System Division, active investment in construction was seen in Japan as in the fiscal year ended March 31, 2015, due to the execution of urban redevelopment projects and robust demand for offices by companies with improved business performance, thus creating favorable conditions for the building HVAC business sector. For the industrial HVAC business sector, there was an increase in capital investment by manufacturing companies in Japan in part due to the effects of the weaker yen. As for overseas markets, because China's economic growth slowed down, companies in other Asian countries engaged in the export of products to China refrained from making active capital investment. For the Paint Finishing System Division, business conditions were favorable in the United States, where automobile sales were strong and investment in equipment and facilities increased. However, the Division was faced with the harsh business environment in Brazil and Russia, where economic decline resulted from falling resource prices, causing the postponement of new factory construction plans. Under these circumstances, our consolidated business results recorded ¥221,700 million in orders received as compared to our initial forecast of ¥215,000 million, and registered ¥212,400 million in net sales as compared to our initial forecast of ¥205,000 million. Thus, the actual results exceeded our initial forecasts. Our profitability improved due to the policy focused on obtaining profitable orders, proposal of VE at the sites, reduction of procurement costs, and others. As a result, operating income totaled ¥12,734 million as compared to our initial forecast of ¥9,700 million, and ordinary income amounted to ¥12,343 million as compared to our initial forecast of ¥10,600 million. Profit attributable to owners of parent registered ¥7,084 million as compared to our initial forecast of ¥5,700 million. All these results exceeded our initial forecasts and recorded the highest profit figures. Next, I will describe our business forecasts for the fiscal year ending March 31, 2017. The market conditions in Japan are expected to improve steadily. Overseas, capital investment is anticipated to expand in the Paint Finishing System Business in the United States and India. However, there is a possibility that growing concerns for economic uncertainties in Japan and other countries may discourage capital investment decisions. Our target figures are premised on the currency exchange rates of ¥108 per US dollar, ¥122 per euro, and ¥3.06 per Thai Baht. These rates indicate the appreciation of the yen by 10% or more as compared to the average rates of ¥121 per US dollar, ¥134.65 per euro, and ¥3.54 per Thai Bhat prevailing in the fiscal year ended March 31, 2016. Under such circumstances, the forecast figures for the fiscal year ending March 31, 2017 are lower than the figures registered in the previous fiscal year, reflecting the large impacts of the differences in the currency exchange rates. For the fiscal year ending March 31, 2018 and thereafter, we will strive to expand business in steps by steadily promoting the new Mid-Term Business Plan. Guided by our Mission Statement, "Customers First," the Taikisha Group will further develop and expand business on a global scale while continuing to contribute to the protection of the global environment by deploying its environmental technologies associated with "energy, air, and water." In these efforts, we look forward to your understanding of our management policies and seek your continued support and guidance.
Satoru KamiyamaPresident and Representative Director

3Taikisha Ltd. Annual Report 2016

Interview with the President
4 Taikisha Ltd. Annual Report 2016
What are the particular background factors and issues you paid heed to when formulating the new Mid-Term Business Plan?
The first is response to the risk resulting from a possible decrease in investment by our customers due to the changing market environment. In Japan, capital investment is expected to be on an upward trend. However, if economic prospects become uncertain due to the stronger yen, reduced demand in emerging markets, or other factors, the private sector may cut back their investment. Overseas markets are also faced with a risk of declining investment by customers. For the Green Technology System Business, the volume of products exported from Southeast Asia to China decreased due to the economic slowdown in China, and this could curtail capital investment in the region. In the Paint Finishing System Business, on the other hand, we can expect an increase in investment in equipment and facilities in the United States and India. However, investment plans in Russia and Brazil may be postponed due to the economic downturn brought about by falling resource prices and other factors.
In view of these circumstances, our new Mid-Term Business Plan aims to expand sales and maintain stable profitability. To those ends, the Plan calls for the following initiatives: • Preferential allocation of management resources to markets and
business areas with growth potential • Productivity improvement and cost optimization • Expansion of business domains We will execute these initiatives with concerted efforts in order to overcome the challenging business conditions. The second is response to social demand for corporate governance. We will continue to enhance the management supervisory function of the Board of Directors in line with the Corporate Governance Code. At the same time, we will promote constructive discussions with all stakeholders including shareholders and strive to practice management with the focus on improving capital efficiency. Guided by our Mission Statement, "Customers First," we will steadily carry out the Mid-Term Business Plan in order to maintain sustainable growth of our company and respond to your expectations.

5Taikisha Ltd. Annual Report 2016
Please describe the basic policy of the new Mid-Term Business Plan and numerical targets.
The newly announced Mid-Term Business Plan focuses on two basic policies. The first is to respond to the changing social needs and market environment in a flexible and timely manner and achieve steady and sustainable development. In accordance with this policy, we will establish the corporate governance system which is adapted to the further globalization of our business. Furthermore, we will place our emphasis on growing markets and business field and allocate management resources strategically. The second policy is to be highly trusted and evaluated by all stakeholders.
Next, I will describe our business forecasts for the fiscal year ending March 31, 2017. In the Japanese market, we anticipate steady growth of demand. As for overseas markets, capital investment by the Paint Finishing System Business is expected to increase in the United States and India. However, rising concerns for economic uncertainties both in Japan and abroad may discourage the private sector from making active capital investment. Our target figures are premised on the currency exchange rates of ¥108 per US dollar, ¥122 per euro, and ¥3.06 per Thai Baht. These rates indicate the appreciation of the yen by 10% or more as compared to the average
Specifically, we focus on the following four areas.1) We will meet customers' expectations and ensure their confidence
from our customers by providing optimal “technology”, “service” and “cost”.
2) We will contribute to conservation of the global environment and improvement of the environmental value of our customers with the environment related business.
3) We will cultivate the corporate culture, in which diverse employees play an active role and strengthen human resource development.
4) We will engage in dialogue with stakeholders and make an effort to improve the capital efficiency.
Based on the above basic policies, each division and headquarters plans and implements concrete initiatives.
rates of ¥121 per US dollar, ¥134.65 per euro, and ¥3.54 per Thai Bhat prevailing in the fiscal year ended March 31, 2016. Under such circumstances, the forecast figures for the fiscal year ending March 31, 2017 are lower than the figures registered in the previous fiscal year, reflecting the large impacts of the differences in the currency exchange rates. For the fiscal year ending March 31, 2018 and thereafter, we will strive to expand business in steps by steadily promoting the new Mid-Term Business Plan.
(in billion yen)
FY March 2016 FY March 2017 (Target) FY March 2018 (Target) FY March 2019(Target)
Orders received 221.7 200.2 208.5 213.0
Sales 212.4 194.0 202.5 208.1
Operating income 12.7 11.1 11.6 12.3
Ordinary income 12.3 11.8 12.3 13.0
Profit attributable to owners of parent 7.0 6.9 7.1 7.5
(Exchange rate: 1US$ = 108JPY, 1Euro = 122JPY, 1Baht = 3.06JPY)
Business results for the fiscal year ending March 31, 2016 and targets specified in the new Mid-Term Business Plan

Interview with the President
6 Taikisha Ltd. Annual Report 2016
Overseas construction markets continue to lack strength, while the appreciating yen can create negative impacts on the Japanese market. How will you change the management policies in the future in order to respond to the changing conditions in the Japanese and overseas markets?
For the Green Technology System Division, technological advancement in electronic parts and increased demand for pharmaceutical products are anticipated to spur companies in those fields to invest in the industrial HVAC business sector, although there is a concern that the effects of the appreciating yen may affect the capital investment decisions of many companies and result in negative impacts on this business sector. For the building HVAC business sector, on the other hand, redevelopment projects in the Metropolitan area are expected to increase the investment for the construction of new office buildings. In the long term, we anticipate that demand for renovation of HVAC systems in existing buildings will rise in percentage. For the future, by keeping an eye on the fields and markets with potential for investment growth, we will respond promptly to demand increases and allocate management resources strategically, and also actively conduct proposal-intensive marketing activities for maintenance/renovation projects that are expected to increase in number. Overseas, we will strengthen our sales and construction organizational structures in an
effort to respond to the needs of not only local Japanese companies but also non-Japanese companies. For the Paint Finishing System Division, active investment is expected in the United States and India, where automobile sales are increasing steadily, to bring favorable effects for the automotive paint business sector, although investment plans may be postponed in Russia and Brazil due to the economic downturn brought about by falling resource prices and other factors. For the future, we will preferentially allocate management resources to markets with growth potential and create an organizational structure capable of responding more efficiently. In addition, we will strengthen the collaboration with our overseas group companies for aggressively increasing orders from non-Japanese automakers and energetically expanding into peripheral business domains, such as painting systems for other than automobiles, such as for aircraft, and conveyor systems.
Consolidated Orders Received Consolidated Sales
2017/3Forecast
2017/3Forecast
200,200
97,90048.9%
102,30051.1%
2015/3 2016/3
187,311
221,764
93,94050.2%
101,33645.7%
93,37149.8%
120,42854.3%
194,000
94,10048.5%
99,90051.5%
2015/3 2016/3
183,648212,424
82,30444.8%
94,54344.5%
101,34455.2%
117,88155.5%
(Millions of yen) Domestic (Millions of yen)
0
50,000
100,000
150,000
200,000
250,000
0
50,000
100,000
150,000
200,000
250,000
Overseas Domestic Overseas

7Taikisha Ltd. Annual Report 2016
Dividends paid out in �scal year ended March 31, 2016: ¥67 per share
0
1,500
3,000
4,500
6,000
7,500
2017/3Forecast
2013/3 2014/3 2015/3 2016/3 2017/3Forecast
(Millions of yen) (Yen)
0
20
40
60
806,9006,200
4,155
6,084
2013/3 2014/3 2015/3 2016/3
7,084 70
5045
52
67
5
45
100th Anniversary commemorative dividend
Profit attributable to owners of parent Dividends per Share
What is your policy on shareholders returns?
We consider the return of profits to our shareholders through dividends as one of our most important responsibilities. We have raised the consolidated dividend payout ratio from the previous 30% to 35% and maintain stable dividend payouts as we always have.
The total dividends for the fiscal year ending March 31, 2017 will be ¥70 per share. We will acquire treasury stock flexibly as we deem fit for the purposes of improving our capital efficiency and realizing flexible financial policies.

Review of Operations
8 Taikisha Ltd. Annual Report 2016
Green Technology System DivisionBusiness OverviewGreen Technology System Business mainly consists of an Industrial HVAC business (for clean rooms and other manufacturing facilities) and a Building HVAC business (for office buildings) those designs and constructs HVAC systems both in Japan and overseas.
Topics
In August 2015, Taikisha received an order for "Taiki Green Farm," a hydroponic cultivation plant factory system using only artificial lighting, from NOUMANN INC. (head office: Mihama-cho, Fukui Prefecture, Japan). The system is being installed in NOUMANN's plant factory, by the full-scale renovation of an idle facility, and it can produce vegetables stably under a completely chemical-free, clean environment, by using a high-efficiency reflection-type lighting system. The LED seedling system, which was initially developed and installed in GREENLAND factory of Kidaya Shoten (formally “Kidaya Corporation”) by our company, is able to increase the planting density in the seedling line by about three times. It was a common belief that high-density planting would result in uneven growth rates, but the matching effect of high-density planting and LED
lighting achieves uniform seedling growth and also increases the percentage of high-grade vegetables, thus significantly improving the efficiency in the usage of cultivation beds in the factory. Taikisha continues to utilize environmental technologies and actively work on plant factory projects inside and outside Japan with the aim of contributing to society.
LED Seedling System Installed in a Plant Factory Using Only Artificial Lighting

9Taikisha Ltd. Annual Report 2016
0
4,000
8,000
12,000
0
50,000
100,000
150,000
0
50,000
100,000
150,000
HVAC for buildings Industrial HVAC (Domestic) Industrial HVAC (Overseas) HVAC for buildings Industrial HVAC (Domestic) Industrial HVAC (Overseas) Ordinary Income
Ordinary Income by SegmentOrders Received by Segment Sales by Segment
132,706
45,138 42,798
27,078 38,295
53,842 44,896
126,058 125,989 134,822
51,695
27,294
36,455
40,150
35,157
40,827
115,444 116,134 8,950
4,4495,991
(Millions of yen) (Millions of yen) (Millions of yen) 2014/3 2015/3 2016/32014/3 2015/3 2016/32014/3 2015/3 2016/3
(Millions of yen) (Millions of yen) (Millions of yen) 2016/32016/32016/3
Ordinary Income
Ordinary Income by Segment
0
2,000
4,000
6,000
8,000
0
30,000
60,000
90,000
120,000
0
20,000
40,000
60,000
80,000
Domestic Overseas Domestic Overseas
Orders Received by Segment Sales by Segment
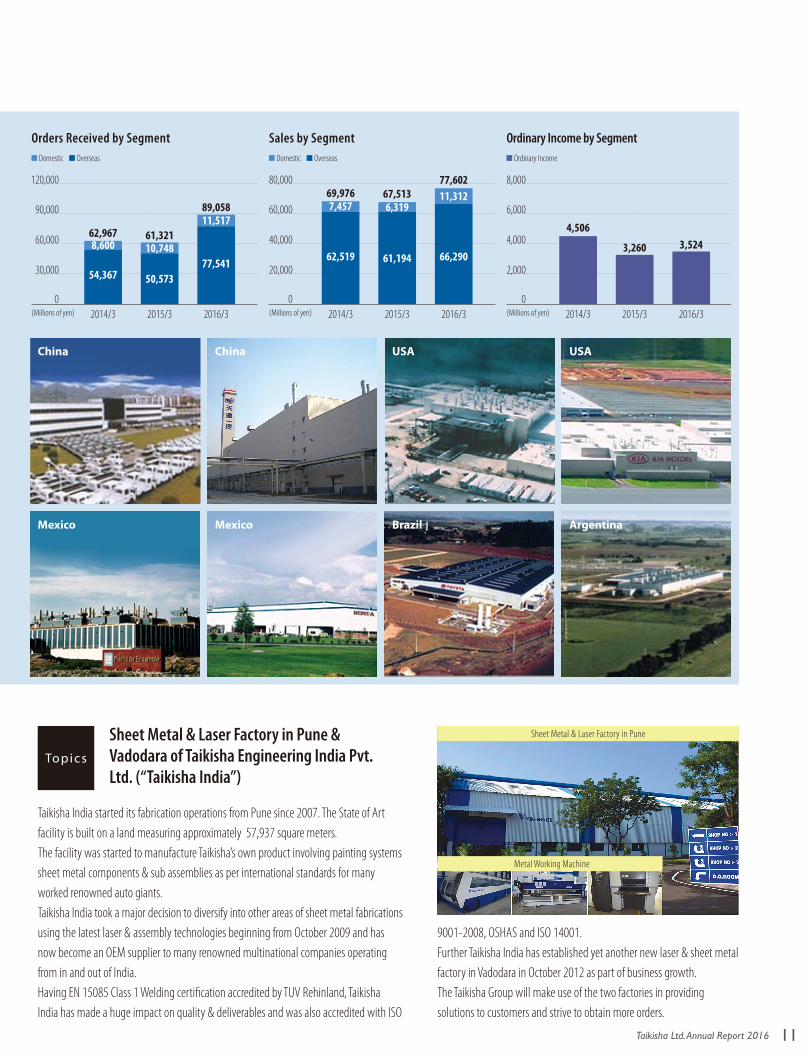
89,058
2014/3 2015/3
66,290
11,31277,602
2014/3 2015/3
62,519
7,457
61,194
6,31969,976 67,513
3,524
2014/3 2015/3
4,506
3,260
42,887
46,101
43,717
51,591
39,623
43,608
77,541
11,517
54,367 50,573
62,967 61,3218,600 10,748
School & Educational Facilities
Printing, Publishing & Paper Industries
Station & Airport FacilitiesThis photo is sponsored by The Airports of Thailand.
Pharmaceutical, Biotechnology & Food Industris
Commercial FacilitiesCultural & Recreational Facilities
Electrical & Electronic Devices / Precision Machinery Industries
Medical & Welfare Facilities
Topics
As reported frequently by news media, China's air pollution problem, including PM2.5 (particulate matter of 2.5 microns or less), is worsening, necessitating urgent environmental measures. The Chinese Government is revising laws and taxation systems and strengthening the penalties for violators, all with the aim of completely preserving the environment. The private sector is also making investments toward environmental protection at accelerated rates. Although the Chinese economy is sputtering, the environmental business is considered a growth sector, and investments are expected to increase continuously in this field. Taikisha has been contributing to the reduction of environmental load in China by utilizing its emissions treatment technology accumulated over many years. In anticipation of an increase in demand for VOC treatment system in the
future, Taikisha has established a local production system in China. Taikisha also hold technology exchange meetings with many regional environmental agencies and environmental protection industry associations to energetically promote our technology. These efforts have led to the increase of concrete business inquiries. Taikisha continues to help improve the environment in China and expand the business volume.* VOC stands for Volatile Organic Compound, and it refers to one of the substances that cause photochemical smog.
VOC Treatment System in China
Technology exchange meeting held in China
Regenerative Thermal Oxidizer

Review of Operations
10 Taikisha Ltd. Annual Report 2016
Paint Finishing System DivisionBusiness OverviewThe Paint Finishing System Business mainly consists of an automobile paint plant design and construction business, whose major customers are domestic and overseas automobile manufacturers. The business of the Company has one of the largest sales in this field globally.
Topics
It has been five years since the Company and Geico S.p.A. established a business and capital Alliance. Since then a new council called TCSC has been formed to set common strategies for Paint Finishing System Division in Globalization, R&D, M&A, Procurement and Manufacturing activities to reach the group’s common goal.The double digit compound average growth rate both in sales and profit of Geico group since its foundation in May 2011, enhances the Alliance between Taikisha and Geico into the future.The Company will continue to draw on the synergies created by the Alliance, in order to achieve further expansion of business.
Taikisha Coating Strategic Council (“TCSC”)
Board members of TCSC at Geico’s headquarters in Milan
11Taikisha Ltd. Annual Report 2016
0
4,000
8,000
12,000
0
50,000
100,000
150,000
0
50,000
100,000
150,000
HVAC for buildings Industrial HVAC (Domestic) Industrial HVAC (Overseas) HVAC for buildings Industrial HVAC (Domestic) Industrial HVAC (Overseas) Ordinary Income
Ordinary Income by SegmentOrders Received by Segment Sales by Segment
132,706
45,138 42,798
27,078 38,295
53,842 44,896
126,058 125,989 134,822
51,695
27,294
36,455
40,150
35,157
40,827
115,444 116,134 8,950
4,4495,991
(Millions of yen) (Millions of yen) (Millions of yen) 2014/3 2015/3 2016/32014/3 2015/3 2016/32014/3 2015/3 2016/3
(Millions of yen) (Millions of yen) (Millions of yen) 2016/32016/32016/3
Ordinary Income
Ordinary Income by Segment
0
2,000
4,000
6,000
8,000
0
30,000
60,000
90,000
120,000
0
20,000
40,000
60,000
80,000
Domestic Overseas Domestic Overseas
Orders Received by Segment Sales by Segment
89,058
2014/3 2015/3
66,290
11,31277,602
2014/3 2015/3
62,519
7,457
61,194
6,31969,976 67,513
3,524
2014/3 2015/3
4,506
3,260
42,887
46,101
43,717
51,591
39,623
43,608
77,541
11,517
54,367 50,573
62,967 61,3218,600 10,748
Topics
Taikisha India started its fabrication operations from Pune since 2007. The State of Art facility is built on a land measuring approximately 57,937 square meters. The facility was started to manufacture Taikisha’s own product involving painting systems sheet metal components & sub assemblies as per international standards for many worked renowned auto giants. Taikisha India took a major decision to diversify into other areas of sheet metal fabrications using the latest laser & assembly technologies beginning from October 2009 and has now become an OEM supplier to many renowned multinational companies operating from in and out of India. Having EN 15085 Class 1 Welding certification accredited by TUV Rehinland, Taikisha India has made a huge impact on quality & deliverables and was also accredited with ISO
9001-2008, OSHAS and ISO 14001. Further Taikisha India has established yet another new laser & sheet metal factory in Vadodara in October 2012 as part of business growth. The Taikisha Group will make use of the two factories in providing solutions to customers and strive to obtain more orders.
Sheet Metal & Laser Factory in Pune & Vadodara of Taikisha Engineering India Pvt. Ltd. (“Taikisha India”)
Argentina
China
Brazil
USAUSA
Mexico Mexico
China
Sheet Metal & Laser Factory in Pune
Metal Working Machine

Corporate Social Responsibility
12 Taikisha Ltd. Annual Report 2016
Environmentally Friendly Technologies
Environmental Protection Technologies in Coating Process - Low-temperature, low-humidity flash-off process
CSR InitiativesLinking of Mission Statement with StakeholdersThe spirit of “Customers First,” our mission statement, is to win persistent trust from the overall society.Based on this spirit, we respond quickly to changing social demands (in terms of the economy, the environment, and social value). We also contribute to all our stakeholders by establishing a management base that enables us to achieve sustainable corporate growth, as well as improving our corporate values and proactively addressing social issues.
Better customer satisfactionWe improve customer satisfaction and strive to improve our quality based on the quality policies set out by each division.
Relationship with our business partnersTaikisha broadly welcomes both domestic and overseas business partners with its motto “open and fair,” and operates fair business transactions.Also the Company occasionally provides information and engineering support to overseas companies if they are interested in exploring the Japanese market.
Involvement with employeesWe strive to make our company an inspiring and attractive one.
Involvement with shareholders and investorsWe disclose financial data and management information for our shareholders and investors as a company with a high level of integrity.
The Measure for EnvironmentTaikisha Group has decided to make the utmost effort to address critical global issues and global environmental conservation, has formulated its own environmental policy, and promotes a wide variety of environmental control activities.
Compliance InformationTaikisha conducts its operations in accordance with its corporate philosophy and Code of Conduct, observes all the laws and ordinances related to its business, and makes every effort to implement fair and sound business practices.In addition, we have installed a Corporate Compliance Committee, Corporate Compliance Department in order to remind all employees to observe the relevant laws and ordinances.
For global environment protection, many automakers now use water-based paint in order to reduce the volatile organic compound (VOC) emission from the automotive coating process. Water-based paint is applied to the vehicle body in three separate coating steps: intermediate coating process, top-coat base coating process, and top-coat clear coating process. A flash-off (intermediate drying) process is conducted after each coating process to prevent transfer of paint between coating layers. The flash-off process must not only heat and cool the vehicle body in the limited length of the process zone, but also remove the evaporated moisture from the equipment using a large volume of air flow. This
consumes a huge amount of energy. Taikisha has developed dehumidifying equipment jointly with a heat source equipment manufacturer in order to reduce the energy consumed by the flash-off process. Use of this equipment decreases the humidity in the flash-off process, thus enabling drying of the coated paint at lower heating temperatures than before. The installation of the equipment is expected to achieve a 20 to 40% reduction in energy consumption depending on conditions. Taikisha continues to develop and industrialize various environmental protection technologies at the aim of contributing to society through the betterment of the environment.

13Taikisha Ltd. Annual Report 2016
Report Cooperation
InternalAudit
Appointment / Dismissal
Appointment / Dismissal
Direction / Supervision
Submission / Report
Report
Report
Direction
Direction
Direction / Supervision
Report
Appointment / Dismissal / Supervision
Report
Submission / ReportAp
point
ment
/ Dis
missa
l
Audit
Audit
Advice
Report
Support / Guidance
Direction
Divisions and Headquarters Corporate Compliance Dept.
Taikisha Group
Policy Review Meeting
Corporate Compliance Committee
Risk Management Committee
Crisis Management Committee
Board of Directors10 Directors
(including 2 Outside Director)
Internal Audit O�ce
Shareholders’ Meeting
Lega
l Con
sulta
nt
Audit & Supervisory Board4 Audit & SupervisoryBoard Members(including 2 Outside Audit & Supervisory Board Members)
Accounting Auditors
ReportGuidance / Advice
Management Meeting6 Directors
President
Corporate GovernanceBasic policyThe Company has established a basic policy of corporate governance to gain the trust of all stakeholders and aim to become a corporate group that grows and develops in a healthy manner by thoroughly incorporating compliance awareness and realizing fair and highly transparent management, in order to achieve its corporate philosophy and management vision in accordance with the spirit of the Company’s Mission Statement: “Customers First”*. In conformity with the basic policy and based on the organizational structure
of a company with an audit & supervisory board, the Company is continuously working to strengthen the Taikisha Group’s governance and reform of management. It is doing this by taking measures such as reinforcing the supervisory function of the Board of Directors through the application of Non-Executive Directors (meaning Outside Directors and the Director & Chairman) and speeding up the decision making of the Board of Directors through the adoption of the corporate officer system, aiming to further enhance and reinforce corporate governance of Taikisha Group.* “Customers” is defined as Overall Society in a broad sense. The spirit of “Customers First” is to win persistent
trust from customers.Conceptual Diagram of Corporate Governance
Low-temperature, low-humidity flash-off process

Millions of yenThousands of U.S. dollars
Orders received: . Green Technology System Division Environmental facilities(building HVAC) Industrial facilities(industrial HVAC) Paint Finishing System Division
Sales: Green Technology System Division Environmental facilities(building HVAC) Industrial facilities(industrial HVAC) Paint Finishing System DivisionProfit attributable to owners of parentComprehensive income
Total assets Total net assetsEquity ratio (%)Return on equity (%)
Net income per shareCash dividends per shareNet assets per share
Orders received: Green Technology System Division Environmental facilities(building HVAC) Industrial facilities(industrial HVAC) Paint Finishing System Division
Sales: Green Technology System Division Environmental facilities(building HVAC) Industrial facilities(industrial HVAC) Paint Finishing System Division
Financial Sections
MANAGEMENT’S DISCUSSION AND ANALYSIS
2016
¥221,764
43,71788,98889,058
¥212,424
43,60891,21477,602
7,0841,063
¥189,56695,921
48.07.6
¥204.3567.00
2,633.60
¥111,793
41,61146,41623,765
¥107,269
41,42039,96825,880
2016
$1,967,917
387,945789,676790,296
$1,885,037
386,979809,425688,633
62,8669,437
$1,682,196851,198
48.07.6
$1.810.59
23.37
$992,042
369,255411,893210,894
$951,903
367,562354,678229,663
2014
¥189,026
53,84272,21662,967
¥185,421
36,45578,98969,976
4,15510,852
¥166,68084,712
48.35.3
¥116.0845.00
2,282.56
¥104,576
51,47727,47825,620
¥86,200
34,53228,04123,626
2015
¥187,311
44,89681,09361,321
¥183,648
40,82775,30767,513
6,08414,320
¥188,28399,669
50.46.9
¥172.6452.00
2,690.76
¥100,479
42,83238,48219,164
¥93,297
38,53035,38619,381
2013
¥195,920
37,48587,25171,184
¥216,051
46,57390,64178,837
6,20011,006
¥163,01478,537
46.28.7
¥170.9950.00
2,087.16
¥88,223
36,07531,81520,332
¥107,049
44,92932,77729,342
2012
¥195,268
33,26886,81775,182
¥189,716
42,23384,94362,540
4,3724,255
¥156,10869,602
42.96.6
¥119.5235.00
1,834.99
¥102,248
31,73638,30532,206
¥109,205
40,94745,09123,166
CONSOLIDATED
NON-CONSOLIDATED
FIVE-YEAR SUMMARY : Taikisha Ltd. and its Consolidated Subsidiaries for the years ended March 31, 2012 to 2016
Yen U.S. dollars
14 Taikisha Ltd. Annual Report 2016

2016
212,424Sales Overseas Sales Ratio
55.5
2012 2013 2014 2015
189,716216,051
185,421 183,648
51.357.4
61.655.2
69,60278,537 84,712
99,669 95,921
20162012 2013 2014 2015
20162012 2013 2014 2015
Net Income per Share Cash Dividends per Share
67.0
204.3
45.0 52.0
119.5
170.9
116.0
172.6
35.0 50.0
20162012 2013 2014 2015
7.6
6.6
8.7
5.3
6.9
20162012 2013 2014 2015
Operating Income Pro�t Attributable to Owners of Parent 12,734
7,084
9,815
6,2008,083
4,155
8,669
6,084
8,325
4,372
48.0
2016
42.9 46.2 48.3 50.4
2012 2013 2014 2015
189,566
20162012 2013 2014 2015
156,108 163,014 166,680188,283
20162012 2013 2014 2015
3.7
3.0
3.9
2.5
3.4
Sales & Overseas Sales Ratio ( Millions of yen, % ) Operating Income & Profit Attributable to Owners of Parent ( Millions of yen )
Total Net Assets ( Millions of yen ) Equity Ratio ( % )
Net Income per Share & Cash Dividends per Share ( Yen ) Total Assets ( Millions of yen )
ROE ( % ) ROA ( % )
15Taikisha Ltd. Annual Report 2016

Financial Sections
The results for the fiscal year ended March 31, 2016Earnings OverviewThe world economy for the fiscal year ended March 31, 2016 was as follows. U.S. economy basically expanded due to the strong consumer spending as seen in the record-high auto sales. Additionally, European economy showed the movement towards recovery due to the strong consumer spending as well. Meanwhile, economy of the emerging countries continued to show a stagnating trend mainly due to slowdown of the economic growth rate in China and downfall of resource prices. Japanese economy showed a gradual recovery supported by increase of capital investment due to improving corporate profitability and recovery of consumer spending due to the improvement of circumstances of employment and income. In this situation, consolidated orders received increased 18.4% year-on-year to ¥221,764 million, including overseas orders received of ¥120,428 million which increased 29.0% year-on-year. This is mainly due to orders received of large-scale projects of paint finishing system in the United States and China, as well as increase of capital investment of industrial HVAC in Japan. Consolidated sales increased 15.7% year-on-year to ¥212,424 million, including overseas sales of ¥117,881 million which increased 16.3% year-on-year. This is mainly due to increase in sales in Japan and Thailand. In regards to profits, since gross profit ratio increased 0.5% year-on-year because of increase of consolidated sales of ¥28,776 million year-on-year as well as focusing more on profitability in sales activities and cost reduction, gross profit on completed construction contracts increased ¥5,352 million year-on-year to ¥32,570 million, operating income increased ¥4,065 million year-on-year to ¥12,734 million, ordinary income increased ¥2,764 million year-on-year to ¥12,343 million, and profit attributable to owners of parent increased ¥1,000 million year-on-year to ¥7,084 million. Earnings by reportable segments (including intersegment transactions) are as follows.Green Technology SystemConsolidated orders received increased in industrial HVAC. Consolidated sales increased due to increase of volume of construction contracts compared to the previous year both in building HVAC and industrial HVAC. As a result, consolidated orders received increased 5.3% year-on-year to ¥132,706 million. The breakdown is orders received for building HVAC of ¥43,717 million which decreased 2.6% year-on-year and orders received for industrial HVAC
of ¥88,988 million which increased 9.7% year-on-year. Consolidated sales increased 16.1% year-on-year to ¥134,824 million. The breakdown is sales for building HVAC of ¥43,608 million which increased 6.8% year-on-year and sales for industrial HVAC of ¥91,216 million which increased 21.1% year-on-year. Ordinary income increased ¥2,959 million year-on-year to ¥8,950 million.Paint Finishing SystemConsolidated orders received increased mainly due to orders received of large-scale projects in the United States and China. Consolidated sales increased because volume of construction contracts increased compared to last year especially in Japan, the United States, and India. As a result, consolidated orders received increased 45.2% year-on-year to ¥89,058 million(record-high) and consolidated sales increased 15.0% year-on-year to ¥77,735 million. Ordinary income increased ¥264 million year-on-year to ¥3,524 million.
Financial ConditionAssetsAs of March 31, 2016, current assets increased 5.4% year-on-year to ¥148,690 million. This is mainly due to increase in notes receivable, accounts receivable from completed construction contracts and other of ¥14,111 million, despite decrease in securities of ¥4,487 million and costs on uncompleted construction contracts of ¥1,202 million. Non-current assets decreased 13.5% year-on-year to ¥40,876 million. This is mainly due to decrease in investment securities of ¥3,916 million and net defined benefit asset of ¥1,607 million. As a result, total assets increased 0.7% year-on-year to ¥189,566 million.LiabilitiesAs of March 31, 2016, current liabilities increased 7.0% year-on-year to ¥83,493 million. This is mainly due to increase in advances received on uncompleted construction contracts of ¥4,467 million and notes payable, accounts payable for construction contracts and other of ¥3,521 million, despite decrease in short-term loans payable of ¥4,631 million. Non-current liabilities decreased 3.8% year-on-year to ¥10,152 million. This is mainly due to decrease in deferred tax liabilities of ¥1,884 million, despite increase in long-term loans payable of ¥847 million. As a result, total liabilities increased 5.7% year-on-year to ¥93,645 million.
RESULTS OF OPERATIONS (OVERVIEW)
Equity ratio (%)Equity ratio on market value basis (%)Debt to cash flow ratio (%)Interest coverage ratio (Times)
20162014 20152013201248.049.592.138.5
48.347.385.630.8
50.456.0
750.46.3
46.247.149.257.5
42.939.7
287.77.9
Indicators of consolidated financial position are as follows:
Notes: 1. All indicators are calculated using consolidated formulas according to the standards below: *Equity ratio: Shareholders’ equity and Accumulated other comprehensive income/Total assets *Debt to cash flow ratio: Interest-bearing debt/Operating cash flow *Equity ratio on market value basis: Market capitalization/Total assets *Interest coverage ratio: Operating cash flow/Interest expenses 2. Market capitalization is calculated by multiplying the closing stock price on the balance sheet date by the number of outstanding shares (excluding treasury shares) at the balance sheet date. 3. For operating cash flow, Taikisha Group uses net cash provided by operating activities in the consolidated statements of cash flows. 4. Interest-bearing debt includes all debt recorded on the consolidated balance sheets on which Taikisha group pays interest. 5. For interest expenses, Taikisha Group uses the amount of interest expenses paid as shown on the consolidated statements of cash flows.
(Years ended March 31)
16 Taikisha Ltd. Annual Report 2016

Net assetsAs of March 31, 2016, total net assets decreased 3.8% year-on-year to ¥95,921 million. This is mainly due to decrease in valuation difference on available-for-sale securities of ¥2,668 million, foreign currency translation adjustment of ¥2,213 million, and accumulated remeasurements of defined benefit plans of ¥1,822 million, despite increase in retained earnings of ¥5,092 million and treasury shares of ¥2,208 million.
Cash flowCash and cash equivalents as of March 31, 2015 and 2016 were ¥40,505 million and ¥38,369 million respectively. Compared to the previous year, it decreased ¥2,135 million.Cash flows from operating activitiesCash provided by operating activities as of March 31, 2015 and 2016 were ¥1,401 million and ¥7,301 million respectively. Cash increased mainly due to recording income before income taxes and non-controlling interests, increase in notes and accounts payable-trade, and increase in advances received on uncompleted construction contracts, etc, despite cash decreased mainly due to increase in notes and accounts receivable - trade, etc.Cash flows from investing activitiesCash used in investing activities as of March 31, 2015 and 2016 were ¥3,900 million and ¥328 million respectively. Cash decreased mainly due to the excess of payments into time deposits over proceeds from withdrawal of time deposits and the excess of purchase of property, plant and equipment and intangible assets over proceeds from sales of property, plant and equipment and intangible assets, etc, though cash increased mainly due to the excess of proceeds from redemption of securities over purchase of securities, etc.Cash flows from financing activitiesCash provided by financing activities as of March 31, 2015 was ¥1,264 million, and cash used in financing activities as of March 31, 2016 was ¥7,409 million respectively. Cash decreased mainly due to net decrease in short-term loans payable, net increase in treasury shares, and payments of dividends, etc.
Business RisksRisk factors that investors should consider before making any decision concerning Taikisha Group are noted below. Forward-looking statements in this section are based on judgments made as of March 31, 2016.Changes in Private Capital InvestmentBecause of the economic situation changes, cancellation or postponement of clients' investment plans could affect Taikisha Group's business results.Overseas Business RiskUnforeseen changes in laws and regulations, political instability and other factors in overseas where Taikisha Group operates could affect business results. Taikisha Group makes forward foreign exchange contracts and other instruments to hedge currency risks as much as possible in the payments and collections for the foreign currency construction contracts. However, changes of exchange rate still could affect Taikisha Group's business results. In addition, exchange rate could affect Taikisha Group's business results because
the financial statements of overseas subsidiaries are translated into Japanese yen in preparing the consolidated financial statements.Construction Defect LiabilitiesTaikisha Group makes warranty contracts with customers guaranteeing construction against defects for fixed period of time after completion of construction. Taikisha Group allocates a provision for warranties for completed construction to cover repair costs based on previous warranty experience. However, these costs still could potentially exceed the balance of the provision.Accounts Receivable Collection RiskTaikisha Group manages customer credit. However, accounts receivable may become uncollectible due to factors such as customer insolvency, which could affect Taikisha Group's business results.Risk Regarding Severe Price CompetitionThe construction business is in highly competitive situation. This situation could affect Taikisha Group's business results due to the provision for loss on construction contracts.Changes in Material PricesSharp rises in material prices could affect Taikisha Group's business results if Taikisha Group is unable to reflect them to contract prices.Asset Possession RiskTaikisha Group owns real estates, securities and other assets. Changes in market value of these assets could affect Taikisha Group's business results.Risk Regarding Retirement Benefit PlanDownside of pension assets' market value, changes of rate of return or condition of discount rate, could affect Taikisha Group's business results.Disasters and AccidentsThe occurrence of unforeseen events such as natural disasters or accidents could affect Taikisha Group's business results. Taikisha Group maintains the crisis management system. However, if massive and widespread disaster happens, it could damage not only Taikisha Group's property and personnel, but also clients' operating activities and consequently economic condition. These situations, if continue for a long time, could affect Taikisha Group's business results.Legal RiskTaikisha Group is working in concert to ensure assiduous management of legal and regulatory compliance. However, any violation of laws or regulations by directors or employees of Taikisha Group could lead to bad results such as restriction on Taikisha Group's business activities, which could affect Taikisha Group's business results.
Subsidiaries and associatesTaikisha Group consists of Taikisha Ltd., 37 subsidiaries, and 3 associates. Taikisha Ltd. and 3 subsidiaries are domiciled in Japan, and 34 subsidiaries and 3 associates are domiciled overseas.
17Taikisha Ltd. Annual Report 2016

Current assets:
Cash and deposits (Notes 3, 7 and 9)
Notes receivable, accounts receivable from
completed construction contracts and other (Note 9)
Securities (Notes 7, 9 and 10)
Costs on uncompleted construction contracts (Note 3)
Raw materials and supplies
Deferred tax assets (Note 13)
Other
Allowance for doubtful accounts (Note 9)
Total current assets
Non-current assets:
Property, plant and equipment
Buildings and structures
Machinery, vehicles, tools, furniture and fixtures (Note 3)
Land
Other
Accumulated depreciation
Total property, plant and equipment
Intangible assets
Goodwill (Note 18)
Other
Total intangible assets
Investments and other assets
Investment securities (Notes 3, 9 and 10)
Deferred tax assets (Note 13)
Net defined benefit asset (Note 12)
Other
Allowance for doubtful accounts
Total investments and other assets
Total non-current asset
Total assets
2016
Thousands of U.S. dollars
20162015
Millions of yen
Financial Sections
CONSOLIDATED BALANCE SHEETS
$390,463
822,775
118
16,928
2,514
17,694
72,818
(3,844)
1,319,466
65,327
70,049
18,421
4,280
(89,303)
68,774
26,836
13,423
40,259
199,394
4,508
28,426
21,659
(290)
253,697
362,730
$1,682,196
¥44,001
92,718
13
1,907
283
1,993
8,205
(433)
148,690
7,361
7,893
2,075
482
(10,063)
7,750
3,024
1,512
4,536
22,469
508
3,203
2,440
(32)
28,589
40,876
¥189,566
¥43,819
78,607
4,500
3,109
332
1,625
9,573
(546)
141,022
7,352
7,838
2,109
551
(9,808)
8,043
3,481
1,165
4,647
26,385
464
4,810
3,047
(136)
34,571
47,261
¥188,283
Assets
Taikisha Ltd. and its Consolidated Subsidiaries : As of March 31, 2015 and 2016
The accompanying notes are an integral part of these financial statements.
18 Taikisha Ltd. Annual Report 2016

Current liabilities: Notes payable, accounts payable for construction contracts and other (Note 9) Short-term loans payable (Notes 9 and 21) Income taxes payable (Note 9) Deferred tax liabilities (Note 13) Advances received on uncompleted construction contracts Provision for warranties for completed construction Provision for loss on construction contracts (Note 3) Provision for directors' bonuses Provision for loss on Anti-Monopoly Act Reserve for loss on dissolution of employees' pension fund (Note 12) Other (Notes 9 and 21) Total current liabilitiesNon-current liabilities: Long-term loans payable (Notes 9 and 21) Deferred tax liabilities (Note 13) Provision for directors' retirement benefits Reserve for loss on dissolution of employees' pension fund (Note 12) Net defined benefit liability (Note 12) Other (Notes 9 and 21) Total non-current liabilities Total liabilitiesNet assets: Shareholders’ equity Capital stock Authorized: 100,000,000 shares Issued: 36,782,009 shares as of March 31, 2015 and 2016 Capital surplus Retained earnings Treasury shares, at cost — 1,538,406 shares as of March 31,2015 2,219,061 shares as of March 31,2016 Total shareholders’ equity Accumulated other comprehensive income Valuation difference on available-for-sale securities Deferred gains or losses on hedges (Note 11) Foreign currency translation adjustment Accumulated remeasurements of defined benefit plans Total accumulated other comprehensive income Non-controlling interests Total net assets
Total liabilities and net assets
Per share data : Net assets
Basis of calculation Total net assets Amounts to be deducted from net assets (Non-controlling interests) Net assets applicable to common shares Number of common shares as of the year-end (thousands)
2016
Thousands of U.S. dollars
20162015
Millions of yen
$436,721 46,688 18,149 477 141,143 11,945 1,688 1,149 – 2,193 80,757 740,910
12,274 52,105 948 – 14,613 10,148 90,088 830,998
$57,283 65,174 656,170 – (45,502) 733,125
70,183 70 13,565 (9,197) 74,621 43,452 851,198
$1,682,196
$23.37
$851,198 (43,453) 807,745 34,562
¥49,214 5,261 2,045 53 15,905 1,346 190 129 – 247 9,100 83,493
1,383 5,871 106 – 1,646 1,143 10,152 ¥93,645
¥6,455 7,344 73,943 – (5,127) 82,615
7,908 7 1,528 (1,036) 8,409 4,896 95,921
¥189,566
¥2,633.60
¥95,921 (4,896) 91,024 34,562
¥45,693 9,892 1,416 1 11,438 710 298 88 207 – 8,312 78,060
536 7,755 89 251 1,551 369 10,553 ¥88,614
¥6,455 7,344 68,851 (2,919) – 79,731
10,577 (5) 3,742 786 15,100 4,837 99,669
¥188,283
¥2,690.76
¥99,669 (4,837) 94,832 35,243
Liabilities and Net assets
The accompanying notes are an integral part of these financial statements.
U.S. dollarsYen
Millions of yen Thousands of U.S. dollars
19Taikisha Ltd. Annual Report 2016

Consolidated Statements of IncomeNet sales of completed construction contractsCost of sales of completed construction contracts (Note 4) Gross profit on completed construction contractsSelling, general and administrative expenses Directors' compensations Employees' salaries and allowances Provision for directors' bonuses Retirement benefit expenses (Note 12) Provision for directors' retirement benefits Correspondence and transportation expenses Provision of allowance for doubtful accounts Rents Depreciation Amortization of goodwill Other Total selling, general and administrative expenses (Note 4) Operating incomeNon-operating income Interest income Dividend income Dividend income of insurance Real estate rent Reversal of allowance for doubtful accounts Share of profit of entities accounted for using equity method Other Total non-operating incomeNon-operating expenses Interest expenses Sales discounts Rent expenses on real estates Foreign exchange losses Provision of allowance for doubtful accounts Other Total non-operating expenses Ordinary incomeExtraordinary income Gain on disposal of non-current assets (Note 4) Gain on sales of investment securities Gain on liquidation of subsidiaries and associates Reversal of provision for loss on Anti-Monopoly Act Reversal of reserve for loss on dissolution of employees' pension fund (Note 12) Surrender value of insurance Total extraordinary income Extraordinary losses Loss on disposal of non-current assets (Note 4) Impairment loss (Note 17) Loss on sales of investment securities Loss on valuation of investment securities Provision for loss on Anti-Monopoly Act Loss on insurance cancellation Total extraordinary lossesIncome before income taxesIncome taxes-currentIncome taxes-deferredTotal income taxesProfit Profit attributable to non-controlling interestsProfit attributable to owners of parent
201620162015
Financial Sections
CONSOLIDATED STATEMENTS OF INCOME AND CONSOLIDATED STATEMENTS OF COMPREHENSIVE INCOMETaikisha Ltd. and its Consolidated Subsidiaries : For the years ended March 31, 2015 and 2016
Thousands of U.S. dollarsMillions of yen
$1,885,037 1,596,007 289,030
7,214 72,325 1,149 3,410 154 11,335 (633) 12,748 9,808 1,709 56,807 176,026 113,004
5,757 3,961 1,232 925 – 167 2,208 14,250
1,683 401 181 14,703 19 734 17,721 109,533
104 537 243 774 38 0 1,696
153 0 2 6 – – 161 111,068 36,824 1,130 37,954 73,114 10,248 $62,866
¥212,424 179,854 32,570
812 8,150 129 384 17 1,277 (71) 1,436 1,105 192 6,401 19,836 12,734
648 446 138 104 – 18 248 1,605
189 45 20 1,656 2 82 1,996 12,343
11 60 27 87 4 0 191
17 0 0 0 – – 18 12,516 4,149 127 4,276 8,239 1,154 ¥7,084
¥183,648 156,430 27,218
785 7,247 88 491 16 1,267 289 1,416 1,002 175 5,770 18,549 8,669
460 392 142 137 28 52 319 1,533
222 26 39 238 – 94 622 9,579
1,162 0 – – 400 0 1,563
842 96 0 0 38 0 978 10,164 2,796 580 3,376 6,787 703 ¥6,084
20 Taikisha Ltd. Annual Report 2016

Consolidated Statements of Comprehensive IncomeProfit Other comprehensive income (Note 5) Valuation difference on available-for-sale securities Deferred gains or losses on hedges Foreign currency translation adjustment Remeasurements of defined benefit plans Share of other comprehensive income of entities accounted for using equity method Total other comprehensive incomeComprehensive incomeComprehensive income attributable to Comprehensive income attributable to owners of the parent Comprehensive income attributable to non-controlling interests
Per share data : Net income Cash dividends
Basis of calculation Profit attributable to owners of parent Profit attributable to owners of parent for common shares Average number of common shares (thousands)
201620162015
The accompanying notes are an integral part of these financial statements.
U.S. dollarsYen
Millions of yen
Thousands of U.S. dollarsMillions of yen
Thousands of U.S. dollars
$73,114
(23,679) 120 (23,484) (16,283) (351) (63,677) 9,437
3,489 $5,948
$1.81 $0.59
$62,866 62,866 34,667
¥8,239
(2,668) 13 (2,646) (1,834) (39) (7,175) 1,063
393 ¥670
¥204.35 ¥67.00
¥7,084 7,084 34,667
¥6,787
3,811 0 2,597 1,043 79 7,532 14,320
13,528 ¥791
¥172.64 ¥52.00
¥6,084 6,084 35,244
21Taikisha Ltd. Annual Report 2016

Balance at the beginning of current period Cumulative effects of changes in accounting policiesRestated balance Changes of items during the period Dividends of surplus Profit attributable to owners of parent Purchase of treasury shares Disposal of treasury shares Net changes of items other than shareholders’ equity Total changes of items during the periodBalance at the end of current period
Balance at the beginning of current period Cumulative effects of changes in accounting policiesRestated balanceChanges of items during the period Dividends of surplus Profit attributable to owners of parent Purchase of treasury shares Disposal of treasury shares Net changes of items other than shareholders’ equity Total changes of items during the periodBalance at the end of current period
Balance at the beginning of current period Cumulative effects of changes in accounting policiesRestated balanceChanges of items during the period Dividends of surplus Profit attributable to owners of parent Purchase of treasury shares Disposal of treasury shares Net changes of items other than shareholders’ equity Total changes of items during the periodBalance at the end of current period
Capitalstock
Capitalstock
Capitalstock
Shareholders’ equity
Shareholders’ equity
Shareholders’ equity
Accumulated other comprehensive income
Accumulated other comprehensive income
Accumulated other comprehensive income
Retainedearnings
Retainedearnings
Retainedearnings
Totalshareholders’
equity
Totalshareholders’
equity
Totalshareholders’
equity
Deferred gains or
losses onhedges
Deferredgains or
losses onhedges
Deferred gains or
losses onhedges
Capitalsurplus
Capitalsurplus
Capitalsurplus
Treasuryshares
Treasuryshares
Treasuryshares
Valuationdifference onavailable-for-sale securities
Valuationdifference onavailable-for-sale securities
Valuationdifference onavailable-for-sale securities
Foreigncurrency
translationadjustment
Foreigncurrency
translationadjustment
Foreigncurrency
translationadjustment
Totalaccumulated othercomprehensive
income
Totalaccumulated othercomprehensive
income
Totalaccumulated othercomprehensive
income
Non-controlling interests
Non-controlling interests
Non-controlling interests
Totalnet assets
Totalnet assets
Totalnet assets
Millions of yen
Millions of yen
Thousands of U.S. dollars
CONSOLIDATED STATEMENTS OF CHANGES IN NET ASSETS
¥6,455
6,455
– ¥6,455
¥6,455
6,455
– ¥6,455
$57,283
57,283
– $57,283
¥61,908
2,444 64,352
(1,586) 6,084
4,498 ¥68,851
¥68,851
68,851
(1,991) 7,084
5,092 ¥73,943
$610,980
610,980
(17,676) 62,866
45,190 $656,170
¥72,792
2,444 75,236
(1,586) 6,084 (3) 0
4,495 ¥79,731
¥79,731
– 79,731
(1,991) 7,084 (2,208) –
2,883 ¥82,615
$707,533
– 707,533
(17,676) 62,866 (19,598) –
25,592 $733,125
¥(6)
(6)
0 0 ¥(5)
¥(5)
(5)
13
13 ¥7
$(50)
(50)
120
120 $70
¥7,344
7,344
0
0 ¥7,344
¥7,344
7,344
– ¥7,344
$65,174
65,174
–$65,174
¥(2,915)
(2,915)
(3) 0
(3) ¥(2,919)
¥(2,919)
(2,919)
(2,208)
(2,208) ¥(5,127)
$(25,904)
(25,904)
(19,598)
(19,598) $(45,502)
¥6,765
6,765
3,811 3,811 ¥10,577
¥10,577
10,577
(2,668)
(2,668) ¥7,908
$93,862
93,862
(23,679)
(23,679) $70,183
¥1,158
1,158
2,583 2,583 ¥3,742
¥(261)
(261)
1,047 1,047 ¥786
¥7,656
7,656
7,444 7,444 ¥15,100
¥3,742
3,742
(2,213) (2,213) ¥1,528
$33,207
33,207
(19,642)
(19,642) $13,565
¥15,100
15,100
(6,691)
(6,691) ¥8,409
$133,997
133,997
(59,376)
(59,376) $74,621
¥786
786
(1,822)
(1,822) ¥(1,036)
$6,978
6,978
(16,175)
(16,175) $(9,197)
¥4,263
3 4,267
570 570 ¥4,837
¥4,837
4,837
58
58 ¥4,896
$42,929
42,929
523
523 $43,452
¥84,712
2,447 87,159
(1,586) 6,084 (3) 0
8,014 12,509 ¥99,669
¥99,669
– 99,669
(1,991) 7,084 (2,208) –
(6,632)
(3,748) ¥95,921
$884,459
– 884,459
(17,676) 62,866 (19,598) –
(58,853)
(33,261) $851,198
Taikisha Ltd. and its Consolidated Subsidiaries
For the year ended March 31, 2016
For the year ended March 31, 2016
For the year ended March 31, 2015
The accompanying notes are an integral part of these financial statements.
Remeasurementsof defined
benefit plans
Remeasurementsof defined
benefit plans
Remeasurementsof defined
benefit plans
Financial Sections
22 Taikisha Ltd. Annual Report 2016

Cash flows from operating activities: Income before income taxes Depreciation and amortization Amortization of goodwill Increase (decrease) in allowance for doubtful accounts Increase (decrease) in provision for warranties for completed construction Increase (decrease) in provision for loss on construction contracts Increase (decrease) in provision for loss on Anti-Monopoly Act Increase (decrease) in provision of reserve for loss on dissolution of employees' pension fund Increase (decrease) in provision for directors' retirement benefits Increase (decrease) in net defined benefit liability Interest and dividend income Interest expenses Share of (profit) loss of entities accounted for using equity method Loss (gain) on disposal of non-current assets Loss (gain) on sales of investment securities Loss (gain) on valuation of investment securities Decrease (increase) in notes and accounts receivable-trade Decrease (increase) in inventories Decrease (increase) in advances paid Decrease (increase) in non-operating notes receivable Decrease (increase) in accounts receivable-other Increase (decrease) in notes and accounts payable-trade Increase (decrease) in advances received on uncompleted construction contracts Increase (decrease) in non-operating notes payable Increase (decrease) in accrued consumption taxes Increase (decrease) in deposits received Increase (decrease) in accrued expenses Other, net Subtotal Interest and dividend income received Interest expenses paid Income taxes paid Net cash provided by (used in) operating activitiesCash flows from investing activities: Payments into time deposits Proceeds from withdrawal of time deposits Purchase of securities Proceeds from redemption of securities Purchase of property, plant and equipment and intangible assets Proceeds from sales of property, plant and equipment and intangible assets Purchase of investment securities Proceeds from sales of investment securities Proceeds from redemption of investment securities Purchase of shares of subsidiaries resulting in change in scope of consolidation (Note 7) Payments of long-term loans receivable Collection of long-term loans receivable Purchase of insurance funds Proceeds from maturity of insurance funds Purchase of long-term prepaid expenses Other, net Net cash provided by (used in) investing activitiesCash flows from financing activities: Net increase (decrease) in short-term loans payable Proceeds from long-term loans payable Repayments of long-term loans payable Repayments of lease obligations Net decrease (increase) in treasury shares Cash dividends paid Cash dividends paid to non-controlling interests Payments from changes in ownership interests in subsidiaries that do not result in change in scope of consolidation Net cash provided by (used in) financing activitiesEffect of exchange rate change on cash and cash equivalentsNet increase (decrease) in cash and cash equivalentsCash and cash equivalents at beginning of periodCash and cash equivalents at end of period (Note 7)
201620162015
CONSOLIDATED STATEMENTS OF CASH FLOWS
$111,068 11,970 1,709 (1,664) 6,064 (886) (1,845) (38) 154 (7,892) (9,718) 1,683 30 49 (535) 6 (147,344) 9,472 2 (37) (1,683) 46,781 48,629 (171) 3,576 283 (312) 17,776 87,127 9,718 (1,682) (30,367) 64,796
(98,221) 91,723 (35,496) 57,680 (17,228) 301 (4,441) 1,802 – – (571) 577 (27) 11 (407) 1,382 (2,915)
(37,977) 42,094 (30,749) (304) (19,598) (17,664) (1,776) (74) (65,748) (15,087) (18,954) 359,444 $340,490
¥12,516 1,348 192 (187) 683 (99) (207) (4) 17 (889) (1,095) 189 3 5 (60) 0 (16,604) 1,067 0 (4) (189) 5,271 5,480 (19) 403 31 (35) 2,003 9,818 1,095 (189) (3,422) 7,301
(11,068) 10,336 (4,000) 6,500 (1,941) 33 (500) 203 – – (64) 64 (3) 1 (45) 155 (328)
(4,245) 4,743 (3,465) (34) (2,208) (1,990) (200) (8) (7,409) (1,700) (2,135) 40,505 ¥38,369
¥10,164 1,257 175 301 (107) (740) (384) (400) (9) (661) (853) 222 (43) (319) 0 0 (1,825) 1,049 (3) 0 (37) (786) (2,321) 19 666 (90) (56) (2,138) 3,078 853 (222) (2,308) 1,401 (11,308) 9,589 (4,000) 3,000 (1,247) 1,427 (1,497) 9 1,010 (744) (74) 105 (2) 61 (38) (188) (3,900)
2,007 1,876 (474) (29) (3) (1,586) (524) – 1,264 1,878 644 39,861 ¥40,505
Taikisha Ltd. and its Consolidated Subsidiaries : For the years ended March 31, 2015 and 2016
Thousands of U.S. dollarsMillions of yen
The accompanying notes are an integral part of these financial statements.
23Taikisha Ltd. Annual Report 2016

Financial Sections
NOTES TO CONSOLIDATED FINANCIAL STATEMENTSTaikisha Ltd. and its Consolidated Subsidiaries : For the years ended March 31, 2015 and 2016
1. Basis of presenting consolidated financial statements The accompanying consolidated financial statements are prepared based on the accounts maintained by Taikisha Ltd. (the “Company”) and its consolidated subsidiaries (collectively,
the “Companies”) in accordance with accounting principles generally accepted in Japan, which are different in certain respects as to the application and disclosure requirements of International Financial Reporting Standards, and are compiled from the consolidated financial statements prepared by the Company as required by the Financial Instruments and Exchange Law of Japan. Certain amounts in the prior year’s financial statements are reclassified to conform to the changes made for the latest fiscal year.
The accounts of the consolidated financial statements presented herein are expressed in Japanese yen by rounding down to the nearest million. The U.S. dollar amounts shown in the accompanying consolidated financial statements and notes thereto are translated from the original Japanese yen into U.S. dollars on the basis of ¥112.69 to US$1, the rate of exchange prevailing at March 31, 2016, and are then rounded to the nearest thousand. These U.S. dollar amounts are not intended to imply that the Japanese yen amounts are or can be converted, realized or settled in U.S. dollars at this or any other rate.
2. Summary of significant accounting policies(1) Scope of consolidation From this fiscal year, Token Myanmar Co., Ltd., which was newly established, is included in the scope of consolidation. In this fiscal year, “Taikisha (R)"LLC is excluded from the scope of consolidation as a result of the completion of its liquidation procedures. The consolidated financial statements include the accounts of Taikisha Ltd. and all significant subsidiaries listed below as of March 31, 2016:
Domestic subsidiaries San Esu Industry Co., Ltd. Nippon Noise Control Ltd. Tokyo Taikisha Service Ltd. Overseas subsidiaries TKS Industrial Company
Encore Automation LLC (subsidiary of TKS Industrial Company) Taikisha Canada Inc. (subsidiary of TKS Industrial Company) Taikisha de Mexico, S.A. de C.V. (subsidiary of TKS Industrial Company) Taikisha Mexicana Service S.A. de C.V. (subsidiary of Taikisha de Mexico, S.A. de C.V.) Taikisha do Brazil Ltda. Taikisha (Singapore) Pte. Ltd. Taikisha (Thailand) Co., Ltd. Taikisha Trading (Thailand) Co., Ltd. (subsidiary of Taikisha (Thailand) Co., Ltd.) Thaiken Maintenance & Service Co., Ltd. (subsidiary of Taikisha (Thailand) Co., Ltd.) Token Interior & Design Co., Ltd. (subsidiary of Taikisha (Thailand) Co., Ltd.) TKA Co., Ltd. (subsidiary of Taikisha (Thailand) Co., Ltd.) Token Myanmar Co., Ltd. (subsidiary of Taikisha (Thailand) Co., Ltd.) Taikisha Engineering (M) Sdn. Bhd. P.T. Taikisha Indonesia Engineering P.T. Taikisha Manufacturing Indonesia Taikisha Philippines Inc.
Taikisha Vietnam Engineering Inc.Taikisha (Cambodia) Co., Ltd.Taikisha Myanmar Co., Ltd.Wuzhou Taikisha Engineering Co., Ltd.Beijing Wuzhou Taikisha Equipment Co., Ltd. (subsidiary of Wuzhou Taikisha Engineering Co., Ltd.)Tianjin Taikisha Paint Finishing System Ltd.Taikisha Hong Kong LimitedTaikisha (Taiwan) Ltd.Taikisha Korea Ltd.Taikisha Engineering India Private Ltd.Geico S.p.A.Geico Taikisha Europe Ltd. (subsidiary of Geico S.p.A.)J-CO Mexico, S. de R.L. de C.V. (subsidiary of Geico Taikisha Europe Ltd.)Geico Brazil Ltda. (subsidiary of Geico Taikisha Europe Ltd.)Geico Paint Shop India Private Limited (subsidiary of Geico Taikisha Europe Ltd.)Geico Painting System (Suzhou) Co., Ltd. (subsidiary of Geico Taikisha Europe Ltd.)"Geico Russia" LLC (subsidiary of Geico S.p.A.)
(2) Application of the equity method Names of associates subject to the equity method Shanghai Dongbo-Taiki Conveyor System Manufacturing Co., Ltd. Tianjin Dongchun-Taiki Metal Finishing & Conveyor System Manufacturing Co., Ltd. Names of associates not subject to the equity method The associate not subject to the equity method is excluded from application of the equity method because if it is excluded from the scope of application of the equity method, it
has minor impact on net income (proportionate to equity holdings), retained earnings (proportionate to equity holdings), etc., on the consolidated financial statement. Makiansia Engineering (M) Sdn. Bhd.(3) Fiscal year for consolidated subsidiaries All domestic consolidated subsidiaries as well as Taikisha Engineering India Private Ltd., Taikisha Myanmar Co., Ltd., Token Myanmar Co., Ltd., and Geico Paint Shop India Private
Limited have a fiscal year ending on March 31, which is the same as the fiscal year of the Company. The other overseas consolidated subsidiaries have a fiscal year ending on December 31.
In preparing the consolidated financial statements, the Company uses the financial statements of these companies with a fiscal year ending December 31, as of their fiscal year ending. However, the Company uses provisional financial results of Token Myanmar Co., Ltd. as of December 31, which is the fiscal year ending of its direct parent company Taikisha (Thailand) Co., Ltd., also uses provisional financial results of Geico Paint Shop India Private Limited as of December 31, which is the fiscal year ending of its direct parent company Geico Taikisha Europe Ltd.
For those subsidiaries with a fiscal year ending December 31, certain adjustments are made, where appropriate, in preparing the consolidated financial statements to reflect material transactions during the period from their fiscal year end to March 31.
(4) Valuation of significant assets Held-to-maturity debt securities Held-to-maturity debt securities are determined by the amortized cost method. Discounts and premiums are amortized by the straight-line method. Shares of associates Shares of associates are stated at cost, determined by the moving average method. Other securities Other securities with fair value are stated at fair value based on the market prices at the end of fiscal year. Valuation difference is reported as a separate item in net assets at
net-of-tax amount. The cost of securities sold is stated at cost, determined by the moving average method. Other securities without fair value are stated at cost using the moving average method. Derivatives Derivative instruments are recognized as either assets or liabilities at their respective fair values at the date of contract, and gains and losses arising from changes in fair value
are recognized in earnings in the corresponding fiscal period. If certain hedging criteria are met, such gains and losses are deferred and accounted for as assets or liabilities.
24 Taikisha Ltd. Annual Report 2016

Inventories Costs on uncompleted construction contracts are stated at cost using specific identification method. Raw materials and supplies are stated at cost determined by the moving average
method. The cost method (the amounts stated in the balance sheets are calculated by writing down the book values based on lower profitability) is used as a valuation standard. (5) Depreciation method for principal depreciable assets Property, plant and equipment (excluding leased assets) The Companies mainly calculate depreciation by the declining-balance method, while the straight-line method is applied to the buildings, excluding building fixtures,
acquired on or after April 1, 1998. Certain overseas consolidated subsidiaries apply the straight-line method. The useful lives and residual values of depreciable assets are estimated mainly in accordance with the Corporate Tax Law.
Intangible assets (excluding leased assets) Intangible assets are amortized by the straight-line method. Computer software for internal use is amortized by the straight-line method over the estimated useful life of 5 years. Leased assets Leased assets under finance leases that do not transfer ownership of the leased assets to the lessee are depreciated by the straight-line method over the lease period with a
residual value of zero.(6) Standards of accounting for principal allowance and provisions Allowance for doubtful accounts In order to prepare for losses due to bad debts of accounts receivable from completed construction contracts and other, the allowance for doubtful accounts is provided. For
receivables classified as "normal", it is provided based on a historical default ratio. For receivables classified as "doubtful" etc, it is provided based on individual assessment on the probability of collection.
Provision for warranties for completed construction In order to prepare for the costs of repairs for damages related to completed construction work for which the Companies are responsible, the provision is provided based on
past warranty experience. Provision for loss on construction contracts In order to prepare for future losses related to the construction contracts in process, the provision is provided based on estimated amount which will probably be incurred
and which can be reasonably estimated. Provision for directors' bonuses In order to prepare for directors' bonuses, the provision is provided based on the estimated payment of the fiscal year. Provision for loss on Anti-Monopoly Act In order to prepare for surcharge or penalty related to the Anti-Monopoly Act, the provision is provided based on estimated amount which will probably be incurred and
which can be reasonably estimated for each issue. Reserve for loss on dissolution of employees' pension fund In order to prepare for future losses related to the dissolution of employees' pension fund, the provision is provided based on estimated amount which will probably be
incurred and which can be reasonably estimated. (Additional information) Nishinihonreitokutyou Employees' Pension Fund (integrated establishment agency-type), which the Company and domestic consolidated subsidiaries are affiliated with,
has come to a decision on special dissolution that was discussed at the representative assembly that took place on September 18, 2013. In this fiscal year, the Companies recognized "Reversal of reserve for loss on dissolution of employees' pension fund" of ¥4 million (US$ 38 thousand) as extraordinary
income in the consolidated statement of income and "Reserve for loss on dissolution of employees' pension fund" of ¥247 million (US$ 2,193 thousand) as current liabilities in consolidated balance sheet.
Provision for directors' retirement benefits In order to prepare for directors' retirement benefits, domestic consolidated subsidiaries recognize the provision for accrued retirement benefits to directors at 100 percent of
the amount required by their internal policies for retirement benefits.(7) Retirement and pension plans (Method of attributing the projected benefit obligations to periods of service) Benefit formula basis (Actuarial differences) Actuarial differences are amortized using the straight-line method over a certain period of time (10 years) within the average remaining service period of employees from
the following fiscal year of accrual. (Prior service costs) Prior service costs are amortized using the straight-line method over a certain period of time (10 years) within the average remaining service period of employees from the
fiscal year of accrual.(8) Sales and cost recognition Sales of completed construction contracts and cost of sales of completed construction contracts The percentage-of-completion method is applied for construction work for which the completion of a certain percentage of the entire work is reliably recognizable by the
balance sheet date (percentage of completion is estimated by the cost-to-cost method). The completed-contract method is applied for other construction contracts.(9) Hedge accounting Method of hedge accounting Hedging instruments are valued at fair value and accounted for using the deferral method of accounting. As permitted under the accounting principles generally accepted in Japan, when forward foreign exchange contracts meet certain conditions for hedge accounting,
accounts receivable and payable covered by these contracts are translated using the contract rates of these forward foreign exchange contracts. The unrealized gains or losses on the accounts receivable and payable resulting from the difference between the spot foreign exchange rate and contract rate are deferred and amortized over the term of the contract.
With regard to interest rate swaps and interest rate caps which meet certain requirements, the Companies use the special treatment. The special treatment is net amounts to be paid or received under the interest rate swap contracts and interest rate cap contracts added to or deducted from the interest on liabilities for which the contracts are executed.
25Taikisha Ltd. Annual Report 2016

Financial Sections
Hedging instruments and hedged items Hedging instruments : Forward exchange contracts, non-deliverable forward (NDF), interest rate swaps and interest rate caps Hedged items : Foreign trade accounts receivable and payable, forecasted foreign currency transactions and interest for loan payable Hedging policy The Companies use forward exchange contracts not for the purpose of speculation but for hedging future risks of fluctuation of foreign currency exchange rates. The Companies use interest rate swaps and interest rate caps not for the purpose of speculation but for hedging future risks of fluctuation of interest rates. Assessment of hedge effectiveness With regard to forward exchange contacts, hedge effectiveness is not assessed because substantial terms and conditions of the hedging instruments and the hedged transactions are the same. With regard to interest rate swaps and interest rate caps, the evaluation of hedge effectiveness is omitted because they meet certain criteria under the specific method.(10) Scope of cash and cash equivalents in the consolidated statements of cash flows Cash and cash equivalents in the consolidated statements of cash flows are composed of cash in hand, bank deposits able to be withdrawn on demand and short-term
investments with an original maturity of three months or less and which represent a minor risk of fluctuation in value.(11) Amortization method and period for goodwill Goodwill is amortized by the straight-line method over a period of 20 years.(12) Accounting for consumption taxes At the Company and its domestic consolidated subsidiaries, transactions subject to the consumption tax and the local consumption tax are recorded at amounts exclusive of the
consumption tax.(13) Additional information Changes in accounting policies Application of Accounting Standards regarding Business Combinations. The Companies adopted "Accounting Standard for Business Combinations" (Accounting Standards Board of Japan "ASBJ" Statement No.21, September 13, 2013),
"Accounting Standard for Consolidated Financial Statements" (ASBJ Statement No.22, September 13, 2013), and "Accounting Standard for Business Divestitures" (ASBJ Statement No.7, September 13, 2013) from this fiscal year. In line with this, accounting method for change in the Company’s equity interests in subsidiaries was changed to a new method under which, when the Company still hold control over the subsidiaries even after the change in equity interests, gains or losses resulting from the change in equity interests are recorded in capital surplus; and the acquisition costs are expensed in the fiscal year when the costs are incurred. In addition, for business combination implemented on or after the beginning of this fiscal year, the Companies switched to a new method under which adjustments to provisional values of allocated acquisition costs are reflected in the consolidated financial statements for the period which encompasses the effective date of business combination. Furthermore, some changes were made to presentation of net income, and accounting title of minority interests was changed to non-controlling interests. The consolidated financial statements for the previous fiscal year were reclassified to reflect these presentation changes.
These accounting standards were adopted at the beginning of this fiscal year and are applied to the transactions took place on and after the adoption date with transitional treatments stipulated in paragraph 58-2 (4) of the ASBJ Statement No.21, paragraph 44-5 (4) of the ASBJ Statement No.22, and paragraph 57-4 (4) of the ASBJ Statement No.7.
In the consolidated statement of cash flows for this fiscal year, cash flows related to acquisition or sale of subsidiaries’ shares not resulting in change in scope of consolidation were classified into “Cash flows from financing activities,” and cash flows related to costs arising from acquisition of subsidiaries’ shares resulting in change in scope of consolidation or costs arising from acquisition or sale of subsidiaries’ shares not resulting in change in scope of consolidation were classified into “Cash flows from operating activities.”
This change has minimal effect on the Companies’ consolidated financial statements and per share information. Unapplied accounting standards "Implementation Guidance on Recoverability of Deferred Tax Assets" (ASBJ Guidance No.26 of March 28, 2016) (1) Overview The Implementation Guidance basically continues to apply the framework used in The Japanese Institute of Certified Public Accountants "JICPA" Guidance No.66 where
recoverability of deferred tax assets is assessed based on entities’ categories, but certain accounting treatments were changed. The Implementation Guidance includes the following:
(i) accounting treatments for entities which are not included in any category, (ii) criteria as to the classification of entities in the category 2 and 3, (iii) accounting treatments of unscheduled deductible temporary differences for entities in the category 2, (iv) accounting treatments for deductible temporary differences for entities in the category 3, which are scheduled to be deductible after 5 years, and (v) accounting treatments for entities in the category 4 in the current fiscal year, which are expected to be included in the category 2 or 3 in the following year. (2) Scheduled date of adoption The Implementation Guidance is effective from the beginning of the fiscal year beginning on April 1, 2016. (3) Impact of adopting revised accounting standards and guidance The Company is currently evaluating the effect of adopting these revised standards on its consolidated financial statements. Additional information Application of Practical Solution on Transactions of Delivering the Company's Own Stock to Employees etc. through Trusts The Company has introduced "ESOP (Employee Stock Ownership Plan)" (hereinafter the "Plan") when the Company marked the 100th anniversary of its founding. The Plan
is an incentive program granting the stocks of the Company to its employees to motivate them toward improving the company's stock prices and financial results by sharing economic effects with shareholders.
(Overview of transaction) The Plan is a program based on Stock Granting Regulations of the Company that the Company grants points to each employee every year then the accumulated points
change into stocks of the Company after certain period of time. Such stocks are purchased by a trust bank from the Company through third-party allotment by using money which has been settled in trust in advance, and managed separately from books of the Company.
The Company has applied "Practical Solution on Transactions of Delivering the Company's Own Stock to Employees etc. through Trusts" (Practical Issues Task Force No.30, March 26, 2015), but the conventional accounting treatment has been applied.
26 Taikisha Ltd. Annual Report 2016

(The information of the Company's own stocks that are held by trusts) The book value of the Company's own stocks in trusts is ¥ 324 million for the previous year, and ¥ 311 million (US$ 2,766 thousand) for this fiscal year. The Company's
own stocks that are held by trusts are not recognized as treasury shares in shareholders' equity. The number of shares at the end of fiscal year is 174 thousand for previous fiscal year and 167 thousand for this fiscal year. The average number of shares in fiscal year
is 175 thousand for previous fiscal year and 168 thousand for this fiscal year. Neither the number of shares at the end of fiscal year nor the average number of shares in fiscalyear is included in deducted treasury shares for evaluating per-share information.
3. Notes of consolidated balance sheets(1) The information of associates As of March 31, 2015 and 2016 Millions of yen Thousands of U.S. dollars 2015 2016 2016 Investment securities ¥773 ¥730 $6,479
(2) Pledged assets Assets pledged as collateral for security deposits at subsidiaries and associates As of March 31, 2015 and 2016 Millions of yen Thousands of U.S. dollars 2015 2016 2016 Cash and deposits ¥32 ¥36 $323
Assets pledged as collateral for loans payable of invested company As of March 31, 2015 and 2016 Millions of yen Thousands of U.S. dollars 2015 2016 2016 Investment securities ¥2 ¥2 $18
Assets pledged as collateral for loans payable of subsidiaries and associates As of March 31, 2015 Millions of yen Pledged assets Book value Liabilities covered by pledged assets Cash and deposits ¥312 ¥214 Machinery, vehicles, tools, furniture and fixtures ¥30 ¥18
As of March 31, 2016 Millions of yen Thousands of U.S. dollars Pledged assets Book value Liabilities covered Book value Liabilities covered by pledged assets by pledged assets Cash and deposits ¥307 ¥231 $2,733 $2,056 Machinery, vehicles, tools, furniture and fixtures ¥28 ¥15 $254 $140
(3) Guarantee obligations As of March 31, 2015 and 2016 Millions of yen Thousands of U.S. dollars 2015 2016 2016 Guarantee of Employees' loans ¥12 ¥4 $36 Tianjin Dongchun-Taiki Metal Finishing & Conveyor System Manufacturing Co., Ltd. – 342 3,037 Total ¥12 ¥346 $3,073
(4) Commitment lines For efficient procurement of the operating funds, the Company has lending commitment contracts with four dealing banks. Lending commitment amounts are as follows: As of March 31, 2015 and 2016 Millions of yen Thousands of U.S. dollars 2015 2016 2016 Total amount of lending commitment ¥5,000 ¥5,000 $44,370 Borrowing execution balance – – – Net ¥5,000 ¥5,000 $44,370
27Taikisha Ltd. Annual Report 2016

Financial Sections
(5) Endorsed notes As of March 31, 2015 and 2016 Millions of yen Thousands of U.S. dollars 2015 2016 2016 Endorsed notes ¥32 ¥35 $314
(6) Provision for loss on construction contracts Following amounts of provision for loss on construction contracts are offset from the amounts of costs on uncompleted construction contracts. As of March 31, 2015 and 2016 Millions of yen Thousands of U.S. dollars 2015 2016 2016 Provision for loss on construction contracts ¥35 – –
4. Notes of consolidated statements of income(1) Research and development expenses Research and development expenses included in selling, general and administrative expenses are as follows. For the years ended March 31, 2015 and 2016 Millions of yen Thousands of U.S. dollars 2015 2016 2016 General and administrative expenses ¥822 ¥889 $7,892
(2) Gain on disposal of non-current assets For the years ended March 31, 2015 and 2016 Millions of yen Thousands of U.S. dollars 2015 2016 2016 Buildings and structures ¥25 ¥– $– Machinery, vehicles, tools, furniture and fixtures 7 10 96 Land 1,114 – – Long-term deposits 14 0 8 Total ¥1,162 ¥11 $104
(3) Loss on disposal of non-current assets For the years ended March 31, 2015 and 2016 Millions of yen Thousands of U.S. dollars 2015 2016 2016 Buildings and structures ¥212 ¥3 $35 Machinery, vehicles, tools, furniture and fixtures 4 10 92 Land 619 – – Other 5 2 26 Total ¥842 ¥17 $153
(4) Provision for loss on construction contracts Provision for loss on construction contracts included in cost of sales of completed construction contracts are as follows. For the years ended March 31, 2015 and 2016 Millions of yen Thousands of U.S. dollars 2015 2016 2016 Provision for loss on construction contracts ¥142 ¥86 $769
28 Taikisha Ltd. Annual Report 2016

5. Notes of consolidated statements of comprehensive income(1) Reclassification adjustments and tax effects for other comprehensive income For the years ended March 31, 2015 and 2016 Millions of yen Thousands of U.S. dollars 2015 2016 2016 Valuation difference on available-for-sale securities Net gains (losses) arising during the period ¥5,135 ¥(4,179) $(37,087) Reclassification adjustments – (33) (293) Before tax effects 5,135 (4,212) (37,380) Tax effects (1,324) 1,543 13,701 Valuation difference on available-for-sale securities 3,811 (2,668) (23,679) Deferred gains or losses on hedges Net gains (losses) arising during the period (118) (97) (863) Reclassification adjustments 120 118 1,048 Before tax effects 1 20 185 Tax effects (0) (7) (65) Deferred gains or losses on hedges 0 13 120 Foreign currency translation adjustment Net gains (losses) arising during the period 2,597 (2,619) (23,241) Reclassification adjustments – (27) (243) Foreign currency translation adjustment 2,597 (2,646) (23,484) Remeasurements of defined benefit plans Net gains (losses) arising during the period 1,743 (2,260) (20,058) Reclassification adjustments (230) (436) (3,869) Before tax effects 1,512 (2,696) (23,927) Tax effects (469) 861 7,644 Remeasurements of defined benefit plans 1,043 (1,834) (16,283) Share of other comprehensive income of associates accounted for using equity method Net gains (losses) arising during the period 79 (39) (351) Other comprehensive income ¥7,532 ¥(7,175) $(63,677)
6. Notes of consolidated statements of changes in net assets(1) The number of issued shares For the year ended March 31, 2015 Beginning Balance Increase Decrease Ending Balance Common shares 36,782,009 – – 36,782,009
For the year ended March 31, 2016 Beginning Balance Increase Decrease Ending Balance Common shares 36,782,009 – – 36,782,009
(2) The number of treasury shares For the year ended March 31, 2015 Beginning Balance Increase Decrease Ending Balance Common shares 1,537,054 1,386 34 1,538,406 The number of treasury shares increased by 1,386 shares because of purchase of shares less than one unit (*) and decreased by 34 shares because of the transfer of shares less than one unit (*) in response
to purchase requests. (*) The unit share is a specified number of shares which are treated as one purchasing lot and entitled to one voting right. One unit share consists of 100 shares.
For the year ended March 31, 2016 Beginning Balance Increase Decrease Ending Balance Common shares 1,538,406 680,655 – 2,219,061 The number of treasury shares increased by 680,000 shares because of purchase of shares approved by the resolution of board of directors and increased by 655 shares because of purchase of shares less
than one unit (*). (*) The unit share is a specified number of shares which are treated as one purchasing lot and entitled to one voting right. One unit share consists of 100 shares.
(3) Dividends Dividends paid For the year ended March 31, 2015 Resolution approved by Type of shares Amount Amount per share Shareholders' Effective Millions Yen cut-off date date of yen Annual general meeting of March 31, June 30, shareholders (June 27, 2014) Common shares ¥881 ¥25.00 2014 2014 Board of directors September November (November 10, 2014) Common shares ¥704 ¥20.00 30, 2014 28, 2014
29Taikisha Ltd. Annual Report 2016

Financial Sections
For the year ended March 31, 2016 Resolution approved by Type of shares Amount Amount per share Shareholders' Effective Millions Thousands of Yen U.S. dollars cut-off date date of yen U.S. dollars Annual general meeting of March 31, June 29, shareholders (June 26, 2015) Common shares ¥1,127 $10,008 ¥32.00 $0.28 2015 2015 Board of directors September November (November 10, 2015) Common shares ¥864 $7,668 ¥25.00 $0.22 30, 2015 27, 2015
Dividends with a shareholders’ cut-off date during the fiscal year but an effective date subsequent to the fiscal year For the year ended March 31, 2015 Resolution approved by Type of Paid Amount Amount per share Shareholders' Effective shares from Millions Yen cut-off date date of yen Annual general meeting of Common Retained March 31, June 29, shareholders (June 26, 2015) shares earnings ¥1,127 ¥32.00 2015 2015
For the year ended March 31, 2016 Resolution approved by Type of Paid Amount Amount per share Shareholders' Effective shares from Millions Thousands of Yen U.S. dollars cut-off date date of yen U.S. dollars Annual general meeting of Common Retained March 31, June 30, shareholders (June 29, 2016) shares earnings ¥1,451 $12,882 ¥42.00 $0.37 2016 2016
7. Notes of consolidated statements of cash flows(1) Cash and cash equivalents The reconciliation between amounts of cash and cash equivalents reported in the consolidated statements of cash flows and amounts of cash and deposits reported in the
consolidated balance sheets are as follows: For the years ended March 31, 2015 and 2016 Millions of yen Thousands of U.S. dollars 2015 2016 2016 Cash and deposits ¥43,819 ¥44,001 $390,463 Securities 4,500 13 118 Sub total 48,319 44,014 390,581 Time deposits over three months (5,314) (5,631) (49,973) Securities over three months (2,500) (13) (118) Cash and cash equivalents ¥40,505 ¥38,369 $340,490
(2) Detail of assets and liabilities of the company which is included in the scope of consolidation because of acquisition of its membership interest For the year ended March 31, 2015 The detail of assets, liabilities and purchase of membership interest of a subsidiary resulting in inclusion in consolidation is as follows. Encore Automation LLC (as of June 30, 2014) Millions of yen Current assets ¥626 Non-current assets 14 Goodwill 720 Current liabilities (254) Non-current liabilities (120) Non-controlling interests (130) Acquisition cost of membership interest 856 Accounts payable related to purchase of membership interest (60) Cash and cash equivalents (50) Net : Purchase of membership interest ¥744
8. Lease transaction The non-transfer-ownership finance lease as lessee which entered into a contract on and before March 31, 2008 Until the year ended March 31, 2008, non-transfer-ownership finance leases were permitted to be accounted for in the same manner as operating leases. From the year ended March 31, 2009, non-transfer-ownership finance leases are to be capitalized in accordance with "Accounting Standard for Lease Transactions"
(Accounting Standards Board of Japan statement No.13 issued on March 30, 2007). However, the lease transactions entered into contracts on and before March 31, 2008 are continuously accounted for in the same manner as operating leases.
As lessee The acquisition costs, accumulated depreciation and net book value of the leased assets are as follows. As of March 31, 2015 Millions of yen Acquisition cost Accumulated depreciation Net book value Machinery ¥139 ¥102 ¥37
30 Taikisha Ltd. Annual Report 2016

As of March 31, 2016 Millions of yen Thousands of U.S. dollars Acquisition cost Accumulated depreciation Net book value Net book value Machinery ¥139 ¥115 ¥23 $206
The amounts of future lease payments As of March 31, 2015 and 2016 Millions of yen Thousands of U.S. dollars 2015 2016 2016 Due within one year ¥13 ¥13 $124 Due over one year 23 9 82 Total ¥37 ¥23 $206 Note 1. The interest portion is included above future lease payment amounts because the proportion of future lease payments to the ending balance of non-current assets is low.
Total lease payments and depreciation For the years ended March 31, 2015 and 2016 Millions of yen Thousands of U.S. dollars 2015 2016 2016 Total lease payments ¥13 ¥13 $124 Depreciation ¥13 ¥13 $124
Depreciation method Depreciation is calculated by the straight-line method over the lease period with a residual value of zero.
(1) Finance lease transaction As lessee The detail of leased assets The leased assets are mainly office equipments and vehicles in Japan and production equipments and vehicles overseas. The account title the Companies use is
"Machinery, vehicles, tools, furniture and fixtures". Depreciation method Depreciation is calculated by the straight-line method over the lease period with a residual value of zero. Impairment loss There is no impairment loss allocated to the leased assets.(2) Operating lease transaction As lessee The amounts of outstanding future lease payments under non-cancelable operating leases are as follows: As of March 31, 2015 and 2016 Millions of yen Thousands of U.S. dollars 2015 2016 2016 Due within one year ¥158 ¥149 $1,325 Due over one year 150 458 4,070 Total ¥308 ¥607 $5,395
9. Financial instruments(1) Overview Policy on financial instruments The Companies invest temporary surplus funds in highly secure financial assets and finance short-term operating funds by bank borrowings. Derivatives are used for
avoiding risks described below and are not used for trading or speculative purposes. Description of financial instruments, related risks and risk management system Trade receivables such as notes receivable, accounts receivable from completed construction contracts and other are exposed to the customer credit risk. For avoiding this risk,
the Companies have an internal system which checks customer credit standing on a timely basis and monitoring each transaction's due date and balance. Though receivables in foreign currencies are exposed to the market risk of fluctuation in foreign currency exchange rates, this risk is hedged partly by forward foreign currency contracts.
Stocks in investment securities are exposed to market risk of fluctuation. These stocks are mainly the stocks of companies with business relationships. The Companies check market price and financial position of these companies periodically.
Trade payables such as notes payable, accounts payable for construction contracts and other are almost all due within one year. Though these payables including foreign currency for importing equipment and materials are exposed to the market risk of fluctuation in foreign currency exchange rates, these amounts are always less than accounts receivable from completed construction contracts in the same foreign currencies.
Income taxes payable are imposed on the taxable income of the Companies for the fiscal year, and they all mature within one year. Both short-term loans payable and long-term loans payable are for operating activities. Short-term loans payable are exposed to the risk of fluctuation in interest
rate. Long-term loans payable are hedged the risk of fluctuation principally by using fixed interest rates. Derivative transactions are forward exchange contract and non-deliverable forward (NDF) for reducing foreign currencies fluctuation risk in normal operating
cycle, and interest rate swap for reducing interest rate fluctuation risk. The Companies have an internal guideline of foreign exchange management authorized by administrative management chief executive and carry out of forward exchange contracts and non-deliverable forward (NDF) in accordance with the guideline. The guideline prescribes management policy, division name in charge of risk management, purpose of transactions, kinds of transactions and reporting system. With regard to interest rate swap, the Companies admit to make a contract only if this meets the requirements for specific treatment. In case of carrying out derivative transactions, the Companies do business only with high credit rating financial institutions to reduce credit risk.
Trade payable and loans payable are exposed to liquidity risk. The Companies control the risk by preparing financing plans by each subsidiary.
31Taikisha Ltd. Annual Report 2016

Financial Sections
Supplementary explanation of fair values of financial instruments Derivative transactions in "(2) Fair value of financial instruments" below are not indicative of the actual market risk involved in derivative transactions but nominal
contract amounts or estimated amounts based on certain assumptions.
(2) Fair value of financial instruments The following table shows the book values and fair values of financial instruments and any differences. Certain financial instruments for which it is extremely difficult to determine
the fair value are not included (see Note 2 below). As of March 31, 2015 Millions of yen Book value Fair value Difference Cash and deposits ¥43,819 ¥43,819 ¥– Notes receivable, accounts receivable from completed construction contracts and other 78,607 Allowance for doubtful accounts (*1) (450) 78,157 78,002 (154) Securities and Investment securities (*2) 29,437 29,437 – Total Assets 151,414 151,260 (154) Notes payable, accounts payable for construction contracts and other 45,693 45,691 (2) Short-term loans payable 9,892 9,892 – Income taxes payable 1,416 1,416 – Long-term loans payable 536 495 (40) Total Liabilities 57,538 57,495 (42) Derivatives ¥(17) ¥(17) ¥– (*1) Allowance for doubtful accounts estimated by each credit risk of notes receivable, accounts receivable from completed construction contracts and other is deducted. (*2) Investment securities which are extremely difficult to determine the fair values are not included.
As of March 31, 2016 Millions of yen Thousands of U.S. dollars Book value Fair value Difference Book value Fair value Difference Cash and deposits ¥44,001 ¥44,001 ¥– $390,463 $390,463 $– Notes receivable, accounts receivable from completed construction contracts and other 92,718 822,775 Allowance for doubtful accounts (*1) (314) (2,793) 92,403 92,401 (2) 819,982 819,959 (23) Securities and Investment securities (*2) 21,100 21,100 – 187,242 187,242 – Total Assets 157,505 157,502 (2) 1,397,687 1,397,664 (23) Notes payable, accounts payable for construction contracts and other 49,214 49,207 (6) 436,721 436,659 (62) Short-term loans payable 5,261 5,261 – 46,688 46,688 – Income taxes payable 2,045 2,045 – 18,149 18,149 – Long-term loans payable 1,383 1,306 (77) 12,274 11,590 (684) Total Liabilities 57,903 57,819 (84) 513,832 513,086 (746) Derivatives ¥68 ¥68 ¥– $604 $604 $– (*1) Allowance for doubtful accounts estimated by each credit risk of notes receivable, accounts receivable from completed construction contracts and other is deducted. (*2) Securities and investment securities which are extremely difficult to determine the fair values are not included.
(Note 1) Method to determine the fair values of financial instruments and other information related to securities and derivatives Assets Cash and deposits Since deposits are settled in a short period of time, the book value approximates the fair value. Therefore the book value is used the same as fair value. Notes receivable, accounts receivable from completed construction contracts and other The fair value of these items is determined based on the present value of book value, calculated by applying a discount rate determined taking into account the
term of collection and the credit risk. Securities and investment securities The fair value of stocks is determined based on quoted market price and the fair value of debt securities is determined based on the present value of book value,
calculated by applying the national bond rate etc. determined taking into account the term of collection. Liabilities Notes payable, accounts payable for construction contracts and other and short-term loans payable The fair value of these items is determined based on the present value of book value, calculated by applying a discount rate determined taking into account the
term of collection and the credit risk. Income taxes payable Since income taxes payable is settled in a short period of time, the book value approximates the fair value. Therefore the book value is used the same as fair value.
32 Taikisha Ltd. Annual Report 2016

Long-term loans payable With regard to floating rate loans, the book value approximates the fair value because the market interest rate is reflected in the interest rate within a short period
of time and credit risk does not fluctuate a lot after borrowing. Therefore the book value is used as the fair value. With regard to fixed rate loans, the fair value is determined based on the present value of the total principal and interest discounted by an interest rate to be applied if similar new loans are entered into.
Derivative transactions See 11 "Derivative Transactions"
(Note 2) Book value of financial instruments for which it is extremely difficult to determine the fair value As of March 31, 2015 and 2016 Millions of yen Thousands of U.S. dollars 2015 2016 2016 Other securities Non-listed stocks ¥1,416 ¥1,360 $12,076 Investment trusts 9 8 75 Non-listed foreign bonds ¥21 ¥13 $118
It is extremely difficult to determine the fair value for these securities, because they have no quoted market prices available and high cost is expected to require to calculate future cash flow. Therefore, they are not included in “Securities and investment securities” above.
In this fiscal year, loss of valuation of ¥0 million ( US$ 6 thousand) was calculated for non-listed stocks.
(Note 3) Redemption schedule for monetary receivables and securities with maturities As of March 31, 2015 Millions of yen Within one year Over one year Over five years Over ten years within five years within ten years Cash and deposits ¥43,819 ¥– ¥– ¥– Notes receivable, accounts receivable from completed construction contracts and other 73,325 4,886 395 – Securities and Investment securities Held-to-maturity debt securities (Foreign bonds etc.) 500 – – – Other securities with maturity date (Money in trust) 4,000 – – – (Non-listed foreign bonds) – 21 – – Total ¥121,645 ¥4,907 ¥395 ¥–
As of March 31, 2016 Millions of yen Within one year Over one year Over five years Over ten years within five years within ten years Cash and deposits ¥44,001 ¥– ¥– ¥– Notes receivable, accounts receivable from completed construction contracts and other 88,000 4,006 711 – Securities and Investment securities Other securities with maturity date (Non-listed foreign bonds) 13 – – – Total ¥132,015 ¥4,006 ¥711 ¥–
As of March 31, 2016 Thousands of U.S. dollars Within one year Over one year Over five years Over ten years within five years within ten years Cash and deposits $390,463 $– $– $– Notes receivable, accounts receivable from completed construction contracts and other 780,910 35,554 6,311 – Securities and Investment securities Other securities with maturity date (Non-listed foreign bonds) 118 – – – Total $1,171,491 $35,554 $6,311 $–
(Note 4) Redemption schedule for long-term loans payable, lease obligations and other interest-bearing debts
33Taikisha Ltd. Annual Report 2016

Financial Sections
As of March 31, 2015 Millions of yen Within one year Over one year Over two years Over three years Over four years Over five years within two years within three years within four years within five years Short-term loans payable ¥8,113 ¥– ¥– ¥– ¥– ¥– Long-term loans payable 1,778 259 135 51 37 51 Lease obligations 30 24 15 11 3 – Total ¥9,922 ¥284 ¥151 ¥62 ¥40 ¥51
As of March 31, 2016 Millions of yen Within one year Over one year Over two years Over three years Over four years Over five years within two years within three years within four years within five years Short-term loans payable ¥3,310 ¥– ¥– ¥– ¥– ¥– Long-term loans payable 1,950 643 433 165 84 55 Lease obligations 31 22 15 7 4 – Total ¥5,292 ¥665 ¥449 ¥172 ¥89 ¥55
As of March 31, 2016 Thousands of U.S. dollars Within one year Over one year Over two years Over three years Over four years Over five years within two years within three years within four years within five years Short-term loans payable $29,378 $– $– $– $– $– Long-term loans payable 17,310 5,713 3,845 1,470 753 493 Lease obligations 281 196 141 65 40 – Total $46,969 $5,909 $3,986 $1,535 $793 $493
10. Securities(1) Held-to-maturity debt securities As of March 31, 2015 Millions of yen Book value Fair value Difference Securities whose fair value exceeds their book value ¥– ¥– ¥– Securities whose fair value does not exceed their book value 500 500 – Total ¥500 ¥500 ¥–
As of March 31, 2016 There is nothing applicable.
(2) Other securities As of March 31, 2015 Millions of yen Book value Acquisition cost Difference Securities whose book value exceeds their acquisition cost Stocks ¥24,008 ¥8,417 ¥15,590 Securities whose book value does not exceed their acquisition cost Money in trust 2,500 2,500 – Stocks 928 1,048 (120) Bonds 1,500 1,500 – Subtotal 4,928 5,048 (120) Total ¥28,937 ¥13,466 ¥15,470
As of March 31, 2016 Millions of yen Book value Acquisition cost Difference Securities whose book value exceeds their acquisition cost Stocks ¥20,039 ¥8,540 ¥11,498 Securities whose book value does not exceed their acquisition cost Stocks 1,061 1,301 (240) Total ¥21,100 ¥9,841 ¥11,258
34 Taikisha Ltd. Annual Report 2016

As of March 31, 2016 Thousands of U.S. dollars Book value Acquisition cost Difference Securities whose book value exceeds their acquisition cost Stocks $177,825 $75,786 $102,039 Securities whose book value does not exceed their acquisition cost Stocks 9,417 11,551 (2,134) Total $187,242 $87,337 $99,905
(3) Other securities sold
For the year ended March 31, 2015 Millions of yen Sales amount Total gain on sales Total loss on sales Stocks ¥0 ¥0 ¥0 Non-listed foreign bonds 8 – – Total ¥9 ¥0 ¥0
For the year ended March 31, 2016 Millions of yen Sales amount Total gain on sales Total loss on sales Stocks ¥196 ¥60 ¥0 Non-listed foreign bonds 6 – – Total ¥203 ¥60 ¥0
For the year ended March 31, 2016 Thousands of U.S. dollars Sales amount Total gain on sales Total loss on sales Stocks $1,746 $537 $2 Non-listed foreign bonds 56 – – Total $1,802 $537 $2
(4) Securities with impairment loss For the year ended March 31, 2015 and 2016 The acquisition costs of tables above are the amounts that are already deducted impairment losses. The Companies recognize an impairment loss when those
securities' market value fall 50% or more than the acquisition cost and there is no evidence to indicate that the current price will be recovered to the acquisition cost within one year. When those market value fall 30% or more than acquisition cost, the Companies recognize an impairment loss according to market price in the past one year and the possibility of recovery.
35Taikisha Ltd. Annual Report 2016

Financial Sections
11. Derivative transactions(1) Derivative transactions to which the hedge accounting method is not applied Currency-related transactions
As of March 31, 2015 Millions of yen Category Transaction type Contract Over Fair value Unrealized amount one year gain (loss) Except for Forward exchange contracts: market transaction Buy Yen ¥50 ¥– ¥(4) ¥(4) U.S. dollars 154 – (1) (1) Singapore dollars 2 – (0) (0) British pounds 6 – 0 0 Euros 23 – (0) (0) Sell U.S. dollars 84 – (4) (4) Euros 11 – 1 1 Total ¥(9) ¥(9) Note 1. Estimated fair value is provided by financial institutions.
As of March 31, 2016 Millions of yen Category Transaction type Contract Over Fair value Unrealized amount one year gain (loss) Except for Forward exchange contracts: market transaction Buy Yen ¥137 ¥– ¥0 ¥0 U.S. dollars 176 – 0 0 Sell Yen 26 – (0) (0) U.S. dollars 425 – (4) (4) Chinese Yuan 803 – 59 59 Total ¥55 ¥55 Note 1. Estimated fair value is provided by financial institutions.
As of March 31, 2016 Thousands of U.S. dollars Category Transaction type Contract Over Fair value Unrealized amount one year gain (loss) Except for Forward exchange contracts: market transaction Buy Yen $1,216 $– $8 $8 U.S. dollars 1,566 – 6 6 Sell Yen 231 – (7) (7) U.S. dollars 3,775 – (42) (42) Chinese Yuan 7,127 – 529 529 Total $494 $494
36 Taikisha Ltd. Annual Report 2016

(2) Derivative transactions to which the hedge accounting method is applied Currency-related transactions As of March 31, 2015 Millions of yen Hedging method Transaction Main hedged items Contract Over Fair value type amount one year Deferral method Forward exchange contracts Buy U.S. dollars Accounts payable for construction contracts (forecast) ¥4 ¥– ¥0 Euros Accounts payable for construction contracts (forecast) 87 – 1 Chinese Yuan Accounts payable for construction contracts (forecast) 10 – 1 Korean Won Accounts payable for construction contracts (forecast) 1,071 129 (5) Sell U.S. dollars Accounts receivable from completed construction contracts (forecast) 1,263 151 (2) Chinese Yuan Accounts receivable from completed construction contracts (forecast) 170 – (4) Total ¥(8) Note 1. Estimated fair value is provided by financial institutions.
As of March 31, 2016 Millions of yen Hedging method Transaction Main hedged items Contract Over Fair value type amount one year Deferral method Forward exchange contracts Buy Yen Accounts payable for construction contracts (forecast) ¥533 ¥9 ¥10 U.S. dollars Accounts payable for construction contracts (forecast) 308 – (24) Baht Accounts payable for construction contracts (forecast) 50 – (1) Euros Accounts payable for construction contracts (forecast) 37 – 1 Chinese Yuan Accounts payable for construction contracts (forecast) 2 – (0) Korean Won Accounts payable for construction contracts (forecast) 626 129 (51) Sell U.S. dollars Accounts receivable from completed construction contracts (forecast) 1,076 313 78 Chinese Yuan Accounts receivable from completed construction contracts (forecast) 572 – 0 Total ¥12 Note 1. Estimated fair value is provided by financial institutions.
As of March 31, 2016 Thousands of U.S. dollars Hedging method Transaction Main hedged items Contract Over Fair value type amount one year Deferral method Forward exchange contracts Buy Yen Accounts payable for construction contracts (forecast) $4,737 $81 $90 U.S. dollars Accounts payable for construction contracts (forecast) 2,733 – (216) Baht Accounts payable for construction contracts (forecast) 449 – (17) Euros Accounts payable for construction contracts (forecast) 329 – 14 Chinese Yuan Accounts payable for construction contracts (forecast) 24 – (1) Korean Won Accounts payable for construction contracts (forecast) 5,557 – (458) Sell U.S. dollars Accounts receivable from completed construction contracts (forecast) 9,549 2,781 695 Chinese Yuan Accounts receivable from completed construction contracts (forecast) 5,082 – 4 Total $111
37Taikisha Ltd. Annual Report 2016

Financial Sections
Interest-related transactions As of March 31, 2015 Millions of yen Hedging method Transaction type Main hedged items Contract amount Over one year Fair value Special treatment Interest rate swap Payment fixed receiving variable Long-term loans payable ¥102 ¥43 (Note 1) Note 1. Because special treatment of interest rate swaps is made together with hedged long-term loans payable, their market values of interest rate swaps have been included in those of the relevant long-term
loans payable.
As of March 31, 2016 Millions of yen Hedging method Transaction type Main hedged items Contract amount Over one year Fair value Special treatment Interest rate swap Payment fixed receiving variable Long-term loans payable ¥39 ¥– (Note 1) Note 1. Because special treatment of interest rate swaps is made together with hedged long-term loans payable, their market values of interest rate swaps have been included in those of the relevant long-term
loans payable.
As of March 31, 2016 Thousands of U.S. dollars Hedging method Transaction type Main hedged items Contract amount Over one year Fair value Special treatment Interest rate swap Payment fixed receiving variable Long-term loans payable $351 $–
12. Retirement and pension plans(1) Overview The Company and its domestic consolidated subsidiaries apply defined benefit plans and defined contribution plans. The Company and its domestic consolidated subsidiaries
have adopted defined contribution plans from this fiscal year. The overseas consolidated subsidiaries, which apply retirement benefit plan, apply defined benefit or defined contribution plans. The defined benefit plans consist of outside funded defined benefit pension plans and lump-sum retirement payment plans. A retirement benefit trust is set up in certain
outside funded benefit pension plan. Certain domestic and overseas consolidated subsidiaries, which apply lump-sum retirement payment plans, apply simplified method for calculating projected benefit
obligations.(2) Defined benefit plan (except simplified method) Reconciliation of beginning and ending balances for projected benefit obligations For the years ended March 31, 2015 and 2016 Millions of yen Thousands of U.S. dollars 2015 2016 2016 Projected benefit obligations at the beginning of current period ¥20,819 ¥17,765 $157,653 Cumulative effects of changes in accounting policies (3,804) – – Restated balance 17,014 17,765 157,653 Service costs 1,090 1,124 9,981 Interest costs 174 128 1,142 Actuarial differences accrued in the current period 414 982 8,718 Benefits paid (1,047) (1,223) (10,860) Prior service costs accrued in the current period – 1 12 Foreign currency translation 119 (90) (803) Projected benefit obligations at the end of current period ¥17,765 ¥18,688 $165,843
Reconciliation of beginning and ending balances for pension assets For the years ended March 31, 2015 and 2016 Millions of yen Thousands of U.S. dollars 2015 2016 2016 Pension assets at the beginning of current period ¥18,521 ¥21,389 $189,808 Expected return on pension assets 412 463 4,112 Actuarial differences accrued in the current period 2,193 (1,316) (11,686) Contributions from employers 1,250 1,230 10,916 Benefits paid (988) (1,179) (10,470) Foreign currency translation 0 (1) (10) Pension assets at the end of current period ¥21,389 ¥20,585 $182,670
38 Taikisha Ltd. Annual Report 2016

Reconciliation of projected benefit obligations, pension assets, net defined benefit liability, and net defined benefit asset in the consolidated balance sheets As of March 31, 2015 and 2016 Millions of yen Thousands of U.S. dollars 2015 2016 2016 Funded projected benefit obligations ¥16,772 ¥17,619 $156,352 Pension assets (21,389) (20,585) (182,670) Sub total (4,616) (2,965) (26,318) Unfunded projected benefit obligations 992 1,069 9,491 Net amount of liabilities and assets in the consolidated balance sheets (3,623) (1,896) (16,827) Net defined benefit liability 1,186 1,307 11,599 Net defined benefit asset 4,810 3,203 28,426 Net amount of liabilities and assets in the consolidated balance sheets ¥(3,623) ¥(1,896) $(16,827)
Retirement benefit expenses For the years ended March 31, 2015 and 2016 Millions of yen Thousands of U.S. dollars 2015 2016 2016 Service costs ¥1,090 ¥1,124 $9,981 Interest costs 174 128 1,142 Expected return on pension assets (412) (463) (4,112) Amortization of actuarial differences (6) (172) (1,530) Amortization of prior service costs (228) (227) (2,023) Retirement benefit expenses of defined benefit plans ¥617 ¥389 $3,458
Remeasurements of defined benefit plans Detail of remeasurements of defined benefit plans before tax effect adjustments is as follows. For the years ended March 31, 2015 and 2016 Millions of yen Thousands of U.S. dollars 2015 2016 2016 Prior service costs ¥(228) ¥(225) $(2,005) Actuarial differences 1,741 (2,470) (21,922) Total ¥1,512 ¥(2,696) $(23,927)
Accumulated remeasurements of defined benefit plans Detail of accumulated remeasurements of defined benefit plans before tax effect adjustments is as follows. As of March 31, 2015 and 2016 Millions of yen Thousands of U.S. dollars 2015 2016 2016 Unrecognized prior service costs ¥455 ¥229 $2,034 Unrecognized actuarial differences 745 (1,724) (15,305) Total ¥1,200 ¥(1,495) $(13,271)
Pension assets Composition ratio of pension assets is as follows. As of March 31, 2015 and 2016 2015 2016 Debt securities 18% 19% Stocks 38 39 Cash and deposits 0 3 General account of life insurance 33 35 Other 11 4 Total 100% 100% Note 1. For the previous fiscal year, 14% of total pension assets are attributed to the employee retirement benefit trust for benefit pension plan. For this fiscal year, 12% of total pension assets are attributed to the
employee retirement benefit trust for benefit pension plan.
39Taikisha Ltd. Annual Report 2016

Financial Sections
Expected long-term return rate on pension asset is determined by considering current and anticipated future portfolio of pension assets, and current and anticipated future long-term performance of individual asset classes that comprise the funds' asset mix.
Assumptions and policies used to calculate projected benefit obligations For the years ended March 31, 2015 and 2016 2015 2016 Discount rates (weighted average) 0.7% 0.3% Expected long-term return rates on pension assets (weighted average) 2.5% 2.5%
(3) Defined benefit plan calculated by simplified method Reconciliation of beginning and ending balances for net defined benefit liability by the simplified method For the years ended March 31, 2015 and 2016 Millions of yen Thousands of U.S. dollars 2015 2016 2016 Net defined benefit liability at the beginning of current period ¥327 ¥364 $3,236 Retirement benefit expenses 32 29 259 Benefits paid (4) (19) (172) Contributions to the plan (5) (10) (91) Foreign currency translation 12 (26) (239) Other 1 2 21 Net defined benefit liability at the end of current period ¥364 ¥339 $3,014
Reconciliation of projected benefit obligations, pension assets and net defined benefit liability in the consolidated balance sheets As of March 31, 2015 and 2016 Millions of yen Thousands of U.S. dollars 2015 2016 2016 Funded projected benefit obligations ¥87 ¥88 $786 Pension assets (66) (74) (658) Sub total 20 14 129 Unfunded projected benefit obligations 343 325 2,885 Net amount of liabilities and assets in the consolidated balance sheets 364 339 3,014
Net defined benefit liability 364 339 3,014 Net amount of liabilities and assets in the consolidated balance sheets ¥364 ¥339 $3,014
Retirement benefit expenses Retirement benefit expenses calculated by the simplified method is ¥ 32 million for the previous fiscal year and ¥ 29 million (US$ 259 thousand) for this fiscal year.
(4) Defined contribution plan Required contribution amount for defined contribution plan is ¥ 61 million for the previous fiscal year and ¥ 290 million (US$ 2,579 thousand) for this fiscal year.
(5) Multi-employer pension plan Required contribution amount for employees' pension fund of multi-employer pension plan which is recognized as retirement benefit expenses is ¥ 363 million for the previous fiscal
year and nothing applicable for this fiscal year. Total accumulated funds Millions of yen Thousands of U.S. dollars For the previous fiscal year For this fiscal year For this fiscal year As of October 31, 2014 As of March 31, 2016 As of March 31, 2016 Pension assets ¥40,880 ¥41,197 $365,578 Total amount of actuarial liability based on the financial calculations and minimum actuarial reserve (Note 1) 42,059 42,336 375,685 Net Amount ¥(1,179) ¥(1,139) $(10,107) Note 1. "Nishinihonreitokutyou Employees' Pension Fund" (integrated establishment agency-type) (hereinafter the "Fund"), which the Company and domestic consolidated subsidiaries are affiliated with, has
come to a decision on special dissolution that was discussed at the representative assembly that took place on September 18, 2013. The information above is based on information available as of the release of this report.
40 Taikisha Ltd. Annual Report 2016

Contribution ratio of the Companies in the multi-employer plan assets For the years ended March 31, 2015 and 2016 2015 2016 Contribution ratio 21.32% 21.32%
Additional information In the previous fiscal year, the Companies recognized "Reversal of reserve for loss on dissolution of employees' pension fund" of ¥400 million as extraordinary income in the
consolidated statement of income and "Reserve for loss on dissolution of employees' pension fund" of ¥251 million as non-current liabilities in the consolidated balance sheet.
In this fiscal year, the Companies recognized "Reversal of reserve for loss on dissolution of employees' pension fund" of ¥4 million (US$ 38 thousand) as extraordinary income in the consolidated statement of income and "Reserve for loss on dissolution of employees' pension fund" of ¥247 million (US$ 2,193 thousand) as current liabilities in the consolidated balance sheet.
With regard to standardized schedule proposed by the Fund in February 2016, the liquidation of the Fund is expected in the fiscal year 2016. Therefore, the Companies reclassified “Reserve for loss on dissolution of employees’ pension fund” from non-current liabilities to current liabilities from this fiscal year.
The principle factor relating to the net amount in total accumulated funds is a capital fund deficit of ¥1,179 million for the previous fiscal year and ¥1,139 million (US$ 10,107 thousand) for this fiscal year. As a result of the approval for dissolution of the Fund on January 27, 2015, the retirement benefit obligation is limited only for the substitutional portion of the fund managed on behalf of the government, and there are no unamortized prior service costs for the portion.
For the previous fiscal year and this fiscal year, contribution ratio of the Companies in the multi-employer plan assets is calculated by the proportional division of the Companies' standard salary out of the standard salary in the Fund as of September 30, 2013. This calculation method is in accordance with the amendment of the regulation based on the resolution of dissolution of the Fund which was approved on January 5, 2015.
13. Deferred tax accounting(1) Significant components of deferred tax assets and liabilities As of March 31, 2015 and 2016 Millions of yen Thousands of U.S. dollars 2015 2016 2016 Deferred tax assets Allowance for doubtful accounts ¥123 ¥9 $88 Provision for warranties for completed construction 166 350 3,111 Provision for loss on construction contracts 40 34 305 Provision for loss on Anti-Monopoly Act 67 – – Reserve for loss on dissolution of employees' pension fund 83 77 685 Net defined benefit liability 246 277 2,464 Employees' pension trust, investment securities 271 266 2,365 Provision for directors' retirement benefits 31 37 329 Accrued enterprise tax etc. 107 154 1,373 Accrued bonuses 903 1,299 11,534 Loss on valuation of investment securities 130 123 1,092 Loss on valuation of golf club membership 64 61 544 Valuation difference on available-for-sale securities 38 73 653 Deficit carried forward 586 414 3,680 Other 714 593 5,264 Sub total 3,576 3,773 33,487 Valuation allowance (828) (707) (6,279) Total deferred tax assets 2,748 3,066 27,208 Deferred tax liabilities Net defined benefit assets (1,554) (981) (8,711) Valuation difference on available-for-sale securities (4,932) (3,423) (30,377) Retained earnings of consolidated overseas subsidiaries (1,702) (1,753) (15,562) Other (225) (331) (2,938) Total deferred tax liabilities (8,415) (6,489) (57,588) Net deferred tax assets (or liabilities) ¥(5,666) ¥(3,423) $(30,380) Note 1. Net deferred tax assets (or liabilities) for the years ended March 31, 2015 and 2016 are recorded on the following account titles in the consolidated balance sheets.
As of March 31, 2015 and 2016 Millions of yen Thousands of U.S. dollars 2015 2016 2016 Current assets — Deferred tax assets ¥1,625 ¥1,993 $17,694 Non-current assets — Deferred tax assets 464 508 4,508 Current liabilities — Deferred tax liabilities (1) (53) (477) Non-current liabilities — Deferred tax liabilities ¥(7,755) ¥(5,871) $(52,105)
41Taikisha Ltd. Annual Report 2016

Financial Sections
Change in presentation methods “Provision for warranties for completed construction” which was indicated in “Other” of deferred tax assets is stated independently from this fiscal year, as its importance has
increased. To reflect this change in the presentation method, the reclassification is made in notes of consolidated financial statements. As a result, ¥166 million indicated in “Other” of deferred tax assets for the previous fiscal year is reclassified into ¥166 million in “Provision for warranties for completed
construction.”
(2) The reconciliation between the effective statutory tax rate and the actual tax rate after the application of tax effect accounting As of March 31, 2015 and 2016 2015 2016 Effective statutory tax rate 35.64% –% (Adjustments) Permanent differences: entertainment expenses, donations etc. 0.46 – Permanent differences: dividend income etc. (0.72) – Equalization of inhabitants taxes 0.80 – Fluctuation of valuation allowance (4.77) – Elimination of intercompany dividends 0.75 – Lower income tax rates applicable to income in certain foreign countries (3.56) – Tax on dividends from overseas subsidiaries and associates 1.11 – Modification of deferred tax assets cause from change of tax-rate 0.30 – Retained earnings of consolidated overseas subsidiaries 3.12 – Other 0.09 – Actual effective tax rate 33.22% –% Note 1. The note is omitted because the difference between effective statutory tax rate and actual effective tax rate after adoption of tax effect accounting is less than 5% of effective statutory tax rate for this fical
year.
(3) Change in the amount of deferred tax assets and liabilities due to the revision of tax rate As the "Partial Revision of the Income Tax Act, etc." and the "Partial Revision of the Local Tax Act, etc." were enacted in the Diet on March 29, 2016, the effective statutory tax
rates that are applied in this fiscal year to calculate deferred tax assets and deferred tax liabilities are revised (Only for those that the temporary difference will be realized on and after April 1, 2016). Specifically, effective statutory tax rates are revised from the existing 32.30% to 30.86% for those collection or payment periods are by March 31, 2018, and to 30.62% for those collection or payment periods are on and after April 1, 2018.
Due to this revision of the effective statutory tax rates, deferred tax liabilities decreased by ¥163 million (US$ 1,451 thousand), accumulated remeasurements of defined benefit plans decreased by ¥19 million (US$ 176 thousand), valuation difference on available-for-sale securities increased by ¥183 million (US$ 1,631 thousand), and income taxes-deferred increased by ¥0 million (US$ 4 thousand).
14. Asset retirement obligations The Companies are under the term of rental agreements for head offices etc. and have obligations for restitution on their leaving. The obligations are recognized by way of
decreasing deposits.
15. Segment information(1) Overview of reportable segments The reportable segments of the Companies are components for which discrete financial information is available and whose operating results are regularly reviewed by the board
of directors to make decisions about resource allocation and to assess performance. The Companies set their divisions according to kinds of construction equipment and each division plans the comprehensive domestic and foreign strategies and do business
based on the strategies. The Companies have two reportable segments "Green Technology System Division" and "Paint Finishing System Division". "Green Technology System Division" mainly designs, manages and constructs building HVAC for office buildings, and industrial HVAC for manufacturing facilities and
laboratories. This division also produces and sells related equipments. "Paint Finishing System Division" mainly designs, manages and constructs automobile paint plants and sells related equipments.
(2) Calculation method of sales and profits or losses, assets or liabilities and others The accounting treatment of reportable segments is almost all the same as the one the Companies apply when preparing the consolidated financial statements. The profit of reportable segments is the amount on the basis of ordinary income. Internal profits and transfer amounts between the segments are calculated based on the
market price.
42 Taikisha Ltd. Annual Report 2016

(3) Sales and profits or losses, assets or liabilities and others by reportable segments For the year ended March 31, 2015 Millions of yen Green Technology Paint Finishing Total Adjustments Consolidated System Division System Division Sales Sales to customers ¥116,134 ¥67,513 ¥183,648 ¥– ¥183,648 Intersegment 15 100 116 (116) – Total 116,150 67,614 183,764 (116) 183,648 Segment profit 5,991 3,260 9,252 327 9,579 Segment assets 80,697 57,449 138,147 50,136 188,283 Other items Depreciation and amortization 429 814 1,244 13 1,257 Amortization of goodwill – 175 175 – 175 Interest income 232 217 449 10 460 Interest expenses 46 163 210 12 222 Share of profit of entities accounted for using equity method – 52 52 – 52 Investments in associates accounted for using equity method – 770 770 – 770 Increase in tangible and intangible assets ¥295 ¥837 ¥1,132 ¥318 ¥1,450 Note 1. The amounts of Adjustments are as follows. Adjustments of Segment profit of ¥327 million include non-allocatable common profits of ¥331 million and other adjustment of minus ¥3 million. Non-allocatable common profits are mainly dividend
income etc. which are not attributed to any reportable segments. Adjustments of Segment assets of ¥50,136 million are elimination of receivable and payable etc. of minus ¥2,581 million and non-allocatable common assets which are not allocated to any
segments of ¥52,718 million. Non-allocatable common assets are mainly cash and deposits, securities, tangible fixed assets, investment securities, and net defined benefit asset, etc. which are not attributed to any reportable segments.
Adjustments of Increase in tangible and intangible assets of ¥318 million are buildings and structures, machinery, equipment and vehicles, tools, furniture and fixtures and software, etc. which are not attributed to any reportable segments.
The allocation method of assets for reportable segments is different from that of related income and expenses. Note 2. Segment profit is adjusted to the ordinary income of the consolidated statement of income.
For the year ended March 31, 2016 Millions of yen Green Technology Paint Finishing Total Adjustments Consolidated System Division System Division Sales Sales to customers ¥134,822 ¥77,602 ¥212,424 ¥– ¥212,424 Intersegment 2 133 135 (135) – Total 134,824 77,735 212,560 (135) 212,424 Segment profit 8,950 3,524 12,475 (132) 12,343 Segment assets 87,472 65,430 152,902 36,663 189,566 Other items Depreciation and amortization 448 899 1,348 0 1,348 Amortization of goodwill – 192 192 – 192 Interest income 181 466 647 1 648 Interest expenses 30 149 179 9 189 Share of profit of entities accounted for using equity method – 18 18 – 18 Investments in associates accounted for using equity method – 727 727 – 727 Increase in tangible and intangible assets ¥151 ¥1,024 ¥1,176 ¥745 ¥1,921 Note 1. The amounts of Adjustments are as follows. Adjustments of Segment profit of minus ¥132 million (minus US$ 1,175 thousand) include non-allocatable common profits of minus ¥136 million (minus US$ 1,213 thousand) and other adjustment of ¥4
million (US$ 38 thousand). Non-allocatable common profits are mainly general and administrative expenses, dividend income, etc. which are not attributed to any reportable segments. Adjustments of Segment assets of ¥36,663 million (US$ 325,351 thousand) are elimination of receivable and payable etc. of minus ¥2,739 million (minus US$ 24,311 thousand) and non-allocatable
common assets which are not allocated to any segments of ¥39,403 million (US$ 349,662 thousand). Non-allocatable common assets are mainly cash and deposits, tangible fixed assets, investment securities, and net defined benefit asset, etc. which are not attributed to any reportable segments.
Adjustments of Increase in tangible and intangible assets of ¥745 million (US$ 6,612 thousand) are buildings and structures, machinery, equipment and vehicles, tools, furniture and fixtures and software, etc. which are not attributed to any reportable segments.
The allocation method of assets for reportable segments is different from that of related income and expenses. Note 2. Segment profit is adjusted to the ordinary income of the consolidated statement of income.
43Taikisha Ltd. Annual Report 2016

For the year ended March 31, 2016 Thousands of U.S. dollars Green Technology Paint Finishing Total Adjustments Consolidated System Division System Division Sales Sales to customers $1,196,404 $688,633 $1,885,037 $– $1,885,037 Intersegment 19 1,181 1,200 (1,200) – Total 1,196,423 689,814 1,886,237 (1,200) 1,885,037 Segment profit 79,430 31,278 110,708 (1,175) 109,533 Segment assets 776,224 580,621 1,356,845 325,351 1,682,196 Other items Depreciation and amortization 3,984 7,978 11,962 8 11,970 Amortization of goodwill – 1,709 1,709 – 1,709 Interest income 1,610 4,136 5,746 11 5,757 Interest expenses 269 1,327 1,596 87 1,683 Share of profit of entities accounted for using equity method – 167 167 – 167 Investments in associates accounted for using equity method – 6,454 6,454 – 6,454 Increase in tangible and intangible assets $1,347 $9,089 $10,436 $6,612 $17,048
16. Related information in regard to segment information(1) Information by product and service For the year ended March 31, 2015 This item is omitted because similar information is disclosed in "15. Segment information"
For the year ended March 31, 2016 This item is omitted because similar information is disclosed in "15. Segment information"
(2) Sales by regions For the year ended March 31, 2015 Millions of yen Japan North America Southeast Asia East Asia India Other Total Thailand Other Southeast Asia China Other East Asia ¥82,303 ¥7,669 ¥22,896 ¥23,719 ¥15,805 ¥1,365 ¥3,123 ¥26,765 ¥183,648 Note 1. Sales are classified to the countries or regions based on their customers' location.
For the year ended March 31, 2016 Millions of yen Japan North America Southeast Asia East Asia India Other Total Thailand Other Southeast Asia China Other East Asia ¥94,543 ¥11,542 ¥34,197 ¥21,691 ¥23,060 ¥1,437 ¥8,563 ¥17,389 ¥212,424 Note 1. Sales are classified to the countries or regions based on their customers' location.
For the year ended March 31, 2016 Thousands of U.S. dollars Japan North America Southeast Asia East Asia India Other Total Thailand Other Southeast Asia China Other East Asia $838,966 $102,424 $303,462 $192,491 $204,638 $12,758 $75,990 $154,308 $1,885,037
(3) Tangible fixed assets by regions As of March 31, 2015 Millions of yen Japan Thailand Indonesia China India Italy Other Total ¥2,978 ¥493 ¥375 ¥1,213 ¥1,833 ¥872 ¥277 ¥8,043
As of March 31, 2016 Millions of yen Japan Thailand Indonesia China India Italy Other Total ¥2,939 ¥405 ¥300 ¥1,061 ¥1,965 ¥850 ¥226 ¥7,750
As of March 31, 2016 Thousands of U.S. dollars Japan Thailand Indonesia China India Italy Other Total $26,089 $3,598 $2,663 $9,420 $17,444 $7,550 $2,010 $68,774
Financial Sections
44 Taikisha Ltd. Annual Report 2016

(4) Sales Information by main customers For the year ended March 31, 2015 This item is omitted because sales to no external customer represented 10% or more of sales of the consolidated statement of income.
For the year ended March 31, 2016 This item is omitted because sales to no external customer represented 10% or more of sales of the consolidated statement of income.
17. Impairment loss by reportable segmentsImpairment loss of the non-current assets by reportable segments For the year ended March 31, 2015 Millions of yen Green Technology Paint Finishing Total Eliminations/ Consolidated System Division System Division Corporate (*1) Impairment loss ¥0 ¥85 ¥86 ¥9 ¥96 (*1) Eliminations/Corporate is due to the impairment on assets that will be removed because of office relocation.
For the year ended March 31, 2016 Millions of yen Green Technology Paint Finishing Total Eliminations/ Consolidated System Division System Division Corporate (*1) Impairment loss ¥– ¥– ¥– ¥0 ¥0 (*1) Eliminations/Corporate is due to the impairment on idle asset.
For the year ended March 31, 2016 Thousands of U.S. dollars Green Technology Paint Finishing Total Eliminations/ Consolidated System Division System Division Corporate Impairment loss $– $– $– $0 $0
18. Amortization and balance of goodwill(1) Amortization and balance of goodwill by reportable segments For the year ended March 31, 2015 Millions of yen Green Technology Paint Finishing Total Eliminations/ Consolidated System Division System Division Corporate Balance of goodwill ¥– ¥3,481 ¥3,481 ¥– ¥3,481 Note 1. Amortization of goodwill is omitted because it is already disclosed in the "Segment information".
For the year ended March 31, 2016 Millions of yen Green Technology Paint Finishing Total Eliminations/ Consolidated System Division System Division Corporate Balance of goodwill ¥– ¥3,024 ¥3,024 ¥– ¥3,024 Note 1. Amortization of goodwill is omitted because it is already disclosed in the "Segment information".
For the year ended March 31, 2016 Thousands of U.S. dollars Green Technology Paint Finishing Total Eliminations/ Consolidated System Division System Division Corporate Balance of goodwill $– $26,836 $26,836 $– $26,836
(2) Gain on negative goodwill by reportable segments For the year ended March 31, 2015 There is nothing applicable. For the year ended March 31, 2016 There is nothing applicable.
45Taikisha Ltd. Annual Report 2016

Financial Sections
19. Related party transaction For the year ended March 31, 2015 There is nothing applicable. For the year ended March 31, 2016 Category Name of Ratio of voting Relationship Detail of Amount of Transaction Accounts Balance at the related party rights holding (held) Transaction end of the year Director’s Ruriko (Held) Mother of Eitaro Purchase of ¥2,206 million close relative Uenishi Direct: 3.09% Uenishi, director and treasury (US$19,581 thousand) – – chairman of the Company shares for 680 thousand shares Note 1. The transaction was executed through the Tokyo Stock Exchange Trading Network System for Off-Auction Own Share Repurchase Trading (ToSTNeT-3), and price of transaction was decided by closing price
of the day before the trade date in Tokyo Stock Exchange. Note 2. The above ratio of voting rights holding (held) is the figure before selling shares. As a result of selling 680,000 shares on May 18, 2015, the ratio held decreased to 1.19%.
20. Detail of bonds There is nothing applicable.
21. Detail of loans As of March 31, 2016 Millions of yen Thousands of U.S. dollars Beginning Ending Ending Average Maturity balance balance balance interest rate (%) Short-term loans payable ¥8,113 ¥3,310 $29,378 2.590 Current portion of long-term loans payable 1,778 1,950 17,310 2.128 Current portion of lease obligations 30 31 281 – Long-term loans payable October 2018 to (excluding current portion) 536 1,383 12,274 4.020 October 2022 Lease obligations March 2018 to (excluding current portion) 54 49 442 – November 2021 Total ¥10,513 ¥6,725 $59,685 Note 1. The "Average interest rate" is the weighted average interest rate for the ending balance of loans etc. Note 2. The average interest rates on lease obligations are not presented because interest equivalents in the total lease obligation are allocated to expenses every year by the straight-line method. Note 3. The annual repayment schedules of long-term loans payable and lease obligations (excluding current portion) subsequent to March 31, 2016 are as follows.
Millions of yen Over one year Over two years Over three years Over four years within two years within three years within four years within five years Long-term loans payable ¥643 ¥433 ¥165 ¥84 Lease obligations ¥22 ¥15 ¥7 ¥4
Thousands of U.S. dollars Over one year Over two years Over three years Over four years within two years within three years within four years within five years Long-term loans payable $5,713 $3,845 $1,470 $753 Lease obligations $196 $141 $65 $40
22. Detail of asset retirement obligations This item is omitted because asset retirement obligations represented less than 1% of total assets at the beginning of this fiscal year and at the end of this fiscal year,
respectively.
23. Subsequent event There is nothing applicable.
46 Taikisha Ltd. Annual Report 2016

Report of Independent Auditors
47Taikisha Ltd. Annual Report 2016

4 8
25
30 3129
15
10
17
5 6 73
35
13 14
23 241 2
409
37
11
26
12 18 32 33
34
16
22
20
36 39
21
38
28
27
19
Green Technology System Division and Paint Finishing System Division Green Technology System Division Paint Finishing System Division
Corporate Data
Corporate Directory(As of March 31, 2016)
48 Taikisha Ltd. Annual Report 2016
1 Taikisha Ltd. -------------------------------------------------------------------------------------------------------------------------------------- 1913Sumitomo Fudosan Shinjuku Grand Tower, 8-17-1, Nishi-Shinjuku, Shinjuku-ku, Tokyo, 160-6129, JapanTel: 81-3-3365-5320 Fax: 81-3-5338-5195
2 San Esu Industry Co., Ltd. -------------------------------------------------------------------------------------- 19763-24, Ikaga Midori-machi, Hirakata-shi, Osaka, 573-0067, JapanTel: 81-72-845-0128 Fax: 81-72-845-1660
3 Taikisha (Thailand) Co., Ltd. ----------------------------------------------------------------------------- 19716th Floor, Thaniya Bldg., 62 Silom Road, Bangkok 10500, ThailandTel: 66-2-236-8055 Fax: 66-2-236-3502
4 Taikisha Trading (Thailand) Co., Ltd. ---------------------------------------------- 19836th Floor, Thaniya Bldg., 62 Silom Road, Bangkok 10500, ThailandTel: 66-2-236-8055 Fax: 66-2-236-3502
5 Thaiken Maintenance & Service Co., Ltd. ----------------------------- 1990445 Moo 17, Thepharak Rd., T. Bangsaothong, Amphur Bangsaothong ,Samutprakarn 10540, ThailandTel: 66-2-705-8744 Fax: 66-2-705-8748
6 Token Interior & Design Co., Ltd. ------------------------------------------------------------ 19869th Floor., Thaniya Bldg., 62 Silom Road., Bangkok 10500, ThailandTel: 66-2-236-9103 Fax: 66-2-236-0119
7 TKA Co., Ltd. --------------------------------------------------------------------------------------------------------------------------------------- 1991445 Moo 17, Bangna-Trad Rd., Km. 23, Tambol Bangsaothong, Amphur Bangsaothong, Samutprakarn 10540, ThailandTel: 66-2-705-8363 Fax: 66-2-705-8993
8 Token Myanmar Co., Ltd. ---------------------------------------------------------------------------------------- 2015No.395 (Right), 6th Floor, Wireless (3) St,Kabaraya (9) Ward, Mayangone Tsp, Yangon, MyanmarTEL: 95-92-6424-2824
9 Taikisha Engineering (M) Sdn. Bhd. ------------------------------------------------ 1989Suite W301 & W306, 3rd Floor West Wing, Wisma Consplant 1, No.2, Jalan SS 16/4, Subang Jaya, Selangor 47500, MalaysiaTel: 60-3-5623-7200 Fax: 60-3-5623-7201
10 P.T. Taikisha Indonesia Engineering ------------------------------------------------ 1990Menara Bidakara I, 13th Floor Jl. Jend. Gatot Subroto Kav. 71-73, Jakarta 12870 ,IndonesiaTel: 62-21-8379-3325 Fax: 62-21-8379-3310
11 Taikisha Philippines Inc. ------------------------------------------------------------------------------------------ 19955th Floor, Golden Rock Bldg., No.168 Salcedo St., Legaspi Village, Makati City, 1229, PhilippinesTel: 63-2-818-1707 Fax: 63-2-816-1516
12 Taikisha Vietnam Engineering Inc. ---------------------------------------------------- 199812th Floor, Detech Tower, No. 8 Ton That Thuyet , My Dinh 2 Ward, Nam Tu Liem District, Hanoi, VietnamTel: 84-4-3562-2750 Fax: 84-4-3562-2751
13 Wuzhou Taikisha Engineering Co., Ltd. ------------------------------------ 1994#1110, Beijing Fortune Bldg., #5 Dong San Huan Bei Lu, Chaoyang District, Beijing 100004, ChinaTel: 86-10-6590-8251 Fax: 86-10-6590-8257
14 Beijing Wuzhou Taikisha Equipment Co., Ltd. ------------ 2002#1116, Beijing Fortune Bldg., #5 Dong San Huan Bei Lu, Chaoyang District, Beijing 100004, ChinaTel: 86-10-6590-8253 Fax: 86-10-6590-8250
15 Taikisha Engineering India Private Ltd. ---------------------------------- 1995Plot No. 26, Udyog Vihar, Phase-IV, Gurgaon-122015. IndiaTel: 91-124-234-8246 Fax: 91-124-234-8247
16 Geico S.p.A. ----------------------------------------------------------------------------------------------------------------------------------------- 1963Via Pelizza da Volpedo, 109/111, 20092 Cinisello Balsamo, Milan, ItalyTel: 39-2-660221 Fax: 39-2-66022.310
17 Geico Taikisha Europe Ltd. --------------------------------------------------------------------------------- 1989Central Boulevard, Blythe Valley Business Park Shirley, West Midlands, B90 8AG, United KingdomTel: 44-121-700-1140 Fax: 44-1564-711-001
18 J-CO Mexico,S. de R.L de C.V. --------------------------------------------------------------------------- 2014Bosque de Ciruelos, 180 Bosques de Las Lomas, Miguel Hidalgo 11700 Ciudad de México, D.F., MexicoTel: 52-55-2282-1030 Fax: 52-55-2282-1001
19 Geico Brasil Ltda. -------------------------------------------------------------------------------------------------------------------- 1995Rua Francisco Rocha n. 2113, Bairo Bigorrilho, Cep 80710, 540, Curitiba, Paranà, BrasileTel: 55-41-3019-2727 Fax: 55-41-3336-7534
20 Geico Paint Shop India Private Ltd. -------------------------------------------------- 2006A-4, 5th Floor The 5th Avenue, Dhole Patil Road, 411001, Pune, Maharashtra, IndiaTel: 91-997-039-3892
21 Geico Painting System (Suzhou) Co., Ltd. ---------------------------- 2011Room 1702, Harmony Mansion, No.8 wan sheng street, building 1, Suzhou Industrial Park, 215000 ChinaTel: 86-512-8555-0256 Fax:86-512-8555-0701
22 Geico Russia LLC ------------------------------------------------------------------------------------------------------------------------ 201112, Krasnopresnenskaya emb., Entrance 6, office 303, 123610 Moscow - RussiaTel:7-495-249-0780
Location of office FOUNDATION Location of office FOUNDATION Location of office FOUNDATION
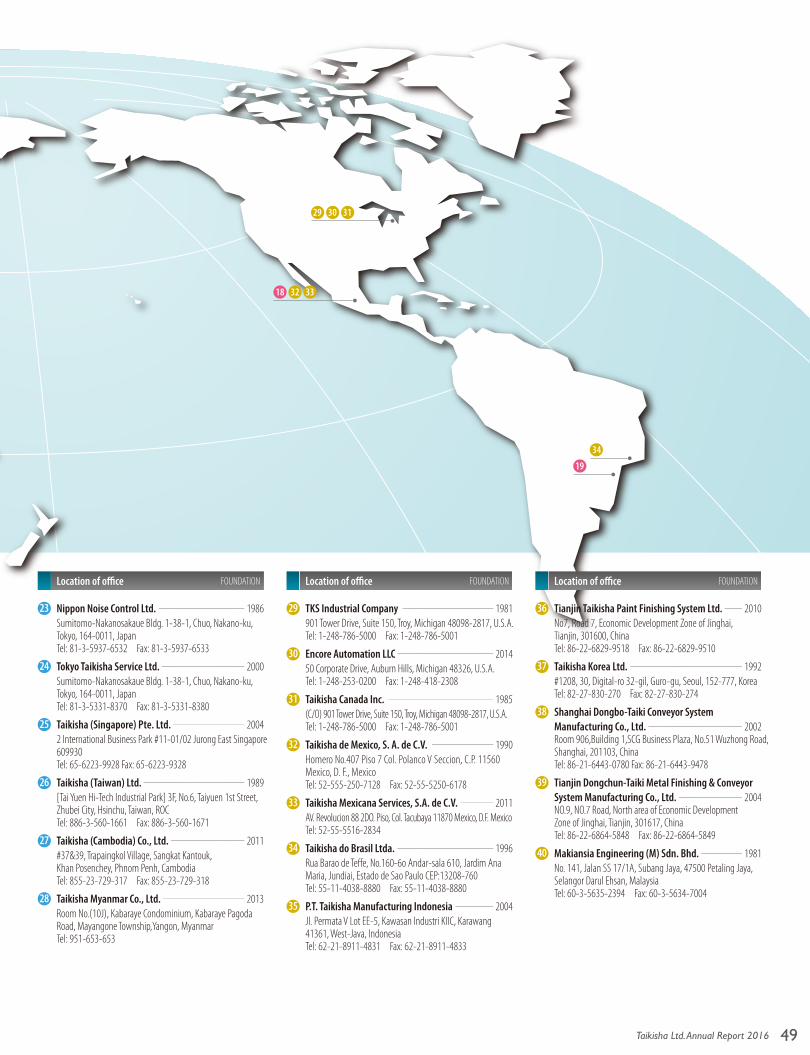
4 8
25
30 3129
15
10
17
5 6 73
35
13 14
23 241 2
409
37
11
26
12 18 32 33
34
16
22
20
36 39
21
38
28
27
19
Green Technology System Division and Paint Finishing System Division Green Technology System Division Paint Finishing System Division
49Taikisha Ltd. Annual Report 2016
23 Nippon Noise Control Ltd. ------------------------------------------------------------------------------------ 1986Sumitomo-Nakanosakaue Bldg. 1-38-1, Chuo, Nakano-ku, Tokyo, 164-0011, JapanTel: 81-3-5937-6532 Fax: 81-3-5937-6533
24 Tokyo Taikisha Service Ltd. --------------------------------------------------------------------------------- 2000Sumitomo-Nakanosakaue Bldg. 1-38-1, Chuo, Nakano-ku, Tokyo, 164-0011, JapanTel: 81-3-5331-8370 Fax: 81-3-5331-8380
25 Taikisha (Singapore) Pte. Ltd. ---------------------------------------------------------------------- 20042 International Business Park #11-01/02 Jurong East Singapore 609930Tel: 65-6223-9928 Fax: 65-6223-9328
26 Taikisha (Taiwan) Ltd. --------------------------------------------------------------------------------------------------- 1989[Tai Yuen Hi-Tech Industrial Park] 3F, No.6, Taiyuen 1st Street, Zhubei City, Hsinchu, Taiwan, ROCTel: 886-3-560-1661 Fax: 886-3-560-1671
27 Taikisha (Cambodia) Co., Ltd. ------------------------------------------------------------------------ 2011#37&39, Trapaingkol Village, Sangkat Kantouk, Khan Posenchey, Phnom Penh, CambodiaTel: 855-23-729-317 Fax: 855-23-729-318
28 Taikisha Myanmar Co., Ltd. -------------------------------------------------------------------------------- 2013Room No.(10J), Kabaraye Condominium, Kabaraye Pagoda Road, Mayangone Township,Yangon, Myanmar Tel: 951-653-653
29 TKS Industrial Company ----------------------------------------------------------------------------------------- 1981901 Tower Drive, Suite 150, Troy, Michigan 48098-2817, U.S.A.Tel: 1-248-786-5000 Fax: 1-248-786-5001
30 Encore Automation LLC ---------------------------------------------------------------------------------------------- 201450 Corporate Drive, Auburn Hills, Michigan 48326, U.S.A. Tel: 1-248-253-0200 Fax: 1-248-418-2308
31 Taikisha Canada Inc. ------------------------------------------------------------------------------------------------------- 1985(C/O) 901 Tower Drive, Suite 150, Troy, Michigan 48098-2817, U.S.A.Tel: 1-248-786-5000 Fax: 1-248-786-5001
32 Taikisha de Mexico, S. A. de C.V. ------------------------------------------------------------ 1990Homero No.407 Piso 7 Col. Polanco V Seccion, C.P. 11560 Mexico, D. F., MexicoTel: 52-555-250-7128 Fax: 52-55-5250-6178
33 Taikisha Mexicana Services, S.A. de C.V. -------------------------------- 2011AV. Revolucion 88 2DO. Piso, Col. Tacubaya 11870 Mexico, D.F. MexicoTel: 52-55-5516-2834
34 Taikisha do Brasil Ltda. ---------------------------------------------------------------------------------------------- 1996Rua Barao de Teffe, No.160-6o Andar-sala 610, Jardim Ana Maria, Jundiai, Estado de Sao Paulo CEP:13208-760Tel: 55-11-4038-8880 Fax: 55-11-4038-8880
35 P.T. Taikisha Manufacturing Indonesia ------------------------------------- 2004Jl. Permata V Lot EE-5, Kawasan Industri KIIC, Karawang 41361, West-Java, IndonesiaTel: 62-21-8911-4831 Fax: 62-21-8911-4833
36 Tianjin Taikisha Paint Finishing System Ltd. ----------------- 2010No7, Road 7, Economic Development Zone of Jinghai, Tianjin, 301600, ChinaTel: 86-22-6829-9518 Fax: 86-22-6829-9510
37 Taikisha Korea Ltd. -------------------------------------------------------------------------------------------------------------- 1992#1208, 30, Digital-ro 32-gil, Guro-gu, Seoul, 152-777, KoreaTel: 82-27-830-270 Fax: 82-27-830-274
38 Shanghai Dongbo-Taiki Conveyor System Manufacturing Co., Ltd. -------------------------------------------------------------------------------------------- 2002
Room 906,Building 1,SCG Business Plaza, No.51 Wuzhong Road, Shanghai, 201103, ChinaTel: 86-21-6443-0780 Fax: 86-21-6443-9478
39 Tianjin Dongchun-Taiki Metal Finishing & Conveyor System Manufacturing Co., Ltd. -------------------------------------------------------------- 2004
NO.9, NO.7 Road, North area of Economic Development Zone of Jinghai, Tianjin, 301617, ChinaTel: 86-22-6864-5848 Fax: 86-22-6864-5849
40 Makiansia Engineering (M) Sdn. Bhd. ---------------------------------------- 1981No. 141, Jalan SS 17/1A, Subang Jaya, 47500 Petaling Jaya, Selangor Darul Ehsan, MalaysiaTel: 60-3-5635-2394 Fax: 60-3-5634-7004
Location of office FOUNDATION Location of office FOUNDATION Location of office FOUNDATION

Corporate Data
Directors
Director, ChairmanRepresentative Director, President Corporate Officer
April 1974 Joined the Company
June 2003 Director
April 2005 General Manager, Osaka Branch Office, Green Technology System Division
April 2007 Director, Senior Corporate Officer, General Manager, Tokyo Branch Office 1, Green Technology System Division
April 2008 Director, Senior Corporate Officer, Assistant to President, in charge of Corporate Planning
April 2009 Director, Managing Corporate Officer, Assistant to President, in charge of Company-wide Sales Promotion
April 2010 Representative Director, President Corporate Officer
April 2013 Representative Director, Chairman Corporate Officer
April 2016 Director, Chairman (current position)
April 1968 Joined the Company
April 2008 Corporate Officer, General Manager, Global Business Management Supporting Office, Green Technology System Division, and Vice General Manager, Engineering Dept., Green Technology System Division, and General Manager, Construction Purchasing Office, Green Technology System Division
April 2009 Senior Corporate Officer, Senior General Manager, Engineering Dept., Green Technology System Division
April 2012 Managing Corporate Officer, Chief General Manager, Green Technology System Division June 2012 Director, Managing Corporate Officer, Chief General Manager, Green Technology System Division
April 2013 Director, Executive Corporate Officer, Chief General Manager, Green Technology System Division
April 2015 Director, Executive Vice President Corporate Officer, Chief General Manager, Green Technology System Division
April 2016 Representative Director, Executive Vice President Corporate Officer (current position)
April 1972 Joined the Company
June 2005 Director
April 2007 Director, Senior Corporate Officer, Vice General Manager, Paint Finishing System Division, and Senior General Manager, Engineering Dept., Paint Finishing System Division
April 2009 Director, Managing Corporate Officer, Vice General Manager, Paint Finishing System Division, and Senior General Manager, Engineering Dept., Paint Finishing System Division
April 2010 Director, Managing Corporate Officer, Chief General Manager, Paint Finishing System Division
April 2012 Director, Executive Corporate Officer, Chief General Manager, Paint Finishing System Division
April 2014 Director, Executive Corporate Officer, Chief Executive, Corporate Planning Headquarters
April 2015 Director, Executive Vice President Corporate Officer, Chief Executive, Corporate Planning Headquarters (current position)
April 1970 Joined the Company
June 2003 Director
April 2005 Chief General Manager, Paint Finishing System Division
June 2005 Managing Director
April 2006 Chief General Manager, Paint Finishing System Division, and Senior General Manager, Sales and Marketing Dept., Paint Finishing System Division
April 2007 Director, Managing Corporate Officer, Chief General Manager, Paint Finishing System Division
April 2009 Director, Executive Corporate Officer, Chief General Manager, Paint Finishing System Division
April 2010 Representative Director, Executive Vice President Corporate Officer
April 2013 Representative Director, President Corporate Officer (current position)
April 1978 Joined the Company
June 2005 Director
April 2007 Assistant to Chief General Manager, Green Technology System Division
April 2009 Corporate Officer; General Manager, Engineering Planning Dept., Green Technology System Division
April 2010 Managing Corporate Officer, Chief General Manager, Green Technology System Division, and General Manager, Engineering Planning Dept., Green Technology System Division
June 2010 Director, Managing Corporate Officer, Chief General Manager, Green Technology System Division, and General Manager, Engineering Planning Dept., Green Technology System Division
April 2012 Director, Managing Corporate Officer, Chief Executive, Corporate Planning Headquarters and in charge of Environment, and General Manager, Corporate Planning Office
April 2013 Director, Managing Corporate Officer, Chief Executive, Corporate Planning Headquarters and in charge of CSR
April 2014 Director, Managing Corporate Officer, Chief Executive, Administrative Management Headquarters and in charge of CSR
April 2016 Director, Executive Corporate Officer, Chief Executive, Administrative Management Headquarters and in charge of CSR (current position)
April 1972 Joined the Company
April 2007 Corporate Officer, Senior General Manager, Process Quality Dept., Paint Finishing System Division
April 2010 Senior Corporate Officer, Vice General Manager, Paint Finishing System Division, and Senior General Manager, Engineering Dept., Paint Finishing System Division
June 2011 Director, Senior Corporate Officer, Vice General Manager, Paint Finishing System Division, and Senior General Manager, Engineering Dept., Paint Finishing System Division
April 2012 Director, Managing Corporate Officer, Vice General Manager, Paint Finishing System Division, and Senior General Manager, Engineering Dept., Paint Finishing System Division
April 2013 Director, Managing Corporate Officer, Vice General Manager, Paint Finishing System Division
April 2014 Director, Managing Corporate Officer, Chief General Manager, Paint Finishing System Division
April 2016 Director, Executive Corporate Officer, Chief General Manager, Paint Finishing System Division (current position)
Eitaro Uenishi Satoru Kamiyama
Director, Executive Vice President Corporate Officer
Director, Executive Corporate Officer
Representative Director, Executive Vice President Corporate Officer
Director, Executive Corporate Officer
Kiyoshi Hashimoto
Koji Kato
Toshiaki Shiba
Tetsuya Ogawa
Directors and Audit & Supervisory Board Members
50 Taikisha Ltd. Annual Report 2016

April 1974 Joined the CompanyApril 2012 Corporate Officer, General Manager, Osaka Branch Office, Green Technology System DivisionApril 2014 Senior Corporate Officer, General Manager, Osaka Branch Office, Green Technology System DivisionApril 2015 Managing Corporate Officer, Vice General Manager, Green Technology System DivisionJune 2015 Director, Managing Corporate Officer, Vice General Manager, Green Technology System DivisionApril 2016 Director, Managing Corporate Officer, Chief General Manager, Green Technology System Division (current
position)
April 1981 Joined the CompanyApril 2010 Corporate Officer, General Manager, Office 1, Paint Finishing System DivisionApril 2013 Senior Corporate Officer, Senior General Manager, Engineering Dept., Paint Finishing System DivisionApril 2015 Senior Corporate Officer, Vice General Manager, Paint Finishing System Division, and Senior General
Manager, Sales and Engineering Dept., Paint Finishing System DivisionJune 2015 Director, Senior Corporate Officer, Vice General Manager, Paint Finishing System Division, and Senior
General Manager, Sales and Engineering Dept., Paint Finishing System DivisionApril 2016 Director, Managing Corporate Officer, Vice General Manager, Paint Finishing System Division (current
position)
April 2005 Managing Corporate Officer, General Manager, Shikoku Business, Sompo Japan Insurance Inc. (current Sompo Japan Nipponkoa Insurance Inc.)April 2008 Advisor, Corporate Planning Department. Sompo Japan Insurance Inc.June 2008 Resigned from Sompo Japan Insurance Inc.
Audit & Supervisory Board Member of the Company Full-time Outside Audit & Supervisory Board Member, Origin Electric Co., Ltd. (Retired in June 2012)
June 2012 Director of the Company (current position)
April 1972 Joined The Industrial Bank of Japan, Limited (current Mizuho Bank, Ltd.) (Resigned in March 2001)June 2001 Executive Officer, Dowa Mining Co., Ltd. (current Dowa Holdings Co., Ltd.)March 2002 Outside Audit & Supervisory Board Member, Fujita Kanko Inc. (Retired in March 2003)June 2002 Director in charge of corporate staff, Dowa Mining Co., Ltd.April 2003 Director and CFO in charge of corporate staff, Dowa Mining Co., Ltd.June 2006 Director, Executive Vice President, Dowa Mining Co., Ltd. (Retired in March 2008)October 2007 Advisor, Fujita Kanko Inc.March 2008 Representative Director, Executive Officer and President, Fujita Kanko Inc.August 2009 Representative Director, Executive Officer, President, Chief General Manager and in charge of Mejiro
District in Business Division, Fujita Kanko Inc.February 2010 Representative Director, Executive Officer and President, Fujita Kanko Inc.March 2013 Chairman, Fujita Kanko Inc.April 2014 Counselor, Fujita Kanko Inc. (Resigned in March 2015)February 2016 Outside Audit & Supervisory Board Member, Tobu Trading Co., Ltd. (current position)April 2016 Outside Director, Kamakura Shinsho, Ltd. (current position)
Full-time Audit & Supervisory Board Member
Masaaki SaitoFull-time Audit & Supervisory Board Member
Toshiya FurukatsuOutside Audit & Supervisory Board Member
Junichi NoroOutside Audit & Supervisory Board Member
Hirokazu Hikosaka
Outside Director
Director, Managing Corporate Officer,
Director, Managing Corporate Officer
Outside Director
Kazumasa Suezawa
Hiroshi Mukai Yukinori Hamanaka
Shuichi Murakami
Audit & Supervisory Board Members
51Taikisha Ltd. Annual Report 2016

1913 Kenzaisha (former name of Taikisha Ltd.) founded
1949 Joint stock company, Kenzaisha dissolved and Kenzaisha Co., Ltd. established
1971 Thai Kenzaisha Co., Ltd. established in Bangkok
1973 Company name changed to Taikisha Ltd.
1976 San Esu Industry Co., Ltd. established
1980 Shares listed on the First Section of the Tokyo Stock Exchange
1981 TKS Industrial Company established in U.S.A.
1983 Thai Kenzai Trading Co., Ltd. established in Bangkok
1985 Branch office opened in Singapore Taikisha Canada Inc. established in Toronto
1986 Nippon Noise Control Ltd. established
1989 Taikisha (Taiwan) Ltd. established in Taipei Taikisha Engineering (M) Sdn. Bhd. established in Kuala Lumpur, Malaysia Taikisha UK Ltd. established in Birmingham, UK (former name of Geico Taikisha Europe Ltd.)
1990 P.T. Taikisha Indonesia Engineering established in Jakarta Taikisha de Mexico, S.A. de C.V. established in Mexico City
1992 Donki TEC Ltd. established in Seoul, Korea (former name of Taikisha Korea Ltd.)
1994 Wuzhou Taikisha Engineering Co., Ltd. established in Beijing, China
1995 Taikisha Engineering India Ltd. established in New Delhi Taikisha Philippines Inc. established in Manila Representative office opened in Ho Chi Minh City, Vietnam
1996 Taikisha do Brasil Ltda. established in São Paulo, Brazil
1997 Representative office opened in Hong Kong
1998 Taikisha Vietnam Engineering Inc. established in Hanoi
2000 Tokyo Taikisha Service Ltd. established (formerly Atmos Service Ltd. established in 1987)
2001 Thai Kenzaisha Co. Ltd. renamed Taikisha (Thailand) Co., Ltd. Thai Kenzai Trading Co., Ltd. renamed Taikisha Trading (Thailand) Co., Ltd.
2003 Company reorganized into three division structure
2004 Singapore branch office closed. Subsidiary Taikisha (Singapore) Pte. Ltd. established R&D facilities integrated as Research and Development Center in Kanagawa prefecture P.T. Taikisha Manufacturing Indonesia established
2006 Established the company-wide Compliance Committee and the Compliance Division
2007 Reorganized businesses into two division structure comprising the Green Technology System Division and the Paint Finishing Division
2009 “Taikisha (R)” LLC established in Kaluga, Russia
2010 Tianjin Taikisha Paint Finishing System Ltd. established in Tianjin, China
2011 Formed a capital and business alliance with Geico S.p.A. Taikisha (Cambodia) Co., Ltd. established in Phnom Penh, Cambodia
2013 The 100th anniversary of the foundation Taikisha Myanmar Co., Ltd. established in Yangon, Myanmar
2014 Formed a capital and business alliance with Encore Automation LLC
Founded under the name of joint-stock company "Kenzaisha"
1913
1971
Corporate Data
History
Formed global alliance with Geico S.p.A
The 100th anniversary of the foundation
Changed the name to "Taikisha Ltd."
Established first overseas subsidiary in Bangkok
1973
2011
2013
52 Taikisha Ltd. Annual Report 2016

Investor Information
Shareholder's NameNumber ofshares held
(in thousands)
Ratio ofshareholding
(%)
Ichigo Trust Pte. Ltd. 2,818 8.2
The Master Trust Bank of Japan, Ltd. (Trust Account) 2,669 7.7
Kenzaisha Ltd. 1,730 5.0
Japan Trustee Services Bank, Ltd. (Trust Account 9) 1,500 4.3
Japan Trustee Services Bank, Ltd. (Trust Account) 1,272 3.7
Taikisha Business Partners Shareholding Association 1,003 2.9
Dai ni Kenzaisha Ltd. 1,000 2.9
BNYML-NON TREATY ACCOUNT 930 2.7
Taikisha Employees Shareholding Association 873 2.5
Nippon Life Insurance Company 866 2.5
(Notes) 1. The Company holds 2,219,061 treasury shares but excludes these shares from the list of major shareholders above. The above treasury shares do not include 167,600 shares of the Company’s shares held by Trust & Custody Services Bank, Ltd. (Trust E Account), because of the introduction of ESOP
(Employee Stock Ownership Plan). 2. The Percentage of Shares Held to the Total Number of Issued Shares is calculated by subtracting treasury shares
from all issued shares.
Authorized number of shares 100,000,000
Number of issued shares 36,782,009
Number of shareholders 3,404
COMPOSITION OFSHAREHOLDERS
(BY SHAREHOLDING RATIO)
21.62%Domestic corporations
2.98%Securitiescompanies
14.5%Individuals and others
6.03%Treasury Stock
21.71%Foreign investors
33.15%Financialinstitutions
(As of March 31, 2016)
Major Shareholders of the Company as of March 31, 2016
Corporate Name: Taikisha Ltd.
Head Office: Sumitomo Fudosan Shinjuku Grand Tower, 8-17-1, Nishi-Shinjuku Shinjuku-ku, Tokyo 160-6129, Japan Tel: 81-(0)3-3365-5320 Fax: 81-(0)3-5338-5195
Established: April 10, 1913
Sales: ¥212,424 million (Consolidated: year ended March 2016)
Number of Employees: 4,892 (Consolidated: as of March 2016)
ISO Certification ObtainedISO 9001» Taikisha Ltd.» TKS Industrial Company» Taikisha (Singapore) Pte. Ltd.» Taikisha (Thailand) Co., Ltd.» Thaiken Maintenance & Service Co., Ltd.» TKA Co., Ltd.» Taikisha Engineering (M) Sdn. Bhd.» P.T. Taikisha Indonesia Engineering» P.T. Taikisha Manufacturing Indonesia» Taikisha Philippines Inc.» Wuzhou Taikisha Engineering Co., Ltd.» Tianjin Taikisha Paint Finishing System Ltd.» Tianjin Dongchun-Taiki Metal Finishing & Conveyor System Manufacturing Co., Ltd.» Taikisha (Taiwan) Ltd.» Taikisha Engineering India Private Ltd.» Geico S.p.A.
ISO 14001» Taikisha Ltd.» TKS Industrial Company» Taikisha (Singapore) Pte. Ltd.» Taikisha (Thailand) Co., Ltd.» Wuzhou Taikisha Engineering Co., Ltd.» Tianjin Taikisha Paint Finishing System Ltd.» Tianjin Dongchun-Taiki Metal Finishing & Conveyor System Manufacturing Co., Ltd.» Taikisha Engineering India Private Ltd.
Corporate Data
53Taikisha Ltd. Annual Report 2016

2016.08. TKS. 1100
taikisha-group.com