annual report 2016-2017 - shire of quilpie
TRANSCRIPT

We Value: Respect | Communication | Fun & Humour | Pride | Trust | Teamwork
50 Brolga Street (PO Box 57) Quilpie Qld 4480Phone 07 4656 0500 [email protected] www.quilpie.qld.gov.au
ANNUAL REPORT2016-2017

AdoptionIn accordance with the Queensland Local Government Act2009 and Local Government Regulation 2012, the 2016-2017Annual Report was adopted at the Quilpie Shire CouncilOrdinary Meeting held on 17 November 2017.Questions about the Report?If you would like any further information about the QuilpieShire Council 2016-2017 Annual Report please contact Councilon 07 4656 0500 or email [email protected] RequirementsThe administrative practices of Quilpie Shire Council areprimarily governed by the Queensland Local GovernmentAct 2009 and Local Government Regulation 2012. Underthis legislation, Council is required to prepare and adoptan Annual Report for each financial year, reporting againstthe Shire’s progress with reference to its Corporate andOperational plans.
Quilpie Shire Council50 Brolga StreetPO Box 57QUILPIE QLD 4480
P: 07 4656 0500F: 07 4656 1441E: [email protected]: www.quilpie.qld.gov.au
2016-2017 highlights included the Quilpie Centenary Celebrations (front cover) and completion of the BullooPark Function Centre (above)

Table of Contents
Mayor’s Review ....................................................................................................................................... 1
Chief Executive Officer’s Report ............................................................................................................. 2
Councillors............................................................................................................................................... 3
Organisational Structure ......................................................................................................................... 3
Council Meetings .................................................................................................................................... 4
Councillor Remuneration ........................................................................................................................ 4
Councillor Meeting Attendances ............................................................................................................ 4
Councillor Expenses Reimbursement Policy ........................................................................................... 5
Councillor Complaints, Orders and Recommendations .......................................................................... 5
Overseas Travel ....................................................................................................................................... 6
Administrative Action Complaints .......................................................................................................... 6
Registers .................................................................................................................................................. 7
Non Current Physical Assets ................................................................................................................... 7
Invitations for Changes to Tenders ......................................................................................................... 8
Rating Concessions ................................................................................................................................. 8
Grants to Community Organisations ...................................................................................................... 8
Discretionary Funds ................................................................................................................................ 8
Internal Audit .......................................................................................................................................... 8
Remuneration – Senior Management .................................................................................................... 9
Beneficial Enterprises.............................................................................................................................. 9
Business Activities ................................................................................................................................... 9
Public Sector Ethics Act 1994 ................................................................................................................ 10
Assessment of Performance in Corporate and Operational Plans ....................................................... 10
Community Financial Report ................................................................................................................ 16
Financial Statements ..............................................................................................................................25
Mayor’s Review The last twelve months has seen a very mixed
season for our agriculture sector. Some areas in the
west and north of the shire have had a good year
while properties in the south and east saw their dry
run continue. This improved season for some
coupled with record high wool prices and near
record cattle and sheep markets has seen renewed
optimism in the sector. Most properties in the shire,
however, are still struggling to maintain or increase
stock numbers to be able to take full advantage of
the positive commodity markets. The summer wet
season was disappointing with only patchy storms
at best and only isolated flooding. There is the
feeling, though, that it is only the lack of rain
holding back a real resurrection in our rural
industry.
Our resources sector is still struggling and the
fallout from the collapse in oil prices is still being felt
across the region. A buoyant oil and gas industry
really is a very important driver for this shire’s
economic performance and we should never take it
for granted. There are some initial signs that
exploration activity may be starting to pick up albeit
from a very low base.
It has been a solid year in tourism with the highlight
being the very successful Quilpie town’s centenary
celebration in April. It was very well supported by
locals, ex-pats and more visitors than anticipated.
The grand parade down Brolga Street was
spectacular and won’t be forgotten by those who
were there. It capped off a terrific four days of
events and activities. The Eromanga Natural History
Museum is finding its feet, trading for seven days a
week right through the year and, I believe, will
prove to be a valuable asset in future years as this
shire realises, more and more, the importance of
our awakening tourism industry. It is great to see
private investment in this area with a new camping
and caravanning site being developed,
appropriately named “The Lake”, on the shores of
the picturesque Lake Houdraman. The newly
opened Hell Hole Gorge national park also beckons
locals and visitors alike with its promise of true
wilderness discovery.
The Quilpie Shire Council has had a very successful
and productive year. An extensive road building
program was undertaken and completed under cost
and on time. The first Main Roads upgrade contract
work for many years was completed in excellent
fashion despite extra work being asked of our crews
with little warning. These extra jobs saw a new Rest
Stop constructed and a further road widening and
culvert upgrade project completed west of Quilpie.
It was also great to see the completion of the full
seal of the Kyabra Road linking the Cooper
Development Road at Eromanga to the Diamantina
Development Road at Thylungra. The sealing of this
85 km stretch has taken 15 years and it is great to
see it completed. Again our workforce has
performed well completing this project ahead of
schedule and well within the budget forecast.
The focused, efficient effort by our entire council
staff over the full 12 months has culminated in an
excellent financial performance by Council,
recording a substantial operating surplus for the
year. We also completed the construction of the
new Bulloo Park bar and canteen complex and this
was duly opened in May at the Centenary Race
meeting. Once again, the builder, Peter Holling
must be commended for the great work done here.
On a sad note we should reflect on the passing of
two of our ex-mayors this year, Walter “Boy”
Speedy and John Murray. Both served as mayor in
the 1990’s and their contribution to the Quilpie
shire should be duly acknowledged.
In closing I would like to congratulate and thank all
our staff for another great year. They continue to
provide excellent service to the shire and perform
their work diligently. That solid and consistent
performance of our staff really is critical in
maintaining the services and infrastructure that
provides this community with the quality of life that
we enjoy and the confidence to believe it will only
continue to improve.
Kind Regards,
Stuart Mackenzie
Mayor
Quilpie Shire Council Annual Report 2016-2017 1 | Page

Chief Executive Officer’s Report There were a number of major highlights in 2016-2017 including the completion and opening of the
magnificent Bulloo Park complex, the celebration of the Quilpie Centenary and the completion of the
sealing of Kyabra Road. Other major projects that have commenced and will be completed in 2017/18
include the John Waugh Park All-Sports complex and a new airport terminal building and refuelling facility.
The combined impact of these projects cannot be underestimated in terms of economic development and
the social progress of the Shire.
As tourism and economic development priorities increase, the first full year of operation of the Eromanga
Natural History Museum and the additional promotion of Hell Hole Gorge National Park were of
significance during the year. It is anticipated the momentum in the interest and visitation of these two
unique attractions will build steadily in future years and will significantly impact on our tourism visitation.
Council’s Corporate Plan is the principle guiding strategic document that provides a framework for Council
to plan and undertake its business and service delivery. The expiration of the 2012-2017 Corporate Plan
at 30 June 2016 saw a number of workshops and significant consultation held throughout the year to
prepare and adopt the 2017-2022 Corporate Plan.
Council continued to support a significant training and development program for staff throughout the year.
A large number of staff completed a variety of Certificate and Diploma courses and I congratulate them on
their efforts to achieve these qualifications. In addition, Quilpie Shire Council were delighted to be
announced the 2016 winners of the Local Government Managers Australia southern Queensland Rural
Management Challenge, facing stiff opposition from a number of other larger councils including Southern
Downs and Toowoomba to bring home the title. Council was also winner in the ‘Doing More with Less’
category in the Local Government Excellence Awards for the commitment of staff to the inaugural
Challenge Cup Fundraiser for ‘Friends in Isolation’.
While employee turnover continues to remain a challenge for most rural and remote Councils, staff
numbers remained stable throughout the year. While all staff workloads have been high, the road
construction and concrete crews experienced a very hectic capital works program with additional Main
Roads works (Western Roads Package 1 and 2) and a truck parking facility at 27 Mile being awarded and
completed during the year.
Council have achieved a number of significant outcomes this year and we continue to remain in a strong
financial position.
I thank Mayor Mackenzie and all elected members for their ongoing commitment and support and also
thank and congratulate our workforce for another successful year.
Mr Dave Burges,
Chief Executive Officer
Right: 2016 Southern Queensland
Rural Management Challenge
Winners (L-R): Melissa Koutavas,
Hollie McCarthy, Ethan Crumblin,
Maree Radnedge.
Quilpie Shire Council Annual Report 2016-2017 2 | Page

Councillors Quilpie Shire Council comprises five (5) councillors including the Mayor.
Organisational Structure
Mayor - Cr Stuart Mackenzie Deputy Mayor - Cr Jenny Hewson
Portfolios – Health and Community Services
Cr Roger Volz
Portfolios – Arts, Culture and
Tourism
Cr Bob Hall
Portfolios – Business Development
and Indigenous Affairs
Cr Bruce Paulsen
Portfolios – Sport, Recreation and
Youth
Quilpie Shire Council Annual Report 2016-2017 3 | Page

Council Meetings Ordinary Meetings of the Quilpie Shire Council are held the second Friday of each month in the Quilpie
Shire Boardroom, commencing at 9:30am.
The dates and times of meetings other than special meetings are fixed in accordance with the Local
Government Act and Regulations.
The Chief Executive Officer must call a special meeting if:
There is a prior Council resolution specifying that the meeting will be held;
The Chief Executive Officer has identified an urgent matter that needs to be decided before
the next scheduled Ordinary Council meeting; or
A written request has been received by the Chief Executive Officer which has been signed by
the Mayor and two other Councillors and states a particular matter(s) to be discussed.
All meetings are open to the public, unless Council resolves, under Section 274 of the Local
Government Regulation 2012, that the meeting be closed whilst discussion takes place “in
confidence” regarding specific issues such as staff, legal, contractual or industrial proceedings.
Councillor Remuneration Section 247 of the Local Government Regulation 2012 requires councils to pay each elected representative as per the annual schedule determined by the Local Government Remuneration and Discipline Tribunal unless by resolution they resolve to adopt a lesser amount.
Councillor remuneration for the 2016-2017 financial year is shown in the following table:
Councillor Gross Payment Superannuation Total Remuneration
Cr Stuart Mackenzie $88,525 $8,409.84 $106,865.83
Cr Jenny Hewson $37,938 $3,604.08 $41,542.08
Cr Bob Hall $30,768 $2,922.97 $33,690.97
Cr Bruce Paulsen $31,647 $3,006.48 $34,653.48
Cr Roger Volz $31,647 $3,006.48 $34,653.48
Councillor Meeting Attendances Ordinary
Meeting Special
Meeting Workshop Other Total
Cr Stuart Mackenzie 12 3 11 58 84
Cr Jenny Hewson 12 3 10 26 51
Cr Bruce Paulsen 12 3 9 8 32
Cr Bob Hall 11 2 7 17 37
Cr Roger Volz 12 3 10 22 47
Quilpie Shire Council Annual Report 2016-2017 4 | Page
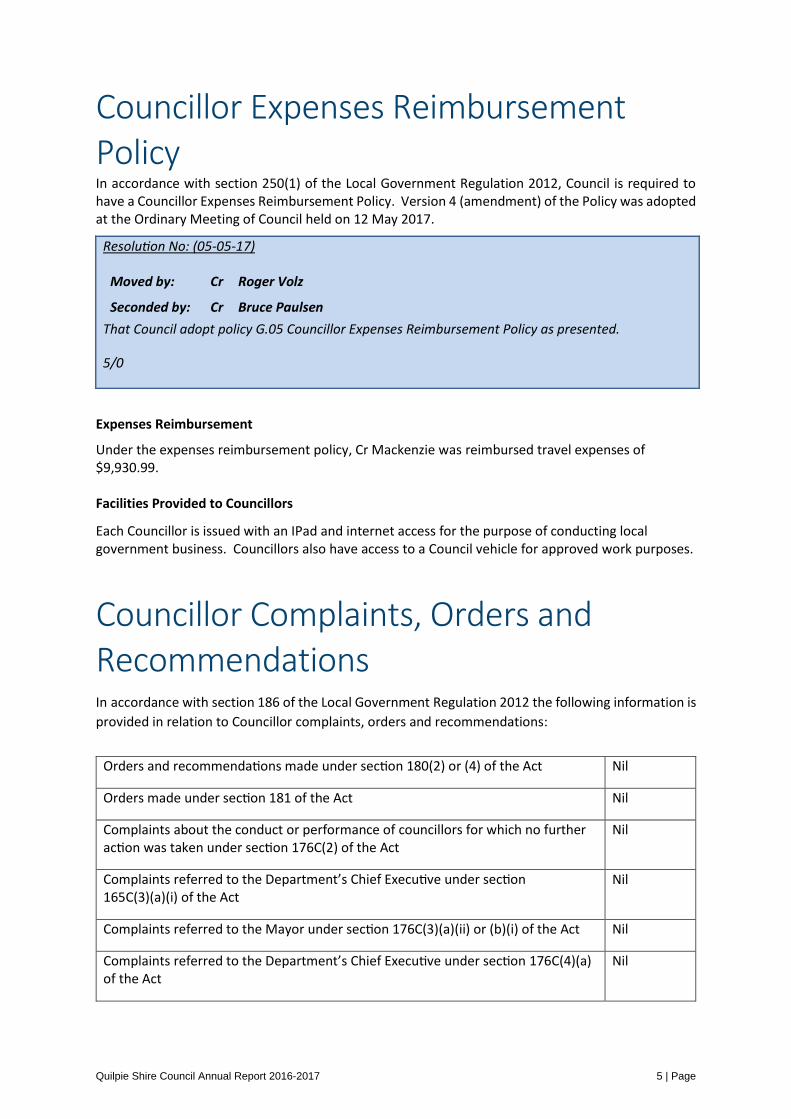
Councillor Expenses Reimbursement Policy In accordance with section 250(1) of the Local Government Regulation 2012, Council is required to have a Councillor Expenses Reimbursement Policy. Version 4 (amendment) of the Policy was adopted at the Ordinary Meeting of Council held on 12 May 2017.
Resolution No: (05-05-17)
Moved by: Cr Roger Volz
Seconded by: Cr Bruce Paulsen
That Council adopt policy G.05 Councillor Expenses Reimbursement Policy as presented.
5/0
Expenses Reimbursement
Under the expenses reimbursement policy, Cr Mackenzie was reimbursed travel expenses of $9,930.99. Facilities Provided to Councillors
Each Councillor is issued with an IPad and internet access for the purpose of conducting local government business. Councillors also have access to a Council vehicle for approved work purposes.
Councillor Complaints, Orders and Recommendations In accordance with section 186 of the Local Government Regulation 2012 the following information is
provided in relation to Councillor complaints, orders and recommendations:
Orders and recommendations made under section 180(2) or (4) of the Act Nil
Orders made under section 181 of the Act Nil
Complaints about the conduct or performance of councillors for which no further action was taken under section 176C(2) of the Act
Nil
Complaints referred to the Department’s Chief Executive under section 165C(3)(a)(i) of the Act
Nil
Complaints referred to the Mayor under section 176C(3)(a)(ii) or (b)(i) of the Act Nil
Complaints referred to the Department’s Chief Executive under section 176C(4)(a) of the Act
Nil
Quilpie Shire Council Annual Report 2016-2017 5 | Page

Complaints assessed by the Chief Executive Officer as being about corrupt conduct under the Crime and Corruption Act
Nil
Complaints heard by a regional conduct review panel Nil
Complaints heard by the Tribunal Nil
Complaints to which section 176C(6) of the Act applied Nil
Overseas Travel During the 2016-17 financial year no Councillor or Council employee travelled overseas in an official
capacity.
Administrative Action Complaints The complaints management process is established with the following objectives:
The fair, efficient and consistent treatment of complaints about decisions and other
administrative actions of the Council;
A complaints management process that is easy to understand and is readily accessible to all;
Detection and rectification, where appropriate, of administrative errors;
Identification of areas for improvement in the Council’s administrative practices;
Increase in awareness of the complaints management process for the Council’s staff and the
community;
Enhancement of the community’s confidence in the complaints management process and the
reputation of the Council as being accountable and transparent;
Building the capacity of staff to effectively manage complaints in an environment of continuous
improvement;
Complaints will be acknowledged and resolved in a timely manner;
Council will manage complaints confidentially and ensure that complainants do not suffer any
form of reprisal for making a complaint; and
Council will abide by the principles of natural justice and procedural fairness when dealing with
complaints.
Council’s implementation of its Complaints Management Process and Assessment
Council is committed to dealing with administrative action complaints fairly and has reviewed and
adopted the amended policy on 10 June 2016. This policy will again be reviewed in June 2018.
Council’s Complaints Management policy and process is available on Council’s website and at the
Administration office.
Number of Administrative Complaints made, resolved by Council, not resolved by Council and
complaints not resolved in the previous year.
Number of administrative action complaints made to Council Two
Number of administrative action complaints resolved by Council (under
complaints management process)
Two
Quilpie Shire Council Annual Report 2016-2017 6 | Page

Number of administrative action complaints not resolved by Council (under
complaints management process)
Nil
Number of administrative action complaints not resolved by Council in the previous year
Nil
Registers Council is required to keep and make available for public inspection certain documents. These
documents are available from the Quilpie Shire Council Office and include:
Investment Register
Register of Local Planning Policies
Register of Delegations of Authority Council to CEO
Register of Delegations of Authority by the CEO to employee / contractor
Register of Policies
Register of Roads
Contract Register
Register of Legal Documents
Register of Fees and Charges
Building Application Register
Development Application Register
Cemetery Register
Register of Interest of Councillors
Register of Disclosure of Electoral Gifts and Loans
Local Laws and Subordinate Local Laws Register
Register of Burials
Register of Lands
Register of Related Parties Disclosures
Non Current Physical Assets Council made no resolution in accordance with section 206(2) of the Local Government Regulation 2012 in the 2016-17 financial year. The following amounts for each different type of non-current asset below which the value of an asset of the same type will be treated as an expense (the recognition threshold) remain as:
Type of Assets Value
Furniture and Fittings $ 5,000.00
Plant and Equipment $ 5,000.00
Buildings and other structures $10,000.00
Infrastructure assets $10,000.00
Land $ 1.00
These amounts are disclosed in Note 11(a) of the financial statements.
Quilpie Shire Council Annual Report 2016-2017 7 | Page

Invitations for Changes to Tenders During the 2016-17 financial year there was one (1) instance where tenderers were invited to change
their tenders, namely Tender T14 15-16 – Eromanga Natural History Museum Stage 1B. The invitation
was issued following a review of the project design.
Rating Concessions In accordance with Sections 119 and 120 of the Local Government Regulation 2012 Council offers a
concession of 50% up to $450 on rates and utility charges (excluding the State Fire Levy) to recipients
of Aged, Disability and Widows Pensions and holders of Veteran Affairs cards in accordance with
Council’s Pensioner Rate Concession Policy.
Grants to Community Organisations During the 2016-17 financial year Council provided the following grants or in-kind support under its
Community Assistance Policy:
Financial contribution $25,100.00
In Kind contribution $9,010.84
Sponsorship $1,500.00
Discretionary Funds Councillors do not have any discretionary funds.
Internal Audit Council engaged the services of O’Regan and Partners to perform the internal audit activities for the
2015-16 financial year. The internal auditor works with management to identify and implement
recommended improvements to Council’s operations, systems and processes and ensure compliance
with adopted procedures.
In accordance with section 190(h) of the Local Government Regulation 2009, the internal audit report
for 2015-16 is presented:
Internal Audit Commentary – 2017 Annual Report
During the 2016/2017 year two onsite internal audit visits were undertaken.
The following areas of Council operations were reviewed:
Water Operations – including controls, procedures and policies for levying water charges and cost recovery considerations.
Council Garbage Tips administration, operation and compliance with environmental legislation
Insurance – on Council fleet and all infrastructure assets.
Community Grants – including policy and controls and procedures in grant allocation and accountability by recipient.
Quilpie Shire Council Annual Report 2016-2017 8 | Page

During the year all statutory obligations regarding the holding of Audit Committee meetings were
exceeded with three such meetings being held, Financial Statements were reviewed before audit
and the Budget was reviewed for compliance with statutory requirements.
A detailed review of Plant Hire Rates and Plant Utilisation has been started and progressed with
projected completion now deferred until the next site visit as a result of tying this review in with
the QRA plant hire rates consideration.
During the year there were a number of other miscellaneous matters attended to including:
Advice to store person regarding issues with procurement processes
Sundry advice on GST matters as applicable to certain aspects of Council operations, assistance in drafting responses to external audit reports and other accounting and assistance as needed during the year.
Remuneration – Senior Management During the 2016-2017 financial year Quilpie Shire Council had three (3) senior management positions.
• 1 senior management employee with a total remuneration package in the range of $200,000 – under $300,000 per annum; and
• 2 senior management employees with a total remuneration package in the range of $100,000 to under $200,000 per annum
In accordance with section 201 (1) of the Local Government Act 2009, the total of all remuneration packages payable to senior management in 2016-17 was $497,636.91
Beneficial Enterprises Council did not conduct any beneficial enterprises during the 2016-17 financial year.
Business Activities Council did not conduct any significant business activities as defined in section 19 of the Local
Government Regulation 2012. Council is involved in a wide range of business activities that involve
‘trading goods and services’ as defined by the Local Government Act 2009. In 2016-17 these included:
• Plumbing services;
• Minor housing maintenance (State Government properties);
• Accommodation services;
• Water and sewerage supply services;
• Waste and regulated waste management services;
• Provision of museums and art gallery;
• Facility, venue and equipment hire;
• Provision of sporting facilities;
• Land borne amusement equipment hire;
• Bus hire;
• Airport maintenance;
• Administrative services such as photocopying;
• Building certification activities;
• Visitor information services and sales;
Quilpie Shire Council Annual Report 2016-2017 9 | Page

• Library services including internet and computer access; and
• Road contracting services.
Public Sector Ethics Act 1994 Council adopted a Code of Conduct in December 2015. The Code reflects and incorporates the four (4) public service ethics principles:
• integrity and impartiality • promoting the public good • commitment to the system of government • accountability and transparency
Education and training with respect to the ethics principles and the Code of Conduct has been provided progressively to Council staff during the year, both in targeted sessions and as part of the induction process for all new employees. In addition, toolbox talks also reinforce Code of Conduct principles on a regular basis.
As part of Council’s governance processes, all policies, procedures and practices have regard to the ethics obligations of public officials and Council’s Code of Conduct. All employees are encouraged to act in ways which give commitment to a high standard of ethics and which ensures the highest standards of public administration. The same principles have been applied by Council in the review and preparation of Corporate and Operational Plans, and compliance with the Code of Conduct is assessed through the performance management process, with reasonable management action taken where there is a suspected breach.
Assessment of Performance in Corporate and Operational Plans In accordance with section 190(1)(a) of the Local Government Regulation 2012 the annual report must
contain an assessment by the Chief Executive Officer of the local government’s progress towards
implementing its 5-year Corporate Plan and annual Operational Plan.
Council’s Corporate Plan is the primary strategic business and organisational planning document and
forms the basis of Council’s annual Operational Plan. The 2012-2017 Corporate Plan expired on 30
June 2017.
The Operational Plan sets out Council’s work program for the financial year including costs, timelines
and outcomes. The Operational Plan is reviewed quarterly and at all times remains consistent with the
Corporate Plan.
Implementation of the 2016-17 Operational Plan was generally on track. Ten year renewal and
maintenance plans were not finalised due to time constraints. A number of council housing projects
were not completed. The development of the Biosecurity Plan and Stock Route Management Plan will
be undertaken in 2017-18.
KPIs – BY THEME
KEY PERFORMANCE INDICATOR TARGET ACTUAL SCORECARD
Achievement of Outcomes - Our Communities 100% 100%
25 1 0
Achievement of Outcomes - Our Wellbeing 100% 65%
19 1 11
Quilpie Shire Council Annual Report 2016-2017 10 | Page
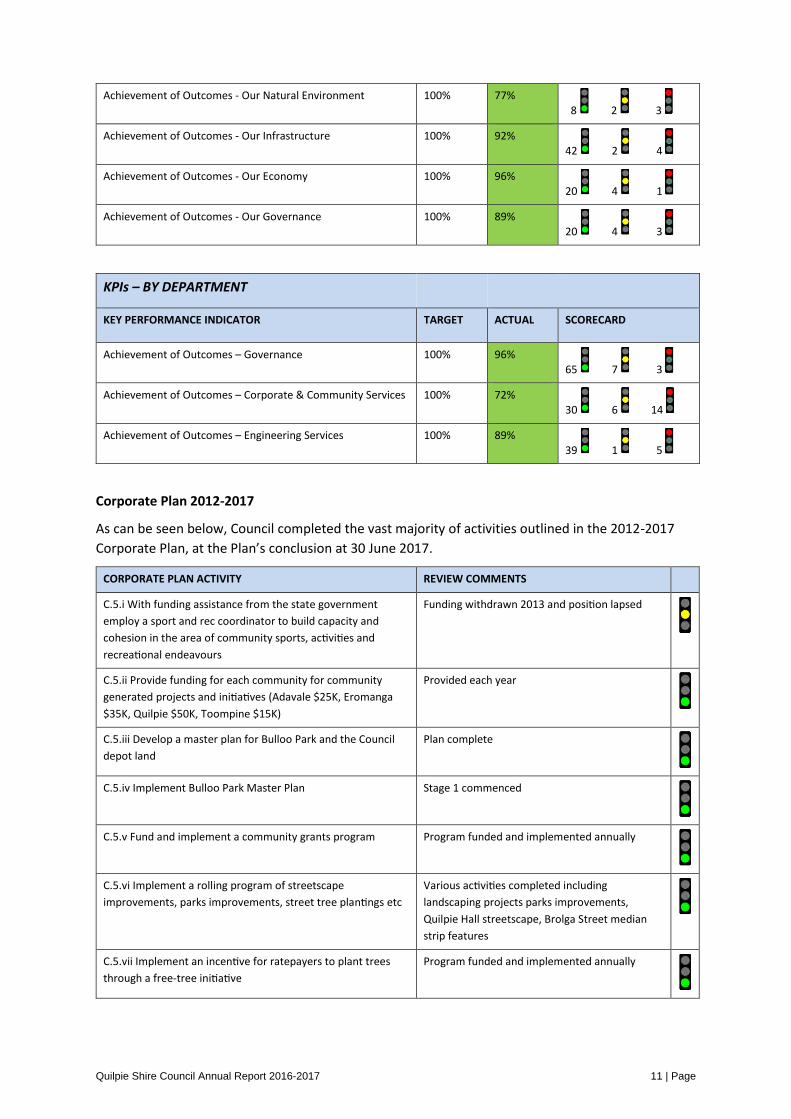
Achievement of Outcomes - Our Natural Environment 100% 77%
8 2 3
Achievement of Outcomes - Our Infrastructure 100% 92%
42 2 4
Achievement of Outcomes - Our Economy 100% 96%
20 4 1
Achievement of Outcomes - Our Governance 100% 89%
20 4 3
KPIs – BY DEPARTMENT
KEY PERFORMANCE INDICATOR TARGET ACTUAL SCORECARD
Achievement of Outcomes – Governance 100% 96%
65 7 3
Achievement of Outcomes – Corporate & Community Services 100% 72%
30 6 14
Achievement of Outcomes – Engineering Services 100% 89%
39 1 5
Corporate Plan 2012-2017
As can be seen below, Council completed the vast majority of activities outlined in the 2012-2017
Corporate Plan, at the Plan’s conclusion at 30 June 2017.
CORPORATE PLAN ACTIVITY REVIEW COMMENTS
C.5.i With funding assistance from the state government
employ a sport and rec coordinator to build capacity and
cohesion in the area of community sports, activities and
recreational endeavours
Funding withdrawn 2013 and position lapsed
C.5.ii Provide funding for each community for community
generated projects and initiatives (Adavale $25K, Eromanga
$35K, Quilpie $50K, Toompine $15K)
Provided each year
C.5.iii Develop a master plan for Bulloo Park and the Council
depot land
Plan complete
C.5.iv Implement Bulloo Park Master Plan Stage 1 commenced
C.5.v Fund and implement a community grants program Program funded and implemented annually
C.5.vi Implement a rolling program of streetscape
improvements, parks improvements, street tree plantings etc
Various activities completed including
landscaping projects parks improvements,
Quilpie Hall streetscape, Brolga Street median
strip features
C.5.vii Implement an incentive for ratepayers to plant trees
through a free-tree initiative
Program funded and implemented annually
Quilpie Shire Council Annual Report 2016-2017 11 | Page

CORPORATE PLAN ACTIVITY REVIEW COMMENTS
C.5.viii Develop community master plans for Eromanga and
Quilpie
Not commenced
C.5.ix Manage the RADF program Program funded and implemented annually
C.5.x Funding programs clearly identified in budgets and
monitored and acquitted as required
All grants and funding programs budgeted for
and acquitted in accordance with funding
agreements
C.5.xi The number of activities, programs and events that
Council supports
2 x Art Tour events each year, local races, rodeos
and shows, Channel Country Ladies Day
C.5.xii Publish details of all community activities and events in
the Community Bi-monthly newsletter
Published and advertised regularly
W.5.i Complete the Chipu Street residential subdivision Subdivision completed and allotments for sale
W.5.ii Implement a program for the construction of new
houses
6 new houses constructed
W.5.iii Buy out the Community Housing Community housing buyout completed
W.5.iv Plan, design and construct a rural residential
subdivision
Land secured and subdivision designed.
Construction deferred due to other land
availability
W.5.v With funding assistance from Medicare Local, employ a
health promotions officer to build capacity and cohesion in the
area of community health
HPO employed and programs implemented
W.5.vi Parks and open spaces enhanced Numerous enhancements undertaken including
plantings to median in Brolga Street, cemetery
landscaping, new depot highway frontage
landscaping, street tree program
N.5.i Provide a funding contribution to the Outback Eromanga
Natural History Museum project
Funding contributions made for stage 1a ($150K)
and stage 1b ($100K)
N.5.ii Review Council’s Planning Scheme to ensure resource
sector activity and impact on the environment is adequately
managed
Scheme reviewed and amendments made as
required. New planning scheme being prepared.
N.5.iii Fund a wild dog control officer in conjunction with other
pest management initiatives
Funding provided and external funding sourced.
Position retained
N.5.iv Prepare Site Based Waste Management Plans and
Stormwater Management Plans for all landfills
Regional Waste Management Plan prepared in
conjunction with surrounding Councils but site
specific plans not prepared
N.5.v Implement identified waste management improvement
strategies
Improvements made at Quilpie landfill
(structured pit arrangement, tip and cover with
drot). Other landfill sites managed to a basic
level
Quilpie Shire Council Annual Report 2016-2017 12 | Page

CORPORATE PLAN ACTIVITY REVIEW COMMENTS
N.5.vi Prepare and adopt a water quality management plan Plan completed
N.5.vi Stock routes managed in accordance with legislation Very little action required due to routes not
being used
N.5.vii Management Plans prepared Biosecurity Plan and Stock Route Management
Plan not developed as per legislative
requirements.
N.5.viii ERA Facilities licensed Water treatment plants, sewerage treatment
plants and landfill licences maintained
I.4.i Continue sealing Quilpie Adavale Road in sections Three sections sealed
I.4.ii Widen Quilpie Windorah Road in sections Road widened when funds provided by TMR.
Major projects undertaken in 2016/2017
I.4.iii Undertake drainage improvements to Napoleon Road Various drainage improvements completed
I.4.iv Improve flood immunity Napoleon Road Gravel re-sheeting undertaken to several
sections. Project briefs being prepared for future
TIDS funding.
I.4.v Continue sealing Kyabra Road in sections Sealing of Kyabra Road completed 2016/2017
I.4.vi Plan for the upgrading of the Quilpie Airport circa 2020 New terminal construction underway.
Completion due November 2017
I.4.vii Implement a rolling plant replacement program Replacement program budgeted for and
delivered in all financial years
I.4.viii Develop and implement an Infrastructure Charges
Schedule
Schedule developed and adopted. Now
redundant due to changes in planning legislation
I.4.ix Adequately maintain Council community facilities,
houses and buildings
Maintenance and improvements to community
facilities funded and delivered annually
I.4.x Maintain Shire and State roads to a safe and serviceable
standard
Shire roads maintained, NDRRA works completed
and RMPC contract delivered annually. Reseal
program budgeted for and delivered annually
I.4.xi Undertake various road and drainage improvements to
shire roads and local streets
Various improvements undertaken annually
I.4.xii Undertake gravel resheeting to Shire Roads Gravel re-sheeting programs completed
annually.
I.4.xiii Maintain and upgrade as necessary all necessary service
infrastructure such as water and sewerage services
Water and sewerage infrastructure maintained
and upgraded annually.
Eromanga WTP upgraded
Mains replaced in Eromanga and Quilpie
Quilpie Shire Council Annual Report 2016-2017 13 | Page

CORPORATE PLAN ACTIVITY REVIEW COMMENTS
I.4.xiv Asset management Plans reviewed annually Asset management plans not as advanced as
desired
I.4.xv Whole of life costs considered in infrastructure provision
decision making
Considered for major projects only
I.4.xvi % of capital works program completed Capital works programs generally completed well
I.4.xvii % of capital invested in existing infrastructure renewal
versus new infrastructure
Determined when setting the annual budget
I.4.xviii Priority Infrastructure Plan adopted Plan adopted but now made redundant by new
planning legislation
E.4.i Plan, design and construct a new industrial subdivision Stage 1 constructed and allotments for sale
E.4.ii Plan, design and construct a new light industrial / mixed
use subdivision
Deferred until available land uptake increases
E.4.iii Plan, design and construct a new Works Depot Completed
E.4.iv Obtain public access to Hell Hole Gorge National Park Road constructed and opened. Hell Hole Gorge
open to public
E.4.v Prepare and action an Economic Development Strategy Strategy prepared and adopted. Review
undertaken in May 2016
E.4.vi Review and upgrade tourism attraction facilities to
ensure they remain relevant and appealing
Annual reviews of facilities undertaken. Tourism
Development Plan completed
E.4.vii Investigate and implement as decided additional
tourism attractions
Additional attractions implemented include
Military History Museum, Rail Museum, Hell Hole
Gorge, Eromanga Natural History Museum,
Powerhouse Museum
E.4.viii Investigate additional tourist routes that can be
developed within the Shire and the Region
Hell Hole Gorge opened
Natural Sciences Loop revisited and redeveloped.
SWRED and initiatives planned
Eromanga Natural History Museum open and
operating
E.4.ix Undertake and promote a key annual event to attract
tourists
Art and Cultural Plan adopted identifying this
issue. Various events being reviewed / initiated
included the May and September races and
Outback Fringe Festival
E.4.x Partnerships established with government and private
enterprise
Numerous partnerships established
G.8.i Elected member professional development program
implemented
Program prepared and implemented. Elected
member updates undertaken bi-annually (LGAQ)
Various internal and external training courses
undertaken
Quilpie Shire Council Annual Report 2016-2017 14 | Page

CORPORATE PLAN ACTIVITY REVIEW COMMENTS
G.8.ii Community development / scholarship program
implemented
Program funded and implemented annually.
Changed in 2015
G.8.iii Use technology to ensure Council operates efficiently Technology innovations adopted include use of
iPads for staff and councillors, Asset Edge Reflect
system for road defect and maintenance, Magiq
records management system
G.8.iv Ensure the organisation complies with relevant
legislation
Legislative compliance system implemented
Policies reviewed annually or biannually as
required
Delegations reviewed as legislation is amended
G.8.v Community Engagement policy adopted Policy adopted and regularly reviewed.
G.8.vi Community engagement strategies developed and
implemented
Strategies developed and implemented including
monthly newsletter, online surveys etc.
G.8.vii Regional forums and meetings attended Numerous regional forums and meetings
attended. Regular forums include SWRED,
SWLGA, SWRRTG, SWRRTG TC, LGAQ annual
conference.
G.8.viii Long term financial plan adopted, reviewed and
monitored
LTFP adopted and regularly reviewed
G.8.x Staff training plan developed Plan developed and implemented. Rolling
program and plan reviews implemented.
G.8.xi Customer Service Charter implemented and reported on Implemented and reviewed in 2017. Reporting
not being undertaken regularly.
G.8.xii Monitor and act on the community survey results Limited action required as most results were
very satisfactory.
G.8.xiii Meet legislative requirements of the Work Health &
Safety Act 2011
WHS SafePlan implemented and operating
Quilpie Shire Council Annual Report 2016-2017 15 | Page

Community Financial Report The Community Financial Report is a ‘plain English’ summary of Council's Financial Statements
prepared in accordance with Section 179 of the Local Government Regulation 2012.
2016/17 SNAPSHOT
Key highlights of the 2016/17 financial year include:
• Construction of the Bulloo Park redevelopment at a total cost of $1,668,590;
• Upgrade to Kyabra Road valued at $1,730,593; and
• Replacement of Plant costing $997,990 after trade ins.
COUNCIL'S END OF YEAR FINANCIAL STATEMENTS
What you will find in the Financial Statements
The Audited Financial Statements of Council set out the financial performance, financial position, cash
flows and the net wealth of Council for the financial year ended 30 June 2017.
About the Management Certificate
The Financial Statements must be certified by both the Mayor and the Chief Executive Officer as
"presenting fairly" the Council's financial results for the year and are required to be adopted by Council
- ensuring both responsibility for, and ownership of, the Financial Statements by management and
elected representatives.
About the Financial Statements
The Financial Statements incorporate four (4) "primary" financial statements and accompanying
notes:
Statement of Comprehensive Income
A summary of Council's financial performance for the year, listing both regular income, expenses and
other comprehensive income which records items such as changes in the fair values of Council's assets
and investments.
Balance Sheet
A 30 June snapshot of Council's Financial Position including its assets and liabilities.
Statement of Changes in Equity
The overall change for the year (in dollars) of Council's "net wealth".
Statement of Cash Flows
Indicates where Council's cash came from and where it was spent.
Notes to the Financial Statements
Provides greater detail to the line numbers of the four (4) "primary" financial statements.
About the Auditor's Report
Council's Financial Statements are required to be audited by the Queensland Audit Office. The audit
of many Queensland Councils is contracted to audit firms that specialise in Local Government. The
Quilpie Shire Council Annual Report 2016-2017 16 | Page

Auditor provides an audit report which gives an opinion on whether the Financial Statements present
fairly the Council's financial performance and position.
Where to find a complete version of Council's 2016/2017 Financial Statements?
A complete version of Council's Financial Statements for the 12 months to 30 June 2017 can be found
on our website, www.quilpie.qld.gov.au (About Council / Corporate Documents / Annual Budget and
Financial Documents), or at Council's administration office at 50 Brolga Street Quilpie during business
hours.
AN OVERVIEW OF THIS YEAR'S FINANCIAL RESULT AND FINANCIAL POSITION
Council's Statement of Comprehensive Income (Profit & Loss) for 2016/17
Council's headline "profit/loss" result for the 2016-2017 year was a $7,575,228 surplus. This included
the following key financial performance highlights:
• Federal Government’s Financial assistance grant totaling $7,555,852 (This included $2,495,462
advance on 2017/2018 grant);
• Funding for the 2014 flood damage totaling $1,287,632;
• Payment for 2016 flood damage works of $917,161;
• Roads to recovery funding of $1,985,375; and
• Expenditure on 2016 flood restoration works of $2,283,085.
COUNCIL’S RESULT
$ ‘000 Actual 2017 Budget 2017 Actual 2016
Expenditure 17,259 19,816 22,101
Revenue (excluding income for capital
purposes)
19,925 16,993 21,857
Net Result before Capital Grants and
Contributions
2,666 -2,823 -244
Capital Grants and Contributions 5,154 5,480 3,820
Net Result 7,820 2,657 3,576
The budgeted "profit/loss" for 2016/17 was $2,657,079 - meaning Council came in much better than
was budgeted. The main reasons relating to this difference between the actual result and the
budgeted performance was due to outstanding payments from the Queensland Reconstruction
Authority for the 2014 event.
The above result included Flood damage reinstatement works (payments totalling $1,287,632 were
received in 2016/2017) and advance payment of the Financial Assistance Grant (FAGs) of $2,495,462.
Overall Council and management believe the financial result for 2016-2017 to be satisfactory.
The following charts summarise where Council's revenue and expense came from:
Quilpie Shire Council Annual Report 2016-2017 17 | Page

30%
37%
0%
32%
1%
Council's Total Expenditure (by type) 2016-2017
Employee Benefits (30%)
Materials and Services (36%)
Finance Costs (0%)
Depreciation and Amortisation (32%)
Loss on disposal (1%)
4%
15%
6%
9%
1%
62%
3%
Total Expenditure by Function / Activity
Corporate Governance (4%)
Community Services (15%)
Environment & Health (6%)
Finance and Information (9%)
Waste Management (1%)
Transport Infrastructure (63%)
Water & Sewerage Infrastructure 3%)
18%
0%
42%20%
1%
1%
17% 1%
Council's Revenue Sources for 2016-2017
Rates, Levies and charges (18%)
Fees and charges (0%)
Grants & Contribution - Operating (41%)
Grants & Contribution - Capital (20%)
Interest & Investment Revenue (1%)
Rent (1%)
Sales Revenue (17%)
Other (1%)
Quilpie Shire Council Annual Report 2016-2017 18 | Page

Councils Statement of Financial Position (Balance Sheet) for 2016-2017
Council's Net Wealth
The Balance Sheet "bottom line" discloses the Net Community Equity of Council, which represents
its wealth as measured by a dollar value of its assets less liabilities.
Council’s Wealth
$ ‘000 Actual 2017 Actual 2016
The major items that make up Council’s wealth include the
following assets:
Available Cash and Investments 16,304 11,101
Cash & Investments “restricted” for future funding purposes 1,416
Receivables 3,498 684
Other current assets 441 444
Infrastructure, Property, Plant & Equipment
- Land and Improvements 2,933 3,336
- Buildings 24,492 22,775
- Plant and Equipment 4,467 4,211
- Road, Drainage and Bridge Network 138,316 136,473
- Water 3,664 3,662
- Sewerage 2,880 2,883
- Other Infrastructure Assets 3,177 1,779
- Furniture and Fittings 372 406
- Liabilities -1,743 -1,664
Net Community Equity 198,865 187,574
Council's Capital Expenditure for 2016-2017
Council's Capital Expenditure by Asset Class was as follows:
Furniture & Fittings $0
Buildings $2,928,000
Plant $1,122,000
Roads $2,939,000
Sewers $4,000
Quilpie Shire Council Annual Report 2016-2017 19 | Page

Water $46,000
Land -$4,000
Other Assets $339,000
Council's Major Projects for 2016-2017 included the following:
Bulloo Park $1,668,000
Sealing of Kyabra Road $1,731,000
These expenditures were funded by:
Grants and Contributions $5,106,000
General Revenue $2,270,000
Council’s Key Financial Figures – A Snapshot
A summary of some key financial figures over the past five (5) years lets you see some overall trends.
Financial Performance Figures ($’000) 2017 2016 2015 2014 2013
Inflows:
Rates, Levies & Charges 4,624 4,548 3,981 3,350 2,789
Fees & Charges 48 38 101 38 33
Rental Income 301 353 394 363 208
Interest Received 265 309 387 377 795
Sales Revenue 4,344 2,170 3,561 10,185 29,958
Grants, Subsidies, Contributions & Donations
- Operating & Capital 15,290 18,224 19,935 18,860 8,740
Total Income from Continuing Operations 24,872 25,677 28,470 33,231 42,552
Sale Proceeds from PP&E 449 371 185 185 58
New Loan Borrowings & Advances 0 0 0 0 0
Outflows:
Employee Benefits 5,324 5,444 5,096 5,299 5,179
Materials & Services 6,259 11,803 11,464 27,317 35,316
Finance Costs 6 5 6 6 3
Depreciation 5,670 4,850 2,742 2,533 1,914
Total Expenses from Continuing Operations 17,259 22,102 35,155 42,412 20,780
Total Cash purchases of PP&E 7,375 10,179 6,472 4,859 4,921
Total Loan Repayments (including finance leases) 0 0 0 0 0
Quilpie Shire Council Annual Report 2016-2017 20 | Page

Operating Surplus / (Deficit) (excluding Capital
Income and Expenditure)
2,666 -245 6,316 -3,813 -828
Current Assets 20,243 13,645 16,138 11,440 14,990
Current Liabilities 1,743 1,664 2,666 3,459 3,038
Net Current Assets 18,500 11,981 13,472 7,981 11,952
Cash and Cash Equivalents 16,304 12,517 14,963 9,738 11,107
Total Borrowings Outstanding (Loans, advances and
finance leases excluding any overdraft)
0 0 0 0 0
Total Value of PP&E (excluding land and
improvements)
233,715 227,637 217,295 204,272 174,123
Total Accumulated Depreciation 57,469 56,394 60,400 52,333 50,217
Indicative Remaining Useful Life (as a % of GBV) 75% 72% 74% 71% 70%
Source: Published audited financial statements of Council (current year and prior year annual financial
statements.
FINANCIAL SUSTAINABILITY MEASURES
The Financial Sustainability of Councils is now a cornerstone of the Local Government Act and a core
responsibility of individual Councils across Queensland. Financial Sustainability is defined as when a
"Local Government is able to maintain its financial capital and infrastructure capital over the long
term" [source: Local Government Act 2009 section 102(2)].
The Financial Sustainability indicators (in accordance with the Local Government Regulation 2012) that
Council must publish are as follows:
Operating Surplus Ratio
This is calculated as the Net Result divided by Total Operating Revenue.
This is an indicator of the extent to which revenues raised cover operational expenses only or are
available for capital funding purposes or other purposes.
Asset Sustainability Ratio
This is calculated as the Capital Expenditure on the Replacement of Assets (Renewals) divided
by Depreciation Expense.
This is an approximation of the extent to which the infrastructure assets managed by the local
government are being replaced as they reach the end of their useful lives.
Depreciation expense represents an estimate of the extent to which the infrastructure assets have
been consumed in a period.
Capital expenditure on renewals (replacing assets that the local government already has) is an
indicator of the extent to which the infrastructure assets are being replaced.
This ratio indicates whether a local government is renewing or replacing existing non-financial assets
at the same rate that its overall stock of assets is wearing out.
Quilpie Shire Council Annual Report 2016-2017 21 | Page

Net Financial Liabilities Ratio
Calculated as Total Liabilities less Current Assets divided by Total Operating Revenue, this is an
indicator of the extent to which the net financial liabilities of a local government can be serviced by
its operating revenues. Council has reported a negative ratio as we do not have any borrowings.
Financial Sustainability Indicators at year ended 30 June 2017
Operating Surplus Ratio Asset Sustainability Ratio Net Financial Liabilities
Ratio
Target 0-10% >90% <60%
Actual 2014* -10% 0% -24.5%
Actual 2015 25.8% 145% -51%
Actual 2016 -1% 181% -55%
Actual 2017 13% 71% -93%
Long Term Financial Plan Projections
Year 1, 2018 -29% 53% -104%
Year 2, 2019 -7% 60% -104%
Year 3, 2020 -7% 41% -101%
Year 4, 2021 -7% 57% -99%
Year 5, 2022 -7% 44% -96%
Year 6, 2023 -7% 58% -94%
Year 7, 2024 -7% 66% -78%
Year 8, 2025 -7% 63% -78%
Year 9, 2026 -7% 50% -79%
Year 10, 2027 9% 101% -93%
• Council aims to have a positive Operating surplus ratio every year but occasionally this is not
possible due to the timing of receipts. In 2017/2018 Council is budgeting for a deficit. This is
caused by the advance payment of FAGS. Had this been paid in the “correct” year, the budget
would show a surplus.
• The asset sustainability ratio should, ideally, be more than 90% but given that we have spent in
excess of this for the past two years a rate in excess of 70% is considered adequate.
• The liabilities ratio will continue to rise in the negatives until 2025 when Council plans to borrow
for sewer treatment plant replacement works when the ratio will decline slightly although it
should remain negative.
• *Ratios were not calculated until 2014/2015.
Quilpie Shire Council Annual Report 2016-2017 22 | Page

Operating Surplus Ratio
The large surplus in 2014-2015 was largely a result of an advance payment for flood damage while
the related expenditure was recorded in 2015-2016.
Asset Sustainability Ratio
The capital expenditure in 2014-2015 and 2015-2016 was high due to works on Kyabra Road and the
new depot. Going forward these will not be repeated to the same extent so the ratio will even out
over time.
-40%
-30%
-20%
-10%
0%
10%
20%
30%
OPERATING SURPLUS RATIO
0%
20%
40%
60%
80%
100%
120%
140%
160%
180%
200%
ASSET SUSTAINABILITY RATIO
Quilpie Shire Council Annual Report 2016-2017 23 | Page

Net Financial Liabilities Ratio
In 2025-2026 Council is planning to borrow for sewerage treatment plant works but even then the
liability ratio will remain very much in negative territory.
-120%
-100%
-80%
-60%
-40%
-20%
0%
NET FINANCIAL LIABILITIES RATIO
Quilpie Shire Council Annual Report 2016-2017 24 | Page

QUILPIE SHIRE COUNCILFinancial statementsFor the year ended 30 June 2017
Statement of Comprehensive income 2Statement of Financial Position 3Statement of Changes in Equity 4Statement of Cash Flows 5Notes to the financial statements 61 Significant accounting policies 62 Analysis of results by function 8
3 Revenue 94 Grants, subsidies, contributions and donations 10
5 Employee benefits 106 Materials and services 117 Capital expenses 118 Cash and cash equivalents 119 Receivables 1210 Asset values 1311 Property, plant and equipment 1512 Payables 1913 Leases 1914 Provisions 1915 Asset revaluation surplus 2016 Contingent liabilities 2117 Superannuation 2118 Reconciliation of net result for the year to net cash flow from operating 22
activities
19 Events after the reporting period 2220 Financial instruments and financial risk management 2321 Transactions with related parties 25Management Certificate 26Independent Auditor's Report (General Purpose Financial Statements) ICurrent Year Financial Sustainability Statement liiCertificate of Accuracy - for the Current Year Financial Sustainability Statement liiIndependent Auditor's Report (Current Year Financial Sustainability Statement) Iv
Long Term Financial Sustainability Statement vCertificate of Accuracy - for the Long Term Financial Sustainability Statement v
1
Quilpie Shire Council Annual Report 2016-2017 25 | Page

QUILPIE SHIRE COUNCIL
Statement of Comprehensive Income
Formeyearended30 June2017
2017 2016Note $ $Income
Recurrent revenue
Rates, levies and charges 3(a) 4,624,422 4,547,553Fees and charges 47,757 37,715Rental income 300,516 353,314interest received 3(b) 265,432 308,969Sales revenue 4,343,741 2,169,841Other income 4(a) 159,074 34,974Grants, subsidies, contributions and donations 10,184,015 14,404,307
Total recurrent revenue 19,924,957 21,856,673Recurrent expenses
Employee benefits 5 (5,324,074) (5,443,522)Materials and services 6 (6,258,816) (11,803,020)Finance costs (6,048) (5,164)Depreciation 10 (5,669,703) (4,849,636)
Total recurrent expenses (17.258.641) (22,101,342)Net recurrent income 2,666,316 (244,668)Capital revenue
Grants, subsidies, contributions and donations 4(b) 5,105,798 3,819,956
Other capital income 15 47,867Total capital revenue 5,153,665 3,819,956Capital expenses 7 (244,753) (423,977)Net capital income 4,908,912 3,395,979Net result
7,575,228 3,151,308
Other comprehensive income
items that will not be reclassified to net result
Increase in asset revaluation surpius 15 3,714,829 10,871,322Total comprehensive income for the year 11,290,057 14,022,630The above statement should be read in conjunction with the accompanying notes and Significant Accounting Policies.
2
Quilpie Shire Council Annual Report 2016-2017 26 | Page

QUILPIE SHIRE COUNCILStatement of Financial Position
as at 30 June 2017
2017 2016Note $ $Current assets
Cash and cash equivaients 8 16,304,228 12,517,016Receivables 9 3,498,220 684,251Inventories 365,838 389,893Prepayments 74,852 53,934Total current assets 20,243,138 13,645,095Non-current assets
Receivables 9 63,750 67,500Property, plant and equipment 10 180,300,757 175,526,144Total non-current assets 180,364,507 175,593,644Total assets 200,807,645 189,238,737Current liabilities
Payables 12 1,190,457 1,155,064Provisions 14 507,716 394,156Total current liabilities 1,698,173 1,549,220Non-current liabilities
Provisions 14 44,908 115,010Total non-current liabilities 44,908 115,010Total liabilities 1,743,081 1,664,230Net community assets 198,864,565 187,574,507Community equity
Asset revaluation surplus 15 107,745,259 104,030,430Retained surplus/(deficiency) 91,119,306 83,544,077Total community equity 198,864,565 187,574,507
The above statement should be read in conjunction with the accompanying notes and Significant AccountingPolicies.
3
Quilpie Shire Council Annual Report 2016-2017 27 | Page

QUILPIE SHIRE COUNCILStatement of Changes in EquityFor the year ended 30 June 2017
Asset Retained Totalrevaluation Surplus
surplusNote
$ S SBalance as at 1 July 2016 104,030,430 83,544,077 187,574,507
Net operating surplus - 7,575,228 7,575,228Other comprehensive income for the year 3,714,829 - 3,714,829increase in asset revaluation surplus 10,15 3,714,829 7,575,228 11,290,057
Total comprehensive income for the year
Balance as at 30 June 2017 107,745,260 91,119,306 198,864,565Balance as at 1 July 2015 93,159,107 80,392,769 173,551,877
Net operating surplus 3,151,308 3,151,308Other comprehensive income for the year
increase in asset revaluation surplus 10,15 10,871,322 - 10,871,322Total comprehensive income for the year 10,871,322 3,151,308 14,022,630Balance as at 30 June 2016
104 030430 83544 077 187574507
The above statement should be read in conjunction with the accompanying notes and Summary of Significant Accounting Policies.
4
Quilpie Shire Council Annual Report 2016-2017 28 | Page

QUILPIE SHIRE COUNCIL
Statement of Cash Flows
Forthe yearended 30 June2017
Note 2017 2016Cash flows from operating activities
Receipts from customers 6,341,242 6,799,922Payments to suppliers and employees (11,487,166) (18,312,737)(5,145,924) (11,512,815)
Interest received 265,432 308,969Rental income 300,516 353,314Non capital grants and contributions 4(a) 10,184,015 14,404,307Net cash inflow from operating activities 18 5,604,039 3,553,775Cash flows from investing activities
Payments for property, plant and equipment 10 (7,375,523) (10,178,633)Net movement in loans and advances 3,750 3,750Proceeds from sale of property plant and equipment 7 449,149 370,907Assets not previously recognised (16,000)Grants, subsidies, contributions and donations 4(b) 5,105,798 3,819,956Net cash (outflow) from investing activities (1,816,826) (6,000,020)
Net increase (decrease) in cash and cash equivalent held 3,787,211 (2,446,245)
Cash and cash equivalents at the beginning of the financial year 12,517,016 14,963,2608
Cash and cash equivalents at end of the financial year 16,304,228 12,517,016
The above statement should be read in conjunction with the accompanying notes and Summary of Significant Accounting Policies.
5
Quilpie Shire Council Annual Report 2016-2017 29 | Page

QUILPIE SHIRE COUNCIL
Notes to the financial statements
Forthe yearended 30 June 2017
1 Significant accounting policies1A Basis of preparation
These general purpose financial statements are for the period 1 July 2016 to 30 June 2017. They are prepared in accordance with theLocal Government Act 2009 and the Local Government Regulation 2012 .
They comply with Australian Accounting Standards and 1nterpretations issued by the Australian Accounting Standards Board (AASB).Council is a not-for-profit entity and the Australian Accounting Standards include requirements for not-for- profit entities which areinconsistent with Intemational Financial Reporting Standards (IFRS). Therefore in some instances these financial statements do not
comply with IFRS. The main impacts are the offsetting of revaluation gains and losses within a class of assets and the timing ofrecognition of non-reciprocal grant revenue.
These financial statements have been prepared under the historical cost convention except where stated.
1B ConstitutionThe Quilpie Shire Council is constituted under the Queensland Local Govemment Act 2009 and is domiciled in
1C New and revised Accounting Standards
This year Council has applied AASB 124 Related Party Disclosures for the first time. As a result Council has disclosed more informationabout related parties and transactions with them. This information is presented in note 21.
Some Australian Accounting Standards and Interpretations have been issued but are not yet effective. Those standards have not beenapplied in these financial statements. Council will implement them when they are effective. The standards are not expected to have amaterial impact upon councifs future financial statements.
Effective for annual reporting periods beginning on or after 1 January 2017AASB 2016-2 Amendments to Australian Accounting Standards - Disclosure initiative:Amendments to AASB 107
AASB 2016-4 Amendments to Australian Accounting Standards - Recoverable Amount of Non- cash generatingspecialised assets of Not for Profit Entities.
A ASB 2016-7 Amendments to Australian Accounting Standards - Deferral of A ASB 15 for Not- for-profitEntities.
Effective for annual reporting periods beginning on or after 1 January 2018AASB 2016-3 Amendments to Australian Accounting Standards - Clarifications to AASB 15
Effective for annual reporting periods beginning on or after 1 January 2019A ASB 2016-8 Amendments to Australian Accounting Standards - Australian Implementation Guidance for Not for
Profit Entities.
Effective for annual reporting periods beginning on or after 1 January 2018AASB 9 Financial instruments - This replaces AASB 139 Financial instruments Recognition and
Measurement and could change the classification and disclosures of financial assets. It is not anticipated thatthe measurement criteria will have a material impact.
1D Estimates and judgements
Where necessary judgements, estimates and assumptions have been used in preparing these financial statements. Those that have asignificant effect, or risk of causing an adjustment to council's assets or liabilities relate to:
Valuation and depreciation of property, plant and equipment (Note 11)
Provisions (Note 14)
1E Rounding and comparativesThe financial statements are in Australian dollars that have been rounded to the nearest $1.Comparative information has been restated where necessary to be consistent with disclosures in the current reporting period.
1F TaxationThe income of local government and public authorities is exempt from Income tax. However council is subject to Fringe Benefits Tax andGoods and Services Tax ('GST'). The net amount of GST recoverable from the ATO or payable to the ATO is shown as an asset orliability respectively.
6
Quilpie Shire Council Annual Report 2016-2017 30 | Page

QUILPIE SHIRE COUNCIL
Notes to the financial statementsForthe yearended 30 June 2017
2. Analysis of Results by Function
2(a) Components of council functions
The activities relating to the Council's components reported on in Note 2(b) are as follows :
Corporate governanceThe objective of corporate govemance is for Council to be open, accountable, transparentand deliver value for money community outcomes. This function includes strategic andoperational planning, risk management, legal and administrative support. The Mayor,Councillors and Chief Executive Officer are included in corporate govemance.
Administration & FinanceFinance and information provides professional finance and information services across all ofcouncil. This function includes intemal audit, budget support, financial accounting, indirecttaxation and information technology services. The goal of this function is to provideaccurate, timely and appropriate information to support sound decision making and meetstatutory requirements.
Community servicesThe goal of community services is to ensure Quilpie Shire is a healthy, vibrant,
contemporary and connected community. Community services provides well managed andmaintained community facilities, and ensures the effective delivery of cultural, health,welfare, environmental and recreational services.
This function includes:LibrariesEntertainment venuesPublic health servicesSporting venuesPlanning and development
Environmental Health ServicesThis program ensures that the community's environment is protected and maintained toacceptable levels.
Engineering and WorksThe objective of the engineering and works program is to ensure the community is servicedby a high quality, appropriate and effective road network. The function provides andmaintains transport infrastructure, including the maintenance and provision of the drainagenetwork.
Waste managementThe goal of this function is to protect and support our community and natural environment bysustainably managing refuse. The function provides refuse collection and disposal services.
Water infrastructureThe goal of this program is to support a healthy, safe community through sustainable waterservices. This function includes all activities relating to water reticulation, treatment andplumbing.
Sewerage infrastructureThis function protects and supports the health of our community by sustainably managingsewerage infrastructure.
7
Quilpie Shire Council Annual Report 2016-2017 31 | Page

QUILPIE SHIRE COUNCIL
Notes to the financial statements
Fortheyearended 30 June2017
2 Analysis of results by function(b) Income and expenses defined between recurring and capital are attributed to the following functions:
Yearended30 June2017
Functions Grossprogramincome Total Grossprogramexpenses Total Netresult Net AssetsRecurrent Capital income Recurrent Capital expenses fromrecurrent Result
Grants Other Grants Other operationsS $ $ $ $ $ $ $ 5 5 $Corporate govemance 8,950 - - - 8,950 717,186 - 717,186 (708,236) (708,236)Administration & Finance 7,325,898 4,269,531 - 47,867 11,643,296 1,438,916 188,540 1,607,456 10,156,513 10,035,840 46,408,771Community services 422,165 433,384 1,460,961 - 2,318,510 2,629,410 - 2,629,410 (1,773,861) (312,900)Environment & Health 158,636 81,235 - - 239,871 1,001,583 - 1,001,563 (761,692) (761,692)Engineering & Works 2,268,366 4,322,543 3,644,837 - 10,235,746 10,882,919 76,213 10,959,132 (4,292,010) (723,386) 147,829,198Waste management - 205,080 - - 205,080 126,041 - 126,041 79,039 79,039Water & Sewer - 429,168 - - 429,168 462,606 - 462,606 (33,438) (33,438) B,369,676Total Council 10,184,015 9,740,942 5,105,798 47,867 25,078,620 17,258,640 244,753 17,503,393 2,666,316 7,575,229 200,607,644Yearended 30 June2016
Functions Gross program income Total Gross program expenses Total Net result Net AssetsRecurring Capital income Recurring Capital expenses fromrecurring Result
Grants Other Grants Other operationsS $ 5 5 5 $ $ S 5 S SCorporate govemance 33,000 7,920 - - 40,920 723,643 - 723,643 (682,723) (682,723)Administration & Finance 4,815,936 4,399,228 - - 9,215,164 1,956,476 418,768 2,375,244 7,258,688 6,839,920 40,230,428Community services 697,803 284,875 1,006,311 - 1,988,789 2,359,143 - 2,359,143 (1,376,665) (370,354)Environment & Health 172,955 14,642 - - 187,597 B11,457 - 811,457 (623,860) (623,860)Engineering & Works 8,684,813 2,143,174 2,813,645 - 13,641,631 15,662,141 5,209 15,667,350 (4,834,154) (2,025,719) 142,463,274Waste management - 200,090 - - 200,090 136,430 - 136,430 63,660 63,660Water & Sewer - 402,438 - - 402,438 452,054 - 452,054 (49,616) (49,616) 6,545,037Total Council 14,404,307 7,452,367 3,819,956 - 25,676,629 22,101,344 423,977 22,525,321 (244,668) 3,151,308 189,238,739
8
Quilpie Shire Council Annual Report 2016-2017 32 | Page
QUILPIE SHIRE COUNCILNotes to the financial statementsForthe yearended 30 June 2017
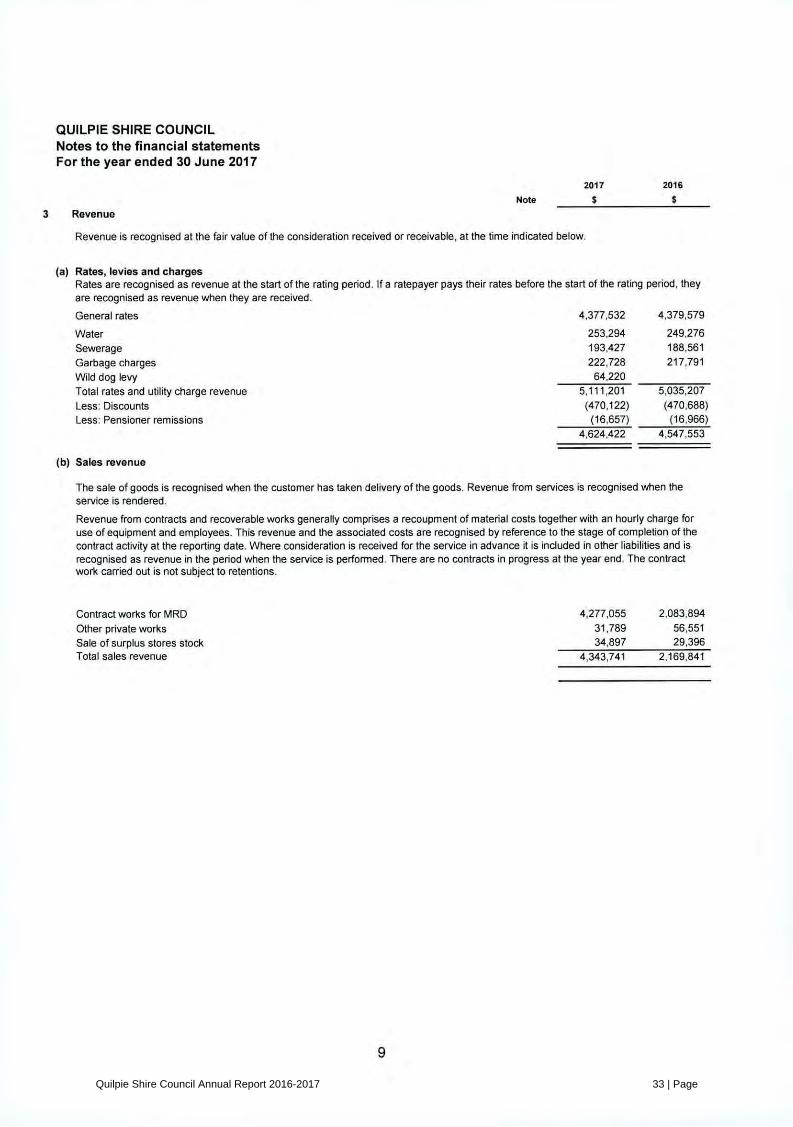
2017 2016Note $ $3 Revenue
Revenue is recognised at the fair value of the consideration received or receivable, at the time indicated below.
(a) Rates, levies and chargesRates are recognised as revenue at the start of the rating period. lf a ratepayer pays their rates before the start of the rating period, theyare recognised as revenue when they are received.
General rates 4,377,532 4,379,579Water 253,294 249,276Sewerage 193,427 188,561Garbage charges 222,728 217,791Wild dog levy 64,220Total rates and utility charge revenue 5,111,201 5,035,207Less: Discounts (470,122) (470,688)Less: Pensioner remissions (16,657) (16,966)4,624,422 4,547,553
(b) Sales revenue
The sale of goods is recognised when the customer has taken delivery of the goods. Revenue from services is recognised when theservice is rendered.
Revenue from contracts and recoverable works generally comprises a recoupment of material costs together with an hourly charge foruse of equipment and employees. This revenue and the associated costs are recognised by reference to the stage of completion of thecontract activity at the reporting date. Where consideration is received for the service in advance it is included in other liabilities and isrecognised as revenue in the period when the service is performed. There are no contracts in progress at the year end. The contractwork carried out is not subject to retentions.
Contract works for MRD 4,277,055 2,083,894Other private works 31,789 56,551Sale of surplus stores stock 34,897 29,396Total sales revenue 4,343,741 2,169,841
9
Quilpie Shire Council Annual Report 2016-2017 33 | Page

QUILPIE SHIRE COUNCILNotes to the financial statementsForthe yearended 30 June2017
2017 2016Note $ $4 Grants, subsidies, contributions and donations
Grants, subsidies, contributions and donations that are non-reciprocal in nature are recognised as revenue when Council obtains controlover them, which is usually upon receipt of funds.
Where grants are received that are reciprocal in nature. revenue is recognised as the various performance obligations under the fundingagreement are fulfilled. Council does not currently have any reciprocal grants.
a) Recurrent
General purpose grants 7,555,852 5,177,428State government subsidies and grants 2,522,911 9,226,779Commonwealth government subsidies and grants 105,253
Donations - 10010,184,015 14,404,307
On June 29th Council received a payment of $2,495,462 which is half of the estimated FAGS grant for 2017/2018.
(b) Capital
Capital Revenue includes grants and subsidies received which are tied to specific projects for the replacement or upgrade of existing non-current assetsand/or investment in new assets.
State govemment subsidies and grants 3,120.426 2.100.904Commonwealth 1,985,372 1.719,0525.105,798 3.819.956
5 Employee benefitstal staff wages and safariesCouncillors' remuneration
Annual, sick and long service leave entitlements
Superannuation
Other employee related expenses Less:
Capitalised employee expenses
4,011,651 3,941,984246,035 283,461702,868 801.836
17 504,544 515,8125,465,098 5,543,093169,593 151,492
5,634,691 5,694,585(310,617) (251,062)
5,324,074 5,443,522
Councillor remuneration represents salary. and other allowances paid in respect of carrying out their duties.
Total Council employees (FTE) at the reporting date: 2017 2016
Elected members 5 5Administration staff 17 17Depot and outdoors staff 50 47Total full time equivalent employees 72 69
10Quilpie Shire Council Annual Report 2016-2017 34 | Page
QUILPIE SHIRE COUNCILNotes to the financial statements
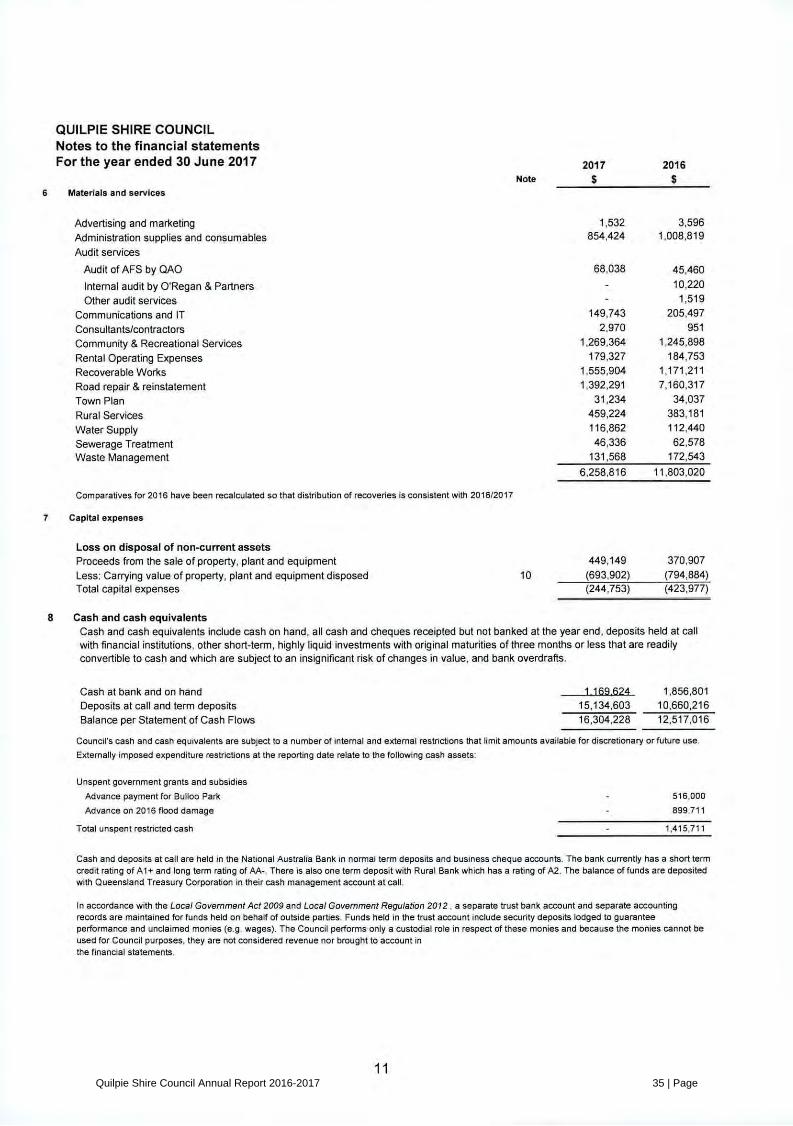
Forthe yearended 30 June 2017 2017 2016Note $ $6 Materials and services
Advertising and marketing 1,532 3,596Administration supplies and consumables 854,424 1,008,819Audit services
Audit of AFS by QAO 68,038 45,460Internal audit by O'Regan & Partners - 10,220Other audit services - 1,519Communications and IT 149,743 205,497Consultants/contractors 2,970 951Community & Recreational Services 1,269,364 1,245,898Rental Operating Expenses 179,327 184,753Recoverable Works 1,555,904 1,171,211Road repair & reinstatement 1,392,291 7,160,317Town Plan 31,234 34,037Rural Services 459,224 383,181Water Supply 116,862 112,440Sewerage Treatment 46,336 62,578Waste Management 131,568 172,5436,258,816 11,803,020
Comparatives for 2016 have been recalculated so that distribution of recoveries is consistent with 2016/2017
7 Capital expenses
Loss on disposal of non-current assets
Proceeds from the sale of property, plant and equipment 449,149 370,907Less: Carrying value of property, plant and equipment disposed 10 (693,902) (794,884)
Total capital expenses (244,753) (423,977)8 Cash and cash equivalents
Cash and cash equivalents include cash on hand, all cash and cheques receipted but not banked at the year end, deposits held at callwith financial institutions, other short-term, highly liquid investments with original maturities of three months or less that are readilyconvertible to cash and which are subject to an insignificant risk of changes in value, and bank overdrafts.
Cash at bank and on hand 1 169 624 1,856,801Deposits at call and term deposits 15,134,603 10,660,216Balance per Statement of Cash Flows 16,304,228 12,517,016CouncWs cash and cash equivalents are subject to a number of intemal and extema( restrictions that limit amounts available for discretionary or future use.
Extemally imposed expenditure restrictions at the reporting date relate to the following cash assets:
Unspent govemment grants and subsidies
Advance payment for Bulloo Park - 516,000Advance on 2016 Hood damage - 899,711Total unspent restricted cash - 1,415,711Cash and deposits at call are held in the National Australia Bank in normal term deposits and business cheque accounts. The bank currently has a short termcredit rating of A1+ and long term rating of AA-. There is also one term deposit with Rural Bank which has a rating of A2. The balance of funds are depositedwith Queensland Treasury Corporation in their cash management account at call.
In accordance with the Local Govemment Act 2009 and Local Govemment Regulation 2012 , a separate trust bank account and separate accountingrecords are maintained for funds held on behalf of outside padies. Funds held in the trust account include security deposits lodged to guaranteeperformance and unclaimed montes (e.g. wages), The Council performs only a custodial role in respect of these monies and because the monies cannot beused for Council purposes, they are not considered revenue nor brought to account inthe financial statements.
11Quilpie Shire Council Annual Report 2016-2017 35 | Page
QUILPIE SHIRE COUNCILNotes to the financial statementsForthe yearended 30 June 2017
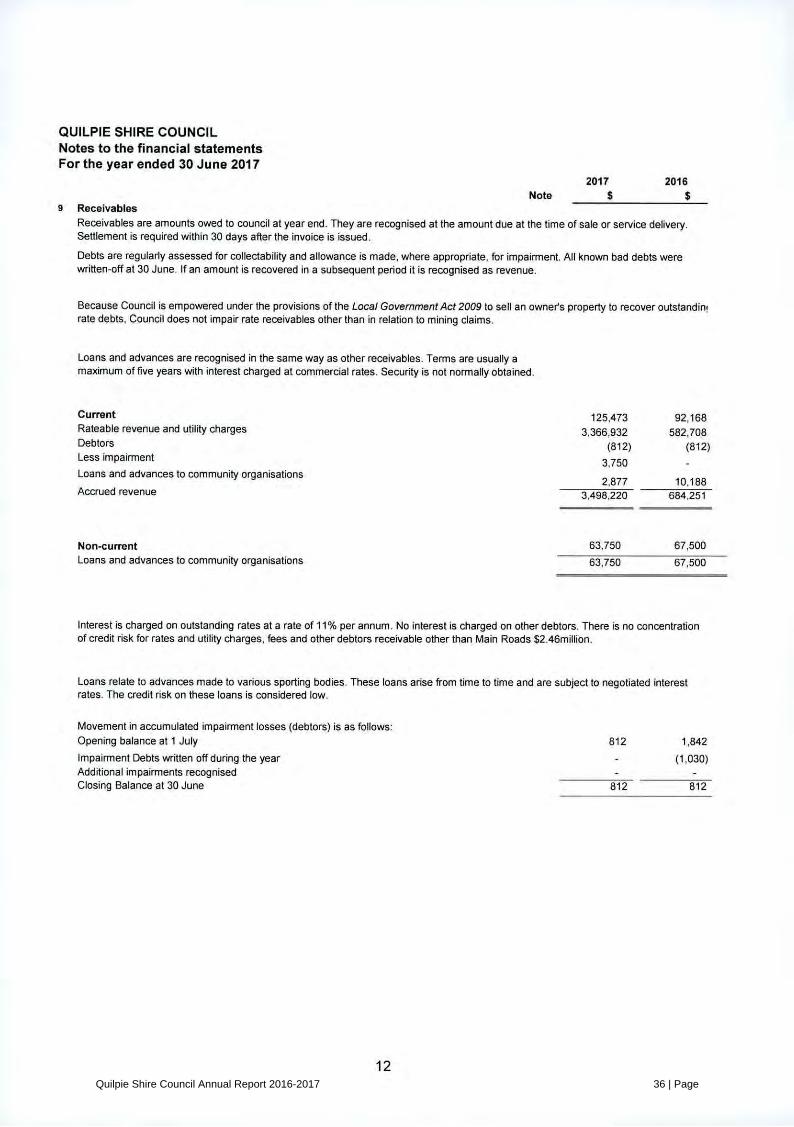
2017 2016Note $ $9 Receivables
Receivables are amounts owed to council at year end. They are recognised at the amount due at the time of sale or service delivery.Settlement is required within 30 days after the invoice is issued.
Debts are reguiarly assessed for collectability and allowance is made, where appropriate, for impairment. All known bad debts werewritten-off at 30 June. If an amount is recovered in a subsequent period it is recognised as revenue.
Because Councii is empowered under the provisions of the Local Govemment Act 2009 to sell an owner's property to recover outstandin!rate debts, Council does not impair rate receivables other than in relation to mining claims.
Loans and advances are recognised in the same way as other receivables. Terms are usually amaximum of five years with interest charged at commercial rates. Security is not normally obtained.
Current 125,473 92,168Rateable revenue and utility charges 3,366,932 582,708
Debtors (812) (812)Less impairment 3,750Loans and advances to community organisations 2,877 10,188Accrued revenue 3,498,220 684,251
Non-current 63,750 67,500Loans and advances to community organisations 63,750 67,500
Interest is charged on outstanding rates at a rate of 11% per annum. No interest is charged on other debtors. There is no concentrationof credit risk for rates and utility charges, fees and other debtors receivable other than Main Roads $2.46million.
Loans relate to advances made to various sporting bodies. These loans arise from time to time and are subject to negotiated interestrates. The credit risk on these loans is considered low.
Movement in accumulated impairment losses (debtors) is as follows:
Opening balance at 1 July 812 1,842Impairment Debts written off during the year - (1,030)Additional impairments recognised
Closing Balance at 30 June 812 812
12Quilpie Shire Council Annual Report 2016-2017 36 | Page

QUILPIE SHIRE COUNClLNotes to the financial statements For the yearended 30 June 2017
10 Asset Values 30 June 2017 Note
Basis of measurementAsset valuesOpening gross value as at 1 July 2016
Additions
Disposals
Revaluation adjustment to other comprehensive
income(asset revaluation surplus)
Previous loss on reval reversed
Transfers between classes
Closing gross value as at 30 June 2017
Accumulated depreciation and impairmentOpening balance as at 1 July 2016
Depreciation provided in period
Depreciation on disposals
Revaluation adjustment to asset revaluation surplus
Previous loss on reval reversed
Transfers between classes
Accumulated depreciation as at 30 June 2017
Total written down value as at 30 June 2017Range of estimated useful life in years
Work in ProgressOpening Balance 1 July 2016
Expenditure in year
Transferred to asset register
Closing Balance 30 June 2017
Total PPE
Additions comprise:
Renewals
Other additions
Total additions
Road,
Furniture & . Plant & drainage andFittings Buildings Equiprnent bridge Sewerage Water Land Total
network
Cost Fair Value Cost Fair Value ElEMM Fair Value Fair Value
624,017 33,675,56E 8,613,763 171,605,218 4,083,817 EIMM@H 3,053,934 230,691,221
2,667,664 1,121,778 3,279,655 - - 7,203,8317 - (778,455 (35,960 HEIMM15 1,826,09 (1,548,043 104 882 (363,952 - 18,988
15 69,425(2,075,37E (1 2 075,379624,017 35,293,90f 8,957,085 173,336,830 4,153 242 ETT 2,654,022 5,075,382 MTIMiIiG
218,369 11,300,19E 4,403,106 35,472,327 1,213 048 2,527,371 - 56,393,85733,631 865,942 508,465 3,937,949 55,083 - 164,179 5,669,703
7 - (499,541 (419,026 - - - -15 648,572 (1,994 (4,389,153 44,741 (3,697,834
15 - 21,558 21,5581 (852,86E (1 - - -252,001 11,462,304 4,490,550 35,021,123 1,289,689 2,676,564 - 2,276,485
372,016 E 4,466,535 138,315,701 2,863,553 3,597954 2,654,02; 2,798,897 EFITMTEM
2-20 2-20 5-250 20-100 unlirnited 2-50400,33E - 340,256 12,281 282,54! 173,638 1,228,780
2,928,224 1,121,778 2,939,473 4,319 (3,681 339,262 7,375,523(2,667,664 (1,121,778 (3,279,655 - - (134,734 (7 203,831660,89E - 74 278,85- 378,166 1 400,472
372,016 24,492,497 4,466,535 138,315,781 2,880,153 TI K5H 2,932,87! 3,177,063 180 300,757
1,058,302 1,067,972 1,799,389 118,718 4 044,3811,869,922 53,806 1,140,084 4,319 (3,681 220,544 3 331,142
- 2,928,224 1,121,778 4,31E (3,688 339,262
Quilpie Shire Council Annual Report 2016-2017 37 | Page

30 June 2016 Note Road,Fumiture & Plant & drainage andFittings Buildings Equipmen bridge Sewerage Water Other assets Total
network
Basis of measurement COSt Fair Value Cost Fair Value Fair Value Fair Value Cost
Asset values 5 5 5 5Opening gross value as at 1 July 2015 857,50( 24,666,628 9,016,55? MIMiPT:El 4,078,03C 6,169,634 2,231,296 9,753,564 219,526,202Additions 259,414 6,139,500 1,007,45C 2,312,849 5,78- - - 203,223 9,928,222DisposalsRevaluation adjustment to other comprehensiveincome(asset revaluation surplus)Asset not previously recognised
Assets with zero WDV written offTransfers between classes
Closing gross value as at 30 June 2016
Accumulated depreciation and impairmentOpening balance as at 1 July 2015 Depreciation
provided in periodDepreciation on disposalsRevaluation adjustment to asset revaluation surplus
Assets with zero WDV written offTransfers between classesAccumulated depreciation as at 30 June 2016
Total written down value as at 30 June 2016Range of estimated useful life in years
Work in ProgressOpening Balance 1 July 2015Expenditure in year Transferred to
asset register Closing Balance 30June 2016
Total PPE
Additions comprise:Renewals Other
additions Totaladditions
7 (323,37f (205,991 (546,03115 .. 149,194 - 3,481,798
16,00C
(185,52' - ME!EtM- 2,926,238 (271,712 3,057,576
624,01f 33,675,569 8,613,762 171,605,218
364,071 9,710,041 EMiliDM 39,038,563
4,083,817 6,169,63s
1,158,062 2,416,61'
(186,698 M (1,333,067- 4,641,572
- 16,00C(2,087,711
(1 245 (5,710,8573053,934 M 230,691,22C
2,795 919 60,399,8667 74,631 868,273 698,225 2,857,494 54,98E 110,76(15 (34,81f (113,829 (389 53E
15,339 (7,255,643
(185,521 (592 49 -820 375 831,913218,37C 11 300,199 35,472,327 1,213,048 2,527,37"
405,647 Mi 4,210,657 136,132,891 2,870,76S 3,642,26:2-20 10-75 2-20 5-250 20-100 25-110
728,850 -259,414 5,810,986 1,007 450 M (13,50C 19,722(259,414 (6,139,500 (1,007 45C (2,312,849
400,336 - 340,256 12 281 19,724405,647 22,775,707 136,473,147 2,883,050
259,414 5,639,687 1,007,450 1,406,708171,299 - 1,246,397 (13,50C 19,724
259,414 MiMIMII 1,007,450 2,653,105 (13,500 19,722
- 4,849,636- (538,1831 010,554 (6,229,750
ERIM (2,087,711
1,259437
3,053 934 1,605 832 174 297,364unlimited
217,952 - 978,37064,593 376,861 10,178,633(203,223 (9,928,223
282,545 1,228,7803,336,479 1 779,470 MWME§
- 8,644,83664,593 45 284 1,533,79764,593 10,178,633
Quilpie Shire Council Annual Report 2016-2017 38 | Page

QUILPIE SHIRE COUNCILNotes to the financial statementsFortheyearended30 June2017
11 Property, plant and equipment
11 (a) Recognition
Plant and equipment with a total value of less than $5,000, and infrastructure assets and buildings with a total value of less than $10,000 aretreated as an expense in the year of acquisition. All other items of property, plant and equipment are capitalised.
Replacement of a major component of an asset, in order to maintain its service potential, is treated as the acquisition of a new asset. However,routine operating maintenance. repair costs and minor renewals to maintain the operational capacity and useful life of the non-current asset isexpensed as incurred.
Expenditure incurred in accordance with Natural Disaster Relief and Recovery Arrangements on road assets is analysed to determine whetherthe expenditure is capital in nature. The analysis of the expenditure requires Council engineers to review the nature and extent of expenditureon a given asset. For exampie, expenditure that patches a road is generally maintenance in nature, whereas a kerb to kerb rebuild is treatedas capital Material expenditure that extends the useful life or renews the service potential of the asset is capitalised.
Land under the roads and reserve land which falls under the Land Act f994 or the Land Title Act 1994 is controlled by the QueenslandGovernment pursuant to the relevant legislation. This land is not recognised in these financial statements.
11(b) Measurement
Property plant and equipment assets are initially recorded at cost. Subsequently, each class of property, plant and equipment is stated at cost
or fair value (as shown in the note 12 table above) less, where applicabie, any accumulated depreciation and accumulated impairment loss.
Cost is determined as the fair value of the assets given as consideration plus costs incidental to the acquisition, including freight in, architect's feesand engineering design fees and all other establishment costs.
Direct labour and materials incurred in the acquisition or construction of assets are also incruded in their cost.
Property, plant and equipment received in the form of contributions. are recognised as assets and revenues at fair value.
14(c) Depreciation
Assets are depreciated from the date of acquisition or, in respect of internally constructed assets, from the time an asset is completed andcommissioned ready for use, at which time they are reclassified from work in progress to the appropriate property, plant and equipment class.
Land is not depreciated as it has an unlimited useful life. Depreciation on other property, plant and equipment assets is calculated on astraight-line basis so as to write-off the net cost or revalued amount of each depreciable asset, less its estimated residual value, progressivelyover its estimated useful life to the Council. Management believe that the straight-line basis appropriately reflects the pattem of consumptionof al) Council assets.
Where assets have separately identifiable components that are subject to regular replacement, these components are assigned useful livesdistinct from the asset to which they relate. Any expenditure that increases the originally assessed capacity or service potential of an asset iscapitafised and the new depreciable amount is depreciated over the remaining useful life of the asset to the Council
Major spares purchased specifically for particular assets that are above the asset recognition threshold are capitalised and depreciated on the
same basis as the asset to which they relate.
The depreciable amount of improvements to or on leasehold land is allocated progressively over the estimated useful lives of theimprovements to the Council or the unexpired period of the lease, whichever is the shorter.
Depreciation methods. estimated useful lives and residual values of property, plant and equipment assets are reviewed at the end of eachreporting period and adjusted where necessary to reflect any changes in the pattem of consumption. physical wear and tear, technical orcommercial obsolescence, or management intentions. The condition assessments performed as part of the annuaf valuation process forassets measured at writtendown current replacement cost are used to estimate the useful lives of these assets at each reporting date.
15Quilpie Shire Council Annual Report 2016-2017 39 | Page

QUILPIE SHIRE COUNCILNotes to the financial statementsForthe yearended30June2017
11(d) ImpairmentProperty, plant and equipment is assessed for indicators of impairment annually. If an indicator of possible impairment exists, the Councildetermines the asset's recoverable amount. Any amount by which the asset's carrying amount exceeds the recoverable amount is recorded as animpairment loss.
11(e) Valuation
(i) Valuation processes
Council's valuation policies and procedures are set by the the executive management team which comprises the Chief Executive Officer.Director of Corporate Services,Chief Finance Officer and Director of Engineering. They are reviewed annually taking into consideration ananalysis of movements in fair value and other relevant information.
Non-current physical assets measured at fair value are revalued, where required, so that the carrying amount of each class of asset does notmaterially differ from its fair value at the reporting date. This is achieved by engaging independent, professionally qualified valuers to determinethe fair value for each class of property, plant and equipment assets at least once every 3 years. This process involves the valuer physicallysighting a representativesample of Council assets across all asset classes and making their own assessments of the condition of the assets at the date of inspection,
In the intervening years, Council uses internal engineers and asset managers to assess the condition and cost assumptions associated withall infrastructure assets, the results of which are considered in combination with an appropriate cost index for the region. Together these areused to form the basis of a management valuation for infrastructure asset classes in each of the intervening years. With respect to thevaluation of the land and improvements, buildings and major plant asset classes in the intervening years, management engage independent,professionally qualified valuers to perform a "desktop" valuation. A desktop valuation involves management providing updated information tothe valuer regarding additions, deletions and changes in assumptions such as useful life, residual value and condition rating. The valuer thendetermines suitable indices which are applied to each of these asset classes.
An analysis performed by management has indicated that, on average, the variance between an indexed asset value and the valuation by anindependent valuer when performed is not significant and the indices used by Council are sound. Further details in relation to valuers, themethods of valuation and the key assumptions used in valuing each different asset class are disclosed below.
Any revaluation increment arising on the revaluation of an asset is credited to the appropriate class of the asset revaluation surplus, except to theextent it reverses a revaluation decrement for the class previously recognised as an expense. A decrease in the carrying amount on revafuation ischarged as an expense to the extent it exceeds the balance, if any, in the revaluation surplus of that asset class.
On revaluation. accumulated depreciation is restated proportionately with the change in the carrying amount of the asset and any change in theestimate of remaining useful life. Separately identified components of assets are measured on the same basis as the assets to which theyrelate.
In accordance with AASB 13 fair value measurements are categorised on the following basis:
- Fair value based on quoted prices (unadjusted) in active markets for identical assets or liabilities (Level 1)
- Fair value based on inputs that are directly or indirectly observable, such as prices for similar assets, for the asset or liability (level 2)
- Fair value based on unobservable inputs for the asset and liability (level 3)
There were no transfers between levels 1 and 2 during the year, nor between levels 2 and 3.
Council's policy is to recognise transfers in and out of the fair value hierarchy levels as at the end of the reporting period.
16Quilpie Shire Council Annual Report 2016-2017 40 | Page

QUILPIE SHIRE COUNCILNotes to the financial statementsFortheyearended30June2017
(ii) Valuation techniques used to derive fair values
Land (level 2)
Land fair values were determined by independent valuer. AssetVal effective 30 June 2017. Level 2 valuation inputs were used to value land infreehold title as well as land used for special purposes, which is restricted in use under current zoning rules. Sales prices of comparabie landsites in close proximity are adjusted for differences in key attributes such as property size. The most significant inputs into this valuationapproach are price per square metre.
Buildings (level 2 and 3)The fair value of buildings were also determined by independent valuer, AssetVal effective 30 June 2017. Where there is a market for Councilbuilding assets, they are categorised as non-specialised buifdings and fair value is derived from the sales prices of comparable properties afteradjusting for differences in key attributes such as property size (fevel 2). The most significant inputs into this valuation approach were price persquare metre.
Where Council buildings are of a specialist nature and there is no active market for the assets, fair vafue has been determined on the basis ofreplacement with a new asset having similar service potential including allowances for preliminaries and professional fees. The gross currentvalues have been derived from reference to market data for recent projects and costing guides issued by the Australian Institute of QuantitySurveyors, Rawlinson's (Australian Construction Handbook). Where a depth in market can be identified, the net current value of a buildingasset is the difference between the market value of the asset as a whole (including land) and the market value of the land component. Wherethere is no depth of market, the net current value of a building asset is the gross current value less accumulated depreciation to reflect theconsumed or expired service potential of the asset.
in determining the level of accumulated depreciation the asset has been disaggregated into significant components which exhibit useful lives.Allowance has been made for the typical asset life cycle and renewal treatments of each component, residual value at the time the asset is
considered to be no longer available for use and the condition of the asset. Condition was assessed taking into account both physicalcharacteristics as well as holistic factors such as functionality. capabihty, utilisation and obsolescence.
While the unit rates based on square metres can be supported by market evidence (level 2), the estimates of residual value, useful life, patternof consumption and asset condition that are used to calcuiate accumulated depreciation comprise unobservable inputs (level 3). Where theseother inputs are significant to the valuation the overall valuation has been classified as level 3.
infrastructure assets (level 3)
All Council infrastructure assets were fair valued using written down current replacement cost. This valuation comprises the asset's currentreplacement cost (CRC) less accumulated depreciation calculated on the basis of such cost to reflect the already consumed or expired futureeconomic benefits of the asset. Council first determined the gross cost of replacing the full service potential of the asset and then adjusted thisamount to take account of the expired service potential of the asset.
CRC was measured by reference to the lowest cost at which the gross future economic benefits of the asset could currently be obtained in thenormal course of business. Where existing assets were over designed, had excess capacity, or were redundant an adjustment was made sothat the resulting valuation reflected the cost of replacing the existing economic benefits based on an efficient set of modern equivalent assetsto achieve the required level of service output within the council's planning horizon.
The unit rates (labour and materials) and quantities applied to determine the CRC of an asset or asset component were based on a "Greenfield"assumption meaning that the CRC was determined as the full cost of replacement with a new asset including components that may not need tobe replaced, such as earthworks. The CRC was determined using methods relevant to the asset class as described under individuai assetcategories below.
17Quilpie Shire Council Annual Report 2016-2017 41 | Page

QUILPIE SHIRE COUNCILNotes to the financial statementsForthe yearended 30 June 2017
Roads
Currentreplacementcost
Council categorises its road infrastructure into urban and rural roads and then further sub-categorises these into sealed and unsealed roads. Allroads are managed in segments which vary in length depending upon changes in size or form. All road segments are then componentisedinto formation, pavement and seal (where applicable). Council assumes that environmental factors such as soil type, climate and topography areconsistent across each segment. Council also assumes a segment is designed and constructed to the same standard and uses a consistentamount of labour and materials.
CRC was calculated by reference to asset linear and area specifications, estimated labour and material inputs and services costs. For internalconstruction estimates, material and services prices were based on existing supplier contract rates or supplier price lists and labour wagerates were based on Council's Enterprise Bargaining Agreement (EBA). All direct costs were allocated to assets at standard usage quantitiesaccording to recently completed similar projects. Where construction is outsourced, CRC was based on the average of completed similarprojects over the last few years.
The last full valuation of road infrastructure was undertaken eifective 30 June 2016. CRC at 30 June 2017 was determined by Council'sconsulting engineers Proterra using data collected during flood damage works over the past three years. A full valuation of sealed roads andassociated infrastructure is planned again in 2018.
Accumulated depreciation
[n determining the level of accumulated depreciation, roads were disaggregated into significant components which exhibited different useful lives.
A condition assessment was undertaken and expressed as a value from 1 (new road) to 5 (no longer serviceable) and incorporated into thedata collected by Proterra to provide an estimate of current health, the proportion of health remaining and the remaining useful lives of theassets.
Water and SewerageCurrent replacement cost
Water and sewerage infrastructure fair values were determined by independent valuers, AssetVal effective 30 June 2016 and updated byindexation. CRC was calculated based on expected replacement costs. In all cases the assets were disaggregated to component level toensure a reliable measure of cost and service capacity and deterioration of estimated remaining life.
Accumulated depreciation
in determining accumulated depreciation, assets were either subject to a site inspection or an assessment to determine remaining useful life.Where site inspections were conducted (i.e. for active assets), the assets were allocated a condition assessment rating of between 1 and 5,which was used to estimate remaining useful life - 1 being excellent with a remaining useful life of 95% and 5 being unserviceable with aremaining useful fife of 5%. The higher the condition rating, the lower the fair value.
Where site inspections were not conducted (i.e. for passive assets and active assets for which no site inspections were undertaken), theremaining useful life was calculated on an age basis after taking into consideration current and planned maintenance records.
For wastewater gravity mains the assumption that the pipes will be relined was adopted. The fair value for sewer gravity mains wasdetermined as follows:
? For all pipes, replacement cost was determined based on replacement by trench excavation, useful life was determined as the pipe useful lifeplus the reline useful life, and the pipe fair value was based on age.
- Where pipes have been relined. the total pipe useful life was determined as the pipe age when the reline occurred plus the refine life.
- The relining of pipes was valued at reline rates and depreciated over the reline life (70 years). The reline fair value was based on age.
18Quilpie Shire Council Annual Report 2016-2017 42 | Page
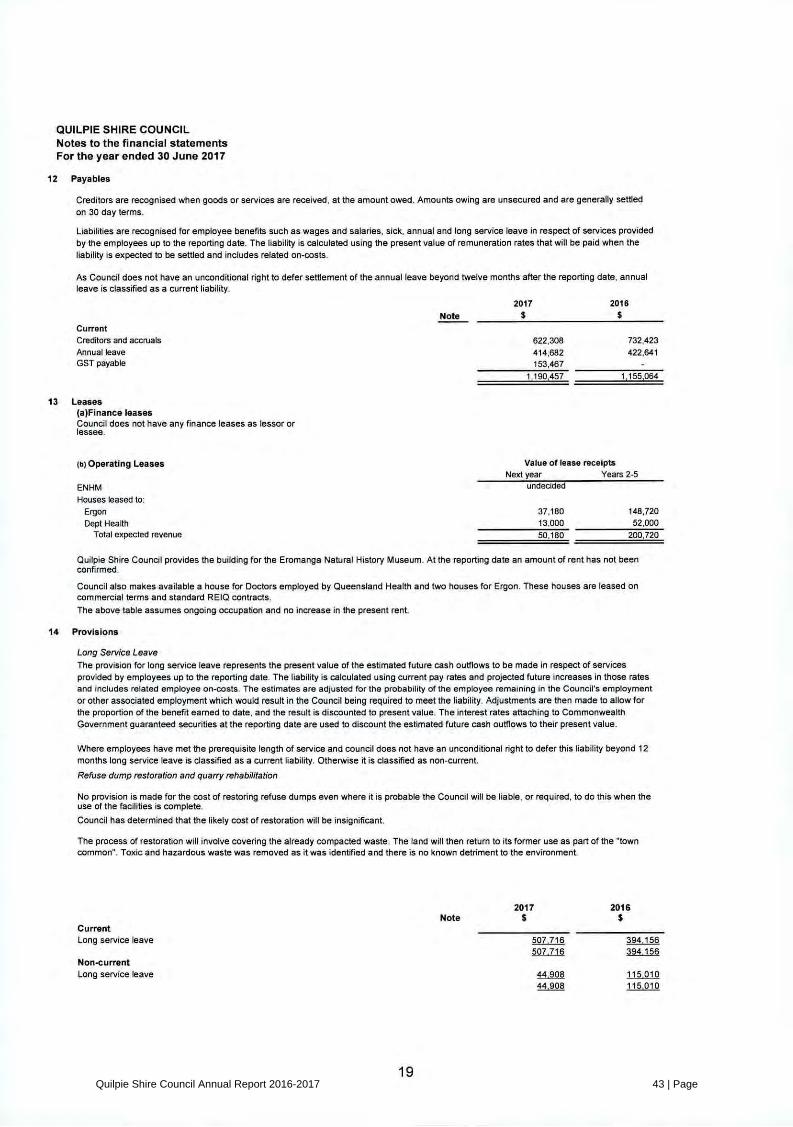
QUILPIE SHIRE COUNCILNotes to the financial statementsForthe yearended30 June2017
12 Payables
Creditors are recognised when goods or services are received, at the amount owed. Amounts owing are unsecured and are generally settledon 30 day terms.
Liabilities are recognised for employee benefits such as wages and salaries, sick, annual and long service leave in respect of services providedby the employees up to the reporting date. The liability is calculated using the present value of remuneration rates that will be paid when theliability is expected to be settled and includes related on-costs.
As Council does not have an unconditional right to defer settlement of the annua! leave beyond twelve months after the reporting date, annualleave is classified as a current liability.
2017 2015Note $ $Current
Creditors and accruals 622,308 732,423Annual leave 414,682 422£41GST payable 153.4671 190 457 1,155,064
13 Leases(a)Finance leasesCouncil does not have any finance leases as lessor orlessee.
(b) Operating Leases Value of lease receiptsNext year Years 2-5
ENHM undecidedHouses leased to:
Ergon 37,180 148,720Dept Health 13,000 52,000Total expected revenue 50,180 200,720Quilpie Shire Council provides the building for the Eromanga Natural History Museum. At the reporting date an amount of rent has not beenconfirmed.
Council also makes available a house for Doctors employed by Queensland Health and two houses for Ergon. These houses are leased oncommercial terms and standard RElQ contracts.The above table assumes ongoing occupation and no increase in the present rent.
14 Provisions
Long Service Leave
The provision for long service leave represents the present value of the estimated future cash outflows to be made in respect of servicesprovided by employees up to the reporting date. The liability is calculated using current pay rates and projected future increases in those ratesand includes related employee on-costs. The estimates are adjusted for the probability of the employee remaining in the CounciYs employmentor other associated employment which would result in the Council being required to meet the liability. Adjustments are then made to allow forthe proportion of the benefit eamed to date, and the result is discounted to present value. The interest rates attaching to CommonwealthGovernment guaranteed securities at the reporting date are used to discount the estimated future cash outffows to their present value.
Where employees have met the prerequisite length of service and council does not have an unconditional right to defer this liabßity beyond 12months long service leave is classified as a current liability. Otherwise it is classified as non-current.Refuse dump restoration and quarry rehabilitation
No provision is made for the cost of restoring refuse dumps even where it is probable the Council wul be liable. or required, to do this when theuse of the facilities is complete.Council has determined that the likely cost of restoration will be insignificant.
The process of restoration will involve covering the already compacted waste. The land will then retum to its former use as part of the "towncommon". Toxic and hazardous waste was removed as it was identified and there is no known detriment to the environment.
2017 2016Note $ $Current
Long service leave 507,716 394 156507 716 394 156Non<urrent
Long service leave 44,908 115 01044.908 115010
19Quilpie Shire Council Annual Report 2016-2017 43 | Page
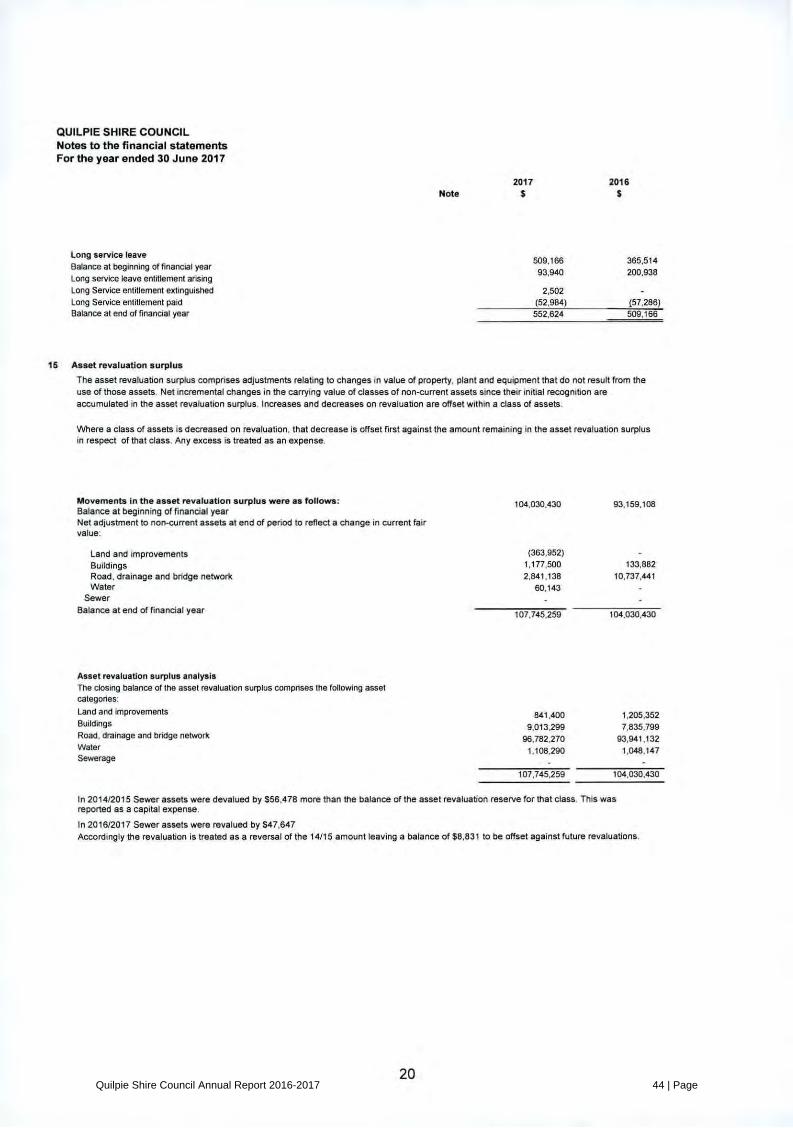
QUILPIE SHIRE COUNCILNotes to the financial statementsFortheyearended30June2017
2017 2016Note $ $Long service leave 509.166 365,514Balance at beginning of financial year 93.940 200,938Long service leave entitlement arising
Long Service entitlement extinguished 2,502Long Service entitlement paid (52,984) {57,286)Balance at end of financial year 552,624 509,16615 Asset revaluation surplus
The asset revaluation surplus comprises adjustments relating to changes in value of property, plant and equipment that do not result from the
use of those assets. Net incremental changes in the carrying value of classes of non-current assets since their initial recognition areaccumulated in the asset revaiuation surplus. Increases and decreases on revaluation are offset within a class of assets.
Where a class of assets is decreased on revaluation, that decrease is offset first against the amount remaining in the asset revaluation surpfusin reSpect of that class. Any excess is treated as an expense.
Movements in the asset revaluation surplus were as follows: 104,030.430 93,159,108Balance at beginning of financial yearNet adjustment to non-current assets at end of period to reflect a change in current fairvalue:
Land and improvements (363,952)Buildings 1,177,500 133,882Road, drainage and bridge network 2,841,138 10.737.441
Water 60,143Sewer
Balance at end of financial year 107.745,259 104,030,430
Asset revaluation surplus analysisThe closing balance of the asset revaluation surplus comprises the following assetcategories:
Land and improvements 841,400 1.205,352Buildings 9,013.299 7,835.799Road, drainage and bridge network 96,782,270 93,941,132Water 1,108,290 1,048,147Sewerage
107,745,259 104,030,430
In 2014/2015 Sewer assets were devalued by $55,478 more than the balance of the asset revaluation reserve for that class. This wasreported as a capital expense.In 2016/2017 Sewer assets were revalued by $47,647Accordingly the revaluation is treated as a reversal of the 14/15 amount leaving a balance of $8,831 to be offset against future revaluations,
20Quilpie Shire Council Annual Report 2016-2017 44 | Page

QUILPIE SHIRE COUNCILNotes to the financial statementsForthe yearended 30 June2017
16 Contingent liabilities
Details and estimates of maximum amounts of contingent liabilities are as follows:Local Government MutualThe Council is a member of the local govemment mutual liability self-insurance pool, LGM Queensland. ln the event of the pool being wound up or it isunable to meet its debts as they fall due, the trust deed and rules provide that any accumulated deficit will be met by the individual pool members in the sameproportion as their contribution is to the total pool contributions in respect to any year that a deficit arises.
As at 30 June 2017 the financial statements reported an accumulated surplus and it is not anticipated any liability will arise.
Local Government WorkcareThe Council is a member of the Queensland local government worker's compensation self-insurance scheme, Local Government Workcare. Under this schemethe Council has provided an indemnity towards a bank guarantee to cover bad debts which may remain should the self insurance licence be cancelled and there
was insufficient funds available to cover outstanding liabilities. Only the Queensland Government's workers compensation authority may call on any part of theguarantee should the above circumstances arise. The Council's maximum exposure to the bank guarantee is $120,000.
17 Superanuation
The Council contributes to the Local Government Superannuation Scheme (Old) (the scheme). The scheme is a Multi-employer Plan as defined in the AustralianAccounting Standard AASB119 Employee Benefits .
The Queensland Local Government S upe ran nuation Board, the trustee of the scheme, ad vised that the local g overnment superannuation scheme was a complying
superannuation scheme for the purpose of the Commonwealth Superannuation Industry (Supervision) legislation.
The scheme has three elements referred to as:The City Defined Benefits Fund (CDBF) which covers former members of the City Super Defined Benefits Fund
The Regional Defined Benefits Fund (Regional DBF) which covers defined benefit fund members working for regional local governments; and
The Accumulation Benefits Fund (ABF)
The ABF is a defined contribution scheme as defined in AASB 119. Council has no liability to or interest in the ABF other than the payment of the statutorycontributions as required by the Local Govemment Act 2009 .
Council does not have any employees who are members of the COBF and, therefore, is not exposed to the obligations, assets or costs associated with this fund.
The Regional DBF is a defined benefit plan as defined in AASB119. The Council is not able to account for the Regional DBF as a defined benefit plan in accordancewith AASB119 because the scheme is unable to account to the Council for its proportionate share of the defined benefit obligation, plan assets and costs. The fundingpolicy adopted in respect of the Regional DBF is directed at ensuring that the benefits accruing to members and beneficiaries are fully funded as they fall due.
To ensure the ongoing solvency of the Regional DBF, the scheme's trustee can vary the rate of contributions from relevant local government employers subject toadvice from the scheme's actuary. As at the reporting date, no changes had been made to prescribed employer contributions which remain at 12% of employee assetsand there are no known requirements to change the rate of contributions.
Any amount by which the scheme is over or under funded would only affect future benefits and contributions to the Regional DBF, and is not an asset or liability of theCouncil. Accordingly there is no recognition in the financial statements of any over or under funding of the scheme.
As at the reporting date, the assets of the scheme are sufficient to meet the vestedbenefits.The most recent actuarial assessment of the scheme was undertaken as at 1 July 2015. The actuary indicated that 'At the valuation date of 1 July 2015, the netassets of the scheme exceeded the vested benefits and the scheme was in a satisfactory financial posïtion as at the valuation date."
In the 2015 actuarial report the actuary has recommended no change to the employer contribution levels at this time.
Under the Local Govemment Act 2009 the trustee of the scheme has the power to levy additional contributions on councils which have employees in the RegionalDBF when the actuary advises such additional contributions are payable - normally when the assets of the DBF are insufficient to meet members' benefits.
There are currently 72 entities contributing to the Regional DBF plan and any changes in contribution rates would apply equally to all 72 entities. Quilpie ShireCouncil made less than 4% of the total contributions to the plan in the 2016-17 financial year.
The next actuarial investigation will be conducted as at t July 2018.
2017 2016Note $ $The amount of superannuation contributions paid by Council to the scheme in this 5
period for the benefit of employees was: 504,544 515,812
21Quilpie Shire Council Annual Report 2016-2017 45 | Page

QUILPIE SHIRE COUNCILNotes to the financial statementsForthe yearended30 June 2017
18 Reconcillation of net result for the year to net cash flow from operatin9 2017 2016activities
Netresult 7,575,228 3,151,308Non-cash items:
Depreciation and amortisation 5,669,703 4,849,636Revaluation adjustments (47,867)5,621,836 4,849,636Investing and development activities:
Net (profit)/foss on disposal of non-current assets 244,753 423,977Capital grants and contributions (5,105,798) (3,819,956)(4,861,045) (3,395,979)
Financing activities: (3,750)(3,750)
Changes in operating assets and liabilities:
(tncrease)/ decrease in receivables (2,810,219) 20,348(increase)/decrease in inventory 24,055 9,512(Increase)/decrease in other assets (20,918)Increase/(decrease) in payables 35,393 (1,238,030)Increase/(decmase) in liabilities 43,458 13,327Increase/(decrease) in other provisions - 143,652(2,728,231) (1,051,191)
Net cash inflow from aperating activities 5 604 039 3..553 77519 Events after the reporting period
There were no material adjusting events after the balance date.
22Quilpie Shire Council Annual Report 2016-2017 46 | Page

QUILPIE SHIRE COUNCILNotes to the financial statementsForthe yearended30 June 2017
20 Financial instruments and financial risk managementFinancial assets and financial liabilities
Quilpie Shire Council has exposure to the following risks arising from financial instruments:
- credit risk- liquidity risk- market risk
Quilpie Shire Council is responsible for the establishment and oversight of the risk management framework, together with developing and monitoring riskmanagement policies.Council's management approves policies for overalt risk management, as well as specifically for managing credit, liquidity and market risk.
The Council's risk management policies are estab$ished to identify and analy se the risks faced, to set appropriate limits and controls and to mon itor these risks and
adherence ag ainst limits. The Council aims to manage volatility to minimise potential adverse effects on the financial performan ce of the Council.
Credit risk
Credit risk is the risk of financiaf loss if a counterparty to a financial instrument fails to meet its contractual obligations. These obligations arise principally from the Council'sinvestments and receivables from customers.
Exposure to credit risk is managed th rough regular anary sis of credit counter party ability to meet payment obligations. The carrying amount of financial assets represents the
maximum credit exposure.
In vestments in financial instruments are required to be made with Queen slan d Treasury Corporation (OT C) or similar state/ commonwealth bodies or financial institutions inAustralia, in iine with the requirements of the Statutory Bodies Financia) Arrangements Act 1982 .
No collateral is held as security relating to the financial assets held by Quilpie Shire Council.
The following table represents the maximum exposure to credit risk based on the carrying amounts of financial assets at the end of the reporting period:
Note 2017 2016
Financial assets $ $Cash and cash equivalents 8 16,304,228 12,517,016Receivables - rates 9 125,473 92,168Receivables - other 9 3,372,747 595,461Prepayments 74,852 53,934Total financial assets 19,877,300 13,258,579
Cash and cash equivalentsThe Council may be exposed to credit risk through its investments in the QTC Cash Fund . The QTC Cash Fund is an asset management portfolio that invests with a
wide range of high credit rated counterparties. Deposits with the QTC Cash Fund are capitaf guaranteed.
Other Snancial assetsOther in vestments are held with financial institutions, wh ich are rated Aa2 to A2 based on rating agency Moody's ratings, and whilst not ca pital guaranteed, the likelihood
of a credit failure is assessed asremote.
Trade and other receivables
inthe caseofratereceivables, the Council hasthe powerto selltheproperty to recoveranydefaulted amounts. In effecithispower protectstheCouncil against creditrisk in the case of defaults.
In other cases, the Council assesses the credit risk before providing goods or services and applies normal business credit protection procedures to min imise the risk.
23Quilpie Shire Council Annual Report 2016-2017 47 | Page

QUILPIE SHIRE COUNCIL
Notes to the financial statements
Fortheyearended30 June2017By the nature of the Councils operations, there is a geographical concentration of risk in the Council's area. Because the area is largely agriculturat/mining ,there is also a concentration in the agricultural/mining sector.
Ageing of past due receivables and the amount of any impairment is disclosed in the following table:
2017 2016
Not past due 3,236,244 620,998Past due 31-60 days 975 24,760Past due 61-90 days 249,925 600More than 90 days 11,076 39,812Impaired 0 1,459Total 3,498,220 687,629Liquidity riskLiq uidity risk is the risk that the Council will encounter d ifficulty in meeting the obligations associated with its financial liabilities that are settled by delivering cash or
another financial asset.
Quilpie Shire Council is exposed to liquidity risk through its normal course of business.
The Council manages its exposure to liquidity risk by maintaining sufficient cash deposits to cater for unexpected volatility in cash flows.
The following table sets out the liquidity risk in relation to financial liabilities held by the Council it represents the remaining contractual cashflows (principal andinterest) of financial liabilities at the end of the reporting period, excluding the impact of netting agreements:
0 to 1 year 1 to 5 years Total Carryingcontractual amountcash flows
S $ $ $2017
Trade and other payables 1,190,457 - 1,190,457 1,190,4571,190,457 0 1,190,457 1,190,4572016
Trade and other payables 1,155,064 - 1,155,064 1,155,0641,155,064 0 1,155,064 1,155,064The outflows in the above table are not expected to occur significantly earlier or for significantly different amounts than indicated in the table.
Market riskMarket risk is the risk that changes in market prices. such as interest rates. will affect the Council's income or the value of its holdings of financial instruments.
Interest rate risk
Quilpie Shire Council is exposed to interest rate risk through investments and borrowings with QTC and other financial institutions.
The Council has access to a mix of variable and fixed rate funding options through QTC so that interest rate risk exposure can be minimised.
SensitivitySensitivity to interest rate movements is shown for variabie financial assets and liabilities based on the carrying amount at reporting date.
Calculation shows that if interest rates were to rise or fall by 1% the impact on net result and equity would be +/-$163,000 (2016: +/-5125,000)
24Quilpie Shire Council Annual Report 2016-2017 48 | Page
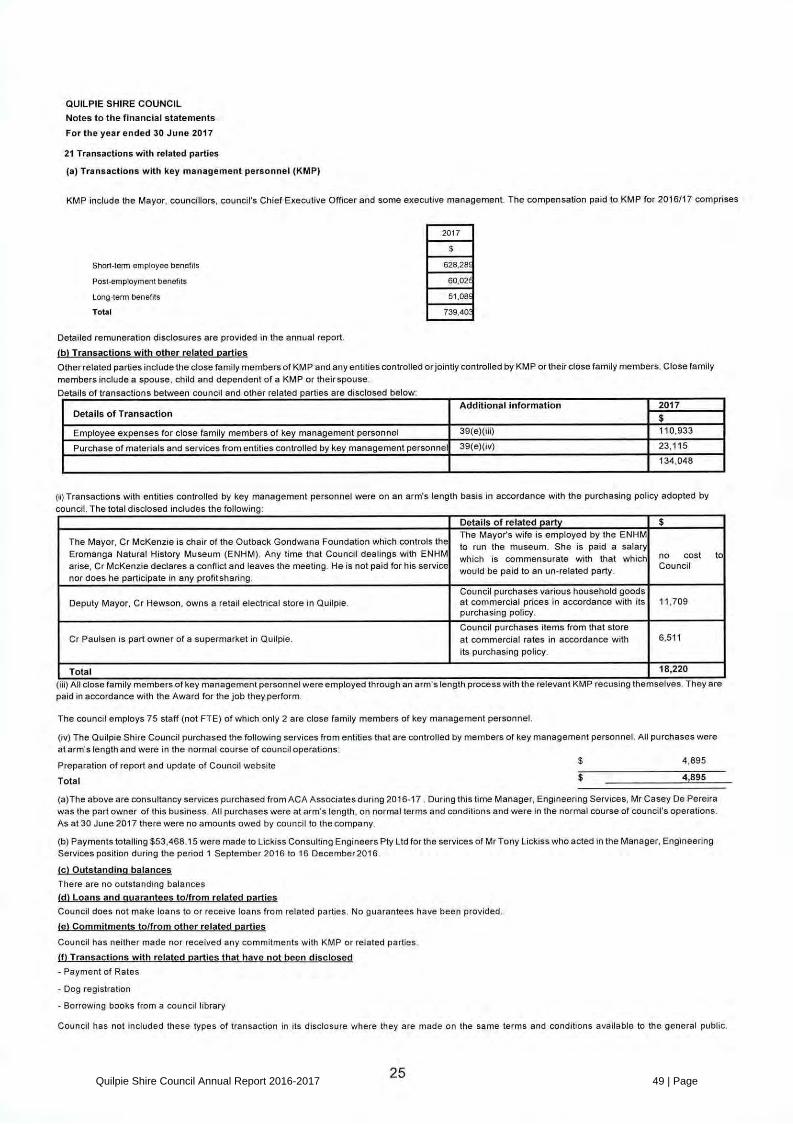
QUlLPIE SHIRE COUNCILNotes to the financial statements
Fortheyearended30 June 2017
21 Transactions with related parties
(a) Transactions with key management personnel (KMP)
KMP include the Mayor, councillors, council's Chief Executive Officer and some executive management. The compensation paid to KMP for 2016/17 comprises
2017
Short-term employeebenefits 628,28Post4mployment benefits 60,02Long-term benefits 51,08Total 739,40Detailed remuneration disclosures are provided in the annual report.
(b) Transactions with other related partiesOther related parties inclu de the close family me mber s of KM P an d any entiti es controlled or jointly controlled by KM P or their close fa mily members. C lose family
members include a spouse, child and dependent of a KMP or their spouse.Details of transactions between council and other related parties are disclosed below:
Additional information 2017Details of Transaction
Employee expenses for close family members of key management personnel 39(e)(iii) 110,933Purchase of materials and services from entities controlled by key management personnel 39(e)(iv) 23,115
134,048
(ii) Transactions with entities controlled by key management personnel were on an arm's length basis in accordance with the purchasing policy adopted bycouncil The total disclosed includes the following:
Details of related party $The Mayor's wife is employed by the ENHMThe Mayor, Cr McKenzie is chair of the Outback Gondwana Foundation which controls the . .to run the museum. She is paid a salaryEromanga Natural History Museum (ENHM). Any time that Council deaiings with ENHM which is commensurate with that which no cost toarise, Cr McKenzie declares a conflict and feaves the meeting. He is not paid for his service Councilwould be paid to an un-related party.nor does he participate in any profitsharing.
Council purchases various household goodsDeputy Mayor, Cr Hewson, owns a retail electrical store in Quilpie. at commercial prices in accordance with its 11,709
purchasing policy.Council purchases items from that store
Cr Paulsen is part owner of a supermarket in Quilpie. at commercial rates in accordance with 6,511its purchasing policy.
Total 18,220tiii) All close family members of key management personnel were employed through an arm's length process with the relevant KMP recusing themselves. They arepaid in accordance with the Award for the job they perform.
The council employs 75 staff (not FTE) of which only 2 are close family members of key management personnel.
(iv) The Quiipie Shire Council purchased the following services from entities that are controlled by members of key management personnel. All purchases wereat arm's length and were in the normal course of council operations:
Preparation of report and update of Council website $ 4.895
Total $ 4,895(a)The above are consultancy services purchased from ACA Associates during 2016-17 . During this time Manager, Engineering Services, Mr Casey De Pereirawas the part owner of this business. All purchases were at arm's length, on normal terms and conditions and were in the normal course of council's operations.As at 30 June 2017 there were no amounts owed by council to the company.
(b) Payments totalling $53.468.15 were made to Lickiss Consulting Engineers Pty Ltd for the services of Mr Tony Lickiss who acted in the Manager, EngineeringServices position during the period 1 September 20'T6 to 16 December2016.
(c) Outstandina balancesThere are no outstanding balances
(d) Loans and quarantees to/from related partiesCouncif does not make loans to or receive loans from related parties. No guarantees have been provided.
(e) Commitments to/from other related partiesCouncil has neither made nor received any commitments with KMP or related parties.
(f) Transactions with related parties that have not been disclosed
- Payment of Rates
- Dog registration
- Borrowing books from a council library
Council has not included these types of transaction in its disclosure where they are made on the same terms and conditions available to the general public.
25Quilpie Shire Council Annual Report 2016-2017 49 | Page

QUILPIE SHIRE COUNCIL
Financial statements
For the year ended 30 June 2017
Management Certificate
For the year ended 30 June 2017
These general purpose financial statements have been prepared pursuant to sections 176 and 177 of theLocal Govemment Regulation 2012 (the Regulation) and other prescribed requirements.
In accordance with section 212(5) of the Regulation we certify that:
(i) the prescribed requirements of the Local Govemment Act 2009 and Local Govemment Regulation 2012for the establishment and keeping of accounts have been complied with in all material respects; and
(ii) the general purpose financial statements, as set out on pages x to x, present a true and fair view, inaccordance with Australian Accounting Standards, of the Councifs transactions for the financial yearand financial position at the end of the year.
Mayor Chief Executive OfficerCr Stuart MacKenzie Dave Burges
Date: Date:
26Quilpie Shire Council Annual Report 2016-2017 50 | Page

INDEPENDENT AUDITOR'S REPORT
To the Councillors of Quilpie Shire Council
Report on the Audit of the Financial Report
Opinion
I have audited the financial report of Quilpie Shire Council
In my opinion, the financial report:
a) gives a true and fair view of the council's financial position as at 30 June 2017, and ofits financial performance and cash flows for the year then ended
b) complies with the Local Government Act 2009, the Local Government Regulation 2012and Australian Accounting Standards.
The financial report comprises the statement of financial position as at 30 June 2017, the
statement of comprehensive income, statement of changes in equity and statement of cashflows for the year then ended, notes to the financial statements including significant
accounting policies and other explanatory information, and the certificate given by the Mayorand Chief Executive Officer.
Basis for opinion
I conducted my audit in accordance with the Auditor-Generai of Queensland AuditingStandards, which incorporate the Australian Auditing Standards. My responsibilities underthose standards are further described in the Auditor's responsibilities for the audit of thefinancial report section of my report.
I am independent of the council in accordance with the ethical requirements of theAccounting Professional and Ethical Standards Board's APES 110 Code of Ethics forProfessional Accountants (the Code) that are relevant to my audit of the financial report inAustralia. I have also fulfilled my other ethical responsibilities in accordance with the Code
and the Auditor-Generai of Queensland Auditing Standards.
I believe that the audit evidence I have obtained is sufficient and appropriate to provide abasis for my opinion.
Other information
Other information comprises the information included in Quilpie Shire Council's annual reportfor the year ended 30 June 2017, but does not include the financial report and my auditor's
report thereon. At the date of this auditor's report, the other information was the current yearfinancial sustainability statement and long-term financial sustainability statement.
My opinion on the financial report does not cover the other information and accordingly I donot express any form of assurance conclusion thereon. However, as required by the LocalGovernment Regulation 2012, I have expressed a separate opinion on the current yearfinancial sustainability statement.
In connection with my audit of the financial report, my responsibility is to read the otherinformation and, in doing so, consider whether the other information is materially inconsistentwith the financial report and my knowledge obtained in the audit or otherwise appears to bematerially misstated.
Quilpie Shire Council Annual Report 2016-2017 51 | Page

If, based on the work I have performed, I conclude that there is a material misstatement ofthis information, I am required to report that fact. I have nothing to report in this regard.
Responsibilities of the council for the financial report
The council is responsible for the preparation of the financial report that gives a true and fair
view in accordance with the Loca/ Government Act 2009, the Local Government Regulation2012 and Australian Accounting Standards, and for such internal control as the councildetermines is necessary to enable the preparation of the financial report that is free from
material misstatement, whether due to fraud or error.
The council is also responsible for assessing the council's ability to continue as a going
concern, disclosing, as applicable, matters relating to going concern and using the goingconcern basis of accounting unless it is intended to abolish the council or to otherwise ceaseoperations.
Auditor's responsibilities for the audit of the financial report
My objectives are to obtain reasonable assurance about whether the financial report as a
whole is free from material misstatement, whether due to fraud or error, and to issue anauditor's report that includes my opinion. Reasonable assurance is a high level of assurance,but is not a guarantee that an audit conducted in accordance with the Australian AuditingStandards will always detect a material misstatement when it exists. Misstatements can arisefrom fraud or error and are considered material if, individually or in aggregate, they couldreasonably be expected to influence the economic decisions of users taken on the basis ofthis financial report.
As part of an audit in accordance with the Australian Auditing Standards, I exercise
professional judgement and maintain professional scepticism throughout the audit. I also:
? Identify and assess the risks of material misstatement of the financial report, whetherdue to fraud or error, design and perform audit procedures responsive to those risks,
and obtain audit evidence that is sufficient and appropriate to provide a basis for myopinion. The risk of not detecting a material misstatement resulting from fraud is higherthan for one resulting from error, as fraud may involve collusion, forgery, intentionalomissions, misrepresentations, or the override of internal control.
? Obtain an understanding of internal control relevant to the audit in order to design auditprocedures that are appropriate in the circumstances, but not for expressing an opinionon the effectiveness of the council's internal control.
? Evaluate the appropriateness of accounting policies used and the reasonableness ofaccounting estimates and related disclosures made by the council.
? Conclude on the appropriateness of the council's use of the going concern basis ofaccounting and, based on the audit evidence obtained, whether a material uncertaintyexists related to events or conditions that may cast significant doubt on the council'sability to continue as a going concern. If I conclude that a material uncertainty exists, Iam required to draw attention in my auditor's report to the related disclosures in thefinancial report or, if such disclosures are inadequate, to modify my opinion. I base my
conclusions on the audit evidence obtained up to the date of my auditor's report.However, future events or conditions may cause the council to cease to continue as agoing concern.
Quilpie Shire Council Annual Report 2016-2017 52 | Page

? Evaluate the overall presentation, structure and content of the financial report, includingthe disclosures, and whether the financial report represents the underlying transactionsand events in a manner that achieves fair presentation.
I communicate with the council regarding, among other matters, the planned scope andtiming of the audit and significant audit findings, including any significant deficiencies ininternal control that I identify during my audit.
Report on other legal and regulatory requirements
In accordance with s.40 of the Auditor-GeneralAct 2009, for the year ended 30 June 2017:
a) I received all the information and explanations I required.b) In my opinion, the prescribed requirements in relation to the establishment and keeping
of accounts were complied with in all material respects.
D A STOL Queensland Audit Officeas delegate of the Auditor-General Brisbane
Quilpie Shire Council Annual Report 2016-2017 53 | Page
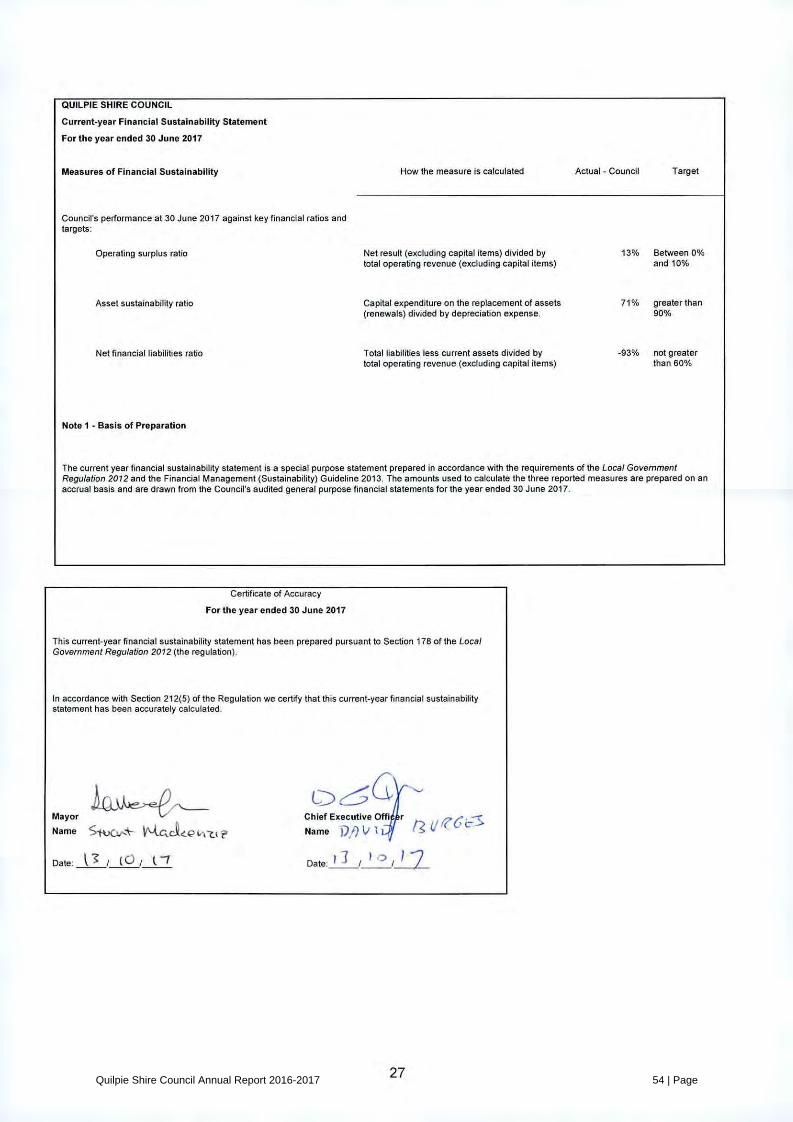
QUILPIE SHIRE COUNCIL
Current-year Financial Sustainability Statement
Forthe yearended 30 June 2017
Measures of Financial SustainablHty How the measure is calculated Actual - Council Target
Council's performance at 30 June 2017 against key financial ratios andtargets:
Operating surplus ratio Net result (excluding capital items) divided by 13% Between 0%total operating revenue (excluding capital items) and 10%
Asset sustainability ratio Capital expenditure on the replacement of assets 71% greater than(renewals) divided by depreciation expense. 90%
Net financial liabilities ratio Total liabilities less current assets divided by -93% not greatertotal operating revenue (excluding capital items) than 60%
Note 1 - Basis of Preparation
The current year financial sustainability statement is a specia5 purpose statement prepared in accordance with the requirements of the Local GovemmentRegulation 2012 and the Financial Management (Sustainability) Guideline 2013. The amounts used to calculate the three reported measures are prepared on anaccrual basis and are drawn from the Council's audited general purpose financial statements for the year ended 30 June 2017.
Certificate of Accuracy
Forthe yearended 30 June 2017
This current-year financial sustainability statement has been prepared pursuant to Section 178 of the LocalGovemment Regulation 2012 (the regulation).
In accordance with Section 212(5) of the Regulation we certify that this current-year financial sustainabilitystatement has been accurately calculated.
Mayor ChiefExecutiveOffi r n +. 7Name t p NameDate: / Date:
27Quilpie Shire Council Annual Report 2016-2017 54 | Page

QUILPIE SHIRE COUNCIL
Long-Term Financial Sustainability Statement
Prepared as at 30 June 2017
Projected for the years ended
Measures of Financial Sustainability Measure Target Actuals at 30 June 30 June 30 June 30 June 30 June 30 June 30 June 30 June 30 June30 June 2018 2019 2020 2021 2022 2023 2024 2025 20262017
Council
Operating surplus ratio Net result divided by total Between 13% -29% -7% -7% -7% -7% -7% -7% -7% -7%operating revenue 0% and10%
Asset sustainability ratio Capital expenditure on the greater 71% 53% 60% 41% 57% 44% 58% 66% 63%
replacement of assets than 90% 50(renewals) divided bydepreciation expense.
Net financial liabilities ratio Total liabilities less current not greater -93% -104% -104% -101% -99% -96% -94% -78% -78% -79%assets divided by total than 60%operating revenue
Quilpie Shire Council's Financial Management Strategy
Council measures revenue and expenditure trends over time as a guide to future requirements and to make decisions about the efficient aHocation of resources to ensure the most effective provision of services. Council ensures that itsfinancial management strategy is prudent and that its long-term financial forecast shows a sound financial position whilst also being able to meet the community's current and future needs.
Certificate of Accuracy
For the long-term financial sustainability statement prepared as at 30 June 2017
This long-term financial sustainability statement has been prepared pursuant to Section 178 of the LocalGovemment Regulation 2012 (the regu\ation).
In accordance with Section 212(5) of the Regulation we certify that this long-term financial sustainabilftystatement has been accurately calculated.
Mayor Chief Executive Off er n.3Name 5 . c.A V Name 7Date: Date:
Quilpie Shire Council Annual Report 2016-2017 55 | Page

INDEPENDENT AUDITOR'S REPORT
To the Councillors of Quilpie Shire Council
Report on the Current Year Financial Sustainability Statement
Opinion
I have audited the accompanying current year financial sustainability statement of QuilpieShire Council for the year ended 30 June 2017, comprising the statement, explanatory
notes, and the certificate of accuracy given by the Mayor and the Chief Executive Officer.
In accordance with section 212 of the Local Government Regulation 2012, in my opinion, in
all material respects, the current year financial sustainability statement of Quilpie ShireCouncil for the year ended 30 June 2017 has been accurately calculated.
Basis of opinion
I conducted my audit in accordance with the Auditor-General of Queensland AuditingStandards, which incorporate the Australian Auditing Standards. My responsibilities underthose standards are further described in the Auditor's responsibilities for the audit of thecurrent year financial sustainability statement section of my report.
I am independent of the council in accordance with the ethical requirements of theAccounting Professional and Ethical Standards Board APES 110 Code of Ethics forProfessional Accountants (the Code) that are relevant to my audit of the statement inAustralia. I have also fulfilled my other ethical responsibilities in accordance with the Code
and the Auditor-General of Queensland Auditing Standards.
I believe that the audit evidence I have obtained is sufficient and appropriate to provide abasis for my opinion.
Emphasis of matter - basis of accounting
I draw attention to Note 1 which describes the basis of accounting. The current year financial
sustainability statement has been prepared in accordance with the Financial Management(Sustainability) Guideline 2013 for the purpose of fulfilling the council's reportingresponsibilities under the Local Government Regulation 2012. As a result, the statementmay not be suitable for another purpose. My opinion is not modified in respect of this matter.
Other Information
Other information comprises the information included in Quilpie Shire Council's annual reportfor the year ended 30 June 2017, but does not include the current year financial
sustainability statement and my auditor's report thereon. At the date of this auditor's report,the other information was the general purpose financial statements and long-term financialsustainability statement.
My opinion on the current year financial sustainability statement does not cover the otherinformation and accordingly I do not express any form of assurance conclusion thereon.However, as required by the Local Government Regulation 2012, I have expressed aseparate opinion on the general purpose financial report.
Quilpie Shire Council Annual Report 2016-2017 56 | Page

In connection with my audit of the financial report, my responsibility is to read the otherinformation and, in doing so, consider whether the other information is materially inconsistent
with the financial report and my knowledge obtained in the audit or otherwise appears to bematerially misstated.
If, based on the work I have performed, I conclude that there is a material misstatement ofthis information, I am required to report that fact. I have nothing to report in this regard.
Responsibilities of the council for the current year financial sustainability statement
The council is responsible for the preparation and fair presentation of the current yearfinancial sustainability statement in accordance with the Local Government Regulation 2012.The council's responsibility also includes such internal control as the council determines isnecessary to enable the preparation and fair presentation of the statement that is accuratelycalculated and is free from material misstatement, whether due to fraud or error.
Auditor's responsibilities for the audit of the current year financial sustainabilitystatementMy objectives are to obtain reasonable assurance about whether the current year financialsustainability statement as a whole is free from material misstatement, whether due to fraudor error, and to issue an auditor's report that includes my opinion. Reasonable assurance isa high level of assurance, but is not a guarantee that an audit conducted in accordance withthe Australian Auditing Standards will always detect a material misstatement when it exists.Misstatements can arise from fraud or error and are considered material if, individually or inthe aggregate, they could reasonably be expected to influence the economic decisions of
users taken on the basis of this statement.
My responsibility does not extend to forming an opinion on the appropriateness or relevance
of the reported ratios, nor on the council's future sustainability.
As part of an audit in accordance with the Australian Auditing Standards, I exercise
professional judgement and maintain professional scepticism throughout the audit. I also:
? Identify and assess the risks of material misstatement of the statement, whether due tofraud or error, design and perform audit procedures responsive to those risks, and
obtain audit evidence that is sufficient and appropriate to provide a basis for myopinion. The risk of not detecting a material misstatement resulting from fraud is higherthan for one resulting from error, as fraud may involve collusion, forgery, intentionalomissions, misrepresentations, or the override of internal control.
? Obtain an understanding of internal control relevant to the audit in order to design auditprocedures that are appropriate in the circumstances, but not for the purpose ofexpressing an opinion on the effectiveness of the councifs internal control.
? Evaluate the appropriateness of accounting policies used and the reasonableness ofaccounting estimates and related disclosures made by the council.
? Evaluate the overall presentation, structure and content of the statement, including thedisclosures, and whether the statement represents the underlying transactions andevents in a manner that achieves fair presentatlon.
Quilpie Shire Council Annual Report 2016-2017 57 | Page
I communicate with the council regarding, among other matters, the planned scope andtiming of the audit and significant audit findings, including any significant deficiencies ininternal control that I identify during my audit.
OuEENSL4mg
19 OCT 2017
D A STOLZ 400/r of fics Queensland Audit Officeas delegate of the Auditor-General Brisbane
Quilpie Shire Council Annual Report 2016-2017 58 | Page