annual report 2016 - coeclerici€¦ · · 2017-06-12we specialize in coal mining, ... factors...
TRANSCRIPT

ANNUAL REPORT 2016

The cover image shows “The m/v “Cocler” in the port of Genoa”, painted by Dirk Verdoorn. A long-standing part of the Coeclerici collection, the painting is presently exhibited at the Galata Sea Museum in Genoa in the “Scagni & Vapori - Shipowners Tell” hall which opened in March 2017.
Selecting this image for the 2016 financial statements cover was not a coincidence. The “Cocler” was the first Liberty ship purchased by Henry Coe & Clerici to restart shipping after the Second World War.
The “Cocler” symbolises rebirth, the future, the ability to overcome difficulties and seize the challenges and opportunities offered by the market. It represents 2016 which was a turning point in which the Coeclerici Group decided to diversify and enter new business areas.
Coeclerici SpA
Registered Office:Piazza Generale Armando Diaz 7, 20123 Milan, Italy
VAT Reg.No., Tax Code No. and Registered Companies No.: 00269690103
Chamber of Commerce No. 1761693Direction and Coordination: Fincler Srl

RED IS GREEN
We specialize in coal mining, trading and logistics for energy and steel industries all over the world. We’ve always believed in an energy source that helps improve life for a growing global community. Today’s technological evolutions have proven us right, demonstrating that coal can be a go-to resource for shared, sustainable development.
WE BELIEVE IN CLEAN COAL TECHNOLOGY: THE BEST PATH TO A BRIGHTER, MORE ENVIRONMENTALLY FRIENDLY FUTURE.
ItalyAustraliaChinaColombiaGermanyIndiaIndonesiaRussiaSingaporeSwitzerlandThe Netherlands UsaVenezuela
THE COECLERICIGROUP
www.coeclerici.com

TABLE OF CONTENTS
3
6
11
14
22
26
28
32
32
32
32
32
33
33
34
37
46
54
57
83
84
85
40
41
41
42
43
Chairman’s message
Company Officers
Group Structure
Directors’ Report
Notes to the Consolidated Financial Statements
Consolidated Financial Statements
Principles used in drawing up the financial statements
Consolidation area
Notes to the accounts
Appendix 1 – List of consolidated companies
Appendix 2 – Comparison of equity
Technical glossary
Consolidated balance sheet
Consolidated income statement
Consolidated statement of comprehensive income
Consolidated statement of changes in equity
Consolidated statement of cash flows
Consolidated results
Trading Division
Mining Division
Logistics & Shipping Division
Holding Company
Research and development
Staff training
Own shares and shares of the parent company
Transactions with parent and related companies
Main risks and uncertainties
Environment and safety
Corporate governance
Outlook
88
90
Auditors’ Report Independent Auditors’ Report
Board of Statutory Auditors’ Report
94Offices

Turnover Investmentsover last 5 years*
Countries Employees **
621 ml 236 ml 13 917
COECLERICIGROUP
AT A GLANCE
* Includes entities accounted for using the equity method Investments adjusted to exchange rates at 31 December 2016** Figures at 31 December 2016
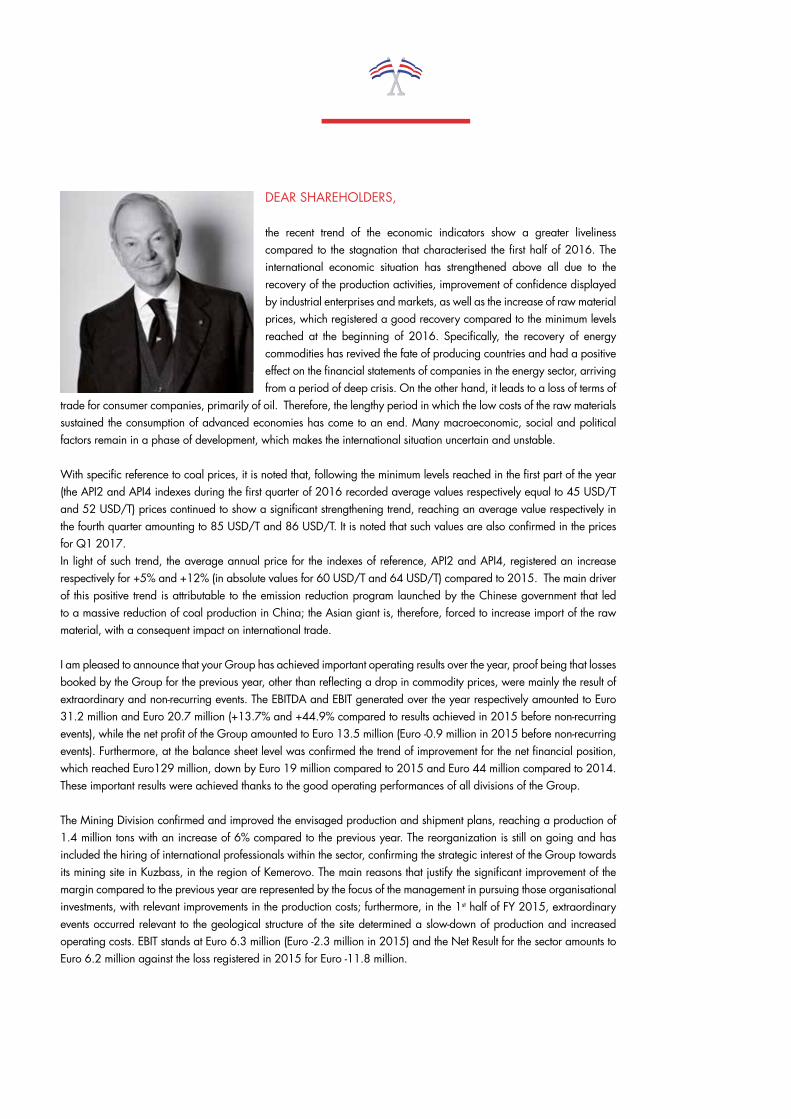
DEAR SHAREHOLDERS,
the recent trend of the economic indicators show a greater liveliness compared to the stagnation that characterised the first half of 2016. The international economic situation has strengthened above all due to the recovery of the production activities, improvement of confidence displayed by industrial enterprises and markets, as well as the increase of raw material prices, which registered a good recovery compared to the minimum levels reached at the beginning of 2016. Specifically, the recovery of energy commodities has revived the fate of producing countries and had a positive effect on the financial statements of companies in the energy sector, arriving from a period of deep crisis. On the other hand, it leads to a loss of terms of
trade for consumer companies, primarily of oil. Therefore, the lengthy period in which the low costs of the raw materials sustained the consumption of advanced economies has come to an end. Many macroeconomic, social and political factors remain in a phase of development, which makes the international situation uncertain and unstable.
With specific reference to coal prices, it is noted that, following the minimum levels reached in the first part of the year (the API2 and API4 indexes during the first quarter of 2016 recorded average values respectively equal to 45 USD/T and 52 USD/T) prices continued to show a significant strengthening trend, reaching an average value respectively in the fourth quarter amounting to 85 USD/T and 86 USD/T. It is noted that such values are also confirmed in the prices for Q1 2017. In light of such trend, the average annual price for the indexes of reference, API2 and API4, registered an increase respectively for +5% and +12% (in absolute values for 60 USD/T and 64 USD/T) compared to 2015. The main driver of this positive trend is attributable to the emission reduction program launched by the Chinese government that led to a massive reduction of coal production in China; the Asian giant is, therefore, forced to increase import of the raw material, with a consequent impact on international trade.
I am pleased to announce that your Group has achieved important operating results over the year, proof being that losses booked by the Group for the previous year, other than reflecting a drop in commodity prices, were mainly the result of extraordinary and non-recurring events. The EBITDA and EBIT generated over the year respectively amounted to Euro 31.2 million and Euro 20.7 million (+13.7% and +44.9% compared to results achieved in 2015 before non-recurring events), while the net profit of the Group amounted to Euro 13.5 million (Euro -0.9 million in 2015 before non-recurring events). Furthermore, at the balance sheet level was confirmed the trend of improvement for the net financial position, which reached Euro129 million, down by Euro 19 million compared to 2015 and Euro 44 million compared to 2014.These important results were achieved thanks to the good operating performances of all divisions of the Group.
The Mining Division confirmed and improved the envisaged production and shipment plans, reaching a production of 1.4 million tons with an increase of 6% compared to the previous year. The reorganization is still on going and has included the hiring of international professionals within the sector, confirming the strategic interest of the Group towards its mining site in Kuzbass, in the region of Kemerovo. The main reasons that justify the significant improvement of the margin compared to the previous year are represented by the focus of the management in pursuing those organisational investments, with relevant improvements in the production costs; furthermore, in the 1st half of FY 2015, extraordinary events occurred relevant to the geological structure of the site determined a slow-down of production and increased operating costs. EBIT stands at Euro 6.3 million (Euro -2.3 million in 2015) and the Net Result for the sector amounts to Euro 6.2 million against the loss registered in 2015 for Euro -11.8 million.
The Trading Division, over the year, achieved good results in a market experiencing strong tension and difficulty and by constantly changing and volatile indices. Traded volumes, for 8.2 million tons of coal, are down by 16% compared to the previous year, this due to a strategy aimed at marketing products with higher added value, favouring profitability over volume, hence mitigating corporate risk, as well as the transfer of a part of the American subsidiary’s client portfolio to shale gas. The continuity of production at our mine in Russia has reduced the supply of raw material from outside suppliers with a positive impact on margins. Also noteworthy is the Asian activity, which has achieved good results in terms of strengthening and diversification of sources and clients. The organisational stability achieved following an approximately two-year reorganisation process, contributed in terms of commercial synergy and scale economies, as well as the achievement of objectives. The EBIT generated over the year amounts to Euro 11.5 million (Euro 0.8 million in FY 2015).
The Logistics Division confirmed the excellent results achieved during the previous year, owing to the financial and operational performance recorded by owned vessels: both the sister vessels Bulk Zambesi and Bulk Limpopo operating in Mozambique to the benefit of the mining giant Vale and the operating units in Indonesia, 4 units to the benefit of the client Berau and one operating for KPC, achieved excellent results with and EBITDA margin of 51%. During the year, the certification pursuant to the BS OHSAS 18001:07 standard was successfully extended to the Indonesian companies and five vessels, hence completing the certification of the entire fleet and relevant shipping companies.Rationalisation of the organisational and corporate structures of the division continues.As regards to the Shipping Division, over this year the last two Supramax sister ships were delivered, DACC Adriatico and DACC Atlantico. The delivery of the mentioned vessels allowed for the completion of the envisaged investment plan with an operating fleet of four 60,000 ton Supramax sister ships, which allowed for the joint venture with the d’Amico Group, called dACC Maritime d.a.c, to continue its operations in the shipping business for the transport of dry bulk cargo; this business is still affected by low charter rates but have recorded the first signs of recovery.At an organisational level, Coeclerici Logistics S.p.A., through its commercial, technical business and dedicated staff, continued to coordinate and be the hub of the Logistics and Shipping Activities of your Group with full autonomy and capacity to meet current and future challenges. Overall, the two divisions confirm the turnover levels of Euro 41 million, good profitability with an EBITDA and EBIT respectively for Euro 17.9 million and Euro 11.1 million and a net result of Euro 8.9 million (+5% compared to the previous period).
2016 was a particularly important year for our Group; in addition to achieving more encouraging economic results compared to previous years, due to changes such as the redesign and innovation of the business model, customer services and corporate organisation, it represented the entry of our Group into a new business area. The Group, in line with the innovative capacity of our history and the enthusiasm to continue to take on new challenges, entered into the business of manufacturing high-technology automatic industrial machineries for the converting, packaging and automotive sectors by acquiring a majority stake in the IMS Deltamatic Group. This investment represents a fundamental step, which launches us into a new dynamic and profitable market. The acquisition fits in the business diversification strategy and confirms the entrepreneurial and industrial nature of our Group.
IMS Deltamatic, with headquarters in Calcinate (Bergamo), boasts a long track record in the converting industry, with its first machine built by the subsidiary Goebel in 1851. Through several acquisitions carried out in the last few years, the group has become a leading player with a steady growth rate on a global scale. With four plants – two in Italy, one in Germany and one in the US – an office in China and over 300 employees, IMS Deltamatic has reached a consolidated turnover of about Euro 60 million in 2015, 90% generated abroad, and an EBITDA margin of approximately 7.5%. The takeover, effective as of January 2017, of 67% of the capital by our Group entails an overall investment of about Euro 19 million, of which Euro 10 million to strengthen its net asset through a capital increase, aimed to support the future growth of the company also through further acquisitions.
IMS Deltamatic’s founder Raffaele Ghilardi will hold the remaining 33% stake and he will support the management for the definition of strategies, ensuring business continuity and knowledge of the markets and the clients’ business. In market terms, the target company operates in sectors that have been growing as a direct result of the increased use of plastic film, aluminium, paper and related compounds for the food and pharmaceutical industries as well as special applications, and automotive components (platforms, trunk coverings, parcel shelves), although, it reports different geographic trends in the above sectors.
I would like to take the opportunity to thank the management and employees of the Group for their constant commitment and the results obtained.
Milan, 28 March 2017 Chairman an CEO Paolo Clerici

COMPANY OFFICERS
Board of Directors Paolo Clerici
Teresio Gigi Gaudio
Corrado Papone
Antonio Belloni
Giorgio Cefis
Andrea Clavarino
Giacomo Clerici
Giovanni Jody Vender
Lupo Rattazzi
Chairman and CEO
Executive Deputy Chairman and Responsible for Risk Avoidance
Deputy Chairman
Director
Director
Director
Director
Director
Director
The term of office of the Board of Directors expired with the approval of the financial statements on 31 December 2016.
Chairman
Standing Auditor
Standing Auditor
Deputy Auditor
Deputy Auditor
The term of office of the Board of Statutory Auditors will expire with the approval of the financial statements on 31 December 2017.
Independent AuditorsEY SpA
The independent auditing firm has been appointed for the three-year period 2015/2017. The term of office of the independent auditing firm will expire with the approval of the financial statements on 31 December 2017.
Board of Statutory AuditorsGuglielmo Calderari di Palazzolo
Maurizio Dragoni
Isabella Resta
Antonino Foti
Nicola Iberati

COECLERICI’S ROLE IN THECOAL VALUE CHAIN
The added value offered by the Coeclerici Group arises from its experience in all phases of the supply of coal. The Group’s activities vary from mining extraction to the transportation of coal by land, and from transshipment to the transportation of coal by sea, thereby guaranteeing that clients receive the high-quality product within the times agreed.
THE VALUE CHAIN
Mining
Land transport
Rail
Truck
Waterway
Exportseaterminal
Client
Energy andSteel industries
Land transport
Rail
Truck
Waterway
Importseaterminal
Shipping
TransshipmentBlending/Storage Blending/StorageTransshipment

A HISTORY OF SUCCESS
Coeclerici becomes the first company to import US coal into Italy and expands into the shipping sector. In 1913, the Group buys its first dry cargo vessel: the “Tirreno”.In 1916 Henry Coe leaves the company, selling his stake to Alfonso Clerici Senior.
Alfonso’s son Jack Clerici joins the company in 1936.After World War II, Coeclerici resumes business and consolidates its international presence in the US, England, South Africa, Australia and the Soviet Union (at the end of the 1950s).In 1964, Coeclerici signs an agreement for exclusive right to sell Soviet coal and scrap iron on the Italian market.
The Shipping division concluded 16 charter contracts to build10 new Panamax and 6 Capesize. The Coeclerici pool operates a fleet of 47 Capesize and44 Panamax; becomes one of the top three operators of dry bulk cargo in Europe.Coeclericiopens offices in China and Indonesia and starts to operate transshipment activities in Indonesia with the “Bulk Pioneer”.
1936-1969
1910s
Coeclerici signs a contract with the trade port of Murmanskand finances the dredging operations for the same, necessary to allow access to ships up to 130,000 tons.In 2000, in Murmansk, Coeclerici loads the first ever Capesize ship in a port of Northern Russia.The first contracts are signed for transshipment activities on a worldwide level.
2002
Coeclerici invests approximately 18 million USD to finance the completion of a coal mine in Kemerovo, in Russia, and signs a long-term contract, granting the company the exclusive rights to sell the two million tons of coal produced annually. The Group also signs a ten-year partnershipwith the port of Murmanskfor the exclusive use of acoal berth.
1998-2000
2003-2005
1970-1997
Coeclerici strengthens its shipping sector by purchasing and operating barges to transship coal within port basin areas. This solution is called and registered as “Cavalletto”.A strategic step towards developing the Group’s logistics business. In 1985 Bulkitalia S.p.A was founded; this company acquires Nedlloyd’s dry bulk fleet in 1992 and in 1994 acquires Fermar, a company belonging to Ferruzzi Group, and Sidermar.
1895Founded in Genoa, the
company starts its activity by importing coal from the
United Kingdom

2007
Coeclericiacquires a 60% stake – increased to 85% in 2008 and to 100% in 2010 – in RAG Trading Asia Pacific Ltd, a Singapore based company specialized in coke and coking coal Through CoeclericiAsia (Pte) Ltd,the Group develops and strengthens its activities across the Far East.
Coeclericiacquires 100% of Korchakol,a low volatile coal (PCI and thermal coal) mine located in Siberia in the vicinity of the city of Novokuznetsk,becoming the first and only Western company to have acquired a steam coal mine in Russia.The Logistics division starts to operate in India with “Bulk Prosperity”,a last-generation offshore transshipper.
The Logistics Division takes delivery of the first four of six new vessels, designed to the highest standard and performance to be employed in long term service contracts signed: the “Bulk Java” and the “Bulk Borneo”, used in Indonesia,the “BulkZambesi” and the “Bulk Limpopo”,used in Mozambique.Coeclerici enters the US market.The Group’s Trading Division acquires the assets of the American company CoalNetwork Inc.
2011-2012
2008
The Group once again invests in theShipping sector with the creation of dACCMaritime d.a.c.,a joint venture with the d’Amico Group, for the purchase of four Supramax bulk carriers.In 2013 Coeclerici Coal Network LLC acquires full ownership of the coal trading division of Alley-Cassetty Companies, Inc.The new vessels“Bulk Celebes”and “BulkSumatra”.
2013Coeclericicelebrates the 120th anniversaryof its foundation(1895 – 2015).
dACC Maritime Ltd takes delivery of “DACC Tirreno” (which inherits the name of the first vessel purchased by the Group in 1913)and “DACC Egeo”.
Coeclerici enters into the business of manufacturing high-technology automatic industrial machineries for the converting, packaging and automotive sectors by acquiring a majority stake in the IMS Deltamatic Group.
dACC Maritime d.a.c. takes delivery of the last two ships “DACC Adriatico” and “DACC Atlantico”.
2015
2016


GROUPSTRUCTURE
DECEMBER, 31 2016
COECLERICISpA
Non operational companies and those in liquidation are excluded* 1% of the subsidiary LLC Coeclerici Russia is held by Coeclerici SpA** Previously named Coeclerici Compagnie SA (change of name occured on January, 5th 2016)
LOGISTICS DIVISION
SHIPPING DIVISION
TRADING DIVISION
MINING DIVISION
100% Coeclerici Logistics SpA
100% Coeclerici Mozambico SpA
100% Capo Noli Transportes Maritimos Lda
90% Bulkguasare de Venezuela SA
90% Venezuela BulkLogistics SA
70% Logconversion Transportes Maritimos Lda
49% PT Pelayaran Logistik Konversi Indonesia
49% PT Asian Bulk Logistics
100% CGU Logistic Ltd
49% dACC Maritime d.a.c.
100% Coeclerici Commodities SA
100% LLC Scc-Rozco
99% LLC Coeclerici Russia*
100% DAKO Coal GmbH
70% Coeclerici Coal Network Inc.
100% SC Kisk
100% LLC UK PTU
100% Sel Pre Taylepskoe
100% Coeclerici Far East (Pte) Ltd
100% Elvezia Immobiliare SA
100% Coeclerici Americas Real Estate Inc.
99.98% Nuevaco Imobiliaria Srl


14Consolidated results
22 Trading Division
26 Mining Division
28 Logistics & Shipping Division
32Holding Company
32 Research and Development
32 Staff training
32Own shares and shares of the parent company
32Transactions with parent and related companies
33 Main risks and uncertainties to which the Group is exposed
33 Environment and safety
34 Corporate governance
37 Outlook
DIRECTORS’ REPORT

DIRECTORS’ REPORT
2016 2015 2014
Turnover 621,037 683,981 588,628
Ebitda 31,175 20,254 30,431
Ebit 20,650 4,129 14,330
Net Result 14,568 (22,354) 5,380
Group Net Profit 13,491 (22,876) 4,157
2016 2015 2014
Fixed assets 158,537 152,134 173,763
Working Capital 43,868 54,747 68,773
Net Capital Employed 202,405 206,881 242,536
Group Equity 66,349 51,883 60,453
Minority Interests 6,986 6,727 9,013
Net Financial Position 129,070 148,271 173,070
Sources of Finance 202,405 206,881 242,536
Cash flow from operating activities 38,805 28,896 16,683
Cash flow from investing activities (12,283) 7,935 (16,780)
Cash flow from financing activities (21,380) (15,880) (4,976)
ROE 22% (35%) 7%
ROI 10% 2% 6%
Indice PFN/EQUITY 1.76 2.53 2.49
CONSOLIDATED RESULTSHere below are shown some of the main financial indicators and a comparison with the consolidated financial statements of 2015 and 2014 drawn up in accordance with International Financial Reporting Standards - IFRS (figures in thousands of Euros):
The Group’s net result for 2016 was Euro 13.5 million, a significant increase over the comparable figure of 2015. However, 2015 was marked by extraordinary and non-recurring events which generated a loss of Euro 22.3
million. In order for a better comparison of the figures shown above, it is useful to illustrate, in the table below, the list of “Key Performance Indicators” net of these events (2015 Adjusted).
Euros of Group Net Profit in 2016
13.5 M L
1514
ANNUAL REPORT 2016
DIRECTORS’ REPORT
CONSOLIDATED RESULTS
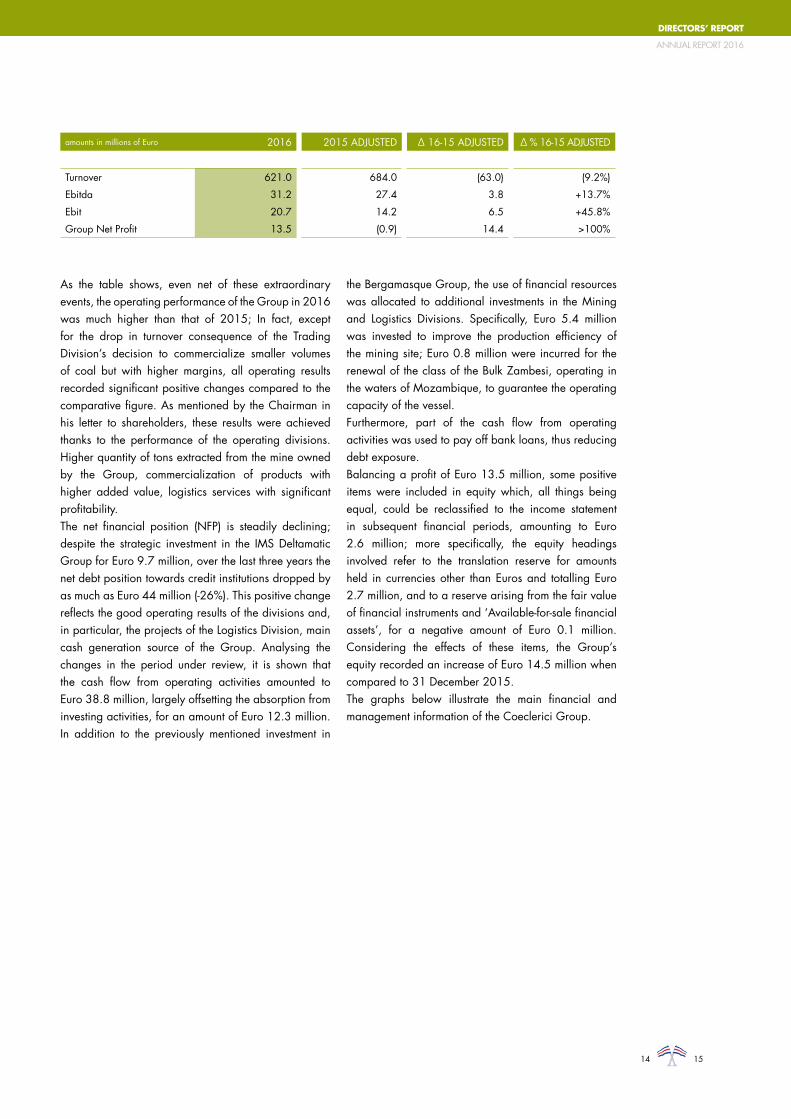
As the table shows, even net of these extraordinary events, the operating performance of the Group in 2016 was much higher than that of 2015; In fact, except for the drop in turnover consequence of the Trading Division’s decision to commercialize smaller volumes of coal but with higher margins, all operating results recorded significant positive changes compared to the comparative figure. As mentioned by the Chairman in his letter to shareholders, these results were achieved thanks to the performance of the operating divisions. Higher quantity of tons extracted from the mine owned by the Group, commercialization of products with higher added value, logistics services with significant profitability.The net financial position (NFP) is steadily declining; despite the strategic investment in the IMS Deltamatic Group for Euro 9.7 million, over the last three years the net debt position towards credit institutions dropped by as much as Euro 44 million (-26%). This positive change reflects the good operating results of the divisions and, in particular, the projects of the Logistics Division, main cash generation source of the Group. Analysing the changes in the period under review, it is shown that the cash flow from operating activities amounted to Euro 38.8 million, largely offsetting the absorption from investing activities, for an amount of Euro 12.3 million. In addition to the previously mentioned investment in
the Bergamasque Group, the use of financial resources was allocated to additional investments in the Mining and Logistics Divisions. Specifically, Euro 5.4 million was invested to improve the production efficiency of the mining site; Euro 0.8 million were incurred for the renewal of the class of the Bulk Zambesi, operating in the waters of Mozambique, to guarantee the operating capacity of the vessel.Furthermore, part of the cash flow from operating activities was used to pay off bank loans, thus reducing debt exposure.Balancing a profit of Euro 13.5 million, some positive items were included in equity which, all things being equal, could be reclassified to the income statement in subsequent financial periods, amounting to Euro 2.6 million; more specifically, the equity headings involved refer to the translation reserve for amounts held in currencies other than Euros and totalling Euro 2.7 million, and to a reserve arising from the fair value of financial instruments and ‘Available-for-sale financial assets’, for a negative amount of Euro 0.1 million. Considering the effects of these items, the Group’s equity recorded an increase of Euro 14.5 million when compared to 31 December 2015.The graphs below illustrate the main financial and management information of the Coeclerici Group.
amounts in millions of Euro 2016 2015 ADJUSTED ∆ 16-15 ADJUSTED ∆ % 16-15 ADJUSTED
Turnover 621.0 684.0 (63.0) (9.2%)
Ebitda 31.2 27.4 3.8 +13.7%
Ebit 20.7 14.2 6.5 +45.8%
Group Net Profit 13.5 (0.9) 14.4 >100%

FINANCIAL CAPITALTURNOVER BY GEOGRAPHICAL AREA (M/EURO)
America
FY14FY15FY160
5.000
10.000
15.000
20.000
25.000
30.000
35.000
20132014
77
166
1318%
12%
52%
27%
FY161%
AfricaAsia and AustraliaEuropeAmerica Russia and Middle East

1716
ANNUAL REPORT 2016
DIRECTORS’ REPORT
Europe Russia
Africa Asia & Australia
FY14FY15FY16
168
251
176
FY14FY15FY160
5.000
10.000
15.000
20.000
25.000
30.000
35.000
20132014
4852
31
FY14FY15FY160
5.000
10.000
15.000
20.000
25.000
30.000
35.000
20132014
4
3
6
FY14FY15FY160
5.000
10.000
15.000
20.000
25.000
30.000
35.000
20132014
324
212
245FY14FY15FY16
0
5.000
10.000
15.000
20.000
25.000
30.000
35.000
20132014
621
684
589
Revenues

TONNES HANDLED (THOUSANDS OF METRIC TONNES - MT)*
FY 2016 TURNOVER BY DIVISION
* Offset by intercompany transactions
Mining*
1% 6%
93%
Logistics
Trading
FY1631,886
FY1534,501
FY1429,759

1918
ANNUAL REPORT 2016
DIRECTORS’ REPORT
PRODUCTIVE CAPITAL
0
2
4
6
8
10
12
14
16
18
20
FY14FY15FY16
2016 182015 82014 18
Investments over the last 3 years equal to
Euro 44 million
2016 1992015 2142014 217
INVESTMENTS* (M/EURO)
FINANCIAL LIABILITIES (M/EURO)
0
50
100
150
200
250
FY14FY15FY16
Disponibiliàliquide al
31 Dicembre2015
Flussomonetario
da attività difinanziamento
Flussomonetario
da attività diinvestimento
Flussomonetarioda attivitàoperativa
Disponibiliàliquide al
31 Dicembre2015
Flussomonetario
da attività difinanziamento
Flussomonetario
da attività diinvestimento
Flussomonetarioda attivitàoperativa
Disponibiliàliquide al
31 Dicembre2014
77%
23%
76%
24%
62%
38%
49
+17 -17
-5
44
+29+8 -16
65
Short term financial liabilities Medium-long term financial liabilities
*Does not include investments made by companies consolidated using the equity method

CASH FLOW (M/EURO)
0
50
100
150
200
250
201320142015
Cash and cash equivalents
at 31 December 2016
Cash flowfrom financing
activities
Cash flowfrom investing
activities
Cash flowfrom operating
activities
Cash and cash equivalents at 31 December
2015
Cash flow from financing
activities
Cash flow from investing
activities
Cash flow from operating
activities
Cash and cash equivalents at 31 December
2014
76%
24%
62%
38%
69%
31%
44
+29+8 -16
65
+39 -12
-22
70
NET FINANCIAL POSITION (M/EURO)
2016 1292015 1482014 173115
125
135
145
155
165
175
185
FY14FY15FY16

2120
ANNUAL REPORT 2016
DIRECTORS’ REPORT
HUMAN CAPITAL
N° OF EMPLOYEES 2016 2015
Africa 67 68
America 18 19
Asia & Oceania 52 52
Russia & Middle East 711 717
Europe 69 78
Total 917 934
2016 2015
Average age of employees 43 43
2016 2015
Level of education* 49% 55%
* This index considers the percentage of white collar Group employees with university degrees.

TRADING DIVISION
Volumes handled by the Division were 16% lower than the previous year determining a decrease in turnover despite the prices of coal increased in the second half of the year. The drop in volumes is the result both of the commercial strategy adopted to sell products with higher added value (the graph below shows the increase of the PCI, product with a higher heat-producing power and with higher margins, which goes from an incidence of sales of 26% in 2015 to an important 38% in 2016), and from the transfer to shale gas of a part of the client portfolio of the American subsidiary. The increase of coal prices, production continuity and mining quality of our mine together with the increased efficiency which affected all the stages of the value chain (storage, transport, blending and marketing) of our mining site were the main determining factors of the profitability achieved; EBITDA registered an increase of Euro 7.8 million compared to the previous year and the net result for the sector, for Euro 7.5 million, neutralizes and exceeds
the loss recorded in 2015.The Asian activities during the year reached important operational results thanks to the consolidation of its core business and a greater differentiation of products and customers.
Despite strong competition from alternative sources in the US market our subsidiary Coeclerici Coal Network during the year generated positive results, albeit lower than in previous years.
The German subsidiary Dako Coal, specialised in the commercialisation and distribution of Petcoke, after various years of negative margins over the year it achieved a positive operating result net of the extraordinary impacts.
Here below follows a comparison of tons handled, by product type:
2016 2015 2014
Tonnes handled 8,230,420 9,811,440 8,564,340
Turnover 575,592 638,826 549,249
Ebitda 11,834 4,010 8,511
Ebit 11,417 717 6,937
Net Result 7,497 (7,086) 2,952Ebitda 2016 compared to 2015
2.9 X
COAL PRODUCT TYPE
16%10%
5%
38%
FY1617%
12%
2%
19% 21%
4%
26%
FY1521%
8%1%
29%
16%
6%27%
FY14 14%
7%
1%
Russian Steam Coal Other Steam Coal Coking Coal
CokePetcoke
PCI Distribution and other

2322
ANNUAL REPORT 2016
DIRECTORS’ REPORT
0
100
200
300
400
500
600
700
FY14FY15FY16
-10%
+16%
-2%
TURNOVER TREND (M/EURO)
FY16 576 FY15 639FY14 549
CAGR +1.6%
PCI Distribution and other
TURNOVER BY GEOGRAPHICAL AREA
3%
26%
39%
FY15
32%
1%
24%
1%
FY14
43%
31%
AfricaAmericaAsia and Australia
Russia and Middle EastEurope
3%
13%29%
FY16
55%

As illustrated in the letter of the Chairman, API2, our benchmark index, registered a significant drop in prices for the first quarter of the year and then it registered a reversal of the trend arriving in December 2016 at a price of 90 USD/T.
The evolution of the two main coal market indicators of the previous three years appear below, which shows the improvement of the course of the raw material compared to 2015.
API 2API 4
USD/mt
100.0
90.0
80.0
70.0
60.0
50.0
40.0
30.0
20.0
Q12014
Q22014
Q32014
Q42014
Q12015
Q22015
Q32015
Q42015
Q12016
Q22016
Q32016
Q42016
API#2 = CIF coal price (including freight cost) - unloading ARA (Amsterdam-Rotterdam-Antwerp)API#4 = FOB coal price (without freight cost) - port of Richards Bay (South Africa)
2016 2015 2014
API#2 INDEX – average 60 57 75
API#4 INDEX – average 64 57 72

2524
ANNUAL REPORT 2016
DIRECTORS’ REPORT

MINING DIVISION
2016 2015 2014
Tonnes handled 1,368,633 1,202,096 1,226,662
Turnover 36,441 31,820 33,402
Ebitda 9,236 1,588 3,549
Ebit 6,308 (2,335) (1,365)
Net Result 6,248 (11,783) (5,695)
Over the year, as confirmation of the Group’s strategic interest in the mining site owned, Coeclerici Commodities subscribed a capital increase in its subsidiary SC KISK, aimed at supporting the capex plan necessary to optimise profitability and full operations of the investment.The coal extracted exceeded the forecast of the production plan resulting in an increase of 6% compared to 2015. The 14% increase of tonnes handled was affected by the extraordinary events during the first half of FY 2015, due to the geological structure of the site, which resulted in a slow-down of production, subsequently recovered in the second half of the previous year.
The positive figures relevant to the production are further encouraged by the gradual drop in costs, also in light of the reorganisation process started at the end of 2015, by hiring international professionals with years of experience in the mining industry.
EBITDA and EBIT are respectively Euro 9.2 million and Euro 6.3 million. Net income is also impacted by currency exchange gains mainly due to the exchange rate effect of the rouble on debts in USD.
Tonnes extracted compared to 2015
+6%
TONNES EXTRACTED (THOUSANDS OF MT)
FY161,422
FY151,335
FY141,102

2726
ANNUAL REPORT 2016
DIRECTORS’ REPORT

LOGISTICS & SHIPPING DIVISION
2016 2015 2014
Metric tonnes handled including JV 23,552,821 24,600,729 21,182,296
Turnover 40,770 39,792 36,916
Ebitda 17,874 22,674 15,220
Ebit 11,148 14,551 6,184
Net Result 8,880 8,446 6,428
The drop in tonnes handled for 1,047,908 tonnes is due to the drop in quantities of coal handled by Coeclerici Mozambico S.p.A. in the port of Beira that, over the last quarter, required the use of only one vessel. The drop in
quantities handled does not affect profitability given than the two units are managed under long-term time charter contracts with fixed daily hire.
Ebitda margin
+44%
TONNES HANDLED (THOUSANDS OF MT)
FY1623,553
FY1524,601
FY1421,182
BSI TCEUSD/Day
14,040
12,040
10,040
8,040
6,040
4,040
2,040
Q12014
Q22014
Q32014
Q42014
Q12015
Q22015
Q32015
Q42015
Q12016
Q22016
Q32016
Q42016
The higher revenues compared to 2015 (+2.4%), are due to the strong performance by the associate PT Pelayaran Logistik Konversi Indonesia. The operational units employed in Mozambican and East Kalimantan waters have confirmed the good profitability and a significant cash generation. The decrease of the EBITDA is attributable both to the write-down of a trade receivable from previous years, for Euro 2.1 million, and the loss recorded by JV dACC Maritime d.a.c. with the d’Amico Group, for Euro 3 million, which was affected
by the unfavourable situation in the shipping market. Nevertheless, the net result of the division recorded an increase of 5% compared to the previous year. Here below follows the evolution of the main indices of the shipping market for the Supramax Vessels (Baltic Supramax Index Time Charter Equivalent – BSI TCE), which highlights the reversal of the trend, after touching a record low in February 2016 with a daily freight rate of Euro 2.5 thousand.

2928
ANNUAL REPORT 2016
DIRECTORS’ REPORT
0
10
20
30
40
50
60
FY14FY15FY16
+2% +8%+48%
TURNOVER TREND (M/EURO)
FY16 41FY15 40FY14 37
CAGR +3.4%
TURNOVER BY GEOGRAPHICAL AREA
3%
22%
FY16
75%
AfricaAsia and Australia
Europe
3%
21%
FY15
76%
11%
72%
FY14
17%

COMPANY TPL YEAR OF CONSTRUCTION
Bulk Pioneer PT Pelayaran Logistik Konversi Indonesia 5,974 2005
Bulk Zambesi Coeclerici Mozambico SpA 54,400 2011
Bulk Limpopo Coeclerici Mozambico SpA 54,400 2012
Bulk Celebes PT Asian Bulk Logistics* 11,470 2007
Bulk Java PT Asian Bulk Logistics* 11,838 2011
Bulk Borneo PT Asian Bulk Logistics* 11,838 2012
Bulk Sumatra PT Asian Bulk Logistics* 11,838 2013
Lancia Matias Bulkguasare de Venezuela SA N/A 2010
Lancia Sophie Bulkguasare de Venezuela SA N/A 2010
Lancia Jack C. Bulkguasare de Venezuela SA N/A 2010
(*) Company consolidated using equity method
The Logistics Division fleet at 31 December 2016, consisted of the following:

3130
ANNUAL REPORT 2016
DIRECTORS’ REPORT

HOLDING COMPANY
RESEARCH AND DEVELOPMENT
STAFF TRAINING
OWN SHARES AND SHARES OF THE PARENT COMPANY
TRANSACTIONS WITH PARENT AND RELATED COMPANIES
2016 2015 2014
Turnover 3,824 6,489 6,217
Ebitda (7,769) (8,018) 3,151
Ebit (8,223) (8,804) 2,574
Net Result (8,057) (11,931) 1,695
The Holding, following the reorganization process which gave more autonomy to the divisions by transferring personnel and structures, focused on the coordination, control and definition of the strategic guidelines of the
Coeclerici Group. Nevertheless, the Holding Company continues to offer its subsidiaries and associates IT and Human Resource services.
The Group conducts development primarily of a commercial nature, with special reference to the Logistics and Trading divisions. Inside the Logistics Division, this activity focus on research into and study of new projects
regarding the transportation and transshipping of raw materials. All R&D costs are included in the income statement.
During 2016, health and safety at work courses were planned to meet statutory requirements.
Overall were set aside 564 hours of training.
The Holding Company does not hold its own shares nor those of its parent company.
The Group has important relations for tax consolidation procedures with the parent company Fincler Srl, which holds the position of consolidator. The credit arising from this position at 31 December 2016 towards Fincler Srl is mentioned in the Notes to the accounts. Furthermore, an office rental contract exists between the Group and its direct holding company, Fincler Srl, referring to the offices in Piazza Generale Armando Diaz, 7 – Milan.
In accordance with clause 5, article 2497 bis of the Italian Civil Code, it is hereby affirmed that relations with Fincler Srl, which conducts activities of direction and coordination of the Group, exclusively concerned the rental contract which was regulated by normal market conditions, as well as the tax consolidation, as described in the Notes to the accounts.

3332
ANNUAL REPORT 2016
DIRECTORS’ REPORT
MAIN RISKS AND UNCERTAINTIES TO WHICH THE GROUP IS EXPOSED
ENVIRONMENT AND SAFETY
The main risks linked to the Group’s activities, monitored and handled by Coeclerici SpA and its subsidiaries, are as follows:• market risk resulting from exposure to the volatility
of commodity prices;• market risk resulting from exposure to fluctuations
in the exchange rate;• market risk resulting from exposure to fluctuations
in interest rates;• credit risk resulting from the possibility of insolvency
of a counterparty;• liquidity risk resulting from a lack of financial
resources to meet commitments undertaken;• political risk, resulting from activities conducted
countries where from time to time elements of uncertainty arising from specific political and social conditions may be present;
• the risk of losing, partially or wholly, the vessels used to carry out the principal activities of the Logistics Division, and the risk of damage caused to these vessels during these activities;
• operational risk inherent to the extraction of coal, typical of open-face mining, for the Mining Division.
Refer to ‘Note 27 – Risks characterising the Group’s business’ for further details.
The Coeclerici Group is particularly sensitive to the need to protect its employees in any place where they may have to work. As evidence of the considerable effort made by the Group regarding health and safety, and with the intention of raising its already high standards in this field, in 2015 the company Coeclerici Logistics SpA underwent a process of certification and reorganisation which led to the creation of a specific department dedicated to health and safety and related management systems, thereby
obtaining the internationally recognized BS OHSAS 18001:2007 standard early in 2015.The Coeclerici Group has adopted a system of prevention and protection, constantly monitored by the HSE-Q department (Health Safety Environment and Quality), and suitable for identifying the risks to safety and put in place the measures required to prevent them, also by means of key persons who guarantee the improvement over time of safety standards. In addition, the carrying-out of maritime logistics services entails respect for
Commoditiesprice risk
FX risk
Credit riskPolitical risk
Interestrate risk
Liquidity risk
Loss ofvessels risk
Miningextraction risk
Low Endogeneous risk
Low
Exog
eneo
us ri
skH
igh
High
certain local, national and international regulations and the maintenance of qualitative standards. In particular, Coeclerici Logistics SpA operates in compliance with the following standards and regulations:• Environment: binding Venezuelan cogent
regulations and authorization to work of the Dirección Ambiental Zulia RASDA 2009 for Venezuela. All terminals apply the internationally binding IMO regulations and those of MARPOL;
• Safety: ISM System conforming to ISM Code (checked by RINA on Bulk Zambesi and Bulk Limpopo, Coeclerici SpA Milan, and by Seacom Indonesia on Bulk Celebes), conforming to MLC 2006 regulations (Maritime Labour Convention) on the seafarer staff health and safety for Bulk Zambesi and Bulk Limpopo vessels, safety regulations and Italian law D.Lgs, 271/99, binding Venezuelan regulations;
• Standard BS OHSAS 18001:2007: award of certification regarding the two vessels Bulk Zambesi and Bulk Limpopo, and for the companies Coeclerici Logistics SpA and Coeclerici Mozambico SpA;
• In 2016, the certification pursuant to the BS OHSAS 18001:07 standard was successfully extended to the companies PT Asian Bulk Logistics and PT Pelayaran Logistik Konversi Indonesia and to the five Indonesian vessels, hence completing the certification of the entire fleet and relevant shipping companies.
• As regards to the Russian mining site, the Group has put into place all the prevention activities relevant to environment and safety in compliance with the local laws in force.
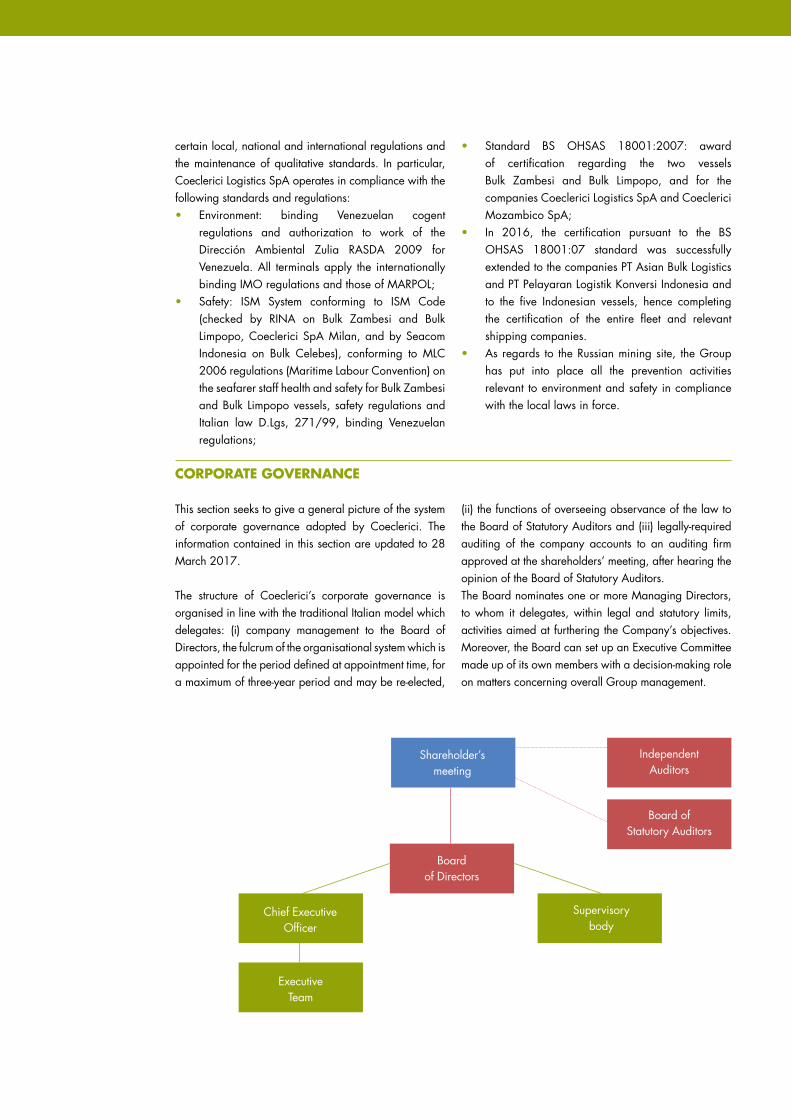
CORPORATE GOVERNANCE
This section seeks to give a general picture of the system of corporate governance adopted by Coeclerici. The information contained in this section are updated to 28 March 2017.
The structure of Coeclerici’s corporate governance is organised in line with the traditional Italian model which delegates: (i) company management to the Board of Directors, the fulcrum of the organisational system which is appointed for the period defined at appointment time, for a maximum of three-year period and may be re-elected,
(ii) the functions of overseeing observance of the law to the Board of Statutory Auditors and (iii) legally-required auditing of the company accounts to an auditing firm approved at the shareholders’ meeting, after hearing the opinion of the Board of Statutory Auditors.The Board nominates one or more Managing Directors, to whom it delegates, within legal and statutory limits, activities aimed at furthering the Company’s objectives. Moreover, the Board can set up an Executive Committee made up of its own members with a decision-making role on matters concerning overall Group management.
Shareholder’smeeting
IndependentAuditors
Board ofStatutory Auditors
Boardof Directors
Chief ExecutiveOfficer
Supervisorybody
ExecutiveTeam

3534
ANNUAL REPORT 2016
DIRECTORS’ REPORT
CompositionIn accordance with article 17 of the Statute, the number of members of the Board of Directors may vary between a minimum of three and a maximum of fifteen. An ordinary shareholders’ meeting determines the number, within the said limits. The ordinary shareholders’ meeting of 29 April 2015 decided to decrease the number of members from twelve to nine. The Board of Directors, appointed by the Ordinary Shareholders’ Meeting on 5 May 2016, was given an annual mandate expiring with the approval of the financial statements for the financial year 2016.
DutiesThe Board of Directors has wide powers for the ordinary and extraordinary management of the business and, consequently, may put into effect such measures as it considers necessary and opportune to meet the Company’s objectives, excluding only those which statute specifically reserves for the Shareholders’ meeting.
Requisites of independenceThe Board of Directors has a central role in checking and guiding the process of Company management.The efficiency and effectiveness of this organization is guaranteed by the presence within it of independent directors who pay great attention to the substance as well as the form of Company activities. In particular, thepresence of independent directors guarantees (i) checks that Company management is inspired by criteria of prudence and transparency; (ii) checks of the adequacy of reporting, ensuring that information is reliable and complete; (iii) updating of the budget for the subsequent year, in line with strategic intentions and the financial, human and physical resources available; (iv) proposals (in the light of the above) for possible corrective action and support to the owners and management of the Company in the execution of their activities; (v) maintenance, over the period of the mandate, of a careful supervision of the Company in order to identify any risks which may not have been adequately guarded against or evaluated.
Executive Team has the task to define and put into effect the corporate strategy and assess its effectiveness; the
members belonging to such body hold top roles within Coeclerici Group.
For Coeclerici the so-called ‘risk and related control’ culture helps to characterise and affect the outlook and choices of management in pursuing Company objectives and reporting their results. Coeclerici has therefore for some time encouraged the increase and spread of awareness regarding internal control among all Company employees.
In order to ensure that the business’s activities are managed properly, correctly and coherently with the pre-established objectives, Coeclerici supports a preventive approach to risk management which aims to orient management towards choices and activities which reduce the probability that negative events will take place and may more easily be contained if they do. To this end, Coeclerici uses risk management strategies which depend on the nature and type of those risks, and which are considered in more detail in ‘Note 27- Risks
characterising Group’s business’. The ways in which management identifies, evaluates, manages and monitors the specific risks arising from Company processes are set out by the regulatory, procedural and organisational instruments contained in the Company’s regulatory system. These instruments are permeated with risk culture and therefore geared towards risk containment.The internal control system is reviewed and updated from time to time to guarantee its suitability for safeguarding against the main risks involved in Company activity, bearing in mind the features of its various operating sectors and organizational structure, as well as any new laws. During this accounting period, the Group internal auditor assisted top management by offering assessments, analysis, evaluations and recommendations in connection with the functioning of and respect for the internal control system and the manner of handling risk at both Company and Group level.
Board of Directors
Executive Team
Internal control system

Each month the companies of the Group prepare reports which aim to communicate and share information. During the reporting phase, specific checks are made on the accounting procedures and the output data arising from these procedures, so that any errors may be identified
and corrected which could affect the correctness and completeness of financial information. This is done both for routine processes taking place during the financial year, and for non-routine ones which generally occur when the accounts are closed at year-end.
Italian law D.Lgs. 231/2001 introduced administrative responsibility for juridical persons, companies and associations. Specifically, it introduced the criminal responsibility of organizations for certain crimes committed in their interest or to their advantage by persons who hold a representative, administrative or managerial role within the organization or within any of its sub-sections possessing administrative and functional autonomy, as well as by persons who exercise by title or in fact the management and control of the same and, finally, by persons under the direction or supervision of the entities indicated above. The important criminal actions are those against the Public Administration and in favour of the company’s interests.However, arts. 6 and 7 of Italian Legislative Decree 231/2001 envisage a form of exemption from liability, should (i) the company demonstrate that it had adopted and put into practice organizational, management and control models, before the crime was committed, suited to preventing the crimes indicated in the law; (ii) if the task of supervising the functioning and observance of the models and ensuring that they are updated has been entrusted to a department of the organization with autonomous powers of initiative and control.
To this end, on 27 September 2012, the Board of Directors of Coeclerici Spa approved, the organization, management and control model established by D.Lgs. 231/2013, with the purpose of creating a structured and organic system of procedures and preventive control activities having as its objective the prevention of crimes referred to in the aforementioned decree. During 2016, the Board of Directors approved the Model updated after the recent organizational changes that affected Coeclerici Group.The supervisory body consists of three members, of which two external and one internal.
During the year, the supervisory body has applied and analysed the systems of information flow which enable it to supervise the functioning and observance of the model, including similarly an examination of reports arising from audit, as well as the planning of further activities.In order to put the checks into effect, the supervisory body has set up a series of interventions to check that the protocols adopted are respected.
Coeclerici SpA is subject to management and coordination by Fincler Srl. For the purposes of article 2497 bis of the Italian civil code, direct and indirect Italian subsidiaries have indicated Coeclerici SpA as the company exercising management and coordination. This activity consists in identifying general and operational strategic indications for the Group, and takes shape in the defining and adjusting of internal control and risk management systems together with governance models and Company organization, in the issuing of a Code
of Conduct adopted at Group level and in the creation of general policies for human and financial resource management, and the supply of productive, marketing and communication factors. In addition, it provides, apart from Group coordination, for the management of treasury, legal and administrative functions, as well as those of internal audit, if necessary through specialized companies.Management and coordination, at Group level, enables subsidiaries, which remain fully autonomous at a
Reporting activities
Adoption of the Organisation, Management and Control Model in accordance with Italian law D.lgs 231/2001
Activity of Management and Coordination

3736
ANNUAL REPORT 2016
DIRECTORS’ REPORT
managerial and operational level, to enjoy economies of scale by using the professionalism and specialist knowledge available thereby raising quality levels and
concentrating their energies on their core business. Subsidiaries based abroad generally benefit from such activities.
OUTLOOK
The most recent economic indicators forecast a 2017 with a more favourable pace compared to 2016. The first quarter of the year confirms the high level of commodity prices in the second half of 2016. The latest figures confirm the upturn of inflation, mainly due to the recovery of the dynamics of prices for energy products. The forecast for the trend of interest and exchange rates remains uncertain.
It is widely believed that the growing request for energy from emerging economies will be satisfied in the future with a significant recourse to coal; this fuel, owning to new technologies, is still significantly competitive in terms of cost, risk and physical availability compared to other energy sources. According to the projections of the International Energy Agency, in its scenario of reference called “New Policies”, the use of coal is expected to increase by 0.2% yearly until 2040; growth driven by emerging countries that compensate for the drop in demand for coal in OECD countries.
As a consequence, the Group’s strategy is to take advantage of the best opportunities for development through the consolidation and improvement of its core business by employing the know-how it has earned over the years. Attention has been placed on creating the conditions to produce long-term success; at the same time, attention will also be given to short-term results and the maintenance of fundamental balance in the company.
As regards to the Trading Division, the focus on high added value transactions shall continue with a “balanced risk” approach. The signs of recovery for coal prices, which are confirmed by the prices of the first months of 2017, represent an opportunity to continue strengthening the planning process and synergies with the Mining Division. The commitment to achieve a greater client and product diversification (specifically Indonesian steam coal and Chinese Coke) within the Asian market shall continue, also in light of the first results achieved over the year and positive signs from the Far East market.Management is evaluating an exit from the US market,
through the disposal of its subsidiary Coal Network, and the German market through the disposal of its German subsidiary Dako Coal.
As far as the Mining Division is concerned, efforts to improve efficiency will be continued and plans to increase production will be defined, bearing in mind the new licence and a possible recovery in the market currently in progress. Activities and projects aimed at improving production/logistics processes will continue, as well as the strengthening of the synergies with the Trading Division.
The Logistics Division will continue its transshipment activities in 2017 in Indonesia and Mozambique with ever greater focus on the management of production costs and the quality of services provided, in order to improve its own performance and customer satisfaction. In addition to the consolidation of projects already in being, the objective is to find new market opportunities to exploit.
The Shipping Division, through the associated company dACC Maritime d.a.c., began full operations during this year, with the delivery of the third and fourth ship. All vessels are operated within a pool, to mitigate the effects of the current shipping market phase, which is experiencing particularly low prices, although in improvement. It is expected that the elimination of the bulk in excess, which occurred this year, will give rise to a greater balance between demand and offer with a consequent revaluation of the price for the Supramax vessels and an improvement of charters.
Concerning the investment made in the Bergamasque company, the subscription for the capital increase in IMS Deltamatic Spa in January 2017 is aimed at supporting future growth that, over the next few years, will also develop through further acquisitions.


40 Consolidated balance sheet
41 Consolidated Income statement
41 Consolidated statement of comprehensive income
42 Consolidated statement of changes in equity
43 Consolidated statement of cash flows
CONSOLIDATED FINANCIAL STATEMENTS

ASSETS (NOTE) 31-DEC-2016 31-DEC-2015 CHANGES
NON-CURRENT ASSETS
Property, plant and equipment 1 122,931 121,998 933
Intangible assets 2 4,551 2,975 1,576
Interests in jointly
controlled entities3 28,603 23,663 4,940
Other investments 3 10 452 (442)
Available-for-sale financial assets 3 2,442 3,046 (604)
Deferred tax assets 24 9,648 10,869 (1,221)
Other non-current assets 4 41,947 25,787 16,160
TOTAL NON-CURRENT ASSETS 210,132 188,790 21,342
CURRENT ASSETS
Inventories 5 17,575 18,485 (910)
Trade receivables 6 39,911 67,659 (27,748)
Prepayments 7 5,932 2,886 3,046
Other receivables and current assets 7 18,122 20,435 (2,313)
Cash and cash equivalents 8 70,464 65,322 5,142
TOTAL CURRENT ASSETS 152,004 174,787 (22,783)
TOTAL ASSETS 362,136 363,577 (1,441)
EQUITY AND LIABILITIES (NOTE) 31-DEC-2016 31-DEC-2015 CHANGES
SHAREHOLDERS' EQUITY
Group equity 9 66,349 51,883 14,466
Minority interests 9 6,986 6,727 259
TOTAL SHAREHOLDERS' EQUITY 73,335 58,610 14,725
NON-CURRENT LIABILITIES
Interest bearing liabilities and borrowings 10 119,077 150,167 (31,090)
Provision for risks and charges 11 27,800 20,049 7,751
Post-employment benefits 12 1,740 1,497 243
Deferred tax liabilities 24 2,766 3,018 (252)
TOTAL NON-CURRENT LIABILITIES 151,383 174,731 (23,348)
CURRENT LIABILITIES
Interest bearing liabilities and borrowings 10 80,457 63,426 17,031
Provision for risks and charges 11 - 25 (25)
Trade payables 13 39,277 48,046 (8,769)
Other payables and current liabilities 14 17,684 18,739 (1,055)
TOTAL CURRENT LIABILITIES 137,418 130,236 7,182
TOTAL SHAREHOLDERS’ EQUITY AND LIABILITIES 362,136 363,577 (1,441)
CONSOLIDATED BALANCE SHEET AT 31 DECEMBER 2016 (thousands of Euro)
CONSOLIDATED FINANCIAL STATEMENTS

4140
ANNUAL REPORT 2016
CONSOLIDATED FINANCIAL STATEMENTS
CONSOLIDATED INCOME STATEMENT AT 31 DECEMBER 2016 (thousands of Euro)
CONSOLIDATED STATEMENT OF COMPREHENSIVE INCOME AT 31 DECEMBER 2016(thousands of Euro)
(NOTE) 2016 2015 CHANGES
Revenues from sales and services 15 621,037 683,981 (62,944)
Operating costs 16 (544,712) (635,749) 91,037
GROSS MARGIN 76,325 48,232 28,093
Overhead and administrative expenses 17 (35,764) (33,603) (2,161)
Capital gains / (losses) on non-current assets 18 1,954 2,053 (99)
Profit / (loss) companies measured using the E.M. 19 2,274 2,704 (430)
Other net operating income (costs) 20 (13,614) 868 (14,482)
EBITDA 31,175 20,254 10,921
Depreciation, amortization and devaluation 21 (10,525) (16,125) 5,600
OPERATING PROFIT (EBIT) 20,650 4,129 16,521
Net financial income / (expenses) 22 (6,770) (10,769) 3,999
Profit / (loss) on foreign exchange 23 4,241 (20,810) 25,051
RESULT BEFORE TAXES 18,121 (27,450) 45,571
Taxes 24 (3,553) 5,096 (8,649)
NET PROFIT AFTER TAX FROM CONTINUING OPERATIONS 14,568 (22,354) 36,922
Net profit from discontinued operations - - -
NET PROFIT 14,568 (22,354) 36,922
Attributable to the Coeclerici SpA Group 13,491 (22,876) 36,367
Attributable to minority interests 1,077 522 555
(NOTE) 2016 2015 CHANGES
NET PROFIT 14,568 (22,354) 36,922
Items that may be reclassified subsequently to the Income Statement
- Differences from conversion of financial statements in currencies other than Euro
2,901 7,729 (4,828)
- Change in the fair value of available-for-sale financial assets
3 (118) 2,680 (2,798)
- Change in the fair value of cash flow hedge financial instruments
26 75 7,562 (7,487)
Total items that may be reclassified, net of tax effects
2,858 17,971 (15,113)
Items that will NOT be reclassified in subsequently to the Income Statement:
- Actuarial / (losses) gains (16) 236 (252)
Total items that will NOT be reclassified, net of tax effects
(16) 236 (252)
NET INCOME RECORDED DIRECTLY IN EQUITY 2,842 18,207 (15,365)
TOTAL COMPREHENSIVE INCOME 17,410 (4,147) 21,557
ATTRIBUTABLE TO:
- Attributable to the Coeclerici Group 16,127 (4,859) 20,986
- Attributable to minority interests 1,283 712 571

CONSOLIDATED STATEMENT OF CHANGES IN EQUITY AT 31 DECEMBER 2016 (thousands of Euro)
SHARE CAPITAL
LEGAL RESERVE
TRANSLATION RESERVE
MERGER SURPLUS RESERVE
RESERVE RELATED TO
THE FAIR VALUE OF
FINANCIAL INSTRUMENTS
ACTUARIAL GAINS/ (LOSSES)
OTHER RESERVES
RETAINED EARNINGS
NET PROFIT TOTAL CC GROUP EQUITY
TOTAL CC MINORITY
TOTAL EQUITY
At 31 December 2014
10,000 2,000 (4,346) 27,921 (11,767) (364) 49,198 (16,346) 4,157 60,453 9,013 69,466
2014 profit transferred to reserves
- - - - - - - 4,157 (4,157) - - -
Dividends paid - - - - - - - (4,000) - (4,000) (2,634) (6,634)
Net income recorded directly in equity
- - 7,539 - 10,242 236 - - - 18,017 190 18,207
Effect of change in consolidation area
- - - - - - - 289 - 289 (364) (75)
Profit / (Loss) for 2015
- - - - - - - - (22,876) (22,876) 522 (22,354)
At 31 December 2015
10,000 2,000 3,193 27,921 (1,525) (128) 49,198 (15,900) (22,876) 51,883 6,727 58,610
2015 profit transferred to reserves
- - - - - - - (22,876) 22,876 - - -
Dividends paid - - - - - - - (2,000) - (2,000) (682) (2,682)
Net income recorded directly in equity
- - 2,695 - (43) (16) - - - 2,636 206 2,842
Effect of change in consolidation area
- - 49 - - - - 290 - 339 (342) (3)
Profit / (Loss) for 2016
- - - - - - - - 13,491 13,491 1,077 14,568
At 31 December 2016
10,000 2,000 5,937 27.921 (1,568) (144) 49,198 (40,486) 13,491 66,349 6,986 73,335

4342
ANNUAL REPORT 2016
CONSOLIDATED FINANCIAL STATEMENTS
CONSOLIDATED STATEMENT OF CHANGES IN EQUITY AT 31 DECEMBER 2016 (thousands of Euro) CONSOLIDATED STATEMENT OF CASH FLOWS AT 31 DECEMBER 2016 (thousands of Euro)
2016 2015
A CASH AND CASH EQUIVALENTS AT BEGINNING OF PERIOD 65,322 44,371
B CASH FLOW GENERATED (ABSORBED) FROM OPERATING ACTIVITIES
Net operating profit 13,491 (22,876)
Minority interest profit 1,077 522
Depreciation of property, plant and equipment 10,173 11,308
Amortisation of intangible assets 352 3,428
Devaluation of fixed assets - 1,389
Losses (gains) on non-current assets (1,954) (2,053)
Share of profits from equity investments measured using the equity method (2,274) (2,704)
Interest paid (3,567) (5,993)
Net change in provisions for liabilities and charges 7,726 2,433
Net change in post-employment benefits 243 (623)
Net change in deferred taxes (1,473) (3,313)
Change in inventories 910 5,461
Change in trade receivables 27,748 (18,170)
Change in trade payables (8,769) 24,451
Other changes in working capital (4,878) 35,636
CASH FLOW GENERATED (ABSORBED) FROM OPERATING ACTIVITIES (B) 38,805 28,896
C CASH FLOW GENERATED (ABSORBED) FROM INVESTING ACTIVITIES
Investments in property, plant and equipment (6,873) (7,133)
Investments in intangible assets (1,210) (849)
Disposal of property, plant and equipment 293 6,483
Disposal of intangible assets - -
Change in other non-current assets 37 1,359
Investments in equity - advances (9,690) -
Disposal / (Increase) of investments in other companies - 7,558
Disposal / (Increase) of investments in available-for-sale financial assets 2,952 517
Dividends and other gains received from affiliates and jointly controlled companies 2,208 -
CASH FLOW GENERATED (ABSORBED) FROM INVESTING ACTIVITIES (C) (12,283) 7,935
D CASH FLOW GENERATED (ABSORBED) FROM FINANCING ACTIVITIES
Change in current and non-current financial receivables (4,639) (5,398)
Net change in current and non-current financial payables (14,059) (3,848)
Dividends paid (2,000) (4,000)
Dividends paid and capital reimbursements to minority interest (682) (2,634)
CASH FLOW GENERATED (ABSORBED) FROM FINANCING ACTIVITIES (D) (21,380) (15,880)
E OVERALL CASH FLOW GENERATED (ABSORBED) (E = B + C + D) 5,142 20,951
F CASH AND CASH EQUIVALENTS AT END OF PERIOD (A + E) 70,464 65,322


46 Principles used in drawing up the financial statements
54 Consolidation area
57 Notes to the Consolidated Financial Statements
83 Appendix 1 – List of consolidated companies
84 Appendix 2 – Comparison of equity
85 Technical glossary
NOTES TO THE CONSOLIDATED FINANCIAL STATEMENTS

of the Coeclerici Group as of December 31, 2016
The consolidated financial statements have been drawn up in accordance with the International Financial Reporting Standards (IFRS) issued by the International Accounting Standards Board (IASB) and approved by the European Union. IFRS also includes the International Accounting Standards (IAS) still in place, as well as the interpretations of the IFRS Interpretations Committee, formerly called the International Financial Reporting Interpretations Committee (IFRIC) and even earlier the Standing Interpretations Committee (SIC).
The financial statements have been drawn up on the basis of historical cost, modified as requested for the evaluation of some financial instruments.
The financial statements are in EUR, and unless otherwise indicated, figures are in thousands of EUR.The consolidated financial statements consist of the
balance sheet, income statement, comprehensive income statement, a statement of changes in equity, a cash flow statement and notes to the financial statements, and they have been drawn up by using the accounts of the Holding Company and its subsidiaries, whether Italian or foreign, in which Coeclerici SpA directly or indirectly holds a majority of voting rights, and on which it therefore exercises control or from which it obtains benefits in virtue of its power of regulating their financial and operational policies.
For the purposes of drawing up the consolidated financial statements, the financial statements of the period to 31 December 2016 have been used. The financial statements have been adjusted where necessary to respect consolidation requirements and bring them into line with International Financial Reporting Standards (IFRS).
Financial statement modelsThe Coeclerici Group presents its income statement by expense type, a manner regarded as more representative than classification by function.
The balance sheet has been drawn up in conformity with IAS 1 by classifying assets and liabilities as ‘current/non-current’.
Current assets are classified as such when they may predictably be realised within the normal operational cycle of the business, that is within twelve months from the date of the financial statements. Inventories and trade
receivables are included in current assets.
Tangible and intangible assets, as well as all assets other than current ones, are included as non-current assets.
Current liabilities are classified as such when they may predictably be discharged within the normal operational cycle of the business, that is within twelve months from the date of the financial statements.
The cash flow statement was drawn up according to the indirect method.
PRINCIPLES FOR THE PREPARATION OF THE FINANCIAL STATEMENTS
PRINCIPLES OF CONSOLIDATION
SubsidiariesThese are firms that the Group controls, as defined by ‘IFRS 10 - Consolidated Financial Statements’, standard issued by the IASB in May 2011. Control exists when the Group has the direct or indirect power to govern the financial
and operating policies of an entity to obtain benefits from its activities. The financial statements of subsidiaries are included in the consolidated financial statements from the date control begins until such time as that control ceases
NOTES TO THE CONSOLIDATED FINANCIAL STATEMENTS

4746
NOTES
ANNUAL REPORT 2016
of the Coeclerici Group as of December 31, 2016
to exist. The amounts of equity and profit attributable to minority shareholders are shown separately in the consolidated balance sheet and income statement. Where necessary, adjustments have been made to the financial statements of subsidiaries to bring their accounting policies in line with those adopted by the Group. The book value of the shares held is eliminated against a corresponding
fraction of the subsidiary’s equity, calculated by attributing each asset and liability its value at the date the Group acquired control. Any remaining positive difference (gain) is included as profit under ‘goodwill’; any negative difference (loss) is recorded in the income statement, as required by ‘IFRS 3 - Business Combinations’.
Associated companiesThese are companies over whose financial and operating policies the company has considerable influence, but not control or joint control, as defined by ‘IAS 28 – Investments in associates’.The consolidated financial statements include the share of the profits of associated firms attributable to the Group, measured using the equity method, from the date on which considerable influence starts until the moment it ceases to exist. If the share of losses attributable to the
Group exceeds the book value of the equity investment in the financial statements, the value of the equity investment is written off and the Group’s share of any further losses is not recorded, unless and to the extent to which the Group is obliged to answer for them. Where necessary, adjustments have been made to the financial statements of associated companies to bring their accounting policies in line with those adopted by the Group.
Join controlled entitiesThese are firms over whose business the Group has joint control as defined in ‘IFRS 11 – Joint Arrangements’, issued by the IASB in May 2011. The consolidated financial statements include the share of the profits of jointly controlled entities attributable to the Group, measured using the equity method, from the date on which joint control starts until the moment it ceases to exist. If the share of losses attributable to the Group exceeds the book
value of the equity investment in the financial statements, the value of the equity investment is written off and the Group’s share of any further losses is not recorded, unless and to the extent to which the Group is obliged to answer for them. Where necessary, adjustments have been made to the financial statements of jointly controlled entities to bring their accounting policies in line with those adopted by the Group.
Other investmentsMinor equity investments in other companies are entered at fair value with the effects charged to the equity reserve along with the other components of the overall profit; variations in the fair value shown in the equity are taken to the income statement at the moment of devaluation
or realisation. When the investment is not quoted in a regulated market and the fair value cannot be reliably determined, the investment is valued at cost adjusted for loss of value. Dividends received from these businesses are included in the income statement.

When preparing the consolidated financial statements, all balances and significant transactions between Group
companies are eliminated, as well as all unrealized gains and losses on intercompany transactions.
Foreign currency transactionsItems originally expressed in foreign currency are converted into EUR at the historical exchange rate on the date of the transaction. Exchange rate differences upon collection of receivables and settlement of payables in foreign currency are recorded in the income statement.Foreign currency assets and liabilities are entered at the year-end spot exchange rate and the relevant exchange gains and losses are recorded in the income statement. Any net profit is set aside in a special non-distributable reserve until it is realized.The conversion of the financial statements of foreign subsidiaries using other currencies into EUR is on the basis of the year-end exchange rate for balance sheet items and the average annual exchange rate for income statement items. Exchange differences stemming from the conversion of financial statements expressed in foreign currencies are allocated directly to the ‘translation I reserve’ item under equity. The USD bank loan granted to the subsidiary
Coeclerici Mozambico SpA was however not adjusted to the year-end exchange rate as described above since the sole purpose of the subsidiary is to perform a single contract that entails revenues in USD using two Supramax vessels financed with a medium-term loan in USD. In line with this contract, the revenues generated are not converted into EUR unless they exceed the three-month loan repayment instalment due. The revenues are instead placed in a foreign currency account and recorded financially at the same exchange rate in force when the loan was taken out. This procedure avoids the effects of exchange rate fluctuations when the loan is paid back, since it is covered by the revenue flow in USD. The contract is expected to give rise to revenues in USD that are greater than the payments required to pay back the loan, and this will be periodically checked.
ACCOUNTING POLICIES
The most important criteria used for valuing when drawing up the consolidated financial statements are shown below.
DEPRECIATION RATES
Buildings 3%
Plant and equipment 10% - 25%
Other tangible assets 12% - 25%
Property, plant and equipment Tangible fixed assets are entered at cost price or production cost and are not re-valued.Any costs incurred after purchase are included only if they increase the future economic benefits inherent in the asset they refer to. All other costs are recorded in the
income statement when incurred. Assets are depreciated by applying the following depreciation rates, which are designed to spread the value of the tangible assets adequately over their estimated useful life.Land is not depreciated.
Fleet depreciation is applied on the basis of the cost of each vessel, decreased by the amount it is estimated could be gained from scrapping, on the basis of an assumed
useful life of 25 years for the hull, 15-20 years for the engines, 10-15 years for cranes and conveyor belts and 5 years for all components subject to renovation or
Transactions eliminated during consolidation

4948
NOTES
ANNUAL REPORT 2016
replacement during dry-dock maintenance.‘Mining reserves’ are determined on the basis of an assessment of the fair value of the coal reserves conducted at the moment the mine was purchased, in keeping with ‘IFRS 3 - Business Combinations’. Mine depreciation is calculated on the basis of the production schedule taking into consideration the quantities mined during the reference period. The depreciation schedule used will write off the value of the coal reserves when the licence expires. The carrying amount of the mining reserves, which is determined on the basis of the recoverability of the book value, may be written down, as outlined in IAS 36.
The costs of dismantling and reclaiming mining sites are recorded in compliance with IAS 16 as a separate component of the reference asset and amortized over the whole remaining life of that asset. These costs are set off against a special risk provision that is used when amounts are paid out to reclaim the sites.‘Assets under construction and advances’ include all investments that have not yet become part of the production process.
Exploration assetsCosts relating to the purchase of exploration rights, geological and topographical surveys, exploratory drilling and excavation, sampling, and the technical feasibility and commercial viability studies of a mining resource are recorded as exploration and evaluation assets, in compliance with IFRS 6. These costs are recorded
as intangible assets and amortized over the period during which it is expected the relevant mining will take place. Exploration assets may be decreased in value in compliance with the procedures laid down in IAS 36, when their book value is not recoverable.
Intangible assetsAccording to ‘IAS 38 - Intangible Assets’, intangible assets are entered as assets when it is likely that use of
the asset will generate future economic benefits and when the cost of the asset may be measured reliably.
GoodwillIf companies are taken over, the assets, liabilities and potential liabilities acquired and identifiable are recorded at their fair value on the takeover date.If the difference between the takeover price and the share held by the Group at its fair value is positive, these assets and liabilities are classified as goodwill and are entered in the financial statements as intangible assets.Any negative difference (badwill) is instead recognised in the income statement at the time of acquisition.Goodwill is not amortized but its value is tested annually, or whenever specific events or changes in circumstances suggest it may have been impaired. After initial
determination, goodwill is calculated at cost less any accumulated impairment losses.If a previously acquired company whose takeover gave rise to goodwill is partly or entirely transferred, the remaining goodwill will be taken into account in the capital gain or capital loss calculation.When the International Financial Reporting Standards were applied for the first time, the Group chose not to apply ‘IFRS 3 - Business Combinations’ retroactively to company takeovers that occurred before 1 January 2006. Consequently, the allocations made on the purchase dates have not been reviewed.
Other intangible assetsAccording to ‘IAS 38 - Intangible Assets’, other intangible assets (purchased or produced internally) are entered as such when it is likely that use of the asset will generate future economic benefits and when the cost of the asset
may be measured reliably.These assets are assessed at purchase price or production cost and amortized on a straight-line basis over their estimated useful lives if they have a definite useful lifespan.

Intangible assets with indefinite useful lives are not amortized, but are assessed for loss of value annually, or whenever specific events suggest they may have been impaired.
Other intangible assets acquired after taking over a company are entered separately from goodwill if their fair value can be measured reliably.
Leasing contractsAssets held under financial lease contracts, which essentially transfer all the risks and benefits linked to ownership of the assets to the Group, are recognized as Group assets at their fair value or, if lower, at the present value of the lease payments due. The corresponding liability for the lessor is shown as a specific liability item. The contract is classified
as a finance lease upon stipulation by examining the contract requirements and/or asset involved. Payments made under operating lease contracts are charged to the income statement on a straight-line basis over the lease term.
Loss of asset valueThe Group regularly assesses the recoverability of the book values of intangible and tangible assets to determine if there is any sign they may have been impaired. If there is such evidence, the book values of the assets concerned are decreased to their respective recoverable values. The recoverable value of an asset is either its fair value less any costs of sale or its value in use, whichever the greater. To determine the value in use of an asset, the Group calculates the present value of the estimated future cash flows (gross of taxation) discounted at a before-tax rate which reflects the current market time value of money and
the specific risks associated with that asset.An impairment loss is recorded if the recoverable value is lower than the book value. When an impairment loss (excluding impairment losses on goodwill) subsequently reverses or decreases, the book value of that asset or cash-generating unit is increased to the revised estimate of its recoverable amount which cannot exceed the book value that would have been determined had no impairment loss been recognized for that asset. Reversal of an impairment loss is immediately recognized in the income statement.
Available-for-sale financial assets Financial assets available for sale are initially recorded at purchase price and subsequently assessed at fair value. The gains and losses stemming from changes in fair value are recorded directly in equity until the financial asset is eliminated from the balance sheet, which is when the overall profits and losses are recorded in the income
statement. If a decrease in fair value is recorded directly in equity and there is objective evidence that the asset has undergone a permanent decrease in value, the cumulative loss which has been recorded in equity is reversed and recorded in the income statement.
Financial instrumentsNon-current financial assets other than equity investments, current financial assets, and financial liabilities are entered
according to ‘IAS 39 - Financial instruments: recognition and measurement’.
5150
NOTES
ANNUAL REPORT 2016
Financial derivativesFinancial derivatives are normally used with the intention of hedging. In line with IAS 39, financial derivatives may be recorded according to the methods laid down for hedge accounting only when, at the beginning of the hedging, there is a formally designated and documented hedging relationship, the hedging is considered to be highly effective, its effectiveness may be reliably measured, and the hedging itself is highly effective during the various accounting periods for which it is designated.All financial derivatives are measured at their fair value, as laid down in IAS 39. When financial instruments have the appropriate characteristics to be entered according to hedge accounting methods, the following accounting principles are applied:
• Fair value hedge – If a financial derivative is designated to hedge the exposure to changes in fair value of an asset or liability shown on the financial statements and attributable to a particular risk which may affect the income statement, the gain or loss from subsequently re-measuring the hedging instrument at fair value is entered on the income statement. The gain or loss on the hedged item attributable to the hedged risk changes the book value of that item and is recognized in the income statement.
• Cash flow hedge – If a financial derivative is designated to hedge exposure to changes in the future cash flows of an asset or liability entered into the financial statements or of a highly probable forecast transaction that may affect the income statement, the effective portion of the gains or losses on the financial derivative is recorded in equity. Accrued equity gains or losses are reversed and entered into the income statement in the same period in which the hedged transaction is recorded. Gains or losses associated with hedging (or part thereof) which becomes ineffective are recorded in the income statement immediately. If a hedging instrument or hedging relationship is closed before the hedged transaction occurs, the accrued gains and losses recorded up to that time in equity are recorded in the income statement when the relevant transaction actually occurs.
If the hedged transaction is no longer considered likely, thegains or losses that have not yet been realized and are suspended in equity are immediately recorded in the income statement. If hedge accounting cannot be applied, the gains or losses arising from the fair value assessment of the financial derivative are immediately entered in the income statement.
InventoriesInventories of lubricants and fuels on board ships are recorded at cost price, measured according to the FIFO method. Inventories of commodities are entered at either
the cost price of the inventories on hand, measured according to the FIFO method, or their estimated realizable value on the basis of market price, whichever the lower.
Trade receivablesThese are recorded at their presumed realizable value.
Cash and cash equivalentsThese include cash funds, the surplus balance of current accounts, the total of bank deposits, and all high-liquidity
investments with due date within the next three months.

Provisions for liabilities and chargesThe Group records provisions for liabilities and charges when: it has a legal or implicit obligation towards third parties, when it is likely that Group resources will be needed to fulfil this obligation and when a reliable estimate of the total value of the obligation itself may be l made. The provisions reflect the best possible estimate on the
basis of the facts available. Estimates are updated to the date of the financial statements. Changes in the estimates are reflected in the income statement for the period during which they are made.
Post-employment benefitsPost-employment benefits are calculated according to IAS 19. Further information is provided under paragraph ‘Other Information’.The severance indemnity reserve is regarded as a ‘defined benefit plan’ and is measured on the basis of actuarial calculations using the ‘Projected Unit Credit Method’. The actuarial gains and losses generated by applying this method are recognized in the income statement. Since all the Italian companies belonging to the Group have less than 50 employees, the amendments made by Italian law No. 296 of 27 December 2006 (the 2007 Finance Act) and subsequent decrees and regulations issued during the first few months of 2007 allow employees to keep their post-employment benefit within the company
without being obliged to opt to hand it over to a supplementary pension fund or assign the post-employment benefit to the treasury fund at the Italian national social security institute (INPS).The actuarial calculation made since 2007 excludes the component relating to future pay increases only for employees who voluntarily exercised the options laid down in the above-mentioned law. The difference resulting from the new calculation is treated as a ‘curtailment’ according to paragraph 109 of IAS 19 and is consequently entered in the first six months of 2007.Amounts of post-employment benefit falling due for employees from the moment they exercise the option are deemed a ‘Defined Contribution Plan’.
Recognition of revenues and costs Revenues are recorded to the extent that it is likely the Group will receive economic benefits and that their total value may be measured reliably. Revenues are shown net of discounts and allowances.Revenues from sales are recognized at the end of the
service performed or when property is transferred. Financial revenues and revenues from services are recognized on an accrual basis.Revenues from time charters are recognised on a straight-line basis over the period of the contract in question.
Capital grantsCapital grants are recognized when they are definitively assigned to the Company and recorded in the income
statement at the same time as the asset they refer to is depreciated.
Financial income and expensesFinancial income and expenses are recognized on an accrual basis, according to the amount of time that passes
and using the actual effective rate.
Income tax for the periodIncome taxes include all the taxes calculated on the Group taxable income. They are recognized in the income
statement, with the exception of those concerning items directly charged or credited to equity, in which case

5352
NOTES
ANNUAL REPORT 2016
the tax effect is recorded directly in equity. Other taxes not related to income, such as taxes on property and capital, are included among the operating expenses. The taxable income is different from the amount recorded in the income statement since it excludes positive and negative components that are taxable in other accounting periods and excludes items that will never be taxable or allowable. The liability for current taxes is calculated using the rates officially or actually in force at the year-end.Deferred taxes are set aside according to the overall
liability allocation method. They are calculated on all temporary differences which may emerge between the taxable base of an asset or liability and the book value in the consolidated financial statements. Deferred tax assets on tax losses and unused tax receivables that may be carried forward, as well as on temporary differences, are recognized to the extent that it is likely that future taxable income may emerge against which they can be recovered.
Use of estimatesIn order to draw up the financial statements, the Directors produce estimates and assessments that affect the amounts recorded as assets, liabilities, costs and revenues, and potential future gains and losses. The Directors periodically check their estimates and assessments on the basis of past
experience and other factors considered reasonable in the circumstances. The use of estimates and assessments is particularly important in determining the following balance sheet and income statement items:
a) Tangible and intangible assets – Useful life and recoverability estimatesThe Company has significant quantities of tangible and intangible assets. Establishing the useful lives of assets and determining whether they are recoverable (in order to decide whether the company should write them down), involves assessments and estimates.Assets are depreciated or amortized on the basis of their
useful lives, which is estimated for each category (tangible and intangible). The recoverable value of tangible and intangible assets depends on the possibility the assets have of generating sufficient net cash flows to recover their book value over the course of their estimated useful life.
b) Additional estimatesEstimates are also used to enter the presumed values of certain receivables, the fair value of derivatives and financial assets available for sale, the funds set aside for employee benefits, taxes and other provisions. Further details about these kinds of estimates can be found in the specific notes on each item. Generally speaking, the final figures in the following accounting period may differ from the estimates originally entered. Changes in estimates are recorded in the income statement for the accounting period during which they actually appear.
In the absence of an established principle or interpretation applicable to a specific operation, the Group’s management decides which accounting methods to adopt, through its own well thought-out and subjective evaluations, in order to provide relevant and reliable information so that the financial statements:• paint a true picture of the company’s balance sheet
and financial position, profit result and cash flows;• reflect the economic substance of transactions;• is neutral;• are prepared on a prudent basis;• are complete in all relevant respects.

CONSOLIDATION AREA
Included in the notes to the financial statements are lists of companies included in the consolidation, holdings in joint ventures, and associated companies valued using the equity method. Some transactions brought about variations in the consolidation when compared to the previous financial year:
• On 30 June 2016, the US subsidiary Coeclerici Coal Network Inc. established, with subscription of 100% of the share capital, the US company CCN Transload Terminal, LLC.
• the divestment of the stake held in the Russian subsidiary Delta Property was completed.
ACCOUNTING PRINCIPLES RECENTLY ISSUED
Accounting principles, amendments and interpretations applied starting on 1 January 2016The following IFRS accounting principles, amendments and interpretations were applied for the first time by the Group starting on 1 January 2016:
• Amendment to ‘IAS 19 Defined Benefit Plans: Employee Contributions’ (published on 21 November 2013), referring to the accounting of contributions made by employees or third parties to defined benefit plans. The amendment applies from the financial years starting from 1 February 2015 or at any later date. The adoption of these amendments did not have any significant impact on the Group’s consolidation scope.
• Amendment to ‘IFRS 11 Joint Arrangements - Accounting for acquisitions of interests in joint operations’ (published on 6 May 2014), referring to accounting for the acquisition of interests in a joint operation that is a business. The amendments are effective as of 1 January 2016 but the early adoption is allowed. The adoption of these amendments did not have any significant impact on the Group’s consolidation area.
• Amendment to ‘IAS 16 Property, plant and equipment’ and ‘IAS 41 Agriculture – Bearer Plants’ (published on 30 June 2014): bearer plants, i.e. fruit trees that produce an annual harvest (i.e. vines, hazelnut plants) should be accounted for according to the requirements of IAS 16 (rather than IAS 41). The amendments are effective as of 1 January 2016 but the early adoption is allowed. The adoption of these amendments did not have any significant impact on the Group’s consolidation scope.
• Amendments to ‘IAS 16 Property, Plant and Equipment’ and ‘IAS 38 Intangible Assets - Clarification of acceptable methods of depreciation and amortization’ (published on 12 May 2014), under which a revenue-based method of depreciation is not appropriate, because revenue generated by an activity that includes the use of an asset generally reflects factors other than the consumption of the economic benefits embodied in the asset, a condition which is, instead, required for depreciation. The amendments are effective as of 1 January 2016 but the early adoption is allowed. The adoption of these amendments did not have any significant impact on the Group’s consolidation scope.
• Amendment to ‘IAS 1 Disclosure Initiative’ (published on 18 December 2014), referring to disclosures that may be perceived as impediments to a clear and understandable preparation of financial statements. The amendments are effective as of 1 January 2016 but the early adoption is allowed. The adoption of these amendments did not have any significant impact on the Group’s consolidation area.
Furthermore, in the annual improvement process of the standards, on 25 September 2014 and 25 September 2014, IASB published the following documents: ‘Annual Improvements to IFRSs: 2012-2014 Cycle’ (inter alia: ‘IFRS 5 – Non-current Assets Held for Sale and Discontinued Operations’, ‘IFRS 7 – Financial Instruments: Disclosure’ and ‘IAS 19 – Employee Benefits’), partially supplementing the already existing standards. The amendments are effective from the financial years starting from 1 February 2016 or at any later date. The adoption of these amendments did not have any significant impact on the Group’s consolidation area.

5554
NOTES
ANNUAL REPORT 2016
Accounting standards, amendments and interpretations issued by the IASB/IFRIC and approved by the European CommissionThe following new and amended standards, which have been issued but have not come into effect yet, have not been applied by the Group:
The new standard, which replaces the IFRS 9 previous versions, must be applied as of 1 January 2018.
• Amendment ‘IFRS 7 – Financial Instruments: Disclosures issued’ (published 18 August 2005): The amendment clarifies that a servicing contract inclusive of a fee must represent a continuing involvement in a financial asset. An entity shall determine the nature of the compensation and agreement on the basis of the guidance within IFRS 7, relevant to the continuing involvement to assess whether disclosure is required. The amendments are effective as of 1 January 2016 but the early adoption is allowed.
• ‘IFRS 9 final version – Financial instruments’ (published on 24 July 2014). This document represents the IASB purpose to replace IAS 39 and it includes the steps concerning classification and measurement, Impairment, and Hedge accounting:- o new criteria for classification and measurement
of financial assets and liabilities have been included;
- in relation to the impairment model, it requires that the estimate of credit losses should be made on the basis of the expected losses model (and not on the incurred losses model used by IAS 39), using supportable information, available without unreasonable expense or effort, that includes historic, current and future data;
- a new hedge accounting model was introduced (increase of eligible transactions for hedge accounting, changes in the accounting method for forward contracts and options when they are included in the hedge accounting report, efficacy test was modified);
• New standard ‘IFRS 15 – Revenue from Contracts with Customers’ (published on 28 May 2014) is designed to replace ‘IAS 18 – Revenue’ and ‘IAS 11 – Construction Contracts’, as well as the interpretations ‘IFRIC 13 – Customer Loyalty Programmes’, ‘IFRIC 15 – Agreements for the Construction of Real Estate’, ‘IFRIC 18 – Transfers of Assets from Customers’ and ‘SIC 31 – Revenues-Barter Transactions Involving Advertising Services’. The standard establishes a new model for the recognition of revenue, which will be applied to all contracts stipulated with customers except for those falling within the application of other IAS/IFRS standards as leasing, insurance contracts and financial instruments. The key steps for the accounting of revenue on the basis of this new model are:- identification of the contract with the customer;- identification of the performance obligations
included in the contract;- pricing;- price allocation on the basis of the performance
obligations included in the contract;- the criteria for the recognition of revenue when the
entity meets each performance obligations.The standard is applicable as of 1 January 2018 and early adoption is also possible.
The Directors do not expect any significant impact on the Group’s consolidated financial statements from the adoption of these amendments.

Accounting standards and interpretations issued by the IASB/IFRIC and not yet approved by the European Commission
At the date of the Consolidated Financial Statements, the relevant bodies of the European Union had not yet finished the process of ratification necessary to adopt the amendments and principles described below.
• On 13 January IASB published the standard ‘IFRS 16 – Leases’ which is designed to replace ‘IAS 17 – Leases’, as well as the interpretations ‘IFRIC 4 Determining whether an Arrangement contains a Lease’, ‘SIC-15 Operating Leases —Incentives’ and ‘SIC-27 Evaluating the Substance of Transactions Involving the Legal Form of a Lease’.
The new standard provides a new definition of lease and introduces a criterion on the basis of the control (right of use) of an asset to distinguish leases from service contracts, the differences lying in: the identification of the asset, the right to replace the asset, the right to essentially receive all the financial benefits arising from the use of the asset, and the right to control the use of the asset underlying the contract.
The standard introduces a single lessee accounting model, by which an asset under a lease, including an operating lease, is recognized in assets with an offsetting financial liability. The model also provides the possibility of not recognizing as leases those contracts regarding low-value assets and leases with a term of 12 months or less. Conversely, the standard introduces no material changes for the lessor.
The standard is applicable as of 1 January 2019; early adoption is allowed only for those companies that have applied ‘IFRS 15 Revenue from Contracts with Customers in advance’.
• On 11 September 2014, IASB published amendments to IFRS 10 and IAS 28 ‘Sale or Contribution of Assets between an Investor and its Associate or Joint Venture’ (hereinafter: amendments to IFRS 10 and IAS 28), which defined the method to account for the relevant economic effects, especially, the loss of control of an investment as an effect of its transfer to an associate or joint venture. On 17 December
2015, IASB published the amendment that definitively postpones the amendments to IFRS 10 and IAS 28.
• On 19 January 2016, IASB published the amendments to IAS 12 ‘Recognition of Deferred Tax Assets for Unrealised Losses’, which provide clarifications relevant to the recognition and measurement of the assets for advance tax payments. Amendments to IAS 12 are effective starting from the financial years starting on, or after, 1 January 2017.
• On 29 January 2016, IASB published the amendments to IAS 7 ‘Disclosure Initiative’, which reinforces disclosure requirements in the event of changes, monetary and non-monetary, financial liabilities. Amendments to IAS 7 are effective starting from the financial years starting on, or after, 1 January 2017. On 12 April 2016, IASB published the document ‘Clarifications to IFRS 15 Revenue from Contracts with Customers’ (hereinafter: amendments to IFRS 15) containing clarifications relevant to various aspects regarding the implementation of the new accounting standard. Amendments to IFRS 15 are effective starting from the financial years starting on, or after, 1 January 2018.
• On 8 December 2016, IASB published the IFRIC Interpretation 22 ‘Foreign Currency Transactions and Advance Consideration’ (hereinafter: IFRIC 22), on the basis of which interest rate to use for the initial entry of an asset, cost or revenue relevant to an advance payment, previously paid/collected, in foreign currency, is that which is in force on the date of recognition of the non-monetary asset/liability relevant to such advance payment. IFRIC 22 is effective starting from the financial years starting on, or after, 1 January 2018.
• On 8 December 2016, IASB published the document ‘Annual Improvements to IFRS Standards 2014-2016 Cycle’, containing amendments, essentially of a technical and
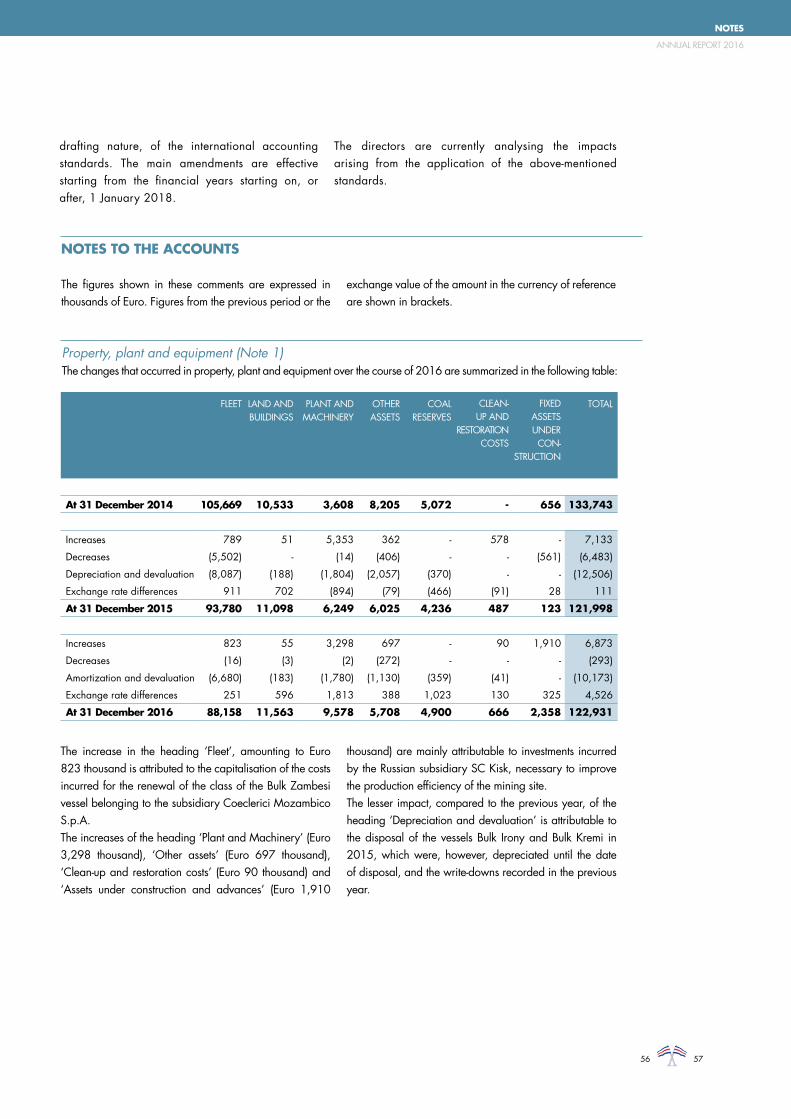
5756
NOTES
ANNUAL REPORT 2016
drafting nature, of the international accounting standards. The main amendments are effective starting from the financial years starting on, or after, 1 January 2018.
The directors are currently analysing the impacts arising from the application of the above-mentioned standards.
NOTES TO THE ACCOUNTS The figures shown in these comments are expressed in thousands of Euro. Figures from the previous period or the
exchange value of the amount in the currency of reference are shown in brackets.
Property, plant and equipment (Note 1)The changes that occurred in property, plant and equipment over the course of 2016 are summarized in the following table:
The increase in the heading ‘Fleet’, amounting to Euro 823 thousand is attributed to the capitalisation of the costs incurred for the renewal of the class of the Bulk Zambesi vessel belonging to the subsidiary Coeclerici Mozambico S.p.A.The increases of the heading ‘Plant and Machinery’ (Euro 3,298 thousand), ‘Other assets’ (Euro 697 thousand), ‘Clean-up and restoration costs’ (Euro 90 thousand) and ‘Assets under construction and advances’ (Euro 1,910
thousand) are mainly attributable to investments incurred by the Russian subsidiary SC Kisk, necessary to improve the production efficiency of the mining site. The lesser impact, compared to the previous year, of the heading ‘Depreciation and devaluation’ is attributable to the disposal of the vessels Bulk Irony and Bulk Kremi in 2015, which were, however, depreciated until the date of disposal, and the write-downs recorded in the previous year.
FLEET LAND AND BUILDINGS
PLANT AND MACHINERY
OTHER ASSETS
COAL RESERVES
CLEAN-UP AND
RESTORATION COSTS
FIXED ASSETS UNDER CON-
STRUCTION
TOTAL
At 31 December 2014 105,669 10,533 3,608 8,205 5,072 - 656 133,743
Increases 789 51 5,353 362 - 578 - 7,133
Decreases (5,502) - (14) (406) - - (561) (6,483)
Depreciation and devaluation (8,087) (188) (1,804) (2,057) (370) - - (12,506)
Exchange rate differences 911 702 (894) (79) (466) (91) 28 111
At 31 December 2015 93,780 11,098 6,249 6,025 4,236 487 123 121,998
Increases 823 55 3,298 697 - 90 1,910 6,873
Decreases (16) (3) (2) (272) - - - (293)
Amortization and devaluation (6,680) (183) (1,780) (1,130) (359) (41) - (10,173)
Exchange rate differences 251 596 1,813 388 1,023 130 325 4,526
At 31 December 2016 88,158 11,563 9,578 5,708 4,900 666 2,358 122,931

The item ‘Increases’, amounting to Euro 1,210 thousand, are mainly explained by an increase of Euro 1,147 thousand relevant to the extension of the project of the mining licence by the Russian subsidiary SC Kisk.At 31 December 2016, the heading ‘Other intangible fixed assets’ primarily included the residual value of the mining licence held by the Russian subsidiary and
value of the customer relationships held by the American subsidiary.The lesser impact, compared to the previous year, of the heading ‘Amortization and devaluation’ is mainly attributable to the amortisations recorded for the previous year.
Interests in jointly controlled entities, other investments and available-for-sale financial assets (Note 3)This item consists of the following:
Intangible assets (Note 2)The changes in intangible assets which occurred during 2016 financial period are summarized in the table below:
GOODWILL OTHER FIXED ASSETS
TOTAL
At 31 December 2014 191 5,642 5,833
Increases - 849 849
Decreases - - -
Amortization and devaluation (191) (3,428) (3,619)
Exchange rate differences - (88) (88)
At 31 December 2015 - 2,975 2,975
Increases - 1,210 1,210
Decreases - - -
Amortization and devaluation - (352) (352)
Exchange rate differences - 718 718
At 31 December 2016 - 4,551 4,551
31/12/2016 31/12/2015
Interests in jointly controlled entities 28,603 23,663
Other investments 10 452
Available-for-sale financial assets 2,442 3,046
Total 31,055 27,161

5958
NOTES
ANNUAL REPORT 2016
‘Interests in jointly controlled entities’, measured using the equity method, changed in the following ways during 2016:
The key financial information regarding jointly controlled entities, and a brief description of the activities conducted, is given below:
The Coeclerici Group has a 49% stake in PT Asian Bulk Logistics through the subsidiary Coeclerici Logistics SpA. The company carries out transshipment activities in Indonesia.The Coeclerici Group has a 49% stake in dACC Maritime The Coeclerici Group has a 49% stake in
dACC Maritime d.a.c. through the subsidiary Coeclerici Logistics SpA. The company, during the previous year, started to ship dry bulk.The heading ‘Investments in other companies’ consisted of the following at 31 December 2016:
During the year, the stake in Telemar S.p.A. was sold, bringing about a gain of Euro 2,057 thousand, registered under ‘Capital gains’ and commented in ‘Note 18 –
Gains (Losses) on non-current assets’. ‘Available-for-sale financial assets’, which will remain as permanent items in the company’s assets, consist of the following:
PT ASIAN BULK
LOGISTICS
dACC
MARITIME d.a.c.TOTAL
At 31 December 2015 24,546 (883) 23,663
Result 5,310 - 5,310
Dividends paid (2,208) - (2,208)
Foreign exchange effect 955 - 955
Other movements - reclassifications - 883 883
At 31 December 2016 28,603 - 28,603
PT ASIAN BULK LOGISTICS dACC MARITIME d.a.c.
Assets 91,183 107,938
Liabilities 32,810 116,305
Shareholders' Equity 58,373 (8,367)
Turnover 30,030 5,632
Operating result 14,568 (2,963)
Net income 10,837 (6,197)
31/12/2016 31/12/2015
Ambienta SGR SpA 9 9
Consorzio Armatori per la Ricerca (Cons.A.R.) Srl 1 9
Telemar SpA - 434
Total other investments 10 452

During the course of 2016, this heading fell overall by Euro 604 thousand; the decrease resulted mainly from the drop in fair value of the Ambienta Fund, for Euro 588 thousand, and the Canara Robeco Treasury Advantage Fund, for Euro 112 thousand, partially mitigated by the
increase in fair value of the fund Hao Capital Fund II L.P., for Euro 102 thousand.Further information regarding the closed investment funds Ambienta I and Hao Capital Fund II L.P. are given under ‘Note 28 – Commitments and Guarantees’.
Other non-current assets (Note 4)This heading consists of the following:
‘Other receivables’ amounting to Euro 32,171 thousand refer mainly to the funding of Euro 25,176 thousand (Euro 17,712 thousand at 31 December 2015) of the subsidiary dACC Maritime d.a.c., in order to finance the construction of four 60,000-ton Supramax vessels, and to an amount held in the ‘Reserve Account’ of the subsidiary Coeclerici Mozambico SpA of Euro 5,235 thousand (Euro 6,380 thousand at 31 December 2015). ‘Tax receivables’ for Euro 1,398 thousand, include fiscal and tax receivables
related to previous financial years which have not yet been recovered.The heading ‘Advances for investments to be subscribed’, includes the first tranche of the payment relevant to the acquisition of the stake in the IMS Deltamatic Group, as already illustrated in the Directors’ Report.The Provision for bad debt refers mainly to tax receivables.
31/12/2016 31/12/2015
Banca Carige SpA - 3
Ambienta I Fund 891 1,479
Hao Capital Fund II L.P. 583 481
Value Secondary Investments SICAR 132 136
Canara Robeco Treasury Advantage Fund 743 855
Banca Popolare di Sondrio 93 92
Total available-for-sale financial assets 2,442 3,046
31/12/2016 31/12/2015
Other receivables 32,171 25,664
Tax receivables 1,398 1,398
Advances for investments to be subscribed 9,690 -
Guarantee Deposits 249 286
Provision for other bad debts (1,561) (1,561)
Total other non-current assets 41,947 25,787
Inventories (Note 5)Stocks, equal to EUR 17,575 thousand (EUR 18,485 thousand at 31 December 2015), are made up as follows:
31/12/2016 31/12/2015
Goods 16,869 17,913
Consumables 706 572
Total inventories 17,575 18,485

6160
NOTES
ANNUAL REPORT 2016
As shown in the details of the heading ‘Goods’ indicated below and referring entirely to various types of coal, notwithstanding the increase of coal prices, the heading
‘Stocks’ drops following the drop in the turnover of stocks:
Trade receivables (Note 6)This heading amounts to Euro 39,911 thousand (Euro 67,659 thousand at 31 December 2015) and consists entirely of receivables resulting from normal commercial operations with clients. It is shown net of the provision for bad debts amounting to Euro 19,877 thousand (Euro
16,591 thousand at 31 December 2015).
Trade receivables at 31 December 2016 can be divided between the following expiry periods:
It should be noted that in the months subsequent to December 2016 a large proportion of the receivables shown in the table at 31 December 2016 with an expiry of less than 60 days were actually received. Negotiations remain in being to recover all debts receivable at 31 December 2016. The share of overdue payables beyond
the year not hedged by the provision for bad debts refers mainly to receivables covered by an insurance guarantee; the risk of unrecoverability of such amounts is remote.The movement in the provision for bad debts during 2016 was as follows:
31/12/2016 31/12/2015
TONNES EURO/000 TONNES EURO/000
Goods 405,071 16,869 421,221 17,913
31/12/2016 31/12/2015
Invoices to be issued 244 7,232
Receivables not yet due 9,777 32,248
Due < 60 days 24,513 18,550
Due < 180 days 108 4,251
Due < 365 days 285 4,468
Due > 1 year 4,205 -
Debts in litigation previous years 20,656 17,501
Provision for bad debts (19,877) (16,591)
Total trade receivables 39,911 67,659
Provision for bad debts at 31 December 2015 (16,591)
Provisions (2,716)
Uses -
Exchange rate differences (570)
Provision for bad debts at 31 December 2016 (19,877)
The increase in the provision for bad debts during the financial year refers primarily to receivables, arising
during previous years, towards an Italian trade partner in bankruptcy proceedings.

Prepayments and other receivables and current assets (Note 7)This heading consists of the following:
‘Payments on account to suppliers’, amounting to Euro 5,932 thousand (Euro 2,886 thousand at 31 December 2015), refer mainly to advance payments made to Russian suppliers for the purchase of coal delivered in the months following 31 December 2016; the increase was primarily due to the higher price of coal.‘Receivables relating to the fair value of financial instruments’ refer mainly to currency sales made by the Group and considered in more detail in ‘Note 26 – Information regarding financial instruments’, which gives further details.
It is noted that, during the year, the associated company PT Asian Bulk Logistics extinguished the loan granted to
the same by the subsidiary Coeclerici Logistics S.p.A., resulting in the write-off of the heading ‘Receivables from joint ventures’ (Euro 5,741 thousand at 31 December 2015). ‘Receivables from the holding company’ refer to receivables arising from the tax consolidation for IRES purposes. For further details regarding the composition of this amount, refer to ‘Note 24 – Taxation’. These receivables, which arose as a result of the transfer to the parent company of the tax losses of the Group, shall be liquidated, pursuant to the tax consolidation agreement, upon the use by the Consolidator of the aforementioned tax losses.
Cash and cash equivalents (Note 8)This heading consists of the following:
31/12/2016 31/12/2015
Payments on account to suppliers 5,932 2,886
Other receivables 1,673 1,786
Receivables relating to the fair value of financial instruments 1,821 81
Tax Credits 10,087 8,430
Receivables from joint ventures - 5,741
Receivables from the holding company 3,520 3,070
Accrued income and prepaid expenses 1,021 1,327
Total prepayments and other receivables and current assets 24,054 23,321
31/12/2016 31/12/2015
Bank and postal deposits 70,421 65,234
Cash in hand 43 88
Total cash and cash equivalents 70,464 65,322
Bank deposits held with mainstream banks are managed centrally by the Holding Company’s Treasury department, or under its direct supervision if held separately. Refer
to the Cash Flow Statement for an explanation of the variations in cash and cash equivalents.
6362
NOTES
ANNUAL REPORT 2016
Total Equity (Note 9)The movements which occurred in the various elements of Group equity are indicated in the relevant notes.
The ‘Share Capital’, wholly subscribed to and paid up, amounted to Euro 10,000 thousand and consisted of 10,000,000 ordinary shares each of a nominal value of Euro 1.
The ‘Legal Reserve’ of Euro 2,000 thousand is the legal reserve held in the Holding Company.
The ‘Translation Reserve’ has a positive value of Euro 5,937 thousand and regards the conversion into Euros of the financial statements of foreign Group companies included in the consolidation but held in currencies other than the Euro, and increased in the financial period by Euro 2,744 thousand.
The ‘Merger Surplus Reserve’ had a positive value of Euro 27,921 thousand and remained unchanged compared to its value at 31 December 2015.
The ‘Reserve for Fair Value of Financial Instruments’ had a negative value of Euro 1,568 thousand, showed a drop for Euro 43 thousand relevant to the change in fair value of such financial instruments (as is considered in more detail in ‘Note 26 – Information regarding financial instruments’) and to changes in the fair value of the assets held for sale.
The heading ‘Actuarial Gains (Losses)’, with a negative balance of Euro 144 thousand, increased by Euro 16 thousand which arose from actuarial evaluation of post-employment benefits (TFR) at 31 December 2016 (as is
considered in more detail in ‘Note 12 – Post-employment benefits’).
The heading ‘Other reserves’ had a positive balance of Euro 49,198 thousand and remained unchanged compared to its value at the end of the previous financial period.
The heading ‘Retained earnings’ showed a negative balance equal to Euro 40,486 thousand, after recording an increase as the result of variations in the perimeters of the consolidation of Euro 290 thousand, and after retaining the loss from the previous financial year of Euro 22,876 thousand.With reference to the information envisaged by IAS 1 paragraph 124, it should be noted that the objectives identified by the Group in the management of its capital are the following: the creation of value for its shareholders, the safeguarding of the company’s future and support for the development of the other Group companies. For this reason, the Group seeks to maintain an adequate level of capitalization enabling it to give its shareholders a satisfactory financial return and ensure it has access to external sources of financing, also by means of an adequate credit rating. This strategy has remained the same since the previous financial period.
Il The Group monitors its capital structure constantly, especially the level of net financial debt, calculated as the ratio between the net financial position and equity. This ratio, compared with that of the previous financial year, was as follows:
31/12/2016 31/12/2015
Net financial position 129,070 148,271
Equity 73,335 58,610
NFP/EQUITY 1.76 2.53

Interest bearing liabilities and borrowings (Note 10) This heading consists of the following:
The trend of coal prices and a rationalisation in the management of the Group liquidity have driven the changes to the item ‘Interest bearing liabilities and borrowings’. Short-term advances, amounting to Euro 46,616 thousand (Euro 50,481 thousand at 31 December 2015) refer mainly to loans received to finance coal trading, especially that carried out by the subsidiaries Coeclerici Commodities SA, Coeclerici Coal Network Inc. and Dako Coal GmbH.
Secured loans amounting to Euro 40,034 thousand, down compared to 2015 by Euro 5,263 thousand, refer to loans granted by leading banks to fund the construction of the vessels owned by the Group, in addition to the funding for the acquisition of the property located in Riva Paradiso,
Lugano, headquarters of the Trading Division.Unsecured loans amounted to Euro 111,367 thousand, dropped compared to 2015 of Euro 6,448 thousand, and refer to loans from banks to finance the Group’s investment activities.It should be noted that the financial covenants included in the financing contracts were always respected.
The heading Leasing includes only the payable from the signing of financial leasing contracts by the Russian subsidiary SC Kisk for the purchase of machinery and other assets necessary for mining production.
‘Interest bearing liabilities and borrowings’ at 31 December 2016 had the following expiry periods:
31/12/2016 31/12/2015
CURRENT NON-
CURRENTTOTAL CURRENT NON
CURRENTTOTAL
Short term advances 46,616 - 46,616 50,481 - 50,481
Secured loans from financial institutions 6,482 33,552 40,034 5,447 39,850 45,297
Unsecured loans from financial institutions 27,139 84,228 111,367 7,498 110,317 117,815
Leasing 220 1,297 1,517 - - -
Interest bearing liabilities
and borrowings80,457 119,077 199,534 63,426 150,167 213,593
Within 2017 2018 - 2019 2020 - 2021 After 2021 TOTAL
Short term advances 46,616 - - - 46,616
Secured loans from financial institutions 6,482 11,967 11,951 9,634 4,034
Unsecured loans from financial institutions 27,139 25,997 58,231 - 111,367
Leasing 220 661 636 - 1,517
Interest bearing liabilities and borrowings 80,457 38,625 70,818 9,634 199,534
31/12/2016 31/12/2015
CURRENT NON
CURRENTTOTAL CURRENT NON
CURRENTTOTAL
Chf 940 1,753 2,693 37 2,656 2,693
Eur 3,249 59,880 63,129 9,904 75,868 85,772
Rub 1,048 1,453 2,501 883 1,381 2,264
Usd 75,220 55,991 131,211 52,602 70,262 122,864
Interest bearing liabilities and
borrowings by currency80,457 119,077 199,534 63,426 150,167 213,593
‘Interest bearing liabilities and borrowings’ included the following:

6564
NOTES
ANNUAL REPORT 2016
Provisions for liabilities and charges (Note 11)This heading comprises all of the provisions made for possible liabilities arising from legal, fiscal and commercial disputes in being. It also includes the cost of dismantling and reclaiming the Russian mine; these provisions will be used when amounts are actually paid to carry out the work in question. Releases were made after previous provisions
created against potential liabilities were considered no longer necessary.
At 31 December 2016, this heading consisted of the following:
During the financial year, the movements under this heading were as follows:
During the financial year, Euro 6.6 million was set aside to meet possible liabilities which could reasonably result from previous judicial relations.It should be noted that, in previous financial years, the Holding Company Coeclerici Logistics SpA received verification notices from the Italian Tax Authority - Provincial Division I - Milan) for the years 2007, 2008, 2009 and 2010. In 2016, further verification notices were received by the Holding Company Coeclerici Logistics SpA for the years 2011 and 2012. The dispute concerns undue detractions for VAT and tax recoveries for IRES and IRAP purposes. The Company has appealed against the verification notice to the Milan taxation tribunal as it considers the issue to be illegitimate and unfounded.
In the 2013 financial year, the Company was the subject of a check regarding IRES and IRAP for 2010. In the 2015 financial year, the company received a verification notice for this. In 2016, further verification notices were received by the Holding Company Coeclerici Logistics SpA for the years 2011 and 2012. The Company has
appealed against the verification notice to the Milan taxation tribunal as it considers the issue to be illegitimate and unfounded. In 2014, the subsidiary Coeclerici Coal and Fuels SpA was the subject of a check by the Italian tax Authority (Lombardy Regional Direction) regarding the financial years 2010 and 2011.
In 2015 and subsequently in 2016 further verification notices were received for the years 2010 and 2011. The dispute concerns undue detractions for VAT and tax recoveries for IRES and IRAP purposes. The Company has appealed the notices relevant to the year 2010 before the Tax Commission of the Province of Milan, contesting the illegitimacy and groundlessness of the findings, while for the year 2011, the Company forwarded its disagreement to the Italian Tax Authority - Lombardy Regional Direction - Large Contributors’ Office for a definitive assessment application. It is noted that, except for one minor case, all of the decisions of the provincial tax commissions to date issued have had a positive outcome with acceptance of the appeals submitted by the Group.
31/12/2016 31/12/2015
Current - 25
Non-current 27,800 20,049
Total provisions for liabilities and charges 27,800 20,074
At 31 December 2015 20,074
Allocation 6,563
Actuarial variation in restoration costs 129
Restoration costs 90
Releases -
Uses (32)
Exchange rate differences 976
At 31 December 2016 27,800

Post-employment benefits (Note 12)The changes in post-employment benefit provision were as follows:
The main assumptions behind the actuarial valuation of the post-employment benefit provisions are as follows:
The method of recalculating the TFR fund on an actuarial basis is set out in the accounting principles; in accordance with IAS 19, the method used is that of ‘Unitary Credit Projection’. Actuarial gains and losses generated by applying this method are included in equity. As anticipated by IAS 19, actuarial gains and losses arising in the financial year, amounting to Euro 22 thousand, consisted of ‘actuarial gains from experience’ for Euro 3 thousand,
and ‘actuarial gains from change of demographic suppositions’ for Euro 19 thousand. There follows below an analysis of the sensitivity of each important actuarial hypothesis in order to show the effects (in absolute terms and in thousands of Euros) which would result following reasonably possible variations at that date in determining the liability at 31 December 2016:
At 31 December 2014 2,120
Provisions for the period 682
Actuarial (gains) / losses (325)
Uses (980)
At 31 December 2015 1,497
Provisions for the period 221
Actuarial (gains) losses 22
Uses -
At 31 December 2016 1,740
31/12/2016 31/12/2015
Updating coefficient 0.86% 1.39%
Inflation rate 1.50% Year 2016: 1.50%
Year 2017: 1.80%
Year 2018: 1.70%
Year 2019: 1.60%
After 2020: 2.00%
Annual salary increase rate Executives 2.00% 2.00%
Management / white-collar 2.00% 2.00%
Annual post-employment benefit increase rate 2.62% Year il 2016: 2.62%
Year il 2017: 2.85%
Year il 2018: 2.77%
Year il 2019: 2.70%
After 2020: 3.00%
Changes 31/12/2016
Inflation rate +0.25% 11
Inflation rate -0.25% (11)
Updating coefficient +0.25% (13)
Updating coefficient -0.25% 13

6766
NOTES
ANNUAL REPORT 2016
Trade payables (Note 13)The balance of Euro 39,277 thousand (Euro 48,046 thousand at 31 December 2015) includes current payables for supplies linked to the Group’s normal operating activities. The variation arising in the financial
year is consistent with the decrease in trade receivables and was generated by the Trading Division’s normal activities.
Other payables and current liabilities (Note 14)‘Other payables and current liabilities’ consist of the following:
The heading ‘Other payables’ amounted to Euro 8,647 thousand (Euro 4,316 thousand at 31 December 2015), and included payables of various types falling due in the subsequent financial year, and also advance payments received from clients.‘Payables relating to the fair value of financial instruments’ amounted to Euro 1,641 thousand (Euro 7,134 thousand at 31 December 2015) refer to forward exchange transactions of coal commented in ‘Note 26 – Information
regarding financial instruments’, which gives further details.‘Accrued expenses and deferred income’ amounted to Euro 4,487 thousand (Euro 4,291 thousand at 31 December 2015) and consisted mainly of accruals of various operating costs and deferred income regarding advance invoicing of hire charges regarding the Logistics Division’s transshipment activities.
Revenues (Note 15)The item is composed as follows:
‘Raw material sales’ amounted to Euro 579,453 thousand and referred to trading activities.The decrease of such item, for Euro 63,538 thousand, is attributable to the lesser volumes handled. The new sales strategy of the Group, in fact, focuses on the commercialization of products with higher added value, privileging profitability over volumes. The decrease is only
partly attributable to the appreciation of the dollar over the Euro.The other revenue items were not subject to significant changes in absolute value. Information by division is shown in ‘Note 25 – Information by division and geographical area’.
31/12/2016 31/12/2015
Other payables 8,647 4,316
Payables relating to the fair value of financial instruments 1,641 7,134
Tax payables 2,192 2,210
Payables to Social Security institutions 717 788
Accrued expenses and deferred income 4,487 4,291
Total other payables and current liabilities 17,684 18,739
2016 2015
Raw material sales 579,453 642,991
Charters and shipping transport 8,723 8,588
Transshipment and other logistics services 30,667 30,123
Coal brokerage commission 729 718
Other services 1,465 1,561
Total revenues 621,037 683,981

Cost of sales (Note 16)The item is composed as follows:
The decrease in ‘Purchase of raw materials’, for Euro 83,813 thousand, is attributable, as already indicated for ‘Sales of raw materials’ to the reduction of the volumes handled. It is also noted that during the previous year there were extraordinary events relevant to the geological structure of the Russian mining site, which significantly increased the cost item ‘Purchase of raw materials’ and ‘Mine operating costs’.The reduction in ‘Cost of seafaring personnel’ and in ‘Technical costs for fleets and plants’ may be attributed
mainly to the reduction of activity of some of the vessels.The heading “Port expenses and other shipping costs”, for Euro 820 thousand, is in line with the figures of the years prior to 2015; the comparative value shown in the table is influenced by the charter costs incurred by the Indonesian subsidiary PLKI, for Euro 791 thousand, and reflects the use of the Bulk Celebes vessel by the associate company PT Asian Bulk Logistics given that the Bulk Pioneer vessel was involved in extraordinary maintenance in order to renew its class.
Overhead and administrative expenses (Note 17)The item is composed as follows:
2016 2015
Purchase of raw materials 509,275 593,088
Mine operating costs 19,663 24,005
Cost of mining personnel 5,366 6,218
Cost of seafaring personnel 4,957 5,312
Technical costs for fleet and plants 3,243 3,861
Port expenses and other shipping costs 820 1,842
Lubricants / spare parts 1,166 1,211
Bunkers 222 212
Total cost of sales 544,712 635,749
2016 2015
Personnel costs 17,854 17,962
Consultancy 5,157 4,773
Director and Statutory Auditors’ fees 4,611 1,829
Rents, leases and similar 2,466 2,617
Other costs 2,877 3,231
Travel expenses 1,049 1,072
Entertainment expenses 548 550
Utilities Building administration – Representative offices 786 898
Consumables 131 158
Advertising 285 513
Total overhead and administrative expenses 35,764 33,603

6968
NOTES
ANNUAL REPORT 2016
For the heading ‘Personnel Costs’ for Euro 17,854 thousand, further details are provided in ‘Note 30 - Other information’. ‘Director and Statutory Auditors’ fees’ for
Euro 4,611 thousand incur an increase of Euro 2,782 thousand. The heading includes fees due to Directors and Auditors of the Holding, as shown below:
The heading ‘Rents, leases and similar’ mainly concerned the rental paid to the holding company Fincler Srl for the Milan offices.
Capital gains / (losses) on non-current assets (Note 18)The item is composed as follows:
The heading “Gains” includes the effects from the sale of the stake held in Telemar S.p.A for Euro 2,057 thousand.
Profit (loss) from jointly controlled entities measured using the equity method (Note 19) This is comprised of:
The above income is attributable to the positive result achieved by the company PT Asian Bulk Logistics for Euro 5,310 thousand, net of the loss recorded by the company dACC Maritime d.a.c. For Euro 3,036 thousand. It is noted that this loss was offset as an adjustment of the
financial receivable due to the Irish associate company. For further information on the nature of business of these companies, see ‘Note 3 – Interests in jointly controlled entities, other investments and available-for-sale financial assets’.
2016 2015
Number Remuneration Number Remuneration
Directors 9 4,357 9 1,592
Statutory Auditors 3 55 3 54
Total Fees 12 4,412 12 1,646
2016 2015
Capital gains 2,128 2,706
Capital losses (174) (653)
Total capital gains (losses) on non-current assets 1,954 2,053
2016 2015
Profit (loss) from jointly controlled entities measured using the equity 2,274 2,704

Other net income / (expenses) (Note 20)The item is composed as follows:
This heading mainly comprises the movements in the headings ‘Provisions for liabilities and charges’ and ‘Other non-current assets – provision for other bad debts’, already
mentioned in the relevant points regarding the balance sheet in the Notes to the financial statements.
Depreciation, amortization and devaluation (Note 21)The item is composed as follows:
Refer to ‘Note 1 – Property, plant and equipment’ and ‘Note 2 – Intangible assets’ for more detail regarding depreciation, amortization and devaluation.
Net financial income / (expenses) (Note 22)This consists of the following financial income (expenses):
2016 2015
Other operating income
Release of provisions and other liabilities - 2,967
Insurance claims 511 207
Gains on derivatives - 6,913
Total other operating income 511 10,087
Other operating costs
Allocations to provisions for liabilities (6,563) (3,708)
Allocations to provisions for bad debts (2,748) (4,154)
Gains on derivatives (2,288) -
Other net income (costs) (2,526) (1,357)
Total other operating costs (14,125) (9,219)
Total other net income / (expenses) (13,614) 868
2016 2015
Depreciation of property, plant and equipment and devaluation 10,173 12,506
Amortization of intangible assets and devaluation 352 3,619
Total amortisations, depreciations and devaluation 10,525 16,125
2016 2015
Total net financial income (expenses) (6,770) (10,769)

7170
NOTES
ANNUAL REPORT 2016
The category includes the following financial income:
The heading ‘Interest receivable’ amounted to Euro 1,634 thousand and mainly concerns interest receivable from financial institutions on current and deposit accounts and on financing given to the companies involved in the PT Asian Bulk Logistics and dACC Maritime d.a.c. joint
ventures, in order to finance the construction of new vessels, as mentioned in ‘Note 4 – Other non-current assets’ and ‘Note 7 - Prepayments, other receivables and current assets’.Financial expenditure included the following:
‘Bank charges’ refers mainly to use of the syndicated line and the stipulation of new specific funding contracts specific to investments in being.
‘Interests payable’ refer mainly to financial charges on bank loans, mentioned in more detail in ‘Note 10 - Interest bearing liabilities and borrowings’.
Exchange gains (losses) (Note 23) In addition to the exchange rate differences arising at the end of the financial period from the translation of assets and liabilities in other currencies, this heading also shows Exchange rate differences realised during the financial period. As has already been mentioned in the Director’s
Report, the heading includes the negative effect of currency (Rouble) hedging. Details of exchange rate differences, both realised and not realised in 2016, and their comparison to the previous financial period, are shown in the table below:
2016 2015
Dividends from equity investments in other companies - 50
Interest received 1,634 1,441
Other income 31 439
Total financial income 1,665 1,930
2016 2015
Bank charges (1,422) (1,532)
Available-for-sale financial asset loss/devaluation - (3,594)
Interests payable (7,013) (7,573)
Total financial expenses (8,435) (12,699)
2016 2015
REALIZED NON -
REALIZEDTOTAL REALIZED NON -
REALIZEDTOTAL
Exchange gains 12,305 12,183 24,488 12,705 7,207 19,912
Exchange losses (14,088) (6,159) (20,247) (21,934) (18,788) (40,722)
Total exchange gains (losses) (1,783) 6,024 4,241 (9,229) (11,581) (20,810)
Income taxes (Note 24)The amount of the tax burden regarding the period was negative for Euro 3,553 thousand. It was calculated in conformity with existing statutory regulations and includes expected exemptions, elements of deferred taxation and,
as far as Italian companies in the Group are concerned, the effects of adhesion to the tax consolidation produced by the holding company Fincler Srl.The amount of taxation consists of the following:
The amounts in the table below refer to deferred tax assets and liabilities held in the balance sheets of Group
companies and to the effects of consolidation.
‘Deferred tax assets’ can mainly be attributed to additions to a risk provision during the financial year and in previous financial years, which cannot be immediately deductible fiscally, and also to additions for fiscal losses which will be recovered in subsequent financial periods.The balance under the heading ‘Deferred tax liabilities’ consists of the deferred taxation arising from the setting
aside of elements of income or expenditure subject to deferred taxation.
The tax assets and liabilities of Group companies included in the taxation consolidation at 31 December 2016 were as follows:
Information by operating segment and geographical area (Note 25)The information by operating segment for 2016 period is summarized in the following table:
2016 2015
Current taxes (2,116) (1,007)
Deferred taxes (1,437) 6,103
Total taxes (3,553) 5,096
31/12/2016 31/12/2015
Receivable for advance tax payments 9,648 10,869
Deferred tax liabilities (2,766) (3,018)
Net balance of advance taxes (provision for deferred
taxes)6,882 7,851
RECEIVABLES PAYABLES TOTAL
Coeclerici Logistics SpA 986 - 986
Coeclerici SpA 2,534 - 2,534
Total receivables (payables) owing to tax consolidation 3,520 - 3,520
TRADING MINING LOGISTICS HOLDING ADJUSTMENT
TOTAL
Revenues from sales and services 575,592 36,441 40,770 (31,766) 621,037
Operating profit (EBIT) 11,417 6,308 11,148 (8,223) 20,650
Net financial income / (expenses) (2,201) (1,113) (2,664) (792) (6,770)
Net income 7,497 6,248 8,880 (8,057) 14,568

7372
NOTES
ANNUAL REPORT 2016
The following table shows details of Group revenues from sales and services broken down by region:
Information regarding financial instruments (Note 26) Financial derivative instruments The Group has used hedging transactions (fair value hedge and cash flow hedge) to meet the risks of oscillation in the Eur/USD and Rub/USD exchange rates and variation of coal prices.
Fair value hedgeTransactions in existence at 31 December 2016 which amount to fair value hedges and whose variations in fair
value can be included in the income statement under the heading ‘Exchange gains / (losses)’ are indicated below:
Cash flow hedgeAt 31 December 2016 currency transactions were in being which had the characteristics of cash flow hedges, and the variations to their fair value have been included
net of the fiscal effects in net assets under the heading ‘Reserve related to the fair value of financial instruments’, shown in detail below:
TRADING MINING LOGISTICS HOLDING ADJUSTMENT
TOTAL
Africa 17,353 - 30,653 - 48,006
Americas 77,127 - - - 77,127
Asia and Australia 314,733 123 8,736 - 323,592
Russia and Middle East - 4,068 - - 4,068
Europe 166,379 32,250 1,381 (31,766) 168,244
Total revenues from sales and services 575,592 36,441 40,770 (31,766) 621,037
EXPIRY AMOUNT (THOUSAND)
CURRENCY FORWARD EXCHANGE
CONTRACT RATE
NOTIONAL VALUE (EUR/000)
FAIR VALUE AT 31-DEC-2016
(EUR/000)
Q4 2017 598 USD 1.0669 561 4
Total sales 561 4
EXPIRY AMOUNT (THOUSAND)
CURRENCY FORWARD EXCHANGE
CONTRACT RATE
NOTIONAL VALUE
(EUR/000)
FAIR VALUE AT 31-DEC-2016
(EUR/000)
Q1 2017 785,600 RUB 66.00 11,904 785
Q2 2017 654,650 RUB 67.38 9,716 660
Q3 2017 155,250 RUB 69.28 2,241 174
Q4 2017 155,250 RUB 70.20 2,212 164
Total purchases 26,073 1,783

Finally, hedging transactions existed at 31 December 2016 relating to variations in the price of coal. Forward sales transactions at 31 December 2016, which displayed the characteristics of cash flow hedges, and l the variations
in their fair value, have been shown net of their fiscal effect in equity under the heading ‘Reserve related to the fair value of financial instruments’, and are shown below:
EXPIRY AMOUNT (TONNES)
CONTRACT PRICEPER MT
NOTIONAL VALUE
(USD/000)
FAIR VALUE AL 31DEC-2016
(EUR/000)
Q1 2017 60,000 66.44 3,986 (772)
Q2 2017 45,000 62.33 2,805 (329)
Q3 2017 45,000 59.47 2,676 (311)
Q4 2017 30,000 56.35 1,691 (229)
Total purchases 180,000 11,158 (1,641)
Summary of fair value derivativesThe values and variations in the fair value of derivative instruments in existence at 31 December 2016 are shown in the table below:
EXPIRY AMOUNT (THOUSAND)
CURRENCY FORWARD EXCHANGE
CONTRACT RATE
NOTIONAL VALUE (EUR/000)
FAIR VALUE AT 31-DEC-2016
(EUR/000)
Q1 2017 310 EUR 1.0468 296 2
Q2 2017 310 EUR 1.0503 295 3
Q3 2017 620 EUR 1.0581 586 5
Total purchases 1,177 10
EXPIRY AMOUNT
(THOUSAND)CURRENCY FORWARD
EXCHANGE CONTRACT RATE
NOTIONAL VALUE(EUR/000)
FAIR VALUE AT 31-DEC-2016
(EUR/000)
Q1 2017 292 USD 1.1061 264 13
Q2 2017 138 USD 1.0503 131 6
Q3 2017 130 USD 1.0581 123 5
Total purchases 518 24

7574
NOTES
ANNUAL REPORT 2016
The fair value of all financial derivatives has been calculated on the basis of forward quotations of market indices at the reference date. The reserve in equity, which includes the fair value of financial instruments, is shown net of any taxation.The table below shows an analysis of financial instruments at their fair value, grouped in levels from 1 to 3 on the basis of the ability to calculate their fair value:• level 1, the fair value is determined by prices quoted
in active markets• level 2, the fair value is determined by valuing
techniques on the basis of variables which are, directly or indirectly, observable in the market;
• level 3, the fair value is determined by means of valuing techniques which are on the basis of significant variables which cannot be observed in the market.
31/12/2015 CHANGES IN EQUITYCHANGES IN
INCOME STATEMENT31/12/2016
Receivables
Foreign exchange market 2 1,817 2 1,821
Forward coal sales to be received 79 (79) - -
Total receivables 81 1,738 2 1,821
Payables
Foreign exchange market* (7,051) - 876 -
Forward coal sales to be received (83) (1,641) 83 (1,641)
Total payables (7,134) (1,641) 959 (1,641)
Total net value (7,053) 97 961 180
* In line with the accounting entries made in the previous year, payments made for collar derivative contracts that reached maturity during the year were offset by cash and cash equivalents; the lesser amounts paid affected the income statement.
LEVEL 1 LEVEL 2 LEVEL 3
Financial assets
Available-for-sale 836 - 1,606
Hedging derivatives - 1,821 -
Total financial assets 836 1,821 1,606
Financial liabilities
Hedging derivatives - (1,641) -
Total financial liabilities - (1,641) -

Financial instruments classified at level 1 are shares in quoted companies, whose value is listed daily, and also open investment funds. Level 2 includes financial
derivatives; in order to determine their market value, the Group used the following model for measuring and evaluating them:
Instruments classified as level 3 refer to shares held at 31 December 2016 in closed-end investment funds.
Other financial informationFor completeness, some additional financial information is given below:• ‘Note 10 – Interest bearing liabilities and
borrowings’ summarizes the characteristics of the bank loans and gives their due dates and interest rates applied;
• ‘Note 22 – Net financial income / (expenses)’ gives information about interest receivables and payables relating to financial items.
Risks characterising the Group’s business (Note 27)The main risks connected with the Group’s business, which are monitored and managed by Coeclerici SpA and its subsidiaries, are as follows.
Commodity riskThe company’s profit is affected by changes in the prices of the commodities and services it sells through its Trading Division. Volatile coal prices and freight rates generally lead to volatile operating profits and sales margins. The risks connected with trading may be limited by:• Back-to-Back transactions;• undertaking time-limited commitments to
purchase/sell coal and transport services (freight) at values mainly pegged to the API#2 and API#4 indices and partly to fixed values; prior inspection and approval of transactions according to the corporate policy.
Trading risks are assessed through:• constant monitoring of all trading transactions,
including the continuous monitoring of trading partners;
• periodic business projections and analysis of the effects of the main variables (freight rates andcommodity indices).
As regards sources of coal supply, the Group has depended less on suppliers since the Group took over the Russian ‘SC Kisk’ mine in 2008.The demand for dry bulk transshipment services depends on the levels of freight rates. When freight rates are high, the development of efficient dock services, able to reduce loading and unloading times, becomes strategically important for traders and this favours the development of new opportunities for the Group.
Exchange riskMost of the subsidiaries’ revenues and operating costs are recorded in currencies other than EUR (mainly USD and RUB). The Group manages the exchange rate risk, where it deems necessary, through forward currency
transactions and foreign currency loans. In addition, loans are stipulated by the operating companies in the same currency as the revenues, where possible, in order to attenuate exchange rate oscillations.
TYPE INSTRUMENT PRICING MODEL
MARKET DATA USED DATA PROVIDER
IFRS 7 HIERARCHY
Foreign exchange / coal derivatives
Forward Discounted cash flow
- Spot rate - Zero coupon curve of reference currency
Bank of reference
Level 2

7776
NOTES
ANNUAL REPORT 2016
Interest-rate riskThe Coeclerici Group is mainly funded at variable interest rates. The Group’s policy is to monitor the trend in interest rates and the long-term forecasts in order to make sure that financial expenditure is always sustainable. In the current market situation, the company does not consider it wise to engage in hedging transactions with the aim of stabilizing interest rates over time with the exception of the Interest
Rate Swap contract described in ‘Note 26 – Information regarding financial instruments’. In a risk sensitivity assessment, it was estimated that a 10% increase in market interest rates compared to those actually applied during 2016, would have had a negative effect of Euro 485 thousand on the 2016 income statement and of Euro 495 thousand on equity.
Credit riskCredit risk is the company’s exposure to potential losses deriving from the failure of trading partners to comply with their commitments. Commercial credit management is entrusted to the business units, in agreement with the Group holding company, on the basis of formal risk assessment procedures, including debt collecting and any dispute proceedings. Furthermore, all outstanding receivables are monitored monthly by Division credit committees, including regular prospective analysis of credit limits.The credit position of certain clients with a degree of financial risk identified by scores representing levels of risk
is monitored with even daily frequency.Credit risk hedging is mainly carried out through the following instruments:• confirmed letters of credit (bank guarantees) in
the Trading Division;• performance bonds (guarantees of satisfactory
completion of a contract) and advance payment bonds in the Logistics Division;
• commercial credit insurance by leading insurance agencies (SACE B.T SpA, Garant and Coface), in the Trading Division.
Liquidity riskLiquidity risk is the risk that financial resources may not be available or are only available at high cost. Thanks in part to use of the credit system, the structure of the Coeclerici Group’s sources of finance is diversified and makes sufficient sources of finance available to satisfy foreseeable financial needs both in the medium and long term. Moreover, corporate liquidity risk management aims to ensure a suitable level of operational elasticity for the Group’s development programmes.
The Trading Division needs to finance its current assets, especially the down payments made to Russian suppliers
for the purchase of commodities. This need is mainly met by short-term borrowing through bank loans.As regards the Logistics Division, the investments to build vessels are usually financed through specific medium and long-term loans whose characteristics are normally negotiated so that they are compatible with the cash flows forecast from sector operating activities. In addition, specific contract provisions such as advance payments in time charter contracts and guaranteed minimum tonnages in contracts on the basis of quantities handled are exploited, among other things, to achieve optimal short-term financial management.
Political riskThe Group’s business takes place through investments all over the world. In the case of investments made in a country considered to be politically ‘at risk’, the Group protects itself where possible with a specific investment insurance policy drawn up with a leading insurance company, SACE SpA. These investment insurance policies protect companies that set up or hold shares in foreign companies or that make indirect investments through
foreign companies controlled by the Italian company. These policies cover the risk of losses in capital, revenues, interest and amounts owed to the Italian company or its subsidiaries in connection with the investment, caused by the following political events: expropriation and other acts of absolute power, currency restrictions and moratoriums, force majeure events and civil unrest.

Operational riskFor the Logistics Division in particular, there exists a general operational risk arising from the use of vessels as part of the contractual activities undertaken. Amongst the main categories of risk in this sense there are events resulting from the loss – either partial or total – of the Division’s vessels, as well as those arising from responsibility for damage caused during the course of activities. Protection against such risks is made by means of insurance policies agreed with primary counterparts. The policies used are
typical of those used by companies operating in shipping, and include Hull and Machinery policies for damages to the ships and the equipment installed on board, Protection and Indemnity third party liability policies, profit loss Trade Disruption policies and war risk policies.In addition, and wherever possible, Escalation clauses are included in transshipment contracts which recalculate tariffs to reflect any increase in a number of cost categories.
Operational risk of extractionAs far as the Mining Division is concerned, the operational risks arising from mining activities are mitigated by the usual civil liability insurance for any damages caused by
the use of equipment to move the coal once extracted, as well as the compulsory protection regarding cover for professional accidents.
Obligations and guarantees (Note 28)Obligations relating to derivativesThe existing derivatives are shown in ‘Note 26 – Information regarding financial instruments’ and concern
forward transactions on the foreign exchange and interest rate markets.
Obligations relating to financial instruments‘Obligations relating to financial investments’ are shown in the following table:
AmbientaI Fund‘Ambienta I’ is a private equity set up in 2007, which invests in the environmental sector. It was set up and is managed by ‘Ambienta Società di Gestione del Risparmio SpA’, of whose share capital 0.6% was bought in 2007 for an amount of Euro 9 thousand, classified under fixed
assets as ‘Other investments’. During 2007, the Group committed itself to purchasing Euro 3,000 thousand of the fund’s shares. In 2016, further sums amounting to Euro 87 thousand were paid to it. At 31 December 2015, the fair value of the shares was Euro 891 thousand.
YEAR OF SUBSCRIPTION
FUND DURATION
OVERALL COMMITMENT
SUBSCRIBED AMOUNT
RESIDUAL COMMITMENT
Ambienta I 2007 10 anni 3,000 2,685 315
Hao Capital Fund II L.P. 2008 10 anni 949 806 143
Total financial instruments 3,949 3,491 458
Hao Capital Fund II L.P.The ‘Hao Capital Fund II L.P.’ is a private equity fund investing in the Chinese market. During 2008, the Group took on the commitment to buy the shares, at a cost of USD 1 million equal to Euro 948 thousand at 31 December
2016. The financial investment was recorded to its market value of Euro 583 thousand, as indicated under the heading ‘Available-for-sale financial assets’.

7978
NOTES
ANNUAL REPORT 2016
Guarantees issuedAt 31 December 2016, guarantees given to third parties stood at Euro 18,118 thousand, and are illustrated below:
Guarantees receivedAt 31 December 2016, guarantees received by third parties stood at Euro 15,807 thousand, and are illustrated below:
Related party transactions (Note 29)During the financial period, a number of transactions were conducted with the holding company, Fincler Srl, in the tax consolidation of the Group whose holding company is also the consolidating company, as described in ‘Note 7 – Prepayments, other receivables and current assets’. Furthermore, an office rental contract exists between the Company and its direct holding company, Fincler Srl,
referring to the offices in Piazza Generale Armando Diaz, 7 – Milan. The Chairman of the Board of Directors and the CEO of Coeclerici SpA is also the Group’s majority shareholder.Dr Andrea Clavarino, Director of the Holding Company, is also Chairman of the Board of Directors and CEO of Coeclerici Logistics SpA.
Other information (Note 30)Staff costsPersonnel costs for 2016 totalled Euro 28,177 thousand (Euro 29,492 thousand in 2015), of which Euro 4,957 thousand related to seafaring staff (Euro 5,312 thousand in 2015), Euro 5,366 thousand to personnel at the Russian mine (Euro 6,218 thousand in 2015) and Euro 17,854
thousand to staff personnel (Euro 17,962 thousand in 2015).
The average composition of employees was as follows:
The average decrease of employees and relevant drop in costs is the result of the reorganisation process implemented over the recent years that follows, as a
guideline, the departmental and work simplification structure of the Group.
31/12/2016 31/12/2015
Bank guarantees 15,324 21,381
Total guarantees received 2,794 10,769
18,118 32,150
2016 2015
Executives 33 44
White Collars 214 257
Seafaring staff 100 98
Miners 560 547
Total employees 907 946
31/12/2016 31/12/2015
Bank guarantees 15,807 13,011
Total guarantees received 15,807 13,011

Subsequent events (Note 31) In January, the transfer of the equity interests in the company IMS Deltamatic was completed. Furthermore, the Group subscribed an increase in share capital, hence, the stake held is 67%. The investment takes over, for accounting and tax purposes, starting from 1 January 2017.As already mentioned in the Directors’ Report, the management is evaluating an exit from the US market,
through the disposal of the subsidiary Coeclerici Coal Network, and the German market through the disposal of the German subsidiary Dako Coal. During the first months of 2017, preparatory activities were started for the realization of these transactions. It is noted that the impact of such transactions on the financial statements at 31 December 2016, is not tangible.

8180
NOTES
ANNUAL REPORT 2016

8382
NOTES
ANNUAL REPORT 2016
APPENDIX 1LIST OF COMPANIES CONSOLIDATED USING FULL CONSOLIDATION METHOD
LIST OF COMPANIES CONSOLIDATED USING EQUITY METHOD
NAME REGISTERED OFFICES
CURRENCY SHARE CAPITAL EQUITY SHARE
Nuevaco Imobiliaria Srl Dominican Republic Dop 25,002,000 99.98%
Dako Coal GmbH Germany Eur 150,000 100.00%
CGU Logistic Ltd India Inr 910,000,000 100.00%
PT Coeclerici Indonesia Indonesia Idr 2,265,000,000 100,00%
PT Pelayaran Logistik Konversi Indonesia ("PLKI") Indonesia Idr 17,000,000,000 49.00%
Coeclerici Logistics SpA Italy Eur 10,500,000 100.00%
Coeclerici Mozambico SpA Italy Eur 10,000,000 100.00%
Capo Noli Transportes Maritimos Lda Portugal Eur 5,000 100.00%
Logconversion Transportes Maritimos Lda Portugal Eur 2,300,000 70.00%
LLC Zapadny Russia Rub 20,000 100.00%
SC Kuznetskaya Investitsionno – Stroitelnaya Compania (“Kisk”) Russia Rub 1,060,000,000 100.00%
LLC Coeclerici Russia Russia Rub 4,000,000 100.00%
LLC Razrez Korciakolskij Russia Rub 10,000 100.00%
LLC Scc-Rozko Russia Rub 13,381,000 100.00%
LLC Yuzhno – Kuzbasskoe promyshlenno –transportnoe upravlenie (“Ptu”) Russia Rub 10,000 100.00%
Selskohozyaistvennoe predpriyatie Taylepskoe Russia Rub 125,600,000 100.00%
Coeclerici Asia (Pte) Ltd Singapore Usd 1,995,000 100.00%
Coeclerici Far East (Pte) Ltd Singapore Usd 100,000 100.00%
Coeclerici Americas Real Estate Inc. United States Usd 9,300,000 100.00%
Coeclerici Coal Network Inc. United States Usd 6,351,000 70.00%
CCN Transload Terminal, LLC United States Usd 100 70.00%
Coeclerici Commodities SA Switzerland Chf 10,000,000 100.00%
Elvezia Immobiliare SA Switzerland Chf 1,300,000 100.00%
Bulkguasare de Venezuela SA Venezuela Vef 2,408,000 90.00%
Venezuelan Bulk Logistics SA Venezuela Vef 2,000,000 90.00%
NAME REGISTERED OFFICES
CURRENCY SHARE CAPITAL EQUITY SHARE
PT Asian Bulk Logistics Indonesia Usd 20,000,000 49.00%
dACC Maritime d.a.c. Irlanda Usd 100,000 49.00%

APPENDIX 2COMPARISON OF EQUITY OF COECLERICI SPA AND THAT OF GROUP
NET PROFIT EQUITY
Coeclerici SpA at 31 December 2016 5,349 102,240
Equity and net profit for the period recorded by consolidated companies 34,690 301,116
Consolidation adjustments:
- elimination of holdings in subsidiaries and transactions between consolidated companies with exception of intercompany dividends 9,507 (338,332)
- application of IAS/IFRS international accounting principles 2,380 1,325
- elimination of intercompany dividends (38,435) -
Coeclerici Group at 31 December 2016 13,491 66,349

8584
NOTES
ANNUAL REPORT 2016
TECHNICAL GLOSSARY
API#2 (cif ARA): Average Coal Price Index (cost insurance freight on the Amsterdam-Rotterdam-Antwerp route). Average weekly coal price index including cost of freight on Amsterdam-Rotterdam-Antwerp route.
API#4 (fob Richards Bay): Average Coal Price Index (free on board on the Richards Bay port). Average weekly coal price index without freight cost referring to port of Richards Bay (South Africa).
B/B – Bare Boat Charter Contract putting a vessel at the disposal of a charterer, without crew, for a given period of time; apart from the costs of the voyage (fuel, port taxes, canal transit fees etc.), the charterer also pays all operational costs (crew, maintenance, repairs, lubricants, provisions, insurance).
Capesize: Ship for transportation of dry bulk commodities exceeding 90,000 dwt, not able owing to its size to navigate the Panama Canal.
Demurrage: Penalty charged for the time, exceeding that established by the contract with the owner, which the charterer uses to bring loading/unloading operations of a vessel to a conclusion.
Despatch: Premium acknowledged for the time, less than that established by the contract with the owner, which the charterer uses to bring loading/unloading operations of a vessel to a conclusion.
DWT - TPL - Dead Weight Tonnage: Transportation capacity of a ship, expressed in tonnes, including cargo, fuel, provisions and crew.
Floating Transfer Station (FTS): Vessel patented by Coeclerici possessing adequate equipment (crane, conveyor belt, loaders etc.) and able to conduct cargo transshipping activities from one vessel to another.
Floating Storage & Transfer Station (FSTS): Ship adequately converted and equipped to store cargo and perform cargo transshipping operations.
Floating cranes: floating cranes used in transshipping operations from barge to ship or vice versa.
IRS: Interest Rate Swap A contract with which two parties agree to exchange payments, calculated on the basis of differing and pre-defined interest rates applied to a notional capital, for a period of time previously defined at the moment the contract is drawn up.
Panamax: Bulk-carrier vessel suitable for transiting the Panama Canal, with a width therefore not in excess of 32.24 metres. Normally these vessels are not greater than 80,000 dwt.
PCI: Pulverized Coal Injection. Coal used in steelworks, whose main characteristics are a low ashes content and a high heat-producing power.
Revamping: Extraordinary maintenance operations seeking to improve a vessel and increase its value.
Supramax: Bulk-carrier vessel suitable for transiting the Panama Canal, with a width therefore not in excess of 32.24 metres. Normally these vessels are not greater than 64,000 dwt. Vessel with a central crane enabling coal to be handled directly.
T/C - Time Charter: A contract whereby a ship is made available to a charterer who bears fuel costs, port fees, canal transit costs and other costs relating to the voyage. Normally expressed in USD per day of the ship’s availability.
Transshipment vessel – Floating Terminal: Vessel able to transfer cargo from one vessel to another, positioned in the waters outside the port, with which loading or unloading operations of ocean-going vessels are conducted.

88Independent Auditors’ Report
90Board of Statutory Auditors’ Report
AUDITORS’ REPORT

INDEPENDENT AUDITORS’ REPORT

8988
AUDITORS’ REPORT
ANNUAL REPORT 2016

BOARD OF STATUTORY AUDITORS’ REPORT

9190
AUDITORS’ REPORT
ANNUAL REPORT 2016


9392
AUDITORS’ REPORT
ANNUAL REPORT 2016

COECLERICI GROUP OFFICES
LuganoPalazzo MantegazzaRiva Paradiso 26900 Lugano Paradiso – Switzerlandtel. +41 91 68 29 591fax +41 91 68 29 593
e-mail: [email protected]
Mason7697 Innovation Way, Suite 100Mason – Ohio 45040 United States of Americatel. +1 513 39 82 625fax +1 513 39 85 419e-mail: [email protected]
MoscowMytnaya Str., 1, build. 1, 3rd floor 1190049 Moscow – Russiatel. +7 499 23 76 892fax +7 495 95 98 432e-mail: [email protected]
Mumbai106, Hallmark Business PlazaSant Dyaneshwar Marg Bandra (East)400051 Mumbai – Indiatel. +91 22 61 77 66 50fax +91 22 61 77 66 51e-mail: [email protected]
Novokuznetsk35, Ordzhenikidze Street, Office 801654007 Novokuznetsk – Russiatel. +7 38 43 99 33 90fax +7 38 43 99 33 91e-mail: [email protected]
Singapore16-01 Shaw House Tower 350 Orchard Road 238868 Singaporetel. +65 67 37 07 50 fax +65 67 33 05 58e-mail: [email protected]
SydneySuite 11, 11th Floor100 Walker Street – North SydneyNSW 2060 – Australiatel. +61 2 94 60 25 80fax +61 2 94 60 25 82e-mail: [email protected]
MilanPiazza Generale Armando Diaz, 720123 Milan – Italytel. +39 02 62 46 91fax +39 02 62 46 97 03www.coeclerici.com e-mail: [email protected]
AmsterdamSingel 250, 1st Floor1016 AB AmsterdamThe Netherlandstel. +31 20 799 5626e-mail: [email protected]
BeijingRoom 1002, AnLian Plaza, No. 38Dongsanhuan Road (North)Chaoyang District100026 Beijing – Chinatel. +86 10 85 91 17 79fax +86 10 85 91 12 88e-mail: [email protected]
BogotáCra 12 No. 98-35 Of. 401110221 Bogotá – Colombiatel. +57 1 640 31 71fax +57 1 622 70 03e-mail: [email protected]
BrisbaneSuite 13, Level 8, 320 Adelaide Street 4000 QLD Brisbane – Australiatel. +61 7 3221 8060fax +61 7 3010 9001e-mail: [email protected]
CaracasAvenida Venezuela con Calle El RecreoEdificio Torre America – Piso 6 Oficina 6061050 Caracas – Venezuelatel. +58 261 79 31 296fax +58 261 79 33 576 e-mail: [email protected]
DortmundKampenstrasse, 151D-58456 Witten – Germanytel. +49 2302 97030 – 0 fax +49 2302 97030 – 70 e-mail: [email protected]
JakartaMenara Karya 20 Floor Unit DJl. HR. Rasuna Said Block. X–5 Kav.1–2 12950 Jakarta – Indonesiatel. +62 21 57 85 19 60 fax +62 21 57 85 19 59e-mail: [email protected]


COECLERICI SPA
PIAZZA GENERALE ARMANDO DIAZ, 720123 MILAN, ITALY TEL. +39.02.62.469.1WWW.COECLERICI.COM