annual report 2015–16 - audit.vic.gov.au · annual report 2015–16 a challenging but productive...
TRANSCRIPT

Annual R
epo
rt 2015–16
Victo
rian Aud
itor-G
eneral’s Office
Level 24, 35 Collins Street, Melbourne Vic 3000Telephone 61 3 8601 7000 Facsimile 61 3 8601 7010
www.audit.vic.gov.au
Annual Report 2015–16
101046 VAGO_Annual Report 2015-6_Cover_r3.pdf | Page 1 of 2 101046 VAGO_Annual Report 2015-6_Cover_r3.pdf | Page 1 of 2

Our visionTo be a catalyst for continuous improvement in the accountability and performance of the public sector
101046 VAGO_Annual Report 2015-6_Cover_r3.pdf | Page 2 of 2 101046 VAGO_Annual Report 2015-6_Cover_r3.pdf | Page 2 of 2

Our purposeProviding assurance to Parliament

2 Victorian Auditor-General’s Office
Annual Report 2015–16
A challenging but productive year
It has been a very difficult but remarkably productive year for our office. Looking back on 2015–16, our people are entitled to be gratified with the quality of the work they continued to deliver, for the significant value they added and, despite considerable internal upheaval, for maintaining their pride in, and commitment to, the office they serve.
In 2015–16, we tabled 39 reports in Parliament, some of them unprecedented in nature, covering topics as various as major projects, bullying and harassment, strategic planning in our education system, hospital performance and the Annual Financial Report on the state. The office also delivered 647 audit opinions on agencies’ financial statements and their non-financial performance indicators.
Sustained performance and commitment to continual improvement
We delivered most of our parliamentary performance targets within budget, and we have looked for more efficient and effective ways to produce our work. In particular, we completely reviewed and re-engineered our performance audit methodology and adapted our practice to better target our audit effort and maximise our impact throughout the public sector. With improvements to our practice always in mind, we are also looking forward to benefiting from the lessons and recommendations of the triennial audit of our office, which is nearing its conclusion.
Our impact
Our vision for the office has been to act as a catalyst for change, and, as the chapter on our impact sets out, whenever the agencies we audit have acted on our findings and implemented our recommendations, clearly attributable improvements and efficiencies have ensued. These take a variety of forms: agencies are prompted to amend policies and processes, to review their legislation and regulations, and to reconsider resourcing decisions, often while our audits are still on foot. This is a tribute not simply to our office, but to the vast majority of Victorian Public Service agencies with which we engage. While there is always room to improve, as the Key Audit Themes section of our report continues to demonstrate, it is heartening that many agencies have seen past the adversarial spin that is often put on their relationship with Parliament’s Auditor. They recognise audit engagements as opportunities for a transparent, objective and independent examination of their program delivery, which benefits them, assures the Parliament and serves our citizens.
Nothing better exemplifies that spirit of positive engagement than VAGO’s recent experience with the Department of Education & Training (DET). Following a disclaimer of audit opinion on DET’s financial statements, the office worked very closely with a clearly committed minister, secretary and senior staff as the department embarked on a major remedial program which already has yielded significant improvements.
Legislative reform fit for a modern public sector
To have maximum, effective impact, our office needs legislation that is fit for purpose. The Integrity and Accountability Legislation Amendment (A Stronger System) Act 2016 recently passed by Parliament gives the office ‘follow-the-dollar’ powers—the ability to examine and report on the performance of bodies delivering government services under contract. This is a good start, but comprehensive reform of the Audit Act 1994 still beckons. Our legislation needs to be fit for the contemporary public sector we now audit, and it also needs to protect and preserve the independence and discretion of Parliament’s Auditor. Nonetheless, we do acknowledge the government’s ongoing review of the accountability and integrity system, and its commitment to improve the Auditor-General’s legislation.

3
From the Acting Auditor-General
Valuing and listening to our people: Creating a positive workplace culture
In any organisation, people are paramount, and building and maintaining a positive and resilient work culture capable of dealing with and learning from inappropriate behaviours—such as bullying and harassment—is of first-order importance. Unfortunately, this was an issue with which our office had a very public experience in 2015. That experience served as our own internal catalyst for change and, with input from all our staff, we developed our Culture Program, a series of policy and process reviews and training and development initiatives. These were designed to address five key themes that an all-staff survey identified, namely:• leadership • behaviours and values • practice management • people• organisational cohesion.
Many of the Culture Program’s elements have already been completed, some are in progress and others will commence shortly. The Culture Program has given all our people opportunities to reflect, in particular, on the values and behaviours which should define the integrity business we are in, for ourselves, for our stakeholders and clients, and for the community. In the few months the program has been in progress, it has been especially gratifying to observe the discernibly more positive mood across the office, and a general willingness to ‘turn the page’ and look to the future.
We are rightly proud of our staff. They are among the most highly credentialed, trained and experienced across the Victorian public sector. Here again, the Culture Program has been the vehicle for us to take a fresh look at how we train, develop and treat our people.
Thank you to our principal stakeholder
Sincere thanks must go to Mr Danny Pearson (Chair) and Mr David Morris (Deputy Chair) and the other members of the Public Accounts and Estimates Committee for the support they provided, in helping the office come through the difficult period occasioned by the resignation of the former Auditor-General. One happy consequence is that the professional relationship between the Committee and this office is now stronger and more mutually respectful than ever. We look forward to building on that foundation.
The future
Finally, as we look ahead, we welcome the appointment of Victoria’s 27th Auditor-General, Mr Andrew Greaves. Andrew brings to his new role formidable skills and a wealth of audit experience gained both here and in other jurisdictions, most recently, as Auditor-General for Queensland. Parliament, the public sector and our citizens can have confidence that in its 166th year, Victoria’s oldest integrity office is in safe hands.
Dr Peter Frost Acting Auditor-General

Annual Report 2015–16
Contents
1 Snapshot of our year 6
2 Our impact 18
3 Our people 27
4 Our office 41
5 Performance audit 59
6 Financial audit 67
7 Our financial management 73
8 Appendices 129
The Hon Bruce Atkinson MLC President Legislative Counci Parliament House Melbourne
The Hon Telmo Languiller MP Speaker Legislative Assembly Parliament House Melbourne
Dear Presiding Officers
I am pleased to transmit, in accordance with section 7B of the Audit Act 1994, the annual report of the Victorian Auditor-General’s Office for the year ended 30 June 2016 for presentation to Parliament.
Andrew Greaves Auditor-General
Melbourne 12 October 2016
Accountable officer’s declaration
In accordance with the Financial Management Act 1994, I am pleased to present the Report of Operations for the Victorian Auditor-General’s Office for the year ended 30 June 2016.
Dr Peter Frost Acting Auditor-General
Melbourne 13 September 2016
Pursuant to section 20(3) of the Audit Act 1994, unless otherwise indicated, any persons named in this report are not the subject of adverse comment or opinion.
PhotographyFront cover: The Parliament of Victoria. Jason Benz Bennee / Shutterstock.Inside front cover: Melbourne’s skyline. Phillip Minnis / Shutterstock.Page 8: Inside the Legislative Assembly in the Parliament of Victoria. Page 37: Victorian Auditor-General’s Office. Page 38: Bandits and Co. Page 52: Victorian Auditor-General’s Office.

5
About this report
What you need to know about this report
Our annual report informs parliamentarians, public sector agencies, integrity and oversight bodies and the community about our operational and financial performance.
Our annual report is prepared in line with the Department of Treasury and Finance’s 2015–16 Model Report, available at Treasury and Finance’s website, www.dtf.vic.gov.au. The model report is prepared under the Financial Management Act 1994 and incorporates the requirements of Australian Accounting Standards, Financial Reporting Directions (FRD) and Standing Directions as at 1 March 2016, for the reporting period ended 30 June 2016. A disclosure index in Appendix four (page 145) helps to identify how VAGO complies with statutory disclosure requirements.
[Figure 1] We report on our performance against several planning inputs
Part 1 includes a high-level summary of:• who we are• what we do• our performance• our key achievements• our key priorities.
Parts 2 to 6 provide more information about our impact, our people, how our office is governed and managed, and our services.
Part 7 includes detailed statements that fulfil our financial reporting requirements.
The appendices include further details about the information within the main sections of the report.
We welcome your feedback on our annual reporting. You can provide feedback through our website, www.audit.vic.gov.au.
Our annual report
Str
ateg
ic
plan
State Budget
Papers
Annual planInternal
business plan
Audit A
ct
objectives

6 Victorian Auditor-General’s Office
Our achievements
Of surveyed parliamentarians, 98 per cent of respondents agreed that our reports and services provide valuable information on public sector performance (page 48).
We were actively involved in the development of public sector audit through our contributions to the Australasian Council of Auditors-General and the Pacific Association of Supreme Audit Institutions and the hosting of auditors on secondment from Papua New Guinea (pages 37–38).
Despite being affected by staff turnover and delays filling vacancies, our staff continued to demonstrate their resilience while delivering quality outcomes (page 36).
We reviewed and strengthened our audit topic selection framework to increase its rigour (page 61).
We introduced a new internal consultation policy and database to improve the efficiency and effectiveness of the provision of technical auditing and accounting advice to our audit engagement teams (page 47).
We achieved most of our parliamentary performance targets within budget (page 14).
We reviewed and re-engineered our Performance Audit methodology (page 62).
We broadened our annual planning consultation to include parliamentary committees for the first time (page 11).
Our findings and recommendations continue to contribute to improving the work of audited agencies and the public sector more broadly (pages 18–26).
We tabled 39 reports in Parliament (three more than in 2014–15), and prepared 647 audit opinions on the financial statements and non-financial performance indicators of agencies (page 14).
We established a specialist data analytics strategy and capability team within our office (page 65).
1 Snapshot of our year
98%

7
Snapshot of our year
Our challenge in the year ahead
Next steps
Some of our output measures do not appropriately assess our performance. We will review and seek to progressively revise relevant measures (page 14).
We will continue to improve our internal working culture (page 40).
We will develop a new information and communications technology (ICT) strategy (page 58).
We will deliver a cohesive and comprehensive learning and development program for our office (page 40).
We will act on the findings of the 2016 Public Accounts and Estimates Committee audit of our office (page 58).
We will continue to build advanced data analytics capabilities throughout our office (page 66).
We will actively support the government review of the Audit Act 1994 (page 9).
We will review our organisational performance measures to ensure that they provide adequate assurance to Parliament on our operational performance (page 58).

8 Victorian Auditor-General’s Office
Annual Report 2015–16

9
Snapshot of our year
Our role in the public sector
What do we do?
The Auditor-General provides independent assurance to Parliament and the Victorian community on the state’s financial reporting and performance. To do this, our office carries out financial audits and performance audits of public sector agencies. The agencies are accountable to Parliament for their use of public resources and the powers Parliament confers on them.
How do we fit into Victoria’s integrity system?
Victoria’s integrity system includes the following bodies:• our office—we examine the performance and accountability of the public sector and report to
the Parliament and the citizens of Victoria• the Victorian Inspectorate—has oversight of Victoria’s integrity system• the Victorian Ombudsman—which examines the decisions and actions of Victorian
government bodies by investigating complaints • the Independent Broad-based Anti-corruption Commission—which investigates, reports
and works to prevent corruption in the public sector• the Local Government Investigations and Compliance Inspectorate—which assesses how
Victoria’s 79 local authorities comply with the Local Government Act 1989.
Who do we audit?
The Auditor-General’s audit responsibilities cover about 540 agencies which earn about $88 billion in revenue, hold assets worth more than $359 billion, and employ more than 340 000 people.
Agencies we audit include government departments, public bodies, educational institutions, public hospitals, local authorities, agencies controlled by the state or a public body, and particular bodies that provide government services under contract.
Guiding legislation and our mandate
Integrity legislation changes and Audit Act 1994 review
The principal pieces of legislation governing and guiding the Auditor-General and our office are:• the Constitution Act 1975, which establishes the role of the Auditor-General and gives the
Auditor-General complete discretion in the performance and exercise of his functions and powers
• the Audit Act 1994, which establishes the Auditor General’s mandate, provides the legal basis for his powers, and identifies his responsibilities.
The Audit Act 1994 gives the Auditor-General extensive access and reporting powers to enable him to fulfil this mandate, including getting full access to information from associated entities.
Since 2009, we have advocated for a complete rewrite of the Audit Act 1994. As governments have moved to different and innovative ways of delivering services, the Audit Act 1994 has failed to keep pace. This has steadily eroded our mandate and limited the assurance we can provide to Parliament.

10 Victorian Auditor-General’s Office
Annual Report 2015–16
In late 2015–16, Parliament passed the Integrity and Accountability Legislation Amendment (A Stronger System) Act 2016 (the Act). The Act is an important first step towards closing this accountability gap, and finally provides the Auditor-General with limited ‘follow-the-dollar’ powers. However, comprehensive legislative reform is needed to address the challenges of a contemporary public sector, and to improve its transparency and accountability.
We welcome the government’s extensive review of the integrity and accountability system and its commitment to consider further improvements to our legislation.
Accountability
The Auditor-General is an independent officer of the Victorian Parliament, and cannot be directed by anyone, including Parliament or the government. Although independent, the Auditor-General remains accountable to Parliament, through the Public Accounts and Estimates Committee. Our office has a statutory relationship with the committee and must consult with it about our annual plan and, in certain circumstances, on our performance audit specifications. We are also subject to annual financial audits and independent performance audits every three years, as required under the Audit Act 1994. These audits ensure that we are held accountable to the same standards of performance rigour and financial statement accuracy to which we hold the public sector accountable.
Organisational changes
In early 2015–16, our performance audit business unit was segregated into two separate areas led by the appointment of two new Assistant Auditors-General. The former Auditor-General, John Doyle, resigned soon after in September 2015, and Dr Peter Frost became our Acting Auditor-General. After a brief trial of the new structure, we decided to revert to having a single Assistant Auditor-General to oversee our performance audit practice, while the other Assistant Auditor-General executive transitioned to lead the Audit Support Group as their Acting Executive Director, while the incumbent executive was on extended leave.

11
Snapshot of our year
Our planning frameworkOur planning framework aligns our Strategic Plan and Annual Plan with our operational business plans, as shown in Figure 2.
[Figure 2] Our planning framework
Our progress against our Strategic Plan
Our Leadership Group prepares and approves our Strategic Plan in consultation with staff. Our Strategic Plan sets out our vision, purpose, objectives and values, and informs our Annual Plan, organisational Business Plan, and divisional business unit plans. Our 2016–17 Strategic Plan was rolled over from 2015–16, with the exception of some updates. We expect to prepare a new four-year plan for 2017–18, with guidance and support from our new Auditor-General.
We detail progress towards our 2015–16 Strategic Plan on page 12.
Our Annual Plan
Our Annual Plan, one of our key accountability mechanisms, sets out our work program for the next two financial years and the resources required to put that program into effect. The plan gives Parliament, the public sector and the community an opportunity to learn about our audit priorities and scrutinise our proposed program. This year, in addition to departments and key integrity and oversight bodies, we broadened our process for consulting stakeholders to include parliamentary committees for the first time.
Our Business Plan
Our Business Plan supports the delivery of our work program and initiatives, as set out in our Annual Plan. It also supports our day-to-day operations and office-wide business improvement projects, as we work towards achieving the objectives in our Strategic Plan.
Our business unit plans
Our business unit plans provide specific blueprints outlining the progress that each business unit makes towards various office objectives in the year ahead.
Individual performance development plans
Every year, each of our staff members prepares a performance development plan. The work priorities identified in each business unit plan are linked directly to specific performance objectives outlined in individual staff performance development plans.
Strategic Plan
Annual Plan
business unit plans
Business Plan
Individual PDPs

12 Victorian Auditor-General’s Office
Annual Report 2015–16
Performance against our 2015–16 Strategic PlanHere is an overview of progress made during the year against the five objectives in our 2015–16 Strategic Plan.
Objective 1
Being authoritative and relevant
Better targeting of topics, audit effort directed to areas of public value, and promoting broader access to reports.
Achievements during 2015–16
• We tabled 39 reports in Parliament, and produced 647 audit opinions on the financial statements and non-financial performance indicators of agencies (page 14).
• We continued to present at conferences, educational courses and professional groups to promote education of our report findings and to increase awareness of our activities (pages 142–143).
• We continued to produce our ‘Key Audit Themes’ product, a summary of the most frequent and significant audit findings that offer opportunities for agencies to learn from the experience of others (pages 130–141).
Objective 2
Being highly regarded by Parliament
A smooth flow of reports to Parliament, and good engagement with parliamentary committees and individual parliamentarians.
Achievements during 2015–16
• Of surveyed parliamentarians, 98 per cent of respondents agreed that our reports and services provide valuable information on public sector performance (page 48).
• There were 285 Hansard references to our audit reports this year, an increase from 263 in 2014–15 (page 18).
• We made submissions to five parliamentary committee inquiries (page 18).
• We broadened our Annual Plan consultation to include parliamentary committees for the first time (page 11).
• We provided regular briefings to Parliament and ministers, as well as support for, and effective engagement with parliamentary committees and relevant inquiries (pages 18 and 26).
Objective 3
Fostering productive relationships with audit clients
Clients are appropriately informed about audit plans, processes and activities, and our staff foster professional relationships with clients.
Achievements during 2015–16
• We appropriately informed agencies about our audit plans (including our Annual Plan), processes and activities (page 11).
• We established a stakeholder engagement project led by our Performance Audit business unit (page 65).

13
Snapshot of our year
Objective 4
Fostering a stimulating work environment
Rigorous performance planning and management, best practice training, and a safe and healthy workplace.
Achievements during 2015–16
• We developed a series of initiatives to improve our office’s internal working culture (page 28).
• We improved our performance development plan process so that management and staff clearly understand performance expectations (page 31).
• We were actively involved in the national and international development of public sector audit, through our contributions to the Australasian Council of Auditors-General and the Pacific Association of Supreme Audit Institutions, and the hosting of auditors on secondment from Papua New Guinea (pages 37–38).
Objective 5
Leveraging our systems and processes to improve organisational performance
Systems and processes are aligned, investment in capability for long-term sustainability, and being a responsible corporate citizen.
Achievements during 2015–16
• We reviewed and re-engineered our Performance Audit methodology (page 62).
• We reviewed and strengthened our audit topic selection framework to increase its rigour (page 61).
• We rolled out an updated audit sampling methodology to enhance our audit approach to tests of controls (page 47).
• We established a new internal consultation policy and database to improve the efficiency and effectiveness of the provision of auditing and accounting advice to our audit engagement teams (page 47).
• We developed a new post-audit quality assurance framework to drive continuous improvement for our audit engagements (page 47).
• We established a specialist data analytics strategy and capability team within the office (page 65).
• We established a strategic audit planning project led by our Performance Audit business unit (page 65).
14 Victorian Auditor-General’s Office
Annual Report 2015–16
Continued excellence in delivering our outputsOur annual performance measures and outputs
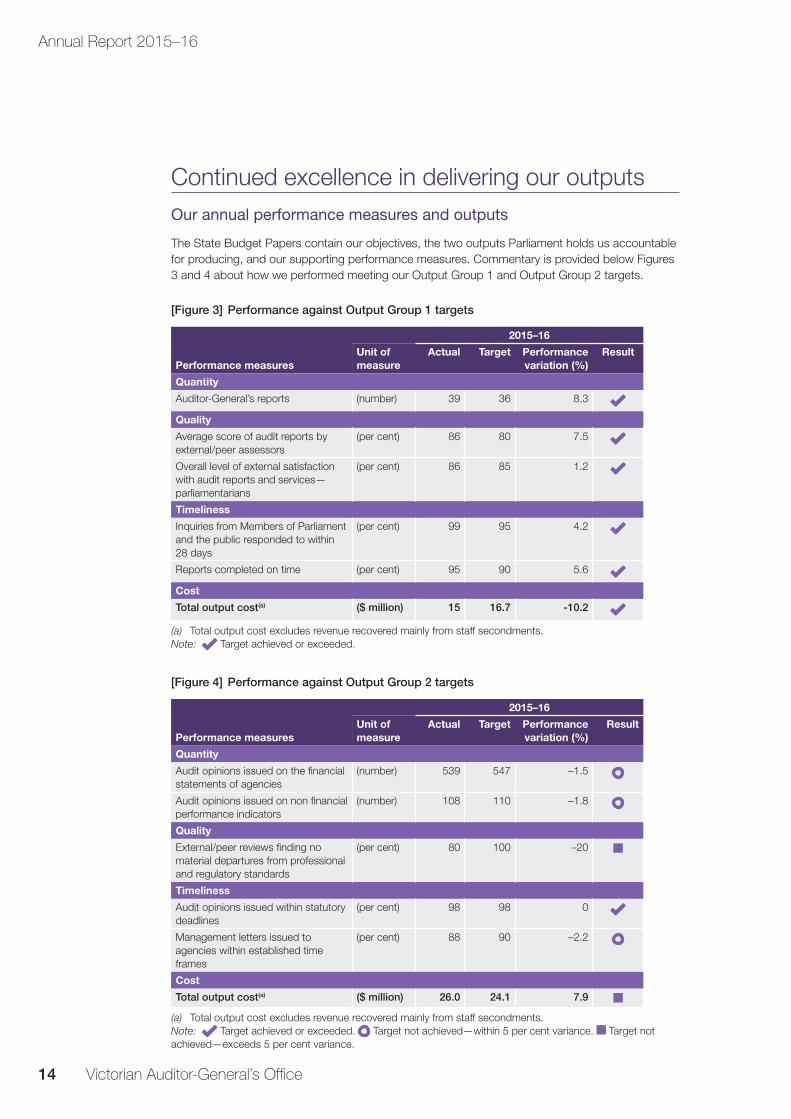
The State Budget Papers contain our objectives, the two outputs Parliament holds us accountable for producing, and our supporting performance measures. Commentary is provided below Figures 3 and 4 about how we performed meeting our Output Group 1 and Output Group 2 targets.
[Figure 3] Performance against Output Group 1 targets
Performance measures
2015–16
Unit of measure
Actual Target Performance variation (%)
Result
Quantity
Auditor-General’s reports (number) 39 36 8.3
Quality
Average score of audit reports by external/peer assessors
(per cent) 86 80 7.5
Overall level of external satisfaction with audit reports and services—parliamentarians
(per cent) 86 85 1.2
Timeliness
Inquiries from Members of Parliament and the public responded to within 28 days
(per cent) 99 95 4.2
Reports completed on time (per cent) 95 90 5.6
Cost
Total output cost(a) ($ million) 15 16.7 -10.2
(a) Total output cost excludes revenue recovered mainly from staff secondments.Note: Target achieved or exceeded.
[Figure 4] Performance against Output Group 2 targets
Performance measures
2015–16
Unit of measure
Actual Target Performance variation (%)
Result
Quantity
Audit opinions issued on the financial statements of agencies
(number) 539 547 –1.5
Audit opinions issued on non financial performance indicators
(number) 108 110 –1.8
Quality
External/peer reviews finding no material departures from professional and regulatory standards
(per cent) 80 100 –20
Timeliness
Audit opinions issued within statutory deadlines
(per cent) 98 98 0
Management letters issued to agencies within established time frames
(per cent) 88 90 –2.2
Cost
Total output cost(a) ($ million) 26.0 24.1 7.9
(a) Total output cost excludes revenue recovered mainly from staff secondments.Note: Target achieved or exceeded. Target not achieved—within 5 per cent variance. Target not achieved—exceeds 5 per cent variance.

15
Snapshot of our year
Output Group 1: Parliamentary reports and servicesOur Output Group 1 targets primarily relate to the reports we table in Parliament on the results of our financial and performance audits. The Auditor-General’s parliamentary reports include:• all performance audit reports • sector reports on the results of financial audits• a report on the Annual Financial Report of the State of Victoria • our Annual Plan• our Annual Report.
Output Group 1—Quantity
We tabled 39 reports, exceeding our target of 36. This result consists of 29 performance audit reports, eight Financial Audit reports, and two accountability products (our Annual Plan and Annual Report).
Output Group 1—Quality
Average score of audit reports
Our reports are independently assessed against criteria set by the Australasian Council of Auditors-General. In 2015–16, eight reports—six performance reports and two financial audit reports—received an average score of 86 per cent, which exceeded our target of 80 per cent.
Overall level of satisfaction
Every year, we survey parliamentarians to find out how satisfied they are with our reports and services. In 2015–16, 37 per cent of parliamentarians responded to our survey (47 out of 127). Of those responding, 86 per cent indicated that overall, they were satisfied or very satisfied with our reports and services. This exceeds our target of 85 per cent.
Output Group 1—Timeliness
Reports completed on time
In 2015–16, we tabled 95 per cent of our reports within one month of the planned date. These results show that we continue to exceed our target in this area.
Responses to inquiries
In 2015–16, we responded to 99 per cent of inquiries within 28 days, exceeding our target of 95 per cent. This is especially notable because of the 10 per cent increase in inquiries during the year. The inquiries consisted of letters, email messages, telephone calls and online correspondence from various groups, including the general public. Key issues of concern were:• transport infrastructure projects• bullying in the health sector
• private residential building issues• local government matters.
Output Group 1—Cost
In 2015–16, our budget for the delivery of Output Group 1 Parliamentary reports and services was $16.7 million. We delivered all parliamentary reports within this budget, at a cost of $15 million. Delays filling vacancies arising throughout the year meant we spent $1.7 million less than budgeted.
The cost of individual parliamentary reports—performance audit, financial audit, and accountability products—ranged from $102 553 to $618 390. The average cost of a performance audit parliamentary report was $364 870, a decrease of around $40 000 from the average cost of performance audit reports in the previous year. This significant decrease is because we published relatively more follow-up audit reports, which cost less than other reports.
In 2015–16, the average cost of a financial audit parliamentary report was $168 490, a decrease of around $12 500 from the average cost of financial audit reports produced in 2014–15.

16 Victorian Auditor-General’s Office
Annual Report 2015–16
Output Group 2: Audit reports on financial statementsOur Output Group 2 targets primarily relate to our audits of agency financial reports. In addition to audit opinions, we also issue interim and final management letters to advise agencies of issues raised in our audits. The Auditor-General’s reports on financial statements include:• an audit opinion on the Annual Financial Report of the State of Victoria • a review of the estimated financial statements of the State of Victoria• audit opinions issued on agencies’ financial statements• audit opinions issued on agencies’ non-financial performance statements.
Output Group 2—Quantity
In 2015–16, we issued 539 audited opinions on the financial statements of agencies, and 108 audit opinions on non-financial performance indicators. These results are satisfactory, because they fall within the acceptable variation range (5 per cent of target), and are affected by factors beyond our control—such as machinery-of-government changes, which in turn affect the number of agency financial statements and performance statements we receive each year.
Output Group 2—Quality
In 2015–16, 10 financial audit engagements were subject to a post-audit quality review. Two instances of material departures from Australian Auditing Standards were identified, meaning that we did not meet our target of 100 per cent. The variance is a result of our peer/external review processes, which identified material departures from Australian Auditing Standards for two out of 10 audit engagements. Although all audit engagements reviewed in 2015–16 had sufficient appropriate evidence to support the audit opinion, we will perform a root cause analysis of the review outcomes that resulted in these material departures to identify and implement appropriate remediation.
Output Group 2—Timeliness
Audit opinions issued within statutory deadlines
In 2015–16, we issued 98 per cent of our audit opinions within the statutory deadline of four weeks of receipt of agency financial statements. This meets our target (98 per cent) and continues our record of achieving excellence in this area.
Management letters issued within established time frames
We issued 88 per cent of our final management letters in 2015–16 within the established time frames, just short of meeting our target of 90 per cent. This is a marginal reduction in performance compared with 2014–15 (91 per cent), but well within our acceptable variation range (within 5 per cent), and resulted from delays in clients preparing financial reports, several contentious and complex matters encountered during the financial reporting cycle, and audit opinion qualifications.
Output Group 2—Cost
In 2015–16, our budget for delivering Output Group 2 was $24.1 million. We delivered all products in Output Group 2 for $26.0 million (7.9 per cent more than our budget). The additional expenditure was largely a result of increased salary and audit service provider (ASP) costs.
The cost of individual financial audits ranged from $1 250 to $850 000, and the average cost of financial audits was $43 785, a marginal increase (2 per cent) on the average cost of financial audits in 2014–15. The Audit Act 1994 requires the Auditor-General to charge agencies an amount which is sufficient to defray the reasonable costs and expenses of a financial audit. The estimated cost is determined based on the expected level and range of resources to be used, commensurate with the audit risks and complexity of the audit. We carried out fewer audits in 2015–16 than in 2014–15, which contributed to the increase in the average cost of audits. The change in the number of audits arises from factors beyond our control.

17
Snapshot of our year
Chief Financial Officer highlightsIn 2015–16, we:• received $41.4 million in funding from external sources ($39.7 million in 2014–15)• increased revenue by 4 per cent from inflation-indexed general appropriation and increases in
internally generated Section 29 revenue resulting from increases in the recovery of ASP costs• increased expenditure by 5 per cent mainly as a result of increased ASP fees and staff salaries • improved our net assets by $83 000 from the resultant operating surplus—our financial position
remained strong, through increases in financial assets offset by reductions in non-financial assets
• engaged 27 ASPs (24 in 2014–15)• employed 199 in-house staff at 30 June 2016 (184 at 30 June 2015).
[Figure 5] Financial summary 2015–16 and previous four years
Item2015–16
($’000)2014–15
($’000)2013–14
($’000)2012–13
($’000)2011–12
($’000)
Percentage change
2014–15 to 2015–16
Total revenue 41 383 39 698 38 954 38 654 37 120 4
Total expenses 41 300 39 161 38 994 37 197 36 542 5
Surplus/deficit 83 537 (40) 1 457 578 –85
Financial assets 16 962 15 019 13 965 12 930 10 755 13
Non-financial assets 1 386 1 803 2 326 2 518 2 690 –23
Total assets 18 348 16 822 16 291 15 448 13 445 9
Total liabilities 9 654 8 211 8 217 7 333 6 787 18
Net assets 8 694 8 611 8 074 8 115 6 658 1

18 Victorian Auditor-General’s Office
Annual Report 2015–16
2 Our impactRelevant strategic objectives
Reports and advice Being authoritative and relevant
Parliament Being highly regarded by Parliament
Audit clients Fostering productive relationships with audit clients
Beyond providing assurance to Parliament, we aim to be a catalyst for change in the public sector, in line with our vision in our Strategic Plan. Our findings and recommendations can often facilitate improvements in audited agencies, and the public sector more broadly.
Specifically, we bring value to the public sector in several ways, such as by influencing proposed amendments to policies or processes, legislative changes or how government resources are allocated. In 2015–16, we continued to observe tangible impacts of our work within the Victorian community.
Technological improvements
• new ICT Digital Dashboard introduced by the Department of Premier & Cabinet
• government investment in an electronic traceability system for livestock
• development and implementation of a new wood supply modelling system by VicForests
• better traffic modelling by VicRoads, resulting in smoother traffic flows on 23 major Melbourne roads
Government policy, standards and legislative inputs
Legislative changes arising from audits• Transparency in Government Bill 2015• Children Legislation Amendment Bill 2016• Gambling Legislation Amendment Act 2015
Strengthening accountability frameworks in Victoria: submissions to reviews and consultations• Integrity and Accountability Legislation Amendment
(A Stronger System) Act 2016• Standing Directions of the Minister for Finance 2016• Governance principles for boards of public sector
agencies in Australia (Governance Institute of Australia)
• Victorian Protective Data Security Standards (Commissioner for Privacy and Data Protection)
• Vocational Education and Training Funding Review (Minister for Training and Skills)
• submissions to five parliamentary committee inquiries
• Parliament using more of our reports (285 Hansard references in 2015–16, compared to 263 in 2014–15)

19
Our impact
Resources allocated
• $25.6 million to livestock and horticulture industries• $22 million to catchment management authorities• $20 million to support and manage occupational
health and safety (OH&S) issues• more than $53 million for family support services• $168 million to the Roadmap for Reform package
for vulnerable children and families
Governance and oversight
• pilot programs to target OH&S, planned work inspections and greater public sector collaboration on OH&S
• greater focus on bullying and harassment• dedicated flying squads to assess, educate and
support organisations• increased agency accountability and performance
monitoring• audit of organisational participation in workforce surveys• establishing advisory committees to drive improvements• establishing new services (a Domestic Building
Resolution Service) and the centralising of regulatory powers with the Victorian Building Authority
• increased control and oversight of training provided by gaming authorities in relation to responsible gambling
• working group established for the independent review of the Caulfield Racecourse Reserve Trust which will implement our 2014 audit report recommendations
• consistent style and structure of our reports referenced as examples of best practice reporting by the Institute of Public Administration Australia
• commitment by the Department of Education & Training to review and strengthen its funding agreements for all state government grants, and to develop a targeted risk-based audit program by the end of 2016
• a new reform project, Roadmap for Reform (for vulnerable children and families), to shape long-term support services system for vulnerable children and families
• the conduct of self-assessments by some agencies, such as the Phillip Island Nature Park, against the issues identified in our Key Audit Themes
Top five audit reports most covered by media
• East West Link Project (December 2015)
• Realising the Benefits of Smart Meters (September 2015)
• Unconventional Gas: Managing Risks and Impacts (August 2015)
• Hospital Performance: Length of Stay (February 2016)
• Follow up of Managing Major Projects (August 2015)
Our impact achievements
at a glance

20 Victorian Auditor-General’s Office
Annual Report 2015–16
Our internal count of the number of recommendations accepted by agencies is based on agencies’ formal submissions to our reports.
Our Performance Audit business unit made 145 recommendations in 2015–16, of which 139 were accepted (96 per cent). Our Financial Audit business unit made 44 recommendations, of which 43 were accepted (98 per cent). At an aggregate level, our total recommendation acceptance rate is 96 per cent. A similar acceptance rate in 2014–15 (96 per cent) is indicative of the influence our recommendations have in acting as a catalyst for change throughout the public sector.
Case studiesTechnological improvements
New Information and Communications Technology Digital Dashboard delivering transparency
Following our April 2015 audit report Digital Dashboard: Status Review of ICT Projects and Initiatives, the Department of Premier & Cabinet’s Enterprise Solutions team released its first ICT Digital Dashboard to track the cost of government ICT projects with values of more than $1 million. It is anticipated that this increase in reporting transparency will bolster the delivery of public ICT systems going forward.
Improved traffic flows on major roads
Traffic is flowing more smoothly on 23 major Melbourne roads after VicRoads tweaked the traffic light sequences at hundreds of intersections, following our June 2014 report Using ICT to Improve Traffic Management. Major traffic routes where peak-hour travel times have been cut in recent months include Dandenong Road, Ringwood Bypass, Nepean Highway, Blackburn Road, Burke Road, Toorak Road and Springvale Road.
The changes, at 660 sets of lights, were part of a push by VicRoads to make better use of technology in traffic management after our audit found that the authority was doing too little to tackle growing congestion on arterial roads. VicRoads accepted our recommendation to review traffic signals more regularly, with a focus on roads that also function as important tram and bus routes.
Acceptance of recommendations
189 145 44recommendations
made
96% accepted
Performance Audit recommendations made
96% accepted
Financial Audit recommendations made
98% accepted

21
Our impact
Other notable gains to the public as a result of actions undertaken by VicRoads included:• peak-hour queues being cut in half on the Ringwood Bypass, from one kilometre to 500 metres,
saving four minutes in the morning and six minutes in the evening, by modifying just three sets of lights
• a seven-minute reduction in travel times in the morning along the Police Road/Centre Road arterial route between EastLink and the Nepean Highway, and five minutes in the evening
• on Plenty Road in Mill Park, a crucial link for Melbourne’s booming northern suburbs, peak-hour journeys have improved 20 per cent in each direction between McKimmies Road and The Lakes Boulevard.
Governance and oversight
Tackling bullying and harassment to improve workplace culture
Our March 2016 report Bullying and Harassment in the Health Sector exposed a culture of bullying and harassment throughout Victoria’s health system. Following the audit, the government developed a new strategy, Our pathway to change: Eliminating bullying and harassment in healthcare. As part of this new strategy, the government committed to:• establishing an independent anti-bullying flying squad to identify and crack down on health
services with poor workplace culture and elevated rates of bullying and harassment• delivering education and support to health service boards, leaders and the workforce to prevent
bullying and harassment as an occupational health and safety risk • holding health services to account for reducing the risk and incidence of bullying through
performance monitoring and, if necessary, ministerial direction • auditing the health workforce through sector-wide participation in the ‘People Matters Survey’ to
identify hot spots of bullying and harassment.
An advisory committee led by the former Victorian Equal Opportunity & Human Rights Commissioner and current chief executive of Oxfam Australia, Helen Szoke, will oversee how this strategy is put into effect. It will bring together hospitals, unions, colleges, Australian Medical Association Victoria, WorkSafe, the Victorian Public Sector Commission and other stakeholders to tackle the issues that we identified in our audit.
The Goulburn Valley Health chief executive Dale Fraser welcomed our report. At the time of its publication, Mr Fraser said: ‘We have considered [the Auditor-General’s] audit findings with the program that we have already established, and will use his recommendations to further enhance our approach.’ He added: ‘We applaud the work of the Auditor-General’s Office to bring focus on this most disturbing issue.’
The Minister for Health, the Hon Jill Hennessy, also confirmed that many parts of the health sector workforce were subsequently identifying significant cultural changes that need to take place within the health system to deal with bullying and harassment. In particular, the Minister ‘… perceived that there was a significant issue in the health system on this issue, and the Auditor-General confirmed that’.
Following the tabling of this report, we received many requests to present to hospitals and health services on the findings and recommendations from our audit.

22 Victorian Auditor-General’s Office
Annual Report 2015–16
Working to improve the management of the Caulfield Racecourse Reserve
A new bipartisan working group was established in March 2016 to conduct an independent review of the Caulfield Racecourse Reserve Trust, following our 2014 report Management and Oversight of the Caulfield Racecourse Reserve, which found that the reserve trustees had not managed the reserve effectively. The report also found that there had been insufficient attention given to use of the reserve for recreational pursuits and as a public park.
The working group, which reported to the Minister for Environment, Climate Change and Water, was established after calls from Caulfield State Liberal MP David Southwick, to find an ‘agreed way forward on a new governance model for the Caulfield Racecourse Reserve’. The group would work with key stakeholders to ‘establish a more robust accountable model’, and provide independent advice on the long-term management of the Caulfield Racecourse Reserve.
Having completed its report in late August 2016, the bipartisan working group found that the current trustee structure was ‘unworkable’, and suggested that the government request the resignations of the trustees and establish a new independent body to manage the reserve, in order to accelerate implementation of required actions.
This historic issue has been languishing for far too long and requires decisive action. We must ensure there is a balance between the needs of the racing community and local residents.
—The Hon Lily D’Ambrosio, Minister for Energy, Environment and Climate Change
Corrective actions at alpine agencies
Our Portfolio Departments and Associated Entities: Results of the 2013–14 Audits report identified the following issues at Lake Mountain and Mount Baw Baw alpine resorts:• lack of oversight of outsourcing arrangements• noncompliance with legislation• internal control environment deficiencies • lack of preparedness for financial year end.
The relevant agencies took prompt and specific action to remedy these issues following the tabling of our report. We carried out a follow-up audit of these issues as part of our 2014–15 financial audits and found significant improvements, indicative of management’s commitment to taking corrective action to resolve the issues we identified. In addition, the boards responsible for managing Lake Mountain and Mount Baw Baw were merged in April 2016 to improve governance at the two respective resorts.
Increasing consumer protection for building construction
Our May 2015 report Victoria’s Consumer Protection Framework for Building Construction assessed the effectiveness of the consumer protection framework for domestic building construction. Our audit also examined the performance of the Victorian Building Authority (VBA), the Building Practitioners Board, Consumer Affairs Victoria and the Victorian Managed Insurance Authority, as the work of these bodies is critical to regulating domestic building and protecting consumers.
Following the audit, the government announced in March 2016 that it was establishing the Domestic Building Resolution Service, and replacing the Building Practitioners Board with the VBA. The VBA will be given new powers to direct builders to fix work that does not comply with regulations or is defective. Furthermore, Parliament passed the Building Legislation Amendment (Consumer Protection) Act 2016, which improved registration standards and allowed the VBA to attach conditions to registration, restricting the scope of work that a builder can perform.
23
Our impact
The VAGO May 2015 report on Victoria’s Consumer Protection Framework for Building Construction has once again criticised the current system for providing inadequate protection to consumers. This bill responds to VAGO’s report, as well as earlier reports …
—The Hon Richard Wynne, Minister for Planning
The government would like to acknowledge that there are longstanding flaws in the Victorian building system, as particularly identified by the Victorian Auditor-General in May last year. We need to act now to protect consumers as we know that when things go wrong the system is failing the community.
—The Hon Philip Dalidakis, Minister for Small Business, Innovation and Trade
Addressing Occupational Violence
Our May 2015 report Occupational Violence Against Healthcare Workers contained a number of recommendations aimed at facilitating better and healthier workplaces.
Following the audit, the government committed to addressing occupational violence, particularly in the healthcare industry. The government has subsequently delivered specific initiatives, including:• funding 16 health services to pilot improved programs in their workplaces• evaluating all WorkSafe guidance on occupational violence• commissioning independent research to analyse all Victorian hospitals’ data on OHS incidents• carrying out research support to improve the Department of Health & Human Services’ risk
reporting• developing a 10-year Mental Health Strategy• establishing a dedicated health practice team in WorkSafe• developing a customised strategy for Ambulance Victoria.
In September 2015, health services also became eligible to apply for funding to reduce and prevent violence, as part of the allocation of $20 million to the Health Service Violence Prevention Fund, established by the government.
In addition, the government further committed to meeting all the state’s public health boards to discuss the health and safety of their organisations, and to consider additional strategies to mitigate key risks.
I was the lead facilitator at yesterday’s Corrections Victoria Occupational Violence summit, which was held at Melton. I sat in the audience and heard your [staff’s] presentation … [the] presentation was fantastic, [your staff] spoke really well and more than anything, [the] messages came across terrifically well. By far, the consensus of all of the people I spoke with was [VAGO’s] session was the stand out for them … congratulations, outstanding presentation, very impressive indeed.
—Paul Stevens, Manager Integrity Operations, Office of the Racing Integrity Commissioner
Increasing the transparency of the Environmental Contribution Levy
Our June 2014 report Administration and Effectiveness of the Environmental Contribution Levy found that the information published about the levy’s purpose, activities and outcomes was limited and, consequently, information about how the levy was used was not transparent.
Following this, the government developed a discussion paper that examined the effectiveness of environment contribution investments in waterway health. The Minister for Water, the Hon Lisa Neville, confirmed that ‘there were substantial improvements recommended in the transparency following this report’. The Minister also highlighted her confidence that: ‘we will be able to, at the end of this, have a water plan, an implementation plan, targets, budget measures against that and be able to report back to not just the Auditor-General but, most importantly, back to Victorians who are making the contribution.’

24 Victorian Auditor-General’s Office
Annual Report 2015–16
Government policy, standards and legislative inputs
Holding agencies to account—Transparency in Government Bill 2015
Our March 2015 report Emergency Service Response Times assessed the accountability of emergency service organisations, the Department of Health & Human Services, and the Department of Justice & Regulation for their response time performance. We found that while response time performance had largely been stable throughout the last three years, multiple problems with emergency response time measures, targets and data prevented Parliament and the public from holding agencies fully to account.
Following our report, the government developed the Transparency in Government Bill 2015 (the Bill) which was presented to Parliament in April 2016. The Bill establishes a framework for the release of response times and performance data, by requiring the response times of ambulances and fire services in each local government area for prescribed emergency incidents to be published every three months.
What this bill attempts to do is address the need to improve the public reporting of emergency services response times, as outlined in the 2015 Victorian Auditor-General’s Office Emergency Service Response Times report. The Victorian Auditor-General’s Office noted that there is limited public reporting of the actual number of minutes it takes to respond to urgent calls to the public and that a focus on only reporting high-level state-wide data means that there is little understanding of how performance varies across Victoria. VAGO identified a need to report on response times in a way that government, Parliament and the public can understand, rely on and use.
—Frank McGuire, Member for Broadmeadows
Responding to the needs of vulnerable children and families—Children Legislation Amendment Bill 2016
Our March 2014 report Residential Care Services for Children found that the residential care system had insufficient capacity and capability to respond to the demand and growing complexity of children’s needs. We also found that current staffing models did not provide sufficient quality and stability of care for children.
Following our May 2015 report Early Intervention Services for Vulnerable Children and Families, the government confirmed its commitment to improve services for vulnerable children and families, announcing a package of new measures that included:• in-home support services for vulnerable families• extra child protection workers• more culturally sensitive support for Aboriginal children• increasing the number of foster and kinship carers.
In its 2016–17 Budget, the government allocated an additional $168 million to the Roadmap for Reform package for vulnerable children and families. Also, the Children Legislation Amendment Bill 2016 was introduced to Parliament in March 2016.
Our 2016 follow-up audit Residential Care Services for Children found that the Department of Health & Human Services had initiated adequate action to address all of the recommendations and underlying issues in our 2014 report. Actions implemented to date have had a positive impact on reducing the number of children in residential care and have improved how the respective department oversees the performance of its service providers.

25
Our impact
Resources allocated
Strengthening our biosecurity
The government announced an investment of $25.6 million into the livestock and horticulture industries as part of its 2016–17 Budget, following our August 2015 report Biosecurity: Livestock, which found that Victoria’s ability to respond to a livestock disease outbreak had been weakened by a decline in financial and staff resourcing for core biosecurity functions. The government also committed to acting on our recommendation to introduce a new electronic traceability system for sheep and goats, which will improve the traceability of livestock.
The Minister for Agriculture, the Hon Jaala Pulford further confirmed that we had exposed our industries to unacceptable risk, and that ‘it has been a real priority for me to rebuild that capability, and we will need to continue to work to this end’.
In addition, our report informed a review by Australian agricultural ministers of the national biosecurity system, and underpinning Intergovernmental Agreement on Biosecurity. Representatives from our office were invited to discuss with the review panel the findings of our report, and the biosecurity challenges and opportunities the national review might address.
Increasing the effectiveness of our catchment management authorities
Our September 2014 report Effectiveness of Catchment Management Authorities found that catchment management authorities faced significant and escalating challenges if they were to maintain and enhance long-term land productivity, while also conserving the environment. The report also found that while existing catchment management approaches were delivering some gains, they were inadequate to meet these challenges.
Following the report, the government launched the first statewide strategy for integrated catchment management—Our Catchments, Our Communities (the Strategy). The Strategy confirms the government’s commitment to managing our catchments to benefit our environment, and focuses on the management of the state’s natural resources by ensuring catchment management partners work better together.
The Minister for Water, the Hon Lisa Neville highlighted that the Strategy will ‘set that vision and framework for how [catchment management authorities] will work again in each community, backed up by the $22 million in the Budget to help implement the recommendations out of VAGO’.
Improving the condition of our regional and rural schools
Our February 2013 report Implementation of School Infrastructure Programs found that more than 5 000 individual school buildings were below the Department of Education & Training’s accepted standard, requiring further investment to address this issue.
Following the report, the government confirmed that a key focus of its 2016–17 Budget was addressing the condition of secondary schools in rural and regional Victoria. In particular, the Minister for Education, the Hon James Merlino, highlighted that he was ‘particularly proud to be able to deliver the funding for those 20 specialist schools’. He added: ‘They are in the poorest condition. That was a result of an audit back in 2012’.

26 Victorian Auditor-General’s Office
Annual Report 2015–16
Further influence
Helping students with disabilities
The government commissioned an internal review of its Program For Students With Disabilities (the program) in July 2015, following our reports Program for Students with Special Learning Needs, Additional School Costs for Families, and Education Transitions, tabled in August 2012, February 2015 and March 2015 respectively.
The review, which was led by the Department of Education & Training, focused on the transition from primary to secondary school and the specific needs of students with autism and dyslexia. The review aimed to assess the effectiveness of the program, including ensuring that support and resourcing was sustainable, and that the program delivered improved learning and wellbeing outcomes for children and young people with disabilities.
The review was the most comprehensive undertaken since the program’s inception, and delivered 20 key findings and 25 recommendations to help the government realise its vision of inclusive education for all students. Following this, the government announced an additional $22 million in funding for this area in April 2016.
Our Key Audit Themes—providing value to agencies
Appendix one summarises common findings from our audit reports. We encourage Victorian public sector agencies to self-assess their performance, systems and operations against the common challenges identified.
Phillip Island Nature Parks is one agency that completed a self-assessment against the common challenges identified in our Key Audit Themes 2014–15. The agency confirmed that it did not find any gaps in its performance, systems or operations following the assessment.
Improving the accessibility and communication of reports
We continually review and update our website to make our reports and services more accessible.
In 2015–16, we continued to publish media releases for all parliamentary reports and recorded short presentations that outline the key findings, conclusions and recommendations of each report. We also updated the form of these presentations to allow people to more easily understand and engage with the key findings of our audits.
Looking forwardEvery year, we hope to broaden the impact of our work. In 2016–17, we will continue to engage with our stakeholders through events, one-on-one meetings and briefings.
We will continue to work to strengthen Victoria’s accountability framework, by contributing to parliamentary and government reviews of legislation, policies and standards.
We will build on the success of our online recorded presentations, by introducing a new content management system to make our website more functional, usable and accessible.
We will aim to increase the number of face-to-face presentations about the findings of our reports, so that we distribute the key messages more broadly.

27
Our people
3 Our peopleRelevant strategic objectives
People Fostering a stimulating working environment
Organisation Leverage our systems and processes to improve our organisational performance
Our people are key to the success of our organisation. We value them and seek to provide rigorous performance planning and management, challenging work, developmental opportunities, flexible work arrangements and a close-knit, collaborative culture. We remain committed to providing a safe and healthy workplace.
Here is an overview of our achievements, challenges and future steps for our office.
Challenges in the year ahead
• We reported seven injuries but no critical incidents under our OH&S policy. Although this is a reduction on the previous year's result of eight injuries, there is still scope for improvement (page 33).
• We recorded two lost time claims as a result of OH&S incidents (page 33).
Next steps
• We will deliver a cohesive and comprehensive learning and development program for our office (page 40).
• We will review our internal communications processes and improve our communication and consultation practices (page 40).
• We will continue to be actively involved in the national and international development of public sector audit, especially through our participation in ACAG and PASAI (page 40).
Achievements
• Our staff continued to demonstrate their resilience while delivering quality outcomes, despite turnover and delays in filling vacancies (page 36).
• Our staff are highly qualified, with 82 per cent having at least a bachelor’s degree and 29 per cent having a master’s degree (page 30).
• Our Leadership Development Program continues to develop our people into leaders who are strategic thinkers, with adaptable, responsive and resilient mindsets (page 31).
• We continue to support lifelong learning and development through our generous Study Assistance Program (page 31).
• Our staff provided positive feedback about their work/life balance and physical work environment (page 28).
• We developed a series of initiatives to improve our office’s internal working culture (page 28).
• We improved our performance development plan process to ensure that management and staff clearly understand performance expectations (page 31).
• We were actively involved in the national and international development of public sector audit through our contributions to the Australasian Council of Auditors‑General (ACAG) and the Pacific Association of Supreme Audit Institutions (PASAI) and the hosting of auditors on secondment from Papua New Guinea (pages 37–38).
• Our Staff Consultation Committee played a more prominent role in activities that influenced the culture of our office (page 35).

28 Victorian Auditor-General’s Office
Annual Report 2015–16
Our staff are key to our successCulture Program
The wellbeing of our staff is crucial. We believe in the importance of building and maintaining a positive workplace culture that effectively and decisively deals with the full range of inappropriate behaviours, including bullying and harassment. Following an investigation and release of a Parliamentary report into a bullying and harassment incident within our office in early 2015–16, the former Auditor-General resigned. We undertook a staff survey in December 2015, which had a response rate of 72 per cent. Our staff provided positive feedback about their work/life balance and physical work environment. Many staff members commented on the flexibility in their work arrangements and the capacity to manage ‘work around life’. The results from the survey identified workplace culture as a key issue, and identified five key priority areas in consultation with staff at a number of meetings. These priority areas are the focus of our Culture Program.
Leadership This encompasses the Leadership Group and other leaders within the office building individual and team capability to deliver the organisation’s vision and the concept of ‘one office’. This includes better communication and knowledge-sharing.
In 2015–16, we reviewed our approval processes and delegations, and made recommendations to reduce internal red tape.
Behaviours and values
This includes redefining our approaches to inappropriate behaviour, agreeing and modelling the behaviour we want to see at our Office (and how our values support this), and reviewing how we recognise our staff.
In 2015–16, we engaged the Australian Human Resource Institute to train all our staff to recognise and work to eliminate bullying and harassment.
Practice management
This includes a focus on strategic, resource and budget planning, and delivering timely corporate activities.
In 2015–16, we rolled out our revised Performance Audit methodology, which included system updates and training.
People management and development
This includes reviewing our learning and development processes, and delivering a cohesive and comprehensive program that fulfils the collective and separate needs of our business units.
In 2015–16, we established a Learning and Development working group.
Organisational cohesion
This includes developing behaviours and processes that foster cross-collaboration and reducing a ‘silo’ mentality within the office.
In 2015–16, we reviewed our grievance policy and processes, and revised policies to provide greater clarity about methods of informal dispute resolution and interconnections between related policies.

29
Our people
In 2016–17, activities aimed at improving culture will be continued, including:• establishing and providing management and leadership training and coaching• consolidating our Learning and Development activities into a comprehensive and cohesive program• reviewing our internal communications processes, and improving how we communicate and
consult.
Staff profile
At 30 June 2016, we had 199 staff, with 178 ongoing staff—about 168 full-time equivalents (FTE) and 21 fixed-term or casual staff. Figure 6 shows how many employees we had at 30 June 2016. Appendix three (see page 144) contains more information about our staff numbers.
[Figure 6] Headcount at 30 June 2016
176
179
185
184 19
9
162
161
168
163
178
14 18 17 21 21
0
50
100
150
200
250
June2012
June2013
June2014
June2015
June2016
Employees
Total Ongoing Fixed-term or casual
Note: Staff on leave without pay or absent on secondment, external contractors/consultants, and temporary staff employed by employment agencies are excluded.
As shown in Figure 7, our office is evenly balanced in relation to the age and gender of staff. Our recruitment strategy is based on merit, and we have a diverse mix of employees who come from a wide range of backgrounds, experiences and cultures.
[Figure 7] Age and gender pyramid, snapshot of staff at 30 June 2016
40 30 20 10 0 10 20 30 40
Under 25
25 to 34
35 to 44
45 to 54
55 to 64
Over 65
Per cent
Age
% male (2015–16) % female (2015–16)
30 Victorian Auditor-General’s Office
Annual Report 2015–16
Staff qualifications, development and training
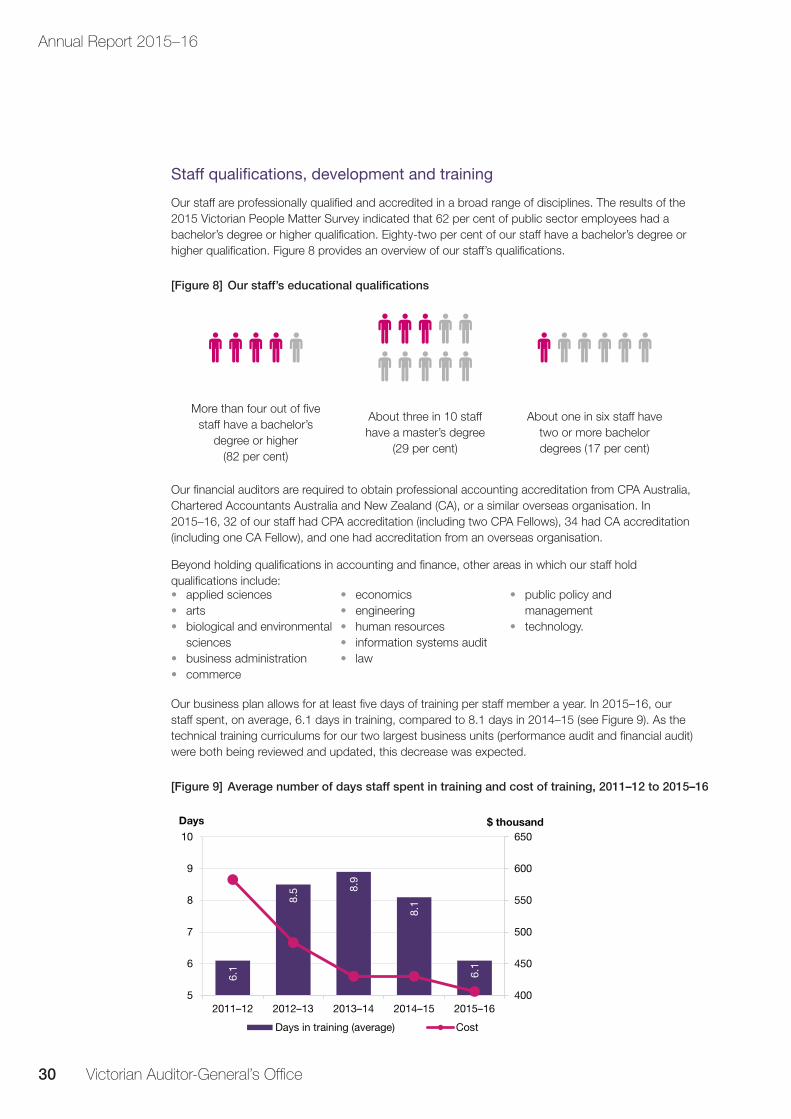
Our staff are professionally qualified and accredited in a broad range of disciplines. The results of the 2015 Victorian People Matter Survey indicated that 62 per cent of public sector employees had a bachelor’s degree or higher qualification. Eighty-two per cent of our staff have a bachelor’s degree or higher qualification. Figure 8 provides an overview of our staff’s qualifications.
[Figure 8] Our staff’s educational qualifications
More than four out of five staff have a bachelor’s
degree or higher (82 per cent)
About three in 10 staff have a master’s degree
(29 per cent)
About one in six staff have two or more bachelor degrees (17 per cent)
Our financial auditors are required to obtain professional accounting accreditation from CPA Australia, Chartered Accountants Australia and New Zealand (CA), or a similar overseas organisation. In 2015–16, 32 of our staff had CPA accreditation (including two CPA Fellows), 34 had CA accreditation (including one CA Fellow), and one had accreditation from an overseas organisation.
Beyond holding qualifications in accounting and finance, other areas in which our staff hold qualifications include:• applied sciences• arts• biological and environmental
sciences• business administration• commerce
• economics• engineering• human resources• information systems audit• law
• public policy and management
• technology.
Our business plan allows for at least five days of training per staff member a year. In 2015–16, our staff spent, on average, 6.1 days in training, compared to 8.1 days in 2014–15 (see Figure 9). As the technical training curriculums for our two largest business units (performance audit and financial audit) were both being reviewed and updated, this decrease was expected.
[Figure 9] Average number of days staff spent in training and cost of training, 2011–12 to 2015–16
6.1
8.5 8.
9
8.1
6.1
400
450
500
550
600
650
5
6
7
8
9
10
2011–12 2012–13 2013–14 2014–15 2015–16
$ thousandDays
Days in training (average) Cost

31
Our people
In 2015–16, we set up a Learning and Development Working Group as part of our wider objective to deliver a cohesive and comprehensive Learning and Development program for our office, and in response to feedback from our staff survey. The working group is responsible for developing, delivering and maintaining a cohesive and comprehensive learning and development program and associated frameworks.
Performance planning cycle
In the 2015–16 performance review cycle, improvements were made to the performance development plan process to ensure that management and staff clearly understand performance expectations.
To support this change, we revised position descriptions, in consultation with staff, to establish the key responsibilities and Careers@VAGO capability profile for each role. The position descriptions then formed the basis of the objectives and measures aligned to business unit plans that employees set in their performance development plans.
Careers@VAGO Leadership Development Program
The Careers@VAGO Leadership Development Program aims to develop our people into leaders who are strategic thinkers, with adaptable, responsive and resilient mindsets. We expect our leaders to be able to coach, mentor and train staff, and build flexible, collegial teams. Our Leadership Development Program is based on four key leadership dimensions—strategic thinking, execution of goals, proficiency, and integrity—and has been developed with on-the-job learning principles in mind.
In 2015–16, 15 emerging leaders from our office participated in a 360-degree feedback process. This process informed the development of tailored learning and development plans for participants. As our first cohort complete their plans throughout 2016–17, we will review this program as part of our wider objective to deliver a cohesive and comprehensive Learning and Development program for our office.
I am currently participating in VAGO’s first Leadership Development Program and I’m finding the experience to be expanding my horizons. While it is still early days, I have undertaken the 360-degree feedback for the first time in my life, and this gave me a clear sense of my strengths and areas for development. I have also attended a fantastic training session on self-confidence for women, which was an eye-opener, and challenged my own beliefs and assumptions. I have many elements to achieve as part of my bespoke Learning and Development plan, and I’m finding that each element is a piece in the puzzle which is enabling me to develop my leadership skills further than I had thought possible.
—Stephanie Briskin, Manager, Policy and Legislation
Professional qualifications
Our office supports lifelong learning and development through our Study Assistance Program, which reimburses study fees and provides study and examination leave.
Study assistance
In 2015–16, 34 staff members accessed study assistance. Of those, 19 utilised both study leave and financial help, and 21 were continuing their CPA or CA studies. Staff members also studied for other qualifications, including a Master of Science (Applied Statistics), Master of Social Policy, Master of Public Policy and Management, Master of Commerce, Master of Business Administration, Graduate Diploma of Government Law, Graduate Diploma of Applied Corporate Governance and Diploma of Business.
32 Victorian Auditor-General’s Office
Annual Report 2015–16
I have been undertaking a Masters in Commerce (Human Resource Management) at Swinburne University since 2014. My study has provided me with the opportunity to enhance my intellectual capability, and my theoretical and practical knowledge of the Human Resource field. Having completed 11 of 12 subjects that relate to human resource management, organisational behaviour, leadership and change, people development and employee relations, study leave has allowed me to prepare and attend assessments, and will assist me to complete my Masters in October 2016.
—Kitty Gordon, People and Culture Officer
Secondments
Internal
Where appropriate, we encourage our staff to undertake secondments to other business units within the office, to broaden their professional experience and organisational knowledge. In 2015–16, nine staff members undertook internal secondments.
In January 2016 I commenced a 12-month secondment to the Standards and Quality team. As part of my secondment, I have gained exposure to a number of opportunities which have included connecting with other audit offices, attending round table discussions arranged by standard setting boards, developing training materials, and providing training on our financial audit methodology to staff and contractors commencing with our office.
This secondment has also provided me with the opportunity to develop relationships with members of other teams that I had not previously worked with and to gain a greater understanding of the roles and functions of the different business units of the office. In addition, I have worked on a range of projects and provided advice in relation to financial auditing, giving me the chance to look at a wide range of auditing issues which has significantly contributed to my own professional development.
—Jessica Cross, Secondee from the Financial Audit team to the Standards and Quality team
External
In 2015–16, four staff members were seconded to external organisations—one each to:• the Department of Health & Human Services• the Department of Economic Development, Jobs, Transport & Resources• the Office of the Commissioner for Privacy & Data Protection• VicRoads.
We support our staff members taking these opportunities to broaden their professional experience and expand their skillsets, which will be invaluable to the office when they return.
Merit and equity
We reviewed our policies and procedures to better support the organisational commitment we made in 2015–16, to make our workplace free from discrimination, harassment and bullying. This work has tied in closely with our other culture improvement projects, including updates to our:• Dispute Resolution and Grievance Policy • Appropriate Behaviour Policy • Allegations of Misconduct Policy.
We also abide by the Victorian Charter of Human Rights and the Code of Conduct for Victorian Public Sector Employees of Special Bodies.

33
Our people
Occupational health and safety
Our office places an emphasis on individual health. In 2015–16, we continued our efforts to strategically identify and manage hazards to psychological health. We have an OH&S policy and a range of supporting policies, as well as a workplace injury or illness guideline that aims to ensure that all our staff remain safe and healthy at work. In 2015–16, we carried out a WorkSafe review of our OH&S policy.
In October 2015, our office further supported a ‘mental health month’, a month-long program of activities and events aimed at raising awareness, encouraging discussion, and promoting positive mental health among staff in the workplace.
We also partnered with an external risk management consultancy to provide strategic advice and guidance regarding work-related injury and illness, and managing the return to work of staff members on extended leave.
With greater focus on OH&S and recognising its importance within our office, OH&S matters were added as a standing item to business unit meeting agendas.
Currently, we are only able to compare OH&S data for four years because of changes in operations and systems. In 2015–16, seven OH&S incidents were reported (one less than in 2014–15), an incident rate of 3.3 per 100 FTE. In the past three years, the number of reported incidents has remained stable.
In 2015–16, two standard WorkCover claims were lodged, as shown in Figure 10.
[Figure 10] WorkCover claims, 2012–13 to 2015–16
Claims and rate 2012–13 2013–14 2014–15 2015–16
No. of standard claims(a) 0(b) 0 3 2
Rate per 100 FTE 0.0 0.0 1.3 1.0
(a) Data from the Victorian WorkCover Authority (VWA). Standardised claims are those that have exceeded the employer excess or are registered as a standard claim and are open, with no payments at the time of extraction.
(b) The 2012–13 data has been revised to report accurate figures in line with VWA data. Previously, we had reported two claims for 2012–13, but these claims were not standardised claims.
In 2015–16, we recorded two lost time claims. As shown in Figure 11, the average cost of claims was $211 807.
[Figure 11] Lost time and average cost of claims, 2012–13 to 2015–16
Lost time and cost 2012–13 2013–14 2014–15 2015–16
Number of lost time claims(a) 0 0 3 2
Average cost of claims $0(c) $0 $43 343(c) $211 807(b)
(a) All data from VWA. A lost time claim is a standardised claim one with one or more days compensated by the VWA (after employer excess) at the time of the extraction. Previously, VAGO reported the number of actual lost time days. Now we report the number of lost time claims to ensure the privacy of claimants.
(b) Based on claims reported between 1 July 2015 and 30 June 2016. Claims include employer and VWA payments to date plus an estimate of outstanding claims costs (further costs as calculated by the VWA’s statistical case estimate model).
(c) This historical data has been replaced with correct costings as supplied by VWA. Previously, VAGO made claims cost calculations using internal payment data, which did not include all claims costs paid.

34 Victorian Auditor-General’s Office
Annual Report 2015–16
Occupational Health and Safety Committee
The OH&S Committee is a consultative group made up of trained Health and Safety Representatives, a Human Resources representative, and a Leadership Group representative.
The committee provides a forum at which management and employees can identify, discuss and resolve health and safety issues. The committee also provides guidance and OH&S-related recommendations to our Operations Committee and Leadership Group, to assist in the facilitation of a safe working environment.
During 2015–16, the committee:• organised workplace inspections of the whole office to identify hazards and agree on solutions
going forward• prepared educative material to reinforce the ‘safe working’ message and ensured that it was
provided and accessible to staff members• promoted mental health month to all staff through an education and awareness campaign• organised free flu vaccinations for staff• considered the nature of injuries that took place during the year, including identifying systemic
incidents• reviewed preventative measures and the suitability of OH&S reporting.
Our performance towards meeting OH&S performance indicators is shown in Figure 12.
[Figure 12] Performance against OH&S performance indicators, 2015–16
Performance indicator Result Performance
All new and existing staff are offered ergonomic assessments and required products are sourced and purchased.
All staff have been offered an ergonomic assessment within two weeks of starting work at VAGO.
All claims received are lodged with WorkCover within 10 working days.(a)
One out of three claims was lodged outside this time frame.
All reported incidents and accidents are followed up within 24 hours and closed as soon as practicable.
100 per cent.
Return to work plans are in place, as soon as practicable and regularly monitored until complete.
100 per cent.
Report on the number of claims and costs is provided to the Leadership Group as required.
Reported as required.
Coordinate and chair the OH&S Committee and schedule quarterly meetings.
Four meetings held in 2015–16, meeting the requirements of the Occupational Health and Safety Act 2004.
(a) This performance indicator has been revised from five working days to 10 in line with WorkSafe requirements.
Note: Target achieved or exceeded. Target not achieved—exceeds 5 per cent variance.
OH&S training
In 2015–16, all Health and Safety Representatives and First Aid Officers were appropriately trained in their respective roles. Our office also has a staff member trained as an Equal Opportunity Contact Officer.

35
Our people
Between February and May 2016, all staff received training in understanding and working to:• eliminate bullying and harassment• further educate employees on legislative obligations• assist in raising awareness of the impact of bullying and harassment on others as part of our
culture improvement activities• help make our workplace safer.
In 2016–17, we will launch a revised OH&S compliance e-learning module for all employees to complete.
Staff Consultation Committee
Members of the Staff Consultation Committee (SCC)—formerly called the Staff Consultation and Development Group—act as a conduit between staff and the Leadership Group.
The committee includes staff representatives from a range of levels throughout the organisation, with at least one representative from each business unit. Ex-officio members include a representative from People and Culture, the Assistant Auditor-General, Standards and Quality, and the Acting Auditor-General/Chief Executive Officer.
The Executive Director, Governance, Legal and Strategy has line of sight on behalf of the Leadership Group over the SCC’s activities and initiatives, to enable clear reporting lines and accountability. The SCC also provides periodic updates to the Operations Committee.
Staff can use the SCC to provide anonymous feedback on the work and culture of our office. The SCC meets every two months and schedules special meetings as required. Non-members are also welcome to attend meetings, suggest agenda items, make presentations to the group, and approach SCC members at any time in complete confidence.
The SCC’s objectives are to:• provide a channel of communication between staff and the senior executive and a source of
staff consultation for the senior executive on matters directly affecting the culture and business of the office
• contribute to the implementation of the strategic direction and values of VAGO• develop a healthy working environment by facilitating effective communication throughout
the organisation.
In line with its objectives, the SCC consults on and undertakes several projects.In 2015–16, the SCC:• facilitated the provision of feedback from staff to the People and Culture group on
the development of the Careers@VAGO Leadership Development Program• provided input to a Reports and Communications review of internal communications,
particularly in relation to maximising participation and communicating findings• provided feedback to the Governance, Legal and Strategy business unit on the usability and
messaging of the revised Stakeholder Engagement Framework, focusing particularly on how staff use it and what the key messages should be
• adopted a key role representing staff in the Office Culture Program, including raising matters on behalf of staff at focus groups, and briefing the Leadership Group on issues raised during this process
• assisted the People and Culture group to establish a team to lead the office’s culture work• continued to relay staff members’ feedback to the Leadership Group and senior managers.
In 2015–16, the SCC sought to play a more prominent role in activities that influenced the culture of our office. This is reflected in the projects it has undertaken.

36 Victorian Auditor-General’s Office
Annual Report 2015–16
Recruitment and retention
In 2015–16, our staff continued to demonstrate their resilience while delivering quality outcomes, despite being impacted by delays in the filling of vacancies that affected the adequate resourcing of some projects. Consequently, we commenced a full review into our recruitment policies and practices to clarify and streamline our approach to reducing the time it takes to fill vacancies. This work will conclude in early 2016–17, and the results will feed into our strategic recruitment model.
Our strategic recruitment model is aimed at attracting and retaining candidates for difficult-to-fill roles, particularly those requiring specific expertise within our Performance Audit business unit.
In addition, potential candidates can register their interest for roles within our office, including graduate and internship positions, on our website, at any time.
In 2015–16, I undertook a 200-hour internship with the Performance Audit business unit at VAGO as part of a placement requirement for an Executive Internship subject for my tertiary studies. At the time, I was completing a Masters in Public Policy and Management at the University of Melbourne, and worked on the planning phase of the Regulating Gambling and Liquor audit.
On completion of my placement with VAGO, an Associate opportunity was available and I was recruited into this role within the Performance Audit business unit. VAGO continues to support me in my new role through on-the-job training and other development activities.
—Zoe Parer-Cook, Intern
Staying in touch
We also have a number of ways to stay in touch with employees on extended leave—such as leave without pay or maternity, partner or long service leave. These ways include sending them our monthly internal newsletter, Voice of VAGO, any ‘All Staff’ communications, and all pertinent team-related information such as recruitment activity and significant business unit updates.
Staff departures, turnover and exemptions
A shown in Figure 13, our staff turnover was 15.4 per cent in 2015–16. This is a decrease from 17.4 per cent in 2014–15, which suggests a stabilisation of our workforce after a significant period of uncertainty. The turnover figure is slightly lower than the Australian average of 16 per cent.1 When comparing the last five years of departures and turnover data, it is clear that the exceptionally low turnover we experienced in 2012–13 was unique.
[Figure 13] Staff departures and turnover
Number of employeesFull-time equivalent
(FTE)
Voluntary turnover rate(per cent)Year Ongoing
Fixed-term and casuals Ongoing Fixed-term
2011–12 21 12 19.7 11.8
2012–13 7 3 6.3 2.7
2013–14 17 6 16.9 6.0
2014–15 26 6 25.2 6.0
2015–16 22 5 21.8 5.0
In December 2015, one manager role and one senior manager role did not have to be advertised. Both roles had been submitted to competitive processes as fixed-term contracts, and these contracts were subsequently converted into ongoing roles.
11.9
5.4
12.4
17.4
15.4
1 AHRI Pulse Survey: Turnover and Retention October 2015.

37
Our people
Contributing to capacity-buildingWe contribute to capacity building in the audit sector through engagement with other Australian and international audit offices.
The Australasian Council of Auditors-General
In 2015–16, our office continued to be actively involved in the national and international development of public sector audit, through our participation in the Australasian Council of Auditors-General (ACAG).
Involvement in ACAG brings significant benefits, allowing us to:• learn from good practice and innovations in other public sector audit offices• contribute to the development of national and international regulatory and professional
standards frameworks • receive independent expert external assessments of our work.
Highlights of our 2015–16 work with ACAG included:• continuing as the secretariat of the ACAG Financial Reporting and Auditing Subcommittee,
which provides Auditors-General and ACAG with strategic and technical advice on developments in financial auditing, accounting and reporting, and involves leading and coordinating technical submissions on behalf of ACAG, and managing relationships with accounting professional bodies, standard setters and regulators
• sharing good practice through three ACAG meetings and eight meetings of ACAG specialist sub-groups in financial reporting and auditing, performance audit, and quality assurance
• participating in ACAG’s quality assurance program of external assessments of reports• leading development of a nationally coordinated approach to audits of key programs governed
by intergovernmental agreements• participating in shared training for performance auditors • comparing organisational performance using the ACAG Macro Benchmarking Survey• sharing a comparative analysis of Australian public sector audit legislation and identifying
opportunities for Victoria to update the Audit Act 1994 by drawing on good practice in other jurisdictions.
2015–16 Members of Australasian Council of Auditors-General, from left: Andrew Richardson (South Australia), Julie Crisp (Northern Territory) Rod Whitehead (Tasmania), Peter Frost (VAGO), Lyn Provost (New Zealand), Maxine Cooper (ACT), Colin Murphy (Western Australia), Margaret Crawford (New South Wales), Grant Hehir (Australian National Audit Office), Rachael Portelli (Secretary), Andrew Greaves (Queensland).

38 Victorian Auditor-General’s Office
Annual Report 2015–16
International engagement
We share insights, systems and practices with international stakeholders to help them grow capacity and knowledge throughout our profession. We do this through direct engagement with auditors and audit offices from other countries, as well as participation in the Pacific Association of Supreme Audit Institutions (PASAI).
Hosted delegations and secondments
In 2015–16, we met representatives of audit offices from Uganda, Japan, Vanuatu and South Korea. We also hosted two auditors on secondment from Papua New Guinea, as part of a program coordinated by the Australian National Audit Office and supported by the Department of Foreign Affairs & Trade. Further information about international delegations is available on our website.
Pacific Association of Supreme Audit Institutions
PASAI is our regional chapter of the International Organisation of Supreme Audit Institutions (INTOSAI). We support PASAI’s work on building the capacity of public sector audit offices in the Pacific region.
In May 2016, we hosted the PASAI/ACAG Regional Working Group on Environmental Auditing. Delegates from Australia, Indonesia and the Pacific region shared their emerging practice and recent findings from environmental audit, and considered ways to improve the impact of audits.
At the annual PASAI Congress in Port Vila, Vanuatu, on 13–16 October 2015, our Executive Director, Governance, Legal and Strategy, Dr Marco Bini, presented the keynote address, speaking about how we apply INTOSAI Independence Principles. PASAI has since used our work to produce a toolkit for Pacific Auditors-General, to assess their independence and promote changes to their legislation.
Twinning with audit offices in the Pacific region
Our office participates in a ‘twinning’ program, designed to provide focused assistance and support, using a framework agreed between ACAG and PASAI. We are twinned with Tuvalu, reflecting the similar relationship between Tuvalu’s Parliament and the Parliament of Victoria. In 2015–16, at the request of Tuvalu, we:• shared technical training materials• reviewed the Tuvalu Auditor-General’s legislation against INTOSAI standards to advise on
potential improvements• supported Tuvalu Audit Office’s participation in PASAI’s cooperative performance audit, by
attending PASAI workshops and offering support to the auditors between PASAI workshops• assisted the Tuvalu Audit Office to review material relevant to rewriting Tuvalu’s audit and public
finance legislation.
Delegates attending the PASAI/ACAG Regional Working Group on Environmental Auditing in Melbourne, May 2016.

39
Our people
Contributing to staff engagement and the wider community Our office supports staff engagement and contributes to broader community development through the activities of the Social Club, and through our staff’s volunteering efforts.
Our Social Club makes a difference
Our Social Club arranges many events and charity drives throughout the year to promote engagement and teamwork and support staff morale. Social Club events are often held after business hours to allow staff who do not regularly interact the opportunity to get to know each other.
The Social Club supports about 12 charities a year. In 2015–16, our staff participated in and hosted a number of fundraising events for charities (see Figure 14).
[Figure 14] Charities supported by VAGO’s Social Club in 2015–16
Charity Amount raised ($)
Tree Project 441.50
Cancer Council 354.35
East Timor Hearts Fund 288.70
Leukaemia Foundation 313.85
Shorter Brothers’ fight against Duchenne 463.40
Street Action & Bicycles for Humanity 469.95
Sacred Heart Mission 233.91
Movember 407.81
beyondblue 623.46
Beagle Rescue Victoria 613.61
Autism Spectrum Australia 571.86
Save the Bilby Foundation 309.80
Total 5 092.20
Our donations are appreciated…
We are grateful for your gift donated on behalf of Max, William and Hudson Shorter.
—Shorter Brothers’ fight against Duchenne
Thank you so, so much…that’s amazing and so generous! It will go straight towards our vet bills and be a big help.
—Beagle Rescue Victoria

40 Victorian Auditor-General’s Office
Annual Report 2015–16
Volunteering
In 2015–16, our staff carried out a diverse range of volunteering activities, including taking part in sporting groups, providing community legal advice and donating blood.
I volunteer for Bush Search & Rescue Victoria, a division of Bushwalking Victoria Incorporated that assists the Victoria Police Search & Rescue Squad with self-sufficient search groups for overnight searching on foot in rough terrain and in any weather conditions. I often volunteer with searches for lost people in bushland areas and the snow fields.
Recently, I was involved in the search of a missing person in Victoria’s bushland, and have attended training in alpine environments, including the steep snow and ice technical training.
Volunteering provides me with the opportunity to use my skills and experience to provide an additional benefit to the community. By participating in search call outs and weekend training, I have also been able to further develop my teamwork, communication and initiative skills, whilst supporting the balance between my work and personal life.
—Rowan Jennion, Assistant Manager, Financial Audit
Looking forwardIn 2016–17, we will continue to undertake activities that foster world-class auditing, effective management and leadership, robust performance management, planned ongoing professional development, a safe and healthy workplace and a close-knit, collaborative culture. These activities include:• continuing to deliver culture improvement activities, such as our internal communications review,
and review of organisational values• greater investment in developing technical skills, and effective management and leadership
capabilities• establishing comprehensive capability and Learning and Development frameworks to support
ongoing professional development• developing relationships with other audit offices and integrity bodies to deliver more efficient
training and mentoring• rigorous resource and workforce planning• reviewing our reward, recognition and wellbeing programs with the aim of making them more
proactive, agile and responsive.
Our Social Club will explore means for increasing staff engagement, by making it easier for staff who work part-time or are only in the office during specific periods of the day to attend events. It will also cooperate more closely with other VAGO committees and groups in volunteering, and improving environmental performance and health.
Externally, we will continue to be actively involved in the national and international development of public sector audit, especially through our participation in ACAG and PASAI.
41
Our office
4 Our officeRelevant strategic objectives
Organisation Leverage our systems and processes to improve our organisational performance
We pride ourselves as being a high-performing organisation. In 2015–16, we worked to streamline our business performance to ensure that we best use our limited resources to make a difference in the community.
Here is an overview of our achievements, challenges and future steps for our office.
Challenges in the year ahead
• Our internal audit function identified opportunities for improvement in the areas of practice management, assurance mapping, management reporting, ICT vulnerability assessment, audit service provider management and supervision, and knowledge management (page 54).
Next steps
• We will develop a new ICT strategy (page 58).
• We will see changes to our organisational structure (page 58).
• We will review our organisational performance measures to ensure that they provide adequate assurance to Parliament on our operational performance (page 58).
• We will act on the findings of the 2016 Public Accounts and Estimates Committee audit of our office (page 58).
Achievements
• We reviewed and updated our Strategic Risk Register to more appropriately reflect the risks, challenges and opportunities facing our organisation (page 53).
• We introduced a new internal consultation policy and database to improve the efficiency and effectiveness of the provision of technical auditing and accounting advice to our audit engagement teams (page 47).
• We developed a new post-audit quality assurance framework to drive continual improvement in our audit engagements (page 47).
• We reviewed our approval processes and delegations and made recommendations to reduce internal red tape (page 28).
• We reviewed our grievance policy and processes, with revised policies providing greater clarity about methods of informal dispute resolution and interconnections between related policies (page 28).
• We rolled out Accellion—our secure platform for sharing electronic documents—within Financial Audit more broadly, allowing us to send audit documents to audited agencies as part of the conduct of our financial audits (page 51).

42 Victorian Auditor-General’s Office
Annual Report 2015–16
Leadership GroupOur Leadership Group provides advice and counsel to the Auditor-General. It also manages our day-to-day operations, through weekly meetings and regular committee meetings.
Figure 15 shows our organisational chart as at 30 June 2016.
In 2015–16, significant changes to the structure of the executive management team included:• the resignation of the former Auditor-General, John Doyle• the appointment of two new Performance Audit Assistant Auditors-General• the transition of one Performance Audit Assistant Auditor-General to lead the Audit Support
Group while the incumbent executive was on extended leave.
[Figure 15] Executive management organisational chart
Assistant Auditor-General, Information Systems Audit
Karen Phillips
Assistant Auditor-General, Standards & Quality
Matthew Zappulla
Assistant Auditor-General, Financial Audit
Craig Burke
Executive Officer
Susanna Young
Assistant Auditor-General, Performance Audit
Steven Vlahos
Acting Executive Director, Audit Support Group
Chris Sheard
Executive Director, Governance Legal & Strategy
Marco Bini
Audit and Risk Committee
Operations Committee
Challenge Committee
Remuneration Committee
Acting Auditor-General / Chief Executive Officer
Peter Frost
Accredited Purchasing Unit

43
Our office
Executive profiles
Acting Auditor-General/ Chief Executive OfficerPeter Frost (BA, BLitt, MPhil, MEd, PhD)
Peter was appointed Our Chief Operating Officer in January 2007 and became the Deputy Auditor-General/Chief Executive Officer in 2013. He has also been Acting as the Auditor-General since September 2015, and provides leadership to all of the business units within VAGO.
Peter has extensive senior public sector management experience, gained primarily in the Victorian public sector, higher education and international development with the Commonwealth Secretariat, World Bank and Asian Development Bank.
Assistant Auditor-General, Information Systems AuditKaren Phillips (BBus (Acc), BComp, MIMS)
Karen joined VAGO in April 2014 and manages the Information Systems Audit business unit. Before this, Karen was a director at PricewaterhouseCoopers, specialising in systems assurance, internal controls, internal audit and business continuity management.
Assistant Auditor-General, Standards and QualityMatthew Zappulla (BCom, FCA)
Matthew joined VAGO in April 2014 and manages the Standards and Quality business unit. Matthew has oversight of the Technical Issues Committee and Technical Panel, as well being the Leadership Group representative on our Staff Consultation Committee and Challenge Committee. Before this, Matthew was a director at PricewaterhouseCoopers responsible for overseeing the implementation of assurance methodologies and technologies.
Assistant Auditor-General, Financial Audit Craig Burke (BBus (Acc), FCPA)
Craig was appointed as Assistant Auditor-General, Financial Audit in November 2014. He is responsible for VAGO’s financial audit business unit, and has substantial financial expertise, with more than 30 years in public sector accounting, risk management and auditing throughout several organisations, including the Parliament of Victoria.

44 Victorian Auditor-General’s Office
Annual Report 2015–16
Assistant Auditor-General, Performance Audit Steven Vlahos (BSc, MSc)
Steven joined VAGO in November 2002, and manages the Performance Audit business unit. Steven has substantial performance auditing experience, with more than 15 years in public sector auditing and expertise in several areas, including transport, planning, and local government.
Acting Executive Director, Audit Support GroupChris Sheard (BArts (Hons))
Chris joined VAGO in July 2003, and has substantial performance auditing experience, with more than 13 years in public sector auditing, and expertise in several areas, including health and human services, justice, education and the environment. Chris has also been Acting Executive Director for the Audit Support Group business unit since February 2016, while the substantive incumbent has been away on extended leave. The Audit Support Group consists of the Finance, Reports and Communications, Information Technology and Services, and People and Culture groups.
Executive Director, Governance, Legal and StrategyMarco Bini (BCom, LLB, MCom, LLM, MPubPol, PhD)
Marco joined VAGO in September 2007. He is the Executive Director for the Governance, Legal and Strategy business unit, which provides a range of internal policy, governance and strategy services. Marco has significant public sector experience and provides a range of legal, policy and administrative advice to VAGO.

45
Our office
Executive informationOur executive officers are responsible for our office’s ongoing activities and deliverables. In 2015–16, no executive officers were involved in carrying out special projects. Information on our executive officers by classification, and reconciliation of numbers is provided in Figures 16 and 17.
[Figure 16] Number of executive officers by classification, at 30 June 2016
Total (ongoing) Vacancies Male Female
Classification No. Var.(a) No. No. Var. No. Var.
EO1 1 0 0 1 0 0 0
EO2 7 2 0 5 2 2 0
EO3 17 –2 0 10 –2 7 0
Total 25 0 0 16 0 9 0
(a) Var. refers to variance to the numbers reported for June 2015.Note: The Auditor-General is not included in this table.
[Figure 17] Reconciliation with executive numbers, June 2016 and June 2015
Remuneration and vacancies 2016 2015
Executives employed with total remuneration over $100 000 21 25
Vacancies 0 0
Executives employed with total remuneration below $100 000 7 1
Accountable officer(a) 0 1
Secondment 0 0
Separations –3 –1
Total executive numbers at 30 June 25 26
(a) Including the Auditor-General, VAGO’s Accountable Officer.
Declaration of interests
All our executive officers and business unit managers have completed statements declaring whether their interests, shares in, and other benefits from business enterprises could give rise to a conflict of interest. There were no such conflicts.
Committees reporting to the Acting Auditor-General
Executive remuneration—Remuneration Committee
The Remuneration Committee is responsible for ensuring that we follow our remuneration policy, and for monitoring the executive officer annual performance appraisal process and salary review. This committee comprises the Auditor-General, an independent member and the Manager, People and Culture. In 2015–16, the independent member was Ms Liz Roadley, Director for Enterprising Results, an external company.
Operations Committee
In 2015–16, the Operations Committee, made up of the Leadership Group excluding the Auditor-General, focused on:• monitoring our office’s performance against our strategic and business plans• sustaining the capability and performance of our workforce• guiding information and communications technology (ICT) and information security.

46 Victorian Auditor-General’s Office
Annual Report 2015–16
Before April 2016, the Operations Committee met monthly, after which a decision was made to move to quarterly meetings. Two subcommittees report to the Operations Committee:• OH&S Committee• Recognition Review Committee.
Challenge Committee
The Challenge Committee oversees the progress of all Parliamentary reports (see pages 63 and 70 for Performance Audit and Financial Audit respectively).
Accredited Purchasing Unit
The Accredited Purchasing Unit oversees procurement for goods and services (greater than $100 000) throughout all business areas in our office.
Other committees
The Audit and Risk Committee (see pages 52–53) also reports to the Acting Auditor-General.
Working with other integrity bodies
Due to recent changes to our legislation (see page 9), as part of the reform of Victoria’s integrity system, our office is interacting more frequently with other Victorian integrity bodies. The Audit Act 1994 largely prevents us from sharing information collected during the course of an audit, and we work within these limitations.
We have commenced our mandatory reporting process and have the capacity to receive referrals, share information with other integrity bodies and conduct coordinated investigations. We also have a representative on Victoria’s Independent Broad-based Anti-corruption Commission’s ongoing Prevention and Education Advisory Group.
Our commitment to continual improvementOur office has a range of quality systems and processes in place to help us continually raise our standards and better meet the needs of our key stakeholders. These systems and processes are collectively bound together as part of our quality framework.
A key component of our quality framework is an internal assessment of the maturity of these systems and processes against the Australasian Council of Auditors-General (ACAG) Governance and Audit framework. ACAG’s framework covers the requirements of:• professional standard APES 320 Quality Control for Firms • Auditing Standard and ASQC1 Quality Control for Firms that Perform Audits and Reviews of
Financial Reports and Other Financial Information, Other Assurance Engagements and Related Service Engagements.
The following key quality controls are already incorporated in our audit methodologies: • The audit program, working papers and key deliverables are reviewed by the audit engagement
leader or team leader, who must confirm that the audit meets professional standards.• An engagement quality control reviewer—a senior staff member who is independent of
the audit engagement team—is assigned to review the quality control of the audit and the judgements made by the audit team. This applies to all high-risk financial audits and, currently, all performance audit engagements.

47
Our office
In addition, the following activities were undertaken in 2015–16 to improve the quality of our financial audits:• introduction of a new internal consultation policy and database to improve the efficiency
and effectiveness of the provision of technical auditing and accounting advice to our audit engagement teams
• rollout of an updated audit sampling methodology to enhance our audit approach to tests of controls
• completion of a revised financial audit technical competency framework and curriculum for our staff
• development of a new post audit quality assurance framework to drive continuous improvement for our audit engagements.
Complying with standards issued by the Auditing and Assurance Standards Board
Under the Audit Act 1994, we must comply with the standards issued by the Auditing and Assurance Standards Board. These cover audit planning, communication, conduct, evidence, quality assurance and reporting.
In addition to the rigorous standards and risk-based audit methodologies applied by our Performance Audit and Financial Audit teams (see pages 62 and 69), other quality assurance activities conducted over our audits include:• parliamentary accountability measures• benchmarking our activities.
We comply with all Australian auditing and assurance standards and have developed our audit methodologies based on these standards.
Parliamentary accountability measures
Under the Audit Act 1994, we must consult Parliament’s Public Accounts and Estimates Committee when developing our Annual Plan and, in certain circumstances, on specifications for performance audits.
Our office is also subject to both financial statement and performance audits, conducted on behalf of Parliament. Our financial statements are audited every year. The Audit Act 1994 also requires a performance audit of our office every three years to determine whether the Auditor-General is achieving his objectives effectively, and is doing so economically and efficiently, and in compliance with the Audit Act 1994. The Public Accounts and Estimates Committee appoints our performance auditor.
The performance audit of our office currently underway commenced in July 2016. Specific preparations on this front included:• a refresh of our assessment against the ACAG Governance & Audit framework• internal audit review of the status of recommendations from the 2013 performance audit of
our office• the provision of an assessment and evidence against each of the terms of reference of the
performance audit.
Our internal quality control framework is also being reviewed again in conjunction with the current triennial performance audit, which is due for completion in November 2016.
We maintain a Continuous Improvement Register to monitor progress against agreed actions that arise from reviews such as internal audits, post-audit quality reviews, surveys, audit debriefs and external reviews. In addition, our internal audit function annually reviews progress against the commitments our office has made towards the implementation of any internal audit recommendations.

48 Victorian Auditor-General’s Office
Annual Report 2015–16
Surveys of key stakeholders
We survey a range of key stakeholders to obtain feedback on our audits and audit reports. The results of these surveys assist us to identify new improvement initiatives and monitor progress on existing initiatives. An independent survey company runs the surveys to better assure the validity of the results. We publish high-level results of the surveys on our website.
Surveys of parliamentarians
Every year, for more than a decade, our office has surveyed parliamentarians to gauge their feedback. The results of this survey contribute significantly to our efforts to continually improve our performance and services.
The results of our surveys of parliamentarians are used as a performance measure of quality for Output Group 1—Parliamentary reports and services. In 2015–16, parliamentarians’ overall satisfaction with our office and services remains positive, with a survey score of 86 out of 100, which exceeded our target of 80. Further details regarding our performance for this measure are on page 14.
The survey results also showed that parliamentarians’ perceptions of our office’s work were highly positive, with 98 per cent of respondents agreeing that the Auditor-General’s reports and services provide valuable information on public sector performance. In addition, 89 per cent agreed that the Auditor-General’s reports and services help improve public sector administration.
Quotes from survey of parliamentarians
I think [VAGO staff] do a great job and it’s a fantastic resource.
When I have had face-to-face briefings on tabled reports the presentation quality has been very good.
Surveys of audited agencies
In 2015–16, VAGO surveyed:• contacts nominated by the audited agency for every performance audit• chief finance officers of agencies subject to a financial audit by our office.
We use survey results to assess the impact of activities aimed at increasing the clarity of audit reports, better understand the audited agency’s environment, and improve communication with audited agencies.
overall satisfaction with our office and services
of respondents agreed that the
Auditor-General’s reports and services
provide valuable information on public sector performance
of respondents agreed that the
Auditor-General’s reports and services help improve public
sector administration
89%98%86100

49
Our office
For performance and financial audit surveys, an overall index score out of 100 is generated, based on three areas—audit process, audit reporting, and value of the audit to the agency.
The performance audit surveys in 2015–16 had an average index score of 71 index points, which is a decrease on the previous year’s score of 75.
The financial audit surveys in 2015–16 had an average index score of 75.3 index points. Although this is slightly lower than the score of 76.8 index points when the survey was last run in 2013–14, it remains in line with our benchmark of 75 index points.
Stakeholder survey
In 2015–16, we carried out a pilot survey of stakeholders who were previously consulted as part of the planning phase of our performance audits, to better understand their perceptions of how our audits have acted as a catalyst for change. Results of this survey are currently being considered.
Quality assurance
To seek assurance that our audits meet professional and internal quality standards, the robustness of the audit process and the quality of the final audit report are reviewed.
Review of audit processes
Performance Audit
In 2015–16, external reviewers of several performance audits found that all had complied with performance assurance standards, and recommended only minor changes to internal documents. As part of our Performance Audit Methodology Review project (see page 62), we worked to implement these identified improvements.
The reviewers found that our executives have a high level of control over the quality of tabled audit reports, but that our Engagement Quality Control Review (EQCR) arrangements would benefit from further review. In response, the Standards & Quality group led a review of the EQCR policy, which was finalised by the end of 2015–16.
Financial Audit
We undertake engagement quality reviews of a selection of completed financial audits, including audits undertaken by Audit Service Providers.
Our key performance measure for the quality of our financial audit reports is through the conduct of engagement quality reviews, which aim to uncover any material departures from professional and regulatory standards on our financial audits. Our performance for this measure in 2015–16 is discussed on page 16.
Our engagement quality reviews also identify areas for continual improvement, which guide the development of technical training programs, policies and guidance materials for our financial audit staff.
External assessments of audit reports
Each year a selection of parliamentary audit reports are independently assessed against criteria agreed to by ACAG. The six assessors on the panel bring experience as members of Parliament, senior public servants and journalists. Each audit office selects three assessors to review each report. These assessors receive a copy of the printed report, and are also able to access the report online.
After their review, the panel provides its opinion on how well we communicated our audit findings. The scores are combined with the results from the financial audit reports and are used as a quality measure. Our performance for this measure in 2015–16 is discussed on page 15.

50 Victorian Auditor-General’s Office
Annual Report 2015–16
Quotes from ACAG assessors
Bullying and Harassment in the Health Sector (March 2016)
The authors of the report have done very well to summarise and analyse all the evidence, identify priority areas for improvement and produce a set of recommendations that should ensure greater workplace harmony and safety—as well as better performance—for all concerned.
Grants to Non-Government Schools (March 2016)
The report has highlighted the clear absence of goals, outcomes and governance processes around state funding.
Universities: 2015 Audit Snapshot (May 2016)
The report seems to identify and deal well with the key areas where improvement is needed.
Benchmarking our activities
We benchmark our activities against audit offices throughout Australia, and use the results of this benchmarking to identify priority areas for improvement—see Figure 18.
[Figure 18] Comparison of our costs against other state and territory audit offices
While our office performed better than the state and territory average, this result should be interpreted with caution, given the differences between jurisdictions and audit offices. We are confident that we performed well against these benchmarks, particularly considering that we produce a higher proportion of performance audits than most other Australian audit offices.
29¢ 11¢
compared to the state and territory average of 38¢
Per $1 000 of public sector
transactions
compared to the state and territory average of 17¢
Per $1 000 of public sector
assets

51
Our office
Improving our information and communications technology
Technological improvements
In 2015–16, we reviewed, implemented and began developing several technologies to improve the effectiveness, efficiency and quality of our operations and services. In addition, we:• asked our staff what they want in a new intranet—sharing concept designs and testing how
staff accessed information—and how they would like to access information in the future• reviewed and improved our Audit Methodology Performance (AmP) databases• rolled out Accellion (our secure electronic document sharing platform) within our Financial Audit
business unit more broadly, allowing us to send audit documents to audited agencies as part of our financial audits
• trialled an electronic briefing system, but this was put on hold while we improved other systems, such as AmP
• developed an interim ICT strategy• developed a ‘market place’ system, for resourcing of small projects internally• introduced a new internal consultation policy and database• reviewed our mobile phone guidelines• updated our VAGO Employee Service Portal Application.
Information and communications technology expenditure
Although there were no major technology improvements for our office in 2015–16, there were a number of upgrades and planning conducted for future work, which we will undertake in 2016–17 and beyond.
In 2015–16, we upgraded the records management system, secure document delivery system, employee service portal, and AmP system. Planning work for future ICT improvements included evaluating:• and selecting new software for our intranet and website• and purchasing new laptops to roll out in 2016–17• network security and procurement of upgrades to be implemented in 2016–17• our finance and practice management system.
In addition, we established a specialist data analytics team (see page 65).
As shown in Figure 19, during 2015–16, we spent $1.7 million on ICT. This expenditure was expected, and reflects the small size of our organisation when compared to other public sector agencies.
[Figure 19] Details of information and communications technology expenditure
Business as Usual ICT expenditure
$’000
Non-Business as Usual ICT expenditure
(operational expenditure and capital expenditure)
$’000
Operational expenditure
$’000Capital expenditure
$’000
1 495 169 73 96
Note: Our ICT expenditure reflects our costs in providing business-enabling ICT services. It comprises Business As Usual (BAU) ICT expenditure and Non-Business As Usual (Non-BAU) ICT expenditure. Non-BAU ICT expenditure relates to extending or enhancing our current ICT capabilities, and consists of both operational ICT expenditure and capital ICT expenditure. BAU ICT expenditure is all remaining ICT expenditure, which primarily relates to ongoing activities to operate and maintain our current ICT capabilities.

52 Victorian Auditor-General’s Office
Annual Report 2015–16
Audit and risk managementAudit and Risk Committee chair’s report (year ended 30 June 2016)
The Audit and Risk Committee is appointed by the Auditor-General to provide independent advice to assist him in the discharge of his responsibilities for the management of the Victorian Auditor-General’s Office’s risk, control and compliance framework, and the external accountability responsibilities as prescribed in the Financial Management Act 1994, the Audit Act 1994 and other relevant legislation and prescribed requirements.
All committee members are independent, non-executive members who are appointed by the Auditor-General for a term of three years and are eligible for reappointment subject to a formal review of the member’s performance by the Auditor-General. The Audit and Risk Committee has appropriate financial and industry expertise. All members are financially literate and have an appropriate understanding of the operation of the office.
Sara Watts has been Chair of the Audit and Risk Committee since 1 January 2014. The members of the Audit and Risk Committee for the year ended 30 June 2016, their qualifications and attendance at meetings, are set out in Figure 20.
[Figure 20] Members of the Audit and Risk Committee, qualifications and meeting attendance, 2015–16
2015–16
Committee memberMeetings attended
Meetings held
Sara Watts (Chair), BSc, MBA, GAICD, FCPA Non-executive director
4 4
Kerry Jacobs (term ended 31 December 2015), BComm, MCom(Hons), PhD, FCPA, FCA Professor of Accounting, UNSW at ADFA, Canberra
2 2
Lyn Baker, BA, MBA, GAICD Non-executive director and consultant
4 4
Derek Parkin OAM, BComm, CTA, FCA, CPA, FAICD Professor of Accounting, University of Notre Dame Australia, Fremantle Non-executive director
3 4
Joydeep Hor (commenced 1 January 2016), LLM, LLB(Hons), BA, FCIPD, FAHRI Managing Principal, People + Culture Strategies, Sydney
2 2
The responsibilities of the Audit and Risk Committee are defined in its charter, which is approved by the Auditor-General.
The responsibilities of the committee include:• to review the external auditors’ proposed approach, conduct and the outcomes of the audit process • to review, assess and recommend to the Auditor-General the adoption of the annual financial report• to determine the scope of the internal audit function and review its effectiveness• to review VAGO’s approach to risk identification and management• to consider VAGO’s approach to compliance with relevant legislation, regulations and guidelines.
In fulfilling its responsibilities at each meeting, the Audit and Risk Committee has received operational management reports, risk management reports and briefings from the Auditor-General on his activities and issues affecting the office.
2015–16 Audit and Risk Committee members: Lyn Baker, Sara Watts (Chair), Derek Parkin, Joydeep Hor.

53
Our office
During the course of the year, the Audit and Risk Committee has considered:• the closing report from the external financial auditor for the year ended 30 June 2015, which
identified no significant issues• status updates and review reports from the new internal auditor, which include management’s
response to matters raised by internal audit, together with subsequent follow-up• the office’s risk management reports and noted that risks were being appropriately identified,
monitored and addressed by the office• systems of control for conflicts of interest and the monitoring of those systems• policies and procedures in place for the development of VAGO’s Annual Plan, performance
measurement, and budget and resource planning• whether the office has appropriate policies and practices in place to review and implement, where
appropriate, recommendations from external reviews, including parliamentary committee inquiries• the effectiveness of the internal audit program.
At the time of signing this report the annual financial report for the year ended 30 June 2016 had been considered and recommended for adoption by the Auditor General.
In July 2015, the Audit and Risk Committee provided feedback on the Standing Directions (Directions) to the Minister for Finance for consideration. The issues raised by the committee related to how risk is to be managed within public sector agencies, expertise required of audit committee members, and, potentially, improving the Directions by referring to elements of the Australian Securities Exchange Guidelines and Principles for audit committees. The committee took further action to proactively reflect these items in its own charter.
The Audit and Risk Committee has met in camera with the external financial auditors, the Auditor-General and the internal auditor. In the last financial year, committee members held a workshop to undertake a comprehensive self-assessment and review the charter and work plan. The current work plan was endorsed and approved at the committee’s meeting in February 2016.
In closing, the committee wishes to acknowledge the significant and positive contribution made by the Acting Auditor-General consequent to the resignation of the Auditor General.
Sara Watts (Chair) 9 August 2016
Risk management
Management of risk is an integral part of our culture and organisational processes. The aim of risk management at VAGO is to identify, understand, communicate and manage risks that could influence the office’s ability to achieve its strategic objectives.
To achieve this, we have a risk management policy in place, which is based on and is consistent with the Australian/New Zealand Risk Management Standard: AS/NZS ISO 31000:2009. Our risk management policy incorporates compliance requirements and articulates operational and strategic risks within the organisation.
Risks are captured in either the strategic risk register or in separate business unit risk registers. Business unit heads are responsible for overseeing their business unit’s risk management processes and monitoring any changes at the business unit level that may impact the strategic risk register or the organisation.
In 2015–16, the strategic risk register was reviewed, and significant changes were introduced to more appropriately reflect the risks, challenges and opportunities facing our organisation. Key strategic risks facing our organisation include:• keeping pace with regulatory changes (Audit Act 1994 changes)• doing the right audits at the right time• maintaining and improving key stakeholder relationships.

54 Victorian Auditor-General’s Office
Annual Report 2015–16
Attestation of compliance with the Australian/New Zealand Risk Management Standard
I, Peter Frost, certify that the Victorian AuditorGeneral’s Office (VAGO) has risk management processes in place consistent with AS/NZS ISO 31000:2009 (or an equivalent designated standard) and an internal control system in place that enables the executive to understand, manage and satisfactorily control risk exposures.
The Audit and Risk Committee verifies this assurance and that the risk profile of VAGO has been critically reviewed within the last 12 months.
Dr Peter Frost Acting Auditor-General Victorian Auditor-General’s Office
9 August 2016
Attestation of compliance with the Ministerial Standing Direction 4.5.5.1—Insurance
I, Peter Frost, certify that the Victorian AuditorGeneral’s Office (VAGO) has complied with Ministerial Direction 4.5.5.1—Insurance.
Dr Peter Frost Acting Auditor-General Victorian Auditor-General’s Office
9 August 2016
Internal audit
PricewaterhouseCoopers has been appointed as our internal auditor for the period July 2015 to June 2018. The internal auditor reports to our Audit and Risk Committee and the Auditor-General. The following reviews were carried out in 2015–16:• practice management• assurance mapping• management reporting• ICT vulnerability assessment• Audit Service Provider management and supervision• knowledge management• progress towards implementation of internal audit recommendations.
The internal auditor also attended each meeting of our Audit and Risk Committee where reports were being considered, and provided a report on the status of the internal audit program, as required.

55
Our office
Compliance with legislation and policy We must comply with a range of state and Commonwealth legislation and policy, and report on our compliance in this report.
Audit opinion delegations
Under the Audit Act 1994, the Auditor-General can delegate the authority to sign audit opinions (section 7G(1)) and must report the names of people to whom these powers have been delegated.
Under our current ‘Audit Opinion Delegations’ policy, the Auditor-General signs the audit opinions on the financial reports of:• Parliament and the associated superannuation fund• key government accountability documents—Annual Financial Report and Estimated Financial
Statements• central agencies and other departments whose main role is to develop policy or underpin law
and order.
The Auditor-General also signs any modified opinions, and the opinions for agencies whose financial operations are significant in economic and infrastructure terms for whole of government.
To be eligible to receive a delegated power to sign audit opinions (see Figure 21 for delegations in 2015–16), a staff member must have all of the following:• an appropriate tertiary qualification in accounting or similar discipline• ongoing full membership of CPA Australia or CA, or their international equivalents, including
compliance with the continuing professional development requirements of the professional body• a substantive or acting VPS classification of EO3 or above.
[Figure 21] Audit opinions delegations by role and individual (including acting roles), 2015–16
Financial Audit, Assistant Auditor-General Craig Burke
Financial Audit, Sector Directors Simone BohanTravis DerricottStan NaylorTim LoughnanRonald MakAnna HiggsRoberta SklirosCharlotte JeffriesJonathan KyvelidisTim Maxfield
Financial Audit, Acting Sector Directors Peter Gallagher
Standards and Quality, Assistant Auditor-General Matthew Zappulla
Standards and Quality, Director Paul Martin

56 Victorian Auditor-General’s Office
Annual Report 2015–16
Managing and responding to complaints
Our policies ‘Complaints about the conduct of audits’ and ‘Complaints about matters other than audits’ require us to make publicly available an annual summary of complaints received and any trends arising.
In 2015–16, we received one complaint under the ‘Complaints about the conduct of audits’ policy. We acknowledged this within the required five business days and responded to it within four business days, well within the 28 business days allowed within the complaints policy.
We did not receive any complaints under the ‘Complaints about matters other than audits’ policy.
Due to the minimal number of complaints made in previous years under both policies (less than five in total), no further trend analysis is available.
Overseas travel
All overseas travel by our staff must be approved by the Auditor-General. In November 2015, a performance audit senior manager was sent to New Zealand to attend the Pacific Association of Supreme Audit Institutions Co-operative Audit Workshop.
In addition, as outlined on page 38, the Executive Director, Governance, Legal and Strategy, also attended the annual PASAI Congress in Vanuatu in October 2015, and presented a paper titled Applying INTOSAI Independence Principles: The Australian Experience’, which compared the independence of audit offices in Australia.
Environmental managementOur office aims to minimise our:• consumption of energy, water, paper and other materials• waste generation• environmental impact from travel and other business activities.
We are committed to continually improving our environmental performance and do this by encouraging environmental awareness and integrating environmental performance monitoring and reporting into our business. We expect all our staff to support our environmental commitments.
Governance
In 2015–16, a review of our Environmental Management Committee found that a committee structure was no longer necessary to manage the reporting and awareness campaigns, but that a single role championing these activities would be more appropriate. The role of Environmental Representative was subsequently created as a formal role within our Social Club Committee.

57
Our office
Environmental performance
VAGO monitors and analyses its environmental performance against seven focus areas to help us to understand our environmental impact, identify areas to improve, and allow us to benchmark our performance against other jurisdictions.
Energy use
Waste production
Paper use
Transportation
Greenhouse gas emissions
Procurement
paper use in 2015–16, down
from 14.9 reams in the previous year
travelled in 2015–16, our highest figure
in five years
greenhouse gas emissions
in 2015–16
sustainable procurement to reduce environmental impact
waste recycled in 2015–16 against a
target of 80%
green energy use in 2015–16
Australian paper used
reduction in flight kilometres
this year, to 91 837 km
greenhouse gas emissions in 2015–16, below the 2.0-tonne average for similar
offices
waste produced —8.5 kg below of our
target of 71 kg per person
imported paper used
CO2 emissions in 2015–16, up 21.7% from the year before
because of using less efficient vehicles
result of a waste production audit by
National Australian Built Environment Rating System in 2015–16
energy use during 2015–16, consistent with the average for
similar offices of 7 000 MJ per FTE
13.9 reamsper FTE
234 314 km
189.77tonnes
78.9%
100%
9.4 reamsper FTE
33.5%
1.04tonnes per FTE
62.5 kgper FTE
4.5 reamsper FTE
47.5 tonnes
7 217 MJper FTE
Water consumption
water use in 2015–16, up from
5.6 kL in the year before
6.1 kLper FTE
Criteria/factors for calculating emissions inventory
Department of Environment (August 2015), National Greenhouse Accounts Factors
United Kingdom Department of Environment, Food and Rural Affairs, Conversion Factors for greenhouse gas (GHG) reporting 2016
Environment Protection Authority Victoria, EPA Victoria’s greenhouse gas inventory management plan: 2012–13 update EPA GIMP 2013
Australian Government, Green Vehicle Guide 2016

58 Victorian Auditor-General’s Office
Annual Report 2015–16
Looking forwardAs part of the coming year, we will see changes to our organisational structure, which will reflect our new priorities and areas of audit interest. In consultation with the new Auditor-General, we will:• review our organisational performance measures to ensure that they continue to provide
adequate assurance to Parliament regarding our operational performance• develop a new ICT strategy for the office that aligns our technological requirements with our
business goals• continue to monitor and assess our environmental performance.
We will consider the outcomes of the triennial Public Accounts and Estimates Committee performance audit, and implement and monitor progress against any agreed actions.

59
Performance audit
5 Performance auditRelevant strategic objectives
Reports and advice Being authoritative and relevant
Parliament Being highly regarded by Parliament
Here is an overview of our achievements, challenges and future steps for our Performance Audit business unit.
Challenges in the year ahead• Our significant turnover and staffing
challenges require us to be innovative in our structure and delivery of our work program (page 36).
• Our average indexed ratings for questions about audit value was decreased by 10 per cent, from 74 per cent in 2014–15 to 64 per cent in 2015–16, with audit clients less likely to agree that the audit would help them to improve the performance of the audited activity (page 64).
• Our average index score for performance audit reporting decreased by 3 per cent, from 76 per cent in 2014–15 to 73 per cent in 2015–16, with agencies’ perceptions about the balance and fairness of our reports affecting the score (page 64).
Next steps• We will focus on our six improvement
projects, which will enhance the quality of our performance audit practices (page 66).
• We will continue to build advanced data analytic capabilities throughout our office (page 66).
• We will review our approach towards the selection of follow-up audit topics (page 66).
• We will review and update our audit procedures as appropriate, to account for our new ‘follow-the-dollar’ powers (page 66).
• We will work with other jurisdictions to develop a strategy for the way we conduct concurrent audits (page 66).
Achievements
• We delivered 29 performance audit reports delivered (including six follow-up audits), three more than our target of 26 (page 60).
• 139 of the 145 recommendations we made were accepted (page 20).
• We reviewed and re-engineered our Performance Audit methodology (page 62).
• We reviewed and strengthened our audit topic selection framework to increase its rigour (page 61).
• We restructured our teams to better target our audit effort and maximise our impact throughout the public sector (page 64).
• We established a specialist data analytics strategy and capability team within the office (page 65).

60 Victorian Auditor-General’s Office
Annual Report 2015–16
What we doOur performance audit program provides assurance to Parliament and the public on the effectiveness, efficiency and economy of public sector agencies’ operations and activities, and the extent to which they are complying with relevant legislation.
Performance audits may examine all or part of an agency’s activities, or the activities of a number of agencies. Our audits can find examples of better practice and can identify opportunities for improvement.
Below is a list of all performance audit reports tabled during the year.
August 2015
Unconventional Gas: Managing Risks and Impacts
Applying the High Value High Risk Processes to Unsolicited Proposals
Biosecurity: Livestock
Follow up of Management of Staff Occupational Health and Safety in Schools
Follow up of Managing Major Projects
Follow up of Collections Management in Cultural Agencies
September 2015
Realising the Benefits of Smart Meters
Regional Growth Fund: Outcomes and Learnings
October 2015
Department of Education & Training: Strategic Planning
Delivering Services to Citizens and Consumers via Devices of Personal Choice: Phase 2
December 2015
Access to Public Sector Information
Implementing the Gifts, Benefits and Hospitality Framework
East West Link Project
Responses to Performance Audit Recommendations 2012–13 and 2013–14
February 2016
Victorian Electoral Commission
Public Safety on Victoria’s Train System
Hospital Performance: Length of Stay
Administration of Parole
March 2016
Local Government Service Delivery: Recreational Facilities
Bullying and Harassment in the Health Sector
Patient Safety in Victorian Public Hospitals
Digital Dashboard: Status Review of ICT Projects and Initiatives – Phase 2
Grants to Non-Government Schools
May 2016
Reducing the Burden of Red Tape
Monitoring Victoria’s Water Resources
Managing and Reporting on the Performance and Cost of Capital Projects
June 2016
Follow up of Residential Care Services for Children
Follow up of Asset Confiscation Scheme
Follow up of Recreational Maritime Safety
We tabled 29 of the 35 performance audit reports listed in our Annual Plan 2015–16, three more than our target of 26 performance audit reports. The 29 reports consist of 27 performance audit reports and two Information Systems Audit reports.
Four audits originally planned for delivery in 2015–16 were deferred to either 2016–17 or 2017–18:• Audit committee governance• Diverting young people from the criminal justice system• Effectiveness of school governance• High Value High Risk.
Prospective audits ‘University student management systems’ and ‘Administration of court non-judicial functions’, originally scheduled to be completed in 2015–16, were discontinued after further assessment of the proposed topic.

61
Performance audit
How we do itThe quality of our performance audits is measured and monitored through our performance audit program quality framework.
The quality framework includes:• processes for the selection of performance audit topics• processes for delivering our audits• a standards-based performance audit methodology.
Selection of performance audit topics
We seek to maximise the impact of our performance audits. As part of the process for shortlisting potential topics, we assess the risk and materiality of the activity proposed for examination.
We also consider:• whether we have effectively covered our legislative obligations to review efficiency, effectiveness,
economy and compliance with all relevant Acts, and to consider waste, probity and resource management
• the spread of activity throughout the sectors and selected themes• the number of standalone and other topics • the coordination between our performance audit and financial audit programs.
In 2015–16, we reviewed and strengthened our topic selection framework to increase its rigour, by introducing the following additional criteria:• Potential for our office to have an impact—in examining the potential impact of a particular
topic, we seek to determine if it has the potential to improve the achievement of government’s desired outcomes or program objectives (effectiveness), or the management of public resources (efficiency, economy)
• Potential for our office to address matters of public interest—we consider whether the audit topic has the potential to improve outcomes for key segments of the Victorian community (such as vulnerable people, regional Victoria and Indigenous Australians), or the public’s understanding of high-profile and contentious issues.
Figure 22 provides a high-level illustration of our performance audit topic selection framework.
[Figure 22] Selection of performance audit topics
Correspondence from the community
Develop a draft list of two years of audits
Consult on proposed audit topics with agencies and PAEC
Publish the annual plan
Environmental scanning
Stakeholder consultation
Findings from previous audits
See the our Annual Plan 2016–17 for more discussion of VAGO’s performance audit topics.
62 Victorian Auditor-General’s Office
Annual Report 2015–16
Stakeholder consultation and engagement
We consult widely with parliamentarians, public sector agencies and the community to gather information and ideas, and to discuss the merits and approach of potential audit topics. This helps us target our audits, both at a whole-of-government level and within sectors.
We analyse feedback from stakeholders and the community to identify themes that recur and are highly relevant to our mandate. These themes are fed into our annual planning process for consideration.
Parliament plays a significant part in shaping our audit program. In our 2016 parliamentary survey, half (52 per cent) of all respondents made suggestions in relation to areas for us to focus on, most of which we can group into four main areas:• efficiency/accountability of government service provision (in terms of staff and/ or financial
aspects)• transport/infrastructure• environmental issues• following up on ongoing issues (with follow-up audits).
Delivering our audits
With our thorough approach to gathering and analysing information, briefing agencies and clearing proposed audit reports, each audit typically ranges from six to 10 months in duration. This is why we include a two-year program in our Annual Plan.
After we have consulted on the specification of an audit as part of our annual planning process, we will typically undertake more detailed planning and scoping to refine the criteria and lines of inquiry related to the audit. We normally do this by gathering and reviewing relevant documents and consulting key stakeholders, including agencies, interest groups, academics and others about key matters. We then finalise the specification before commencing the conduct of the audit.
Resourcing our audits
Our performance audits are typically delivered by in-house staff who are trained internally. From time to time, we engage experts to advise our performance audit teams on complex and technical issues.
Standards-based performance audit methodology
We carry out our performance audits using our AmP system, an electronic database which was developed in-house. AmP is used to document work and evidence and assist to manage and review audits.
AmP contains policies, guidance and standard procedures that align with the auditing standards set by the Australian Auditing and Assurance Standards Board.
In 2015–16 VAGO completed an AmP Review project to update our methodology, practice and policies, including the provision of AmP guidance to staff.

63
Performance audit
Challenge Committee
Our Challenge Committee oversees the progress of audits and clarifies any ambiguities to ensure the quality, accuracy, logic and rigour of an audit to determine whether it should progress to the next stage. The committee adds value to the audit process, and to the office more broadly, by identifying opportunities to improve internal processes and common themes in audits.
Debrief process
When a performance audit is completed, we debrief to identify key lessons, issues, and opportunities for improvement. Each audit debrief is considered and discussed by our Challenge Committee.
The lessons and outcomes from audits are shared with staff and used to inform staff training materials.
In 2015–16, several continual improvement actions were identified through the debrief process. These covered a range of areas, including:• stakeholder engagement• alternative ways to approach the resourcing of audit teams• internal process improvements• staff training and development.
Many recommended actions have either been addressed or are the focus of continuing business improvement projects.
Quality assurance
To seek assurance that our audits meet professional and VAGO quality standards, the robustness of the audit process and the quality of the final audit report are reviewed. See page 49 for further information.

64 Victorian Auditor-General’s Office
Annual Report 2015–16
Feedback from audited agencies For every performance audit, we undertake a postaudit survey to find out if audited agencies found the audit valuable. These surveys tell us whether the audited agencies believe the audit will help them to improve their performance.
For performance audits tabled in 2015–16, the average indexed ratings for questions about audit value was 64 per cent, a decrease from 74 per cent in 2014–15. While mostly positive, audit clients were less likely to agree that the audit would help them to improve the performance of the audited activity.
We also ask audited agencies about the performance audit process and performance audit reporting to identify areas for improvement. While the average index score for the performance audit process was consistent with the previous year, the average index score for performance audit reporting fell from 76 per cent in 2014–15 to 73 per cent in 2015–16, with agencies’ perceptions about the balance and fairness of our reports affecting the score.
Extracts from agencies’ responses to our post-audit surveys
The auditors identified useful and constructive recommendations that will improve monitoring of [the audited activity]. The report was thorough and clear on what needed to be improved, why, and the outcomes expected.
… It would also have been [beneficial] to include a project that was running well and on schedule, to highlight any differences in project management skills or capability.
Key developments in 2015–16Performance Audit restructure
As indicated in our Annual Report 2014–15, we reviewed the Performance Audit business unit’s operating structure in early 2015–16 as part of our commitment to continual improvement. In early 2015–16, we introduced a new structure to Performance Audit to better target audit effort, and maximise our impact in the public sector.
After receiving feedback from staff, we further refined the structure in the second half of 2015–16. Our Performance Audit business unit now consists of six teams: • Community safety• Education• Environment
• Health and human services• Infrastructure• Investments.
The new structure encourages greater collaboration across the Performance Audit business unit, as well as innovation in how we select, plan and execute our audits. This structure also recognises that there are some challenges that can only be resolved through a whole-of-government approach, and which cannot be addressed adequately through a traditional sector-based audit structure. By better focusing on the things that matter most, our new structure aims to maximise our impact on improving public sector performance in these critical areas.

65
Performance audit
Improvement projects
Within the Performance Audit business unit, we established six working groups to explore and oversee the implementation of improvement projects identified through reflection on operations, or through the audit debrief process.
The working groups focus on:• strategic audit planning• workforce development• continual improvement/learning and development
• audit resourcing• business information• stakeholder engagement.
Data analytics in audits
In 2015–16, our Information Systems Audit business unit established an advanced analytics strategy and specialist data analytics team. Through the use of new technologies and advanced analytics, the team aims to leverage data to enhance the audit process, reduce audit risks and uncover insights. Recent performance audits that have incorporated data analytics extensively include Hospital Performance: Length of Stay (February 2016), and the ‘Efficiency and Effectiveness of Hospital Services: Emergency Care’ audit currently in progress.
VAGO’s advanced analytics capability will: • enhance typical financial analytics work and develop limited forensic data audit capability to help
improve the effectiveness and efficiency of audits• establish data analytics infrastructure and capability, including skills, competencies, and
resources for data analytics in performance audits• build partnerships with national and international audit analytics user groups in order to share
information• provide auditors with easy-to-use intuitive tools, such as interactive dashboards.
In 2015–16, our data analytics team developed an advanced data analytics strategy and explored suitable tools and systems, leading to the development of a proof of concept. The focus going forward will be the implementation of systems and tools and the building of internal advanced analytic capabilities throughout our office.
Increased flexibility in follow-up audits
In 2015–16, we discontinued our Responses to performance audit recommendations report, after analysing how agencies responded to the report, and finding that we could not always verify agencies’ stated responses. However, we will continue to carry out follow-up audits, choosing each topic after discussions with agencies and reviewing evidence of the actions agencies have implemented in addressing our audit report recommendations. This will give us more flexibility and allow us to target follow-up audits better.
Governance program
We will continue to examine governance issues in the public sector through our Governance Program. The audit stream of the program will examine key governance issues in the Victorian public sector. The stream includes the following audits for 2016–17:• Audit committee governance• Managing public sector records• Board performance
• Internal audit programs• Effectiveness of the Victorian Public Sector
Commission.
We will also examine existing education and better practice activities as part of our ‘Effectiveness of the Victorian Public Sector Commission’ audit, also scheduled for 2016–17.

66 Victorian Auditor-General’s Office
Annual Report 2015–16
Looking forwardTargeted audit program and follow-the-dollar audits
In 2016–17, we plan to table 29 performance audit reports drawn largely from the topics listed in our Annual Plan 2016–17. We remain committed to our follow-up program and intend to review our approach towards the selection of follow-up audit topics. Furthermore, in response to amendments to the Audit Act 1994, we will further review and update our audit procedures as appropriate, to account for our new ‘follow-the-dollar’ powers.
Collaborating with others
We plan to work with other jurisdictions to develop a strategy for the way we conduct concurrent audits, particularly in light of changes to the Audit Act 1994 and our ability to now share more information with other auditor-general offices.
Innovation and continual improvement
We are committed to continuing to improve our performance audit practices. We will build on our improvement projects as follows:• Strategic audit planning—We will explore additional ways to ensure that we are selecting the
most appropriate topics to audit. We will also review how we engage the Victorian community and seek feedback on audit topics that are in the public interest.
• Workforce development—We aim to ensure the quality of our workforce remains strong through ongoing recruitment and succession planning.
• Continual improvement/learning and development—We are committed to providing our workforce with learning and development opportunities that will assist in building their knowledge and skills in performance auditing.
• Audit resourcing—We are reviewing our approaches to resourcing our audits to ensure that we are efficient in our auditing and have the right audit teams for our planned audits.
• Business information—We are reviewing our business reporting to ensure that we have the information we need to make the improvements we are striving for.
• Stakeholder engagement—We are exploring ways to improve our stakeholder engagement, with audited agencies and the broader Victorian community.
• Data analytics—We will continue to build internal advanced analytic capabilities throughout our office.

67
Financial audit
6 Financial audit Relevant strategic objectives
Reports and advice Being authoritative and relevant
Parliament Being highly regarded by Parliament
Here is an overview of our achievements, challenges and future steps for our Financial Audit business unit.
Our challenge in the year ahead
• We did not achieve our target of 100 per cent for the performance measure ‘External/peer reviews finding no material departures from professional and regulatory standards’ (page 14).
• Our average index score for financial audit process decreased by 4 per cent, from 77 per cent in 2014–15 to 73 per cent in 2015–16, with some agencies concerned about the timeliness of the audit program, the continuity of audit staff, and responsiveness to agency needs (page 71).
Next steps
• We will increase our focus on people within the financial audit business unit, particularly around learning and development, reward and recognition, and succession planning (page 72).
• We will change our model for delivery of financial audits, particularly around the extent to which we rely on audit service providers for high-risk, material and/or strategic financial audits (page 72).
• We will continue to enhance our Audit Snapshot reports to Parliament (page 72).
• We will rebase all of our financial audit budgets as part of a cyclical review process (page 72).
Achievements
• Following the issue of a disclaimer of audit opinion on its 2014–15 financial report, the Department of Education & Training (DET) undertook a major remedial work program working in close consultation with our office (page 71).
• We issued the Auditor-General’s review report on the 2016–17 Estimated Financial Statements of the state on 22 April 2016, earlier than in the previous year (page 71).
• We issued 98 per cent of our audit opinions within the statutory deadlines, right on target, despite encountering client delays, several contentious and complex matters, and changes arising from the 2015 machinery-of-government changes (page 14).
• We tabled seven reports on the results of financial audits in Parliament, and a report on financial systems information technology controls (page 68).
• 43 of the 44 recommendations we made were accepted (page 20).
• We issued 539 audit opinions on the financial statements of agencies, and 108 audit opinions on the performance statements of agencies (page 14).

68 Victorian Auditor-General’s Office
Annual Report 2015–16
What we doOur financial audit program delivers a number of assurance services for a range of agencies.
As part of Output Group 1, our financial audit program delivers reports to Parliament on the results of financial audits and on the Annual Financial Report of the State of Victoria.
As part of Output Group 2, our financial audit program delivers audit opinions on financial statements and performance statements of public sector agencies, an opinion on the Annual Financial Report of the State of Victoria and a review report on the estimated financial statements of the State of Victoria.
Eight financial audit reports (including one Information Systems Audit report) listed in our Annual Plan 2015–16 were tabled, as listed below. There were no changes to the proposed program of tabled reports during the year.
October 2015
Financial Systems Controls Report: Information Technology 2014–15
November 2015
Local Government: 2014–15 Audit Snapshot
Auditor-General’s Report on the Annual Financial Report of the State of Victoria, 2014–15
Public Hospitals: 2014–15 Audit Snapshot
December 2016
Water Entities: 2014–15 Audit Snapshot
Portfolio Departments and Associated Entities: 2014–15 Audit Snapshot
May 2016
Universities: 2015 Audit Snapshot
Technical and Further Education Institutes: 2015 Audit Snapshot
How we do itThe objective of each of our annual financial audits is to express an ‘audit opinion’ as to whether the financial report (or other statement as applicable) presents fairly, in all material respects, the financial position and the financial performance of the audited agency, in accordance with applicable Australian Accounting Standards and the relevant legislative financial reporting requirements. When undertaking a financial audit, the Audit Act 1994 requires the Auditor-General to also consider the issues of waste, probity, and the prudent use of public resources.
Our financial audits apply a risk-based audit methodology to ensure that they are performed in accordance with the Australian Auditing Standards and relevant professional and legislative requirements. Each year, our financial auditors review key internal controls over the financial systems of each government agency to assess the risk of material misstatements in the financial report. They also test aspects of controls or activities in detail, to draw out and report on systemic or sector-specific issues.
Selection of areas of audit focus
‘Areas of focus’ are selected for specific review as part of our financial audits, such as governance, probity, fraud, financial prudence and noncompliance. The selected areas of focus are identified in our annual plan, and can result in related commentary being included in our reports to Parliament on the results of financial audits.

69
Financial audit
Delivering our audits
Resourcing
Our financial audits are conducted by our staff, or with the assistance of externally engaged firms. All financial audits conducted with the assistance of external firms known as audit service providers (ASPs) are subject to project management and quality assurance by our staff, and all audit opinions are issued by the Auditor-General.
The mix of resources we use to deliver our financial audit program changes over time based on multiple factors. In 2015–16, approximately 33 per cent of our audits were undertaken by our staff, with the remaining 67 per cent undertaken with the assistance of ASPs, as shown in Figure 23.
[Figure 23] Audits conducted in 2015–16, by materiality, risk and sourcing model
Materiality and audit riskIn-house (number)
Audit service provider assisted
(number)Total
(number)
Material entity audits
High risk 10 4 14
Moderate risk 17 15 32
Low risk 0 1 1
Total material entity audits 27 20 47
Non-material entities
High risk 3 12 15
Moderate risk 56 130 186
Low risk 100 208 308
Total non-material entity audits 159 350 509
Total audits 186 370 556
Note: Based on data as at 30 June 2016.
The criteria we use to determine the resourcing of financial audits includes:• Materiality
Considerations of materiality also includes material agencies, which are those whose revenue, expenses, assets and/or liabilities are significant to the State of Victoria’s annual financial report.
• Risk profile An agency’s risk profile also includes audit risk. This is the risk that an inappropriate audit opinion is issued on a financial report.
• Strategic value of the agency An agency’s strategic value is assessed in terms of its strategic importance to the state or relevant sector as a whole. For example, this includes the significance of its role in the state’s budget strategy, as set out in the State Budget Papers.
Risk-based financial audit methodology
To ensure that our financial audits are performed in accordance with the Australian Auditing Standards and relevant professional and legislative requirements, our financial audit methodology is integrated into our electronic audit toolset, Integrated Public Sector Audit Methodology, which was developed with the Queensland Audit Office, and is in use in four other Australian jurisdictions.

70 Victorian Auditor-General’s Office
Annual Report 2015–16
Methodology for reviewing the estimated financial statements
Our review of the state’s estimated financial statements uses the principles in ASAE 3450 Assurance Engagements involving Corporate Fundraising, and/or Prospective Financial Information.
Technical Issues Committee
Our Technical Issues Committee provides advice and recommendations to the Auditor-General on proposed modifications to financial audit opinions, the appropriate policy or guidance that we should adopt in relation to significant financial reporting and auditing issues, and issues affecting our legislative mandate.
The committee comprises the Assistant Auditor-General, Standards and Quality, the Assistant Auditor-General, Financial Audit, the Standards and Quality Director, the relevant Financial Audit Sector Director responsible for the audits under consideration, and an independent Financial Audit Sector Director.
Technical Panel
Our Technical Panel was established in June 2015 to inform and discuss the following matters with the Auditor-General and Deputy Auditor-General/Chief Executive Officer:• current accounting and auditing technical issues• current developments and emerging issues in the accounting and auditing technical profession,
and our office’s responses to these matters• current and planned activities to address technical issues, including audit quality reviews and
training• current and planned activities of the ACAG Financial Reporting and Auditing Committee and
other relevant professional bodies, including the status of responses to standard-setting bodies.
Our Technical Panel generally meets every month, and provides a forum to capture feedback from the Auditor-General and Deputy Auditor-General on the above matters.
Challenge Committee
Our Challenge Committee reviews the progress and completion of financial audit parliamentary reports at key points in their development to ensure their quality, accuracy, logic and rigour. The committee then determines if the approach and the report are of a sufficiently high standard to progress to the next phase, or for documentation to be issued to relevant agencies.
Debrief process
At the end of every financial audit parliamentary report, we conduct an audit debrief process to identify positives and areas for improvement, which are considered in future activities. Each audit debrief is given careful consideration by our Challenge Committee.
Quality assurance
To seek assurance that our audits meet professional and VAGO quality standards, our audits are reviewed by external or peer reviewers both in relation to the robustness of the audit process, and the quality of the final audit report. See page 49 for further information.

71
Financial audit
Feedback from audited agencies Every second year we survey chief financial officers, and ask about the value they obtain from their financial audits.
In 2015–16, the average indexed rating for questions about audit value was 76 index points, which was consistent with the results for 2013–14 survey. Feedback from most financial audit clients was positive about the value of the audit, and in particular, many clients indicated that the audit provided assurance and confidence in relation to the financial processes of their organisation
We also survey the chief financial officers about the financial audit process and financial audit reporting to identify areas for improvement. While the average index score for financial audit reporting to agencies was consistent with the previous survey, the average index score for financial audit process decreased from 77 per cent to 73 per cent, 4 per cent lower than the last time the survey was run in 2013–14. While professionalism and skills of staff continue to score well, some agencies were concerned about the timeliness of the audit program, the continuity of audit staff, and responsiveness to agency needs. We discussed feedback received with our agency contacts where relevant, in part to clarify that feedback, and any action we may take in response as appropriate.
Extracts from agencies responses to our post-audit surveys
We value VAGO’s observations on our financial statements—they raise issues that we sometimes overlook.
Recommendations are well received and respected within our organisation.
Key developments in 2015–16Contentious and complex matters
In 2015–16, we encountered several contentious and complex matters during a financial reporting cycle that had been influenced by the 2015 machinery-of-government changes. This resulted in a disclaimer of audit opinion on the 2014–15 financial report of the Department of Education & Training (DET).
Pleasingly, we note that DET has undertaken a major program of work throughout 2015–16 to systematically address the matters raised by our audit. This has included a revaluation of all land and buildings, a review and cleanse of asset records and a new assurance regime over school based transactions has been developed and is being implemented. This program of work has been assigned a very high priority by DET.
Our review of the State of Victoria’s 2016–17 Estimated Financial Statements was completed over a week earlier than in the previous year. This is a substantial achievement, given that the already tight deadlines for this review had been further tightened and some contentious matters were considered as part of that review. This led to the Auditor-General issuing an emphasis-of-matter paragraph.
Financial audit re-orientation
The re-orientation of our financial audit business unit undertaken in 2015–16 included a review of the model for the delivery of audits, which considered the optimal resourcing model for the conduct of financial audits—that is, using internal resources or undertaking audits with the assistance of ASPs. This project will result in the delivery of a larger proportion of higher-risk, material and/or strategic financial audits using internal resources, and will benefit our office in several ways, including increasing control and oversight and consistency of approach to the more significant audits, reducing risk and increasing assurance.
In addition, we successfully managed the implementation of our new ASP panel arrangements.

72 Victorian Auditor-General’s Office
Annual Report 2015–16
Looking forward Targeted audit program
We plan to table seven financial audit snapshot reports and one information technology financial systems controls report in 2016–17. We expect to issue 555 audit opinions on financial statements and 111 audit opinions on performance statements.
Innovation and continual improvement
We are committed to continual improvement in our financial audit practice and have identified the following three areas of focus for 2016–17.
People
Our focus will particularly be on learning and development (including developing and rolling out the financial audit training curriculum), reward and recognition, and succession planning.
Product
We will continue to enhance our financial audit reports to Parliament, including how we develop focus areas and analyse financial sustainability. We will continue to change our model for delivering financial audits, particularly the extent to which we rely on ASPs for high-risk, material and/or strategic financial audits. Also, we will implement an updated audit sampling methodology to enhance our audit approach to tests of details. We will further consider introducing enhanced audit reports (opinions), as envisaged under the Auditing and Assurance Standards Board Enhanced Audit Reporting framework.
Process
We will review how we supervise our ASPs.
In addition, we will rebase all of our financial audit budgets as part of a cyclical review process.

73
Our financial management
7 Our financial management
Financial performanceOur net financial result for the year as shown in Figure 24 was a surplus of $83 000 (compared with a surplus of $537 000 in 2014–15).
[Figure 24] Revenues and expenses, 2011–12 to 2015–16
Item2015–16
($’000)2014–15
($’000)2013–14
($’000)2012–13
($’000)2011–12
($’000)
Revenue
General appropriation 15 789 15 404 15 179 14 661 13 959
Special appropriation 576 541 495 362 456
Section 29 24 732 23 536 23 191 23 136 22 547
Section 32 carry-over – – – 344 –
Other 286 217 89 151 158
Total revenue 41 383 39 698 38 954 38 654 37 120
Total expenses 41 300 39 161 38 994 37 197 36 542
Surplus/(deficit) 83 537 (40) 1 457 578
Revenue
We are funded through Parliamentary appropriations and Financial Management Act 1994 section 29 revenue (as shown in Figure 25).
Revenue increased 4 per cent in 2015–16 because of increases in inflation in respect of general appropriation, and increases in internally generated Section 29 revenue as a result of increases in the recovery of audit service providers (ASP) costs. Other revenue increased as a result of recovering additional costs from our staff seconded to other agencies.
[Figure 25] Sources of VAGO funding, 2011–12 to 2015–16
10
20
30
40
50
2011–12 2012–13 2013–14 2014–15 2015–16
General appropriation Special appropriation Section 29Section 32 Other
$ million
Note: See Figure 24 for breakdown.
Relevant strategic objective
Organisation Leverage our systems and processes to improve organisational performance.

74 Victorian Auditor-General’s Office
Annual Report 2015–16
Expenses
Our office spends most of its budget on employees, contract audit services (including ASPs) and miscellaneous expenses, such as accommodation, supplies and services.
As shown in Figure 26, spending increased 5 per cent in 2015–16, mainly as a result of ASPs’ fees and staff salaries—despite annualised FTE declining from 184.4 to 182.2. We also spent more on consultants, human resources recruitment fees, PwC internal audit fees, and legal fees.
[Figure 26] Expenses, 2011–12 to 2015–16
10
20
30
40
50
2011–12 2012–13 2013–14 2014–15 2015–16
Employee expenses Depreciation and amortisationContract audit services AccommodationOther operating expenses
$ million
Note: See Figure 27 for breakdown.
[Figure 27] Expenses from ordinary activities, 2011–12 to 2015–16
Item2015–16
($’000)2014–15
($’000)2013–14
($’000)2012–13
($’000)2011–12
($’000)
Expenses
Depreciation and amortisation 657 765 753 802 732
Employee expenses 23 715 23 238 21 714 19 587 18 917
Contract audit services 11 893 10 446 11 652 11 956 11 531
Rental expenses – accommodation 1 520 1 514 1 509 1 462 1 477
Other expenses 3 515 3 198 3 366 3 390 3 885
Total expenses(a) 41 300 39 161 38 994 37 197 36 542
(a) Gross including secondment costs.

75
Our financial management
Output resultsOutput Group 1—Parliamentary reports and services
Output revenue increased by $0.4 million, in line with inflation. Output costs were lower by $1.1 million due to lower salaries from unfilled staff positions and lower contractor costs, offset by higher consulting and internal audit fees.
Output Group 2—Audit reports on financial statements
Output revenue increased by $1.3 million, mainly due to increased ASPs’ fee recovery. Output costs are higher by $3.2 million, largely due to higher ASPs’ fees ($1.4 million) and higher employee entitlements ($1.7 million).
[Figure 28] Total revenues and expenses attributed to outputs, 2014–15 and 2015–16
2015–16 2014–15
Output GroupRevenue
($’000)Expenses(a)
($’000)Net result
($’000)Revenue
($’000)Expenses(a)
($’000)Net result
($’000)
1. Parliamentary reports and services
16 239 15 151 1 088 15 840 16 221 (381)
2. Audit reports on financial statements
25 144 26 149 (1 005) 23 858 22 940 918
Total 41 383 41 300 83 39 698 39 161 537
(a) Gross including secondment costs.
Financial positionAs shown in Figure 29, our financial position at 30 June 2016 remained strong, with total assets of $18.3 million, total liabilities of $9.6 million and net assets of $8.7 million.
Assets
Total financial assets increased by $1.9 million due to an increase in the SAU asset (inter-agency balance). This is, in turn, due to a corresponding increase in liabilities (see comments below).
Non-financial assets reduced by $0.4 million from a declining asset base.
Liabilities
Total payables increased by $0.6 million, mainly from higher supplier costs and accrued salaries from more days leading to 30 June, offset by early payment of some creditors.
Lease liabilities were higher ($0.1 million) due to increased purchase of motor vehicles.
Provisions have increased by $0.7 million. This is mostly attributable to increased employee entitlement provisions from higher annual leave and long service leave. This is partly a result of new staff bringing additional entitlements as they join our office. Our accommodation make-good provision of $0.6 million switched from non-current to current because our lease is due to expire on 31 March 2017.

76 Victorian Auditor-General’s Office
Annual Report 2015–16
Net assets
Net assets increased by $0.1 million from the resultant operating surplus.
[Figure 29] Asset and liability movement, 2011–12 to 2015–16
Item2015–16
($’000)2014–15
($’000)2013–14
($’000)2012–13
($’000)2011–12
($’000)
Financial assets 16 962 15 019 13 965 12 930 10 755
Non-financial assets 1 386 1 803 2 326 2 518 2 690
Total assets 18 348 16 822 16 291 15 448 13 445
Total liabilities 9 654 8 211 8 217 7 333 6 787
Net assets 8 694 8 611 8 074 8 115 6 658
Other financial mattersFinancial report
Under Standing Direction 4.2 of the Financial Management Act 1994, the financial statements of government departments must be presented fairly and in accordance with the requirements in the model financial report. This annual report complies with this requirement.
Consultancies
In 2015–16, we engaged one consultancy where the total fees payable were greater than $10 000. Details of this consultancy are outlined in Figure 30. We also engaged seven consultancies where the total fees payable were less than $10 000, with total expenditure of $26 000 (excluding GST).
[Figure 30] Details of individual consultancies—payments in excess of $10 000, 2015–16
ConsultantPurpose of consultancy Start date End date
Total approved
project fee (excluding
GST)
Expenditure 2015–16
(excluding GST)
Future expenditure
(excluding GST)
Aginic Advice on data analytics software
20 April 2016
20 May 2016
$46 000 $46 000 –

77
Our financial management
Performance audit contractors
In 2015–16, we paid $0.54 million ($0.45 million in 2014–15) to 17 contractors for services related to our performance audits (See Figure 31).
[Figure 31] Payments to performance audit contractors, 2014–15 and 2015–16
Performance audit contractor2015–16
($’000)2014–15
($’000)
Australian Survey Research Group Proprietary Limited 45 13
Chappell Dean Proprietary Limited 77 29
Clear Horizon Consulting Proprietary Limited 108 77
Deakin University 0 12
EMI Partners 0 10
E W Russell & Associates Proprietary Limited 16 16
Guidera Consulting Group Proprietary Limited 77 0
J H Resources Proprietary Limited 0 29
O’Connor Marsden & Associates Proprietary Limited 0 21
Orima Research Proprietary Limited 30 43
Ovum Proprietary Limited 24 21
P S Consulting 0 47
Paul Edney 20 0
P G Rorke 46 59
Pitt Group 0 34
Security Infrastructure Solutions 68 0
Wallis 0 22
Other—Seven service providers (three in 2014–15) 29 16
Total 540 449

78 Victorian Auditor-General’s Office
Annual Report 2015–16
Financial audit service providers
In 2015–16, we paid $11.4 million ($10.0 million in 2014–15) to 27 audit firms that provided services related to our financial statement audits (see Figure 32).
[Figure 32] Payments to financial audit service providers, 2015–16
Financial Audit Service Provider (ASP)2015–16
($’000)2014–15
($’000)
Accounting and Auditing Solutions 47 66
Coffey Hunt Audit 411 466
Crowe Horwath 461 838
Crowe Horwath Albury 428 336
Crowe Horwath Vic 706 478
Crowe Horwath West Vic 215 0
Davidsons Assurance Services Proprietary Limited 56 57
Deloitte Touche Tohmatsu 92 401
DFK Kidsons 74 110
DMG Audit and Advisory 178 75
Ernst & Young 1 163 846
Grant Thornton Audit Proprietary Limited 76 90
HLB Mann Judd (VIC Partnership) 2 365 2,013
Johnsons MME 227 278
KPMG 370 6
LD Assurance 102 128
McLean Delmo Bentleys Proprietary Limited 812 186
MGR Accountants Proprietary Limited 17 62
Pricewaterhousecoopers (Vietnam) Limited 38 34
RSD Advisors 1 102 982
RSM Australia Proprietary Limited (previously RSM Bird Cameron)
2 288 1 551
UHY Haines Norton Melbourne Proprietary Limited 16 872
University of Melbourne(a) 82 81
Other—four service providers (two in 2014–15) 28 41
Total 11 354 9 997
Note: The University of Melbourne was engaged to assist in the review of the estimated financial statements. The University of Melbourne is also one of the agencies the Auditor-General is required to audit, and it has not been engaged by VAGO directly or indirectly to audit its own financial statements.
79
Financial report
Financial report
Declaration 80
Independent auditor’s report 81
Comprehensive operating statement 82
Balance sheet 83
Statement of changes in equity 84
Cash flow statement 85
Notes the financial statements 86
1 Summary of significant accounting policies 86
2 Departmental (controlled) outputs 101
3 Administered (non-controlled) items 103
4 Income from transactions 104
5 Expenses from transactions 105
6 Other economic flows included in net result 106
7 Receivables 106
8 Property, plant and equipment 107
9 Intangible assets 110
10 Prepayments and accrued income 110
11 Payables 111
12 Borrowings 111
13 Provisions 112
14 Superannuation 113
15 Leases 114
16 Commitments for expenditure 115
17 Contingent assets and contingent liabilities 115
18 Financial instruments 116
19 Cash flow information 119
20 Summary of compliance with annual Parliamentary and special appropriations 120
21 Responsible persons 121
22 Remuneration of executives 122
23 Remuneration of auditors 123
24 Subsequent events 123
25 Glossary of terms and style conventions 124

80 Victorian Auditor-General’s Office
Annual Report 2015–16
DeclarationAccountable Officer’s and Chief Financial Officer’s declaration
The attached financial statements for the Victorian Auditor-General’s Office (VAGO) have been prepared in accordance with Standing Direction 4.2 of the Financial Management Act 1994, applicable Financial Reporting Directions, Australian Accounting Standards including Interpretations, and other mandatory professional reporting requirements.
We further state that, in our opinion, the information set out in the comprehensive operating statement, balance sheet, statement of changes in equity, cash flow statement and accompanying notes, presents fairly the financial transactions during the year ended 30 June 2016 and financial position of VAGO at 30 June 2016.
At the time of signing, we are not aware of any circumstance which would render any particulars included in the financial statements to be misleading or inaccurate.
We authorise the attached financial statements for issue on 9 August 2016.
Dr Peter Frost Acting Auditor-General Victorian Auditor-General’s Office
Melbourne 9 August 2016
Chiang Yip Chief Financial Officer Victorian Auditor-General’s Office
Melbourne 9 August 2016

81
Financial report
Independent auditor’s report

82 Victorian Auditor-General’s Office
Annual Report 2015–16
Comprehensive operating statementfor the financial year ended 30 June 2016
Note 2015–16 2014–15
$'000 $'000Income from transactions
)a(4snoitairporppa tuptuO 40,521 38,940)b(4snoitairporppa laicepS 576 541)c(4secivres dna sdoog fo elaS 253 182
Fair value of services received free of charge or for nominal consideration
4(d) 33 35
383,14snoitcasnart morf emocni latoT 39,698
Expenses from transactions)a(5sesnepxe eeyolpmE 23,715 23,238)b(5noitasitroma dna noitaicerpeD 657 765)c(5esnepxe tseretnI 15 33
Capital asset charge 120 117Fair value of services provided free of charge or for nominal consideration
- 75
Contract audit services 11,893 10,446Rental expenses – accommodation 1,520 1,514Recruitment and training 634 531
)d(5sesnepxe gnitarepo rehtO 2,673 2,358822,14snoitcasnart morf sesnepxe latoT 39,077
551)ecnalab gnitarepo ten( snoitcasnart morf tluser teN 621
Other economic flows included in net resultNet gain / (loss) on non-financial assets (i) 6(a) 24 (10)Other gains / (losses) from other economic flows 6(b) (96) (75)
)27(tluser ten ni dedulcni swolf cimonoce rehto latoT (84)
Net result 83 537
38tluser evisneherpmoC 537
(i)
The comprehensive operating statement should be read in conjunction with the accompanying notes 1 to 25.
'Net gain / (loss) on non-financial assets' includes realised gains / (losses) from disposals of all physical assets.

83
Financial report
Balance sheetas at 30 June 2016
Note 2015–16 2014–15$'000 $'000
AssetsFinancial assets
Cash 19(a) 1 17selbavieceR 16,961 15,018
Total financial assets 16,962 15,019
Non-financial assets8tnempiuqe dna tnalp ,ytreporP 810 1,2409stessa elbignatnI 94 5101emocni deurcca dna stnemyaperP 481 511
Total non-financial assets 1,386 1,802
Total assets 18,348 16,822
Liabilities11selbayaP 2,130 1,51921sgniworroB 292 19731snoisivorP 7,232 6,495
Total liabilities 9,654 8,211
Net assets 8,694 8,611
EquityAccumulated surplus 8,398 8,315Contributed capital 295 295
Net worth 8,694 8,611
61erutidnepxe rof stnemtimmoC71seitilibail tnegnitnoc dna stessa tnegnitnoC
The balance sheet should be read in conjunction with the accompanying notes 1 to 25.

84 Victorian Auditor-General’s Office
Annual Report 2015–16
Statement of changes in equityfor the financial year ended 30 June 2016
Accumulated Contributed TOTALsurplus capital
$'000 $'000 $'000
Balance at 1 July 2014 7,779 295 8,074
Net result for the year 537 - 537
Balance at 30 June 2015 8,315 295 8,611
Net result for the year 83 - 83
Balance at 30 June 2016 8,398 295 8,694
The statement of changes in equity should be read in conjunction with the accompanying notes 1 to 25.

85
Financial report
Cash flow statementfor the financial year ended 30 June 2016
Note 2015–16 2014–15$'000 $'000
Cash flows from operating activitiesReceiptsReceipts from government 41,836 40,782Receipts from other entities 253 182
090,24stpiecer latoT 40,964
PaymentsPayments to suppliers and employees (40,853) (39,797)Goods and Services Tax paid to the ATO (i) (966) (809)Capital asset charge payments (120) (117)Interest paid - (13)
)939,14(stnemyap latoT (40,735)Net cash flows from / (used in) operating activities 19(b) 151 229
Cash flows from investing activitiesPurchases of non-financial assets (381) (187)Sales of non-financial assets 135 4
)642(seitivitca gnitsevni )ni desu( / morf swolf hsac teN (183)
Cash flows from financing activitiesProceeds from finance leases 278 40Repayment of finance leases (182) (86)
59seitivitca gnicnanif )ni desu( / morf swolf hsac teN (46)
Net increase / (decrease) in cash held - -Cash at the beginning of the financial year 1 1Cash at the end of the financial year 19(a) 1 1
(i)
The above cash flow statement should be read in conjunction with the accompanying notes 1 to 25.
Goods and Services Tax paid to the ATO is presented on a net basis.

86 Victorian Auditor-General’s Office
Annual Report 2015–16
Notes to financial statementsNote 1. Summary of significant accounting policies
These annual financial statements represent the audited general purpose financial statements for the Victorian Auditor-General's Office (VAGO) for the year ending 30 June 2016. The purpose of the report is to provide users with information about VAGO's stewardship of resources entrusted to it.
(a) Statement of compliance These general purpose financial statements have been prepared in accordance with the Financial
Management Act 1994 (FMA) and applicable Australian Accounting Standards (AAS) which include Interpretations, issued by the Australian Accounting Standards Board (AASB). In particular, they are presented in a manner consistent with the requirements of the AASB 1049 Whole of Government and General Government Sector Financial Reporting.
Where appropriate, those AASs paragraphs applicable to not-for-profit entities have been applied.
Accounting policies are selected and applied in a manner which ensures that the resulting financial information satisfies the concepts of relevance and reliability, thereby ensuring that the substance of the underlying transactions or other events is reported.
To gain a better understanding of the terminology used in these financial statements, a glossary of terms and style conventions can be found in Note 25.
These annual financial statements were authorised for issue by Dr Peter Frost (Acting Auditor-General) and Chiang Yip (Chief Financial Officer) on 9 August 2016.
(b) Basis of accounting preparation and measurement The accrual basis of accounting has been applied in the preparation of these financial statements, whereby
assets, liabilities, equity, income and expenses are recognised in the reporting period to which they relate, regardless of when cash is received or paid.
Judgements, estimates and assumptions are required to be made about the carrying values of assets and liabilities that are not readily apparent from other sources. The estimates and associated assumptions are based on professional judgements derived from historical experience and various other factors that are believed to be reasonable under the circumstances. Actual results may differ from these estimates.
Those judgements, estimates and assumptions that have the most significant effect on the amounts recognised in the financial report are included in the following notes:
• Notes 8 and 9—estimated useful life of major classes of property, plant and equipment, and intangible assets; and
• Note 13—wage inflation and discount rate used in the measurement of employee entitlements.
Revisions to accounting estimates are recognised in the period in which the estimate is revised and also in future periods that are affected by the revision. Judgements and assumptions made by management in the application of AASs that have significant effects on the financial statements and estimates, with a risk of material adjustments in the next year, are disclosed throughout the notes to the financial statements.
These financial statements are presented in Australian dollars, the functional and presentation currency of VAGO.
This report has been prepared in accordance with the historical cost convention. Historical cost is based on the fair values of the consideration given in exchange for assets.
Consistent with AASB 13 Fair Value Measurement, VAGO determines the policies and procedures for recurring fair value measurements such as property, plant and equipment, and financial instruments, in accordance with the requirements of AASB 13 and the relevant Financial Reporting Directions.
All assets and liabilities for which fair value is measured or disclosed in the financial statements are categorised within the fair value hierarchy, described as follows, based on the lowest level input that is significant to the fair value measurement as a whole:
• Level 1 — Quoted (unadjusted) market prices in active markets for identical assets or liabilities; • Level 2 — Valuation techniques for which the lowest level input that is significant to the fair value
measurement is directly or indirectly observable; and • Level 3 — Valuation techniques for which the lowest level input that is significant to the fair value
measurement is unobservable.

87
Financial report
For the purpose of fair value disclosures, VAGO has determined classes of assets and liabilities on the basis of the nature, characteristics and risks of the asset or liability and the level of the fair value hierarchy as explained above.
In addition, VAGO determines whether transfers have occurred between levels in the hierarchy by re-assessing categorisation (based on the lowest level input that is significant to the fair value measurement as a whole) at the end of each reporting period.
(c) Reporting entity
The financial statements cover VAGO as an individual reporting entity. Its address is: Level 24, 35 Collins Street, Melbourne VIC 3000
VAGO is an administrative agency acting on behalf of the Crown.
The financial statements include all the controlled activities of VAGO.
A description of the nature of VAGO's operations and its principal activities is included in the report of operations, which does not form part of these financial statements.
Objectives and funding
The main purpose of VAGO is to provide assurance to Parliament on the accountability and performance of the Victorian public sector.
VAGO is predominantly funded by accrual-based Parliamentary appropriations for the provision of pre-agreed outputs. Its financial audit function is provided on a fee-for-service basis and the revenue generated is treated as administered revenue.
VAGO's outputs
VAGO has 2 outputs:
• Parliamentary reports and services • Audit reports on financial statements.
Information about VAGO's outputs is set out in Note 2.
(d) Administered items VAGO administers but does not control certain resources of the state. It is accountable for the transactions
involving those administered resources, but does not have the discretion to deploy the resources for achievement of VAGO's objectives. For these resources, VAGO acts only as an agent of the Victorian Government. Administered resources are accounted for using the accrual basis of accounting.
The administered resources of VAGO are primarily audit fees raised from performing attest audits and relate to the activities of the output 'Audit reports on financial statements'. (also refer Note 2).
Transactions and balances relating to these administered resources are not recognised as VAGO's income, expenses, assets or liabilities within the body of the financial statements, but are disclosed in Note 3. Except as otherwise disclosed, administered items are accounted for on the same basis and using the same accounting policies as for departmental items. Both controlled and administered items of VAGO are consolidated into the financial statements of the state.
(e) Scope and presentation of financial statements Comprehensive operating statement
The comprehensive operating statement comprises two components, being 'net result from transactions' (or termed as 'net operating balance') and 'other economic flows included in net result'. The sum of these two represents the net result.
The net result is equivalent to profit or loss derived in accordance with AASs.
'Other economic flows' are changes arising from market remeasurements. They include:
• gains and losses from disposals of non-financial assets; • revaluations and impairments of non-financial physical and intangible assets; and • revaluation of the long service leave liability.

88 Victorian Auditor-General’s Office
Annual Report 2015–16
Notes to financial statementsNote 1. Summary of significant accounting policies (continued)
This classification is consistent with the whole of government reporting format and is allowed under AASB 101 Presentation of Financial Statements.
Balance sheet
Assets and liabilities are presented in liquidity order with assets aggregated into financial assets and non-financial assets.
Current and non-current assets and liabilities are disclosed in the notes, where relevant. In general, non-current assets or liabilities are expected to be recovered or settled more than 12 months after the reporting period, except for the provisions of employee benefits, which are classified as current liabilities if VAGO does not have the unconditional right to defer the settlement of the liabilities within 12 months after the end of the reporting period.
Statement of changes in equity
The statement of changes in equity presents reconciliations of non-owner and owner changes in equity from opening balances at the beginning of the reporting period to the closing balances at the end of the reporting period. It also shows separately changes due to amounts recognised in the 'Comprehensive result' and amounts related to 'Transactions with owner in its capacity as owner' .
Cash flow statement
Cash flows are classified according to whether or not they arise from operating, investing or financing activities. This classification is consistent with requirements under AASB 107 Statement of Cash Flows.
Rounding
Amounts in the financial statements have been rounded to the nearest $1 000, unless otherwise stated. Figures in the financial statements may not equate due to rounding. Please refer to the end of Note 25 for a style convention for explanations of minor discrepancies resulting from rounding.
(f) Income from transactions Income is recognised to the extent that it is probable that the economic benefits will flow to the entity and the
income can be reliably measured.
Appropriation income
Appropriated income becomes controlled and is recognised by VAGO when it is appropriated from the Consolidated Fund by the Victorian Parliament and applied to the purposes defined under the relevant appropriations act. Additionally, VAGO is permitted under section 29 of the FMA to have certain income annotated to the annual appropriation. The income which forms part of a section 29 agreement is recognised by VAGO and the receipts paid into the Consolidated Fund as an administered item. At the point of income recognition, section 29 provides for an equivalent amount to be added to the annual appropriation, which is then available for application.
Where applicable, amounts disclosed as income are net of returns, allowances, duties and taxes. All amounts of income over which VAGO does not have control are disclosed as administered income in the schedule of administered income and expenses (see Note 3). Income is recognised for each of VAGO's major activities as follows:
Output appropriations
Income from the outputs VAGO provides to Parliament is recognised when those outputs have been delivered and the Minister for Finance and the Treasurer have certified delivery of those outputs in accordance with specified performance criteria.
Special appropriations
Under section 94A(6) of the Constitution Act 1975, revenue related to costs associated with the Auditor-General is recognised when the amount appropriated for that purpose is due and payable by VAGO.

89
Financial report
Sale of goods and services
Income from the supply of services
Income from the supply of services is recognised by reference to the stage of completion of the services being performed. The income is recognised when:
• the amount of the income, stage of completion and transaction costs incurred can be reliably measured; and
• it is probable that the economic benefits associated with the transaction will flow to VAGO.
Under the stage of completion method, income is recognised by reference to labour hours supplied.
Income from sale of goods
Income from the sale of goods is recognised when:
• VAGO no longer has any of the significant risks and rewards of ownership of the goods transferred to • the buyer; • VAGO no longer has continuing managerial involvement to the degree usually associated • with ownership nor effective control over the goods sold; • the amount of income, and the costs incurred or to be incurred in respect of the transactions, • can be reliably measured; and • it is probable that the economic benefits associated with the transaction will flow to VAGO.
Sale of goods and services includes regulatory fees which are recognised at the time the regulatory fee is billed.
Fair value of services received free of charge or for nominal consideration
Contributions of services received free of charge or for nominal consideration are recognised at fair value when control is obtained over them, irrespective of whether these contributions are subject to restrictions or conditions over their use. Contributions in the form of services are only recognised when a fair value can be reliably determined and the services would have been purchased if not received as a donation.
(g) Expenses from transactions Expenses from transactions are recognised as they are incurred, and reported in the financial year to which
they relate.
Employee expenses
Refer to the section in Note 1(m) regarding employee benefits.
These expenses include all forms of considerations given by VAGO in exchange for service rendered by employees or for the termination of employment. This includes wages and salaries, superannuation, fringe benefits tax, leave entitlements, termination payments and WorkCover premiums.
Superannuation
The amount recognised in the comprehensive operating statement is the employer contributions for members of both defined benefit and defined contribution superannuation plans that are paid or payable during the reporting period.
The Department of Treasury and Finance (DTF) in its annual financial statements, discloses on behalf of the state as the sponsoring employer, the net defined benefit cost related to the members of these plans as an administered liability. Refer to DTF’s annual financial statements for more detailed disclosures in relation to these plans.

90 Victorian Auditor-General’s Office
Annual Report 2015–16
Notes to financial statementsNote 1. Summary of significant accounting policies (continued)
Depreciation and amortisation
All plant and equipment and other non-financial physical assets (excluding items under operating leases and assets held for sale) that have finite useful lives are depreciated. Depreciation is generally calculated on a straight-line basis, at rates that allocate the asset’s value, less any estimated residual value, over its estimated useful life. Refer to Note 1(l) for the depreciation policy for leasehold improvements.
The estimated useful lives, residual values and depreciation method are reviewed at the end of each annual reporting period, and adjustments made where appropriate.
Intangible produced assets with finite useful lives are amortised as an expense from transactions on a straight-line basis over the asset's useful life.
Depreciation begins when the asset is available for use, that is, when it is in the location and condition necessary for it to be capable of operating in the manner intended by management.
Note 8 provides details on the estimated useful lives that are used in the calculation of depreciation and amortisation on property, plant and equipment. Note 9 provides details on the estimated useful lives that are used in the calculation of amortisation on intangible assets.
Interest expense
Interest expense represents costs incurred in connection with borrowings. It includes interest components of finance lease repayments, and the increase in financial liabilities and non-employee provisions due to the unwinding of discounts to reflect the passage of time.
Interest expense is recognised in the period in which it is incurred. Refer to Note 25 for an explanation of interest expense items.
Capital asset charge
A charge levied on the written down value of controlled non current physical assets in a department’s balance sheet which aims to: attribute to agency outputs the opportunity cost of capital used in service delivery; and provide incentives to departments to identify and dispose of underutilised or surplus assets in a timely manner. The capital asset charge is calculated on the budgeted carrying amount of applicable non financial physical assets.
Other operating expenses
Other operating expenses generally represent the day-to-day running costs incurred in normal operations and include:
Contract audit services, rental expenses—accommodation, recruitment and training and other operating expenses
Contract audit services, rental expenses—accommodation, recruitment and training and other operating expenses are recognised as an expense in the reporting period in which they are incurred.
Fair value of services provided free of charge or for nominal consideration
Contributions of resources provided free of charge or for nominal consideration are recognised at their fair value when the transferee obtains control over them, irrespective of whether restrictions or conditions are imposed over the use of the contributions.
Contributions in the form of services are only recognised when a fair value can be reliably determined and the services would have been purchased if not donated.
(h) Other economic flows included in net result Other economic flows measure changes in the volume or value of assets or liabilities that do not result from
transactions.
Net gain / (loss) on non-financial assets
Net gain / (loss) on non-financial assets and liabilities includes realised and unrealised gains and losses as follows:
Net gain / (loss) on disposal of non-financial assets
Any gain or loss on the disposal of non-financial assets is recognised at the date of disposal and is determined after deducting the proceeds from the carrying value of the asset at that time.
91
Financial report
Net profits or losses on disposal of motor vehicles held under finance leases are treated as a controlled item, and disclosed in the comprehensive operating statement.
When any other type of plant and equipment is disposed of, the disposal proceeds are treated as an administered item, being remitted to the Consolidated Fund according to the provisions of the FMA. The written down value of such disposals is treated as a controlled item, being debited to contributed capital, according to the provisions of Financial Reporting Direction 119 Contributions by Owners.
Impairment of non-financial assets
Assets are assessed annually for indications of impairment, except for non-financial physical assets held for sale.
If there is an indication of impairment, the assets concerned are tested as to whether their carrying value exceeds their recoverable amount. Where an asset’s carrying value exceeds its recoverable amount, the difference is written off as an other economic flow.
If there is an indication that there has been a reversal in the estimate of an asset’s recoverable amount since the last impairment loss was recognised, the carrying amount shall be increased to its recoverable amount. The impairment loss is reversed only to the extent that the asset’s carrying amount does not exceed the carrying amount that would have been determined, net of depreciation or amortisation, if no impairment loss had been recognised in prior years.
It is deemed that, in the event of the loss or destruction of an asset, the future economic benefits arising from the use of the asset will be replaced unless a specific decision to the contrary has been made. The recoverable amount for most assets is measured at the higher of depreciated replacement cost and fair value less costs to sell. Recoverable amount for assets held primarily to generate net cash inflows is measured at the higher of the present value of future cash flows expected to be obtained from the asset and fair value less costs to sell.
Refer to Note 1(l) in relation to the recognition and measurement of non-financial assets.
Net gain / (loss) on financial instruments
Net gain / (loss) on financial instruments includes:
• impairment and reversal of impairment for financial instruments at amortised cost; and • disposals of financial assets.
Other gains / (losses) from other economic flows
Other gains / (losses) from other economic flows include the gains or losses from the revaluation of the present value of the long service leave liability due to changes in the bond interest rates.
(i) Administered income VAGO does not gain control over assets arising from audit fees, consequently no income is recognised in
VAGO's financial statements.
VAGO collects these amounts on behalf of the Victorian Government. Accordingly, the amounts are disclosed as income in the schedule of Administered Items (see Note 3).
(j) Financial instruments Financial instruments arise out of contractual agreements that give rise to a financial asset of one entity and a
financial liability or equity instrument of another entity. Due to the nature of VAGO’s activities, certain financial assets and financial liabilities arise under statute rather than a contract. Such financial assets and financial liabilities do not meet the definition of financial instruments in AASB 132 Financial Instruments: Presentation. For example, statutory receivables arising from taxes, fines and penalties do not meet the definition of financial instruments as they do not arise under contract.
Where relevant, for note disclosure purposes, a distinction is made between those financial assets and financial liabilities that meet the definition of financial instruments in accordance with AASB 132 and those that do not.

92 Victorian Auditor-General’s Office
Annual Report 2015–16
Notes to financial statementsNote 1. Summary of significant accounting policies (continued)
The following refers to financial instruments unless otherwise stated.
Categories of non-derivative financial instruments
Receivables
Receivables are financial instrument assets with fixed and determinable payments that are not quoted on an active market. These assets are initially recognised at fair value plus any directly attributable transaction costs. Subsequent to initial measurement, receivables are measured at amortised cost using the effective interest method, less any impairment.
Receivables category includes cash (refer to Note 1(k)), trade receivables and other receivables, but not statutory receivables.
Financial liabilities at amortised cost
Financial instrument liabilities are initially recognised on the date they are originated. They are initially measured at fair value plus any directly attributable transaction costs. Subsequent to initial recognition, these financial instruments are measured at amortised cost with any difference between the initial recognised amount and the redemption value being recognised in profit and loss over the period of the interest bearing liability, using the effective interest rate method.
Financial instrument liabilities measured at amortised cost include all of VAGO's contractual payables, and interest bearing arrangements other than those designated at fair value through profit or loss.
(k) Financial assets Cash
Cash comprises cash on hand.
Receivables
Receivables consist of:
• contractual receivables, such as debtors in relation to goods and services; and • statutory receivables, such as amounts owing from the Victorian Government and Goods and Services
Tax (GST) input tax credits recoverable.
Receivables and work-in-progress related to audit fees raised are reported as administered items in Note 3.
Contractual receivables are classified as financial instruments and categorised as receivables (refer to Note 1(j) Financial instruments for recognition and measurement). Statutory receivables are recognised and measured similarly to contractual receivables (except for impairment), but are not classified as financial instruments because they do not arise from a contract.
Receivables are subject to impairment testing as described below. A provision for doubtful receivables is recognised when there is objective evidence that the debts may not be collected, and bad debts are written off when identified.
For the measurement principle of receivables, refer to Note 1(j).
Impairment of financial assets
At the end of each reporting period, VAGO assesses whether there is objective evidence that a financial asset or group of financial assets is impaired. Objective evidence includes financial difficulties of the debtor, default payments, debts which are more than 60 days overdue, and changes in debtor credit ratings. All financial assets are subject to annual review for impairment.
Bad and doubtful debts for financial assets are assessed on a regular basis. Those bad debts considered as written off by mutual consent are classified as a transaction expense. Bad debts not written off by mutual consent and the allowance for doubtful receivables are classified as ‘other economic flows’ in the net result.

93
Financial report
(l) Non-financial assets Work in progress
Work in progress represents the reasonable cost of audit services performed but not yet invoiced and is based on:
• weekly timesheets and hourly rates for each level of staff; and • cost of work undertaken on behalf of the Office by contracted audit service providers.
The recoverability of work in progress is regularly reviewed and an allowance for impairment is provided if there is evidence that amounts are not fully recoverable. Work-in-progress related to audit fees raised is reported in administered items in Note 3.
Property, plant and equipment
All non-financial physical assets are initially measured at cost, and subsequently measured at fair value less accumulated depreciation and impairment.
The initial cost for non-financial physical assets under a finance lease (refer to Note 1(n)) is measured at amounts equal to the fair value of the leased asset or, if lower, the present value of the minimum lease payments, each determined at the inception of the lease.
The fair value of plant and equipment is normally determined by reference to the asset’s depreciated replacement cost.
Certain assets are acquired under finance leases. Refer to Notes 1(n) Leases and 1(p) Commitments for more information.
For the accounting policy on impairment of non-financial physical assets, refer to impairment of non-financial assets under Note 1(h) Impairment of non-financial assets.
More details about the valuation techniques and inputs used in determining the fair value of non-financial physical assets are discussed in Note 8 Property, plant and equipment.
Leasehold improvements
The cost of leasehold improvements is capitalised as an asset and depreciated over the remaining term of the lease or the estimated useful life of the improvements, whichever is the shorter.
Intangible assets
Purchased intangible assets are initially recognised at cost. Subsequently, intangible assets with finite useful lives are carried at cost less accumulated amortisation and accumulated impairment losses. Costs incurred subsequent to initial acquisition are capitalised when it is expected that additional future economic benefits will flow to VAGO.
When the recognition criteria in AASB 138 Intangible Assets are met, internally generated intangible assets are recognised and measured at cost less accumulated amortisation and impairment.
Refer to Note 1(g) Depreciation and amortisation, and Note 1(h) Impairment of non-financial assets.
Prepayments and accrued income
Prepayments represent payments in advance of receipt of goods or services or that part of expenditure made in one accounting period covering a term extending beyond that period. Accrued income represents amounts not received at the balance sheet date in exchange for the provision of services in the accounting period.

94 Victorian Auditor-General’s Office
Annual Report 2015–16
Notes to financial statementsNote 1. Summary of significant accounting policies (continued)
(m) Liabilities Payables
Payables consist of:
• contractual payables, such as accounts payable. Accounts payable represent liabilities for goods and services provided to VAGO prior to the end of the financial year that are unpaid, and arise when VAGO becomes obliged to make future payments in respect of the purchase of those goods and services; and
• statutory payables, such as goods and services tax and fringe benefits tax payables.
Contractual payables are classified as financial instruments and categorised as financial liabilities at amortised cost (refer to Note 1(j)). Statutory payables are recognised and measured similarly to contractual payables, but are not classified as financial instruments and not included in the category of financial liabilities at amortised cost, because they do not arise from a contract.
Borrowings
Borrowings are initially measured at fair value, being the cost of the borrowings, net of transaction costs (refer to Note 1(n) Leases).
Subsequent to initial recognition, borrowings are measured at amortised cost with any difference between the initial recognised amount and the redemption value being recognised in net result over the period of the borrowing using the effective interest rate method.
Provisions
Provisions are recognised when VAGO has a present obligation, the future sacrifice of economic benefits is probable, and the amount of the provision can be measured reliably.
The amount recognised as a provision is the best estimate of the consideration required to settle the present obligation at reporting date, taking into account the risks and uncertainties surrounding the obligation. Where a provision is measured using the cash flows estimated to settle the present obligation, its carrying amount is the present value of those cash flows, using a discount rate that reflects the time value of money and risks specific to the provision.
Employee Benefits
Provision is made for benefits accruing to employees in respect of wages and salaries, annual leave and long service leave (LSL) for services rendered to the reporting date.
(i) Wages and salaries, and annual leave
Liabilities for wages and salaries and annual leave are recognised in the provision for employee benefits as ‘current liabilities’, because VAGO does not have an unconditional right to defer settlements of these liabilities.
Depending on the expectation of the timing of settlement, liabilities for wages and salaries, and annual leave, are measured at:
• nominal value if VAGO expects to wholly settle within 12 months; or • present value if VAGO does not expect to wholly settle within 12 months.
(ii) Long service leave
Liability for LSL is recognised in the provision for employee benefits.
Unconditional LSL is disclosed in the notes to the financial statements as a current liability, even where VAGO does not expect to settle the liability within 12 months because it will not have the unconditional right to defer the settlement of the entitlement should an employee take leave within 12 months.

95
Financial report
The components of this current LSL liability are measured at:
• nominal value – if VAGO expects to wholly settle within 12 months; and • present value – if VAGO does not expect to wholly settle within 12 months.
Conditional LSL representing less than seven years of continuous service is disclosed as a non-current liability. There is an unconditional right to defer the settlement of the entitlement until the employee has completed the requisite years of service. This non-current LSL liability is measured at present value.
Consideration is given to expected future wage and salary levels, experience of employee, departures and periods of service. Expected future payments are discounted using a single weighted average discount rate based on market yields of national government bonds in Australia that reflects the estimated timing and amount of benefit payments.
Any gain or loss following revaluation of the present value of the non-current LSL liability is recognised as a transaction, except to the extent that a gain or loss arises due to changes in bond interest rates for which it is then recognised as an other economic flow (refer to Note 1(h)).
(iii) Termination benefits
Termination benefits are payable when employment is terminated before the normal retirement date, or when an employee decides to accept an offer of benefits in exchange for the termination of employment. VAGO recognises termination benefits when it is demonstrably committed to either terminating the employment of current employees according to a detailed formal plan without possibility of withdrawal or providing termination benefits as a result of an offer made to encourage voluntary redundancy. Benefits falling due more than 12 months after the end of the reporting period are discounted to present value.
(iv) Performance incentive entitlements
The Executive Officers' performance incentive entitlements for the performance review period ending on the balance sheet date and payable within the next financial year, are classified as a current liability in the balance sheet.
On-costs related to employee expenses
On-costs such as payroll tax, workers' compensation and superannuation are recognised separately from the provision for employee benefits.
Operating lease contracts
Provision is made for rentals due under operating lease contracts, where the amortised cost of the whole-of-life lease rentals exceeds the rentals due at the end of the reporting period.
(n) Leases A lease is a right to use an asset for an agreed period of time in exchange for payment.
Leases are classified at their inception as either operating or finance leases based on the economic substance of the agreement so as to reflect the risks and rewards incidental to ownership. Leases of property, plant and equipment are classified as finance leases whenever the terms of the lease transfer substantially all the risks and rewards of ownership from the lessor to the lessee. All other leases are classified as operating leases.

96 Victorian Auditor-General’s Office
Annual Report 2015–16
Notes to financial statementsNote 1. Summary of significant accounting policies (continued)
Finance leases
VAGO as lessee
At the commencement of the lease term, finance leases are initially recognised as assets and liabilities at amounts equal to the fair value of the lease property or, if lower, the present value of the minimum lease payment, each determined at the inception of the lease. The lease asset is accounted for as a non-financial physical asset. If there is certainty that VAGO will obtain the ownership of the lease asset by the end of the lease term, the asset shall be depreciated over the useful life of the asset. If there is no reasonable certainty that the lessee will obtain ownership by the end of the lease term, the asset shall be fully depreciated over the shorter of the lease term and its useful life.
Minimum finance lease payments are apportioned between reduction of the outstanding lease liability, and periodic finance expense which is calculated using the interest rate implicit in the lease and charged directly to the comprehensive operating statement. Contingent rentals associated with finance leases are recognised as an expense in the period in which they are incurred.
Operating leases
VAGO as lessee
Operating lease payments, including any contingent rentals, are recognised as an expense in the comprehensive operating statement on a straight-line basis over the lease term, except where another systematic basis is more representative of the time pattern of the benefits derived from the use of the leased asset. The leased asset is not recognised in the balance sheet.
All incentives for the agreement of a new or renewed operating lease are recognised as an integral part of the net consideration agreed for the use of the leased asset, irrespective of the incentive’s nature or form or the timing of payments.
In the event that lease incentives are received to enter into operating leases, the aggregate cost of incentives are recognised as a reduction of rental expense over the lease term on a straight line basis, unless another systematic basis is more representative of the time pattern in which economic benefits from the leased asset are consumed.
(o) Equity Contributions by owners
Consistent with the requirements of AASB 1004 Contributions, contributions by owners (that is, contributed capital and its repayment) are treated as equity transactions and, therefore, do not form part of the income and expenses of VAGO.
Additions to net assets which have been designated as contributions by owners are recognised as contributed capital. Other transfers that are in the nature of contributions to or distributions by owners have also been designated as contributions by owners.
(p) Commitments Commitments for future expenditure include operating and capital commitments arising from contracts.
These are disclosed by way of a note (refer to Note 16 Commitments for expenditure) at their nominal value and inclusive of the Goods and Services Tax (GST) payable.
In addition, where it is considered appropriate and provides additional relevant information to users, the net present values of significant individual projects are stated. These future expenditures cease to be disclosed as commitments once the related liabilities are recognised in the balance sheet.

97
Financial report
(q) Contingent assets and contingent liabilities Contingent assets and contingent liabilities are not recognised in the balance sheet, but are disclosed by way
of a note (refer to Note 17 Contingent assets and contingent liabilities) and, if quantifiable, are measured at nominal value. Contingent assets and liabilities are presented inclusive of GST receivable or payable respectively.
(r) Accounting for the Goods and Services Tax (GST)
Income, expenses and assets are recognised net of the amount of associated GST, except where GST incurred is not recoverable from the taxation authority. In this case, the GST payable is recognised as part of the cost of acquisition of the asset or as part of the expense.
Receivables and payables are stated inclusive of the amount of GST receivable or payable. The net amount of GST recoverable from, or payable to, the taxation authority is included with other receivables or payables in the balance sheet.
Cash flows are presented on a gross basis. The GST components of cash flows arising from investing or financing activities which are recoverable from, or payable to the taxation authority, are presented as operating cash flow.
Commitments and contingent assets and liabilities are also stated inclusive of GST (refer to Note 1(p) and Note 1(q)).
(s) Foreign currency transactions All foreign currency transactions during the financial year are brought to account using the exchange rate in
effect at the date of the transaction.
(t) Events after the reporting period Assets, liabilities, income or expenses arise from past transactions or other past events. Where the
transactions result from an agreement between VAGO and other parties, the transactions are only recognised when the agreement is irrevocable at or before the end of the reporting period. Adjustments are made to amounts recognised in the financial statements for events which occur between the end of the reporting period and the date when the financial statements are authorised for issue, where those events provide information about conditions which existed at the reporting date. Note disclosure is made about events between the end of the reporting period and the date the financial statements are authorised for issue where the events relate to conditions which arose after the end of the reporting period that are considered to be of material interest.
(u) Australian Accounting Standards issued that are not yet effective Certain new Australian Accounting Standards (AAS) have been published that are not mandatory for the
30 June 2016 reporting period. VAGO has assessed their applicability and potential for early adoption and has chosen not to early adopt these standards.

98 Victorian Auditor-General’s Office
Annual Report 2015–16
Notes to financial statementsNote 1. Summary of significant accounting policies (continued)
Standard/Interpretation Summary Applicable for annual reporting periods beginning on
Impact on VAGO financial statements
AASB 15 Revenue from Contracts with Customers
The core principle of AASB 15 requires an entity to recognise revenue when the entity satisfies a performance obligation by transferring a promised good or service to a customer.
1/01/2018 The changes in revenue recognition requirements in AASB 15 may result in changes to the timing and amount of revenue recorded in the financial statements. The Standard will also require additional disclosures on service revenue and contract modifications.
AASB 2014-5 Amendments to Australian Accounting Standards arising from AASB 15
Amends the measurement of trade receivables and the recognition of dividends.
1/01/2017, except amendments to AASB 9 (Dec 2009) and AASB 9 (Dec 2010) apply from 1/01/2018
The assessment has indicated that there will be no significant impact for the public sector. Trade receivables, that do not
have a significant financing component, are to be measured at their transaction price, at initial recognition.
Dividends are recognised in the profit and loss only when:
• the entity’s right to receive payment of the dividend is established;
• it is probable that the economic benefits associated with the dividend will flow to the entity; and
• the amount can be measured reliably.
AASB 2015-8 Amendments to Australian Accounting Standards – Effective Date of AASB 15
This Standard defers the mandatory effective date of AASB 15 from 1 January 2017 to 1 January 2018.
1/01/2018 This amending standard will defer the application period of AASB 15 to the 2018-19 reporting period in accordance with the transition requirements.

99
Financial report
Standard/Interpretation Summary Applicable for annual reporting periods beginning on
Impact on VAGO financial statements
AASB 2016-3 Amendments to Australian Accounting Standards – Clarifications to AASB 15
• This Standard amends AASB 15 to clarify the requirements on identifying performance obligations, principal versus agent considerations and the timing of recognising revenue from granting a licence. The amendments require:
1/01/2018 The assessment has indicated that there will be no significant impact for the public sector, other than the impact identified in AASB 15.
• A promise to transfer to a customer a good or service that is ‘distinct’ to be recognised as a separate performance obligation;
• For items purchased online, the entity is a principal if it obtains control of the good or service prior to transferring to the customer; and
• For licences identified as being distinct from other goods or services in a contract, entities need to determine whether the licence transfers to the customer over time (right to use) or at a point in time (right to access).
AASB 16 Leases The key changes introduced by AASB 16 include the recognition of most operating leases (which are currently not recognised) on balance sheet.
1/01/2019 The assessment has indicated that as most operating leases will come on balance sheet, recognition of lease assets and lease liabilities will cause net debt to increase.
Depreciation of lease assets and interest on lease liabilities will be recognised in the income statement with marginal impact on the operating surplus.
The amounts of cash paid for the principal portion of the lease liability will be presented within financing activities and the amounts paid for the interest portion will be presented within operating activities in the cash flow statement.

100 Victorian Auditor-General’s Office
Annual Report 2015–16
Notes to financial statementsNote 1. Summary of significant accounting policies (continued)
Standard/Interpretation Summary Applicable for annual reporting periods beginning on
Impact on VAGO financial statements
AASB 2014-4 Amendments to Australian Accounting Standards – Clarification of Acceptable Methods of Depreciation and Amortisation [AASB 116 & AASB 138]
Amends AASB 116 Property, Plant and Equipment and AASB 138 Intangible Assets to:
1/01/2016 The assessment has indicated that there is no expected impact as the revenue-based method is not used for depreciation and amortisation.
• establish the principle for the basis of depreciation and amortisation as being the expected pattern of consumption of the future economic benefits of an asset;
• prohibit the use of revenue-based methods to calculate the depreciation or amortisation of an asset, tangible or intangible, because revenue generally reflects the pattern of economic benefits that are generated from operating the business, rather than the consumption through the use of the asset.
AASB 2015-6 Amendments to Australian Accounting Standards – Extending Related Party Disclosures to Not-for-Profit Public Sector Entities
The Amendments extend the scope of AASB 124 Related Party Disclosures to not-for-profit public sector entities.
1/07/2016 The amending standard will result in extended disclosures on VAGO's key management personnel (KMP), and the related party transactions.
[AASB 10, AASB 124 & AASB 1049]
AASB 2016-4 Amendments to Australian Accounting Standards – Recoverable Amount of Non-Cash-Generating Specialised Assets of Not-for-Profit Entities
The standard amends AASB 136 Impairment of Assets to remove references to using depreciated replacement cost (DRC) as a measure of value in use for not-for-profit entities.
1/01/2017 The assessment has indicated that there is minimal impact. Given the specialised nature and restrictions of public sector assets, the existing use is presumed to be the highest and best use (HBU), hence current replacement cost under AASB 13 Fair Value Measurement is the same as the depreciated replacement cost concept under AASB 136.

101
Financial report
Note 2. Departmental (controlled) outputs
Output groups—VAGO has 2 output groups: (1) Parliamentary reports and services VAGO informs Parliament, its primary client, of the results of its work through its reports.
The reports provide Parliament with independent assurance on the adequacy of accountability and resource management practices in the public sector and include:
• performance audits, that focus on the effectiveness, efficiency and economy of publicly funded activities, or probity and compliance;
• an annual assessment of the state’s finances; • reports of results from the financial statement audits conducted during the year; • management letters to audited agencies conveying matters for improvement identified during audits.
VAGO also tables the Auditor-General’s Annual Plan and the VAGO Annual Report to inform Parliament of its planned activity and actual performance respectively.
(2) Audit reports on financial statements A core statutory responsibility of the Auditor-General is to undertake an annual audit of the financial statements, and in
some cases other statements (such as performance statements), of public authorities, including departments and municipal councils and of the State of Victoria, and to issue an audit opinion on whether the financial statements, and other statements where applicable, are fairly presented.
The main products from this output group are:
• audit reports on the financial statements of public sector authorities, including departments and municipal councils, and on the State’s Annual Financial Report
• audit reports on performance statements prepared by local government, certain water bodies, and technical and further education institutes
• management letters issued to audited authorities conveying matters for improvement and other findings identified during audits
• a negative assurance report on the review of the General Government Sector’s Estimated Financial Statements for inclusion in the State’s annual budget papers presented to Parliament.
Other products include the examination and certification by the Auditor-General of warrants authorising the expenditure of public funds by government. The preparation of warrants in Victoria is required under the provisions of the Constitution Act 1975 and the Financial Management Act 1994. Warrants provide the legislative authority for the Treasurer to issue funding in accordance with the relevant parliamentary authority and must be signed by the Auditor-General and approved by the Governor.
Another product from this output group comprises the audit of acquittal statements for the receipt and expenditure of Commonwealth-funded activities or capital works. These audits are undertaken in accordance with the requirements of the relevant funding agreement.
The major function of VAGO is to provide the organisational framework and resources to enable the Auditor-General to carry out an external audit of public sector agencies on behalf of Parliament.
All resources controlled by VAGO in order to carry out its functions have been included in the financial report.
External contractors are appointed by the Auditor-General, following a process of contestability, to assist in the conduct of performance and attest audits. The costs of such are expensed as a controlled item. Audit fee income arising from attest audits, whether undertaken directly or contracted out, is required under the FMA to be paid into the Consolidated Fund and is treated as an administered item.

102 Victorian Auditor-General’s Office
Annual Report 2015–16
Controlled income and expenses for the year ended 30 June 2016
2015–16 2014–15 2015–16 2014–15 2015–16 2014–15$'000 $'000 $'000 $'000 $'000 $'000
Income from transactionsOutput appropriations 15,789 15,404 24,732 23,536 40,521 38,940Special appropriations 288 277 288 264 576 541Sale of goods and services 144 140 109 42 253 182Fair value of services received free of charge or for nominal consideration
18 19 15 16 33 35
Total income from transactions 16,239 15,840 25,144 23,858 41,383 39,698
Expenses from transactionsEmployee expenses 11,484 12,718 12,232 10,520 23,715 23,238Depreciation and amortisation 361 421 296 344 657 765Interest expense 9 19 6 14 15 33Capital asset charge 66 64 54 53 120 117Fair value of services provided free of charge or for nominal consideration
- 75 - - - 75
Contract audit services (i) 540 449 11,354 9,997 11,893 10,446Rental expenses – accommodation 836 833 684 681 1,520 1,514Recruitment and training 319 286 315 245 634 531Other operating expenses 1,502 1,311 1,171 1,048 2,673 2,358Total expenses from transactions 15,116 16,176 26,112 22,901 41,228 39,077
Net result from transactions (net operating balance)
1,123 (336) (968) 957 155 621
Other economic flows included in net resultNet gain / (loss) on non-financial assets 13 (5) 11 (4) 24 (10)Other gains / (losses) from other economic flows (49) (40) (48) (35) (96) (75)Total other economic flows included in net result (35) (45) (37) (39) (72) (84)
Net result 1,088 (381) (1,005) 918 83 537
Comprehensive result 1,088 (381) (1,005) 918 83 537
Controlled assets and liabilities as at 30 June 2016
2015–16 2014–15 2015–16 2014–15 2015–16 2014–15$'000 $'000 $'000 $'000 $'000 $'000
AssetsFinancial assets 6,223 6,221 10,739 8,798 16,962 15,019
Non-financial assets 508 747 877 1,056 1,386 1,802Total assets 6,731 6,968 11,616 9,854 18,348 16,822
Liabilities
Total liabilities 3,542 3,401 6,112 4,810 9,654 8,211Net assets 3,189 3,567 5,504 5,044 8,694 8,611
Parliamentary reports and services
Audit reports on financial statements
Total
Parliamentary reports and services
Total Audit reports
on financial statements
(i) The increase in contract audit services expenses from 2014-15 to 2015-16 was due to two main factors. Firstly, there were additional payments to audit contractors for the audit of changed local government performance statements. Secondly, there were additional payments to audit contractors relating to the changed timing of the conduct of the relevant financial audits. These additional payments are offset by additional section 29 appropriation revenue, and therefore did not affect our net result.
Notes to financial statementsNote 2. Departmental (controlled) outputs (continued)

103
Financial report
Note 3. Administered (non-controlled) items
2015–16 2014–15$'000 $'000
Administered income from transactionsSales of services 24,854 23,536Miscellaneous income - 1
458,42snoitcasnart morf emocni deretsinimda latoT 23,537
Administered expenses from transactionsDoubtful debts expense 122 -Payments into the Consolidated Fund 24,732 23,537
Total administered expenses from transactions 24,854 23,537
- -
Net gain / (loss) on non-financial assets - --swolf cimonoce rehto deretsinimda latoT -
-tluser ten deretsinimdA -
-tluser evisneherpmoc deretsinimda latoT -
2015–16 2014–15$'000 $'000
Administered financial assetsReceivables (i) 2,563 2,385Provision for doubtful receivables (ii) (122) -
144,2stessa laicnanif deretsinimda latoT 2,385
Administered non-financial assetsWork in progress (iii) 3,146 3,619
641,3stessa laicnanif-non deretsinimda latoT 3,619
785,5stessa deretsinimda latoT 6,004
Administered liabilitiesAmounts owing to the state 5,587 6,004
785,5seitilibail deretsinimda latoT 6,004
Total administered net assets - -
In addition to the specific operations of VAGO which are included in the financial statements (comprehensive operating statement, balance sheet, statement of changes in equity and cash flow statement), VAGO administers or manages other activities and resources on behalf of the state such as income from audit fees raised from performing attest audits. The transactions relating to these activities are reported as administered items (refer to Note 1 (d) and (i)) in this note.
Total administered net result from transactions (net operating balance)
Administered other economic flows included in administered net result

104 Victorian Auditor-General’s Office
Annual Report 2015–16
2015–16 2014–15$'000 $'000
(a) Output appropriations (i)Annual appropriation for the provision of outputs 15,789 15,404Appropriation under s29 FMA 1994 24,732 23,536
Total output appropriations 40,521 38,940
(b) Special appropriations (i)Appropriation under s94A(6) of the Constitution Act 1975 576 541
Total special appropriations 576 541
(c) Sale of goods and servicesSales of goods (ii) 26 34Rendering of services (iii) 227 148
Total sale of goods and services 253 182
(d) Fair value of services received free of charge or for nominal considerationServices (iv) 33 35
33 35
(i)
(ii)
(iii)
(iv) This represents the cost of the external audit of VAGO. Refer to Note 23.
From time to time, staff are seconded to other Victorian government departments and agencies and other State Government Auditor-General's Offices. The basis for cost recovery is determined by the terms of the various secondments.
Refer to Note 20 for further details of appropriations.
This revenue stream arises principally from the sale of reports.
Total fair value of services received free of charge or for nominal consideration
Notes to financial statementsNote 3. Administered (non-controlled) items (continued)
(i) Receivables comprise debtors falling due as follows:
Current 2,180 2,182Overdue between 30 to 60 days 173 192Overdue beyond 60 days 210 11
2,563 2,385
(ii)
(iii) Work in progress is stated net of an estimate of the amount of financial audit fee revenue deemed to be not a reasonable cost of the audit. At the balance sheet date, this estimate was $1,583,000 (2014-15: $Nil). This was due to an overestimation of the hourly rates of staff which are built into the internal pricing mechanism.
The provision for doubtful receivables relates to a receivable which has been outstanding for one year.
Of the receivables overdue more than 30 days, $122,000 (2014-15: $Nil) has been provided against (see Note (ii) below). A further $82,000 (2014-15: $162,000) had been collected at the date of signing of the financial statements.
Note 4. Income from transactions
2015–16 2014–15$'000 $'000
Administered income from transactionsSales of services 24,854 23,536Miscellaneous income - 1
458,42snoitcasnart morf emocni deretsinimda latoT 23,537
Administered expenses from transactionsDoubtful debts expense 122 -Payments into the Consolidated Fund 24,732 23,537
Total administered expenses from transactions 24,854 23,537
- -
Net gain / (loss) on non-financial assets - --swolf cimonoce rehto deretsinimda latoT -
-tluser ten deretsinimdA -
-tluser evisneherpmoc deretsinimda latoT -
2015–16 2014–15$'000 $'000
Administered financial assetsReceivables (i) 2,563 2,385Provision for doubtful receivables (ii) (122) -
144,2stessa laicnanif deretsinimda latoT 2,385
Administered non-financial assetsWork in progress (iii) 3,146 3,619
641,3stessa laicnanif-non deretsinimda latoT 3,619
785,5stessa deretsinimda latoT 6,004
Administered liabilitiesAmounts owing to the state 5,587 6,004
785,5seitilibail deretsinimda latoT 6,004
Total administered net assets - -
In addition to the specific operations of VAGO which are included in the financial statements (comprehensive operating statement, balance sheet, statement of changes in equity and cash flow statement), VAGO administers or manages other activities and resources on behalf of the state such as income from audit fees raised from performing attest audits. The transactions relating to these activities are reported as administered items (refer to Note 1 (d) and (i)) in this note.
Total administered net result from transactions (net operating balance)
Administered other economic flows included in administered net result

105
Financial report
2015–16 2014–15$'000 $'000
(a) Employee expensesPost employment benefits:
Defined contribution superannuation expense 1,666 1,597Defined benefit superannuation expense 103 139
Termination benefits 198 222Salaries and wages, annual leave and long service leave 21,748 21,280Total employee expenses 23,715 23,238
(b) Depreciation and amortisationDepreciation of non-current assets:
Furniture and fittings 2 2Computer software 57 62Computer hardware 135 186Office equipment 13 14
Total depreciation of non-current assets 206 264Amortisation of non-current assets:
Leasehold improvements 349 349Intangible produced assets 30 81Motor vehicles – leased 72 72
Total amortisation of non-current assets 451 501Total depreciation and amortisation 657 765
(c) Interest expenseInterest on finance leases - 13Unwinding of discount on make-good provision 15 20
15 33
(d) Other operating expensesInformation technology 597 613Information management 208 251Consultants 72 37Legal expenses 75 15Auditors' remuneration 33 35Motor vehicles 247 278Contractors 486 315Internal audit 268 118Travel 238 243Other office expenses 449 454Total other operating expenses 2,673 2,358
Total interest expense
Note 5. Expenses from transactions

106 Victorian Auditor-General’s Office
Annual Report 2015–16
2015–16 2014–15$'000 $'000
(a) Net gain / (loss) on non-financial assetsNet gain / (loss) on disposal of property, plant and equipment 24 (10)Total net gain / (loss) on non-financial assets 24 (10)
(b) Other gains / (losses) from other economic flowsNet gain / (loss) arising from revaluation of long service liability (i) (96) (75)Total other gains / (losses) from other economic flows (96) (75)
(i) Revaluation gain / (loss) due to changes in bond rates.
Notes to financial statementsNote 6. Other economic flows included in net result
2015–16 2014–15$'000 $'000
Current receivablesContractualOther receivables (i) 43 54StatutoryAmounts due from Victorian Government (ii) (iii) 8,874 6,988GST input tax credit recoverable 128 -Total current receivables 9,045 7,042
Non-current receivablesStatutoryAmounts due from Victorian Government (ii) (iii) 7,916 7,976Total non-current receivables 7,916 7,976
Total receivables 16,961 15,018
(i)
(ii)
(iii)
(a) Ageing analysis of contractual receivables
(b) Nature and extent of risk arising from contractual receivables
(c) Provision for doubtful contractual receivablesNo provision for doubtful contractual receivables has been made, as VAGO considers that there is no objective evidence of impairment of those receivables, either in the current year 2015-16 or the previous year 2014-15.
Please refer to Table 18.3 in Note 18 for the ageing analysis of contractual receivables.
Please refer to Note 18 for the nature and extent of risks arising from contractual receivables.
Other receivables comprises recoup of expenses of production of reports, and a receivable relating to a WorkCover claim.
The total amount recognised as being due from the Victorian Government was $16,789,000 (2014–15: $14,964,000) of which $8,874,000 (2014–15: $6,988,000) is likely to be drawn down in the next financial year and is reported accordingly as a current receivable.
The amount recognised as being due from the Victorian Government comprises previously applied Parliamentary appropriations not yet drawn down. The balance is represented by accumulated surpluses, payables, movements in provisions and accumulated depreciation and amortisation net of asset acquisition. The amounts represent funding for all commitments incurred through the appropriations and are drawn from the Consolidated Fund as the commitments fall due.
Note 7. Receivables
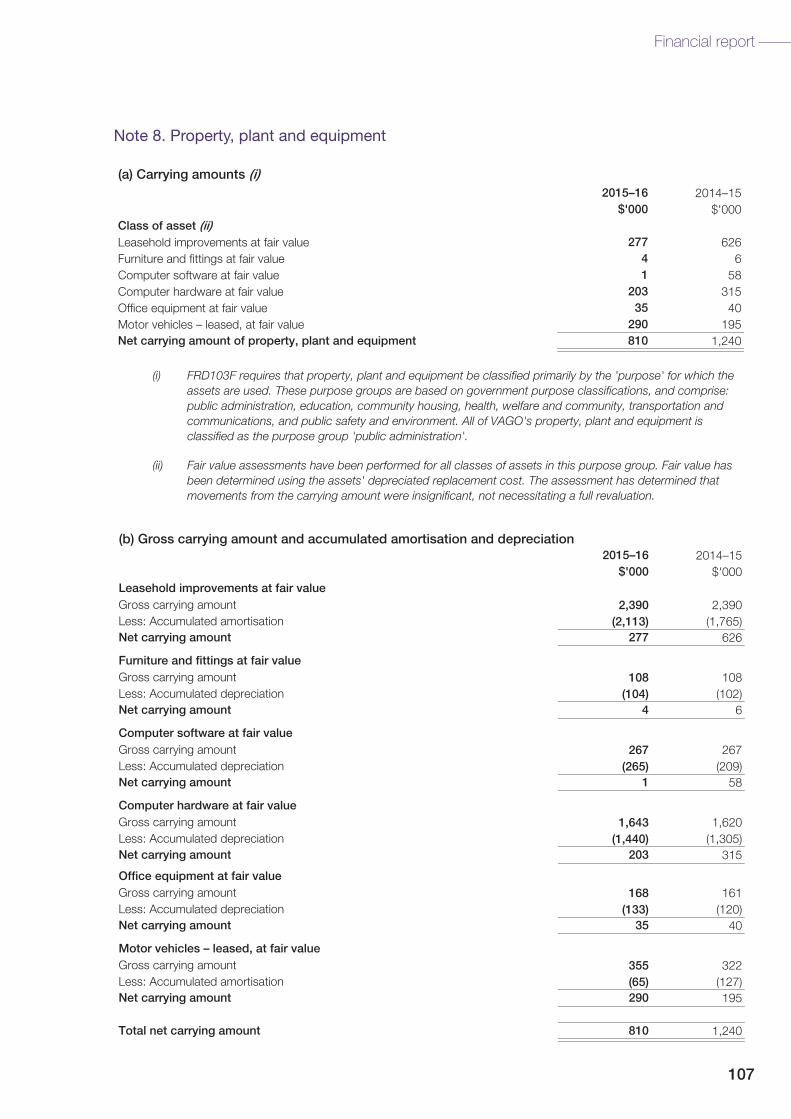
107
Financial report
(a) Carrying amounts (i)2015–16 2014–15
$'000 $'000Class of asset (ii)Leasehold improvements at fair value 277 626Furniture and fittings at fair value 4 6Computer software at fair value 1 58Computer hardware at fair value 203 315Office equipment at fair value 35 40Motor vehicles – leased, at fair value 290 195Net carrying amount of property, plant and equipment 810 1,240
(i)
(ii)
FRD103F requires that property, plant and equipment be classified primarily by the 'purpose' for which the assets are used. These purpose groups are based on government purpose classifications, and comprise: public administration, education, community housing, health, welfare and community, transportation and communications, and public safety and environment. All of VAGO's property, plant and equipment is classified as the purpose group 'public administration'.
Fair value assessments have been performed for all classes of assets in this purpose group. Fair value has been determined using the assets' depreciated replacement cost. The assessment has determined that movements from the carrying amount were insignificant, not necessitating a full revaluation.
2015–16 2014–15$'000 $'000
2,390 2,390Less: Accumulated amortisation (2,113) (1,765)
277 626
108 108Less: Accumulated depreciation (104) (102)
4 6
267 267Less: Accumulated depreciation (265) (209)
1 58
1,643 1,620Less: Accumulated depreciation (1,440) (1,305)
203 315
168 161Less: Accumulated depreciation (133) (120)
35 40
355 322Less: Accumulated amortisation (65) (127)
290 195
810 1,240
(b) Gross carrying amount and accumulated amortisation and depreciation
Gross carrying amount
Net carrying amount
Leasehold improvements at fair value
Furniture and fittings at fair valueGross carrying amount
Net carrying amount
Computer software at fair valueGross carrying amount
Net carrying amount
Computer hardware at fair valueGross carrying amount
Net carrying amount
Office equipment at fair valueGross carrying amount
Gross carrying amount
Net carrying amount
Total net carrying amount
Net carrying amount
Motor vehicles – leased, at fair value
Note 8. Property, plant and equipment

108 Victorian Auditor-General’s Office
Annual Report 2015–16
Leasehold Furniture Computer Computer OfficeMotor
vehiclesimprovements and fittings software hardware equipment – leased TOTAL
$'000 $'000 $'000 $'000 $'000 $'000 $'000
587,10423509302174794102 yluJ 1 ta ecnalaB
351041111-1-snoitiddA
Disposals - - - - - (14) (14)
Depreciation / amortisation expense (349) (2) (62) (186) (14) (72) (684)
Balance at 30 June 2015 626 6 58 315 40 195 1,240
Additions - - - 23 7 278 308
Disposals - - - - - (111) (111)
Depreciation / amortisation expense (349) (2) (57) (135) (13) (72) (627)
Balance at 30 June 2016 277 4 1 203 35 290 810
The following useful lives of assets are used in the calculation of depreciation and amortisation for current and prior years:
Leasehold improvements 2–10 years
Furniture and fittings 10 years
Computer software 3 years
Computer hardware 4 years
Office equipment 5 years
Motor vehicles – leased 3 year lease term
Aggregate depreciation allocated during the year is recognised as an expense and disclosed in Note 5 to the financial statements.
(d) Fair value measurement hierarchy for assets as at 30 June 2016
(c) Movements in carrying amounts
As noted in Note 8(a)(ii), fair value assessments have been performed for all classes of assets, on the basis of their depreciated lAll property, plant and equipment is classified as Level 3 in the fair value hierarchy. See Note 1(b) for a description of the fair value
hierarchy. There have been no transfers between levels during the period.For all assets measured at fair value, the current use is considered the highest and best use.
Leasehold Furniture Computer Computer OfficeMotor
vehiclesimprovements and fittings software hardware equipment – leased
$'000 $'000 $'000 $'000 $'000 $'000
0423509302174794102 yluJ 1 ta ecnalaB
041111-1-snoitiddA
Disposals - - - - - (14)
Depreciation / amortisation expense (349) (2) (62) (186) (14) (72)
Balance at 30 June 2015 626 6 58 315 40 195
Additions - - - 23 7 278
Disposals - - - - - (111)
Depreciation / amortisation expense (349) (2) (57) (135) (13) (72)
Balance at 30 June 2016 277 4 1 203 35 290
The following useful lives of assets are used in the calculation of depreciation and amortisation for current and prior years:
Leasehold improvements 2–10 years
Furniture and fittings 10 years
Computer software 3 years
Computer hardware 4 years
Office equipment 5 years
Motor vehicles – leased 3 year lease term
(d) Fair value measurement hierarchy for assets as at 30 June 2016
(c) Movements in carrying amounts
l
hierarchy. There have been no transfers between levels during the period.For all assets measured at fair value, the current use is considered the highest and best use.
Notes to financial statementsNote 8. Property, plant and equipment (continued)
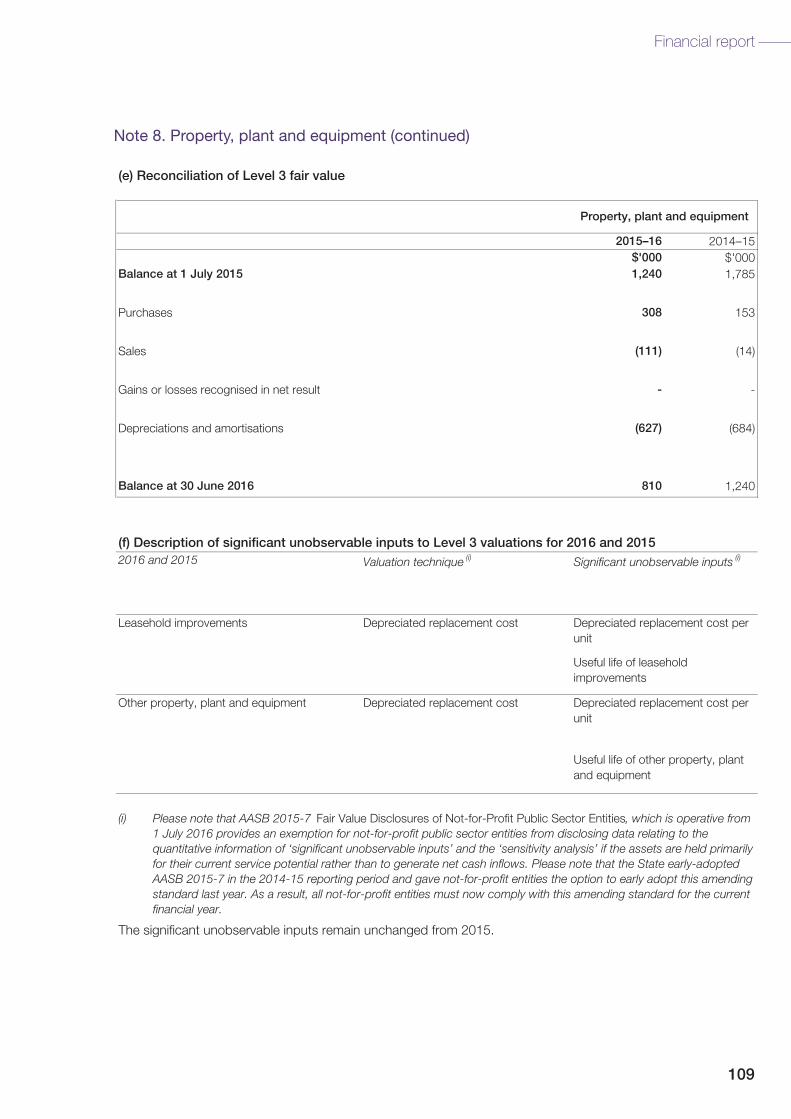
109
Financial report
(e) Reconciliation of Level 3 fair value
2015–16 2014–15$'000 $'000
Balance at 1 July 2015 1,240 1,785
Purchases 308 153
Sales (111) (14)
Gains or losses recognised in net result - -
Depreciations and amortisations (627) (684)
Balance at 30 June 2016 810 1,240
(f) Description of significant unobservable inputs to Level 3 valuations for 2016 and 2015Valuation technique (i)
Leasehold improvements Depreciated replacement cost
(i)
The significant unobservable inputs remain unchanged from 2015.
Depreciated replacement cost per unit
Useful life of other property, plant and equipment
Please note that AASB 2015-7 Fair Value Disclosures of Not-for-Profit Public Sector Entities, which is operative from 1 July 2016 provides an exemption for not-for-profit public sector entities from disclosing data relating to the quantitative information of ‘significant unobservable inputs’ and the ‘sensitivity analysis’ if the assets are held primarily for their current service potential rather than to generate net cash inflows. Please note that the State early-adopted AASB 2015-7 in the 2014-15 reporting period and gave not-for-profit entities the option to early adopt this amending standard last year. As a result, all not-for-profit entities must now comply with this amending standard for the current financial year.
Other property, plant and equipment
Property, plant and equipment
Depreciated replacement cost
2016 and 2015 Significant unobservable inputs (i)
Depreciated replacement cost per unit
Useful life of leasehold improvements
Note 8. Property, plant and equipment (continued)

110 Victorian Auditor-General’s Office
Annual Report 2015–16
(a) Cost and accumulated amortisation2015–16 2014–15
$'000 $'000Intangible assetsAt cost 1,737 1,664Less: Accumulated amortisation (1,643) (1,613)Total intangible assets 94 51
(b) Movements in intangible assets
Computer TOTALsoftware
$'000 $'000Carrying amountBalance at 1 July 2014 98 98
Additions 34 34
Amortisation expense (i) (81) (81)
Balance at 30 June 2015 51 51
Additions 73 73
Amortisation expense (i) (30) (30)
Balance at 30 June 2016 94 94
(i)
The following useful lives of assets are used in the calculation of amortisation for current and prior years:
Intangible assets – Computer software 3 years
Aggregate amortisation allocated during the year is recognised as an expense and disclosed in Note 5.
The consumption of intangible produced assets is included in the 'Depreciation and amortisation' line item in the comprehensive operating statement.
Notes to financial statementsNote 9. Intangible assets
2015–16 2014–15$'000 $'000
Current prepayments and accrued incomeInformation management 11 24Software and hardware maintenance contracts 189 191Rental expense – accommodation 143 139Recruitment and training 45 37Insurance 21 -Accrued income - salaries of secondees - 64Other 73 52
Total current prepayments and accrued income 481 508
Non-current prepaymentsInformation management - 1Software and hardware maintenance contracts - 2
Total non-current prepayments - 3Total prepayments and accrued income 481 511
Note 10. Prepayments and accrued income

111
Financial report
Note 11. Payables
2015–16 2014–15$'000 $'000
Current payablesContractualSupplies and services (i) 1,704 937Amounts payable to government and agencies (ii) 34 14Other payables (iii) 302 184
2,040 1,135StatutoryPAYG payable - 192FBT payable 11 89GST payable - 14Payroll tax payable 79 89Total current payables 2,130 1,519
(i) The average credit period is 30 days.(ii)
(iii)
(a) Maturity analysis of contractual payables
(b) Nature and extent of risk arising from contractual payables
2015–16 2014–15$'000 $'000
Current borrowingsFinance lease liabilities (i) (Note 15(a)) 80 135Total current borrowings 80 135
Non-current borrowingsFinance lease liabilities (i) (Note 15(a)) 212 62Total non-current borrowings 212 62
Total borrowings 292 197
(i)
(a) Maturity analysis of borrowings
(b)
(c) Defaults and breaches
Please refer to Note 18 for the nature and extent of risks arising from borrowings.
During the current and prior year, there were no defaults and breaches of any of the loans.
Note 11. Payables
Note 12. Borrowings
Please refer to Table 18.4 in Note 18 for the maturity analysis of contractual payables.
Please refer to Note 18 for the nature and extent of risks arising from contractual payables.
Please refer to Table 18.4 in Note 18 for the maturity analysis of borrowings.
Nature and extent of risk arising from borrowings
Secured by the assets leased. Finance leases are effectively secured as the rights to the leased assets revert to the lessor in the event of default.
Terms and conditions of amounts payable to other government agencies vary according to a particular agreement with that agency.
The comparative figure for 2014-15 now excludes an amount of $121,000 in respect of performance incentive payments. This is now classified and disclosed as a provision in Note 13.
Note 12. Borrowings

112 Victorian Auditor-General’s Office
Annual Report 2015–16
Notes to financial statementsNote 13. Provisions
2015–16 2014–15$'000 $'000
Current provisionsEmployee benefits (i) (Note 13(a))Annual leave (Note 13(a)):
– Unconditional and expected to settle within 12 months (ii) 1,328 1,153– Unconditional and expected to settle after 12 months (iii) 551 381
Long service leave (Note 13(a)):– Unconditional and expected to settle within 12 months (ii) 371 314– Unconditional and expected to settle after 12 months (iii) 2,626 2,365
Performance incentive entitlements (Note 13(a)):– Unconditional and expected to settle within 12 months (ii) (vi) 337 313
5,214 4,526Provisions for on-costs (Note 13(a) and Note 13(b)):
– Unconditional and expected to settle within 12 months (ii) 259 226– Unconditional and expected to settle after 12 months (iii) 487 427
746 653Lease contracts (iv) (Note 13(b) and Note 16) 143 156Make-good provision (v) (Note 13(b)) 561 -Total current provisions 6,664 5,334
Non-current provisionsEmployee benefits: (i) (Note 13(a)) – long service leave 492 409On-costs (Note 13(a) and Note 13(b)): 76 64Lease contracts (iv) (Note 13(b) and Note 16) - 143Make-good provision (v) (Note 13(b)) - 545Total non-current provisions 568 1,161
Total provisions 7,232 6,495
(a) Employee benefits and on-costs (i)(vi) 2015–16 2014–15
$'000 $'000Current employee benefits
Annual leave entitlements 1,880 1,534Long service leave entitlements 2,997 2,679Performance incentive entitlements (vi) 337 313
5,214 4,526Non-current employee benefits
Long service leave entitlements 492 409Total employee benefits 5,706 4,934
On-costsCurrent on-costs 746 653Non-current on-costs 76 64
228stsoc-no latoT 716825,6stsoc-no dna stifeneb eeyolpme latoT 5,651
(i)
(ii)(iii)(iv)
(v)
The amounts disclosed are discounted to present values.The amounts disclosed are nominal amounts.
Provisions for employee benefits consist of amounts for annual leave and long service leave accrued by employees, and assuming wage inflation of 4.12% per annum (2014-15: 4.44%) and discount rate of 1.99% (2014-15: 3.03%), each as advised by the Department of Treasury and Finance. On-costs such as payroll tax and workers' compensation insurance are not employee benefits and are recognised as a separate provision.
The provision for lease contracts reflects a requirement to provide for known future increases in operating lease rentals for the lease of VAGO's premises.
The make-good provision reflects a requirement in the terms of the lease of VAGO's premises to restore

113
Financial report
Note 14. Superannuation
2015–16 2014–15 2015–16 2014–15$'000 $'000 $'000 $'000
Defined benefit plans (i) :State Superannuation Fund – revised and new 102 139 2 1Defined contribution plans:VicSuper 1,111 1,097 16 9Other 590 540 8 4Total 1,803 1,776 26 15
(i) The bases for determining the level of contributions are determined by the various actuaries of the defined benefit superannuation plans.
Contribution outstanding at year end
Paid contribution for the year
Employees of VAGO are entitled to receive superannuation benefits and VAGO contributes to both defined benefit and defined contribution plans. The defined benefit plan provides benefits based on years of service and final average salary.
VAGO does not recognise any defined benefit liability in respect of the plan because the entity has no legal or constructive obligation to pay future benefits relating to its employees; its only obligation is to pay superannuation contributions as they fall due. The Department of Treasury and Finance recognises and discloses the state's defined benefit liabilities in its disclosure for administered items.
However, superannuation contributions paid or payable for the reporting period are included as part of employee benefits in the comprehensive operating statement of VAGO.
The name, details and amounts expensed in relation to the major employee superannuation funds and contributions made by VAGO are as follows:
Fund
(i)
(ii)(iii)(iv)
(v)
(vi)
(b) Movement in provisions On-costs Lease
contracts Make-good Total
2015–16 2015–16 2015–16 2015–16 $'000 $'000 $'000 $'000
Opening balance 716 299 545 1,561Additional provisions recognised 105 - 15 121Provisions released - (156) - (156)Closing balance 822 143 561 1,526
Current 746 143 561 1,450
Non-current 76 - - 76822 143 561 1,526
The amounts disclosed are discounted to present values.The amounts disclosed are nominal amounts.
Provisions for employee benefits consist of amounts for annual leave and long service leave accrued by employees, and assuming wage inflation of 4.12% per annum (2014-15: 4.44%) and discount rate of 1.99% (2014-15: 3.03%), each as advised by the Department of Treasury and Finance. On-costs such as payroll tax and workers' compensation insurance are not employee benefits and are recognised as a separate provision.
The provision for lease contracts reflects a requirement to provide for known future increases in operating lease rentals for the lease of VAGO's premises.
The make-good provision reflects a requirement in the terms of the lease of VAGO's premises to restore the property at the end of the lease term.
The comparative figure for 2014–15 includes an amount of $121,000 which was previously classified as 'other payables' in Note 11. It represents an estimate of the performance incentive entitlements payable to non-executive staff.
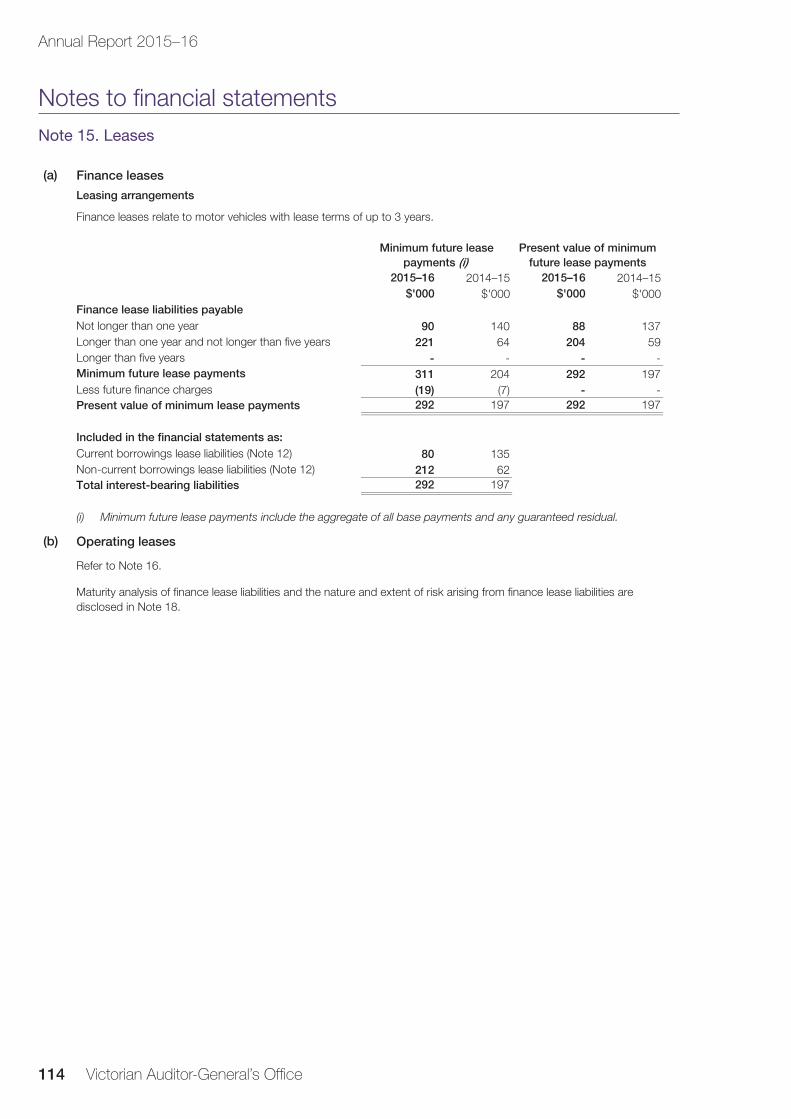
114 Victorian Auditor-General’s Office
Annual Report 2015–16
(a) Finance leases
Leasing arrangements
Finance leases relate to motor vehicles with lease terms of up to 3 years.
2015–16 2014–15 2015–16 2014–15$'000 $'000 $'000 $'000
Finance lease liabilities payableNot longer than one year 90 140 88 137Longer than one year and not longer than five years 221 64 204 59Longer than five years - - - -Minimum future lease payments 311 204 292 197Less future finance charges (19) (7) - -Present value of minimum lease payments 292 197 292 197
Included in the financial statements as:Current borrowings lease liabilities (Note 12) 80 135Non-current borrowings lease liabilities (Note 12) 212 62Total interest-bearing liabilities 292 197
(b) Operating leases
2015–16 2014–15$'000 $'000
Commitments payable (i)
Non-cancellable operating lease commitments Less than 1 year 1,423 1,850
Longer than 1 year but not longer than 5 years - 1,4245 years or more - -Total non-cancellable operating lease commitments 1,423 3,274
Contract commitments payableLess than 1 year 4,469 10,148Longer than 1 year but not longer than 5 years 712 2,9225 years or more - -Total contract audit commitments 5,181 13,070
Total commitments for expenditure (inclusive of GST) 6,604 16,344Less GST recoverable from the Australian Taxation Office (600) (1,486)Total commitments for expenditure (exclusive of GST) 6,003 14,858
(ii) Operating leases relate to VAGO's office accommodation with a lease term of 10 years, with an option to extend for a further 5 years. The operating lease contract contains a market review clause in the event that VAGO exercises its option to renew. VAGO does not have an option to purchase the leased asset at the expiry of the lease period.
The following commitments have not been recognised as liabilities in the financial statements:
(i) For future finance lease payments that are recognised on the balance sheet, refer to Note 15 Leases.
Present value of minimum future lease payments
(i) Minimum future lease payments include the aggregate of all base payments and any guaranteed residual.
Minimum future lease payments (i)
Refer to Note 16.
Maturity analysis of finance lease liabilities and the nature and extent of risk arising from finance lease liabilities are disclosed in Note 18.
Note 16. Commitments for expenditure
Notes to financial statementsNote 15. Leases

115
Financial report(b) Operating leases
2015–16 2014–15$'000 $'000
Commitments payable (i)
Non-cancellable operating lease commitments Less than 1 year 1,423 1,850
Longer than 1 year but not longer than 5 years - 1,4245 years or more - -Total non-cancellable operating lease commitments 1,423 3,274
Contract commitments payableLess than 1 year 4,469 10,148Longer than 1 year but not longer than 5 years 712 2,9225 years or more - -Total contract audit commitments 5,181 13,070
Total commitments for expenditure (inclusive of GST) 6,604 16,344Less GST recoverable from the Australian Taxation Office (600) (1,486)Total commitments for expenditure (exclusive of GST) 6,003 14,858
(ii) Operating leases relate to VAGO's office accommodation with a lease term of 10 years, with an option to extend for a further 5 years. The operating lease contract contains a market review clause in the event that VAGO exercises its option to renew. VAGO does not have an option to purchase the leased asset at the expiry of the lease period.
The following commitments have not been recognised as liabilities in the financial statements:
(i) For future finance lease payments that are recognised on the balance sheet, refer to Note 15 Leases.
(i) Minimum future lease payments include the aggregate of all base payments and any guaranteed residual.
Refer to Note 16.
Maturity analysis of finance lease liabilities and the nature and extent of risk arising from finance lease liabilities are disclosed in Note 18.
Note 16. Commitments for expenditureNote 16. Commitments for expenditure
Note 17. Contingent assets and contingent liabilities
At the reporting date, VAGO was not aware of any contingent assets or contingent liabilities.

116 Victorian Auditor-General’s Office
Annual Report 2015–16
Notes to financial statementsNote 18. Financial instruments
(a) Financial risk management objectives and policies
- cash assets;- receivables (excluding statutory receivables);- payables (excluding statutory payables); and- finance lease payables.
2015–16 2014–15$'000 $'000
Contractual financial assets - receivablesCash 1 1Receivables: (i) Other receivables 43 54
44stessa laicnanif lautcartnoc latoT 55
Contractual financial liabilities at amortised costPayables: (i) Supplies and services 1,704 937
34 14 Other payables 302 184Borrowings: Finance lease liabilities 292 197
233,2seitilibail laicnanif lautcartnoc latoT 1,332
2015–16 2014–15$'000 $'000
Contractual financial liabilitiesFinancial liabilities at amortised cost: Interest on finance leases - (13)
-seitilibail laicnanif lautcartnoc latoT (13)
There have been no net holding gains or losses in respect of contractual financial assets.
VAGO's principal financial instruments comprise:
(i) The total amounts disclosed here exclude statutory amounts (e.g. amounts owing from Victorian Government (2015-16: $16,789,000, 2014–15: $14,964,000) and taxes payable (2015-16: $90,000, 2014–15: $383,000)). Statutory financial assets will be used to cover payment of contractual financial liabilities.
The net holding gains or losses disclosed above are determined as follows:
Details of the significant accounting policies and methods adopted, including the criteria for recognition, the basis of measurement, and the basis on which income and expenses are recognised, with respect to each class of financial asset and financial liability above are disclosed in Note 1 to the financial statements.
Amounts payable to government and agencies
The main purpose in holding financial instruments is to prudently manage VAGO's business.
The carrying amounts of VAGO's contractual financial assets and financial liabilities by category are disclosed in Table 18.1 below.
Table 18.2 Net holding gain/(loss) on financial instruments by category
Table 18.1 Categorisation of financial instruments
- For financial liabilities measured at amortised cost, the net gain or loss is calculated by taking the interest expense, plus or minus foreign exchange gains or losses arising from the revaluation of financial liabilities measured at amortised cost.

117
Financial report
Less than 1 month
1–3 months 3 months –1 year
1–5 years
2015–16 $'000 $'000 $'000 $'000 $'000 $'000Receivables (i) :Other receivables 43 43 - - - -Total 43 43 - - - -
2014–15Receivables (i) :Other receivables 54 54 - - - -Total 54 54 - - - -
(i) The carrying amounts disclosed here exclude statutory amounts (e.g. Amounts owing from Victorian Government and GST input tax credit recoverable).
Carrying amount
Not past due and not
impaired
Past due but not impaired
Table 18.3 Ageing analysis of contractual financial assets
(c) Liquidity risk
The following table discloses the contractual maturity analysis for VAGO's contractual financial liabilities:
Liquidity risk is the risk that VAGO would be unable to meet its financial obligations as and when they fall due. VAGO operates under the Government fair payments policy of settling financial obligations within 30 days and in the event of a dispute, making payment within 30 days from the date of resolution.
VAGO's exposure to liquidity risk is deemed insignificant based on prior periods' data and current assessment of risk. Cash for unexpected events is generally sourced from the SAU balances held with Victorian Government.
Maximum exposure to liquidity risk is the carrying amount of financial liabilities as disclosed on the face of the balance sheet.
(b) Credit risk
Contractual financial assets that are either past due or impaired
Currently VAGO does not hold any collateral as security nor credit enhancements relating to any of its financial assets.
There are no financial assets that have had their terms renegotiated so as to prevent them from being past due or impaired, and they are stated at the carrying amounts as indicated. The following table discloses the ageing only of contractual financial assets that are past due but not impaired:
Whilst it is recognised that the Victorian Government is VAGO's largest debtor, VAGO’s exposure to credit risk is limited due to legislative provisions provided under the Audit Act 1994 which requires an audited entity to pay to the Consolidated Fund an amount to be determined by the Auditor-General to defray the reasonable costs and expenses of a financial audit undertaken by VAGO.
As at the reporting date, there is no event to indicate that any of the financial assets were impaired.

118 Victorian Auditor-General’s Office
Annual Report 2015–16
(d) Market risk
VAGO has no sensitivity to interest rate risk, as all its finance lease liabilities are fixed rate.
Less than 1 month
1–3 months 3 months – 1 year
1–5 years
2015–16$'000 $'000 $'000 $'000 $'000 $'000
Payables (ii) :
Supplies and services 1,704 1,556 1,556 - - -
Amounts payable to government and agencies 34 34 34 - - -
Other payables 302 302 302 - - -
Borrowings:Finance lease liabilities 292 311 7 13 70 221
2,332 2,203 1,898 13 70 221
2014–15Payables (ii) :Supplies and services 937 937 937 - - -Amounts payable to government and agencies 14 14 14 - - -Other payables 184 184 184 - - -Borrowings:Finance lease liabilities 197 204 20 38 83 64
1,332 1,340 1,155 38 83 64
(ii) The carrying amounts disclosed exclude statutory amounts (e.g. GST payables).
Table 18.4 Maturity analysis of contractual financial liabilities (i)
Carrying amount
(i) Maturity analysis is presented using the contractual undiscounted cash flows.
Nominal amount
Maturity dates
Notes to financial statementsNote 18. Financial instruments (continued)
Fixed interest rate
Variable interest rate
Non-interest bearing
2015–16$'000 $'000 $'000 $'000
Financial assetsCash - 1 - - 1Receivables (i) :
Other receivables - 43 - - 43Total financial assets 44 - - 44
Financial liabilitiesPayables (i) :Supplies and services - 1,704 - - 1,704Amounts payable to government and agencies - 34 - - 34Other payables - 302 - - 302Borrowings:Finance lease liabilities 4.06% 292 292 - -Total financial liabilities 2,332 292 - 2,040
2014–15
Financial assetsCash - 1 - - 1
Receivables (i) :
Other receivables - 54 - - 54Total financial assets 55 - - 55
Financial liabilitiesPayables (i) :Supplies and services - 937 - - 937Amounts payable to government and agencies - 14 - - 14Other payables - 184 - - 184Borrowings:Finance lease liabilities 5.10% 197 197 - -Total financial liabilities 1,332 197 - 1,135
(i)
Interest rate exposure
The carrying amounts disclosed here exclude statutory amounts (e.g. amounts owing from Victorian Government, GST input tax credit recoverable, and GST payables).
Table 18.5 Interest rate exposure of financial instrumentsWeighted
average interest rate
Carrying amount

119
Financial report
(a) Reconciliation of cash 2015–16 2014–15
$'000 $'000Total cash disclosed in the balance sheet (i) 1 1Balance as per cash flow statement 1 1
(i)
(b) Reconciliation of net result for the period 2015–16 2014–15
$'000 $'000Net result for the period 83 537Non-cash movements:
(Gain) / loss on disposal of non-current assets (24) 10Depreciation and amortisation of non-current assets 657 765
Movements in assets and liabilities: (Increase) / decrease in receivables (1,942) (1,054) (Increase) / decrease in prepayments 30 (68) Increase / (decrease) in payables 612 (672) Increase / (decrease) in provisions 736 711
Net cash flows from / (used in) operating activities 151 229
Due to the State of Victoria's investment policy and government funding arrangements, VAGO does not hold a large cash reserve in its bank accounts. Cash received by VAGO from the generation of income is generally paid into the State's bank account, known as the Public Account. Similarly, any VAGO expenditures, including those in the form of cheques drawn by VAGO for the payment of goods and services to its suppliers and creditors are made via the Public Account. The process is such that, the Public Account would remit to VAGO the cash required for the amount drawn on the cheques. This remittance by the Public Account occurs upon the presentation of the cheques by VAGO's suppliers or creditors. The balance of the Public Account is represented by amounts receivable from Victorian Government.
The above funding arrangements often result in VAGO having a notional shortfall in the cash at bank required for payment of unpresented cheques at the end of the reporting period.
At 30 June 2016, cash at bank included the amount of a notional shortfall for the payment of unpresented cheques of $1,000 (30 June 2015: $Nil).
Note 19. Cash flow information
(e) Fair valueThe carrying amounts of financial assets and financial liabilities recognised at the balance date, consisting of cash, receivables, payables and borrowings, represent fair value.

120 Victorian Auditor-General’s Office
Annual Report 2015–16
2015
–16
2014
–15
2015
–16
2014
–15
2015
–16
2014
–15
2015
–16
2014
–15
2015
–16
2014
–15
2015
–16
2014
–15
2015
–16
2014
–15
2015
–16
2014
–15
$'00
0$'
000
$'00
0$'
000
$'00
0$'
000
$'00
0$'
000
$'00
0$'
000
$'00
0$'
000
$'00
0$'
000
$'00
0$'
000
Con
trol
led
Pro
visi
on fo
r ou
tput
s (i)
15
,789
15,4
04-
--
-24
,732
23,5
36-
-40
,521
38,9
4040
,521
38,9
40-
-
Add
ition
s to
net
ass
ets
--
--
--
--
--
--
--
--
Tota
l15
,789
15,4
04
-
-
-
-
24
,732
23,5
36
-
-
40
,521
38,9
4040
,521
38,9
40
-
-
Par
liam
enta
ry a
pp
rop
riat
ions
2015
–16
2014
–15
$'00
0$'
000
App
ropr
iatio
n A
ct
Ann
ual a
ppro
pria
tion
15,7
8915
,404
15,7
8915
,404
Fina
ncia
l Man
agem
ent
Act
199
4
Sec
tion
29 –
est
imat
e (i)
23,5
0023
,400
1,23
213
624
,732
23,5
36
Tota
l Par
liam
enta
ry A
utho
rity
40,5
2138
,940
App
ropr
iatio
ns a
pplie
d40
,521
38,9
40Va
rianc
e-
-
Plu
s: v
aria
nce
from
est
imat
e (ii
)
Ad
vanc
e fr
omTr
easu
rer
See
Not
e 2
for
the
brea
k-up
of a
nnua
l app
ropr
iatio
n by
out
put g
roup
.
Sec
tion3
(2)
app
lied
Ap
pro
pri
atio
ns
(i)
$42
304
of t
he s
ectio
n 29
App
ropr
iatio
n dr
awn
dow
n in
201
4-15
was
app
lied
agai
nst
the
cost
s as
soci
ated
with
the
Aud
itor-
Gen
eral
(ple
ase
refe
r to
Not
e 20
(b)).
Var
ianc
e
(ii)
The
var
ianc
e fr
om e
stim
ate
in 2
015-
16 w
as d
ue t
o hi
gher
tha
n ex
pect
ed fe
e re
cove
ry fr
om a
udit
serv
ice
prov
ider
s.
Par
liam
enta
ry a
utho
rity
Tota
lA
nnua
l ap
pro
pri
atio
n
(a) S
umm
ary
of c
omp
lianc
e w
ith a
nnua
l Par
liam
enta
ry a
pp
rop
riatio
ns
App
ropr
iatio
n A
ctFi
nanc
ial M
anag
emen
t A
ct 1
994
Sec
tion
29S
ectio
n 32
The
follo
win
g ta
ble
disc
lose
s th
e de
tails
of t
he v
ario
us a
nnua
l Par
liam
enta
ry a
ppro
pria
tions
rec
eive
d by
VA
GO
for
the
year
. In
acco
rdan
ce w
ith a
ccru
al o
utpu
t-ba
sed
man
agem
ent p
roce
dure
s, 'P
rovi
sion
for
outp
uts'
and
'Add
ition
s to
net
ass
ets'
are
dis
clos
ed a
s 'c
ontr
olle
d' a
ctiv
ities
of V
AG
O.
Adm
inis
tere
d tr
ansa
ctio
ns a
re th
ose
that
are
und
erta
ken
on b
ehal
f of t
he s
tate
ove
r w
hich
VA
GO
has
no
cont
rol o
r di
scre
tion.
Notes to financial statementsNote 20. Summary of compliance with annual Parliamentary and special appropriations

121
Financial report
(b) Summary of compliance with special appropriations
Authority Purpose2015–16 2014–15
$'000 $'000
Section 94A(6) of the Constitution Act 1975 Costs associated with the Auditor-General (i) 576 541
Appropriations applied
(i) In 2014-15, the total costs associated with the Auditor-General were $583,000. VAGO applied $42,000 of the costs against its section 29 appropriation for the provision of outputs. This was due to the requirement to provide for a Fringe Benefits Tax event, which was not foreseen at the time of finalising the original warrant for special appropriation.
Note 21. Responsible persons
(a)
• J Doyle, Auditor-General (1 July 2015 to 22 September 2015) • •
(b) Remuneration
2015–16 2014–15
No. No.
$510,000 – $519,999 (substantive) - 1
$390,000 – $399,999 (acting) 1 -
$160,000 – $169,999 (substantive) 1 -
$100,000 – $109,999 (acting) - 1
$10,000 – $19,999 (acting) 1 -
(c) Related party transactions
Persons who held the Accountable Officer position in relation to VAGO at any time during the reporting period are:
Related party transactions requiring disclosure under the Directions of the Minister for Finance have been considered and there are no matters to report.
Given the independent relationship of the Auditor-General with the Parliament, no Government Minister has any direct responsibility for the operations of VAGO. The following disclosures are made relating to the Accountable Officer in accordance with the Directions of the Minister for Finance under the Financial Management Act 1994 :
Total remuneration received or receivable by the substantive and acting Accountable Officers in connection with the responsibilities of the position during the reporting period was in the following ranges:
Names
C Sheard (Acting, for 12 days during the period 1 July 2015 to 30 June 2016)P Frost (Acting, for 270 days during the period 1 July 2015 to 30 June 2016)

122 Victorian Auditor-General’s Office
Annual Report 2015–16
Income band 2015–16 2014–15 2015–16 2014–15No. No. No. No.
$70,000 to $79,999 - - - 1 $90,000 to $99,999 - - 1 - $100,000 to $109,999 2 - 2 - $110,000 to $119,999 - - 2 - $120,000 to $129,999 3 - - 1 $130,000 to $139,999 - 1 - 2 $140,000 to $149,999 - 1 - - $150,000 to $159,999 - 3 3 6 $160,000 to $169,999 2 4 1 1 $170,000 to $179,999 - 3 4 6 $180,000 to $189,999 6 6 1 1 $190,000 to $199,999 1 - 1 - $200,000 to $209,999 1 - - - $210,000 to $219,999 - - 2 2 $220,000 to $229,999 2 2 1 2 $230,000 to $239,999 1 2 1 1 $240,000 to $249,999 1 1 2 - $250,000 to $259,999 2 - - 1 $310,000 to $319,999 - - - 1 $330,000 to $339,999 - 1 - - $410,000 to $419,999 - 1 - -
12 srebmun latoT 25 21 25
Total annualised employee equivalents (i) 20.2 24.4 20.2 24.4
414,188,3 $ tnuoma latoT $ 4,973,964 $ 3,639,646 $ 4,504,193
Remuneration of executive officers whose total remuneration was less than $100,000 during the reporting period:
(i) Annualised employee equivalent is based on working 38 ordinary hours per week over the reporting period.
The numbers of executive officers, other than the Accountable Officer, whose total remuneration exceeded $100,000 during the reporting period are shown in the first two columns in the table below in their relevant income bands. The base remuneration of executive officers receiving more than $100,000 in total remuneration is shown in the third and fourth columns. Base remuneration is exclusive of bonus payments, long-service leave payments, termination payments and retirement benefits. The total annualised employee equivalent provides a measure of full time equivalent executive officers over the reporting period.
Total remuneration Base remuneration
Other than those executive officers whose remuneration is disclosed in the table above, there were 7 executive officers for whom remuneration disclosure is required whose remuneration was less than the reportable threshold of $100,000 (2 maternity leave, 3 appointments part way through the year, 2 departures). Their total remuneration was $511,292. In 2014-15, there was 1 executive officer whose total remuneration was less than $100,000. This officer was on secondment, and their total remuneration was $8,358.
Notes to financial statementsNote 22. Remuneration of executives

123
Financial report
2015–16 2014–15$'000 $'000
Audit of the financial statements of VAGO:Nexia Melbourne Audit Pty Ltd 33 -PKF Melbourne Audit & Assurance - 35
33 35
The auditor of VAGO is appointed by Parliament and paid by the Public Accounts and Estimates Committee in accordance with the Audit Act 1994 . Mr Geoff Parker from Nexia Melbourne Audit Pty Ltd was appointed to this position in 2016.
Nexia Melbourne Audit Pty Ltd has advised that it and its related practices were not at any time during the year directly or indirectly involved in any other audit or non-audit services provided to VAGO, including attest audits as a financial audit service provider.
As the remuneration of the auditor is paid by the Public Accounts and Estimates Committee, the amount disclosed above is included in "fair value of services received free of charge or for nominal consideration" in the comprehensive operating statement (see Note 4(d)).
Note 23. Remuneration of auditors
Note 24. Subsequent events
VAGO has no subsequent events to report.

124 Victorian Auditor-General’s Office
Annual Report 2015–16
Notes to financial statementsNote 25. Glossary of terms and style conventions
Glossary
Actuarial gains or losses on superannuation defined benefit plans Actuarial gains or losses are changes in the present value of the superannuation defined benefit liability resulting from: a) experience adjustments (the effects of differences between the previous actuarial assumptions and what has actually
occurred); and b) the effects of changes in actuarial assumptions. Administered item Administered item generally refers to VAGO lacking the capacity to benefit from that item in the pursuit of its objectives and to deny or regulate the access of others to that benefit. Borrowings Borrowings refers to interest-bearing liabilities raised from finance leases.
Capital asset charge A charge levied on the written down value of controlled non-current physical assets in a department’s balance sheet which aims to: attribute to agency outputs the opportunity cost of capital used in service delivery; and provide incentives to departments to identify and dispose of underutilised or surplus assets in a timely manner. Commitments Commitments include those operating, capital and other outsourcing commitments arising from non-cancellable contractual or statutory sources. Comprehensive result The comprehensive result is the net result of all items of income and expense recognised for the period. It is the aggregate of operating result and other comprehensive income.
Controlled item Controlled item generally refers to the capacity of VAGO to benefit from that item in the pursuit of its objectives and to deny or regulate the access of others to that benefit.
Depreciation Depreciation is an expense that arises from the consumption through wear or time of a produced physical or intangible asset. This expense is classified as a 'transaction' and so reduces the 'net result from transactions'.
Effective interest method The effective interest method is used to calculate the amortised cost of a financial asset or liability and of allocating interest income over the relevant period. The effective interest rate is the rate that exactly discounts estimated future cash receipts through the expected life of the financial instrument, or, where appropriate, a shorter period. Employee benefits expenses Employee benefits expenses include all costs related to employment including wages and salaries, fringe benefits tax, leave entitlements, redundancy payments, defined benefits superannuation plans, and defined contribution superannuation plans.

125
Financial report
Financial asset A financial asset is any asset that is:
a) cash; b) a contractual or statutory right:
- to receive cash or another financial asset from another entity; or - to exchange financial assets or financial liabilities with another entity under conditions that are potentially
favourable to the entity; or
Financial instrument A financial instrument is any contract that gives rise to a financial asset of one entity and a financial liability of another entity. Financial assets or liabilities that are not contractual (such as statutory receivables or payables that arise as a result of statutory requirements imposed by governments) are not financial instruments.
Financial liability A financial liability is any liability that is:
A contractual obligation: i. To deliver cash or another financial asset to another entity; or ii. To exchange financial assets or financial liabilities with another entity under conditions that are potentially
unfavourable to the entity.
Financial statements Financial statements comprises: a) a balance sheet as at the end of the period; b) a comprehensive operating statement for the period; c) a statement of changes in equity for the period; d) a cash flow statement for the period; e) notes, comprising a summary of significant accounting policies and other explanatory information; f) comparative information in respect of the preceding period as specified in paragraph 38 of AASB 101 Presentation of
Financial Statements; and g) a statement of financial position as at the beginning of the preceding period when an entity applies an accounting
policy retrospectively or makes a retrospective restatement of items in its financial statements, or when it reclassifies items in its financial statements in accordance with paragraph 41 of AASB 101.
General government sector The general government sector comprises all government departments, offices and other bodies engaged in providing services free of charge or at prices significantly below their cost of production. General government services include those which are mainly non-market in nature, those which are largely for collective consumption by the community and those which involve the transfer or redistribution of income. These services are financed mainly through taxes, or other compulsory levies and user charges.
Intangible produced assets Refer to produced assets in this glossary.
Interest expense Costs incurred in connection with the borrowing of funds includes interest on short-term and long-term borrowings, interest component of finance leases repayments, and the increase in financial liabilities and non-employee provisions due to the unwinding of discounts to reflect the passage of time.

126 Victorian Auditor-General’s Office
Annual Report 2015–16
Notes to financial statementsNote 25. Glossary of terms and style conventions (continued)
Net result Net result is a measure of financial performance of the operations for the period. It is the net result of items of income, gains and expenses (including losses) recognised for the period, excluding those that are classified as 'other economic flows - other comprehensive income'.
Net result from transactions/net operating balance Net result from transactions or net operating balance is a key fiscal aggregate and is income from transactions minus expenses from transactions. It is a summary measure of the ongoing sustainability of operations. It excludes gains and losses resulting from changes in price levels and other changes in the volume of assets. It is the component of the change in net worth that is due to transactions and can be attributed directly to government policies.
Net worth Assets less liabilities, which is an economic measure of wealth.
Non-financial assets Non-financial assets are all assets that are not ‘financial assets’. It includes plant and equipment, intangible assets, and prepayments and accrued income. Other economic flows included in net result Other economic flows included in net result are changes in the volume or value of an asset or liability that do not result from transactions. It includes: • gains and losses from disposals and impairments of non-financial physical and intangible assets; and • gains and losses arising form the revaluation of the long service leave liability.
Payables Includes short and long-term trade debt and accounts payable, grants, taxes and interest payable.
Produced assets Produced assets are non-financial assets that have come into existence as outputs of production processes. Produced assets include certain intangible assets, such as computer software.
Receivables Receivables include amounts owing from government through appropriation receivable, short and long-term trade credit and accounts receivable, grants and taxes receivable.
Sales of goods and services Refers to income from the direct provision of goods and services and includes fees and charges for services rendered and sales of goods and services.
Supplies and services Supplies and services generally represent cost of goods sold and the day-to-day running costs, including maintenance costs, incurred in the normal operations of VAGO. Transactions Transactions are those economic flows that are considered to arise as a result of policy decisions, usually an interaction between two entities by mutual agreement. They also include flows in an entity such as depreciation, where the owner is simultaneously acting as the owner of the depreciating asset and as the consumer of the service provided by the asset. Taxation is regarded as mutually agreed interactions between the government and taxpayers. Transactions can be in kind (e.g. assets provided/given free of charge or for nominal consideration) or where the final consideration is cash. In simple terms, transactions arise from the policy decisions of the government.

127
Financial report
Style conventions Figures in the tables and in the text have been rounded. Discrepancies in tables between totals and sums of components reflect rounding. Percentage variations in all tables are based on the underlying unrounded amounts.
The notation used in the tables is as follows: - zero, or rounded to zero (xxx.x) negative numbers 200x year period 200x-0x year period
The financial statements and notes are presented based on the illustration for a government department in the 2015–16 Model Report for Victorian Government Departments. The presentation of other disclosures is generally consistent with the other disclosures made in earlier publications of VAGO's annual reports.


129
Financial report
8 Appendices
Appendix one Key Audit Themes 130
Appendix two External engagements in 2015–16 142
Appendix three Employee profile by gender, age and classification 144
Appendix four Disclosure index 145
Appendix five Extract of whole-of-government financial statements—non-audited 147
Appendix six Policies and compliance 148
Appendix seven Additional information available on request 150
Appendix eight Five-year statistics 151

130 Victorian Auditor-General’s Office
Annual Report 2015–16
Appendix one
Key Audit Themes
01 Governance and oversight
02 Effective leadership
04 Implementation and delivery
03 Managing information
05 Measuring and reporting performance
06 Monitoring and managing risks to financial sustainability
07 Stakeholder engagement
Helping you to use the key audit themes
We regularly give tailored presentations on the key audit themes to specific sectors or interests. If you want us to present to your organisation, email us at [email protected].

131
Appendices
Introduction
Audits are designed to help agencies understand risks and challenges and help them to improve performance, governance and accountability.
All of our audit reports are publicly available. Despite this, agencies do not always take the opportunity to learn from the experience of others.
To help agencies benefit from insights from our wider audit program, each year we look through our reports to see whether similar findings appear across different reports. If a matter comes up in several audits, it is likely to be a widespread theme of interest to a range of agencies.
Key audit themes for 2015–16
Seven themes arise from our 2015–16 audit reports, each drawing on a number of common findings:• governance and oversight• effective leadership• managing information• implementation and delivery• measuring and reporting performance• monitoring and managing risks to financial sustainability• stakeholder engagement.
This year, about 20 per cent of findings in our audit reports were positive—higher than usual. Where appropriate, we have reflected this in the themes. However, as our audit program is designed to address areas of risk for the public sector, audit findings more often cover areas to improve than affirm positive practice.
How to use the themes
Each theme includes a high-level summary and detail on what we have seen and why it is problematic. We include excerpts from audit reports published between July 2015 and June 2016 to illustrate our findings and help you to identify reports that you may want to read in more detail. We present specific instances of good management, where available. It is important to remember that practices may have improved since our reports were tabled.
The self-assessment questions for each theme give a practical starting point for assessing how your agency fares in relation to that theme. People use the themes in different ways: • Boards and audit committees can ask managers to tell them how their organisations are
addressing the risks identified in the themes.• Risk managers can use the themes to help identify potential risks to address in their
organisation’s risk management plans.• Managers can consider the themes when designing new programs.• Internal auditors can use the themes to help them to choose what operational areas to audit
each year.• Human resources teams can use the themes to identify areas where further training for staff
may be useful.

132 Victorian Auditor-General’s Office
Annual Report 2015–16
Governance frameworks
There were encouraging improvements in relation to governance frameworks. We found that several agencies have worked to more clearly and formally define their governance arrangements.
‘Over the past six months the Department of Economic Development Jobs Transport & Resources (DEDJTR) has put a governance framework in place to ensure that there are consistent assumptions underpinning the transport modelling and economic appraisal of projects, and that these have been properly applied.’—Applying the High Value High Risk Process to Unsolicited Proposals (August 2015).
However, many aspects remain to be improved. We found that several governance frameworks were unclear or inadequate. The task of appropriately governing collaborative operations continues to be challenging, particularly for information-sharing.
‘[The Department of Education and Training’s (DET)] governance framework is deficient and consequently undermines the application of its planning framework … DET’s reliance on committees makes it difficult to identify responsible executive officers and diminishes their accountability. It is impossible to know whether these committees are operating effectively as it is often unclear who oversees their performance, how decisions are made, who is attending and how often they meet.’ —Department of Education and Training: Strategic Planning (October 2015).
Oversight of delegated or contracted activity
In 2015–16, we continued to find significant shortcomings in how senior managers and agencies oversee and monitor, especially in outsourced or ‘arm’s length’ arrangements.
‘In some cases, DET relies on system authorities to administer and oversee grants made to schools. In effect, this means that the system authorities oversee themselves ... DET does not oversee or monitor system authorities to assure itself that grants are used for their intended purpose or achieving the intended outcomes.’—Grants to Non-Government Schools (March 2016)
While there have been overall improvements during the year in how outsourced IT environments are managed, additional improvements are still required. There is a need to increase awareness of ownership and obligations relating to these outsourced environments, including assessing the reliability and quality of audits conducted over an entity’s outsourced environment and assessing the impact of any control weaknesses on the entities’ control environment. —Financial Systems Controls Report: Information Technology 2014–15 (October 2015)
Responding to recommendations and reviews
A key aspect of governance is having systems in place to ensure that actions take place in response to audits and other reviews. We found positive signs of responsiveness to our recommendations.
Governance and oversightGovernance arrangements include the structures, processes and practices that an agency uses to achieve its objectives. Poor governance arrangements make it more difficult for an agency to operate effectively and blur accountability for actions and outcomes. A long-running challenge in the public sector, the past year’s audits found some areas of positive performance, as well as persistent shortcomings.
01

133
Appendices
‘The majority of agencies, 82 per cent, reported assigning recommendations to responsible individuals. Nearly half of the individuals assigned to monitor and report on specific recommendations held executive management positions. This greater accountability for the timely completion of recommendations is reflected in the completion rates for agencies that took this approach.’ —Responses to Performance Audit Recommendations 2012–13 and 2013–14 (December 2015)
‘The department has initiated adequate action to address all of the recommendations in our 2014 report. In most instances, this has meant addressing systemic issues that require a long time to overcome.’ —Follow up of Residential Care Services for Children (June 2016)
However, we found several examples where the effort was not enough to address identified problems. Some agencies were particularly slow to address recommendations or did not address all recommendations. In other instances, the action taken did not lead to effective change. Audit committees did not always fulfil their role in seeking assurance that recommendations were being addressed.
‘The department’s audit committee has processes in place to assess progress in implementing recommendations from other external reports. However, it is not assessing the impact these actions are having. As a consequence, neither the department nor the audit committee can be assured that the effort being put into addressing the issues underlying the recommendations is effective.’ —Follow up of Managing Major Projects (August 2015)
Complying with regulatory frameworks
Some agencies did not comply with mandatory requirements, mainly in relation to financial management and accountability. We found several instances where agencies did not comply with the Financial Management Act 1994—the public sector’s framework for financial administration, accountability and
reporting—and the Standing Directions and standards that sit under this Act. More broadly, some agencies did not comply with mandated processes and policies, or fulfil reporting obligations.
‘2014–15 was the first financial year public hospitals were required by Standing Direction 4.5.6 Treasury Risk Management of the Financial Management Act 1994, to invest non-operational funds of greater than $2 million with the state’s treasury bodies, rather than investing in deposit institutions with a lower than AAA credit rating. Seventeen public hospitals did not comply with this requirement.’ —Public Hospitals: 2014–15 Audit Snapshot (November 2015)
‘Agencies also fall well short of fully complying with their obligations under Part II of the Freedom of Information Act 1982, to publish registers of the information they hold.’ —Access to Public Sector Information (December 2015)
Self-assessment questions
1 What assurance does my agency have that its governance arrangements are appropriate, clear and well understood?
2 How does my agency monitor activity that it is responsible for or that it has delegated or contracted to others?
3 How does my agency know whether it is identifying, managing and monitoring all relevant risks?
4 Does my agency have a system in place to monitor action on recommendations and reviews in a way that ensures that action is timely and meaningful and addresses the core problem?
5 Have we done enough to address the problems we already know about?
6 Does my agency have assurance over how it complies with relevant legislation and regulations?

134 Victorian Auditor-General’s Office
Annual Report 2015–16
Guidance and direction
There were instances of leadership showing the way and being the source of improvement, as well as instances where agencies failed to effectively set direction and drive change.
‘Systemic failures by [the Department of Health & Human Services] DHHS—some of which were identified over a decade ago in our 2005 audit—collectively indicate that DHHS is not effectively providing leadership or oversight of patient safety.’ —Patient Safety in Victorian Public Hospitals (March 2016)
Operational guidance from the centre on key activities or processes was often unclear, inadequate or absent, although we found some examples of good guidance material.
Creating a positive and ethical culture
Leaders are role models for an organisation’s behaviour and actions. Leaders who model appropriate conduct and behaviour will contribute to a positive culture. We found problems with culture—how members of an organisation approach their work and interact with each other—that were concerning. Leaders have opportunities to make a difference to these matters, by driving cultural change.
‘There is widespread fear among staff and a reluctance to raise issues or make formal complaints because of the perceived repercussions of doing so.’ —Bullying and Harassment in the Health Sector (March 2016)
‘There needs to be cultural change across Victoria Police, supported by strong leadership for this initiative to succeed.’ —Follow up of Asset Confiscation Scheme (June 2016)
Leadership is a critical element of an organisation. The approach of public sector leaders to decision-making and culture has a major influence on their organisations. Although audits rarely set out to consider the effectiveness of leadership, several reports highlighted the significant role of leadership within the programs and activity they assessed.
Effective leadership
02

135
Appendices
Frank and fearless advice
For leaders to fulfil their roles and make informed decisions, they need frank, impartial and timely advice from the public sector. This is enshrined in the values and principles that guide the public sector, with ‘providing frank, impartial and timely advice to government’ listed as a key value in the Public Administration Act 2004. We found some positive examples where decision-makers were supported well with advice.
‘Advice provided to government to support decisions on the establishment and rollout of the [Protective Services Officer (PSO)] … program was comprehensive. The report back to government following the first 18 months of the program was focused on the government’s priorities at the time, but it also advocated for changes to the PSO program in order to improve efficiency and effectiveness and to reduce costs. While government chose not to follow this advice, the options presented were comprehensive and soundly based.’ —Public Safety on Victoria’s Train System (February 2016)
However, we found several instances where this principle was not fulfilled across aspects of public sector administration including for major policies and infrastructure decisions. Similarly, we found shortcomings in advice or information provided to oversight bodies such as audit committees.
‘Over the life of this costly and complex project, advice to government did not always meet the expected standard of being frank and fearless. This highlights a risk to the integrity of public administration that needs to be addressed.’ —East West Link Project (December 2015)
‘The application of the [High Value High Risk] … process to CityLink Tulla had significant gaps which [the Department of Treasury and Finance] … needs to address for similar proposals in the future. The lack of sufficient information on the project’s benefits, the absence of a full funding analysis and weaknesses in the approach to stakeholder engagement are fundamental gaps which compromise the quality of advice government is entitled to receive.’ —Applying the High Value High Risk Process to Unsolicited Proposals (August 2015)
‘Public sector leadership needs to be focussed on creating a sense of public trust for government’s stewardship role. This public trust needs to be a network of trust: Citizens must be able to trust public institutions to defend their interests. Politicians and ministers must be able to trust that the public service will give them objective, high quality and fearless advice.’ —Chris Eccles, Secretary, Department of Premier & Cabinet, in his ‘Leadership from the centre’ address, Melbourne 23 June 2016
Self-assessment questions
1 How does my agency get assurance and feedback about whether the guidance and support we give other agencies or staff meets their needs?
2 Does my agency’s leadership group use indicators to benchmark positive culture to strengthen integrity and monitor the risk of inappropriate behaviour?
3 Do I have assurance that my agency provides frank and fearless advice to government? Do I offer advice both for and against options in briefings to support decision-making?

136 Victorian Auditor-General’s Office
Annual Report 2015–16
Quality of data and information
We continued to find widespread shortcomings in data and information throughout the public sector. Some agencies failed to record important decisions or activity. Others did not effectively analyse, use or disseminate the information they held. Some agencies did not model or forecast options and plans effectively. Nonetheless there were positive examples where agencies had good quality data and information.
‘[The Department of Environment, Land, Water and Planning’s] spatial data has long been recognised for its high quality, and efforts to ensure that it is supported by mature and robust governance and management processes have made it one of Victoria’s most valuable and highly used data sources.’ —Access to Public Sector Information (December 2015)
Systems and controls
Today, the public sector does much of its work using information systems. We found examples of out-of-date systems, including those used for financial management and reporting, that undermined efficiency and effectiveness. We found that, although financial reporting systems and controls throughout the public sector are generally sound, many weaknesses remained, including in security controls.
‘IT security controls need improvement—IT security control weaknesses account for 68 per cent of all IT audit findings. There is poor management of IT security, particularly relating to user access and alignment with Victorian Government IT security standards.’ —Financial Systems Controls Report: Information Technology 2014–15 (October 2015)
Record-keeping
Often, agencies could not show why or how they had spent funds, made decisions or managed risks. However, record-keeping is not just about creating an audit trail. It is a fundamental governance matter because it is about retaining corporate knowledge and improving how the public sector works. Addressing this shortcoming is a straightforward way of improving the public sector’s efficiency, economy and effectiveness. We found pervasive inadequacies in record-keeping.
‘The absence of documentation for three of the 15 selected projects is a significant issue, as it is impeding effective project governance by agencies and means we have been unable to assess if these projects addressed key elements in the investment lifecycle guidance.’ —Managing and Reporting on the Performance and Cost of Capital Projects (May 2016)
Managing informationThe right information can completely change the way you look at a problem. Having relevant, complete and accurate information helps to improve decision-making. Sharing information can have a huge impact. Taking time to focus on the technical side of managing information can provide your agency with more reliable reporting.
03
Self-assessment questions
1 What information does my agency collect and how does it use it? Is this enough? Could this be improved?
2 Are my agency’s information and monitoring systems in place, up to date, secure, and meeting users’ needs?
3 Is my agency committed to record-keeping, including training our staff and allocating enough time and resources to record-keeping? Is it easy to trace decisions and demonstrate activities? Are key processes documented properly?

137
Appendices
Achieving results
Public sector goals are hard to achieve. Agencies do not face an easy task to achieve their targets in a complex environment with limited resources and constant change. We found that the public sector’s performance was mixed. We found examples of the public sector achieving good results:
‘[State schools are] now performing better than non-government schools and the Victorian workers’ compensation scheme in returning injured employees back to work earlier.’ —Follow up of Management of Staff Occupational Health and Safety in Schools (August 2015)
‘[The Parole System Reform Program] has improved the operations of the APB [Adult Parole Board]. Board members now have sufficient time to consider each case, and improved ICT systems allow easier access to information and the improved recording of decisions made.’ —Administration of Parole (February 2016)
We found several instances where the public sector did not achieve intended results, or fully implement projects and programs.
‘I also found a real risk that the expected benefits will not be achieved. Current forecasts predict consumers will only receive approximately 80 per cent of the benefits identified in the most recent 2011 cost-benefit analysis—provided that all issues and risks are effectively mitigated—and as costs increase over the life of the program, the final net cost to consumers is likely to rise above $319 million.’ —Realising the Benefits of Smart Meters (September 2015)
Project management
Several audits found that projects and programs were delivered late and over budget. Infrastructure and services were not available as soon as intended, and the state paid millions of dollars more than planned, particularly in relation to ICT and capital projects.
‘None of the ICT Projects considered in this audit were completed or will be completed as initially budgeted. One of the six projects examined finished on schedule. One project was terminated prior to system delivery, six years after the planned completion date and having cost twice the intended budget. Most of the six projects examined in this audit faced significant challenges at various points during implementation.’ —Digital Dashboard: Status Review of ICT Projects and Initiatives – Phase 2 (March 2016)
Implementation and deliveryThe public sector is responsible for delivering big-budget projects and programs to bring about the outcomes and objectives that government sets. The community expects government to deliver the services and outcomes it says it will. In keeping with legislation, performance audits examine whether it has done so effectively, efficiently and economically.
04
Self-assessment questions
1 Is my agency achieving its objectives?
2 How informative are the explanations given for any target shortfalls?
3 How is my agency monitoring project timeliness and spending?
4 How does my agency respond when projects are in danger of going over budget or schedule?

138 Victorian Auditor-General’s Office
Annual Report 2015–16
Financial reporting
We continued to find that public sector financial reporting can be largely relied on, with most financial statements of Victorian public sector agencies receiving a clear audit opinion.
‘Clear financial audit opinions were issued for the 79 local councils for the year ended 30 June 2015. This means that Parliament and the public can have confidence in the financial statements of these local councils.’—Local Government: 2014–15 Audit Snapshot (November 2015)
However, we found that more financial reports could not be completely relied on. Twenty-six audit opinions were either a qualified or disclaimer opinion or the opinion identified an emphasis of matter. Of particular concern, the Annual Financial Report of the State of Victoria (AFR) and the financial reports of two of the seven government departments had problems that led to the Auditor-General issuing qualified opinions.
‘The AFR received a modified audit opinion, consisting of two audit qualifications: the AFR did not record an expense, and associated liability, recognising the state’s obligation to return to the Commonwealth Government $1.5 billion of funding relating to the [East West Link] … project; the property, plant and equipment balances of DET, which are included in the AFR, were not supported by proper accounts and records.’ —Auditor-General’s Report on the Annual Financial Report of the State of Victoria, 2014–15 (November 2015)
We observed that the overall timeliness of financial reporting is slipping. This reduces the accountability and transparency of the public sector’s finances. The AFR was late, because most of the agencies that contribute to this report were late in providing their draft financial statements to the Department of Treasury & Finance.
Designing performance measurement frameworks
If the framework for measuring performance is not designed well in the first place, it undermines the entire performance measurement regime. This has been a longstanding theme in our audits. We found that some programs or agencies did not have performance measurement frameworks at all. For those that did, key performance indicators were not always relevant, or agencies did not set targets for performance. In several instances, evaluations should have been carried out but were not, meaning that agencies had no strong evidence to demonstrate performance or inform future activities.
‘The long-term water quality monitoring programs in the Port Phillip and Western Port region are not clearly linked to these objectives and they have not been evaluated against them.’ —Monitoring Victoria’s Water Resources (May 2016)
Reporting financial and non-financial performance demonstrates whether government has delivered on its commitments and used funds provided by Parliament efficiently, effectively and for the purposes that were intended. Public sector agencies are required to publish financial reports that comply with legislation and standards and that fairly present their financial position. If performance measurement and reporting systems are designed poorly or reports are difficult to understand or unreliable, then the public sector cannot be held to account for its performance.
Measuring and reporting performance
05
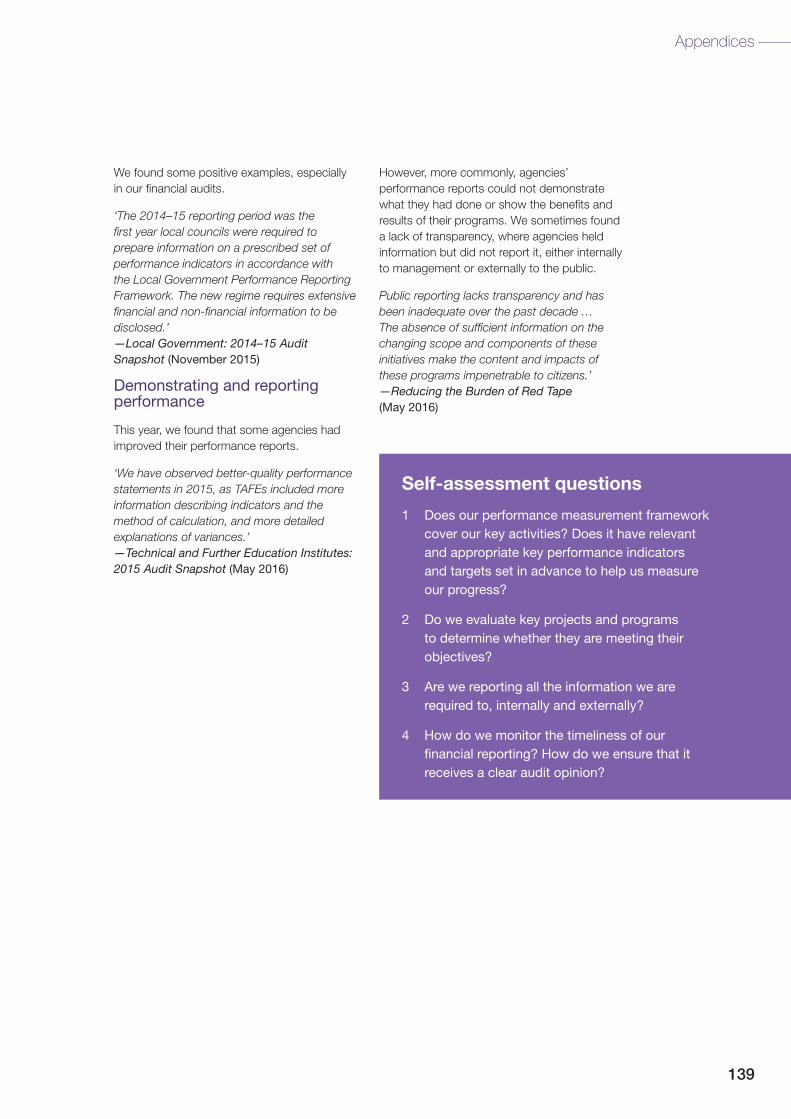
139
Appendices
We found some positive examples, especially in our financial audits.
‘The 2014–15 reporting period was the first year local councils were required to prepare information on a prescribed set of performance indicators in accordance with the Local Government Performance Reporting Framework. The new regime requires extensive financial and non-financial information to be disclosed.’ —Local Government: 2014–15 Audit Snapshot (November 2015)
Demonstrating and reporting performance
This year, we found that some agencies had improved their performance reports.
‘We have observed better-quality performance statements in 2015, as TAFEs included more information describing indicators and the method of calculation, and more detailed explanations of variances.’ —Technical and Further Education Institutes: 2015 Audit Snapshot (May 2016)
However, more commonly, agencies’ performance reports could not demonstrate what they had done or show the benefits and results of their programs. We sometimes found a lack of transparency, where agencies held information but did not report it, either internally to management or externally to the public.
Public reporting lacks transparency and has been inadequate over the past decade … The absence of sufficient information on the changing scope and components of these initiatives make the content and impacts of these programs impenetrable to citizens.’—Reducing the Burden of Red Tape (May 2016)
Self-assessment questions
1 Does our performance measurement framework cover our key activities? Does it have relevant and appropriate key performance indicators and targets set in advance to help us measure our progress?
2 Do we evaluate key projects and programs to determine whether they are meeting their objectives?
3 Are we reporting all the information we are required to, internally and externally?
4 How do we monitor the timeliness of our financial reporting? How do we ensure that it receives a clear audit opinion?

140 Victorian Auditor-General’s Office
Annual Report 2015–16
Impact of funding models on financial sustainability
The funding or pricing models that some agencies are required to operate within can challenge the capacity of management to make long-term financial plans, or to grow income beyond a fixed ceiling. Agencies that rely on earned income from operations, including arts, sports and tourism organisations, can be particularly vulnerable to financial sustainability risks.
‘These [self-funded] entities face significant financial challenges, that if not addressed, may lead to a reduction in the services they provide to the community. If they are to be financially sustainable over the long term, the underlying pricing model used to generate revenue may need amendment, another funding source may need to be identified, cost structure may need review, or additional government support may be required.’ —Portfolio Departments and Associated Entities: 2014–15 Audit Snapshot (December 2015)
Maintaining and renewing assets
A key aspect of financial sustainability is being able to replace and repair assets. Assets include buildings such as schools, hospitals, and universities and other infrastructure such as community swimming pools. Assets have to be maintained and eventually replaced. Managing this process is a significant part of the work of many agencies. We found that some agencies were not funding new assets or maintaining assets at the same rate as assets were depreciating. If assets are not maintained or replaced, the quality of services the community receives can decrease and, as time goes by, it can become more expensive to address problems.
‘The continuing deficits are not allowing public hospitals to build up reserves from operations to replace or renew their fixed assets. Funds for replacement and new assets are provided mostly through specific purpose government grants, which are awarded based on the assessment of business cases. In addition, public hospitals also undertake specific fund raising. Current revenue levels create longer-term financial sustainability risks, and could, ultimately, impact the quality and variety of services offered to the public.’ —Public Hospitals: 2014–15 Audit Snapshot (November 2015)
Agencies must be able to generate enough funds from operations to meet financial obligations, fund asset replacement and renewal, and absorb foreseeable changes. Management must monitor and manage its agency’s ability to do this. Our audits found improvements in most indicators of risks to financial sustainability, although a range of challenges remain.
Monitoring and managing risks to financial sustainability
06
Self-assessment questions
1 Has my agency assessed the impact of our funding or pricing models on our financial sustainability?
2 Does my agency monitor key indicators of risk to financial sustainability, including debt and cash flow?
3 Does my organisation have an appropriate risk management regime in place to assess financial sustainability risks?
4 What actions does my agency take in response to significant and emerging risks to its financial sustainability?
5 Is my organisation maintaining, replacing and renewing assets as required?

141
Appendices
Getting input from stakeholders
We found good examples of stakeholders being consulted to collect information, opinions and advice.
‘The department is working to improve its complaints processes and assess the feasibility of an independent advocacy role for children and young people in residential care, which will contribute further to meeting their needs. This has involved engaging with children and young people in residential care to include their voice in identifying the issues and the possible actions to address these.’ —Follow Up of Residential Care Services for Children (June 2016)
However, we did see shortcomings. Sometimes, agencies did not consult key stakeholders, or did not consult in a well-planned way.
‘DEDJTR engages extensively with non-government stakeholders on livestock biosecurity matters. However, this engagement has not occurred in line with an overarching strategic approach. The needs of, and risks to, non-government stakeholder groups— including livestock industries and private veterinary practitioners—have not been systematically assessed.’ —Biosecurity: Livestock (August 2015)
Communicating to stakeholders
Communications activities can often be overlooked. Failing to communicate can significantly affect outcomes, effective implementation, the uptake of a service and stakeholders’ perceptions. Although some agencies’ communications and awareness activities were effective, others’ were not.
‘The lack of a PSO public awareness strategy means that agencies are not capitalising on the presence of PSOs to improve perceptions of safety and increase patronage on trains after 6 pm.’ —Public Safety on Victoria’s Train System (February 2016)
This year, several of our audits assessed how well agencies engage with stakeholders, including the public. This engagement has become more frequent, reflecting the impact it has on effective public sector administration. One of the Victorian Special Minister of State’s six directions for reforming the public sector includes considering how citizens and communities co-create public value.
Stakeholder engagement
07
Self-assessment questions
1 Do we have a stakeholder engagement plan for the whole organisation?
2 Is stakeholder engagement given adequate consideration in planning key projects, programs and activities?
3 Do we carry out adequate communications and awareness activities for stakeholders?
4 Do we review how effectively we engage stakeholders?

142 Victorian Auditor-General’s Office
Annual Report 2015–16
Appendix two
External engagements in 2015–16Presentations by the Auditor-General and senior staff in 2015–16
Date Presentation to Topic
3 August 2015 Centre for Excellence in Child and Family Welfare (a peak body for family service providers)
Key findings of the audit Early intervention services to vulnerable children and families.
4 August 2015 Inquiry into Rate Capping Policy Presentation of findings from recent audits of local government.
7 August 2015 Association of TAFE Business Managers Financial Outcomes for the Sector for 2014 and perspectives looking forward to 2015.
7 August 2015 Local Government Pro Chief Executive Officers Forum
Financial Sustainability Risk and the Asset Renewal Gap.
15 August 2015 ANZSOG Ministerial Staff Workshop Overview of Auditor-General’s role and responsibilities and interactions with ministers’ offices.
14 September 2015 Masters students in the Health Services Management & Public Health Program
Quality and Safety Assurance—the role of the Victorian Auditor-General’s Office.
21 September 2015 Monash University Governance Auditors-General in the integrity system.
25 September 2015 University of Melbourne Oversight of the public sector: explosion or erosion? A perspective from the Victorian Auditor-General’s Office.
8 October 2015 Governance Institute Public Sector Update Luncheon
Key Audit Themes 2014–15.
15 October 2015 Annual PASAI Congress in Vanuatu ‘Applying INTOSAI Independence Principles: The Australian Experience’, comparing independence of Audit Offices across Australian jurisdictions.
26 October 2015 Safe and Secure Hospitals Conference Addressing Violence in Victorian Health Care Settings—an Audit Perspective.
28 October 2015 PwC Audit Committee Chairs luncheon Key Audit Themes 2014–15.
30 October 2015 Local Government Finance Professionals Results of the 2014–15 Local Government Audits.
13 November 2015 Victorian OHS Network Occupational Violence against Healthcare Workers audit.
18 November 2015 AUSFOG Conference Audit observations.
4 December 2015 VicRoads Audit Committee Key Audit Themes 2014–15.
12 February 2016 Australian College of Health Service Management
Health Service Financial management—An Audit Perspective.
25 February 2016 DOJR Statutory Entities VAGO Update.
18 February 2016 Local Government Finance Professionals Local Government Audit Snapshot 2014–15.
2 March 2016 Australian Institute of Project Management Panel Roundtable (AIPM Melbourne Chapter)
Project Management in Local Government—the state of play.
17 March 2016 Australian Institute of Building Surveyors(South Australian Chapter Conference, Adelaide)
Presentation on Victoria’s consumer protection framework for building construction report.
18 March 2016 Local Government Pro CEO Forum Integrity and Accountability Legislation Amendment (A Stronger System) Bill 2015—A VAGO perspective.

143
Appendices
Date Presentation to Topic
13 April 2016 KPMG Accounting and Reporting Issues Seminar
Key Audit Themes 2014–15.
20 April 2016 7th Annual Victorian Major Projects conference
East West Link Project.
12 May 2016 PASAI/ACAG Regional Working Group on Environmental Auditing
Impacts of Performance Audits—Regulatory Approaches.
12 May 2016 Victorian Country Pools Conference (Aquatics & Recreation Victoria)
VAGO report—Asset management shortfalls: what does this mean to country pools?
26 May 2016 Local Government Finance Professionals Preparedness for 30 June 2016 audits.
26 May 2016 Australian Health Services Financial Management Association ‘Meeting of the Minds’
Key Audit Themes 2014–15.
2 June 2016 Regulators’ Community of Practice (hosted by the Commissioner for Better Regulation)
Reducing the Burden of Red Tape performance audit—key insights and recommendations.
8 June 2016 Ernst & Young Government Accounting update
Key Audit Themes 2014–15.
24 June 2016 Corrections Victoria Occupational Violence Summit
Occupational Violence Audit.
14 July 2016 Sustainability Victoria Stakeholder Engagement Network
Better Practice Guide: Public Participation in Government Decision-making.
International delegations to VAGO in 2015–16
Date Organisation Purpose, interest or theme of visit
17 September 2015 Ugandan Ministry of Finance, Planning and Economic Development
Public Private Partnerships.
24 November 2015 Foreign Policy Research Team of Cheongju City Hall, South Korea
Information Systems Auditing and ICT systems interfaces. Obtaining data easily for auditing or anti-corruption purposes.Information System Audit reports by VAGO.
10 December 2015 National Audit Office of the People’s Republic of China
Financial audit methods used by VAGO as well as general information about performance audit. The delegation outlined specific topics for discussion during their visit.Financial audit under the context of a mixed economy.How to improve the accounting information transparency and the audit independence.
26 February 2016 Board of Audit of Japan VAGO’s overall role and mandate, our audit of private public partnerships, and specifically our Operating Water Infrastructure Using Public Private Partnerships audit.
4 May 2016 Northern Pacific Auditors-General The role and mandate of VAGO and an outline of current and planned financial and performance audits.

144 Victorian Auditor-General’s Office
Annual Report 2015–16
Appendix three
Employee profile by gender, age and classification(a)(b)
Ongoing employees Fixed term and casual
Number (headcount)
Full time (headcount)
Part time (headcount) FTE FTE
June 2016 178 149 29 168.45 20.80
June 2015 163 138 25 156.00 20.60
June 2016 June 2015
OngoingFixed term and casual Ongoing
Fixed term and casual
Number (headcount) FTE FTE
Number (headcount) FTE FTE
Gender
Male 73 72.00 14.00 72 71.00 10.00
Female 105 96.45 6.80 91 85.00 10.60
Total 178 168.45 20.80 163 156.00 20.60
Age
Under 25 2 2.00 3.00 6 6.00 2.00
25-34 59 56.63 9.00 59 58.00 8.00
35-44 67 62.32 5.80 51 46.50 6.60
45-54 37 34.90 3.00 32 30.90 2.00
55-64 11 10.60 0.00 14 13.60 2.00
Over 64 2 2.00 0.00 1 1.00 0.00
Total 178 168.45 20.80 163 156.00 20.60
Classification
Auditor-General 0 0.00 0.00 1 1.00 0.00
Executive 24 23.70 0.00 24 23.80 1.00
STS(c) 3 2.70 0.00 3 2.60 0.00
Grade 6 43 39.03 3.00 33 30.40 4.00
Grade 5 40 37.39 7.80 24 22.00 8.00
Grade 4 28 26.23 3.00 34 32.80 1.00
Grade 3 35 34.40 1.00 33 32.40 3.60
Grade 2 5 5.00 6.00 11 11.00 3.00
Grade 1 0 0.00 0.00 0 0.00 0.00
Total 178 168.45 20.80 163 156.00 20.60
(a) All figures reflect active employees during the last full pay period in June each year.(b) Excluded are those on leave without pay or absent on secondment, external contractors/consultants, and
temporary staff employed by employment agencies.(c) The Senior Technical Specialist roles at VAGO comprise one specialist senior auditing role, one specialist
senior accounting role, and one senior business management role.

145
Appendices
Appendix four
Disclosure indexOur annual report is prepared in accordance with all relevant Victorian legislation and pronouncements. This index has been prepared to facilitate identification of our compliance with statutory disclosure requirements.
Legislation Requirement Page
Ministerial directions
Report of operations—FRD guidance
Charter and purpose
FRD 22G Manner of establishment and the relevant Minister 9
FRD 22G Purpose, functions, powers and duties 9
FRD 22G Key initiatives and projects 12–13
FRD 22G Nature and range of services provided 9
Management and structure
FRD 22G Organisational structure 42
Financial and other information
FRD 8D, SD 4.2(k) Performance against output performance measures 14
FRD 8D Budget portfolio outcomes 147
FRD 10A Disclosure index 145
FRD 15C Executive officer disclosures 45
FRD 22G Employment and conduct principles 32
FRD 22G Occupational health and safety policy 33
FRD 22G Summary of the financial results for the year 17
FRD 22G Significant changes in financial position during the year 17
FRD 22G Major changes or factors affecting performance 10
FRD 22G Subsequent events 123
FRD 22G Application and operation of Freedom of Information Act 1982 149
FRD 22G Compliance with building and maintenance provisions of the Building Act 1993
148
FRD 22G Statement on National Competition Policy 148
FRD 22G Application and operation of the Protected Disclosure Act 2012 148
FRD 22G Details of consultancies over $10 000 76
FRD 22G Details of consultancies under $10 000 76
FRD 22G Statement of availability of other information 150
FRD 22G Disclosure of ICT expenditure 51
FRD 24C Reporting of office-based environmental impacts 57
FRD 25B Victorian Industry Participation Policy disclosures 148
FRD 29A Workforce data disclosures – Public Sector Employees 29, 144
SD 4.5.5 Risk management compliance attestation 54
SD 4.5.5.1 Ministerial Standing Direction 4.5.5.1 compliance attestation 54
SD 4.2(g) Specific information requirements 1–72
SD 4.2(j) Sign off requirements 4
Financial report
Financial statements required under Part 7 of the Financial Management Act 1994
SD4.2(a) Statement of changes in equity 84
SD4.2(b) Operating statement 82
SD4.2(b) Balance sheet 83
SD4.2(b) Cash flow statement 85

146 Victorian Auditor-General’s Office
Annual Report 2015–16
Legislation Requirement Page
Other requirements under Standing Directions 4.2
SD4.2(c) Compliance with Australian accounting standards and other authoritative pronouncements
86
SD4.2(c) Compliance with Ministerial Directions 80
SD4.2(c) Accountable officer’s and chief financial and accounting officer’s declaration
80
SD4.2(d) Rounding of amounts 88
SD4.2(f) Compliance with Model Financial Report 76
Other disclosures as required by FRDs in notes to the financial statements
FRD 9A Disclosure of administered assets and liabilities 103
FRD 13 Disclosure of Parliamentary appropriations 120
FRD 21B Disclosures of responsible persons, executive officers and other personnel (contractors with significant management responsibilities) in the financial report
121
FRD 103F Non-current physical assets 107–109
FRD 110 Cash flow statements 85
FRD 112D Defined benefit superannuation obligations 89
FRDs applicable to VAGO with no disclosures to make in 2015–16
FRD 11 Disclosure of ex-gratia payments
FRD 12A Disclosure of major contracts
FRD 22G Application and operation of the Carers Recognition Act 2012
FRD 22G Disclosure of government advertising expenditure
FRD 102 Inventories
Legislation
Financial Management Act 1994 86
Audit Act 1994 9
Freedom of Information Act 1982 149
Building Act 1993 148
Protected Disclosure Act 2012 148
Victorian Industry Participation Policy Act 2003 148
The only departure from FRDs is in relation to FRD 30B Standard Requirements for the Publication of Annual Reports, April 2015. The departure is specifically in relation to 5.3 Design. Section 5.3 Design of FRD30B suggests that internal colour should be kept to one colour, or as few colours as possible where it is essential to enable the readability and legibility of complex charts, graphs, maps or diagrams. Our Annual Report 2015–16 uses several colours in complex charts, graphs, maps and diagrams to enable our readers to easily understand content and flow.

147
Appendices
Appendix five
Extract of whole-of-government financial statements—non-audited
The following table provides a comparison between the actual financial statements of VAGO and the forecast financial information published in the Budget Paper No. 5 Statement of Finances 2015–16 (BP5), for the portfolio of Parliament. The table comprises the comprehensive operating statement. The table has been prepared on a consolidated basis and includes all general government sector agencies within the portfolio. Financial transactions and balances are classified into either controlled or administered categories as agreed with the Treasurer in the context of the published statements in BP5. The following statements are not subject to audit and are not prepared on the same basis as VAGO’s financial statements as they include the consolidated financial information of the Parliament agency.
Actual Variance (ii)
Parliament VAGO Controlled Parliament (i)
VAGO VAGO
$'000 $'000 $'000 $'000 $'000Income from transactions
Output appropriations 107,131.6 39,611.0 146,742.6 40,520.8 909.8Special appropriations 38,738.0 611.0 39,349.0 576.3 (34.7)Sale of goods and services 0.0 0.0 0.0 253.4 253.4Grants 0.0 0.0 0.0 0.0 0.0Fair value of services received free of charge or for nominal consideration
0.0 35.0 35.0 33.0 (2.0)
Total income from transactions 145,869.6 40,257.0 186,126.6 41,383.5 1,126.5
Expenses from transactionsEmployee benefits 85,393.6 24,247.0 109,640.6 23,715.4 531.6Depreciation and amortisation 13,981.0 802.0 14,783.0 656.9 145.1Interest expense 129.3 29.0 158.3 15.3 13.7Capital asset charge 2,898.1 120.0 3,018.1 119.9 0.1Other operating expenses 43,495.8 15,619.0 59,114.8 16,720.6 (1,101.6)
Total expenses from transactions 145,897.8 40,817.0 186,714.8 41,228.1 (411.1)
Net result from transactions (net operating balance) (28.2) (560.0) (588.2) 155.4 715.4
(i) Budget figures are as published in 2015–16 Statement of Finances: Budget Paper No. 5 , page 139 (shown in $millions).(ii) For income items, the variance is positive if actual exceeds budget. For expense items, the variance is positive if budget exceeds actual.
The following table provides a comparison between the actual financial statements of VAGO and the forecast financial information published in the Budget Paper No. 5 Statement of Finances 2015–16 (BP5), for the portfolio of Parliament. The table comprises the comprehensive operating statement. The table has been prepared on a consolidated basis and includes all general government sector entities within the portfolio. Financial transactions and balances are classified into either controlled or administered categories as agreed with the Treasurer in the context of the published statements in BP5. The following statements are not subject to audit and are not prepared on the same basis as VAGO’s financial statements as they include the consolidated financial information of the Parliament entity.
Budget
2015–16

148 Victorian Auditor-General’s Office
Annual Report 2015–16
Appendix six
Policies and complianceBuilding Act
VAGO does not own or control any government buildings and, therefore, has no responsibilities under the Building Act 1993.
DataVic Access Policy
In August 2012, the Victorian Government endorsed the DataVic Access Policy to enable public access to government data, and to improve how the public sector shares information.
VAGO complies with this policy, and agreed data sets are available on our website.
Victorian Industry Participation Policy
The Victorian Industry Participation Policy Act 2003 requires public bodies and departments to report on the application of the Victorian Industry Participation Policy. During 2015–16, VAGO did not undertake any procurement activity that was subject to the Victorian Industry Participation Policy.
National Competition Policy
VAGO complies with the National Competition Policy, including complying with the requirements of the Department of Treasury and Finance’s Competitive Neutrality Policy.
Oversight by the Victorian Inspectorate
The Victorian Inspectorate was established in 2012 as part of the reform of Victoria’s integrity systems. The Inspectorate has monitoring and oversight functions in respect of certain integrity bodies including VAGO.
In 2015–16, VAGO had nothing to report to the Inspectorate and the Inspectorate did not review any of VAGO’s activities.
Work arrangements
VAGO offers flexible work arrangements for staff, in response to staff demand and legislative obligations for employers to provide flexible working conditions. We encourage our staff to take advantage of the arrangements available to them.
Declaration of interests
All executive officers and business unit managers have completed statements declaring whether their interests, shares in, and other benefits from business enterprises could give rise to a conflict of interest, and there were no such conflicts.

149
Appendices
Protected disclosures
To enable and encourage people to make disclosures about improper conduct within the public sector, Victorian legislation protects the confidentiality and welfare of these individuals and sets up a system to investigate disclosed matters.
Under the Protected Disclosure Act 2012, VAGO cannot receive protected disclosures.
Disclosures about VAGO officers may be made to the Independent Broad-based Anti-corruption Commission or the Victorian Inspectorate.
Further information on VAGO’s responsibilities is available at: http://www.audit.vic.gov.au/about_us/corporate_information/protected_disclosures.aspx.
Freedom of information
The Freedom of Information Act 1982 provides the community the right to access, as far as possible, information held by the Victorian Government.
Section 20A of the Audit Act 1994 broadly precludes us from disclosing information we gather during an audit, other than reporting to Parliament. Section 20B of the Audit Act 1994 also precludes third parties from accessing any audit-related information and documents we hold.
Our administrative processes come under the state’s Freedom of Information legislation. We did not receive any applications under this legislation in 2015–16.
Further information on what we do in relation to the Freedom of Information Act 1982 is available on our website.
Freedom of Information Requests
Requests for access to non-audit-related information and documents we hold can be made to: Chris Sheard Acting Executive Director, Audit Support Group Victorian Auditor-General’s Office
In writingFreedom of Information Victorian Auditor-General’s Office Level 24, 35 Collins Street Melbourne 3000

150 Victorian Auditor-General’s Office
Annual Report 2015–16
Appendix seven
Additional information available on requestThis report and our website publish all information required by the Directions of the Minister for Finance.
Further details in respect of the information items below have been retained by us and are available if requested—subject to the Freedom of Information requirements, if applicable:• a statement that declarations of pecuniary interests have been duly completed by all relevant
staff of the office (see also page 45)• details of shares held by a senior officer as nominee or held beneficially in a statutory authority
or subsidiary• details of changes in prices, fees, charges, rates and levies charged by our office• audit fees, which are revised every year• details of overseas visits, including a summary of the objectives and outcomes of each visit
(see also page 38)• details of assessments and measures to improve the occupational health and safety of staff
(see also page 34)• a general statement on industrial relations within the office and details of time lost through
industrial accidents and disputes • a list of major committees we sponsor, the purposes of each, and the extent to which the
purposes have been achieved (see also pages 45–46, 52)• further information on our environmental performance (see also page 57)• details of all consultants and contractors, (see also pages 76–78) including:
– consultants and contractors engaged – services provided – spending committed to for each engagement.
This information can be requested from our Freedom of Information Officer, as listed in Appendix six.
There were no relevant activities undertaken by our office with respect to the following areas:• major external reviews carried out on the agency• other research and development activities• major promotional, public relations and marketing activities to develop community awareness
of the services provided.
The following information is available from our website:• details of documents we published about our activities• copies of all our reports since 1956• a list of all agencies we currently audit.

151
Appendices
Appendix eight
Five-year statistics
2015–16 2014–15 2013–14 2012–13 2011–12
Reports tabled in Parliament
Auditor-General’s report on the finances of the state
(number) 1 1 1 1 1
Sector-based reports on results of financial audits
(number) 7 8 5 5 5
Performance audit reports (number) 29 25 29 29 29
Non-audit reports (annual report and annual plan)
(number) 2 2 2 2 2
External assessment of Parliamentary reports
(per cent) 86 86 84 84 83
Parliamentarian satisfaction with reports and services
(per cent) 86 81 90 92 93
Audit reports on financial statements
Audit responsibilities (agencies at 30 June 2016)
(number) 552 547 553 550 561
Unqualified opinions issued during reporting year
(number) 530 541 550 547 545
Disclaimer of opinions issued during reporting year
(number) 1 – – – 14
Qualified opinions issued during reporting year
(number) 8 6 4 3 4
Total opinions issued during reporting year
(number) 539 547 554 550 563
Audit opinions issued within time frame
(per cent) 98 99 100 100 99
External/peer reviews finding no material departures from professional and regulatory standards
(per cent) 80 86 100 100 100
Audit reports on performance statements
Total opinions on performance statements
(number) 108 108 114 115 115
Audit reports on local government performance statements
Unqualified opinions issued during reporting year
(number) 79 79 78 79 77
Qualified opinions issued during reporting year
(number) – – 1 – 2
Total opinions issued during reporting year
(number) 79 79 79 79 79
Audit reports on regional water authority performance statements
Unqualified opinions issued during reporting year
(number) 15 19 16 16 16
Qualified opinions issued during reporting year
(number) 4 – – – –
Total opinions issued during reporting year
(number) 19 19 16 16 16

152 Victorian Auditor-General’s Office
Annual Report 2015–16
2015–16 2014–15 2013–14 2012–13 2011–12
Audit reports on technical and further education institute performance statements
Unqualified opinions issued during reporting year
(number) 10 10 19 20 20
Qualified opinions issued during reporting year
(number) – – – – –
Total opinions issued during reporting year
(number) 10 10 19 20 20
Resources
In-house staff (number) 199 184 185 179 176
Financial audit service providers (number) 27 24 23 36 41
Average days sick leave per employee (number) 8.9 8.7 8.8 7.3 6.4
Workers compensation claims (standardised claims)(a)
(number) 2 3 0 2(b) 5(c)
Injuries reported (number) 7 8 6 2 4
Grievances lodged (number) 1 4 2 2 5
Training and professional development per employee
(days) 6 8.1 8.9 8.5 6.1
Financial management
Expenditure on audit service providers ($ million) 11.4 10.0 10.8 10.7 10.8
Revenue from audit fees ($ million) 24.7 23.5 23.2 23.1 22.5
Operating surplus/(deficit) ($ million) 0.1 0.5 0.0 1.5 0.6
Assets ($ million) 18.3 16.8 16.3 15.4 13.4
Liabilities ($ million) 9.7 8.2 8.2 7.3 6.8
(a) Standardised claims are those that have exceeded the employer excess or are registered as a standard claim and are open with no payments at the time of extraction. This data is supplied by the Victorian WorkCover Authority (VWA)
(b) This data has been revised to report accurate figures in line with data supplied by VWA. Previously, two claims were reported for 2012–13. This was inaccurate because these claims were not standardised claims.
(c) This data has been revised to report accurate figures in line with data supplied by VWA. Previously, five claims were reported for 2011–12. This was inaccurate because these claims were not standardised claims.