annual report 2015 - 日本板硝子株式会社/media/nsg/site content/temporary...photography...
TRANSCRIPT

ANNUAL REPORT 2015FISCAL YEAR ENDED 31 MARCH 2015
‘MAKING A DIFFERENCE TO OUR WORLD THROUGH GLASS TECHNOLOGY’

THE NSG GROUP IS ONE OF THE WORLD’SLARGEST MANUFACTURERS OF GLASSAND GLAZING PRODUCTS FOR THEARCHITECTURAL, AUTOMOTIVE ANDTECHNICAL GLASS SECTORS.
With around 27,000 permanent employees, we have principal operations in 28 countries and sales in over 130.Geographically, over a third of our sales are in Europe, around a third in Japan and Asia, and the rest primarily in North and South America. We operate in three main sectors:Architectural supplies glass for buildings and Solar Energy applications.Automotive serves the original equipment, aftermarket replacement and specialized transport glazing markets.Technical Glass products include very thin glass for displays, lenses and light guides for printers, and glass fiber, used in battery separators and engine timing belts.
Cover photographs Top: Stonehenge Visitor Centre, United Kingdom Pilkington Optiwhite™ extra-clear, low-iron glass Photography courtesy of Vitrine Systems Ltd
NSG Group Annual Report 2015 01
OverviewOur business
Financial performance
Corporate information
Financial statements
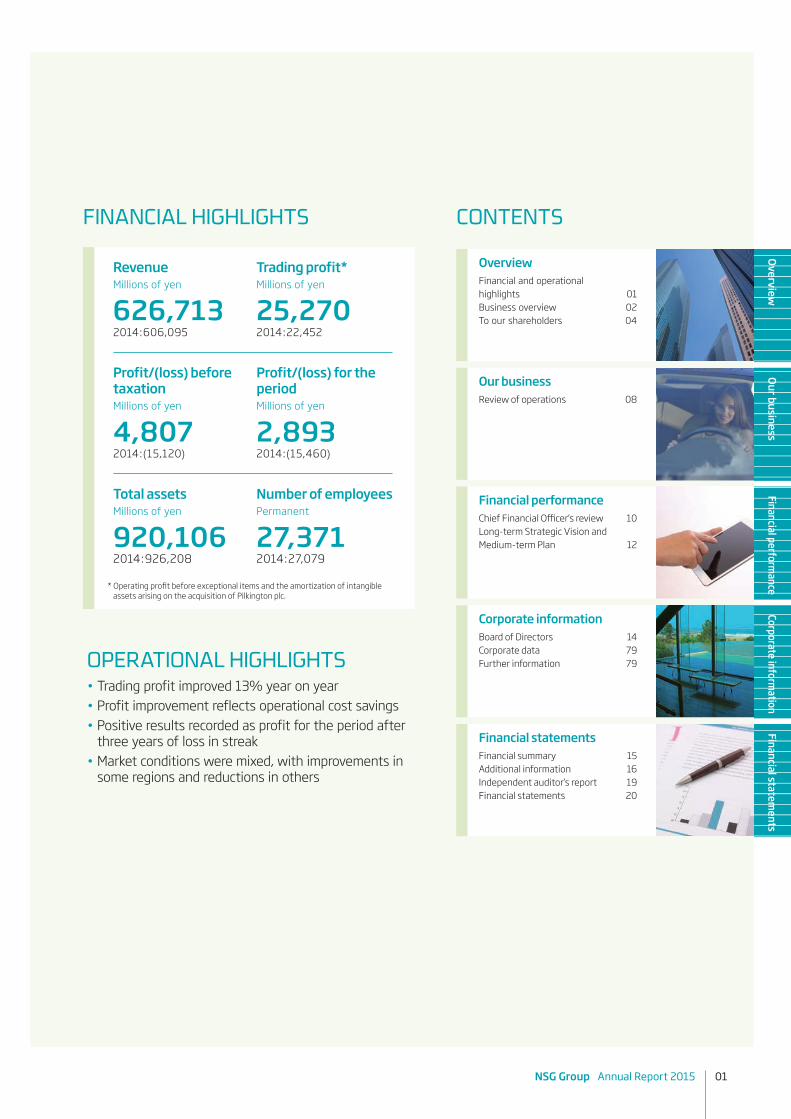
Revenue Trading profit*Millions of yen Millions of yen
626,713 25,2702014: 606,095 2014: 22,452
Profit/(loss) before Profit/(loss) for the taxation periodMillions of yen Millions of yen
4,807 2,8932014:(15,120) 2014:(15,460)
Total assets Number of employeesMillions of yen Permanent
920,106 27,3712014: 926,208 2014: 27,079
* Operating profit before exceptional items and the amortization of intangible assets arising on the acquisition of Pilkington plc.
CONTENTS
Overview Financial and operationalhighlights 01Business overview 02To our shareholders 04
Our business Review of operations 08
Financial performanceChief Financial Officer’s review 10Long-term Strategic Vision andMedium-term Plan 12
Corporate information Board of Directors 14Corporate data 79Further information 79
Financial statements Financial summary 15Additional information 16Independent auditor’s report 19Financial statements 20
FINANCIAL HIGHLIGHTS
OPERATIONAL HIGHLIGHTS• Trading profit improved 13% year on year• Profit improvement reflects operational cost savings• Positive results recorded as profit for the period after
three years of loss in streak• Market conditions were mixed, with improvements in
some regions and reductions in others

02 NSG Group Annual Report 2015
BUSINESS OVERVIEW
WE OPERATE THREE BUSINESS LINES: ARCHITECTURAL, SUPPLYING GLASS FOR THE WORLD’S BUILDINGS AND SOLAR ENERGY; AUTOMOTIVE, PRODUCING GLASS AND GLAZING SYSTEMS FOR VEHICLES WORLDWIDE; AND TECHNICAL GLASS IN NICHE SECTORS.
Architectural A leader in architectural glazing andSolar Energy products Financial year in review• Revenues increased due to the translational impact of the
weakened Japanese yen, and the improved market conditions in North America.
• Operating results were better than the previous year due to cost savings arising from the Group’s restructuring program and improved market conditions in North America.
Revenue by region Financial Year 2015
40% Contribution to Group revenue
• • • •Europe 37% Japan 27% North America 13% Rest of World 23%
Automotive Supplying every major vehicle manufacturerin the world Financial year in review• Revenues were slightly better than the previous year due to the
translational impact of the weaker Japanese yen. • Profits fell slightly with market conditions remaining challenging
across many regions.
Revenue by region Financial Year 2015
50% Contribution to Group revenue
• • • •Europe 46% Japan 17% North America 26% Rest of World 11%
Financial highlights by business Millions of yen
2015 2014Revenue 252,914 240,606Operating profit* 17,020 10,951Net trading assets 154,809 150,007Capital expenditure 13,783 4,642
* Before exceptional items.
Financial highlights by business Millions of yen
2015 2014Revenue 313,956 305,114Operating profit* 9,372 11,154Net trading assets 165,599 168,738Capital expenditure 17,500 10,743
* Before exceptional items.

NSG Group Annual Report 2015 03
OverviewOur business
Financial performance
Corporate information
Financial statements
Technical Glass World leader in thin display glass and opticaldevices for office machinery
Financial year in review• Revenues and profits were below the previous year due partly
to reduced price levels for certain products. • The impact was partly offset by improved asset utilization
and cost savings.
Revenue by sector Financial Year 2015
10% Contribution to Group revenue
Financial highlights by business Millions of yen
2015 2014Revenue 58,741 59,355Operating profit* 4,922 5,898Net trading assets 50,645 48,310Capital expenditure 4,513 14,120
* Before exceptional items.
• • • •Thin glass for displays 23% Copiers/printer lenses 31% Glass cord and fine glass products 38% Other 8%
Other Financial year in review• This segment covers corporate costs, consolidation adjustments,
certain small businesses not included in the segments covered above and the amortization of other intangible assets related to the acquisition of Pilkington plc.
• Operating costs incurred in Other Operations and Eliminations increased slightly from the previous year, with the translational impact of the weakened Japanese yen offsetting underlying cost reductions.
<1% Contribution to Group revenue
Consolidated revenueBy business
By region Architectural Europe 15% Architectural Japan 11% Architectural North America 5% Architectural Rest of World 9% Automotive Europe 23%Automotive Japan 8%Automotive North America 13%Automotive Rest of World 6%Technical Glass 10%
Europe 39%Japan 25%North America 18%Rest of World 18%
• • • • • • • • •
• • • •
Financial highlights by business Millions of yen
2015 2014Revenue 1,102 1,020Operating profit/(loss)* (14,466) (13,436)Net trading assets (1,955) 561Capital expenditure 762 2,066
* Before exceptional items.

04 NSG Group Annual Report 2015
TO OUR SHAREHOLDERS
WE AIM TO BE THE GLOBAL LEADER IN INNOVATIVE HIGH-PERFORMANCE GLASS AND GLAZING SOLUTIONS, IN CONTRIBUTING TO ENERGY CONSERVATION AND GENERATION, AND IN WORKING SAFELY AND ETHICALLY.
Business results Operating results in the Architectural business were better than the previous year due to cost savings arising from the Group’s restructuring program as well as improved market conditions in North America. Revenues increased due to the translational impact of the weakened Japanese yen, and improved market conditions in North America.In the Automotive business, revenues were slightly better than the previous year due to the translational impact of the weaker Japanese yen. Profits fell slightly, with market conditions remaining challenging across many regions.Revenues and profits in the Technical Glass business were below the previous year due partly to reduced price levels for certain products. The impact was partly offset by improved asset utilization and cost savings.
“On behalf of the NSG Group, we thank you for your continued support.From April 2015, Shigeki Mori took office as the Group’s President and CEO.
Conditions in the Group’s major markets were mixed, with improvements in some regions and reductions in others. The full-year operating profit represents an improvement on the previous year due mainly to reduced cost levels following the Group’s restructuring program.
The Group aims to be well positioned to respond appropriately to a changing and diversified global economy, with a balanced global footprint and business mix. We will further accelerate the recovery of our profitability in line with our Medium-term Plan covering the period to 31 March 2018.”
Seiichi Asaka Chairman of the Board Shigeki Mori President and CEO
FL-17, Vila Olímpia – São Paulo, Brazil, Architect: Botti Rubin, Solar control Low-E and SKN sun protection glass, Photo © Mozart Latorre

NSG Group Annual Report 2015 05
OverviewOur business
Financial performance
Corporate information
Financial statements
Achieved
Medium-term
Long-term
• Our restructuring programs over the past years have restored profitability
Profitability restored Financial Sustainability Growth
FY12 - FY14 Medium-term Plan FY15-FY18
Long-termFY19 -
FY15: Year to 31 March 2015
• Establishing a sound financial position is the main objective of the next step
• Continue to maintain focus on profit improvement
• Increase VA ratio
• Financial sustainability will establish basis for top-line growth
A rubber belt manufactured by NGF Europe customer Megadyne using our Carbon Fiber/Glass high technology VA hybrid cord. Picture courtesy of Rizoma.
In May 2014, the Group announced its Medium-term Plan (MTP), covering the financial period to 31 March 2018. Our strategic vision, which is the foundation for the MTP, is to transform the NSG Group into a VA Glass Company. We believe that the Group,
Our 3-Phase Strategy
through the MTP, will be able to create shareholder value by focusing on producing innovative and technologically advanced glass products and thus improving financial performance.
Long-term Strategic Vision and Medium-term Plan (MTP)

06 NSG Group Annual Report 2015
Dividend policyThe Group’s dividend policy is to secure dividend payments based on sustainable business results. As a consequence of the current market conditions faced by the Group, the directors do not recommend a dividend for the year to 31 March 2015.We recognize the importance of dividends to our shareholders and anticipate resuming dividend payments when the financial performance of the Group allows.
The BoardIn March 2015, the Group announced changes to the Group’s Board membership as follows.Sumitaka Fujita has served as an Independent External Director of the Board since June 2009. Since Mr. Fujita has completed the full six-year term expected of an Independent External Director serve, as stipulated in our internal rules, he will now retire. The Group has appointed Toshikuni Yamazaki as director candidate in his place. We take this opportunity to thank Mr. Fujita for his contribution during his tenure with the Group.Following the above-mentioned changes to the Board membership, Mr. Yamazaki will serve as a member of each Board committee and will chair the Audit Committee.At the 149th Ordinary General Meeting of Shareholders on 26 June 2015 and the Board meeting followed on the same day, the above appointments were formally confirmed. The Board now comprises eight Directors, of which four are Independent External Directors. All of the Group’s three Board Committees, as well as the Board of Directors itself, are chaired by an Independent External Director.
Corporate governanceCorporate governance is a key element in the operational agenda of the NSG Group. The Group adopts a three-committee structure, under which we intend and seek to: introduce additional safeguards for shareholders, increase the transparency of management, and enhance corporate governance by separating the functions of execution and oversight, with the role of the Independent External Directors strengthened.In May 2015, we announced the newly established NSG Group Corporate Governance Guidelines, supporting the Principles of the TSE Corporate Governance Code, which took effect on 1 June 2015.These Guidelines provide the basic principles and framework for the NSG Group to enhance its corporate value in a sustainable way over a medium- to long-term period and thus increase the common value of the Group for our various stakeholders including our shareholders. Under the corporate governance structure as shown in the Guidelines, including the balanced roles and membership of the Board of Directors, the three committees of Nomination, Audit, and Compensation, and the Independent External Directors and Executive Officers, we aim to ensure an appropriate system of checks and balances and accountability. This enables management to make prompt and bold business decisions in an effective, efficient and ethical manner, as well as maintaining good relationships with and balancing the needs of our stakeholders such as shareholders, customers, employees, suppliers and communities.Under the supervision of our management team led by new CEO Shigeki Mori, appointed in April, the Group will accelerate the execution of its Medium-term Plan in line with the Long-term Strategic Vision as part of our corporate governance framework.
Along with the Guidelines, we also published related policies such as the Policy on Constructive Dialogue with Shareholders, General Criteria to Select Candidates for Director, and Policy and Procedure on Appointment of Executive Management.NSG Corporate Governance Guidelines and the related policies: www.nsg.comThese actions build on initiatives taken by the Group over the past few years to further strengthen corporate governance. We believe these developments mark our further progress towards the achievement of the advanced level of corporate governance that we regard as being key to the sustainable growth of the Group. The NSG Group is committed to continually improving the level and performance of the Group’s corporate governance.
SustainabilityThe NSG Group is committed to sustainable development. Our strategy and policies respond to the challenges we all face in managing the world’s limited resources. We deliver products and services of unique value to the markets we serve that contribute to improving living standards, promoting the safety and wellbeing of people, and to the generation and conservation of energy.We aim to achieve our sustainability objectives by balancing the needs of all our stakeholders, managing the environmental impacts of our activities, developing our people, encouraging innovation in processes and products, working in harmony with the communities in which we operate and encouraging our customers, contractors and suppliers to do the same. Our policies underline the contribution our products can make to addressing climate change. We are also committed to improving our own energy usage and resource management. The year to 31 March 2015 greenhouse gas emissions dropped by 1 percent to 4.2 million tons through improved capacity utilization and energy usage. We aim to make a positive environmental contribution to the value chains in which we operate while benefiting from the growing international demand for our products that help save and generate energy. Glass has an important contribution to make in helping to reduce greenhouse gas emissions. We work with stakeholders in the framing of policies and regulations to help improve energy efficiency through the use of glass.Over the past year, we have made further progress in embedding the principles of sustainability within the NSG Group. We are a member of the UN Global Compact and support the advancement of its 10 principles. We consider these principles to be a natural extension of our Code of Ethics, which defines our commitment to our social and environmental responsibilities. Our principal sustainability targets and the progress we have made so far towards their attainment are covered in our 2014 Sustainability Report and on our website.

NSG Group Annual Report 2015 07
OverviewOur business
Financial performance
Corporate information
Financial statements
EmployeesOur management philosophy, “People are the most important asset of our company,” is deeply rooted in the 400-year-old Sumitomo Spirit to which we subscribe. The Group has around 27,000 permanent employees operating in 28 countries and speaking over 25 languages. Around 44 percent of Group employees work in Europe, 16 percent in Japan, 16 percent in North America and just over 24 percent in the rest of Asia and South America.Our policy is to put the best person in each job, regardless of nationality or regional identity. We have identified specific challenges in attracting and retaining talent, particularly in emerging markets, and we are already putting in place measures to address these.Employee engagement is being given a high priority, with continuing training for managers and supervisors in communication skills and additional briefings to keep employees informed of developments. We continue to promote the health and wellbeing of our people.
SafetySafety at work is a priority for the Group. Our safety programs emphasize the importance of individuals taking personal responsibility and of appropriate safe behavior. All injuries at work are regarded as unnecessary and avoidable. We require full reporting of all incidents, no matter how minor, and appropriate investigation to ensure we learn from all such events.The Significant Injury Rate (SIR) is our primary reactive indicator. This records injuries requiring medical treatment or the reallocation of duties to allow an individual to continue working, expressed as a rate per 200,000 hours.Over the past year, we had 113 Significant Injuries (46 of them resulting in time lost from work). The SIR for the year to 31 March 2015 of 0.35 represents a 10 percent improvement in safety performance compared to the previous year. However, unfortunately, we had a tragic fatality. We must acknowledge and learn from it.We owe it to our colleagues and their families to fully investigate and follow through on the concrete actions identified. We are committed to our high risk reduction program and the safety tools we have in place.
Management principlesThe fundamental principles of the Group’s basic management policy are ensuring open and fair business dealings, adhering to corporate ethical standards, and contributing to the resolution of global environmental issues, all of which are aimed at establishing a company with a global presence and a spirit of innovation and thereby maximizing value for all stakeholders.In undertaking all of our actions and activities, we will not lose sight of our core values and principles, with safety and quality remaining top priorities. We aim to be a sustainable company in all senses of the word. Good management of our people, our resources, our communities and our environment also makes good business sense.
ProspectsSuccessful restructuring has restored the Group’s profitability, helping create a more agile, leaner, lower cost organization. NSG is well positioned to capitalize on improvements in the global economy, with a balanced global footprint and business mix. Our management team is confident of increasing shareholder value by focusing on producing more innovative and technologically advanced glass products as outlined in our MTP. We aim to increase the proportion of sales of these value-added products and services over the years to 31 March 2018, thus improving our financial performance and building a more financially sustainable Group.We remain optimistic about the longer-term future of the NSG Group as we operate in a good industry with positive prospects.We at the NSG Group greatly appreciate the steadfast understanding and input of all our shareholders.
Seiichi AsakaChairman of the Board
Shigeki MoriPresident and CEO
Transparent Mirror Pilkington MirroView™

08 NSG Group Annual Report 2015
ArchitecturalOperating results in the Architectural business were better than the previous year due to cost savings arising from the Group’s restructuring program as well as improved market conditions in North America. Revenues increased due to the translational impact of the weakened Japanese yen, and improved market conditions in North America.In Europe, representing 37 percent of the Group’s Architectural sales, low levels of economic activity continued to depress construction and refurbishment activity. Cumulative local currency revenues fell slightly due to soft market conditions and the mothballing of under-utilized production facilities during the previous year. While the difficult market conditions prevented any sustained upward selling price pressure, the Group’s restructuring actions generated an improved level of asset utilization, enabling an improvement in profitability.In Japan, representing 27 percent of Architectural sales, cumulative volumes fell following the increase in consumption taxes earlier in the year. Revenues fell due to the reduced volumes.In North America, representing 13 percent of Architectural sales, architectural glass markets continued to perform strongly with revenues and profits improved from the previous year. Volumes increased, with strengthening domestic demand and higher dispatches of Solar Energy glass. Domestic price levels were above the previous year.In the rest of the world, markets in South East Asia were strong, with improving domestic demand and increased dispatches of Solar Energy glass. Expressed in US dollars, revenues in South America were similar to the previous year.
REVIEW OF OPERATIONS
THE FULL-YEAR OPERATING PROFIT REPRESENTS AN IMPROVEMENT ON THE PREVIOUS YEAR.MANAGEMENT IS COMMITTED TO IMPROVING PROFITABILITY FURTHER AS PART OF OUR MEDIUM-TERM PLAN TO INCREASE VALUE-ADDED SALES.
“In the year to 31 March 2015, conditions in the Group’s major markets were mixed, with improvements in some regions and reductions in others. Profitability has improved from the previous year, mainly due to the effect of the Group’s restructuring program. Through the first year of the Medium-term Plan, the Group achieved good progress in increasing the value-added sales ratio.The Group expects a gradual improvement in market conditions during the year to 31 March 2016.”
Clemens Miller Chief Operating Officer

NSG Group Annual Report 2015 09
OverviewOur business
Financial performance
Corporate information
Financial statements
AutomotiveIn the Automotive business, revenues were slightly better than the previous year due to the translational impact of the weaker Japanese yen. Profits fell slightly with market conditions remaining challenging across many regions.Europe represents 46 percent of the Group’s Automotive sales. Cumulative light-vehicle sales were ahead of the previous year, with year-on-year increases during the fourth quarter potentially indicating a meaningful recovery.In the OE (original equipment) sector, the Group’s cumulative local currency revenues were similar to the previous year. Automotive Glass Replacement (AGR) revenues were below the previous year due to weather-related sluggish demand, although profitability increased with an improved mix of products.In Japan, representing 17 percent of the Group’s Automotive sales, cumulative OE volumes were stronger than the previous year. Domestic demand was generally robust despite the consumption tax increase earlier in the year. Vehicle sales weakened slightly during the fourth quarter, however. The Group’s cumulative revenues improved with the increased demand, although profitability was impacted by increased input costs. AGR markets were below the previous year.In North America, representing 26 percent of the Group’s Automotive sales, cumulative revenues and profitability improved. OE market volumes continued to increase and the AGR business benefited from robust demand.In the rest of the world, revenues and profits fell. Market conditions in South America continued to be challenging.
Technical GlassRevenues and profits in the Technical Glass business were below the previous year due partly to reduced price levels for certain products. The impact was partly offset by improved asset utilization and cost savings. Increased competition negatively affected revenues from thin glass for displays. On 10 June 2014, the Group started up its new Ultra Fine Flat (UFF) glass production line in Vietnam. This line commenced production during the third quarter. Demand for
components used in multi-function printers improved from the previous year. Volumes of glass cord used in engine timing belts were similar to the previous year.
Research and DevelopmentThe NSG Group continues its strong investment in R&D and recognizes that innovation is a critical part of the Group’s recovery and future growth in difficult economic and market conditions. R&D costs amounted to ¥8,212 million for the year ended 31 March 2015.
OutlookThe Group expects a gradual improvement in market conditions during the year to 31 March 2016. In Europe, Architectural markets are likely to be broadly flat. Automotive markets should benefit from a continuation of the positive vehicle sales experienced during the fourth quarter of the year to 31 March 2015, although volumes will still be significantly below pre-recession levels. Architectural markets in Japan are likely to register a modest improvement. Automotive markets in Japan are expected to be generally flat, although tax changes could impact sales in the short term. Volumes in North America are expected to be robust, although volumes in South America will continue to suffer from a challenging economic environment. Market conditions in South East Asia are likely to improve further, and demand for Solar Energy glass should continue to grow. Technical Glass markets are generally expected to improve.Taking account of the above factors, the Group expects to record a further improvement in operating profitability.
Clemens MillerChief Operating Officer
New innovative 'Delta Chain' belt launched by NGF Europe customer Optibelt using NGF Europe Carbon Fibre cord which utilises RI coating
The Toyota New Alphard/Vellfire in Japan. All glass parts are produced and supplied by NSG.

10 NSG Group Annual Report 2015
Results for the yearRevenueRevenue increased by 3 percent from ¥606,095 million to ¥626,713 million, although this was mainly due to the translational impact of a weaker Japanese yen. At constant exchange rates, revenues were similar to the previous year.Trading profitTrading profit (before amortization and exceptional items) increased from a profit of ¥22,452 million to a profit of ¥25,270 million. After charging amortization costs arising on the acquisition of Pilkington plc, operating profit before exceptional items increased from a profit of ¥14,567 million to a profit of ¥16,848 million. Including exceptional items, operating profits improved from a profit of ¥734 million to a profit of ¥22,338 million.Exceptional itemsThe Group has separately disclosed exceptional items in its income statement. These costs are analyzed in a note to the Annual Financial Statements and comprise transactions that are of a material, non-routine nature. Joint ventures and associatesThe Group’s share of profits from joint ventures and associates decreased from ¥1,002 million to ¥413 million. Profits at Cebrace, the Group’s joint venture in Brazil, were similar to the previous year. Losses widened at the Group’s joint venture in Russia, due largely to exchange translation losses following a significant reduction in the value of the ruble during the third quarter. The results at the Group’s associate in Colombia improved, with the previous year including costs associated with the start-up of this company’s float glass facility. The Group’s shares of its associates’ profits in China were below the previous year.
CHIEF FINANCIAL OFFICER’S REVIEW
THE FULL-YEAR RESULTS REFLECT THE IMPACT OF THE RESTRUCTURING THAT HAS TAKEN PLACE AND ONGOING IMPROVEMENTS IN THE GROUP’S COST BASE.
“Profitability has improved mainly as a result of the Group’s operational cost savings, which improved profitability by ¥9,000 million during the year, consistent with our expectations.The Group’s underlying cash flows continue to improve, supported by a steady improvement in operating profit and a reduction in exceptional costs incurred as part of the Group’s restructuring program. Cash flows have also benefitted from further significant reductions in working capital and careful management of capital expenditure.”
Mark Lyons Chief Financial Officer
NGF Europe received the prestigious Queen’s Award for Enterprise in the Innovation category from the Queen’s representative.

NSG Group Annual Report 2015 11
OverviewOur business
Financial performance
Corporate information
Financial statements
Selfoc Lens Array® is used in LED-PRINT-HEAD(LPH). Picture courtesy Fuji Xerox Co., Ltd
Funding and liquidityNet debtNet financial indebtedness decreased by ¥5,020 million from 31 March 2014 to ¥374,092 million at the period end. Currency movements generated a decrease in net debt of approximately ¥8,310 million over the period. Gross debt was ¥442,743 million at the period end. As of 31 March 2015, the Group had undrawn committed facilities of ¥19,371 million. Sources of financeThe Group is financed by a combination of cash flows from operations, bank loans and corporate bonds. The Group aims to refinance borrowings well before their due date and ensures that any uncommitted or short-term borrowings are supported by undrawn committed facilities. The Group aims to obtain its funding from a variety of sources and access markets globally as and when they are available to it.The Group seeks to deal with relationship banks that are able to support its businesses worldwide with the services it requires and at the same time provide, where necessary, appropriate levels of credit. The Group has obtained long-term investment grade credit ratings from two rating agencies. The current ratings are BBB- from JCR and BB+ from R&I.Shareholders’ equity (net assets)Total equity at the end of March 2015 was ¥186,008 million, representing a decrease of ¥7,478 million from the end of March 2014. Re-measurement of retirement benefit obligations during the fourth quarter negatively affected the shareholders’ equity, which more than offset the profit recorded for the year.
Mark LyonsChief Financial Officer
Interest expensesNet interest expenses increased compared to the previous year as a result of the increased cost of the Group’s borrowings.TaxationThe Group has a tax charge for the financial period to 31 March 2015 equivalent to 43.56 percent of the profit before taxation, excluding the Group’s share of net profits of joint ventures and associates (31 March 2014 restated—a tax charge on losses of (2.11) percent). The tax charge consists of a current taxation charge of ¥3,507 million and a deferred taxation credit of ¥1,593 million.Non-controlling interestsProfits attributable to non-controlling interests increased from ¥1,145 million to ¥1,225 million. This was due to improved profitability of the Group’s operations with non-controlling interests, which operate mainly in the Architectural business unit. Earnings per shareBasic (undiluted) earnings per share increased from a net loss per share of ¥18.40 (restated) to a net profit per share of ¥1.85.DividendsThe Group’s dividend policy is to secure dividend payments based on sustainable business results. As a consequence of the current market conditions faced by the Group, the Directors do not recommend a dividend for the year to 31 March 2015. The Group recognizes the importance of dividends to its shareholders and anticipates resuming dividend payments when the financial performance of the Group allows. Cash flowsThe Group’s focus on cash generation has led to a significant improvement in cash flow performance, with support from improved trading profits, further significant reductions in working capital, and careful management of capital expenditure.Cash inflows from operating activities were ¥24,593 million. Cash outflows from investing activities were ¥23,192 million, including capital expenditure on property, plant and equipment of ¥32,602 million. As a result, total cash inflows before financing were ¥1,401 million.

12 NSG Group Annual Report 2015
Long-term Strategic VisionThe NSG Group’s new vision is to become a VA Glass Company.The growth sector within the glass and glazing markets is for more value-added (VA) products containing greater complexity and functionality. The Group already has a wide range of VA products, not only in our Technical Glass business unit but also in our Architectural and Automotive units.Our aim as a VA Glass Company is to:• Consolidate our trusted reputation as a glass specialist• Work closely with our customers in a range of global industries
to deliver unique value through our products and services• Transform our flat glass business, moving from a traditional
business model towards one increasingly focused on VA
By transforming ourselves into a VA Glass Company, we will become a more profitable and financially stronger business, with a lighter asset base, while reducing the cyclical nature of the business at the same time.
Medium-term Plan: April 2014 to March 2018These years are critical to the establishment of the Group as a “VA Glass Company”. The priority being to enhance our financial and operational performance while we shift to selling more value-added products as described in our new long term-vision.
LONG-TERM STRATEGIC VISION AND MEDIUM-TERM PLAN
THE IMPLEMENTATION OF NSG GROUP’S NEW LONG-TERM STRATEGIC VISION AND MEDIUM-TERM PLAN WILLL ACCELERATE THE RECOVERY OF PROFITABILITY.
Financial Targets and FY18 Expectations
FY18 Main Financial Targets
Net Debt/EBITDA : 3x
Return on Sales : 8%**Operating Profit before amortization and exceptionals
Glass growth assumptions
Developed economies: slow recovery
Emerging markets: moderate growth
ExecutionOperational performance will focus on our shift to selling a greater proportion of value-added products, fully utilizing our existing capacity and consolidating our reputation for manufacturing excellence.Financial performance will be focused on increasing our operating profit and the generation of free cash flows to reduce net debt and financing costs to create a more financially stable Group.
Accelerating shift to VA productsProportion of VA products in total salesArchitectual Glass+Automotive Glass (OE)+Technical Glass
VA ratioApproximately
1/3(FY14)
VA ratioAiming for
1/2or greater
(FY19-)
FY18 projected outcomes (JPY bn)
FY18 FY14Revenues: >=670 606
Operating Profit: 60* 22
EBITDA: 100 54
Net Debt: 300 379
ROE : >=10%*Operating Profit before amortization and exceptionals

NSG Group Annual Report 2015 13
OverviewOur business
Financial performance
Corporate information
Financial statements
EBITDA expansion
Capex<Depreciation
Selected non-core asset disposals
Working capital reductionPositive spiral leads to achievement of targets
Architectural
Value-added products
Automotive Technical Glass
Europe: Meet advanced functionality needs.Japan: Meet demand for eco-glass for energy efficiency building regulations.North America: Exploit online coating technology, expand into non-architectural markets.Rest of World: Regional driven approach.
• Glass for photovoltaics• Vacuum glazing• Low-E+Solar control coatings• Fire protection glass• Extra-clear low-iron glass
Europe: Load remaining facilities with recovering demand. Benefit from advanced, integrated facility in Poland.Japan: Promote UV cut and IR cut products. Cooperate with leading OEMs in developing advanced glazing.North America: Improve operational performance to increase returns from ongoing high demand.Rest of World: Absorb market growth through fully utilizing existing capacity.
• Solar control, super UV+IR cut• Integrated functionality for safety and
comfort• Complicated styling• AGR
Display: Thin glass market continues to grow with expansion of touch panel applications.Information device: Growing office-use printer market.Functional products: Increasing share of glass cord reinforced belts used in automotive engines. Enhanced separators for higher performance batteries.
• Thin glass for touch panels and cover glass
• Optical devices for LED printers• Glass cord for timing belts in oil• Battery separators for idling start and
stop system• Glass flake for anticorrosion paint
Finance cost
reductionNet debt decrease
Free cashflow
increase
LONG-TERM STRATEGIC VISION AND MEDIUM-TERM PLAN
THE IMPLEMENTATION OF NSG GROUP’S NEW LONG-TERM STRATEGIC VISION AND MEDIUM-TERM PLAN WILLL ACCELERATE THE RECOVERY OF PROFITABILITY.
Financial strategy
Focus by Strategic Business Unit (SBU)In Architectural and Automotive, the main focus will be on profitability improvement. In Technical Glass, the aim is to grow with the existing businesses and develop new products, with a focus on R&D.

14 NSG Group Annual Report 2015
Shigeki MoriDirector Representative Executive Officer President and CEO
Seiichi AsakaExternal Director Chairman of the Board
Clemens MillerDirector Representative Executive Officer Executive Vice President Chief Operating Officer
Hiroshi KomiyaExternal Director
Mark LyonsDirector Representative Executive Officer Executive Vice President Chief Financial Officer
Günter ZornExternal Director
Kenichi MorookaDirector Executive Officer Executive Vice President
Toshikuni YamazakiExternal Director
Nomination CommitteeHiroshi Komiya*Seiichi Asaka Günter Zorn Toshikuni YamazakiShigeki MoriKenichi Morooka Audit CommitteeToshikuni Yamazaki*Seiichi AsakaHiroshi KomiyaGünter Zorn
Compensation CommitteeGünter Zorn*Seiichi AsakaHiroshi KomiyaToshikuni YamazakiShigeki MoriKenichi Morooka*Committee Chairman
BOARD OF DIRECTORS

NSG Group Annual Report 2015 15
OverviewOur business
Financial performance
Corporate information
Financial statements
Revenue
Millions of Yen700,000
600,000
500,000
400,000
300,000
200,000
100,000
0
20152014
Trading profit1
Millions of Yen25,000
20,000
15,000
10,000
5,000
0
20152014
1: Operating profit before exceptional items and the amortization of intangible assets arising on the acquisition of Pilkington plc.2: Certain amounts shown have been restated due to changes in accounting policies. Please refer to note 1.2 and note 39 for more information.
Restated amounts are indicated throughout these accounts where appropriate.
Profit/(loss) for the period
Millions of Yen20152014
10,000
5,000
0
(5,000)
(10,000)
(15,000)
(20,000)
Millions of yen
Period ended 31 March2015 2014
(restated2)
Revenue 626,713 606,095Trading profit1 25,270 22,452Profit/(loss) before taxation 4,807 (15,120)Profit/(loss) for the period 2,893 (15,460)Profit/(loss) attributable to owners of the parent 1,668 (16,605)Earnings per share attributable to owners of the parent (yen) Basic 1.85 (18.40) Diluted 1.84 (18.40)Total assets 920,106 926,208Total shareholders’ equity 175,746 183,974Number of permanent employees 27,371 27,079
FINANCIAL SUMMARY

16 NSG Group Annual Report 2015
This information does not form part of the audited consolidated financial statements of the Nippon Sheet Glass Co., Ltd. and is provided purely for the information of investors.
Business and other risksThe Group regularly reviews the principal financial and operating risk factors considered relevant to its current business activities and financial position. An updated analysis of the principal financial and operating risk factors facing the Group is presented below. Any references to future events below are based on what the Group judged as effective as at the end of this financial year. There were no material issues or events occurring during the year that cast doubt on the ability of the Group to continue to operate as a going concern for the foreseeable future.Economic conditionsThe majority of the Group’s products are sold in the Japanese, European and North American markets, with these markets representing 25 percent, 39 percent and 18 percent, respectively, of net sales for the year ended 31 March 2015. The majority of sales made outside of these three areas are in emerging markets such as South America. The Group expects that its growth in emerging markets is likely to exceed its growth in more mature markets, and therefore the proportion of Group sales recorded in such markets is likely to increase in the future. Such markets may be considered to have a more significant level of risk than the more mature markets in which the Group operates. Changes in the business environments of the Group’s customers might affect the Group’s business, and if economic conditions or particular business environments in these regions of the Group’s major markets and emerging markets deteriorate, this could have a significant negative effect on the Group’s financial performance and financial position.Europe represents the largest region for Group revenues. The current economic downturn in Europe has continued to effect demand for the Group’s products in this region. European volumes are expected to improve during FY2016, and then continue to recover thereafter, although there can be no assurance that this will be the case. Dependency on certain specified industries and sectorsThe Group’s Architectural and Automotive business together account for 90 percent of Group revenues for the year ended 31 March 2015. In FY2015, the Group’s Architectural and Automotive business accounted for 40 percent and 50 percent of sales to external customers respectively. The products to external customers are principally provided to customers in the construction, housing and automotive industries. These industries have continued to be negatively affected by the global economic conditions experienced during the year to 31 March 2015.The Group is working to increase its revenues generated from value-added glass products that generate higher than average margins, and are typically sold into markets with significant growth prospects. Such products would normally have a lower level of cyclical volatility than commodity products, and are therefore less likely to be effected by deteriorating economic conditions. However there can be no assurance that such products will continue to enjoy higher than average margins, or that the markets for such products will continue to grow at higher than
average rates. In addition, technological advances by other glass manufacturers in these areas could lead to an increased level of competition with a resulting erosion of profit margins for value-added products. The Automotive business is also working to diversify its customer base. In recent years there has been a significant level of consolidation in the Automotive industry, leading to increased purchasing power for the Group’s automotive customers. If such consolidation continues then this could mean that the Group’s automotive customer base becomes more concentrated.CompetitionThe Group competes with domestic and overseas glass product manufacturers. The Group also competes with material manufacturers of various plastic, metal and other materials used in the Architectural, Automotive and/or IT sectors. Although the Group endeavors to ensure a competitive edge in the provision of original technologies and products in these markets, if the Group is unable to ensure a competitive advantage due to changes in market needs or due to the emergence of a manufacturer providing low-cost products, or due to a manufacturer with a solid customer base and a high level of name recognition, or if our competitors receive governmental subsidies which are not available to us, there could be an adverse effect on the Group’s financial performance and financial position.Development of new products and technological innovationThe Group focuses on developing original technologies and products in its existing business fields and on developing new products in non-exploited business fields. The new product development process could require considerable time and expenses, and the Group might be requested to invest considerable amounts of capital and resources before achieving revenues from the sale of new products. Should any competitor launch a similar product in the target market earlier than the Group, or if alternative technologies and products are preferred by the market, the previous investment in the Group’s product development might not produce the profits initially expected. Should the Group be unable to predict or respond to an anticipated technological innovation and/or succeed in the development of a new product that sufficiently meets customers’ needs, such failure in product development or technological innovation could adversely affect the Group’s businesses, financial performance and financial position.
ADDITIONAL INFORMATION

NSG Group Annual Report 2015 17
OverviewOur business
Financial performance
Corporate information
Financial statements
Funds necessary for future business operationsThe Group might have additionally to raise funds to 1) launch new products, 2) conduct business or R&D projects, 3) extend manufacturing capacity, 4) acquire a supplementary business, technology or service, 5) implement cost-saving initiatives and restructuring projects, or 6) repay maturing debt. If such funds cannot be raised under the intended conditions or at all, the Group might not be able to invest in the expansion, development or reinforcement of any product or service, capitalize on an opportunity for business development, or ensure higher competitiveness to its competitors, or the Group’s financial position could be negatively affected.Overseas operationsThe Group has many production facilities in numerous areas around the world including Japan, elsewhere in Asia, Europe, North America, and South America.In particular, the Group is working to expand operations in emerging markets, such as South America, Eastern Europe and China, and if economic growth slows in one or more of these markets it could also adversely affect the Group’s financial performance and financial position.The Group has joint venture operations, investments, alliances and other operations in South America, Russia, China and other areas. The Group believes that the stakes it holds in these operations are an important part of its strategy to expand its manufacturing capacities in these regions. However, there is no assurance that the Group will be able to effectively execute these strategies through these joint ventures. In addition, the Group could face unexpected losses from these investments if it becomes difficult to continue an operation as a result of disagreements with its joint venture partners or other partners regarding business operation policy or for other reasons.Risk involved in the suspension of productionThe Group undertakes regular anti-disaster inspections and the maintenance of facilities in order to minimize the potential adverse effects that might be caused by the suspension of production activity. Nevertheless, the potential adverse effects on production facilities due to a natural disaster (including an earthquake, an electric power outage or any other type of event that causes a suspension of the Group’s or of its customers’ production) cannot always be prevented or mitigated. In some cases, certain types of products manufactured at a Group facility might not be able to be produced by another facility. Consequently, in case that production activity is suspended at a facility due to an earthquake or any other similar event, the possibility of considerably reduced production capacity for certain specific product(s) could adversely affect the Group’s financial performance and financial position. The Group insures against such events but there can be no guarantee that such insurance will fully compensate the Group in all circumstances.
Fluctuations in foreign exchange and interest ratesThe Group has manufacturing operations in 28 countries and sales in around 130 countries. Consequently, the Group is exposed to the risk of fluctuations in foreign exchange and interest rates associated with those countries. In addition, as the assets and liabilities denominated in local currencies are translated into yen when consolidated financial statements are prepared, the Group might be exposed to the risk of fluctuations in foreign exchange rates. Furthermore, fluctuations in interest rates might affect the values of interest expenses, interest income or financial assets and liabilities. Although the Group aims to hedge these risks, such fluctuations in foreign exchange and interest rates could adversely affect the Group’s businesses, financial performance and financial position.Changes in supply of raw materials and fuel, and distribution of productsSpecific raw materials, such as silica sand and soda ash, and fuels, such as fuel oil and natural gas, are critical to the glass manufacturing process. Fluctuations in the cost of supplying raw materials and fuel may adversely affect the Group’s financial performance and financial condition. The Group uses commodity derivatives and swap contracts to hedge the effect of fluctuations in the market prices for raw materials and fuel. However, there can be no assurance that such measures can eliminate the impact of increases in the prices of raw materials and fuel. The Group has entered into purchase agreements with selected suppliers of raw materials and fuel for medium and long-term fixed prices. The Group also sells its products through third party distributors in addition to its own distribution channels. If, for some reason, the Group’s relationship with a major supplier or distributor ended, or such suppliers failed to perform their contractual obligations, the Group may have to enter into agreements with less favorable terms and conditions, or the supply of raw materials and the distribution of products may be impeded. This may result in the Group’s financial performance and financial condition being adversely affected.Retirement Benefit ObligationsThe Group operates numerous corporate pension plans and healthcare benefit plans for retiring employees. In the event of large fluctuations in the market value of the Group’s pension assets, discount rates used to calculate pension liabilities, or mortality assumptions used in the calculation of pension liabilities, the Group may be obliged to contribute additional funds into the schemes. While providing appropriate retirement benefit plans for our employees, the Group regularly reviews its retirement benefit obligations in order to reduce the risk to the Group. In recent years the Group has taken actions such as reducing the risk profile of assets within asset backed schemes, hedging longevity risks of certain groups of pensioners, and capping pensionable salaries for certain groups of active employees. However, there can be no assurance that such actions will be completely effective in eliminating the risk of increasing cash outflows into the Group’s pension schemes in the future.
ADDITIONAL INFORMATION

18 NSG Group Annual Report 2015
Legal restrictionsForeign subsidiaries and affiliates of the Group are subject to local regulations relative to investment, imports and exports, fair competition rules, regulations for environmental conservation, and other laws regarding business transactions, labor, intellectual property rights, income tax, currency control and so forth of the respective countries and regions where they operate. Any change to these laws and regulations or operation thereof could adversely affect the Group’s financial performance and financial position through limitation of the Group’s business activities or imposition of expenses to be disbursed regarding legal compliance or penalty fees, and their subsequent claims for damages based on civil liability, to the Group by reason of infringement of any of the relevant laws and regulations.Business strategiesThe Group’s business strategies are affected by a variety of factors, including the economic environment, the price of raw materials, foreign exchange rates, and the development and provision of new technologies and products. However, there can be no assurances that, under these conditions, the Group’s business plan will be successful, or that the intended results of the business strategies through the success of the strategy will be achieved. Furthermore, it is possible that the proposed execution of the Group’s business plan will not be delivered, or that the intended effects will not be realized. The Group acquired Pilkington plc in June 2006, a company with a significant presence in Europe. If the financial performance in Europe underperform compared to the Group’s expectations at the time of acquisition, or if some or all of the synergies cannot be achieved as planned, the Group could be required to recognize impairment charges on the goodwill or other intangible assets, which may have an adverse effect on the Group’s financial performance and financial condition.The Group invests intensively in shifting from relatively low margin products to value-added products which require advanced technology in order to keep its competitive advantages. However, there can be no assurance that the Group can succeed in development of higher technology earlier than its competitors, or, as a result, can ensure higher competitiveness than its competitors.Intellectual property rightsPatents and other intellectual property rights are an important competitive factor in the Group’s operation. However, there can be no assurance that the Group will always be successful in adequately protecting our intellectual property rights. In addition, we conduct our operations globally, which increases the risk of disputes between us and third parties over intellectual property rights. Any such infringements or disputes could have a negative impact on the Group’s business, financial performance and financial condition.
Civil liabilityIf individuals are injured as a result of defects in the Group’s products, the Group could be subject to claims for damages based on product liability. In addition, the occurrence of the claim could negatively affect the Group’s reputation.The Group strives to ensure that its products are of the highest quality. However, if unexpected quality problems occur, the Group may need to conduct a major recall. If this happens, the Group’s reputation may be harmed and its financial performance and financial position may be adversely affected.Environmental laws and regulationsThe Group is subject to a variety of environmental laws and regulations. Although the Group makes efforts to implement a variety of measures in regard to product development and manufacturing process in order to have a beneficial environmental impact and comply with the relevant laws and regulations, there can be no assurance that the Group can achieve expected results through those measures. Also, any change to these laws and regulations or operation thereof could adversely affect the Group’s financial performance and financial position through limitation of the Group’s business activities or imposition of expenses to be disbursed regarding legal compliance or penalty fees to the Group by reason of infringement of any of the relevant laws and regulations.Evaluation and impairment of balance sheet assetsThe Group has a considerable value of assets included on its balance sheet that must be tested annually for impairment. Such assets include, but are not limited to, goodwill and intangible assets arising on the acquisition of Pilkington plc, and deferred taxation assets arising largely from historic taxable losses generated in certain territories. The Group has previously evaluated such assets and concluded that no material impairments have been necessary. However, there can be no assurance that the same conclusion will follow similar impairment testing exercises conducted in the future. In particular, if the performance of the Group in the future does not improve to the extent that has been assumed in previous impairment tests, then impairments of such assets in the future will be more likely.

NSG Group Annual Report 2015 19
OverviewOur business
Financial performance
Corporate information
Financial statements
INDEPENDENT AUDITOR’S REPORT The Board of DirectorsNippon Sheet Glass Company, Limited
We have audited the accompanying consolidated financial statements of Nippon Sheet Glass Company, Limited and its consolidated subsidiaries, which comprise the consolidated balance sheet as at 31 March 2015, the consolidated income statement, the consolidated statements of comprehensive income, changes in equity and cash flows for the year then ended and notes to the consolidated financial statements.
Management’s Responsibility for the Consolidated Financial StatementsManagement is responsible for the preparation and fair presentation of these consolidated financial statements in accordance with International Financial Reporting Standards, and for designing and operating such internal control as management determines is necessary to enable the preparation and fair presentation of the consolidated financial statements that are free from material misstatement, whether due to fraud or error. Auditor’s ResponsibilityOur responsibility is to express an opinion on these consolidated financial statements based on our audit. We conducted our audit in accordance with auditing standards generally accepted in Japan. Those standards require that we plan and perform the audit to obtain reasonable assurance about whether the consolidated financial statements are free from material misstatement.An audit involves performing procedures to obtain audit evidence about the amounts and disclosures in the consolidated financial statements. The procedures selected depend on the auditor’s judgment, including the assessment of the risks of material misstatement of the consolidated financial statements, whether due to fraud or error. The purpose of an audit of the consolidated financial statements is not to express an opinion on the effectiveness of the entity’s internal control, but in making these risk assessments the auditor considers internal controls relevant to the entity’s preparation and fair presentation of the consolidated financial statements in order to design audit procedures that are appropriate in the circumstances. An audit also includes evaluating the appropriateness of accounting policies used and the reasonableness of accounting estimates made by management, as well as evaluating the overall presentation of the consolidated financial statements.We believe that the audit evidence we have obtained is sufficient and appropriate to provide a basis for our audit opinion. OpinionIn our opinion, the consolidated financial statements referred to above present fairly, in all material respects, the consolidated financial position of Nippon Sheet Glass Company, Limited and its consolidated subsidiaries as at 31 March 2015, and their consolidated financial performance and cash flows for the year then ended in conformity with International Financial Reporting Standards. Emphasis of MatterWe draw attention to the note for changes in accounting policies, which describes the Company has changed its accounting policy with respect to the surplus and the further funding requirements of its main UK pension scheme. Our opinion is not qualified in respect of this matter.
Ernst & Young ShinNihon LLC29 June 2015Tokyo, Japan

20 NSG Group Annual Report 2015
CONSOLIDATED INCOME STATEMENT Nippon Sheet Glass Co., Ltd and consolidated subsidiaries For the period ended 31 March 2015
CONSOLIDATED STATEMENT OF COMPREHENSIVE INCOMENippon Sheet Glass Co., Ltd and consolidated subsidiaries For the period ended 31 March 2015
Millions of yen
Note2015 2014
(restated)
Revenue 2 626,713 606,095Cost of sales (473,194) (459,821)Gross profit 153,519 146,274Other income 3 3,929 7,205Distribution costs (59,131) (57,677)Administrative expenses (68,788) (66,619)Other expenses 4 (12,681) (14,616)Operating profit before exceptional items 2 16,848 14,567Exceptional items 6 5,490 (13,833)Operating profit 22,338 734Finance income 8 2,201 3,338Finance expenses 8 (20,145) (20,194)Share of post-tax profits of joint ventures and associates accounted for using the equity method 14 413 1,002Profit/(loss) before taxation 4,807 (15,120)Taxation 9 (1,914) (340)Profit/(loss) for the period 2,893 (15,460)
Profit attributable to non-controlling interests 41 1,225 1,145Profit/(loss) attributable to owners of the parent 1,668 (16,605)
2,893 (15,460)
Earnings per share attributable to owners of the parent:Basic earnings per share (yen) 35 1.85 (18.40)Diluted earnings per share (yen) 35 1.84 (18.40)
There were no revenues or costs incurred during the period with respect to discontinued operations.
Millions of yen
Note2015 2014
(restated)
Profit/(loss) for the period 2,893 (15,460)Other comprehensive income:Items that will not be reclassified to profit or loss:Re-measurement of retirement benefit obligations (net of taxation) 26 (13,199) 1,956Share of other comprehensive income of joint ventures and associates accounted for using the equity method (1,721) 602Sub total (14,920) 2,558Items that may be reclassified to profit or loss:Foreign currency translation adjustments 7,009 38,569Revaluation of available-for-sale investments 795 (571)Cash flow hedges – fair value (losses)/gains, net of taxation (2,355) 59Sub total 5,449 38,057Other comprehensive income for the period, net of taxation (9,471) 40,615Total comprehensive income for the period (6,578) 25,155
Attributable to non-controlling interests 1,728 (110)Attributable to owners of the parent (8,306) 25,265
(6,578) 25,155

NSG Group Annual Report 2015 21
OverviewOur business
Financial performance
Corporate information
Financial statements
CONSOLIDATED BALANCE SHEETNippon Sheet Glass Co., Ltd and consolidated subsidiaries As at 31 March 2015
Millions of yen
Note2015 2014
(restated)As at 1 April 2013
(restated)
AssetsNon-current assetsGoodwill 10 130,734 135,826 116,768Intangible assets 11 75,680 86,999 84,496Property, plant and equipment 12 293,529 289,389 267,983Investment property 13 867 644 635Investments accounted for using the equity method 14 30,528 50,070 45,063Retirement benefit asset 26 9,754 4,624 —Trade and other receivables 15 16,656 15,615 14,208Financial assets available-for-sale investments 16 31,870 6,743 6,742 derivative financial instruments 17 75 893 1,362Deferred tax assets 19 62,072 51,980 47,792Tax receivables 1,199 1,619 2,306
652,964 644,402 587,355Current assetsInventories 20 113,662 109,167 100,790Construction work-in-progress 21 825 982 428Trade and other receivables 15 79,010 92,523 101,242Financial assets available-for-sale investments 16 3 94 652 derivative financial instruments 17 882 1,434 2,168Cash and cash equivalents 22 67,695 73,864 83,472Tax receivables 1,558 1,943 2,686
263,635 280,007 291,438Assets held for sale or included in a disposal group held for sale 23 3,507 1,799 2,638
267,142 281,806 294,076Total assets 920,106 926,208 881,431

22 NSG Group Annual Report 2015
CONSOLIDATED BALANCE SHEET CONTINUED
Millions of yen
Note2015 2014
(restated)As at 1 April 2013
(restated)
Liabilities and equityCurrent liabilitiesFinancial liabilities borrowings 24 112,119 119,954 152,585 derivative financial instruments 17 3,090 1,514 1,744Trade and other payables 25 133,550 127,858 113,780Taxation liabilities 2,326 2,510 3,371Provisions 27 12,509 19,179 17,982Deferred income 28 3,345 3,027 2,914
266,939 274,042 292,376Liabilities included in a disposal group held for sale 23 — 332 666
266,939 274,374 293,042Non-current liabilitiesFinancial liabilities borrowings 24 325,008 331,839 291,793 derivative financial instruments 17 2,527 1,996 1,727Trade and other payables 25 741 573 1,049Deferred tax liabilities 19 20,700 23,190 23,641Taxation liabilities 650 1,837 1,295Retirement benefit obligations 26 89,924 72,636 72,347Provisions 27 17,826 16,477 18,620Deferred income 28 9,783 9,800 9,056
467,159 458,348 419,528Total liabilities 734,098 732,722 712,570
Capital and reserves attributable to the owners of the parentCalled up share capital 30 116,449 116,449 116,449Capital surplus 31 127,511 127,511 127,511Retained earnings 32 (25,082) (11,773) 2,133Retained earnings (translation adjustment at the IFRS transition date) (68,048) (68,048) (68,048)Other reserves 33 24,916 19,835 (19,606)Total shareholders’ equity 175,746 183,974 158,439Non-controlling interests 41 10,262 9,512 10,422Total equity 186,008 193,486 168,861Total liabilities and equity 920,106 926,208 881,431
The financial statements on pages 20 to 78 were approved by the directors on 29 June 2015
Directors Shigeki Mori Mark Lyons Representative Executive Officer Representative Executive Officer President and CEO Chief Financial Officer

NSG Group Annual Report 2015 23
OverviewOur business
Financial performance
Corporate information
Financial statements
CONSOLIDATED STATEMENT OF CHANGES IN EQUITYNippon Sheet Glass Co., Ltd and consolidated subsidiaries For the period ended 31 March 2015
Millions of yen
Called up share
capital
Capital surplus
Retained earnings
Retained earnings
(translation adjustment at the IFRS
transition date)
Other reserves
Total shareholders’
equity
Non-controlling interests
Total equity
Balance at 1 April 2013 (restated) 116,449 127,511 2,133 (68,048) (19,606) 158,439 10,422 168,861(Loss)/profit for the period — — (16,605) — — (16,605) 1,145 (15,460)Other comprehensive income — — 2,558 — 39,312 41,870 (1,255) 40,615Total comprehensive income — — (14,047) — 39,312 25,265 (110) 25,155Transactions with owners Stock options — — — — 135 135 — 135 Dividends paid — — — — — — (646) (646)Issuance and purchase of treasury stock — (7) — — (6) (13) — (13)Acquisition of additional investments in subsidiaries — — 148 — — 148 (154) (6)Transfer from retained earnings to capital surplus — 7 (7) — — — — —Balance at 31 March 2014 (restated) 116,449 127,511 (11,773) (68,048) 19,835 183,974 9,512 193,486Profit for the period — — 1,668 — — 1,668 1,225 2,893Other comprehensive income — — (14,920) — 4,946 (9,974) 503 (9,471)Total comprehensive income — — (13,252) — 4,946 (8,306) 1,728 (6,578)Transactions with owners Stock options — — — — 138 138 — 138 Dividends paid — — — — — — (978) (978)Issuance and purchase of treasury stock — (57) — — (3) (60) — (60)Transfer from retained earnings to capital surplus — 57 (57) — — — — —Balance at 31 March 2015 116,449 127,511 (25,082) (68,048) 24,916 175,746 10,262 186,008

24 NSG Group Annual Report 2015
CONSOLIDATED STATEMENT OF CASH FLOWSNippon Sheet Glass Co., Ltd and consolidated subsidiaries For the period ended 31 March 2015
Millions of yen
Note 2015 2014
Cash flows from operating activitiesCash generated from operations 34 44,935 37,508Interest paid (18,314) (18,830)Interest received 2,168 2,877Income tax paid (4,196) (3,675)Net cash generated from operating activities 24,593 17,880Cash flows from investing activitiesDividends received from joint ventures and associates 3,131 3,199Purchase of joint ventures and associates (183) (22)Proceeds on disposal of joint ventures and associates 162 3Purchase of subsidiaries (net of cash acquired) (488) (122)Proceeds on disposal of subsidiaries and businesses (net of cash disposed) 144 1,097Purchases of property, plant and equipment (32,602) (25,686)Proceeds on disposal of property, plant and equipment 6,229 3,292Purchase of intangible assets (2,338) (1,717)Proceeds on disposal of intangible assets 21 25Purchase of available-for-sale investments (10) (16)Proceeds on disposal of available-for-sale investments 203 996Loans advanced to joint ventures, associates and third parties (1,486) (593)Loans repaid from joint ventures, associates and third parties 630 1,964Others 3,395 474Net cash used in investing activities (23,192) (17,106)Cash flows from financing activitiesDividends paid to shareholders (11) (13)Dividends paid to non-controlling interests (978) (646)Repayment of borrowings (135,828) (154,359)Proceeds from borrowings 144,115 134,280Others (3) (6)Net cash generated from/(used in) financing activities 7,295 (20,744)Increase/(decrease) in cash and cash equivalents (net of bank overdrafts) 8,696 (19,970)Cash and cash equivalents (net of bank overdrafts) at the beginning of the period 22 52,293 65,173Effect of foreign exchange rate changes 1,351 7,090Cash and cash equivalents (net of bank overdrafts) at the end of the period 22 62,340 52,293

NSG Group Annual Report 2015 25
OverviewOur business
Financial performance
Corporate information
Financial statements
1.1 Summary of significant accounting policiesThe principal accounting policies applied in the preparation of these consolidated financial statements are set out below. These policies have been consistently applied to all the periods presented, unless otherwise stated. There were no material changes to the Group’s accounting principles, practices and presentations arising as a result of amended IFRS accounting standards and interpretations during the year.
Reporting entityNippon Sheet Glass Co., Ltd (the Company) together with its consolidated subsidiaries (the Group) is a world leader in the supply of flat glass for architectural and automotive applications. In addition, the Group has a number of discreet technical glass businesses, operating in high technology areas. The parent company of the Group, Nippon Sheet Glass Co., Ltd is incorporated and domiciled in Japan and has shares publicly traded on the Tokyo Stock Exchange. The registered office is located at 5-27, Mita 3-chome, Minato-ku, Tokyo, 108-6321, Japan.
Basis of preparationThe consolidated financial statements of the Group have been prepared in accordance with International Financial Reporting Standards (IFRS) as issued by the International Accounting Standards Board (IASB).
The consolidated financial statements have been prepared on a historical cost basis, except for investment property, derivative financial instruments and available-for-sale investments that have been measured at fair value.
The financial statements are presented in Japanese yen and are rounded to the nearest million yen (¥m) except where otherwise indicated.
IFRS standards not relevant for this financial periodCertain new standards, amendments and interpretations to existing standards have been published that are mandatory for the Group’s annual accounting periods beginning on or after 1 April 2015 and are considered to be relevant to the Group’s primary financial statements. The Group has elected not to adopt early the standards as described below:
IFRS 9, ‘Financial instruments’, addresses the classification, measurement and recognition of financial assets and financial liabilities and will be effective from the Group’s financial period commencing 1 April 2018. This new standard will replace certain elements of IAS 39. The Group has not yet calculated the impact of the adoption of this new standard.
IFRS 15 ‘Revenue from Contracts with Customers‘ addresses the recognition of revenues and is effective from the Group’s financial period commencing 1 April 2017. The International Accounting Standards Board has subsequently issued an exposure draft that proposes a one-year deferral of the effective date, potentially meaning that IFRS 15 would be effective from the Group’s annual reporting period commencing 1 April 2018. This new standard will replace IAS 18 ‘Revenue’ and IAS 11 ‘Construction Contracts’. The Group has not yet calculated the impact of the adoption of this new standard.
Consolidation(a) SubsidiariesSubsidiaries are all entities over which the Group has the power to control the financial and operating policies, generally accompanying a shareholding of more than one-half of the voting rights. The existence
and effect of potential voting rights arising from equity share options that are currently exercisable or convertible, are considered when assessing whether the Group controls another entity. Subsidiaries where the Group controls more that 50 percent of the voting rights are fully consolidated from the date on which control is transferred to the Group. They are consolidated until the date that control ceases.
The Group uses the acquisition method of accounting to account for business combinations. The consideration transferred for the acquisition of a subsidiary is the fair value of the assets transferred, the liabilities incurred and the equity interests issued by the Group. The consideration transferred includes the fair value of any assets or liabilities resulting from a contingent consideration arrangement. Acquisition-related costs are expensed as incurred. Identifiable assets acquired, and liabilities and contingent liabilities assumed, in a business combination are measured initially at their fair values at the acquisition date.
The excess of the consideration transferred, the amount of any non-controlling interest, based upon the appropriate share of the acquiree’s net asset value, and the acquisition-date fair value of any previous equity interest in the acquiree, over the fair value of the Group’s share of the identifiable net assets acquired, is recorded as goodwill. If this is less than the fair value of the net assets of the subsidiary acquired in the case of a bargain purchase, the difference is recognized immediately in the consolidated income statement (see Intangible Assets — Goodwill).
Inter-company transactions, balances and unrealized gains on transactions between Group companies are eliminated. Unrealized losses are also eliminated unless the transaction provides evidence of an impairment of the asset transferred. All Group companies use a common set of accounting policies, and are consolidated using a common accounting reference date of 31 March.
(b) Non-controlling interests, joint ventures and associatesNon-controlling interestsChanges in the Group’s ownership interests in subsidiaries, arising from transactions between the Group and non-controlling interests, that do not result in a change in the Group’s control over a subsidiary, are treated as equity transactions and therefore do not result in goodwill, or in gains and losses in the income statement.
Joint venturesA joint venture is a contractual arrangement whereby the Group and other parties undertake an economic activity, which is then subject to joint control. In the Group, all such jointly controlled activities are undertaken through jointly controlled entities with the Group entitled to a share of the net assets of the jointly controlled entity. Consequently, the Group considers each of its joint arrangements to be joint ventures rather than joint operations. The Group considers that it has no other material contractual arrangements with its joint venture partners, other than the joint venture agreement itself. The Group accounts for its interest in these jointly controlled entities by the equity method of accounting, as described in relation to associates below.
AssociatesAssociates are all entities over which the Group has significant influence, generally accompanying a shareholding of between 20 and 49 percent of the voting rights. Significant influence is the power to participate in the financial and operating policy decisions of an investee, but is not control or joint control over these policies. Investments in associates are accounted for by the equity method of accounting and are initially recognized at cost. The Group considers that it has no material contractual arrangements with the other investors in
NOTES TO THE CONSOLIDATED FINANCIAL STATEMENTS

26 NSG Group Annual Report 2015
each of the Group’s associated entities, other than those which arise in the normal course of business. The Group’s investment in associates includes goodwill (net of any accumulated impairment loss) identified on acquisition (see Intangible Assets— Goodwill).
The Group’s share of its associates’ post-acquisition profits or losses is recognized in the income statement, and its share of post-acquisition movements in reserves is recognized in reserves. The cumulative post-acquisition movements are adjusted against the carrying amount of the investment. When the Group’s share of losses in an associate equals or exceeds its interest in the associate, including any other unsecured receivables, the Group does not recognize further losses, unless it has incurred obligations or made payments on behalf of the associate.
Unrealized gains on transactions between the Group and its associates are eliminated to the extent of the Group’s interest in the associates. Unrealized losses are also eliminated unless the transaction provides evidence of an impairment of the asset transferred.
Accounting for joint ventures and associatesJoint ventures and associates are accounted for on the basis of audited accounts, or where these are not available, on the basis of unaudited management accounts prepared up to the Group’s accounting date. Where it is not practicable to obtain such accounts, audited accounts or unaudited management accounts prepared to an accounting date not more than three months prior to the Group’s accounting date are used. Where appropriate, the financial statements of joint ventures and associates are adjusted to conform to the Group’s accounting policies.
Segment reportingThe chief operating decision-making body in the Group is the Board of Directors. The Group reports the results of its operating segments externally in a manner consistent with its internal reporting to the Board of Directors. The Board of Directors is responsible for allocating resources to, and assessing the performance of, the Group’s operating segments.
Foreign currency translation(a) Functional and presentation currencyItems included in the financial statements of each of the Group’s entities are measured using the currency of the primary economic environment in which the entity operates (the functional currency). The consolidated financial statements are presented in Japanese yen which is the Company’s functional and the Group’s presentation currency.
(b) Transactions and balancesForeign currency transactions are translated into the functional currency using the exchange rates prevailing at the dates of the transactions. Foreign exchange gains and losses resulting from the settlement of such transactions and from the translation at period-end exchange rates of monetary assets and liabilities denominated in foreign currencies are recognized in the income statement, except when deferred in equity as qualifying cash flow hedges and qualifying net investment hedges.
Translation differences on non-monetary items, such as equities classified as available-for-sale financial assets, are included in the fair value reserve in equity.
(c) Group companiesThe results and financial position of all the Group entities with a functional currency different from the Group’s presentation currency (none of which has the currency of a hyperinflationary economy) are
translated into the presentation currency as follows:
• assets and liabilities for each balance sheet presented are translated at the closing rate at the date of that balance sheet;
• income and expenses for each income statement are translated at average exchange rates (unless this average is not a reasonable approximation of the cumulative effect of the rates prevailing on the transaction dates, in which case income and expenses are translated at the dates of the transactions); and
• all resulting exchange differences are recognized in the exchange translation reserve, a separate component of equity.
On consolidation, exchange differences arising from the translation of the net investment in foreign entities, and of borrowings and other currency instruments designated as hedges of such investments, are taken to the exchange translation reserve within shareholders’ equity. When a foreign operation is sold, such exchange differences are recognized in the income statement as part of the gain or loss on sale.
Exchange differences recognized prior to 31 March 2010 are included in a separate reserve within retained earnings called ‘Retained earnings (translation adjustment at the IFRS transition date)’. Exchange differences arising on or after 1 April 2010 are recognized within a separate exchange reserve.
Goodwill, intangibles and fair value adjustments arising on the acquisition of a foreign entity are treated as assets and liabilities of the foreign entity and translated at the closing rate.
Property, plant and equipmentLand and buildings comprise mainly the Group’s manufacturing facilities. Land is shown at historical cost. All property (excluding land) and plant and equipment are stated at historical cost less accumulated depreciation and impairment. Historical cost comprises all expenditure that is directly attributable to the acquisition of the items. Cost may also include transfers from equity of any gains/losses on qualifying cash flow hedges of foreign currency purchases of property, plant and equipment.
Borrowing costs are capitalized with respect to material capital expenditure projects, using the Group’s marginal cost of borrowing over the period of construction of the asset. Borrowing costs are depreciated over the useful economic life of the asset to which they relate.
Subsequent costs are included in the asset’s carrying amount or recognized as a separate asset, as appropriate, only when it is probable that future economic benefits associated with the item will flow to the Group and the cost of the item can be measured reliably. All other repairs and maintenance are charged to the income statement during the financial period in which they are incurred.
Land is not depreciated. Depreciation on other assets is calculated using the straight-line method to allocate their cost less their residual values over their estimated useful lives, as follows:
Freehold buildings 3 to 50 years Long leasehold buildings lease term or useful economic life Float glass tanks 10 to 15 years Glass-making plant 25 years Glass-processing plant 15 years Other plant and equipment 5 to 20 years Vehicles 5 years
The assets’ residual values and useful lives are reviewed to take account of technological changes, intensity of use over their lives and
NOTES TO THE CONSOLIDATED FINANCIAL STATEMENTS CONTINUED

NSG Group Annual Report 2015 27
OverviewOur business
Financial performance
Corporate information
Financial statements
market requirements, and adjusted if appropriate, at each balance sheet date. In the event of impairment, an asset’s carrying amount is written down immediately to its recoverable amount (see Impairment of Assets).
Gains and losses on disposals are determined by comparing the proceeds with the carrying amount. These are included in the income statement.
Investment propertyInvestment property principally comprises land, office buildings and small industrial units, and those parts of other properties not occupied by the Group, which are held for long-term rental yields. Investment properties are initially recognized at cost and are thereafter carried at fair value, representing open-market value determined annually by discounted cash flows or by the use of external valuers. Changes in fair value are recorded in the income statement as part of other income and expense.
Intangible assets(a) GoodwillGoodwill is tested annually for impairment and carried at cost less accumulated impairment losses. Gains and losses on the disposal of an entity include the carrying amount of goodwill relating to the entity sold.
Goodwill is allocated to cash-generating units for the purpose of impairment testing. Each of those cash-generating units represents the Group’s investments in each region of operation by each primary reporting segment (see Impairment of Assets).
(b) Trademarks and licensesTrademarks and licenses are shown at historical cost. Trademarks and licenses have a definite useful life and are carried at cost less accumulated amortization. Amortization is calculated using the straight-line method to allocate the cost of trademarks and licenses over their estimated useful lives (over a maximum of twenty years).
(c) Computer softwareAcquired computer software licenses are capitalized on the basis of the costs incurred to acquire and bring to use the specific software. These costs are amortized over their estimated useful lives (five to ten years).
Costs associated with developing or maintaining computer software programs are recognized as an expense as incurred. Costs that are directly associated with the production of identifiable and unique software products controlled by the Group, which are seen to generate economic benefits exceeding costs beyond one year, are recognized as intangible assets. Direct costs include the software development employee costs and an appropriate portion of relevant overheads.
Computer software development costs recognized as assets are amortized over their estimated useful lives (not exceeding ten years).
(d) Research and developmentResearch expenditure is recognized as an expense as incurred. Costs incurred on development projects (relating to the design and testing of new or improved products or processes which will be used internally within the Group) are recognized as intangible assets when it is probable that the project will be commercially successful and technologically feasible or will give rise to internally improved processes, and costs can be measured reliably. Other development expenditure is recognized as an expense as incurred. Development costs previously recognized as an expense are not recognized as an asset in a subsequent period. Development costs with a finite useful life that have been capitalized, are amortized from the date when the
product or use of the process becomes available for commercial production on a straight-line basis over the period of its expected benefit, not exceeding five years (products) and twenty years (processes).
(e) Intangible assets created on acquisitionThe intangible assets identified on acquisition of the Pilkington Group as part of the fair valuing of the net assets acquired include customer relationships, know-how, license agreements, the Pilkington brand name and other brands, in-process research and development and developed technology. These have been capitalized and are amortized over the estimated life of each category of intangible asset and are amortized on a straight-line basis over the period of their expected benefit to the Group as follows:
Customer relationships Up to 20 years Know-how 10 years License agreements 11 years Pilkington brand name* Nil Other brands 10 years Research and development Up to 20 years Developed technology Up to 15 years
* The Pilkington brand name has been assigned an indefinite useful life and is therefore not subject to routine amortization, but is instead tested annually for impairment.
Impairment of assetsAssets that have an indefinite useful life are not subject to amortization and are tested annually for impairment. Assets that are subject to amortization are reviewed for impairment whenever events or changes in circumstances indicate that the carrying amount may not be recoverable. An impairment loss is recognized when the asset’s carrying amount exceeds its recoverable amount. The recoverable amount is the higher of an asset’s fair value less costs to sell and value in use.
For the purposes of assessing impairment, assets are grouped at the lowest levels for which there are separately identifiable cash flows (cash-generating units). A number of significant assumptions and estimates are involved in forecasting future cash flows, including market growth rates, sales volumes and market prices. Forecasts of future cash flows are based on best estimates of future revenues and operating expenses using historical trends, market conditions and industry trends. These assumptions are subject to review by management and the Board of Directors. The future forecasts are adjusted by an appropriate discount rate derived from the cost of capital plus a risk premium at the date of the evaluation. The discount rate, based on the pre-tax weighted average cost of capital used in calculating the recoverable value, is set at a rate appropriate to each territory, consistent with the rates used to assess the potential impairment of goodwill, detailed in note 10.
InvestmentsThe Group classifies its investments in the following categories: financial assets at fair value through profit or loss, loans and receivables, held-to-maturity investments, and available-for-sale investments. The classification depends on the purpose for which the investments were acquired. Management determines the classification of its investments at initial recognition and reevaluates this designation at every reporting date.
(a) Financial assets/liabilities at fair value through profit or lossThis category has two sub-categories: financial assets held for trading, and those designated at fair value through profit or loss at inception. A financial asset is classified in this category if acquired principally for the
NOTES TO THE CONSOLIDATED FINANCIAL STATEMENTS CONTINUED
28 NSG Group Annual Report 2015
purpose of selling in the short term or if so designated by management. Derivatives are also categorized as held for trading unless they are designated as hedges. Assets/liabilities in this category are classified as current assets/liabilities if they are either held for trading or are expected to be realized within 12 months of the balance sheet date.
(b) Loans and receivablesLoans and receivables are non-derivative financial assets with fixed or determinable payments that are not quoted in an active market. They arise when the Group provides money, goods or services directly to a debtor with no intention of trading the receivable. They are included in current assets, except for maturities greater than 12 months after the balance sheet date and these are classified as non-current assets. Loans and receivables are included in trade and other receivables in the balance sheet (see Trade receivables).
(c) Held-to-maturity investmentsHeld-to-maturity investments are non-derivative financial assets with fixed or determinable payments and fixed maturities that the Group’s management has the positive intention and ability to hold to maturity. The Group does not hold any investments in this category.
(d) Available-for-sale investmentsAvailable-for-sale investments are non-derivative financial assets that are either designated in this category or not classified in any of the other categories. They are included in non-current assets unless management intends to dispose of the investment within 12 months of the balance sheet date. They are initially recognized at fair value plus transaction costs and thereafter at fair value.
Purchases and sales of investments are recognized on the trade date, the date on which the Group commits to purchase or sell the asset. Investments are derecognized when the rights to receive cash flows from the investments have expired or have been transferred and the Group has transferred substantially all risks and rewards of ownership. If the Group neither transfers nor retains substantially all the risks and rewards of ownership of the investments, the Group considers whether it has retained control of the investments. Available-for-sale investments and financial assets at fair value through profit or loss are subsequently carried at fair value. Loans and receivables and held-to-maturity investments are carried at amortized cost using the effective interest method. Realized and unrealized gains and losses arising from changes in the fair value of the ‘financial assets at fair value through profit or loss’ category are included in the income statement in the period in which they arise. Unrealized gains and losses arising from changes in the fair value of non-monetary securities classified as available-for-sale are recognized in the fair value reserve within equity. When securities classified as available-for-sale are sold or impaired, the accumulated fair value adjustments are included in the income statement as gains and losses from investment securities.
The fair values of quoted investments are based on current bid prices. For unlisted securities or where the market for a financial asset is not active, the Group establishes fair value by using valuation techniques. These include the use of recent arm’s-length transactions, reference to other instruments that are substantially the same, discounted cash flow analysis, and option pricing models refined to reflect the issuer’s specific circumstances.
The Group assesses at each balance sheet date whether there is objective evidence that a financial asset or a group of financial assets is impaired. In the case of equity securities classified as available-for-sale, a significant or prolonged decline in the fair value of the security below its cost would be considered in determining whether the securities are impaired. If any such evidence exists for available-for-sale investments,
the cumulative loss, measured as the difference between the acquisition cost and the current fair value, less any impairment loss on that financial asset previously recognized in profit or loss, is removed from equity and recognized in the income statement.
InventoriesInventories are stated at the lower of cost and net realizable value. Cost is mainly determined using the first-in, first-out (FIFO) method. The cost of finished goods and work-in-progress comprises design costs, raw materials, direct labor, other direct costs and related production overheads (based on normal operating capacity). Net realizable value is the estimated selling price in the ordinary course of business, less applicable variable selling expenses. Costs of inventories include the transfer from equity of any gains/losses on qualifying cash flow hedges relating to purchases of raw materials.
Inventories carried in the balance sheet are reviewed on a regular basis and, in the case of any inventories which are slow moving, or where the Group considers that it is unlikely to recover the cost of such inventory through subsequent sale, appropriate provisions are made to impair the inventory to its estimated net realizable value.
Construction work-in-progressConstruction work-in-progress is represented by engineering construction contracts for the building, construction and delivery of float glass lines or other assets for third-party customers. Profits are recognized where revenue and contract costs can be reliably estimated and are based on the stage of completion of the contract. Where the outcome cannot be estimated reliably, revenue is only recognized to the extent that it is probable that the contract costs incurred will be recoverable. Where it is probable that the contract costs will exceed the total contract revenue, the expected loss is recognized as an expense immediately in the income statement.
The stage of completion on construction contracts is assessed at regular intervals by the engineering project team and is based on an analysis of construction progress made, order fulfillment, costs incurred and technical completion at the balance sheet date.
Trade and other receivablesTrade and other receivables are recognized initially at fair value and subsequently measured at amortized cost using the effective interest method, less provision for impairment. A provision for impairment of trade receivables is established when there is objective evidence that the Group will not be able to collect all amounts due according to the original terms of trade. The amount of the provision is the difference between the asset’s carrying amount and the present value of estimated future cash flows, discounted at the effective interest rate. The movement in the provision is recognized in the income statement.
Cash and cash equivalentsCash and cash equivalents include cash in hand, deposits held on call with banks, other short-term highly liquid investments with original maturities of three months or less, and bank overdrafts. Bank overdrafts are shown within borrowings in current liabilities on the balance sheet.
Trade and other payablesTrade and other payables are obligations to pay for goods or services that have been acquired in the ordinary course of business from suppliers. Trade and other payables are classified as current liabilities if payment is due within one year or less. If not, they are presented as non-current liabilities.
NOTES TO THE CONSOLIDATED FINANCIAL STATEMENTS CONTINUED

NSG Group Annual Report 2015 29
OverviewOur business
Financial performance
Corporate information
Financial statements
BorrowingsBorrowings consist of bonds payable, loans payable, lease obligations and non-controlling interests entitled to receive a fixed share dividend. Borrowings are recognized initially at fair value. Borrowing transaction costs are expensed in the income statement over the period to the maturity of the related financial liability. Borrowings are subsequently stated at amortized cost. Any difference between the proceeds (net of transaction costs) and the redemption value is recognized in the income statement over the period of the borrowings using the effective interest method.
Non-equity preference shares are classified as liabilities and are measured in the balance sheet at their most recent redemption price. The dividends on these preference shares are recognized in the income statement as interest expense.
Borrowings are classified as current liabilities unless the Group has an unconditional right to defer settlement of the liability for at least 12 months after the balance sheet date.
LeasesAssets held under finance leases (in which a significant proportion of the risks and rewards of ownership are retained by the Group) are included in property, plant and equipment and intangible assets at cost and are depreciated/amortized over the shorter of the lease term or their useful economic life. Obligations under finance leases, net of finance charges in respect of future periods, are included as appropriate under borrowings due within or after one year. Finance charges are allocated to accounting periods over the lease term to reflect a constant rate of interest on the remaining balance of the obligations.
Where a lease is identified as an operating lease (is a lease other than a finance lease), any payments made thereunder (net of any incentives received from the lessor) are charged to the income statement on a straight-line basis over the period of the lease.
TaxationCurrent income taxes for the current period are measured based on the amount expected to be paid to, or recovered from, local taxation authorities.
Deferred income tax is provided in full, using the liability method and without discounting, on temporary differences arising between the tax bases of assets and liabilities and their carrying amounts in the consolidated financial statements. However, if the temporary difference arises from initial recognition of an asset or liability in a transaction other than a business combination that at the time of the transaction affects neither accounting nor taxable profit or loss, it is not accounted for. Deferred income tax is determined using tax rates (and laws) that have been enacted or substantially enacted by the balance sheet date and are expected to apply when the related deferred income tax asset is realized or the deferred income tax liability is settled.
Deferred income tax assets are recognized to the extent that it is probable that future taxable profits will be available, against which the temporary differences can be utilized. Deferred income tax is provided on temporary differences arising on investments in subsidiaries and associates, except where the timing of the reversal of the temporary difference is controlled by the Group and it is probable that the temporary difference will not reverse in the foreseeable future. Deferred taxation liabilities are not recognized on timing differences arising from the initial recognition of goodwill. The Group offsets deferred tax assets and liabilities if a legally enforceable right exists to
set off current tax assets against current income tax liabilities and the deferred tax asset and liability are related to the same taxable entity or group of entities and the same taxation authority.
Employee benefits(a) Pension obligationsGroup companies operate various pension schemes. The schemes are generally funded through payments to insurance companies or trustee-administered funds, determined by periodic actuarial calculations. The Group has both defined benefit and defined contribution plans.
The liability recognized in the balance sheet in respect of defined benefit pension plans is the present value of the defined benefit obligation at the balance sheet date less the fair value of plan assets. The defined benefit obligation is calculated annually by independent actuaries using the projected unit credit method. The present value of the defined benefit obligation is determined by discounting the estimated future cash outflows using interest rates of high quality corporate bonds that are denominated in the currency in which the benefits will be paid, and that have terms to maturity approximating to the terms of the related pension liability.
Retirement benefit assets are recognized for schemes in surplus, when the Group has an unconditional right to a refund of that surplus.
Current service costs, representing the additional liability accrued as a result of employee’s services undertaken during the period, are charged to operating costs within the income statement.
Past service costs are recognized immediately in the income statement.
Finance costs are calculated by applying territory specific discount rates to the net defined benefit obligation in that region.
Actuarial gains and losses arising from experience adjustments and changes in actuarial assumptions are taken through the statement of comprehensive income to equity in accordance with IAS 19 ‘Employee Benefits’.
For defined contribution plans, the Group pays contributions to publicly or privately administered pension insurance plans on a mandatory, contractual or voluntary basis. The Group has no further payment obligations once the contributions have been paid.
Prepaid contributions are recognized as an asset to the extent that a cash refund or a reduction in the future payments is available.
(b) Other post-employment retirement obligationsGroup companies in the USA and the UK provide post-retirement healthcare benefits to certain retired employees. The entitlement to these benefits is usually conditional on the employee remaining in service up to retirement age and the completion of a minimum service period. The expected costs of these benefits are accrued over the period of employment using an accounting methodology similar to that for defined benefit pension plans.
Actuarial gains and losses arising from experience adjustments, and changes in actuarial assumptions, are charged or credited to the statement of comprehensive income in accordance with IAS 19. These obligations are valued annually by independent qualified actuaries.
(c) Termination benefitsTermination benefits are payable when employment is terminated before the normal retirement date, or whenever an employee accepts voluntary redundancy in exchange for these benefits. The Group recognizes termination benefits when it is demonstrably committed to either terminating the employment of current employees according to
NOTES TO THE CONSOLIDATED FINANCIAL STATEMENTS CONTINUED

30 NSG Group Annual Report 2015
a detailed formal plan without possibility of withdrawal, or providing termination benefits as a result of an offer made to encourage voluntary redundancy.
(d) Profit-sharing, bonus and management incentive plansThe Group recognizes a liability and an expense for bonus schemes, which take into consideration the attainment of profit and cash flow targets. The Group recognizes a provision where contractually obliged or where there is a past practice that has created a constructive obligation.
ProvisionsProvisions are recognized when the Group has a present obligation (legal or constructive) as a result of a past event, it is probable that an outflow of resources will be required to settle the obligation and a reliable estimate can be made of the amount of the obligation. When the Group expects some or all of a provision to be reimbursed, for example, under an insurance contract, the reimbursement is recognized as a separate asset, but only when the reimbursement is virtually certain. The expense relating to a provision is presented in the income statement net of any reimbursement. Provisions are not recognized for future losses.
Where there are a number of similar obligations, the likelihood that an outflow will be required in settlement is determined by considering the class of obligations as a whole. A provision is recognized even if the likelihood of an outflow with respect to any one item included in the same class of obligations may be small.
All provisions, where the time value of money is material with a settlement date exceeding 12 months, are discounted and carried at their discounted value. The discount is unwound through a charge to finance costs each period until the provision is settled. Discount rates are based on rates applicable in each relevant territory where the provision is carried, consistent with risks specific to the liability.
Revenue recognitionRevenue comprises the fair value for the sale of goods and services, net of value-added or similar sales-based taxes, rebates and discounts and after eliminating sales within the Group. Revenue is recognized as follows:
(a) Sales of goodsSales of goods are recognized when a Group entity has delivered products to the customer, the customer has accepted the products and collectability of the related receivables is reasonably assured.
Where a product is sold with a right of return, accumulated experience is used to estimate and provide for such returns at the time of sale.
(b) Sales of servicesSales of services are recognized in the accounting period in which the services are rendered, by reference to the completion of the specific transaction, and assessed on the basis of the actual service provided as a proportion of the total services to be provided.
(c) Engineering revenueEngineering revenue is recognized on engineering construction contracts for the building, construction and supply of float glass lines for third-party customers.
Profits are recognized on such long-term contracts where revenue and contract costs can be reliably estimated and are based on the estimated stage of completion of the contract. Where the outcome of the contract cannot be estimated reliably, revenue is only recognized to the extent that it is probable that the contract costs incurred will be
recoverable. In circumstances where it is probable that the total contract costs will exceed the total contract revenue, the expected loss is recognized as an expense immediately in the income statement.
(d) Interest incomeInterest income is recognized on a time-proportion basis using the effective interest method. When a receivable is impaired, the Group reduces the carrying amount to its recoverable amount (i.e. the estimated future cash flow discounted at the original effective interest rate of the instrument), and continues unwinding the discount as interest income. Interest income on impaired loans is recognized either as cash is collected or on a cost-recovery basis as conditions warrant.
(e) Royalty incomeRoyalty income is recognized on an accruals basis in accordance with the substance of the relevant agreements.
(f) Dividend incomeDividend income is recognized when the right to receive payment is established.
Exceptional ItemsThe Group discloses certain gains or losses in the income statement as exceptional items if this is necessary to gain a fair understanding of the Group’s operating performance. Exceptional items would usually be material in value and/or would be of a non-recurring nature. Charges resulting from the Group’s profit improvement program are included within exceptional items.
Deferred income(a) Government grantsThe Group recognizes government grants at their fair value where there is reasonable assurance that the grant will be received and all attaching conditions will be complied with. When the grant relates to an expense item, it is recognized as income over the periods necessary to match the grant on a systematic basis to the costs that it is intended to compensate. Where the grant relates to property, plant and equipment, the fair value is credited to deferred income and released to the income statement over the expected useful life of the relevant asset by equal annual installments.
(b) Other deferred incomeThe Group recognizes other deferred income including customers’ contributions to automotive tooling costs at their fair value. The income is recognized in the income statement over the periods necessary to match the write-off of the asset, to which the deferred income relates, by equal annual installments.
Emission rightsEmissions rights granted are recognized on a systematic basis over the period to which they relate. The difference between the emission rights granted and recognized at the balance sheet date, and CO2 emitted is recorded as an asset or liability at fair value at each balance sheet date.
Borrowing costsBorrowing costs directly attributable to the acquisition, construction or production of qualifying assets, which are assets that necessarily take a substantial period of time to get ready for their intended use or sale, are added to the cost of these assets, until such time as the assets are substantially ready for their intended use or sale. All other borrowing costs are recognized in the consolidated income statement in the period in which they are incurred.
NOTES TO THE CONSOLIDATED FINANCIAL STATEMENTS CONTINUED

NSG Group Annual Report 2015 31
OverviewOur business
Financial performance
Corporate information
Financial statements
Accounting for derivative financial instruments and hedging activitiesDerivatives are initially recognized at fair value on the date a derivative contract is entered into and are subsequently re-measured at their fair value. The method of recognizing the resulting gain or loss depends on whether the derivative is designated as a hedging instrument, and, if so, the nature of the item being hedged and the effectiveness of the hedging arrangement. The Group designates certain derivatives as hedges of the changes in fair value of recognized assets or liabilities or a firm commitment (fair value hedges), hedges of exposure to variability in cash flows associated with an asset or liability or arising from highly probable forecast transactions (cash flow hedges), and hedges of net investments in foreign operations (net investment hedges).
The Group documents at the inception of the transaction the relationship between hedging instruments and hedged items, as well as its risk management objective and strategy for undertaking various hedge transactions. The Group also documents, both at hedge inception and on an ongoing basis, its assessment of whether the derivatives used in hedging transactions are highly effective in offsetting changes in fair values or cash flows of hedged items.
(a) Fair value hedgeChanges in the fair value of derivatives, designated and qualifying as fair value hedges, are recorded in the income statement, together with any changes in the fair value of the hedged asset or liability, attributable to the hedged risk.
(b) Cash flow hedgeThe effective portion of changes in the fair value of derivatives, designated and qualifying as cash flow hedges, is recognized in equity. The gain or loss relating to the ineffective portion is recognized immediately in the income statement.
Amounts accumulated in equity are recycled in the income statement in the periods when the hedged item affects profit or loss (for instance, when the forecast sale that is hedged takes place). However, when the forecast transaction that is hedged results in the recognition of a non-financial asset (for example, inventory) or a liability, the gains and losses previously deferred in equity are transferred from equity and included in the initial measurement of the cost of the asset or liability.
When a forecast transaction is no longer expected to occur, the cumulative gain or loss that was reported in equity is immediately transferred to the income statement.
(c) Net investment hedgeHedges of net investments in foreign operations are accounted for similarly to cash flow hedges. Any gain or loss on the hedging instrument relating to the effective portion of the hedge is recognized in equity, the gain or loss relating to the ineffective portion is recognized immediately in the income statement.
Gains and losses accumulated in equity are included in the income statement when the foreign operation is disposed of.
(d) Derivatives that do not qualify for hedge accountingCertain derivative instruments do not qualify for hedge accounting. Changes in the fair value of any derivative instruments, not qualifying for hedge accounting, are recognized immediately in the income statement.
Fair value estimationThe fair value of financial instruments traded in active markets (such as
derivatives and available-for-sale investments) is based on quoted market prices at the balance sheet date. The quoted market price used for financial assets held by the Group is the current bid price. The appropriate quoted market price for financial liabilities is the current offer price. In the event of an indication of a potential impairment, management assess the recoverable value of the asset based on the higher of its value in use and fair value less cost to sell.
The fair value of financial instruments that are not traded in an active market is determined by using valuation techniques. The Group uses a variety of methods and makes assumptions that are based on market conditions existing at each balance sheet date.
The fair values of foreign exchange contracts are determined using forward exchange market rates at the balance sheet date. The fair values of interest rate swaps are calculated as the present value of the estimated future cash flows based on observable yield curves at the balance sheet date. The fair values of commodity hedges are determined by using forward market prices at the balance sheet date.
The fair value of financial liabilities is determined using cash flows discounted using a rate based on credit risk factors and the relevant currency swap rate for the specific maturity, plus a margin.
Share capitalOrdinary shares are classified as equity. Mandatory redeemable preference shares are classified as liabilities.
Incremental costs directly attributable to the issue of new shares or options are shown in equity as a deduction, net of tax, from the proceeds.
Treasury sharesTreasury shares represent the Group’s interests in its own equity instruments, and are included within shareholders’ funds. Treasury shares are measured at their cost.
Share based paymentsThe Group operates a number of equity settled, share-based payment plans, under which the entity receives services from directors, executive officers, senior corporate officers and corporate officers as consideration for equity instruments (options) of the Group. The fair value of the employee services received in exchange for the grant of options is calculated using the Black-Scholes model. In accordance with IFRS 2 ‘Share-based Payment’, the resulting cost is recognized in the income statement over the vesting period of the options, being the period in which the services are received. The value of the charge is adjusted to reflect expected and actual levels of vesting options, except where the failure to vest is as a result of not meeting a market condition. All plans are classified as equity settled.
Discontinued operations and assets held for saleDiscontinued operations include components of the Group that have been disposed of (through sale or abandonment) or are classified as held for sale and represent a major line of the Group’s business or geographical area of operations or represent a part of a single coordinated plan to dispose of such a business line or geographical area.
Non-current assets and disposal groups are classified as held for sale if their carrying amount will be recovered principally through a sale transaction rather than through continued use. This condition is regarded as met only when the sale is highly probable and the non-current asset (or disposal group) is available for immediate sale in its present condition. Management must be committed to the sale,
NOTES TO THE CONSOLIDATED FINANCIAL STATEMENTS CONTINUED

32 NSG Group Annual Report 2015
which should be expected to be completed within one year.
When the Group is committed to a sale plan involving loss of control of a subsidiary, all of the assets and liabilities of that subsidiary are classified as held for sale when the criteria described above are met, regardless of whether the Group will retain a minority interest in its former subsidiary after the sale.
Assets classified as held for sale are measured at the lower of their previous carrying amount and fair value less costs to sell. Property, plant and equipment and intangible assets classified as held for sale are not depreciated or amortized after classification as held for sale.
Financial risk management
Financial risk factorsThe Group’s multinational operations and debt financing expose it to a variety of financial risks that include the effects of changes in foreign currency exchange rates, energy prices, debt market prices, interest rates, credit risks, and liquidity. The Group has in place a risk management program that seeks to limit the effects on the financial performance of the Group by using financial instruments.
Financial risk management is carried out by a central treasury department (Group Treasury) under policies approved by the Board of Directors. Group Treasury identifies, evaluates and hedges financial risks in close co-operation with the Group’s operating units. The Board provides written principles for overall risk management, as well as written policies covering specific areas, such as foreign exchange risk, energy price risk, use of derivative and non-derivative financial instruments, credit risk, and investing excess liquidity.
(a) Market risk(i) Foreign exchange riskThe Group operates internationally and is exposed to foreign exchange risk arising from various currency exposures, primarily with respect to the euro, sterling and US dollar. Foreign exchange risk arises from future commercial transactions, recognized assets and liabilities and net investments in foreign operations.
To manage their foreign exchange risk arising from future commercial transactions and recognized assets and liabilities, companies in the Group use forward contracts, transacted with Group Treasury. Foreign exchange risk arises when future commercial transactions and recognized assets and liabilities are denominated in a currency that is not the entity’s functional currency. Group Treasury is responsible for managing the net position in each foreign currency by using external forward currency contracts.
Each subsidiary designates contracts with Group Treasury as fair value hedges or cash flow hedges, as appropriate.
External foreign exchange contracts are designated at Group level as hedges of foreign exchange risks on specific assets, liabilities or future transactions on a gross basis.
The Group’s risk management policy is to hedge forecast transactions creating the foreign currency exposure provided that such forecast transactions are reasonably certain.
The Group has certain investments in foreign operations, whose net assets are exposed to foreign currency translation risk. Currency exposure arising from the net assets of the Group’s foreign operations is managed primarily through borrowings denominated in the relevant foreign currencies.
The Group is exposed to the risk of fluctuations in foreign exchange rates, mainly as the assets, liabilities, incomes and expenses
denominated in local currencies are translated into yen when consolidated financial statements are prepared.
All other things being equal, a 1% increase in the value of the yen would lead to a decrease in total equity of ¥4,000 million (2014: ¥4,000 million). Based on the financial results for the year to 31 March 2015, a 1% increase in the value of the yen would result in a decrease in the profit for the period of ¥10 million (2014: decrease in loss for the period of ¥150 million).
(ii) Energy price risksThe Group consumes significant amounts of energy and is exposed to energy price risk arising from this consumption, principally of oil and gas.
The Group’s risk management policy is to hedge between 20 percent and 100 percent of anticipated purchases for the subsequent 12 months and between 10 percent and 80 percent for the next four years.
(iii) Cash flow and fair value interest rate riskAs the Group has no significant interest-bearing assets, the Group’s income and operating cash flows are substantially independent of changes in market interest rates.
The Group’s interest rate risk arises primarily from long-term borrowings. Borrowings issued at variable rates expose the Group to cash flow interest rate risk. Borrowings issued at fixed rates expose the Group to fair value interest rate risk. Group policy is to maintain approximately 30 to 70 percent of net borrowings in fixed rate instruments. All other things being equal, a 1 percent increase in interest rates would result in an increase in annual interest costs on financial balances of ¥2,404 million.
The Group manages its cash flow interest rate risk by using floating-to-fixed interest rate swaps. Such interest rate swaps have the economic effect of converting borrowings from floating rates to fixed rates. Under the interest rate swaps, the Group agrees with other parties to exchange, at specific intervals, the difference between fixed contract rates and floating rate interest amounts calculated by reference to the agreed notional principal amounts.
(b) Credit riskThe Group has no significant concentrations of credit risk other than in relation to the receivables due from automotive original equipment manufacturers. It has policies in place to ensure that sales of products are made to customers with an appropriate credit history. Derivative counterparties are limited to high credit quality financial institutions. The Group has policies that limit the amount of credit exposure to any financial institution.
As set out in note 38, the Group has outstanding loans and receivables owed by joint ventures and associates. The Group manages these balances on an arms-length basis, ensuring that loans and receivables are only advanced to joint ventures and associates where the Group is satisfied that these balances will be repaid.
(c) Liquidity riskPrudent liquidity risk management policies maintain sufficient cash and cash equivalents and availability of funding through committed credit facilities. Due to the dynamic nature of the underlying businesses, Group Treasury aims to maintain flexibility in funding by keeping a substantial portion of committed credit lines undrawn.
Critical accounting estimates and assumptionsEstimates and judgments are continually evaluated and are based on historical experience and other factors, including expectations of
NOTES TO THE CONSOLIDATED FINANCIAL STATEMENTS CONTINUED

NSG Group Annual Report 2015 33
OverviewOur business
Financial performance
Corporate information
Financial statements
future events that are believed to be reasonable under the circumstances.
The Group makes estimates and assumptions concerning the future. The resulting accounting estimates will not usually be equal to the resulting actual results. The estimates and assumptions that have a significant risk of causing a material adjustment to the carrying amounts of assets and liabilities within the next financial period are discussed below.
(a) Estimated impairment of goodwill and intangible assetsThe Group tests, on an annual basis, whether goodwill or intangible assets with an indefinite useful life have suffered any impairment, in accordance with the accounting policy stated above.
(b) Income taxesThe Group is subject to income taxes in numerous jurisdictions worldwide. During the normal course of business, there are a significant number of transactions where the final tax determination is uncertain. The Group recognizes liabilities for anticipated tax audit issues based on an estimate of both the value of any additional taxes that may be due and the likelihood that the final tax audit outcome may result in such additional liabilities. In arriving at the total liability to be provided, significant judgment is required. Where the final tax outcome of these matters is different from the amounts provided, any difference is recorded in the period in which that final outcome is known.
(c) Post-retirement benefitsThe Group has a variety of post-retirement benefit schemes in various countries in which it operates. Where such schemes are in the nature of a defined benefit arrangement, the Group uses a variety of assumptions in the calculation of the scheme assets and liabilities. These assumptions are subject to a degree of uncertainty and the Group takes advice from professional actuaries before finalizing such assumptions.
(d) ProvisionsIf appropriate, the directors seek professional advice regarding the valuation of provisions.
(e) Investments accounted for using the equity methodAt 31 March 2014, the Group had a 15.18 percent shareholding in Shanghai Yaohua Pilkington Glass Group Co., Ltd (SYP), which was accounted for using the equity method as management judged the Group exerted a significant influence over this company due to the level of its management involvement with SYP.
As set out in note 6, following a decrease in the level of the Group’s management involvement with SYP, the Group is no longer able to exert a significant influence over SYP.
1.2 Changes in accounting policies and disclosuresThe Group has re-assessed its policy towards the recognition of retirement benefit scheme assets and liabilities in light of ongoing debate by the IFRS foundation in respect of IFRIC 14 and IAS 19. The Group has previously had a policy of imposing a nil-value asset ceiling on the recognition of pension assets arising at its main UK pension scheme on the basis that the trustee has the discretionary ability to take actions that could reduce or extinguish the surplus. The Group has also then had a policy of recognizing a further liability with respect to the funding requirements of this scheme. Consistent with the latest proposals made by the IFRS foundation, the Group has revised its policy with respect to the application of an asset ceiling. The Group has an unconditional right to a refund of surplus, as defined under IFRIC 14 and
considers that the possibility that a surplus could be reduced or extinguished by discretionary actions by the trustee does not affect the existence of the asset at the end of the reporting period. Given these circumstances, a nil-value asset ceiling is no longer applied by the Group. Consequently the Group now recognizes a pension asset with respect to this scheme and no longer recognizes an additional liability with respect to further funding contributions. The accounting impact of this change has been applied retrospectively in accordance with IAS8. The Group has therefore restated its comparative opening balance sheet as at 1 April 2013, its comparative income statement and statement of comprehensive income for the period to 31 March 2014, and its comparative balance sheet as at 31 March 2014.
The impact of this change is summarized in note 39.
NOTES TO THE CONSOLIDATED FINANCIAL STATEMENTS CONTINUED

34 NSG Group Annual Report 2015
2. Segmental information
Primary reporting format – by business lineThe Group is organized on a worldwide basis into the following principal primary operating segments:
The Architectural segment engages in the manufacturing and sale of flat glass and various interior and exterior glazing products within commercial and residential markets. It also includes glass for the solar energy sector.
The Automotive segment supplies a wide range of automotive glazing for new vehicles and for replacement markets.
The Technical Glass segment comprises a number of discrete businesses, including the manufacture and sale of very thin glass for small displays, lenses and light guides for printers, as well as glass fiber products, such as battery separators and glass components for engine timing belts.
The Other segment covers corporate costs, consolidation adjustments, certain small businesses not included in the segments covered above, and the amortization of other intangible assets related to the acquisition of Pilkington plc.
No operating segments have been aggregated to form the above reportable operating segments.
The segmental results for the periods ended 31 March 2015 and 2014 are as follows:
Millions of yen
2015
Architectural AutomotiveTechnical
Glass Other Total
RevenueExternal revenue 252,914 313,956 58,741 1,102 626,713Inter-segmental revenue 21,142 2,424 26 5,132 28,724Total revenue 274,056 316,380 58,767 6,234 655,437Trading profit 17,020 9,372 4,922 (6,044) 25,270Amortization arising from acquisition of Pilkington plc — — — (8,422) (8,422)Operating profit before exceptional items 17,020 9,372 4,922 (14,466) 16,848Exceptional items 5,490Operating profit 22,338Finance costs – net (17,944)Share of post-tax profit from joint ventures and associates 413Profit before taxation 4,807Taxation (1,914)Profit for the period 2,893
Millions of yen
2014 (restated)
Architectural AutomotiveTechnical
Glass Other Total
RevenueExternal revenue 240,606 305,114 59,355 1,020 606,095Inter-segmental revenue 15,494 2,147 89 5,411 23,141Total revenue 256,100 307,261 59,444 6,431 629,236Trading profit 10,951 11,154 5,898 (5,551) 22,452Amortization arising from acquisition of Pilkington plc — — — (7,885) (7,885)Operating profit before exceptional items 10,951 11,154 5,898 (13,436) 14,567Exceptional items (13,833)Operating profit 734Finance costs – net (16,856)Share of post-tax profit from joint ventures and associates 1,002Loss before taxation (15,120)Taxation (340)Loss for the period (15,460)
NOTES TO THE CONSOLIDATED FINANCIAL STATEMENTS CONTINUED
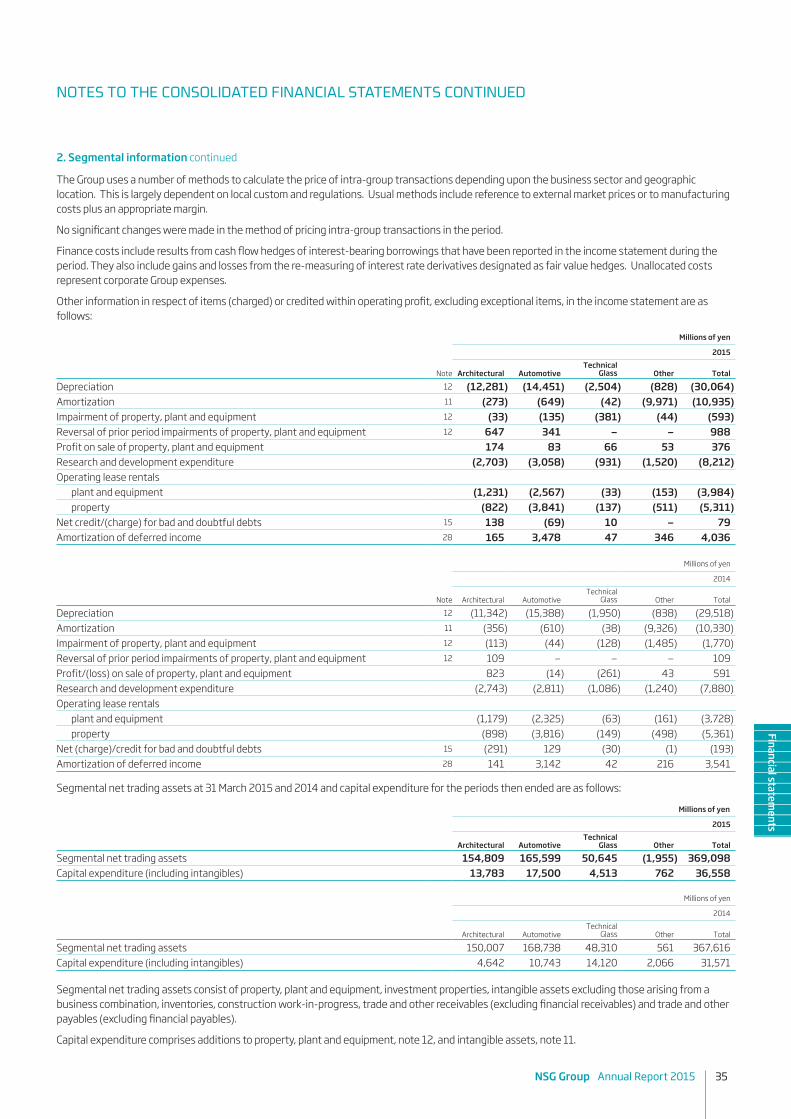
NSG Group Annual Report 2015 35
OverviewOur business
Financial performance
Corporate information
Financial statements
2. Segmental information continued
The Group uses a number of methods to calculate the price of intra-group transactions depending upon the business sector and geographic location. This is largely dependent on local custom and regulations. Usual methods include reference to external market prices or to manufacturing costs plus an appropriate margin.
No significant changes were made in the method of pricing intra-group transactions in the period.
Finance costs include results from cash flow hedges of interest-bearing borrowings that have been reported in the income statement during the period. They also include gains and losses from the re-measuring of interest rate derivatives designated as fair value hedges. Unallocated costs represent corporate Group expenses.
Other information in respect of items (charged) or credited within operating profit, excluding exceptional items, in the income statement are as follows:
Millions of yen
2015
Note Architectural Automotive Technical Glass Other Total
Depreciation 12 (12,281) (14,451) (2,504) (828) (30,064)Amortization 11 (273) (649) (42) (9,971) (10,935)Impairment of property, plant and equipment 12 (33) (135) (381) (44) (593)Reversal of prior period impairments of property, plant and equipment 12 647 341 — — 988Profit on sale of property, plant and equipment 174 83 66 53 376Research and development expenditure (2,703) (3,058) (931) (1,520) (8,212)Operating lease rentals plant and equipment (1,231) (2,567) (33) (153) (3,984) property (822) (3,841) (137) (511) (5,311)Net credit/(charge) for bad and doubtful debts 15 138 (69) 10 — 79Amortization of deferred income 28 165 3,478 47 346 4,036
Millions of yen
2014
Note Architectural Automotive Technical Glass Other Total
Depreciation 12 (11,342) (15,388) (1,950) (838) (29,518) Amortization 11 (356) (610) (38) (9,326) (10,330) Impairment of property, plant and equipment 12 (113) (44) (128) (1,485) (1,770) Reversal of prior period impairments of property, plant and equipment 12 109 — — — 109Profit/(loss) on sale of property, plant and equipment 823 (14) (261) 43 591 Research and development expenditure (2,743) (2,811) (1,086) (1,240) (7,880)Operating lease rentals plant and equipment (1,179) (2,325) (63) (161) (3,728) property (898) (3,816) (149) (498) (5,361) Net (charge)/credit for bad and doubtful debts 15 (291) 129 (30) (1) (193) Amortization of deferred income 28 141 3,142 42 216 3,541
Segmental net trading assets at 31 March 2015 and 2014 and capital expenditure for the periods then ended are as follows:
Millions of yen
2015
Architectural Automotive Technical Glass Other Total
Segmental net trading assets 154,809 165,599 50,645 (1,955) 369,098Capital expenditure (including intangibles) 13,783 17,500 4,513 762 36,558
Millions of yen
2014
Architectural Automotive Technical Glass Other Total
Segmental net trading assets 150,007 168,738 48,310 561 367,616Capital expenditure (including intangibles) 4,642 10,743 14,120 2,066 31,571
Segmental net trading assets consist of property, plant and equipment, investment properties, intangible assets excluding those arising from a business combination, inventories, construction work-in-progress, trade and other receivables (excluding financial receivables) and trade and other payables (excluding financial payables).
Capital expenditure comprises additions to property, plant and equipment, note 12, and intangible assets, note 11.
NOTES TO THE CONSOLIDATED FINANCIAL STATEMENTS CONTINUED

36 NSG Group Annual Report 2015
2. Segmental information continuedSegmental net trading assets are reconciled to total assets as follows:
Millions of yen
2015 2014(restated)
Segmental net trading assets for reportable segments 369,098 367,616 Add back trade and other payables 134,183 128,300Exchange and other timing adjustments 2,136 13,779Unallocated:Goodwill 130,734 135,826 Intangible assets arising on the acquisition of Pilkington 62,141 73,749 Financial receivables 12,671 11,875 Investments accounted for using the equity method 30,528 50,070 Retirement benefit asset 9,754 4,624Financial assets – available-for-sale investments 31,873 6,837 Financial assets – derivative financial instruments 957 2,327 Deferred tax assets 62,072 51,980 Assets held for sale 3,507 1,799 Tax receivables 2,757 3,562 Cash and cash equivalents 67,695 73,864 Total assets per the balance sheet 920,106 926,208
Secondary reporting format – by revenue category and geographical locationMillions of yen
2015 2014
Analysis of revenue by categorySale of glass and glass-related products 604,102 582,987Sales of services 2,868 2,839Royalty and licensing income 697 919Engineering contracts 4,811 5,138Other sundry sales 14,235 14,212
626,713 606,095
The Group’s revenue from its external customers based on the geographical location of those customers is as follows:
Millions of yen
2015 2014
RevenueJapan 144,167 146,184Europe 239,162 238,269North America 112,138 96,448Rest of World 131,246 125,194
626,713 606,095
No individual customer accounts for more than 10 percent of total revenues of the Group.
The total of non-current assets, other than financial instruments, deferred tax assets, trade and tax receivables, located in Japan is ¥34,322 million (2014: ¥33,784 million), UK ¥279,863 million (2014: ¥303,825 million) and the total of these non-current assets located in other countries is ¥217,153 million (2014: ¥225,319 million).
3. Other incomeMillions of yen
Note 2015 2014
Dividend income on available-for-sale assets 130 121 Gains on settlements of insurance proceeds 104 610Profit on disposals 1,000 2,051Increase in fair value of investment properties 13 288 —Other 2,407 4,423
3,929 7,205
NOTES TO THE CONSOLIDATED FINANCIAL STATEMENTS CONTINUED

NSG Group Annual Report 2015 37
OverviewOur business
Financial performance
Corporate information
Financial statements
4. Other expensesMillions of yen
Note 2015 2014
Amortization of intangibles 11 (10,935) (10,330) Impairment of property, plant and equipment 12 (593) (1,770) Reversal of prior period impairments of property, plant and equipment 12 988 109Impairment of intangible assets 11 (4) —Impairment of available-for-sale investments 16 (1) (3) Research and development costs expensed in the period (814) (743) Bad debts written back/(written off) (170) 490 Doubtful debt provision increase 15 (686) (1,308) Reversal of previously held doubtful debt provision 15 765 1,115 Float tank repair costs (2) (203) Net foreign exchange on other expense items (197) 92 Decrease in fair value of investment properties 13 (10) (87)Redundancy and restructuring (272) (408)Loss on disposal (81) (763)Others (669) (807)
(12,681) (14,616)
5. Net foreign exchange gains and lossesThe net foreign exchange differences on operating items charged to the income statement in the year amounted to a gain of ¥150 million (2014: a gain of ¥392 million).
6. Exceptional itemsMillions of yen
Note 2015 2014
Exceptional Items (gains):Gain on reclassification of investments 13,349 —Gain on disposal of non-current assets 5,141 —Reversal of impairment of non-current assets 12 518 1,227Gain on dilution of shares in an associate — 2,056Reduction of pension liabilities 26 — 1,098Gain on disposal of available-for-sale assets — 335Others 560 802
19,568 5,518Exceptional Items (losses):Restructuring costs, including employee termination payments (8,922) (15,927)Impairment of investments in associates (2,124) —Settlement of litigation matters (1,337) (572)Loss on dilution of investment in associates (649) —Impairments of non-current assets 10,11,12,16 (560) (2,034)Loss on disposal or scrapping of non-current assets — (240)Others (486) (578)
(14,078) (19,351)5,490 (13,833)
The gain on reclassification of investments relates to the Group’s interests in Shanghai Yaohua Pilkington Glass Group Co., Ltd (SYP). The Group owns a shareholding in SYP of 15.18 percent. Previously the Group has carried this investment in its balance sheet as an affiliated company using the equity method of accounting. Following a decrease in the level of the Group’s management involvement with SYP, the Group is no longer able to exert a significant influence over SYP. IAS 28 “Investments in Associates and Joint Ventures” contains a rebuttable presumption that a shareholding of less than 20 percent does not enable an investor to exert significant influence over an investee. Previously the Group has been able to rebut this presumption due to the level of its management involvement with SYP. As a consequence of this change, the Group is no longer able to rebut this presumption in IAS 28. The Group is therefore required to record its investment in SYP at fair value, and reclassify it as an available-for-sale asset on the Group’s balance sheet. The gain in the table above includes a credit, of ¥926 million, arising on the recycling to the income statement of items relating to SYP previously posted to reserves using the Statement of Comprehensive Income.
The gain on disposal of non-current assets arises mainly on the sale and lease-back of land at Itami City, Hyogo Prefecture, Japan, as announced on 26 September 2014. It also includes gains on disposals of property, plant and equipment no longer in use following the Group’s restructuring program.
NOTES TO THE CONSOLIDATED FINANCIAL STATEMENTS CONTINUED

38 NSG Group Annual Report 2015
6. Exceptional items continuedThe reversal of impairments of non-current assets relates to land located mainly in the UK, which has had its recoverable value re-assessed during the year, following an updated valuation.
The previous-year reversal of impairments of non-current assets relates to assets mainly in Sweden, which have either been given an alternative use elsewhere in the Group, or are anticipated to have an alternative use elsewhere in the Group.
The previous-year gain on dilution of shares in associates, relates to placings of new shares by Shanghai Yaohua Pilkington Glass Group Co., Ltd (China) and Holding Concorde SA (Colombia), an NSG Group affiliate, in which the Group did not participate.
The previous-year reduction in pension liabilities arose at a UK subsidiary, where employees accepted a change to their terms and conditions, whereby pensionable salaries in the subsidiary’s pension scheme were capped at their level on 1 January 2014.
The previous-year gain on disposal of available-for-sale investments related to the disposal of investments in Japan.
Restructuring costs arose in a variety of locations around the world representing the final stages of the Group’s previously announced restructuring program. It also includes the cost of maintaining idle facilities, principally in Europe.
The restructuring costs incurred during the previous year include the costs arising from the Group’s decision to mothball its float line at Cowley Hill, St Helens, UK.
The impairment of investment in associates represents an impairment of the Group’s interests in China Glass Holdings Ltd, following a review of the recoverable value of this investment, using a discount rate of 14.01 per cent.
The settlement of litigation matters for both the current and previous years, relates to claims made by certain of the Group’s Automotive customers in Europe, following the European Commission’s earlier decision to fine the Group for alleged breaches of European competition law.
The loss on dilution of shares in an associate arose following a placing of shares by China Glass Holdings Ltd in which the Group did not participate.
The impairments of non-current assets arising during the year relates to the Group’s Architectural facilities in Japan.
The impairments arising during the previous year mainly related to the Group’s Architectural facilities in Cowley Hill, UK, and Halmstad, Sweden.
The previous-year loss on disposal or scrapping of non-current assets relates to a variety of disposals, principally in China, Japan, and the Philippines.
7. Employee benefit expensesMillions of yen
Note 2015 2014
Wages and salaries (127,144) (124,262)Redundancy and termination benefits (1,261) (3,707)Social security costs (14,523) (13,400)Share options granted to directors and employees 29 (81) (127)Pension costs, excluding those classed as exceptional items defined contribution schemes (8,598) (8,374) defined benefit schemes (2,981) (2,904)Other short-term employee benefits (8,285) (7,911)
(162,873) (160,685)
Key management compensation (included above) comprises:
Millions of yen
2015 2014
Short-term employee benefits (1,150) (1,301)Post-employment benefits (88) (135)Other long-term benefits (132) (60)Termination benefits — (224)Share-based payment (81) (127)
(1,451) (1,847)
NOTES TO THE CONSOLIDATED FINANCIAL STATEMENTS CONTINUED

NSG Group Annual Report 2015 39
OverviewOur business
Financial performance
Corporate information
Financial statements
7. Employee benefit expenses continuedKey management compensation comprises the remuneration of those 30 (2014: 32) key employees who have responsibility for planning, controlling and directing the activities of the Group and includes all the members of the Group’s Executive Board and corporate and senior corporate officers. Included within key management remuneration are post-employment benefits based on the IFRS operating cost charge in respect of service costs.
8. Finance income and expensesMillions of yen
Note2015 2014
(restated)
Finance incomeInterest income 2,093 2,929Foreign exchange transaction gains 108 409
2,201 3,338Finance expensesInterest expense – bank and other borrowings (15,852) (15,724)Dividend on non-equity preference shares due to minority shareholders (278) (274)Foreign exchange transaction losses (31) (88)Other interest and similar charges (1,846) (1,892)
(18,007) (17,978)Unwinding of discounts on provisions 27 (139) (293)Retirement benefit obligations – net finance charge 26 (1,999) (1,923)
(20,145) (20,194)
9. Income tax The analysis of the tax charge for the period is as follows:
Millions of yen
Note2015 2014
(restated)
Current tax charge for the period (3,483) (4,437) adjustment in respect of prior periods (24) (61)
(3,507) (4,498)Deferred tax credit for the period 3,013 1,419 adjustment in respect of prior periods (691) (44) adjustment in respect of rate changes (729) 2,783
19 1,593 4,158(1,914) (340)
The tax charge for the year is calculated as the sum of the total current and deferred tax charge or credit arising in each territory in which the Group operates. The Group's weighted average tax rate (after deducting the Group's share of post-tax profits of joint ventures and associates) is 57.85 percent (2014 restated: 20.93 percent). The tax rate is different to the prior year because of changes in the mix of profits and losses realized by the Group in each of the territories in which it operates and differences in tax rates across each of those territories. A number of countries have changed their corporate income tax rates during the year and any such changes that have been enacted, or substantively enacted, at 31 March 2015 are reflected in the weighted average tax rate. None of these rate changes are significant enough, on their own, to have a material impact on the weighted average tax rate. For reference, the applicable tax rate in Japan is 35.64% (2014: 38.01%) and this consists of corporate income tax, inhabitants' taxes and enterprise tax.
NOTES TO THE CONSOLIDATED FINANCIAL STATEMENTS CONTINUED
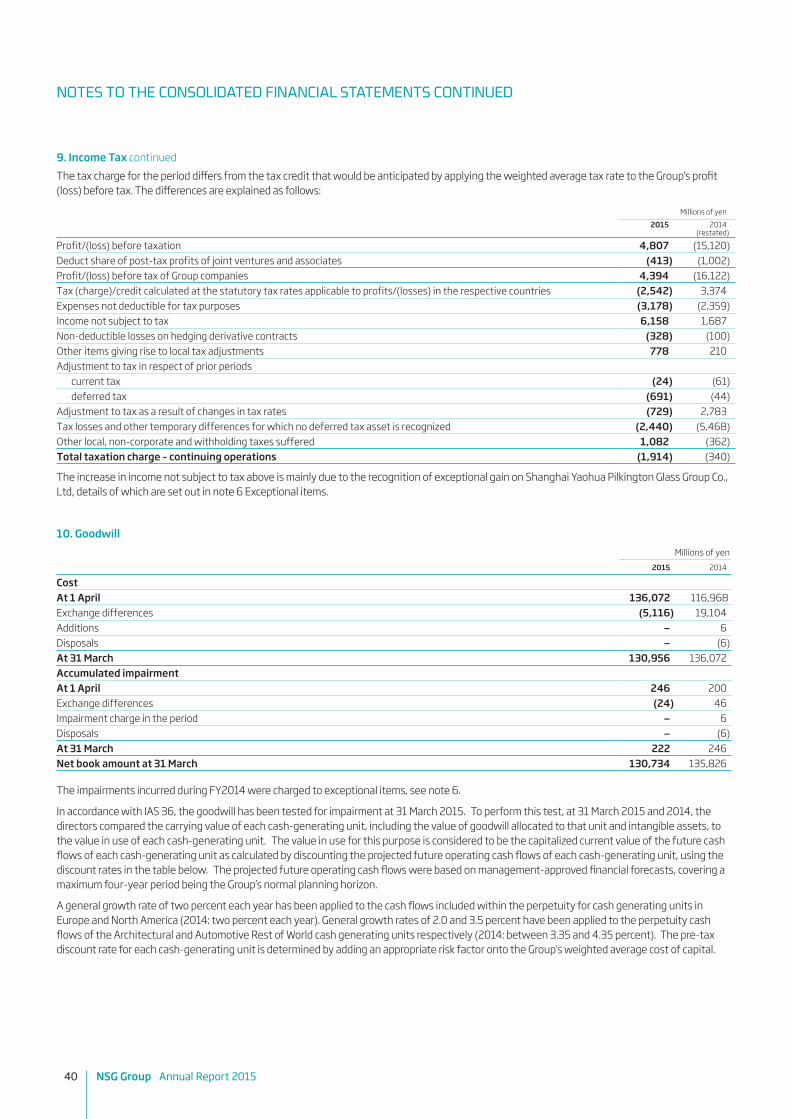
40 NSG Group Annual Report 2015
9. Income Tax continuedThe tax charge for the period differs from the tax credit that would be anticipated by applying the weighted average tax rate to the Group’s profit (loss) before tax. The differences are explained as follows:
Millions of yen
2015 2014(restated)
Profit/(loss) before taxation 4,807 (15,120)Deduct share of post-tax profits of joint ventures and associates (413) (1,002)Profit/(loss) before tax of Group companies 4,394 (16,122)Tax (charge)/credit calculated at the statutory tax rates applicable to profits/(losses) in the respective countries (2,542) 3,374Expenses not deductible for tax purposes (3,178) (2,359)Income not subject to tax 6,158 1,687Non-deductible losses on hedging derivative contracts (328) (100)Other items giving rise to local tax adjustments 778 210Adjustment to tax in respect of prior periods current tax (24) (61) deferred tax (691) (44)Adjustment to tax as a result of changes in tax rates (729) 2,783Tax losses and other temporary differences for which no deferred tax asset is recognized (2,440) (5,468)Other local, non-corporate and withholding taxes suffered 1,082 (362)Total taxation charge – continuing operations (1,914) (340)
The increase in income not subject to tax above is mainly due to the recognition of exceptional gain on Shanghai Yaohua Pilkington Glass Group Co., Ltd, details of which are set out in note 6 Exceptional items.
10. GoodwillMillions of yen
2015 2014
CostAt 1 April 136,072 116,968Exchange differences (5,116) 19,104Additions — 6Disposals — (6)At 31 March 130,956 136,072Accumulated impairmentAt 1 April 246 200Exchange differences (24) 46Impairment charge in the period — 6Disposals — (6)At 31 March 222 246Net book amount at 31 March 130,734 135,826
The impairments incurred during FY2014 were charged to exceptional items, see note 6.
In accordance with IAS 36, the goodwill has been tested for impairment at 31 March 2015. To perform this test, at 31 March 2015 and 2014, the directors compared the carrying value of each cash-generating unit, including the value of goodwill allocated to that unit and intangible assets, to the value in use of each cash-generating unit. The value in use for this purpose is considered to be the capitalized current value of the future cash flows of each cash-generating unit as calculated by discounting the projected future operating cash flows of each cash-generating unit, using the discount rates in the table below. The projected future operating cash flows were based on management-approved financial forecasts, covering a maximum four-year period being the Group’s normal planning horizon.
A general growth rate of two percent each year has been applied to the cash flows included within the perpetuity for cash generating units in Europe and North America (2014: two percent each year). General growth rates of 2.0 and 3.5 percent have been applied to the perpetuity cash flows of the Architectural and Automotive Rest of World cash generating units respectively (2014: between 3.35 and 4.35 percent). The pre-tax discount rate for each cash-generating unit is determined by adding an appropriate risk factor onto the Group’s weighted average cost of capital.
NOTES TO THE CONSOLIDATED FINANCIAL STATEMENTS CONTINUED

NSG Group Annual Report 2015 41
OverviewOur business
Financial performance
Corporate information
Financial statements
10. Goodwill continuedThe goodwill included in the balance sheet with an indefinite useful life has been allocated to cash-generating units as set out in the table below, for the purposes of testing the goodwill for potential impairment.
Millions of yen
2015 2014
Architectural Europe 46,199 48,974Architectural Japan 12 12Architectural North America 9,351 7,775Architectural Rest of World 6,369 5,741Automotive Europe 44,052 48,814Automotive North America 14,707 12,231Automotive Rest of World 8,893 11,033Others 1,151 1,246Total 130,734 135,826
The key assumptions used in this process are as follows:
Assumption Value Period used for discounted cash flow calculations Maximum of four years from the balance sheet date with perpetuity thereafter Perpetuity growth rate 2.0% to 3.5% Pre-tax discount rate used 7.85% to 13.80%
Other key assumptions include glass prices, growth in market volumes, and input prices. Glass prices are projected using current trends and expectations of demand and supply movements in the period covered. Growth in market volumes is estimated with reference to general GDP growth in each territory and specific factors pertaining to the glass industry in that market including for example changes in regulatory environment. Input prices are estimated based on recent negotiations with suppliers and also generally available industry forecasts.
As a result of this test, the directors are satisfied that no goodwill impairment is necessary as at 31 March 2015.
The key sensitivity in the impairment test described above is the selection of the discount rate. If discount rates greater than the rates quoted above were used, there would be a reduction in the headroom for each cash-generating unit.
The cash-generating unit with the least amount of headroom was Automotive Rest of World. An increase in the discount rate of more than 0.2 percent could have resulted in this cash-generating unit not having any residual headroom. Above this level, each additional one percent increase in the discount rate with respect to Automotive Rest of World, would have resulted in an impairment of ¥4,359 million.
The cash-generating unit that would first run out of residual headroom, in response to an increase in the discount rate, is also Automotive Rest of World.
The sensitivities above consider the impact of future increases in discount rates in isolation.
11. Intangible assets Millions of yen
Trademarksand licenses
Development costs
Computer software Other Total
CostAt 1 April 2014 395 14,294 13,755 158,418 186,862Exchange differences (7) 551 (314) (6,678) (6,448)Additions — 1,241 1,097 — 2,338Disposals — — (27) (25) (52)At 31 March 2015 388 16,086 14,511 151,715 182,700Accumulated amortization and impairmentAt 1 April 2014 387 8,090 9,764 81,622 99,863Exchange differences (6) 315 (175) (3,882) (3,748)Amortization charge for the period 3 1,281 929 8,722 10,935Impairment charge in the period — — — 4 4Disposals — — (27) (7) (34)At 31 March 2015 384 9,686 10,491 86,459 107,020Net book amount at 31 March 2015 4 6,400 4,020 65,256 75,680
NOTES TO THE CONSOLIDATED FINANCIAL STATEMENTS CONTINUED
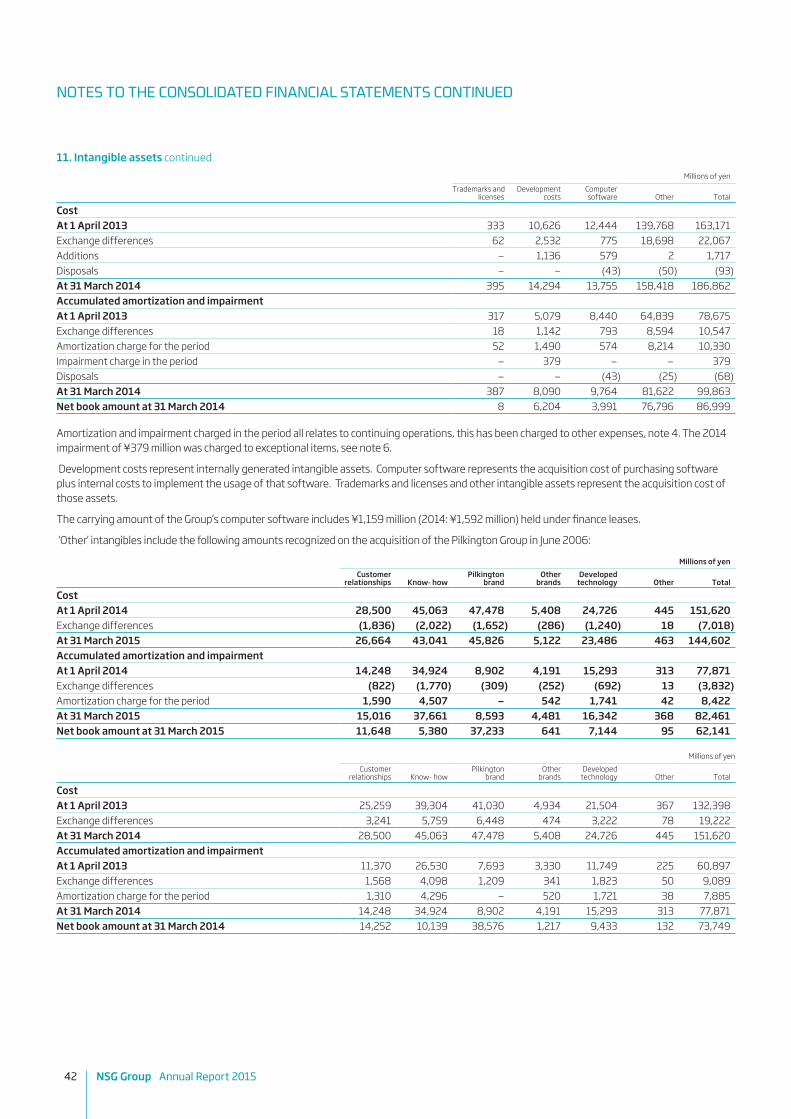
42 NSG Group Annual Report 2015
11. Intangible assets continued Millions of yen
Trademarks and licenses
Development costs
Computer software Other Total
CostAt 1 April 2013 333 10,626 12,444 139,768 163,171 Exchange differences 62 2,532 775 18,698 22,067 Additions — 1,136 579 2 1,717 Disposals — — (43) (50) (93) At 31 March 2014 395 14,294 13,755 158,418 186,862 Accumulated amortization and impairmentAt 1 April 2013 317 5,079 8,440 64,839 78,675 Exchange differences 18 1,142 793 8,594 10,547 Amortization charge for the period 52 1,490 574 8,214 10,330 Impairment charge in the period — 379 — — 379 Disposals — — (43) (25) (68) At 31 March 2014 387 8,090 9,764 81,622 99,863 Net book amount at 31 March 2014 8 6,204 3,991 76,796 86,999
Amortization and impairment charged in the period all relates to continuing operations, this has been charged to other expenses, note 4. The 2014 impairment of ¥379 million was charged to exceptional items, see note 6.
Development costs represent internally generated intangible assets. Computer software represents the acquisition cost of purchasing software plus internal costs to implement the usage of that software. Trademarks and licenses and other intangible assets represent the acquisition cost of those assets.
The carrying amount of the Group’s computer software includes ¥1,159 million (2014: ¥1,592 million) held under finance leases.
‘Other’ intangibles include the following amounts recognized on the acquisition of the Pilkington Group in June 2006:
Millions of yenCustomer
relationships Know- how Pilkington
brand Other
brands Developed
technology Other Total
CostAt 1 April 2014 28,500 45,063 47,478 5,408 24,726 445 151,620Exchange differences (1,836) (2,022) (1,652) (286) (1,240) 18 (7,018)At 31 March 2015 26,664 43,041 45,826 5,122 23,486 463 144,602Accumulated amortization and impairmentAt 1 April 2014 14,248 34,924 8,902 4,191 15,293 313 77,871Exchange differences (822) (1,770) (309) (252) (692) 13 (3,832)Amortization charge for the period 1,590 4,507 — 542 1,741 42 8,422At 31 March 2015 15,016 37,661 8,593 4,481 16,342 368 82,461Net book amount at 31 March 2015 11,648 5,380 37,233 641 7,144 95 62,141
Millions of yenCustomer
relationships Know- how Pilkington
brand Other
brands Developed
technology Other Total
CostAt 1 April 2013 25,259 39,304 41,030 4,934 21,504 367 132,398Exchange differences 3,241 5,759 6,448 474 3,222 78 19,222At 31 March 2014 28,500 45,063 47,478 5,408 24,726 445 151,620Accumulated amortization and impairmentAt 1 April 2013 11,370 26,530 7,693 3,330 11,749 225 60,897Exchange differences 1,568 4,098 1,209 341 1,823 50 9,089Amortization charge for the period 1,310 4,296 — 520 1,721 38 7,885At 31 March 2014 14,248 34,924 8,902 4,191 15,293 313 77,871Net book amount at 31 March 2014 14,252 10,139 38,576 1,217 9,433 132 73,749
NOTES TO THE CONSOLIDATED FINANCIAL STATEMENTS CONTINUED

NSG Group Annual Report 2015 43
OverviewOur business
Financial performance
Corporate information
Financial statements
11. Intangible assets continuedIn addition to the other intangible assets recognized on the acquisition of the Pilkington Group, the Group also has intangible assets relating to customer relationships recognized on smaller acquisitions and other intangible assets, amounting to ¥3,115 million (2014: ¥3,047 million). Amortization charged in the period on these other intangible assets amounted to ¥300 million (2014: ¥329 million) and impairments on these other intangible assets amounts to ¥4 million (2014: ¥nil million).
The Pilkington Brand has been assigned an indefinite useful life and is therefore not subject to routine amortization. This brand has a long history in an established industry, with a significant share of the worldwide glass market. These factors, together with the scale of the business, contribute to the brand’s durability. The Group intends to use the Pilkington brand indefinitely. All other intangible assets have finite lives, as set out in note 1.1.
The Pilkington Brand included in the intangible assets on the balance sheet has been allocated to cash generating units as set out in the table below, for the purposes of testing for potential impairment. The testing has been carried out as part of the exercise to test goodwill for potential impairment. See note 10, goodwill, for details of the assumptions used in this testing.
Millions of yen
2015 2014
Architectural Europe 17,583 19,114Architectural North America 3,737 3,201Automotive Europe 9,047 9,840Automotive North America 5,272 4,516Automotive Rest of World 1,594 1,905Total 37,233 38,576
12. Property, plant and equipment Millions of yen
Land and buildings
Plant, equipment
and vehicles Total
CostAt 1 April 2014 189,056 542,130 731,186Exchange differences (65) 6,490 6,425Transferred to assets held for sale (5,638) (1,435) (7,073)Acquisition of businesses 295 140 435Disposal of businesses — (415) (415)Additions 3,276 30,944 34,220Disposals (4,440) (8,972) (13,412)At 31 March 2015 182,484 568,882 751,366Accumulated depreciation and impairmentAt 1 April 2014 96,052 345,745 441,797Exchange differences 807 2,612 3,419Disposal of businesses — (326) (326)Charge for the period 3,372 27,406 30,778Impairment losses arising in the period 374 779 1,153Reversal of impairment losses from prior periods (538) (968) (1,506)Transferred to assets held for sale (4,048) (1,031) (5,079)Eliminated on disposals (3,684) (8,715) (12,399)At 31 March 2015 92,335 365,502 457,837Net book amount at 31 March 2015 90,149 203,380 293,529
NOTES TO THE CONSOLIDATED FINANCIAL STATEMENTS CONTINUED

44 NSG Group Annual Report 2015
12. Property, plant and equipment continued Millions of yen
Land and buildings
Plant, equipment
and vehicles Total
CostAt 1 April 2013 184,283 479,384 663,667Exchange differences 9,860 46,725 56,585Transferred to assets held for sale (2,154) (199) (2,353)Additions 2,959 26,894 29,853Disposals (5,892) (10,674) (16,566)At 31 March 2014 189,056 542,130 731,186Accumulated depreciation and impairmentAt 1 April 2013 92,425 303,259 395,684Exchange differences 2,106 26,541 28,647Charge for the period 3,553 26,528 30,081Impairment losses arising in the period 2,299 985 3,284Reversal of impairment losses from prior periods (306) (1,030) (1,336)Transferred to assets held for sale (462) (235) (697)Eliminated on disposals (3,563) (10,303) (13,866)At 31 March 2014 96,052 345,745 441,797Net book amount at 31 March 2014 93,004 196,385 289,389
The carrying amount of the Group’s land and buildings includes ¥1,309 million (2014: ¥1,308 million) and the Group’s plant, equipment and vehicles includes ¥295 million (2014: ¥398 million) in respect of assets held under finance leases.
Land and buildings includes assets with a carrying amount of ¥1,218 million (2014: ¥1,334 million), and plant and machinery with a carrying amount of ¥5,724 million (2014: ¥3,682 million), are subject to specific charges to secure Group borrowings.
Of the additions in the period, ¥48 million were financed by new finance leases (2014: ¥98 million).
Capitalized borrowing costs have been included within additions of plant and equipment additions ¥102 million (2014: ¥164 million). The average rate used to calculate borrowing costs capitalized during the year was 4.05% (2014: 3.57%)
Depreciation charged in the period all relates to continuing operations, this has been charged to cost of sales ¥26,443 million (2014: ¥25,905 million), distribution costs ¥1,693 million (2014: ¥1,649 million), administrative expenses ¥1,928 million (2014: ¥1,964 million), and exceptional items of ¥714 million (2014: ¥563 million)
Impairments in the period have been charged to exceptional items ¥560 million (2014: ¥1,514 million), note 6, and other expenses ¥593 million (2014: ¥1,770 million), note 4. The reversal of previous period impairments have been credited to exceptional items ¥518 million (2014: ¥1,227 million), note 6, and other expenses ¥988 million (2014: ¥109 million), note 4.
Property, plant and equipment includes ¥2,493 million (2014: ¥1,191 million) in respect of assets in the course of construction.
13. Investment property Millions of yen
Note 2015 2014
Fair valueAt 1 April 644 635Exchange differences (55) 96Net increase/(decrease) in fair value 3, 4 278 (87)At 31 March 867 644
Investment property principally comprises land, office buildings and small industrial units, and those parts of other properties not occupied by the Group, which are held for long-term rental yields. Investment properties are initially recognized at cost and are thereafter carried at fair value, representing open-market value determined annually by discounted cash flows or by the use of external valuers. Changes in fair value are recorded in the income statement as part of other income and other expenses.
The property rental income earned by the Group from its investment properties, all of which are leased out under operating leases, amounted to ¥254 million (2014: ¥222 million). Direct operating expenses arising on the investment properties in the period amounted to ¥156 million (2014: ¥154 million).
The Group has no restrictions on the realizability of its investment properties and there were no commitments at 31 March 2015 or 2014.
Fair value measurement disclosures for investment properties are provided in note 18.
NOTES TO THE CONSOLIDATED FINANCIAL STATEMENTS CONTINUED

NSG Group Annual Report 2015 45
OverviewOur business
Financial performance
Corporate information
Financial statements
14. Investments accounted for using the equity method
Joint venturesThe Group’s interests in its material joint ventures, all of which are unlisted, are as follows: Name
Proportion of issued ordinary shares held
Country of operation and incorporation Principal activity
Cebrace Cristal Plano Limitada (Cebrace) 50% Brazil Glass manufacturingSP Glass Holdings BV 50% Russia/Netherlands Glass manufacturingJiangsu Pilkington SYP Glass Co., Ltd 50% China Glass manufacturing
There were no material additions to joint ventures in the period-ended 31 March 2015 (31 March 2014 – none).
The Group has legal ownership of 50 percent of the issued share capital of SP Glass Holdings BV, but, due to the existence of call options held by one of the Group’s joint venture partners over part of the Group’s shareholding, the Group accounts for this investment using a beneficial shareholding percentage of 35 percent.
Jiangsu Pilkington SYP Glass Co., Ltd is a 50 percent joint venture with Shanghai Yaohua Pilkington Glass Group Co., Ltd. In addition, Pilkington International Holdings BV, a subsidiary of the Group, holds a 15.1841 percent interest in Shanghai Yaohua Pilkington Glass Group Co., Ltd. Therefore, the Group’s proportionate economic interest in the entity is 57.59 percent.
Of the joint ventures above, Cebrace and Jiangsu Pilkington SYP Glass Co., Ltd report to an accounting date coterminous with that of the Group, but SP Glass Holdings BV reports to 31 December, being its local statutory accounting date.
The balance sheet values of the Group’s material joint ventures are as follows:
Millions of yen
2015
CebraceSP Glass
Holdings BV
Jiangsu Pilkington SYP Glass
Co., Ltd Others Total
Current assets 14,418 2,900 5,256 705 23,279Non-current assets 41,461 15,276 10,429 487 67,653Current liabilities (22,695) (3,170) (5,194) (58) (31,117)Non-current liabilities (13,274) (6,613) (7,170) (98) (27,155)Total equity 19,910 8,393 3,321 1,036 32,660NSG Group interest in total equity 9,955 2,937 1,661 315 14,868Goodwill — 3,190 — — 3,190Impairments — (1,153) — — (1,153)Carrying amount of the Group’s investment 9,955 4,974 1,661 315 16,905
The total equity above includes: Cash and cash equivalents 881 820 120 560 2,381Current financial liabilities (15,117) (1,141) (622) — (16,880)Non-current financial liabilities (4,432) (6,396) (7,170) (2) (18,000)
Millions of yen
2014
CebraceSP Glass
Holdings BV
Jiangsu Pilkington SYP Glass
Co., Ltd Others Total
Current assets 12,962 5,541 4,455 1,699 24,657Non-current assets 53,908 25,316 10,003 5,907 95,134Current liabilities (19,846) (4,270) (7,988) (963) (33,067)Non-current liabilities (22,421) (7,402) (2,992) (100) (32,915)Total equity 24,603 19,185 3,478 6,543 53,809NSG Group interest in total equity 12,302 6,715 1,739 2,765 23,521Goodwill — 3,470 — — 3,470Impairments — (1,108) — — (1,108)Carrying amount of the Group’s investment 12,302 9,077 1,739 2,765 25,883
The total equity above includes: Cash and cash equivalents 1,065 1,542 678 203 3,488Current financial liabilities (11,448) (1,119) (3,832) — (16,399)Non-current financial liabilities (13,009) (6,288) (2,992) (2) (22,291)
NOTES TO THE CONSOLIDATED FINANCIAL STATEMENTS CONTINUED

46 NSG Group Annual Report 2015
14. Investments accounted for using the equity method continued The Group considers that for all joint ventures accounted for using the equity method the balance sheet value approximates the fair value of the Group’s investment. Current and non-current financial liabilities exclude trade and other payables as well as provisions.
The Group has no unrecognized commitments, relating to any of its joint ventures, which would result in a future outflow of economic resources from the Group.
The key income statement and comprehensive income figures of the Group’s material joint ventures are as follows:
Millions of yen
2015
CebraceSP Glass
Holdings BV
Jiangsu Pilkington SYP Glass
Co., Ltd Others Total
Revenue 55,637 16,159 6,837 2,584 81,217Profit/(loss) for the period from continuing operations 5,404 (4,664) (701) (571) (532)Other comprehensive income — (5,254) — (6) (5,260)Total comprehensive income 5,404 (9,918) (701) (577) (5,792)NSG Group’s share of profit/(loss) for the period 2,702 (1,632) (350) (246) 474Dividends received by NSG Group 2,868 — — — 2,868
The profit/(loss) for the period includes the following: Depreciation and amortization (4,821) (1,754) (1,195) (14) (7,784)Interest expense (2,377) (3,326) (340) (43) (6,086)Taxation (1,542) (19) — — (1,561)
Millions of yen
2014
CebraceSP Glass
Holdings BV
Jiangsu Pilkington SYP Glass
Co., Ltd Others Total
Revenue 53,837 20,125 6,955 1,666 82,583Profit/(loss) for the period from continuing operations 5,147 (1,708) (305) (516) 2,618Other comprehensive income — 190 — (58) 132Total comprehensive income 5,147 (1,518) (305) (574) 2,750NSG Group’s share of profit/(loss) for the period 2,574 (598) (153) (221) 1,602Dividends received by NSG Group 3,089 — — 1 3,090
The profit/(loss) for the period includes the following:Depreciation and amortization (4,727) (1,599) (1,114) (5) (7,445)Interest expense (2,768) (923) (399) (20) (4,110)Taxation (2,655) 87 — — (2,568)
AssociatesThe Group’s interest in its material associates, all of which are unlisted, except for China Glass Holdings Ltd, is as follows:
Name
Proportion of issued ordinary shares held at 31 March
2015Country of operation and
incorporation Principal activity
Flachglas Wernberg GmbH 49% Germany Glass manufacturing and processingChina Glass Holdings Ltd 21.55% China/Bermuda Glass manufacturing and processingHolding Concorde SA 23.8% Columbia Glass manufacturing and processing
During the year to 31 March 2015, the Group’s investment in Shanghai Yaohua Pilkington Glass Group Co., Ltd (SYP) was reclassified as an available-for-sale asset (See note 6 – exceptional items). In addition, the Group’s associated entity, China Glass Holdings Ltd issued a placing of new shares in which the Group did not participate. As a result, the Group’s shareholding reduced to 21.55 per cent (2014: 25.17 per cent).
In respect of the year ended 31 March 2014: on 30 December 2013, Shanghai Yaohua Pilkington Glass Group Co., Ltd, issued a placing of new shares in which the Group did not participate. As a result, the Group’s shareholding in this entity reduced to 15.18 percent. The new interest percentage was applied to the Group’s share of net assets at the end of the period. On 26 March 2014, the Group’s associated entity in Colombia, Holding Concorde SA, also issued a placing of new shares in which the Group did not participate. As a result, the Group’s shareholding reduced to 23.8 percent. The Group also has a minority interest shareholding in a subsidiary of Holding Concorde SA, resulting in an effective economic interest of 25.03 percent (2014: 24.98 percent) in the consolidated net assets of Holding Concorde SA at the balance sheet date.
NOTES TO THE CONSOLIDATED FINANCIAL STATEMENTS CONTINUED

NSG Group Annual Report 2015 47
OverviewOur business
Financial performance
Corporate information
Financial statements
14. Investments accounted for using the equity method continued The accounting date for each of the associates listed above, is 31 December, the date to which each draws up its annual accounts. Holding Concorde SA previously reported to 31 March. Therefore the Group’s results for the period include only nine months for Concorde Holding, being 1 April 2014 to 31 December 2014.
The balance sheet values of the Group’s material associates are as follows:
Millions of yen
2015Flachglas
Wernberg GmbH
China Glass Holdings
LtdHolding
Concorde SA Others Total
Current assets 4,753 44,081 3,892 3,940 56,666Non-current assets 6,235 75,718 20,487 3,973 106,413Current liabilities (2,663) (54,315) (5,427) (2,760) (65,165)Non-current liabilities (4,052) (19,634) (7,453) (1,799) (32,938)Total equity 4,273 45,850 11,499 3,354 64,976NSG Group interest in total equity 2,094 9,880 2,878 1,044 15,896Goodwill — 3,112 — — 3,112Impairments — (5,385) — — (5,385)Carrying amount of the Group’s investment 2,094 7,607 2,878 1,044 13,623
Millions of yen
2014
Shanghai Yaohua Pilkington Glass
Group Co., Ltd
Flachglas Wernberg
GmbH
China Glass Holdings
Ltd
Holding
Concorde SA Others Total
Current assets 44,648 4,921 25,500 3,691 4,662 83,422Non-current assets 59,730 7,269 65,795 23,411 4,542 160,747Current liabilities (29,912) (4,187) (46,793) (4,703) (3,412) (89,007)Non-current liabilities (21,407) (3,345) (8,548) (8,611) (1,940) (43,851)Total equity 53,059 4,658 35,954 13,788 3,852 111,311NSG Group interest in total equity 8,057 2,283 9,050 3,444 1,306 24,140Goodwill — — 2,645 — — 2,645Impairments — — (2,598) — — (2,598)Carrying amount of the Group’s investment 8,057 2,283 9,097 3,444 1,306 24,187
The Group considers that for all associates accounted for using the equity method, the balance sheet value is approximately equal to the fair value, or, following an impairment, the recoverable value of the Group’s investment, based on value-in-use, is at least equal to the balance sheet value.
The key income statement and comprehensive income figures of the Group’s material associates are as follows:
Millions of yen
2015Shanghai Yaohua
Pilkington Glass Group Co., Ltd*
Flachglas Wernberg
GmbH
China Glass Holdings
LtdHolding
Concorde SA Others Total
Revenue 18,379 19,350 44,106 7,629 13,886 103,350Profit/(loss) for the period from continuing operations 544 251 32 (1,573) 297 (449)Other comprehensive income — (53) (5) 622 — 564Total comprehensive income 544 198 27 (951) 297 115NSG Group’s share of profit/(loss) for the period 83 123 8 (374) 99 (61)Dividends received by NSG Group 15 102 54 — 92 263*Data prior to transfer to available-for-sale investments, see note 6.
Millions of yen
2014Shanghai Yaohua
Pilkington Glass Group Co., Ltd
Flachglas Wernberg
GmbH
China Glass Holdings
LtdHolding
Concorde SA Others Total
Revenue 32,279 19,009 45,108 8,069 16,414 120,879Profit/(loss) for the period from continuing operations 1,917 309 1,334 (3,277) 394 677Other comprehensive income — — (3) 914 — 911Total comprehensive income 1,917 309 1,331 (2,363) 394 1,588NSG Group’s share of profit/(loss) for the period 372 151 336 (1,606) 147 (600)Dividends received by NSG Group 52 — — — 57 109
NOTES TO THE CONSOLIDATED FINANCIAL STATEMENTS CONTINUED

48 NSG Group Annual Report 2015
15. Trade and other receivablesMillions of yen
Note 2015 2014
Trade receivables 55,130 74,294Less provision for impairment of receivables (3,829) (4,331) Trade receivables – net 51,301 69,963 Amounts due from customers for contract work 21 1,772 966 Amounts owed by related parties (trading) 38 2,141 2,142 Loans to related parties 38 9,157 8,095 Other receivables 26,624 22,790 Prepayments and accrued income 4,671 4,182
95,666 108,138 Current 79,010 92,523 Non-current 16,656 15,615
95,666 108,138
The directors consider that the carrying amount of trade and other receivables approximates to their fair value.
There is no particular concentration of credit risk relating to Architectural, Automotive AGR, or Technical Glass balances, as these operations have a large number of customers. There is, however, a concentration of credit risk within the Automotive OE balances where the Group is supplying automotive manufacturers worldwide. The Automotive OE business customers constitute the majority of the major global car manufacturers. Due to the nature of the industry with a relatively small number of large customers, there is therefore a higher credit risk concentration. Total amounts owed by Automotive OE customers, net of related provisions, were ¥18,318 million (2014: ¥23,306 million). This risk is managed through the monitoring of aged receivables, analysis of the cost effectiveness of insuring receivables and through general credit collection procedures.
Receivable balances are impaired on a case by case basis when there is evidence to suggest that the value may not be collectable. Overdue balances may not be impaired when there is good reason to expect that the receivable would still be collected.
As at 31 March 2015, trade receivables at nominal value of ¥3,829 million, (2014: ¥4,331 million) were impaired and fully provided for. Movements in the provision for impairment of receivables were as follows:
Millions of yen
Note 2015 2014
At 1 April (4,331) (4,903) Exchange differences 130 (555) Charge for the period 4 (686) (1,308) Unused amounts reversed 4 765 1,115 Utilized 293 1,320 At 31 March (3,829) (4,331)
As at 31 March, the ageing analysis of current trade and other receivables (excluding prepayments and accrued income) is below. All non-current trade and other receivables (excluding prepayments and accrued income) is considered neither past due nor impaired.
Millions of yen
Past due but not impaired
Total
Neither past due nor
impaired
Less than 3 months
overdue
Between 3 and 6 months
overdue
Between 6 and 12 months
overdue
More than 12 months
overdue
2015 75,861 69,707 3,266 903 315 1,6702014 88,870 83,068 3,140 1,093 1,046 523
NOTES TO THE CONSOLIDATED FINANCIAL STATEMENTS CONTINUED

NSG Group Annual Report 2015 49
OverviewOur business
Financial performance
Corporate information
Financial statements
16. Available-for-sale investmentsMillions of yen
Note 2015 2014
At 1 April 6,837 7,394Exchange differences 3,325 799Acquisitions 10 16Transferred from investments accounted for using the equity method 20,955 —Transferred from former subsidiaries — 29Disposals (182) (1,413)Impairment in the period to the income statement 4, 6 (1) (4)Revaluation surplus transferred to equity 33 929 16At 31 March 31,873 6,837Current 3 94Non-current 31,870 6,743
31,873 6,837
The transfer from investments accounted for using the equity method mainly relates to the Group’s investment in Shanghai Yaohua Pilkington Glass Group Co., Ltd, see note 6.
The disposal in the period ended 31 March 2015 relates mainly to the sale of various bonds (2014: relates to the sale of unlisted shares). Impairments in the period have been charged to exceptional items ¥nil million (2014: ¥1 million), note 6, and other expenses ¥1 million (2014: ¥3 million), note 4.
Available-for-sale financial assets include the following:
Millions of yen
2015 2014
UK Government gilts 3,941 3,539 Listed equities 24,672 161 Unlisted shares 2,714 2,481 Bond funds 303 498 Other 243 158
31,873 6,837
Fair value measurement disclosures for available-for-sale investments are provided in note 18.
17. Derivative financial instrumentsMillions of yen
2015 2014
Assets Liabilities Assets Liabilities
Interest rate swaps not qualifying as hedges — 203 — 198 cash flow hedges 17 1,163 58 930Forward foreign exchange contracts not qualifying as hedges 32 33 123 10 cash flow hedges 194 110 140 203 net investment hedges 628 902 151 625Energy hedges cash flow hedges 86 3,206 1,855 1,544
957 5,617 2,327 3,510Current 882 3,090 1,434 1,514Non-current 75 2,527 893 1,996
957 5,617 2,327 3,510Maturity within one year 882 3,090 1,434 1,514 between one and two years 53 1,456 491 666 between two and three years 22 897 246 1,123 between three and four years — 160 137 169 over four years — 14 19 38
957 5,617 2,327 3,510
Of the above financial instruments, gross cash flows are exchanged for forward foreign exchange contracts only. The contractual liabilities are ¥129,325 million (2014: ¥114,220 million), falling due within one year.
NOTES TO THE CONSOLIDATED FINANCIAL STATEMENTS CONTINUED
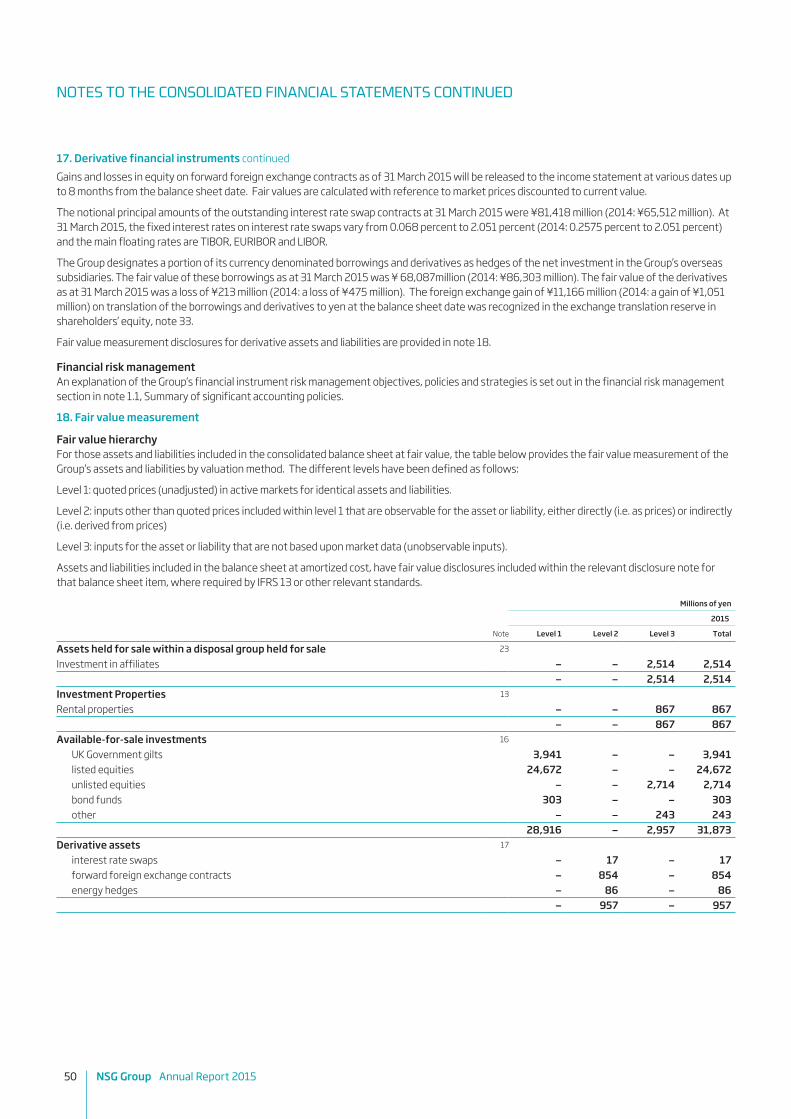
50 NSG Group Annual Report 2015
17. Derivative financial instruments continuedGains and losses in equity on forward foreign exchange contracts as of 31 March 2015 will be released to the income statement at various dates up to 8 months from the balance sheet date. Fair values are calculated with reference to market prices discounted to current value.
The notional principal amounts of the outstanding interest rate swap contracts at 31 March 2015 were ¥81,418 million (2014: ¥65,512 million). At 31 March 2015, the fixed interest rates on interest rate swaps vary from 0.068 percent to 2.051 percent (2014: 0.2575 percent to 2.051 percent) and the main floating rates are TIBOR, EURIBOR and LIBOR.
The Group designates a portion of its currency denominated borrowings and derivatives as hedges of the net investment in the Group’s overseas subsidiaries. The fair value of these borrowings as at 31 March 2015 was ¥ 68,087million (2014: ¥86,303 million). The fair value of the derivatives as at 31 March 2015 was a loss of ¥213 million (2014: a loss of ¥475 million). The foreign exchange gain of ¥11,166 million (2014: a gain of ¥1,051 million) on translation of the borrowings and derivatives to yen at the balance sheet date was recognized in the exchange translation reserve in shareholders’ equity, note 33.
Fair value measurement disclosures for derivative assets and liabilities are provided in note 18.
Financial risk managementAn explanation of the Group’s financial instrument risk management objectives, policies and strategies is set out in the financial risk management section in note 1.1, Summary of significant accounting policies.
18. Fair value measurement
Fair value hierarchyFor those assets and liabilities included in the consolidated balance sheet at fair value, the table below provides the fair value measurement of the Group’s assets and liabilities by valuation method. The different levels have been defined as follows:
Level 1: quoted prices (unadjusted) in active markets for identical assets and liabilities.
Level 2: inputs other than quoted prices included within level 1 that are observable for the asset or liability, either directly (i.e. as prices) or indirectly (i.e. derived from prices)
Level 3: inputs for the asset or liability that are not based upon market data (unobservable inputs).
Assets and liabilities included in the balance sheet at amortized cost, have fair value disclosures included within the relevant disclosure note for that balance sheet item, where required by IFRS 13 or other relevant standards.
Millions of yen
2015
Note Level 1 Level 2 Level 3 Total
Assets held for sale within a disposal group held for sale 23
Investment in affiliates — — 2,514 2,514— — 2,514 2,514
Investment Properties 13
Rental properties — — 867 867— — 867 867
Available-for-sale investments 16
UK Government gilts 3,941 — — 3,941 listed equities 24,672 — — 24,672 unlisted equities — — 2,714 2,714 bond funds 303 — — 303 other — — 243 243
28,916 — 2,957 31,873Derivative assets 17
interest rate swaps — 17 — 17 forward foreign exchange contracts — 854 — 854 energy hedges — 86 — 86
— 957 — 957
NOTES TO THE CONSOLIDATED FINANCIAL STATEMENTS CONTINUED

NSG Group Annual Report 2015 51
OverviewOur business
Financial performance
Corporate information
Financial statements
18. Fair value measurement continued Millions of yen
2014
Note Level 1 Level 2 Level 3 Total
Investment Properties 13
Rental properties — — 644 644— — 644 644
Available-for-sale investments 16
UK Government gilts 3,539 — — 3,539 listed equities 161 — — 161 unlisted equities — — 2,481 2,481 bond funds 498 — — 498 other — — 158 158
4,198 — 2,639 6,837Derivative assets 17
interest rate swaps — 58 — 58 forward foreign exchange contracts — 414 — 414 energy hedges — 1,855 — 1,855
— 2,327 — 2,327
Millions of yen
2015
Note Level 1 Level 2 Level 3 Total
Derivative liabilities 17
interest rate swaps — 1,366 — 1,366 forward foreign exchange contracts — 1,045 — 1,045 energy hedges — 3,206 — 3,206
— 5,617 — 5,617
Millions of yen
2014
Note Level 1 Level 2 Level 3 Total
Derivative liabilities 17
interest rate swaps — 1,128 — 1,128forward foreign exchange contracts — 838 — 838energy hedges — 1,544 — 1,544
— 3,510 — 3,510
Assets held for sale within a disposal group held for saleInvestments in affiliates classified as held for sale are valued at expected sales proceeds less cost to sell. Other assets classified as held for sale are valued at cost, being lower than fair value.
Investment propertiesInvestment properties are valued either by reference to future expected rental receipts or by reference to a recently obtained valuation prepared by a qualified valuation professional. Gains or losses arising on the fair value of investment properties are recognized in operating profit, see note 13. The sensitivity of the fair value of investment properties is subject to rental yields and fluctuation of property prices in the relevant markets.
Available-for-sale investmentsUK government gilts, listed equities, and bond funds are valued based on quoted market prices obtained by the Group at the balance sheet date. Unlisted equities and other available-for-sale investments are valued using a variety of different techniques including future projected cash flows and net asset values of the underlying investments. Those classified in level 3 of the fair value hierarchy are subject to a variety of sensitivities and, as these investments comprise mainly Japanese trading companies, economic growth projections in Japan are the main sensitivity influencing the valuation. The Group has not quantified the impact of the change in GDP growth rates for these investments, included within level 3, as any reasonable movement would not have a material impact.
Gains and losses arising on the fair value of available-for-sale investments are posted either to operating profit or are recognized directly within the statement of comprehensive income, depending on the nature of the change in the fair value, see note 16.
NOTES TO THE CONSOLIDATED FINANCIAL STATEMENTS CONTINUED

52 NSG Group Annual Report 2015
18. Fair value measurement continued
DerivativesThe fair values of foreign exchange contracts are determined using forward exchange market rates at the balance sheet date. The fair values of interest rate swaps are calculated as the present value of the estimated future cash flows based on observable yield curves at the balance sheet date. The fair values of commodity hedges are determined by using forward market prices at the balance sheet date.
Gains and losses arising on the fair value of net derivative assets and liabilities have been recognized as follows. A gain of ¥13 million was recognized in operating profit (2014: loss of ¥50 million). A loss of ¥3,479 million was recognized directly in the statement of comprehensive income (2014: loss of ¥344 million).
Transfers between levelsThe Group determines whether a transfer between levels in the hierarchy has occurred by reassessing categorization at the end of each reporting period. During the periods ended 31 March 2015 and 2014, there were no transfers between Level 1 and Level 2 fair value measurements.
There have been no changes in the valuation techniques in either the current or prior year.
A reconciliation of movements in available-for-sale investments included in the above hierarchy based on level 3 valuation techniques is as follows:
Millions of yen
2015 2014
At 1 April 2,639 3,293Acquisitions — 29Transferred from investments accounted for using the equity method 104 —Disposals (6) (742)Movements in fair value recognized in comprehensive income 236 38Exchange differences recognized in other comprehensive income (16) 21At 31 March 2,957 2,639
Management have assessed that cash and short-term deposits, trade receivables, trade payables, bank overdrafts and other current liabilities approximate their carrying amounts largely due to the short-term maturity of these instruments.
19. Deferred income taxMillions of yen
2015 2014(restated)
Deferred tax assets 62,072 51,980Deferred tax liabilities (20,700) (23,190)Net deferred tax asset 41,372 28,790
The movement for the period in the net deferred tax asset is as follows:
Millions of yen
Note2015 2014
(restated)
At 1 April 28,790 24,151Exchange differences 5,046 2,858Credit to the income statement for the period 9 1,593 4,158Deferred tax transferred to assets held for sale (421) 301Deferred tax of former subsidiaries — (5)Credit/(charge) to other comprehensive income for the period 6,364 (2,673)At 31 March 41,372 28,790
The credit of ¥6,364 (2014 restated: ¥2,673 charge) to other comprehensive income in the year comprises a credit to the hedging reserve of ¥1,261 million (2014: a credit ¥456 million), note 33, and a charge to the fair value reserve of ¥134 million (2014: a credit of ¥248 million). The company also has a credit to other comprehensive income in respect of retirement benefit obligations in retained earnings of ¥5,237 million (2014: a charge of ¥3,377 million), note 26.
NOTES TO THE CONSOLIDATED FINANCIAL STATEMENTS CONTINUED

NSG Group Annual Report 2015 53
OverviewOur business
Financial performance
Corporate information
Financial statements
19. Deferred income tax continuedThe following movement in the Group’s deferred tax assets and liabilities took place during the periods ended 31 March 2015 and 31 March 2014:
Millions of yen
Note
Property, plant and
equipment Tax losses Fair value
losses
Defined benefit
obligations Provisions Other Total
Deferred tax assetsAt 1 April 2014 (restated) 4,034 27,863 442 17,123 8,696 6,598 64,756Exchange differences 146 1,935 (36) 1,552 458 11 4,066(Charge)/credit to the income statement in the period 9 (1,504) 925 (1) (1,164) (358) 211 (1,891)
Charge to assets held for sale (67) — — — — — (67)Credit to other comprehensive income for the period — — — 5,237 71 920 6,228Gross deferred tax assets 2,609 30,723 405 22,748 8,867 7,740 73,092Offset of deferred tax assets and liabilities relating to income taxes levied by the same taxation authority
— (4,506) (404) (2,463) (952) (2,695) (11,020)
At 31 March 2015 2,609 26,217 1 20,285 7,915 5,045 62,072
Millions of yen
Note
Property, plant and
equipment Tax losses Fair value
losses
Defined benefit
obligations Provisions Other Total
Deferred tax assetsAt 1 April 2013 (restated) 3,444 24,072 414 18,204 8,002 6,681 60,817Exchange differences 427 2,840 43 2,739 27 840 6,916Credit/(charge) to the income statement in the period 9 163 951 (15) (443) 632 (1,381) (93)Deferred tax of former subsidiaries — — — — (5) — (5)Charge to assets held for sale — — — — (24) (6) (30)(Charge)/credit to other comprehensive income for the period — — — (3,377) 64 464 (2,849)Gross deferred tax assets 4,034 27,863 442 17,123 8,696 6,598 64,756Offset of deferred tax assets and liabilities relating to income taxes levied by the same taxation authority (20) (7,142) (440) (485) (4,429) (260) (12,776)At 31 March 2014 (restated) 4,014 20,721 2 16,638 4,267 6,338 51,980
The Group assesses its ability to utilize tax losses in future periods based on management-approved financial forecasts. This takes account of the Group’s medium and long-term strategic and financial plans and the expected future economic outlook. The ability to utilize tax losses in future periods also takes account of material tax adjusting items and the period (if any) in which tax losses might expire under local tax laws. The Group’s ability to utilize its tax losses is re-assessed annually.
At 31 March 2015, the Group has tax losses which it is able to carry forward of ¥241,616 million (2014: ¥220,532 million), in respect of which it is recognizing a deferred tax asset of ¥30,723 million (2014: ¥27,863 million).
A significant part of this deferred tax asset arises in the USA and a deferred tax asset of ¥16,342 million (2014: ¥14,943 million) has been recognized based on management-approved financial forecasts and taking into account the date of expiry of tax losses under US tax laws.
A deferred tax asset of ¥6,224 million (2014: ¥4,989 million) has been recognized in respect of tax losses arising in Japan, based on the management-approved financial forecast. Further tax losses of ¥1,147 million (2014: ¥4,336 million) are being carried forward in Japan and the Group does not consider it probable that there will be sufficient future taxable profits against which these losses may be utilized and no deferred tax asset is being recognized. These tax losses are subject to time expiry between FY2016 and FY2024.
A further ¥2,136 million (2014: ¥1,457 million) of the deferred tax asset relates to tax losses arising in the UK, based on the management-approved financial forecasts. These tax losses are not subject to time expiry. Further tax losses of ¥89,869 million (2014: ¥78,060 million) are being carried forward in the UK and the Group does not consider it probable that there will be sufficient future taxable profits against which these losses may be utilized and no deferred tax asset is being recognized.
A deferred tax asset of ¥6,021 million (2014: ¥6,474 million), in respect of tax losses arising in other territories, is being recognized in full, based on management-approved financial forecasts.
In addition to tax losses in Japan and the UK on which no deferred tax asset is being recognized, the Group has considered it appropriate not to recognize a deferred tax asset in respect of other tax losses of ¥50,655 million (2014: ¥47,600 million), with ¥10,973 million subject to time expiry under local tax laws. The balance of unrecognized tax losses, of ¥39,682 million, are not subject to time expiry.
NOTES TO THE CONSOLIDATED FINANCIAL STATEMENTS CONTINUED

54 NSG Group Annual Report 2015
19. Deferred income tax continuedThe deferred tax asset in respect of Group’s retirement benefit obligations arises mainly in the USA, where a deferred tax asset of ¥14,769 million (2014: ¥9,431 million) is being recognized, the UK, where a deferred tax asset of ¥459 million (2014 restated: ¥1,337 million) is being recognized and in Germany, where a deferred tax asset of ¥5,744 million (2014: ¥4,355 million) is being recognized. In addition in the UK there is a further asset of ¥1,015 million (2014: ¥nil million) which is not being recognized in respect of retirement benefit obligations.
The Group also has other assets which on which no deferred tax is recognized amounting to ¥9,995 million (2014: ¥10,743 million).
Millions of yen
Note
Property, plant and
equipmentFair value
gains Provisions Other Total
Deferred tax liabilitiesAt 1 April 2014 16,832 17,077 684 1,373 35,966Exchange differences (233) (736) (5) (6) (980)Credit to the income statement in the period 9 (658) (2,063) (666) (97) (3,484)Transfer to assets held for sale 354 — — — 354(Credit)/charge to other comprehensive income for the period — 43 71 (250) (136)Gross deferred tax liabilities 16,295 14,321 84 1,020 31,720Offset of deferred tax assets and liabilities relating to income taxes levied by the same taxation authority (8,755) (1,751) (9) (505) (11,020)At 31 March 2015 7,540 12,570 75 515 20,700
Millions of yen
Note
Property, plant and
equipmentFair value
gains Provisions Other Total
Deferred tax liabilitiesAt 1 April 2013 15,672 18,946 601 1,447 36,666Exchange differences 1,515 2,451 7 86 4,059(Credit)/charge to the income statement in the period 9 (30) (4,090) 14 (145) (4,251)Transfer to assets held for sale (325) — — (7) (332)(Credit)/charge to other comprehensive income for the period — (230) 62 (8) (176)Gross deferred tax liabilities 16,832 17,077 684 1,373 35,966Offset of deferred tax assets and liabilities relating to income taxes levied by the same taxation authority (9,319) (1,861) (563) (1,033) (12,776)At 31 March 2014 7,513 15,216 121 340 23,190
Deferred taxation provided on unremitted earnings of joints ventures and associates at 31 March 2015, was ¥277 million (2014: ¥181 million). This reflects local withholding and other taxes which would be suffered if these earnings were repatriated and which would not be creditable against local corporation tax.
Fair value gains principally relate to the recognition of intangible assets on acquisition of the Pilkington Group by NSG UK Enterprises Ltd.
20. Inventories Millions of yen
2015 2014
Raw materials 29,218 32,514Work-in-progress 19,388 17,152Finished goods 65,056 59,501
113,662 109,167
The cost of inventories recognized as an expense and included in cost of sales amounted to ¥356,028 million (2014: ¥348,654 million) and includes the write down of inventories totaling ¥1,748 million (2014: ¥2,268 million) and the reversal of inventory write-downs made in previous periods.
The carrying amount of inventories carried at fair value less cost to sell (net realizable value) amount to ¥15,949 million (2014: ¥16,257 million).
The amount of the reversal of inventory write-downs made in previous periods and credited to the income statement in the period amounted to ¥980 million (2014: ¥984 million). The reversal of previous write-downs relates to an increase in the net realizable value at the end of the period.
NOTES TO THE CONSOLIDATED FINANCIAL STATEMENTS CONTINUED

NSG Group Annual Report 2015 55
OverviewOur business
Financial performance
Corporate information
Financial statements
21. Construction work-in-progress Millions of yen
Note 2015 2014
Contract costs incurred plus recognized profits less recognized losses 3,260 5,952Less amounts invoiced (2,435) (4,970)
825 982Contracts in progress at 31 MarchAmounts due from contract customers included in trade and other receivables 15 1,772 966
1,772 966
Advances received from customers for contract work, included in the above summary, amounted to ¥224 million (2014: ¥544 million).
At 31 March 2015 and 2014, there were no amounts included in trade and other receivables arising from construction contracts which are due for settlement after more than 12 months.
There are no material amounts of construction work-in-progress held by customers as retentions.
The Group’s income statement included the following results in respect of engineering contracts:
Millions of yen
2015 2014
Contract revenue 4,811 5,138 Contract costs (3,714) (3,984) Gross profit 1,097 1,154 Profit before tax 819 866
22. Cash and cash equivalents Millions of yen
2015 2014
Cash at bank and in hand 45,856 55,303 Short-term deposits 21,839 18,561
67,695 73,864
The effective interest rate on the Group’s short-term bank deposits was 2.25 percent (2014: 2.45 percent) with an average maturity of 9 days (2014: 12 days).
The short-term deposits noted above, which constitute cash equivalents, are represented by deposit account balances principally in the UK, Vietnam and Chile.
The Group’s cash flow statement includes the following:
Millions of yen
Note 2015 2014
Cash and cash equivalents 67,695 73,864 Bank overdrafts 24 (5,355) (21,571)
62,340 52,293
23. Assets held for sale Millions of yen
2015 2014
Assets held for sale within a disposal group held for sale Property, plant and equipment 931 1,799 Investments in affiliates 2,514 — Deferred taxation 62 —
3,507 1,799 Liabilities held for sale within a disposal group held for saleDeferred taxation — 332
— 332Net assets held for sale 3,507 1,467
At 31 March 2015, assets held within a disposal group comprise of an investment which was previously categorized as an investment accounted for using the equity method, and excess property, plant and equipment within the European businesses that are surplus to the Group’s requirements and are expected to be disposed of within 12 months of the balance sheet date.
NOTES TO THE CONSOLIDATED FINANCIAL STATEMENTS CONTINUED

56 NSG Group Annual Report 2015
23. Assets held for sale continuedAt 31 March 2014, assets and liabilities held within a disposal group mainly comprised of excess property, plant and equipment within the European and North American architectural businesses that were surplus to the Group’s requirements. They were disposed during the period ended 31 March 2015.
24. Borrowings
a. Borrowings and net debt Millions of yen
Note 2015 2014
CurrentBank overdrafts 22 5,355 21,571Bank borrowings 80,044 94,391Other long-term loans 25,582 2,843Finance lease liabilities 872 860Non-equity non-controlling interest preference shares 266 289
112,119 119,954Non-currentBank borrowings 285,304 265,682Other long-term loans 34,879 60,038Finance lease liabilities 148 1,032Non-equity non-controlling interest preference shares 4,677 5,087
325,008 331,839Total borrowings 437,127 451,793
Group borrowings include secured liabilities of ¥8,191 million (2014: ¥10,014 million). Borrowings are secured by fixed and floating charges over certain assets of undertakings in the Group. Bank borrowings in the above table include the liabilities of ¥7,457 million (2014: ¥8,554 million) as a consequence of the finance lease contracts from the sale and leaseback transactions made by the Group in Japan.
Summary of net debt Millions of yen
Note 2015 2014
Financial liabilities borrowings 437,127 451,793 derivative financial instruments 17 5,617 3,510Financial assets derivative financial instruments 17 (957) (2,327)Cash and cash equivalents 22 (67,695) (73,864)Net debt 374,092 379,112
Net debt includes energy hedges within derivative financial instruments.
b. Interest rate exposureThe exposure of the Group’s borrowings to interest rate changes and the contractual re-pricing dates are as follows:
Millions of yen
2015Less than
one year One to five
yearsOver five
years Total
Total borrowings 389,650 42,800 4,677 437,127Effect of interest rate swaps (37,489) 37,489 — —
352,161 80,289 4,677 437,127
Millions of yen
2014Less than
one year One to five
yearsOver five
years Total
Total borrowings 365,914 80,792 5,087 451,793Effect of interest rate swaps (50,632) 50,632 — —
315,282 131,424 5,087 451,793
NOTES TO THE CONSOLIDATED FINANCIAL STATEMENTS CONTINUED
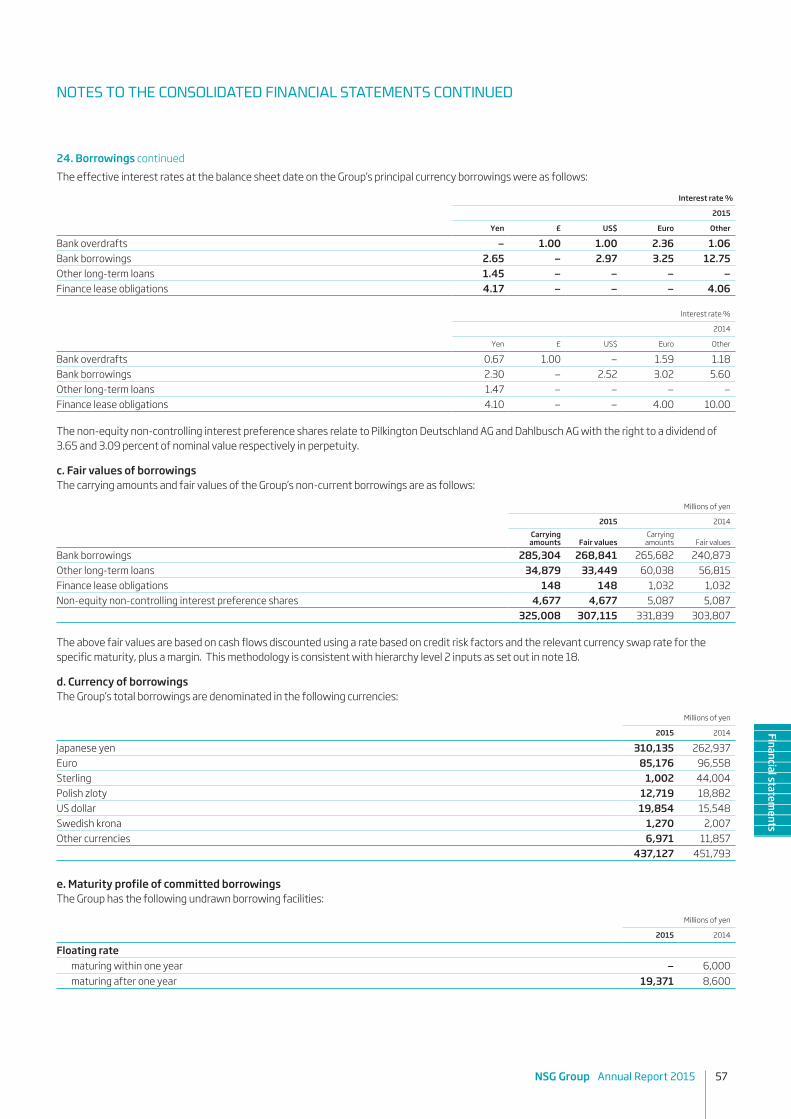
NSG Group Annual Report 2015 57
OverviewOur business
Financial performance
Corporate information
Financial statements
24. Borrowings continuedThe effective interest rates at the balance sheet date on the Group’s principal currency borrowings were as follows:
Interest rate %
2015
Yen £ US$ Euro Other
Bank overdrafts — 1.00 1.00 2.36 1.06Bank borrowings 2.65 — 2.97 3.25 12.75Other long-term loans 1.45 — — — —Finance lease obligations 4.17 — — — 4.06
Interest rate %
2014
Yen £ US$ Euro Other
Bank overdrafts 0.67 1.00 — 1.59 1.18Bank borrowings 2.30 — 2.52 3.02 5.60Other long-term loans 1.47 — — — —Finance lease obligations 4.10 — — 4.00 10.00
The non-equity non-controlling interest preference shares relate to Pilkington Deutschland AG and Dahlbusch AG with the right to a dividend of 3.65 and 3.09 percent of nominal value respectively in perpetuity.
c. Fair values of borrowingsThe carrying amounts and fair values of the Group’s non-current borrowings are as follows:
Millions of yen
2015 2014Carrying
amounts Fair valuesCarrying
amounts Fair values
Bank borrowings 285,304 268,841 265,682 240,873Other long-term loans 34,879 33,449 60,038 56,815Finance lease obligations 148 148 1,032 1,032Non-equity non-controlling interest preference shares 4,677 4,677 5,087 5,087
325,008 307,115 331,839 303,807
The above fair values are based on cash flows discounted using a rate based on credit risk factors and the relevant currency swap rate for the specific maturity, plus a margin. This methodology is consistent with hierarchy level 2 inputs as set out in note 18.
d. Currency of borrowingsThe Group’s total borrowings are denominated in the following currencies:
Millions of yen
2015 2014
Japanese yen 310,135 262,937Euro 85,176 96,558Sterling 1,002 44,004Polish zloty 12,719 18,882US dollar 19,854 15,548Swedish krona 1,270 2,007Other currencies 6,971 11,857
437,127 451,793
e. Maturity profile of committed borrowings The Group has the following undrawn borrowing facilities:
Millions of yen
2015 2014
Floating rate maturing within one year — 6,000 maturing after one year 19,371 8,600
NOTES TO THE CONSOLIDATED FINANCIAL STATEMENTS CONTINUED

58 NSG Group Annual Report 2015
24. Borrowings continuedThe overall maturity profile of the Group’s borrowings is as follows:
Millions of yen
2015 2014
Within one year 112,119 119,954One to two years 135,880 158,229Two to three years 107,634 93,035Three to four years 56,065 20,825Four to five years 20,752 54,663After five years 4,677 5,087
437,127 451,793
f. Finance leasesThe finance lease liabilities are analyzed as follows:
Millions of yen
2015 2014
Finance lease liabilities – minimum lease payments not later than one year 872 861 later than one year and not later than five years 148 1,034Future finance charges on finance leases — (3)Present value of finance lease liabilities 1,020 1,892
The maturity of the present value of finance lease liabilities is as follows:
Millions of yen
2015 2014
Not later than one year 872 860Later than one year and not later than five years 148 1,032
1,020 1,892
The fair value of the Group’s non-current finance lease liabilities equates to book value.
It is the Group’s policy to lease certain of its plant and equipment and intangible assets under finance leases. Interest rates are fixed at the contract date. The majority of the Group’s leases are subject to fixed interest rates and all leases are on a fixed repayment basis.
25. Trade and other payablesMillions of yen
Note 2015 2014
Trade payables 88,865 81,834Amounts owed to related parties (trading) 38 4,272 3,988Loans from related parties 109 120Social security and other taxes 5,029 5,282Other payables 23,082 24,702Accruals 12,934 12,505
134,291 128,431Current 133,550 127,858Non-current 741 573
134,291 128,431
The directors consider that the carrying amount of trade and other payables approximates to their fair value.
NOTES TO THE CONSOLIDATED FINANCIAL STATEMENTS CONTINUED

NSG Group Annual Report 2015 59
OverviewOur business
Financial performance
Corporate information
Financial statements
26. Pensions and other post-employment benefits The Group operates a number of defined benefit pension arrangements, together with related arrangements, which are required to be disclosed as post-employment or other long-term benefits under IAS 19. The defined benefit pension arrangements cover schemes operating in Japan, the UK, Germany, Austria, the USA, Canada and Sweden and there are leaving indemnity arrangements in Italy, Austria and France, together with phased retirement (Altersteilzeit) and long service arrangements in Germany.
The defined benefit pension schemes are closed with the exception of those in Japan, Canada and Sweden. The German and UK defined benefit pension schemes are closed to new members but continuing employees accrue pension rights covering their current employment. Although benefits are accruing in the UK plans, the definition of pensionable salary has been 'frozen' so that benefits no longer increase in line with salary increases.
All the pension schemes are unfunded except for those in Japan, the UK, the USA and Canada. The assets of the funded schemes are generally held in separately administered trusts, either as specific assets or as a proportion of a general fund, or are insurance contracts. Pension scheme assets held in trust are governed by local regulations and practice in each country. Responsibility for governance of the schemes - including investment decisions and contribution schedules – lies either with the Group or jointly with the Group and the board of trustees.
Through its defined benefit pension schemes, the Group is exposed to a number of risks, the most significant of which are detailed below:
Asset volatility The liabilities are calculated using a discount rate set with reference to corporate bond yields; if assets underperform against this yield, this will create a deficit. All funded schemes hold a significant proportion of growth assets, which are expected to outperform corporate bonds in the long-term while providing volatility and risk in the short-term. The allocation to growth assets is monitored regularly to ensure it remains appropriate and in line with the Group's long-term strategy to manage the schemes.
Changes in bond yields A decrease in corporate bond yields will increase the scheme liabilities, although this will be partially offset by an increase in the value of the schemes' bond holdings.
Inflation risk Much of the UK schemes' benefit obligations are linked to inflation, and higher inflation will lead to higher liabilities (although, in most cases, caps on the level of inflationary increases are in place to protect against extreme inflation). The majority of the assets are either unaffected by or loosely correlated with inflation, meaning that an increase in inflation will also increase the deficit.
Life expectancy The majority of the plans’ obligations are to provide benefits for the life of the member, and in some cases, their spouse on death of the member, so increases in life expectancy will result in an increase in the liabilities. Some of the longevity risk in the main UK plan is hedged with a longevity swap which was put in place in 2012.
Pension plan assets are invested in different asset classes in order to maintain a balance between risk and return. The main plans use government and corporate bonds as well as cash as liability matching assets. The remainder of the asset classes are used as return seeking assets. Investments are well diversified to limit the financial effect of the failure of any individual investment.
The largest pension scheme is in the UK. This scheme, the Pilkington Superannuation Scheme (PSS), covered 1,045 employees, 3,155 deferred members and 10,870 pensioners as at 31 March 2015. This scheme was closed to new members with effect from 30 September 2008. This scheme is subject to applicable UK employment laws and is governed by a Board of Trustees. The Board of Trustees consists of seven member nominated directors and seven employer nominated directors. Of the employer nominated directors, two are independent and five are current or former employees of the Group. The Board of Trustees is responsible for the overall governance of the scheme and the management of its assets.
Prior to 1 January 2009, employer contributions under the PSS’s governing trust deed were fixed at 10.5 percent of pensionable salary for active members. However, with effect from that date, employer contributions are now levied at 16 percent of pensionable salary for active members accruing on a 1/60th basis, and 12.5 percent for active members accruing on a 1/80th basis.
A formal funding valuation of the scheme's liabilities is carried out using a prudent basis, as agreed between the Trustee and the Company, every three years. If the funding valuation reveals a deficit the Trustee agree with the Group a plan for recovering that deficit. Following the actuarial valuation as at 31 December 2011, the Group has agreed a funding plan which is intended to cover the funding deficit arising from that valuation over a period of 10 years, with annual deficit contributions of £23 million (¥4,071 million at FY2015 exchange rates) payable for the first four years of that period and £25 million (¥4,425 million at FY2015 exchange rates) for three further years.
NOTES TO THE CONSOLIDATED FINANCIAL STATEMENTS CONTINUED

60 NSG Group Annual Report 2015
26. Pensions and other post-employment benefits continuedThe Group has re-assessed its policy towards the recognition of retirement benefit scheme assets and liabilities in light of ongoing debate by the IFRS foundation in respect of IFRIC 14 and IAS 19. The Group has previously had a policy of imposing a nil-value asset ceiling on the recognition of pension assets arising at its main UK pension scheme on the basis that the trustee has the discretionary ability to take actions that could reduce or extinguish the surplus. The Group has also then had a policy of recognizing a further liability with respect to the funding requirements of this scheme. Consistent with the latest proposals made by the IFRS foundation, the Group has revised its policy with respect to the application of an asset ceiling. The Group has an unconditional right to a refund of surplus, as defined under IFRIC 14 and considers that the possibility that a surplus could be reduced or extinguished by discretionary actions by the trustee does not affect the existence of the asset at the end of the reporting period. Given these circumstances, a nil-value asset ceiling is no longer applied by the Group. Consequently the Group now recognizes a pension asset with respect to this scheme and no longer recognizes an additional liability with respect to further funding contributions. The accounting impact of this change has been applied retrospectively in accordance with IAS8. The Group has therefore restated its comparative opening balance sheet as at 1 April 2013, its comparative income statement and statement of comprehensive income for the period to 31 March 2014, and its comparative balance sheet as at 31 March 2014.
The scheme’s Statement of Investment Principles sets out the investment objectives and asset allocation policy adopted by the Trustee. This policy is linked to a ‘de-risking’ plan that was agreed with the Group as part of the 2011 valuation. Under this plan the amount of return-seeking assets as a proportion of the total is expected to reduce as the funding position improves. The current benchmark is 20% return-seeking 80% liability matching assets.
The Group operates a number of defined benefit pension plans in Japan. These plans are of cash balance design and generally provide lump sums at retirement. The plans are governed by the Japanese Ministry of Health, Labor and Welfare in accordance with the Defined Benefit Corporate Pension Law. They are subject to minimum funding requirements stipulated in law, which requires the plan sponsor to pay additional contributions to achieve a minimum funding level within a certain time scale if the plan does not hold sufficient assets. The largest Japanese plan covers employees of Nippon Sheet Glass Co., Ltd. The latest valuation for this plan was carried out as at 31 March 2013, and showed a deficit of approximately ¥1 billion. The company is currently paying contributions which are intended to remove this deficit over 2 years 8 months from the valuation date. The investment strategy is determined by the Company and the current strategic allocation is approximately 22% equity, 45% bonds and 33% insurance products.
The Group also operates post-retirement healthcare and life insurance benefits for employees, retirees and their dependents in the USA and for retirees in the UK. The method of accounting, assumptions and the frequency of actuarial valuations are similar to those used for defined benefit pension schemes.
Balance sheet obligations (assets) are as follows:
Millions of yen2015 2014
(restated)
Recognized in non-current (assets): Pension and early-retirement benefit schemes in surplus (9,754) (4,624)Recognized in Pension and other long-term benefit obligations: Pension and early-retirement benefit schemes in deficit 56,898 49,810 Post-retirement healthcare benefits 32,866 22,660 Long service arrangements 160 166Total recognized in Pension and other long-term benefit obligations 89,924 72,636Net liability in the balance sheet 80,170 68,012
(Charges)/credits in the income statement and statement of comprehensive income are as follows:
Millions of yen
2015 2014 (restated)
NoteOperating
profit Finance
costs SoCI* Operating
profit Finance
costs SoCI*
Pension and early-retirement benefits (3,108) (1,062) (9,042) (2,707) (1,044) 5,326Post-retirement healthcare benefits (66) (934) (6,749) (76) (876) 2,322Long service arrangements (18) (3) — (3) (3) —Deferred income and other taxes** 19 — — 2,592 — — (5,692)At 31 March (3,192) (1,999) (13,199) (2,786) (1,923) 1,956* Statement of comprehensive income
** Of the deferred income and other taxes, a credit of ¥5,237 million (2014: a debit of ¥3,377 million) is included within deferred tax (note 19). Other taxes of ¥2,645 million (2014: ¥2,315 million) are included as a charge against the pension asset.
NOTES TO THE CONSOLIDATED FINANCIAL STATEMENTS CONTINUED
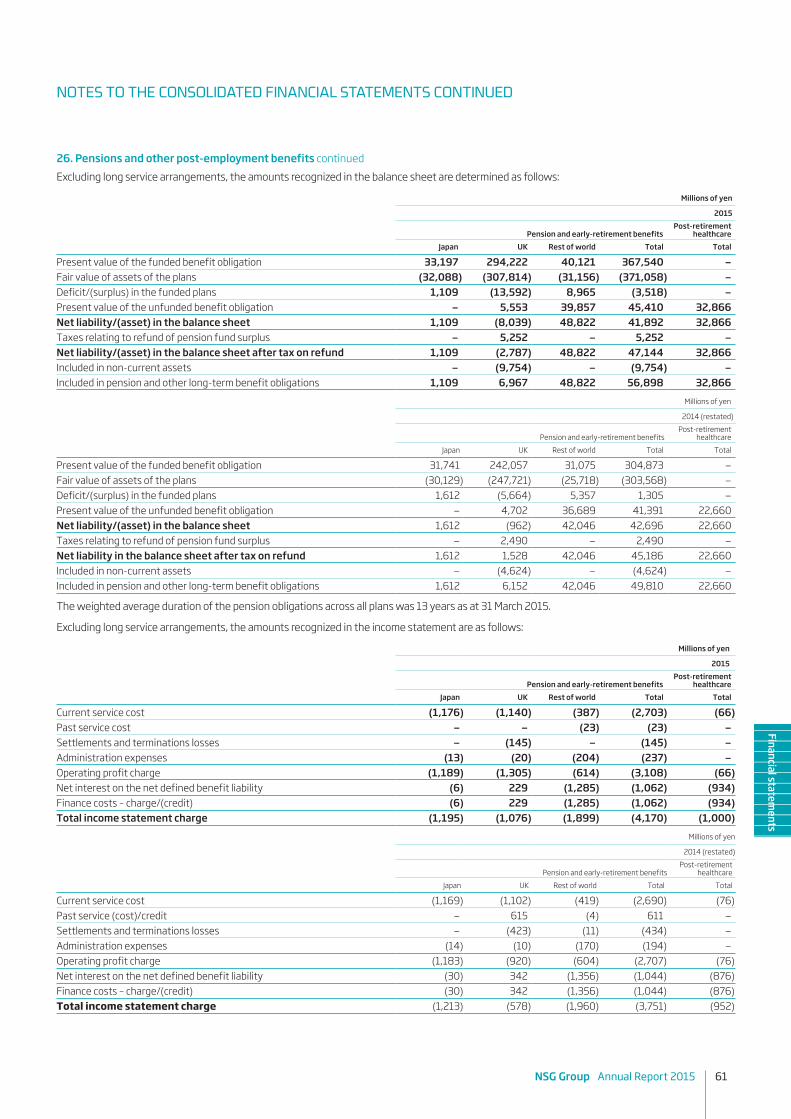
NSG Group Annual Report 2015 61
OverviewOur business
Financial performance
Corporate information
Financial statements
26. Pensions and other post-employment benefits continuedExcluding long service arrangements, the amounts recognized in the balance sheet are determined as follows:
Millions of yen
2015
Pension and early-retirement benefitsPost-retirement
healthcareJapan UK Rest of world Total Total
Present value of the funded benefit obligation 33,197 294,222 40,121 367,540 —Fair value of assets of the plans (32,088) (307,814) (31,156) (371,058) —Deficit/(surplus) in the funded plans 1,109 (13,592) 8,965 (3,518) —Present value of the unfunded benefit obligation — 5,553 39,857 45,410 32,866Net liability/(asset) in the balance sheet 1,109 (8,039) 48,822 41,892 32,866Taxes relating to refund of pension fund surplus — 5,252 — 5,252 —Net liability/(asset) in the balance sheet after tax on refund 1,109 (2,787) 48,822 47,144 32,866Included in non-current assets — (9,754) — (9,754) —Included in pension and other long-term benefit obligations 1,109 6,967 48,822 56,898 32,866
Millions of yen
2014 (restated)
Pension and early-retirement benefitsPost-retirement
healthcareJapan UK Rest of world Total Total
Present value of the funded benefit obligation 31,741 242,057 31,075 304,873 —Fair value of assets of the plans (30,129) (247,721) (25,718) (303,568) —Deficit/(surplus) in the funded plans 1,612 (5,664) 5,357 1,305 —Present value of the unfunded benefit obligation — 4,702 36,689 41,391 22,660Net liability/(asset) in the balance sheet 1,612 (962) 42,046 42,696 22,660Taxes relating to refund of pension fund surplus — 2,490 — 2,490 —Net liability in the balance sheet after tax on refund 1,612 1,528 42,046 45,186 22,660Included in non-current assets — (4,624) — (4,624) —Included in pension and other long-term benefit obligations 1,612 6,152 42,046 49,810 22,660
The weighted average duration of the pension obligations across all plans was 13 years as at 31 March 2015.
Excluding long service arrangements, the amounts recognized in the income statement are as follows:
Millions of yen
2015
Pension and early-retirement benefitsPost-retirement
healthcareJapan UK Rest of world Total Total
Current service cost (1,176) (1,140) (387) (2,703) (66)Past service cost — — (23) (23) —Settlements and terminations losses — (145) — (145) —Administration expenses (13) (20) (204) (237) —Operating profit charge (1,189) (1,305) (614) (3,108) (66)Net interest on the net defined benefit liability (6) 229 (1,285) (1,062) (934)Finance costs – charge/(credit) (6) 229 (1,285) (1,062) (934)Total income statement charge (1,195) (1,076) (1,899) (4,170) (1,000)
Millions of yen
2014 (restated)
Pension and early-retirement benefitsPost-retirement
healthcareJapan UK Rest of world Total Total
Current service cost (1,169) (1,102) (419) (2,690) (76)Past service (cost)/credit — 615 (4) 611 —Settlements and terminations losses — (423) (11) (434) —Administration expenses (14) (10) (170) (194) —Operating profit charge (1,183) (920) (604) (2,707) (76)Net interest on the net defined benefit liability (30) 342 (1,356) (1,044) (876)Finance costs – charge/(credit) (30) 342 (1,356) (1,044) (876)Total income statement charge (1,213) (578) (1,960) (3,751) (952)
NOTES TO THE CONSOLIDATED FINANCIAL STATEMENTS CONTINUED
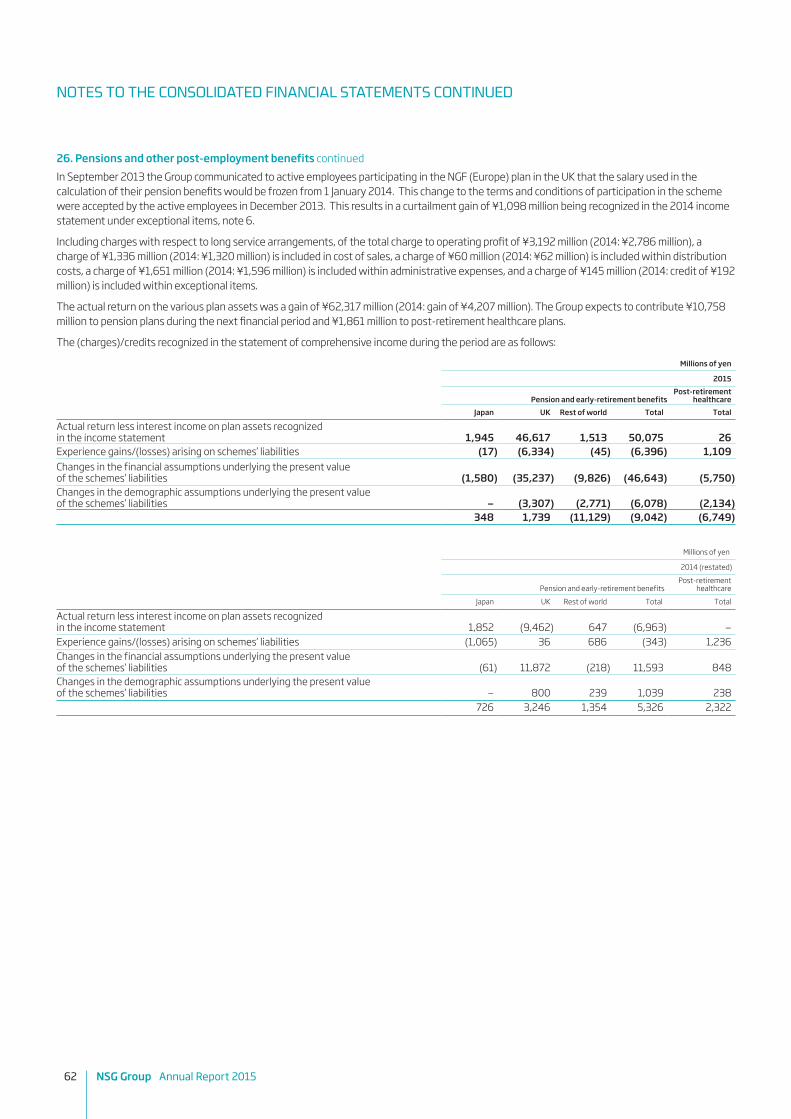
62 NSG Group Annual Report 2015
26. Pensions and other post-employment benefits continuedIn September 2013 the Group communicated to active employees participating in the NGF (Europe) plan in the UK that the salary used in the calculation of their pension benefits would be frozen from 1 January 2014. This change to the terms and conditions of participation in the scheme were accepted by the active employees in December 2013. This results in a curtailment gain of ¥1,098 million being recognized in the 2014 income statement under exceptional items, note 6.
Including charges with respect to long service arrangements, of the total charge to operating profit of ¥3,192 million (2014: ¥2,786 million), a charge of ¥1,336 million (2014: ¥1,320 million) is included in cost of sales, a charge of ¥60 million (2014: ¥62 million) is included within distribution costs, a charge of ¥1,651 million (2014: ¥1,596 million) is included within administrative expenses, and a charge of ¥145 million (2014: credit of ¥192 million) is included within exceptional items.
The actual return on the various plan assets was a gain of ¥62,317 million (2014: gain of ¥4,207 million). The Group expects to contribute ¥10,758 million to pension plans during the next financial period and ¥1,861 million to post-retirement healthcare plans.
The (charges)/credits recognized in the statement of comprehensive income during the period are as follows:
Millions of yen
2015
Pension and early-retirement benefitsPost-retirement
healthcareJapan UK Rest of world Total Total
Actual return less interest income on plan assets recognized in the income statement 1,945 46,617 1,513 50,075 26Experience gains/(losses) arising on schemes’ liabilities (17) (6,334) (45) (6,396) 1,109Changes in the financial assumptions underlying the present value of the schemes’ liabilities (1,580) (35,237) (9,826) (46,643) (5,750)Changes in the demographic assumptions underlying the present value of the schemes’ liabilities — (3,307) (2,771) (6,078) (2,134)
348 1,739 (11,129) (9,042) (6,749)
Millions of yen
2014 (restated)
Pension and early-retirement benefitsPost-retirement
healthcare
Japan UK Rest of world Total Total
Actual return less interest income on plan assets recognized in the income statement 1,852 (9,462) 647 (6,963) —Experience gains/(losses) arising on schemes’ liabilities (1,065) 36 686 (343) 1,236Changes in the financial assumptions underlying the present value of the schemes’ liabilities (61) 11,872 (218) 11,593 848Changes in the demographic assumptions underlying the present value of the schemes’ liabilities — 800 239 1,039 238
726 3,246 1,354 5,326 2,322
NOTES TO THE CONSOLIDATED FINANCIAL STATEMENTS CONTINUED

NSG Group Annual Report 2015 63
OverviewOur business
Financial performance
Corporate information
Financial statements
26. Pensions and other post-employment benefits continued The movements in the present value of the Defined Benefit Obligations (DBO) recognized in the balance sheet are as follows:
Millions of yen
Pension and early-retirement benefitsPost-retirement
healthcareJapan UK Rest of world Total Total
At 1 April 2013 31,149 217,387 61,747 310,283 23,092Current service cost 1,169 1,102 419 2,690 76Interest cost on the schemes’ liabilities 429 9,505 2,280 12,214 876Members’ contributions — 576 — 576 —Plan amendments — (1,098) — (1,098) —Curtailments — 483 4 487 —Settlements and terminations — 423 11 434 —Actuarial losses/(gains) 1,126 (12,708) (707) (12,289) (2,322)Benefits paid (2,132) (13,979) (4,772) (20,883) (1,536)Exchange differences — 45,068 8,782 53,850 2,474At 31 March 2014 31,741 246,759 67,764 346,264 22,660Current service cost 1,176 1,140 387 2,703 66Interest cost on the schemes’ liabilities 430 10,421 2,427 13,278 934Members’ contributions — 548 — 548 —Plan amendments — — 23 23 —Settlements and terminations — 145 — 145 —Actuarial losses 1,597 44,878 12,642 59,117 6,775Benefits paid (1,747) (14,458) (5,156) (21,361) (1,731)Exchange differences — 10,342 1,891 12,233 4,162At 31 March 2015 33,197 299,775 79,978 412,950 32,866
The movements in the fair value of assets recognized in the balance sheet are as follows:
Millions of yen
Pension and early-retirement benefitsPost-retirement
healthcare
Japan UK Rest of world Total Total
At 1 April 2013 27,737 210,668 22,772 261,177 —Members’ contributions — 576 — 576 —Settlements and terminations — 423 — 423 —Return on plan assets (excluding amount included in interest income) 1,852 (9,462) 647 (6,963) —Benefits paid (2,132) (13,979) (4,772) (20,883) (1,536)Expenses paid (14) (10) (170) (194) —Employer’s contributions 2,287 5,380 3,871 11,538 1,536Interest income on assets 399 9,847 924 11,170 —Exchange differences — 44,278 2,446 46,724 —At 31 March 2014 30,129 247,721 25,718 303,568 —Members’ contributions — 548 — 548 —Settlements and terminations — 145 — 145 —Return on plan assets (excluding amount included in interest income) 1,945 46,617 1,513 50,075 26Benefits paid (1,747) (14,458) (5,156) (21,361) (1,731)Expenses paid (13) (20) (204) (237) —Employer’s contributions 1,350 6,190 3,929 11,469 1,705Interest income on assets 424 10,650 1,142 12,216 —Exchange differences — 10,421 4,214 14,635 —At 31 March 2015 32,088 307,814 31,156 371,058 —
NOTES TO THE CONSOLIDATED FINANCIAL STATEMENTS CONTINUED

64 NSG Group Annual Report 2015
26. Pensions and other post-employment benefits continued The movements in the net liability recognized in the balance sheet are as follows (excluding taxation arising on refund of surplus):
Millions of yen
Pension and early-retirement benefitsPost-retirement
healthcareJapan UK Rest of world Total Total
At 1 April 2013 (restated) (3,412) (6,719) (38,975) (49,106) (23,092)Total charge recognized in the income statement (1,213) (578) (1,960) (3,751) (952)Total credit recognized in other comprehensive income 726 3,246 1,354 5,326 2,322Employer’s contributions 2,287 5,380 3,871 11,538 1,536One-off employer contributions for financing terminations — 423 — 423 —Exchange differences — (790) (6,336) (7,126) (2,474)At 31 March 2014 (restated) (1,612) 962 (42,046) (42,696) (22,660)Total charge recognized in the income statement (1,195) (1,076) (1,899) (4,170) (1,000)Total credit/(charge) recognized in other comprehensive income 348 1,739 (11,129) (9,042) (6,749)Employer’s contributions 1,350 6,190 3,929 11,469 1,705One-off employer contributions for financing terminations — 145 — 145 —Exchange differences — 79 2,323 2,402 (4,162)At 31 March 2015 (1,109) 8,039 (48,822) (41,892) (32,866)
The principal actuarial assumptions (calculated as weighted averages over the various Group plans) were as follows:
2015 2014
Japan UK Rest of world Japan UK Rest of world
Discount rate 0.90% 3.10% 2.40% 1.40% 4.20% 3.60%Future salary increases* 2.20% — 2.10% 2.20% — 2.50%Future pension increases — 0.70% 1.50% — 0.70% 2.00%Consumer Price inflation 0.25% 2.00% 1.80% 0.25% 2.40% 2.10%Long-term increase in healthcare costs — 3.70% 5.00% — 3.70% 5.00%* The weighted average future salary increases exclude frozen salaried plans; UK PSS, NGF and US salaried plan.
The Group uses appropriate mortality tables in each geographical location. The mortality assumptions used for the valuation of the PSS (which accounts for around 65 percent of the Group’s total Defined Benefit Obligation) at 31 March 2015 are based on the ‘SAPS2’ standard UK mortality tables, with an adjustment to reflect actual mortality experience of members of that scheme based on recent experience investigations carried out by the scheme’s Trustees. Future improvements in mortality have been allowed for in line with the CMI 2014 Core Projections with a long-term rate of mortality improvements of 1.25 percent per annum. Expected future lifetimes of pensioners using this mortality basis are shown below:
31 March 2015
YearsExpected future lifetime of a current pensioner aged 60 - Men - Women
26.829.1
Expected future lifetime, at age 60, of a future pensioner aged 60 in 20 years time - Men - Women
28.531.0
NOTES TO THE CONSOLIDATED FINANCIAL STATEMENTS CONTINUED

NSG Group Annual Report 2015 65
OverviewOur business
Financial performance
Corporate information
Financial statements
26. Pensions and other post-employment benefits continued The composition and fair value of the schemes’ assets are:
Millions of yen
2015
Japan UK Rest of world
Quoted Unquoted Quoted Unquoted Quoted Unquoted
Domestic government bonds 8,323 — 152,944 9,630 242 —Domestic corporate bonds — 1,000 52,784 — 26,669 —Overseas bonds 2,029 1,764 — — 114 —Domestic equities 5,495 — 4,965 — 2,547 —Overseas equities 2,244 — 43,304 5,910 1,150 —Property — — 330 9,292 — —Cash 992 — 33 31,310 336 —Other — 10,241 — (2,688)* 98 —
19,083 13,005 254,360 53,454 31,156 —* Note: this is a negative asset in respect of the longevity swap transaction carried out during 2012
Millions of yen
2014
Japan UK Rest of world
Quoted Unquoted Quoted Unquoted Quoted Unquoted
Domestic government bonds 9,325 — 111,889 — — —Domestic corporate bonds — — 80,237 — 19,990 —Overseas bonds 1,677 — — — 60 —Domestic equities 5,446 — 4,976 — 3,569 —Overseas equities 2,229 — 32,938 4,822 1,585 —Property — — 221 9,217 — —Cash 226 — 151 6,943 389 —Other — 11,226 55 (3,728)* 125 —
18,903 11,226 230,467 17,254 25,718 —* Note: this is a negative asset in respect of the longevity swap transaction carried out during 2012
The principal assumptions used to determine the Defined Benefit Obligation (DBO) are the discount rate, inflation rate and the mortality basis. The sensitivity of the DBO to changes in each of these assumptions is set out below for the material plans in UK and Japan:
Assumption Change in assumption Impact on scheme liabilities (%) Japan UK Discount rate Increase/decrease by 0.5% Decrease/increase by 5.3% / 5.7% Decrease/increase by 6.8% / 7.7% Inflation rate Increase/decrease by 0.5% n/a Increase/decrease by 3.4% / 3.0% Mortality Increase life expectancy by one year n/a Increase by 3.6%
A one percent reduction in healthcare cost trend rates would result in a decrease in the benefit obligation of ¥1,950 million and a decrease in the interest and service costs of ¥15 million. A one percent increase in healthcare cost trend rates would result in an increase in the benefit obligation of ¥1,215 million and an increase in the interest and service costs of ¥17 million. The above trend rate sensitivities take into account the fact that increases in employer costs are subject to an annual cap.
The above sensitivity analyses are generally based on a change in one assumption while holding all other assumptions constant. In practice, this is unlikely to occur, and some changes of the assumptions may be correlated. Where relevant, the inflation sensitivity above includes changes to any inflation linked pension increases.
When calculating the sensitivity of the DBO to significant assumptions the same method has been applied as when calculating the pension liability recognized in the statement of financial position.
The methods and types of assumptions used in preparing the sensitivity analysis did not change compared to previous periods.
NOTES TO THE CONSOLIDATED FINANCIAL STATEMENTS CONTINUED

66 NSG Group Annual Report 2015
27. ProvisionsMillions of yen
WarrantyRedundancy and
Restructuring Bonus EnvironmentalClaims and
litigation Other Total
At 1 April 2014 462 7,287 6,736 6,460 6,842 7,869 35,656Exchange differences (19) (158) 54 784 (101) (23) 537Charged to the income statement Charged to provisions 64 3,019 8,324 549 3,003 565 15,524 Effect of discounting — 5 — 134 — — 139Released to the income statement in the period (29) (627) (903) (159) (476) (918) (3,112)Utilized in the period (49) (5,944) (9,303) (200) (2,512) (401) (18,409)At 31 March 2015 429 3,582 4,908 7,568 6,756 7,092 30,335Current 233 1,646 4,549 336 2,715 3,030 12,509Non-Current 196 1,936 359 7,232 4,041 4,062 17,826
429 3,582 4,908 7,568 6,756 7,092 30,335Millions of yen
WarrantyRedundancy and
Restructuring Bonus EnvironmentalClaims and
litigation Other Total
At 1 April 2013 630 9,341 2,301 6,416 7,630 10,284 36,602Exchange differences 83 1,281 242 645 980 569 3,800Charged to the income statement Charged to provisions 33 6,328 9,988 551 1,578 786 19,264 Effect of discounting — — — 220 — 73 293Transferred to assets held for sale — — (4) — 157 (6) 147Released to the income statement in the period (141) (181) (372) (1,060) (631) (3,203) (5,588)Utilized in the period (143) (9,482) (5,419) (312) (2,872) (634) (18,862)At 31 March 2014 462 7,287 6,736 6,460 6,842 7,869 35,656Current 229 5,576 6,465 597 3,026 3,286 19,179Non-Current 233 1,711 271 5,863 3,816 4,583 16,477
462 7,287 6,736 6,460 6,842 7,869 35,656
Warranty provisions are created where the Group has given a guarantee to cover the reliability and performance of products over an extended period. Warranty provisions are calculated based on historical claims levels. Future claim levels could be different to historical claims, although changes in claims levels are not expected to have a material effect on the amounts provided. Warranty provisions are expected to be utilized over the warranty periods granted, resulting in an average period of utilization of less than three years.
Redundancy and restructuring provisions relate to provisions set up in Architectural amounting to ¥2,458 million (2014: ¥5,565 million), Automotive ¥656 million (2014: ¥1,240 million), Technical Glass ¥389 million (2014: ¥434 million) and Other Operations ¥79 million (2014: ¥48 million). Redundancy and restructuring provisions are established when the Group has a detailed formal plan and has announced that plan to the employees affected. The eventual outcome of such restructuring programs is unlikely to be materially different to the amounts provided as the provision is calculated based on specific data on the number of employees affected and related employment termination costs. Redundancy and restructuring provisions are expected to be utilized mainly within the next financial period.
Bonus provisions are established on the accrued expected payment with respect to bonus schemes offered to employees. These are calculated with reference to the performance of the Group in comparison to the metrics within the bonus scheme. Where this relates to expectations of future performance, the Group compares its estimates of expected future performance with the metrics of the bonus scheme, to calculate an expected future bonus payment.
Environmental provisions cover the cost of remediating environmental issues where the Group has a constructive or legal obligation to do so. At 31 March 2015, ¥797 million (2014: ¥873 million) of this provision was recorded in Architectural, ¥81 million (2014: ¥86 million) was recorded in Automotive, ¥329 million (2014: ¥382 million) was recorded in Technical Glass and ¥6,361 million (2014: ¥5,119 million) was recorded in Other Operations. The environmental provision in Other Operations relates primarily to historic liabilities in North America.
Claims and litigation provisions cover a variety of claims and potential settlements. Included in this category are historic employee and public liability issues, some of which are the subject of litigation. Where appropriate this provision includes an element of Incurred But Not Reported (IBNR) liabilities. Also included in this category are claims from certain Automotive customers following the European Commission’s decision announced on 12 November 2008, to impose a fine on the Group for alleged breaches of European competition laws. The Group intends to defend itself against such claims.
Other provisions relate principally to immaterial pension provisions of ¥3,711 million (2014: ¥3,898 million), cumulative leave provisions of ¥3,009 million (2014: ¥3,164 million) and onerous lease and rental provisions of ¥163 million (2014: ¥370 million).
NOTES TO THE CONSOLIDATED FINANCIAL STATEMENTS CONTINUED

NSG Group Annual Report 2015 67
OverviewOur business
Financial performance
Corporate information
Financial statements
28. Deferred incomeMillions of yen
2015 2014
Deferred income 8,145 7,785Government grants 4,983 5,042
13,128 12,827Current 3,345 3,027Non-current 9,783 9,800
13,128 12,827Millions of yen
Note 2015 2014
At 1 April 12,827 11,970Exchange differences (192) 1,753Deferred income receivable 4,529 2,645Released to income statement 2 (4,036) (3,541)At 31 March 13,128 12,827
Deferred income comprises of customer contributions to automotive tooling costs ¥7,784 million (2014: ¥7,304 million) and other deferred income of ¥361 million (2014: ¥481 million). The former principally comprises income received from automotive customers, whereby the tool (carried in property, plant and equipment within non-current assets) is depreciated over the same period as the related deferred income is amortized to the income statement.
Government grants mainly arise in the European Architectural and Automotive businesses and relate to capital expenditure grants in the UK, Italy, Germany and Poland. Government grants are recognized in the income statement on a straight-line basis over the period of the grant. There are no unfulfilled conditions or contingencies relating to government grants recognized as deferred income.
29. Share based paymentsThe Group operates a number of equity settled, share-based payment plans, under which the entity receives services from Directors, Executive Officers, Senior Corporate Officers or Corporate Officers as consideration for equity instruments (options) of the Group. The fair value of the employee services received in exchange for the grant of options is calculated using the Black-Scholes model. In accordance with IFRS 2 ‘Share-based Payment’, the resulting cost is recognized in the income statement over the vesting period of the options, being the period in which the services are received. The value of the charge is adjusted to reflect expected and actual levels of vesting options, except where the failure to vest is as a result of not meeting a market condition. All plans are classified as equity settled.
The expense recognized for compensation type share options received during the period is shown below:
Millions of yen
Note 2015 2014
Total expenses arising from share-based payment transactions 7 81 127
There have been no cancellations or modifications to any of the plans during 2015 or 2014.
Each share option entitles the recipient to acquire one thousand shares of common stock. Movements in the number of stock compensation-type stock options outstanding and their related weighted average exercise price are as follows:
2015 2014Weighted
average exercise price
Yen/shareOptions
(‘000 shares)
Weighted average
exercise priceYen/share
Options (‘000 shares)
At 1 April 107 5,834 134 4,643Granted 1 898 1 1,442Exercised 1 (376) 1 (251)Expired 418 (455) — —At 31 March 74 5,901 107 5,834
Out of the 5,901 outstanding options (2014: 5,834 options), 1,763 options (2014: 2,432 options) were exercisable. Options exercised in 2015 resulted in 376,000 shares (2014: 251,000 shares) being transferred at a price of 1 yen each (2014: 1 yen each). The related weighted average share price at the time of exercise was 122 yen (2014: 129 yen) per share.
NOTES TO THE CONSOLIDATED FINANCIAL STATEMENTS CONTINUED

68 NSG Group Annual Report 2015
29. Share based payments continued Share options outstanding at the end of the period have the following expiry date and exercise prices:
2015 2014
Stock option Expiry date Exercise price in yen/share
Shares ‘000
Shares ‘000
2004 Stock Options (i) 28 June 2014 418 — 4552005 Stock Options (i) 28 June 2015 466 495 4952006 Stock Options (i) 28 June 2016 578 345 3452007 Stock Options (ii) 28 September 2037 1 54 812008 Stock Options (ii) 27 September 2038 1 178 2312009 Stock Options (ii) 30 September 2039 1 350 4812010 Stock Options (ii) 30 September 2040 1 303 3032011 Stock Options (ii) 14 October 2041 1 492 4922012 Stock Options (ii) 28 September 2042 1 1,344 1,5092013 Stock Options (ii) 15 October 2043 1 1,442 1,4422014 Stock Options (ii) 30 September 2044 1 898 —
5,901 5,834
Conditions for vesting of stock options
(i) Those who hold these stock options must remain employees from the grant date of the option to the vesting date in order to be able to exercise the options except for holders’ mandatory retirement, end of tenure or for other due reasons.
(ii) There are no vesting conditions for these stock options.
Method for estimating the fair value per share of stock options
The fair value of options granted during the period is determined using the Black-Scholes valuation model and the significant inputs into the model are listed below.
Note 2014 plan 2013 plan
Share price at grant date (yen) 121 124Exercise price (yen) 1 1Expected volatility of the share price i 47.3% 47.8%Expected remaining life of the option ii 8 years 8 yearsExpected dividend iii 4.3yen/share 5.1yen/shareRisk-free interest rate iv 0.36% 0.51%
Notes:i. The volatility of the share price for the 2014 plan is estimated by taking into account the actual share prices for eight years (from 2 October 2006 to 30 September
2014 (2013 plan: eight years (from 17 October 2005 to 15 October 2013)).ii. The expected remaining life of the option is estimated reflecting the actual conditions of the option, taking into account that any person to whom the stock options
were allotted may exercise the stock options five years after the holders’ tenure as a Director, an Executive Officer, Senior Corporate Officer or a Corporate Officer had ended.
iii. Expected dividends for the period ended 31 March 2015 is based on the actual dividends paid in the eight year period between 31 March 2007 and 31 March 2015 (2013 plan: based on the actual dividends paid in the eight year period between 31 March 2006 and 31 March 2014).
iv. The risk-free interest rate represents the yield on Government bonds for the period that corresponds to the expected remaining life of each option.
NOTES TO THE CONSOLIDATED FINANCIAL STATEMENTS CONTINUED

NSG Group Annual Report 2015 69
OverviewOur business
Financial performance
Corporate information
Financial statements
30. Called up share capitalNumber of shares
2015 2014
Authorized 1,775,000,000 1,775,000,000Ordinary shares of no par value each 903,550,999 903,550,999Ordinary shares held as treasury stock 415,309 758,952
Millions of yen
2015 2014
Number of shares Value Number of shares Value
Issued and fully paid ordinary shares At 1 April and 31 March 903,550,999 116,449 903,550,999 116,449
Capital managementThe Group considers that called up share capital and capital surplus together constitutes its capital, and they are managed in such a way as to improve its financial strength consistent with its strategy. The directors will consider this position on an ongoing basis in line with the Group’s performance. As of 31 March 2015, no changes are made to this objective.
31. Capital surplusMillions of yen
Note 2015 2014
At 1 April 127,511 127,511Issuance and purchase of treasury stock (57) (7)Transfer from retained earnings to capital surplus 32 57 7At 31 March 127,511 127,511
32. Retained earningsMillions of yen
Note 2015 2014 (restated)
At 1 April (11,773) 2,133Profit/(loss) for the period 1,668 (16,605)Retirement benefit obligations 26 (15,791) 7,648Deferred taxation on retirement benefit obligations 19, 26 2,592 (5,692)Share of comprehensive income of joint ventures and associates (1,721) 602Acquisition of additional investments in subsidiaries — 148Transfer from retained earnings to capital surplus 31 (57) (7)At 31 March (25,082) (11,773)Retained earnings (translation adjustment at the IFRS transition date) (68,048) (68,048)Total retained earnings at 31 March (93,130) (79,821)
Nippon Sheet Glass Co., Ltd is subject to The Corporation Law of Japan (the Law). The Law provides that an amount equal to 10 percent of the amount to be disbursed as distributions of capital surplus (other than the capital reserve) and retained earnings (other than the legal reserve) be transferred to the capital reserve and the legal reserve, respectively, until the sum of the capital reserve and the legal reserve equals 25 percent of the capital stock account. Such distributions can be made at any time by resolution of the shareholders, or by the Board of Directors if certain conditions are met.
NOTES TO THE CONSOLIDATED FINANCIAL STATEMENTS CONTINUED

70 NSG Group Annual Report 2015
33. Other reservesMillions of yen
NoteHedging
reserveFair value
reserve
Exchange translation
reserve Treasury stock
Stock subscription
rights Total
At 1 April 2014 (restated) (2,568) 445 21,611 (285) 632 19,835Currency translation differences — — (4,721) — — (4,721)Gain on net investment hedges 17 — — 11,166 — — 11,166Cash flow hedges fair value loss in the period (3,418) — — — — (3,418) transferred to income statement (137) — — — — (137) deferred tax on fair value loss in the period 19 1,261 — — — — 1,261Available-for-sale investments fair value gains in the period 16 — 929 — — — 929 deferred tax on fair value gains in the period 19 — (134) — — — (134)Purchase of treasury stock — — — (4) — (4)Disposal of treasury stock — — — 1 — 1Share based payments — — — 138 — 138At 31 March 2015 (4,862) 1,240 28,056 (150) 632 24,916
Millions of yen
NoteHedging reserve
Fair value reserve
Exchange translation
reserve Treasury stock
Stock subscription
rights Total
At 1 April 2013 (2,562) 1,016 (18,278) (374) 592 (19,606)Currency translation differences — — 38,838 — — 38,838Gain on net investment hedges 17 — — 1,051 — — 1,051Cash flow hedges fair value loss in the period (409) — — — — (409) transferred to income statement (53) — — — — (53) deferred tax on fair value loss in the period 19 456 — — — — 456Available-for-sale investments fair value gains in the period 16 — 16 — — — 16 transferred to income statement — (835) — — — (835) deferred tax on fair value gains in the period 19 — 248 — — — 248Purchase of treasury stock — — — (6) — (6)Share based payments — — — 95 40 135At 31 March 2014 (restated) (2,568) 445 21,611 (285) 632 19,835
Hedging reserveThis reserve is used to record the portion of the gain or loss on a hedging instrument that is determined to be an effective hedge.
Fair value reserveThis reserve records fair value changes on available-for-sale investments.
Exchange translation reserveThis reserve is used to record exchange differences arising from the translation of the financial statements of foreign subsidiaries and the effect of hedging foreign net investments in foreign operations.
Of the net fair value losses of cash flow hedges transferred to the income statement of ¥137 million (2014: losses of ¥53 million), ¥103 million is credited to finance income (2014: ¥101 million charged to finance costs), ¥1 million is charged (2014: ¥nil million) to other expenses, ¥nil million is credited (2014: ¥185 million) to other income and ¥239 million is charged (2014: ¥137 million) to cost of sales.
Of the net fair value gains of available for sale investments transferred to the income statement in 2014 of ¥835 million, ¥301 million is credited to other income and ¥534 million is credited to exceptional items.
NOTES TO THE CONSOLIDATED FINANCIAL STATEMENTS CONTINUED

NSG Group Annual Report 2015 71
OverviewOur business
Financial performance
Corporate information
Financial statements
34. Cash flow from operating activitiesMillions of yen
Note2015 2014
(restated)
Profit/(loss) for the period from continuing operations 2,893 (15,460)Adjustments for taxation 9 1,914 340 depreciation 12 30,778 30,081 amortization 11 10,935 10,330 impairments 3,544 3,593 reversal of impairment of non-current assets 6, 12 (1,506) (1,227) profit on sale of property, plant and equipment (5,216) (591) (profit)/loss on sale of subsidiaries, joint ventures, associates and businesses (26) 57 gain on reclassification of investments 6 (13,349) — deemed disposal of share of associate 6 649 (2,056) movements in grants and deferred income 28 493 (896) finance income 8 (2,201) (3,338) finance expense 8 20,145 20,194 share of profit from joint ventures and associates (413) (1,002) other (1,449) (1,777)Operating cash flows before movement in provisions and working capital 47,191 38,248Decrease in provisions/retirement benefit obligations (16,134) (15,911)Changes in working capital: inventories (2,973) 1,176 construction work-in-progress 154 (437) trade and other receivables 11,610 8,424 trade and other payables 5,087 6,008Net change in working capital 13,878 15,171At 31 March 44,935 37,508
In the cash flow statement, proceeds from the sale of property, plant and equipment, joint ventures and associates and investments are as follows:
Millions of yen
2015
Property, plant and equipment
Joint ventures and associates
Available for sale
investmentsAssets held
for sale
Subsidiary and other business
undertakings Total
Net book amount 1,013 162 182 2,920 118 4,395Profit on sale 5,216 — 21 475 26 5,738Proceeds from sale 6,229 162 203 3,395 144 10,133
Millions of yen
2014
Property, plant and equipment
Joint ventures and associates
Available for sale
investmentsAssets held
for sale
Subsidiary and other business
undertakings Total
Net book amount 2,701 3 1,413 381 1,155 5,653Exchange gains — — (835) — (1) (836)Profit/(loss) on sale 591 — 418 93 (57) 1,045Proceeds from sale 3,292 3 996 474 1,097 5,862
There were no non-cash transactions in the period ended 31 March 2015 or 31 March 2014.
NOTES TO THE CONSOLIDATED FINANCIAL STATEMENTS CONTINUED

72 NSG Group Annual Report 2015
35. Earnings per share
BasicBasic earnings per share is calculated by dividing the profit attributable to owners of the parent by the weighted average number of ordinary shares in issue during the period excluding ordinary shares purchased by the company and held as treasury shares.
Millions of yen2015 2014
(restated)
Profit/(loss) attributable to owners of the parent 1,668 (16,605)Weighted average number of shares (thousands) 902,919 902,618Basic earnings per share (yen) 1.85 (18.40)
DilutedDiluted earnings per share is calculated by adjusting the weighted average number of ordinary shares outstanding to assume conversion of all dilutive potential ordinary shares, following the conversion of share options. A calculation is done to determine the number of shares that could have been acquired at fair value (determined as the average annual market share price of the Company’s shares) based on the monetary value of the subscription rights attached to the outstanding share options. The number of shares calculated as above is compared with the number of shares that would have been issued assuming the exercise of the share options.
Millions of yen2015 2014
(restated)
Profit/(loss) attributable to owners of the parent 1,668 (16,605)Profit/(loss) used to determine diluted earnings per share 1,668 (16,605)Weighted average number of ordinary shares in issue (thousands) 902,919 902,618Adjusted for; share options (thousands) 4,575 —Weighted average number of ordinary shares for diluted earnings per share (thousands) 907,494 902,618Diluted earnings per share (yen) 1.84 (18.40)
Diluted earnings per share for the period ended 31 March 2014 does not include stock options due to the anti-dilutive effect caused by the loss during the period.
There have been no significant transactions involving ordinary shares or potential ordinary shares between the reporting date and the authorization of these financial statements.
36. ContingenciesThe Group has the following contingencies:
ClaimsFollowing the European Commission’s decision announced on 12 November 2008 to impose a fine on the Group for alleged breaches of European competition laws, certain of the Group’s Automotive customers have communicated to the Group their intention to pursue the Group for damages arising from the alleged activities. The Group intends to defend itself against such claims. To cover the cost of defense as well as any potential financial impact as may result from the resolution of certain cases the Group has made a provision for amounts that may be payable. In certain other cases, the Group considers that it is too early to judge the probable future outcome of the claim and as such cannot determine that the claim will probably result in an outflow of economic benefits to the claimants.
37. Commitments
Capital commitmentsCapital expenditure contracted for at the balance sheet date but not yet incurred is as follows:
Millions of yen
2015 2014
Property, plant and equipment 4,750 1,240
NOTES TO THE CONSOLIDATED FINANCIAL STATEMENTS CONTINUED

NSG Group Annual Report 2015 73
OverviewOur business
Financial performance
Corporate information
Financial statements
37. Commitments continued
Operating lease commitmentsThe Group leases various property, plant and equipment under non-cancellable operating lease agreements. The leases have varying terms, escalation clauses and renewal rights. The lease expenditure charged to the income statement during the period is disclosed in note 2.
The future aggregate minimum lease payments under non-cancellable operating leases which fall due are as follows:
Millions of yen
2015 2014
Property Plant and
equipment Property Plant and
equipment
Not later than one year 3,266 1,264 2,401 1,181Later than one year and not later than five years 11,009 3,539 6,137 4,227Later than five years 10,409 196 9,599 290
24,684 4,999 18,137 5,698
38. Related party transactionsDuring the period, the Group entered into the following transactions with related parties, who are not members of the Group. Related parties have been identified as those businesses that act as joint ventures or had an associate relationship with Nippon Sheet Glass Co., Ltd and its subsidiaries.
Sales of goods and services Millions of yen
2015 2014
Sales of goods Joint ventures 611 410 Associates 1,716 1,850Sales of services Joint ventures 584 2,002 Associates 136 162
3,047 4,424
Goods and services are sold to joint ventures and associates on normal commercial terms, applicable to third parties. Additionally, services are provided through the supply of on-line coating technology by Group Engineering to joint ventures. In 2015, these amounted to ¥584 million, of which related to SP Glass Holdings BV (2014: ¥2,002 million of which the majority related to SP Glass Holdings BV).
Purchase of goods and services Millions of yen
2015 2014
Purchase of goods Joint ventures 10,245 10,614 Associates 1,332 969Purchase of services Associates 3,368 3,612
14,945 15,195
Goods are purchased from joint ventures by Nippon Sheet Glass Co., Ltd’s subsidiaries as follows:
Cebrace – on normal trading conditions at prices agreed by both joint venture parties. Payments are made on 37 day terms from the invoice date.
Technical assistance and license agreements to Millions of yen
2015 2014
Joint ventures 305 224
The Group has technical assistance agreements and license agreements with related parties. These agreements cover income received in respect of the use of technology and intellectual property used in the manufacture of float and automotive glass.
In addition, there is income in respect of royalties on patents, the provision of technical support and the use by the related party of know-how.
Royalties and fees are calculated as a percentage of the sales value or on the number of pieces produced (piece rates) depending upon the nature of the license and the normal commercial practice in that area. Agreements with related parties are made on commercial terms similar or identical to those with other licensees.
NOTES TO THE CONSOLIDATED FINANCIAL STATEMENTS CONTINUED

74 NSG Group Annual Report 2015
38. Related party transactions continued
Period-end balances arising from sales and purchases of goods and services, technical assistance and license agreementsMillions of yen
Note 2015 2014
Receivables from related parties 15
Joint ventures 1,904 1,949 Associates 237 193
2,141 2,142Payables to related parties 25
Joint ventures 3,304 2,972 Associates 968 1,016
4,272 3,988
In relation to the receivables from related parties there are no provisions against their non-recovery either in 2015 or 2014. Similarly, there were no receivable balances from related parties, joint ventures or associates written off during the period.
Loans to related partiesMillions of yen
2015 2014 2015 2014
Note Joint ventures Associates
At 1 April 7,906 8,072 189 159 Exchange differences 595 1,037 (4) 29 Loans advanced in period — — — 71 Loan repayments received — (1,679) (38) (71) Interest charged 504 476 5 1 At 31 March 15 9,005 7,906 152 189
The loans to joint ventures and associates are unsecured.
Commitments and contingenciesThere were no material commitments and contingencies of joint ventures and associates at 31 March 2015 or 2014.
At 31 March 2015 and 31 March 2014, the Group has not made any guarantees in the ordinary course of business in respect of joint ventures and associates.
Key management compensationDetails of the key management compensation are disclosed in note 7.
NOTES TO THE CONSOLIDATED FINANCIAL STATEMENTS CONTINUED

NSG Group Annual Report 2015 75
OverviewOur business
Financial performance
Corporate information
Financial statements
39. Restatement of comparative dataAs described in note 1.2 Changes in accounting policies and disclosures, the Group has restated its comparative results following a re-assessment of its accounting treatment with respect to the application of an asset ceiling on retirement benefit obligations. The table below sets out the adjustments made to FY2014 comparative data and the impact of this amendment on the current year financial statements.
Millions of yen
2015 2014 2013
As of 1 April Increase in total shareholders’ equity 18,988 13,408 — Increase in total equity 18,988 13,408 —As of 31 March Decrease in finance expenses 1,095 1,281 — Increase in profit / decrease in loss before taxation 1,095 1,281 — Increase in taxation charge 219 256 — Increase in profit / decrease in loss for the period 876 1,025 — Re-measurement of retirement benefit obligations included within the statement of comprehensive
income, net of taxation 2,082 1,511 —
Foreign currency translation adjustments included within the statement of comprehensive income 794 3,044 — Increase in other comprehensive income for the period, net of taxation 2,876 4,555 — Increase in total comprehensive income for the period 3,752 5,580 — Increase in retirement benefit assets 9,754 4,624 — Decrease in deferred taxation assets 3,247 3,591 4,005 Decrease in retirement benefit obligations 16,233 17,955 17,413 Increase in total shareholders’ equity 22,740 18,988 13,408 Increase in total equity 22,740 18,988 13,408
Increase in earnings / decrease in loss per share attributable to owners of the parent (basic) - yen 0.97 1.13 — Increase in earnings / decrease in loss per share attributable to owners of the parent (diluted) - yen 0.97 1.13 —
NOTES TO THE CONSOLIDATED FINANCIAL STATEMENTS CONTINUED

76 NSG Group Annual Report 2015
40. Group informationThe consolidated financial statements of the Group include over 220 subsidiaries, joint ventures and associates. The following list of subsidiary undertakings comprises those companies that principally affect the financial statements of the Group. All subsidiary undertakings account to 31 March each year. Details of joint ventures and associates can be found in note 14.
Name Proportion of issued ordinary shares held
Country of operation and incorporation Principal activity
JapanNSG Building Products Co., Ltd. 100% Japan ArchitecturalThanxs Corporation Co., Ltd. 92.5% Japan ArchitecturalNSG Win-Tec Co., Ltd. 99.3% Japan Architectural
EuropePilkington United Kingdom Ltd. 100% UK ArchitecturalPilkington Automotive Ltd. 100% UK AutomotivePilkington Technology Management Ltd. 100% UK Architectural and AutomotiveNGF Europe Ltd. 100% UK Technical GlassPilkington Deutschland AG 96.3% Germany ArchitecturalPilkington Automotive Deutschland GmbH 100% Germany AutomotivePilkington Austria GmbH 100% Austria ArchitecturalPilkington Norge AS 100% Norway ArchitecturalPilkington Floatglas AB 100% Sweden ArchitecturalPilkington Automotive Finland OY 100% Finland AutomotivePilkington IGP Sp. zo.o. 100% Poland ArchitecturalPilkington Automotive Poland Sp. zo.o. 100% Poland AutomotivePilkington Polska Sp. zo.o. 100% Poland ArchitecturalPilkington Italia SpA 100% Italy Architectural and Automotive
North AmericaPilkington North America Inc. 100% USA Architectural and AutomotiveL-N Safety Glass SA de CV 100% Mexico Automotive
Rest of the WorldVidrieria Argentina S.A. 51% Argentina ArchitecturalVidrios Lirquen S.A.* 51.6% Chile ArchitecturalPilkington Automotive Argentina S.A. 100% Argentina AutomotivePilkington Brasil Ltda. 100% Brazil Architectural and AutomotiveGuilin Pilkington Safety Glass Co., Ltd. 100% China AutomotivePilkington Solar (Taicang) Ltd. 100% China ArchitecturalSuzhou NSG Electronics Co., Ltd. 100% China Technical GlassNSG Hong Kong Co., Ltd. 100% Hong Kong Technical GlassMalaysian Sheet Glass Sdn. Bhd. 100% Malaysia Architectural and AutomotiveVietnam Float Glass Co., Ltd. 55% Vietnam ArchitecturalNSG Vietnam Glass Industries Ltd. 100% Vietnam Architectural and Technical Glass
Holding and financing companiesNSG Holding (Europe) Ltd. 100% UK Holding companyNSG UK Enterprises Ltd. 100% UK Holding companyPilkington Group Ltd. 100% UK Holding company
*: Vidrios Lirquen S.A. is owned 51.6% by a 51% owned subsidiary of Pilkington Group Limited.
NOTES TO THE CONSOLIDATED FINANCIAL STATEMENTS CONTINUED

NSG Group Annual Report 2015 77
OverviewOur business
Financial performance
Corporate information
Financial statements
40. Group information continued
Parent companyThe parent company of the Group, Nippon Sheet Glass Co., Ltd is incorporated and domiciled in Japan and has shares publicly traded on the Tokyo Stock Exchange.
Restrictions on accessing the assets of subsidiaries The ability of NSG UK Enterprises Ltd, a significant subsidiary company of the Group, to pay cash dividends to its immediate parent company, and ultimately therefore to Nippon Sheet Glass Co., Ltd, is restricted by the external banking agreements entered into by NSG UK Enterprises Ltd, such that NSG UK Enterprises Ltd is only able to pay cash dividends to its immediate parent, to the extent that such a dividend would not cause it to be in breach of its banking covenants.
The cash and cash equivalent balances held by the Group’s subsidiaries which are not generally available for use elsewhere amounted to ¥4,828 million (2014: ¥2,635 million).
41. Non-controlling interests
Name Non-controlling shareholdingCountry of
operation and incorporation Principal activity
Vidrieria Argentina S.A. 49% Argentina Architectural Vidrios Lirquen S.A.* 48.4% Chile Architectural
*: Vidrios Lirquen S.A. is owned 51.6% by a 51% owned subsidiary of Pilkington Group Limited.
Millions of yen
2015 2014
Accumulated balances of material non-controlling interests Vidrieria Argentina S.A. 4,261 3,337 Vidrios Lirquen S.A. 3,525 4,264 Others 2,476 1,911 Total 10,262 9,512Profit/(loss) for the period allocated to material non-controlling interests Vidrieria Argentina S.A. 742 1,081 Vidrios Lirquen S.A. 121 161 Others 362 (97) Total 1,225 1,145
The summarized financial information of these subsidiaries is provided below. This information is based upon amounts before intra-company eliminations.
Summarized income statements Millions of yen
2015 2014Vidrieria
Argentina S.AVidrios
Lirquen S.AVidrieria
Argentina S.A.Vidrios
Lirquen S.A
Revenue 18,476 7,036 16,941 6,469Profit for the period from continuing operations 1,515 164 2,205 218Total comprehensive income 1,643 (130) 1,041 (79)Dividends paid to non-controlling interests — (633) (96) (156)
NOTES TO THE CONSOLIDATED FINANCIAL STATEMENTS CONTINUED

78 NSG Group Annual Report 2015
41. Non-controlling interests continued
Summarized statements of financial position Millions of yen
2015 2014Vidrieria
Argentina S.AVidrios
Lirquen S.AVidrieria
Argentina S.A.Vidrios
Lirquen S.A
Current assets 10,587 2,821 9,048 3,452Non-current assets 5,463 4,438 3,000 4,403Current liabilities (6,689) (1,516) (4,546) (1,472)Non-current liabilities (666) (960) (693) (597)Total equity 8,695 4,783 6,809 5,786Attributable to owners of the parent 4,434 1,258 3,473 1,522Attributable to non-controlling interests 4,261 3,525 3,336 4,264
Summarized income statements Millions of yen
2015 2014Vidrieria
Argentina S.AVidrios
Lirquen S.AVidrieria
Argentina S.A.Vidrios
Lirquen S.A
Cash flows from operating activities 2,453 320 813 399Cash flows from investing activities (2,608) (104) (282) (86)Cash flows from financing activities (70) (633) 17 (156)Increase/(decrease) in cash and cash equivalents (net of bank overdrafts) (225) (417) 548 157Cash and cash equivalents (net of bank overdrafts) at the beginning of the period 1,946 1,331 2,132 1,239Effect of foreign exchange rates 115 27 (734) (65)Cash and cash equivalents (net of bank overdrafts) at the end of the period 1,836 941 1,946 1,331
42. Post-balance sheet eventsThere have been no post balance sheet events.
NOTES TO THE CONSOLIDATED FINANCIAL STATEMENTS CONTINUED

NSG Group Annual Report 2015 79
Corporate information
Company name Nippon Sheet Glass Co., Ltd.
Head office 5-27, Mita 3-chome, Minato-ku, Tokyo 108-6321, Japan Telephone: +81-3-5443-9500
Established 22 November 1918
Number of permanent employees(consolidated) 27,371
Number of shares Authorized: 1,775,000,000 Issued: 903,550,999
Number of shareholders 75,134
Paid-in capital ¥116,449 million
Stock listing Tokyo (Code: 5202)
Independent auditors Ernst & Young ShinNihon LLC
Transfer agent Sumitomo Mitsui Trust Bank, Limited 4-1, Marunouchi 1-chome, Chiyoda-ku, Tokyo, Japan
CORPORATE DATA
FURTHER INFORMATION
The following information is available from our corporate website: www.nsg.com• Shareholder information• Global operations and workforce
In addition to this report, we produce a regular flow of publications intended to provide current and potential investors with as much information about the Group, the industries in which we operate and the organization, strategy, targets and progress of the Group. All of this information is available from our website.
