annual report 2014/15 -...
TRANSCRIPT

BANG & OLUFSEN A/S GROUP
Comreg: 41257911
ANNUAL REPORT2014/15
01 JUNE 2014 – 31 MAY 2015

3REPORT
About Bang & Olufsen ............................................................... 3
Letter to our shareholders ........................................................4
Key figures ...................................................................................... 8
Financial review .......................................................................... 10
Retail development ....................................................................15
Innovation ......................................................................................18
Corporate Social Responsibility ............................................21
The Bang & Olufsen share ......................................................24
28STRATEGY & OUTLOOK
Strategy .........................................................................................29
Outlook for 2015/16 ...................................................................32
33GOVERNANCE
Board of Directors .....................................................................34
Executive Management ...........................................................36
Corporate Governance .............................................................37
Risk management and internal controls ............................41
44ACCOUNTS & DATA
Consolidated income statement ......................................... 46
Consolidated statement of comprehensive income .....47
Consolidated balance sheet ...................................................48
Consolidated statement of cash flows.............................. 50
Consolidated statement of shareholders’ equity ............51
Notes ...............................................................................................52
Financial statements for Bang & Olufsen a/s ................109
Management’s statement ...................................................... 134
Independent auditor’s report .............................................. 135
CONTENTS
BANG & OLUFSEN A/S ANNUAL REPORT 2014/15 · 2
KEY FIGURES · MANAGEMENT REPORT · STRATEGY & OUTLOOK · GOVERNANCE · ANNUAL ACCOUNTS · STATEMENTS

ABOUT BANG & OLUFSENThe Bang & Olufsen Group designs and develops high-quality,
innovative audio and visual solutions for its customers by combining design and technology in
innovative and meaningful ways.
Bang & Olufsen was founded in Struer, Denmark, in
1925 by Peter Bang and Svend Olufsen, two innovative,
young engineers devoted to high quality audio repro-
duction. Since then, the brand has become an icon of
performance and design excellence through its long-
standing craftsmanship tradition and the strong com-
mitment to high-tech research and development.
Still at the forefront of domestic technology,
Bang & Olufsen’s current product range epitomizes
seamless media experiences in the home and on the
move.
At the end of the financial year, Bang & Olufsen em-
ployed 2,015 people and the company’s products are
currently sold in more than 70 countries across the
world. Bang & Olufsen’s shares are listed on NASDAQ
Copenhagen.
Core competencies
Bang & Olufsen recognises the importance of identify-
ing, cultivating and utilising its own expertise and has,
over the years, built up a number of areas of expertise
through experience, practice, development and coop-
eration with external partners. Of these areas, some
have been identified as the company’s core areas of
expertise, such as sound and acoustics, concept devel-
opment, design, system integration and craftsmanship.
Business areas
Bang & Olufsen operates within two business seg-
ments; Bang & Olufsen and B&O PLAY.
The Bang & Olufsen business comprises audio and
video products sold exclusively in 700 Bang & Olufsen
stores around the world. The B&O PLAY brand delivers
headphones and portable audio systems distributed
through Bang & Olufsen stores and third party retailers
and online.
BANG & OLUFSEN A/S ANNUAL REPORT 2014/15 · 3
KEY FIGURES · MANAGEMENT REPORT · STRATEGY & OUTLOOK · GOVERNANCE · ANNUAL ACCOUNTS · STATEMENTS
ABOUT BANG & OLUFSEN · SHAREHOLDER LETTER · FINANCIAL REVIEW · RETAIL DEVELOPMENT INNOVATION · PRODUCT LAUNCHES · CSR · THE BANG & OLUFSEN SHARE
ABOUT BANG OLUFSEN

LETTER TO OUR SHAREHOLDERS
2014/15 was an eventful and challenging year for Bang & Olufsen. While the company demonstrated solid growth in the consumer segment driven by strong product innovation and a strengthened distribution, the continued vulnerability related to the lack of scale and high complexity resulted in an unsatisfactory result. This caused an adjustment of the
strategy, with the aim of creating a less complex, more focused business model, better positioned to deliver profitable growth in the future.
The revenue for the continuing business increased by 9
per cent in the 2014/15 financial year, driven by new, in-
novative products launched under the Bang & Olufsen
and the B&O PLAY brands. The continued strengthen-
ing of the Bang & Olufsen retail network and expansion
of the B&O PLAY third party retail network supported
the growth.
The earnings before interest and tax (EBIT) of the con-
tinuing business was negative DKK 807 million, which
was negatively impacted by DKK 484 million of non-re-
curring and aperiodic, non-cash items as well as costs
for shared functions and license fees previously allocat-
ed to discontinued operations in the fourth quarter to
reflect a new and leaner operating model implemented
as part of the update to the Company’s strategy. Even
after adjusting for these non-recurring and aperiodic
costs the result was unsatisfactory and did not live up
to the company’s plans and expectations, especially
for the first half of the financial year, where unexpected
issues related to the ramp-up of the TV production
adversely affected sales, profitability and net working
capital with knock-on effect on activities across the
business. Consequently, the Board of Directors and
Executive Management in December 2014 decided to
initiate a review to analyze strategic and structural op-
tions to strengthen the balance sheet and address the
company’s lack of scale and high degree of complexity.
Creating a strong, consumer focused business
Based on the results of the strategic review, the Board
of Directors and Executive Management decided to
divest the Automotive assets and transform the Auto-
motive business to a licensed based business, allowing
the company to focus on building the two consumer
brands Bang & Olufsen and B&O PLAY. The Bang &
Olufsen high-end brand is the backbone of the compa-
ny, on which the continuing business will be built. The
Bang & Olufsen brand will continuously be strength-
ened by integrating the company’s unique capabilities
within design, acoustics, innovation and craftsmanship.
Focus for the B&O PLAY branded business is to contin-
ue to strengthen the young brand’s premium positioning
and to further increase the global brand awareness and
accessibility, leveraging the Group’s core capabilities.
Automotive
Bang & Olufsen took a significant step to reduce the
company’s complexity and issues related to the lack
of scale, by the divesture of the Automotive assets
BANG & OLUFSEN A/S ANNUAL REPORT 2014/15 · 4
KEY FIGURES · MANAGEMENT REPORT · STRATEGY & OUTLOOK · GOVERNANCE · ANNUAL ACCOUNTS · STATEMENTS
ABOUT BANG & OLUFSEN · SHAREHOLDER LETTER · FINANCIAL REVIEW · RETAIL DEVELOPMENT INNOVATION · PRODUCT LAUNCHES · CSR · THE BANG & OLUFSEN SHARE
DEAR BANG OLUFSEN SHAREHOLDER

and entering a brand licensing agreement with HAR-
MAN International Industries Inc. The partnership is
expected to increase Bang & Olufsen’s brand presence
in the Automotive industry through the scale, technol-
ogy platform and global footprint of HARMAN, while
reducing the risk and complexity of the Bang & Olufsen
business model.
The transaction resulted in a significant strengthening
and stabilization of the company’s financial position by
securing an upfront cash payment of DKK 1,105 million,
as well as future license payments.
New and innovative products
Bang & Olufsen launched a number of new and innova-
tive products during 2014/15, which were well received
by the market. Products were launched across all seg-
ments in the Group and all products build on Bang &
Olufsen’s unique competencies within acoustics, design
and craftsmanship.
The TV portfolio was expanded with the BeoVision
Avant 75 and 85-inch Ultra High Definition (UHD) TVs.
The BeoVision Avant TV accentuates Bang & Olufsen’s
high level of innovation and, as a testimony to this, was
awarded the Design and Engineering Honouree Status
in High Performance Home Audio at CES.
In January 2015, Bang & Olufsen launched a pioneer-
ing audio product, BeoSound Moment. BeoSound Mo-
ment includes several ground-breaking features such
as a touch-on-wood functionality, PatternPlay and the
MoodWheel. All of which combine Bang & Olufsen’s
craftsmanship traditions with high-tech innovation
to create a truly magical Bang & Olufsen user experi-
ence.
B&O PLAY expanded the product portfolio with many
new products during the year. Key launches included
the BeoPlay H8 wireless on-ear headphones and the
BeoPlay A2 Bluetooth speaker. Both products have re-
ceived numerous design and innovations awards.
The retail network
During the year, the net number of B1 and shop-in-shop
stores declined by 10, as the company’s journey to-
wards a retail network of fewer, more profitable stores
continues. The net development was a consequence
of 73 store closings and 63 openings. The average like
for like sales per store in the Bang & Olufsen retail net-
work continued to increase during the year leading to
a stronger foundation for delivering a consistent, high-
end customer experience.
B&O PLAY revenue through third party channels
increased by 80 per cent in 2014/15, and has now
become a significant contributor to the B&O PLAY
revenue. This increase was driven by strong demand
for new B&O PLAY products and an increase in the
number of third party stores, which exceeded 3,300
stores at the end of the financial year. The aggressive
expansion is expected to continue in the coming years,
especially in the US, while focusing on growing like-for-
like sales, driven by increased brand awareness, strong
in-store merchandising and a high launch pace of new
innovative products. In addition to generating sales,
the increase in the number of stores has also increased
the exposure of the company’s unique capabilities
within acoustics, design and craftsmanship to a broad
group of potential customers.
Employees and organisation
Bang & Olufsen’s employees are an essential part of
the company’s success and continued development.
During the year, the company continued to take steps
to build stronger competencies and processes as well
as strengthen general management capabilities, while
continuing to optimize the global footprint and create
a smaller, less complex organisation. At the end of the
financial year, Bang & Olufsen had 2,015 full time em-
ployees worldwide.
Strengthening of management
Changes occurred to the Board of Directors and Exe-
cutive Management during the year. At the Annual
BANG & OLUFSEN A/S ANNUAL REPORT 2014/15 · 5
KEY FIGURES · MANAGEMENT REPORT · STRATEGY & OUTLOOK · GOVERNANCE · ANNUAL ACCOUNTS · STATEMENTS
ABOUT BANG & OLUFSEN · SHAREHOLDER LETTER · FINANCIAL REVIEW · RETAIL DEVELOPMENT INNOVATION · PRODUCT LAUNCHES · CSR · THE BANG & OLUFSEN SHARE

General Meeting in September, Andre Loesekrug-Pietri
and Rolf Eriksen stepped down from the Board and
were replaced by Albert Bensoussan and Mads Nipper.
In August 2014 Anders Aakær Jensen joined Bang &
Olufsen as Executive Vice President and CFO. In addi-
tion, Stefan Persson joined the company as Executive
Vice President and COO from October 2014. Executive
Management now consists of CEO Tue Mantoni, CFO
Anders Aakær Jensen and COO Stefan Persson.
Dividend policy and capital structure
At the end of 2014/15 the company received significant
proceeds from the Automotive transaction. Nonethe-
less, due to the company’s vulnerable situation, histori-
cal earnings volatility, the fact that the new strategy is
not yet proven, and the fact that the company’s bank
debt facilities have been repaid, the Board of Directors
will re commend to the AGM that no dividend is paid to
the shareholders.
The company is currently undergoing a significant
transformation. When the new strategy starts to gain
traction the Board of Directors will establish a long
term capital structure and will reconsider distribution
of capital to the shareholders.
The future
With the solid financial foundation created in 2014/15,
the company will focus on further strengthening the
Bang & Olufsen and B&O PLAY brands and continue
the journey of creating a more agile, less complex and
more profitable company that again begins to offer an
attractive return to the shareholders.
Focus for the Bang & Olufsen branded business will be
to address scale issues in product development by in-
creasing the use of technology partners in areas where
Bang & Olufsen can benefit from the partners’ scale
and technology. At the same time, the company will fo-
cus on protecting and enhancing the value of the Bang
& Olufsen high-end brand by keeping innovation at a
high level and continue strengthening the customer
experience in the Bang & Olufsen branded distribution.
B&O PLAY will broaden the headphones and portable
audio portfolio by building on the success of the exist-
ing products, the unique capabilities within acoustics
and design, and continued use of outsourcing partners,
while aggressively expanding distribution.
To turn around the Group and restore profitability and
to ensure that costs for shared functions are eliminated
following the Automotive transaction, strong emphasis
will be given to further reduce complexity across the
company and lower the costs and net working capital.
The increased level of innovation, the growth momen-
tum in B&O PLAY, slimming down the operational asset
base, the sharper strategic focus and focused execu-
tion are expected to drive profitable growth in the
Bang & Olufsen Group.
Best regards,
Ole Andersen Tue Mantoni
Chairman President & CEO
BANG & OLUFSEN A/S ANNUAL REPORT 2014/15 · 6
KEY FIGURES · MANAGEMENT REPORT · STRATEGY & OUTLOOK · GOVERNANCE · ANNUAL ACCOUNTS · STATEMENTS
ABOUT BANG & OLUFSEN · SHAREHOLDER LETTER · FINANCIAL REVIEW · RETAIL DEVELOPMENT INNOVATION · PRODUCT LAUNCHES · CSR · THE BANG & OLUFSEN SHARE

BeoLab 18
Inspired by the legendary BeoLab 8000 speaker, BeoLab 18 honours the classic, slender, and straight-lined beauty of that same vertical silhouette. BeoLab 18 delivers exceptional wireless performance to achieve peerless home acoustics without compromise.
BANG & OLUFSEN A/S ANNUAL REPORT 2014/15 · 7
KEY FIGURES · MANAGEMENT REPORT · STRATEGY & OUTLOOK · GOVERNANCE · ANNUAL ACCOUNTS · STATEMENTS

KEY FIGURES
Bang & Olufsen a/s – Group (DKK million) 2014/15 2013/14* 2012/13* 2011/12* 2010/11*
Income statementRevenue 2,356 2,162 2,814 3,008 2,867Gross margin, % 24.6 38.4 38.9 40.4 40.3Earnings before interest, taxes, depreciation, amortisation and capitalisation (EBITDAC) (535) (95) (107) 99 48Earnings before interest, taxes, depreciation and amortisation (EBITDA) (376) 81 144 379 299Earnings before interest and tax (EBIT) (807) (261) (187) 122 60Financial items, net (6) (29) (25) (16) (20)Earnings before tax (EBT) (803) (286) (210) 104 40Earnings after tax, continued operations (607) (228) (210) 104 40Earnings after tax, discontinued operations 664 199 - - -Earnings after tax 57 (29) (159) 73 28 Financial position: Total Assets 3,449 2,892 2,757 2,892 2,508Share capital 432 393 393 362 362Equity 1,921 1,604 1,640 1,626 1,538Net interest-bearing deposit/(debt) 788 (374) (273) (248) (85)Net working capital 261 657 557 613 451 Cash flow: – from operating activities 55 184 127 225 320– from investment activities 858 (285) (328) (380) (318) – acquisition of tangible assets (83) (82) (84) (121) (96)– free cash flow 913 (101) (202) (155) 2– from financing activities 233 64 171 134 (100)Cash flow for the period 1,146 (37) (30) (21) (98) Key figures: EBITDA-margin, % (16.0) 3.8 5.1 12.3 10.4EBIT-margin, % (34.3) (12.1) (6.6) 4.1 2.1NIBD/EBITDA ratio - 4.6 1.9 0.7 0.3Return on assets, % (36.1) (10.6) (7.6) 5.2 2.8Return on invested capital, excl. goodwill, % (41.5) (0.9) 2.4 17.4 13.3Return on equity, % 3.2 (1.8) (9.7) 4.6 1.8 Full time employees at the end of the period 2,015 2,180 2,036 2,106 2,008 Stock related key figures: Earnings per share (EPS), DKK 1 (1) (4) 2 1Earnings per share from continuing operations (EPS), DKK (14) (6) (4) 2 1Earnings per share, diluted (EPS-D), DKK 1 (1) (4) 2 1Earnings per share from continuing operations (EPS-D), DKK (14) (6) (4) 2 1Price/Earnings 44 (84) (13) 30 96
For definitions refer to Section 5.8
* Comparative figures for the 2013/14 income statement have been adjusted in order to reflect that the discontinuing operations have been separated. Figures for 2012/13, 2011/12 and 2010/11 have not been adjusted.
BANG & OLUFSEN A/S ANNUAL REPORT 2014/15 · 8
KEY FIGURES · MANAGEMENT REPORT · STRATEGY & OUTLOOK · GOVERNANCE · ANNUAL ACCOUNTS · STATEMENTSKEY FIGURES

BeoPlay H6
BeoPlay H6 combines a natural and authentic sound performance with carefully selected, high-quality materials that rest softly and comfortably on your head, bringing a true sense of everyday luxury.
BANG & OLUFSEN A/S ANNUAL REPORT 2014/15 · 9
KEY FIGURES · MANAGEMENT REPORT · STRATEGY & OUTLOOK · GOVERNANCE · ANNUAL ACCOUNTS · STATEMENTS

FINANCIAL REVIEW2014/15 was financially challenging for Bang & Olufsen’s continuing business, which showed healthy revenue growth but unsatisfactory
underlying earnings. A number of significant steps, including a brand license agreement and the sale of the Automotive assets were taken to
sharpen the company’s strategic focus, thereby strengthening the capital structure and creating a leaner, more agile business model on which a
profitable, growing company can be built.
Revenue
Revenue in Bang & Olufsen Group continuing opera-
tions was DKK 2,356 million in 2014/15, which is DKK
195 million higher than last year, corresponding to an
increase of 9 per cent which was in line with guidance
for the year. Both the Bang & Olufsen and the B&O
PLAY segments showed growth in the financial year,
driven by new and innovative products, and expansion
of the distribution, especially within the third party
retail. Revenue declined by 2 per cent during the first
half of the financial year, but regained momentum and
grew by 19 per cent in the second half of the year. Rev-
enue in the discontinued operations declined by DKK
67 million.
The Bang & Olufsen segment generated revenue of
DKK 1,743 million in the 2014/15 financial year against
DKK 1,628 million last year, corresponding to an in-
crease of 7 per cent. The first half of the 2014/15 was
adversely impacted by ramp up issues related to the
launch of the BeoVision Avant, and the knock-on ef-
fects on the launch of other products. However, during
the second half of the financial year, the growth mo-
mentum was regained.
47 per cent of the revenue in the continuing business
was generated from the TV category (incl. BeoPlay V1)
compared to 43 per cent in 2013/14. The BeoVision
Avant was well received by customers, and was the
main driver revenue growth in the TV category.
Revenue in the Audio category declined to 5 per cent
of revenue from 8 per cent in 2013/14. The launch of
a multiroom functionality in the audio category, com-
bined with the BeoSound Moment, is expected to
increase the share of revenue generated by the Audio
category going forward.
The share of revenue from speaker sales was 18 per
cent compared to 20 per cent last year. Last year was
positively impacted by the launch of a broad range of
wireless speakers in Bang & Olufsen. In addition, the
speaker category in general is negatively impacted by
the declining Audio sales.
During the 2014/15 financial year, B&O PLAY generated
revenue of DKK 613 million against DKK 534 million
last year corresponding to a growth of 15 per cent.
B&O PLAY showed strong growth through third party
channels, which grew by 80 per cent compared to last
financial year, while revenue through the B1 and shop-
in-shop channel declined by 7 per cent. The overall
growth was driven by a series of product launches,
where especially the BeoPlay A2 and BeoPlay H8
BANG & OLUFSEN A/S ANNUAL REPORT 2014/15 · 10
KEY FIGURES · MANAGEMENT REPORT · STRATEGY & OUTLOOK · GOVERNANCE · ANNUAL ACCOUNTS · STATEMENTS
ABOUT BANG & OLUFSEN · SHAREHOLDER LETTER · FINANCIAL REVIEW · RETAIL DEVELOPMENT INNOVATION · PRODUCT LAUNCHES · CSR · THE BANG & OLUFSEN SHARE
FINANCIAL REVIEW

performed well, as well as a significant growth in the
number of third party stores.
Gross margin
As a result of the Automotive transaction and the
sale of the 33 per cent stake in Medicom as well as
the revised strategy, the company has reassessed the
value of certain assets of the continuing business. This
resulted in value adjustments of the tangible assets,
investment property, inventory, and specific trade re-
ceivables. The adjustments have no cash effect for the
company. However, the changes did have a significant
on the gross margin and capacity cost of the continu-
ing business.
The Group’s reported gross margin for the continuing
operations in the 2014/15 financial year was 24.6 per
cent. Adjusting for non-recurring and aperiodic items
and costs and license fees previously allocated to the
discontinued operations, the gross margin was 37.2 per
cent. The gross margin for the continuing business was
38.4 per cent last year.
The non-recurring and aperiodic items impacting the
gross profit in 2014/15 totaled DKK 171 million and were
related to:
• Revaluation of inventory values on service stock and
terminated products corresponding to DKK 62 mil-
lion. This was partly due to the reassessment of the
future service obligations as well as the strategic de-
cision to discontinue certain products and focus on
the best selling products.
• Write down of fixed assets, primarily production fa-
cilities, corresponding to DKK 17 million.
• Adverse effects on indirect production costs from
the write–down of inventory and other adjustments
corresponding to DKK 36 million.
• Ramp-up issues related to the launch of the BeoVi-
sion Avant in the first half of 2014/15, which impacted
gross profit by approximately DKK 19 million.
• Other items related to restructuring in the fourth
quarter of DKK 36 million.
The gross margin for the Bang & Olufsen segment in
the financial year was 26.5 per cent. Adjusting for the
above mentioned non-recurring and aperiodic items the
gross margin was 35.2 per cent. The gross margin was
44.1 per cent in the last financial year. The underlying
* The BeoPlay V1 is included in the TV revenue
Share of revenue 2014/15 – (%) Share of revenue 2013/14 – (%)
B&O PLAY** – 25%
B&OPLAY
Bang &Olufsen
Other – 5%
Speakers – 18%
Audio – 5%
TV* – 47%
B&O PLAY** – 22%
Other – 7%
Speakers – 20%
Audio – 8%
TV* – 43%B&OPLAY
Bang &Olufsen
BANG & OLUFSEN A/S ANNUAL REPORT 2014/15 · 11
KEY FIGURES · MANAGEMENT REPORT · STRATEGY & OUTLOOK · GOVERNANCE · ANNUAL ACCOUNTS · STATEMENTS
ABOUT BANG & OLUFSEN · SHAREHOLDER LETTER · FINANCIAL REVIEW · RETAIL DEVELOPMENT INNOVATION · PRODUCT LAUNCHES · CSR · THE BANG & OLUFSEN SHARE

gross margin was negatively impacted by a changed
product mix, as the TVs category generally has a lower
gross margin than the Speakers and Audio category.
The gross margin for B&O PLAY in the 2014/15 financial
year was 27.2 per cent. The non-recurring and aperi-
odic items described above only had a minor impact
on the B&O PLAY gross margin, hence resulting in an
underlying gross margin of 30.2 per cent. The gross
margin was 31.8 per cent last year. The decline in gross
margin mainly relates to a change in the product mix in
the segment, and a larger share of revenue from third
party retailers.
In addition, the gross profit was affected by costs for
shared functions and license fees previously allocated
to Automotive of DKK 124 million.
During the second half of the year, the Group took
several initiatives to improve the gross margin includ-
ing the restructuring of the AV business (See Company
Announcement no. 14.25). These improvements are ex-
pected to take effect during 2015/16, which will result
in an improved gross margin in 2015/16 compared to
2014/15.
Capacity costs
The reported capacity costs for the continuing business
were DKK 1,387 million in 2014/15. As mentioned above,
the capacity costs were adversely affected by non-re-
curring and aperiodic, non-cash items mainly related to
the Automotive transaction and the revised strategy as
well as costs for shared functions and license fees pre-
viously allocated to the discontinued operations. These
amounted to DKK 189 million for the 2014/15 financial
year. The underlying capacity costs were DKK 1,198 mil-
lion, compared to DKK 1,090 million last year.
The non-recurring and aperiodic costs were related to:
• Restructuring of the Bang & Olufsen business corre-
sponding to DKK 16 million
• Impairment of buildings following the sale of the
Automotive assets and Medicom of DKK 22 million
• An impairment of development assets and an assess-
ment of warranty provisions in line with the strategy
to focus on the most innovative and best selling
products of DKK 36 million
Revenue and growth by segment – (DKK million)
0
500
1000
1500
2000
2500
0
500
1,000
1,500
2,000
2,500
Bang & Olufsen
FY 13/14 Graf-data er her indtakt - ret i denne og kopier,ungroup og flyt 1. hold søjler 2 mm til højre,2. hold 5 mm og 3. hold 8 mm til højre.
B&O PLAY TotalContinuing
business
FY 14/15
+7%
+15%
+9%
Gross margin by segment – (%)
FY 13/14
FY 14/15
0
10
20
30
40
50
0
10
20
30
40
50
Graf-data er her indtakt - ret i denne og kopier,ungroup og flyt 1. hold søjler 2 mm til højre,2. hold 5 mm og 3. hold 8 mm til højre.
Bang & Olufsen B&O PLAY Totalcontinuingbusiness
BANG & OLUFSEN A/S ANNUAL REPORT 2014/15 · 12
KEY FIGURES · MANAGEMENT REPORT · STRATEGY & OUTLOOK · GOVERNANCE · ANNUAL ACCOUNTS · STATEMENTS
ABOUT BANG & OLUFSEN · SHAREHOLDER LETTER · FINANCIAL REVIEW · RETAIL DEVELOPMENT INNOVATION · PRODUCT LAUNCHES · CSR · THE BANG & OLUFSEN SHARE

• Provisions for losses on specific debtors and other
adjustments following the strategy to lift the quality
of the network of DKK 42 million
• Other non-recurring and aperiodic items of DKK 17
million
In addition to these items, the continuing business was
adversely impacted by the costs for shared functions,
which were previously allocated to the discontinued
business of approximately DKK 57 million. Final closing
of the Automotive transaction was completed on 29
May, and pursuant to the agreement Bang & Olufsen
will continue to deliver services to HARMAN during
a transition period. During this transition period, the
Group will work to adapt the capacity costs, to align
with the future activity level of the Group.
Distribution and marketing costs were DKK 862 mil-
lion in the 2014/15 financial year compared to DKK 732
million last year. This corresponds to an increase of
DKK 130 million of which approximatly DKK 42 million
relates to provisions for losses on specific debtors and
other non-recurring and aperiodic costs as mentioned
above. The remaining increase mainly relates to in-
creased marketing of new products in Bang & Olufsen
as well as B&O PLAY.
Administrative costs for the continuing business
amounted to DKK 77 million, which was an increase
of DKK 11 million compared to last year, due to various
cost savings, partly offset by a gain of DKK 11 million in
2013/14 relating to the sale and lease back in the Czech
Republic.
Development costs recognised as an expense (incl.
amortization and impairment losses) were DKK 449
million compared to DKK 293 million last year. The de-
velopment costs included non-recurring and aperiodic
costs of DKK 90 million as described above, related
to the impairment of development projects and other
non-recurring and aperiodic cost.
The capitalized development costs were DKK 159 mil-
lion for the continuing business in the financial year,
compared to DKK 176 million last year, corresponding
to a capitalization rate of 43.1 per cent compared to
61.8 per cent last year.
Total amortization charges and impairment losses on
development projects were DKK 238 million compared
to DKK 184 million last year. The net effect on earnings
before interest and tax (EBIT) of the continuing busi-
ness, from amortisation and capitalization was negative
DKK 79 million compared to DKK 8 million last year.
EBIT in the continuing business was negative DKK 807
million for the 2014/15 financial year. The underlying
EBIT (i.e. adjusting for non-recurring, aperiodic costs
as well as costs for shared functions and license fees
previously allocated to discontinued operations) was
negative DKK 323 million. This was below guidance of
negative DKK 230 – 260 million. EBIT for the continu-
ing business was negative DKK 261 million last year.
Financial items, net for the year was negative DKK 6
million compared to negative DKK 29 million last year.
The development mainly relates to positive exchange
rate gains.
Capitalised development costs and carrying amount
(DKK million)
2014/15 B2C
Capitalised, net 159
Carrying amount, net 392
2013/14 B2C
Capitalised, net 178
Carrying amount, net 471
BANG & OLUFSEN A/S ANNUAL REPORT 2014/15 · 13
KEY FIGURES · MANAGEMENT REPORT · STRATEGY & OUTLOOK · GOVERNANCE · ANNUAL ACCOUNTS · STATEMENTS
ABOUT BANG & OLUFSEN · SHAREHOLDER LETTER · FINANCIAL REVIEW · RETAIL DEVELOPMENT INNOVATION · PRODUCT LAUNCHES · CSR · THE BANG & OLUFSEN SHARE

Tax on earnings for the year for continuing business
was positive DKK 195 million compared to DKK 59 mil-
lion last year. Tax on earnings for discontinued business
was 20 million including tax impact from Automotive
transaction compared with DKK 65 million last year.
Net earnings for the 2014/15 financial year for the con-
tinuing operations were negative DKK 607 million.
Net earnings from discontinued operations (i.e. Auto-
motive and ICEpower) were positive DKK 664 million.
The result was driven by the net result from discontin-
ued operations of DKK 172 million for the year and the
net gain (i.e. after tax and book value of assets) from
the sale of the Automotive assets of DKK 492 million.
The net earnings for the Group was positive DKK 57
million for the 2014/15 financial year, compared to neg-
ative DKK 29 million last year.
Development in balance sheet items and cash flow
As a result of the Automotive transaction and the sale
of the 33 per cent stake in Medicom as well as the re-
vised strategy, the company has reassessed the value
of certain assets of the continuing business. This result-
ed in a value adjustment of the intangible and tangible
assets, investment property and inventory. The change
had no cash effect for the company.
The investment in intangible assets in the continuing
business was DKK 209 million, of which the main part
relates to development projects, corresponding to 9
per cent of revenue. Last year’s investment level was 11
per cent (incl. Automotive and ICEpower). The invest-
ment in tangible assets was DKK 83 million compared
to DKK 82 million last year.
At the end of the 2014/15 financial year the net work-
ing capital of the continuing business was DKK 261
million compared to DKK 657 million at the end of the
financial year 2013/14. Approximately DKK 145 million
of the reduction was a result of the discontinuation of
ICEpower and Automotive. The remaining reduction
mainly came from inventory value adjustments and
write downs on receivables as well as higher payables.
Free cash flow in the 2014/15 financial year was DKK
913 million compared to negative DKK 101 million last
year. The free cash flow was positively impacted by
DKK 1,123 million from the sale of activities. Adjusting
for this, the free cash flow for the year was negative
DKK 210 million. This was mainly due to a negative free
cash flow of DKK 281 million during the first half of the
year, while the free cash flow during the second half
of the year was positive DKK 70 million adjusted for
the gain from the sale of assets. The free cash flow in
the last financial year was positively affected by a non-
recurring positive impact from DKK 79 million from the
disposal of the land and production facilities owned by
Bang & Olufsen s.r.o. in the Czech Republic.
At the end of the financial year, the company had a net
interest bearing deposit of DKK 788 million, compared
to a net interest bearing debt of DKK 374 million at the
end of 2013/14. The improvement related to the cash
received from the Automotive transaction.
In June 2014 Bang & Olufsen a/s carried out a capital
increase through a private placement at market price
using an accelerated book-building process. The capi-
tal increase represented 3,927,042 shares of a nominal
value of DKK 10 each and generated net proceeds of
DKK 250 million.
Group equity increased to DKK 1,921 million from DKK
1,604 million last year. The increase in the equity was
mainly the result of the Automotive transaction and the
capital increase made in the first quarter of the 2014/15
financial year. The Group equity ratio was 56 per cent
at the end of the 2014/15 financial year against 55 per
cent at the end of the 2013/14 financial year.
Subsequent events
No significant subsequent events have occured after 31
May 2015.
BANG & OLUFSEN A/S ANNUAL REPORT 2014/15 · 14
KEY FIGURES · MANAGEMENT REPORT · STRATEGY & OUTLOOK · GOVERNANCE · ANNUAL ACCOUNTS · STATEMENTS
ABOUT BANG & OLUFSEN · SHAREHOLDER LETTER · FINANCIAL REVIEW · RETAIL DEVELOPMENT INNOVATION · PRODUCT LAUNCHES · CSR · THE BANG & OLUFSEN SHARE

RETAIL DEVELOPMENTDuring the 2014/15 financial year, the focus on lifting the retail experience
and creating a strong, sustainable retail network continued. Upgraded retail training programmes, innovative retail merchandising and
marketing initiatives and an increased focus on the best and high-potential stores contributed to an increase in sales per retailer and positive same-store-sales growth for the year.
Retail strategy
During the 2014/15 financial year, work has continued
to attract new retail partners to create a strong and
profitable network of stores, which can invest in ser-
vice, events, marketing, store design and other custom-
er focused activities. During the year 78 new B1-stores
and shop-in-shops have opened, primarily in Europe.
This was however surpassed by the closure of 88 low
performing stores during the year, thereby leading to a
reduction in the number of B1 and shop-in-shops to 714
from 724 last year.
A key focus area for the year has been to strengthen
the in-store customer experience. This has been done
through initiatives such as the Bang & Olufsen Retail
Academy and a strengthening of the product dem-
onstration tools. During the year, the roll-out of the
new store design has continued. The store design has
a strong emphasis on Bang & Olufsen’s core capabili-
ties within acoustics, design and craftsmanship and is
designed to create a unique shopping experience for
Bang & Olufsen’s customers.
Growth by region – excluding third party retail
-8
-6
-4
-2
0
2
4
6
8
Europe North America BRIC Rest of World Total
FY 14/15
%
1) Europe covers Austria, Belgium, Denmark, France, Germany, Italy, Netherlands, Norway, Spain, Sweden, Switzerland and United Kingdom.
2) North America covers USA, Canada and Mexico.3) BRIC covers Brazil, Russia, India and Greater China (Mainland
China, Hong Kong, Korea and Taiwan).
BANG & OLUFSEN A/S ANNUAL REPORT 2014/15 · 15
KEY FIGURES · MANAGEMENT REPORT · STRATEGY & OUTLOOK · GOVERNANCE · ANNUAL ACCOUNTS · STATEMENTS
ABOUT BANG & OLUFSEN · SHAREHOLDER LETTER · FINANCIAL REVIEW · RETAIL DEVELOPMENT INNOVATION · PRODUCT LAUNCHES · CSR · THE BANG & OLUFSEN SHARE
RETAIL DEVELOPMENT

In addition to improving the company distribution
through B1 stores and shop-in-shops, it has been a key
focus area to increase the revenue through alternative
channels distribution for the B&O PLAY brand. The
interest from third party retailers to market the B&O
PLAY products has been strong, and during the year,
distribution agreements were signed with large dis-
tributors across the world.
B&O PLAY therefore increased the distribution to
more than 3,300 third party retail stores at the end of
2014/15 from 2,400 stores at the end of February 2015
and 1,400 stores at the end of May 2014, and thereby
significantly increased the brand presence and revenue
in third party channels.
In addition, B&O PLAY continued to leverage the e-
commerce platform, making it simple and easy for cus-
tomers to shop B&O PLAY products online.
Development in Bang & Olufsen’s revenue by region
During the 2014/15 financial year, the European region
saw an increase in revenue of DKK 87 million from DKK
1,335 million to DKK 1,422 million, corresponding to 6
per cent. The growth was driven by the launch of new
and innovative products as well as a stabilization and
an emerging strengthening of the retail network.
Revenue in North America increased by DKK 5 million
to DKK 165 million in the 2014/15 financial year, cor-
responding to an increase of 3 per cent compared to
the 2013/14 financial year. Revenue in North America
was positively impacted by a strengthening of the US
dollar. The underlying performance of the market was
weak and adversely affected by the closure of stores.
BRIC revenue was almost unchanged of DKK 307 mil-
lion. The revenue in the BRIC markets was adversely
impacted by the crisis in Russia where revenue de-
clined by approximately DKK 35 million.
Revenue for the Rest of World decreased by DKK 7
million to DKK 218 million in the 2014/15 financial year,
corresponding to a decrease of 3 per cent compared to
the 2013/14 financial year.
Distribution development
At the end of May 2015 the Bang & Olufsen and B&O
PLAY products were distributed through 525 B1 stores
and 189 shop-in-shops. In addition, the B&O PLAY
products were distributed through approximately
TPR stores
0
500
1,000
1,500
2,000
2,500
3,000
3,500
4,000
11/12 13/14 14/1512/13
B1-shops per region
0
50
100
150
200
250
300
350
400
Europe
31.05.14
North America
31.05.15
BRIC Rest of World
BANG & OLUFSEN A/S ANNUAL REPORT 2014/15 · 16
KEY FIGURES · MANAGEMENT REPORT · STRATEGY & OUTLOOK · GOVERNANCE · ANNUAL ACCOUNTS · STATEMENTS
ABOUT BANG & OLUFSEN · SHAREHOLDER LETTER · FINANCIAL REVIEW · RETAIL DEVELOPMENT INNOVATION · PRODUCT LAUNCHES · CSR · THE BANG & OLUFSEN SHARE

3,300 third party retail stores as well as online. The
broad global distribution ensures that existing as well
as potential customers are exposed to Bang & Oluf-
sen’s unique capabilities within acoustics, design and
craftsmanship.
Revenue to B1 stores and shop-in-shop stores which
have been in operation for more than 24 months in-
creased by 2 per cent for B1 stores and 10 per cent for
shop-in-shops.
Store development
B1 31.05.14 Openings Closures Conversions 31.05.15
Europe 347 19 (31) (1) 334
North America 47 1 (7) (5) 36
BRIC 68 5 (5) (3) 65
Rest of World 87 10 (9) 2 90
Total 549 35 (52) (7) 525
BANG & OLUFSEN A/S ANNUAL REPORT 2014/15 · 17
KEY FIGURES · MANAGEMENT REPORT · STRATEGY & OUTLOOK · GOVERNANCE · ANNUAL ACCOUNTS · STATEMENTS
ABOUT BANG & OLUFSEN · SHAREHOLDER LETTER · FINANCIAL REVIEW · RETAIL DEVELOPMENT INNOVATION · PRODUCT LAUNCHES · CSR · THE BANG & OLUFSEN SHARE

INNOVATIONThe Bang & Olufsen Group’s strong position in innovation was
reaffirmed in 2014/15 with many new and pioneering product launches. BeoSound Moment, the expansion in the award-winning BeoVision Avant
TV portfolio and the enlargement of the B&O PLAY product portfolio were key in positioning the company to continue to deliver
world-class products and services to the market.
Bang & Olufsen launched many new, innovative prod-
ucts during the 2014/15 financial year, which clearly
demonstrated Bang & Olufsen’s unique capabilities
within acoustics, design and craftsmanship.
The Bang & Olufsen audio portfolio was expanded with
the pioneering BeoSound Moment – the modern and
cloud based wireless music system. Moment includes a
touch-on-wood feature, which combines craftsmanship
traditions and the high-tech world, and allows the user
to access exactly the sound experience that fits the
daily rhythm by one-touch.
BeoSound Moment includes several other ground-
breaking features including an intelligent algorithm
that over time learns the rhythm of the user’s home.
PatternPlay tracks what the BeoSound Moment is play-
ing, what day of the week and what time of the day. It
learns from every interaction and the more it is used
the smarter becomes. Touch the wheel and it starts to
playback the music or radio, which is typically listened
to that day of the week and that time of the day. The
MoodWheel is an instant one-touch interface on top of
the integrated Deezer music streaming service and the
user’s own music collection based on the NAS drive or
iTunes on the PC/MAC. With the MoodWheel, the user
can adjust the music to how they want to feel and what
atmosphere they want to create.
Bang & Olufsen expanded the TV portfolio with the Beo-
Vision Avant 75 and 85-inch Ultra High Definition (UHD)
TV. The Avant TV family accentuates Bang & Olufsen’s
high level of innovation. The BeoVision Avant has been
conceived building on core Bang & Olufsen competences
within acoustics, design and craftsmanship. The nicely or-
chestrated mechanical movements of speakers and stands
make the Avant a perfect fit in the modern homes of Bang
& Olufsen’s customers. In January 2015 the BeoVision
Avant was awarded the Design and Engineering Honou-
ree Status in High Performance Home Audio at CES.
B&O PLAY expanded the product portfolio by many
new and innovative products during the year. In
November, the BeoPlay H2 on-ear headphone was
launched, and in January 2015 the BeoPlay H8 wireless
on-ear headphones was added to the portfolio. The
BeoPlay H8 features an innovative aluminium touch
interface on the right ear cup, active noise cancellation,
Bluetooth 4.0 and up to 14 hours of battery lifetime.
The B&O PLAY wireless audio portfolio was expanded
with BeoPlay A2 and Beolit 15. Both BeoPlay A2 and
Beolit 15 feature B&O PLAYs True360 omni-directional
sound technology and latest 4.0 Bluetooth technology
that ensures best-in-class streaming performance.
To ensure that TV and audio products continue to be
up-to-date, Bang & Olufsen has made a commitment to
its customers to provide regular feature and function-
ality enhancements through software updates.
BANG & OLUFSEN A/S ANNUAL REPORT 2014/15 · 18
KEY FIGURES · MANAGEMENT REPORT · STRATEGY & OUTLOOK · GOVERNANCE · ANNUAL ACCOUNTS · STATEMENTS
ABOUT BANG & OLUFSEN · SHAREHOLDER LETTER · FINANCIAL REVIEW · RETAIL DEVELOPMENT INNOVATION · PRODUCT LAUNCHES · CSR · THE BANG & OLUFSEN SHARE
R OG D

Q1 Q2
Product launches in FY 2014/2015
BEOPLAY S8August The flexible and compact BeoPlay S8 stereo system comprises an 8-inch subwoofer powered by a dedicated 280 watts amplifier and two satellite speakers, each powered by a dedicated 140 watts amplifier. BeoPlay S8 connects to almost all streaming devices, hooks up to “regular” audio amplifiers, or connects to BeoPlay V1 or any Bang & Olufsen television.
BEOPLAY H6 SPECIAL EDITIONAugust Graphite Blush, Bronzed Hazel and Blue Stone are special editions of BeoPlay H6. The special editions of the popular headphones bring an edge that makes them particularly interesting for youthful, design affectionate professionals looking for that something special that stands out.
AUTOMOTIVEJune Bang & Olufsen announced the launch of a bespoke system for the 2014 Audi S7 powered by the company’s new amplifier, the BeoCore. The amplifier generates 1,440 watts of power for the 15 loudspeakers.
July Bang & Olufsen announced the launch of a high-end surround sound system for the new BMW X6. The system features model specific sound tuning, anodised aluminium grilles, Acoustic Lens Technology, and a motorised opening centre speaker unit – and delivers a total of 1,200 watts of audio power.
BEOVISION AVANT 85September The new 85-inch flagship television displays Ultra High-Definition (4K) picture, and with eight integrated driver units and a surround sound module BeoVision Avant 85 provides sound performance unlike any other TV. BeoVision Avant 85 is a state-of-the-art product at a competitive price for a television of this size and level of innovation.
BEOPLAY A2October BeoPlay A2 is a portable Bluetooth speaker with 360 degrees of sound, and it has enough battery power to keep the music playing for up to 24 hours on a single battery charge. Designed by industrial designer Cecilie Manz, BeoPlay A2 has a flat design with two rugged polymer shells and a solid aluminium core.
BEOPLAY H2November BeoPlay H2 is a new ultra flexible, on-ear headphone weighing in at a modest 150 grams. Despite the low weight it is a very strong and wear-resistant headphone, made from durable composites and rugged textiles, and with smooth, genuine lambskin covering the ears.
BEOPLAY H6 WITH DJ KHALEDNovember A new collaboration between B&O PLAY and HEADS Innovation was announced. This has resulted in the US launch of BeoPlay H6 with DJ Khaled, an American music producer and DJ.
AUTOMOTIVENovember Bang & Olufsen announced the launch of the Bang & Olufsen Sound System for the new Audi TT Roadster. The system features 12 active loud- speakers and delivers a total output of 680 watts.
BANG & OLUFSEN A/S ANNUAL REPORT 2014/15 · 19
KEY FIGURES · MANAGEMENT REPORT · STRATEGY & OUTLOOK · GOVERNANCE · ANNUAL ACCOUNTS · STATEMENTS
ABOUT BANG & OLUFSEN · SHAREHOLDER LETTER · FINANCIAL REVIEW · RETAIL DEVELOPMENT INNOVATION · PRODUCT LAUNCHES · CSR · THE BANG & OLUFSEN SHARE
PRODUCT LAUNCHES

Q3 Q4
Product launches in FY 2014/2015
BEOLIT 15February Beolit 15 is a portable Bluetooth speaker with True360 omni-directional sound, 240 watts of peak power, up to 24 hours of continuous playtime from a single battery charge and featuring materials such as anodised aluminium and full grain leather. Beolit 15 is designed by Danish designer Cecilie Manz.
AUTOMOTIVEJanuary Bang & Olufsen presented the Bang & Olufsen 3D Advanced Sound System for the all new Audi Q7. The system is powered by Bang & Olufsen’s Class-D BeoCore amplifier and delivers over 1,900 watts of efficient power. The system consists of 23 loudspeakers.
February BMW and Bang & Olufsen unveiled the new BMW 6 Series with bespoke Bang & Olufsen high-end surround sound system. With its 16 fully active loudspeakers, the system delivers 1,200 watts of power.
BEOVISION AVANT 75January Bang & Olufsen introduced a 75-inch version of BeoVision Avant. BeoVision Avant 75 also displays Ultra High-Definition (4K) picture, and with eight integrated driver units and a surround sound module it provides sound performance unlike any other TV.
BEOSOUND MOMENTJanuary The modern and cloud based wireless music system BeoSound Moment has a detachable and double-sided interface that allows for two different user experiences. One side is an aluminium interface with a touch screen for interaction, and the other side holds the world´s first touch-sensitive wood interface designed for one-touch access. BeoSound Moment is compatible with the whole Bang & Olufsen range of wireless and wired speakers.
BEOPLAY H8January The new wireless on-ear headphones BeoPlay H8 feature an innovative aluminium touch interface placed on the right ear cup, active noise cancellation, Bluetooth 4.0 and up to 14 hours of battery lifetime. Nevertheless, BeoPlay H8 is one of the lightest active noise cancellation headphones on the market.
BEOPLAY A2 BLACK COPPERMay B&O PLAY introduces a new Black Copper edition of the BeoPlay A2 Bluetooth speaker. The Black Copper edition joins the already existing grey, green and black editions that made Bang & Olufsen history by becoming the fastest selling product in the history of the company.
LOVE AFFAIR COLLECTIONMarch Bang & Olufsen commemorates its 90th Anniversary with the Love Affair Collection, which is a carefully selected range of iconic Bang & Olufsen products in a rose golden nuance. The Love Affair Collection consists of BeoVision Avant 85, BeoVision 11-46, BeoLab 5, BeoLab 19, BeoRemote One, BeoPlay A9, BeoPlay H6 and BeoLab 18 with a new walnut lamella front.
ICEPOWERApril 700ASC2 is the newest addition to ICEpower’s broad range of Class D amplifiers and the company’s most powerful two-channel solution to date with an output power of 2 x 700 watts. 700ASC2 opens up for endless design applications within consumer and professional audio products such as active speakers, subwoofers and PA amplifiers.
AUTOMOTIVEMarch The Bang & Olufsen Sound System in the new Audi R8 debuts in Geneva. The new Audi R8 features 13 active loudspea-kers, each with their own dedicated amplifier channel including a subwoofer placed into the cavity of the front wheel liner.
BEOPLAY H6 RAPHA EDITIONMay The BeoPlay H6 Rapha Edition over-ear headphones is designed in close collaboration with British cycling brand Rapha.
BEOPLAY H3 OCEAN BLUEMay B&O PLAY introduces a combination consisting of the special edition BeoPlay H3 Ocean Blue headphones together with POINT, a leather and felt pouch from Hard Graft.
BANG & OLUFSEN A/S ANNUAL REPORT 2014/15 · 20
KEY FIGURES · MANAGEMENT REPORT · STRATEGY & OUTLOOK · GOVERNANCE · ANNUAL ACCOUNTS · STATEMENTS
ABOUT BANG & OLUFSEN · SHAREHOLDER LETTER · FINANCIAL REVIEW · RETAIL DEVELOPMENT INNOVATION · PRODUCT LAUNCHES · CSR · THE BANG & OLUFSEN SHARE

CORPORATE SOCIAL RESPONSIBILITY
The Bang & Olufsen logo is a quality guarantee as it has been since the company was established in 1925. This is not only related to delivering products of high quality to the customers, but also
related to the way the business is run.
This section summarises Bang & Olufsen’s CSR policy.
A detailed description of Bang & Olufsen’s CSR work
is available in Bang & Olufsen statement of corporate
social responsibility in accordance with the Financial
statement Act §99a.
Bang & Olufsen recognises the UN and ILO declara-
tions regarding human rights, labour rights, environ-
ment and anti-corruption and has therefore chosen to
structure the CSR work, including the CSR policy, in ac-
cordance with the UN Global Compact guidelines.
Bang & Olufsen works systematically with CSR, and is
certified in accordance with ISO 9001 (quality manage-
ment), TS16949 (technical standard for quality within
the automotive industry), ISO 14.001 (environmental
management) and OHSAS 18.001 (work environment
management). The management systems contribute
to ensure that the efforts are concentrated in the areas
with main potential for improvement.
The CSR policy is supported by Bang & Olufsen’s Code
of Conduct, which contains the company’s CSR require-
ments to suppliers. External audits of the suppliers, as
well as their sub-suppliers, are carried out when there is
a concrete suspicion of breach of the Code of Conduct.
Bang & Olufsen’s procurement department has a set of
moral and ethics guidelines, which include internal anti-
corruption guidelines for e.g. gift exchange, negotia-
tion principles and handling of conflicts of interest. The
internal anti-corruption guidelines have been extended
to include the sales organisation, which is especially
relevant for new markets where Bang & Olufsen is cur-
rently expanding the business.
To support the guidelines, Bang & Olufsen has set up a
whistle-blower function, which is an externally run hot-
line to which the employees anonymously can report
suspected unethical behaviour.
Bang & Olufsen’s CSR policy
Bang & Olufsen’s CSR policy states the guidelines for
the Corporate Social Responsibility activities within the
framework of the Bang & Olufsen Group.
BANG & OLUFSEN A/S ANNUAL REPORT 2014/15 · 21
KEY FIGURES · MANAGEMENT REPORT · STRATEGY & OUTLOOK · GOVERNANCE · ANNUAL ACCOUNTS · STATEMENTS
ABOUT BANG & OLUFSEN · SHAREHOLDER LETTER · FINANCIAL REVIEW · RETAIL DEVELOPMENT INNOVATION · PRODUCT LAUNCHES · CSR · THE BANG & OLUFSEN SHARE
CSR

Bang & Olufsen aims to ensure compliance both within
its own organization as well as for partners and suppli-
ers.
Human Rights
Bang & Olufsen aims, in all matters within the Group’s
control, to support and respect the protection of inter-
nationally proclaimed human rights.
Employee Rights
Bang & Olufsen aims to show the greatest degree
of social responsibility towards our employees.
Bang & Olufsen supports the abolition of child labour
and forced labour, and condemns discrimination in em-
ployment and occupation.
Bang & Olufsen attaches great importance to freedom
of association and recognizes the right to collective
bargaining. Bang & Olufsen aims to be a tolerant work-
place where each employee thrives and has the possi-
bility to develop and create a good work-life balance.
Anti-Corruption
Bang & Olufsen strongly disassociates itself from all
kinds of corruption, including extortion and bribery.
Environment and Climate
Bang & Olufsen has an integrated thinking with regard
to the environmental consequences the production and
products have on employees, customers and surround-
ings. We use the word “environment” broadly to cover
the disciplines of work environment, product environ-
ment and external environment.
As a responsible company Bang & Olufsen aims to cre-
ate sustainable products. The considerations involved
in the operation, design, and longevity of products
must be in mutual balance with the environmental im-
pact of production. Bang & Olufsen complies with ex-
isting legislation in the countries where Bang & Olufsen
produces and sells products.
More specifically, Bang & Olufsen aims to focus on the
areas where the right balance between effort and im-
pact can be achieved:
• Improve the work environment and the health and
safety conditions of employees
• Prevent work related illnesses and/or injuries
• Improve and prevent negative environmental impact
from production and products including reduction of
climate impact.
The CSR effort, objectives and results
A detailed description of Bang & Olufsen’s CSR work
and results in the 2014/15 financial year, as well as the
activities and targets for the 2015/16 financial year, are
available in Bang & Olufsen’s statement for Corporate
Social Responsibility (CSR), which is reported in ac-
cordance with the Financial Statements Act §99a. The
statement is available in its entirety on the company’s
homepage [http://www.bang-olufsen.com/CSR-report-
2015-UK], and forms part of the management report
in the Bang & Olufsen Annual Report for the 2014/15
financial year.
The work, objectives, and results are summarised in the
first table below. Detailed comments and explanations
on deviations to targets, can be found in the com-
pany’s full statement on CSR by clicking on the above
mentioned link.
In 2015/16 Bang & Olufsen will continue the work to
improve the working environment and reduce the envi-
ronmental impact of the Group’s activities. Independ-
ent supplier audits will continue with re-audits of the
suppliers where deviations have been found in relation
to Code of Conduct. Bang & Olufsen’s CSR activities
and target for the 2015/16 financial year are summa-
rised in the table below.
BANG & OLUFSEN A/S ANNUAL REPORT 2014/15 · 22
KEY FIGURES · MANAGEMENT REPORT · STRATEGY & OUTLOOK · GOVERNANCE · ANNUAL ACCOUNTS · STATEMENTS
ABOUT BANG & OLUFSEN · SHAREHOLDER LETTER · FINANCIAL REVIEW · RETAIL DEVELOPMENT INNOVATION · PRODUCT LAUNCHES · CSR · THE BANG & OLUFSEN SHARE

CSR activities, objectives and results for 2014/15 (refer to full report published on web for comments on deviations)
Policy area Topic Objective Result 2014/15
Human rights Labour
Independent supplier audits Risk-assessment of supplier base to identify audit need. Conduct audits and follow-up accordingly
2 new suppliers audited 2 suppliers re-audited
Environment Reduction in the frequency of work accidents per 1 million working hours
Frequency must not exceed 2 3.5
Reduction in hours of absence per 1,000 working hours due to work related accidents
Severity must not exceed 0.095
0.214
Reduction of energy consumption (kWh/total salary expense)
<0.34 0.35
Reduction of scrap A reduction of 5 per cent compared to the 2013/14 financial year
10.7 per cent reduc-tion
Sustainable Design Meet the increasing demand for sustainable products
Sustainable design has now been implemented as an integral part of the innovations process
Prepare CZ-site for ISO 14001 and OHSAS 18001 certification
Gaps identified Gap analysis com-pleted
Anti-corruption Sharpen white collar’s awareness of anti-corruption policy and -legislations
Training conducted for white collars in Procurement and Sales
Policy Awareness program conducted for all white collar employees
Planned CSR activities and objectives in 2015/16
Policy area Topic Objective
Human rights Labour
Collective agreement for employees (Suppliers and contractors)
Risk-assessment of supplier base to identify audit need. Conduct audits and follow-up accordingly
Conflict minerals Review and maintain processes and supplier agreements to avoid conflict minerals in any product
Environment Reduction of accidents Frequency must not exceed 2. Severity must not exceed 0.095
Energy savings in facilities <0.34 kWh/total salary expense
Anti-corruption Policy review Policies reviewed and updated to reflect actual business set-up
Anti-corruption training Conduct training for white collars in Procure-ment and sales
BANG & OLUFSEN A/S ANNUAL REPORT 2014/15 · 23
KEY FIGURES · MANAGEMENT REPORT · STRATEGY & OUTLOOK · GOVERNANCE · ANNUAL ACCOUNTS · STATEMENTS
ABOUT BANG & OLUFSEN · SHAREHOLDER LETTER · FINANCIAL REVIEW · RETAIL DEVELOPMENT INNOVATION · PRODUCT LAUNCHES · CSR · THE BANG & OLUFSEN SHARE

THE BANG & OLUFSEN SHARE
Bang & Olufsen focuses continuously on creating long-term growth and to secure a competitive return on the shareholders’ invest-
ment. It is expected that the ongoing implementation of the corporate strategy will achieve this.
IR Policy
It is Bang & Olufsen’s objective to inform NASDAQ
OMX Copenhagen A/S, current and potential investors
as well as equity analysts and brokers quickly and accu-
rately about all relevant matters relating to the Group.
The purpose of such information is to increase the
knowledge of Bang & Olufsen among investors in Den-
mark as well as abroad and give investors structured,
continuous and relevant information that meets the
requirements for information when deciding on invest-
ments in Bang & Olufsen shares.
The information given and the issuance of such infor-
mation must always be in accordance with applicable
rules and regulations issued by NASDAQ OMX Copen-
hagen A/S or other relevant bodies.
For further details regarding the Investor Relations
Policy on www.bang-olufsen.com/investors.
Investor meetings
Investor meetings and/or telephone conferences are
held following the publication of each quarterly report
to provide participants with the opportunity to address
questions to Executive Management. The telephone
The Bang & Olufsen share
Stock exchange: NASDAQ OMX Copenhagen A/S
Identification code (ISIN): DK 0010218429
2014/15 2013/14
Closing price 31 May 58.0 62.5
Market value 31 May
(DKK million) 2,504 2,454
Nominal share value (DKK) 431,974,780 392,704,350
Nominal value (DKK) 10 10
Issued shares 43,197,478 39,270,435
Own shares 29,999 77,369
Shares in circulation 43,167,479 39,193,066
Registered shareholders
(approx.) 27,500 29,000
Hereof in Denmark (approx.) 26,500 28,000
Listed capital placed in Denmark* 51% 47%
* Percentage of owner registered capital
BANG & OLUFSEN A/S ANNUAL REPORT 2014/15 · 24
KEY FIGURES · MANAGEMENT REPORT · STRATEGY & OUTLOOK · GOVERNANCE · ANNUAL ACCOUNTS · STATEMENTS
ABOUT BANG & OLUFSEN · SHAREHOLDER LETTER · FINANCIAL REVIEW · RETAIL DEVELOPMENT INNOVATION · PRODUCT LAUNCHES · CSR · THE BANG & OLUFSEN SHARE
THE BANG OLUFSEN SHARE

conferences are subsequently available at www.bang-
olufsen.com/investors. In addition, it is also possible
to contact the company’s Investor Relations function,
which is responsible for maintaining an on-going dia-
logue with current and potential shareholders.
The share and share capital
At the end of the financial year Bang & Olufsen had a
share capital of DKK 431,974,780, which was made up
of a single share class (43,197,478 shares of a nominal
value of DKK 10 per share). Each share entitles the
holder to one vote, and all shares carry the same rights.
Bang & Olufsen a/s holds 22,999 own shares to cover
the company’s share option programme.
The Bang & Olufsen share price was DKK 58.0 per share
on 31 May 2015 corresponding to a decrease of 7 per
cent for the financial year. The OMXC Mid Cap index
increased 24 per cent in the same period. The average
daily turnover of the Bang & Olufsen share was DKK
8,518,066 in the 2014/15 financial year compared to
DKK 4,559,569 in 2013/14.
The chart below shows the development in share price
from 1 June 2011 to 31 May 2015:
As at 31 May, 2015, the following individuals or legal enti-
ties hold 5 per cent or more of the company’s capital or
share capital’s voting rights:
30
50
70
90
01/06/11 01/06/12 01/06/1401/06/13
Closing price Number Capital/
of shares votes %
Delta Lloyd Asset Management N.V.,
Amstelplein 6, P.O. Box 1000,
1000 BA Amsterdam,
the Netherlands 6,359,351 14.7
Arbejdsmarkedets Tillægspension,
Kongens Vænge 8, 3400 Hillerød,
Danmark 5,361,391 12.4
Sparkle Roll Holdings Ltd, 25/F,
Office Tower 1, Henderson Center,
No 18 Jianguomennei Avenue,
Beijing 100005, P.R.of China 2,404,186 5.6
Analyst coverage
The following brokers covered the Bang & Olufsen
share at the end of the financial year:
Alm. Brand Markets
Carnegie Bank A/S
Danske Markets Equities
Nordea Markets
SEB Equities
Sydbank
Dividend
At the end of 2014/15 the company received significant
proceeds from the Automotive transaction. Nonethe-
less, due to the company’s vulnerable situation, histori-
cal earnings volatility, the fact that the new strategy is
not yet proven, and the fact that the company’s bank
debt facilities have been repaid, the Board of Directors
will re commend to the AGM that no dividend is paid to
the shareholders.
BANG & OLUFSEN A/S ANNUAL REPORT 2014/15 · 25
KEY FIGURES · MANAGEMENT REPORT · STRATEGY & OUTLOOK · GOVERNANCE · ANNUAL ACCOUNTS · STATEMENTS
ABOUT BANG & OLUFSEN · SHAREHOLDER LETTER · FINANCIAL REVIEW · RETAIL DEVELOPMENT INNOVATION · PRODUCT LAUNCHES · CSR · THE BANG & OLUFSEN SHARE

The company is currently undergoing a significant
transformation. When the new strategy starts to gain
traction the Board of Directors will establish a long
term capital structure and will reconsider distribution
of capital to the shareholders.
Capital structure
As a consequence of the Automotive transaction the
company was obliged in accordance with its loan
covenants to redeem its bank facilities.
Website
Bang & Olufsen invites investors and other stakehold-
ers to visit the company’s website www.bang-olufsen.
com, where a wide range of information of interest to
the investors is available, e.g. announcements, annual
reports, interim reports, the financial calendar and the
company’s history and a presentation of its products.
Contact
The company’s Investor Relations function is responsi-
ble for maintaining an on-going dialogue with current
and potential shareholders.
Investor Relations Manager
Claus Højmark Jensen
Phone: +45 9684 1251
Email: [email protected]
Annual General Meeting
Bang & Olufsen a/s’ Annual General Meeting will be held
on Thursday 10 September 2015 at Struer Statsgymna-
sium, Jyllandsgade 2, DK-7600 Struer.
Financial calendar
Annual General Meetings
10 September 2015 Annual General Meeting 2014/15
Financial statements
30 September 2015 Interim report (1st quarter 2015/16)
13 January 2016 Interim report (2nd quarter 2015/16)
6 April 2016 Interim report (3rd quarter 2015/16)
11 August 2016 Annual report 2015/16
27 September 2016 Interim report (1st quarter 2016/17)
BANG & OLUFSEN A/S ANNUAL REPORT 2014/15 · 26
KEY FIGURES · MANAGEMENT REPORT · STRATEGY & OUTLOOK · GOVERNANCE · ANNUAL ACCOUNTS · STATEMENTS
ABOUT BANG & OLUFSEN · SHAREHOLDER LETTER · FINANCIAL REVIEW · RETAIL DEVELOPMENT INNOVATION · PRODUCT LAUNCHES · CSR · THE BANG & OLUFSEN SHARE

The statements can be read in full at www.bang-olufsen.com under Investors
http://www.bang-olufsen.com/en/investors
Company Announcements 2014/15
No Date Subject
1 19 June 2014 Bang & Olufsen a/s releases preliminary results for the fourth quarter of the 2013/14 financial
year in line with the company’s previous guidance
2 19 June 2014 Offering of up to 3,927,043 new shares in Bang & Olufsen a/s
3 20 June 2014 Offering of up to 3,927,043 new shares will be completed
4 25 June 2014 Registration of share capital increase of nominally DKK 39,270,430 completed
5 26 June 2014 Bang & Olufsen appoints new Chief Operating Officer
6 01 Juli 2014 Bang & Olufsen a/s major shareholder announcement
7 13 August 2014 Bang & Olufsen a/s Group Annual Report 2013/14
8 18 August 2014 Annual General Meeting in Bang & Olufsen a/s
9 10 September 2014 Annual General Meeting in Bang & Olufsen a/s
10 10 September 2014 Articles of Association for Bang & Olufsen a/s
11 15 September 2014 Introduction of Matching Shares Programme for a group of non-executive managerial
employees
12 02 October 2014 Interim Report 1st quarter 2014/15 (1 June 2014 - 31 August 2014)
13 02 October 2014 Announcement of managerial staffs etc. trading with company shares
14 03 October 2014 Announcement of managerial staffs etc. trading with company shares
15 06 October 2014 Announcement of managerial staffs etc. trading with company shares
16 07 October 2014 Announcement of managerial staffs etc. trading with company shares
17 15 October 2014 Announcement of managerial staffs etc. trading with company shares
18 16 October 2014 Announcement of managerial staffs etc. trading with company shares
19 27 October 2014 Announcement of managerial staffs etc. trading with company shares
20 29 October 2014 Announcement of managerial staffs etc. trading with company shares
21 03 November 2014 Bang & Olufsen a/s’ CEO, CFO and COO participate in Matching Shares Programme
22 21 November 2014 Bang & Olufsen a/s - financial calendar
23 22 December 2014 Bang & Olufsen releases revised guidance for the 2014/15 full year based on preliminary
results for the second quarter of the 2014/15 financial year
24 20 January 2015 Interim report 1st half-year 2014/15 (1 June 2014 - 30 November 2014)
25 12 March 2015 Bang & Olufsen a/s restructures the AV business and confirms guidance for the financial year
based on a strong growth in the third quarter
26 31 March 2015 Bang & Olufsen enters into an Automotive brand license agreement and transfers its
Automotive assets to HARMAN to focus on scaling the core consumer business based on the
Bang & Olufsen and B&O PLAY brands
27 16 April 2015 Interim Report 3rd Quarter 2014/15 (1 June 2014 - 28 February 2015)
28 29 May 2015 Bang & Olufsen completes its previously announced transaction with HARMAN comprising a
brand license agreement and the transfer of its Automotive assets to HARMAN
BANG & OLUFSEN A/S ANNUAL REPORT 2014/15 · 27
KEY FIGURES · MANAGEMENT REPORT · STRATEGY & OUTLOOK · GOVERNANCE · ANNUAL ACCOUNTS · STATEMENTS
ABOUT BANG & OLUFSEN · SHAREHOLDER LETTER · FINANCIAL REVIEW · RETAIL DEVELOPMENT INNOVATION · PRODUCT LAUNCHES · CSR · THE BANG & OLUFSEN SHARE
STRATEGY & OUTLOOK
BeoVision Avant
The majestic 85” version of BeoVision Avant delivers exquisite imagery and iconic sound, bringing the true power of cinema straight to your living room, with unprecedented flexibility and freedom of movement.
BANG & OLUFSEN A/S ANNUAL REPORT 2014/15 · 28
KEY FIGURES · MANAGEMENT REPORT · STRATEGY & OUTLOOK · GOVERNANCE · ANNUAL ACCOUNTS · STATEMENTS
STRATEGY · OUTLOOK FOR 2015/16
OUTLOOK

STRATEGYThe increased level of innovation, the growth momentum in B&O PLAY and the reduced business complexity brought about by the Automotive transaction represent an opportunity to drive profitable growth in the
future through an undivided focus on the consumer business.
Since the launch of the Leaner, Faster, Stronger strat-
egy, Bang & Olufsen has revitalised the company’s
product portfolio and lifted the overall level of innova-
tion, launched B&O PLAY attracting new and younger
customers, as well as strengthened the company’s
global retail network.
Despite significant and fundamental improvements,
the company has not delivered satisfactory financial
results. This is partly due to continued challenges re-
lated to the lack of scale, and a continued high degree
of complexity in the way the company operates. There-
fore, on the back of disappointing results, the Board
of Directors and Executive Management in December
2014 decided to initiate a review to identify strategic
and structural options to address the company’s lack
of scale and high degree of complexity.
During spring 2015, Bang & Olufsen took significant
steps to the company’s challenges. The main step be-
ing the divesture of the Automotive assets and a brand
licensing agreement with HARMAN International In-
dustries Inc. This will allow the company to focus on its
consumer business whilst continuing and expanding its
presence in the Automotive market through a strong
licensing partner.
The strategy for the coming years will focus on build-
ing the two consumer brands Bang & Olufsen and B&O
PLAY, complemented by a targeted brand license busi-
ness.
The Bang & Olufsen high-end brand is the backbone
of the company, on which the rest of the business
will be built. The Bang & Olufsen brand will continu-
ously be strengthened by integrating the company’s
unique capabilities within design, acoustics, innovation
and craftsmanship. Key focus for the Bang & Olufsen
branded business will be to further strengthen the
brand attractiveness to its target customers and con-
tinue to invest in innovation and retail experiences,
while improving the segment’s profitability.
Focus for the B&O PLAY branded business is to contin-
ue to strengthen the young brand’s premium position-
ing and further increase the global brand awareness
and accessibility, leveraging the Group’s core capabili-
ties within design and acoustics. The brand targets a
younger and broader audience than the Bang & Oluf-
sen brand and will in the medium term be the main
growth driver for the Group. The high frequency of
launching innovative, personal audio products and fur-
ther expanding the distribution will continue.
BANG & OLUFSEN A/S ANNUAL REPORT 2014/15 · 29
KEY FIGURES · MANAGEMENT REPORT · STRATEGY & OUTLOOK · GOVERNANCE · ANNUAL ACCOUNTS · STATEMENTS
STRATEGY · OUTLOOK FOR 2015/16
STRATEGY FOLLOW-UP

The business model of the Group will be adapted so
the consumer focused business is complemented by
brand licensing partnerships within selected comple-
mentary categories to support the long-term brand
building of the company and drive value. Bang & Oluf-
sen’s Automotive partnership with HARMAN is a key
part of this brand licensing strategy. The partnership
enables Bang & Olufsen to accelerate the brand pres-
ence in the Automotive industry through the scale,
technology and global footprint of HARMAN, while
reducing the risk of the Bang & Olufsen business
model.
Product development and innovation:
The Bang & Olufsen product portfolio will further build
on the acoustical leadership, as well as the strengths
within design and craftsmanship, while increasing the
use of technology partners in areas where Bang & Oluf-
sen can benefit from the partners’ scale and technolo-
gy. The company will strengthen Bang & Olufsen’s own
capabilities with particular focus on software design
and innovation, to ensure readiness for further prod-
uct innovation. The overall profitability of the product
portfolio is a key focus area, with special attention on
improving the profitability of the TV portfolio through
a significant degree of outsourcing and partnerships.
Retail experiences:
A key focus area is to continue strengthening the
customer experience in the Bang & Olufsen branded
distribution (B1 and shop-in-shop). Emphasis is on cre-
ating a consistent, high-end customer experience. This
will be done by continuing the roll out of the Sensory
Store concept, which has proven to significantly lift
the like-for-like sales of the upgraded stores. Other key
initiatives include working with the current network of
retailers on increased training, best practice sharing,
optimizing the sales process and in-store demonstra-
tions, retail standards and visual merchandising.
Complementing the improvement of the existing dis-
tribution, Bang & Olufsen will continue the effort to
attract new, high potential partners to key locations,
especially in Europe. This will allow Bang & Olufsen to
continue to lift the standards in the network and there-
by improve the customer experiences. Bang & Olufsen
will only selectively own stores in locations considered
strategically important for the company.
For markets outside Europe, focus is to ensure a con-
trolled, profitable, organic growth. In North America,
pilots during the 14/15 financial year have shown prom-
ising results from working with custom installers and
A/V consultants who have direct contact with the tar-
get customers in this competitive market. This route to
market will be exploited further with special emphasis
Controlled growth in the Bang & Olufsen branded
business and sharpening of the high-end positioning
Focus for the Bang & Olufsen branded business will
be to address scale issues in product development
and continue focusing the efforts on protecting and
enhancing the value of the Bang & Olufsen high-end
brand. The latter will be done, in particular, by keeping
innovation at a high level combined with continuously
improved and consistent customer experiences in re-
tail.
by
by
Licensing High-end sound and picture experiences
Premium portable audio and headphones
Targeted brand licensing
BANG & OLUFSEN A/S ANNUAL REPORT 2014/15 · 30
KEY FIGURES · MANAGEMENT REPORT · STRATEGY & OUTLOOK · GOVERNANCE · ANNUAL ACCOUNTS · STATEMENTS
STRATEGY · OUTLOOK FOR 2015/16

given to selected geographical locations like New York
City and Los Angeles. In China, focus continues to be
on building brand awareness and delivering organic
growth, based on the company-owned and -operated
retail network in the tier 1 and tier 2 cities, and the sales
and customer support organisation, which has been
built up over the last three years.
Aggressive expansion of B&O PLAY
B&O PLAY will broaden the headphones and portable
audio portfolio by building on the success of the exist-
ing products, the unique capabilities within acoustics
and design, and continued use of outsourcing partners.
B&O PLAY will continue to expand the third party retail
distribution globally, with particular focus on expand-
ing the distribution in North America to ensure a strong
and broad brand presence in this key market. The retail
expansion will continue to happen through professional
value-added distributors with local knowledge, to en-
sure that the distribution evolves in a cost efficient way
and with high speed. The aggressive expansion will be
done, while focusing on maintaining the sales per store
and like-for-like growth, driven by increased brand
awareness, strong in-store merchandising and high
launch pace of new innovative products.
E-commerce continues to be a key part of the B&O
PLAY distribution strategy and support the overall
growth of the brand through sales and increased brand
awareness.
A more lean and agile company
To turn around the Group and restore profitability and
to ensure that costs for shared functions are eliminated
following the Automotive transaction, strong emphasis
is given to create a more lean and agile company and
lower the costs and net working capital. Particular fo-
cus is on:
• Increased use of technology and sourcing partners in
areas where the Group can benefit from the partners’
economy of scale, especially in the TV business
• Strong product life cycle management, for effective
transitions at product launches and elimination of
older, non-productive products
• Optimised logistics, especially for B&O PLAY, to en-
sure the best possible scale advantages related to
third party distribution
• Simplified service and service related setup to effec-
tively match current and future dealer and consumer
demands
As a consequence of the Automotive transaction and
to reflect the new strategy and a leaner and more agile
business model (e.g., shorter product lifecycles, elimi-
nation of older, non-productive products and a higher
degree of technology partnerships), significant non-
recurring, non-cash adjustments were made to the bal-
ance sheet in the fourth quarter of 2014/15.
The increased level of innovation, the growth momen-
tum in B&O PLAY, slimming down the operational asset
base and focused execution will drive profitable growth
in the consumer business over time. The year-on-year
increase in revenue, reduction in costs (especially the
shared costs remaining from the Automotive transac-
tion) and the expected license revenues from Automo-
tive from 2017 are expected to lead to a positive EBIT
from the 2016/17 financial year onwards.
Financial targets for the 2015/16 to 2017/18 strategy period
Target
Revenue Approx. 10 per cent CAGR with B&O PLAY
as the primary growth driver for the Group
EBIT margin Approx. 7 per cent EBIT margin before
special items reached within the strategy
period
Cash flow Generate a positive free cash flow during
the strategy period
BANG & OLUFSEN A/S ANNUAL REPORT 2014/15 · 31
KEY FIGURES · MANAGEMENT REPORT · STRATEGY & OUTLOOK · GOVERNANCE · ANNUAL ACCOUNTS · STATEMENTS
STRATEGY · OUTLOOK FOR 2015/16

Safe Harbour statementThe report contains statements relating to the expectations for future developments, including future revenues and Operating results, as well as expected business-related events. Such statements are uncertain and carry an element of risk since many factors, of which some are beyond Bang & Olufsen’s control, can mean that actual developments will deviate significantly from the expectations expressed in the report. Without being exhaustive, such factors include among others general economic and commercial factors, including market and competitive matters, supplier issues and financial issues in the form of foreign exchange, interest rates, credit and liquidity risk.
OUTLOOK FOR 2015/16In the 2015/16 financial year, the key focus will be to create
profitable growth, by growing revenue, improving gross margin and adapting the cost base to reflect the reduced size of the company.
Revenue
Revenue for the Group’s business is expected to grow
8 to 12 per cent compared to 2014/15. B&O PLAY is ex-
pected to be the main growth driver, while the rate of
growth in Bang & Olufsen is expected to be moderate.
New product launches and organic growth in Bang &
Olufsen and B&O PLAY, as well as a continued expan-
sion of especially the third party retail network will be
the main growth contributors.
EBIT
As a result of higher revenue, an improved gross
margin and continued cost reduction efforts, Bang
& Olufsen expects to significantly improve the earn-
ings before interest and tax (EBIT) of the continuing
business, compared to 2014/15.
However, as costs for functions that previously were
shared with the Automotive division will not be fully
eliminated during 2015/16, and since the strategic
initiatives such as footprint optimization and restruc-
turing will take time to implement and as the company
does not expect to receive any license payment related
to Automotive during 2015/16, Bang & Olufsen expects
to realize a negative EBIT. Adjusted for costs for shared
functions previously allocated to Automotive, EBIT in
2015/16 is expected to be around break-even.
BANG & OLUFSEN A/S ANNUAL REPORT 2014/15 · 32
KEY FIGURES · MANAGEMENT REPORT · STRATEGY & OUTLOOK · GOVERNANCE · ANNUAL ACCOUNTS · STATEMENTS
STRATEGY · OUTLOOK FOR 2015/16
EXPECTATIONS 2013/14

GOVERNANCE
BeoPlay A9
Designed and crafted like a beautiful piece of furniture, BeoPlay A9 is a music system that responds to your touch like magic. BeoPlay A9 is always ready to deliver gorgeous sound that is big enough to fill even the most spacious of rooms.
BANG & OLUFSEN A/S ANNUAL REPORT 2014/15 · 33
KEY FIGURES · MANAGEMENT REPORT · STRATEGY & OUTLOOK · GOVERNANCE · ANNUAL ACCOUNTS · STATEMENTS
BOARD OF DIRECTORS & EXECUTIVE MANAGEMENT · CORPORATE GOVERNANCE · RISK MANAGEMENT AND INTERNAL CONTROLS
GOVERNANCE

Jim Hagemann Snabe (1965)
Deputy chairmanYear of first appointment, 2011M.Sc. (Economics and Business Administration)
Directorships and other offices:Danske Bank A/S (Board Member), Siemens AG (Board Mem-ber), Allianz SE (Board Member), SAP SE (Board Member), World Economic Forum (member of Foundation Board and Chariman of Centre of Global Industries)
This member is considered independent Member of the Nomination Committee Number of shares in Bang & Olufsen a/s at the end of the year: 11,740 (2013/14; 7,940)
Ole Andersen (1956)
ChairmanYear of first appointment, 2009State-authorised public accountantM.Sc. (Economics and Business Administration)
Directorships and other offices:Chr. Hansen Holding A/S (Chairman of the Board), Danske Bank A/S (Chairman of the Board), Zebra A/S (Chairman of the Board), EQT Partners (Senior Advisor), NASDAQ OMX Nordic (Member of the Nomination Committee)
This member is considered independent Chairman of the Remuneration and Nomination Committees Number of shares in Bang & Olufsen a/s at the end of the year: 84,650 (2013/14; 80,250)
Majken Schultz (1958)
Year of first appointment, 2013M.Sc. Political SciencePhD Business Administration
Directorships and other offices:Danish Crown A/S (Board Member), Danske Spil A/S (Board Member), Realdania (Board Member), VCI Holding ApS (Di-rector), Professor of Management at Copenhagen Business School, International Research Fellow, Oxford University
This member is considered independent Member of the Audit Committee Number of shares in Bang & Olufsen a/s at the end of the year: 5,300 (2013/14; 0)
Jesper Jarlbæk (1956)
Year of first appointment, 2011State-authorised public accountantM.Sc (Economics and Business Administration)
Directorships and other offices:Altius Invest A/S (Chairman), Basico Consulting International ApS and 3 subsidiaries (Chairman), Catacap Management ApS (Chairman), Frokost.DK Aps (Chairman), GroupCare A/S (Chairman), GroupCare Holding A/S (Chairman), Jaws A/S (Chairman), Sanderman Pte. Ltd (Singapore) (Chair-man), ShowMe ApS (Chairman), Valuemaker A/S (Chairman), A-Solutions A/S (Board Member), Polaris III Invest Fonden (Board Member), Økonomiforum ApS (Board Member), Earl-brook Holdings Ltd A/S (Director and Board Member), SCSK 2272 ApS (Director), TIMPCO ApS (Director), Golf Metrics Inc. ,Delaware, USA, CC Track Holding A/S (Board Member), Be-yond Budgetting Institute P/S (Chairman), Smartshare systems A/S (Board Member), Business Angles Fond - London I-II-III A/S (Chairman and Board Member), Bookboon Corporate A/S (Board Member, Lyngsoe systems holding A/S (Board Member)
This member is considered independent Chairman of the Audit Committee Number of shares in Bang & Olufsen a/s at the end of the year: 6,500 (2013/14; 4,500)
BOARD OF DIRECTORS
BANG & OLUFSEN A/S ANNUAL REPORT 2014/15 · 34
KEY FIGURES · MANAGEMENT REPORT · STRATEGY & OUTLOOK · GOVERNANCE · ANNUAL ACCOUNTS · STATEMENTS
BOARD OF DIRECTORS & EXECUTIVE MANAGEMENT · CORPORATE GOVERNANCE · RISK MANAGEMENT AND INTERNAL CONTROLS
BOARD OF DIRECTORS

Albert Bensoussan (1959)
Year of first appointment, 2014Kering (Division CEO)Master of Business Administration (MBA)
Boucheron Holding SAS (Vice president)Sowind Group SA (Board Member)Ulysse Nardin SA (Chairman)Pomellato s.p.A. (Board Member)Queelin Holding Luxembourg (Board Member)
This member is considered independent Member of the Audit Committee Number of shares in Bang & Olufsen a/s at the end of the year: 0 (2013/14; 0)
Knud Olesen (1952)
Year of first appointment, 2003 Employee-electedTechnical Project Manager
Number of shares in Bang & Olufsen a/s at the end of the year:885 (2013/14; 885)
Mads Nipper (1966)
Year of first appointment, 2014Grundfos Holding A/S (Group President/CEO)M.Sc. Business Administration
Tulip food company A/S (Board Member)
This member is considered independent Number of shares in Bang & Olufsen a/s at the end of the year: 2,890 (2013/14; 0)
Jesper Olesen (1978)
Year of first appointment, 2007Employee-electedEngineering Worker
Number of shares in Bang & Olufsen a/s at the end of the year:1,578 (2013/14; 1,578)
Per Østergaard Frederiksen (1971)
Year of first appointment, 2011Employee-electedTechnical Project Manager
Number of shares in Bang & Olufsen a/s at the end of the year:206 (2013/14; 206)
BANG & OLUFSEN A/S ANNUAL REPORT 2014/15 · 35
KEY FIGURES · MANAGEMENT REPORT · STRATEGY & OUTLOOK · GOVERNANCE · ANNUAL ACCOUNTS · STATEMENTS
BOARD OF DIRECTORS & EXECUTIVE MANAGEMENT · CORPORATE GOVERNANCE · RISK MANAGEMENT AND INTERNAL CONTROLS

EXECUTIVE MANAGEMENT
Tue Mantoni (1975)
President & CEOEmployed since 1 March 2011M.Sc. (Business Administration and Management Science)
Directorships*)
Danish Bake (“Lagkagehuset”) (Board Member)Number of shares in Bang & Olufsen a/s at the end of the year:78,267 (2013/14; 73,267)
*) With the exception of 100 per cent owned Bang & Olufsen subsidiaries.
Anders Aakær Jensen (1974)
Executive Vice President & CFOEmployed since 1 August 2014Cand Oecon, EconomicsIMD (International Institute for Management Development) - Business Programs
Directorships*)
None
Number of shares in Bang & Olufsen a/s at the end of the year:7,200 (2013/14; 0)
Stefan Persson (1967)
Executive Vice President & COOEmployed since 1 Ocotober 2014M.Sc The institute of Technology at Linköping University
Directorships*)
None
Number of shares in Bang & Olufsen a/s at the end of the year:3,000 (2013/14; 0)
BANG & OLUFSEN A/S ANNUAL REPORT 2014/15 · 36
KEY FIGURES · MANAGEMENT REPORT · STRATEGY & OUTLOOK · GOVERNANCE · ANNUAL ACCOUNTS · STATEMENTS
BOARD OF DIRECTORS & EXECUTIVE MANAGEMENT · CORPORATE GOVERNANCE · RISK MANAGEMENT AND INTERNAL CONTROLS

CORPORATE GOVERNANCE
Bang & Olufsen follows all recommendations that are part of the Corporate Governance disclosure requirements applicable
to companies listed on NASDAQ OMX Copenhagen.
Bang & Olufsen’s Board of Directors and Executive
Management constantly strive to ensure that the
Group’s management structure and control systems are
appropriate and work satisfactorily. Internal procedures
have been developed and are regularly updated in or-
der to ensure active, reliable and profitable business
management.
As a company listed on NASDAQ OMX Copenhagen
A/S, and in accordance with Section 107b of the Danish
Financial Statements Act, Bang & Olufsen is covered by
the recommendations for corporate governance imple-
mented by NASDAQ OMX Copenhagen A/S in “rules
for issuers of shares”.
Pursuant to these rules, the Company must apply the
recommendations adopted based on the “comply-or
explain” principle. In November 2014, NASDAQ OMX
Copenhagen A/S implemented revised recommenda-
tions for corporate governance. Bang & Olufsen a/s
complies with these recommendations.
The Board of Directors of Bang & Olufsen a/s has
prepared a report on corporate governance for the
2014/15 financial year, which has been incorporated
into management’s report. This report is available for
review and download at www.bang-olufsen.com/in-
vestor/corporate-governance/uk. The report contains
a description of Bang & Olufsen’s approach to the
“Recommendations for Corporate Governance” and a
description of the management structure and the main
elements of our internal control and risk management
systems in connection with the Company’s presenta-
tion of the annual report.
Management structure
Bang & Olufsen a/s’ management structure comprises
the Board of Directors and Executive Management.
Further information is available in the above-men-
tioned corporate governance report.
Board self-assessment
The Chairman of the Board of Directors is responsible
for conducting an annual review of the Board’s perfor-
mance, addressing the effectiveness of the Board, the
processes supporting its work, individual board mem-
bers’ contributions and the Chairman’s performance.
In 2014/15, the evaluation was conducted by the indi-
vidual directors and executives anonymously complet-
ing a comprehensive online questionnaire which was
then summarized by an external consultant.
BANG & OLUFSEN A/S ANNUAL REPORT 2014/15 · 37
KEY FIGURES · MANAGEMENT REPORT · STRATEGY & OUTLOOK · GOVERNANCE · ANNUAL ACCOUNTS · STATEMENTS
BOARD OF DIRECTORS & EXECUTIVE MANAGEMENT · CORPORATE GOVERNANCE · RISK MANAGEMENT AND INTERNAL CONTROLS
CORPORATE GOVERNANCE

The results of the assessment process will be present-
ed to the Board of Directors in September 2015 by the
Chairman. The report describes a number of areas in
which the Board is both effective and well-functioning
and gives an overall impression of a well performing
Board of Directors. The report further shows that most
areas for improvement which were identified in the
previous Board assessment have been addressed. The
Chairman will hold individual meetings with each Di-
rector to review their performance.
The Board of Directors consists of the following mem-
bers with the following functions:
of the underrepresented gender on the Board of Direc-
tors.
The new legislation requires the Board of Directors to
decide on a policy to increase the proportion of the
underrepresented gender in senior management posi-
tions. The Board of Directors believes that members
should be chosen for their overall competences, and
also recognizes the benefits of a diverse Board in re-
spect of experience, culture and gender.
Currently one member, or 17 per cent of the Board of
Directors, elected by the General Meeting is a woman.
According to the objective set in 2013 with regard to
gender diversity of the Board of Directors, the target
was to have female representation on the Board of
Directors at the latest by the Annual General Meeting
2017, and therefore this objective was already met in
2014. Based hereon, the Board of Directors has in 2015
decided to set a new target setting for female repre-
sentation according to which the Company’s goal is to
have two female members of the Board of Directors
elected by the General Meeting by 2018.
The share of women in the senior management in the
Bang & Olufsen Group has increased from 7.5 per cent
on 31 May 2014 to 11.1 per cent on 31 May 2015. Senior
management is defined as Executive Management and
the Business Leadership Team. The total number of
employees in this group at the end of May 2015 was 36
employees.
The Board of Directors has set out a policy to increase
the proportion of women in senior management where
the relevant action points are as follows:
• Secure at least one female candidate for vacancies
arising in senior management
• Ensuring an appropriate level of female participants
in the Bang & Olufsen Talent Programme
The goal is to have not less than 15 per cent female
members at senior management level by May 2017.
Albert Bensoussan •
Jesper Jarlbæk • •
Jesper Olesen •
Jim Hagemann Snabe • • •
Knud Olesen •
Mads Nipper •
Majken Schultz •
Ole Andersen • • •
Per Østergaard Frederiksen •
CH
AIR
MA
N
DE
PU
TY
C
HA
IRM
AN
AU
DIT
CO
MM
ITT
EE
RE
MU
NE
RA
TIO
N
CO
MM
ITT
EE
NO
MIN
AT
ION
C
OM
MIT
TE
E
EM
PLO
YE
E E
LEC
TE
D
For further information about the Board of Directors
refer to the section ‘Board of Directors’ on pages 34-
35.
Diversity
IIn April 2013 the Board of Directors adjusted the Com-
pany’s objectives for the diversity of the members of
the Board of Directors elected by the General Meeting
in relation to gender in order to comply with new Da-
nish legislation of objectives to increase the proportion
BANG & OLUFSEN A/S ANNUAL REPORT 2014/15 · 38
KEY FIGURES · MANAGEMENT REPORT · STRATEGY & OUTLOOK · GOVERNANCE · ANNUAL ACCOUNTS · STATEMENTS
BOARD OF DIRECTORS & EXECUTIVE MANAGEMENT · CORPORATE GOVERNANCE · RISK MANAGEMENT AND INTERNAL CONTROLS

Other information in accordance with the
Financial Statements Act § 107 a
The Company’s Articles of Association state the
following:
The Board of Directors is in the period until 31 May
2019 authorized at one or more times to decide to
increase the Company’s share capital by up to a nomi-
nal value of DKK 43,197,470 by issuing new shares at
market price or at a discount to market price by way
of cash contribution or otherwise. The capital increase
shall be with preemptive subscription rights for the
Company’s existing shareholders. The new shares shall
in all respects rank pari passu with the existing shares.
The new shares shall be negotiable instruments, shall
be issued to named holders and shall rank for divi-
dends and other rights in the Company from such time
as is determined by the Board of Directors in its deci-
sion to increase the Company’s share capital pursuant
to this section, although no more than one year after
the date of registration.
The Board of Directors is in the period until 31 May
2019 authorized at one or more times to decide to in-
crease the Company’s share capital by up to a nominal
value of DKK 43,197,470 by issuing new shares at mar-
ket price by way of cash contribution or otherwise. The
capital increase shall be without preemptive subscrip-
tion rights for the Company’s existing shareholders.
The new shares shall in all respects rank pari passu with
the existing shares. The new shares shall be negotiable
instruments, shall be issued to named holders and shall
rank for dividends and other rights in the Company
from such time as is determined by the Board of Direc-
tors in its decision to increase the Company’s share
capital pursuant to this section, although no more than
one year after the date of registration.
Pursuant to Article 4, sections 4 and 5 in the Articles
of Association, the Board of Directors may not decide
to increase the Company’s share capital by more than
a total nominal value of DKK 43,197,470 equal to 10 per
cent of the total share capital of the Company.
The Board of Directors may implement the necessary
amendments to the Articles of Association in connec-
tion with changes to the capital structure in accord-
ance with the above resolution.
At the Annual General Meeting in September 2014 the
Board of Directors was authorised in the period until
30 September 2015, to let the Company acquire own
shares up to a nominal value corresponding to 10 per
cent of the Company’s share capital, provided that the
share price does not deviate by more than 10 per cent
from the most recently quoted market price for the
shares on NASDAQ OMX Copenhagen A/S at the time
of the purchase.
Specific information concerning the possibilities of
amending the Articles of Association can be found in
the Company’s Articles of Association on the Com-
pany’s website: http://www.bangolufsen.com/da/inves-
tors.
The Company shall be managed by a Board of Direc-
tors of between 4 and 8 members elected by the
shareholders at the Annual General Meeting and any
representatives elected by the Company’s employees
as required by law. The members of the Board of Direc-
tors elected at the Annual General Meeting shall retire
at each year’s Annual General Meeting, but shall be
eligible for re-election. Board members elected by the
Annual General Meeting comprise a group of experi-
enced international business executives. The age limit
for members of the Board of Directors is 70.
Under the Danish Companies Act, employees in the
Group’s Danish companies have the right to elect a
number of directors and alternates to the Board of Di-
rectors. Employees are entitled to elect the equivalent
of half the board members elected by the Annual Gen-
eral Meeting, albeit not less than two members.
Employees have chosen to elect board members on
group level, which means that only representatives
on the Board of Directors of the parent company,
BANG & OLUFSEN A/S ANNUAL REPORT 2014/15 · 39
KEY FIGURES · MANAGEMENT REPORT · STRATEGY & OUTLOOK · GOVERNANCE · ANNUAL ACCOUNTS · STATEMENTS
BOARD OF DIRECTORS & EXECUTIVE MANAGEMENT · CORPORATE GOVERNANCE · RISK MANAGEMENT AND INTERNAL CONTROLS

Bang & Olufsen a/s are elected. The employees have,
therefore, elected three colleagues to represent them
on the main Board of Directors.
The latest election of employees to the Board of Di-
rectors took place in June 2015 by means of a writ-
ten, secret and direct vote. Employee-elected board
members are elected for a four-year period and eligible
employees are those who are of age and who on the
election day have been employed by the Company for
at least 12 months. The three Employee-elected board
members which were elected at the election in June
2015 will join the Board of Director’s after the Annual
General Meeting in September 2015.
Should an Employee-elected board member’s employ-
ment be terminated, the employee in question will re-
tire from the Board of Directors and be replaced by an
elected substitute. An employee-elected board mem-
ber has the same rights, obligations and responsibilities
as the other board members.
Remuneration etc.
Bang & Olufsen’s share option programme extends to a
number of the Group’s executive directors and manag-
ers. As at 31 May 2015 the total pool of options amount
to 1,119,769 which can be exercised during the period
2014-2016 if certain criteria are met.
Further, at the Annual General Meeting in September
2014, the Company’s “General guidelines concerning
incentive-based remuneration” was amended to the
effect that the members of the Management Board at
the discretion of the Board of Directors, can be offered
to participate in a new Matching Shares Program, ex-
ercisable from 2017. As a consequence of the introduc-
tion of the new Matching Shares Program, any further
grants of new stock options under the existing Long-
term Incentive Share Option Scheme and the Special
Share Option Scheme was discontinued.
For further details, please refer to note 4.7 and note 15
in the consolidated and the parent company financial
statements respectively.
The Company’s CEO can terminate his employment by
giving 12 months’ notice and the Company can termi-
nate the employment by giving 24 months’ notice. In
the event that the Company is taken over and delisted
from NASDAQ OMX Copenhagen A/S, the CEO is enti-
tled to consider his employment to be terminated. The
CEO is subject to a non-competition clause. For further
information about remuneration to the CEO refer to
note 2.2 and note 4 in the consolidated and the parent
company financial statements respectively.
BANG & OLUFSEN A/S ANNUAL REPORT 2014/15 · 40
KEY FIGURES · MANAGEMENT REPORT · STRATEGY & OUTLOOK · GOVERNANCE · ANNUAL ACCOUNTS · STATEMENTS
BOARD OF DIRECTORS & EXECUTIVE MANAGEMENT · CORPORATE GOVERNANCE · RISK MANAGEMENT AND INTERNAL CONTROLS

RISK MANAGEMENT AND INTERNAL CONTROLS
The Group is exposed to a number of risks related to its activities. The risks are very different, but they are all common risks within
the high-end and electronics industry.
Management considers efficient risk management as
an integrated part of all the Group’s activities and is
continuously striving to identify, analyze and control
major risks in order to optimize the Group for the be-
ne fit of its stakeholders. The Group carries out an
annual review of how its overall risk exposure has
changed, and whether the risk mitigation measures
undertaken are sufficient or excessive. The Board of Di-
rectors sets out the guidelines for the most important
risk areas, follows developments and ensures that plans
are in place for controlling the different risks, including
strategic, operational and financial risks.
Strategic risks
Markets and competition
Although the Group’s products are marketed globally,
most of the revenue derives from Europe. Bang & Oluf-
sen is a niche player in an industry dominated by major
international electronics companies.
The company can be affected by economic trends in
the countries where the Group’s products are sold, as
well as by new technological initiatives by the indus-
try’s main players.
Sales trends are seasonal with the main emphasis on
the period from October to December. In order to miti-
gate risks related to the seasonal variations and the
exposure to economic trends, the company has a high
degree of flexibility in the production. In addition, the
company uses sourcing partners where commercially
relevant and attractive.
Customer relations
Bang & Olufsen mainly sells its products through
a network of dedicated stores which primarily sell
Bang & Olufsen products. The products are marketed
globally, but the main part of the Group’s revenue
stems from stores in Europe. To avoid excessive sensi-
tivity to changing economic cycles in the different mar-
kets, Bang & Olufsen is increasingly establishing stores
outside of Europe.
To broaden the company’s target group and product
portfolio, the company launched the B&O PLAY brand
in 2012. B&O PLAY has launched a number of products
which are more attractive to a younger target group
than Bang & Olufsen’s classic products, for which rea-
son Bang & Olufsen now generally covers a wider tar-
get group than before. In addition, B&O PLAY products
are also sold outside the dedicated Bang & Olufsen
store network, through third party channels and e-com.
BANG & OLUFSEN A/S ANNUAL REPORT 2014/15 · 41
KEY FIGURES · MANAGEMENT REPORT · STRATEGY & OUTLOOK · GOVERNANCE · ANNUAL ACCOUNTS · STATEMENTS
BOARD OF DIRECTORS & EXECUTIVE MANAGEMENT · CORPORATE GOVERNANCE · RISK MANAGEMENT AND INTERNAL CONTROLS
RISK MANAGEMENT

Compliance
As a global company, Bang & Olufsen is obliged to
comply with the legislation and guidelines of the coun-
tries in which the Group operates. In the subsidiaries,
management has extensive knowledge of local rules
and on central level compliance is addressed in relation
to products, production, finance, administration and CSR
in order to assist the organization in complying with
applicable rules, regulations, policies and standards.
Bang & Olufsen recognizes the UN and ILO declara-
tions on human rights, labour rights, the environment
and anti-corruption, for which reason we have chosen
to structure our CSR work and reporting according to
the UN’s Global Compact.
Design
Bang & Olufsen devotes considerable efforts to creat-
ing innovative and durable concepts and designs to
differentiate the company from other consumer elec-
tronics producers. The company’s concept develop-
ers collaborate with a number of selected external
designers who have a high degree of independence
and considerable influence, which helps ensure that the
interaction between user-friendliness and technology is
fully optimized. The cooperation with external design-
ers means that Bang & Olufsen is constantly receiving
new input and maintaining a broad creative horizon in
terms of design.
Innovation ability
Bang & Olufsen is constantly striving to optimize the
company’s innovation processes, which encompasses
the definition, creation and realization of the right
products for customers in the target group. The pro-
duct and technology strategy is continuously being de-
veloped based on general market developments, input
from markets and customers, completed technology
projects and Bang & Olufsen’s so-called technology
radar, which contains information on, and an overview
of, expected future technologies. The strategy is based
on Bang & Olufsen’s core competencies in combination
with a number of strategic partnerships, ensuring to
the greatest possible extent that Bang & Olufsen’s own
strengths are being applied to the technology areas
where Bang & Olufsen’s products stand out from the
products of other producers.
Quality
Bang & Olufsen strives to improve the efficiency of the
quality management system by preventive quality im-
provement activities to provide the customers with the
best possible quality, innovation and craftmanship.
Quality objectives are defined and used as a bench-
mark for the performance. These objectives are revised
on an ongoing basis to ensure that they are appropri-
ate for Bang & Olufsen and relevant to the customers.
The ambition is to fulfil our quality objectives by having
clear processes and controls as well as well-educated
staff, recognized for their professional integrity and
proactive and customer-oriented approach, at all levels.
Bang & Olufsen’s quality management system is
based on ISO 9001:2008 for the Bang & Olufsen
branded business. The system is subjected to regular
internal and annual external reviews to ensure that
Bang & Olufsen continually improve quality and fulfil
the requirements.
Patents and trademarks
In connection with the development of new products,
continuous internal control is performed to ensure, as
far as possible, that these products do not infringe on
any third-party rights. This applies both to patents,
trademarks and design.
With regard to Bang & Olufsen’s rights, these are re-
gistered in order to ensure that the business plans for
the future may be realized, just as the enforcement of
Bang & Olufsen’s rights is carried out with the same
focus.
BANG & OLUFSEN A/S ANNUAL REPORT 2014/15 · 42
KEY FIGURES · MANAGEMENT REPORT · STRATEGY & OUTLOOK · GOVERNANCE · ANNUAL ACCOUNTS · STATEMENTS
BOARD OF DIRECTORS & EXECUTIVE MANAGEMENT · CORPORATE GOVERNANCE · RISK MANAGEMENT AND INTERNAL CONTROLS

Operational risks
Suppliers
The Group is dependent on a large number of sup-
pliers, primarily from Europe and Asia, and strives to
maintain long-term supplier relations with regard to
the purchase of development services and produc-
tion goods. Bang & Olufsen endeavours to ensure that
supplies of critical raw materials are assured through
contracts and agreements and, when possible, through
co-operation with several suppliers.
Employees
Focus is on individual personal and career develop-
ment which is secured through maintaining and creat-
ing interesting and challenging jobs throughout the
Group to attract and retain highly qualified employees
at all times.
Each year the Group therefore actively contributes to a
range of training programmes for its employees.
Insurance
Bang & Olufsen’s insurance policy stipulates that
insurance policies must cover any damage aris-
ing to Bang & Olufsen’s assets and any claims that
Bang & Olufsen may incur so that such damage or
claims do not impact the company’s capital and future
operations to any significant extent. Consistent with
this, the Group can be self-insured in respect of minor
risks, while major risks are fully insured. In those in-
stances, when deemed financially beneficial, insurance
policies contain an excess. In respect to the above, a
global insurance programme has been established to
include all-risk, operational losses, business and pro-
duct responsibility.
Bang & Olufsen has a written contingency plan and
works continuously with risk management in order to
protect against damage to own and contractors’ facili-
ties.
IT risk
The Group is dependent on reliable IT systems for its
day-to-day operations, to ensure control of product
procurement and to increase the efficiency of the
Group’s supply chain. Work is continuously being un-
dertaken to hedge these risks in the form of firewalls,
access control, emergency plans etc.
The overall IT platform and infrastructure have been
outsourced to a major global supplier, which signifi-
cantly reduces the risk.
Financial risks
The Group’s management of financial risks
As a result of Bang & Olufsen’s extensive international
activities, the Group’s income statement, balance sheet
and equity are exposed to a number of financial risks
at any given time.
These risks are as follows:
• Foreign exchange rate risk
• Interest rate risk
• Credit risk
• Liquidity risk
Bang & Olufsen continually assesses these risks at
Group level. As it is the Group’s policy not to speculate
in financial instruments, its financial management is
solely directed towards the management of financial
risks in relation to operations and financing.
The company’s main credit risk relates to trade receiva-
bles from store owners. The company continuously
works on improving the credit management policy and
processes in order to mitigate potential future credit
risk.
For further information about the Group’s management
of financial risks, please refer to note 4.3 Financial In-
struments in the Group financial statements.
BANG & OLUFSEN A/S ANNUAL REPORT 2014/15 · 43
KEY FIGURES · MANAGEMENT REPORT · STRATEGY & OUTLOOK · GOVERNANCE · ANNUAL ACCOUNTS · STATEMENTS
BOARD OF DIRECTORS & EXECUTIVE MANAGEMENT · CORPORATE GOVERNANCE · RISK MANAGEMENT AND INTERNAL CONTROLS

ACCOUNTS & DATA
BANG & OLUFSEN A/S ANNUAL REPORT 2014/15 · 44
KEY FIGURES · MANAGEMENT REPORT · STRATEGY & OUTLOOK · GOVERNANCE · ANNUAL ACCOUNTS · STATEMENTS
GROUP · PARENT COMPANY
ACCOUNTS DATA

CONTENTS – GROUP
Consolidated income statement 1 June – 31 May .............................................................................................................................. 46
Consolidated statement of comprehensive income 1 June – 31 May ............................................................................................ 47
Consolidated balance sheet at 31 May .................................................................................................................................................. 48
Consolidated cash flow statement 1 June – 31 May .......................................................................................................................... 50
Consolidated statement of changes in equity 1 June – 31 May ...................................................................................................... 51
Section 1 – Basis of reporting
1.1 Basis of reporting .................................................................... 52
1.2 Critical accounting estimates and judgements ........... 55
Section 2 – Results for the year
2.1 Operating segment information ........................................ 56
2.2 Staff costs .................................................................................. 61
2.3 Development costs ................................................................. 62
2.4 Fees to auditors appointed by
the Annual General Meeting ................................................ 62
2.5 Taxation ....................................................................................... 63
2.6 Earnings per share .................................................................. 66
Section 3 – Operating assets and liabilities
3.1 Intangible assets ...................................................................... 67
3.2 Tangible assets ......................................................................... 71
3.3 Investment property .............................................................. 74
3.4 Other financial receivables .................................................. 75
3.5 Working capital ........................................................................ 76
3.6 Pensions ...................................................................................... 79
3.7 Provisions ................................................................................... 81
3.8 Deferred income ...................................................................... 82
Section 4 – Capital structure and financing costs
4.1 Mortgage loans and loans from banks ............................ 83
4.2 Financial items .......................................................................... 84
4.3 Financial instruments ............................................................. 84
4.4 Capital structure ...................................................................... 92
4.5 Share capital .............................................................................. 92
4.6 Costs relating to capital increase ...................................... 94
4.7 Share-based payment ........................................................... 94
Section 5 – Other notes
5.1 Non-cash items ........................................................................ 98
5.2 Discontinued operations ...................................................... 99
5.3 Business combinations ........................................................101
5.4 Contingent liabilities and
other financial commitments ............................................103
5.5 Related parties .......................................................................105
5.6 Events after the balance sheet date ..............................106
5.7 Approval of the annual report for publication ...........106
5.8 Companies in the Bang & Olufsen Group ....................107
5.9 Key figure definitions ...........................................................108
BANG & OLUFSEN A/S ANNUAL REPORT 2014/15 · 45
KEY FIGURES · MANAGEMENT REPORT · STRATEGY & OUTLOOK · GOVERNANCE · ANNUAL ACCOUNTS · STATEMENTS
GROUP · PARENT COMPANY
GROUP

CONSOLIDATED INCOME STATEMENT 1 JUNE – 31 MAY
(DKK million) Notes 2014/15 2013/14 Revenue 2.1 2,356.5 2,161.7 Production costs 2.2 (1,776.2) (1,332.0)Gross profit 580.3 829.7 Development costs 2.2, 2.3 (448.5) (292.8)Distribution and marketing costs 2.2 (861.7) (731.9)Administration costs 2.2, 2.4 (77.1) (65.8)Operating profit (EBIT) (807.0) (260.6) Share of result after tax in associated companies 10.5 3.2 Financial income 4.2 24.8 5.6 Financial expenses 4.2 (30.9) (34.5)Financial items, net (6.1) (28.9) Earnings before tax (EBT) (802.7) (286.4) Income tax 2.5 195.4 58.7Earnings for the year - continued operations (607.3) (227.6)Earnings for the year after tax - discontinued operations 5.2 664.3 198.6Earnings for the year 57.0 (29.0) Earnings per share Earnings per share (EPS) DKK 1.3 (0.7)Diluted earnings per share (EPS-D) DKK 1.3 (0.7)Earnings per share from continuing operations, DKK (14.2) (5.8)Diluted earnings per share (EPS-D) from continuing operations, DKK 2.6 (14.2) (5.8)
BANG & OLUFSEN A/S ANNUAL REPORT 2014/15 · 46
KEY FIGURES · MANAGEMENT REPORT · STRATEGY & OUTLOOK · GOVERNANCE · ANNUAL ACCOUNTS · STATEMENTS
GROUP · PARENT COMPANY

CONSOLIDATED STATEMENT OF COMPREHENSIVE INCOME
1 JUNE – 31 MAY
(DKK million) Notes 2014/15 2013/14 Earnings for the year 57.0 (29.0) Items that will be reclassified subsequently to the income statement:Exchange rate adjustment of investment in foreign subsidiaries 12.1 (9.6)Change in fair value of derivative financial instruments used as cash flow hedges (8.8) (2.7)Transfer to the income statement of fair value adjustments of derivative financial instruments used as cash flow hedges, realised cash flows: Transfer to revenue (8.2) 1.7 Transfer to production costs 12.4 (2.9)Income tax on items that will be reclassified to the income statement: 2.5 1.1 1.0 Items that will not be reclassified subsequently to the income statement:Actuarial gains/(losses) on defined benefit plans (4.2) (0.1)Income tax on items that will not be reclassified to the income statement 2.5 0.9 0.0 Other comprehensive income for the year, net of tax 5.3 (12.7) Total comprehensive income for the year 62.3 (41.7)
BANG & OLUFSEN A/S ANNUAL REPORT 2014/15 · 47
KEY FIGURES · MANAGEMENT REPORT · STRATEGY & OUTLOOK · GOVERNANCE · ANNUAL ACCOUNTS · STATEMENTS
GROUP · PARENT COMPANY

CONSOLIDATED BALANCE SHEET AT 31 MAY
(DKK million) Notes 31/5/15 31/5/14 Goodwill 70.2 63.5 Acquired rights 8.0 14.5 Completed development projects 312.1 406.2 Development projects in progress 80.3 317.6 Intangible assets 3.1 470.6 801.7 Land and buildings 104.6 114.7 Plant and machinery 68.9 123.5 Other equipment 26.8 26.8 Leasehold improvements 44.9 39.5 Tangible assets in course of construction and prepayments for tangible assets 9.1 29.8 Tangible assets 3.2 254.3 334.3 Investment property 3.3 17.2 38.6 Investments in associates 5.9 10.2 Other financial receivables 3.4 123.3 44.2 Financial assets 129.2 54.4 Deferred tax assets 2.5 187.5 180.4 Total non-current assets 1,058.8 1,409.5 Inventories 3.5 533.1 666.2 Trade receivables 3.5 456.6 537.4 Receivables from associates 5.4 - 1.9 Corporation tax receivable 33.5 21.3 Other receivables 71.5 65.8 Prepayments 19.9 69.5 Total receivables 581.5 696.0 Cash 1,198.0 120.4 Assets held for sale 77.6 - Total current assets 2,390.2 1,482.6 Total assets 3,449.0 2,892.1
BANG & OLUFSEN A/S ANNUAL REPORT 2014/15 · 48
KEY FIGURES · MANAGEMENT REPORT · STRATEGY & OUTLOOK · GOVERNANCE · ANNUAL ACCOUNTS · STATEMENTS
GROUP · PARENT COMPANY

CONSOLIDATED BALANCE SHEET AT 31 MAY
(DKK million) Notes 31/5/15 31/5/14 Share capital 4.5 432.0 392.7 Translation reserve 24.6 12.4 Reserve for cash flow hedges (3.5) 0.0 Retained earnings 4.6 1,468.3 1,199.2 Total equity 1,921.4 1,604.4 Pensions 3.6 17.1 13.3 Deferred tax 2.5 10.6 7.7 Provisions 3.7 44.8 39.8 Mortgage loans 4.1 191.1 197.8 Other non-current liabilities 1.6 1.9 Deferred income 3.8 148.7 - Total non-current liabilities 414.0 260.5 Mortgage loans 4.1 8.4 8.2 Loans from banks 4.1 210.0 220.0 Overdraft facilities - 68.5 Provisions 3.7 25.4 28.8 Trade payables 3.5 443.1 434.0 Corporation tax payable 33.7 18.1 Other liabilities 309.1 215.8 Deferred income 67.7 33.9 Other current liabilities 1,097.4 1,027.2 Liabilities associated with assets held for sale 16.3 - Total liabilities 1,527.6 1,287.8 Total equity and liabilities 3,449.0 2,892.1
BANG & OLUFSEN A/S ANNUAL REPORT 2014/15 · 49
KEY FIGURES · MANAGEMENT REPORT · STRATEGY & OUTLOOK · GOVERNANCE · ANNUAL ACCOUNTS · STATEMENTS
GROUP · PARENT COMPANY

CONSOLIDATED CASH FLOW STATEMENT 1 JUNE – 31 MAY
(DKK million) Notes 2014/15 2013/14 Earnings for the year - continuing operations (607.3) (227.6)Earnings for the year - discontinued operations 664.3 198.6 Amortisation, depreciation and impairment losses 430.8 342.1 Adjustments for non-cash items 5.1 (662.3) (13.9)Change in receivables 10.6 (141.2)Change in inventories 78.5 (63.2)Change in trade payables etc 155.8 127.1 Cash flow from operations 70.3 221.9 Interest received 24.8 5.6 Interest paid (30.9) (34.5)Income tax paid (9.2) (9.5)Cash flow from operating activities 55.0 183.5 Purchase of intangible non-current assets (209.2) (310.5)Purchase of tangible non-current assets (82.9) (82.3)Acquisition of activity - (41.0)Sales of tangible non-current assets - 142.7 Proceeds from sale of associated companies 12.5 -Proceeds from sale of businesses 1,110.8 -Received reimbursements, intangible non-current assets 12.5 7.4 Change in financial receivables 14.0 (0.9)Cash flow from investing activities 857.7 (284.6) Free cash flow 912.7 (101.1) Repayment of long-term loans (6.5) (6.8)Proceeds from/repayment of short-term borrowings (10.0) 70.0 Capital increase 248.2 - Purchase of own shares - - Sale of own shares 2.6 1.2 Settlement of share options (0.9) - Cash flow from financing activities 233.4 64.4 Change in cash and cash equivalents 1,146.1 (36.7) Cash and cash equivalents, 1 June 51.9 89.7 Exchange rate adjustment, cash and cash equivalents - (1.1)Cash and cash equivalents, 31 May 1,198.0 51.9 Cash and cash equivalents: Cash 1,198.0 120.4 Current overdraft facilities - (68.5)Cash and cash equivalents 31 May 1,198.0 51.9
BANG & OLUFSEN A/S ANNUAL REPORT 2014/15 · 50
KEY FIGURES · MANAGEMENT REPORT · STRATEGY & OUTLOOK · GOVERNANCE · ANNUAL ACCOUNTS · STATEMENTS
GROUP · PARENT COMPANY

CONSOLIDATED STATEMENT OF CHANGES IN EQUITY
1 JUNE – 31 MAY
Foreign cur- Cash flow rency trans- hedge Retained (DKK million) Share capital lation reserve reserve earnings Total
Equity 31 May 2014 392.7 12.5 0.0 1,199.3 1,604.4 Earnings for the year - - - 57.0 57.0 Other comprehensive income - 12.1 (4.6) (4.2) 3.3 Other comprehensive income, tax - - 1.1 0.9 2.0 Comprehensive income for the year - 12.1 (3.5) 53.7 62.3 Capital increase 39.3 - - 219.9 259.2 Costs relating to capital increase - - - (10.9) (10.9)Grant of share options - - - 4.6 4.6 Reversal of dividend - - - - - Sale of own shares - - - 2.6 2.6 Settlement of share options - - - (0.9) (0.9)Equity 31 May 2015 432.0 24.6 (3.5) 1,468.3 1,921.4 Equity 1 June 2013 392.7 22.1 3.0 1,222.4 1,640.2 Earnings for the year - - - (29.0) (29.0)Other comprehensive income - (9.6) (4.0) (0.1) (13.7)Other comprehensive income, tax - 1.0 0.0 1.0 Comprehensive income for the year - (9.6) (3.0) (29.1) (41.7) Grant of share options - - - 4.2 4.2 Reversal of dividend - - - 0.6 0.6 Sale of own shares - - - 1.2 1.2 Equity 31 May 2014 392.7 12.5 0.0 1,199.3 1,604.4
BANG & OLUFSEN A/S ANNUAL REPORT 2014/15 · 51
KEY FIGURES · MANAGEMENT REPORT · STRATEGY & OUTLOOK · GOVERNANCE · ANNUAL ACCOUNTS · STATEMENTS
GROUP · PARENT COMPANY

SECTION 1BASIS OF REPORTING
This section introduces Bang & Olufsen’s financial accounting policies in general, as well as an overview of management’s key accounting estimates and the new IFRS requirements. All group companies follow the same Group accounting poli-cies. A detailed description of accounting policies related to specific reported amounts is presented in each note to the relevant financial items.
1.1 BASIS OF REPORTING
Basic principlesThe consolidated financial statements of the Bang & Olufsen Group and the financial statements for 2014/15 for Bang & Olufsen a/s have been prepared in accordance with International Financial Reporting Standards (IFRS) as adopted by the EU and additional Danish requirements for the presentation of financial statements for listed companies (class D entities) cf. the Statutory Order on Adoption of IFRS (the Danish announcement on Adoption of IFRS) issued in accordance with the Danish Financial Statements Act.
The consolidated and the separate financial statements are presented in DKK which is the presentation currency for the Group and the functional currency for the parent company.
Assets are recognized in the balance sheet, when it is probable that future economic benefits resulting from a past event will flow to the Group. Liabilities are recognized in the balance sheet when it is probable that the Group will give up future economic benefits as a consequence of a legal or constructive obligation resulting from a past event. The value of the assets and liabilities should be able to be measured reliably.
The consolidated financial statements have been prepared on a going concern basis and under the historical cost con-vention with the exception of derivatives which are measured at fair value.
ConsolidationThe consolidated financial statements comprise the parent company, Bang & Olufsen a/s, and the companies (subsidiar-ies), which are controlled by the parent company. The parent company is presumed to have control, when it directly or indirectly holds more than 50 per cent of the voting rights or in other ways can exercise or is exercising controlling influ-ence. Companies, in which the Group directly or indirectly holds between 20 per cent and 50 per cent of the voting rights and has a significant influence but not control, are regarded as associates.
The consolidated financial statements have been prepared on the basis of the financial statements of the parent compa-ny and its subsidiaries. The consolidated financial statements have been prepared by adding uniform items. The financial statements that are used for the consolidation are prepared in accordance with the Group’s accounting principles. In the process of consolidation, intra-group income and expenses, intra-group accounts receivable and payable and dividend and profits and losses from transactions between the consolidated companies have been eliminated. In the consolidated financial statements the subsidiaries’ items are recognised 100 per cent.
Translation of foreign currencyOn initial recognition, transactions in a currency other than the company’s functional currency are translated at the exchange rate prevailing at the transaction date. Receivables, payables and other monetary items in foreign currency, which have not been settled at the balance sheet date, are translated at the exchange rates prevailing at this date. Cur-rency gains and losses arising between the transaction date and the date of payment or the balance sheet date, respec-tively, are recognised in the profit and loss account as financial income or financial costs. Tangible and intangible non-current assets, inventories and other non-monetary assets, which have been purchased in a foreign currency, and which are measured at historical cost prices, are translated at the exchange rate prevailing at the transaction date.
BANG & OLUFSEN A/S ANNUAL REPORT 2014/15 · 52
KEY FIGURES · MANAGEMENT REPORT · STRATEGY & OUTLOOK · GOVERNANCE · ANNUAL ACCOUNTS · STATEMENTS
GROUP · PARENT COMPANY

When recognising companies that present their financial statements in another functional currency than Danish kroner (DKK) in the consolidated financial statements, profit and loss accounts are translated using average exchange rates for the year. The balance sheet items are translated using the exchange rates prevailing on the balance sheet date. Goodwill is regarded as belonging to the acquired company and is translated using the exchange rates prevailing on the balance sheet date.
Translation differences arising from the translation of the foreign subsidiaries’ balance sheet items at the beginning of the year to the exchange rates prevailing at the balance sheet date, and from the translation of the profit and loss accounts from average exchange rates to the balance sheet date exchange rates, are recognised in other comprehensive income. Similarly, translation differences that arise on changes made directly to the foreign company’s equity are recognised in other comprehensive income.
Investments in associatesInvestments in associates are recognised and measured according to the equity method in the consolidated financial statements., i.e. at the proportional share of the accounting net asset value of the companies, in accordance with the Group’s accounting principles with the deduction or addition of proportional intra-group gains and losses and with the addition of a carrying amount of goodwill.
The proportional share of the companies result after tax with the reduction of any impairment losses on goodwill is rec-ognised in the income statement.
Investments in associates with a negative net asset value are measured at DKK 0. Receivables and other non-current fi-nancial assets, which are regarded as being part of the total investment in the associate, are written down by the remain-ing negative net asset value. Trade receivables and other receivables are written down to the extent they are assessed to be irrecoverable.
A provision to cover the remaining negative net asset value is recognized only to the extent that the Group has a legal or constructive obligation to cover the obligations of the company in question.
New investments in associates are accounted for by using the acquisition method.
Production costsProduction costs comprise wages, consumption of stock and indirect costs, including salaries, depreciation/amortisation and impairment losses, which are incurred with the purpose of achieving the net turnover for the year.
Distribution and marketing costsDistribution and marketing costs comprise costs relating to sales and distribution of the Group’s products, including salaries for sales personnel, advertising and exhibition costs, depreciation/amortization and impairment losses. Costs in subsidiaries, which are responsible exclusively for the sale of the Group’s products, are allocated to distribution and marketing costs.
Administration costs etc.Administration costs etc. comprise costs for the administrative personnel, management and office costs etc. including depreciation/ amortisation and impairment losses.
SECTION 1BASIS OF REPORTING
BANG & OLUFSEN A/S ANNUAL REPORT 2014/15 · 53
KEY FIGURES · MANAGEMENT REPORT · STRATEGY & OUTLOOK · GOVERNANCE · ANNUAL ACCOUNTS · STATEMENTS
GROUP · PARENT COMPANY

Adoption of new or amended IFRSsBased on an assessment of new or amended and revised accounting standards and interpretations (‘IFRS’) issued by IASB and IFRS endorsed by the European Union effective on or after 1 January 2015, it has been assessed that the appli-cation of these new IFRSs has not had a material impact on the Consolidated financial statements in 2015, and Manage-ment does not anticipate any significant impact on future periods from the adoption of these new IFRS.
New or amended EU endorsed accounting standardsBang & Olufsen has adopted all new, amended standards, revised accounting standards, and interpretations (IFRIC) as endorsed by the EU and effective for the financial year 1 June 2014 – 31 May 2015.
Based on an assessment of new or amended and revised accounting standards and interpretations (‘IFRS’) issued by IASB and IFRS endorsed by the European Union effective on or after 1 June 2015, it has been assessed that the applica-tion of these new IFRSs has not had a material impact on the consolidated financial statements in 2014/15, and manage-ment does not anticipate any significant impact on future periods from the adoption of these new IFRS.
Bang & Olufsen has thoroughly considered the impact of the new IFRS standards and interpretations, and has concluded that other standards which are effective for the financial year 1 June 2015 - 31 May 2016 are either of no relevance to the Group, or exert no material impact on the financial statements for the current year.
IASB has issued a number of new standards, amendments to existing standards and bases for conclusions, which have not yet come into force, but which will become effective in the financial year later than 2015/16. New and revised stand-ards are expected to be implemented on the effective date. The following standards are in general expected to change current accounting regulation most significantly:
• IASB has issued IFRS 9 ‘Financial Instruments’, with effective date probably from 1 January 2018. It currently awaits EU endorsement. IFRS 9 is part of the IASB’s project to replace IAS 39, and the new standard will substantially change the classification and measurement of financial instruments and hedging requirements.
• IASB has issued IFRS 15 ‘Revenue from contracts with customers’, with effective date 1 January 2018. It currently awaits EU endorsement. IFRS 15 is part of the convergence project with FASB to replace IAS 18. The new standard will establish a single, comprehensive framework for revenue recognition.
• IASB has issued a re-exposure draft on IAS 17 ‘Leasing’. Depending on the wording of the final standard, the change in lease accounting is expected to require capitalization of the majority of the Group’s operational lease contracts.
Management is currently assessing the potential impact on the consolidated financial statements. It is Management’s immediate assessment that the changes will not have any significant impact on recognition and measuring.
SECTION 1BASIS OF REPORTING
BANG & OLUFSEN A/S ANNUAL REPORT 2014/15 · 54
KEY FIGURES · MANAGEMENT REPORT · STRATEGY & OUTLOOK · GOVERNANCE · ANNUAL ACCOUNTS · STATEMENTS
GROUP · PARENT COMPANY

1.2 CRITICAL ACCOUNTING ESTIMATES AND JUDGEMENTS
When applying the Group’s accounting principles it is necessary that management makes a number of accounting as-sessments and estimates as well as makes assumptions about the carrying amount of certain assets and liabilities and the recognised revenue and costs, which cannot be deduced directly from other sources. Significant judgements are made when assessing provisions, development projects, trade receivables, inventories and deferred tax assets.
Management bases its estimates and assumptions on historical experience and other relevant factors that are believed to be reasonable under the given circumstances. The actual outcome can differ from these estimates.
The estimates made and the underlying assumptions are reviewed on a continuous basis. Changes made to the account-ing estimates are recognised in the financial period, where the change takes place and future financial periods, if the change affects both the period, where the change takes place, and the following financial periods.
The critical accounting estimates and judgements are described under the sections to which they relate:
Accounting estimate/judgement Note
Deferred tax assets 2.5Development projects 3.1Inventories 3.5.1Trade receivables 3.5.2Provision for warranty and fairness 3.7
SECTION 1BASIS OF REPORTING
BANG & OLUFSEN A/S ANNUAL REPORT 2014/15 · 55
KEY FIGURES · MANAGEMENT REPORT · STRATEGY & OUTLOOK · GOVERNANCE · ANNUAL ACCOUNTS · STATEMENTS
GROUP · PARENT COMPANY

SECTION 2RESULTS FOR THE YEAR
This section contains notes relating to earnings for the year including operating segments, development and staff costs and taxes for the year. A detailed description of the results for the year is given in the Financial Review on pages 10-14.
2.1 OPERATING SEGMENT INFORMATION
Accounting policiesRevenue recognitionRevenue is recognised in the income statement, when delivery and transfer of the risks of ownership to the customer has taken place, if the revenue can be measured reliably, and payment is expected to be received. Revenue is recognised net of value added tax and discounts related to the sale.
Revenue regarding sales of goods is recognised in the income statement, if the transfer of the risks of ownership to the customer has taken place before the end of the financial year.
Segment informationSegment information has been prepared in accordance with the Group’s accounting principles and follows the Group’s management structure and the internal management reporting that is used by top operational management to evaluate results and resource allocation.
The Group’s reportable segments are:
• Bang & Olufsen• B&O PLAY
The segments are split based on differences in the customers and products of the segments. Bang & Olufsen and B&O PLAY which has been created with a view to increase revenue and attract new potential customers to the existing Bang & Olufsen distribution. The B&O PLAY products are sold through Bang & Olufsen’s B1 stores and shop-in-shops and through third party retail stores as well as online.
The segments performance measurement is gross profit. Segment income and costs include the items that can be di-rectly attributed to the individual segment.
The segments asset measurement is a sum consisting of completed development projects, development projects in pro-gress and trade receivables. The internal management reporting does not include segment liabilities.
In 2014/15 the Group’s reportable segments have been adjusted to consist of Bang & Olufsen and B&O PLAY. The former Automotive and ICEpower segments have been excluded and are reported as discontinued operations cf. note 5.2.
BANG & OLUFSEN A/S ANNUAL REPORT 2014/15 · 56
KEY FIGURES · MANAGEMENT REPORT · STRATEGY & OUTLOOK · GOVERNANCE · ANNUAL ACCOUNTS · STATEMENTS
GROUP · PARENT COMPANY

SECTION 2RESULTS FOR THE YEAR
Trade between the Group’s reportable segments is carried out at arm’s length conditions.
The Group’s geographical areas are:
• Europe• North America• BRIC• Rest of World
BRIC includes Brazil, Russia, India, China, Taiwan, Hong Kong and Korea.
The geographical areas are split on the basis of the location of the customers and assets.
As the Group’s domicile is Denmark disclosure is also made of total non-current assets and net revenue split between Denmark and the Rest of world.
2.1 OPERATING SEGMENT INFORMATION (CONTINUED)
BANG & OLUFSEN A/S ANNUAL REPORT 2014/15 · 57
KEY FIGURES · MANAGEMENT REPORT · STRATEGY & OUTLOOK · GOVERNANCE · ANNUAL ACCOUNTS · STATEMENTS
GROUP · PARENT COMPANY

(DKK million)
2.1 OPERATING SEGMENT INFORMATION (CONTINUED)
2014/15 Bang & Olufsen B&O PLAY Unallocated Total Revenue, Group 1,743.0 613.5 - 2,356.5 Gross profit, Group 461.4 167.1 (48.2)* 580.3 Gross margin-% 26.5 27.2 - 24.6 Amortization, depreciation and impairment losses (281.7) (41.7) (5.0) (328.4) Other non-allocated capacity costs - - (1,058.9) (1,058.9)Share of result after tax in associated companies - - 10.5 10.5 Financial income - - 24.8 24.8 Financial expenses - - (30.9) (30.9)Earnings before tax - - (1,107.7) (802.7) Completed development projects 318.2 24.6 - 342.8 Development projects in progress 79.6 0.7 - 80.3 Total segment assets 397.8 25.3 - 423.1 Unallocated assets - - 3,025.9 3,025.9 Total assets, Group 397.8 25.3 3,025.9 3,449.0 Denmark 1,043 31 - 1,074 Rest of world 981 15 - 996 Average number of full-time employees, Group 1,975 46 - 2,070
* Unallocated costs include cost for shared functions previously allocated to discontinued operations.* Comparative figures for 2013/14 have been adjusted to reflect that the discontinuing operations have been separated.
SECTION 2RESULTS FOR THE YEAR
BANG & OLUFSEN A/S ANNUAL REPORT 2014/15 · 58
KEY FIGURES · MANAGEMENT REPORT · STRATEGY & OUTLOOK · GOVERNANCE · ANNUAL ACCOUNTS · STATEMENTS
GROUP · PARENT COMPANY

(DKK million)
2.1 OPERATING SEGMENT INFORMATION (CONTINUED)
2013/14 Bang & Olufsen B&O PLAY Unallocated Total Revenue, Group 1,628.0 534.7 - 2,161.7 Gross profit, Group 718.2 170.2 (58.7)* 829.7 Gross margin-% 44.1 31.8 - 38.4 Amortization, depreciation and impairment losses (234.3) (44.3) (2.3) (280.9) Other non-allocated capacity costs - - (809.5) (809.5)Share of result after tax in associated companies - - 3.2 3.2 Financial income - - 5.6 5.6 Financial expenses - - (34.5) (34.5)Earnings before tax - - (896.2) (286.4) Completed development projects 260.5 28.1 - 288.6 Development projects in progress 173.9 8.7 - 182.5 Total segment assets 434.3 36.8 - 471.1 Unallocated assets - - 2,421.0 2,421.0 Total assets, Group 434.3 36.8 2,421.0 2,892.1 Denmark 1,107 21 - 1,128 Rest of world 897 2 - 898 Average number of full-time employees, Group 2,003 23 - 2,026
* Unallocated costs include cost for shared functions previously allocated to from discontinued operations.
SECTION 2RESULTS FOR THE YEAR
BANG & OLUFSEN A/S ANNUAL REPORT 2014/15 · 59
KEY FIGURES · MANAGEMENT REPORT · STRATEGY & OUTLOOK · GOVERNANCE · ANNUAL ACCOUNTS · STATEMENTS
GROUP · PARENT COMPANY

(DKK million)
2.1 OPERATING SEGMENT INFORMATION (CONTINUED)
Total non-current assets Total revenue 2014/15 2013/14 2014/15 2013/14
Geographical information* Europe 701.1 876.5 1,421.7 1,335.0 North America 8.7 7.6 165.2 159.8 BRIC 38.1 42.3 307.3 306.1 Rest of world - 2.7 218.0 225.2 Total Bang & Olufsen distribution 747.9 929.1 2,112.2 2,026.0 B&O PLAY - - 244.3 135.7 Total third party distribution and e-commerce - - 244.3 135.7 Total - Group 747.9 929.1 2,356.5 2,161.7 Denmark 597.5 875.6 312.4 272.2 Rest of world 150.4 53.5 2,044.1 1,889.5 Total 747.9 929.1 2,356.5 2,161.7
Non-current assets do not include deferred tax assets, pension assets and non-current financial instruments.
Bang & Olufsen Group has no transactions with individual customers which make up more than 10 per cent of the Group’s revenue.
The Group’s total revenue is almost exclusively derived from the sale of goods (99.9 per cent in 2014/15 and 99.9 per cent in 2013/14).
SECTION 2RESULTS FOR THE YEAR
BANG & OLUFSEN A/S ANNUAL REPORT 2014/15 · 60
KEY FIGURES · MANAGEMENT REPORT · STRATEGY & OUTLOOK · GOVERNANCE · ANNUAL ACCOUNTS · STATEMENTS
GROUP · PARENT COMPANY

(DKK million) 2014/15 2013/14
2.2 STAFF COSTS
Wages and salaries etc. 732.9 646.8 Share-based payment 4.3 3.8 Pensions 45.6 42.5 Other social security costs 41.3 37.4 Total 824.1 730.5 Expensed as follows: Production costs 405.8 368.5 Development costs 118.7 131.9 Distribution- and marketing costs 238.1 189.9 Administration costs 61.5 40.2 Total 824.1 730.5 Average number of full-time employees 2,070 2,026
2014/15 2013/14 Executive Other key Executive Other key Whereof to: Board Management employees Board Management employees
Wages, salaries and fees 3.7 9.4 14.1 3.7 8.4 12.9 Pensions - 0.4 1.6 - - 1.3 Bonus - - 2.2 - 0.5 1.2 Total 3.7 9.8 17.9 3.7 8.9 15.4 Share-based payment - 2.1 1.5 - 2.3 1.4 Total remuneration 3.7 11.9 19.4 3.7 11.1 16.8
In 2014/15 there were 8 members of staff in the group ‘Other key employees’, which is unchanged from last year.
Specified as follows: 2014/15 2013/14
Remuneration of Executive Management:Tue Mantoni 7.3 7.7 Anders Aakær Jensen (appointed 01.08.2014) 2.4 - Stefan K Persson (appointed 01.10.2014) 1.5 - Henning Bejer Beck (resigned 31.07.2014) 0.8 2.8 John Bennett-Therkildsen - 0.6 Total 11.9 11.1
The value of the share-based payment expresses the group income statement effect of allocated share options. Please see note 4.7 for further information.
Refer to note 4.7 for further information about the Group’s share option programme.
SECTION 2RESULTS FOR THE YEAR
BANG & OLUFSEN A/S ANNUAL REPORT 2014/15 · 61
KEY FIGURES · MANAGEMENT REPORT · STRATEGY & OUTLOOK · GOVERNANCE · ANNUAL ACCOUNTS · STATEMENTS
GROUP · PARENT COMPANY

(DKK million) 2014/15 2013/14
2.2 STAFF COSTS (CONTINUED)
Remuneration of the Board:Ole Andersen (chairman) 0.9 0.9 Jim Hagemann Snabe (deputy chairman) 0.6 0.6 Jesper Jarlbæk 0.4 0.4 Majken Schultz 0.3 0.2 Albert Bensoussan (appointed 10.09.2014) 0.2 - Mads Nipper (appointed 10.09.2014) 0.2 - Knud Olesen 0.3 0.3 Jesper Olesen 0.3 0.3 Per Østergaard Frederiksen 0.3 0.3 André Loesekrug-Pietri (resigned 10.09.2014) 0.1 0.3 Rolf Eriksen (resigned 10.09.2014) 0.1 0.3 Alberto Torres (resigned 19.09.2013) - 0.1 Total 3.7 3.7
2.3 DEVELOPMENT COSTS
Accounting policiesDevelopment costs, which do not meet the criteria for capitalization as defined in note 3.1 are recognised in the income statement as development costs along with amortization and impairment losses on capitalized development projects.
Incurred development costs before capitalization 369.7 285.0 Hereof capitalized (159.2) (176.1)Incurred development costs after capitalization 210.5 108.9 Capitalization (%) 43.1 61.8Total amortization charges and impairment losses on development projects 238.0 183.9 Total 448.5 292.8
In 2013/14 there were in addition to the incurred development costs above further additions of DKK 47.5 million to capi-talized development costs ref note 3.1. These additions related to key components and technologies acquired from third parties.
2.4 FEES TO AUDITORS APPOINTED AT THE ANNUAL GENERAL MEETING
Statutory audit 2.2 2.1Other assurance services 0.2 0.5Tax services 1.1 0.4Other services 3.0 0.8Total 6.5 3.8 EY were re-appointed as auditors at the Annual General Meeting on 10 September 2014.
SECTION 2RESULTS FOR THE YEAR
BANG & OLUFSEN A/S ANNUAL REPORT 2014/15 · 62
KEY FIGURES · MANAGEMENT REPORT · STRATEGY & OUTLOOK · GOVERNANCE · ANNUAL ACCOUNTS · STATEMENTS
GROUP · PARENT COMPANY

(DKK million)
2.5 TAXATION
Accounting policiesTax for the year, which includes the current tax and changes in deferred tax for the year, is recognised in profit or loss with the share that is attributable to the result for the year and in other comprehensive income or directly in equity with the share, which can be attributed to entries made in other comprehensive income or directly in equity, respectively.
Current income tax payable and current income tax receivable is recognised in the balance sheet as the tax calculated on the year’s taxable income adjusted for prepaid tax.
When calculating current tax for the year the tax rates and regulations prevailing at the balance sheet date in the differ-ent countries are used.
Deferred tax is recognised using the balance sheet liability method on all temporary differences between the tax base and the carrying amount of assets and liabilities, except for deferred tax on temporary differences that arise either on initial recognition of goodwill or on initial recognition of a transaction that is not a business combination, and where the temporary difference on initial recognition affects neither accounting profit or loss nor the taxable income.
Deferred tax on temporary differences relating to investments in subsidiaries and associates is recognised, unless the parent company is able to control when the deferred tax is realised, and it is probable that the deferred tax will not be realised as current tax within the foreseeable future.
The deferred tax is calculated based on the planned use of each asset and settlement of each liability, respectively.
The deferred tax is measured using the tax rates and regulations in the different countries, which – based on the laws that have been enacted or substantively enacted at the balance sheet date – are expected to prevail, when the deferred tax is expected to be realized as current tax. The change in deferred tax due to changes in tax rates or regulations is recognised in profit or loss, unless the deferred tax is attributable to transactions, which have previously been recognised directly in equity or in other comprehensive income. In the latter case the change is also recognised directly in equity or in other comprehensive income, respectively.
Deferred tax assets, including the tax value of any tax loss carryforwards, are recognised in the balance sheet at the value, the asset is expected to be realised at, either by set-off against deferred tax liabilities or as net tax assets to be set-off against future positive taxable income. At each balance sheet date it is assessed, if it is probable that sufficient taxable income will exist in the future, so that the deferred tax asset can be utilised.
The parent company is jointly taxed with all Danish subsidiaries. The current Danish corporation tax is distributed be-tween the jointly taxed companies in proportion to their taxable income.
Critical accounting estimates and judgementsDeferred tax assets are recognised in the balance sheet at the value, the asset is expected to be realised at, either by set-off against deferred tax liabilities or as net tax assets to be set-off against future positive taxable income. At each bal-ance sheet date it is assessed, if it is probable that sufficient taxable income will exist in the future, so that the deferred tax asset can be utilised. The deferred tax assets amount to DKK 187.5 million as at 31 May 2015 (DKK 180.4 million as at 31 May 2014).
SECTION 2RESULTS FOR THE YEAR
BANG & OLUFSEN A/S ANNUAL REPORT 2014/15 · 63
KEY FIGURES · MANAGEMENT REPORT · STRATEGY & OUTLOOK · GOVERNANCE · ANNUAL ACCOUNTS · STATEMENTS
GROUP · PARENT COMPANY

(DKK million) 2014/15 2013/14
2.5 TAXATION (CONTINUED)
Tax recognised in Income statementCorporation tax, continuing operations (195.4) (58.7)Corporation tax, discontinued operations 204.1 65.4Total 8.7 5.8
Income statement and other comprehensive incomeCurrent tax charge/credit 18.1 (17.1)Adjustment for prior periods, current tax (6.3) (0.5) 11.8 (17.6)Change in deferred tax (10.3) 10.8 Adjustment of deferred tax prior years 8.8 (8.0)Adjustments from change in tax rate (2.7) 19.6 (4.2) 22.4 Total taxation charge in the income statement 7.6 4.8 Tax recognised in: Income statement 8.7 5.8 Other comprehensive income (1.1) (1.0)Total 7.6 4.8
Tax on other comprehensive income relates to change in fair value of derivative financial instruments used as cashflow hedges, and is recognised in retained earnings.
The taxation charge in the income statement that would arise at the standard rate of DK corporation tax is reconciled to the actual tax charge as follows:
2014/15 2013/14
Tax calculated on earnings before tax 23.5% 16.2 24.5% (5.6)Non-deductible costs and non-taxable income 0.6% 0.4 (7.8%) 1.8 Deviating tax rates in foreign subsidiaries 4.7% 2.7 (2.2%) 0.5 Changes in tax rates (3.8%) (2.7) (84.8%) 19.6 Adjustments to prior periods 3.6% 2.5 34.3% (8.0)Re-capitalised tax loss carry-forwards (15.6%) (10.7) 7.9% (1.8)Foreign withholding tax 0.2% 0.2 0.5% (0.1)Non-taxable dividends/profit from subsidiaries and associates (0.6%) (0.4) 3.9% (0.9)Other 0.6% 0.5 (1.4%) 0.3 Annual effective tax rate/taxation charge in income statement 13.2% 8.7 (25.1%) 5.8
SECTION 2RESULTS FOR THE YEAR
BANG & OLUFSEN A/S ANNUAL REPORT 2014/15 · 64
KEY FIGURES · MANAGEMENT REPORT · STRATEGY & OUTLOOK · GOVERNANCE · ANNUAL ACCOUNTS · STATEMENTS
GROUP · PARENT COMPANY

(DKK million)
2.5 TAXATION (CONTINUED)
Balance sheet
Non- Tax loss current carry- Deferred tax assets assets Inventories Receivables Provisions forwards Other Total
Deferred tax assets 1 June 2013 75.4 12.3 7.7 20.2 66.7 0.8 183.1 Changes in tax rates (13.0) (1.0) - (0.5) (5.1) - (19.6)Recognised in the income statement 36.3 0.3 1.4 (9.4) (12.5) 0.8 16.9 Deferred tax assets 31 May 2014 98.7 11.6 9.1 10.3 49.1 1.6 180.4 Changes in tax rates 0.9 0.5 - 0.8 0.5 2.7 Recognised in the income statement (25.9) (12.5) (0.1) 6.9 (5.3) 41.3 4.4 Deferred tax assets 31 May 2015 73.7 (0.4) 9.0 18.0 44.3 42.9 187.5
Deferred tax assets relate to the subsidiaries in Norway, Sweden, Germany, the UK, Belgium, France, Italy, Spain, the US, Singapore and the jointly-taxed Danish companies. Deferred tax assets have been calculated based on local tax rates.
Other includes deferred tax assets of DKK 32.6 milion from deferred income.
In 2014/15 a deferred tax assets of DKK 14.4 million has been recognised in the jointly-taxed Danish companies based on tax loss carry-forwards, which can be indefinitely carried forward. This deferred tax asset has been recognised on the basis of management’s expectations of the Group’s long-term earnings up to 5 years.
In 2014/15 has Bang & Olufsen US capitalised DKK 11.1 million of the total losses carried forward. The recognition in Bang & Olufsen US is based on the expectations to future earnings in the US subsidiary. The unrecognised deferred tax assets amount to DKK 45.3 million. The basis for the remaining unrecognised deferred tax assets includes tax losses of DKK 128.3 million. The tax losses can be carried forward for a period of one to 20 years.
SECTION 2RESULTS FOR THE YEAR
BANG & OLUFSEN A/S ANNUAL REPORT 2014/15 · 65
KEY FIGURES · MANAGEMENT REPORT · STRATEGY & OUTLOOK · GOVERNANCE · ANNUAL ACCOUNTS · STATEMENTS
GROUP · PARENT COMPANY
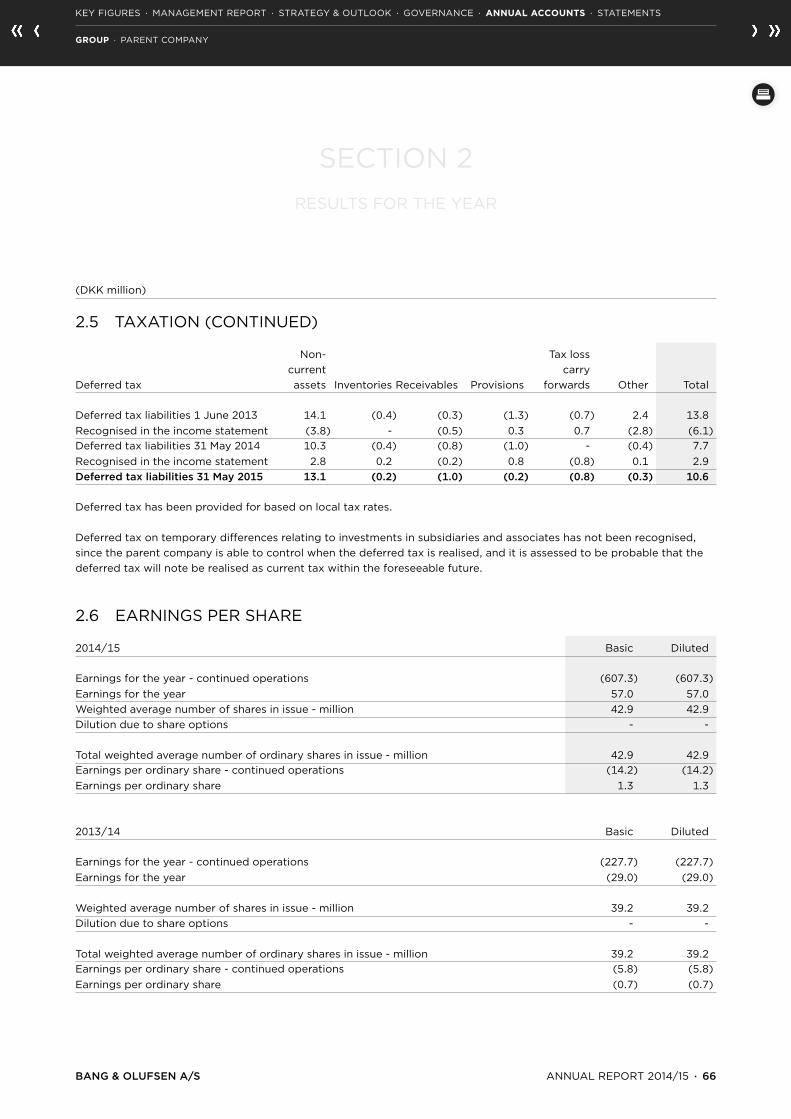
(DKK million)
2.5 TAXATION (CONTINUED)
Non- Tax loss current carry Deferred tax assets Inventories Receivables Provisions forwards Other Total
Deferred tax liabilities 1 June 2013 14.1 (0.4) (0.3) (1.3) (0.7) 2.4 13.8 Recognised in the income statement (3.8) - (0.5) 0.3 0.7 (2.8) (6.1)Deferred tax liabilities 31 May 2014 10.3 (0.4) (0.8) (1.0) - (0.4) 7.7 Recognised in the income statement 2.8 0.2 (0.2) 0.8 (0.8) 0.1 2.9 Deferred tax liabilities 31 May 2015 13.1 (0.2) (1.0) (0.2) (0.8) (0.3) 10.6
Deferred tax has been provided for based on local tax rates.
Deferred tax on temporary differences relating to investments in subsidiaries and associates has not been recognised, since the parent company is able to control when the deferred tax is realised, and it is assessed to be probable that the deferred tax will note be realised as current tax within the foreseeable future.
2.6 EARNINGS PER SHARE
2014/15 Basic Diluted
Earnings for the year - continued operations (607.3) (607.3)Earnings for the year 57.0 57.0Weighted average number of shares in issue - million 42.9 42.9Dilution due to share options - - Total weighted average number of ordinary shares in issue - million 42.9 42.9Earnings per ordinary share - continued operations (14.2) (14.2)Earnings per ordinary share 1.3 1.3 2013/14 Basic Diluted
Earnings for the year - continued operations (227.7) (227.7)Earnings for the year (29.0) (29.0) Weighted average number of shares in issue - million 39.2 39.2Dilution due to share options - - Total weighted average number of ordinary shares in issue - million 39.2 39.2 Earnings per ordinary share - continued operations (5.8) (5.8)Earnings per ordinary share (0.7) (0.7)
SECTION 2RESULTS FOR THE YEAR
BANG & OLUFSEN A/S ANNUAL REPORT 2014/15 · 66
KEY FIGURES · MANAGEMENT REPORT · STRATEGY & OUTLOOK · GOVERNANCE · ANNUAL ACCOUNTS · STATEMENTS
GROUP · PARENT COMPANY

SECTION 3OPERATING ASSETS AND LIABILITIES
This section contains notes relating to the assets that form the basis for the activities in the Bang & Olufsen Group and the related liabilities.
3.1 INTANGIBLE ASSETS
Accounting policies
Asset class Recognition ValuationAmortisation method
Estimated useful life
Goodwill When recognising goodwill, the goodwill amount is allocated to those of the Group’s activities that gener-ate independent cash flows (cash-generating units). The definition of cash-generating units is in accordance with the managerial structure and the internal management accounting and report-ing in the Group.
Goodwill is initially recognised and measured as the differ-ence between on the one hand, the cost price of the acquired company, the value of minority interests in the acquired com-pany and the acquisition-date fair value of previously held equity interests, and, on the other hand, the fair value of the acquired assets, liabilities and contingent liabilities.
N/A Unlimited – tested for impairment annually.
Development projects (under construction)
Clearly defined and iden-tifiable projects if proba-ble that they can be mar-keted as new products in a potential market.
Measured at cost price. This comprises costs, including salaries and depreciation/am-ortisation that relate directly to the development projects, and which are necessary to com-plete the project from the time when the development project initially meets the criteria for recognition as an asset. Reim-bursements and grants are de-ducted from the cost price.
N/A N/A until completed – tested for impair-ment annually.
Development projects (completed)
Measured at cost price less accumulated amortisation and impairment losses.
Straight-line 2-6 years for com-pleted development projects, or over remaining term of intellectual property right if less
Acquired rights
Software, key money and patents.
Measured at cost price less accumulated amortisation and impairment losses.
Straight-line Over the shorter of the estimated useful life and the term of the contract.
BANG & OLUFSEN A/S ANNUAL REPORT 2014/15 · 67
KEY FIGURES · MANAGEMENT REPORT · STRATEGY & OUTLOOK · GOVERNANCE · ANNUAL ACCOUNTS · STATEMENTS
GROUP · PARENT COMPANY

SECTION 3OPERATING ASSETS AND LIABILITIES
3.1 INTANGIBLE ASSETS (CONTINUED)
Critical accounting estimates and judgementsDevelopment costs are capitalized only after technical and commercial feasibility of the projects have been established. In connection with the capitalization of development costs, the expected useful life of the product is to be determined. Management has assessed that the amortization period is usually 2-6 years. Management also makes assumptions when assessing the possible impairment of development projects. The applied principles are unchanged from the 2013/14 financial year. Development projects amount to DKK 392.4 million as at 31 May 2015 (DKK 723.8 million as at 31 May 2014). The main additions in the 2014/15 financial year are development projects relating to TV platform and speakers.
ImpairmentThe carrying amount of intangible non-current assets with a definite useful life is reviewed at the balance sheet date to determine if there are indications of decreases in value. If this is the case, the recoverable amount of the asset is deter-mined to assess the need for recognition of any impairment loss.
For development projects in progress and goodwill the recoverable amount is determined at least once a year whether or not there are indications of impairment.
If the asset does not generate cash flows independently of other assets, the recoverable amount is determined for the smallest cash generating unit that includes the asset.
The recoverable amount is determined as the highest value of the asset’s or the cash-generating unit’s fair value less costs to sell and the value in use. When the value in use is determined, the estimated future cash flows are discounted at their present value using a discount rate that reflects both the present market assessment of the time value of money and the specific risks that are connected with the asset and the cash-generating unit, respectively, for which no adjust-ment has been made in the estimated future cash flows.
If the asset’s or the cash-generating unit’s recoverable amount is less than the carrying amount, the carrying amount is reduced to the recoverable amount. For cash-generating units the impairment loss is allocated to reduce first any good-will amounts and then a remaining impairment loss is allocated to the other assets of the unit, in a way so that no asset is reduced to a value below its fair value less costs to sell.
Impairment losses are recognised in the income statement. On any subsequent reversals of impairment losses recognised in prior periods due to changes in the estimates used to determine the recoverable amount the asset’s or the cash-generating unit’s carrying amount is increased to the adjusted recoverable amount, however not exceeding the carrying amount the asset or the cash-generating unit would have had if it had not been impaired. Impairment of goodwill is not reversed.
BANG & OLUFSEN A/S ANNUAL REPORT 2014/15 · 68
KEY FIGURES · MANAGEMENT REPORT · STRATEGY & OUTLOOK · GOVERNANCE · ANNUAL ACCOUNTS · STATEMENTS
GROUP · PARENT COMPANY

(DKK million)
3.1 INTANGIBLE ASSETS (CONTINUED)
Completed Development Acquired development projects in Goodwill rights projects progress Total
Cost At 1 June 2013 54.5 166.9 1,320.1 178.2 1,719.7 Exchange rate adjustment to year-end rate (0.1) - - - (0.1)Additions in the year 11.9 4.2 73.2 233.4 322.7 Reimbursements received - - - (7.4) (7.4)Disposals in the year (0.1) (7.0) (374.3) - (381.4)Completed development projects - - 86.6 (86.6) - At 31 May 2014 66.2 164.1 1,105.6 317.6 1,653.5 Exchange rate adjustment to year-end rate 4.3 - - - 4.3 Additions in the year 2.8 1.1 81.1 124.2 209.2 Reimbursements received - - - (9.2) (9.2)Disposals in the year (2.1) - (167.9) (1.3) (171.3)Disposals in the year from sale of businesses - (3.8) (302.3) (104.9) (411.0)Transfer to assets held for sale - (1.5) (44.3) (24.3) (70.1)Completed development projects - - 221.8 (221.8) - At 31 May 2015 71.2 159.9 894.0 80.3 1,205.4 Amortisation and impairment At 1 June 2013 (2.6) (146.2) (835.4) - (984.2)Exchange rate adjustment to year-end rate (0.1) - - - (0.1)Amortisation during the year - (7.1) (238.3) - (245.4)Reversed amortisation on disposals - 3.7 374.3 - 378.0 At 31 May 2014 (2.7) (149.6) (699.4) - (851.7)Exchange rate adjustment to year-end rate (0.4) - - - (0.4)Amortisation during the year (6.4) (253.2) - (259.6)Impairment losses during the year - - (30.7) - (30.7)Reversed amortisation on disposals 2.1 - 167.9 - 170.0 Reversed amortisation on disposals from sale of businesses - 2.6 199.3 - 201.9Assets transfered to held for sale - 1.5 34.2 - 35.7At 31 May 2015 (1.0) (151.9) (581.9) - (734.8) Net book value At 31 May 2015 70.2 8.0 312.1 80.3 470.6 At 31 May 2014 63.5 14.5 406.2 317.6 801.8
SECTION 3OPERATING ASSETS AND LIABILITIES
BANG & OLUFSEN A/S ANNUAL REPORT 2014/15 · 69
KEY FIGURES · MANAGEMENT REPORT · STRATEGY & OUTLOOK · GOVERNANCE · ANNUAL ACCOUNTS · STATEMENTS
GROUP · PARENT COMPANY

(DKK million)
3.1 INTANGIBLE ASSETS (CONTINUED)
Impairment losses during the year
Goodwill The majority of the Group’s goodwill (DKK 41.7 million) is related to the acquisition of the Dutch distribution in 2004/05. The goodwill is allocated to the cash-generating unit, which includes the activities in Holland. DKK 20.0 million relate to the take over of 20 shops from the previous master dealer Richcom in China in 2013/14. The goodwill is allocated to the cash-generating unit, which includes the activities in BRIC. The goodwill relates in its entirety to the business segment Bang & Olufsen. No impairment losses have been recognised on cash-generating units which include goodwill in 2014/15 or 2013/14 in the Group.
The assessment of the recoverable amount of the cash-generating units which include goodwill is based on calcula-tions of value in use, which is calculated based on expected future cash flows according to the company’s strategy and forecasts for the coming 2 financial years. The terminal value is determined on the assumption of a growth of 2 per cent (2013/14; 2.0 per cent). The growth rate is not expected to exceed the long-term growth rate. A discount rate before tax of 9 per cent is used (6.9 per cent after tax) (2013/14; 10 per cent/7.6 per cent).
Development projectsThe assessment of the recoverable amount of the intangible assets excl. goodwill is based on calculations of value in use of the assets. The value in use is calculated based on expected future cash flows from the assets based on the bud-gets approved by management over the expected life-time of the assets, and a discount rate before tax of 10 per cent (2013/14; 10.0 per cent).
Further it has been assesed whether impairments are required on any individual development projects. During 2014/15 impairment losses of DKK 30.7 million have been recognised on development projects related to terminated products (2013/14; DKK 0 million).
2014/15 2013/14
Amortisation and impairment losses Production costs 4.3 4.1 Development costs 283.8 239.2 Distribution- and marketing costs 2.0 1.9 Administration costs 0.2 0.2 Total 290.3 245.4
SECTION 3OPERATING ASSETS AND LIABILITIES
BANG & OLUFSEN A/S ANNUAL REPORT 2014/15 · 70
KEY FIGURES · MANAGEMENT REPORT · STRATEGY & OUTLOOK · GOVERNANCE · ANNUAL ACCOUNTS · STATEMENTS
GROUP · PARENT COMPANY

(DKK million)
3.2 TANGIBLE ASSETS
Accounting policiesTangible non-current assets are measured at cost price with deduction of accumulated depreciation and impairment losses.
The cost price comprises the acquisition price and costs directly related to the acquisition until the time, when the asset is ready for use. For self-constructed non-current assets, the cost price comprises direct costs for wages, materials, com-ponents and sub-suppliers.
Reimbursements and grants concerning tangible non-current assets are deducted from the cost price.
Interest expenses related to financing of the construction of qualifying tangible non-current assets are recognised in the cost price of the assets, if they relate to the period of construction.
The cost price of a tangible non-current asset is divided into individual components, which are depreciated separately, if the expected useful life differs for the individual components.
For tangible non-current assets held under finance leases, the cost price equals the lower of fair value of the assets and the present value of the future minimum lease payments. The interest rate implicit in the lease or the incremental borrow-ing rate is used as discount rate, when calculating the present value.
SECTION 3OPERATING ASSETS AND LIABILITIES
Asset class Asset type Depreciation policy
Land & Buildings Land None
Buildings Straight-line over 40 years
Interior refurbishment/ special installations
Straight-line over 10 years
Plant & machinery Single purpose production tools Straight-line over 3-6 years
Other Straight-line over 8-10 years
Other equipment Other equipment Straight-line over 3-10 years
Leasehold improvements Leasehold improvements Straight-line over term of lease, max 10 years
Tangible assets in course of construction
Tangible assets in course of construction
None
BANG & OLUFSEN A/S ANNUAL REPORT 2014/15 · 71
KEY FIGURES · MANAGEMENT REPORT · STRATEGY & OUTLOOK · GOVERNANCE · ANNUAL ACCOUNTS · STATEMENTS
GROUP · PARENT COMPANY

(DKK million)
3.2 TANGIBLE ASSETS (CONTINUED)
Impairment The carrying amount of tangible non-current assets is reviewed at the balance sheet date to determine if there are indica-tions of decreases in value. If this is the case, the recoverable amount of the asset is determined to assess the need for recognition of any impairment loss.
If the asset does not generate cash flows independently of other assets, the recoverable amount is determined for the smallest cash generating unit that includes the asset.
The recoverable amount is determined as the highest value of the asset’s or the cash-generating unit’s fair value less costs to sell and the value in use. When the value in use is determined, the estimated future cash flows are discounted at their present value using a discount rate that reflects both the present market assessment of the time value of money and the specific risks that are connected with the asset and the cash-generating unit, respectively, for which no adjust-ment has been made in the estimated future cash flows.
If the asset’s or the cash-generating unit’s recoverable amount is less than the carrying amount, the carrying amount is reduced to the recoverable amount. For cash-generating units the impairment loss is allocated to first reduce any good-will amounts and then a remaining impairment loss is allocated to the other assets of the unit, in a way so that no asset is reduced to a value below its fair value less costs to sell.
In 2014/15 impairment losses have been recognised in the income statement. On any subsequent reversals of impair-ment losses recognised in prior periods due to changes in the estimates used to determine the recoverable amount the asset’s or the cash-generating unit’s carrying amount is increased to the adjusted recoverable amount, however not exceeding the carrying amount the asset or the cash-generating unit would have had, had it not been impaired.
Impairment losses on individual tangible assets of DKK 17.4 million have been recognised relating to assets no longer used (2013/14 DKK 0 million).
SECTION 3OPERATING ASSETS AND LIABILITIES
BANG & OLUFSEN A/S ANNUAL REPORT 2014/15 · 72
KEY FIGURES · MANAGEMENT REPORT · STRATEGY & OUTLOOK · GOVERNANCE · ANNUAL ACCOUNTS · STATEMENTS
GROUP · PARENT COMPANY

(DKK million)
3.2 TANGIBLE ASSETS (CONTINUED) Tangible Leasehold assets in Land and Plant and Other improve- course of buildings machinery equipment ments construction Total
Cost At 1 June 2013 482.8 1,240.9 202.6 72.8 67.5 2,066.6 Exchange rate adjustment to year-end rate (6.5) (3.2) (0.4) (1.5) - (11.6)Reclassification - - 0.3 (0.3) - Additions in the year 4.2 22.7 9.9 25.7 24.8 87.3 Completed assets 0.5 11.6 3.7 - (15.8) - Disposals in the year (99.4) (21.7) (8.4) (16.9) (46.7) (193.1)At 31 May 2014 381.6 1,250.3 207.7 79.8 29.8 1,949.2 Exchange rate adjustment to year-end rate 0.8 (0.1) 5.5 10.4 0.2 16.8 Additions in the year 6.8 28.4 16.3 19.4 12.0 82.9 Completed assets 1.2 25.0 0.5 0.7 (27.4) - Disposals in the year (3.6) (20.8) (13.0) (11.5) (0.4) (49.3)Disposals in the year from sale of businesses - (136.6) (16.2) (8.9) (4.0) (165.7)Transfer to assets held for sale - (2.1) (6.3) (0.9) (1.1) (10.4)At 31 May 2015 386.8 1,144.1 194.5 89.0 9.1 1,823.5
Amortisation and impairment At 1 June 2013 (284.6) (1,085.3) (178.2) (42.6) - (1,590.7)Exchange rate adjustment to year-end rate 1.8 2.9 0.4 0.6 - 5.7 Reclassification (0.1) 0.1 Depreciation during the year (12.7) (64.9) (9.5) (12.7) - (99.8)Reversed depreciation on disposals 28.6 20.5 6.5 14.3 - 69.9 At 31 May 2014 (266.9) (1,126.8) (180.9) (40.3) - (1,614.9)Exchange rate adjustment to year-end rate (0.3) (3.1) (4.1) - (7.5)Depreciation during the year (10.8) (60.2) (11.3) (18.0) - (100.3)Impairment losses during the year (4.4) (12.2) (0.8) - - (17.4)Reversed depreciation on disposals 0.2 21.8 12.2 9.8 - 44.0 Reversed amortisation on disposals from sale of businesses - 100.4 11.0 7.6 - 119.0 Reversed depreciation on assets transfered to held for sale - 1.8 5.2 0.9 - 7.9 At 31 May 2015 (282.2) (1,075.2) (167.7) (44.1) - (1,569.2)
Net book value At 31 May 2015 104.6 68.9 26.8 44.9 9.1 254.2 At 31 May 2014 114.7 123.5 26.8 39.5 29.8 334.3
There are no contractual obligations regarding purchase of tangible assets.
SECTION 3OPERATING ASSETS AND LIABILITIES
BANG & OLUFSEN A/S ANNUAL REPORT 2014/15 · 73
KEY FIGURES · MANAGEMENT REPORT · STRATEGY & OUTLOOK · GOVERNANCE · ANNUAL ACCOUNTS · STATEMENTS
GROUP · PARENT COMPANY

(DKK million) 2014/15 2013/14
3.2 TANGIBLE ASSETS (CONTINUED)
Depreciation and impairment lossesProduction costs 84.5 57.2 Development costs 7.6 12.9 Distribution- and marketing costs 25.0 27.2 Administration costs etc. 0.6 2.5 Total 117.7 99.8
Impairment losses of DKK 17.4 million have been recognised in relation to tangible assets during 2014/15 (2013/14 DKK 0 million).
3.3 INVESTMENT PROPERTY
Accounting policiesInvestment property is property held to earn rental income or for capital appreciation.
Investment property is measured at cost price with deduction of accumulated depreciation and impairment losses. In-vestment property is depreciated on a straight-line basis over 40 years.
Impairment losses of DKK 20.2 million have been recognised in relation to change in use of investment property during 2014/15 (2013/14 DKK 0 million).
Cost At 1 June 2013 79.9 At 31 May 2014 79.9 At 31 May 2015 79.9 Depreciation and impairment At 1 June 2013 (39.9)Depreciation during the year (1.3)At 31 May 2014 (41.2)Depreciation during the year (1.3)Impairment losses during the year (20.2)At 31 May 2015 (62.8) Net book value At 31 May 2015 17.2 At 31 May 2014 38.6
Investment property consists of a building that is used only for rental purposes, and the property that is partly used by Bang & Olufsen Medicom a/s.
External rental income of DKK 2.5 million has been received from the investment property in 2014/15 (2013/14; DKK 2.3 million), and directly attributed operating expenses were DKK 1.5 million (2013/14; DKK 1.6 million).
The property is leased on operating leases with a remaining duration of 46 months. According to the existing opera ting leases a rental income of DKK 2.5 million will be received in 2015/16.
SECTION 3OPERATING ASSETS AND LIABILITIES
BANG & OLUFSEN A/S ANNUAL REPORT 2014/15 · 74
KEY FIGURES · MANAGEMENT REPORT · STRATEGY & OUTLOOK · GOVERNANCE · ANNUAL ACCOUNTS · STATEMENTS
GROUP · PARENT COMPANY

(DKK million)
3.4 OTHER FINANCIAL RECEIVABLES
Cost At 1 June 2013 54.8 Exchange rate adjustment to year-end rate 1.6 Changes in the year (1.9)At 31 May 2014 54.5 Exchange rate adjustment to year-end rate 3.2 Changes in the year 89.0 At 31 May 2015 146.7 Impairment At 1 June 2013 (12.1)Exchange rate adjustment to year-end rate (0.5)Impairment reversals/losses during the year 2.3 At 31 May 2014 (10.3)Exchange rate adjustment to year-end rate (1.1)Impairment reversals/losses during the year (12.0)At 31 May 2015 (23.4) Net book value At 31 May 2015 123.3 At 31 May 2014 44.2 The fair value of other financial receivables in the Group amounts to DKK 123.3 million (DKK 44.2 million in 2013/14).The fair value is calculated as the present value of the future expected cash flows from the receivables.
SECTION 3OPERATING ASSETS AND LIABILITIES
BANG & OLUFSEN A/S ANNUAL REPORT 2014/15 · 75
KEY FIGURES · MANAGEMENT REPORT · STRATEGY & OUTLOOK · GOVERNANCE · ANNUAL ACCOUNTS · STATEMENTS
GROUP · PARENT COMPANY

(DKK million)
3.5 WORKING CAPITAL
Accounting policiesInventoriesInventories are measured at the lower of cost price according to the FIFO principle and net realisable value. The cost price of raw materials, consumables and purchased goods comprises the acquisition price including delivery costs. The cost price of finished goods and work in progress comprises costs of materials and direct labour plus indirect production costs.
Indirect production costs include indirect materials and wages, maintenance and depreciation on plant and machinery, facto-ry buildings and other equipment used in the production process as well as costs of factory administration and management.
The net realisable value of inventories is calculated as the expected selling price less costs of completion and costs nec-essary to make the sale.
ReceivablesReceivables comprise trade receivables, other financial receivables primarily loans to external parties and other receiva-bles. The receivables are categorised as loans and receivables, which are non-derivative financial assets with fixed or determinable payments that are not quoted in an active market.
On initial recognition, the receivables are measured at fair value and subsequently at amortised cost price, which nor-mally correspond to face value less provisions for expected losses. Provisions for losses are based on an individual as-sessment of each outstanding account.
PrepaymentsPrepayments comprise incurred costs related to the following financial years. The prepayments are measured at cost price.
Other financial liabilitiesOther financial liabilities comprise trade payables and other payables to public authorities etc. and are measured at am-ortised cost price.
Deferred incomeDeferred income comprises received payments related to income in the following financial years. Deferred income is measured at cost price.
Critical accounting estimates and judgementsTrade receivablesSpecific estimates of trade receivables are made on an assessment of the dealer’s historical ability to pay and the current situation. The applied principles are unchanged from the 2013/14 financial year. The trade receivables amount to DKK 456.6 million as at 31 May 2015 (DKK 537.4 million as at 31 May 2014).
InventoriesA specific assessment of the need for write-downs for obsolescence of inventories is made based on an assessment of the future sales potential. During the assessment the expected technological developments and the expected service periods are taken into account. In 2014/15 a change in the method for estimating the net realisable value of spare parts has been imple-mented. The changed estimate has been implemented as it is management’s view that the new method reflect the current use of spare parts more reliabily. The change has resulted in a further write-down of inventory of approximately DKK 40 million compared to the estimate used in previous years. Estimates for other inventories than spare parts are unchanged from the 2013/2014 financial year. Inventories amount to DKK 533.1 million as at 31 May 2015 (DKK 666.2 million as at 31 May 2014).
SECTION 3OPERATING ASSETS AND LIABILITIES
BANG & OLUFSEN A/S ANNUAL REPORT 2014/15 · 76
KEY FIGURES · MANAGEMENT REPORT · STRATEGY & OUTLOOK · GOVERNANCE · ANNUAL ACCOUNTS · STATEMENTS
GROUP · PARENT COMPANY

(DKK million) 2014/15 2013/14
3.5 WORKING CAPITAL (CONTINUED)
3.5.1 Inventories
Raw materials 132.8 140.0 Work in progress 30.4 37.1 Spare parts 75.1 113.6 Finished goods 294.8 375.4 Total 31 May 533.1 666.2 It is Group policy that spare parts should be available for a number of years after sale of the product. DKK 38.2 million (2013/14; DKK 57.8 million) out of the DKK 75.1 million in spare parts, is expected to be realised in the period after more than 12 months.
Other disclosures:
Inventory movement recognised in production costs 1,654.0 1,303.5 Impairment of inventories recognised in production costs 60.0 12.9 Reversal of impairment of inventories recognised in production costs 1.9 2.8 Reversal of impairment of inventories is, as in the previous year, a result of better than expected sales of impaired inven-tories.
3.5.2 Trade receivables Trade receivables at 31 May (gross) 577.3 634.6 Impairment 1 June (97.2) (91.9)Exchange rate adjustment to year-end rate 0.1 (0.2)Change in impairment during the year (59.8) (7.3)Actual losses during the year 36.2 2.2 Impairment 31 May (120.7) (97.2) Trade receivables at 31 May (net) 456.6 537.4
All trade receivables fall due within one year.
Financial income of DKK 4.2 million (2013/14; DKK 4.2million) has been recognised in the Group relating to impaired trade receivables.
SECTION 3OPERATING ASSETS AND LIABILITIES
BANG & OLUFSEN A/S ANNUAL REPORT 2014/15 · 77
KEY FIGURES · MANAGEMENT REPORT · STRATEGY & OUTLOOK · GOVERNANCE · ANNUAL ACCOUNTS · STATEMENTS
GROUP · PARENT COMPANY

(DKK million)
3.5 WORKING CAPITAL (CONTINUED)
Impairment of trade receivables is recognised in distribution and marketing costs in the income statement. The impair-ment charge is based on an individual assessment of each individual debtor’s ability to pay. All overdue trade receivables are provided for, except for those where sufficient collateral has been obtained.
The carrying amount of receivables which fall due within 1 year after the end of the financial year, is expected to be a reasonable approximation of the fair value.
2014/15 2013/14
Maturity analysis: Amounts not due 388.3 461.1 Overdue up to 30 days 30.8 5.9 Overdue between 30 and 60 days 13.4 12.9 Overdue between 60 and 90 days 9.2 5.2 Overdue between 90 and 120 days 8.7 6.4 Overdue more than 120 days 6.2 45.9 Trade receivables at 31 May (net) 456.6 537.4
For further details about the credit risk associated with the trade receivables, refer to Note 4.3 Financial Instruments.
SECTION 3OPERATING ASSETS AND LIABILITIES
BANG & OLUFSEN A/S ANNUAL REPORT 2014/15 · 78
KEY FIGURES · MANAGEMENT REPORT · STRATEGY & OUTLOOK · GOVERNANCE · ANNUAL ACCOUNTS · STATEMENTS
GROUP · PARENT COMPANY

(DKK million)
3.6 PENSIONS
Accounting policiesAs employer, the Bang & Olufsen Group participates in pension plans according to normal practice in the countries in which the Group operates. There are two types of plans; defined contribution plans and defined benefit plans.
Under defined contribution plans the Group recognises the pension contributions, which can either be a fixed amount of a fixed percentage of the monthly salary, in the income statement as they are paid to independent pension insurance companies. Any unpaid contributions are recognised in the balance sheet as a liability in other liabilities. Once the contri-butions have been paid the Group has no further obligations and the individual employee carries the risk for the value of the pension insurance at retirement. All pension plans in Denmark and most pension plans in the foreign subsidiaries are defined contribution plans.
Under defined benefit plans the Group has an obligation to pay a fixed amount or a fixed percentage of the salary at retirement. This means that the Bang & Olufsen carries the risk of any changes in the actuarially calculated capital value of the pension plans. Bang & Olufsen currently operates with defined benefit plans in Germany and in Norway.
Annual actuarial calculations are made of the present value of the future benefits that the employees are entitled to. The present value is calculated based on a number of assumptions relating to the future development in salary levels and in-terest-, inflation-, and mortality rates. The present value of the defined benefit obligation net of the fair value of the plan assets is recognised in the balance sheet as a pension asset or a pension liability.
Changes in the assumptions mentioned above as well as differences between the expected and the realised return on plan assets cause actuarial gains and losses are recognised immediately in other comprehensive income in the period in which they arise.
If the defined benefit plan is a net asset, the asset is recognised only if it corresponds to, or is lower than, the sum of unrecognised actuarial losses, unrecognised past service costs and the present value of any future refunds from the plan or reductions in future contributions to the plan. Changes to the benefits, which relate to the employees’ previous employment in the Group, cause a change in the actuarially calculated present value, which is regarded as past service costs. If the covered employees are immediately entitled to the changed benefit the change is recognised in the income statement at once. Otherwise the change is recognised in the income statement during the period, where the employees become entitled to the changed benefit.
SECTION 3OPERATING ASSETS AND LIABILITIES
BANG & OLUFSEN A/S ANNUAL REPORT 2014/15 · 79
KEY FIGURES · MANAGEMENT REPORT · STRATEGY & OUTLOOK · GOVERNANCE · ANNUAL ACCOUNTS · STATEMENTS
GROUP · PARENT COMPANY

(DKK million) 2014/15 2013/14
3.6 PENSIONS (CONTINUED)
Amounts recognised in the income statement: Defined contribution plans 47.8 45.6 Defined benefit plans 1.1 1.9 Total pension amount charged to the income statement 48.9 47.5 Amounts recognised in the balance sheet: Wholly unfunded defined benefit plans 3.3 3.6 Wholly or partly funded defined benefit plans 28.2 24.6 Present value of defined benefit obligation 31 May 31.5 28.2 Fair value of plan assets (13.8) (14.8)Unrecognised actuarial(gains) and losses - - Defined benefit plans obligation 31 May 17.7 13.4 Actual return on plan assets 0.2 0.2
The Group’s defined benefit plans are administered by independent pension funds. None of the plan assets are connected to any of the Group companies.
The defined benefit plans in Germany and Norway are partly funded by means of an independent pension fund.
Germany Norway 2014/15 2013/14 2014/15 2013/14
Actuarial assumptions:Calculation rate p.a. 1.6% 3.0% 2.3% 4.0%Expected salary increase p.a. 1.5% 1.5% 2.75% 3.75%Expected rate of return p.a. 1.6% 3.0% 2.3% 4.0%
SECTION 3OPERATING ASSETS AND LIABILITIES
BANG & OLUFSEN A/S ANNUAL REPORT 2014/15 · 80
KEY FIGURES · MANAGEMENT REPORT · STRATEGY & OUTLOOK · GOVERNANCE · ANNUAL ACCOUNTS · STATEMENTS
GROUP · PARENT COMPANY

(DKK million)
3.6 PENSIONS (CONTINUED)
2014/15 2013/14
Germany:Present value of future payments 20.9 18.1 Fair value of plan assets (8.3) (8.4)Actuarially calculated net obligation 12.6 9.7 Norway: Present value of future payments 7.3 6.5 Fair value of plan assets (5.5) (6.4)Actuarially calculated net receivable 1.8 0.1 Net obligation 14.4 9.8 Wholly unfunded defined benefit plans 3.3 3.6 Defined benefit plans 31 May, net 17.7 13.4
5 year overview: 2014/15 2013/14 2012/13 2011/12 2010/11
Present value of defined benefit obligation 31.5 28.2 27.2 26.2 23.8 Fair value of plan assets (13.8) (14.8) (14.6) (14.9) (14.6)Deficit, defined benefit plans 17.7 13.4 12.6 11.3 9.2 Experience-based adjustments of defined benefit obligation 4.2 1.2 1.4 1.7 0.6 Experience-based adjustments of plan assets for defined benefit plans (0.6) 0.6 (0.0) (0.1) (0.4)
3.7 PROVISIONS
Accounting policiesProvisions comprise provisions for warranty, provisions for fairness and other provisions. Provisions for warranty are ob-ligations to repair products within the warranty period, whereas provisions for fairness are obligations to repair products after the end of the warranty period. Provisions are recognised when the Group has a legal or constructive obligation as a result of events in the financial year or previous years, and it is probable that an outflow of financial resources will be required to settle the obligation. Provisions are measured on basis of past experience with warranty repairs and other obligations. Provisions that are ex-pected to fall due more than one year after the balance sheet date are measured at present value.
SECTION 3OPERATING ASSETS AND LIABILITIES
BANG & OLUFSEN A/S ANNUAL REPORT 2014/15 · 81
KEY FIGURES · MANAGEMENT REPORT · STRATEGY & OUTLOOK · GOVERNANCE · ANNUAL ACCOUNTS · STATEMENTS
GROUP · PARENT COMPANY

(DKK million)
3.7 PROVISIONS (CONTINUED)
Critical accounting estimates and judgementsThe Bang & Olufsen Group repairs or replaces products that do not function satisfactorily both within the warranty pe-riod and in certain situations after the warranty period. Consequently provisions are made for future repairs and returns. The provisions are made based on historical statistics of repairs and returns and based on management’s judgements. The future repairs and returns can differ from the historical pattern, but management assesses that the estimate of the provisions is reasonable and appropriate.
The Group provides 2-5 years of warranty on certain products and is therefore committed to repairing or replacing prod-ucts which do not function satisfactorily. Some products are repaired after the end of the warranty period, and a provi-sion is made regarding this potential fairness claim.
Provisions for warranty and fairness of DKK 58.8 million have been recognized as at 31 May 2015 (2013/14; DKK 51.7 million) to cover expected warranty and fairness claims. The size and timing of the provisions are based on previous ex-perience of the level and timing of repairs and returns. The principles are unchanged from the 2013/14 financial year. No reimbursements will be received from third parties to cover the provisions.
Employee Warranty anniversary Other and fairness benefits obligations Total
At 1 June 2013 70.9 8.0 18.4 97.3 Exchange rate adjustment to year-end rate (0.4) 0.1 (0.4) (0.7)Provisions in the year 26.6 0.3 2.1 28.9 Provisions used in the year (31.2) (0.9) (5.7) (37.8)Provisions reversed in the year (14.2) (4.5) (0.4) (19.2)At 31 May 2014 51.7 2.9 14.0 68.5 Exchange rate adjustment to year-end rate 3.0 - 0.8 3.8 Provisions in the year 53.4 0.8 2.5 56.7 Provisions used in the year (32.1) (0.8) (5.5) (38.4) Provisions reversed in the year (17.2) - (3.2) (20.4) At 31 May 2015 58.8 2.9 8.6 70.2 Falls due 1-5 year 34.2 2.3 8.3 44.8 Falls due after 5 years - - - - Non-current provisions 34.2 2.3 8.3 44.8 Falls due within one year 24.6 0.6 0.3 25.4 At 31 May 2015 58.8 2.9 8.6 70.2
3.8 DEFERRED INCOME
Deferred income classified as non-current liabilities constitute revenue related to the license agreement with Harman. This includes deferred revenue from the Aluminum production agreement and future license income.
SECTION 3OPERATING ASSETS AND LIABILITIES
BANG & OLUFSEN A/S ANNUAL REPORT 2014/15 · 82
KEY FIGURES · MANAGEMENT REPORT · STRATEGY & OUTLOOK · GOVERNANCE · ANNUAL ACCOUNTS · STATEMENTS
GROUP · PARENT COMPANY

SECTION 4CAPITAL STRUCTURE AND FINANCING COSTS
This section contains notes relating to the capital structure and financial items of the Bang & Olufsen Group.
4.1 MORTGAGE LOANS AND LOANS FROM BANKS
Accounting policiesFixed interest loans, such as mortgage loans or bank loans, are recognised at the date of the loan at the received pro-ceeds less transaction costs. In subsequent periods, the loans are measured at amortised cost price. This means, that the difference between the proceeds from the raising of the loan and the amount, that must be repaid, is recognised in the income statement during the term of the loan as a financial cost using the effective interest method.
The fair value is calculated as the present value of the expected future instalments and interest payments.
Other financial liabilities comprise overdraft facilities etc. and are measured at amortised cost price.
4.1.1 Mortgage loans Falls due Falls due Falls due Falls due after after 1 year, within 1 year 1-5 years 5 years total
Fixed rate loans, interest rate 4.1% 2.1 9.4 17.4 26.8 Floating rate loans, interest rate level 0.5 - 1.0 % 6.3 25.4 138.9 164.3 Book value 31 May 2015 8.4 34.8 156.3 191.1 Fixed rate loans, interest rate 4.1% 2.0 9.1 18.3 27.3 Floating rate loans, interest rate level 0.5 - 1.0 % 6.2 25.2 145.3 170.5 Book value 31 May 2014 8.2 34.3 163.5 197.8
The fair value of the Group’s mortgage loans amounts to DKK 199.9 million (2013/14; DKK 207.4 million). All loans are in DKK.
4.1.2 Loans from banks
The Group has a current draw of DKK 210.0 million (2013/14; DKK 220.0 million) on a committed facility with Nordea. This is also the fair value. As a consequence of the Automotive transaction the company was obliged in accordance with its loan covenants to redeem its bank facilities.
BANG & OLUFSEN A/S ANNUAL REPORT 2014/15 · 83
KEY FIGURES · MANAGEMENT REPORT · STRATEGY & OUTLOOK · GOVERNANCE · ANNUAL ACCOUNTS · STATEMENTS
GROUP · PARENT COMPANY

SECTION 4CAPITAL STRUCTURE AND FINANCING COSTS
(DKK million)
4.2 FINANCIAL ITEMS
Accounting policiesFinancial items include interest income and cost, realised and unrealised capital gains and losses on securities, liabilities, and transactions in foreign currency as well as charges and refunds under the instalment payment tax scheme.
2014/15 2013/14
Interest income from banks 0.8 0.2 Exchange rate gains, net 19.5 - Other financial income 4.5 5.4 Financial income 24.8 5.6
Interest costs on bank loans etc (9.6) (8.4)Interest costs on mortgage loans (7.2) (10.0)Exchange rate losses, net - (4.6)Other financial costs (14.1) (11.5)Financial costs (30.9) (34.5) All financial income and costs are related to financial assets and liabilities, which are not measured at fair value in the income statement.
4.3 FINANCIAL INSTRUMENTS
Accounting policies
Financial assets
The Group classifies its financial assets into the following categories:• financial assets at fair value through profit or loss;• loans and receivables; or• derivative instruments designated as hedges. The classification is dependent on the purpose for which the financial asset is acquired. Management determines the classification of its financial assets at the time of the initial recognition. Financial assets are recognised when the Company becomes a party to the contractual provisions of the instrument or secures other access to economic benefits. Such assets consist of cash or a contractual right to receive cash or another financial asset. Financial assets, or a portion of a financial asset, are derecognised when, and only when, the entity loses control of the contractual rights that comprise the financial asset (or a portion of the financial asset). Such control is lost if the entity realises the right to benefits specified in the contract, the rights expire, or the entity surrenders those rights.
BANG & OLUFSEN A/S ANNUAL REPORT 2014/15 · 84
KEY FIGURES · MANAGEMENT REPORT · STRATEGY & OUTLOOK · GOVERNANCE · ANNUAL ACCOUNTS · STATEMENTS
GROUP · PARENT COMPANY

(DKK million)
4.3 FINANCIAL INSTRUMENTS (CONTINUED)
Financial assets at fair value through profit or lossFinancial instruments are classified under this category if held for trading, or if designated at fair value through profit or loss at inception. A financial instrument is classified as held-for-trading if acquired or incurred principally for the purpose of selling it in the short term. Derivatives are also classified as held-for-trading unless they are designated as hedges. Financial instruments in this category are classified as current assets and liabilities. Financial assets at fair value through profit or loss are initially recognised at fair value, and transaction costs are expensed in the statement of comprehensive income. Realised and unrealised gains and losses arising from changes in the fair value of the financial instruments at fair value through profit or loss are included in the statement of comprehensive income during the period in which they arise. Financial derivative instruments on the statement of financial position are classified in this category.
Loans and receivablesLoans and receivables are non-derivative financial assets with fixed or determinable payments that are not quoted in an active market. These are included in current assets, except for maturities greater than 12 months from year-end, which are classified as non-current assets. Loans and receivables are initially recognised at fair value and subsequently meas-ured at amortised cost, less impairments, using the effective interest rate method. Loans and receivables comprise the other noncurrent financial assets, trade and other financial receivables, amounts due by Group companies, cash restrict-ed for use and cash and cash equivalents.
Financial liabilities
Financial liabilities are classified into the following categories:• financial liabilities at fair value through profit or loss; and• financial liabilities at amortised cost.
The classification is dependent on the purpose for which the financial liabilities were acquired or incurred. Management determines the classification of its financial liabilities at the time of initial recognition.
Financial liabilities are recognised when there is an obligation to transfer benefits and that obligation is a contractual liability to deliver cash or another financial asset or to exchange financial instruments with another entity on potentially unfavourable terms. Financial liabilities are derecognised when the obligation specified in the contract is discharged, cancelled or expires.
Financial liabilities at amortised costThis category of financial liabilities comprises preference shares (liability component), borrowings, trade and other fi-nancial payables and amounts due to Group companies. These financial liabilities are initially recognised at fair value plus transaction costs, and are subsequently measured at amortised cost using the effective interest rate method.
Accounting for derivative financial instruments and hedging activitiesThe Group’s criteria for a derivative instrument to be designated as a hedging instrument require that:
• the hedge transaction is expected to be highly effective in achieving offsetting changes in fair value or cash flows attributable to the hedged risk;
• the effectiveness of the hedge can be reliably measured throughout the duration of the hedge;• there is adequate documentation of the hedging relationship at the inception of the hedge; and• for cash flow hedges, the forecast that is the subject of the hedge must be highly probable.
SECTION 4CAPITAL STRUCTURE AND FINANCING COSTS
BANG & OLUFSEN A/S ANNUAL REPORT 2014/15 · 85
KEY FIGURES · MANAGEMENT REPORT · STRATEGY & OUTLOOK · GOVERNANCE · ANNUAL ACCOUNTS · STATEMENTS
GROUP · PARENT COMPANY

(DKK million)
4.3 FINANCIAL INSTRUMENTS (CONTINUED)
The Group designates certain derivatives as one of the following on the date the derivative contract is entered into:
• a hedge of the exposure to changes in fair value of a recognised asset or liability or a firm commitment (fair value hedge); or
• a hedge of the exposure to variability in cash flows that is attributable to a particular risk associated with a recognised asset or liability or a highly probable forecast transaction (cash flow hedge).
Fair value hedgesChanges in the fair value of derivatives that are designated and qualify as fair value hedges are recorded in the statement of comprehensive income as financing costs/income, along with any changes in fair value of the hedged asset or liability that is attributable to the hedged risk. If the hedge no longer meets the criteria for hedge accounting, the adjustment to the carrying amount of a hedged item for which the effective interest rate method is used is amortised in the statement of comprehensive income over the period to maturity.
Cash flow hedgesThe effective portion of changes in the fair value of derivatives that are designated and qualify as cash flow hedges are recognised in other comprehensive income. The ineffective portion is recognised immediately in the statement of com-prehensive income within financing costs. Where the forecast transaction or firm commitment results in the recognition of a non-financial asset or a non-financial liability, the gains or losses previously deferred in equity are transferred from equity and included in the initial cost or other carrying amount of the asset or liability. Otherwise, amounts deferred in equity are transferred to the statement of comprehensive income and classified as gains or losses in the same financial years during which the hedged firm commitment or forecast transaction affects the statement of comprehensive income.
When a hedging instrument expires or is sold, or when a hedge no longer meets the criteria for hedge accounting, any cumulative gain or loss existing in equity at that time remains in equity and is recognised when the forecast transaction is recognised in the statement of comprehensive income. When the forecast transaction is no longer expected to occur, the cumulative gain or loss that was reported in equity is immediately transferred to the statement of comprehensive income.
At the inception of the transaction the Group documents the relationship between hedging instruments and hedged items, as well as its risk management objective and strategy for undertaking various hedge transactions. The Group also documents its assessment, both at the hedge inception and on an ongoing basis, of whether the derivatives that are used in hedging transactions are highly effective in offsetting changes in fair values or cash flows of hedged items.
Movements on the hedging reserves in shareholders’ equity are shown under non-distributable reserves in the state-ment of changes in equity. The full fair value of a hedging derivative is classified as a non-current asset or liability when the remaining hedged item is more than 12 months and as a current asset or liability when the remaining maturity of the hedged item is less than 12 months. Trading derivatives are classified as a current asset or liability.
Certain derivative transactions, while providing effective economic hedges under the Group’s risk management policies, do not qualify for hedge accounting. Changes in the fair value of any derivative instruments that do not qualify for hedge accounting are recognised immediately in the statement of comprehensive income within financing costs.
SECTION 4CAPITAL STRUCTURE AND FINANCING COSTS
BANG & OLUFSEN A/S ANNUAL REPORT 2014/15 · 86
KEY FIGURES · MANAGEMENT REPORT · STRATEGY & OUTLOOK · GOVERNANCE · ANNUAL ACCOUNTS · STATEMENTS
GROUP · PARENT COMPANY

(DKK million)
4.3 FINANCIAL INSTRUMENTS (CONTINUED)
Fair value estimationThe fair value of publicly traded derivatives is based on quoted market prices at year-end. The fair value of interest rate swaps is calculated as the present value of estimated future cash flows. The fair value of forward exchange contracts is determined using forward exchange market rates at year-end.
Financial instruments that are measured at fair value in the statement of financial position are classified into the following levels of the fair value measurement hierarchy: • quoted prices (unadjusted) in active markets for identical assets or liabilities (level 1);• inputs other than quoted prices included within level 1 that are observable for the assets or liabilities, either directly,
as prices, or indirectly, derived from prices (level 2); and• inputs for the assets or liabilities that are not based on observable market data, unobservable inputs (level 3).
Quoted market prices or dealer quotes for the specific or similar instruments are used for non-current debt. The fair val-ues of non-current financial assets and deferred-payables for disclosure purposes are estimated by discounting the future contractual cash flows at the interest rates available to the Group at year-end. Other techniques, such as options pricing models and estimated discounted value of future cash flows, are used to determine fair value of the remaining financial instruments.
In assessing the fair value of non-traded derivatives and other financial instruments, the Group makes assumptions that are based on market conditions existing at each year-end.
The carrying values of the following financial assets and financial liabilities approximate their fair values:• trade and other financial receivables;• cash and cash equivalents;• other non-current financial receivables;• amounts due to Group companies;• amounts due by Group companies;• trade and other financial payables;• current borrowings; and• non-current borrowings.
SECTION 4CAPITAL STRUCTURE AND FINANCING COSTS
BANG & OLUFSEN A/S ANNUAL REPORT 2014/15 · 87
KEY FIGURES · MANAGEMENT REPORT · STRATEGY & OUTLOOK · GOVERNANCE · ANNUAL ACCOUNTS · STATEMENTS
GROUP · PARENT COMPANY

SECTION 4CAPITAL STRUCTURE AND FINANCING COSTS
(DKK million)
4.3 FINANCIAL INSTRUMENTS (CONTINUED)
Additional balance sheet disclosures in accordance with IFRS 7 (Financial Instruments)
Categories of financial assets and liabilities
Carrying amount of financial instruments by measurement category under IAS 39
2014/15 2013/14 Carrying Fair Carrying Fair value value value value
Other financial receivables 123.3 123.3 44.2 44.2Trade receivables 456.6 456.6 537.4 537.4Receivables from associates 0.0 0.0 1.9 1.9Other receivables 71.5 71.5 65.8 65.8Loans receivable and other receivables 651.4 651.4 649.3 649.3 Mortgage loans 199.5 199.9 206.0 207.4Loans from banks 210.0 210.0 220.0 220.0Overdraft facilities 0.0 0.0 68.5 68.5Trade payables 443.1 443.1 434.0 434.0Other liabilities 309.1 309.1 215.8 215.8Financial liabilities valued at amortised cost 1,161.7 1,162.1 1,144.3 1,145.7 Derivative financial instruments relating to hedging of forecasted future transactions included in Other receivables (4.5) (4.5) 0.0 0.0Financial liabilities held for trading (4.5) (4.5) 0.0 0.0 For financial assets and liabilities, the fair value is approximately equal to the carrying amount.
Foreign exchange contracts are measured at fair value in the balance sheet. The fair value is based on observable market data and is part of level 2 in the fair value hierarchy and in the category financial assets and liabilites used as hedging instruments. The fair value is negative DKK 4.5 million (2013/14; DKK 0.0 million).
BANG & OLUFSEN A/S ANNUAL REPORT 2014/15 · 88
KEY FIGURES · MANAGEMENT REPORT · STRATEGY & OUTLOOK · GOVERNANCE · ANNUAL ACCOUNTS · STATEMENTS
GROUP · PARENT COMPANY

SECTION 4CAPITAL STRUCTURE AND FINANCING COSTS
(DKK million)
4.3 FINANCIAL INSTRUMENTS (CONTINUED)
Foreign exchange rate riskIn 2014/15 90 per cent of the Group’s turnover was in foreign currency (2013/14; 91 per cent). Since part of the Group’s purchasing policy is to match purchasing and sales currencies to the greatest possible extent, the figure does not express the Group’s foreign exchange rate risk.
The Group has significant net in-flows in EUR, GBP and CHF, and the most significant exposure is presently related to these. The most significant exposure on the outflow is USD and CZK. The company thus only has a limited natural hedging of the currency risk.
The Group’s foreign exchange rate risks are managed centrally by the parent company’s finance department based on a foreign exchange rate policy approved by the Board of Directors, under which up to 75 per cent of the expected net cash flows in selected currencies are covered. Forward contracts are continually used for this hedging. The forward contracts are classified as hedging and fulfil the accounting requirements for hedging of future cash flow. Forward contracts are used for commercial transactions only, and hedging is made for a horizon of up to 18 months.
Besides the foreign exchange rate risk relating to current transactions, the Group’s equity is affected by foreign exchange rate risks relating to the translation of the Group’s foreign subsidiaries from local currencies to DKK.
Foreign exchange contractsAs at 31 May 2015, the Group has entered into foreign exchange forward contracts at a repurchase value of net DKK 434.3 million (2013/14; DKK 9.6 million), with a fair value of negative DKK 4.5 million (2013/14; DKK 0 million).
Foreign exchange contracts, net sale (purchase)
31 May 2015 31 May 2014 Contractual Fair Contractual Fair value value value value
USD (339.3) 1.2 (109.1) - GBP - - - - CHF 161.0 (5.5) 108.0 - CZK (66.0) (0.2) - - Other - - 10.7 - Total (244.3) (4.5) 9.6 -
BANG & OLUFSEN A/S ANNUAL REPORT 2014/15 · 89
KEY FIGURES · MANAGEMENT REPORT · STRATEGY & OUTLOOK · GOVERNANCE · ANNUAL ACCOUNTS · STATEMENTS
GROUP · PARENT COMPANY

(DKK million)
4.3 FINANCIAL INSTRUMENTS (CONTINUED)
Sensitivity analysis Effect on Group EBIT and equity based on 5% change in the selected currencies compared to average annual rates esti-mated on unhedged basis. EBIT Equity 2014/15 2013/14 2014/15 2013/14 USD (9.8) (12.7) (7.5) (9.5)GBP 8.4 7.6 6.4 5.7 CHF 8.4 8.8 6.4 6.6 Other - (0.9) 0.8 0.1 Total 7.0 2.8 6.1 2.9
Interest rate riskThe Group interest rate risk relates to interest-bearing assets and debt.
The Group interest-bearing assets mainly consist of liquid funds, which at the end of the financial year totaled DKK 1198.0 million (2013/14; DKK 120.4 million). Liquid funds yield interest in the short-term money market. The interest rate risk is deemed to be insignificant in that a change in the interest rate level of 0.5 percentage points would have impacted the Group’s earnings before tax by approx. DKK 0.6 million in 2014/15 (2013/14; DKK 0.5 million).
At the end of the financial year, the Group’s interest-bearing debt totaled DKK 409.5 million (2013/14; DKK 494.5 million) corresponding to 11.7 per cent of the balance sheet total (2013/14; 17.1 per cent).
Of the interest-bearing debt DKK 156.3 million falls due after five years (2013/14; DKK 163.5 million). Further information is provided in note 4.1.
Due to the low debt level and the fact that the borrowings are in fixed rate loans or loans with a fixed rate of minimum three years, the Group’s interest rate risks are insignificant and are not expected to significantly impact the Group’s earn-ings.
Credit riskThe Group’s balance sheet items that are subject to credit risk are primarily trade receivables and bank deposits. The amounts at which these balance sheet items are recognized correspond to the maximum credit risk.
At the end of the financial year, the Group sold its products through 714 dealers worldwide. The Group is, therefore, exposed to a risk of losses on trade receivables.
The individual dealers, including their geographical location, are subject to ongoing evaluation. When deemed necessary, the Group employs bank guarantees or debtor insurance against outstanding debts, and in some situations other forms of securities are attained, e.g. in the form of security in inventories or other assets.
In the 2014/15 financial year, DKK 36.2 million was expensed as losses on trade receivables (2013/14; DKK 2.2 million).
Liquid funds are placed with financial institutions with high credit ratings. Derivatives, including foreign exchange for-ward contracts, are entered into with such institutions only. Therefore, it is deemed that the credit risk relating to liquid funds is of no significance to Bang & Olufsen’s annual report.
SECTION 4CAPITAL STRUCTURE AND FINANCING COSTS
BANG & OLUFSEN A/S ANNUAL REPORT 2014/15 · 90
KEY FIGURES · MANAGEMENT REPORT · STRATEGY & OUTLOOK · GOVERNANCE · ANNUAL ACCOUNTS · STATEMENTS
GROUP · PARENT COMPANY

SECTION 4CAPITAL STRUCTURE AND FINANCING COSTS
Liquidity riskThe financial reserve is continually assessed and managed by the parent company’s finance department. It is ensured that there at any given time, is sufficient, flexible and unused credit facilities available provided by major, reputable finan-cial institutions. On the basis of the Group’s financial reserve arrangements, and the expectations to the Groups future cash flows, management believes that there are sufficient capital resources.
Contractual maturity analysis for financial liabilities Between Less than one and More than one year five years five years Total
2014/15 Long-term bank loans 60.3 202.3 262.6Short-term bank loans 218.4 - - 218.4Trade payables 443.1 - - 443.1Total non-derivative financial liabilities 661.5 60.3 202.3 924.1Total financial liabilities 661.5 60.3 202.3 924.1
Between Less than one and More than one year five years five years Total
2013/14 Long-term bank loans - 59.9 218.3 278.2Short-term bank loans 297.0 - - 297.0Trade payables 434.0 - - 434.0Total non-derivative financial liabilities 731.0 59.9 218.3 1,009.2Total financial liabilities 731.0 59.9 218.3 1,009.2
Specification of net interest-bearing debt
2014/15 2013/14
Cash and cash equivalents 1,198.0 120.4 Bank loans, non-current liabilities (191.1) (197.8)Bank loans, current liabilities (218.4) (297.0)Total 788.5 (374.4)
Defaults or breaches on loansNo loan agreements have been defaulted or breached in 2014/15 or 2013/14.
(DKK million)
4.3 FINANCIAL INSTRUMENTS (CONTINUED)
BANG & OLUFSEN A/S ANNUAL REPORT 2014/15 · 91
KEY FIGURES · MANAGEMENT REPORT · STRATEGY & OUTLOOK · GOVERNANCE · ANNUAL ACCOUNTS · STATEMENTS
GROUP · PARENT COMPANY

SECTION 4CAPITAL STRUCTURE AND FINANCING COSTS
(DKK million)
4.4 CAPITAL STRUCTURE
Based on the company’s result and to have sufficient funds to support the strategic initiatives, the Board of Directors proposes to the General Meeting that no dividend be paid out for the 2014/15 financial year. It is the intention of the Board of Directors to resume dividend payments as soon as the financial results justify it.
Bang & Olufsen operates in an industry with very frequent and significant changes in technology, and therefore, the Group will from time to time be faced with small or medium-sized investment opportunities within new business areas and new fields of technology. The product distribution largely takes place through partner-owned retail shops. But in certain markets it might from time to time be necessary for the Group to acquire established retail networks or open new stores. For these reasons and to ensure adequate reserves to implement the the second phase of the “Leaner, Faster, Stronger” strategy where the main focus will be on creating profitable growth, and to manage the considerable seasonal variations in the company’s income, Bang & Olufsen must maintain an adequate capital reserve.
4.5 SHARE CAPITAL
Accounting policies
DividendDividend is recognised as a liability at the time of approval by the Annual General Meeting.
Own sharesAcquisition and sales prices for own shares and dividend received on these shares are recognised directly in equity under retained earnings. Translation reserveThe translation reserve for exchange rate differences in the consolidated financial statements comprises exchange rate differences that occur when translating the foreign subsidiaries’ financial statements from their functional currency into Bang & Olufsen a/s’ presentation currency. On disposal of net investments the exchange rate differences on the individual investment are recognised in the profit and loss account. The reserve is a distributable reserve. Reserve for cash flow hedgesReserve for cash flow hedges comprises accumulated changes in fair value of derivative financial instruments, which meets the conditions for hedging of future cash flows, where the hedged position has not yet been realised.
The changes in fair value are transferred to the profit and loss account, when the hedged positions are realised.
BANG & OLUFSEN A/S ANNUAL REPORT 2014/15 · 92
KEY FIGURES · MANAGEMENT REPORT · STRATEGY & OUTLOOK · GOVERNANCE · ANNUAL ACCOUNTS · STATEMENTS
GROUP · PARENT COMPANY

SECTION 4CAPITAL STRUCTURE AND FINANCING COSTS
(DKK million)
4.5 SHARE CAPITAL (CONTINUED)
Issued shares Number Nominal value (DKK mio) 2014/15 2013/14 2014/15 2013/14
1 June 39,270,435 39,270,435 392.7 392.7 Capital increase 3,927,043 - 39.3 - 31 May 43,197,478 39,270,435 432.0 392.7
Bang & Olufsen a/s carried out a capital increase through an accelerated book-building process in June 2014 (refer to company announcements 14.02, 14.03 and 14.05 of 19 June, 20 June and 25 June respectively). The capital increase rep-resents 3,927,043 share of a nominal value of DKK 10 each and was subscribed for at a price per share of DKK 66. Bang & Olufsen received net proceeds of DKK 250 million and will use these to accelerate the execution of the Group’s growth plan.
Transaction costs of DKK 10.9 million have been recognised directly in equity in relation to the capital increase. The costs are specified in note 4.6.
The share capital consists of 43,197,478 shares with a nominal value of 10 DKK each. Each share gives one vote. No shares have special rights. There are no limitations to transferability and no voting restrictions.
2014/15 2013/14 2012/13 2011/12 2010/11
Specification of movements in the share capital:Share capital 392.7 392.7 362.4 362.4 362.4 Capital increase 39.3 - 30.3 - - Share capital 432.0 392.7 392.7 362.4 362.4
Own shares Number Nominal value (DKKm) % of share capital 2014/15 2013/14 2014/15 2013/14 2014/15 2013/14
1 June 77,369 102,021 0.8 1.0 0.2 0.3 Used in connection with employee share option programmes (54,370) (24,652) (0.5) (0.2) (0.1) (0.1)31 May 22,999 77,369 0.2 0.8 0.1 0.2
All own shares are owned by Bang & Olufsen a/s.
BANG & OLUFSEN A/S ANNUAL REPORT 2014/15 · 93
KEY FIGURES · MANAGEMENT REPORT · STRATEGY & OUTLOOK · GOVERNANCE · ANNUAL ACCOUNTS · STATEMENTS
GROUP · PARENT COMPANY
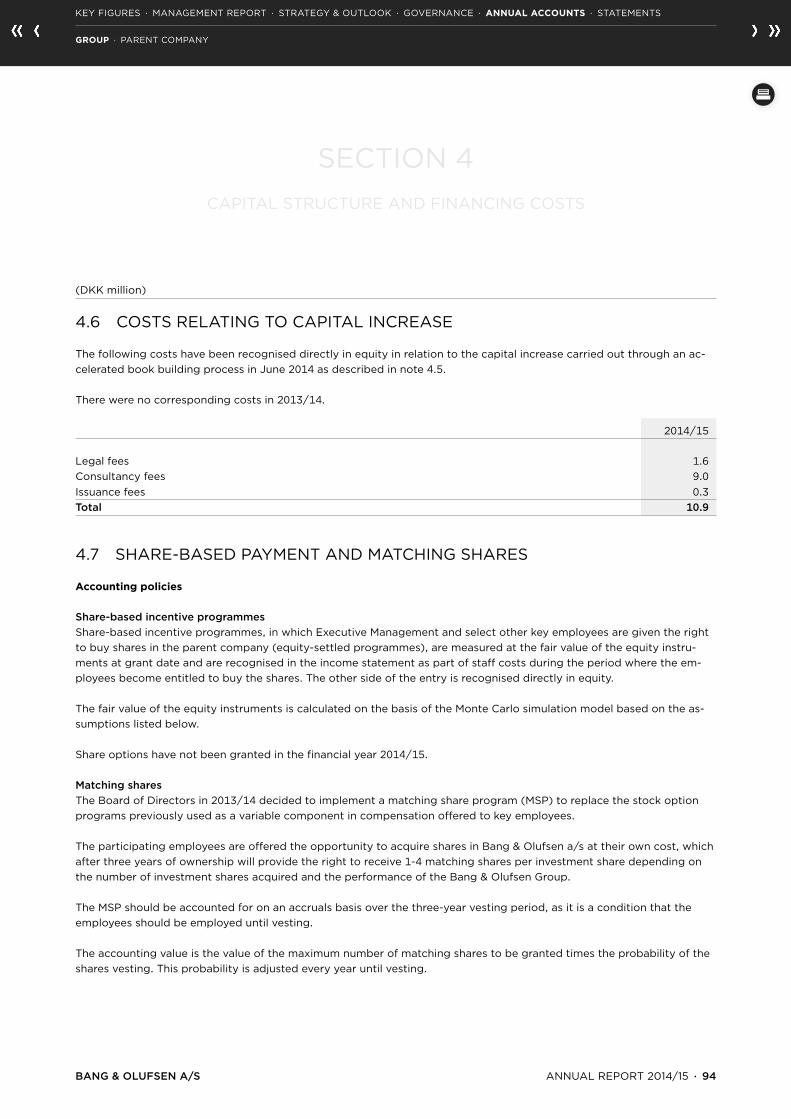
SECTION 4CAPITAL STRUCTURE AND FINANCING COSTS
(DKK million)
4.6 COSTS RELATING TO CAPITAL INCREASE
The following costs have been recognised directly in equity in relation to the capital increase carried out through an ac-celerated book building process in June 2014 as described in note 4.5.
There were no corresponding costs in 2013/14.
2014/15
Legal fees 1.6 Consultancy fees 9.0 Issuance fees 0.3 Total 10.9
4.7 SHARE-BASED PAYMENT AND MATCHING SHARES
Accounting policies
Share-based incentive programmesShare-based incentive programmes, in which Executive Management and select other key employees are given the right to buy shares in the parent company (equity-settled programmes), are measured at the fair value of the equity instru-ments at grant date and are recognised in the income statement as part of staff costs during the period where the em-ployees become entitled to buy the shares. The other side of the entry is recognised directly in equity. The fair value of the equity instruments is calculated on the basis of the Monte Carlo simulation model based on the as-sumptions listed below.
Share options have not been granted in the financial year 2014/15.
Matching sharesThe Board of Directors in 2013/14 decided to implement a matching share program (MSP) to replace the stock option programs previously used as a variable component in compensation offered to key employees.
The participating employees are offered the opportunity to acquire shares in Bang & Olufsen a/s at their own cost, which after three years of ownership will provide the right to receive 1-4 matching shares per investment share depending on the number of investment shares acquired and the performance of the Bang & Olufsen Group.
The MSP should be accounted for on an accruals basis over the three-year vesting period, as it is a condition that the employees should be employed until vesting.
The accounting value is the value of the maximum number of matching shares to be granted times the probability of the shares vesting. This probability is adjusted every year until vesting.
BANG & OLUFSEN A/S ANNUAL REPORT 2014/15 · 94
KEY FIGURES · MANAGEMENT REPORT · STRATEGY & OUTLOOK · GOVERNANCE · ANNUAL ACCOUNTS · STATEMENTS
GROUP · PARENT COMPANY

SECTION 4CAPITAL STRUCTURE AND FINANCING COSTS
(DKK million)
4.7 SHARE-BASED PAYMENT (CONTINUED)
Share-based payment The Bang & Olufsen Group’s share option programmes extend to Executive Management and a number of key employees in the Group. As at 31 May 2015, the total pool of options amount to 2,127,790 options, which can be exercised in the period 2015-2016. Vesting of the share options is dependent on the recipient of the option being employed during the vesting period. For some of the programs there are certain demands regarding development in share price and other performance measures.
The share options can only be settled with shares. To a limited extent, Bang & Olufsen a/s has purchased own shares to cover the obligation for the outstanding options. The shares are recognised directly in the equity. The holding of own shares totals 26,999 shares as at 31 May 2015 (77,639 shares as at 31 May 2014).
2014/15 2013/14 Avg. exercise Avg. exercise price per price per Number of option Number of option options (DKK) options (DKK)
Outstanding at 1 June 3,037,285 77 2,882,254 82 Granted 271,104 0 1,022,962 81 Exercised (134,411) 48 (24,652) 47 Expired (1,023,731) 78 (562,490) 121 Forfeited (22,457) 71 (280,789) 63 Outstanding 31 May 2,127,790 58 3,037,285 77
BANG & OLUFSEN A/S ANNUAL REPORT 2014/15 · 95
KEY FIGURES · MANAGEMENT REPORT · STRATEGY & OUTLOOK · GOVERNANCE · ANNUAL ACCOUNTS · STATEMENTS
GROUP · PARENT COMPANY

SECTION 4CAPITAL STRUCTURE AND FINANCING COSTS
(DKK million)
4.7 SHARE-BASED PAYMENT (CONTINUED)
Further information about the outstanding stock options:
2014/15 2013/14 Avg. exercise Remaining Avg. exercise Remaining price per term to price per term to Number of option maturity Number of option maturity options (DKK) (months) options (DKK) (months)
Outstanding programme 2008/09 - - - 119,010 103 2Outstanding programme 2009/10 58,339 58 2 72,446 58 14Outstanding programme 2010/11 172,364 47 14 244,842 47 26Outstanding programme 2010/11 - - - 416,667 77 3Outstanding programme 2010/11 416,667 86 3 416,667 86 15Outstanding programme 2011/12 - - - 535,880 67 3Outstanding programme 2012/13 261,911 81 3 275,972 81 15Outstanding programme 2013/14 665,000 60 15 665,000 60 27Outstanding programme 2013/14 282,405 55 15 290,801 55 27Matching shares 2014/15 271,104 - 29 Outstanding 31 May 2,127,790 - 3,037,285 69
The value of the share-based payment expresses the group income statement effect of allocated share options. 134,411 share options have been exercised in the year with an average exercise price of DKK 48.
The share option agreements entitle Bang & Olufsen to demand cash settlement of the share options. 84,041 share op-tions were settled with cash settlement and total payment amounted to DKK 0.9 million.
The remaining options have not been, and may never be exercised.
BANG & OLUFSEN A/S ANNUAL REPORT 2014/15 · 96
KEY FIGURES · MANAGEMENT REPORT · STRATEGY & OUTLOOK · GOVERNANCE · ANNUAL ACCOUNTS · STATEMENTS
GROUP · PARENT COMPANY

SECTION 4CAPITAL STRUCTURE AND FINANCING COSTS
(DKK million)
4.7 SHARE-BASED PAYMENT (CONTINUED)
Options granted in 2013/14 Weighted average fair value (DKK per option) 15 The expense recognition according to the Monte Carlo option pricing formula has been based on the following assumptions: Weighted average share price (DKK per option) 55 Expected volatility, first grant 40.0%Risk-free interest rate, first grant 0.41%
In 2013/14 an average dividend addition for the Bang & Olufsen a/s share of 0.00% has been used in the calculation.
The expected maturity is fixed to be the end of the vesting period.
The volatility is based on one year’s historical data and five years’ historical data respectively.
Matching shares As stated in company announcement 14.11 from 15 September 2014 the Board of Directors has implemented a matching share programme (MSP) to replace the stock option programmes previously used as a variable component in compensa-tion offered to Executive Management and selected other key employees.
The participating employees are offered the opportunity to acquire shares in Bang & Olufsen a/s at their own cost, which after three years of ownership will provide the right to receive 1-4 matching shares per investment share depending on the number of investment shares acquired and the performance of the Bang & Olufsen Group.
The fair value of Matching shares is 46 DKK per option based on the share price at the time of grant.
Staff cost recognized in the income statement in relation to share-based payments were DKK 4.6 million of which DKK 0.8 million relates to matching shares (2013/14; DKK 4.2 million).
BANG & OLUFSEN A/S ANNUAL REPORT 2014/15 · 97
KEY FIGURES · MANAGEMENT REPORT · STRATEGY & OUTLOOK · GOVERNANCE · ANNUAL ACCOUNTS · STATEMENTS
GROUP · PARENT COMPANY
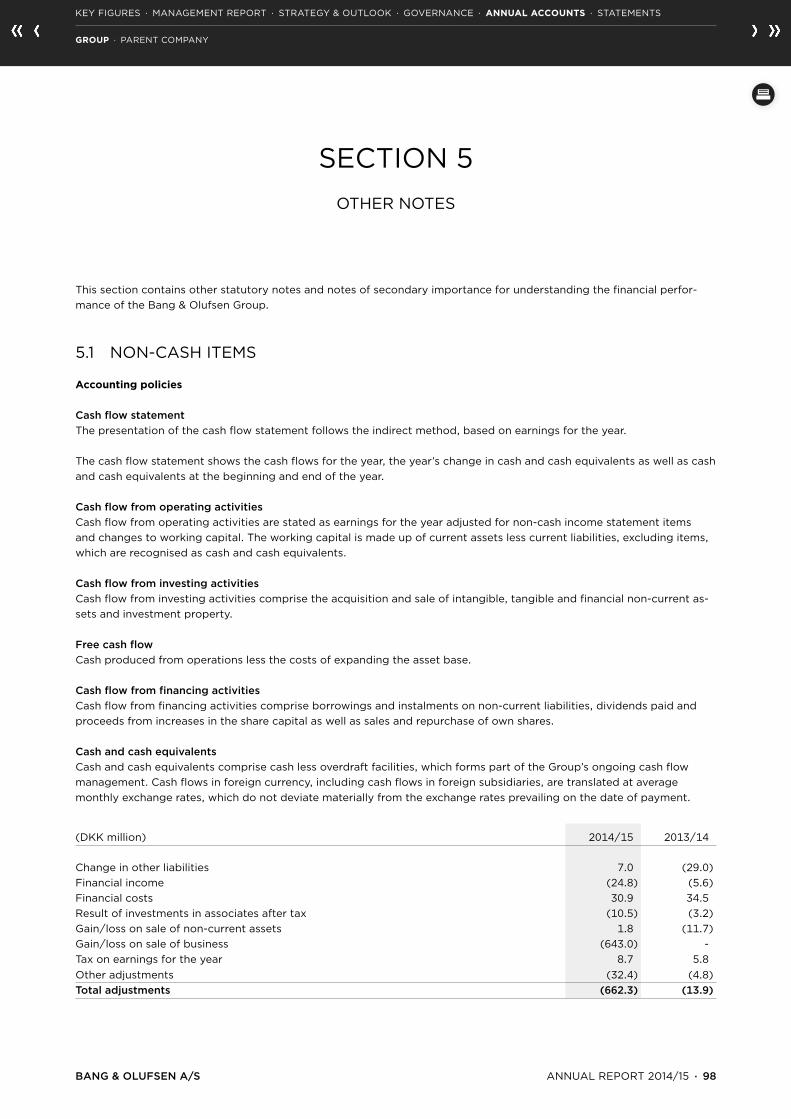
SECTION 5OTHER NOTES
This section contains other statutory notes and notes of secondary importance for understanding the financial perfor-mance of the Bang & Olufsen Group.
5.1 NON-CASH ITEMS
Accounting policies
Cash flow statementThe presentation of the cash flow statement follows the indirect method, based on earnings for the year.
The cash flow statement shows the cash flows for the year, the year’s change in cash and cash equivalents as well as cash and cash equivalents at the beginning and end of the year.
Cash flow from operating activitiesCash flow from operating activities are stated as earnings for the year adjusted for non-cash income statement items and changes to working capital. The working capital is made up of current assets less current liabilities, excluding items, which are recognised as cash and cash equivalents.
Cash flow from investing activitiesCash flow from investing activities comprise the acquisition and sale of intangible, tangible and financial non-current as-sets and investment property.
Free cash flowCash produced from operations less the costs of expanding the asset base.
Cash flow from financing activitiesCash flow from financing activities comprise borrowings and instalments on non-current liabilities, dividends paid and proceeds from increases in the share capital as well as sales and repurchase of own shares.
Cash and cash equivalentsCash and cash equivalents comprise cash less overdraft facilities, which forms part of the Group’s ongoing cash flow management. Cash flows in foreign currency, including cash flows in foreign subsidiaries, are translated at average monthly exchange rates, which do not deviate materially from the exchange rates prevailing on the date of payment.
(DKK million) 2014/15 2013/14
Change in other liabilities 7.0 (29.0)Financial income (24.8) (5.6)Financial costs 30.9 34.5 Result of investments in associates after tax (10.5) (3.2)Gain/loss on sale of non-current assets 1.8 (11.7)Gain/loss on sale of business (643.0) - Tax on earnings for the year 8.7 5.8 Other adjustments (32.4) (4.8)Total adjustments (662.3) (13.9)
BANG & OLUFSEN A/S ANNUAL REPORT 2014/15 · 98
KEY FIGURES · MANAGEMENT REPORT · STRATEGY & OUTLOOK · GOVERNANCE · ANNUAL ACCOUNTS · STATEMENTS
GROUP · PARENT COMPANY

SECTION 5OTHER NOTES
(DKK million)
5.2 DISCONTINUED OPERATIONS
Accounting policiesDiscontinued operations represent a separate major line of business disposed of or in preparation for sale. The results of discontinued operations are presented separately in the income statement and comparative figures are restated. Assets and related liabilities from discontinued operations are presented as separate items in the balance sheet.
Individual assets or groups of assets that are to be disposed of collectively are classified as assets held for sale, when the activities to carry out such a sale have been initiated and the activities are expected to be disposed of within 12 months. Liabilities of a disposal group that are directly related to assets held for sale are presented correspondingly.
Assets and liabilities from discontinued operations and assets held for sale except financial assets, etc. are measured at the lower of carrying amount and fair value less costs to sell. Non-current assets held for sale are not depreciated.
Discontinued operations includes the former business area Automotive sold at end of 2014/15 and ICEpower.
BANG & OLUFSEN A/S ANNUAL REPORT 2014/15 · 99
KEY FIGURES · MANAGEMENT REPORT · STRATEGY & OUTLOOK · GOVERNANCE · ANNUAL ACCOUNTS · STATEMENTS
GROUP · PARENT COMPANY

SECTION 5OTHER NOTES
(DKK million)
5.2 DISCONTINUED OPERATIONS (CONTINUED)
2014/15 2013/14
Revenue 647.1 714.5 Expenses (421.7) (451.4)Earnings before tax 225.4 263.1 Tax (53.0) (64.5)Earnings for the year discontinued operations 172.4 198.6 Gains/losses on sale of assets and businesses 643.0 - Tax (151.1) - Gains/losses on sale of assets and businesses after tax 491.9 -
Total earnings from discontinued operations 664.3 198.6 Earnings per share of discontinued operations 15.5 5.1Diluted earnings per share of discontinued operations 15.5 5.1 Cash flow from operating activities 283.3 273.2 Cash flow used for investing activities 1,063.2 (102.6)Cash flow from financing activities - - Net cash flow from discontinued operations 1,346.5 170.6 Balance sheet items comprise*: Development projects 34.4 252.6 Plant & machinery 0.2 44.4 Other equipment and assets under construction 1.1 2.5 Inventories 9.1 56.2 Trade receivables 18.9 87.9 Other receivables 12.0 19.5 Prepayments 1.8 28.2 Cash 0.1 0.2 Assets held for sale 77.6 491.5 Trade payables 8.4 36.2 Provisions 1.8 0.3 Corporation tax payable 3.3 6.5 Other liabilities 2.8 15.1 Liabilities associated with assets held for sale 16.3 58.1
* Balance sheet items cannot be reconciled to the consolidated balance sheet individually.
BANG & OLUFSEN A/S ANNUAL REPORT 2014/15 · 100
KEY FIGURES · MANAGEMENT REPORT · STRATEGY & OUTLOOK · GOVERNANCE · ANNUAL ACCOUNTS · STATEMENTS
GROUP · PARENT COMPANY

SECTION 5OTHER NOTES
(DKK million)
5.3 BUSINESS COMBINATIONS
Accounting policiesNewly acquired or newly established companies are recognised in the consolidated financial statements as from the date of acquisition or the date of establishment, respectively. The acquisition date is the date, where control of the company is actually obtained. Companies sold or liquidated are included in the profit and loss account until the date of sale or liqui-dation. The date of sale is the date, where control of the company is actually transferred to a third-party. When acquiring new companies, where the Group obtains a controlling influence in the acquired company, the acquisition method is ap-plied, by which the newly acquired companies’ identifiable assets, the liabilities and the contingent liabilities are meas-ured at fair value at the acquisition date.
The consideration paid for a company is the fair value of the consideration paid for the acquired company. Acquisition-related costs are recognised in profit or loss in the periods in which the costs are incurred.
Positive differences (goodwill) between, on the one hand, the consideration paid for the acquired company, the value of minority interests in the acquired company and the acquisition-date fair value of previously held equity interests, and, on the other hand, the fair value of the acquired assets, liabilities and contingent liabilities are recognised as an asset under intangible assets, and are tested for impairment at least once a year. If the carrying amount of the asset exceeds the recoverable amount, the carrying amount of the asset is reduced to the lower recoverable amount.
No business combinations took place in 2014/15
BANG & OLUFSEN A/S ANNUAL REPORT 2014/15 · 101
KEY FIGURES · MANAGEMENT REPORT · STRATEGY & OUTLOOK · GOVERNANCE · ANNUAL ACCOUNTS · STATEMENTS
GROUP · PARENT COMPANY
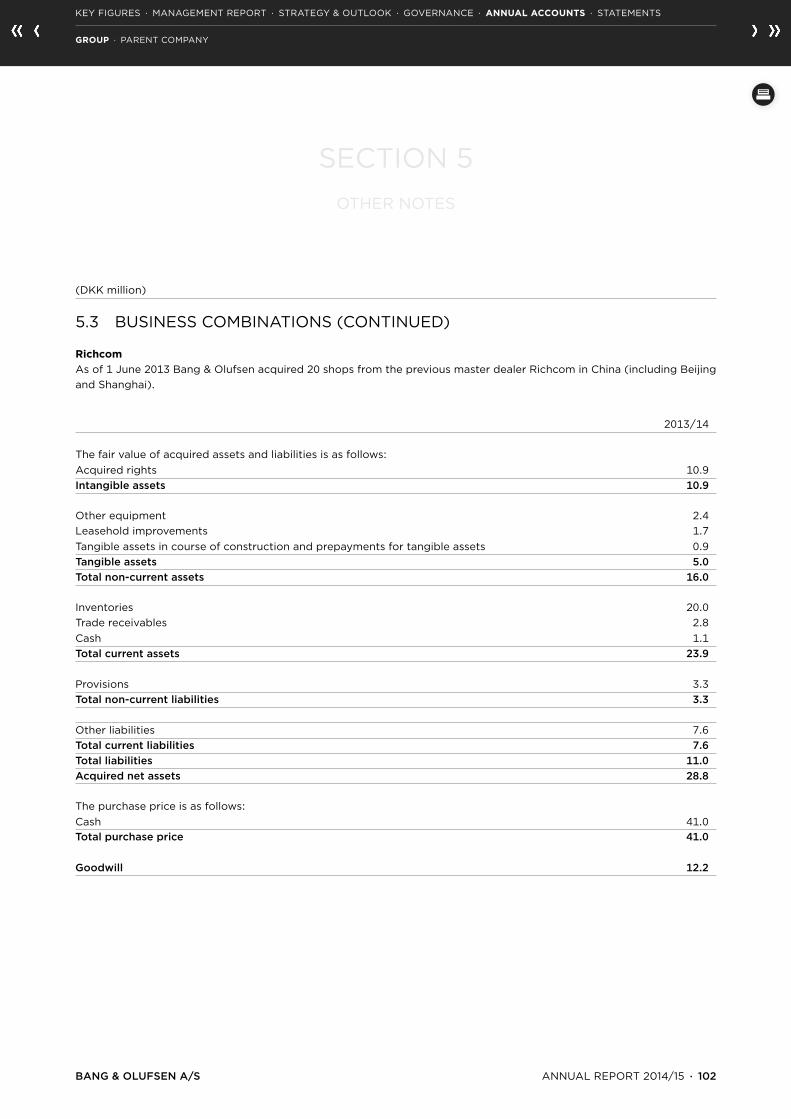
SECTION 5OTHER NOTES
(DKK million)
5.3 BUSINESS COMBINATIONS (CONTINUED)
RichcomAs of 1 June 2013 Bang & Olufsen acquired 20 shops from the previous master dealer Richcom in China (including Beijing and Shanghai).
2013/14
The fair value of acquired assets and liabilities is as follows:Acquired rights 10.9Intangible assets 10.9
Other equipment 2.4Leasehold improvements 1.7Tangible assets in course of construction and prepayments for tangible assets 0.9Tangible assets 5.0Total non-current assets 16.0
Inventories 20.0Trade receivables 2.8Cash 1.1Total current assets 23.9 Provisions 3.3Total non-current liabilities 3.3
Other liabilities 7.6Total current liabilities 7.6Total liabilities 11.0Acquired net assets 28.8 The purchase price is as follows: Cash 41.0Total purchase price 41.0 Goodwill 12.2
BANG & OLUFSEN A/S ANNUAL REPORT 2014/15 · 102
KEY FIGURES · MANAGEMENT REPORT · STRATEGY & OUTLOOK · GOVERNANCE · ANNUAL ACCOUNTS · STATEMENTS
GROUP · PARENT COMPANY

SECTION 5OTHER NOTES
(DKK million)
5.4 CONTINGENT LIABILITIES AND OTHER FINANCIAL COMMITMENTS
Accounting policiesA sale and leaseback transaction involves the sale of an asset and leaseback of the same asset. The accounting treat-ment of a sale and leaseback transaction depends upon the type of lease involved. When the lease is deemed to be an operating lease and the sale transaction is established at fair value, any gain or loss on the sales transaction is recognized in profit/loss immediately. The leaseback is recognized as other operating leases, cf. accounting policies for operating leases.
The Group has entered into a number of operating leases and rental agreements regarding plant and machinery, shops and other property. There is a big diversity in the length of the agreements. The longest agreement has a term term of 15 years.
All agreements contain conditions regarding renewal. The Group is entitled to determine, whether or not the agreements are renewed. None of the agreements impose restrictions in the Group’s rights of disposal.
2014/15 2013/14
Leasing commitments: Plant and machinery etc. 29.1 30.2 Shops 222.0 201.3 Office and factory property 191.7 180.0 Total 442.8 411.5 Maturity: Due within 1 year 111.9 111.6 Due 1 - 5 years 207.3 207.2 Due after 5 years 123.6 92.7 Total 442.8 411.5 Rental and lease payments, net for the year 148.1 126.0 Minimum rental and lease payments 148.1 126.0
No contingent rental or lease payments have been recognised in the income statement in 2014/15 or 2013/14.
In connection with the establishment of shops in previous financial years, the Group has entered into a number of long-term rental agreements. The agreements include conditions concerning the right to sublease.
The Group has not entered into any non-cancellable lease agreements as at the balance sheet date.
Guarantees Total guarantees as at 31 May 2.4 3.4
DKK 0 million (2013/14; DKK 1.3 million) relate to associates.
None of the guarantees are expected to result in any losses.
BANG & OLUFSEN A/S ANNUAL REPORT 2014/15 · 103
KEY FIGURES · MANAGEMENT REPORT · STRATEGY & OUTLOOK · GOVERNANCE · ANNUAL ACCOUNTS · STATEMENTS
GROUP · PARENT COMPANY

(DKK million)
5.4 CONTINGENT LIABILITIES AND OTHER FINANCIAL COMMITMENTS (CONTINUED)
VAT and other taxes The Danish companies in the Group are jointly registrated and are jointly and severally liable for VAT and other taxes of a total of DKK 24.1 million (2013/14; DKK 17.0 million)
Mortgages and securities Land and buildings and investment property have been mortgaged in the amount of DKK 265.1 million (2013/14; DKK 265.1 million) as security for DKK 199.5 million of the Group’s mortgage and bank debt (2013/14; DKK 206.1).
Other tangible non-current assets relating to the land and buildings and investment property are included in the mort-gages. The carrying amount of the Group’s mortgaged land and buildings and investment property is DKK 113.1 million (2013/14; DKK 147.3 million). No intangible assets, financial assets or inventories are pledged as security for liabilities.
As security for all receivables and payables with Danske Bank and Nordea a statement had been made to the effect that no shares in the subsidiaries of Bang & Olufsen a/s can be sold or pledged as security without the consent of the banks.
Lawsuits The companies in the Group are parties to a few pending lawsuits. The management assesses that the outcome of the lawsuits will not materially influence the Group’s financial position. In accordance with the exemption clause in IAS 37 ‘Provisions, Contingent Liabilities and Contingent Assets’, no further information is given regarding the lawsuits, as fur-ther information might harm the Group.
Sale of Automotive In connection with the transfer of the Automotive assets to a subsidiary of Harman International Industries, Incorporated (“Harman”), the company and certain of its subsidiaries has made customary representations and warranties to Harman. The company is not aware of any material breach of such representations and warranties.
SECTION 5OTHER NOTES
BANG & OLUFSEN A/S ANNUAL REPORT 2014/15 · 104
KEY FIGURES · MANAGEMENT REPORT · STRATEGY & OUTLOOK · GOVERNANCE · ANNUAL ACCOUNTS · STATEMENTS
GROUP · PARENT COMPANY

SECTION 5OTHER NOTES
(DKK million)
5.5 RELATED PARTIES
No related parties have a controlling influence in the Bang & Olufsen Group.
The related parties that have significant influence in the Bang & Olufsen Group, are the Board of Directors, Executive Management and other key management personnel in other companies in the Group and the close family members of these persons. Related parties also include companies in which these persons have significant interests.
The related parties in Bang & Olufsen a/s and the Bang & Olufsen Group also comprise the associate John Bjerrum Nielsen A/S, in which Bang & Olufsen a/s has significant influence.
Bang & Olufsen’s share in subsidiaries and associates is shown on page 105.
Board of Directors, Board of Management and other key management personnel Except from what follows from the employment and shareholdings, if any, there have been no transactions with the Board of Directors, Executive Management and other key management personnel. Remuneration and share option pro-grammes are shown in notes 2.2 and 4.7.
Executive Management’s terms of notice is in accordance with normal market conditions (up to 24 months).
Associated companies The transactions with the associates have included the following:
2014/15 2013/14
Purchase of raw materials (27.0) (27.7)Rental income - 2.1
The Group has a net payable with associated companies of DKK 4.7 million (2013/14; DKK 1.9 million, net receivable). The outstanding balances carry interest. Terms of payment on outstanding balances for purchase of goods are current month + 30 days. All receivables fall due within 1 year.
The fair value of the payables are DKK 4.7 million (2013/14; DKK 1.9 million, net receivable). The book value is expected to be a reasonable approximation of the fair value.
There are no securities regarding the outstanding balances. There has been no need for write-down of outstanding bal-ances, and no actual losses have been incurred in 2014/15 and 2013/14.
Other transactions No other transactions have taken place with related parties.
BANG & OLUFSEN A/S ANNUAL REPORT 2014/15 · 105
KEY FIGURES · MANAGEMENT REPORT · STRATEGY & OUTLOOK · GOVERNANCE · ANNUAL ACCOUNTS · STATEMENTS
GROUP · PARENT COMPANY

SECTION 5OTHER NOTES
(DKK million)
5.6 EVENTS AFTER THE BALANCE SHEET DATE
No significant events have occured after the balance sheet date.
5.7 APPROVAL OF THE ANNUAL REPORT FOR PUBLICATION
At the Board meeting held on 13 August 2015 the Board of Directors have approved the publication of this Annual Report.
The Annual Report will be presented for adoption at the ordinary Annual General Meeting of Bang & Olufsen a/s on Thursday 10 September 2015.
BANG & OLUFSEN A/S ANNUAL REPORT 2014/15 · 106
KEY FIGURES · MANAGEMENT REPORT · STRATEGY & OUTLOOK · GOVERNANCE · ANNUAL ACCOUNTS · STATEMENTS
GROUP · PARENT COMPANY

SECTION 5OTHER NOTES
(DKK million)
5.8 COMPANIES IN THE BANG & OLUFSEN GROUP
Share Bang & capital Olufsen Number of local Group’s undisclosed Company name Domicile Currency currency share subsidiaries
Bang & Olufsen a/s Struer, DK DKK 431,974,780 Bang & Olufsen Operations a/s Struer, DK DKK 156,000,000 100 % Scandinavia Bang & Olufsen Danmark a/s Struer, DK DKK 3,000,000 100 % Bang & Olufsen AS Oslo, N NOK 3,000,000 100 % Bang & Olufsen Svenska AB Stockholm, S SEK 4,150,000 100 % Central Europe Bang & Olufsen Deutschland G.m.b.H. München, D EUR 1,022,584 100 % Bang & Olufsen AG Bassersdorf, CH CHF 200,000 100 % Bang & Olufsen Ges. m.b.H Tulln, A EUR 1,744,148 100 % United Kingdom/Benelux Bang & Olufsen United Kingdom Ltd. Berkshire, GB GBP 2,600,000 100 % 2S.A. Bang & Olufsen Belgium N.V. Dilbeek, B EUR 942,000 100 % Bang & Olufsen b.v. Naarden, NL EUR 18,000 100 % Rest of Europe Bang & Olufsen France S.A. Levallois-Perret, F EUR 3,585,000 100 % 1Bang & Olufsen España S.A. Madrid, E EUR 1,803,036 100 % 2Bang & Olufsen Italia S.p.A. Milano, I EUR 774,000 100 % North America Bang & Olufsen America Inc. Deerfield, IL, USA USD 34,000,000 100 % 3 Asia Bang & Olufsen Asia Pte Ltd. Singapore, SG SGD 2 100 % Bang & Olufsen Hong-Kong Pty Ltd Hong Kong, HK HKD 1,000,000 100 % 1Bang & Olufsen Trading (Shanghai) Ltd Shanghai, CN RMB 67,000,000 100 % Bang & Olufsen Wholesale Pty Ltd* Armadale, AUS AUD 6,000,001 100 % 3 Middle East Bang & Olufsen Middle East FZ-LLC Dubai, UAE EUR 113,116 100 % Other Bang & Olufsen Expansion a/s Struer, DK DKK 7,000,000 100 % Bang & Olufsen s.r.o Koprivnice, CZ CZK 187,800,000 100 % B&O PLAY a/s Struer, DK DKK 7,500,000 100 % Bang & Olufsen ICEpower a/s Lyngby Taarbæk, DK DKK 1,939,750 100 % Bang & Olufsen OÜ Tallin, EE EEK 40,000 100 % Associates John Bjerrum Nielsen A/S Bramming, DK DKK 10,000,000 33 % Dormant companies have not been included
* Sold as of 27 May 2015
BANG & OLUFSEN A/S ANNUAL REPORT 2014/15 · 107
KEY FIGURES · MANAGEMENT REPORT · STRATEGY & OUTLOOK · GOVERNANCE · ANNUAL ACCOUNTS · STATEMENTS
GROUP · PARENT COMPANY

SECTION 5OTHER NOTES
(DKK million)
5.9 KEY FIGURE DEFINITIONS
Gross margin, %Gross profit/(loss) x 100/Revenue
EBITDACEarnings before interest, tax, depreciation, amortisation, impairment losses, capitalisation and result of investments in associates after tax
EBITDAEarnings before interest, tax, depreciation, amortisation, impairment losses and result of investments in associates after tax
Free cash flowSum of cash flow from operating and investing activities
EBITDA-margin, %EBITDA x 100/Revenue
EBIT-margin, %Operating profit/(loss) x 100/Revenue
NIBD/EBITDA, %Sum of mortgage loans, loans from banks, credit facilities and cash x 100/EBITDA
Return on assets, %Operating profit/(loss) x 100/Average operational assets
Return on invested capital excl. goodwill, %EBITA x 100 /Average invested capital, excl. goodwill
Return on equity, %Earnings for the year excl. minority interests x 100/Average equity excl. minority interest
Earnings per share (EPS), DKKEarnings for the year, excl. minority interests/Average number of shares in circulation
Earnings per share, diluted (EPS-D), DKKProfit/(loss) for the year, excl. minority interests/Average number of shares in circulation (diluted)
Price/earningsQuotation/Earnings per share (nom. DKK 10)
BANG & OLUFSEN A/S ANNUAL REPORT 2014/15 · 108
KEY FIGURES · MANAGEMENT REPORT · STRATEGY & OUTLOOK · GOVERNANCE · ANNUAL ACCOUNTS · STATEMENTS
GROUP · PARENT COMPANY

CONTENTS – BANG & OLUFSEN A/S
Bang & Olufsen a/s – Management report .........................................................................................................................................110
Income Statement and Statement of comprehensive income for Bang & Olufsen a/s 1 June – 31 May ............................112
Balance sheet for Bang & Olufsen a/s at 31 May ..............................................................................................................................113
Cash flow statement for Bang & Olufsen a/s 1 June – 31 May ......................................................................................................115
Statement of changes in equity for Bang & Olufsen a/s 1 June – 31 May ..................................................................................116
Notes
1 Accounting principles ..........................................................117
2 Critical accounting estimates and judgements .........118
3 Revenue.....................................................................................119
4 Staff costs ................................................................................119
5 Development costs ...............................................................120
6 Financial items ........................................................................120
7 Taxation .....................................................................................121
8 Intangible assets ....................................................................123
9 Tangible assets .......................................................................124
10 Investment property ............................................................125
11 Impairment of non-current assets.............................126
12 Investments in subsidiaries ................................................126
13 Share capital ............................................................................126
14 Mortgage loans and loans from banks ..........................127
15 Share-based payment .........................................................127
16 Non-cash items ......................................................................127
17 Financial instruments ...........................................................128
18 Discontinued operations ....................................................129
19 Contingent liabilities and other
financial commitments ........................................................130
20 Related parties .......................................................................131
21 Events after the balance sheet date ..............................132
BANG & OLUFSEN A/S ANNUAL REPORT 2014/15 · 109
KEY FIGURES · MANAGEMENT REPORT · STRATEGY & OUTLOOK · GOVERNANCE · ANNUAL ACCOUNTS · STATEMENTS
GROUP · PARENT COMPANY
PARENT COMPANY

BANG & OLUFSEN A/S – MANAGEMENT REPORT
Main activities
Bang & Olufsen a/s handles brand ownership and
group staff functions as well as the development of
Bang & Olufsen’s AV products.
Revenue
Bang & Olufsen a/s generated revenue of DKK 123.4
million which is a decrease of DKK 329 million com-
pared to the 2013/14 financial year. The revenue is gen-
erated in Denmark and the decrease compared to last
year is attributable to royalty income from the 100 per
cent owned subsidiary Bang & Olufsen Operations a/s.
The royalty income was DKK 45 million compared to
DKK 375 million last year. The calculation method used
is unchanged year-on-year, and the decrease in royalty
is therefore a result of a general decrease in earnings.
Gross margin
The gross margin in Bang & Olufsen a/s in the financial
year 2014/15 was negative 86.2 per cent compared to
positive 55.3 per cent last year. The decrease is due to
the decrease in royalty, which has no associated cost
of sales.
Capacity costs
Bang & Olufsen a/s’s capacity costs increased by DKK
121 million from DKK 422 million last year to DKK 544
million which was caused by non-recurring items of
DKK 50 million and increase in development costs.
Administrative expenses amounted to DKK 86 million
compared to DKK 80 million. Development costs rec-
ognized as an expense, incl. amortization were DKK
375 million against DKK 271 million last year.
Earnings before interest and tax for the 2014/15 finan-
cial year were negative DKK 650 million against nega-
tive DKK 173 million last year.
Earnings before tax were negative DKK 640 million
against negative DKK 187 million last year. Bang & Oluf-
sen a/s incurred financial items of net positive DKK 8
million mainly due to exchange rate gains.
Development in balance sheet items and cash flow
Free cash flow in the financial year 2014/15 was posi-
tive DKK 912 million against negative DKK 75 million in
the 2013/14 financial year. The significant improvement
is due to sale of non-current assets DKK 1,111 million
from the Automotive transaction.
At the end of the 2014/15 financial year Bang &
Olufsen’s net working capital was negative DKK 448
million compared to positive DKK 51 million at the end
of the 2013/14 financial year. The decrease compared
to last year is primarily caused by a decrease in net
amount receivables from other group companies.
Net interest-bearing deposit increased to DKK 720
million against debt DKK 373 million at the end of the
2013/14 financial year. The increase compared to last
year is caused by the Automotive transaction.
Equity increased from DKK 1,341 million to DKK 1,543
million which was due to the capital increase in June
2014.
Research and development
For information about Bang & Olufsen a/s’s research
and development activities, please refer to the sec-
tion on Innovation as described on pages 18-20 of the
Group Report.
BANG & OLUFSEN A/S ANNUAL REPORT 2014/15 · 110
KEY FIGURES · MANAGEMENT REPORT · STRATEGY & OUTLOOK · GOVERNANCE · ANNUAL ACCOUNTS · STATEMENTS
GROUP · PARENT COMPANY

CSR and Corporate Governance
For information on Bang & Olufsen a/s’s work with CSR
and Corporate Governance, please refer to pages 20-
23 and pages 37-40 respectively in the Group Report.
Expectations to the future
Bang & Olufsen a/s is an integral part of the Group’s
overall operations and the expectations to the future
are closely linked to the Outlook for the Group, as de-
scribed on pages 32 of the Group Report.
Subsequent events
No significant events have occured after the balance
sheet date.
BANG & OLUFSEN A/S ANNUAL REPORT 2014/15 · 111
KEY FIGURES · MANAGEMENT REPORT · STRATEGY & OUTLOOK · GOVERNANCE · ANNUAL ACCOUNTS · STATEMENTS
GROUP · PARENT COMPANY

INCOME STATEMENT AND STATEMENT OF COMPREHENSIVE INCOME FOR
BANG & OLUFSEN A/S 1 JUNE – 31 MAY
(DKK million) Notes 2014/15 2013/14 Revenue 3 123.4 451.9 Production costs 4 (229.8) (202.0)Gross profit (106.4) 249.9 Development costs 4, 5 (374.6) (270.6)Distribution and marketing costs 4 (83.0) (72.3)Administration costs 4 (86.0) (79.5)Operating profit (EBIT) (650.0) (172.5) Dividend from subsidiaries 1.9 2.9 Financial income 6 37.9 18.5 Financial expenses 6 (30.0) (36.0)Financial items, net 7.9 (17.5) Earnings before tax (EBT) (640.2) (187.2) Income tax 7 148.8 37.7 Earnings for the year - continued operations (491.4) (149.5)Earnings for the year - discontinued operations 18 439.6 (68.4)Earnings for the year (51.8) (218.0)
Total comprehensive income for the year (51.8) (218.0)
BANG & OLUFSEN A/S ANNUAL REPORT 2014/15 · 112
KEY FIGURES · MANAGEMENT REPORT · STRATEGY & OUTLOOK · GOVERNANCE · ANNUAL ACCOUNTS · STATEMENTS
GROUP · PARENT COMPANY

BALANCE SHEET FOR BANG & OLUFSEN A/S
AT 31 MAY
(DKK million) Notes 31/5/15 31/5/14 Goodwill 3.2 3.2 Acquired rights 7.1 13.3 Completed development projects 312.0 400.8 Development projects in progress 80.3 294.7 Intangible assets 8 402.6 711.9 Land and buildings 51.7 59.7 Plant and machinery 1.2 3.3 Other equipment 2.3 5.1 Leasehold improvements 1.0 1.2 Tangible assets in course of construction and prepayments of tangible assets 1.8 1.6 Tangible assets 9 58.0 71.0 Investment property 10 61.4 87.6 Investments in subsidiaries 12 651.6 726.1 Investments in associates - 7.7 Other financial receivables 97.1 4.7 Financial assets 748.6 738.5 Deferred tax assets 74.3 124.5 Total non-current assets 1,344.9 1,733.4 Inventories 0.1 0.3 Trade receivables 0.6 - Receivables from subsidiaries 20 480.4 1,406.5 Corporation tax receivable 0.7 0.2 Other receivables 7.1 6.2 Prepayments 9.7 10.7 Total receivables 498.5 1,423.7 Cash 1,129.9 52.6 Assets held for sale 74.5 - Total current assets 1,703.1 1,476.6 Total assets 3,048.1 3,210.1
BANG & OLUFSEN A/S ANNUAL REPORT 2014/15 · 113
KEY FIGURES · MANAGEMENT REPORT · STRATEGY & OUTLOOK · GOVERNANCE · ANNUAL ACCOUNTS · STATEMENTS
GROUP · PARENT COMPANY

BALANCE SHEET FOR BANG & OLUFSEN A/S
AT 31 MAY
(DKK million) Notes 31/5/15 31/5/14 Share capital 13 432.0 392.7 Retained earnings 13 1,111.0 948.2 Total equity 1,543.0 1,340.9 Provisions 0.4 0.8 Mortgage loans 14 191.1 197.8 Other non-current liabilities 148.7 - Total non-current liabilities 340.2 198.7 Mortgage loans 14 8.4 8.2 Loans from banks 14 210.0 220.0 Overdraft facilities - 68.5 Provisions 0.6 0.4 Trade payables 68.2 56.7 Debt to subsidiaries 18 776.3 1,255.3 Other liabilities 101.4 61.2 Total current liabilities 1,164.8 1,670.5 Total liabilities 1,505.1 1,869.1 Total equity and liabilities 3,048.1 3,210.1
BANG & OLUFSEN A/S ANNUAL REPORT 2014/15 · 114
KEY FIGURES · MANAGEMENT REPORT · STRATEGY & OUTLOOK · GOVERNANCE · ANNUAL ACCOUNTS · STATEMENTS
GROUP · PARENT COMPANY

CASH FLOW STATEMENT FOR BANG & OLUFSEN A/S
1 JUNE – 31 MAY
(DKK million) Notes 2014/15 2013/14 Earnings for the year - continued operations (491.4) (149.5)Earnings for the year - discontinued operations 439.6 (68.4)Amortisation, depreciation and impairment losses 326.4 259.5 Adjustments for non-cash items 16 (704.5) 28.2 Change in receivables 925.7 (208.3)Change in inventories 0.2 - Change in trade payables etc (427.4) 377.1 Cash flow from operations 68.6 238.5 Interest received 17.8 18.5 Interest paid (9.8) (36.0)Income tax paid (0.0) 0.1 Cash flow from operating activities 76.5 221.1 Purchase of intangible non-current assets (195.7) (299.7)Purchase of tangible non-current assets (3.2) (5.4)Purchase of investment property (0.5) (0.6)Investment in subsidiary - 0.7 Sales of investments in associates 7.7 - Sales of tangible non-current assets 1,110.8 1.7 Received reimbursements, intangible non-current assets 9.2 7.4 Change in financial receivables (92.4) - Cash flow from investing activities 835.9 (295.9) Free cash flow 912.4 (74.8) Repayment of long-term loans (6.6) (6.8)Proceeds from short-term borrowings (10.0) 70.0 Capital increase 248.3 - Sale of own shares 2.6 1.2 Settlement of share options (0.9) - Cash flow from financing activities 233.4 64.4 Change in cash and cash equivalents 1,145.8 (10.5) Cash and cash equivalents, 1 June (15.9) (5.4)Exchange rate adjustment, cash and cash equivalents - - Cash and cash equivalents, 31 May 1,129.9 (15.9) Cash and cash equivalents: Cash 1,129.9 52.6 Current overdraft facilities - (68.5)Cash and cash equivalents 31 May 1,129.9 (15.9)
BANG & OLUFSEN A/S ANNUAL REPORT 2014/15 · 115
KEY FIGURES · MANAGEMENT REPORT · STRATEGY & OUTLOOK · GOVERNANCE · ANNUAL ACCOUNTS · STATEMENTS
GROUP · PARENT COMPANY

STATEMENT OF CHANGES IN EQUITY FOR BANG & OLUFSEN A/S
1 JUNE – 31 MAY
Shareholders of the parent company Share Retained (DKK million) capital earnings Total
Equity 1 June 2014 392.7 948.2 1,340.9 Earnings for the year - (51.8) (51.8) Other comprehensive income, net of tax - - - Comprehensive income for the year - (51.8) (51.8) Capital increase 39.3 219.9 259.2 Costs relating to capital increase - (10.9) (10.9)Grant of share options - 3.8 3.8 Purchase of own shares - - - Settlement of share options - (0.9) (0.9)Sale of own shares - 2.6 2.6 Equity 31 May 2015 432.0 1,111.0 1,543.0 Equity 1 June 2013 392.7 1,160.3 1,553.0 Earnings for the year - (218.0) (218.0)Other comprehensive income, net of tax - - -Comprehensive income for the year - (218.0) (218.0) Grant of share options - 4.7 4.7 Sale of own shares - 1.2 1.2 Equity 31 May 2014 392.7 948.2 1,340.9
BANG & OLUFSEN A/S ANNUAL REPORT 2014/15 · 116
KEY FIGURES · MANAGEMENT REPORT · STRATEGY & OUTLOOK · GOVERNANCE · ANNUAL ACCOUNTS · STATEMENTS
GROUP · PARENT COMPANY

NOTES
(DKK million)
1 ACCOUNTING PRINCIPLES
The financial statements for 2014/15 for Bang & Olufsen a/s has been prepared in accordance with the International Fi-nancial Reporting Standards (IFRS) endorsed by the European Union and further Danish disclosure requirements for the presentation of financial statements for listed companies (class D entities) cf. the Statutory Order on Adoption of IFRS (the Danish announcement on Adoption of IFRS) issued in accordance with the Danish Financial Statements Act.
Accounting policies for the parent company are unchanged from the last financial and are identical to accounting policies in the Bang & Olufsen Group financial statements, except for the items below. For a description of the accounting poli-cies of the Group please refer to the consolidated financial statements under the relevant notes.
Investments in subsidiaries and associates Investments in subsidiaries and associates are measured at cost. If the cost exceeds the investment’s recoverable amount, the carrying amount is reduced to this lower amount. When selling investments in subsidiaries and associates gain or loss is calculated as the difference between the carrying amount of the sold investments and the fair value of the proceeds from the sale. Dividend from investments in subsidiaries and associates is recognised, when the final right to receive the dividend is established.
DividendThis is typically at the time of the Annual General Meeting’s approval of the distribution of dividend from the company in question. Dividend is recognised as a liability at the time of approval by the Annual General Meeting.
Investment propertyInvestment property is held to earn rental income or for capital appreciation. Investment property consist of a number of properties which are owned with the purpose of renting them to other Group companies, and the property that is partly used by the associate Bang & Olufsen Medicom a/s. Investment property is measured at cost price with deduction of ac-cumulated depreciation and impairment losses. Investment property is depreciated on a straight-line basis over 40 years.
BANG & OLUFSEN A/S ANNUAL REPORT 2014/15 · 117
KEY FIGURES · MANAGEMENT REPORT · STRATEGY & OUTLOOK · GOVERNANCE · ANNUAL ACCOUNTS · STATEMENTS
GROUP · PARENT COMPANY

(DKK million)
2 CRITICAL ACCOUNTING ESTIMATES AND JUDGEMENTS
When applying the parent company’s accounting principles it is necessary that management makes a number of ac-counting assessments and estimates as well as makes assumptions about the carrying amount of certain assets and liabilities and the recognised revenue and costs, which cannot be deduced directly from other sources. Significant judge-ments are made when assessing provisions, development projects, trade receivables, inventories and deferred tax assets.
Management bases its estimates and assumptions on historical experience and other relevant factors that are believed to be reasonable under the given circumstances. The actual outcome can differ from these estimates.
The estimates made and the underlying assumptions are reviewed on a continuous basis. Changes made to the account-ing estimates are recognised in the financial period, where the change takes place and future financial periods, if the change affects both the period, where the change takes place, and the following financial periods.
The critical accounting estimates and judgements are described under the sections to which they relate.
The following accounting estimates are assessed to be material for the parent company financial statements.
Development projectsDevelopment costs are capitalised only after technical and commercial feasibility of the projects have been established. In connection with the capitalisation of development costs, the expected useful life of the product is to be determined. Management has assessed that the amortisation period is usually 3-6 years. The development projects amount to DKK 392.3 million as at 31 May 2014 (DKK 695.4 million as at 31 May 2014).
Deferred tax assetsDeferred tax assets are recognised in the balance sheet at the value, the asset is expected to be realised at, either by set-off against deferred tax liabilities or as net tax assets to be set-off against future positive taxable income. At each bal-ance sheet date it is assessed, if it is probable that sufficient taxable income will exist in the future, so that the deferred tax asset can be utilised. The deferred tax assets amount to DKK 74.3 million as at 31 May 2015 (DKK 123.8 million as at 31 May 2014).
NOTES
BANG & OLUFSEN A/S ANNUAL REPORT 2014/15 · 118
KEY FIGURES · MANAGEMENT REPORT · STRATEGY & OUTLOOK · GOVERNANCE · ANNUAL ACCOUNTS · STATEMENTS
GROUP · PARENT COMPANY

NOTES
(DKK million) 2014/15 2013/14
3 REVENUE
Geographical split: Denmark 123.4 451.9Rest of world 0.0 0.0Total 123.4 451.9 Functional split: Sale of goods - -Sale of services - 0.1Royalty 45.0 375.0Rental income 78.4 76.8Total 123.4 451.9
4 STAFF COSTS
Wages and salaries etc. 240.7 243.9 Share-based payment 3.4 2.5 Pensions 17.3 18.6 Other social security costs 4.9 1.8 Total 266.2 266.7 Expensed as follows: Production costs 87.4 84.3 Development costs 115.1 118.5 Distribution and marketing costs 27.7 29.2 Administration costs 36.1 34.8 Total 266.2 266.7 Average number of full-time employees 472 517
The pension costs all relate to pension contributions under defined contribution plans. The parent company recognises the pension contributions, which can either be a fixed amount of a fixed percentage of the monthly salary, in the income statement as they are paid to independent pension insurance companies. Any unpaid contributions are recognised in the balance sheet as a liability. Once the contributions have been paid the Group has no further obligations and the individu-al employee carries the risk for the value of the pension insurance at retirement.
Refer to note 2.2 in the consolidated financial statements for further information about the remuneration of the Board of Directors, Executive Management and other key employees.
BANG & OLUFSEN A/S ANNUAL REPORT 2014/15 · 119
KEY FIGURES · MANAGEMENT REPORT · STRATEGY & OUTLOOK · GOVERNANCE · ANNUAL ACCOUNTS · STATEMENTS
GROUP · PARENT COMPANY
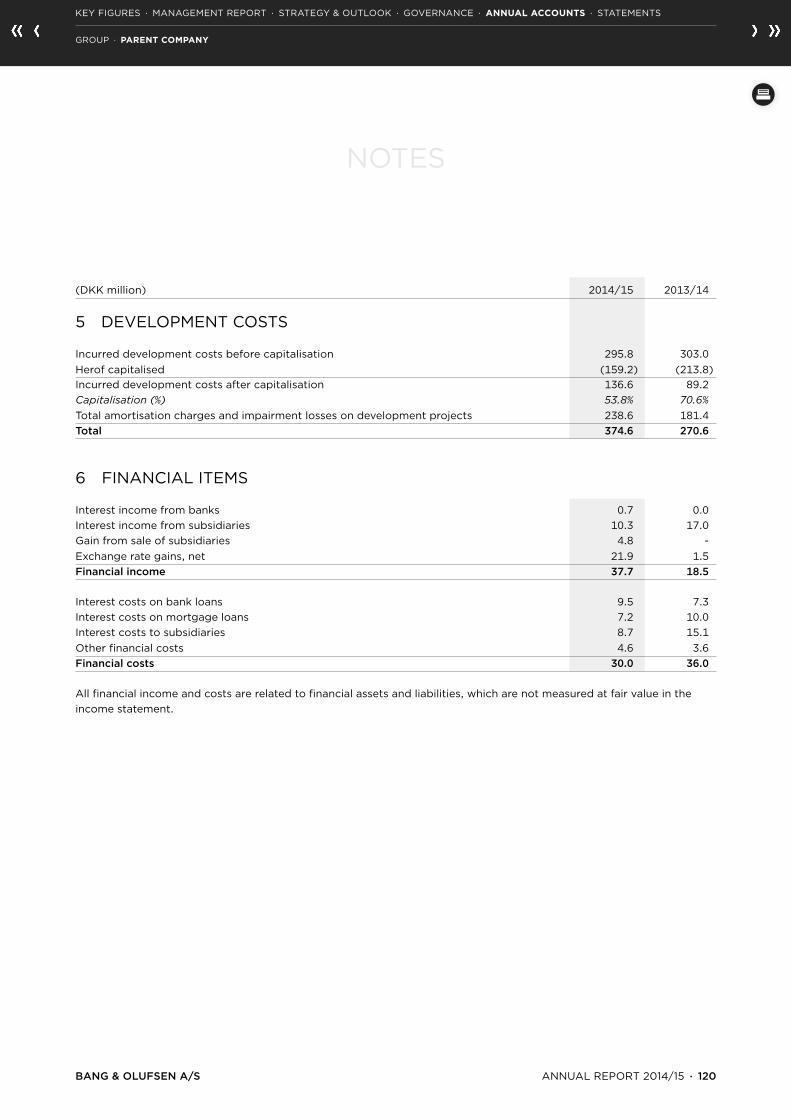
NOTES
(DKK million) 2014/15 2013/14
5 DEVELOPMENT COSTS
Incurred development costs before capitalisation 295.8 303.0 Herof capitalised (159.2) (213.8)Incurred development costs after capitalisation 136.6 89.2 Capitalisation (%) 53.8% 70.6%Total amortisation charges and impairment losses on development projects 238.6 181.4 Total 374.6 270.6
6 FINANCIAL ITEMS
Interest income from banks 0.7 0.0 Interest income from subsidiaries 10.3 17.0 Gain from sale of subsidiaries 4.8 - Exchange rate gains, net 21.9 1.5 Financial income 37.7 18.5
Interest costs on bank loans 9.5 7.3 Interest costs on mortgage loans 7.2 10.0 Interest costs to subsidiaries 8.7 15.1 Other financial costs 4.6 3.6 Financial costs 30.0 36.0
All financial income and costs are related to financial assets and liabilities, which are not measured at fair value in the income statement.
BANG & OLUFSEN A/S ANNUAL REPORT 2014/15 · 120
KEY FIGURES · MANAGEMENT REPORT · STRATEGY & OUTLOOK · GOVERNANCE · ANNUAL ACCOUNTS · STATEMENTS
GROUP · PARENT COMPANY

NOTES
(DKK million) 2014/15 2013/14
7 TAXATION
Income statement and other comprehensive income
Tax recognised in income statementCorporate tax, continuing operations 148.8 37.7 Corporate tax, discontinued operations (135.0) 22.2 13.8 59.9
Current tax charge/credit 6.0 - Adjustment to prior periods, current tax (70.0) 0.1 (64.0) 0.1 Change in deferred tax (20.6) (68.2)Adjustment of deferred tax prior years 71.7 (0.7)Adjustments from change in tax rate (0.9) 9.0 50.2 (59.9)Total taxation charge in the income statement (13.8) (59.8) Tax recognised in: Income statement (13.8) (59.8)Other comprehensive income - - (13.8) (59.8)
The taxation charge that would arise at the standard rate of DK corporation tax is reconciled to the actual tax charge as follows:
2014/15 2013/14
Tax calculated on earnings before tax 23.5% (15.3) 24.5% (68.1)Non-deductible costs and non-taxable income (1.6%) 1.1 (0.4%) 1.0 Adjustments to prior periods (2.7%) 1.7 0.2% (0.7)Changes in tax rates 1.4% (0.9) (3.2%) 9.0 Non-taxable dividends/profit from subsidiaries and associates 2.4% (1.6) 0.3% (0.9)Other (1.7%) 1.2 0.1% (0.1)Annual effective tax rate/taxation charge in income statement 21.3% (13.8) 21.5% (59.8)
Income tax paid including on-account payments for the jointly-taxed Danish companies amounts to DKK 0.1 million (2013/14; DKK 0.1 million)
BANG & OLUFSEN A/S ANNUAL REPORT 2014/15 · 121
KEY FIGURES · MANAGEMENT REPORT · STRATEGY & OUTLOOK · GOVERNANCE · ANNUAL ACCOUNTS · STATEMENTS
GROUP · PARENT COMPANY

NOTES
(DKK million)
7 TAXATION (CONTINUED)
Balance sheet
Critical accounting estimates and judgementsDeferred tax assets are recognised in the balance sheet at the value, the asset is expected to be realised at, either by set-off against deferred tax liabilities or as net tax assets to be set-off against future positive taxable income. At each bal-ance sheet date it is assessed, if it is probable that sufficient taxable income will exist in the future, so that the deferred tax asset can be utilised. The deferred tax assets amount to DKK 74.3 million as at 31 May 2015 (DKK 124.5 million as at 31 May 2014).
Non- Tax loss current carry- assets Receivables Provisions forwards Other Total
Deferred tax assetsDeferred tax assets 1 June 2013 8.3 - 0.9 120.1 (0.2) 129.1 Adjustment to Joint taxation 33.6 - - (98.0) - (64.4)Changes in tax rates (3.8) - (0.1) (5.1) - (9.0)Recognised in the income statement (8.6) - 77.2 0.2 68.8 Deferred tax assets 31 May 2014 29.5 - 0.8 94.2 - 124.5 Adjustment to Joint taxation 4.0 - - (75.7) - (71.7)Changes in tax rates 1.9 (2.6) 1.6 - 0.9 Recognised in the income statement (22.1) - 9.7 0.4 32.6 20.6 Deferred tax assets 31 May 2015 13.3 - 7.9 20.5 32.6 74.3
In 2014/15 a deferred tax assets of DKK 20.5 million has been recognised in the jointly-taxed Danish companies based on tax loss carry-forwards, which can be indefinitely carried forward (2013/14; DKK 94.2 million). This deferred tax asset has been recognised on the basis of management’s expectations of the parent company’s and the Danish subsidiaries earnings up to 5 years.
BANG & OLUFSEN A/S ANNUAL REPORT 2014/15 · 122
KEY FIGURES · MANAGEMENT REPORT · STRATEGY & OUTLOOK · GOVERNANCE · ANNUAL ACCOUNTS · STATEMENTS
GROUP · PARENT COMPANY

NOTES
(DKK million)
8 INTANGIBLE ASSETS
Critical accounting estimates and judgementsDevelopment costs are capitalised only after technical and commercial feasibility of the projects have been established. In connection with the capitalisation of development costs, the expected useful life of the product is to be determined. Management has assessed that the amortisation period is usually 3-6 years. The development projects amount to DKK 392.3 million as at 31 May 2015 (DKK 695.5 million as at 31 May 2014).
Completed Development Acquired development projects in Goodwill rights projects progress Total
Cost At 1 June 2013 3.2 155.5 1,283.8 159.3 1,601.8 Additions in the year - 2.9 72.7 224.1 299.7 Reimbursements received - - - (7.4) (7.4)Disposals in the year - (3.5) (374.3) - (377.8)Completed development projects - 81.3 (81.3) - At 31 May 2014 3.2 154.9 1,063.5 294.7 1,516.3 Additions in the year - 0.5 80.2 115.0 195.7 Reimbursements received - - - (9.2) (9.2)Disposals in the year - - (162.7) - (162.7)Disposals in the year from sale of businesses - (3.1) (302.3) (104.9) (410.3)Completed development projects - - 215.3 (215.3) - At 31 May 2015 3.2 152.3 894.0 80.3 1,129.8
Amortisation and impairment At 1 June 2013 - (135.6) (801.2) - (936.8)Amortisation during the year - (6.8) (235.8) - (242.6)Reversed amortisation on disposals - 0.8 374.3 - 375.1 At 31 May 2014 - (141.6) (662.7) - (804.3)Amortisation during the year - (6.1) (250.6) - (256.7)Reversed amortisation on disposals - - 162.7 - - Reversed amortisation on disposals from sale of businesses - 2.5 199.3 - Impairment losses during the year - - (30.7) - (30.7)At 31 May 2015 - (145.2) (582.0) - (727.2)
Net book value At 31 May 2015 3.2 7.1 312.0 80.3 402.6 At 31 May 2014 3.2 13.3 400.8 294.7 712.0
2014/15 2013/14
Amortisation and impairment lossesProduction costs 3.4 3.2 Development costs 238.6 185.0Adminstration costs etc. - -Total 241.4 188.2
Impairment losses of DKK 30.7 million have been recognised in 2014/15 related to development projects for terminated products (2013/14 DKK 0 million).
BANG & OLUFSEN A/S ANNUAL REPORT 2014/15 · 123
KEY FIGURES · MANAGEMENT REPORT · STRATEGY & OUTLOOK · GOVERNANCE · ANNUAL ACCOUNTS · STATEMENTS
GROUP · PARENT COMPANY

NOTES
(DKK million)
9 TANGIBLE ASSETS
Tangible Leasehold assets in Land and Plant and Other improve- course of buildings machinery equipment ments construction Total
CostAt 1 June 2013 181.7 25.3 129.9 2.4 0.9 340.2 Additions in the year 2.3 0.8 0.9 0.2 1.2 5.4 Completed assets 0.5 (0.5) - Disposals in the year (2.6) (1.3) (3.9)At 31 May 2014 181.9 26.1 129.5 2.6 1.6 341.7 Additions in the year 0.9 0.1 0.8 0.1 1.3 3.2 Completed assets 0.2 0.3 (0.7) (0.2)Disposals in the year (2.0) (0.3) (2.3)Disposals in the year from sale of Business (3.8) (4.6) (0.1) (8.5)At 31 May 2015 183.0 22.4 124.0 2.7 1.8 333.9 Amortisation and impairment At 1 June 2013 (117.4) (21.0) (122.6) (1.1) - (262.1)Depreciation during the year (5.1) (1.8) (3.1) (0.3) - (10.3)Reversed depreciation on disposals 0.3 1.3 - 1.6 At 31 May 2014 (122.2) (22.8) (124.4) (1.4) - (270.8)Depreciation during the year (5.0) (1.0) (2.1) (0.3) - (8.4)Reversed depreciation on disposals 1.6 - 1.6 Impairment losses during the year (4.1) - (0.3) - - (4.4)Reversed amortisation on disposals from sale of Business 2.6 3.5 6.1 At 31 May 2015 (131.3) (21.2) (121.7) (1.7) - (275.9) Net book value At 31 May 2015 51.7 1.2 2.3 1.0 1.8 58.0 At 31 May 2014 59.7 3.3 5.1 1.2 1.6 70.9
There are no contratual obligations regarding purchase of tangible assets.
2014/15 2013/14
Depreciation and impairment lossesProduction costs 4.2 3.4Development costs 8.6 6.9Administration costs etc. 0.0 0.0Total 12.8 10.3
BANG & OLUFSEN A/S ANNUAL REPORT 2014/15 · 124
KEY FIGURES · MANAGEMENT REPORT · STRATEGY & OUTLOOK · GOVERNANCE · ANNUAL ACCOUNTS · STATEMENTS
GROUP · PARENT COMPANY

NOTES
(DKK million)
10 INVESTMENT PROPERTY
CostAt 1 June 2013 269.1 Additions 0.6 Disposals - At 31 May 2014 269.7 Additions 0.5 Completed assets 0.2 At 31 May 2015 270.4 Depreciation and impairment At 1 June 2013 (175.5)Depreciation during the year (6.6)At 31 May 2014 (182.1)Depreciation during the year (6.5)Impairment losses during the year (20.4)At 31 May 2015 (209.0) Net book value At 31 May 2015 61.4 At 31 May 2014 87.6
Investment property consist of a number of properties which are owned with the purpose of renting them to other Group companies, and the property that is partly used by the associate Bang & Olufsen Medicom a/s.
All investment property is located in Struer and is used for production, warehousing and offices. Due to the location of the investment property it is not possible to estimate the fair value of the properties, since the fair value is completely dependent on the Group companies’ continued use of the properties. Furthermore it is not possible to establish a range of estimates within which the fair value of the investment properties are most likely to be. Independent valuers have not been used.
There are no contractual obligations to purchase, construct or develop investment property, nor are there any contrac-tual obligations regarding repairs, maintenance or enhancements of the investment property.
Rental income of DKK 48.7 million has been received from the investment property in 2014/15 (2013/14; DKK 53.5 mil-lion), and directly attributed operating expenses were DKK 23.7 million (2013/14; DKK 29.1 million).
Investment properties are let to the subsidiaries on operating leases with a lease term of 3-46 months. According to the existing operating leases rental income of DKK 10.9 million will be received in the 3 months which are included in the lease term of the operating leases.
BANG & OLUFSEN A/S ANNUAL REPORT 2014/15 · 125
KEY FIGURES · MANAGEMENT REPORT · STRATEGY & OUTLOOK · GOVERNANCE · ANNUAL ACCOUNTS · STATEMENTS
GROUP · PARENT COMPANY
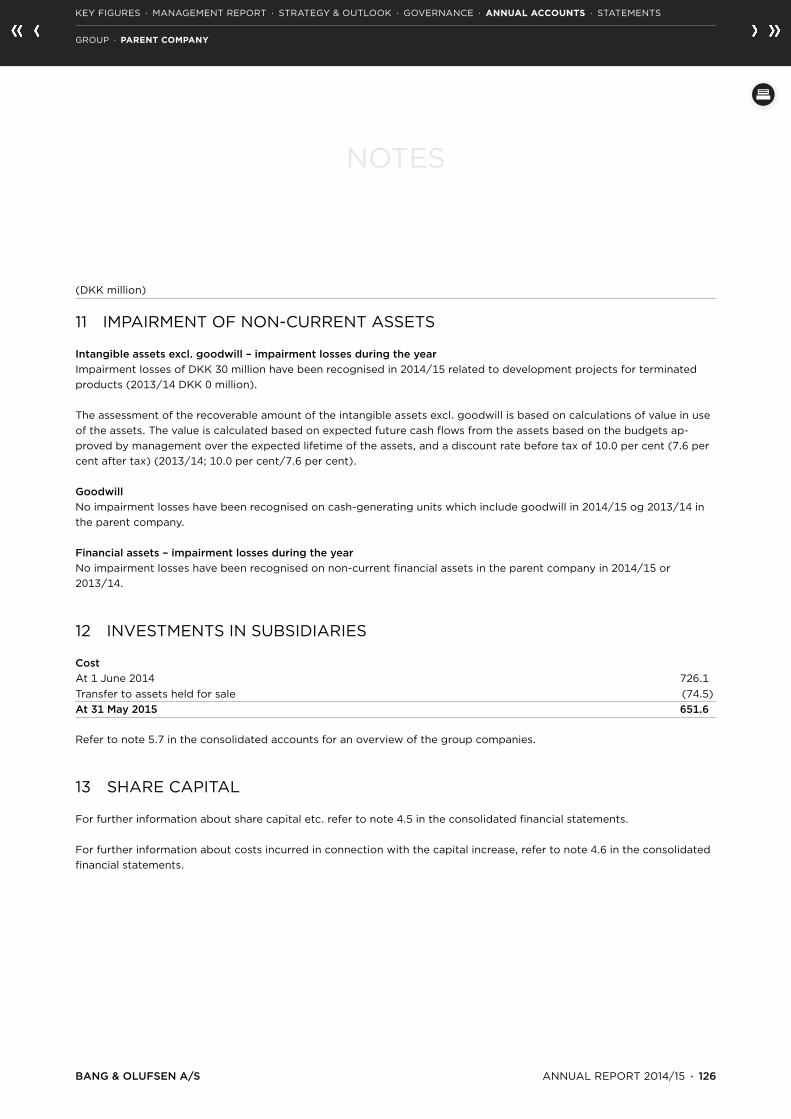
NOTES
(DKK million)
11 IMPAIRMENT OF NON-CURRENT ASSETS
Intangible assets excl. goodwill – impairment losses during the yearImpairment losses of DKK 30 million have been recognised in 2014/15 related to development projects for terminated products (2013/14 DKK 0 million).
The assessment of the recoverable amount of the intangible assets excl. goodwill is based on calculations of value in use of the assets. The value is calculated based on expected future cash flows from the assets based on the budgets ap-proved by management over the expected lifetime of the assets, and a discount rate before tax of 10.0 per cent (7.6 per cent after tax) (2013/14; 10.0 per cent/7.6 per cent).
GoodwillNo impairment losses have been recognised on cash-generating units which include goodwill in 2014/15 og 2013/14 in the parent company.
Financial assets – impairment losses during the yearNo impairment losses have been recognised on non-current financial assets in the parent company in 2014/15 or 2013/14.
12 INVESTMENTS IN SUBSIDIARIES
CostAt 1 June 2014 726.1 Transfer to assets held for sale (74.5)At 31 May 2015 651.6
Refer to note 5.7 in the consolidated accounts for an overview of the group companies.
13 SHARE CAPITAL
For further information about share capital etc. refer to note 4.5 in the consolidated financial statements.
For further information about costs incurred in connection with the capital increase, refer to note 4.6 in the consolidated financial statements.
BANG & OLUFSEN A/S ANNUAL REPORT 2014/15 · 126
KEY FIGURES · MANAGEMENT REPORT · STRATEGY & OUTLOOK · GOVERNANCE · ANNUAL ACCOUNTS · STATEMENTS
GROUP · PARENT COMPANY

(DKK million)
14 MORTGAGE LOANS AND LOANS FROM BANKS
Mortgage loans Falls due Falls due Falls due Falls due after after 1 year, within 1 year 1-5 years 5 years total
Fixed rate loans, interest rate 4.1% 2.1 9.4 17.4 26.8 Floating rate loans, interest rate level 2.0 - 3.0 % 6.3 25.4 138.9 164.3 Book value 31 May 2015 8.4 34.8 156.3 191.1 Fixed rate loans, interest rate 4.1 % 2.0 9.0 18.3 27.3 Floating rate loans, interest rate level 2.0 - 3.0 % 6.2 25.2 145.3 170.5 Book value 31 May 2014 8.2 34.2 163.6 197.8 The fair value of the parent company’s mortgage loans amounts to DKK 199.9 million (2013/14; DKK 207.4 million). All loans are in DKK. The fair value is calculated as the present value of the expected future instalments and interest pay-ments.
Loans from banks The parent company has current draw of DKK 210.0 million (2013/14; DKK 220.0 million) on the committed facility with Nordea. This is also the fair value. This is an ongoing line of credit.
15 SHARE-BASED PAYMENT
The share option programmes described in note 4.7 to the consolidated financial statements are issued by Bang & Olufsen a/s. The value of the share options granted to employees in the parent company’s subsidiaries is recognised in investments in subsidiaries. DKK 0.6 million of the total expense of DKK 4.0 million relates to subsidiaries (2013/14; DKK 1.4 million of DKK 4.8 million).
16 NON-CASH ITEMS
2014/15 2013/14
Financial income (37.7) (18.5) Financial costs 29.8 36.0 Gain/loss on sale of non-current assets (650.6) 3.3 Tax on earnings for the year (13.8) (59.9)Other adjustments (32.2) 67.2 Total adjustments (704.5) 28.2
NOTES
BANG & OLUFSEN A/S ANNUAL REPORT 2014/15 · 127
KEY FIGURES · MANAGEMENT REPORT · STRATEGY & OUTLOOK · GOVERNANCE · ANNUAL ACCOUNTS · STATEMENTS
GROUP · PARENT COMPANY

NOTES
(DKK million)
17 FINANCIAL INSTRUMENTS
Additional balance sheet disclosures in accordance with IFRS 7 (Financial Instruments):
Carrying amount of financial instruments by measurement category under IAS 39
2014/15 2013/14 Carrying Fair Carrying Fair value value value value
Other financial receivables 97.1 97.1 4.7 4.7Receivables from subsidiaries 480.4 480.4 1,406.5 1,406.5Other receivables 7.1 7.1 6.2 6.2Loans receivable and other receivables 584.6 584.6 1,417.4 1,417.4 Mortgage loans 199.5 199.9 206.1 207.4Loans from banks 210.0 210.0 220.0 220.0Overdraft facilities 0.0 0.0 68.5 68.5Payables to subsidiaries 776.3 776.3 1,255.3 1,255.3Trade payables 68.2 68.2 56.7 56.7Other payables 101.4 101.4 61.2 61.2Financial liabilities valued at amortized cost 1,355.4 1,355.8 1,867.9 1,869.2
No receivables in the parent company are overdue at 31 May 2015 (2013/14; DKK 0 million).
Refer to Note 4.3 Financial instruments in the consolidated financial statements for a description of the Group’s manage-ment of financial risks.
Defaults or breaches on loans No loan agreements have been defaulted or breached in 2014/15 or 2013/14.
BANG & OLUFSEN A/S ANNUAL REPORT 2014/15 · 128
KEY FIGURES · MANAGEMENT REPORT · STRATEGY & OUTLOOK · GOVERNANCE · ANNUAL ACCOUNTS · STATEMENTS
GROUP · PARENT COMPANY

NOTES
(DKK million)
18 DISCONTINUED OPERATIONS
Accounting policiesDiscontinued operations represent a separate major line of business disposed of or in preparation for sale. The results of discontinued operations are presented separately in the income statement and comparative figures are restated. Assets and related liabilities from discontinued operations are presented as separate items in the balance sheet, and the cash flows from discontinued operations are presented separately in the cash flow statement.
Individual assets or groups of assets that are to be disposed of collectively are classified as assets held for sale, when the activities to carry out such a sale have been initiated and the activities are expected to be disposed of within 12 months. Liabilities of a disposal group that are directly related to assets held for sale are presented correspondingly.
Assets and liabilities from discontinued operations and assets held for sale except financial assets, etc. are measured at the lower of carrying amount and fair value less costs to sell. Non-current assets held for sale are not depreciated.
Discontinued business in Bang & Olufsen A/S mainly constitute expenses related to administration and development cost related to the former business area Automotive and ICEpower. And the gain from the sale of Automotive business area.
2014/15 2013/14
Revenue - - Expenses (76.0) (90.6)Earnings before tax (76.0) (90.6)Tax 17.9 22.2 Earnings for the year discontinued operations (58.1) (68.4) Gains/losses on sale of assets and businesses 650.6 - Tax (152.9) - Gains/losses on sale of assets and businesses after tax 497.7 - Cash flow from operating activities (41.1) (27.2)Cash flow used for investing activities 1,064.9 (83.0)Cash flow from financing activities - - Net cash flow from discontinued operations 1,023.8 (110.2) Balance sheet items comprise: Development projects - 224.4Investments in subsidiaries 74.5 74.5 Other receivables - 1.0Assets held for sale 74.5 299.9
Other liabilities - 0.8Liabilities associated with assets held for sale - 0.8
BANG & OLUFSEN A/S ANNUAL REPORT 2014/15 · 129
KEY FIGURES · MANAGEMENT REPORT · STRATEGY & OUTLOOK · GOVERNANCE · ANNUAL ACCOUNTS · STATEMENTS
GROUP · PARENT COMPANY

NOTES
(DKK million)
19 CONTINGENT LIABILITIES AND OTHER FINANCIAL COMMITMENTS
Rental and leasing commitments for operating leases The parent company has entered into a number of operating leases and rental agreements regarding plant and machin-ery, shops and other property. There is a big diversity in the length of the agreements. The longest agreement has a term of 10 years. All agreements contain conditions regarding renewal. The parent company is entitled to determine, whether or not the agreements are renewed. None of the agreements impose restrictions in the parent company’s right of dis-posal.
2014/15 2013/14
Leasing commitments: Plant and machinery etc. 32.6 42.9 Office and factory property 11.2 18.3 Total 43.8 61.1 Maturity: Due within 1 year 18.1 20.0 Due 1 - 5 years 25.7 41.2 Due after 5 years - - Total 43.8 61.1 Rental and lease payments, net for the year 33.1 32.6 Minimum rental and lease payments 33.1 32.6
No contingent rental or lease payments have been recognised in the income statement in 2014/15 or 2013/14.
Guarantees Total guarantees as at 31 May - 1.3
None of the guarantees are expected to result in any losses.
VAT and other taxes Refer to note 5.3 in the consolidated financial statements.
Mortgages and securities Mortgages and securities are identical in the parent company and in the Group. For further details refer to note 5.3 in the consolidated financial statements.
BANG & OLUFSEN A/S ANNUAL REPORT 2014/15 · 130
KEY FIGURES · MANAGEMENT REPORT · STRATEGY & OUTLOOK · GOVERNANCE · ANNUAL ACCOUNTS · STATEMENTS
GROUP · PARENT COMPANY

NOTES
(DKK million)
20 RELATED PARTIES
No related parties have a controlling influence in Bang & Olufsen a/s.
The related parties that have significant influence in the Bang & Olufsen Group, are the Board of Directors, Executive Management and other key management personnel in other companies in the Group and the close family members of these persons. Related parties also include companies in which these persons have significant interests.
The related parties in Bang & Olufsen a/s also comprise the subsidiaries in which the company has a controlling interest, and the associates Bang & Olufsen Medicom a/s and John Bjerrum Nielsen A/S, in which Bang & Olufsen a/s has signifi-cant influence.
Bang & Olufsen’s share in subsidiaries and associates is shown in note 5.7 to the consolidated financial statements.
Board of Directors, Executive Management and other key management personnel Except from what follows from the employment and shareholdings, if any, there have been no transactions with the Board of Directors, Executive Management and other key management personnel. Remuneration and share option pro-grammes are shown in notes 2.2 and 4.7 in the consolidated financial statements. Executive Management’s terms of notice is in accordance with normal market conditions (up to 24 months).
Associates and subsidiaries Transactions with subsidiaries and associates have included the following:
2014/15 2013/14
Purchase of services - subsidiaries 55.6 92.2 Sale of services - subsidiaries - - Rental income - subsidiaries 78.4 (1.9)Royalty income - subsidiaries 115.0 375.0 Purchase of services - associated companies - - Rental income - associated companies - 1.9
BANG & OLUFSEN A/S ANNUAL REPORT 2014/15 · 131
KEY FIGURES · MANAGEMENT REPORT · STRATEGY & OUTLOOK · GOVERNANCE · ANNUAL ACCOUNTS · STATEMENTS
GROUP · PARENT COMPANY

NOTES
(DKK million)
20 RELATED PARTIES (CONTINUED)
The parent company has a net payable to subsidiaries of DKK 295.9 million at 31 May (2013/14; net receivable DKK 151.2 million).All receivables and payables with subsidiaries fall due within 1 year.
The fair value of the intercompany receivables and payables are DKK 480.4 million and DKK 776.3 million respectively (2013/14; DKK 1,406.5 million and DKK 1,235.3 million). The book value is expected to be a reasonable approximation of the fair value.
There has been no need for write-down of receivables from subsidiaries and no actual losses have been incurred in 2014/15 and 2013/14.
Other transactions Bang & Olufsen a/s has received DKK 1.9 million in dividend from its subsidiaries (2013/14; DKK 2.9 million). No dividend has been received from its associates in 2014/15 or 2013/14.
Bang & Olufsen a/s has issued guarantees for the related parties, cf. note 18. None of the guarantees are expected to result in any losses.
No other transactions have taken place with related parties.
21 EVENTS AFTER THE BALANCE SHEET DATE
No events have occured after the balance sheet date.
BANG & OLUFSEN A/S ANNUAL REPORT 2014/15 · 132
KEY FIGURES · MANAGEMENT REPORT · STRATEGY & OUTLOOK · GOVERNANCE · ANNUAL ACCOUNTS · STATEMENTS
GROUP · PARENT COMPANY

STATEMENTS
BANG & OLUFSEN A/S ANNUAL REPORT 2014/15 · 133
MANAGEMENT’S STATEMENT · INDEPENDENT AUDITOR’S REPORT
KEY FIGURES · MANAGEMENT REPORT · STRATEGY & OUTLOOK · GOVERNANCE · ANNUAL ACCOUNTS · STATEMENTSSTATEMENTS

MANAGEMENT’S STATEMENT
The Board of Directors and Executive Management
have today considered and approved the annual report
of Bang & Olufsen A/S for the financial year 1 June
2014 – 31 May 2015.
The annual report is prepared in accordance with Inter-
national Financial Reporting Standards as adopted by
the EU and Danish disclosure requirements for listed
companies.
In our opinion, the consolidated financial statements
and the parent company financial statements give a
true and fair view of the Group’s and the parent com-
pany’s financial position at 31 May 2015 as well as of
their financial performance and their cash flow for the
financial year 1 June 2014 – 31 May 2015.
We believe that the management commentary contains
a true and fair review of the development and perfor-
mance of the Group’s and the parent company’s busi-
ness activities and financial situation, the earnings for
the year and the financial position of the parent com-
pany and the financial position as a whole of the entities
included in the consolidated financial statements, to-
gether with a description of the principal risks and un-
certainties that the Group and the parent company face.
We recommend the annual report for adoption at the
Annual General Meeting.
Struer, 13 August 2015
Executive Management:
Tue Mantoni Anders Aakær Jensen Stefan Persson
President & CEO Executive Vice President & CFO Executive Vice President & COO
Board of Directors:
Ole Andersen Jim Hagemann Snabe
Chairman Deputy Chairman
Jesper Jarlbæk Majken Schultz
Albert Bensoussan Mads Nipper
Knud Olesen Jesper Olesen
Per Østergaard Frederiksen
BANG & OLUFSEN A/S ANNUAL REPORT 2014/15 · 134
KEY FIGURES · MANAGEMENT REPORT · STRATEGY & OUTLOOK · GOVERNANCE · ANNUAL ACCOUNTS · STATEMENTSMANAGEMENT STATEMENT
MANAGEMENT’S STATEMENT · INDEPENDENT AUDITOR’S REPORT

INDEPENDENT AUDITOR’S REPORT
To the shareholders of Bang & Olufsen a/s
Independent auditors’ report on the consolidated financial statements and the parent company financial statementsWe have audited the consolidated financial statements and the parent company financial statements of Bang & Olufsen a/s for the financial year 1 June 2014 – 31 May 2015, which comprise income statement, statement of comprehensive income, balance sheet, statement of changes in equity, cash flow statement and notes, including a summary of signifi-cant accounting policies, for the Group as well as for the parent company. The consolidated financial statements and the parent company financial statements are prepared in accordance with International Financial Reporting Stand-ards as adopted by the EU and Danish disclosure require-ments for listed companies.
Management’s responsibility for the consolidated financial statements and the parent company financial statementsManagement is responsible for the preparation of consoli-dated financial statements and parent company financial statements that give a true and fair view in accordance with International Financial Reporting Standards as adopted by the EU and Danish disclosure requirements for listed companies and for such internal control that Management determines is necessary to enable the preparation of con-solidated financial statements and parent company finan-cial statements that are free from material misstatement, whether due to fraud or error.
Auditors’ responsibilityOur responsibility is to express an opinion on the consoli-dated financial statements and the parent company finan-cial statements based on our audit. We conducted our audit in accordance with International Standards on Auditing and additional requirements under Danish audit regulation. This requires that we comply with ethical requirements and plan and perform the audit to obtain reasonable assurance as to whether the consolidated financial statements and the parent company financial statements are free from material misstatement.
An audit involves performing procedures to obtain audit evidence about the amounts and disclosures in the con-solidated financial statements and the parent company financial statements. The procedures selected depend on the auditors’ judgement, including the assessment of the risks of material misstatement of the consolidated financial
statements and the parent company financial statements, whether due to fraud or error. In making those risk assess-ments, the auditors consider internal control relevant to the Company’s preparation of consolidated financial statements and parent company financial statements that give a true and fair view in order to design audit procedures that are appropriate in the circumstances, but not for the purpose of expressing an opinion on the effectiveness of the Com-pany’s internal control. An audit also includes evaluating the appropriateness of accounting policies used and the reasonableness of accounting estimates made by Manage-ment, as well as evaluating the overall presentation of the consolidated financial statements and the parent company financial statements.
We believe that the audit evidence we have obtained is sufficient and appropriate to provide a basis for our opinion.
Our audit has not resulted in any qualification.
OpinionIn our opinion, the consolidated financial statements and the parent company financial statements give a true and fair view of the Group’s and the parent company’s financial position at 31 May 2015 and of the results of the Group’s and the parent company’s operations and cash flows for the financial year 1 June 2014 – 31 May 2015 in accordance with International Financial Reporting Standards as adopted by the EU and Danish disclosure requirements for listed com-panies.
Statement on the Management’s reviewPursuant to the Danish Financial Statements Act, we have read the Management’s review. We have not performed any further procedures in addition to the audit of the consoli-dated financial statements and the parent company finan-cial statements. On this basis, it is our opinion that the infor-mation provided in the Management’s review is consistent with the consolidated financial statements and the parent company financial statements.
Copenhagen, 13 August 2015
ERNST & YOUNGGodkendt Revisionspartnerselskab
Steen Skorstengaard Niels-Jørgen AndersenState Authorised State AuthorisedPublic Accountant Public Accountant
BANG & OLUFSEN A/S ANNUAL REPORT 2014/15 · 135
KEY FIGURES · MANAGEMENT REPORT · STRATEGY & OUTLOOK · GOVERNANCE · ANNUAL ACCOUNTS · STATEMENTSINDEPENDENT AUDITORS REPORT
MANAGEMENT’S STATEMENT · INDEPENDENT AUDITOR’S REPORT

Bang & Olufsen a/s
Peter Bangs Vej 15
DK-7600 Struer
Denmark
Tel. +45 9684 1122
www.bang-olufsen.com
Comreg: 41257911