annual report 2014 - new zealand exchange · the value of argosy’s portfolio at 31 march 2014 was...
TRANSCRIPT

ANNUAL REPORT 2014

ARGOSY PROPERTY LIMITED | ANNUAL REPORT 2014
PROPERTIES TENANTS
66 224
DIVERSITY “Argosy is, and will remain,
invested in a portfolio that is diversified by sector, grade, location and tenant mix.”
1
HIGHLIGHTS
Chairman’s Report 2
Financial Summary 5
Chief Executive Officer’s Report 6
Strategy 10
Board of Directors 12
Our People 14
Environmental Care 18
Portfolio Overview 20
Industrial Portfolio 24
Office Portfolio 26
Retail Portfolio 28
Case Study – 15 Stout Street, Wellington 30
Financial Statements 32
Corporate Governance 68
Investor Statistics 75
Directory 77
CONTENTS
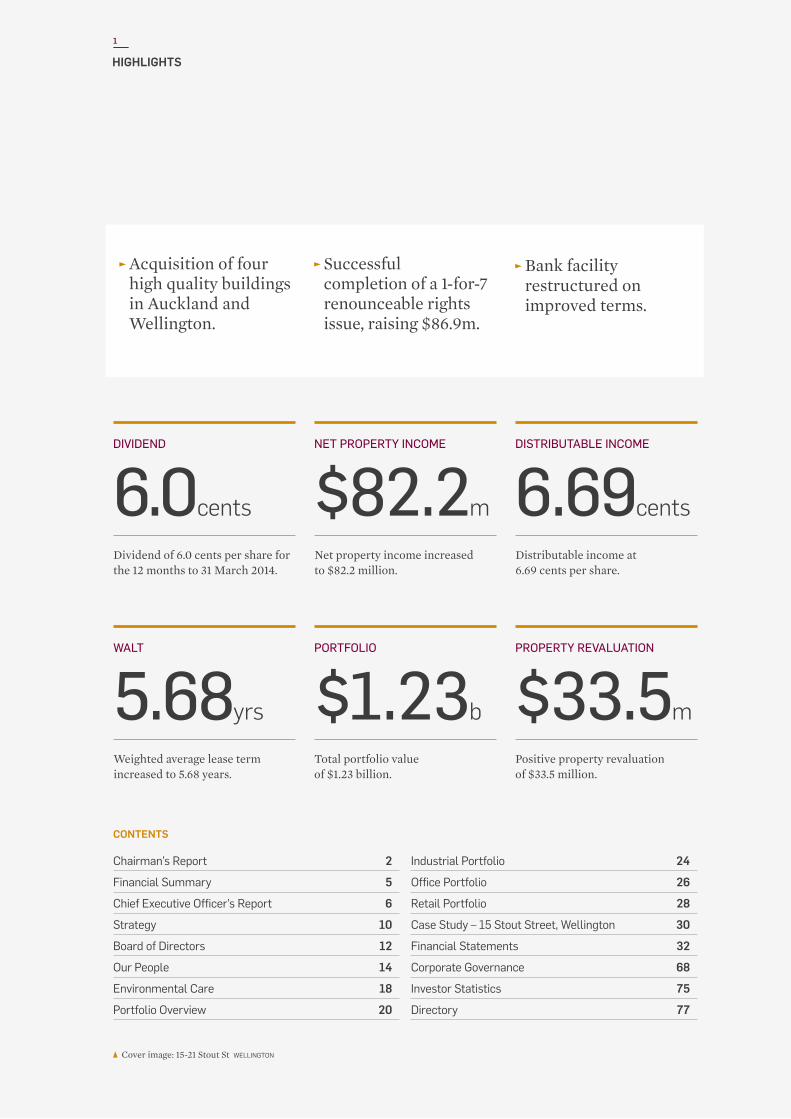
Acquisition of four high quality buildings in Auckland and Wellington.
Successful completion of a 1-for-7 renounceable rights issue, raising $86.9m.
Bank facility restructured on improved terms.
6.0cents
DIVIDeND
$82.2m 6.69cents
Net pRopeRtY INCoMe DIStRIBUtABLe INCoMe
Dividend of 6.0 cents per share for the 12 months to 31 March 2014.
Net property income increased to $82.2 million.
Distributable income at 6.69 cents per share.
$1.23b
poRtFoLIo pRopeRtY ReVALUAtIoN
$33.5m5.68yrs
WALt
Total portfolio value of $1.23 billion.
Positive property revaluation of $33.5 million.
Weighted average lease term increased to 5.68 years.
Cover image: 15-21 Stout St WELLINGTON

2
ARGOSY PROPERTY LIMITED | ANNUAL REPORT 2014
CHAIRMAN’S REPORT
Argosy is pleased to announce its audited financial results for the year ended 31 March 2014, recording a net profit after tax of $85.6 million (2013: $39.2 million), an increase of 118%. Net distributable income for the year was $50.0 million
(2013: $42.2 million), an increase of 18% on the prior period.
Leasing metrics as at 31 March 2014 have improved on the prior year-end, with occupancy increasing to 98.7%. The weighted average lease term at 5.68 years is the highest in eleven years and the leasing profile continues to be well managed.
The 2014 financial year was also one of substantial activity with the acquisition of four high quality buildings in Auckland and Wellington. These buildings all fit within Argosy’s communicated investment policy and are backed by solid tenants with good lease terms.
To assist with the purchase of these properties, Argosy successfully raised $86.9 million of share capital at a premium to net asset backing through a 1-for-7 renounceable rights issue in July 2013.
CONTINUED
MICHAEL SMITH CHAIRMAN MOMENTUM The 2014 financial year was one of
significant progress for Argosy Property Limited (Argosy) with improved operating results and stronger portfolio metrics on the back of a clearly defined portfolio investment strategy and investment policy.
3
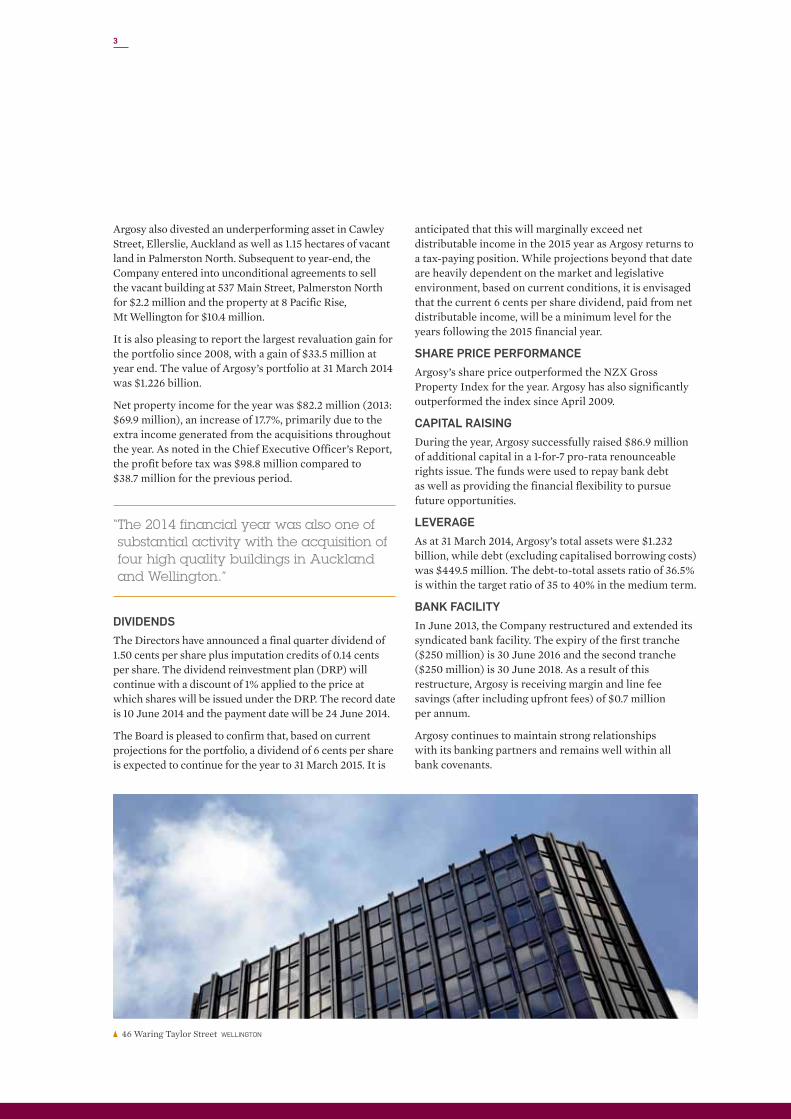
Argosy also divested an underperforming asset in Cawley Street, Ellerslie, Auckland as well as 1.15 hectares of vacant land in Palmerston North. Subsequent to year-end, the Company entered into unconditional agreements to sell the vacant building at 537 Main Street, Palmerston North for $2.2 million and the property at 8 Pacific Rise, Mt Wellington for $10.4 million.
It is also pleasing to report the largest revaluation gain for the portfolio since 2008, with a gain of $33.5 million at year end. The value of Argosy’s portfolio at 31 March 2014 was $1.226 billion.
Net property income for the year was $82.2 million (2013: $69.9 million), an increase of 17.7%, primarily due to the extra income generated from the acquisitions throughout the year. As noted in the Chief Executive Officer’s Report, the profit before tax was $98.8 million compared to $38.7 million for the previous period.
“ The 2014 financial year was also one of substantial activity with the acquisition of four high quality buildings in Auckland and Wellington.”
DIvIDENDSThe Directors have announced a final quarter dividend of 1.50 cents per share plus imputation credits of 0.14 cents per share. The dividend reinvestment plan (DRP) will continue with a discount of 1% applied to the price at which shares will be issued under the DRP. The record date is 10 June 2014 and the payment date will be 24 June 2014.
The Board is pleased to confirm that, based on current projections for the portfolio, a dividend of 6 cents per share is expected to continue for the year to 31 March 2015. It is
anticipated that this will marginally exceed net distributable income in the 2015 year as Argosy returns to a tax-paying position. While projections beyond that date are heavily dependent on the market and legislative environment, based on current conditions, it is envisaged that the current 6 cents per share dividend, paid from net distributable income, will be a minimum level for the years following the 2015 financial year.
SHARE PRICE PERfORMANCEArgosy’s share price outperformed the NZX Gross Property Index for the year. Argosy has also significantly outperformed the index since April 2009.
CAPITAL RAISINGDuring the year, Argosy successfully raised $86.9 million of additional capital in a 1-for-7 pro-rata renounceable rights issue. The funds were used to repay bank debt as well as providing the financial flexibility to pursue future opportunities.
LEvERAGE As at 31 March 2014, Argosy’s total assets were $1.232 billion, while debt (excluding capitalised borrowing costs) was $449.5 million. The debt-to-total assets ratio of 36.5% is within the target ratio of 35 to 40% in the medium term.
BANk fACILITYIn June 2013, the Company restructured and extended its syndicated bank facility. The expiry of the first tranche ($250 million) is 30 June 2016 and the second tranche ($250 million) is 30 June 2018. As a result of this restructure, Argosy is receiving margin and line fee savings (after including upfront fees) of $0.7 million per annum.
Argosy continues to maintain strong relationships with its banking partners and remains well within all bank covenants.
46 Waring Taylor Street WELLINGTON

CHAIRMAN’S REPORT
4
ARGOSY PROPERTY LIMITED | ANNUAL REPORT 2014
GOvERNANCE
At the August 2013 Annual Meeting, Peter Brook and I were re-elected as Independent Directors and our new Directors, Chris Hunter and Jeff Morrison, were also elected as Independent Directors.
PORTfOLIO INvESTMENT STRATEGYOur portfolio investment strategy remains unchanged. In the medium term, Argosy’s portfolio will consist of Core and Value Add properties. Core properties are well constructed, well-located assets which are intended to be long-term investments (>10 years). Core properties will make up 75 to 85% of the portfolio by value.
Core properties enjoy strong long term demand (well located and generic), a leasing profile that provides for rental growth of at least CPI and good structural integrity with minimal maintenance capital expenditure required.
Value Add properties are assets which, through skilled asset management, can increase future earnings and provide capital growth. Value Add properties will already be well located with the potential for strong long-term tenant demand. These properties are available for near to medium-term repositioning or development with the view to moving into the Core category.
Page 21 shows the proportion of Core and Value Add properties in the portfolio. The remaining properties will be divested as market conditions allow.
OuTLOOkAs the country remains in a period of economic growth, it is comforting to know that Argosy’s prospects are equally positive.
The Company has a well-diversified portfolio of good-quality, well located properties and a clear investment strategy that enables us to make the most of current economic conditions.
Argosy is, and will remain, invested in a portfolio that is diversified by sector, grade, location and tenant mix. The portfolio will be located in the Auckland and Wellington markets with modest tenant-driven exposure to provincial markets.
The Board would like to thank all shareholders for their ongoing support over the last 12 months. We look forward to working for you in the year ahead.
P MICHAEL SMITH Chairman
Citigroup Centre AUCKLAND

5
FINANCIAL SUMMARY
2010$000s
Restated2011
$000s2012
$000s2013
$000s2014
$000s
Net property income 77,927 72,260 71,210 69,866 82,218
Profit before financial income/(expenses) and other gains/(losses) 67,718 63,168 35,123 63,110 74,817
Revaluation gains/(losses) (82,761) 2,126 3,658 9,344 33,488
Profit/(loss) for the year (after taxation) (59,100) 26,686 1,949 39,155 85,550
Earnings per share – cents per share (11.05) 4.85 0.35 6.69 11.45
Net distributable Income 33,519 33,371 42,213* 49,961
Investment properties, plant & equipment 932,641 960,607 905,249 976,862 1,226,266
Total assets 950,004 975,171 929,265 992,749 1,232,388
Debt-to-total-assets ratio 40.1% 42.3% 41.4% 33.1% 36.5%
Cash dividend – cents per share 7.50 7.00 6.00 6.00 6.00
Securities on issue at year end – shares 539,328 549,186 558,517 680,932 790,912
Net asset backing per share – cents per share 98 93 87 88 94
Total equity 526,594 511,732 488,446 601,337 739,522
* Distributable income has been restated in 2013 to include the tax impact of depreciation recovered on disposals of investment properties and the taxable gains on properties held on revenue account.
PROPERTY METRICS
2010 2011 2012 2013 2014
Occupancy factor (rent) 96.6% 96.3% 94.1% 96.2% 98.7%
Occupancy factor (sqm) 97.1% 96.8% 92.5% 94.5% 98.7%
Weighted average lease term (years) 4.23 4.92 4.77 5.24 5.68
Number of tenants 294 294 232 221 224
Number of properties** 81 74 65 63 66
Average property size ($m) $11.43 $12.82 $13.93 $15.51 $18.58
Net lettable area (sqm) 549,881 547,483 463,656 485,531 590,991
** Certain titles have been consolidated and treated as one. The total number of buildings excludes properties held for sale.

CHIEf ExECuTIvE OffICER’S REPORT
6
ARGOSY PROPERTY LIMITED | ANNUAL REPORT 2014
Occupancy has reached a level not seen since 2008 and the fundamentals of the property market point to rental growth ahead. Argosy’s weighted average lease term continues to improve and is at its highest since 2003.
Other highlights include the acquisition of four top-quality buildings in Auckland and Wellington, the divestment of underperforming assets and vacant land, a successful capital raising by way of a rights issue raising $86.9 million and the continued progress of two major redevelopments of Argosy properties in Wellington.
Distributable income for the year to 31 March 2014 was 6.69 cents per share. While this is down on the prior year’s amount of 7.22 cents per share, it still represents a good result as the income from the Stout Street acquisition and development in Wellington has yet to be realised.
Profit before finance costs, property revaluations and tax were $74.8 million, compared to $63.1 million in 2013. The profit before tax, after allowing for the non-cash impact of interest rate swaps and property revaluations, was $98.8 million, compared to $38.7 million for the previous period, an increase of 156%.
Interest expense has increased by $1.7 million compared to the previous period. However, after removing capitalised interest of $2.3 million (2013: $4.1 million) relating to development activities, non-capitalised interest expense was $0.1 million less than that for 2013. This reduction is due to the improved margins following the restructure of our banking facility.
pROgRESS
CONSISTENT
PETER MENCE CHIEF EXECUTIVE OFFICER
The 2014 financial year has been one of many highlights for Argosy.

7
In September 2013, Argosy settled the purchase of the Vector Centre at 101 Carlton Gore Road, Newmarket, Auckland, for $22.25 million. Vector Limited is the major tenant of this building on a 7.5-year lease (assuming leases are not terminated in year four or year six).
Finally, in December 2013, Argosy settled the purchase of a new 20,677 square metre distribution centre at 19 Nesdale Avenue, Wiri, Auckland, for $38.0 million. The property is tenanted to Cardinal Logistics Limited on a 15-year lease.
Capital projectsArgosy has two major capital projects occurring at present.
The redevelopment of the newly acquired building at 15 Stout Street, Wellington, is nearing completion and is expected to be opened in July 2014. The property was purchased for $33.2 million and has an upgrade cost of $46.6 million. A case study of this property can be found on pages 30 and 31 of this report.
“ We expect solid rental growth in the year ahead and this is expected to result in further value improvements.”
New Zealand Post House, Wellington, is also being redeveloped by Argosy. This building was purchased in March 2013 for $60 million and has an upgrade cost of $40 million. New Zealand Post and Kiwibank tenant the building and will continue to do so throughout the course of the project. Argosy receives a return of 8% (in arrears) of its share of the development cost until completion.
DivestmentsIn December 2013, Argosy divested the underperforming building at 56 Cawley Street, Ellerslie, Auckland for $10.375 million. The property had suffered from a long-term vacancy factor and had provided an unsatisfactory total return. The sale price represented 92% of its book value at the time.
Argosy sold 1.15 hectares of vacant land in Palmerston North for $1.27 million, which was above its current book value. This sale settled during April 2014.
98.7% 59 36.5%
OCCuPANCY LEASE TRANSACTIONS DEBT TO TOTAL ASSETS RATIO
Overall it is very pleasing to report improved operating fundamentals.
PORTfOLIO ACTIvITYLeasing environmentIn general, the leasing environment has improved over the past year:
— net absorption has again been positive in the industrial and office sectors in Auckland, where the majority of Argosy’s portfolio is located, and vacancy rates have fallen to levels that suggest potential for solid rental growth ahead.
— occupancy enquiry from potential tenants has continued to be strong and incentive levels have reduced.
— the retail sector has improved and while this sector will continue to be challenged by increased Internet sales and additional supply, current turnover levels are at encouraging levels.
LeasingThe management team has continued to focus on occupancy and near-term lease expiries with pleasing results. Occupancy (by rental) has improved to 98.7% from 96.2% at 31 March 2013. Outstanding lease expiries for the period to 31 March 2015 were 9.4% at 31 March 2014.
During the year, 59 lease transactions were completed, including 39 new leases and 20 lease renewals and extensions. The weighted average lease term continues to improve and was 5.68 years at 31 March 2014, up from 5.24 years at 31 March 2013.
AcquisitionsThe 2014 financial year has seen a number of successful acquisitions for Argosy.
In June 2013, the Company purchased the Auckland distribution centre at 80 Favona Road, Mangere for $74.0 million. This property is tenanted to Progressive Enterprises on an 11-year lease.
In July 2013, Argosy settled the purchase of 15 Stout Street, Wellington, for $33.2 million, which is being extensively redeveloped. The property is leased to The Ministry of Business, Innovation and Employment on a 12-year lease.

8
CHIEf ExECuTIvE OffICER’S REPORT ARGOSY PROPERTY LIMITED | ANNUAL REPORT 2014
19 Nesdale Avenue AUCKLAND
Subsequent to financial year end, the Company announced the sale of the vacant property at 537 Main Street, Palmerston North, for $2.2 million, which represented 99.4% of the current book value. This property has underperformed relative to the rest of the portfolio. Settlement is due at end of May.
Argosy also announced the unconditional sale of 8 Pacific Rise, Mt Wellington, Auckland, for $10.4 million, a 2.7% premium to the book value at 31 March 2014. The property had suffered from long-term vacancy issues and a short weighted average lease term. Settlement is expected to occur in July 2014.
Following the settlement of these sales, 9% of the portfolio is considered neither Core nor Value Add and will be divested in the future as market conditions allow.
valuationsThe Company is pleased to report that for the fourth year in succession the revaluation of the property portfolio has resulted in an increase in property values. The increase this year is $33.5 million (2013: $9.3 million). Argosy's portfolio, following the revaluation and including vacant land, shows a passing yield on values of 7.96% and a yield on the assessed fully let market rentals of 7.93%.
OuTLOOkThe outlook for the property market is positive. Rates of enquiry are at levels that Argosy hasn't seen since prior to the global financial crisis and there are signs of rental growth ahead. The management team will continue to focus on the leasing fundamentals as well as positioning the portfolio for the future.
I wish to once again thank the team at Argosy for their dedication and commitment to our vision and values over the past 12 months. The Company is well positioned to continue to deliver shareholders good results for the year ahead.
PETER MENCE Chief Executive Officer

“ The management team will continue to focus on the leasing fundamentals as well as positioning the portfolio in line with our portfolio investment strategy.”
Focus
9
101 Carlton Gore Road AUCKLAND

STRATEGY
10
ARGOSY PROPERTY LIMITED | ANNUAL REPORT 2014
Argosy has a clearly defined portfolio investment strategy.
Argosy is, and will remain, invested in a portfolio that is diversified by sector, grade, location and tenant mix.
The portfolio will consist of Core and Value Add properties. Core properties are well-constructed, well-located assets, intended to be long-term investments (>10 years), making up 75 to 85% of the portfolio by value.
The key features of Core properties are:
— strong long term demand (well-located and generic) — a leasing profile that provides for rental growth of at
least CPI — excellent structural integrity with minimal
maintenance capital expenditure required.
Value Add properties are assets which, through skilled asset management, can increase future earnings and provide capital growth. Value Add properties will already be well located with the potential for strong long-term tenant demand. These properties are available for near to medium term repositioning or development with the view to moving into the Core category.
Properties that are considered neither Core nor Value Add are divested as market conditions allow.
INvESTMENT POLICYOur Investment Policy clearly defines what properties we will seek to own, i.e. it sets the boundaries within which we will operate and invest. The Investment Policy delivers a clear acquisition checklist – and every potential acquisition (and portfolio asset) is measured against that checklist.
Where will we buy?
Industrial 35-45%, Office 35-45%, Retail 15-25%
Focus on good quality Secondary Office (A- to C+), Secondary Industrial and Large Format Retail
Concentrated on Auckland (65-75%) and Wellington (20-30%). Provincial or South Island tenant-driven only (<10%)*
Target Value Add properties where we can leverage internal expertise within overall Core/Value Add targets
Target contiguous properties with potential
Target “off-market” acquisitions and avoid competitive processes
No leasehold
No international properties
* The market rental rates required to provide a reasonable return on new development in Christchurch may be higher than the expected long term rates the market will support. This has the potential to produce declining rental rates in the future. The probable result is an Internal Rate of Return (IRR) that is less than the passing yield, and underperformance relative to the domestic market as a whole. As such, Argosy's Investment Policy excludes Christchurch unless strategically imperative.
In some cases a portfolio of assets may be considered. The strategy for the acquired portfolio must be consistent with the overall Argosy Portfolio Investment Strategy (i.e. the majority of the properties by value are either Core or offer potential to move to Core in the medium term).
In certain circumstances exceptions to the Investment Policy may be considered where an acquisition is made to meet the requirements of a valued tenant.
The portfolio has well diversified income streams, with the largest tenant being New Zealand Post (approximately 8.8% of gross property rental).
Argosy has a diversified portfolio of quality properties with an average value of $18.6 million. This allows the Company to be nimble and react quickly to changing market conditions without the need for potentially dilutive capital raisings when the market is weak. Liquid properties currently represent 21% of the total portfolio.
39 Market Place AUCKLAND

11
Argosy is also focused on continuing to improve operating performance and the asset management team has the extensive experience to ensure appropriate decisions are made in the management of the portfolio. Environmentally sustainable and energy-efficient design is becoming increasingly important and we believe Argosy can provide innovative solutions to make sure that buildings are environmentally sound.
It is essential to manage the tenancy relationship to ensure that tenants are treated appropriately and that any opportunities to add value or security to the income from each lease are acted on. The percentage of tenants retained remains a key operating metric for Argosy.
CAPITAL MANAGEMENTFor Argosy, the reasonable, proportional use of debt and equity to support its assets is a key indicator of balance sheet strength. Astute use of leverage increases the resources available for growth and expansion.
The optimal capital structure for Argosy should be one that enables the Company to maximise its earnings yield through the property cycle within the following parameters:
— properties can be acquired when they meet the approved investment policy criteria, or sold when they are non-Core
— there are limited forced sales of properties or a requirement to issue equity at a price that is dilutive to shareholders
— measured dividend growth is maintained.
Argosy’s capital structure policy is to retain debt-to-total assets between 35 to 40% in the medium term.
This ratio will be monitored on an ongoing basis. Any movement beyond pre-set parameters will require a strategy, action plan and timeframe to move debt levels back to within the prescribed range. The strategy would address the key capital management levers available to Argosy including:
Reduce debt-to-total- assets ratio
Increase debt-to-total- assets ratio
Capital raising Share buy-back
Adopt and distribute an appropriate dividend
Adopt and distribute an appropriate dividend
Acquisitions
Dividend Reinvestment Plan modifications
Value Add expenditure
Divestments Developments
Development
Developments only for tenants who provide strategic value to Argosy
Joint ventures will only be undertaken where the counterparty is of sufficient financial standing to carry their share of risk
No third-party management of external portfolios
value parameters
Greater than $10 million unless strategically imperative ($6 million for Industrial)
No more than 10% of overall portfolio value
Due diligence
Apply Argosy's due diligence checklist
Structural integrity ≥ 70% (unless this represents a Value Add opportunity)

BOARD Of DIRECTORS
12
ARGOSY PROPERTY LIMITED | ANNUAL REPORT 2014
The Board reviews all aspects of portfolio, asset and financial management strategy, formulates and reviews compliance programmes, and approves transactions and capital expenditures.
The Board currently comprises seven members, all of whom bring a significant level of expertise to Argosy. Their experience includes property investment, management and development, finance and
corporate management. The Board has determined that Michael Smith, Peter Brook, Andrew Evans, Chris Hunter, Jeff Morrison and Trevor Scott are independent Directors under the NZX Listing Rules. Mark Cross is not considered to be independent. All Board members are non-executive Directors.
The Board of Directors (the Board) has overall responsibility for the management of Argosy.

IMAGE fROM LEfT
Chris HunterPeter BrookTrevor ScottMichael SmithAndrew EvansMark CrossJeff Morrison
13
MICHAEL SMITHChairman
Mr Smith was employed by Lion Nathan Limited for 29 years. During that time, he held a number of senior executive positions with the Lion Nathan Group and was a director of the parent company for 16 years. Mr Smith is a director of a number of companies, including Greymouth Petroleum Limited, Maui Capital Indigo Fund Limited and Maui Capital Aqua Fund Limited. His previous directorships/trusteeships include Lion Nathan Limited, The Lion Foundation, Fonterra Co-operative Group Limited, Auckland International Airport Limited, OnePath Holdings (NZ) Limited and Fisher & Paykel Healthcare Corporation Limited.
PETER BROOkDirector
Mr Brook has 20 years’ experience in the investment banking industry, retiring in 2000 to pursue his own business and consultancy activities. He is presently chairman of BurgerFuel Worldwide Limited, Trust Investments Management Limited and Generate Investment Management Limited. Mr Brook is also a trustee of the Melanesian Mission Trust Board, a member of the Institute of Finance Professionals New Zealand Inc. and a director of several private companies.
MARk CROSSDirector
Mr Cross has over 20 years’ experience in investment banking, holding senior positions in New Zealand, Australia and, more recently, the United Kingdom. Alongside consulting and private investment activities, he is currently also a director of Milford Asset Management Limited, Triathlon NZ Inc. and other private companies, and chairman of MFL Mutual Fund Limited and Superannuation Investments Limited. He is a member of the New Zealand Institute of Chartered Accountants and Institute of Directors.
ANDREW EvANSDirector
Mr Evans has over 25 years’ experience in commercial real estate and asset management, previously holding executive positions in listed and unlisted real estate investment businesses. He is a director of Vital Healthcare Management Limited, Holmes Group Limited, Holmes General Partner Fire Limited, Trust Investments Management Limited and Hughes & Cossar Limited. In addition, Mr Evans is a past national president of the Property Council of New Zealand, a foundation member of the New Zealand Property Institute and a member of the Institute of Directors.
CHRIS HuNTERDirector
Mr Hunter has extensive commercial property experience including over 25 years in New Zealand’s construction industry, most recently as the chief executive officer of Hawkins Construction. Over the past 20 years he has been associated with more than $10 billion of developments across industrial, commercial, retail, residential and infrastructure. Mr Hunter currently has a portfolio of business investments and is active in the property development sector. He is advising a number of public listed companies in their property and construction ventures. Mr Hunter is an associate member of the New Zealand Institute of Quantity Surveyors, a fellow of the Royal Institute of Chartered Surveyors and holds a Master of Business Administration degree from Massey University.
JEff MORRISONDirector
Mr Morrison has 35 years' of experience as a property lawyer, 29 of them as a commercial property partner at Russell McVeagh. He is a trustee of the Spirit of Adventure and other charitable trusts and holds a number of private company directorships.
Mr Morrison's experience includes advising on the acquisition, development (including financing, construction and leasing) and sale of significant office, retail and industrial properties.
TREvOR SCOTTDirector
Mr Scott is a Wanaka-based chartered accountant and chairman of Arthur Barnett Limited, Roslyn Storage Limited, Whitestone Cheese Limited, Ashburton Guardian Company Limited and Harraway & Sons Limited. In addition, he is a director of Neuren Pharmaceuticals Limited and several other private companies. Mr Scott was inducted into the New Zealand Business Hall of Fame in 2007.

OuR PEOPLE
14
ARGOSY PROPERTY LIMITED | ANNUAL REPORT 2014
IMAGE fROM LEfT
Warren CateAnna HamillScott LunnyDavid SnellingDave FraserPeter MenceTony FrostMarilyn StoreySaatyesh BhanaJoanna SharpeWade Allen
The Argosy team is made up of 15 well-qualified and experienced property professionals who perform at the highest level in the industry. They are supported by an equally committed and competent finance, legal and administration staff of ten.
Our people are an integral part of our business.

15

OuR PEOPLE
16
ARGOSY PROPERTY LIMITED | ANNUAL REPORT 2014
PETER MENCEChief Executive Officer
Peter’s property career spans over 30 years working with firms like Progressive Enterprises, Challenge Properties, Green & McCahill and CBRE. An engineer by background, he joined OnePath (NZ) Limited in 1994 and was appointed General Manager of Argosy Property in 2007. Peter has been an integral part of the management of Argosy Property since 2003 and is responsible for overall performance.
Peter is a fellow of the New Zealand Property Institute and a past lecturer in Advanced Property Management at The University of Auckland and was recently presented with the Stuart McIntosh Award for his contribution to the University.
DAvE fRASER Chief Financial Officer
Dave joined the team in 2011 and was originally responsible for the planning and execution of the management internalisation and Argosy’s corporatisation. He now oversees the financial and corporate activities of the Company.
Dave has spent over 26 years in senior financial and general management roles both in New Zealand and overseas, including six years in Japan as a senior vice president with the Jupiter Group. He has broad experience in strategic and operational planning, business development, debt restructures, equity raisings, and mergers and acquisitions.
In addition to being a qualified Chartered Accountant, Dave has Bachelor of Commerce and Master of Business Administration degrees from The University of Auckland.
DAvID SNELLINGGeneral Counsel
David joined Argosy in 2011 to manage day-to-day corporate compliance. He also provides legal assistance to the property team and general in-house legal support as a solicitor.
Prior to joining Argosy, David’s experience includes working in the tax practices of large New Zealand firms; he has been involved in a broad range of transactions across the property, primary, energy, petroleum, telecommunications, banking and finance sectors. David also has a strong track record in dispute work. He has published articles on topical issues in CCH’s Tax Planning Report.
David is a qualified lawyer and a member of the New Zealand Law Society’s Property Law Section. He graduated from Victoria University in Wellington.
SCOTT LuNNYInvestor Relations Manager
Scott has been with Argosy Property since July 2006 and has over 16 years’ experience in the banking, managed funds and property industries, gaining considerable experience in all aspects of financial reporting, treasury and tax management. Prior to joining Argosy, Scott spent two years in the UK working for various fund managers and five years in the managed funds division of ING New Zealand.
Scott is a Chartered Accountant and has a Bachelor of Business Studies degree and a Postgraduate Diploma in Business and Administration, majoring in Finance, both from Massey University.
ANNA HAMILLFinancial Controller
Anna joined Argosy in 2013 and has responsibility for the financial and management reporting as well as budgeting functions of the Company. Prior to joining Argosy, she worked in the external reporting team of one of the largest general insurers in New Zealand. Prior to that, Anna spent over six years working in audit and assurance services at Deloitte, where her client base consisted of larger corporate and listed entities.
Anna is a Chartered Accountant and has a Bachelor of Commerce degree majoring in Accounting and Marketing and a Postgraduate Diploma in Commerce majoring in Management, both from The University of Auckland.
WARREN CATEAsset Manager
Warren is responsible for a wide variety of properties in the Argosy portfolio. In addition to strategic management and financial performance accountabilities, his extensive property industry experience is utilised to good effect in the investigation and analysis of many of our property acquisition initiatives.
Graduating from The University of Auckland with a Bachelor of Engineering degree, Warren has held a wide range of roles over 25 years in the industry, including as General Manager Property for Magnum Corporation. He joined the team in 1995, making him one of the longest-serving members.

17
TONY fROSTAsset Manager
Tony’s property career includes a wide variety of property and development management roles in private and public sector entities.
He joined the management team in 2007 and has responsibility for a varied portfolio of Argosy’s properties. In addition to strategic management and financial performance accountabilities, Tony is particularly effective at investigating and analysing development projects, using his extensive property industry experience to enhance many of our portfolio initiatives.
Tony has a Diploma in Valuation from The University of Auckland, is a Registered Valuer and a member of the Property Management Institute.
SAATYESH BHANAAsset Manager
Saatyesh has been with the management team for over nine years and is responsible for the strategic management and financial performance of a portfolio of properties predominately located in the Wellington region.
He graduated from Massey University with a Bachelor of Business Studies, specialising in Valuation and Property Management. Saatyesh has worked in a variety of private sector and listed property businesses. His 17 years’ experience includes acquisitions, divestments, leasing and value add projects. He has strong tenant relationship skills which enables a collaborative approach with clients.
MARILYN STOREYAsset Manager
Marilyn has been with the Argosy team for more than five years and has over 20 years’ experience in the commercial property industry ranging from working with tenants and landlords, consulting, project work and energy management.
She is responsible for a mix of properties across our portfolio including development work. On top of her extensive experience, Marilyn is also well qualified with a Master of Business Administration from the University of Otago and a Bachelor's degree in both Property and Commerce from The University of Auckland. She joined Argosy after operating her own property projects consulting business.
JOANNA SHARPEAsset Manager
Joanna joined the Argosy team in July 2013 and is based in Auckland. She has over 17 years’ experience in the retail and property industries including working with retailers and landlords, project work, and resource consent and planning.
Joanna is responsible for our retail portfolio across New Zealand including development work. On top of her experience, she is also well qualified with an MA (Soc Sci) in Business and Psychology from Glasgow University. Joanna has been in New Zealand for 14 years since moving from the UK. Most recently, she worked for Wellington Airport and Foodstuffs (Wellington) Co-operative Society Limited.
WADE ALLENLeasing Manager
Wade is responsible for maximising the leasing and transactional side of Argosy’s business.
He has over 27 years’ experience in the commercial property business, having worked in asset management for NZI, Brierley Investments, Trans Tasman Properties and the National Bank.
More recently, Wade spent four years as Commercial Manager at Manson Developments involved in leasing and acquisitions. He has also run his own property consultancy practice focusing on leasing solutions and the sale and purchase of commercial property assets.
Wade graduated from The University of Auckland with an Arts degree in Economics.

18
ARGOSY PROPERTY LIMITED | ANNUAL REPORT 2014
ENvIRONMENTAL CARE

19
Argosy is well aware that natural resources are finite. We pay attention to environmental issues and encourage environmentally responsible behaviour.
Within our Argosy offices, we ensure that all recyclable goods are recycled and paper wastage is at a minimum. Our biggest role in reducing the impact on the environment, however, is achieved through our Building Management Policy.
ARGOSY BuILDING MANAGEMENT POLICYAs a responsible investor, Argosy is keen to ensure there are initiatives to achieve environmentally sustainable features in each individual building’s strategic plan. We consider the initiative to produce environmentally responsible developments to be a fundamental requirement of any project, be it an existing building management matter, a new development or a retrofit.
This view is supported by tenant demand for environmentally sustainable accommodation that:
— illustrates a tenant’s commitment to the environment — provides a reduction in operating costs — mitigates the functional obsolescence of an investment.
We are committed to finding new and innovative ways of making our buildings more environmentally sound and energy efficient. Argosy is a member of the New Zealand Green Building Council and was recently awarded a 5 star built New Zealand Green Star rating (NZ – Office Built 2009 Certified Rating) for Te Puni Ko-kiri House in Wellington. This property, which is the first built-rated building in Wellington, was also awarded 3 stars in the innovation category for the utilisation of new technology to achieve a better and more efficient strategy for building services. The redevelopment at 15 Stout Street, Wellington, is also targeting a 5-star “as built” Green Star rating.
FOCUS Sustainable development and protecting
the environment are important considerations for Argosy.
15 Stout Street WELLINGTON Te Puni Ko-kiri House WELLINGTON

ARGOSY PROPERTY LIMITED | ANNUAL REPORT 2014
20
PORTfOLIO OvERvIEW
In the past 12 months, Argosy has expanded its portfolio by acquiring four high-quality buildings in Auckland and Wellington as well as divesting some vacant land and under-yielding properties in both Auckland and Palmerston North.
We remain committed to improving operating performance within the portfolio, in order to enhance returns for shareholders. Argosy is determined to be responsive to tenant requirements to ensure retention rates are very high.
pORTFOLIO
EXpANDED

21
Occupancy (by rental) has improved to a six-year high of 98.7%. Argosy’s leasing profile is also in great shape with 21% of the portfolio not expiring until beyond March 2024.
98.7%
TOTAL PORTfOLIO vALuEBy SECTOR
28% Retail
36% office
36% Industrial
TOTAL PORTfOLIO vALuEBy REgION
70% Auckland
22% Wellington
5% palmerston North
3% other regional
85% Core properties
10% properties and land to divest
5% Value Add properties
PORTfOLIO STATISTICS
Total Properties Office Industrial Retail
Number of buildings 66 18 35 13
Market value of assets ($m) 1,226.27 437.34 441.78 347.15
Net lettable area (sqm) 590,991 124,642 326,666 139,683
Vacancy factor by rent 1.29% 1.65% 0.63% 1.57%
WALT (years) 5.68 5.33 6.48 5.16
Average value ($m) 18.58 24.30 12.62 26.70
Passing yield 7.96% 8.36% 7.67% 7.82%
PORTfOLIO MIx
OCCuPANCY

PORTfOLIO OvERvIEW
22
ARGOSY PROPERTY LIMITED | ANNUAL REPORT 2014
NEW LEASES AND LEASE ExTENSIONS*By SECTOR
floor Area (sqm)
Average Lease Term (years) # of Leases
Office 13,814 4.54 27
Industrial 72,395 5.20 13
Retail 22,521 5.02 19
Total 108,730 4.93 59
NEW LEASES AND LEASE ExTENSIONS*By TyPE
floor Area (sqm)
Average Lease Term (years) # of Leases
New lease 69,166 5.76 39
Right of renewal 12,318 2.87 13
Extension 27,246 4.08 7
Total 108,730 4.93 59
RENT REvIEWSBy SECTOR
Number of Reviews
Annualised Rent Increase
Increase over Contract
Office 28 1.8% 125,559
Industrial 12 1.9% 190,957
Retail 40 2.5% 384,339
Total 80 2.1% 700,855
OCCuPANCY, LEASING AND WALTOccupancy improved to 98.7% in the period from 96.2% last year. This area has been a specific focus for the asset management team and it is pleasing to see improved results in this particular metric. The most significant movement was the successful lease of 14,800 sqm at 12-16 Bell Avenue, Auckland.
The weighted average lease term (WALT) increased from 5.24 years to 5.68 years. This is the highest WALT achieved in the past eleven years and is a considerable improvement on the prior year. The WALT is very important because portfolio values are fundamentally affected by security of income streams. The WALT by sector is represented in the chart on page 23.
During the year, 59 lease transactions were completed (excluding car parks) including 39 new leases and 20 lease renewals and extensions. A total of 80 rental reviews were completed resulting in an increased annual rental of $700,855. The lease expiry profile as at 31 March 2014 is shown on page 23.
vALuATIONSThe revaluation of the property portfolio resulted in an increase in property values of $33.5 million (2013: $9.3 million). The Company’s portfolio following the revaluation, including vacant land, shows a passing yield on values of 7.96% and a yield on the assessed fully let market rentals of 7.93%.
Argosy has achieved a positive revaluation of its portfolio for the fourth year in succession. This suggests that positive rental growth will continue in the near future.
* Excludes acquisitions and divestments.

23
Ye
ars
Total Retail Industrial Office0
1
2
3
4
5
7
6 5.685.16
6.48
5.33
WEIGHTED AvERAGE LEASE TERMBy SECTOR
LEASE MATuRITY ExPIRYBy RENT
Pe
rce
nta
ge
of
po
rtfo
lio
(b
y in
com
e) 22%
20%
18%
16%
14%
12%
10%
8%
6%
4%
2%
0%
The number above each bar denotes the total tenantexpiries per year (excluding monthly car parks and tenantswith multiple leases within one property).
Vacant Mar-15 Mar-16 Mar-17 Mar-18 Mar-19 Mar-20 Mar-21 Mar-22 Mar-23 Mar-24 Mar-25Year ending
13
42 30
40
32
23
21
10
12
3
3
821%
2.9%
1.1%
6.6%
3.5%
16.2%
8.9%
10.9%
7.9%
10.3%9.4%
1.3%
IBM AUCKLAND

INDuSTRIAL PORTfOLIO
24
ARGOSY PROPERTY LIMITED | ANNUAL REPORT 2014
— continued development activity is forecast for the next few years, following 140,000 sqm of new builds in 2013.
Industrial vacancy within the Argosy portfolio has decreased markedly, mainly due to the leasing of 14,800 sqm at 12-16 Bell Avenue, Auckland, in 2013. As a result, property values have improved for most of the Company's industrial portfolio, most notably the Ezibuy building in Palmerston North which recorded a $4 million increase. The main exceptions have been the Manawatu Business Park vacant land, 1478 Omahu Road, Hastings, and 32 Bell Avenue, Auckland, which all recorded declines in value over the past 12 months.
During the year, Argosy purchased two industrial buildings in Auckland. The property at 80 Favona Road, Mangere, Auckland was purchased for $74 million and is leased to General Distributors Limited. The property at 19 Nesdale Avenue, Wiri, was purchased for 38 million and is leased to Cardinal Logistics Limited.
The sale of 1.15 hectares of vacant land in Palmerston North went unconditional before year-end and settled in April 2014.
The largest industrial vacancy in the Argosy portfolio is at 19 Richard Pearce Drive, Mangere, Auckland, with 660 sqm currently sitting vacant.
IndustrialIndustrial rents have only slightly improved during the past year but vacancy has declined as occupiers take up more space when they expand their operations.
A continued balance between supply and demand has resulted in limited rental movements in the sector during the year. Investors in the sector continue to show interest.
Some of the trends we are seeing in the industrial market are:
— positive net absorption in the Auckland region
— demand for good-quality, well-located industrial space remains positive
INDuSTRIAL PORTfOLIO STATISTICS
NuMBER Of BuILDINGS
35MARkET vALuE Of ASSETS ($M)
$441.78 vACANCY fACTOR (BY RENT)
0.6%WALT (YEARS)
6.48PASSING YIELD
7.67%
TOP 10 INDuSTRIAL TENANTSBy PERCENTAgE Of RENTAL INCOME
General Distributors Limited
Cardinal Logistics Limited
ezibuy Limited
peter Baker transport Limited
Halls Logistics Limited
Amcor Flexibles (New Zealand) Limited
DSe (NZ) Limited
Visypet (NZ) Limited
Fonterra Co-operative Group Limited
toll Holdings Limited
other
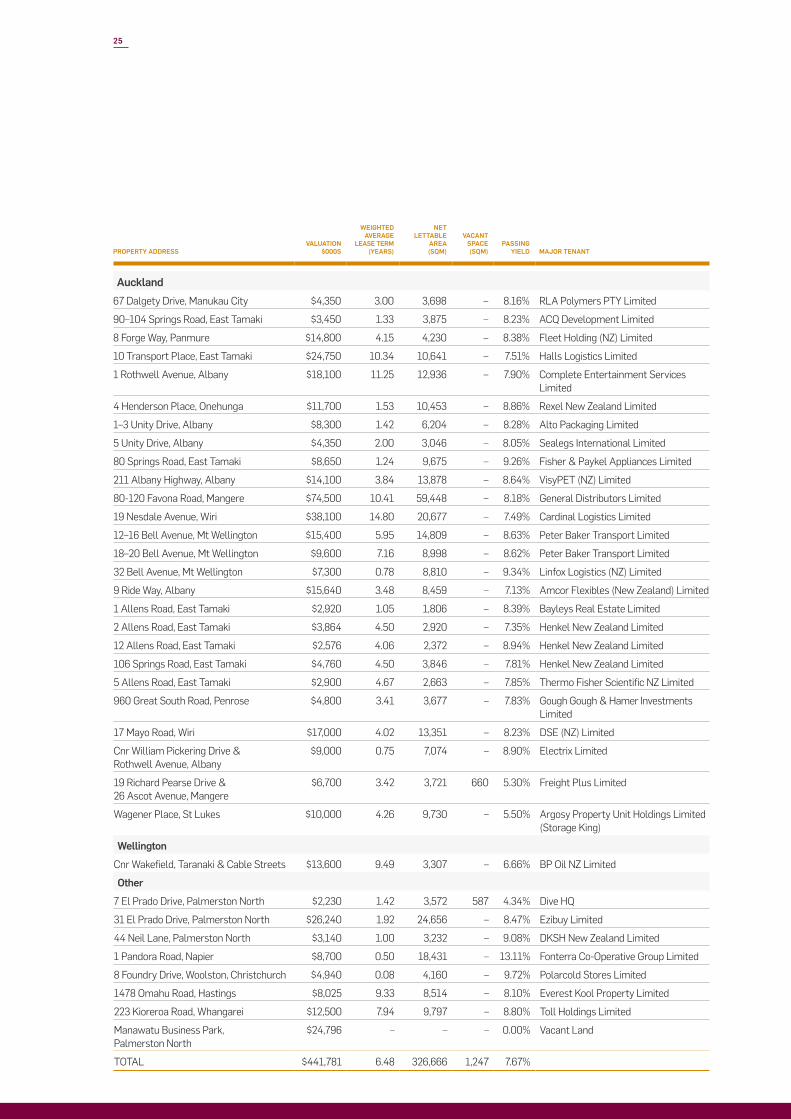
25
PROPERTY ADDRESSvALuATION
$000S
WEIGHTED AvERAGE
LEASE TERM (YEARS)
NET LETTABLE
AREA (SQM)
vACANT SPACE (SQM)
PASSING YIELD MAJOR TENANT
Auckland
67 Dalgety Drive, Manukau City $4,350 3.00 3,698 – 8.16% RLA Polymers PTy Limited
90–104 Springs Road, East Tamaki $3,450 1.33 3,875 – 8.23% ACQ Development Limited
8 forge Way, Panmure $14,800 4.15 4,230 – 8.38% fleet Holding (NZ) Limited
10 Transport Place, East Tamaki $24,750 10.34 10,641 – 7.51% Halls Logistics Limited
1 Rothwell Avenue, Albany $18,100 11.25 12,936 – 7.90% Complete Entertainment Services Limited
4 Henderson Place, Onehunga $11,700 1.53 10,453 – 8.86% Rexel New Zealand Limited
1–3 Unity Drive, Albany $8,300 1.42 6,204 – 8.28% Alto Packaging Limited
5 Unity Drive, Albany $4,350 2.00 3,046 – 8.05% Sealegs International Limited
80 Springs Road, East Tamaki $8,650 1.24 9,675 – 9.26% fisher & Paykel Appliances Limited
211 Albany Highway, Albany $14,100 3.84 13,878 – 8.64% VisyPET (NZ) Limited
80-120 favona Road, Mangere $74,500 10.41 59,448 – 8.18% general Distributors Limited
19 Nesdale Avenue, Wiri $38,100 14.80 20,677 – 7.49% Cardinal Logistics Limited
12–16 Bell Avenue, Mt Wellington $15,400 5.95 14,809 – 8.63% Peter Baker Transport Limited
18–20 Bell Avenue, Mt Wellington $9,600 7.16 8,998 – 8.62% Peter Baker Transport Limited
32 Bell Avenue, Mt Wellington $7,300 0.78 8,810 – 9.34% Linfox Logistics (NZ) Limited
9 Ride Way, Albany $15,640 3.48 8,459 – 7.13% Amcor flexibles (New Zealand) Limited
1 Allens Road, East Tamaki $2,920 1.05 1,806 – 8.39% Bayleys Real Estate Limited
2 Allens Road, East Tamaki $3,864 4.50 2,920 – 7.35% Henkel New Zealand Limited
12 Allens Road, East Tamaki $2,576 4.06 2,372 – 8.94% Henkel New Zealand Limited
106 Springs Road, East Tamaki $4,760 4.50 3,846 – 7.81% Henkel New Zealand Limited
5 Allens Road, East Tamaki $2,900 4.67 2,663 – 7.85% Thermo fisher Scientific NZ Limited
960 great South Road, Penrose $4,800 3.41 3,677 – 7.83% gough gough & Hamer Investments Limited
17 Mayo Road, Wiri $17,000 4.02 13,351 – 8.23% DSE (NZ) Limited
Cnr William Pickering Drive & Rothwell Avenue, Albany
$9,000 0.75 7,074 – 8.90% Electrix Limited
19 Richard Pearse Drive & 26 Ascot Avenue, Mangere
$6,700 3.42 3,721 660 5.30% freight Plus Limited
Wagener Place, St Lukes $10,000 4.26 9,730 – 5.50% Argosy Property Unit Holdings Limited (Storage King)
Wellington
Cnr Wakefield, Taranaki & Cable Streets $13,600 9.49 3,307 – 6.66% BP Oil NZ Limited
Other
7 El Prado Drive, Palmerston North $2,230 1.42 3,572 587 4.34% Dive HQ
31 El Prado Drive, Palmerston North $26,240 1.92 24,656 – 8.47% Ezibuy Limited
44 Neil Lane, Palmerston North $3,140 1.00 3,232 – 9.08% DKSH New Zealand Limited
1 Pandora Road, Napier $8,700 0.50 18,431 – 13.11% fonterra Co-Operative group Limited
8 foundry Drive, Woolston, Christchurch $4,940 0.08 4,160 – 9.72% Polarcold Stores Limited
1478 Omahu Road, Hastings $8,025 9.33 8,514 – 8.10% Everest Kool Property Limited
223 Kioreroa Road, Whangarei $12,500 7.94 9,797 – 8.80% Toll Holdings Limited
Manawatu Business Park, Palmerston North
$24,796 – – – 0.00% Vacant Land
TOTAL $441,781 6.48 326,666 1,247 7.67%

OffICE PORTfOLIO
26
ARGOSY PROPERTY LIMITED | ANNUAL REPORT 2014
OfficeThe office market outlook is very positive and positive net absorption was recorded in Auckland over the year, both inside and outside of the CBD. While negative net absorption continues to hamper the Wellington market, core Wellington CBD actually enjoyed positive net absorption.
Vacancy rates have decreased in both cities. Demand for quality office space has led this decrease in Auckland. The primary cause of this in Wellington was the removal of a number of buildings from available stock following the earthquakes in the region during the year.
Some of the trends we are seeing in the office space are:
— continued focus by tenants on structural integrity
— overall Auckland CBD vacancy levels have decreased
— positive net absorption in both CBD and non-CBD
— positive demand in the non-CBD office market
— a number of Wellington buildings are unavailable for occupation due to earthquake strengthening and refurbishment
— occupier demand continues as tenants look to secure quality office space
— employment, fundamental to the fortunes of the office sector, continues to increase in both Auckland and Wellington and has done so since 2010 (Statistics NZ)
— yields have firmed due to the improved leasing market and increased confidence.
Argosy settled the acquisition of 15 Stout Street, Wellington in July 2013. The building is being upgraded and is expected to be complete by July 2014. A case study on this property can be found on pages 30 and 31 of this report.
Argosy's portfolio was also enhanced by the off-market acquisition of the building at 101 Carlton Gore Road, Newmarket, Auckland, for $22.25 million. The property is leased to Vector Limited.
The building at 56 Cawley Street, Ellerslie, Auckland was divested in December 2013.
Lease enquiry levels are at historically high levels and the asset management team has presented a large number of proposals to tenants. The largest vacancy at 31 March 2014 was at 8 Pacific Rise, Mt Wellington, Auckland, where 946 sqm remains vacant. Subsequent to balance date, this building has been divested.

27
OffICE PORTfOLIO STATISTICS
NuMBER Of BuILDINGS
18MARkET vALuE Of ASSETS ($M)
$437.34vACANCY fACTOR (BY RENT)
1.7%WALT (YEARS)
5.33PASSING YIELD
8.36%
TOP 10 OffICE TENANTSBy PERCENTAgE Of RENTAL INCOME
New Zealand post
Ministry of Business, Innovation and employment
Department of Internal Affairs
te puni Ko-kiri
Arawata Assets Limited
IBM New Zealand Limited
Vector Limited
tonkin & taylor Limited
Dimension Data New Zealand Limited
National Institute of Water & Atmospheric Research
other
PROPERTY ADDRESSvALuATION
$000S
WEIGHTED AvERAGE
LEASE TERM (YEARS)
NET LETTABLE
AREA (SQM)
vACANT SPACE (SQM)
PASSING YIELD MAJOR TENANT
Auckland
99–107 Khyber Pass Road, Newmarket $6,920 3.37 2,442 – 8.71% franklin Plumbers & Builders Supplies Limited
8 Pacific Rise, Mt Wellington $10,130 2.00 3,638 946 7.17% AsureQuality Limited
101 Carlton gore Road, Newmarket $22,250 1.59 4,714 – 7.97% Vector Limited
39 Market Place, Viaduct Harbour $33,000 7.80 10,233 518 10.22% Dimension Data New Zealand Limited
105 Carlton gore Road, Newmarket $25,000 3.98 5,312 – 8.24% Tonkin & Taylor Limited
302 great South Road, greenlane $6,300 3.69 1,890 – 8.71% McDonald's Restaurants (NZ) Limited
308 great South Road, greenlane $4,650 2.93 1,570 – 9.87% Pacific Brands Holdings Limited
626 great South Road, Ellerslie $6,850 1.34 2,647 – 9.66% International Accreditation NZ
25 Nugent Street, grafton $7,350 4.35 3,028 – 9.00% Schindler Lifts NZ Limited
65 Upper Queen Street $6,400 1.60 2,519 764 7.81% Localist Limited
107 Carlton gore Road, Newmarket $25,200 5.14 6,061 – 7.84% Arawata Assets Limited
Citigroup Centre, 23 Customs Street East $39,890 3.31 9,542 866 8.24% USA Embassy
IBM Centre, 82 Wyndham Street $26,000 1.64 6,154 – 9.36% IBM New Zealand Limited
Wellington
143 Lambton Quay $26,000 5.20 6,216 – 8.01% Te Puni Ko-kiri
46 Waring Taylor Street $35,000 2.90 9,014 – 8.47% Department of Internal Affairs
8–14 Willis Street $13,800 2.40 5,056 – 9.09% Earthquake Commission
New Zealand Post House, 7–27 Waterloo Quay $72,500 6.00 24,977 – 8.20% New Zealand Post/Kiwibank
15–21 Stout Street $70,100 12.00 19,629 – 7.50% Ministry of Business, Innovation and Employment
TOTAL $437,340 5.33 124,642 3,094 8.36%

RETAIL PORTfOLIO
28
ARGOSY PROPERTY LIMITED | ANNUAL REPORT 2014
RetailThe retail sector in Auckland has had another challenging year with availability of retail space increasing and vacancy rates remaining stable.
The shopping centre and bulk retail sub-sectors have maintained their popularity, with a good track record of low vacancy.
The future of the retail sector largely depends on the consumer, with ever-increasing competition from online options being the major threat. Key indicators are positive, however, with consumer confidence and retail spending both on the rise. The link between an increase in retail spending and improved retail capital values is inseparable.
Some of the trends evidenced in the retail sector include:
— good-quality and well-managed bulk retail centres continue to be highly sought after
— importance of tenant due diligence with a focus on the quality of income streams
— increased investor demand
— retail continues to be impacted by online shopping, a trend we expect to be ongoing
— retail spending is up, along with consumer confidence
— credit card spending continues to increase
— the demand for durable goods, often sold in bulk retail stores, has been growing strongly since 2011.
Vacancy in the retail portfolio remains low. The largest vacancy is at 537 Main Street, Palmerston North. This building has been sold subsequent to year-end with settlement expected to occur on 30 May 2014. The Albany Mega Centre continues to perform extremely well and demand for space from tenants exceeds supply available.
29
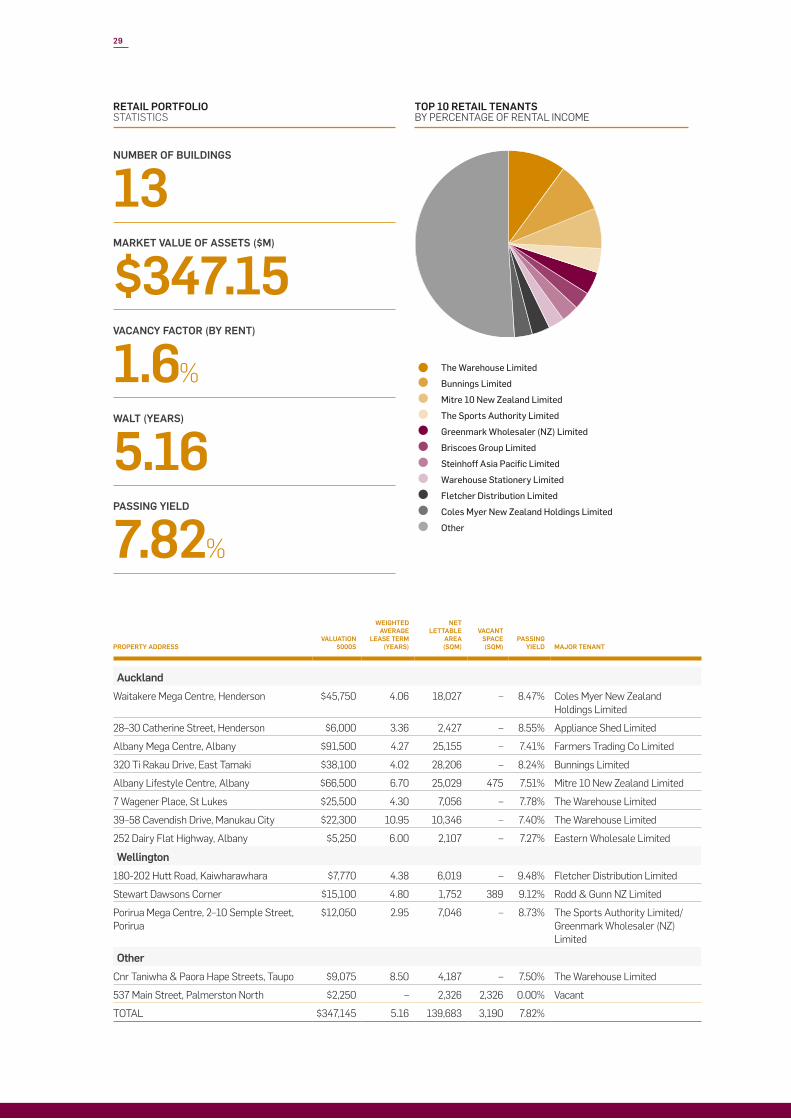
RETAIL PORTfOLIO STATISTICS
NuMBER Of BuILDINGS
13MARkET vALuE Of ASSETS ($M)
$347.15vACANCY fACTOR (BY RENT)
1.6%WALT (YEARS)
5.16PASSING YIELD
7.82%
TOP 10 RETAIL TENANTSBy PERCENTAgE Of RENTAL INCOME
the Warehouse Limited
Bunnings Limited
Mitre 10 New Zealand Limited
the Sports Authority Limited
Greenmark Wholesaler (NZ) Limited
Briscoes Group Limited
Steinhoff Asia pacific Limited
Warehouse Stationery Limited
Fletcher Distribution Limited
Coles Myer New Zealand Holdings Limited
other
PROPERTY ADDRESSvALuATION
$000S
WEIGHTED AvERAGE
LEASE TERM (YEARS)
NET LETTABLE
AREA (SQM)
vACANT SPACE (SQM)
PASSING YIELD MAJOR TENANT
Auckland
Waitakere Mega Centre, Henderson $45,750 4.06 18,027 – 8.47% Coles Myer New Zealand Holdings Limited
28–30 Catherine Street, Henderson $6,000 3.36 2,427 – 8.55% Appliance Shed Limited
Albany Mega Centre, Albany $91,500 4.27 25,155 – 7.41% farmers Trading Co Limited
320 Ti Rakau Drive, East Tamaki $38,100 4.02 28,206 – 8.24% Bunnings Limited
Albany Lifestyle Centre, Albany $66,500 6.70 25,029 475 7.51% Mitre 10 New Zealand Limited
7 Wagener Place, St Lukes $25,500 4.30 7,056 – 7.78% The Warehouse Limited
39–58 Cavendish Drive, Manukau City $22,300 10.95 10,346 – 7.40% The Warehouse Limited
252 Dairy flat Highway, Albany $5,250 6.00 2,107 – 7.27% Eastern Wholesale Limited
Wellington
180-202 Hutt Road, Kaiwharawhara $7,770 4.38 6,019 – 9.48% fletcher Distribution Limited
Stewart Dawsons Corner $15,100 4.80 1,752 389 9.12% Rodd & gunn NZ Limited
Porirua Mega Centre, 2–10 Semple Street, Porirua
$12,050 2.95 7,046 – 8.73% The Sports Authority Limited/ greenmark Wholesaler (NZ) Limited
Other
Cnr Taniwha & Paora Hape Streets, Taupo $9,075 8.50 4,187 – 7.50% The Warehouse Limited
537 Main Street, Palmerston North $2,250 – 2,326 2,326 0.00% Vacant
TOTAL $347,145 5.16 139,683 3,190 7.82%

CASE STuDY – STOuT STREET
30
ARGOSY PROPERTY LIMITED | ANNUAL REPORT 2014
The former Defence House at 15 Stout Street is a landmark Wellington office building that was constructed in 1939 and has been listed by the New Zealand Historic Places Trust with a Category 2 rating.
Built in the Art Deco style, the building utilised a concrete-encased structural steel frame, honed New Zealand stone cladding panels and solid bronze operable windows. The property is located in the heart of Wellington’s CBD with close proximity to Lambton Quay and Parliament buildings.
Argosy purchased the building in July 2013 for $33.2 million and is currently in the process of upgrading the property. The entire upgrade of the building is expected to cost $46.6 million and is expected to be completed in July 2014.
The building is being refurbished to accommodate the Ministry of Business, Innovation and Employment (MBIE) with a 12-year lease on a gross basis with rent reviews to market.
At the time of construction, 15 Stout Street was the biggest office building ever built in Wellington with the purpose of easing the pressure on office accommodation for the government services sector in the city.
The building was designed by Architect John Mair and built by Fletcher Construction. It is adjacent to two other Argosy-owned properties (46 Waring Taylor Street and Te Puni Ko-kiri House). The building comprises 19,629 sqm of net lettable area, over ten levels (including the basement) and 25 carparks.
REfuRBISHMENTThe building has had various upgrades over the years with the last major refurbishment occurring in 1985/86. The interior of the building has been completely stripped for a total refurbishment. The architectural design for the building will provide an environment consistent with the latest standards in workplace design, while at the same time recognising the special heritage character of the original building.
The addition of a new central glazed atrium that is open to each floor will transform the building’s interior, providing good natural light penetration onto each level.
NET LETTABLE AREA SQM
19,629LEvELS
10NATIONAL BuILDING STANDARD COMPLIANCE
100%

31
GREEN STARThere is a high demand for environmentally sustainable accommodation and being able to provide this is an important part of Argosy’s environmental and building management policies. To this end, the Company has targeted a 5-star built New Zealand Green Star rating at 15 Stout Street without first attaining a design rating, as the built rating signifies a greater, more meaningful commitment to sustainability. This allowed Argosy to provide the benefits of a new building together with the character of the existing heritage building.
All parties involved have focused on energy efficiency which results in lower emissions while providing occupants with a premium working environment. This partnership process will allow Argosy to provide the benefits of a new building with the reliability and character of the existing one, at a competitive rental.
fEATuRESThe building will have new electronically commutated fan coil units, which are similar to the fan coil units used at the Te Puni Ko-kiri building, however these units have been assembled locally within New Zealand.
Two new air-cooled chillers will be installed to provide cooled water for the air-conditioning system. The old gas control boilers will be replaced with energy-efficient condensing boilers that will match the occupancy demand of the building. This will reduce excess heating and energy wastage. These items of plant have been designed so that should a chiller or boiler fail, the building can maintain 65% of the total building load.
Air-to-air heat recovery has been installed; this process allows for the incoming air to be tempered and less energy is required to heat or cool the air.
The occupancy sensors will ensure the lights are in operation only when the space is occupied. The new energy-efficient light fittings with high light dispersion will provide even light levels across each floor. Lights along the perimeter of the building are controlled with daylight sensors. When it is bright and sunny outside, these lights will dim to save power, recognising there is sufficient light coming in through the windows.
A new suspended ceiling grid and acoustic tiles will be installed which absorb sound and reflect light, to provide a light and open feel to the space. The new carpet tiles are an environmentally friendly product also.
There are eight passenger lifts in the building; six are from the original set and two new lifts have been installed to increase the lifting capacity to an A grade quality.
STRuCTuRAL STRENGTHThe structural integrity of any building in the Wellington region is of the utmost importance to both the building owner and the tenant.
The building has been constructed using a steel frame with welded joints. The building was physically tested for its seismic strength with certain sections being stretched with
hydraulic jacks to assess the stress points of the frame. The results confirmed that the building far exceeded the current seismic code and testing was stopped when it reached 180% of the new building standard.
The property at 15 Stout Street, Wellington is now one of Argosy’s premier properties with MBIE being the portfolio’s second largest tenant. The building's valuation at 31 March 2014 was $70.1 million with an expected valuation at completion of $86.6 million. This will give the property a passing yield on end valuation of 7.5%.
“The results of the seismic testing confirmed that the building far exceeded the current seismic code and testing was stopped when it reached 180% of the new building standard.”

CONTENTS
Statement of Financial Position 33
Statement of Comprehensive Income 34
Statement of Changes in Equity 35
Statement of Cash Flows 36
Notes to the Financial Statements 37
Auditor’s Report 67
STATEMENTS
FINANCIAL

ARGOSY PROPERTY LIMITED | ANNUAL REPORT 2014
FINANCIAL STATEMENTS
33
STaTEmENT Of fiNaNCial POSiTiONAs At 31 MArch 2014
The notes to the accounts form part of and are to be read in conjunction with these financial statements.
Note
Group2014
$000s
Company2014
$000s
Group 2013
$000s
Company2013
$000s
Non-current assetsInvestment properties 5 1,226,266 – 976,862 – Other non-current assets 7 103 903,003 411 733,500 Derivative financial instruments 6 1,818 1,818 – – Investment in subsidiary 28 – 20,000 – 20,000 Deferred tax 21 – 2,736 – 4,285 Total non-current assets 1,228,187 927,557 977,273 757,785
Current assetscash and cash equivalents 1,294 8 2,265 101 trade and other receivables 8 1,747 8 1,267 – Other current assets 9 367 118 299 96 Derivative financial instruments 6 159 159 – –taxation receivable – – 4,858 –
3,567 293 8,689 197
Non-current assets classified as held for sale 10 634 – 6,787 – Total current assets 4,201 293 15,476 197 Total assets 1,232,388 927,850 992,749 757,982
Shareholders’ fundsshare capital 11 754,453 754,453 658,824 658,824 hedging reserves 12 (1,758) (1,758) (4,257) (4,257)retained earnings/(accumulated losses) 13 (13,173) (298,426) (53,230) (275,529)Total shareholders’ funds 739,522 454,269 601,337 379,038
Non-current liabilitiesBorrowings 14 447,654 447,654 326,045 326,045 Derivative financial instruments 6 397 397 41,115 41,115 Deferred tax 21 22,089 – 13,259 – Total non-current liabilities 470,140 448,051 380,419 367,160
Current liabilitiestrade and other payables 15 8,790 2,573 9,379 2,426 Derivative financial instruments 6 11,057 11,057 – –Other current liabilities 16 2,321 8,408 1,614 9,168 taxation payable 558 3,492 – 190 Total current liabilities 22,726 25,530 10,993 11,784 Total liabilities 492,866 473,581 391,412 378,944 Total shareholders’ funds and liabilities 1,232,388 927,850 992,749 757,982
For and on behalf of the Board
P Michael Smith Trevor ScottDirector Director
Date: 20 May 2014

ARGOSY PROPERTY LIMITED | ANNUAL REPORT 2014
FINANCIAL STATEMENTS
34
STaTEmENT Of COmPrEhENSivE iNCOmEFOr the yeAr eNDeD 31 MArch 2014
The notes to the accounts form part of and are to be read in conjunction with these financial statements.
Note
Group2014
$000s
Company2014
$000s
Group 2013
$000s
Company2013
$000s
Gross property income from rentals 87,881 – 72,913 – Gross property income from expense recoveries 17,097 – 15,349 – Property expenses (22,760) – (18,396) – Net property income 4 82,218 – 69,866 – recharges charged to subsidiaries 28 – 36,165 – 21,511 Other income 17 – – – 3,065 Total income 82,218 36,165 69,866 24,576
Administration expenses 18 7,401 1,477 6,678 2,158 corporatisation related costs – – 78 78 Total expenses before financial income/(expenses)
and other gains/(losses) 7,401 1,477 6,756 2,236 Profit before financial income/(expenses) and other
gains/(losses) 74,817 34,688 63,110 22,340
Financial income/(expense)Interest expense 19 (25,354) (25,354) (23,682) (23,682)Gain/(loss) on derivative financial instruments
held for trading 20,561 20,561 (4,735) (4,735)transfer from hedge reserve 12 (3,471) (3,471) (3,674) (3,674)Finance income 125 31 99 2
(8,139) (8,233) (31,992) (32,089)Other gains/(losses)revaluation gains on investment property 5 33,488 – 9,344 – realised losses on disposal 5 (1,363) – (1,812) – 32,125 – 7,532 –
Profit/(loss) before income tax attributable
to shareholders 98,803 26,455 38,650 (9,749)taxation (credit)/expense 20 13,253 3,859 (505) 19,980 Profit/(loss) for the year attributable to shareholders 85,550 22,596 39,155 (29,729)
Other comprehensive incomeMovement in cash flow hedge reserve 12 3,471 3,471 3,674 3,674 Income tax expense relating to other comprehensive income 20 (972) (972) (1,028) (1,028)Total other comprehensive income after tax 2,499 2,499 2,646 2,646 Total comprehensive income/(loss) after tax 88,049 25,095 41,801 (27,083)
All amounts are from continuing operationsEarnings per shareBasic and diluted earnings per share (cents) 23 11.45 6.69

ARGOSY PROPERTY LIMITED | ANNUAL REPORT 2014
FINANCIAL STATEMENTS
35
STaTEmENT Of ChaNGES iN EquiTyFOr the yeAr eNDeD 31 MArch 2014
The notes to the accounts form part of and are to be read in conjunction with these financial statements.
Note
Group2014
$000s
Company2014
$000s
Group 2013
$000s
Company2013
$000s
Shareholders’ funds at the beginning of the year 601,337 379,038 488,446 335,031
Profit/(loss) for the year 85,550 22,596 39,155 (29,729)Movement in cash flow hedge reserve 2,499 2,499 2,646 2,646 Total comprehensive income for the year 88,049 25,095 41,801 (27,083)
Contributions by shareholdersIssue of shares from Dividend reinvestment Plan 11 11,488 11,488 7,929 7,929 Issue of shares from rights Offer 11 86,911 86,911 – – Issue of shares from share Purchase Plan 11 – – 20,000 20,000 Issue of shares from Placement 11 – – 80,000 80,000 Issue costs of shares 11 (2,770) (2,770) (1,427) (1,427)Dividends to shareholders 13 (45,493) (45,493) (35,412) (35,412)Shareholders’ funds at the end of the year 739,522 454,269 601,337 379,038

ARGOSY PROPERTY LIMITED | ANNUAL REPORT 2014
FINANCIAL STATEMENTS
36
STaTEmENT Of CaSh flOwSFOr the yeAr eNDeD 31 MArch 2014
Note
Group2014
$000s
Company2014
$000s
Group 2013
$000s
Company2013
$000s
Cash flows from operating activities Cash was provided from: Property income 100,020 – 84,799 – Interest received 125 30 201 2 Proceeds from insurance – – 9,928 – taxation refund 20 20 146 –
Cash was applied to: Property expenses (19,087) – (17,899) – Interest paid (24,564) (26,814) (23,236) (27,303)employee benefits (4,055) – (3,018) – Acquisition investigation costs (72) – (854) (739)corporatisation related costs – – (301) (301)Other expenses (2,277) (791) (2,474) (1,320)
Net cash from/(used in) operating activities 22 50,110 (27,555) 47,292 (29,661)
Cash flows from investing activities Cash was provided from: sale of properties 17,268 – 24,725 –
Cash was applied to: capital additions on investment properties (65,834) – (15,577) – capitalised interest on investment property (2,250) – (4,068) – Purchase of properties (159,587) – (65,152) – Advances to subsidiaries – (131,850) – –Net cash from/(used in) investing activities (210,403) (131,850) (60,072) –
Cash flows from financing activities Cash was provided from: Debt drawdown 234,507 234,507 105,700 105,700Advances from subsidiaries – – – 15,578capital raised from Placement and share Purchase Plan – – 100,000 100,000capital raised from rights Issue 86,911 86,911 – –
Cash was applied to: repayment of debt (113,667) (113,667) (161,577) (161,577)Dividends paid to shareholders net of reinvestments (33,994) (34,004) (27,861) (27,485)Issue cost of shares (2,766) (2,766) (1,417) (1,417)Facility refinancing fee (592) (592) (1,085) (1,085)swap contract termination payments (11,077) (11,077) – –Net cash (used in)/from financing activities 159,322 159,312 13,760 29,714
Net increase/(decrease) in cash and cash equivalents (971) (93) 980 53 cash and cash equivalents at the beginning of the year 2,265 101 1,285 48 Cash and cash equivalents at the end of the year 1,294 8 2,265 101
The notes to the accounts form part of and are to be read in conjunction with these financial statements.

ARGOSY PROPERTY LIMITED | ANNUAL REPORT 2014
FINANCIAL STATEMENTS
37
NOTES TO ThE fiNaNCial STaTEmENTS
1. rEPOrTiNG ENTiTy
Argosy Property Limited (APL or the Company) is an issuer for the purpose of the Financial Reporting Act 1993. APL is incorporated and domiciled in New Zealand.
The company’s principal activity is investment in properties which include office, retail and industrial properties throughout New Zealand.
On 30 June 2012, Argosy Property Investments Limited, Argosy Property No.4 Limited, Argosy Property Holdings Limited and Argosy Property No. 6 Limited were amalgamated into Argosy Property No.1 Limited (AP No.1). On that date, all assets, liabilities, property, rights, powers and privileges of the amalgamating companies were vested in AP No.1, being the amalgamated company. The shares in Argosy Property No.3 Limited (AP No.3) transferred to AP No.1 and therefore AP No.3 is a subsidiary of AP No.1 after amalgamation.
These financial statements include those of APL and its subsidiaries (the Group).
2. BaSiS Of PrEParaTiON
Statement of compliance
These financial statements have been prepared in accordance with Generally Accepted Accounting Practice in New Zealand (NZ GAAP). The accounting policies applied in these financial statements comply with New Zealand equivalents to International Financial Reporting Standards (NZ IFRS) and other applicable Financial Reporting Standards issued and effective at the time of preparing these statements as applicable to the Company as a profit-oriented entity. The Company and Group financial statements also comply with International Financial Reporting Standards (IFRS).
Basis of measurement
The financial statements have been prepared on the historical cost basis except for derivative financial instruments and investment properties which are measured at fair value.
use of estimates and judgements
The preparation of financial statements in conformity with NZ IFRS requires the use of certain critical accounting estimates that affect the application of policies and reported amount of assets and liabilities, income and expenses. The areas involving a higher degree of judgement or complexity, or areas where assumptions and estimates are significant to the financial statements are as follows:
Note 5 – Valuation of investment property Note 6 – Valuation of derivative financial instruments Note 21 – Deferred tax (and Taxation in Note 20)
functional and presentation currency
These financial statements are presented in New Zealand dollars which is the Group’s functional currency and have been rounded to the nearest thousand dollars ($000).
These financial statements were approved by the Board of Directors on 20 May 2014.
3. SiGNifiCaNT aCCOuNTiNG POliCiES
Change in accounting policies
The following new accounting policies are effective and have been applied by Argosy Property Limited for the period to 31 March 2014:
NZ IFRS 13 Fair Value Measurement
This standard establishes a single framework for measuring fair value, which takes into account the assumptions that market participants would use when pricing an asset or liability, including assumptions about risk.
Counterparty credit risk adjustments are applied to all over-the-counter derivatives. Own credit risk adjustments are applied to reflect the Group’s own credit risk when valuing derivatives. Bilateral credit-risk adjustments consider the expected cash flows between the Group and its counterparties under the relevant terms of the derivative instruments and the effect of the credit-risk profile of the counterparties on the valuation of these cash flows.
This change in methodology has resulted in a $235,000 reduction in the liability for derivative financial instruments as at 31 March 2014.
NZ IAS 19 Employee Benefits
The amendments to NZ IAS 19 changes the distinction between short and other long term employee benefits. The revised definition of short term employee benefits are employee benefits (other than termination benefits) that are expected to be settled wholly before twelve months after the end of the annual reporting period in which the employees render the related services. The impact of this Standard was not material.
Basis of consolidation
The Group’s financial statements incorporate the financial statements of APL and its controlled subsidiaries as set out in Note 25. Control is achieved when the Company has power over the investee; is exposed, or has rights, to variable returns from its involvement with the investee, and has the ability to use its power to affect its returns. The results of the subsidiaries are included in the consolidated statement of comprehensive income from the date of acquisition which is the date the Company became entitled to income from the subsidiaries acquired. All significant intercompany transactions are eliminated on consolidation.

ARGOSY PROPERTY LIMITED | ANNUAL REPORT 2014
Notes to the fiNaNcial statemeNts (CONTiNued)
fiNaNcial statemeNts
38
3. SiGNifiCaNT aCCOuNTiNG POliCiES (cONtINUeD)
investment properties
Investment property is property held either to earn rental income, for capital appreciation or for both. Investment property is initially measured at cost and subsequently measured at fair value with any change therein recognised in profit or loss. When the use of a property changes such that it is reclassified as property, plant and equipment, its fair value at the date of reclassification becomes its cost for subsequent accounting. Initial direct costs incurred in negotiating and arranging operating leases and lease incentives granted are added to the carrying amount of the leased asset.
In accordance with the valuation policy of the Group complete property valuations are carried out at least annually by independent registered valuers. The valuation policy stipulates that the same valuer may not value a building for more than two consecutive years. The fair values are based on market values being the estimated amount for which a property could be exchanged on the date of the valuation between a willing buyer and a willing seller in an arm’s length transaction after proper marketing wherein the parties had each acted knowledgeably, prudently and without compulsion.
The valuations are prepared using a weighted combination of the Capitalisation of Contract Income, Capitalisation of Market Income and Discounted Cash Flow methodology, which is based on the estimated rental cash flows expected to be received from the property adjusted by a discount rate that appropriately reflects the risks inherent in the expected cash flows.
Investment properties are derecognised when they have been disposed of and any gains or losses incurred on disposal are recognised in profit or loss in the year of derecognition.
Borrowing costs directly attributable to property under development are capitalised as part of the cost of those assets.
Property, plant and equipment
All property, plant and equipment is stated at historical cost less depreciation and accumulated impairment losses. Historical cost includes expenditure that is directly attributable to the acquisition of the items.
impairment
At the end of each reporting period, the Group reviews the carrying amounts of its tangible and intangible assets to determine whether there is any indication that those assets have suffered an impairment loss. If any such indication exists, the recoverable amount of the
asset is estimated in order to determine the extent of the impairment loss (if any). Where it is not possible to estimate the recoverable amount of an individual asset, the Group estimates the recoverable amount of the cash-generating unit to which the asset belongs.
If the recoverable amount of an asset (or cash-generating unit) is estimated to be less than its carrying amount, the carrying amount of the asset (or cash-generating unit) is reduced to its recoverable amount. An impairment loss is recognised immediately in profit or loss.
Non-current assets held for sale
Non-current assets are classified as held for sale if their carrying amount will be recovered principally through a sale transaction rather than through continuing use. This condition is regarded as met only when the sale is highly probable and the asset (or disposal group) is available for immediate sale in its present condition.
Non-current assets classified as held for sale (principally investment property) are measured at the lower of their previous carrying amount and fair value.
Statement of cash flows
The statement of cash flows is prepared on a GST exclusive basis, which is consistent with the statement of comprehensive income.
The following terms are used in the statement of cash flows:
Operating activities are the principal revenue producing activities of the Group and other activities that are not investing or financing activities.
investing activities are the acquisition and disposal of long term assets and other investments not included in cash equivalents.
financing activities are activities that result in changes in the size and composition of the contributed equity and borrowings of the entity. Termination payments for swap contracts, establishment fees, extension fees and arranger fees are considered financing activities as they effect a change in the company’s borrowing arrangements.
financial instruments
Non-derivative financial instruments
Non-derivative financial instruments comprise investments, trade and other receivables, cash and cash equivalents, borrowings and trade and other payables.
Non-derivative financial instruments are recognised and derecognised on trade date when the purchase or sale of an investment is under a contract whose terms require delivery of the financial instrument within the timeframe established by the market concerned, and are initially measured at fair value plus, for instruments not at fair value through profit or loss, any directly attributable transaction costs.

ARGOSY PROPERTY LIMITED | ANNUAL REPORT 2014
Notes to the fiNaNcial statemeNts (CONTiNued)
fiNaNcial statemeNts
39
Measurement
Except for derivatives (interest rate swaps), financial instruments are initially measured at fair value plus directly attributable costs. Subsequently these instruments are measured at amortised cost using the effective interest method.
Derivatives are, initially and subsequently, measured at fair value.
Cash and cash equivalents
Cash and cash equivalents comprise cash balances and demand deposits. Bank overdrafts that are repayable on demand and form an integral part of the Group’s cash management are included as a component of cash and cash equivalents for the purpose of the statement of cash flows.
Trade and other receivables
Trade and other receivables are recognised initially at fair value and subsequently measured at amortised cost using the effective interest method, less provision for impairment. A provision for impairment of trade receivables is established when there is objective evidence that the Group will not be able to collect all amounts due according to the original terms of the receivables. The amount of the provision is the difference between the asset’s carrying amount and the present value of estimated future cash flows, discounted at the original effective interest rate.
Trade and other payables
Trade and other payables are recognised initially at fair value and subsequently measured at amortised cost using the effective interest method.
Bank borrowings
Interest-bearing bank loans and overdrafts are initially measured at fair value net of transaction costs. Subsequent to initial recognition, borrowings are measured at amortised cost with any difference being recognised in profit or loss over the period of the borrowing using the effective interest method.
Fair value estimation
The fair value of interest rate swaps is based on valuation techniques that use market observable inputs. Note 6 of these financial statements provides information on the key observable inputs that management have applied in reaching their estimates of the fair values of interest rate swaps and also provides a sensitivity analysis detailing the potential future impacts of reasonably possible changes in those observable inputs over the next financial period.
The carrying values of the other financial instruments are a reasonable approximation of their fair values.
Derivative financial instruments
Interest rate swaps are entered into to manage interest rate exposure. For interest rate swaps, the net differential paid or received is recognised as a component of interest expense in the profit or loss.
Interest rate swaps are initially recognised at zero at the date a derivative contract is entered into and are subsequently remeasured to their fair value at subsequent reporting dates. The resulting gain or loss is recognised in profit or loss immediately.
Interest rate swaps are presented as a non-current asset or a non-current liability if the remaining maturity of the instrument is more than 12 months and it is not expected to be realised or settled within 12 months. Other interest rate swaps are presented as current assets or current liabilities.
Hedge accounting
The Company and Group no longer apply hedge accounting. However, the cumulative gains and losses relating to derivatives that were previously designated as effective hedges are recognised in profit or loss when the forecast transactions are ultimately recognised. When a forecast transaction is no longer expected to occur, the cumulative gains and losses that were previously recognised in equity are recognised immediately in profit or loss.
financial income and expenses
Finance income comprises interest income using the effective interest method. The effective interest method is a method of calculating the amortised cost of a financial asset or financial liability and of allocating interest income over the relevant period (including all fees and points paid or received between the parties to the contract that form an integral part of the effective interest rate, transaction costs and other premiums or discounts) through the expected life of the financial instrument, or, where appropriate, a shorter period to the net carrying amount of the financial instrument.
Finance expenses comprise interest expense on borrowings and unrealised gains and losses on hedging instruments that are recognised in profit or loss.
Interest expense on borrowings is recognised using the effective interest method.

ARGOSY PROPERTY LIMITED | ANNUAL REPORT 2014
Notes to the fiNaNcial statemeNts (CONTiNued)
fiNaNcial statemeNts
40
3. SiGNifiCaNT aCCOuNTiNG POliCiES (cONtINUeD)
leases
Leases are classified as finance leases whenever the terms of the lease transfer substantially all the risks and rewards of ownership to the lessee. All other leases are classified as operating leases.
APL has entered into commercial property leases on its investment properties. APL has determined that it retains all significant risks and rewards of ownership of these properties and has thus classified these leases as operating leases.
The Group as lessor
Amounts due from leases under finance leases are recorded as receivables at the amount of the Group’s net investment in the leases. Finance lease income is allocated to accounting periods so as to reflect a constant periodic rate of return on the Group’s net investment outstanding in respect of the leases.
Rental income from operating leases is recognised on a straight-line basis over the term of the relevant lease. Initial direct costs incurred in negotiating and arranging an operating lease are added to the carrying amount of the leased asset and recognised on a straight-line basis over the lease term.
In the event that lease incentives are paid to enter into the operating leases, such incentives are recognised as an asset. The aggregate cost of incentives is recognised as a reduction of rental revenue on a straight-line basis, except where another systematic basis is more representative of the time pattern in which economic benefits from the leased asset are consumed.
The Group as lessee
Assets held under finance leases are initially recognised as assets of the Group at their fair value at the inception of the lease or, if lower, at the present value of the minimum lease payments. The corresponding liability to the lessor is included in the statement of financial position as a finance lease obligation.
Lease payments are apportioned between finance charges and reduction of the lease obligation so as to achieve a constant rate of interest on the remaining balance of the liability. Finance charges are charged directly to profit or loss, unless they are directly attributable to qualifying assets, in which case they are capitalised in accordance with the Group’s general policy on borrowing costs. Contingent rentals are recognised as expenses in the periods in which they are incurred.
Operating lease payments are recognised as an expense on a straight-line basis over the lease term, except where another systematic basis is more representative of the time pattern in which economic benefits from the leased asset are consumed. Contingent rentals arising under operating leases are recognised as an expense in the period in which they are consumed.
recognition of other income
Dividend revenue from investments is recognised when the Group’s right to receive the payment has been established.
Management fees are recognised in the period in which the services are performed.
Employee Benefits
A provision is recognised for benefits accruing to employees in respect of annual leave, long service leave and sick leave when it is probable that settlement will be required and they are capable of being measured reliably.
Provisions made in respect of employee benefits expected to be settled within 12 months are measured at their nominal values using the remuneration rate expected to apply at the time of settlement. Provisions made in respect of employee benefits which are not expected to be settled within 12 months are measured as the present value of the estimated future outflows to be made by the Group in respect of services provided by employees up to the reporting date.

ARGOSY PROPERTY LIMITED | ANNUAL REPORT 2014
Notes to the fiNaNcial statemeNts (CONTiNued)
fiNaNcial statemeNts
41
Taxation
Income tax expense
Income tax expense comprises current and deferred tax. Income tax expense is recognised in profit or loss except to the extent that it relates to items recognised directly in equity, in which case it is recognised in equity.
Current tax
Current tax is the expected tax payable on the taxable income for the year, using tax rates enacted or substantively enacted at the reporting date, and any adjustment to tax payable in respect of previous years.
Deferred tax
Deferred tax is recognised on temporary differences between the carrying amount of assets and liabilities in the financial statements and the corresponding tax bases used in the computation of taxable profit, and is accounted for using the balance sheet liability method. Deferred tax liabilities are generally recognised for all taxable temporary differences and deferred tax assets are recognised to the extent that it is probable that taxable profits will be available against which deductible temporary differences can be utilised. Such assets and liabilities are not recognised if the temporary difference arises from goodwill or from the initial recognition (other than in a business combination) of other assets and liabilities in a transaction that affect neither the taxable profit nor the accounting profit.
Deferred tax is calculated at the tax rates that are expected to apply in the period when the liability is settled or the asset realised.
Under NZ IAS 12, the measurement of deferred tax liabilities and deferred tax assets depends on whether an entity expects to recover an asset by using it or by selling it and includes a presumption that an investment property is recovered entirely through sale unless all of its useful life will be consumed.
Standards and interpretations in issue not yet effective
At the date of authorisation of these financial statements the following relevant Standards and Interpretations were in issue but not yet effective and have not been applied in preparing these financial statements. The impact of the following Standards has not yet been assessed.
NZ IFRS 9 Financial Instruments (effective for accounting periods beginning on or after 1 January 2017) introduces a new classification and measurement regime for financial assets and liabilities.
NZ IFRIC 21 Levies (effective for accounting periods beginning on or after 1 January 2014) provides guidance on when to recognise a liability for a levy imposed by a government.
Other Standards and Interpretations in issue but not yet effective are not expected to have an impact in the financial statements of the Group in the period of initial application.
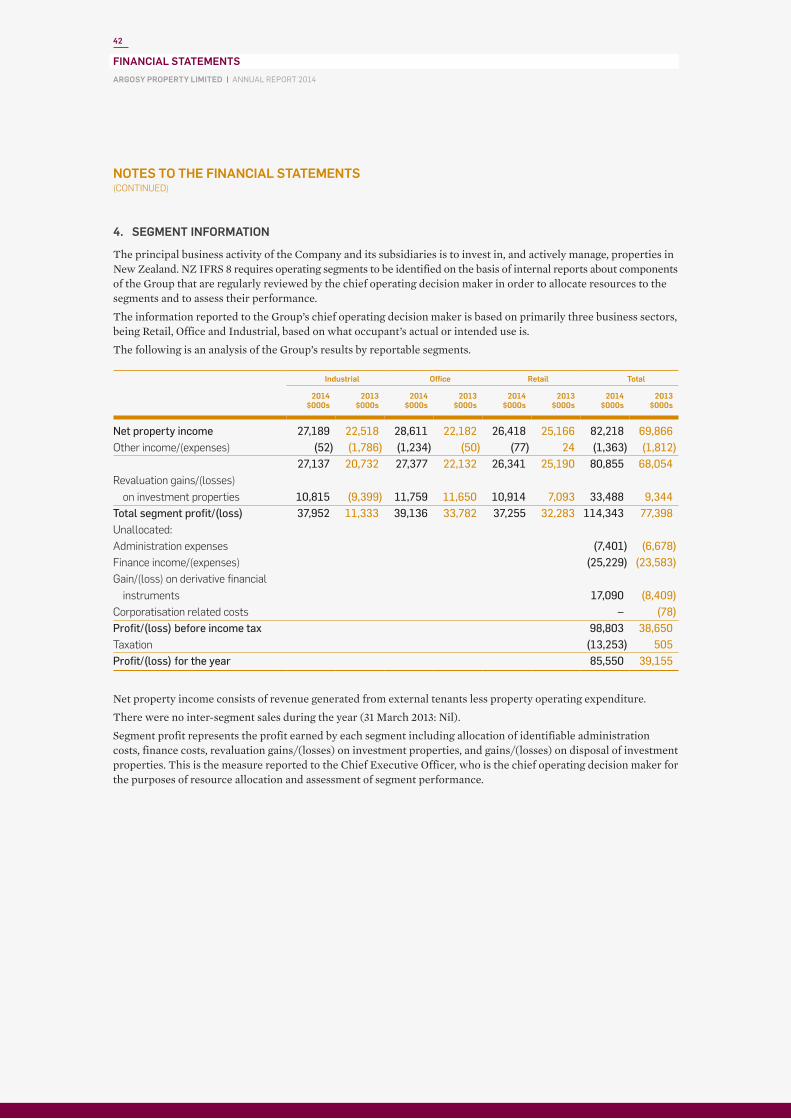
ARGOSY PROPERTY LIMITED | ANNUAL REPORT 2014
Notes to the fiNaNcial statemeNts (CONTiNued)
fiNaNcial statemeNts
42
4. SEGmENT iNfOrmaTiON
The principal business activity of the Company and its subsidiaries is to invest in, and actively manage, properties in New Zealand. NZ IFRS 8 requires operating segments to be identified on the basis of internal reports about components of the Group that are regularly reviewed by the chief operating decision maker in order to allocate resources to the segments and to assess their performance.
The information reported to the Group’s chief operating decision maker is based on primarily three business sectors, being Retail, Office and Industrial, based on what occupant’s actual or intended use is.
The following is an analysis of the Group’s results by reportable segments.
industrial Office retail Total
2014$000s
2013$000s
2014$000s
2013$000s
2014$000s
2013$000s
2014$000s
2013$000s
Net property income 27,189 22,518 28,611 22,182 26,418 25,166 82,218 69,866 Other income/(expenses) (52) (1,786) (1,234) (50) (77) 24 (1,363) (1,812)
27,137 20,732 27,377 22,132 26,341 25,190 80,855 68,054 revaluation gains/(losses)
on investment properties 10,815 (9,399) 11,759 11,650 10,914 7,093 33,488 9,344 Total segment profit/(loss) 37,952 11,333 39,136 33,782 37,255 32,283 114,343 77,398 Unallocated:Administration expenses (7,401) (6,678)Finance income/(expenses) (25,229) (23,583)Gain/(loss) on derivative financial
instruments 17,090 (8,409)corporatisation related costs – (78)Profit/(loss) before income tax 98,803 38,650 taxation (13,253) 505 Profit/(loss) for the year 85,550 39,155
Net property income consists of revenue generated from external tenants less property operating expenditure.
There were no inter-segment sales during the year (31 March 2013: Nil).
Segment profit represents the profit earned by each segment including allocation of identifiable administration costs, finance costs, revaluation gains/(losses) on investment properties, and gains/(losses) on disposal of investment properties. This is the measure reported to the Chief Executive Officer, who is the chief operating decision maker for the purposes of resource allocation and assessment of segment performance.

ARGOSY PROPERTY LIMITED | ANNUAL REPORT 2014
Notes to the fiNaNcial statemeNts (CONTiNued)
fiNaNcial statemeNts
43
industrial Office retail Total
2014$000s
2013$000s
2014$000s
2013$000s
2014$000s
2013$000s
2014$000s
2013$000s
Segment assetscurrent assets 693 506 801 469 449 524 1,943 1,499 Investment properties 441,781 311,381 437,340 336,341 347,145 329,140 1,226,266 976,862 Non-current assets classified
as held for sale 634 863 – – – 5,924 634 6,787 Total segment assets 443,108 312,750 438,141 336,810 347,594 335,588 1,228,843 985,148 Unallocated assets: 3,545 7,601 Total assets 1,232,388 992,749
industrial Office retail Total
2014$000s
2013$000s
2014$000s
2013$000s
2014$000s
2013$000s
2014$000s
2013$000s
Segment liabilitiescurrent liabilities 1,033 991 5,119 5,985 752 550 6,904 7,526 Total segment liabilities 1,033 991 5,119 5,985 752 550 6,904 7,526 Unallocated liabilities 485,962 383,886 Total liabilities 492,866 391,412
For the purposes of monitoring segment performance and allocating resources between segments:
– all assets are allocated to reportable segments other than cash and cash equivalents, derivatives, tax assets, other non-current assets and other minor current assets that cannot be allocated to particular segments.
– all liabilities are allocated to reportable segments other than borrowings, derivatives, current tax, deferred tax liabilities, and other minor current liabilities that cannot be allocated to particular segments.

ARGOSY PROPERTY LIMITED | ANNUAL REPORT 2014
Notes to the fiNaNcial statemeNts (CONTiNued)
fiNaNcial statemeNts
44
5. iNvESTmENT PrOPErTiES
industrial2014
$000s
Office2014
$000s
retail2014
$000s
Group2014
$000s
Group2013
$000s
Movement in investment propertiesBalance at 1 April 308,560 333,186 327,437 969,183 898,823 Acquisition of properties 112,191 55,904 2,309 170,404 65,152 capitalised costs 7,052 41,462 5,076 53,590 29,171 Disposals – (11,275) – (11,275) (25,112)transfer to properties held for sale (634) – – (634) (8,195)change in fair value 10,815 11,759 10,914 33,488 9,344 Balance at 31 March 437,984 431,036 345,736 1,214,756 969,183
Deferred initial direct costs/lease incentivesBalance at 1 April 2,821 3,155 1,703 7,679 6,426 change during the year 976 3,149 (294) 3,831 1,253 Balance at 31 March 3,797 6,304 1,409 11,510 7,679 Total investment properties 441,781 437,340 347,145 1,226,266 976,862
Fair value measurements are categorised into level 1, 2 or 3 based on the degree to which the inputs to the fair value measurements are observable and the significance of the inputs to the fair value measurement in its entirety, which are described as follows: - Level 1 inputs are quoted prices (unadjusted) in active markets for identical assets or liabilities that the entity
can access at the measurement date; - Level 2 inputs are inputs, other than quoted prices included within level 1, that are observable for the asset or
liability, either directly or indirectly; and - Level 3 inputs are unobservable inputs for the asset or liability.
Investment properties are classified as level 3 under the fair value hierarchy on the basis that adjustments must be made to observable data of similar properties to determine the fair value of an individual property.
Deferred initial direct costs/lease incentives
This amount represents costs incurred with the negotiation of operating leases for the Group’s investment property portfolio and which are being amortised over the term of those leases.
The Group holds the freehold to all investment properties other than 39 Market Place, Auckland.

ARGOSY PROPERTY LIMITED | ANNUAL REPORT 2014
Notes to the fiNaNcial statemeNts (CONTiNued)
fiNaNcial statemeNts
45
Properties purchased and disposed of during the year are as follows:
Group2014
$000s
Company2014
$000s
Group2013
$000s
Company2013
$000s
Acquisition of properties15 stout street, Wellington 33,616 – – – 101 carlton Gore road, Newmarket, Auckland 22,288 – – – 80–120 Favona road, Mangere, Auckland 74,036 – – – 19 Nesdale Avenue, Wiri, Auckland 38,155 – – – 50 cavendish Drive, Manukau, Auckland 2,309 – – – Waterloo Quay, Wellington – – 60,364 – cnr 252 state highway 17 & 8 Gills road, Albany, Auckland – – 4,788 –
170,404 – 65,152 –
Disposal of propertiesLot 3, 260 Oteha Valley road, Albany, Auckland1 5,924 – – – Lot 9a, Alderson Drive, Manawatu Business Park1 863 – – – 56 cawley street, ellerslie, Auckland 11,275 – – – 221 Bush road, Albany, Auckland – – 6,900 – 211 Albany highway, Auckland (Land Only) – – 752 – 205 Wakefield street, Wellington – – 4,500 – Part Lot 8, el Prado Drive, Manawatu Business Park,
Palmerston North (Land) – – 782 – Lot 10, el Prado Drive, Manawatu Business Park,
Palmerston North (Land) – – 1,039 – 3 el Prado Drive, Manawatu Business Park, Palmerston North – – 1,010 – Lot 31, el Prado Drive, Manawatu Business Park,
Palmerston North (Land) – – 7,400 – 57 Valor Drive, Palmerston North – – 2,729 –
18,062 – 25,112 – sale proceeds of properties disposed of 17,268 – 24,745 –
Net gain/(loss) on disposal (794) – (367) –
selling costs (569) – (37) – Gain/(loss) on land/buildings held for sale – – (1,408) –
total gain/(loss) on disposal (1,363) – (1,812) –
1 These properties were classified as non-current assets classified as held for sale in the prior year.

ARGOSY PROPERTY LIMITED | ANNUAL REPORT 2014
Notes to the fiNaNcial statemeNts (CONTiNued)
fiNaNcial statemeNts
46
5. iNvESTmENT PrOPErTiES (cONtINUeD)
valuation of investment properties
All investment properties were independently valued as at 31 March 2014 in accordance with the Group’s accounting policy. The valuations were prepared by independent registered valuers CBRE Limited, Colliers International New Zealand Limited, Bayleys Valuations Limited and Absolute Value Limited. The total value per valuer was as follows:
Group2014
$000s
Company2014
$000s
Group2013
$000s
Group2013
$000s
Absolute Value Limited 43,200 – 21,925 – cBre Limited 499,056 – 315,335 – colliers International New Zealand Limited 611,610 – 272,435 – Bayleys Valuations Limited 72,400 – 133,825 – Jones Lang Lasalle – – 169,610 –
1,226,266 – 913,130 –
Investment properties are stated at fair value by independent valuers supported by market evidence of property sale transactions and leasing activity. These valuations are reviewed by the Asset Management team within Argosy. The most common and accepted methods for assessing the current market value are the Capitalisation of Contract Income, Capitalisation of Market Income and the Discounted Cash Flow approaches. The major inputs and assumptions that are used in the valuation that require judgement include forecasts of the current and expected future market rentals and growth, maintenance and capital expenditure requirements, an assessment of capitalisation rates, discount rates, vacancy and leasing costs.
In deriving a market value under each approach, all assumptions are based, where possible, on market based evidence and transactions for properties with similar locations, conditions and quality of construction and fit out. The market value adopted is a weighted combination of the Capitalisation of Contract Income, Capitalisation of Market Income and Discounted Cash Flow approaches.
Principal assumptions, the methodology of which are unchanged from last year, in establishing the valuation include the capitalisation rate, occupancy and the lease term.
Generally as occupancy and weighted average lease terms increase, yields firm, resulting in increased fair values for investment properties.

ARGOSY PROPERTY LIMITED | ANNUAL REPORT 2014
Notes to the fiNaNcial statemeNts (CONTiNued)
fiNaNcial statemeNts
47
Investment property metrics for the year ended 31 March 2014 are as follows:
industrial Office retail Total
contract yield – Average 7.67% 8.36% 7.82% 7.96%– Maximum 13.11% 10.22% 9.48% 13.11%– Minimum 0.00% 7.17% 0.00% 0.00%
Market yield – Average 7.73% 8.30% 7.73% 7.93%– Maximum 14.23% 10.16% 11.89% 14.23%– Minimum 0.00% 7.15% 6.51% 0.00%
Occupancy (rent) 99.37% 98.35% 98.43% 98.71%Occupancy (net lettable area) 99.62% 97.52% 97.72% 98.73%Weighted average lease term 6.48 5.33 5.16 5.68No. of buildings¹ 35 18 13 66
Fair value total ( $000s) $441,781 $437,340 $347,145 $1,226,266
Investment property metrics for the year ended 31 March 2013 are as follows:
industrial Office retail Total
contract yield – Average 7.46% 8.40% 7.98% 7.96%– Maximum 12.51% 10.41% 8.82% 12.51%– Minimum 0.00% 6.07% 0.00% 0.00%
Market yield – Average 7.95% 8.56% 8.11% 8.22%– Maximum 12.03% 11.35% 12.26% 12.26%– Minimum 0.00% 7.53% 7.59% 0.00%
Occupancy (rent) 93.41% 96.48% 98.46% 96.19%Occupancy (net lettable area) 92.49% 95.13% 97.72% 94.52%Weighted average lease term 5.10 4.88 5.76 5.24No. of buildings¹ 33 17 13 63
Fair value total ( $000s) $311,381 $336,341 $329,140 $976,862
1 Certain titles have been consolidated and treated as one. The total number of buildings excludes properties held for sale.

ARGOSY PROPERTY LIMITED | ANNUAL REPORT 2014
Notes to the fiNaNcial statemeNts (CONTiNued)
fiNaNcial statemeNts
48
6. fiNaNCial iNSTrumENTS
The Group has the following financial instruments:
2014
Derivatives at fair value
through profit/loss
$000
loans and receivables
$000
financial liabilities at
amortised cost$000
Total$000
Financial assetscash and cash equivalents – 1,294 – 1,294 trade and other receivables – 1,747 – 1,747 Derivative financial instruments 1,977 – – 1,977
1,977 3,041 – 5,018
Financial liabilitiesBorrowings – – (447,654) (447,654)trade and other payables – – (8,790) (8,790)Derivative financial instruments (11,454) – – (11,454)Other current liabilities – – (2,321) (2,321)
(11,454) – (458,765) (470,219)
2013
Derivatives at fair value
through profit/loss
$000
loans and receivables
$000
financial liabilities at
amortised cost$000
Total$000
Financial assetscash and cash equivalents – 2,265 – 2,265 trade and other receivables – 1,267 – 1,267 Derivative financial instruments – – – –
– 3,532 – 3,532
Financial liabilitiesBorrowings – – (326,045) (326,045)trade and other payables – – (9,379) (9,379)Derivative financial instruments (41,115) – – (41,115)Other current liabilities – – (1,614) (1,614)
(41,115) – (337,038) (378,153)

ARGOSY PROPERTY LIMITED | ANNUAL REPORT 2014
Notes to the fiNaNcial statemeNts (CONTiNued)
fiNaNcial statemeNts
49
The Company has the following financial instruments:
2014
Derivatives at fair value
through profit/loss
$000
loans and receivables
$000
financial liabilities at
amortised cost$000
Total$000
Financial assetscash and cash equivalents – 8 – 8 trade and other receivables – 8 – 8 Derivative financial instruments 1,977 – – 1,977 Advances to subsidiaries – 903,003 – 903,003
1,977 903,019 – 904,996
Financial liabilitiesBorrowings – – (447,654) (447,654)trade and other payables – – (2,573) (2,573)Derivative financial instruments (11,454) – – (11,454)Advances from subsidiaries – – (8,408) (8,408)
(11,454) – (458,635) (470,089)
2013
Derivatives at fair value
through profit/loss
$000
loans and receivables
$000
financial liabilities at
amortised cost$000
Total$000
Financial assetscash and cash equivalents – 101 – 101 trade and other receivables – – – – Derivative financial instruments – – – – Advances to subsidiaries – 733,500 – 733,500
– 733,601 – 733,601
Financial liabilitiesBorrowings – – (326,045) (326,045)trade and other payables – – (2,427) (2,427)Derivative financial instruments (41,115) – – (41,115)Advances from subsidiaries – – (9,168) (9,168)
(41,115) – (337,640) (378,755)

ARGOSY PROPERTY LIMITED | ANNUAL REPORT 2014
Notes to the fiNaNcial statemeNts (CONTiNued)
fiNaNcial statemeNts
50
6. fiNaNCial iNSTrumENTS (cONtINUeD)
risk management
The use of financial instruments exposes the Group to credit, interest rate and liquidity risks. The Group’s overall risk management programme focuses on the unpredictability of financial markets and seeks to minimise potential adverse effects on the Group’s financial performance.
Credit risk
Credit risk relates to the risk that the counterparty to a financial instrument may default on its obligations to the Group, resulting in financial loss.
Group
The Group’s main exposure to credit risk arises from trade receivables and transactions with financial institutions, and is summarised in the table on page 48. There are no significant concentrations of credit risk in specific receivables due to receivables mainly comprising a large number of tenants in the Group’s property portfolio and the Group policy to limit the amount of credit exposure to any financial institution.
The Group manages its exposure to credit risk from trade receivables through its credit policy which includes performing credit evaluations on customers requiring credit. The Group does not hold any collateral in respect of balances past due. Details of impairment losses relating to trade receivables together with the ageing of receivables is provided in Note 8.
The risk from financial institutions is managed by placing cash and deposits with high credit quality financial institutions only. Cash deposits are placed with the ANZ Bank New Zealand Limited and Bank of New Zealand.
Company
The Company’s main exposure to credit risk arises from advances to its subsidiaries as set out in Notes 7 and 28.
Interest rate risk
Interest rate risk arises from long term borrowings (refer Note 14). Variable rate borrowings expose the group to cash flow interest rate risk while fixed rate borrowings expose the group to fair value interest rate risk.
The Group manages its exposure to interest rate risk through derivatives in the form of floating to fixed interest rate swaps. These derivatives provide an economic hedge against variability in cash flows as a result of changes in variable interest rates on borrowings.
The Group’s policy is to maintain a range of 60%–100% of its borrowings in fixed interest rate instruments unless otherwise instructed by the Board of Directors. At year end, 69% of borrowings, after the effect of associated swaps, were at fixed rates (2013: 86%).
Liquidity risk
Liquidity risk is the risk that the Group may encounter difficulty in meeting its obligations associated with its financial liabilities that are settled by delivering cash or another financial asset. Liquidity risk mainly arises from the Group’s obligations in respect of long term borrowings, derivatives and trade and other payables. In addition, the Company’s exposure also includes advances from subsidiaries. The Group aims to maintain flexibility in funding by keeping committed credit lines available (refer Note 14).

ARGOSY PROPERTY LIMITED | ANNUAL REPORT 2014
Notes to the fiNaNcial statemeNts (CONTiNued)
fiNaNcial statemeNts
51
The expected undiscounted cash flows of the Group and the Company’s financial liabilities by remaining contractual maturity at the balance sheet date is as follows:
Group 2014
Carrying amount
$000
less than 1 year $000
1–2 years $000
2–3 years $000
3–4 years $000
4–5 years $000
5+ years $000
Financial liabilitiesBorrowings1 (447,654) (20,858) (20,858) (262,326) (9,483) (201,893) – trade and other payables (8,790) (8,790) – – – – – Derivative financial instruments (11,454) (14,564) (1,898) (1,090) (744) (691) (666)Other current liabilities (2,321) (2,321) – – – – –
(470,219) (46,533) (22,756) (263,416) (10,227) (202,584) (666)
Group 2013
Carrying amount
$000
less than 1 year $000
1–2 years $000
2–3 years $000
3–4 years $000
4–5 years $000
5+ years $000
Financial liabilitiesBorrowings1 (326,045) (14,594) (14,594) (256,363) (3,619) (79,588) – trade and other payables (9,379) (9,379) – – – – – Derivative financial instruments (41,115) (8,940) (8,531) (8,085) (7,665) (7,186) (5,731)Other current liabilities (1,614) (1,614) – – – – –
(378,153) (34,527) (23,125) (264,448) (11,284) (86,774) (5,731)
Company 2014
Carrying amount
$000
less than 1 year $000
1–2 years $000
2–3 years $000
3–4 years $000
4–5 years $000
5+ years $000
Financial liabilitiesBorrowings1 (447,654) (20,858) (20,858) (262,326) (9,483) (201,893) – trade and other payables (2,573) (2,573) – – – – – Derivative financial instruments (11,454) (14,564) (1,898) (1,090) (744) (691) (666)Advances from subsidiaries (8,408) (8,408) – – – – –
(470,089) (46,403) (22,756) (263,416) (10,227) (202,584) (666)
Company 2013
Carrying amount
$000
less than 1 year $000
1–2 years $000
2–3 years $000
3–4 years $000
4–5 years $000
5+ years $000
Financial liabilitiesBorrowings1 (326,045) (14,594) (14,594) (256,363) (3,619) (79,588) – trade and other payables (2,426) (2,426) – – – – – Derivative financial instruments (41,115) (8,940) (8,531) (8,085) (7,665) (7,186) (5,731)Advances from subsidiaries (9,168) (9,168) – – – – –
(378,754) (35,128) (23,125) (264,448) (11,284) (86,774) (5,731)
1 The undiscounted cashflows on borrowings includes interest, margin and line fee.

ARGOSY PROPERTY LIMITED | ANNUAL REPORT 2014
Notes to the fiNaNcial statemeNts (CONTiNued)
fiNaNcial statemeNts
52
6. fiNaNCial iNSTrumENTS (cONtINUeD)
Derivative financial instruments
The Group has a syndicated revolving credit facility with ANZ Bank New Zealand Limited, Bank of New Zealand Limited and the Hongkong and Shanghai Banking Corporation of $500,000,000 (2013: $500,000,000) – refer Note 14.
To manage the Group and Company’s exposure to interest rate risk on variable rate instruments, the Group has implemented a hedging strategy that uses interest rate swaps that have a range of maturities. Details of the contracts are below:
maturing Group and Company 2014 Group and Company 2013
Nominal value$
Contracted rate%
Nominal value$
Contracted rate%
2015 165,000,000 5.49% 50,000,000 2.93%2017 15,000,000 3.91% – – 2018 10,000,000 4.17% 17,000,000 5.25%2019 25,000,000 4.37% – – 2020 – – 151,000,000 6.63%2021 – – 65,000,000 6.53%2022 65,000,000 4.87% – – 2023 30,000,000 4.97% – –
310,000,000 283,000,000
Contracts entered into but not yet effective at 31 March 2014 are as follows:
maturing Group and Company 2014 Group and Company 2013
Nominal value$
Contracted rate%
Nominal value$
Contracted rate%
2019 50,000,000 3.87% – –2021 25,000,000 4.81% – – 2024 45,000,000 5.06% – – 2025 45,000,000 5.12% – –
165,000,000
Interest rate swaps are measured at present value of future cash flows estimated and discounted based on applicable yield curves derived from observable market interest rates. Accepted market best practice valuation methodology using mid-market interest rates at balance date is used, provided from sources perceived to be reliable and accurate. Interest rate swaps have been classified into Level 2 of the fair value hierarchy on the basis that the valuation techniques used to determine the values at balance date use observable inputs.
The net liability for derivative financial instruments as at 31 March 2014 is $9.48 million (31 March 2013: $41.1 million). The mark-to-market reduction in the liability for derivative financial instruments is a result of the movement in the interest rate curve during the financial year as well as the cancellation of swap contracts.
Sensitivity analysis
The sensitivity analysis below has been determined based on the exposure to interest rates for both derivative and non-derivative financial instruments at the reporting date.
2014Group and Company
2013Group and Company
impact on Profit & loss
$
impact on hedge reserve
$
impact on Profit & loss
$
impact on hedge reserve
$
Increase of 100 basis points 15,578,082 – 14,593,374 – Decrease of 100 basis points (16,925,125) – (15,647,245) –

ARGOSY PROPERTY LIMITED | ANNUAL REPORT 2014
Notes to the fiNaNcial statemeNts (CONTiNued)
fiNaNcial statemeNts
53
7. OThEr NON-CurrENT aSSETS
Group2014
$000s
Company2014
$000s
Group2013
$000s
Company2013
$000s
Property, plant and equipment 97 – 90 – Advances to subsidiaries – 903,003 – 733,500 Other 6 – 321 – Total other non-current assets 103 903,003 411 733,500
8. TraDE aND OThEr rECEivaBlES
Group2014
$000s
Company2014
$000s
Group2013
$000s
Company2013
$000s
trade receivables 1,660 8 1,303 – Allowance for doubtful debts (187) – (215) –
1,473 8 1,088 –
Unsettled sales of properties 274 – 179 – Total trade and other receivables 1,747 8 1,267 –
The average credit period on receivables is 4.5 days (2013: 4.2 days). The Group is entitled to charge interest on trade receivables as determined in each individual lease agreement. Interest is charged on receivables over 90 days on a case by case basis at the Group’s effective interest rate plus 5% per annum. The Group has provided for 50% of all receivables over 90 days that are considered doubtful. This amount increases to 100% of any receivable that is determined as not being recoverable. Trade receivables less than 90 days are provided for based on estimated irrecoverable amounts, determined by reference to past default experience.
Group2014
$000s
Company2014
$000s
Group2013
$000s
Company2013
$000s
Aged past due but not impaired trade receivables30–60 Days 342 – 189 – 60–90 Days 12 – 6 – Beyond 90 days 43 – 255 –
397 – 450 –
Included in the Group’s trade receivable balance are debtors with a carrying amount of $396,629 (2013: $449,688) which are past due at the reporting date, for which the Group has not provided as there has not been a significant change in credit quality and the amounts are still considered recoverable.
Group2014
$000s
Company2014
$000s
Group2013
$000s
Company2013
$000s
Movement in the allowance for doubtful debtsBalance at the beginning of the year 215 – 241 – Amounts written off as uncollectible (167) – (98) – Increase in allowance recognised in profit or loss 139 – 72 – Balance at end of the year 187 – 215 –

ARGOSY PROPERTY LIMITED | ANNUAL REPORT 2014
Notes to the fiNaNcial statemeNts (CONTiNued)
fiNaNcial statemeNts
54
9. OThEr CurrENT aSSETS
Group2014
$000s
Company2014
$000s
Group2013
$000s
Company2013
$000s
Accrued Income 15 15 15 15 Prepayments 100 103 104 81 Other 252 – 180 – Total other current assets 367 118 299 96
10. PrOPErTy hElD fOr SalE
Lot 22, 57–86 El Prado Drive, Palmerston North ($634,000) was subject to an unconditional sale and purchase agreement at balance date (2013: Lot 3, 260 Oteha Valley Road, Albany ($5,924,000) and Lot 9a, Alderson Drive, Manawatu Business Park($863,000)).
11. SharE CaPiTal
Group2014
$000s
Company2014
$000s
Group2013
$000s
Company2013
$000s
Balance at the beginning of the year 658,824 658,824 552,322 552,322 Issue of shares from Dividend reinvestment Plan 11,488 11,488 7,929 7,929 Issue of shares from rights Offer 86,911 86,911 – – Issue of shares from share Purchase Plan – – 20,000 20,000 Issue of shares from Placement – – 80,000 80,000 Issue costs of shares (2,770) (2,770) (1,427) (1,427)Total share capital 754,453 754,453 658,824 658,824
The number of shares on issue at 31 March 2014 was 790,911,915 (2013: 680,932,151).
On 1 July 2013 Argosy announced a 1-for-7 pro-rata renounceable rights offer. The rights offer and shortfall bookbuild received strong shareholder support with approximately 97.7 million new shares taken up by shareholders, and the receipt of $86.9 million.
In the prior year, the Group acquired one property at Waterloo Quay, Wellington. The Group funded the acquisition of this property by way of the issue of new equity. Equity was raised in two tranches: a Placement to institutional and other qualified investors raising $80 million and an offer to Argosy’s other shareholders raising $20 million through a Share Purchase Plan (SPP).
All securities are fully paid and rank equally with one vote attached and carry the right to dividends. All ordinary securities have equal voting rights.
Group2014
Company2014
Group2013
Company2013
(in thousands of shares)Balance at the beginning of the year 680,932 680,932 558,517 558,517 Issue of shares from Dividend reinvestment Plan 12,327 12,327 8,777 8,777 Issue of shares from renounceable rights Offer 97,653 97,653 – – Issue of shares from share Purchase Plan – – 22,729 22,729 Issue of shares from Placement – – 90,909 90,909 Total number of shares on issue 790,912 790,912 680,932 680,932
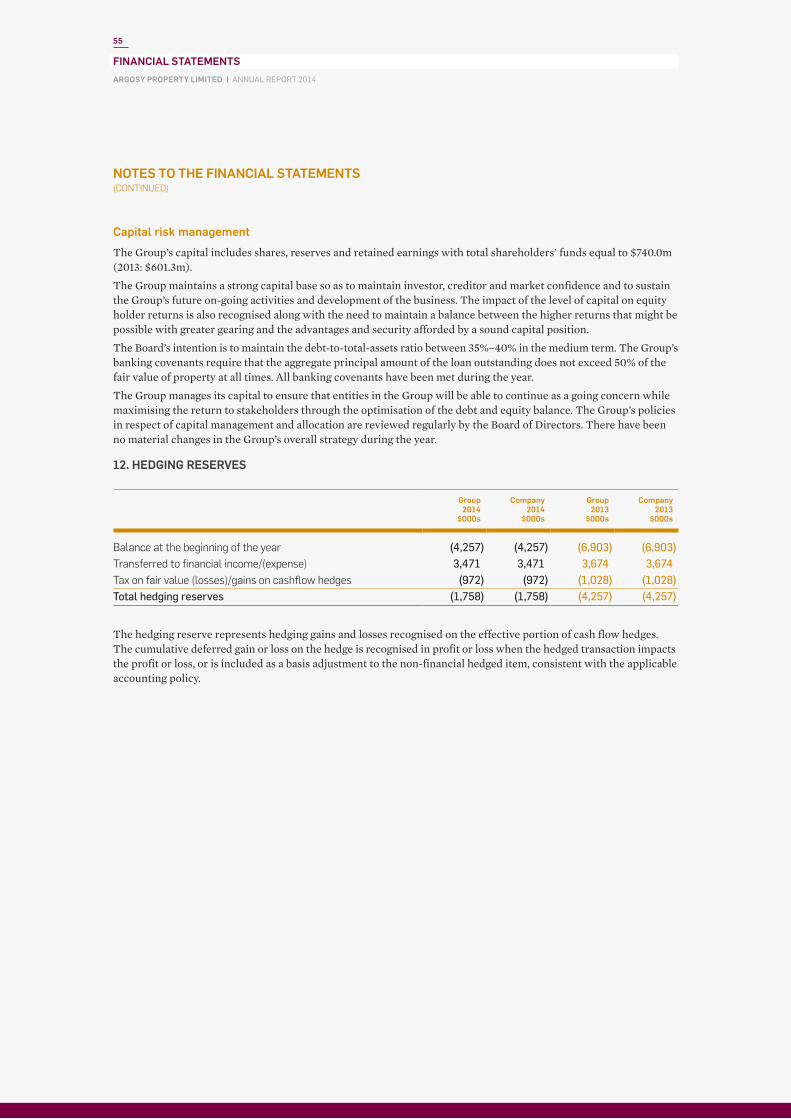
ARGOSY PROPERTY LIMITED | ANNUAL REPORT 2014
Notes to the fiNaNcial statemeNts (CONTiNued)
fiNaNcial statemeNts
55
Capital risk management
The Group’s capital includes shares, reserves and retained earnings with total shareholders’ funds equal to $740.0m (2013: $601.3m).
The Group maintains a strong capital base so as to maintain investor, creditor and market confidence and to sustain the Group’s future on-going activities and development of the business. The impact of the level of capital on equity holder returns is also recognised along with the need to maintain a balance between the higher returns that might be possible with greater gearing and the advantages and security afforded by a sound capital position.
The Board’s intention is to maintain the debt-to-total-assets ratio between 35%–40% in the medium term. The Group’s banking covenants require that the aggregate principal amount of the loan outstanding does not exceed 50% of the fair value of property at all times. All banking covenants have been met during the year.
The Group manages its capital to ensure that entities in the Group will be able to continue as a going concern while maximising the return to stakeholders through the optimisation of the debt and equity balance. The Group’s policies in respect of capital management and allocation are reviewed regularly by the Board of Directors. There have been no material changes in the Group’s overall strategy during the year.
12. hEDGiNG rESErvES
Group2014
$000s
Company2014
$000s
Group2013
$000s
Company2013
$000s
Balance at the beginning of the year (4,257) (4,257) (6,903) (6,903)transferred to financial income/(expense) 3,471 3,471 3,674 3,674 tax on fair value (losses)/gains on cashflow hedges (972) (972) (1,028) (1,028)Total hedging reserves (1,758) (1,758) (4,257) (4,257)
The hedging reserve represents hedging gains and losses recognised on the effective portion of cash flow hedges. The cumulative deferred gain or loss on the hedge is recognised in profit or loss when the hedged transaction impacts the profit or loss, or is included as a basis adjustment to the non-financial hedged item, consistent with the applicable accounting policy.

ARGOSY PROPERTY LIMITED | ANNUAL REPORT 2014
Notes to the fiNaNcial statemeNts (CONTiNued)
fiNaNcial statemeNts
56
13. rETaiNED EarNiNGS/(aCCumulaTED lOSSES)
Group2014
$000s
Company2014
$000s
Group2013
$000s
Company2013
$000s
Balance at the beginning of the year (53,230) (275,529) (56,973) (210,388)Profit/(loss) for the year 85,550 22,596 39,155 (29,729)Dividends to shareholders (45,493) (45,493) (35,412) (35,412)Total retained earnings/(accumulated losses) (13,173) (298,426) (53,230) (275,529)
Dividends to shareholders
Group & Company
2014CPS
Group & Company
2013CPS
Interim 4.50 4.50 Imputation credits – –
4.50 4.50
Final 1.50 1.50 Imputation credits 0.14 –
1.64 1.50
total 6.00 6.00 Imputation credits 0.14 –
6.14 6.00
After 31 March 2014, the final dividend was declared. The dividend has not been provided for. Refer to note 27.

ARGOSY PROPERTY LIMITED | ANNUAL REPORT 2014
Notes to the fiNaNcial statemeNts (CONTiNued)
fiNaNcial statemeNts
57
14. BOrrOwiNGS
Group2014
$000s
Company2014
$000s
Group2013
$000s
Company2013
$000s
ANZ Bank New Zealand Limited 224,761 224,761 205,428 205,428 Bank of New Zealand 134,857 134,857 82,171 82,171 hongkong and shanghai Banking corp 89,905 89,905 41,085 41,085 Borrowing costs (1,869) (1,869) (2,639) (2,639)Total borrowings 447,654 447,654 326,045 326,045
Shown as:term 447,654 447,654 326,045 326,045
The Company has a syndicated revolving facility with ANZ Bank New Zealand Limited, Bank of New Zealand and The Hongkong and Shanghai Banking Corp of $500,000,000 (31 March 2013: $500,000,000) secured by way of mortgage over the investment properties of the Group. The facility includes a Tranche A limit of $250,000,000 and a Tranche B limit of $250,000,000. Tranche A expires on 30 June 2016 and Tranche B on 30 June 2018 (31 March 2013: Tranche A ($250,000,000) expired on 30 June 2015 and Tranche B ($250,000,000) expired on 30 June 2017).
The contractual interest rate on the borrowings as at 31 March 2014 was 3.92% per annum (2013: 3.54%). The Company paid a line fee of between 0.675% and 0.775% per annum on Tranche A and between 0.775% and 0.875% per annum on Tranche B (2013: between 0.825% and 0.90% per annum on Tranche A and between 0.925% and 1.00% per annum on Tranche B).
The weighted average interest rate on borrowings (including margin and line fee and interest rate swaps) as at 31 March 2014 was 6.06% (2013: 7.22%).
Borrowing costs are the costs incurred in establishing the bank facility. These costs are amortised over the life of the facility.
15. TraDE aND OThEr PayaBlES
Group2014
$000s
Company2014
$000s
Group2013
$000s
Company2013
$000s
Gst payable 383 – 196 (17)Other creditors and accruals 8,407 2,573 9,183 2,443 total trade and other payables 8,790 2,573 9,379 2,426

ARGOSY PROPERTY LIMITED | ANNUAL REPORT 2014
Notes to the fiNaNcial statemeNts (CONTiNued)
fiNaNcial statemeNts
58
16. OThEr CurrENT liaBiliTiES
Group2014
$000s
Company2014
$000s
Group2013
$000s
Company2013
$000s
employee entitlements 208 – 140 – Advances from subsidiaries – 8,408 – 9,168 Other liabilities 2,113 – 1,474 – Total current liabilities 2,321 8,408 1,614 9,168
17. OThEr iNCOmE
Group2014
$000s
Company2014
$000s
Group2013
$000s
Company2013
$000s
reversal of intercompany provision – – – 3,065 Total other income – – – 3,065
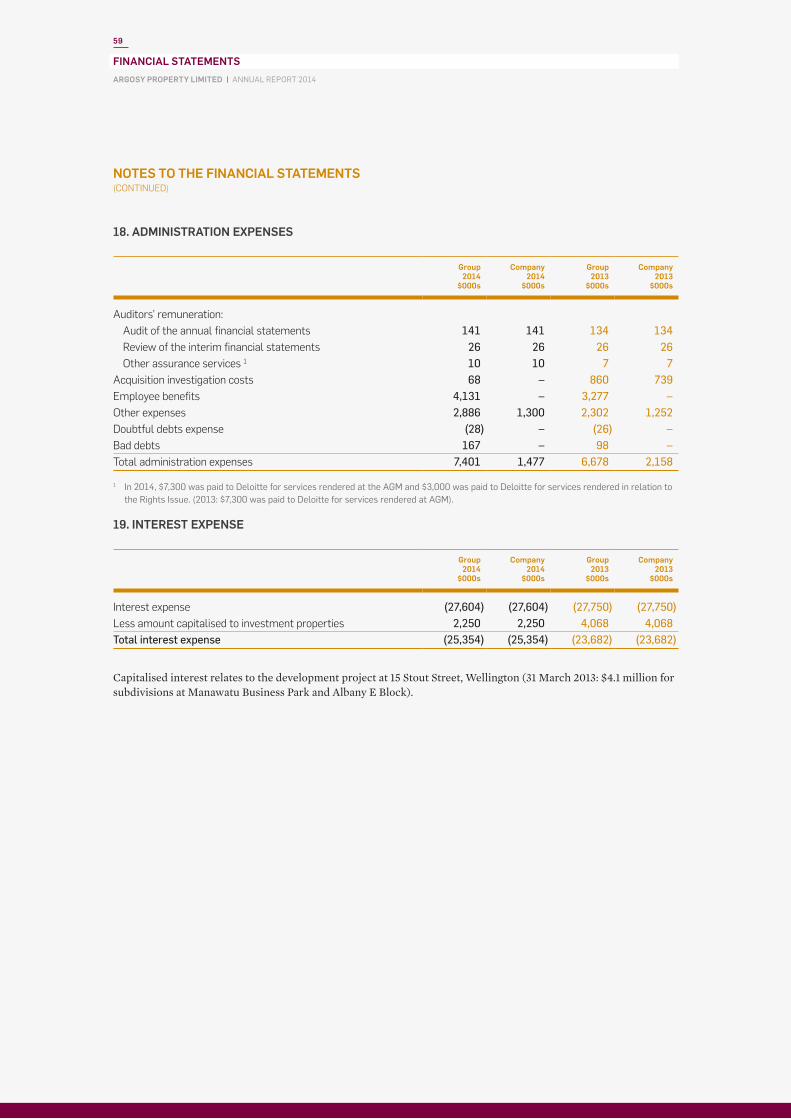
ARGOSY PROPERTY LIMITED | ANNUAL REPORT 2014
Notes to the fiNaNcial statemeNts (CONTiNued)
fiNaNcial statemeNts
59
18. aDmiNiSTraTiON EXPENSES
Group2014
$000s
Company2014
$000s
Group2013
$000s
Company2013
$000s
Auditors’ remuneration: Audit of the annual financial statements 141 141 134 134 review of the interim financial statements 26 26 26 26 Other assurance services 1 10 10 7 7 Acquisition investigation costs 68 – 860 739employee benefits 4,131 – 3,277 – Other expenses 2,886 1,300 2,302 1,252 Doubtful debts expense (28) – (26) – Bad debts 167 – 98 – total administration expenses 7,401 1,477 6,678 2,158
1 In 2014, $7,300 was paid to Deloitte for services rendered at the AGM and $3,000 was paid to Deloitte for services rendered in relation to the Rights Issue. (2013: $7,300 was paid to Deloitte for services rendered at AGM).
19. iNTErEST EXPENSE
Group2014
$000s
Company2014
$000s
Group2013
$000s
Company2013
$000s
Interest expense (27,604) (27,604) (27,750) (27,750)Less amount capitalised to investment properties 2,250 2,250 4,068 4,068 Total interest expense (25,354) (25,354) (23,682) (23,682)
Capitalised interest relates to the development project at 15 Stout Street, Wellington (31 March 2013: $4.1 million for subdivisions at Manawatu Business Park and Albany E Block).

ARGOSY PROPERTY LIMITED | ANNUAL REPORT 2014
Notes to the fiNaNcial statemeNts (CONTiNued)
fiNaNcial statemeNts
60
20. TaXaTiON
Group2014
$000s
Company2014
$000s
Group2013
$000s
Company2013
$000s
The taxation charge is made up as follows:current tax expense 15,359 6,767 526 (3,357)Deferred tax expense (2,133) (2,923) (880) 16,343Adjustment recognised in the current year in relation
to the current tax of prior years 27 15 (151) 6,994 Total taxation expense/(credit) recognised in profit/(loss) 13,253 3,859 (505) 19,980
Reconciliation of accounting profit to tax expense Profit/(loss) before tax 98,803 26,455 38,650 (9,749)
current tax expense/(credit) at 28% 27,665 7,407 10,822 (2,730)
Adjusted for:Non-taxable income – – (85) – expenditure not deductible for tax purposes – – 22 22 capitalised interest (630) (630) (1,139) (1,139)Fixed asset disposals 779 – 1,569 – Fair value movement on investment properties (9,377) – (2,617) – Depreciation (3,261) – (2,415) –Other 183 (10) (5,631) 490Current taxation expense / (credit) 15,359 6,767 526 (3,357)
Movements in deferred tax assets and liabilities attributable to:Investment properties 1,341 – (134) –Interest rate swaps (3,415) (3,415) (694) (694)tax losses – 492 – 17,045Other (59) – (52) (8)Deferred tax expense/(benefit) (2,133) (2,923) (880) 16,343
Adjustment recognised in the current year in relation to the current tax of prior years 27 15 (151) 6,994
total tax expense / (credit) recognised in profit or loss 13,253 3,859 (505) 19,980
Deferred tax recognised in other comprehensive incomeDeferred tax arising from reclassification of amounts
in hedge reserve to profit and loss 972 972 1,028 1,028 total tax recognised in other comprehensive income 972 972 1,028 1,028
Imputation creditstotal imputation credits at end of year – – 517 –

ARGOSY PROPERTY LIMITED | ANNUAL REPORT 2014
Notes to the fiNaNcial statemeNts (CONTiNued)
fiNaNcial statemeNts
61
21. DEfErrED TaX
The following are the major deferred tax liabilities and assets recognised by the Group, and the movements thereon during the current and prior reporting years:
losses carried forward
$000s
interest rate swaps $000s
investment property
$000sOther
$000sTotal
$000s
At 1 April 2013 (5,618) (3,772) 19,770 2,879 13,259 credit to shareholders funds for the year – 972 – – 972charge/(credit) to taxation expense for the year – (3,415) 1,341 (59) (2,133)charge/(credit) to taxation payable 5,618 3,525 – 848 9,991At 31 March 2014 – (2,690) 21,111 3,668 22,089
At 1 April 2012 (9,921) 109 19,904 2,492 12,584 credit to shareholders funds for the year – 1,028 – – 1,028 charge/(credit) to taxation expense for the year – (694) (134) (52) (880)charge/(credit) to taxation payable 4,303 (4,215) – 439 527At 31 March 2013 (5,618) (3,772) 19,770 2,879 13,259
There are nil taxable losses carried forward (2013: $20,062,098) recognised in the Group’s balance of deferred tax.
The following are the major deferred tax liabilities and assets recognised by the Company, and the movements thereon during the current and prior reporting years:
losses carried forward
$000s
interest rate swaps $000s
investment property
$000sOther
$000sTotal
$000s
At 1 April 2013 (492) (3,772) – (21) (4,285)credit to shareholders funds for the year – 972 – – 972charge/(credit) to taxation expense for the year 492 (3,415) – – (2,923)(credit) to taxation payable – 3,525 – (25) 3,500At 31 March 2014 – (2,690) – (46) (2,736)
At 1 April 2012 (17,537) 109 – (869) (18,297)credit to shareholders funds for the year – 1,028 – – 1,028 charge/(credit) to taxation expense for the year 17,045 (694) – (8) 16,343charge/(credit) to taxation payable – (4,215) – 856 (3,359)At 31 March 2013 (492) (3,772) – (21) (4,285)
Significant estimates and judgements in the determination of deferred tax include:
Deferred tax on depreciation – Deferred tax is provided in respect of depreciation expected to be recovered on the sale of property at fair value. Depreciation is claimed at Inland Revenue Department approved rates.
Deferred tax on changes in fair value of investment properties – Deferred tax is provided on the fair value change to investment properties based on the tax consequences of recovering the carrying amount of the investment property through sale, being the taxable temporary difference. Investment properties are valued each year by independent valuers (as outlined in Note 5). These values include an allocation of the valuation between the land and building components. The calculation of deferred tax on depreciation recovered and changes in fair value places reliance on the split provided by the valuers.
Deferred tax on fixtures and fittings – it is assumed that all fixtures and fittings will be sold at their tax book value.

ARGOSY PROPERTY LIMITED | ANNUAL REPORT 2014
Notes to the fiNaNcial statemeNts (CONTiNued)
fiNaNcial statemeNts
62
22. rECONCiliaTiON Of PrOfiT fOr ThE yEar afTEr TaXaTiON wiTh CaSh flOwS frOm OPEraTiNG aCTiviTiES
Group2014
$000s
Company2014
$000s
Group2013
$000s
Company2013
$000s
Profit after tax for the year 85,550 22,596 39,155 (29,729)
Movements in working capital items relating to investing and financing activities 2,294 (908) (7,952) (6,134)
Non cash items Movement in deferred tax liability 8,830 1,549 675 14,012 Movement in interest rate swaps (20,561) (20,561) 4,735 4,735 Fair value change in investment properties (33,488) – (9,344) – Movement in cashflow hedge reserve 2,499 2,499 2,646 2,646 Inter-entity recharges – (36,165) – (21,511)
Movements in working capital items: trade and other receivables (480) 8 15,520 – taxation receivable 4,858 – (7) 6,995 taxation payable 558 3,302 – –trade and other payables (589) 147 2,631 (625)Other current assets (68) (22) (73) (50)Other current liabilities 707 – (694) – Net cash from operating activities 50,110 (27,555) 47,292 (29,661)
23. EarNiNGS/(lOSS) PEr SharE
Basic and diluted earnings/(loss) per share is calculated by dividing the profit attributable to shareholders of the Company by the weighted average number of ordinary shares on issue during the year.
Group 2014
$000s
Group 2013
$000s
Profit/(loss) attributable to shareholders of the company 85,550 39,155 Weighted average number of shares on issue 746,985 585,063 Basic and undiluted earnings/(loss) per share (cents) 11.45 6.69
On 20 May 2014, a final gross dividend of 1.50 cents per share was approved by the Group. Continuation of the Dividend Reinvestment Plan programme will increase the number of shares on issue.

ARGOSY PROPERTY LIMITED | ANNUAL REPORT 2014
Notes to the fiNaNcial statemeNts (CONTiNued)
fiNaNcial statemeNts
63
24. DiSTriBuTaBlE iNCOmE
Group 2014
$000s
Group 2013
$000s
Profit/(loss) before income tax 98,803 38,650 Adjustments:revaluation gains on investment property (33,488) (9,344)realised losses/(gains) on disposal of investment properties 1,363 1,812 tax impact of depreciation recovered on disposal of investment properties
and taxable gains on disposal of revenue account properties¹ 373 1,859 Derivative fair value loss/(gain) (17,090) 8,409 corporatisation related costs² – 51 Acquisition investigation costs³ – 776 Gross distributable income 49,961 42,213 Less current taxation paid – –
Net distributable income 49,961 42,213
Weighted average number of ordinary shares 746,985 585,063 Distributable income after taxation per share – (cents per share) 6.69 7.22
The Company’s dividend policy is based on net distributable income. Net distributable income is determined under the Company’s bank facility agreement.
1 The tax impact of depreciation recovered on the disposal of investment properties and on disposal of properties held on revenue account has been included as an adjustment this year, consistent with industry practice, and as agreed with bank financiers. Prior year distributable income has been restated to reflect this change.
2 The adjustment for corporatisation costs had been limited to $850,000 following agreement with the lenders of the syndicated revolving credit facility, $51,000 of which was recognised in the 2013 financial year.
3 The acquisition investigation costs adjustment is limited to one particular transaction.

ARGOSY PROPERTY LIMITED | ANNUAL REPORT 2014
Notes to the fiNaNcial statemeNts (CONTiNued)
fiNaNcial statemeNts
64
25. iNvESTmENT iN SuBSiDiariES
The Company has control over the following subsidiaries:
Name of subsidiary Principal activity
Place of incorporation and operation holding 2014 holding 2013
Argosy Property No.1 Limited Property investment NZ 100% 100%Argosy No.1 trust Property investment NZ 100% 100%Argosy Property Management Limited Management company NZ 100% 100%Argosy Property No.3 Limited Property investment NZ 100% 100%Argosy Property Unit holdings Limited holding company / storage NZ 100% 100%
The subsidiaries have the same reporting date as the Group.
On 30 June 2012, Argosy Property Investments Limited, Argosy Property No.4 Limited, Argosy Property Holdings Limited and Argosy Property No.6 Limited were amalgamated into Argosy Property No.1 Limited (AP No.1). On that date, all assets, liabilities, property, rights, powers and privileges of the amalgamating companies were vested in AP No.1, being the amalgamated company. The shares in Argosy Property No.3 Limited (AP No.3) transferred to AP No.1 and therefore AP No.3 is a subsidiary of AP No.1 after amalgamation.
26. COmmiTmENTS
Ground rent
A ground lease exists over 39 Market Place, Viaduct Harbour, Auckland. The amount paid in respect of ground leases during the year was $1,060,000 (2013: $1,168,250). The annual ground lease commitment is $1,060,000 and is recoverable from tenants in proportion to their area of occupancy. The lease is renewable in perpetuity with the next renewable date in 2019. The amount currently being paid in respect of the ground lease is the amount advised in the ground lessors notice of rent review. This is currently being disputed by Argosy.
Payments recognised as an expense/development costs
Group2014
$000s
Company2014
$000s
Group2013
$000s
Company2013
$000s
Minimum lease payments as expense 1,060 – 1,113 – 1,060 – 1,113 –

ARGOSY PROPERTY LIMITED | ANNUAL REPORT 2014
Notes to the fiNaNcial statemeNts (CONTiNued)
fiNaNcial statemeNts
65
Building upgrades
Estimated capital commitments contracted for building projects not yet completed at 31 March 2014 and not provided for were $60.3 million (2013: $43.5 million). Of this total, $33.9 million (2013: $36.6 million) relates to the building upgrade at Waterloo Quay, Wellington and $16.2 million relates to Stout Street, Wellington.
There were no other commitments as at 31 March 2014 (2013: Nil).
Non-cancellable operating lease receivable
Operating leases relate to the investment properties owned by the Group with the leases expiring between 2014 and 2030. The lessee does not have an option to purchase the property at the expiry of the period.
Group2014
$000s
Company2014
$000s
Group2013
$000s
Company2013
$000s
Within one year 94,530 – 79,476 – One year or later and not later than five years 299,402 – 243,755 – Later than five years 205,868 – 114,404 –
599,800 – 437,635 –
Non-cancellable operating lease payable
Operating lease commitments relate mainly to the IT infrastructure lease. There are no renewal options or options to purchase in respect of this lease of equipment.
Group2014
$000s
Company2014
$000s
Group2013
$000s
Company2013
$000s
Within one year 143 – 84 – One year or later and not later than five years 73 – 42 – Later than five years – – – –
216 – 126 –
There were no contingent rents recognised as income during the year.
The Company has the following guarantee which is not expected to be called upon:
As a condition of listing on the New Zealand Stock Exchange (NZSX), NZX requires all issuers to provide a bank bond to NZX under NZSX/DX Listing Rule 2.6.2. The bank bond required by APL for listing on the NZSX is $75,000.
27. SuBSEquENT EvENTS
On 20 May 2014, a final gross dividend of 1.50 cents per share was approved by the Company. The record date for the final dividend is 10 June 2014 and a payment is scheduled to shareholders on 24 June 2014. Imputation credits of 0.14 cents per share are attached to the dividend.

ARGOSY PROPERTY LIMITED | ANNUAL REPORT 2014
Notes to the fiNaNcial statemeNts (CONTiNued)
fiNaNcial statemeNts
66
28. rElaTED ParTy TraNSaCTiONS
Details of transactions between the Group and other related parties are disclosed below.
The following transactions occurred between the Company and its subsidiaries during the year, and the following balances were outstanding at year end:
Company 2014 $000
Company 2013 $000
Financial PositionAdvances to subsidiaries 903,003 733,500 Investment in subsidiary (Argosy Property No.1 Limited) 20,000 20,000 Advances from subsidiaries (8,408) (9,168)
914,595 744,332
Statement of Comprehensive Income Interest recharged to subsidiaries 36,165 21,511
36,165 21,511
Advances have been made by the Company to its subsidiaries to finance the purchases of investment properties and to fund working capital requirements when necessary. The subsidiaries have returned money to the Company upon the settlement of properties intended for sale and at other times when working capital requirements allow. The Company re-charges expenses, including management fees and interest, to the subsidiaries.
No related party debts have been written off or forgiven during the year. In the prior year, the Company has provided $3,064,513 for the advances to subsidiaries. Following the amalgamation on 30 June 2012, this provision was reversed (refer to Note 17).
Group 2014 $000
Group 2013 $000
Key management and directors compensationsalaries and other short term employee benefits 1,112 602Directors’ fees 513 401total 1,625 1,003

ARGOSY PROPERTY LIMITED | ANNUAL REPORT 2014
67
TO ThE SharEhOlDErS Of arGOSy PrOPErTy limiTED
report on the financial StatementsWe have audited the financial statements of Argosy Property Limited and group on pages 33 to 66, which comprise the consolidated and separate statements of financial position of Argosy Property Limited, as at 31 March 2014, the consolidated and separate statements of comprehensive income, statements of changes in equity and statements of cash flows for the year then ended, and a summary of significant accounting policies and other explanatory information.
This report is made solely to the company’s shareholders, as a body, in accordance with Section 205(1) of the Companies Act 1993. Our audit has been undertaken so that we might state to the company’s shareholders those matters we are required to state to them in an auditor’s report and for no other purpose. To the fullest extent permitted by law, we do not accept or assume responsibility to anyone other than the company’s shareholders as a body, for our audit work, for this report, or for the opinions we have formed.
Board of Directors’ responsibility for the financial StatementsThe Board of Directors are responsible for the preparation of financial statements in accordance with generally accepted accounting practice in New Zealand and that give a true and fair view of the matters to which they relate, and for such internal control as the Board of Directors determine is necessary to enable the preparation of financial statements that are free from material misstatement, whether due to fraud or error.
auditor’s responsibilitiesOur responsibility is to express an opinion on these financial statements based on our audit. We conducted our audit in accordance with International Standards on Auditing and International Standards on Auditing (New Zealand). Those standards require that we comply with ethical requirements and plan and perform the audit to obtain reasonable assurance about whether the financial statements are free from material misstatement.
An audit involves performing procedures to obtain audit evidence about the amounts and disclosures in the financial statements. The procedures selected depend on the auditor’s judgement, including the assessment of the risks of material misstatement of the financial statements, whether due to fraud or error. In making those risk assessments, the auditor considers internal control relevant to the entity’s preparation of financial statements that give a true and fair view of the matters to which they relate in order to design audit procedures that are appropriate in the circumstances, but not for the purpose of expressing an opinion on the effectiveness of the entity’s internal control. An audit also includes evaluating the appropriateness of the accounting policies used and the reasonableness of accounting estimates, as well as the overall presentation of the financial statements.
We believe that the audit evidence we have obtained is sufficient and appropriate to provide a basis for our audit opinion.
Other than in our capacity as auditor and the provision of other assurance services, we have no relationship with or interests in Argosy Property Limited or any of its subsidiaries.
OpinionIn our opinion, the financial statements on pages 33 to 66: - comply with generally accepted accounting practice in New Zealand; - comply with International Financial Reporting Standards; and - give a true and fair view of the financial position of Argosy Property Limited and group as at 31 March 2014, and
their financial performance and cash flows for the year then ended.
report on Other legal and regulatory requirementsWe also report in accordance with section 16 of the Financial Reporting Act 1993. In relation to our audit of the financial statements for the year ended 31 March 2014: - we have obtained all the information and explanations we have required; and - in our opinion proper accounting records have been kept by Argosy Property Limited as far as appears from our
examination of those records.
Chartered accountants 20 May 2014 Auckland, New Zealand
This audit report relates to the financial statements of Argosy Property Limited and group for the year ended 31 March 2014 included on Argosy Property Limited’s website. Argosy Property Limited’s Board of Directors is responsible for the maintenance and integrity of Argosy Property Limited’s website. We have not been engaged to report on the integrity of Argosy Property Limited’s website. We accept no responsibility for any changes that may have occurred to the financial statements since they were initially presented on the website. The audit report refers only to the financial statements named above. It does not provide an opinion on any other information which may have been hyperlinked to/from these financial statements. If readers of this report are concerned with the inherent risks arising from electronic data communication they should refer to the published hard copy of the audited financial statements and related audit report dated 20 May 2014 to confirm the information included in the audited financial statements presented on this website. Legislation in New Zealand governing the preparation and dissemination of financial statements may differ from legislation in other jurisdictions.
iNDEPENDENT auDiTOr’S rEPOrT

COrPOraTE GOvErNaNCE
68
ARGOSY PROPERTY LIMITED | ANNUAL REPORT 2014
ThE COmPaNyArgosy is a limited liability company incorporated under the Companies Act 1993. Argosy shares are listed on the NZX Main Board (NZX code: ARG). Argosy’s constitution is available on its website (www.argosy.co.nz) and the New Zealand Companies Office website (www.companies.govt.nz).
COrPOraTE GOvErNaNCE PhilOSOPhyUltimate responsibility for corporate governance of the Company resides with the Board of Directors. The Board sees strong corporate governance and stewardship as fundamental to the strong performance of the Company and, accordingly, the Board’s commitment is to the highest standards of business behaviour and accountability.
Outlined below are the main corporate governance practices in place throughout the year, which, in the Board’s opinion, comply with the NZX Corporate Governance Best Practice Code (NZX Code) and the Corporate Governance in New Zealand Principles and Guidelines published by the predecessor to the Financial Markets Authority (the Securities Commission), unless otherwise stated.
EThiCal STaNDarDSThe Board has adopted a Code of Conduct and Ethics, which sets out the ethical and behavioural standards expected of Argosy’s Directors, officers and employees. The purpose of the Code of Conduct and Ethics is to uphold the highest ethical standards, acting in good faith and in the best interests of shareholders at all times. The Code of Conduct and Ethics outlines the Company’s policies in respect of conflicts of interest, fair dealing, compliance with applicable laws and regulations, maintaining confidentiality of information, dealing with company assets and use of company information.
Procedures for dealing with breaches of these policies are contained in the Code of Conduct and Ethics, which forms part of each employee’s conditions of employment.
COmPOSiTiON Of ThE BOarDArgosy is committed to having a Board whose members have the capacity to act independently and have the composite skills to optimise the financial performance of the Company and returns to shareholders. The constitution provides for there to be not fewer than three Directors. All the members of the Board are non-executive Directors. The members of the Board are listed below and their brief resumés are included in the section headed “The Board of Directors” on page 13.
aTTENDaNCE Of DirECTOrS
Board meetings attendedMichael smith (chair) 7 of 9
Peter Brook 9 of 9
Mark cross 9 of 9
Andrew evans 9 of 9
chris hunter 9 of 9
Jeff Morrison 8 of 8
trevor scott 8 of 9
All of the above persons were directors as at 31 March 2014.
The Board does not impose a restriction on the tenure of any Director as it considers that such a restriction may lead to the loss of experience and expertise from the Board.
iNDEPENDENT DirECTOrSThe Company recognises that independent directors are important in assuring shareholders that the Board is properly fulfilling its role and is diligent in holding management accountable for its performance.
In determining whether a Director is independent, the Board considers whether the Director is independent of management and free of any business or other relationship that could materially interfere with, or could reasonably be perceived to materially interfere with, the exercise of his or her unfettered and independent judgement. In accordance with Rule 3.3.2 of the NZX Main Board Listing Rules, the Board has determined that Peter Brook, Andrew Evans, Chris Hunter, Jeff Morrison, Trevor Scott and Michael Smith are, in its view, independent directors as at balance date as they do not have a disqualifying relationship with the Company. Mark Cross is considered not to be an independent director as at balance date as he is also the Chairman of a substantial security holder in the Company (MFL Mutual Fund Limited).
BOarD aND DirECTOr PErfOrmaNCEThe Board has a formal annual performance self-assessment, carried out under the direction of the Chairman. The self-assessment process involves reviewing the performance of the Board and its committees, together with setting forth the goals and objectives of the Company for the upcoming year. Assessment of individual Directors’ performance is a process determined by the Chairman, taking into account the attendance, contribution and experience of each individual Director concerned.

69
iNSiDEr TraDiNG aND rESTriCTED PErSONS TraDiNGArgosy’s Directors, officers and employees, their families and related parties must comply with the Insider Trading and Restricted Persons Trading policy. Amongst other requirements, the policy identifies two “black-out periods” where trading in the Company’s shares is prohibited (unless a special circumstances trading application is granted). The black-out periods are from the close of trading on 28 February (or 29 February in a leap year) until the day following the full year announcement date and from the close of trading on 31 August until the day following the half year announcement date each year. On-going fixed participation in the Dividend Reinvestment Plan (DRP) is available throughout the year.
Trading by Directors, officers and senior employees requires pre-trade approval (with limited exceptions, such as shares acquired under the DRP). Officers and employees must obtain approval from any two Directors or a Director and the Chief Financial Officer and Directors must obtain pre-trade approval from the Chairman (or in the case of the Chairman, the Chairman of the Audit Committee). The holdings of Directors of shares in Argosy are disclosed in the section headed “Holdings of Directors” on page 76.
DirECTOrS aND OffiCErS iNDEmNifiCaTiON aND iNSuraNCEIn accordance with section 162 of the Companies Act 1993 and the constitution of the Company, Argosy has indemnified and insured its Directors and employees, including Directors and employees of subsidiaries, in respect of liability incurred for any act or omission in their capacity as a Director or employee (including defence costs). The insurer reimburses the Company where it has indemnified the Directors or employees.
BOarD COmmiTTEES Board committees assist with the execution of the Board’s responsibilities to shareholders. Each committee operates under a constitution approved by the Board, setting out its role, responsibilities, authority, relationship with the Board, reporting requirements, composition, structure and membership.
rEmuNEraTiON COmmiTTEEThe Board has established a Remuneration Committee which considers the remuneration of the Directors and senior executives, and administers the Company’s bonus scheme. The members of the Remuneration Committee are Michael Smith (Chairman), Peter Brook and Trevor Scott.
aTTENDaNCE aT rEmuNEraTiON COmmiTTEE
remuneration Committee meetings attendedMichael smith (chair) 3 of 3
Peter Brook 3 of 3
trevor scott 3 of 3
NOmiNaTiONS COmmiTTEEThe Board does not maintain a Nominations Committee. As all Directors participate in nomination decisions a nominations committee is considered unnecessary.
auDiT COmmiTTEEThe Board has established an Audit Committee, which is responsible for overseeing the financial and accounting responsibilities of the Company. The minimum number of members on the Audit Committee is three. All members must be Directors, the majority must be independent directors and at least one member must have an accounting or financial background.
The members of the Audit Committee are Trevor Scott (Chairman), Peter Brook, Mark Cross and Michael Smith. The Audit Committee assists the Board in fulfilling its corporate governance and disclosure responsibilities with particular reference to financial matters and external audit, and is specifically responsible for:
- ensuring that processes are in place and monitoring those processes so that the Board is properly and regularly informed and updated on corporate financial matters;
- appointment and removal of the external auditor; - meeting regularly to monitor and review external
audit practices; - having direct communication with and unrestricted
access to the external auditors; - reviewing the financial reports and advising the
Board whether they comply with the appropriate laws and regulations;
- ensuring the external auditor or lead audit partner is changed at least every five years;
- reviewing the performance and independence of the external auditor; and
- monitoring compliance with the Financial Reporting Act 1993, Companies Act 1993 and the NZX Main Board Listing Rules.

COrPOraTE GOvErNaNCE
70
ARGOSY PROPERTY LIMITED | ANNUAL REPORT 2014
aTTENDaNCE aT auDiT COmmiTTEE
audit Committee meetings attendedtrevor scott (chair) 4 of 4
Mark cross 4 of 4
Peter Brook 4 of 4
Michael smith 4 of 4
DirECTOrS’ rEmuNEraTiONDirectors’ feesThe current total directors’ fee pool approved by ordinary resolution at the Company’s 2013 Annual Meeting is $655,000 per annum.
DirECTOrS’ rEmuNEraTiONRemuneration paid to directors by the Company during the year is as follows:
Michael smith (chair) $135,000
Peter Brook $71,250
Andrew evans $63,750
trevor scott $76,250
Mark cross $68,750
chris hunter $53,333
Jeff Morrison $44,765
GENDEr BalaNCEAs at 31 March 2014 the gender balance of the Company’s Directors, Officers and all employees was as follows:
Directors Officers all employees
Female 0 (2013: 0) 3 (2013: 1) 12 (2013: 9)
Male 7 (2013: 5) 8 (2013: 5) 13 (2013: 12)
total 7 (2013: 5) 11 (2013: 6) 25 (2013: 21)
EXECuTivE rEmuNEraTiONAll employees of the Group are employed by Argosy Property Management Limited. The number of employees or former employees of the Group, not being directors, who received remuneration and any other benefits in their capacity as employees of $100,000 per annum or more are set out below:
31-Mar-14 31-Mar-13
$ 100,000 $ 110,000 1 1
$ 110,001 $ 120,000 2 2
$ 120,001 $ 130,000 1 –
$ 130,001 $ 140,000 – 1
$ 150,001 $ 160,000 1 –
$ 160,001 $ 170,000 1 –
$ 170,001 $ 180,000 1 –
$ 180,001 $ 190,000 – 4
$ 200,001 $ 210,000 4 –
$ 270,001 $ 280,000 – 1
$ 330,001 $ 340,000 – 1
$ 520,001 $ 530,000 1 –
$ 590,001 $ 600,000 1 –
13 10

71
iNTErESTS rEGiSTErSDirectors’ shareholdingsEquity securities in which each director and associated person of each director held a relevant interest as at 31 March 2014 are listed below:
Director holder Trustees interest Number Shares
Phillip Michael smith FNZ custodians Limited for trustees of the Mallowdale trust
Philip Michael smith and Dale Gaye D’rose
Non beneficial 242,579
Peter Brook Peter Brook n/a Beneficial 116,072
FNZ custodians Limited for trustees of the Bayview trust
Peter clynton Brook, Mary Patricia Brook, samuel John Goldwater, Nicholas Paul Goldwater
Non beneficial 360,288
Andrew Mark cross Nil Nil Nil Nil
Andrew evans hardwick trust hardwick trustees Limited Non beneficial 80,768
chris hunter Nil Nil Nil Nil
Jeff Morrison Investment custodial services Limited for the suzanne Fisher trust
Jeff Morrison and Barry Fisher
Non beneficial 437,792
JM thompson trust Jeff Morrison, Frederick Mcelrea
Non beneficial 251,892
trevor scott essex castle Limited n/a Beneficial (indirect) 2,057,142
southern capital Limited n/a Beneficial (indirect) 4,012,414
Fraser smith holdings Limited
n/a Non beneficial 588,859
Julian smith Julian smith Non beneficial 526,700
Julian smith Family trust custodian Limited
Julian smith, trevor scott, stuart Walker for the Julian smith Family trust
Non beneficial 1,736,732
Julian smith Investment trust custodian Limited
Julian smith, trevor scott, stuart Walker for the Julian smith Investment trust
Non beneficial 526,700

COrPOraTE GOvErNaNCE
72
ARGOSY PROPERTY LIMITED | ANNUAL REPORT 2014
DirECTOrS’ SharE DEaliNGSThe Directors entered into the following share dealings which relate to the acquisition of shares in the Company during the year:
- Michael Smith acquired a non-beneficial (trust) interest in 30,322 shares in the Company on 9 August 2013 for consideration of $26,986.58 under the Company’s pro-rata renounceable rights offer.
- Peter Brook acquired a beneficial interest in 1,438 shares in the Company on 26 June 2013 for consideration of $1,429.52 under the Company’s dividend reinvestment plan.
- Peter Brook acquired a beneficial interest in 13,819 shares in the Company on 9 August 2013 for consideration of $12,298.91 under the Company’s pro-rata renounceable rights offer.
- Peter Brook acquired a non-beneficial (trust) interest in 45,036 shares in the Company on 9 August 2013 for consideration of $40,082.04 under the Company’s pro-rata renounceable rights offer.
- Peter Brook acquired a beneficial interest in 1,773 shares in the Company on 25 September 2013 for consideration of $1,658.37 under the Company’s dividend reinvestment plan.
- Peter Brook acquired a beneficial interest in 1,841 shares in the Company on 19 December 2013 for consideration of $1,684.97 under the Company’s dividend reinvestment plan.
- Peter Brook acquired a beneficial interest in 1,900 shares in the Company on 26 March 2014 for consideration of $1,712.58 under the Company’s dividend reinvestment plan.
- Andrew Evans acquired a non-beneficial (trust) interest in 1,001 shares in the Company on 26 June 2013 for consideration of $994.73 under the Company’s dividend reinvestment plan.
- Andrew Evans acquired a non-beneficial (trust) interest in 9,616 shares in the Company on 9 August 2013 for consideration of $8,558.24 under the Company’s pro-rata renounceable rights offer.
- Andrew Evans acquired a non-beneficial (trust) interest in 1,233 shares in the Company on 25 September 2013 for consideration of $1,153.98 under the Company’s dividend reinvestment plan.
- Andrew Evans acquired a non-beneficial (trust) interest in 1,281 shares in the Company on 19 December 2013 for consideration of $1,172.48 under the Company’s dividend reinvestment plan.
- Andrew Evans acquired a non-beneficial (trust) interest in 1,322 shares in the Company on 26 March 2014 for consideration of $1,191.69 under the Company’s dividend reinvestment plan.
- Jeff Morrison disclosed a non-beneficial (trust) interest in 240,012 shares in the Company on 20 July 2013 on his appointment as director of the Company.
- Jeff Morrison disclosed a non-beneficial (trust) interest in 383,068 shares in the Company on 20 July 2013 on his appointment as director of the Company.
- Jeff Morrison acquired a non-beneficial (trust) interest in 54,724 shares in the Company on 9 August 2013 for consideration of $48,704.36 under the Company’s pro-rata renounceable rights offer.
- Jeff Morrison acquired a non-beneficial interest in 3,848 shares in the Company on 25 September 2013 for consideration of $3,600.18 under the Company’s dividend reinvestment plan.
- Jeff Morrison acquired a non-beneficial interest in 3,998 shares in the Company on 19 December 2013 for consideration of $3,657.90 under the Company’s dividend reinvestment plan.
- Jeff Morrison acquired a non-beneficial interest in 4,124 shares in the Company on 26 March 2014 for consideration of $3,717.87 under the Company’s dividend reinvestment plan.
- Trevor Scott acquired a beneficial (indirect) interest in 257,142 shares in the Company on 9 August 2013 for consideration of $228,856.38 under the Company’s pro-rata renounceable rights offer (held by Essex Castle Limited).
- Trevor Scott acquired a beneficial (indirect) interest in 501,551 shares in the Company on 9 August 2013 for consideration of $446,380.39 under the Company’s pro-rata renounceable rights offer (held by Southern Capital Limited).
- Trevor Scott acquired a non-beneficial interest in 73,607 shares in the Company on 9 August 2013 for consideration of $65,510.23 under the Company’s pro-rata renounceable rights offer (held by Fraser Smith Holdings Limited).
- Trevor Scott acquired a non-beneficial interest in 65,837 shares in the Company on 9 August 2013 for consideration of $58,594.93 under the Company’s pro-rata renounceable rights offer (held by Julian Smith).
- Trevor Scott acquired a non-beneficial interest in 217,091 shares in the Company on 9 August 2013 for consideration of $193,210.99 under the Company’s pro-rata renounceable rights offer (held by Julian Smith Family Trust Custodian Limited).
- Trevor Scott acquired a non-beneficial interest in 65,837 shares in the Company on 9 August 2013 for consideration of $58,594.93 under the Company’s pro-rata renounceable rights offer (held by Julian Smith Investment Trust Custodian Limited).

73
DirECTOrS’ iNTErESTSThe Directors have declared interests in the entities listed below. Where (R) is included next to the interest, the Director has ceased to have that interest during the year.
Director interest Entity
Michael smith Director Greymouth Petroleum LimitedDirector Maui capital Indigo Fund LimitedDirector Maui capital Aqua Fund LimitedDirector hauraki Private equity No.2 Fundchairman the Lion Foundation (r)
Peter Brook trustee Melanesia Mission trust Boardchairman trust Investments Management Limitedchairman Burger Fuel Worldwide Limitedchairman Generate Investment Management Limited
Mark cross chairman superannuation Investments Limitedchairman MFL Mutual Fund LimitedDirector Alpha Investment Partners LimitedDirector Aspect Productivity technology LimitedDirector Infracom NZ LimitedDirector Milford Asset Management LimitedDirector triathlon New Zealand Inc.
Andrew evans Director Vital healthcare Management LimitedDirector eVcO consultancy LimitedDirector holmes Group LimitedDirector 305 LimitedDirector 403 reM LimitedDirector evmanone LimitedDirector hardwick trustees LimitedDirector holmes Fire & safety LimitedDirector trust Investments Management LimitedDirector holmes GP Fire LimitedDirector hughes & cossar Limited
chris hunter Director hunter corporation LimitedDirector Airwork holdings LimitedDirector Amalgamated Builders Limited
Jeff Morrison Director Matuku trustee LimitedDirector Izard Investments LimitedDirector Izard Pastoral Limited (r)Director Morrison Farm Park LimitedDirector FIL Ventures Limited Director Fisher International LimitedDirector tracy Family trust trustee company LimitedDirector MFI trustee LimitedDirector Waiotira Forests Limited
trevor scott chairman Arthur Barnett Limitedchairman harraway & sons Limitedchairman roslyn storage Limitedchairman Whitestone cheese Limitedchairman Ashburton Guardian company Limitedchairman Mercy hospital Dunedin Limited (r)Director Neuren Pharmaceuticals LimitedDirector Marsh Limited – Advisory Board (r)
COrPOraTE GOvErNaNCE
74
ARGOSY PROPERTY LIMITED | ANNUAL REPORT 2014
iNfOrmaTiON uSED By DirECTOrSNo Director requested to use information received in his or her capacity as a director that would not otherwise be available to the Director.
iNDEmNiTiES aND iNSuraNCE - The Company effected indemnities for directors
and employees for liability (including defence costs) arising in respect of acts or omissions while acting in the capacity of a director employee.
- The Company effected insurance for directors and employees for liability (including defence costs) arising in respect of acts or omissions while acting in the capacity of a director employee, with a sub-limit for defence costs.
EXTErNal auDiT firm GuiDEliNESIn addition to the formal constitution under which the Audit Committee operates, the Audit Committee has adopted an External Auditor Independence Policy containing procedures to ensure the independence of the Company’s external auditor.
The Audit Committee is responsible for recommending the appointment of the external auditor and maintaining procedures for the rotation of the external audit lead partner. Under the Auditor Independence Policy, the external audit lead partner must be rotated every five years.
The policy covers provision of non-audit services with the general principle being that the external auditor should not have any involvement in the production of financial information or preparation of financial statements such that they might be perceived as auditing their own work. It is, however, appropriate for the external auditor to provide services of due diligence on proposed transactions and accounting policy advice.
Deloitte has been appointed as the Company’s external auditor.
iNvESTOr rElaTiONSThe Board aims to ensure that investors are informed of all information necessary to assess the Company’s performance.
It does so through a communication strategy which includes:
- Periodic and continuous disclosure to NZX in accordance with the continuous disclosure requirements;
- Information provided to analysts and media; - Annual and interim reports distributed to
shareholders;
- The annual shareholders’ meeting and any other meetings called to obtain approval for Company actions as appropriate;
- Notices and explanatory memoranda for annual and special meetings;
- Investor roadshows; - The Company’s website www.argosy.co.nz; and - Periodic Investor Update newsletters.
Shareholders have the opportunity to question Directors on the management of the Company at annual and special meetings.
NZX ruliNGS aND waivErSNZX has by a decision dated 1 July 2013 granted a waiver from NZX Main Board Listing Rule 9.2.1 in respect of the Company’s underwritten pro-rata renounceable rights offer. Under the waiver, the Company was not required to obtain shareholder approval in order for MFL Mutual Fund Limited (MFL) to be able to participate in the shortfall bookbuild or act as a sub-underwriter of the offer. Shareholder approval would otherwise have been required, because MFL is a Related Party of the Company (being a substantial security holder in the Company).
DONaTiONSThe Company is a Super Six Sponsor of the Red Beach Surf Lifesaving Club Inc, for a term of three years. The Company contributed $28,000 in the 2014 financial year, and will contribute the same amount in each of the next two financial years.
arGOSy SuBSiDiariES – DirECTOrSAs at 31 March 2014:
- Michael Smith, Peter Brook, Andrew Evans, Peter Mence and David Fraser were the directors of Argosy Property No. 1 Limited.
- Michael Smith, Peter Brook, Andrew Evans, Peter Mence and David Fraser were the directors of Argosy Property No. 3 Limited.
- Michael Smith, Peter Brook, Trevor Scott, Andrew Evans, Peter Mence and David Fraser were the directors of Argosy Property Management Limited.
- Michael Smith, Peter Brook, Peter Mence and David Fraser were the directors of Argosy Property Unit Holdings Limited.
No director of any Argosy subsidiary received additional remuneration or benefits in respect of their directorships. The directors of Argosy’s subsidiaries who are not also directors of the Company have no interests recorded in the interest registers of those companies.

75
arGOSy PrOPErTy limiTED | ANNUAL REPORT 2014
iNvESTOr STaTiSTiCS
20 larGEST rEGiSTErED SECuriTy hOlDErS aS aT 12 may 2014
rank full Name No of shares
% of total issued shares
1 New Zealand central securities Depository Limited 337,853,677 42.71
2 Investment custodial services Limited <A/c c> 27,076,509 3.42
3 custodial services Limited <A/c 3> 20,627,243 2.60
4 FNZ custodians Limited 19,744,558 2.49
5 Forsyth Barr custodians Limited <1-33> 17,737,736 2.24
6 Forsyth Barr custodians Limited <1-17.5> 13,387,393 1.69
7 custodial services Limited <A/c 2> 9,565,659 1.20
8 Forsyth Barr custodians Limited <1-30> 5,779,859 0.73
9 James harvey Mansell & christine Anne Mansell & Douglas tony Brown <harvan A/c> 5,765,000 0.72
10 custodial services Limited <A/c 4> 5,574,002 0.70
11 Peter John Whiting & Janet Graham Whiting & Peter Austin Gowing <Whiting Family A/c> 5,553,714 0.70
12 University of Otago Foundation trust 5,331,337 0.67
13 custodial services Limited <A/c 18> 5,238,965 0.66
14 superlife trustee Nominees Limited <sl Prop A/c> 4,844,232 0.61
15 southern capital Limited 4,012,414 0.50
16 Investment custodial services Limited <A/c r> 3,370,326 0.42
17 NZPt custodians (Grosvenor) Limited 3,222,984 0.40
18 Jarden custodians Limited <A/c 7> 3,200,000 0.40
19 custodial services Limited <A/c 1> 3,137,492 0.39
20 Jarden custodians Limited <A/c 6> 3,000,000 0.37
5 larGEST SECuriTy hOlDErS DiSClOSED By ThE NEw ZEalaND CENTral SECuriTiES DEPOSiTOry limiTED aS aT 12 may 2014
rank holder Name No of shares
% of total issued shares
1 Accident compensation corporation – NZcsD 65,280,529 8.25
2 MFL Mutual Fund Limited – NZcsD 44,545,345 5.63
3 Guardian Nominees No.2 Limited – NZcsD 40,412,511 5.11
4 BNP Paribas Nominees (NZ) Limited – NZcsD 40,062,679 5.07
5 tea custodians Limited – NZcsD 30,720,285 3.88
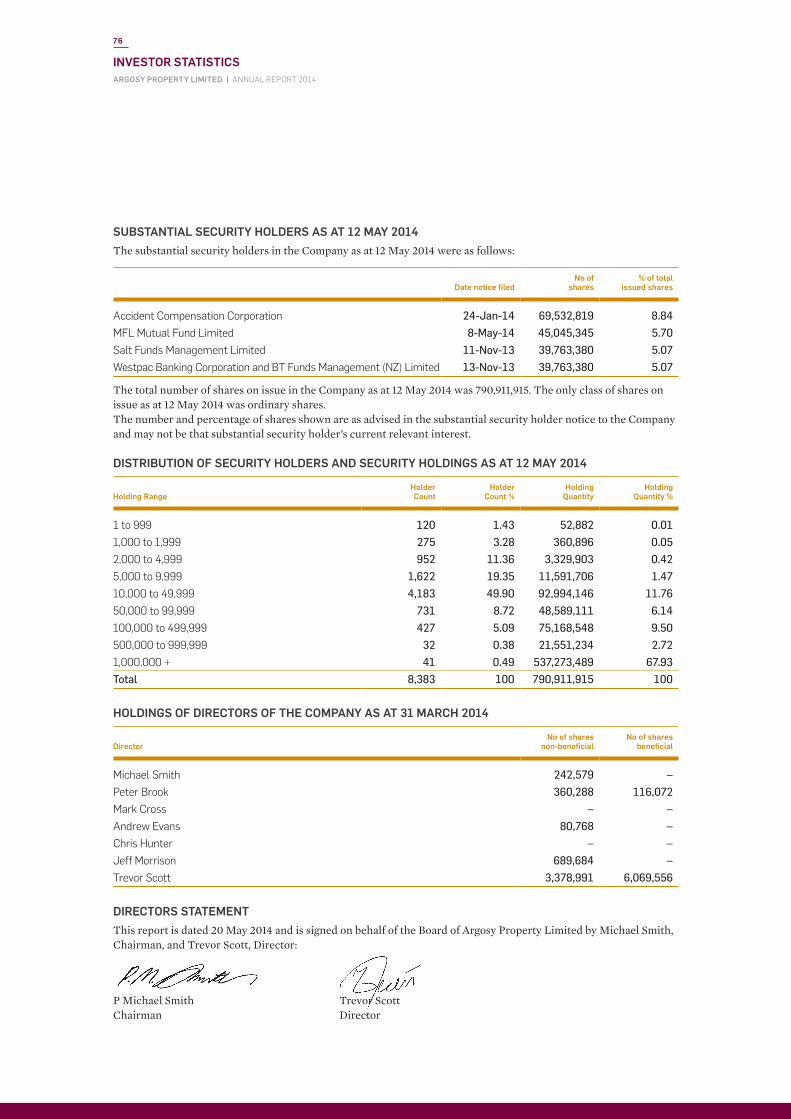
76
arGOSy PrOPErTy limiTED | ANNUAL REPORT 2014
iNvESTOr STaTiSTiCS
SuBSTaNTial SECuriTy hOlDErS aS aT 12 may 2014The substantial security holders in the Company as at 12 May 2014 were as follows:
Date notice filedNo of
shares% of total
issued shares
Accident compensation corporation 24-Jan-14 69,532,819 8.84
MFL Mutual Fund Limited 8-May-14 45,045,345 5.70
salt Funds Management Limited 11-Nov-13 39,763,380 5.07
Westpac Banking corporation and Bt Funds Management (NZ) Limited 13-Nov-13 39,763,380 5.07
The total number of shares on issue in the Company as at 12 May 2014 was 790,911,915. The only class of shares on issue as at 12 May 2014 was ordinary shares.The number and percentage of shares shown are as advised in the substantial security holder notice to the Company and may not be that substantial security holder’s current relevant interest.
DiSTriBuTiON Of SECuriTy hOlDErS aND SECuriTy hOlDiNGS aS aT 12 may 2014
holding rangeholder Count
holder Count %
holding quantity
holding quantity %
1 to 999 120 1.43 52,882 0.01
1,000 to 1,999 275 3.28 360,896 0.05
2,000 to 4,999 952 11.36 3,329,903 0.42
5,000 to 9,999 1,622 19.35 11,591,706 1.47
10,000 to 49,999 4,183 49.90 92,994,146 11.76
50,000 to 99,999 731 8.72 48,589,111 6.14
100,000 to 499,999 427 5.09 75,168,548 9.50
500,000 to 999,999 32 0.38 21,551,234 2.72
1,000,000 + 41 0.49 537,273,489 67.93
Total 8,383 100 790,911,915 100
hOlDiNGS Of DirECTOrS Of ThE COmPaNy aS aT 31 marCh 2014
DirectorNo of shares
non-beneficialNo of shares
beneficial
Michael smith 242,579 –
Peter Brook 360,288 116,072
Mark cross – –
Andrew evans 80,768 –
chris hunter – –
Jeff Morrison 689,684 –
trevor scott 3,378,991 6,069,556
DirECTOrS STaTEmENTThis report is dated 20 May 2014 and is signed on behalf of the Board of Argosy Property Limited by Michael Smith, Chairman, and Trevor Scott, Director:
P Michael Smith Trevor Scott Chairman Director

77
ARGOSY PROPERTY LIMITED | ANNUAL REPORT 2014
DIRECTORY
designedbyinsight.com
A
RG07
0
DIRECTORS
Argosy Property LimitedPhilip Michael Smith, Auckland (Chair)Peter Clynton Brook, AucklandAndrew Mark Cross, AucklandAndrew Hardwick Evans, AucklandChristopher Brent Hunter, AucklandJeffrey Robert Morrison, AucklandTrevor Donald Scott, Wanaka
REGISTERED OFFICE
Argosy Property Limited39 Market PlaceAuckland 1010PO Box 90214Victoria Street WestAuckland 1142Telephone: (09) 304 3400Facsimile: (09) 302 0996
REGISTRAR
Computershare Investor Services Limited159 Hurstmere RoadNorth ShorePrivate Bag 92119Victoria St West Auckland 1142Telephone: (09) 488 8777Facsimile: (09) 488 8787
AUDITOR
DeloitteDeloitte Centre80 Queen StreetPrivate Bag 115-003Auckland 1040Telephone: (09) 303 0700Facsimile: (09) 303 0701
LEGAL ADVISERS
Harmos Horton LuskVero Centre48 Shortland StreetPO Box 28 Shortland StreetAuckland 1140Telephone: (09) 921 4300Facsimile: (09) 921 4319
Russell McVeaghVero Centre48 Shortland StreetPO Box 8 Shortland StreetAuckland 1140Telephone: (09) 367 8000Facsimile: (09) 367 8163
BANKERS TO THE COMPANY
ANZ Bank New Zealand LimitedANZ House23–29 Albert StreetPO Box 6243 Wellesley StreetAuckland 1141
Bank of New Zealand LimitedDeloitte Centre80 Queen StreetPrivate Bag 99208Auckland 1142
The Hongkong and Shanghai Banking Corporation LimitedHSBC House1 Queen StreetPO Box 5947Wellesley StreetAuckland 1141

39 MARKET PLACEPO BOx 90214, VICTORIA STREET WEST, AuCKLAnd 1142P / 09 304 3400F / 09 302 0996
www.argosy.co.nz