annual report 2014 - barilla group of independent auditors 82. 6 “give people food that you would...
TRANSCRIPT

1
Annual Report 2014Annual Report 2014

2

3
Annual Report 2014
Bilancio 2014

4
Pasta, the heart of Barilla’s production in the world.

5
Summary
Chairman’s letter 7
Directors and officers 10
Directors’ Report 17Transactions involving subsidiaries 18Accounting standards - International Financial Reporting Standards (IFRS) 18General information 18Consolidated financial highlights 18Our brands 20Group structure and organisation 22Economic scenario 22Group operating activities review 22Capital expenditure 24Corporate governance 24Knowledge sharing and sustainability of the Barilla business 24Risk management 27Significant events after the balance sheet date 28Management outlook 28Other significant operating events 28Related party transactions 28
Consolidated financial statementsfor the year ended 31 December 2014 32
Consolidated statement of financial position 32Consolidated income statement 34Income statement of discontinued operations 34Statement of comprehensive income 35Statement of changes in net equity 36Consolidated cash flow statement 37Cash flows generated from discontinued operations 37
Illustrative notes 391. Group structure and business 392. Significant events after the balance sheet date 393. Declaration of compliance with International Financial Reporting Standards (IFRS) 394. Basis of preparation - Accounting and valuation policies 395. Change in the scope of consolidation 486. Notes to the consolidated financial statements 487. Financial instruments and net financial position 688. Disclosures in accordance with IAS 24 for related party transactions and key management compensation 74
Annexes 1. List of consolidated companies 762. List of investments in associated and other companies 793. Currency rates of exchange 80
Report of Independent Auditors 82

6
“Give people food that you would give your own children” (Pietro Barilla)
From the left: Paolo Barilla (Deputy chairman), Luca Barilla (Deputy chairman),
Guido Maria Barilla (Chairman), Claudio Colzani (Chief executive officer).

7
Chairman’s letter
In 2014, the global economic scenario remained very challenging. In Europe, the risk of deflation led to the adoption of unprecedented measures by the European Central Bank. America has yet to fully recover from a devastating financial crisis. Asia continues to slow down: the growth rate in China, on average above 10% between 2000 and 2010, is now below 7%. The price of durum wheat rose significantly, putting pressure on our margins. In the first months of 2015, there have been some tentative signs of recovery, but global political instability weighs on the growth prospects for the world economy. Despite such difficulties, we have solid roots that enable us to weather the storm, as shown by the 2014 results. Revenues stood at euro 3,254 million, up 2% from 2013 on a like-for-like basis and excluding the exchange rate effect. In 2014, earnings before interest, tax, depreciation and amortization (EBITDA), accounted on average for 13.1% of revenues, compared to 12.7 % in the previous year (euro 427 million vs. euro 409 million in 2013).During 2014, the Barilla Group continued to invest strongly, giving priority to the expansion of its production and storage capacity: from new production lines for bread in France and for pasta in Russia, to new wheat silos in our main production plant in Parma.In Italy, where the recovery from the economic downturn has been slower than in other countries, Barilla has managed to maintain its positions, with better results compared to the market average. In the rest of the world, sales are growing. These results are a confirmation of the effectiveness of our “Good for You, Good for the Planet” strategy and of loyalty to our brand. Our company has a strong presence in the markets in which it operates: it is accepted, respected and promoted by local communities, who recognize its reliability and values. From an organizational point of view, the Group has found a proper balance between global and local, helping us to improve our ability to listen and understand, and to adapt
our products to people’s preferences, without altering their Italian identity. From common wheat egg pasta in Brazil, to pasta “Pronto” in China and the United States, as well as gluten-free pasta in our key markets. Results were also achieved thanks to the success of our new bakery products, such as “Focaccelle” in Italy: in less than a year from its launch, more than 4 million people have purchased the product. In 2014, we also entered the British market in a structured way and the success of the first Academia Barilla restaurant in New York has paved the way for new openings.In 2014, the Barilla Center for Food and Nutrition Foundation handed the Milan Protocol to the Italian Government, a document that inspired the Milan Charter, which aims to be the most significant legacy of the Universal Exposition taking place in Milan from May to October (EXPO 2015). “Give people food you would give your own children”. These are our father’s words, which still inspire us every day. Our commitment is to achieve total quality, with excellent products in terms of taste, but also safe, balanced and with a lifecycle that respects - from a social and an environmental point of view - all the players of the supply chain as well as the planet’s resources. Quality and the right combination of tradition and innovation have always been the cornerstones of the Barilla Group’s mission. The performance of 2014 and of the first few months of 2015 confirm, once again, that we have laid very solid foundations for further growth in the future.
Guido Barilla

8 9
The Prime Minister Matteo Renzi gives his support to the Milan Protocol on food and nutrition,launched by the Barilla Center for Food and Nutrition Foundation.

10
Directors and officers
BARILLA HOLDING S.P.A.
Board of directors
Chairman Guido Maria Barilla
Deputy chairmen Luca Barilla Paolo Barilla Chief executive officer Claudio Colzani Director Emanuela Barilla
Board of statutory auditors
Chairman Luigi Capitani
Auditors Alberto Pizzi Augusto Schianchi
BARILLA G. E R. FRATELLI S.P.A.
Board of directors
Chairman Guido Maria Barilla
Deputy chairmen Luca Barilla Paolo Barilla
Chief executive officer Claudio Colzani
Directors Emanuela Barilla Antonio Belloni Nicolaus Issenmann Andrea Pontremoli
Board of statutory auditors
Chairman Augusto Schianchi
Auditors Mario Tardini Marco Ziliotti
Independent auditors
KPMG S.p.A.
Barilla’s history in a nutshell, since 1877

11
Barilla’s history in a nutshell, since 1877Barilla’s history in a nutshell, since 1877
12 13
1877
1910
1947
195870
93
1975
1971 1979
2010
2000
T H E B E G I N N I N G S
P O S T W O R L D W A R I I Y E A R S
T H E M U L I N O B I A N C O E R A B E G I N S
B A R I L L A B E C O M E SA M E R I C A N
G U I D O , L U C A A N D P A O L OA T T H E H E L MO F T H E C O M P A N Y
R I C C A R D OA T T H E H E L MO F B A R I L L A
B A R I L L A I T A L I A NL E A D E R
B A R I L L AR E T U R N S T O I T A L YT H A N K S T O P I E T R O T O D A Y
B A R I L L A I N T E R N A T I O N A LC O M P A N Y
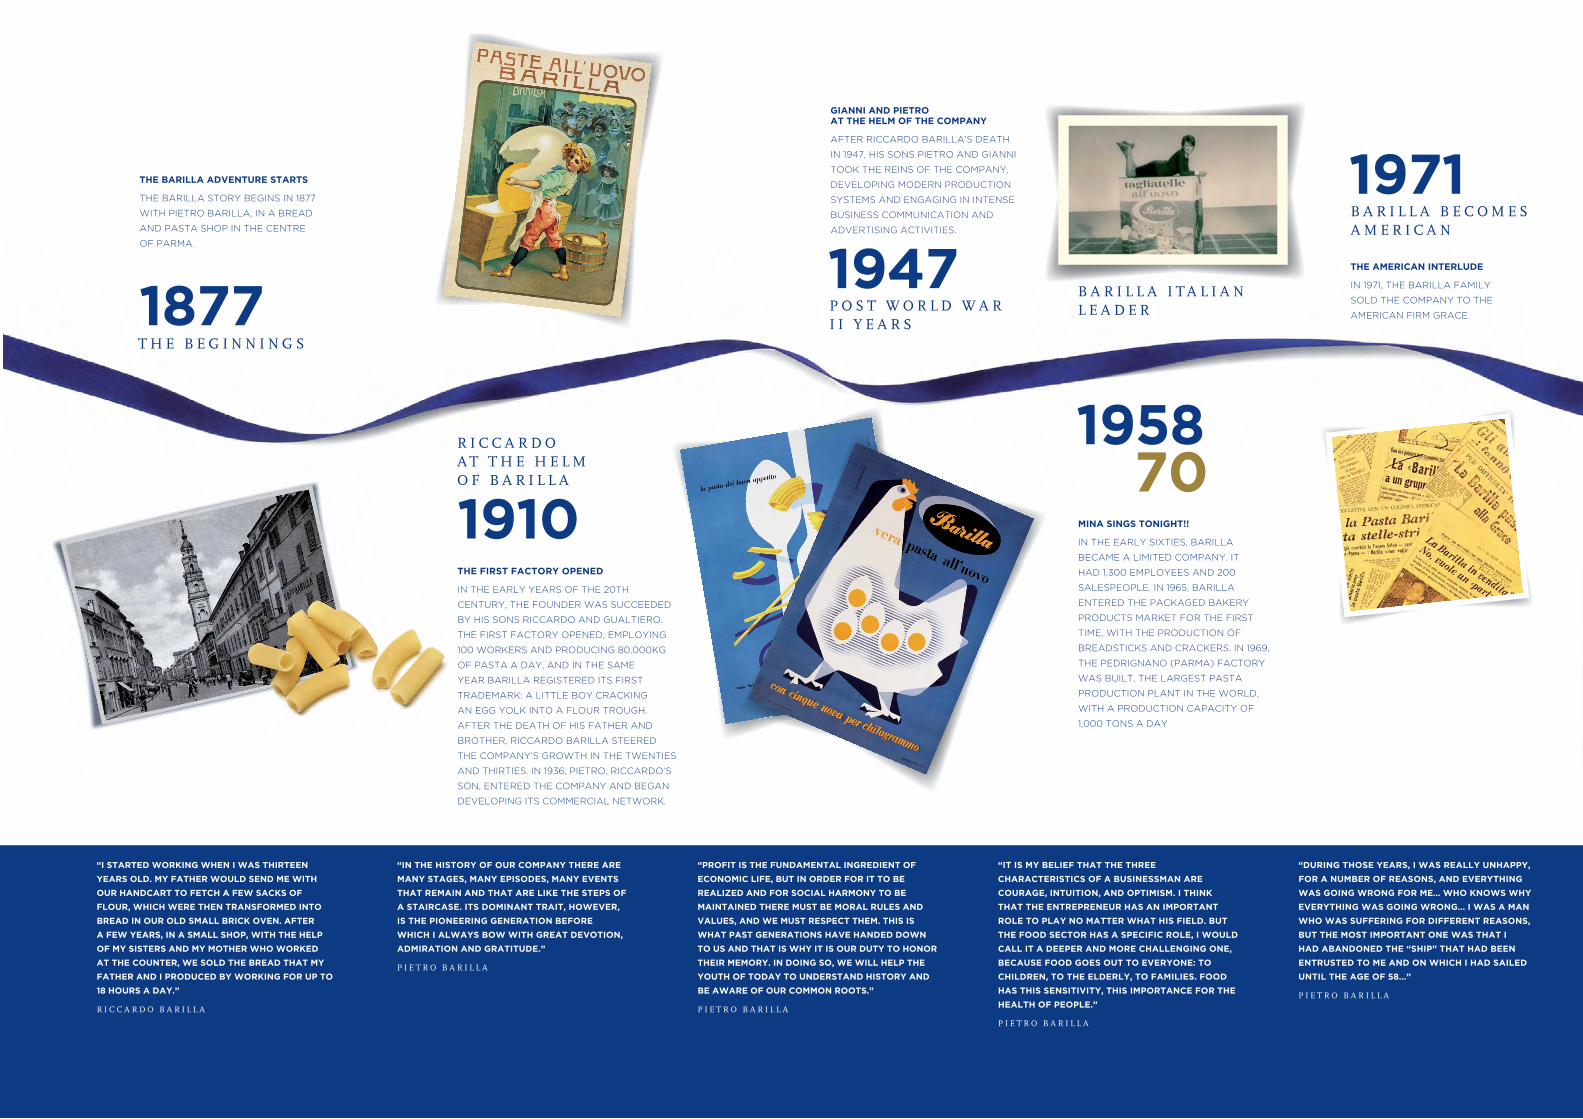
THE BARILLA ADVENTURE STARTS
THE BARILLA STORY BEGINS IN 1877
WITH PIETRO BARILLA, IN A BREAD
AND PASTA SHOP IN THE CENTRE
OF PARMA.
THE FIRST FACTORY OPENED
IN THE EARLY YEARS OF THE 20TH
CENTURY, THE FOUNDER WAS SUCCEEDED
BY HIS SONS RICCARDO AND GUALTIERO.
THE FIRST FACTORY OPENED, EMPLOYING
100 WORKERS AND PRODUCING 80,000KG
OF PASTA A DAY, AND IN THE SAME
YEAR BARILLA REGISTERED ITS FIRST
TRADEMARK: A LITTLE BOY CRACKING
AN EGG YOLK INTO A FLOUR TROUGH.
AFTER THE DEATH OF HIS FATHER AND
BROTHER, RICCARDO BARILLA STEERED
THE COMPANY’S GROWTH IN THE TWENTIES
AND THIRTIES. IN 1936, PIETRO, RICCARDO’S
SON, ENTERED THE COMPANY AND BEGAN
DEVELOPING ITS COMMERCIAL NETWORK.
CREATION OF THE BARILLA CENTER FOR FOOD AND NUTRITION
THE YEAR 2009 SAW THE LAUNCH OF
THE BARILLA CENTER FOR FOOD AND
NUTRITION (BCFN), A MULTIDISCIPLINARY
RESEARCH CENTRE COMMITTED
DEBATE OF TOPICS
RELATED TO FOOD
AND NUTRITION. IMPORTANT ACQUISITIONS
THE NINETIES AND THE FIRST DECADE
OF THE NEW MILLENNIUM WERE
CHARACTERIZED BY A STRONG
INTERNATIONALIZATION PROCESS,
WITH THE GROWTH OF BARILLA’S
PRESENCE IN EUROPEAN AND US
MARKETS, THE OPENING OF NEW
PRODUCTION PLANTS AND THE
ACQUISITION OF IMPORTANT BRANDS
SUCH AS PAVESI (ITALY), MISKO
(GREECE), FILIZ (TURKEY), WASA
(SWEDEN), YEMINA AND VESTA
(MEXICO), LIEKEN (GERMANY) AND
HARRYS (FRANCE).
MINA SINGS TONIGHT!!
IN THE EARLY SIXTIES, BARILLA
BECAME A LIMITED COMPANY. IT
HAD 1,300 EMPLOYEES AND 200
SALESPEOPLE. IN 1965, BARILLA
ENTERED THE PACKAGED BAKERY
PRODUCTS MARKET FOR THE FIRST
TIME, WITH THE PRODUCTION OF
BREADSTICKS AND CRACKERS. IN 1969,
THE PEDRIGNANO (PARMA) FACTORY
WAS BUILT, THE LARGEST PASTA
PRODUCTION PLANT IN THE WORLD,
WITH A PRODUCTION CAPACITY OF
1,000 TONS A DAY
THE RELAUNCH
IN 1979, PIETRO BARILLA RETURNED
TO THE HELM OF THE COMPANY. THE
HISTORIC RE-ACQUISITION COINCIDED
WITH THE RESUMPTION OF A LONG-TERM
INDUSTRIAL AND ADVERTISING
STRATEGY, BASED ON THE IDEA
OF RE-LAUNCHING PASTA AND
THE ITALIAN FIRST COURSE AND
DEVELOPING THE OFFER OF
BAKERY PRODUCTS.
GIANNI AND PIETRO AT THE HELM OF THE COMPANY
AFTER RICCARDO BARILLA’S DEATH
IN 1947, HIS SONS PIETRO AND GIANNI
TOOK THE REINS OF THE COMPANY,
DEVELOPING MODERN PRODUCTION
SYSTEMS AND ENGAGING IN INTENSE
BUSINESS COMMUNICATION AND
ADVERTISING ACTIVITIES. MULINO BIANCO IS CREATED
1975 SAW THE LAUNCH OF MULINO
BIANCO, A NEW BAKERY PRODUCTS
LINE, INCLUDING BISCUITS, BREAD
SUBSTITUTES AND SNACKS,
CHARACTERIZED BY AUTHENTICITY
AND RECIPES WITH NATURAL
INGREDIENTS, USING THE EXPERIENCE
BARILLA HAS GAINED IN CENTURIES
OF CEREAL PROCESSING.
THE AMERICAN INTERLUDE
IN 1971, THE BARILLA FAMILY
SOLD THE COMPANY TO THE
AMERICAN FIRM GRACE.
IN 1993, AFTER THE DEATH OF PIETRO
BARILLA, LEADERSHIP OF THE
COMPANY PASSED INTO THE HANDS
OF HIS SONS GUIDO, LUCA AND
PAOLO.
“I STARTED WORKING WHEN I WAS THIRTEEN
YEARS OLD. MY FATHER WOULD SEND ME WITH
OUR HANDCART TO FETCH A FEW SACKS OF
FLOUR, WHICH WERE THEN TRANSFORMED INTO
BREAD IN OUR OLD SMALL BRICK OVEN. AFTER
A FEW YEARS, IN A SMALL SHOP, WITH THE HELP
OF MY SISTERS AND MY MOTHER WHO WORKED
AT THE COUNTER, WE SOLD THE BREAD THAT MY
FATHER AND I PRODUCED BY WORKING FOR UP TO
18 HOURS A DAY.”
R I C C A R D O B A R I L L A
“IN THE HISTORY OF OUR COMPANY THERE ARE
MANY STAGES, MANY EPISODES, MANY EVENTS
THAT REMAIN AND THAT ARE LIKE THE STEPS OF
A STAIRCASE. ITS DOMINANT TRAIT, HOWEVER,
IS THE PIONEERING GENERATION BEFORE
WHICH I ALWAYS BOW WITH GREAT DEVOTION,
ADMIRATION AND GRATITUDE.”
P I E T R O B A R I L L A
“PROFIT IS THE FUNDAMENTAL INGREDIENT OF
ECONOMIC LIFE, BUT IN ORDER FOR IT TO BE
REALIZED AND FOR SOCIAL HARMONY TO BE
MAINTAINED THERE MUST BE MORAL RULES AND
VALUES, AND WE MUST RESPECT THEM. THIS IS
WHAT PAST GENERATIONS HAVE HANDED DOWN
TO US AND THAT IS WHY IT IS OUR DUTY TO HONOR
THEIR MEMORY. IN DOING SO, WE WILL HELP THE
YOUTH OF TODAY TO UNDERSTAND HISTORY AND
BE AWARE OF OUR COMMON ROOTS.”
P I E T R O B A R I L L A
“IT IS MY BELIEF THAT THE THREE
CHARACTERISTICS OF A BUSINESSMAN ARE
COURAGE, INTUITION, AND OPTIMISM. I THINK
THAT THE ENTREPRENEUR HAS AN IMPORTANT
ROLE TO PLAY NO MATTER WHAT HIS FIELD. BUT
THE FOOD SECTOR HAS A SPECIFIC ROLE, I WOULD
CALL IT A DEEPER AND MORE CHALLENGING ONE,
BECAUSE FOOD GOES OUT TO EVERYONE: TO
CHILDREN, TO THE ELDERLY, TO FAMILIES. FOOD
HAS THIS SENSITIVITY, THIS IMPORTANCE FOR THE
HEALTH OF PEOPLE.”
P I E T R O B A R I L L A
“DURING THOSE YEARS, I WAS REALLY UNHAPPY,
FOR A NUMBER OF REASONS, AND EVERYTHING
WAS GOING WRONG FOR ME… WHO KNOWS WHY
EVERYTHING WAS GOING WRONG… I WAS A MAN
WHO WAS SUFFERING FOR DIFFERENT REASONS,
BUT THE MOST IMPORTANT ONE WAS THAT I
HAD ABANDONED THE “SHIP” THAT HAD BEEN
ENTRUSTED TO ME AND ON WHICH I HAD SAILED
UNTIL THE AGE OF 58...”
P I E T R O B A R I L L A
“THE BRAND MUST BE ABLE TO BUILD
RELATIONSHIPS, NOT JUST TRANSACTIONS, WITH
CONSUMERS; AND OUR FUTURE IS DEPENDENT ON
OUR CONTINUING TO CREATIVELY RENEW THE
WAY WE COMPETE.”
G U I D O B A R I L L A
“THE RETURN WAS NOT EASY. MEETINGS, OBSTACLES,
FINANCE, MONEY, TRIPS: NEW YORK, ZURICH... AS
I WISHED MY CHILDREN TO BE WITNESSES OF THIS
ADVENTURE, THEY CAME ALONG ON MANY OF THESE
TRIPS. AT THE END OF 1978 I DID NOT HAVE THE
AMOUNT NEEDED. IN FRONT OF THE LEADERS OF
GRACE I WAS SO DISAPPOINTED THAT I CRIED. ONE OF
THEM, MR GRAFF – AN EXCELLENT MAN – UNDERSTOOD
MY PREDICAMENT AND CALLED ME ASIDE IN HIS OFFICE
AND SAID TO ME: “DON’T LOSE HEART, WE’LL SEE WHAT
WE CAN DO...” IT WAS THE END OF 1978 AND IN JULY
1979 WE MANAGED TO CLOSE THE DEAL.”
P I E T R O B A R I L L A
“I DON’T THINK THAT MY CHILDREN HAVE A BAD
OPINION OF ME, I LIKE TO THINK THAT THEY TRUST
AND RESPECT ME; THAT THEY BELIEVE IN ME AND
THAT THIS TRANSMISSION OF EXPERIENCES FROM
FATHER TO CHILDREN IS IN EFFECT A TRUTH THAT
CAN BE REALIZED. THE GOAL IS SUCCESSION,
FOR THE FAMILY TO CONTINUE FOR ANOTHER
GENERATION, WHICH MEANS 30-40 YEARS IN THE
COMPANY’S LIFE. THEN THE NEXT GENERATION
WILL PROVIDE… IF IT WILL PROVIDE… FOR THE
SUCCESSION…”
P I E T R O B A R I L L A
“WE WILL BECOME EVER MORE GLOBAL AND
READY TO FACE THE FUTURE BY DEVELOPING OUR
PERFORMANCE IN RELATION TO THE CONSUMER;
NOT BY PURSUING A SIMPLE AND TRADITIONAL
INCREASE IN SIZE, BUT BY ADAPTING OUR
CULTURE OF QUALITY AND OUR PROFESSIONALISM
TO EVER FASTER CHANGES OF SCENARIO.”
G U I D O B A R I L L A
“THE ITALIAN NUTRITIONAL MODEL IS THE ESSENTIAL
POINT OF REFERENCE FOR HEALTHY EATING
HABITS, FOR THE RESPECT AND PROTECTION OF
THE NATURAL RESOURCES OF OUR PLANET AND
FOR SAFEGUARDING THE RIGHTS OF FUTURE
GENERATIONS.”
G U I D O , L U C A A N D P A O L O B A R I L L A
TO THE PROMOTION AND
2014
IN 2014, THE BCFN BECOMES A
FOUNDATION, STRENGTHENING ITS
COMMITMENT TO FIND CONCRETE
SOLUTIONS TO THE WORLD’S MAJOR
FOOD CHALLENGES. THE BCFN
FOUNDATION LAUNCHES THE IDEA
OF SIGNING A GLOBAL FOOD DEAL
AT EXPO 2015 IN MILAN, DUBBED THE
“MILAN PROTOCOL”, WITH THREE
MAIN GOALS:
- CUT FOOD WASTE
- FIGHT HUNGER AND OBESITY
- PROMOTE SUSTAINABLE
AGRICULTURE

14 15
1877
1910
1947
195870
93
1975
1971 1979
2010
2000
T H E B E G I N N I N G S
P O S T W O R L D W A R I I Y E A R S
T H E M U L I N O B I A N C O E R A B E G I N S
B A R I L L A B E C O M E SA M E R I C A N
G U I D O , L U C A A N D P A O L OA T T H E H E L MO F T H E C O M P A N Y
R I C C A R D OA T T H E H E L MO F B A R I L L A
B A R I L L A I T A L I A NL E A D E R
B A R I L L AR E T U R N S T O I T A L YT H A N K S T O P I E T R O T O D A Y
B A R I L L A I N T E R N A T I O N A LC O M P A N Y
THE BARILLA ADVENTURE STARTS
THE BARILLA STORY BEGINS IN 1877
WITH PIETRO BARILLA, IN A BREAD
AND PASTA SHOP IN THE CENTRE
OF PARMA.
THE FIRST FACTORY OPENED
IN THE EARLY YEARS OF THE 20TH
CENTURY, THE FOUNDER WAS SUCCEEDED
BY HIS SONS RICCARDO AND GUALTIERO.
THE FIRST FACTORY OPENED, EMPLOYING
100 WORKERS AND PRODUCING 80,000KG
OF PASTA A DAY, AND IN THE SAME
YEAR BARILLA REGISTERED ITS FIRST
TRADEMARK: A LITTLE BOY CRACKING
AN EGG YOLK INTO A FLOUR TROUGH.
AFTER THE DEATH OF HIS FATHER AND
BROTHER, RICCARDO BARILLA STEERED
THE COMPANY’S GROWTH IN THE TWENTIES
AND THIRTIES. IN 1936, PIETRO, RICCARDO’S
SON, ENTERED THE COMPANY AND BEGAN
DEVELOPING ITS COMMERCIAL NETWORK.
CREATION OF THE BARILLA CENTER FOR FOOD AND NUTRITION
THE YEAR 2009 SAW THE LAUNCH OF
THE BARILLA CENTER FOR FOOD AND
NUTRITION (BCFN), A MULTIDISCIPLINARY
RESEARCH CENTRE COMMITTED
DEBATE OF TOPICS
RELATED TO FOOD
AND NUTRITION. IMPORTANT ACQUISITIONS
THE NINETIES AND THE FIRST DECADE
OF THE NEW MILLENNIUM WERE
CHARACTERIZED BY A STRONG
INTERNATIONALIZATION PROCESS,
WITH THE GROWTH OF BARILLA’S
PRESENCE IN EUROPEAN AND US
MARKETS, THE OPENING OF NEW
PRODUCTION PLANTS AND THE
ACQUISITION OF IMPORTANT BRANDS
SUCH AS PAVESI (ITALY), MISKO
(GREECE), FILIZ (TURKEY), WASA
(SWEDEN), YEMINA AND VESTA
(MEXICO), LIEKEN (GERMANY) AND
HARRYS (FRANCE).
MINA SINGS TONIGHT!!
IN THE EARLY SIXTIES, BARILLA
BECAME A LIMITED COMPANY. IT
HAD 1,300 EMPLOYEES AND 200
SALESPEOPLE. IN 1965, BARILLA
ENTERED THE PACKAGED BAKERY
PRODUCTS MARKET FOR THE FIRST
TIME, WITH THE PRODUCTION OF
BREADSTICKS AND CRACKERS. IN 1969,
THE PEDRIGNANO (PARMA) FACTORY
WAS BUILT, THE LARGEST PASTA
PRODUCTION PLANT IN THE WORLD,
WITH A PRODUCTION CAPACITY OF
1,000 TONS A DAY
THE RELAUNCH
IN 1979, PIETRO BARILLA RETURNED
TO THE HELM OF THE COMPANY. THE
HISTORIC RE-ACQUISITION COINCIDED
WITH THE RESUMPTION OF A LONG-TERM
INDUSTRIAL AND ADVERTISING
STRATEGY, BASED ON THE IDEA
OF RE-LAUNCHING PASTA AND
THE ITALIAN FIRST COURSE AND
DEVELOPING THE OFFER OF
BAKERY PRODUCTS.
GIANNI AND PIETRO AT THE HELM OF THE COMPANY
AFTER RICCARDO BARILLA’S DEATH
IN 1947, HIS SONS PIETRO AND GIANNI
TOOK THE REINS OF THE COMPANY,
DEVELOPING MODERN PRODUCTION
SYSTEMS AND ENGAGING IN INTENSE
BUSINESS COMMUNICATION AND
ADVERTISING ACTIVITIES. MULINO BIANCO IS CREATED
1975 SAW THE LAUNCH OF MULINO
BIANCO, A NEW BAKERY PRODUCTS
LINE, INCLUDING BISCUITS, BREAD
SUBSTITUTES AND SNACKS,
CHARACTERIZED BY AUTHENTICITY
AND RECIPES WITH NATURAL
INGREDIENTS, USING THE EXPERIENCE
BARILLA HAS GAINED IN CENTURIES
OF CEREAL PROCESSING.
THE AMERICAN INTERLUDE
IN 1971, THE BARILLA FAMILY
SOLD THE COMPANY TO THE
AMERICAN FIRM GRACE.
IN 1993, AFTER THE DEATH OF PIETRO
BARILLA, LEADERSHIP OF THE
COMPANY PASSED INTO THE HANDS
OF HIS SONS GUIDO, LUCA AND
PAOLO.
“I STARTED WORKING WHEN I WAS THIRTEEN
YEARS OLD. MY FATHER WOULD SEND ME WITH
OUR HANDCART TO FETCH A FEW SACKS OF
FLOUR, WHICH WERE THEN TRANSFORMED INTO
BREAD IN OUR OLD SMALL BRICK OVEN. AFTER
A FEW YEARS, IN A SMALL SHOP, WITH THE HELP
OF MY SISTERS AND MY MOTHER WHO WORKED
AT THE COUNTER, WE SOLD THE BREAD THAT MY
FATHER AND I PRODUCED BY WORKING FOR UP TO
18 HOURS A DAY.”
R I C C A R D O B A R I L L A
“IN THE HISTORY OF OUR COMPANY THERE ARE
MANY STAGES, MANY EPISODES, MANY EVENTS
THAT REMAIN AND THAT ARE LIKE THE STEPS OF
A STAIRCASE. ITS DOMINANT TRAIT, HOWEVER,
IS THE PIONEERING GENERATION BEFORE
WHICH I ALWAYS BOW WITH GREAT DEVOTION,
ADMIRATION AND GRATITUDE.”
P I E T R O B A R I L L A
“PROFIT IS THE FUNDAMENTAL INGREDIENT OF
ECONOMIC LIFE, BUT IN ORDER FOR IT TO BE
REALIZED AND FOR SOCIAL HARMONY TO BE
MAINTAINED THERE MUST BE MORAL RULES AND
VALUES, AND WE MUST RESPECT THEM. THIS IS
WHAT PAST GENERATIONS HAVE HANDED DOWN
TO US AND THAT IS WHY IT IS OUR DUTY TO HONOR
THEIR MEMORY. IN DOING SO, WE WILL HELP THE
YOUTH OF TODAY TO UNDERSTAND HISTORY AND
BE AWARE OF OUR COMMON ROOTS.”
P I E T R O B A R I L L A
“IT IS MY BELIEF THAT THE THREE
CHARACTERISTICS OF A BUSINESSMAN ARE
COURAGE, INTUITION, AND OPTIMISM. I THINK
THAT THE ENTREPRENEUR HAS AN IMPORTANT
ROLE TO PLAY NO MATTER WHAT HIS FIELD. BUT
THE FOOD SECTOR HAS A SPECIFIC ROLE, I WOULD
CALL IT A DEEPER AND MORE CHALLENGING ONE,
BECAUSE FOOD GOES OUT TO EVERYONE: TO
CHILDREN, TO THE ELDERLY, TO FAMILIES. FOOD
HAS THIS SENSITIVITY, THIS IMPORTANCE FOR THE
HEALTH OF PEOPLE.”
P I E T R O B A R I L L A
“DURING THOSE YEARS, I WAS REALLY UNHAPPY,
FOR A NUMBER OF REASONS, AND EVERYTHING
WAS GOING WRONG FOR ME… WHO KNOWS WHY
EVERYTHING WAS GOING WRONG… I WAS A MAN
WHO WAS SUFFERING FOR DIFFERENT REASONS,
BUT THE MOST IMPORTANT ONE WAS THAT I
HAD ABANDONED THE “SHIP” THAT HAD BEEN
ENTRUSTED TO ME AND ON WHICH I HAD SAILED
UNTIL THE AGE OF 58...”
P I E T R O B A R I L L A
“THE BRAND MUST BE ABLE TO BUILD
RELATIONSHIPS, NOT JUST TRANSACTIONS, WITH
CONSUMERS; AND OUR FUTURE IS DEPENDENT ON
OUR CONTINUING TO CREATIVELY RENEW THE
WAY WE COMPETE.”
G U I D O B A R I L L A
“THE RETURN WAS NOT EASY. MEETINGS, OBSTACLES,
FINANCE, MONEY, TRIPS: NEW YORK, ZURICH... AS
I WISHED MY CHILDREN TO BE WITNESSES OF THIS
ADVENTURE, THEY CAME ALONG ON MANY OF THESE
TRIPS. AT THE END OF 1978 I DID NOT HAVE THE
AMOUNT NEEDED. IN FRONT OF THE LEADERS OF
GRACE I WAS SO DISAPPOINTED THAT I CRIED. ONE OF
THEM, MR GRAFF – AN EXCELLENT MAN – UNDERSTOOD
MY PREDICAMENT AND CALLED ME ASIDE IN HIS OFFICE
AND SAID TO ME: “DON’T LOSE HEART, WE’LL SEE WHAT
WE CAN DO...” IT WAS THE END OF 1978 AND IN JULY
1979 WE MANAGED TO CLOSE THE DEAL.”
P I E T R O B A R I L L A
“I DON’T THINK THAT MY CHILDREN HAVE A BAD
OPINION OF ME, I LIKE TO THINK THAT THEY TRUST
AND RESPECT ME; THAT THEY BELIEVE IN ME AND
THAT THIS TRANSMISSION OF EXPERIENCES FROM
FATHER TO CHILDREN IS IN EFFECT A TRUTH THAT
CAN BE REALIZED. THE GOAL IS SUCCESSION,
FOR THE FAMILY TO CONTINUE FOR ANOTHER
GENERATION, WHICH MEANS 30-40 YEARS IN THE
COMPANY’S LIFE. THEN THE NEXT GENERATION
WILL PROVIDE… IF IT WILL PROVIDE… FOR THE
SUCCESSION…”
P I E T R O B A R I L L A
“WE WILL BECOME EVER MORE GLOBAL AND
READY TO FACE THE FUTURE BY DEVELOPING OUR
PERFORMANCE IN RELATION TO THE CONSUMER;
NOT BY PURSUING A SIMPLE AND TRADITIONAL
INCREASE IN SIZE, BUT BY ADAPTING OUR
CULTURE OF QUALITY AND OUR PROFESSIONALISM
TO EVER FASTER CHANGES OF SCENARIO.”
G U I D O B A R I L L A
“THE ITALIAN NUTRITIONAL MODEL IS THE ESSENTIAL
POINT OF REFERENCE FOR HEALTHY EATING
HABITS, FOR THE RESPECT AND PROTECTION OF
THE NATURAL RESOURCES OF OUR PLANET AND
FOR SAFEGUARDING THE RIGHTS OF FUTURE
GENERATIONS.”
G U I D O , L U C A A N D P A O L O B A R I L L A
TO THE PROMOTION AND
2014
IN 2014, THE BCFN BECOMES A
FOUNDATION, STRENGTHENING ITS
COMMITMENT TO FIND CONCRETE
SOLUTIONS TO THE WORLD’S MAJOR
FOOD CHALLENGES. THE BCFN
FOUNDATION LAUNCHES THE IDEA
OF SIGNING A GLOBAL FOOD DEAL
AT EXPO 2015 IN MILAN, DUBBED THE
“MILAN PROTOCOL”, WITH THREE
MAIN GOALS:
- CUT FOOD WASTE
- FIGHT HUNGER AND OBESITY
- PROMOTE SUSTAINABLE
AGRICULTURE

16
“EVERYTHING IS DONEFOR THE FUTURE”
PIETRO BARILLA

17
Directors’ Report
Despite a difficult and uncertain economic environment, the Barilla Group continued its positive performance in 2014: Group sales volumes increased by 3% compared to the pre-vious year and net revenue amounted to euro 3,254 million, a 2% increase on 2013 at constant scope of consolidation and exchange rates. In Italy, which represents two thirds of total Group sales and a market in which all of the major fast moving consum-er goods (FMCG) companies experienced a significant drop in sales volumes, Barilla managed to hold on to its mar-ket share; there was a growth in sales volumes in Europe, America, Asia and Australia. This performance is a result of particularly effective marketing policies and brand loyalty. The increased volumes and revenue, together with pro-gressive improvements in production efficiency and fixed overhead rationalization measures, generated resources for new marketing initiatives and innovation that contributed to strengthening market share that in turn led to a modest increase in gross margins. The positive performance was also sustained by new product launches (such as gluten-free pasta and “Focaccelle” in the Bakery segment), the consolidation of pasta and sauc-es consumption in a number of major European countries and higher E-Commerce sales. For 2015, the Group continues its strategy to increase sales volumes and revenue by: strengthening its presence in emerging markets (Brazil, Russia and China), undertaking a continuous personalization process in order to render Barilla products more appealing to local customers; adopting meas-ures to consolidate the position of the strong historic brand Voiello in the premium pasta market segment; innovation and new product launches (commencing with the introduc-tion of new variations in the gluten-free segment) with a strategic focus on ready-made sauces. The Group also focuses on the finalization and execu-tion of approved investment projects: the implementation of
the new production line in Ames dedicated to manufactur-ing gluten-free pasta; rationalization of the Pedrignano (Ita-ly) transport system involving the integration of a dedicated railway line and silos allocated to raw materials storage; the installation of new pasta production lines in Solne (Russia); the rationalization and increase in the production capacity of the La Malterie (France) plant production lines. The de-velopment of these projects paves the way to more efficient production that is closer to the end markets and represents, together with geographical diversification, the cornerstone of our medium-term development plan. In its role as world leader of pasta production, Barilla aims to bring pasta back to the forefront of the food indus-try, endorsing the product’s simplicity, extraordinary quality, natural and balanced nutritional content and compatibility with all diets and food traditions. Given its extensive manufacturing network, Barilla also aspires to pursue a path of sustainable development to safeguard the planet. To this end the Group has defined a growth strategy that minimizes its manufacturing impact on the surrounding environment by employing environmental efficiency targets in line with corporate objectives. Moreo-ver, the Group aims to share the benefits of its growth with the local communities in which it operates, in mutual re-spect for their commitments and responsibilities. An ambitious growth plan would not be complete if not combined with adequate corporate cultural change. Barilla is fully aware that it could not achieve these objectives with-out the full support of its employees. A Diversity & Inclusion plan was launched some time ago as the company firmly believes that diversity enriches those that are in continu-ous contact with it. Barilla intends to invest in training its employees in this direction, as this represents the cultural framework on which to build change. Barilla embraces technological innovation that improves the quality of life of both its consumers and employees.

18
BarillaGoesDigital is a new initiative with the ambitious aim of streamlining business processes and encouraging Group employees to use new digital technologies.
Transactions involving subsidiaries
The Group structure has remained largely unchanged. In ac-cordance with IFRS 10 and 11, whereby accounting for joint arrangements is based on the rights and obligations of the par-ticipating parties rather than just the legal form of the entity, the Group has modified the accounting treatment in respect of its investments in Barilla Mexico S.A. de C.V. and Serpasta Pastificio S.A. de C.V., changing from the proportionate method of consolidation allowed by previous standards to consolidation on a line by line basis and disclosure of non-controlling inter-ests. The previous year amounts were amended accordingly. The following commentary provides a detailed review of the activities of the individual group companies and Barilla Holding Società per Azioni (“the Company”), in accordance with the disclosure requirements of article 2428 of the Italian Civil Code and article 40 of Legislative Decree 127 of 9 April 1991.
Accounting standards - International Financial Reporting Standards (IFRS)
The Group’s consolidated financial statements have been prepared in accordance with International Financial Reporting Standards - IFRS (hereinafter “IAS or IFRS”) endorsed by the Eu-ropean Union. The accounting policies adopted are listed in the notes to the consolidated financial statements.
General information
All amounts are expressed in thousands of euro except where otherwise indicated. All comparisons made throughout this report and the consolidated financial statements refer to the financial information for the previous reporting period (dis-closed in brackets). Percentages (on margins and changes) are calculated based on the values expressed in thousands of euro. The Group, of which Barilla Holding Società per Azioni is the parent company, is defined as “the Barilla Holding Group” or “the Group”. Where comments relate specifically to the parent com-pany, or the individual subsidiaries, the full name and legal form of the companies are stated.
Consolidated financial highlights
In terms of cash flows, operating profit from continuing op-erations, before depreciation, amortization and impairment of intangibles and property, plant and equipment (EBITDA), amounted to euro 427 million (euro 409 million), correspond-ing to an average 13.1% of revenue (12.7%). Operating profit from continuing operations (EBIT) to-taled euro 293 million (euro 270 million), representing 9.0% of revenue (8.4%).
Profit before income tax equaled euro 252 million (euro 201 million). Consolidated profit for the year amounted to euro 150 million net of extraordinary income and expenditure, which compares to a profit of euro 111 million in 2013 that reflected the impairment losses recognized on fixed assets and the re-sults of discontinued operations. Consolidated profit attributable to owners of the parent (net of non-controlling interests) amounted to euro 126 mil-lion, compared to euro 92 million last year. Profit attributable to non-controlling interests amounted to approximately euro 25 million. Current and deferred income taxes for the year totaled euro 102 million (euro 95 million); the effective tax rate, net of negative extraordinary items, is in line with the previous year at 40% (40%). Net indebtedness amounted to euro 250 million (euro 347 million) and is detailed further in the notes to the finan-cial statements. The principal financial instruments in place to meet the Group’s current financial requirements are:• BondsissuedbyBarillaFranceS.A.S.totalingUSD292
million placed with US institutional investors in De-cember 2003 and July 2011 and divided into tranches (maturing between 2015 and 2023). The bonds, includ-ing the related hedging instruments valued at mark-to-market, amounted to euro 214 million at the year-end;
• AUSD150millionbondissuedbyBarillaG.eR.Fr-atelli Società per Azioni, that was placed with US in-stitutional investors in December 2013 and matures in 2025. This bond, including the related hedging instru-ments valued at mark-to-market, amounted to euro 111 million at the year-end;
• Afive-yearrevolvingcreditlineofeuro700million,secured in July 2014 by Barilla Iniziative S.r.l., Barilla G. e R. Fratelli Società per Azioni, Barilla France S.A.S. and a group of 12 leading international banks, which had not been drawn-down at 31 December 2014;
• Afixed-termamortizableloanofeuro50millionne-gotiated in January 2012 by Barilla Iniziative S.r.l. and Barilla G. e R. Fratelli Società per Azioni with Banca Europea per gli Investimenti that matures in 2020. The outstanding principal amounted to euro 34 million at 31 December 2014.
(Further details are provided in the notes to the consolidate financial statements).
The Group’s aim is to maintain a high level of medium-term debt in line with well-established financial policy, which pre-vents any credit restrictions as has occurred in recent years. These transactions, together with the positive cash flows gen-erated from operations, ensured that the Group had sufficient resources both to meet its financial obligations and to fund future business opportunities. As mentioned above the Group had an undrawn revolv-ing credit facility of euro 700 million at 31 December 2014.
19
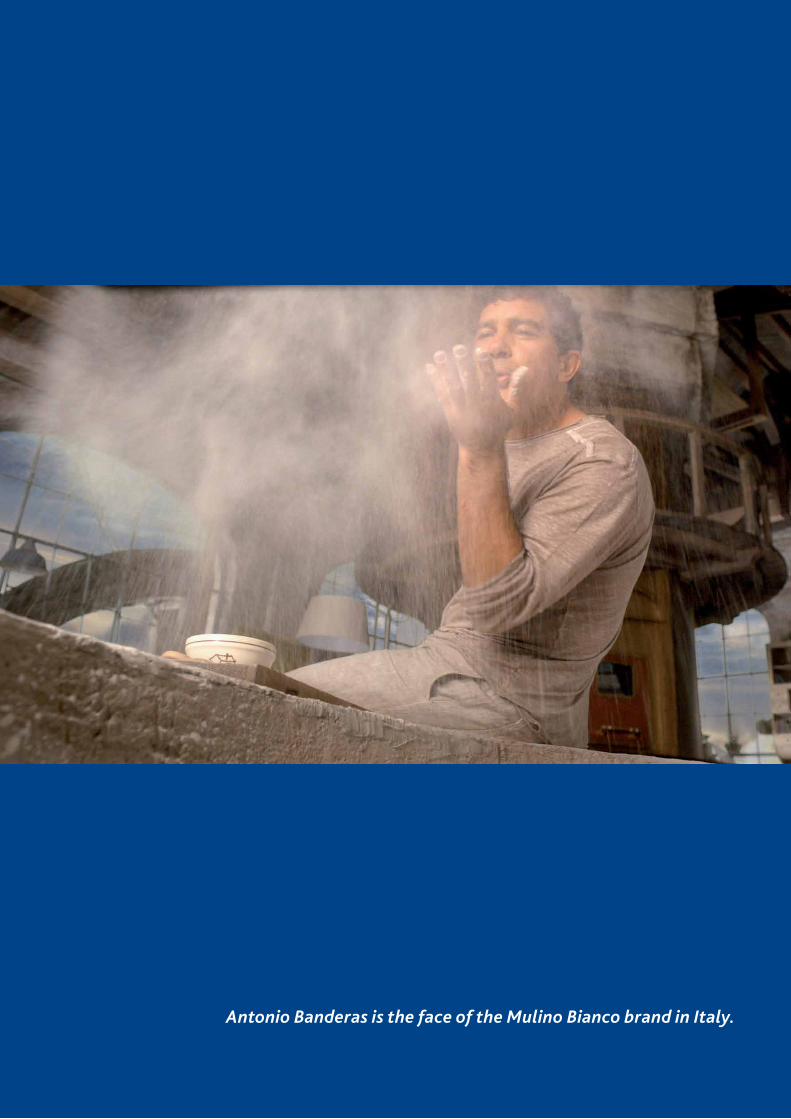
Antonio Banderas is the face of the Mulino Bianco brand in Italy.

20
The Barilla brand has its roots in a small bread and pastastore opened in Parma in 1877. Today it is the number onepasta in Italy and around the world. Thanks to the best durumwheat and impressive modern technologies, Barilla suppliesmillions around the world with pasta that always cooks to aperfect al dente texture, as well as ready-to-eat pasta sauces.
Voiello was established in 1879 as a small store in TorreAnnunziata, a small town outside Naples, a world capital ofpasta making since the 16th century. Voiello pasta comesin all the most popular Neapolitan shapes. Its secret isthe uneven surface achieved with bronze dies. Voiello wasacquired by Barilla in 1973.
BARILLA G. E R. FRATELLI
Founded in 1975, Mulino Bianco is truly a part of the cultural fabric of Italian food and of the everyday diet of Italianfamilies. This brand offers simple, genuine bakery products in all categories that are perfect for eating at home or on the go.
The Pavesi brand was established in 1937 by Mario Pavesi, an inventive baker and entrepreneur in the city of Novara. It of-fers a wide range of bakery products and pastries, all of which have unique flavor and rely on well-developed production technologies. Pavesi was acquired by Barilla in 1992.
The leading pasta brand in Greece, Misko was established in 1927 and represents Greece’s substantial pasta tradition; its logo depicts the monk Akakio on his donkey, going to buy pasta at the village market. Barilla acquired Misko in 1991.
Launched in 1970 on the baked goods market in France, theHarrys brand today is leader in the soft bread market andan important player in the morning goods market. Qualityand innovation are two of the most important key successfactors.
Founded in Sweden in 1919, Wasa is the world’s largestproducer of crispbreads. It distributes its many rye andwheat products in more than 40 countries. Barilla acquiredWasa in 1999.
Established in 1977, Filiz is one of the top pasta producers inTurkey, one of the biggest pasta consuming countries. Barillaacquired Filiz in 1994.
Our brands
On December 1st, 2013, Academia Barilla opened the com-pany’s first restaurant in New York - 6th Avenue 52nd - with the goal of bringing Italian conviviality to the world.

21
Yemina, created in 1952, and Vesta, in 1966, are two of the leading Mexican brands. Barilla entered that market by for-ming a joint-venture with the Mexican Grupo Herdez in 2002.
Pan di Stelle was created in 1983 as one of Mulino Bianco’s breakfast biscuits. In 2007, with the launch of the snacks and the cake, it began its career as a stand-alone brand to become a trademark in its own right much loved by People everywhere.
Gran Cereale was founded in 1989 as a Mulino Bianco whole grain biscuit and has grown to become a Barilla brand of whole grain and natural products. Nowadays, the brand offers consumers a wide range of products ranging from Biscuits to Cereals, from Crackers to “Snackbiscotto”.
FIRST is a brand specialized in retail sales services.

22
Group structure and organisation
Barilla Holding Società per Azioni’s investments in its oper-ating subsidiaries are held indirectly through the sub-holding Barilla Iniziative S.r.l., which is in turn 85% owned by Barilla Holding Società per Azioni. The current Group structure is divided into two operat-ing sub-holdings: Barilla G. e R. Fratelli Società per Azioni, which focuses on the manufacturing and sale of pasta, sauces and bakery products both in the domestic and inter-national markets and Italian Kitchen S.r.l., which develops and manages the Restaurants business. The Group operates directly in 26 countries, exports its products to more than 100 countries and owns 30 produc-tion facilities across 9 countries.
Economic scenario
Italy did not experience economic growth yet again in 2014: average disposable income remained stagnant or was in decline, with consumption following the same trend. The continued uncertainty regarding potential future risks led to a tendency to save and further intensified the downturn in de-mand. In this current climate, despite some signs of improve-ment in the latter months of the year that continued with cautious signs of recovery in early 2015, companies’ expecta-tions regarding the future in respect of their investments are not positive. New factors affecting international political instability are strongly hampering worldwide economic growth. In ad-dition to the current war crisis situations that could directly impact the Group’s raw material procurement, the economic recovery and growth program that is taking shape is also wor-rying. This trend mirrors that of the early 2000s with US con-sumers representing the driving force of the global economy while the others, particularly in Europe, only grow through exports and lack an autonomous support policy for domestic demand. A similar downturn is underway in China with con-tinuous growth in exports but a strong decline in imports. US growth risks being financed by consumer debt that could lead to another financial crisis. Another critical factor arose in the last quarter of 2014 with regard to the price of semolina. In the period August through October 2014, in total contrast to the price trend of other raw materials, the international wheat price increased from 438 to 698 USD/ton, closing at 600 USD/ton in Decem-ber 2014. The price on the Italian market increased from 302 to approximately 390 euro/ton at the year-end.
Group operating activities review
Barilla G. e R. Fratelli The activities of the Barilla G. e R. Fratelli Group have been based on the following business operating model. The organization structure is founded on achieving stra-tegic and organizational balance across two areas: Processes
and Regions (geographical areas). By adopting this frame-work, the Group believes it can speed up response times, improve the ability to adapt to change and widen imple-mentation of all synergies at global level and consequently maximize Barilla’s consolidation process aimed at making it a Key Global Market Player in its field. In achieving the perfect balance between global and lo-cal dimensions, the Group is in a position to satisfy a wide variety of markets, adapting - without losing its core iden-tity - its vision of the Italian gastronomic model throughout the world. This signifies that the Group’s core features and com-petitive qualities, including the brands’ symbolic characteris-tics and identity, must be upheld and protected while at the same time adapting the products portfolio to the different areas in which the Group operates.Regional areas and development:• Italy;• Europe(excludingItaly);• America,includingtheentireAmericancontinent;• Asia,AfricaandAustraliaincludingRussiaandTurkey;With the Categories and Brands:• MealSolutions,comprisingtheproductionandsaleof
first courses (pastas and sauces) under the Barilla, Voi-ello, Misko, Filiz, Yemina and Vesta brands;
• Bakery,consistingoftheproductionandsaleofbakeryproducts principally through the Mulino Bianco, Pavesi, Wasa and Harrys brands.
Moreover, the Academia Barilla and Restaurants business segment is responsible for creating and enhancing the Group’s Business to Consumer models and for developing the activities of the Academia Barilla aimed at promoting and spreading Italian Gastronomic Culture throughout the world by formulating and selling products, services and editorial contents.
Italy RegionDespite an economic and social climate that witnessed a slump in consumption and a downward trend in the sec-tors in which the Group operates, the Italy Region achieved growth in sales volumes compared to last year. All of the product market shares in terms of volume increased most notably in respect of the Bakery segment products while the Meal Solutions segment remained stable in this declining market. The positive performance of the Bakery segment prod-ucts is linked to sales of Rusks, Biscuits and Bread.The strong base products performance, the input of innovation (Fo-caccelle, Cornetti, and new biscuits), effective promotions and an improved marketing mix all contributed to revenue growth despite unfavorable commercial conditions. After a difficult start, the Meal Solutions business re-sults improved thanks to the success of the new “Gluten free pasta” and expansion of the “Whole Grain” and “Spe-cialty” pasta ranges. The Sauces segment also performed well, recording continuous growth both in terms of volume and value, particularly in respect of meat based sauces and pesto varieties.
23
Europe RegionThe macro-economic framework was positive in 2014, with positive growth in GDP across most developed economies (France +0.5%, Germany +1.6%, Sweden +2.0%). Our product categories showed a stable trend in Pasta and growth in sales volumes in the Sauces, Crispbreads, Bread and in France Breakfast products. Barilla achieved outstanding results in 2014, record-ing significant growth in both volumes and revenue. This growth was generated through implementation of a pre-defined strategy, placing greater emphasis on countries with higher potential where the Group accelerated consid-erably its commercial and marketing investments (Poland, United Kingdom, Eastern Europe, Belgium, Spain, Portugal, Netherlands and Austria). The results in those countries where Barilla’s presence is consolidated (France, Germany, Switzerland, Sweden, Norway and Greece) were very satis-fying. Western Europe cluster recorded strong results in terms of both volume and value thanks to excellent per-formance in France, the Iberian Peninsula and Belgium. Barilla also entered the UK market in 2014 through the Tesco chain. Central Europe cluster grew both in terms of volumes and revenue compared to 2013, which was driven by Ger-many, Switzerland and the Netherlands in the Meal Solu-tions category, while the Pasta segment consolidated its position due to increased promotional activities and the progressive expansion of the Sauces category. Northern Europe cluster recorded a marked rise in volumes but a slight fall in revenue due entirely to foreign exchange fluctuations. Performance was extremely positive in Sweden which saw market shares increase across all cat-egories while results in Norway were negatively impacted by expenditure on promotions and particularly aggressive competitive pressure in the Crispbread category. Eastern Europe cluster attained overall growth and a consolidation of revenue in Greece, where the increase in Sauces and the Bakery categories offset the country’s widely known macro-economic structural problems and difficult commercial credit situation; growth was also re-corded in the other countries as part of the Group’s expan-sion policy that produced excellent results particularly in Poland and also Romania, Hungary and the Czech Republic.
America RegionRevenue increased in the America Region in 2014 due to a significant rise in both Brazil and Canada that substantially offset the decreases in Mexico and the United States. Brazil achieved a 4.1% market share in value terms representing a 0.8% increase compared to last year, thanks to continued growth in the distribution of egg pasta made from local wheat that was launched in 2013 and imported durum wheat pasta. The increase was bolstered by invest-ment in trade and marketing that focused on the Sao Paolo region where market share increased by 0.6% on the prior year to reach 16.1%. The market share in value terms in Canada increased
by 2% on last year to 10.6%, which was fostered by promo-tions, expansion of the distribution network of the pasta product range and the launch of gluten free pasta. Mexico experienced a drop in market share in value terms, falling 1.4% on last year to 31.1% caused by a cut in pasta promotions. The United States continues to represent the leading market and accounts for 83% of the region’s net revenue.With regard to individual product categories, Sauces in-creased in both volume and revenue terms thanks to the expansion of the product range while Pasta, despite a fall of 0.3% in volume terms and 1.8% in value in this sector, achieved a marked increase compared to the prior year, bringing it successfully to a 28.9% market share as a result of entry to the premium sector and the launch of gluten free pasta.
Asia, Africa and Australia RegionThe major economies in the Asia, Africa and Australia Re-gion continued to grow in 2014 albeit at a slower pace, principally due to the downturn in growth in China and con-traction of the Russian economy. The major currencies con-tinued to devalue, in particular the Russian ruble, the Turkish lira and the Japanese yen. Despite this situation and the global inflation trend, particularly pronounced in Turkey, the Pasta segment continues to grow across the whole region. The Group recorded another year of Barilla Brand growth: market share increased in all key markets, with par-ticular success in Russia where the outstanding performance compared to last year led to a significant increase in the Group’s market share. Market share also increased in other areas with positive developments in Turkey, Southeast Asia (Singapore and Malaysia) and the consolidation of the Chi-nese market. Volumes in this region increased by 6% in 2014 thanks to the Meal Solutions business that more than offset the closure of the Soft Cake business in Russia. Revenue in-creased by 13% on last year (net of the foreign exchange impact) with strong performance in Russia, Turkey and Aus-tralia. Investment in key markets continued, through increased advertising expenditure in Russia, Turkey and Australia and expanding Barilla brand visibility in China.
Academia Barilla and RestaurantsIn the course of 2014, Academia Barilla maintained distribu-tion of its products through major national and overseas chains and continued to pursue its role as an ambassador of Italian cuisine throughout the world. The Academia Barilla restaurant opened in Manhat-tan, New York, in December 2013 and has just completed its first year of business. The results are encouraging with growing sales and very positive customer reviews. Steps were taken during the year to open a new location in Man-hattan in 2015 in an area famous for both businesses and a significant tourist presence.

24
Capital expenditure
Barilla Group’s expenditure on property, plant and equip-ment amounted to approximately euro 116 million in 2014, corresponding to 4% of revenue. The resources were invested principally in the follow-ing Group areas:• increase in production capacity in France;• constructionofamanufacturingplantwithtwopasta
production lines in Solne, Russia;• increasingwheatstoragecapacityinthePedrignano
and Novara plants in Italy;• expenditureforproductionofthenewFocaccellepro-
duct at the Melfi plant in Italy:• changestothepackagingofpastaatthePedrignano
site and in Caserta for the Voiello brand (Italy).
Corporate governance
The Group’s Italian subsidiaries have adopted a traditional control structure consisting of a Board of Directors and a Board of Statutory Auditors, both of which are appointed by the General Meeting of Shareholders. More specifically, with regard to Barilla G. e R. Fratelli Società per Azioni and its subsidiaries, the governance structure is similar to that of Barilla Holding Società per Azioni, while the internal control system and the Organization, Management and Control Model pursuant to Legislative Decree 231/2001 (the “Decree”) are tailored to the company’s specific needs. The Organization, Management and Control Model comprises a general section and special sections together with the Code of Ethics. These define the types of cor-porate crimes, the business areas considered at risk of a crime being committed, the procedures, systems and pro-tocols aimed at preventing crimes and the set of principles and values that Barilla Group companies identify with and that the directors, statutory auditors, employees, external collaborators, suppliers and customers are required to ad-here to. The Board of Directors is the body vested with the widest powers of ordinary and extraordinary administra-tion with the exception of those assigned to the General Meeting of Shareholders either by law or the articles of association. The Board of Directors is responsible for man-aging the business, assessing the adequacy of the organi-zation, administration and accounting functions, and the review of the overall operating performance. The current Board of Directors consists of five members and the term of office expires at the next General Meeting of Sharehold-ers called to approve the 2014 Annual Report. The Board of Statutory Auditors oversees compliance with the law and the articles of association and compli-ance with the principles of correct administration. The members of the Board of Statutory Auditors are appointed for a three-year term and may be reappointed. The current Board of Statutory Auditors is made up of three permanent and two substitute auditors whose term of office expires at the General Meeting of Shareholders called to approve the 2014 Annual Report.
The Supervisory Board of Barilla Holding Società per Azioni is composed of a sole member starting from 21 June 2013, while the Supervisory Board of Barilla G. e R. Fratelli Società per Azioni consists of three members who remain in office until 4 March 2017. Barilla G. e R. Fratelli Società per Azioni’s Board comprises the heads of Group Legal and Corporate Affairs and Group Internal Audit, and an independent member who is a university lecturer and self-employed professional and is also the sole member of Barilla Holding Società per Azioni’s Board. The Supervisory Boards present half-yearly reports on their activities to the relevant Boards of Directors. Testing activities have been defined and implemented with an extremely positive out-come. In the course of 2014, the Supervisory Boards carried out their role of preventing the commission of corporate crimes pursuant to the Decree (and ensuing updates/amendments) by verifying the adequacy and implementa-tion of the provisions of the Organization, Management and Control Model and the Code of Ethics adopted by the Company. KPMG S.p.A. has been appointed to perform the audit of the separate financial statements as required by law. It has also been appointed to audit the consolidated financial statements of Barilla Holding Group and the separate fi-nancial statements of the principal Group subsidiaries. The governance framework of the main Italian sub-sidiaries reflects the individual operating structure and, in respect of overseas entities, takes into consideration local legislation.
Knowledge sharing and sustainability of the Barilla business
The Group business strategy encapsulates a single vision of how to carry out business defined as “Good for You, Good for the Planet”. This reflects the essence of Barilla’s business and can only be executed in full if it is embraced across the entire supply chain in which the Group operates, from the field to the table. “Good for You, Good for the Planet” is envisaged by Barilla as the only means to grow and through which it intends to strengthen its presence in existing markets and expand into emerging markets. Barilla not only offers products but promotes wellbeing for the individuals and their families who choose its products every day, for their communities and the planet. In particular, for Barilla the “goodness” associated with its way of conducting business is reflected in a common objective undertaken by all in-dividuals who work within the Group and the continuous involvement of the key external stakeholders. This is summarized in: Good for You• offersimpleproductsthatstandoutinthemarketdue
to their taste, quality and safety; • promotenutritionallybalanceddiets.Good for the Planet• guarantee,fromthecultivationofrawmaterials
25
through to their consumption, a product life-cycle that respects the economic, social and environmental aspects of all members of the supply chain and the planet.
Good for the Community• educateyoungpeopletoleadhealthylifestyles;• understandandevaluatetheneeds,distinctivequali-
ties and rights of each local community in which the Group operates, promoting diversity and embracing inclusion through open and transparent relationships;
• fostertheprofessionaldevelopmentofGroupemploy-ees, encouraging their commitment, embracing diver-sity and promoting intellectual curiosity so that they become ambassadors of Barilla’s identity, values and food culture throughout the world.
In 2009 Barilla established a multi-disciplinary think tank that has now become a foundation, the Barilla Center for Food and Nutrition, BCFN (www.barillacfn.com), which was founded to share the outcome of the best worldwide research on four areas: Food for Health, Food for Sustaina-ble Growth, Food for All and Food for Culture. The research work of the BCFN contributes extensively to investigating matters regarding people, their lifestyles and the environ-ment. The studies developed by the center are incorporat-ed into the Barilla Group’s business strategy, one example being the Double Pyramid. The main activity of the foundation in 2014 involved drafting the Milan Protocol for Food and Nutrition which was presented to the Italian Government during the Barilla Center for Food and Nutrition’s 6th International Forum, and is aimed at providing a tangible contribution to the “Feeding the Planet, Energy for Life” theme of the Milan EXPO 2015. The Milan Protocol was shared with interna-tional institutions, government representatives, universi-ties, non-governmental bodies and over 70 organizations confirmed their support by officially signing the document.
Environmental managementAll of the Group’s European bakeries, pasta factories and mills have implemented the Barilla Integrated Environ-mental Management System, which has been developed in accordance with international standard ISO 14001. This signifies that approximately 83% of the total volume of products is manufactured in factories with an ISO 14001 certified Environmental Management System. All of the Italian bakeries and pasta factories hold the Integrated Environmental Authorization in line with strin-gent European IPPC regulations (Integrated Pollution Pre-vention and Control). Although the Sauces factory in Rub-biano is not required to meet regulations, it will voluntarily present the request to obtain the Integrated Environmental Authorization. The Barilla Group is the first food group to have de-veloped and obtained third party certification on a system that assesses the environmental impact of its products us-ing a Life Cycle Analysis tool (Life Cycle Assessment) that complies with the international EPD system (Environmen-tal Product Declaration) - www.environdec.com - which al-
lows publication of certified environmental impact data. In 2014, 73% of production volumes held an environmental impact declaration. After years of work a method has been identified to recycle the paper layer of packaging that protects the Mulino Bianco and Pavesi brands biscuits. Thanks to this and similar projects, 98% of all packaging on the market is technically recyclable. Moreover, all of the cardboard in virgin fiber used for packaging pasta is sourced from sustainably managed for-ests that comply with at least one of the following interna-tional standards managed by non-profit, non-governmen-tal organizations: FSC (Forest Stewardship Council), PEFC (Programme for the Endorsement of Forest Certification) or SFI (Sustainable Forestry Initiative). The entire electricity supply used in the production of Mulino Bianco and Wasa products is covered by special certificates (GO-RECS) that certify the production from renewable sources generated by hydroelectric plants. All of the Italian pasta factories run a cogeneration plant that enables the combined generation of electricity and thermal energy and contributes to improving efficien-cy and reducing the environmental impact. The program to reduce energy consumption contin-ued. Following the improvement plans rolled out across all of the factories, implementation of the Energy Manage-ment System, developed in compliance with the recently introduced international standard ISO 50001, is currently underway. Subsequent to the certification of the Castigli-one delle Stiviere (Italy) factory, which joins the two Wasa factories in Celle (Germany) and Filipstad (Sweden), the Al-tamura (Italy) mill obtained the same certification in 2014. The two plants in Parma and Foggia covered by the Emissions Trading Scheme are certified periodically by an independent third party. The 2014 Mulino Bianco Tour, for the second year running, adopted and certified an Event Sustainability Management System in compliance with ISO 20121. This standard, which specifies the sustainable and responsible management of an event, envisages a series of stringent requirements that must be met such as reducing CO
2
emissions, safeguarding all employees involved in the event and careful waste management. During 2014 a procedure for the definition, validation and publication of environmental labels and declarations was prepared and certified by a third party in accordance with international standards ISO 14020 and 14021.
Health & SafetyThe long-term project to roll-out the Barilla Integrated Safety-at-Work Management System, developed in ac-cordance with international standard OHSAS 18001 (Oc-cupational Health and Safety Assessment Series), aimed at guaranteeing improved health and safety standards for employees, is almost complete: the remaining two facto-ries that have not yet been certified will obtain the certifi-cation during 2015. Approximately 83% of total product volumes is manu-
26
factured in factories that employ a Health and Safety at work management system certified pursuant to OHSAS 18001. In Italy alone, more than 30,000 training hours on the subject of Health and Safety at work and fire prevention took place in 2014, involving more than 5,000 people. Execution of the global Audit plan covering safety, the environment and fire prevention continued: more than 80 specific checks took place across all of the pasta factories, bakeries and mills in 2014 together with the support of specialist enterprises. No critical accidents involving employees occurred in the workplace in 2014 and no actions are pending against the Company in respect of health and safety.
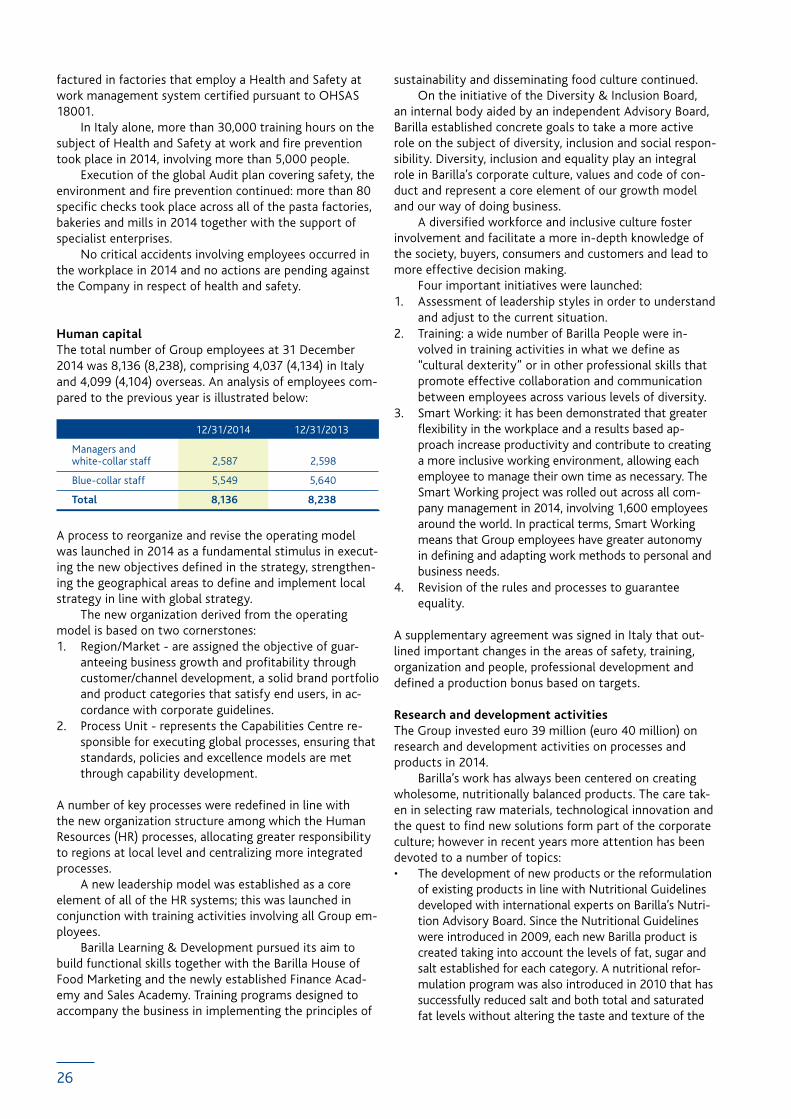
Human capitalThe total number of Group employees at 31 December 2014 was 8,136 (8,238), comprising 4,037 (4,134) in Italy and 4,099 (4,104) overseas. An analysis of employees com-pared to the previous year is illustrated below:
12/31/2014 12/31/2013
Managers and white-collar staff 2,587 2,598
Blue-collar staff 5,549 5,640
Total 8,136 8,238
A process to reorganize and revise the operating model was launched in 2014 as a fundamental stimulus in execut-ing the new objectives defined in the strategy, strengthen-ing the geographical areas to define and implement local strategy in line with global strategy. The new organization derived from the operating model is based on two cornerstones:1. Region/Market - are assigned the objective of guar-
anteeing business growth and profitability through customer/channel development, a solid brand portfolio and product categories that satisfy end users, in ac-cordance with corporate guidelines.
2. Process Unit - represents the Capabilities Centre re-sponsible for executing global processes, ensuring that standards, policies and excellence models are met through capability development.
A number of key processes were redefined in line with the new organization structure among which the Human Resources (HR) processes, allocating greater responsibility to regions at local level and centralizing more integrated processes. A new leadership model was established as a core element of all of the HR systems; this was launched in conjunction with training activities involving all Group em-ployees. Barilla Learning & Development pursued its aim to build functional skills together with the Barilla House of Food Marketing and the newly established Finance Acad-emy and Sales Academy. Training programs designed to accompany the business in implementing the principles of
sustainability and disseminating food culture continued. On the initiative of the Diversity & Inclusion Board, an internal body aided by an independent Advisory Board, Barilla established concrete goals to take a more active role on the subject of diversity, inclusion and social respon-sibility. Diversity, inclusion and equality play an integral role in Barilla’s corporate culture, values and code of con-duct and represent a core element of our growth model and our way of doing business. A diversified workforce and inclusive culture foster involvement and facilitate a more in-depth knowledge of the society, buyers, consumers and customers and lead to more effective decision making. Four important initiatives were launched:1. Assessment of leadership styles in order to understand
and adjust to the current situation. 2. Training: a wide number of Barilla People were in-
volved in training activities in what we define as “cultural dexterity” or in other professional skills that promote effective collaboration and communication between employees across various levels of diversity.
3. Smart Working: it has been demonstrated that greater flexibility in the workplace and a results based ap-proach increase productivity and contribute to creating a more inclusive working environment, allowing each employee to manage their own time as necessary. The Smart Working project was rolled out across all com-pany management in 2014, involving 1,600 employees around the world. In practical terms, Smart Working means that Group employees have greater autonomy in defining and adapting work methods to personal and business needs.
4. Revision of the rules and processes to guarantee equality.
A supplementary agreement was signed in Italy that out-lined important changes in the areas of safety, training, organization and people, professional development and defined a production bonus based on targets.
Research and development activitiesThe Group invested euro 39 million (euro 40 million) on research and development activities on processes and products in 2014. Barilla’s work has always been centered on creating wholesome, nutritionally balanced products. The care tak-en in selecting raw materials, technological innovation and the quest to find new solutions form part of the corporate culture; however in recent years more attention has been devoted to a number of topics:• The development of new products or the reformulation
of existing products in line with Nutritional Guidelines developed with international experts on Barilla’s Nutri-tion Advisory Board. Since the Nutritional Guidelines were introduced in 2009, each new Barilla product is created taking into account the levels of fat, sugar and salt established for each category. A nutritional refor-mulation program was also introduced in 2010 that has successfully reduced salt and both total and saturated fat levels without altering the taste and texture of the

27
products. The decrease in salt content by between 15 and 25% has had a particular impact on soft and dry breads, sauces and tortellini. The decrease in fats has impacted certain snacks and biscuits (e.g. Flauti, Pan-goccioli, Saccottini and Tarallucci).
• Researchactivitiesperformedincollaborationwithuniversities and research institutions both in Italy and overseas. Continuous research is carried out aimed at identifying the benefits of eating cereal based products (pasta, bread and crispbread) on certain health matters, in particular the glucose and lipid metabolism. These products represent the foundations of the Mediterra-nean Diet who inspires Barilla.
• NutritionaleducationactivitiesaimedatBarillaGroupemployees through the “sì.mediterraneo” project that is adopted in all of the canteens of Barilla’s manufacturing locations and offices. Consumers, including Barilla em-ployees, desire honest and reliable nutritional facts. The Company has developed a program to provide healthy dietary advice through information panels, educational booklets, and practical tips, in conjunction with studies on the menus on offer in the company’s canteens. The project was launched in 2011 at the Pedrignano head-quarters and was gradually rolled out to all factories and offices both in Italy and overseas, involving more than 7,000 employees.
Sustainable supply chain management and relations with the local territoryBarilla uses 1,200 suppliers worldwide, 800 types of raw material and 50 types of packaging materials, and for many years has been committed to reducing the environmental im-pact, preferring to grow raw materials in the same country in which they are used in production and developing recyclable packaging. Its mission is to contribute to the wellbeing of the territory in which it operates, not just in environmental terms but also by offering employment and opportunities to local people. 2014 marked a year of important developments as new and more advanced sustainability standards, both available on the market and developed in-house, were adopted by Barilla in a number of countries throughout the world and in some of its supply chains. One example is the durum wheat supply chain where Barilla has always involved its manufacturing partners in the quest to promote sustainable coltivation employing tech-niques that reduce the environmental impact while at the same time guarantee greater control over production qual-ity, balanced pricing strategies and more financial sustain-ability for farmers. The agreements with supply chain part-ners, which optimize the selection of varieties, seed multipli-cation, wheat farming and storage protocols, accounted for approximately 44% of total purchases in Italy in 2014. For the first time a portion of the 2014 harvest, some 85,000 tons, were cultivated in compliance with the provisions of the Decalogue for Sustainable Cultivation of Durum Wheat in association with web decision support systems (DSS) such as Granoduro.net. A similar process was launched in Greece in 2014 result-ing in Barilla receiving the “Environmental Awards 2015”
sponsored by the Greek government and held in Athens in December 2014. 76% of durum wheat used in 2014 in the manufacture of the numerous Barilla Group brands was farmed locally, in the country in which the pasta was produced thus improv-ing supply chain efficiency. With regard to the Mulino Bianco, Pavesi and Le Emiliane brands, Barilla continued to use the supply chain agreements established to ensure that only eggs from free-range hens reared exclusively on vegetable based feed are used, while international agreements guarantee that 100% of cocoa and palm oil is sourced from members of international organiza-tions responsible for sustainability and safeguarding human and environmental rights. By the end of 2014, 32% of palm oil derived from sus-tainable farming certified under RSPO (Roundtable of Sustain-able Palm Oil) and is on track to meeting the 100% target by the end of 2015. Moreover, commencing 2014, 20% of tomatoes used in Barillla sauces produced in Italy derive from Global Gap certi-fied farming, the aim being to reach 100% by 2020. Finally, 98% of all packaging used is technically recy-clable.
Customer relations“Give people food you would give your own children”: in-spired by the words of Pietro Barilla we strive to achieve continuous improvements in product quality, safety and sustainability from the field to the table, through the quest for excellence in every activity undertaken. This year we finalized a project to modify the labelling on our packaging to make it clearer and more effective; we developed and adapted our products locally in line with our geographical and channel expansion. These initiatives enable us to get closer to our customers and satisfy their needs wherever they may be. The journey we embarked on this year, to improve how we listen to people across more countries and a great-er number of channels, will be at the forefront of our work over the coming years. Our aim is to be the first choice of brand and product for our people and customers, focusing not only on the quality and safety of our products, but on trust built on transparent and close relations.
Risk management
Barilla’s Enterprise Risk Management system project be-came a fully-fledged process in 2014. It aims to provide management with a tool to monitor the major risks to which the Group is exposed in order to ensure the follow-ing objectives are met:• thecorporateriskprofileisappropriateandcompatible
with the Group’s risk propensity;• thecreationofastructuredandperiodic(everytwo
years) process for identifying, measuring and prioritizing risk events;
• thedefinitionofadequatemitigationplansandensure sufficient financial coverage;
28
• establishregularmonitoringofcorporateriskexposureand implementation of the defined mitigation plans;
• presentandsharecriticalriskswithtopmanagementona regular basis (twice yearly) and assess the effective-ness of the mitigation plans in place.
In 2010 the Company voluntarily embarked on a process that culminated in the identification of its accepted exposure to risk (Financial & Reputational Risk Appetite) and common parameters to assess each risk event at Group level. Moreover, definition of the corporate risk register (Risk Register) enabled identification of those risk areas to which the Group is poten-tially exposed and assigned management responsibilities for each risk identified to the relevant organization departments (Risk Ownership). Work performed in 2014 focused on risk assessment sessions with all departments throughout the organization: this facilitated a 360 degree mapping of the major risks to which the business is exposed, which were measured and classified using common standards aimed at prioritizing risk and defining appropriate risk mitigation plans. The outcome of the mapping exercise, together with the mitigation plans in place, was presented to top management which has taken it on board to assure that sufficient resources are allocated to manage and mitigate the Group’s key risks. The risk profile will be updated and discussed by the Group Leadership Team twice yearly in order to monitor critical risk exposure and im-plementation of the planned control measures. With regard to Information Technology risks, the Group has a disaster recovery service in place for the majority of its applications, in particular those critical to operations such as SAP and Dassault-Enovia MatrixOne (Product Lifecycle Management). The level of service implemented foresees, in the event of a disaster, that systems are rebooted within a maximum of 24 hours and without loss of data already input to the system. Trial simulation runs are carried out yearly in order to verify that both the process and system are work-ing correctly. A similar disaster recovery plan was formulated for the Pedrignano (Corporate Headquarters in Parma) site’s access to the network in order to guarantee connectivity to Datacenter. Finally, all integrated lines of communication have a back-up. In order to maintain a sufficient security level in re-lation to Information Technology at Group level, projects are executed each year in the field of IT security and third party experts perform regular vulnerability assessments. The corpo-rate network is equipped with a sophisticated NAC (Network Access Control) infrastructure that only enables connection by automatically recognized authorized devices. During the year, a series of projects were developed subsequent to the outcome of the vulnerability assessments, in pursuit of the continuous improvement of the systems management proce-dures and operating standards.
Significant events after the balance sheet date
No significant events took place after 31 December 2014that require disclosure.
Management outlook
2015 results are currently in line with budget, with a stable trend compared to 2014 final quarter.
Other significant operating events
The following transaction took place in 2014:• Barilla Singapore Pte Ltd incorporated a new Dubai
based company, Barilla Middle East FZE, to strengthen the Group’s presence in the Asian market.
Related party transactions
Transactions with Group companies and related parties are not considered uncharacteristic or unusual as they are carried out in the normal course of business of the Group companies. These transactions take place on an arm’s length basis, taking into account market conditions. The nature of the principal transactions with the above parties and the detailed disclosures required by IAS 24 are set out in note 8 of the notes to the consoli-dated financial statements.
29
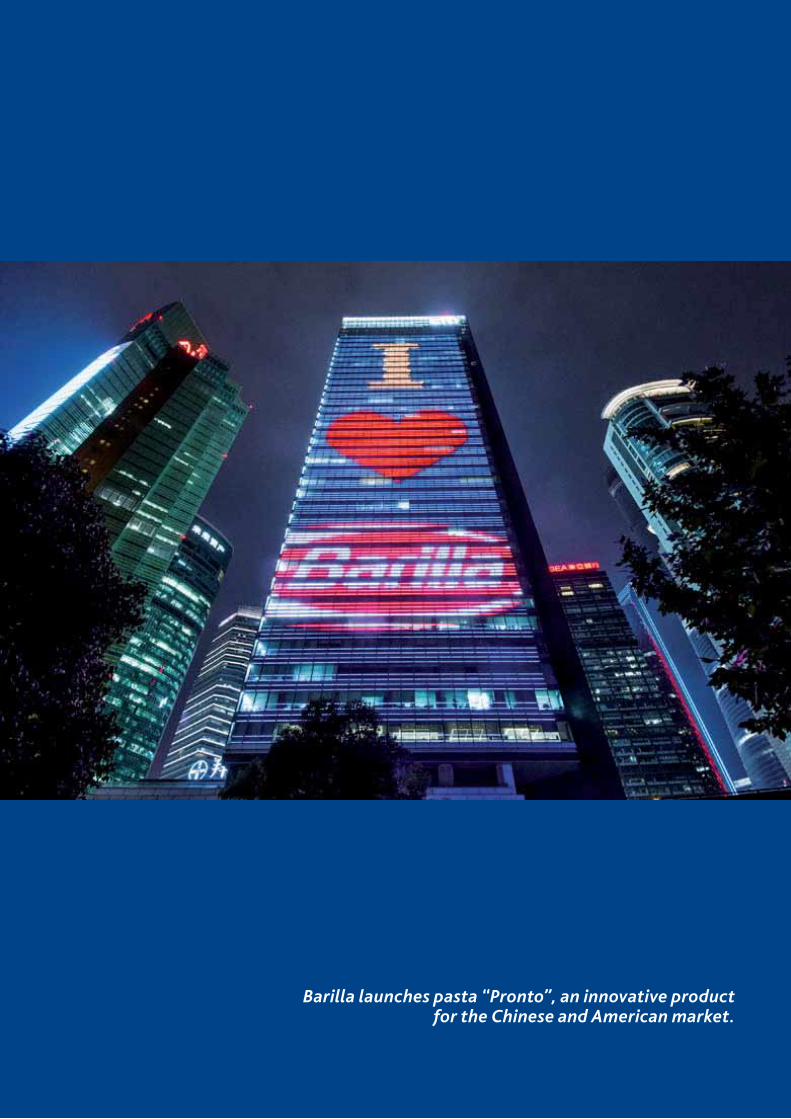
Barilla launches pasta “Pronto”, an innovative productfor the Chinese and American market.

30 31
The Barilla Group inaugurates a new production line at its plantin Plaine de L’Ain (France) for Harrys 100% Mie bread,the brand’s flagship product and leader in this segment.
32
Consolidated financial statementsfor the year ended 31 December 2014
The annual general meeting of shareholders approved the consolidated financial statements for the year ended 31 December 2014 on 5 May 2015.
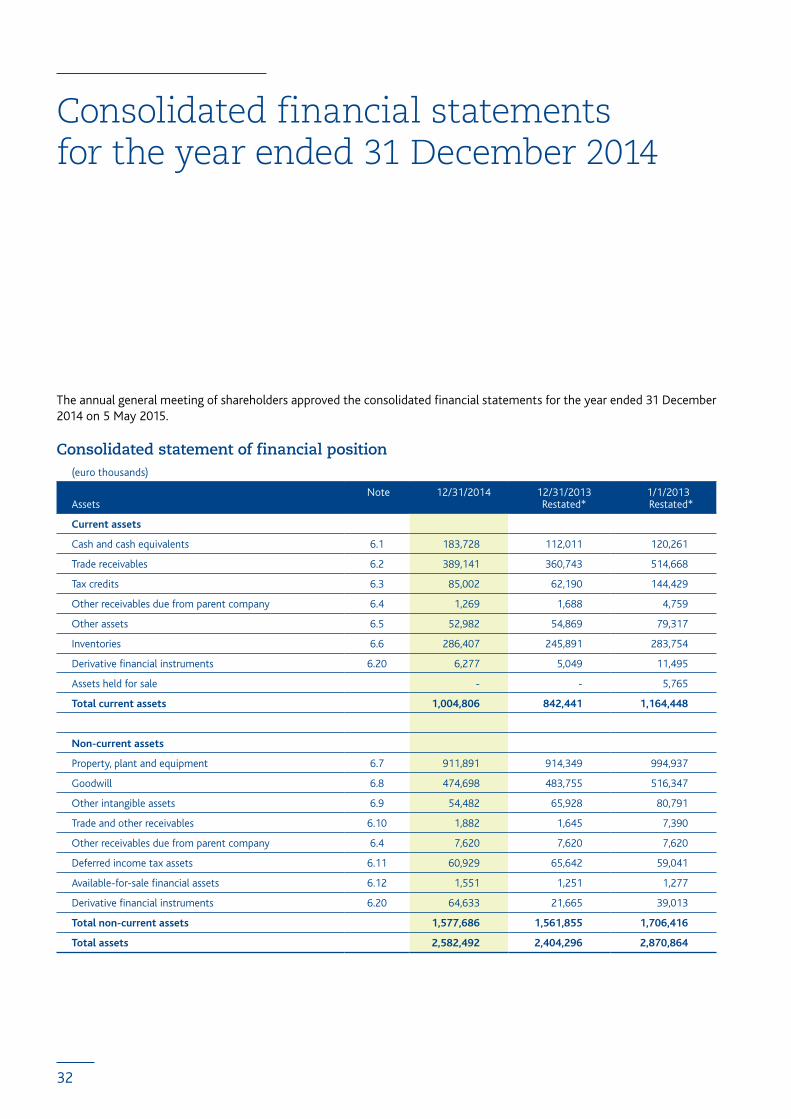
Consolidated statement of financial position (euro thousands)
Assets Note 12/31/2014 12/31/2013
Restated*1/1/2013
Restated*
Current assets
Cash and cash equivalents 6.1 183,728 112,011 120,261
Trade receivables 6.2 389,141 360,743 514,668
Tax credits 6.3 85,002 62,190 144,429
Other receivables due from parent company 6.4 1,269 1,688 4,759
Other assets 6.5 52,982 54,869 79,317
Inventories 6.6 286,407 245,891 283,754
Derivative financial instruments 6.20 6,277 5,049 11,495
Assets held for sale - - 5,765
Total current assets 1,004,806 842,441 1,164,448
Non-current assets
Property, plant and equipment 6.7 911,891 914,349 994,937
Goodwill 6.8 474,698 483,755 516,347
Other intangible assets 6.9 54,482 65,928 80,791
Trade and other receivables 6.10 1,882 1,645 7,390
Other receivables due from parent company 6.4 7,620 7,620 7,620
Deferred income tax assets 6.11 60,929 65,642 59,041
Available-for-sale financial assets 6.12 1,551 1,251 1,277
Derivative financial instruments 6.20 64,633 21,665 39,013
Total non-current assets 1,577,686 1,561,855 1,706,416
Total assets 2,582,492 2,404,296 2,870,864

33
* Following the adoption as January 1, 2014 of IFRS 11 “Joint arrangements” on a retrospective basis, the comparative data for 2013 have been restated as required by IAS 1.
(euro thousands)
Liabilities and equity Note 12/31/2014 12/31/2013 Restated*
1/1/2013 Restated*
Current liabilities
Trade payables 6.13 668,746 587,568 772,238
Borrowings 6.14 140,393 17,153 156,577
Borrowings due to parent companies 6.14 - 5,000 -
Derivative financial instruments 6.20 2,477 810 17,566
Retirement benefit obligations 6.15 11,042 8,183 10,559
Current income tax liabilities 6.16 7,405 7,989 8,769
Other liabilities 6.17 167,074 167,472 190,321
Provisions for other liabilities and charges 6.18 54,839 64,789 40,950
Total current liabilities 1,051,976 858,964 1,196,980
Non-current liabilities
Borrowings 6.19 361,648 441,065 558,817
Derivative financial instruments 6.20 - 21,532 11,596
Retirement benefit obligations 6.15 145,191 124,727 157,936
Deferred income tax liabilities 6.11 48,402 83,692 97,500
Other payables 6.21 4,253 4,239 4,477
Provisions for other liabilities and charges 6.18 18,963 19,288 31,768
Total non-current liabilities 578,457 694,543 862,094
Equity 6.22
Share capital 131,000 131,000 131,000
Reserves:
- Currency translation reserve 34,070 4,710 22,295
- Other reserves 504,683 479,925 472,696
Profit/(loss) for the year 125,519 92,455 50,499
Capital and reserves attributable to Group equity
holders 795,272 708,090 676,490
Non-controlling interests 132,249 124,433 122,779
Profit/(loss) attributable to non-controlling interests 24,538 18,266 12,521
Total non-controlling interests 6.23 156,787 142,699 135,300
Total equity 952,059 850,789 811,790
Total liabilities and equity 2,582,492 2,404,296 2,870,864

34
Income statement of discontinued operations
Consolidated income statement
* Following the adoption as January 1, 2014 of IFRS 11 “Joint arrangements” on a retrospective basis, the comparative data for 2013 have been restated as required by IAS 1.
(euro thousands)
Note 2014 2013Restated *
Revenue 6.24 3,254,095 3,229,973
Cost of sales 6.25 (1,948,608) (1,939,727)
Gross profit 1,305,487 1,290,246
Logistics costs 6.25 (294,270) (285,420)
Selling costs 6.25 (141,804) (143,580)
Marketing costs 6.25 (358,231) (350,592)
Research and development costs 6.25 (25,103) (25,754)
General and administrative expenses 6.25 (176,653) (180,412)
Other income and (expenses) 6.26 (19,519) (39,441)
Goodwill and intangible fixed assets impairment loss 6.9 - 6.25 - (28,354)
Operating profit 289,907 236,693
Finance costs (75,826) (64,511)
Finance income 38,173 28,602
Finance costs - net 6.27 (37,653) (35,909)
Profit before income tax 252,254 200,784
Income tax expense 6.28 (102,197) (94,523)
Profit for the year from continuing operations 150,057 106,261
Profit/(Loss) of discontinued operations - 4,460
Profit/(Loss) for the year 150,057 110,721
Profit/(Loss) attributable to non-controlling interests 24,538 18,266
Profit/(Loss) attributable to Group equity holders 125,519 92,455
(euro thousands)
2014 2013
Revenue - 338,562
Cost of sales - (333,023)
Recurring operating profit/(loss) - 5,539
Finance costs – net - (511)
Income tax expense - -
Profit/(Loss) of discontinued operations - 5,028
Gain/(Loss) on disposal net of directly attributable costs - (568)
Profit/(Loss) of discontinued operations - 4,460

35
Statement of comprehensive income
* Following the adoption as January 1, 2014 of IFRS 11 “Joint arrangements” on a retrospective basis, the comparative data for 2013 have been restated as required by IAS 1.
(euro thousands)
Note 2014 2013Restated *
Profit/(loss) for the year (a) 150,057 110,721
Items that will not be reclassified to profit or loss:
Actuarial gains/(losses) on future employee benefits 6.16 (24,143) 6,035
Fiscal effect 6.12 6,702 (1,721)
Total (b) (17,441) 4,314
Items that may be subsequently reclassified to profit or loss:
Cash flow hedge reserve 6.21 (688) (3,122)
Fiscal effect 6.12 252 967
Currency translation adjustment 34,789 (21,636)
Total (c) 34,353 (23,791)
Other comprehensive income for the year (b+c) 16,912 (19,477)
Total comprehensive income/(loss) for the year (a+b+c) 166,969 91,244
Total profit/(loss) for the year attributable to:
- Non-controlling interest 24,538 18,266
- Group equity holders 125,519 92,455
Total 150,057 110,721
Total comprehensive income/(loss) attributable to:
- Non-controlling interest 27,276 14,444
- Group equity holders 139,693 76,800
Total 166,969 91,244

36
Statement of changes in net equity(euro thousands)
For the year ended 31 December 2014
* Following the adoption as January 1, 2014 of IFRS 11 “Joint Arrangements” on a retrospective basis, the comparative data for 2013 have been restated as required by IAS 1.
For the year ended 31 December 2013
Share capital 131,000 - - - - - 131,000
Translation reserve 4,710 - - - 29,358 29,358 34,068
Actuarial gain (losses) reserve (20,989) - - - (20,507) (20,507) (41,496)
Hedging reserve (1,228) - - - (584) (584) (1,812)
Deferred taxes reserve 6,157 - - - 5,907 5,907 12,064
Retained earnings 495,984 92,455 (52,511) - - - 535,928
Profit 92,455 (92,455) - 125,519 - 125,519 125,519
Total 708,090 - (52,511) 125,519 14,174 139,693 795,272
Non controlling interests 142,699 - (13,188) 24,538 2,738 27,276 156,787
Total equity 850,789 - (65,699) 150,057 16,912 166,969 952,059
Restated balance at
31 December 2013 *
Destination of the profit
Dividends and reserves distribution
Total comprehensiveincome
Profit Other comprehensive
income
Balance at 31 December
2014Total
Share capital 131,000 - 131,000 - - - - - 131,000
Translation reserve 22,295 - 22,295 - - - (17,585) (17,585) 4,710
Actuarial gain (losses) reserve (28,101) - (28,101) - - - 7,112 7,112 (20,989)
Hedging reserve 1,426 - 1,426 - - - (2,654) (2, 654) (1,228)
Deferred taxes reserve 6,802 - 6,802 - - - (645) (645) 6,157
Retained earnings 492,569 - 492,569 50,499 (45,201) - (1,883) (1,883) 495,984
Profit 50,499 - 50,499 (50,499) - 92,455 - 92, 455 92,455
Total 676,490 - 676,490 - (45,201) 92,455 (15,655) 76,800 708,090
Non controlling interests 118,898 16,402 153,300 - (7,045) 18,266 (3,822) 14,444 142,699
Total equity 795,388 16,402 811,790 - (52,246) 110,721 (19,477) 91,244 850,789
Restated balance at 1 January 2013 *
Balance at 1 January
2013
Impact of change in
accounting policy
Destination of the profit
Dividends and reserves distribution
Total comprehensiveincome
Profit Other comprehensive
income
Restated balance at
31 December 2013 *
Total

37
Consolidated cash flow statement
Cash flows generated from discontinued operations
* Following the adoption as January 1, 2014 of IFRS 11 ‘Joint Arrangements’ on a retrospective basis, the comparative data for 2013 have been restated as required by IAS 1.
(euro thousands)
2014 2013Restated *
Profit/(loss) before income tax 252,254 205,244
Profit/(loss) on disposal of investments - 568
Finance costs – net, excluding gains on disposals of equity investments 37,653 35,909
Amortization and depreciation 134,094 151,636
(Profit)/loss on disposal of property, plant and equipment, intangible and financial assets 2,822 2,719
Property, plant and equipment and Intangible asset impairment losses - 28,354
Change in trade receivables/payables 28,714 (64,866)
Change in inventories (40,516) 22,562
Change in provisions (including employee provisions) (13,877) 16,341
Changes in other assets and liabilities (12,193) 83,425
Income taxes paid (132,249) (120,284)
Foreign exchange gains/(losses) and other minor differences 36,841 (8,607)
Net cash generated from/(used in) operating activities (A) 293,541 352,328
Purchases of property, plant and equipment (111,216) (106,530)
Purchases of software (4,503) (3,380)
Proceeds from sale of property, plant and equipment 939 306
Purchases of other intangible assets (2,108) (1,830)
Net proceeds from sale of investments or businesses - 4,651
Proceeds due to change in scope of consolidation area - 53,753
Investment in available for sale financial assets (300) -
Proceeds from capital grants 240 177
Net cash generated from/(used in) investing activities (B) (116,948) (52,853)
Net change in borrowings (64,603) (237,680)
Dividends paid and reserves distribution (65,699) (52,246)
Interest paid (13,890) (19,881)
Net cash generated from/(used in) financing activities (C) (144,192) (309,807)
Net (decrease)/increase in cash and cash equivalents and bank overdrafts (A+B+C) 32,401 (10,332)
Cash and cash equivalents net of bank overdrafts at beginning of the year 106,824 114,430
Cash and cash equivalents net of bank overdrafts at end of the year 139,865 106,824
Exchange differences on cash and bank overdrafts (640) (2,726)
Net (decrease)/increase in cash and cash equivalents 32,401 (10,332)
Bank balances 183,728 112,011
Bank overdrafts (43,863) (5,187)
Total cash and cash equivalents net of bank overdrafts 139,865 106,824
(euro thousands)
2014 2013
Net cash generated from/(used in) operating activities - 2,666
Net cash generated from/(used in) investing activities - (3,673)
Net cash generated from/(used in) financing activities - -

38
Pasta World Championship: Paolo Barilla presents the award to the winner of the 2014 edition, Luca Torricelli, chef of the restaurant “L‘Argentino“ in Lugano (Switzerland).
39
Illustrative notes
1. Group structure and business
Barilla Holding Società per Azioni (hereinafter “Barilla Hold-ing”), a company incorporated in Italy with registered offices in Parma (Italy), is the parent company of the Barilla Hold-ing Group (hereinafter “the Group” or “Barilla”). The Group operates in the manufacture and sale of pasta, sauces, and bakery products, both in Italy and worldwide. The entire share capital is owned by Guido Maria Barilla e F.lli S.a.p.A. through its subsidiaries CO.FI.BA. S.r.l. and Gelp S.p.A. A list of the companies included in the scope of consoli-dation is provided in Annex 1.
2. Significant events after the year-end
Subsequent to 31 December 2014, the end of the report-ing period, and until the date when the financial statements have been authorized for issue, there have been no significant events to report.
3. Declaration of compliancewith International Financial Reporting Standards (IFRS)
The consolidated financial statements of the Group have been prepared in accordance with all of the International Financial Reporting Standards (IFRS) issued by the Inter-national Accounting Standards Board (IASB) and endorsed by the European Union (EU). IFRS comprise all of the Inter-national Financial Reporting Standards, International Ac-counting Standards (IAS), and the interpretations issued by the International Financial Reporting Interpretations Com-mittee (IFRIC), previously named the Standing Interpreta-tions Committee (SIC).
4. Basis of preparation - Accounting and valuation policies
In accordance with Regulation 1606 issued by the Euro-pean Parliament and the European Council in July 2002, the Group’s consolidated financial statements (hereinafter “the Financial Statements”) have been prepared in accordance with International Financial Reporting Standards (IAS/IFRS) in force at 31 December 2014. IFRS have been adopted in Italy and in other countries. A significant number of IFRS have recently been published or revised and for which no established practice relating to their interpretation and application exists. Consequently, the Financial Statements have been prepared based on the most recent information and technical guidance available in re-spect of IFRS. Any new or revised interpretation or practice will be reflected in future financial statements in accordance with the relevant accounting standards. The Financial Statements for the year ended 31 December 2014 have been compared with the prior year financial state-ments (amounts included in brackets in the notes to the finan-cial statements), and comprise the consolidated statement of financial position, consolidated income statement, statement of comprehensive income, statement of changes in equity, con-solidated cash flow statement and the illustrative notes to the consolidated financial statements. Amounts are presented in thousands of euro, the functional currency of the Group, being the euro the currency in the economy where the parent and the major companies of the Group operate. The Group has chosen to present the income statement using the classification of expenses by function while the bal-ance sheet has been prepared with separate disclosure of cur-rent and non-current assets and liabilities. Cost of sales includes all production costs of goods sold, comprising raw materials, components, internal and third party direct and indirect production labor costs, industrial depreciation and amortization and all other pro-duction expenses.

40
The cash flow statement has been presented applying the indirect method. Principles of consolidation, translation of financial state-ments denominated in foreign currencies, accounting and valuation policies have been applied consistently with 31 December 2013, with the exception of the amendments ap-plicable from 1 January 2014 and not early adopted by the Group, as detailed below.
Accounting standards, amendments and interpretations adopted by the Group from 1 January 2014
IFRS 10 and IFRS 11 - Consolidated Financial Statements and joint arrangementFollowing the adoption of the IFRS 10, the Group has modi-fied the model previously utilized for assessing control over investees and the subsequent requirement for consolidation. IFRS 10 introduces a new model for assessing control over every entity based on the power over the relevant activities,
1 January 2013 Effects of changes in accounting policies
As previously reported
Restatement effect
Restated
Total assets 2,850,412 20,452 2,870,864
Total liabilities 2,055,024 4,050 2,059,074
Total non-controlling interests 118,898 16,402 135,300
Total equity attributable to the Group equity holders 676,490 - 676,490
For the year ended 31 December 2013 Effects of changes in accounting policies
As previously reported
Restatement effect
Restated
Total assets 2,383,593 20,703 2,404,296
Total liabilities 1,549,962 3,545 1,553,507
Total non-controlling interests 125,543 17,156 142,699
Total equity attributable to the Group equity holders 708,090 - 708,090
Operating profit 234,555 2,138 236,693
Finance costs - net (35,947) 38 (35,909)
Profit before income tax 198,608 2,176 200,784
Fiscal effect (93,969) (554) (94,523)
Profit for the year 109,099 1,622 110,721
- of which attributable to non-controlling interests 16,644 1,622 18,266
- of which attributable to Group equity holders 92,455 - 92,455
IAS 28 - Investments in associates and joint venturesThe new standard incorporates the new principles for joint ventures discussed by the Board and set out in the Exposure Draft 9. The application of the standard had no impact on the Consolidated Financial Statements of the Group.
or based on the exposure or the rights to variable returns from its involvement with the investee, and on the ability to affect those returns through its power over the investee. In accordance with the transitional provisions of IFRS 10, the Group has reconsidered the assessment of control over investees, and changed the basis for consolidation for Barilla Mexico S.A. de C.V. and Serpasta Pastificio S.A. de C.V., previously considered joint ventures and accounted for with the proportionate method; starting from this year the investees are consolidated line by line and the non-control-ling interests are measured at their proportionate share of the net assets. IFRS 11 provides for a more realistic reflection of joint arrangements by focusing on the rights and obligations of the arrangement, rather than its legal form. Entities will ac-count the contractual rights and obligations arising from the joint arrangement. For further details on the effects of the restatement of the amounts as at 1 January 2013 and 31 December 2013, see the following table:
IFRS 12 - Discosure of interests in other entities The new standard, published on May 2011, refers to the disclosures concerning interests in other entities, including joint ventures associates, SPEs and other off balance sheet vehicles.

41
The Group has modified the information provided in the notes.
IAS 32 - Financial Instruments: Disclosures - Offsetting Financial Assets and Financial LiabilitiesThe application of the standard had no impact on the Financial Statements of the Group.
Accounting standards, amendments and interpretations not yet effective and not early adopted by the Group
The following accounting standards and amendments will be applicable for financial years beginning 1 January 2016:Amendment to IFRS 11 - Accounting for Acquisition of Inter-ests in Joint OperationsAmendment to IAS 16 and IAS 38 - Classification of Accept-able Methods of Depreciation and Amortization
The following accounting standard will be applicable for fi-nancial years beginning 1 January 2017:IFRS 15 - Revenue from Contracts with Customers
The following accounting standard will be applicable for fi-nancial years beginning 1 January 2018:IFRS 9 - Financial Instruments
The Group is evaluating the impact of application of this new standard.
Accounting and valuation policies
Basis of preparationThe Financial Statements are presented in euro and all amounts are stated in thousands of euro (unless otherwise stated). The Financial Statements have been prepared under the historical cost convention, as modified for impairment losses where applicable, with the exception of financial in-struments measured at fair value. Uniform accounting poli-cies are adopted by all Group companies. The purchase or sale of financial assets are recognized or derecognized using settlement date accounting.
Estimates and assumptionsPreparation of the Financial Statements requires manage-ment to use estimates based on subjective assumptions derived from historical experience that is considered reasonable and realistic in relation to the specific circum-stances. These estimates affect the reported amounts of assets and liabilities, revenues and costs and the disclo-sures relating to contingent assets and liabilities at the bal-ance sheet date. Estimates and assumptions principally relate to evalua-tion of the recoverable amount of intangible assets, defini-tion of the useful lives of property, plant and equipment, the recoverability of trade and other receivables and the rec-ognition and measurement of provisions for other liabilities and charges.
Estimates and assumptions are based on the best knowledge available at the date of preparation of the Finan-cial Statements.
Critical accounting policiesA summary of the accounting policies that require manage-ment to exercise more critical judgment in forming esti-mates, and for which a change in the underlying conditions of the assumptions used could have a significant impact on the Financial Statements, is set out below:
a. GoodwillThe value of goodwill is tested for impairment on an annual basis in order to identify any potential impairment losses (impairment test). This assessment requires goodwill to be allocated to cash generating units (CGU) and determination of the recoverable amount, representing the higher of fair value and value in use. Where the recoverable amount of the cash generating units is lower than the carrying amount, comprising allo-cated goodwill, an impairment loss is recognized. Allocation of goodwill to the CGU’s and determination of their value in use requires estimates to be made that are based on subjec-tive assumptions and factors that may change over time with potentially significant effects on the valuations carried out by management.
b. DepreciationThe cost of property, plant and equipment is depreciated systematically over the estimated useful lives of the related assets. The useful life of Group assets is determined by management at the acquisition date; this is based on his-torical experience for similar assets, market conditions and information regarding future events that could affect the useful life, for example changes in technology. As a result, the effective economic life of an asset may differ from the estimated useful life. The Group reviews changes in tech-nology and business factors on a regular basis in order to update the residual useful lives. This update may result in a change in the depreciation period and an adjustment to the depreciation charge for future periods.
c. Impairment of fixed assetsThe carrying amount of fixed assets is tested for impairment to identify any impairment losses, when there is any indica-tion that the carrying value cannot be recovered through future use or sale. The identification of any such impairment indicators re-quires management to carry out subjective valuations based on both internally and externally available information, and subjective assumptions based on historical experience. Moreover, where there is an indication of a potential impair-ment, this should be determined applying suitable valuation techniques. The proper identification of impairment indica-tors and the estimates used to determine the recoverable amounts depend on subjective assumptions and factors which may vary over time, affecting management valua-tions and estimates.

42
d. Deferred income tax assetsAccounting for deferred income tax assets is based on expectations relating to the generation of future taxable income, and the evaluation of technical and institutional factors relating to the fiscal regime to which the taxes relate (for example: time limits for the recovery of tax losses). The estimate of future taxable income for the purpose of recording deferred tax assets depends on fac-tors and assumptions that may vary over time and could have a significant impact on the valuation of deferred tax assets.
e. Provisions for other liabilities and chargesProvisions are made to cover the potential liability relating to legal and tax risks. The measurement of the provisions recognized in the Financial Statements in relation to these risks represents management’s best estimate at the bal-ance sheet date. This estimate requires assumptions to be made that depend on factors that may change over time and could therefore have a significant effect on the current estimates made by management in the preparation of the financial statements.
f. Determination of the fair value of financial instrumentsThe fair value of financial instruments is based on market quotations or, where unavailable, applying suitable valuation techniques with updated financial variables used by market investors and, where possible, taking into account the prices of recent transactions on similar financial instruments. The fair value hierarchy introduces three levels of input:• Level1:quotedpricesinactivemarketforidenticalas-
sets or liabilities;• Level2:pricescalculatedusingobservablemarketin-
puts;• Level3:pricescalculatedusinginputsthatarenot
based on observable market data.
The fair value of financial instruments in level 2 is deter-mined by using standard valuation techniques. Barilla has developed a model based on market practices, commonly based on similar financial instruments indicators, cash flow analysis and pricing models based on observable market data. In the determination of the valuation, the Group maximizes the use of market data compared to internal specific estimates. The Group does not hold financial instruments in level 3 of the fair value hierarchy.
Principles of consolidation
The Financial Statements comprise the financial state-ments of the parent company Barilla Holding, and the subsidiaries in which Barilla Holding holds, either directly or indirectly, a controlling interest. Subsidiaries represent those companies over which Barilla Holding exercises control as it has the power, either directly or indirectly, or it is exposed to variable returns from its involvement with the subsidiary, or it has the
rights to variable returns based on the ability to affect those returns through its power over the investee. The financial statements of the subsidiaries are con-solidated on a line-by-line basis from the date on which the parent gains effective control up to the date on which control ceases. The impact of all transactions between the subsidiaries and the Group is eliminated. The reporting date of all Group companies is 31 December.
Non-controlling interestsNon-controlling interests are measured at their propor-tionate share of the net assets from the date of the acqui-sition.
Foreign currency transactionsAll transactions are measured using the currency of the pri-mary economic environment in which each Group company operates (the functional currency). Transactions denominated in currencies different from the functional currency of the Group companies are translated at the rate of exchange pre-vailing on the date of the transactions. Monetary assets and liabilities are translated using year-end exchange rates and exchange differences are recognized in the income statement as financial items. Non-monetary assets and liabilities, which are measured at historical cost and denominated in foreign currency, are converted at the exchange rate prevailing on the dates of the transactions.
Translation of financial statements denominated in foreign currenciesThe financial statements of subsidiaries denominated in non-euro functional currencies are translated as follows:• assets and liabilities are translated at the year-end rate;• revenue and expenses are translated at average ex-
change rates for the period;• all resulting translation differences are reported in the
statement of comprehensive income.
On disposal of those entities that gave rise to exchange dif-ferences, the cumulative amount of exchange differences deferred in a separate component of the statement of com-prehensive income are recognized in the income statement.
Intangible assets
Intangible assets with a finite useful life are valued at cost, net of amortization and impairment losses, while those with an indefinite useful life are reviewed annually for impair-ment. Cost does not include capitalized borrowing costs. Amortization commences from when the asset is available for use.
GoodwillThe positive difference between the purchase price and the Group’s share of the fair value of assets, liabilities and con-tingent liabilities acquired as part of a business combination, is recorded as goodwill and is classified as an intangible asset with an indefinite useful life.

43
Goodwill is not amortized but is subjected to an annual impairment test. For the purpose of this assessment, goodwill is allocated to groups of cash generating units (“CGU”) that generally represent an operating segment (Business Unit). Goodwill impairment losses may not be reversed.
Trademarks and licenses Trademarks and licenses are valued at cost less amortization and impairment losses. Trademarks are amortized over their useful lives while licenses are amortized over the lower of the contract period and their useful lives.
SoftwareThe cost of software licenses, including other incremental costs, is capitalized and recorded in the Financial Statements net of amortization and impairment losses.
Research and development costsThe research costs relating to new products and/or proc-esses are entirely expensed when incurred. Given the nature of the Group’s business, no development costs, qualified for capitalization, are incurred. The useful lives of intangible assets are as follows:
Trademarks 5 to 20 years
Software 3 to 5 years
Property, plant and equipment
Property, plant and equipment are stated at acquisition or production cost, including directly attributable expenses, less accumulated depreciation and accumulated impairment losses, with the exception of land, which is not depreciated but valued at cost less accumulated impairment losses. Cost does not generally include capitalized borrowing costs. Depreciation is recorded from the month in which the asset is available for use, or when it is able to provide eco-nomic benefits. Depreciation is calculated systematically on a monthly basis applying rates that allocate the depreciable amount of the asset over its useful life or, where the asset is disposed of, up until the last entire month of use. The useful lives are as follows:
Category Useful life
Buildings 33 years
Plant and machinery:
- generic 13 years
- specific 10 - 20 years
- highly technological 5 - 8 years
Industrial and commercial equipment:
- furniture and fittings 8 years
- electronic machinery 3.5 years
Motor vehicles 5 years
Other equipment 2.5 years
Government grants relating to property, plant and equip-ment are recorded as a reduction in the value of the related asset and are recognized as income over the depreciation period. Leasehold improvements are classified in property, plant and equipment in line with the nature of the cost incurred. The depreciation period is the lower of the residual useful life of the asset and the residual period of the lease contract. Spare parts that are significant in value are capitalized and depreciated over the useful life of the asset to which they relate; the cost of other spare parts is expensed in the income statement as incurred.
Leasing
Property, plant and equipment acquired under finance leas-es, whereby all of the risks and rewards relating to the as-sets are transferred to the Group, are recognized at current value or, where lower, the current value of the minimum payment lease obligations, including any amounts to be paid on redemption. The corresponding liability due to the lessor is classified in financial payables. The assets are depreciated applying the rates presented above in respect of “Property, plant and equipment”, except where the lease term is lower than the estimated useful life and it is not reasonably cer-tain that ownership of the leased asset will be transferred on maturity of the contract; in this case the depreciation period corresponds to the lease term. Lease contracts in which the lessor substantially main-tains the risks and rewards arising from ownership of the assets are classified as operating leases. The costs incurred in respect of operating leases are charged to the income statement on a systematic basis over the term of the lease contract.
Impairment of property, plant and equipmentand intangible assets
In the presence of specific indicators that an asset may be impaired, an impairment test should be carried out on prop-erty, plant and equipment and intangible assets. The impairment test consists in the measurement of the recoverable value of the assets and comparison with the related carrying amount. If the recoverable amount of an asset is lower than its carrying amount, the latter should be reduced to the recoverable amount. This reduction represents an impair-ment loss and should be recognized as an expense in the income statement. With regard to assets that are not am-ortized, property, plant and equipment that are no longer used and intangible assets and property, plant and equip-ment not yet available for use, the impairment test is car-ried out on an annual basis, irrespective of whether specific indicators exist. During the year, the Group assesses whether there is any indication that property, plant and equipment and intangible assets with a finite useful life may be impaired.
44
For this purpose both internal and external sources of in-formation are taken into consideration. With regard to internal sources the following indicators are considered: obsolescence or physical deterioration of the asset, sig-nificant adverse changes in the extent to which an asset is used and deterioration in the expected level of the asset’s performance. With regard to external sources these include: performance of the market price of the asset, significant adverse changes in the technological, market, and legal en-vironment, the trend in market rates of return and the dis-count rate used in valuing investments. The recoverable value of an asset is defined as the higher of the fair value net of selling costs and value in use. The value in use is determined as the current value of expected future cash flows calculated applying a discount rate that reflects the current market valuation of the time value of money and the risks inherent in the asset. Where it is not possible to estimate the recoverable value of a single asset, the Group estimates the recoverable value of the cash generating unit or group of cash generating units to which it belongs. Where the conditions that led to the reduction in value no longer exist, the carrying value of the asset or the cash generating unit is restated to the new estimated recoverable value, which may not exceed the carrying value that would have been rec-ognized had the original impairment not been incurred. This restatement is recorded in the income statement. Purchased goodwill that is allocated to units or groups of cash generating units during the year is subjected to an impairment test prior to the end of the financial period in which the purchase and allocation took place. In order to assess its recoverability, the goodwill is al-located from the purchase date to each of the CGU’s or groups of CGU’s that are expected to benefit from the ac-quisition. Where the carrying value of the CGU (or groups of CGU’s) is higher than the respective recoverable amount, an impairment loss is recognized as an expense in the income statement. The impairment loss is initially recorded as a reduction in the carrying amount of the goodwill allocated to the CGU (or group of CGU’s) and secondly to other assets in the CGU on a pro-rata basis considering the relative carrying amount of each asset in the CGU up to the recoverable amount of individual assets with a finite useful life. The future cash flows derive from business plans ap-proved by the board of directors (or a similar body), which normally cover a period not exceeding five years. The long-term growth rate used for the purpose of estimating the terminal value of the CGU (or group of CGU’s) does not generally exceed the average long-term growth rate for the industry, the country or the market in which the CGU (or group of CGU’s) operates. The future cash flows are estimated with reference to current conditions of the CGU’s and do not consider benefits that may arise from future restructuring to which the com-pany is not yet committed, or future investments intended to improve or enhance the performance of the CGU. The Group has identified the cash generating units at production line level.
For the purpose of the impairment test, goodwill is al-located to groups of CGU’s, which generally represent the operating segments. The Group operating segments cor-respond to the following Business Units: Region Italy, Region Europe, Region America, Region Asia, Africa & Australia, for the Categories Meal Solutions and Bakery.
Amortized cost method of measuring financial assets and liabilities
The amortized cost method requires calculation of the ef-fective interest rate at the time the transaction is entered into. The effective interest rate is the rate that exactly dis-counts the future cash flows to the net carrying amount at initial recognition. Any changes in future cash flows, if not attributable to changes in market conditions, result in the restatement of the carrying value of financial assets and liabilities with a corresponding entry to the income statement.
Financial assets
On initial recognition, financial assets are measured at fair value and designated in one of the following categories depending on their nature and the purpose for which they were acquired:(a) Financial assets “at fair value through profit or loss”;(b) Loans and receivables;(c) Available-for-sale financial assets.
The purchase and sale of financial assets are recognized when the entity becomes party to the contractual provi-sions of the instrument. They are derecognized when the contractual rights to the financial asset have expired or the Group has substantially transferred all of the risks and re-wards relating to the asset. Following initial recognition in the Financial Statements, financial assets are measured as follows:
(a) At fair value through profit or lossThis includes financial assets, represented by equity securi-ties, acquired principally with the intention of short-term profit making. These securities are classified as current assets. The financial assets in this category are initially meas-ured at fair value and the directly attributable costs are ex-pensed in the income statement. Gains or losses relating to changes in the fair value of the financial assets at fair value through profit or loss are in-cluded in the income statement within finance income/costs in the period in which they are incurred.
(b) Loans and receivablesLoans and receivables are non-derivative financial assets with fixed or determinable payment terms, principally trade receivables, which are not quoted in an active market. Trade receivables and loans are included in current assets, with the exception of those that mature over twelve months after

45
the balance sheet date, which are classified as non-current assets. These assets are initially measured at fair value and are subsequently measured at amortized cost based on the effective interest rate, net of any impairment losses. Impair-ment losses on financial assets are recognized in the finan-cial statements where there is objective evidence that the Group will not be able to recover the amount due from the counterparty based on contractual conditions. The objective evidence that a financial asset or group of financial assets has incurred impairment loss includes observable data that comes to the attention of the Group regarding the following loss events:(a) significant financial difficulty of the issuer or obligor;(b) the disappearance of an active market for the asset be- cause of financial difficulties;(c) it becomes probable that the borrower will enter bankruptcy or other financial reorganization.
Trade receivables due within one year are measured at fair value, which generally approximates the face value. Securitized or factored receivables, either with or without recourse, which do not meet all of the conditions that per-mit derecognition, are maintained in the balance sheet; a corresponding financial liability is recognized as “Bank bor-rowings”. Receivables that are sold and meet all of the de-rec-ognition criteria for financial assets are removed from the balance sheet at the time of sale. Gains or losses arising from the sale of these assets are recognized when the as-sets are derecognized from the balance sheet.
(c) Available-for-sale financial assets This heading includes equity securities and other debt securities not held-for-trading. These are classified as non-current assets where management does not intend to sell the assets within 12 months of the balance sheet date. These are measured at fair value and any change in fair value is recorded in a separate heading in other compre-hensive income. The recognition of “gains or losses relating to changes in the fair value of financial assets” only occurs when the financial asset is sold or otherwise disposed of. The Group assesses at each balance sheet date wheth-er objective evidence exists that the financial assets have incurred an impairment loss. With regard to equity invest-ments classified as available-for-sale financial assets, a sig-nificant or prolonged decline in the fair value of an invest-ment below its cost is considered an impairment indicator. Where this evidence exists for available-for-sale financial assets, the cumulative loss - determined as the difference between the acquisition cost and the fair value at the bal-ance sheet date less any impairment loss on that financial asset previously recognized in profit or loss - is recognized in the income statement. The restatement of the value of financial assets rep-resented by capital instruments, for which an impairment loss was recognized in the income statement, is recorded directly in other comprehensive income. Any dividends relating to equity investments included
in available-for-sale financial assets are included as divi-dend income in the income statement under the heading “Dividends” only when the Group has acquired the right to receive this payment.
Financial liabilities
Financial liabilities are initially recorded at fair value ad-justed for transaction costs, and subsequently are measured at amortized cost applying the effective interest rate. The difference between amortized cost and the amount to be repaid is recognized in the income statement over the term of the liability. Financial liabilities are classified as current liabilities except where the Group, at the balance sheet date, has an unconditional right to extend the maturity of the loan to at least more than twelve months after the balance sheet date. Trade and other payables with normal trading terms, gener-ally less than one year, are recorded at fair value, which nor-mally approximates the face value.
Inventories
Inventories are stated at the lower of cost, measured applying the FIFO (first in - first out) method, and net realizable value. To account for obsolete or slow-moving inventory provisions are recognized, that are reversed if the circumstances of the abovementioned provisions are no longer applicable.
Cash and cash equivalents
Cash and cash equivalents include cash on hand, bank and post office deposits and short-term highly liquid invest-ments that are readily convertible to cash (three months from the date of acquisition) and not subject to significant fluctuations in value.
Employee benefits
(a) Pension fundsGroup companies operate both defined contribution and de-fined benefit plans. A defined contribution plan is a plan where the Group pays fixed contributions to a separate entity (a fund) and will have no legal or constructive obligation to pay further contributions if the fund does not hold sufficient assets to pay all employee benefits relating to employee services in the current and prior periods. With regard to defined contribution plans, the Group pays contributions, either voluntary or specified in the plan rules, to public and private insurance pension funds. Contribu-tions are recognized as payroll costs applying the accrual basis. The defined benefit obligation recorded in the Financial Statements corresponds to the present value of the obliga-tion at the balance sheet date, less, where applicable, the fair value of any plan assets. The defined benefit obligations are

46
determined on an annual basis by an independent actuary us-ing the projected unit credit method. The present value of the defined benefit plan is determined discounting future cash flows by a rate equal to that of high-quality corporate bonds of equivalent currency and term to the benefit obligations. Remeasurements of actuarial gains and losses arising on the above adjustments and changes in the actuarial assumptions are reflected in the statement of comprehensive income. Service costs and net interest related to the time value in the actuarial calculation (classified within “Finance income and costs”) are recognized in the income statement.
(b) Termination benefits Termination benefits are those payable on termination of an employment before the normal retirement date, or when an employee accepts voluntary redundancy. The Group recognizes termination benefits when a demonstrable com-mitment exists that is governed by a detailed formal plan specifying details of the employment termination, or when payment of the benefit is the result of an offer made to en-courage voluntary redundancy.
Provisions for other liabilities and charges
Provisions are recorded to cover the Group’s legal, con-tractual or constructive obligations that derive from a past event. A provision is recognized where it is probable that an outflow of resources will be required and a reliable estimate of the amount may be made. Where it is estimated that these obligations will arise more than twelve months after the balance sheet date and that they will have a material impact on the financial statements, they are recorded at present value applying a discount rate that reflects current market assessments of the time value of money and the risks specific to the liability. Any adjustment to the estimat-ed provision is recognized in the income statement in the period in which the adjustment occurred. Where discounting is used, any increase in the provision to reflect the passage of time and the impact of changes in the discount rate are recognized as borrowing costs. Restructuring provisions are recognized when there is a constructive obligation, which takes place when the Group has a detailed formal plan and has informed those affected by the plan or when the Group has announced the plan in sufficient detail to raise valid expectation in those affected by the plan that the restructuring will be carried out. Provisions for tax risks are recognized following assess-ments notified to the Group but not yet settled at the bal-ance sheet date.
Derivative financial instruments
Accounting for derivative financial instrumentsDerivative financial instruments are measured at fair value, with any difference charged to income statement, with the exception of cash flow hedges, where gains or losses are rec-ognized in the statement of comprehensive income.
Derivatives that qualify for hedge accountingIn all cases where derivatives are designated as hedging in-struments, the Group formally documents, from inception of the hedge, the relationship between the hedging instru-ment and the related hedged item or transaction, the risk management objective and the hedging strategy adopted. The Group also documents the hedging instrument’s effectiveness to compensate changes attributable to the hedged risk based on changes in the fair value of the hedg-ing instruments compared to changes in the fair value of the hedged item. This assessment is carried out at inception and on a continuous basis throughout the life of the hedge.
Categories of derivativesHedging instruments are categorized as follows:i) Derivatives designated as cash flow hedge: if the
hedge is designated to cover the exposure to vari-ability in cash flows that is attributable to a particular risk associated with a recognized asset or liability or a highly probable forecast transaction, the gains or losses on the effective portion of the hedging instru-ment are recognized in the statement of comprehen-sive income; the ineffective portion of the gain or loss on the hedging instrument is recognized in the income statement. Depending on the nature of the hedge, fi-nancial or commodity related, the ineffective portion is classified in either finance income/costs on financial transactions or operating costs/income, respectively.
The amounts recognized directly in the statement of comprehensive income are recognized in the income statement in the period in which the hedged item af-fects profit or loss.
When a hedging instrument reaches maturity or is sold, or no longer meets the conditions required to be classified as a hedge, the related fair value adjust-ments accumulated to date will be retained until the hedged item affects profit or loss, and only at that time will it be recognized in the income statement applying the accounting treatment relevant to the hedged item. If the forecast transaction that was subject to the hedge is no longer expected to affect the income statement, the accumulated fair value ad-justments are immediately recognized in the income statement.
For the valuation of the financial liabilities hedged by cash flow hedges, please refer to the devoted para-graph.
ii) Derivatives designated as fair value hedges are clas-sified as current or non-current assets or liabilities based on their contractual maturity.
The gain or loss arising on changes in the fair value of these instruments is recognized in the income state-ment. Depending on the nature of the hedge, financial or commodity related, the variation of fair value is classified in either finance income/costs on financial transactions or operating costs/income, respectively.
For the valuation of the financial liabilities hedged by fair value hedges, please refer to the devoted para-graph.

47
iii) Derivative financial instruments at fair value through profit or loss that are not designated as hedges are classified as current or non-current assets or liabilities based on their contractual maturity.
The gain or loss arising on changes in the fair value of these instruments is recognized in the income statement. Depend-ing on the nature of the hedge, financial or commodity re-lated, the variation of fair value is classified in either finance income/costs on financial transactions or operating costs/income, respectively.
Determination of the fair value of a hedging instrument The fair value of an interest rate swap is determined based on the present value of the expected future cash flows. The fair value of forward foreign exchange contracts is deter-mined using the forward rate at the balance sheet date. The fair value of other hedging instruments quoted on an active market is based on the market prices prevailing at the balance sheet date. The fair value of instruments that are not quoted on an active market is determined us-ing valuation techniques based on a series of methods and assumptions, and market information at the balance sheet date.
Non-current assets and liabilities held for sale and discontinued operations
A non-current asset, or group of non-current assets and liabilities, is classified as held for sale when the carrying amount is to be recovered primarily from a sale transaction rather than through continuing use. The assets (or groups of assets) held for sale are measured at the lower of their carry-ing amount and their fair value, less estimated selling costs. The results and the carrying amount of a component of an entity that represents a separate major line of business or geographical area of operations are classified separately in the income statement and in the balance sheet when they meet the conditions to be classified as held for sale or dis-continued.
Total equity
Costs directly attributable to share capital increases are re-corded as a deduction from total equity.
Revenue recognition
Revenue is recognized at the fair value of the amount re-ceived for the sale of products or services, net of returns or discounts.
Sale of productsRevenue from product sales is recognized when all of the following conditions are met, which normally take place on delivery to the customer:
• thesignificantrisksandrewardsarisingfromowner-ship of the goods are transferred to the buyer;
• effectivecontroloverthegoodsceases;• theamountofrevenuecanbereliablymeasured;• itisprobablethattheeconomicbenefitsassociated
with the transaction will flow to the entity;• thecostsincurredortobeincurredinrespectofthe
transaction can be reliably measured.
DividendsDividends are recognized when the right to receive payment is established.
Government grants
Revenue based government grants are recognized in the income statement when the right to receive the payment is established.
Finance income and costs
Finance income and costs are recorded on an accrual basis and comprise: interest payable matured on all borrowings, interest income on cash and cash equivalents and similar securities, dividends, foreign exchange gains and losses and the financial impact arising from hedging the exposure to interest rate and foreign exchange risk, which are taken to the income statement.
Taxation
Taxation includes both current and deferred income taxes. Current income taxes are based on the estimate which the Group expects to pay calculated by applying to taxable in-come the enacted tax rates, or those substantively enacted, at the balance sheet date in each of the relevant tax juris-dictions. Deferred income tax assets and liabilities are deter-mined applying the liability method, whereby all of the tem-porary differences between the tax bases of assets and li-abilities and the carrying amounts at the balance sheet date, except for goodwill, are calculated. Deferred income tax as-sets and liabilities are measured using the tax rates that are expected to apply to the period when the asset is expected to be realized or the liability is expected to be settled, based on tax rates that have been enacted by the balance sheet date. Income taxes arising on the distribution of dividends are recognized on distribution. For the purpose of recognizing deferred tax assets, the Group assesses the likelihood that sufficient future taxable income will be available to recover these assets. Tax assets and liabilities, both current and deferred, may only be offset where the amounts relate to the same tax jurisdiction, where the reversal period is the same and there is a legally enforceable right to offset the recog-nized amounts.

48
Detail of receivables by maturity, net of allowances for doubtful accounts, is as follows:
2014 2013
Not yet overdue 359,779 321,723
Less than 3 months 26,384 36,280
Between 3 and 6 months 2,491 2,683
Between 6 and 12 months 487 57
Total 389,141 360,743
Trade receivables that were not yet overdue nor impaired at 31 December 2014 amounted to euro 186,028 (euro 141,957).
Movements in the allowance for doubtful accounts were as follows:
2014 2013
Opening balance 45,234 43,958
Charges 4,804 5,336
Utilization (3,701) (1,838)
Released (571) (706)
Change in scope of consolidation - (1,330)
Exchange difference (33) (186)
Closing balance 45,733 45,234
“Change in scope of consolidation” related to the balances of Lieken group companies, sold in 2013.
6.3 Tax creditsTax credits represent amounts due from tax authorities in the various countries in which the Group operates and principally relate to income tax installments and VAT recoverable.
These credits may be analyzed as follows:
12/31/2014 12/31/2013
Income tax 15,012 13,860
VAT 69,990 48,330
Total 85,002 62,190
During the year VAT receivables were settled for euro 50 million. The fair value of tax credits substantially approximates the carrying value.
6.4 Other receivables due from parent companyThe balance of euro 8,889 (euro 9,308) relates to the amount due from the parent company CO.FI.BA. S.r.l., as a result of the Group’s participation in the Group consolidated tax regime. The amount is due within one year for euro 1,269 (euro 1,688), and after one year for euro 7,620 (euro 7,620).
Distribution of dividends
Dividends payable to shareholders are recognized when the right to receive payment is established.
Transactions with non-controlling interests
The acquisition and disposal of non-controlling interests in companies in which control already exists are classified as transactions with Group shareholders. Any differences between the carrying value and the purchase price paid or received are recorded in equity.
5. Change in the scope of consolidation
The scope of consolidation area, compared to 31 December 2013, is changed for the incorporation of the trade company Barilla Middle East FZE, located in Dubai (United Arab Emir-ates).
6. Notes to the consolidated financial statements
Consolidated statement of financial position
6.1 Cash and cash equivalentsCash and cash equivalents, which amounted to euro 183,728 (euro 112,011), comprise bank and post office de-posit accounts, cheques and other cash on hand. The change in cash and cash equivalents recorded during the year is reported in the consolidated cash flow statement.
6.2 Trade receivables
12/31/2014 12/31/2013
Trade receivables 434,874 405,977
Allowance for doubtful accounts (45,733) (45,234)
Total 389,141 360,743
Trade receivables consist of amounts due from customers in relation to the sale of goods and provision of services, net of allowances for doubtful accounts. The charges to and utilization of the allowance for doubtful accounts are included in other income and expenses in the in-come statement under the sub-headings, Impairment and losses on receivables and Utilization of risk provisions, respectively. The fair value of trade receivables approximates their carrying value at the year-end. This also represents the maxi-mum exposure to credit risk.
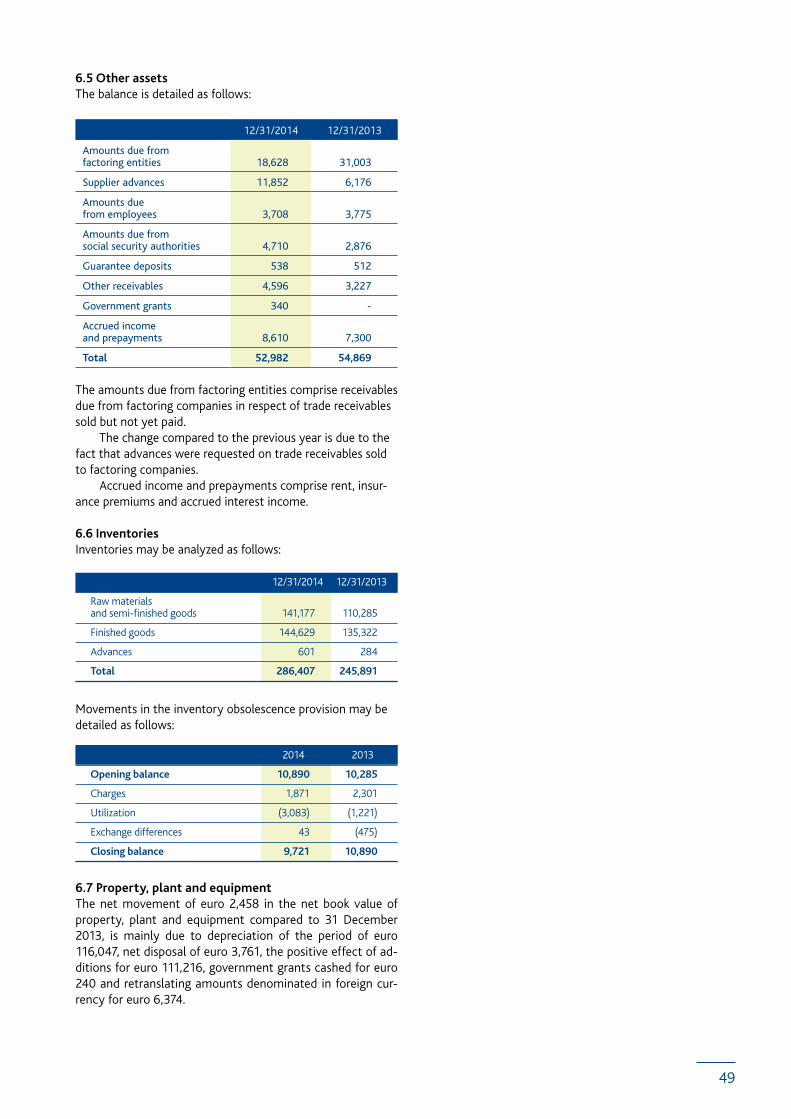
49
6.5 Other assets The balance is detailed as follows:
12/31/2014 12/31/2013
Amounts due from factoring entities 18,628 31,003
Supplier advances 11,852 6,176
Amounts due from employees 3,708 3,775
Amounts due from social security authorities 4,710 2,876
Guarantee deposits 538 512
Other receivables 4,596 3,227
Government grants 340 -
Accrued income and prepayments 8,610 7,300
Total 52,982 54,869
The amounts due from factoring entities comprise receivables due from factoring companies in respect of trade receivables sold but not yet paid. The change compared to the previous year is due to the fact that advances were requested on trade receivables sold to factoring companies. Accrued income and prepayments comprise rent, insur-ance premiums and accrued interest income.
6.6 InventoriesInventories may be analyzed as follows:
12/31/2014 12/31/2013
Raw materials and semi-finished goods 141,177 110,285
Finished goods 144,629 135,322
Advances 601 284
Total 286,407 245,891
Movements in the inventory obsolescence provision may be detailed as follows:
2014 2013
Opening balance 10,890 10,285
Charges 1,871 2,301
Utilization (3,083) (1,221)
Exchange differences 43 (475)
Closing balance 9,721 10,890
6.7 Property, plant and equipmentThe net movement of euro 2,458 in the net book value of property, plant and equipment compared to 31 December 2013, is mainly due to depreciation of the period of euro 116,047, net disposal of euro 3,761, the positive effect of ad-ditions for euro 111,216, government grants cashed for euro 240 and retranslating amounts denominated in foreign cur-rency for euro 6,374.

50
Movements in property, plant and equipment were as follows:
Land Buildings Plant and machinery
Industrial and commercial equipment
Other assets Assets under construction
Total
Movements during 2013
Net book amounts at 1/1/2013 60,226 319,273 522,385 27,716 22,683 42,654 994,937
Capital expenditure - - - - - 106,530 106,530
Capitalizations 24 14,011 77,097 3,301 4,015 (98,448) -
Grants received - - (177) - - - (177)
Disposals - Cost - (887) (29,627) (2,948) (1,030) (40) (34,532)
Disposals- Utilization of accumulated depreciation and impairment losses - 533 27,031 2,866 1,030 - 31,460
Depreciation and impairment losses - (18,130) (94,302) (8,070) (11,828) - (132,330)
Change in scope of consolidation (30,688) - - (281) (7,314) (1,814) (40,097)
Foreign exchange differences (419) (5,402) (4,780) (182) (145) (514) (11,442)
Net book amounts at 12/31/2013 29,143 309,398 497,628 22,402 7,411 48,367 914,349
Historical cost 29,143 603,063 2,145,248 97,031 61,892 48,367 2,984,744
Depreciation and accumulated impairment losses - (293,665) (1,647,620) (74,629) (54,481) - (2,070,395)
Movements during 2014
Capital expenditure - - - - - 111,216 111,216
Capitalizations 112 12,926 91,948 4,530 2,944 (112,460) -
Grants received - (4) (236) - - - (240)
Disposals - Cost (22) (2,163) (30,929) (2,392) (428) - (35,934)
Disposals- Utilization of accumulated depreciation - 1,133 28,481 2,141 418 - 32,173
Depreciation - (17,502) (88,228) (6,309) (4,008) - (116,047)
Foreign exchange differences 765 (903) 6,200 (555) 402 465 6,374
Net book amounts at 12/31/2014 29,998 302,885 504,864 19,817 6,739 47,588 911,891
Historical cost 29,998 608,467 2,194,922 96,452 64,809 47,588 3,020,670
Depreciation and accumulated impairment losses - (305,582) (1,690,058) (76,635) (58,070) - (2,108,779)
As of 31 December 2014, the accumulated impairment losses amount to euro 17,746 (euro 17,779).
Finance leasesThe net book amounts of assets held under finance leases amounted to euro 29,151 (euro 33,258) and comprised:
Land Buildings Plant and machinery
TotalOther assets
At 12/31/2014 191 4,140 24,624 196 29,151
At 12/31/2013 191 4,485 28,309 273 33,258

51
Details of the principal lease contracts outstanding at 31 December 2014 are provided below:• BarillaG.eR.Fratellihastwofinanceleasecontractsre-
lating to the cogeneration plants in Italy, which will expire in 2020 and 2022, and for which purchase options exist at the end of the lease term, amounting to euro 21,912.
• Barilla France has entered into a number of finance lease contracts with a maximum expiry date of Novem-ber 2015, with purchase options at the end of the lease term. The net book value of these assets amounted to euro 3,830. The main contracts relate to property leases, which expire in January and November 2015.
• BarillaDeutschlandhasenteredintoafinanceleasecon-tract for a mill that matures in August 2028. The net book value at 31 December 2014 amounted to euro 2,301.
The present value of future minimum lease payments and the related payment periods are as follows:
12/31/2014 12/31/2013
Not later than 1 year 5,229 5,582
Later than 1 year and not later than 2 years 5,052 5,184
Later than 2 years and not later than 3 years 5,052 5,052
Later than 3 years and not later than 4 years 5,052 5,052
Later than 4 years and not later than 5 years 5,052 5,052
Later than 5 years 7,964 12,616
Total minimum future lease payments 33,401 38,538
The reconciliation between the minimum future lease pay-ments and the present value of the lease payments is as follows:
12/31/2014 12/31/2013
Total minimum future lease payments 33,401 38,538
Interest (5,892) (7,075)
Present value of lease payments 27,509 31,463
Operating leasesThe minimum future lease payments under operating leases and the related repayment period are as follows:
2014 2013
Not later than 1 year 10,900 10,663
Later than 1 year and not later than 5 years 14,409 12,304
Later than 5 years 4,709 -
Total minimum future lease payments 30,018 22,967
Total net operating lease payments recognized in the in-come statement amounted to euro 19,884 (euro 16,642).
6.8 GoodwillMovements in goodwill were as follows:
Goodwill
Movements in 2013
Opening balance at 1/1/2013 516,347
Impairment (28,354)
Foreign exchange differences (4,238)
Total at 12/31/2013 483,755
Movements in 2014
Foreign exchange differences (9,057)
Total at 12/31/2014 474,698
- of which gross value 503,052
- of which accumulated impairments (28,354)
The discontinued operation divested last year, due to the disposal of Lieken group, did not decrease the value of good-will, due to the impairment of the total value allocated to the operation in previous years. An analysis of goodwill by segment for the purpose of performing impairment test at 31 December 2014 is sum-marized in the table below:
Operating Segments - Business Units Amount
Europe Region - Bakery 472,507
Other minor 2,191
Total 474,698
The annual impairment test on goodwill consists in estimat-ing the recoverable amount of the groups of cash generating units to which the goodwill is allocated and comparison with the carrying value of the related assets including goodwill.The recoverable amount of the groups of cash generating units was determined based on the value in use, calculated as the present value of expected future cash flows relating to the groups of cash generating units. The cash flows utilized to determine value in use cover a five year period plus a terminal value. The plans are prepared in varying detail depending on requirements and the relevance of the selected variables, commencing with a series of key macroeconomic indicators (e.g. foreign exchange rates, inflation rates, market assumptions) and economic-financial targets. The qualitative and quantitative content of the plan is approved by Group management. The flows deriving from the groups of cash generating units at the end of the plan period correspond to the perpetual income based on the final year of the plan, normalized where necessary.
The key assumptions used to perform the impairment test at 31 December 2014 were as follows:
2014 2013 2014 2013
Europe Region - Bakery 6.3% 5% 1.3% 1.9%
Discount rate
Growthrate
Operating SegmentsBusiness Units

52
Based on the above assumptions, and considering the worsen-ing in the future profitability, the recoverable value of the Eu-rope Region - Bakery has been impaired last year for the origi-nal amount allocated to the Russia Bakery segment, amounting to euro 28,354. Based on the annual impairment test as of 31 December 2014, no any further impairment is required. The sensitivity analysis on the key assumptions has dem-onstrated that their variations, and the consequent impairment of the CGU’s to which the goodwill is allocated, are remote due to a significantly higher excess value compared to carrying amount of the group of cash generating units. The accumulated impact of fluctuations in exchange rates on goodwill denominated in foreign currencies, mainly in Swedish krona and Norwegian krone, have undergone a change in value due to the change. At 31 December 2014 the effect of conversion shows a net accumulated loss of euro 6,266. 6.9 Other intangible assetsOther intangible assets consisted of the following:
Licenses and software
Trademarks Other Assets under construction
Total
Movements during 2013
Opening balance at 1/1/2013 16,633 61,363 98 2,697 80,791
Acquisitions and capitalizations 5,207 1,135 24 (1,060) 5,306
Change in scope of consolidation (589) (19) - (156) (764)
Foreign exchange differences (30) (70) (1) - (101)
Amortization (7,799) (11,496) (9) - (19,304)
Total at 12/31/2013 13,422 50,913 112 1,481 65,928
Of which:
Historical cost 90,354 267,155 246 1,481 359,236
Amortization and accumulated impairment losses (76,932) (216,243) (134) - (293,309)
Movements during 2014
Acquisitions and capitalizations 4,522 1,217 - 872 6,611
Foreign exchange differences 5 9 (26) 2 (10)
Amortization (6,608) (11,430) (8) - (18,047)
Total at 12/31/2014 11,341 40,709 77 2,355 54,482
Of which:
Historical cost 95,122 265,731 256 2,355 363,464
Amortization and accumulated impairment losses (83,781) (225,022) (179) - (308,982)
Trademarks relate principally to Harrys. The trademarks of Barilla G. e R. (Barilla, Mulino Bianco) have not been recog-nized in the Financial Statements as they were developed internally. The increase in “Licenses and software” refers for euro 4,503 (euro 3,380) to the acquisition of new “Enterprise Re-sources Planning” (ERP) software, in respect of an account-ing, finance, management and control system. The amount of “Assets under construction” mainly relates to costs for software systems not yet in use.
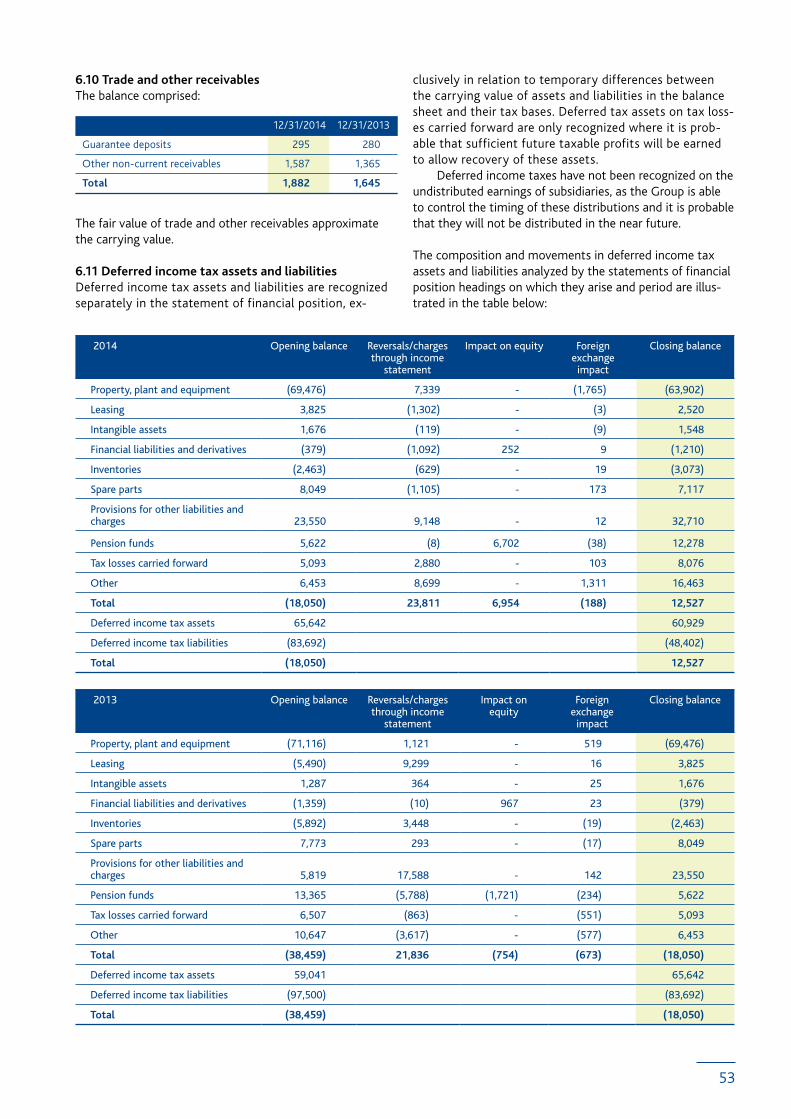
53
6.10 Trade and other receivablesThe balance comprised:
12/31/2014 12/31/2013
Guarantee deposits 295 280
Other non-current receivables 1,587 1,365
Total 1,882 1,645
The fair value of trade and other receivables approximate the carrying value.
6.11 Deferred income tax assets and liabilities Deferred income tax assets and liabilities are recognized separately in the statement of financial position, ex-
clusively in relation to temporary differences between the carrying value of assets and liabilities in the balance sheet and their tax bases. Deferred tax assets on tax loss-es carried forward are only recognized where it is prob-able that sufficient future taxable profits will be earned to allow recovery of these assets. Deferred income taxes have not been recognized on the undistributed earnings of subsidiaries, as the Group is able to control the timing of these distributions and it is probable that they will not be distributed in the near future.
The composition and movements in deferred income tax assets and liabilities analyzed by the statements of financial position headings on which they arise and period are illus-trated in the table below:
2014 Opening balance Reversals/charges through income
statement
Impact on equity Foreign exchange
impact
Closing balance
Property, plant and equipment (69,476) 7,339 - (1,765) (63,902)
Leasing 3,825 (1,302) - (3) 2,520
Intangible assets 1,676 (119) - (9) 1,548
Financial liabilities and derivatives (379) (1,092) 252 9 (1,210)
Inventories (2,463) (629) - 19 (3,073)
Spare parts 8,049 (1,105) - 173 7,117
Provisions for other liabilities and charges 23,550 9,148 - 12 32,710
Pension funds 5,622 (8) 6,702 (38) 12,278
Tax losses carried forward 5,093 2,880 - 103 8,076
Other 6,453 8,699 - 1,311 16,463
Total (18,050) 23,811 6,954 (188) 12,527
Deferred income tax assets 65,642 60,929
Deferred income tax liabilities (83,692) (48,402)
Total (18,050) 12,527
2013 Opening balance Reversals/charges through income
statement
Impact on equity
Foreign exchange
impact
Closing balance
Property, plant and equipment (71,116) 1,121 - 519 (69,476)
Leasing (5,490) 9,299 - 16 3,825
Intangible assets 1,287 364 - 25 1,676
Financial liabilities and derivatives (1,359) (10) 967 23 (379)
Inventories (5,892) 3,448 - (19) (2,463)
Spare parts 7,773 293 - (17) 8,049
Provisions for other liabilities and charges 5,819 17,588 - 142 23,550
Pension funds 13,365 (5,788) (1,721) (234) 5,622
Tax losses carried forward 6,507 (863) - (551) 5,093
Other 10,647 (3,617) - (577) 6,453
Total (38,459) 21,836 (754) (673) (18,050)
Deferred income tax assets 59,041 65,642
Deferred income tax liabilities (97,500) (83,692)
Total (38,459) (18,050)

54
6.12 Available-for-sale financial assets Available-for-sale financial assets principally comprise equity investments in BRW S.p.A., amounting to euro 1,109 and other non-current financial assets that total euro 1,551 (euro 1,251). The Group does not evaluate the investment at equity method because the Group does not exercise a significant influence on BRW S.p.A., despite holding an interest of be-tween 20% and 50%. BRW S.p.A. operates in the advertising and communica-tion business.
6.13 Trade payablesTrade payables, which amounted to euro 668,746 (euro 587,568), represent amounts due in relation to the purchase of goods and services. Trade payables are recorded at nomi-
nal value, which substantially approximates their fair value. All amounts are payable within one year. The total includes euro 488 (euro 1,762) due to BRW S.p.A. The balance comprises amounts due to co-packers, which are governed by medium/long-term supply contracts negotiated at arm’s length, which do however establish guaranteed minimums that are disclosed in contractual commitments for finished goods supplies.
6.14 BorrowingsCurrent borrowings, classified as current liability, comprise amounts due within one year. The balance includes financial debt due to bank and other financiers for euro 64,632 and “Bonds” for euro 75,761:
12/31/2014 12/31/2013
Short-term portion of bank overdrafts and leasing obligations 58,382 10,835
Current portion of long-term bank loans 6,250 6,318
Bonds 75,761 -
Financial debt due to parent companies - 5,000
Total borrowings 140,393 22,153
The short-term portion of bank overdrafts and leasing obliga-tions comprise bank overdrafts amounting to euro 43,863 (euro 5,187), the short-term portion of amounts due to leasing compa-nies of euro 3,820 (euro 3,981), loans for export financing of euro 3,757 (euro 1,667), loans due within one year for euro 6,941. The current portion of medium/long-term bank borrow-ings is not guaranteed by property, plant and equipment. In January 2012 an amortizing loan with the European Investment Bank (BEI) was subscribed for euro 50,000, with expiry in 2020. The current portion, due within 12 months, at 31 December 2014, amounts to euro 6,250. Details of bond classified as current asset, issued by sub-sidiary Barilla France S.A.S. in 2003, with expiry in December 2015 and covered by Cross Currency and Interest Rate Swaps, are summarized below:
Nominal value in currency (thousands)
Nominal coupon in $
Maturity Carrying value
Hedging transaction
Effective interest rate
in euroNominal value
in euroEffective
interest rate
Senior Notes 2003 $ 92,000 5.69 % 9 Dec 2015 75,761 78,700 4.10% (F) 4.19%
Total Notes $ 92,000 75,761 78,700
(F) Fixed interest rate
As of 31 December 2013, financial debt due to parent compa-nies, for euro 5,000, referred to a borrowing received from the parent company CO.FI.BA. S.r.l., expired in July 2014. Current borrowings are measured at the amortized costs deemed to approximate their fair value.

55
• In Greece, the “Retirement Indemnity Plan” provides that the employer is required to pay an indemnity when the employee has reached pensionable age or employ-ment is terminated involuntarily. The indemnity de-pends on a number of factors including years of service, the equivalent monthly salary in the last year of service (including bonuses) and the reason for termination. A scale of multiples is also defined in order to define the number of months to be paid in relation to years of service, also taking into consideration the reason for termination.
• In Germany, the “Pension Plan” provides for the pay-ment of an ongoing pension and not a one-off lump sum. The plan is based on a pre-determined percentage of annual salary and foresees that payment be made on reaching pensionable age and for invalidity, and may be paid in favor of the spouse. For the Pension Plan, there is a risk related to pension increase, established by local law that may have to be increased retrospectively (up to a limit of three years) as well as in respect of future increases.
• In Sweden, “IPT2 Plan” is the pension scheme for white collar employees based on the collective bargaining agreement. The risks are linked to any changes on col-lective bargaining agreement. The retirement benefit obligations are determined applying actuarial calcula-tions carried out by an independent expert or company, and are adjusted for events that require changes to be reflected therein.
The last actuarial valuation was performed at 31 December 2014 using the projected unit credit method, under which the present value of future retirement obligations is deter-mined.
12/31/2014 12/31/2013
Opening balance 132,910 168,495
Services costs 3,112 2,813
Settlement and plans amendments (1,275) (2,166)
Finance costs 4,222 4,187
Actuarial (gains)/losses 24,147 (6,036)
Exchange differences for the year (925) (1,385)
Benefits paid (5,957) (6,540)
Change in scope of consolidation - (26,459)
Closing balance 156,233 132,910
Of which:
Due within one year 11,042 8,183
Due after one year 145,191 124,727
Services costs relate to the charges for the year. Significant actuarial losses were recorded in 2014, which are due to the general decrease of the discount rates.
6.15 Retirement benefit obligationsRetirement benefit obligations comprise amounts paid to employee defined benefit plans, including the staff leav-ing indemnity fund (TFR), equivalent plans and pension schemes. Total obligations relating to future benefits payable to employees amounted to euro 156,233 (euro 132,910), of which amounts due within one year are euro 11,042 (euro 8,183) and due after more than one year are euro 145,191 (euro 124,727), net of plan assets for euro 4,750 (euro 4,538). In Italy, the staff leaving indemnity (TFR) represents the deferred compensation payable by companies to employees on termination of employment, in accordance with article 2120 of the Italian Civil Code. Following changes introduced to Italian law, the TFR provision matured up to 31 December 2006 is still consid-ered a defined contribution plan. The principal specific risks related to this plan refers to the accrued benefit that is payable to the members as a lump sum when retiring or leaving the company. According to the law, it is also possible to receive advance from the total accumulated benefit. Therefore, there is the risk that members leave the plan sooner than expected or request advance payments in a greater measure than expected, generating an actuarial loss in the plan due to cash flow ac-celeration. Other risks to which the plans are exposed are limited to inflation, to which the accrued benefits are linked, and discount rate. Abroad the plans and pension schemes relate to com-panies operating in France, Greece, Germany, Sweden, Tur-key, Norway, Mexico and Switzerland. The principal features of the more significant plans are as follows:• In France, there are the “Retirement Indemnity Plan”
and the “Seniority Awards Plan”. The first plan confers the right to receive a sum of money on termination of employment, in proportion to the number of years of service, final salary levels and whether termination was voluntary or not. For example, based on the terms of a contract for the commerce sector, an employee with more than 20 years service with a company, on volun-tary termination of employment, has the right to re-ceive three months salary (calculated based on the av-erage earnings or the 12 months prior to leaving), plus 1/5 of this amount for each additional year over 20. The specific plan risks are related to the fact that Retire-ment Indemnity Plans are mandatory by lay and are de-fined by national bargaining agreements. The main risks on these plans are the legislation risk, with effect on withdrawal rate, linked on plans average duration. The “Seniority Awards Plan” pays benefits at any defined anniversary of working life with regard to the service in the company. The awards paid at this occasion are exempt of payroll taxes within the value of one month salary. The main risks on these plans would be the fiscal legislation risk that characterizes the plans that would require additional costs. Other risks are related to the change in the discount rate.
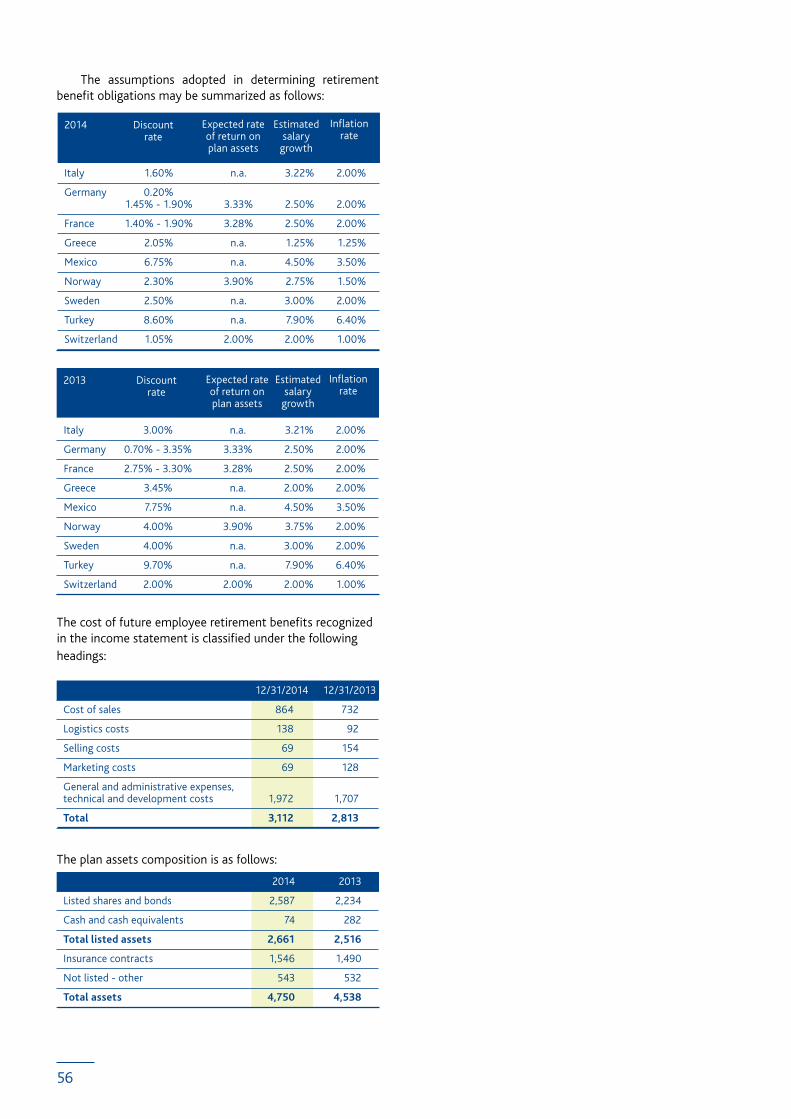
56
The assumptions adopted in determining retirement benefit obligations may be summarized as follows:
Italy 1.60% n.a. 3.22% 2.00%
Germany 0.20% 1.45% - 1.90% 3.33% 2.50% 2.00%
France 1.40% - 1.90% 3.28% 2.50% 2.00%
Greece 2.05% n.a. 1.25% 1.25%
Mexico 6.75% n.a. 4.50% 3.50%
Norway 2.30% 3.90% 2.75% 1.50%
Sweden 2.50% n.a. 3.00% 2.00%
Turkey 8.60% n.a. 7.90% 6.40%
Switzerland 1.05% 2.00% 2.00% 1.00%
Inflation rate
2014 Discount rate
Expected rate of return on plan assets
Estimated salary growth
Inflation rate
2013 Discount rate
Expected rate of return on plan assets
Estimated salary growth
Italy 3.00% n.a. 3.21% 2.00%
Germany 0.70% - 3.35% 3.33% 2.50% 2.00%
France 2.75% - 3.30% 3.28% 2.50% 2.00%
Greece 3.45% n.a. 2.00% 2.00%
Mexico 7.75% n.a. 4.50% 3.50%
Norway 4.00% 3.90% 3.75% 2.00%
Sweden 4.00% n.a. 3.00% 2.00%
Turkey 9.70% n.a. 7.90% 6.40%
Switzerland 2.00% 2.00% 2.00% 1.00%
The cost of future employee retirement benefits recognized in the income statement is classified under the following headings:
12/31/2014 12/31/2013
Cost of sales 864 732
Logistics costs 138 92
Selling costs 69 154
Marketing costs 69 128
General and administrative expenses, technical and development costs 1,972 1,707
Total 3,112 2,813
The plan assets composition is as follows:
2014 2013
Listed shares and bonds 2,587 2,234
Cash and cash equivalents 74 282
Total listed assets 2,661 2,516
Insurance contracts 1,546 1,490
Not listed - other 543 532
Total assets 4,750 4,538
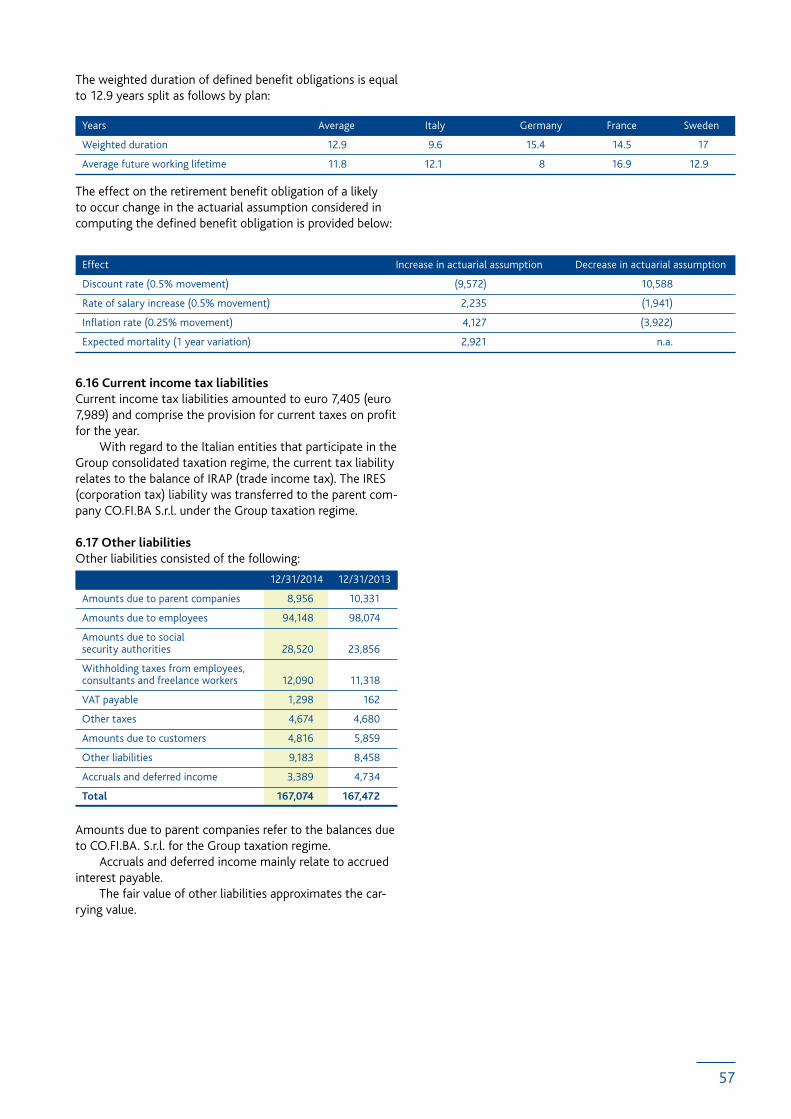
57
The weighted duration of defined benefit obligations is equal to 12.9 years split as follows by plan:
Years Average Italy Germany France Sweden
Weighted duration 12.9 9.6 15.4 14.5 17
Average future working lifetime 11.8 12.1 8 16.9 12.9
The effect on the retirement benefit obligation of a likely to occur change in the actuarial assumption considered in computing the defined benefit obligation is provided below:
Effect Increase in actuarial assumption Decrease in actuarial assumption
Discount rate (0.5% movement) (9,572) 10,588
Rate of salary increase (0.5% movement) 2,235 (1,941)
Inflation rate (0.25% movement) 4,127 (3,922)
Expected mortality (1 year variation) 2,921 n.a.
6.16 Current income tax liabilitiesCurrent income tax liabilities amounted to euro 7,405 (euro 7,989) and comprise the provision for current taxes on profit for the year. With regard to the Italian entities that participate in the Group consolidated taxation regime, the current tax liability relates to the balance of IRAP (trade income tax). The IRES (corporation tax) liability was transferred to the parent com-pany CO.FI.BA S.r.l. under the Group taxation regime.
6.17 Other liabilitiesOther liabilities consisted of the following:
12/31/2014 12/31/2013
Amounts due to parent companies 8,956 10,331
Amounts due to employees 94,148 98,074
Amounts due to social security authorities 28,520 23,856
Withholding taxes from employees, consultants and freelance workers 12,090 11,318
VAT payable 1,298 162
Other taxes 4,674 4,680
Amounts due to customers 4,816 5,859
Other liabilities 9,183 8,458
Accruals and deferred income 3,389 4,734
Total 167,074 167,472
Amounts due to parent companies refer to the balances due to CO.FI.BA. S.r.l. for the Group taxation regime. Accruals and deferred income mainly relate to accrued interest payable. The fair value of other liabilities approximates the car-rying value.

58
6.18 Provisions for other liabilities and charges The current and non-current portions of provisions for other liabilities and charges may be detailed as follows:
Employee risk provision 7,264 3,174 (7,044) 15 3,409
Restructuring provision 38,960 646 (6,652) (13) 32,941
Tax risk provision 224 21 - - 245
Premium dealing risk 742 155 (743) - 154
Returns and unsold goods provision 2,286 - - - 2,286
Revocatory provision 7,287 6,761 (4,770) - 9,278
Litigation provision 348 151 (240) 11 270
Other provisions 26,966 10,488 (12,137) (98) 25,219
Total 84,077 21,396 (31,586) (85) 73,802
Of which:
Due within one year 64,789 54,839
Due after more than one year 19,288 18,963
12/31/201412/31/2013 Charges Decreases/utilization/
reclassification
Foreign exchangeimpact
The employee risk provision and the restructuring provision have been recognized in relation to reorganization programs that include, inter alia, redundancy incentives and other fu-ture employee obligations. The provisions due after more than one year have not been discounted due to the uncertainty of the period of utilization.
6.19 BorrowingsMedium/long-term borrowings may be analyzed as follows:
12/31/2014 12/31/2013
Bonds 309,911 327,283
Bank borrowings and leasing obligations 51,737 113,782
Total 361,648 441,065
The tranche of the US Private Placement whit expiry in December 2015, presenting a nominal value of USD 92 million and carrying amount of euro 75,761, has been classified to financial debt due to bank and other finan-ciers due within one year (Note 6.14). Details of the outstanding non-current bonds are summarized below:
Nominal value
in euro
Nominal value in currency
(thousands)
Nominal coupon in $
Maturity Carrying value Hedging transaction Effective interest rate in euro
Effectiveinterest
rate
Senior notes 2011 $ 75,000 4.14% 15 July 2018 64,284 50,460 2.92% (F) 3.07%
Senior notes 2011 $ 75,000 4.76% 15 July 2021 67,811 50,562 1.59% (V) 1.69%
Senior notes 2011 $ 50,000 4.86% 15 July 2023 46,239 33,718 1.48% (V) 1.56%
Senior notes 2013 $ 150,000 4.43% 13 Dec 2025 131,577 115,050 1.33% (V) 1.37%
Total notes $ 350,000 309,911 249,790
(F) Fixed interest rate
(V)Variable interest rate

59
The interest rate and foreign exchange risks relating to the US Private Placements are hedged by Cross Currency and In-terest Rate Swaps, details of which are provided in note 7. The “Bank borrowings and leasing obligations” includes an amortizing loan with the European Investment Bank (BEI), that has been subscribed in January 2012 for euro 50,000, expiry 2020. At 31 December 2014, the residual balance amounted to euro 28,125 (euro 34,265). The same line item includes the decrease of the portion of medium/long-term leasing obligations mainly relating to the finance leases for the cogeneration plants in Italy, with a balance at year-end of euro 23,689 (euro 24,761). In July 2014 the Group has early closed the credit facili-ties as at 31 December 2013 and subscribed a new irrevoca-ble credit facilities for euro 700,000, expiry 2019 (not used at 31 December 2014 and therefore totally undrawn). A complete analysis of the interest rate risk manage-ment policy is provided in the note 7. The maturity dates of medium/long-term borrowings are illustrated in the table below:
2 to 5 years Over 5 years Total
Bonds 64,284 245,627 309,911
Bank borrowings and leasing obligations 41,536 10,202 50,737
Total medium/long-term bank borrowings 105,819 255,829 361,648
An analysis of bank borrowings, including derivative financial instruments, by maturity date and type of interest rate is as follows:
Borrower Description Interest rate At 12/31/2014 Maturity
Barilla France Bonds (including cross currency and interest rate swaps) fixed-variable 213,159 2015 - 2023
Barilla G.e R. Fratelli Bonds (including cross currency and interest rate swaps) variable 111,364 2025
Barilla Iniziative BEI loan variable 34,265 2020
Barilla G.e R. Fratelli Group Banks variable 51,275 2015 - 2016
Barilla G.e R. Fratelli Group Leasing companies fixed 27,509 2015 - 2028
Total bank borrowings due within one year and after more than one year 437,572*
Borrowings due within one year and after more than one year are denominated in the following currencies:
Currency Carrying value 2014 Carrying value 2013
Euro 100,175 127,101
USD 327,537 329,783
Other 9,860 3,769
Total borrowings due within one year and after more than one year 437,572* 460,653

60
The analysis of borrowings by date of interest rate renego-tiation is as follows:
Period Carrying value 2014 Carrying value 2013
Within 1 year 385,835 344,069
2 to 5 years 41,536 95,872
Over 5 years 10,202 20,712
Total borrowings due within one year and after more than one year 437,572* 460,653
* Total borrowings at 12/31/2014, due within one year and after one year, detailed in the tables, includes negative derivatives and are expressed net of the positive value of derivatives, except for derivatives on commodities (in detail euro 1,354 for commodity hedging transactions qualified as cash flow hedges booked in “Non-current Assets”, euro 795 for contracts relating to commodities hedging transaction that qualified as Cash Flow hedges in “Current Assets”, and euro 1,815 for commodity contracts held for trading in “Current Assets”) as disclosed in paragraph 6.20 “Derivate financial instruments”.
The effective interest rates on borrowings amounted to 2.2% (2.9% in 2013). The comparison between the carrying value and fair value of borrowings is disclosed in note 7. Financial covenants and other contractual obligationsThe bonds issued and loan contracts (the “Loans”) require compliance with a series of contractual obligations and fi-nancial covenants (the “Covenants”). The principal covenants, defined in one or more con-tracts, which are in line with practice in the reference mar-ket for similar transactions, are as follows:
Financial covenants• RatioofnetborrowingsandEBITDA;• RatioofEBITDAandnetinterestonborrowings;• Ratioofborrowingsofoperatingcompaniesplusbor-
rowings secured by real guarantees (except where per-mitted contractually) and total assets in the Financial Statements.
Other restrictions and contractual obligations• Changeofcontrol;• Obligationnottosubordinateborrowingsfordebtop-
erations (pari passu) and/or grant pledges in favor of third parties (except where permitted contractually);
• Maintenanceoffundamentalelementsofbusinessassets (including key plants, trademarks, licenses and intellectual property);
• Rulesandregulationsgoverningutilizationofgainsondisposals, acquisition policies and dividends (where ap-plicable).
Default events (loss of benefits arising from the terms)Principal default events, which are not applied to minor Group companies, are summarized as follows:• Failuretorepayloaninstallments;• Non-compliancewithfinancialcovenantsandother
material restrictions and contractual obligations;• Crossdefault(lossofbenefitsarisingfromthetermsfor
other loans that exceed certain pre-determined limits);• Insolvency,bankruptcyandotheradministrationproce-
dures;• SignificantchangeintheGroup’sbusiness.

61
Where a default event occurs, which is not rectified within contractual time limits, the lenders have the right to request repayment of the sums lent in accordance with the specific loan conditions, together with interest and any other sums due contractually. No defaults arose either during the year or at the year-end.
6.20 Derivative financial instruments
12/31/2014 12/31/2013
Assets Liabilities Assets Liabilities
- Cash flow hedge - interest rate derivatives 12,379 - 6,181 12,809
- Fair value hedge - interest rate derivatives 50,900 - 13,276 7,911
- Held for trading - interest rate derivatives - - - 812
- Cash flow hedge - commodities 1,354 - 2,208 -
Total non-current portion 64,633 - 21,665 21,532
- Cash flow hedge - interest rate derivatives - 2,130 - -
- Cash flow hedge - commodities 795 - - 51
- Held for trading - forward exchange contracts 3,667 347 399 759
- Held for trading - commodities 1,815 - 4,650 -
Total current portion 6,277 2,477 5,049 810
Total derivative financial instruments 70,910 2,477 26,714 22,342
The Group designated the following hedging type:• Currencyandinterestrateswapcontractdesignedas
cash flow hedge to cover fluctuations in interest rates and foreign exchange rates in respect of the US Private Placement signed in 2003, with a residual amount of USD 92 million, with expiry in December 2015. The re-lated negative fair value at 31 December 2014 amount-ed to euro 2,130 and the effect charged to income statement for exchange difference amounted to euro 9,064;
• Currencyandinterestrateswapcontractforatrancheof US Private Placement bond issued in 2011, with a nominal value of USD 75 million that expires on 18 July 2018, which has been designated as a cash flow hedge. The positive fair value at 31 December 2014 amounted to euro 12,379 and the effect charged to income state-ment for exchange difference amounted to euro 7,340;
• Currencyandinterestrateswapcontractsforthetranches of US Private Placement bond issued in 2011, with a nominal value of USD 125 million that expires on 15 July 2021 and 15 July 2023, which have been des-ignated as a fair value hedge. The positive fair value at 31 December 2014 amounted to euro 30,687, that was recognized in the income statement;
• Currencyandinterestrateswapcontractsforthetranches of US Private Placement bond issued in 2013 by Barilla G. e R. Fratelli Società per Azioni, with a nominal value of USD 150 million that expires on 13 December 2025, which have been designated as a fair value hedge. The positive fair value at 31 December 2014 amounted to euro 20,214, that was recognized in the income statement;

62
Derivatives on commodities mainly comprise contracts to hedge electricity costs and price of wheat. Movements in the cash flow hedge reserve were as fol-lows:
2014 2013 Gross reserve Tax effect Gross reserve Tax effect
Opening balance (1,444) 603 1,678 (364)
Change in fair value (17,092) 5,682 (8,781) 3,010
Exchange difference recognized in income statement 16,404 (5,430) 5,659 (2,043)
Closing balance (2,132) 855 (1,444) 603
of which attributable to the Group (1,812) 727 (1,228) 513
The cash flow hedge reserve includes the effective portion of interest rate hedges. The notional value of the Cross Currency and Interest Rate Swap contracts at 31 December 2014 amounts to euro 129,160 in respect of the bonds that expire in 2015 and 2018. The financial risk management policy is disclosed in note 7.
6.21 Other payablesOther payables that amounted to euro 4,253 (euro 4,239) largely represent the liability in respect of social security contributions.
6.22 Equity
Share capitalFully paid share capital at 31 December 2014, as well as at of 31 December 2013, comprised nr. 13,100,000 ordi-nary shares, consisting of nr. 11,790,000 ordinary shares and nr. 1,310,000 B shares. The B shares have the same voting rights as ordinary shares in the ordinary and ex-traordinary shareholders’ meetings but have priority in the profit distribution. It should be noted that the company does not have holdings in its own shares, either directly or indirectly through its subsidiaries or associates. The shareholders’ meeting of 16 June 2014 approved the payment of a dividend of euro 52,511, drawing from the extraordinary reserve, allocated as follows:• to B shares a total of euro 26,043;• to ordinary shares a total dividend of euro 26,468.
These dividends were paid on 9 July 2014.
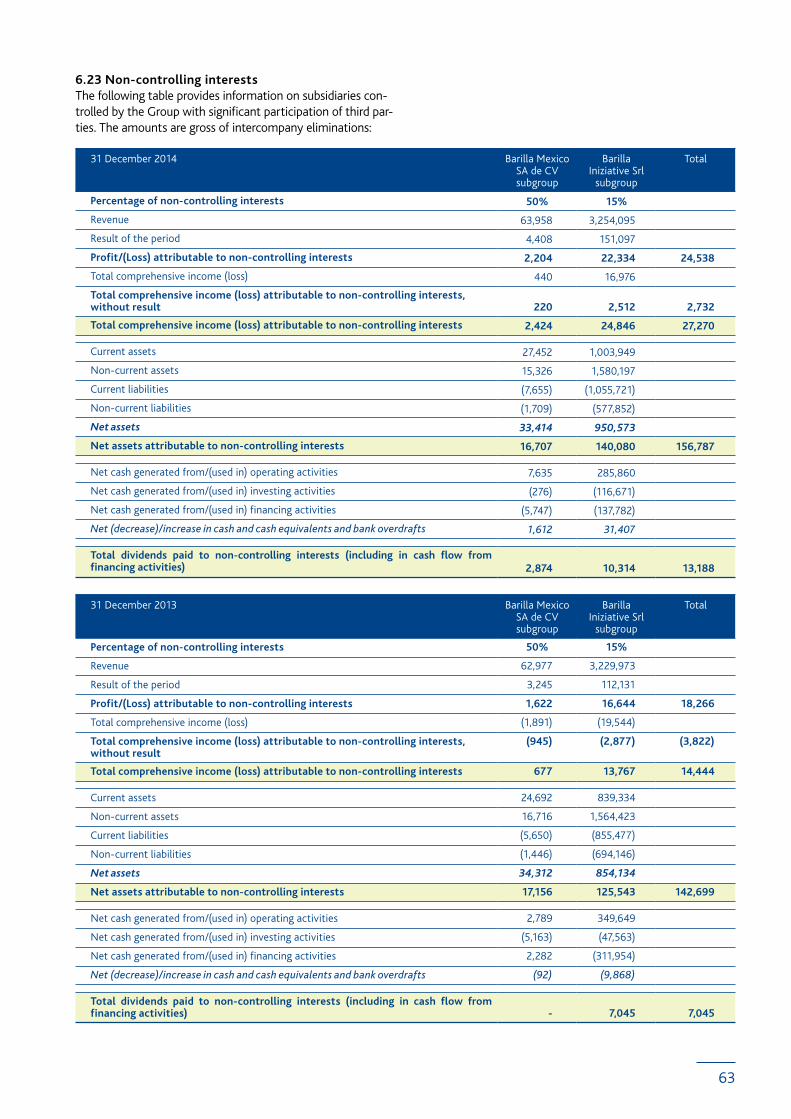
63
6.23 Non-controlling interestsThe following table provides information on subsidiaries con-trolled by the Group with significant participation of third par-ties. The amounts are gross of intercompany eliminations:
31 December 2014 Barilla Mexico SA de CV subgroup
Barilla Iniziative Srl
subgroup
Total
Percentage of non-controlling interests 50% 15%
Revenue 63,958 3,254,095
Result of the period 4,408 151,097
Profit/(Loss) attributable to non-controlling interests 2,204 22,334 24,538
Total comprehensive income (loss) 440 16,976
Total comprehensive income (loss) attributable to non-controlling interests, without result 220 2,512 2,732
Total comprehensive income (loss) attributable to non-controlling interests 2,424 24,846 27,270
Current assets 27,452 1,003,949
Non-current assets 15,326 1,580,197
Current liabilities (7,655) (1,055,721)
Non-current liabilities (1,709) (577,852)
Net assets 33,414 950,573
Net assets attributable to non-controlling interests 16,707 140,080 156,787
Net cash generated from/(used in) operating activities 7,635 285,860
Net cash generated from/(used in) investing activities (276) (116,671)
Net cash generated from/(used in) financing activities (5,747) (137,782)
Net (decrease)/increase in cash and cash equivalents and bank overdrafts 1,612 31,407
Total dividends paid to non-controlling interests (including in cash flow from financing activities) 2,874 10,314 13,188
31 December 2013 Barilla Mexico SA de CV subgroup
Barilla Iniziative Srl
subgroup
Total
Percentage of non-controlling interests 50% 15%
Revenue 62,977 3,229,973
Result of the period 3,245 112,131
Profit/(Loss) attributable to non-controlling interests 1,622 16,644 18,266
Total comprehensive income (loss) (1,891) (19,544)
Total comprehensive income (loss) attributable to non-controlling interests, without result
(945) (2,877) (3,822)
Total comprehensive income (loss) attributable to non-controlling interests 677 13,767 14,444
Current assets 24,692 839,334
Non-current assets 16,716 1,564,423
Current liabilities (5,650) (855,477)
Non-current liabilities (1,446) (694,146)
Net assets 34,312 854,134
Net assets attributable to non-controlling interests 17,156 125,543 142,699
Net cash generated from/(used in) operating activities 2,789 349,649
Net cash generated from/(used in) investing activities (5,163) (47,563)
Net cash generated from/(used in) financing activities 2,282 (311,954)
Net (decrease)/increase in cash and cash equivalents and bank overdrafts (92) (9,868)
Total dividends paid to non-controlling interests (including in cash flow from financing activities) - 7,045 7,045

64
Commitments and guaranteesContractual commitments at the year-end that are not recognized in the Financial Statements amounted to euro 705,641 (euro 581,880) and comprise:• commitmentsforfinishedgoodspurchases,wheat,oth-
er raw materials and packaging for euro 609,210 (euro 511,523);
• commitmentsforcapitalexpenditureforeuro45,431(euro 2,357);
• commitmentsforenergypurchasesforeuro51,000(euro 68,000).
Third party guaranteesComprise guarantees provided by banks and/or insurance companies to government agencies in connection with VAT refunds on behalf of the subsidiary Barilla G. e R. Fr-atelli Società per Azioni, for euro 232,216 (euro 268,617).
Contingent liabilitiesThe Group has contingent liabilities in respect of legal and tax claims arising in the normal course of Group business. It is not anticipated that any material liabilities will arise from contingent liabilities other than those already provided in the Financial Statements.
Consolidated income statement
6.24 RevenueRevenue may be analyzed as follows:
2014 2013
Total sales of finished goods 3,193,322 3,149,750
Sales of by-products 42,746 58,240
Sales of packaging and other materials 18,027 21,983
Total 3,254,095 3,229,973

65
6.25 Detail of costs by natureThe composition of costs by nature in relation to cost of sales, logistics expenses, selling expenses, marketing ex-penses, technical and development costs and general and administrative expenses, is illustrated in the table below:
2014 2013
Purchase of raw materials, semi-finished goods, finished goods, materials and change in inventories 1,328,969 1,336,231
Purchase of other materials 24,671 20,039
Employee costs 469,337 467,704
Depreciation of property, plant and equipment and amortization of intangible assets 134,094 139,398
Goodwill impairment loss - 28,354
Transport and warehousing services 291,723 275,296
Promotional and advertising services 275,426 276,841
Maintenance costs 32,679 29,352
Services 65,030 60,318
Consultancy costs 26,974 35,522
Third party manufacturing costs 76,542 59,065
Sales commissions 51,314 51,768
Utilities 77,396 88,212
Travel and expenses 19,106 19,017
Property leases, rentals and operating leases 19,884 16,642
Directors’ and statutory auditors’ emoluments 4,925 4,971
Insurances 7,901 7,157
Other taxes 9,948 9,281
Employee training costs 3,904 3,539
Postage and telephone expenses 7,233 7,513
Customs duties 5,001 4,776
Factoring services 1,633 1,758
Others 10,989 11,085
Total 2,944,669 2,953,839
Depreciation on property, plant and equipment and am-ortization of intangible assets are classified under the fol-lowing income statement headings:
2014 2013
Cost of sales 103,958 107,357
Logistics costs 5,806 7,002
Selling costs 344 489
Marketing costs 75 54
General and administrative expenses, technical and development costs 23,911 24,496
Total 134,094 139,938

66
6.26 Other income and expensesOther income and expenses comprised:
2014 2013
Income and expenses from continuing operations:
- Gains/(losses) - net on disposals of property, plant and equipment (2,822) (2,719)
- Insurance repayments 1,239 1,323
- Net charges to/utilization of provisions (3,792) (27,857)
- Charge to allowance for doubtful accounts (4,692) (5,742)
- Property and other taxes (6,190) (6,333)
- Donations on behalf of third parties and of employees (5,590) (2,314)
- Membership fees (1,628) (2,043)
- Employee incentives (1,834) (4,318)
- Income/(expenses) relating to other accounting periods 5,762 11,612
- Bank commission and insurance (1,905) (940)
- Net services rendered and other minor amounts 4,714 4,918
Total income/(expenses) from continuing operations (16,737) (34,411)
Non recurring income /(expense), net (2,782) (5,030)
Total income and expenses – non recurring (2,782) (5,030)
Total other income and expenses (19,519) (39,441)
6.27 Finance costs - net Finance costs - net consisted of the following:
2014 2013
Net costs relating to the net financial position:
Interest income on bank accounts 1,161 1,052
Interest expense on short-term bank borrowings (1,067) (1,389)
Interest expense on medium/long -term bank borrowings (6,840) (2,879)
Interest expense on bonds (4,644) (12,011)
Interest expense on finance leases (1,606) (1,812)
Commissions on draw down of irrevocable credit facilities - (1,309)
Total net finance costs relating to the net financial position (12,996) (18,348)
Other finance income/(costs):
Net realized exchange gains/(losses) – commercial and financial 14,568 (7,152)
Net unrealized exchange gains/(losses) – commercial and financial (32,664) (4,900)
Commissions on undrawn amounts (2,670) (2,384)
Interest costs on pension liabilities (4,222) (4,187)
Other income and costs 330 1,062
Total other finance income/(costs) (24,657) (17,561)
Total finance costs - net (37,653) (35,909)
Interest expense on medium/long-term bank borrowings include extraordinary costs for the revolving credit facilities early termination and for the related hedging contracts clo-sure for euro 4,100. Interest expense on bonds include the positive change in fair value of the related hedging instruments for euro 2,857. In 2013, commissions on draw down of irrevocable credit facilities were attributable to the line Committed
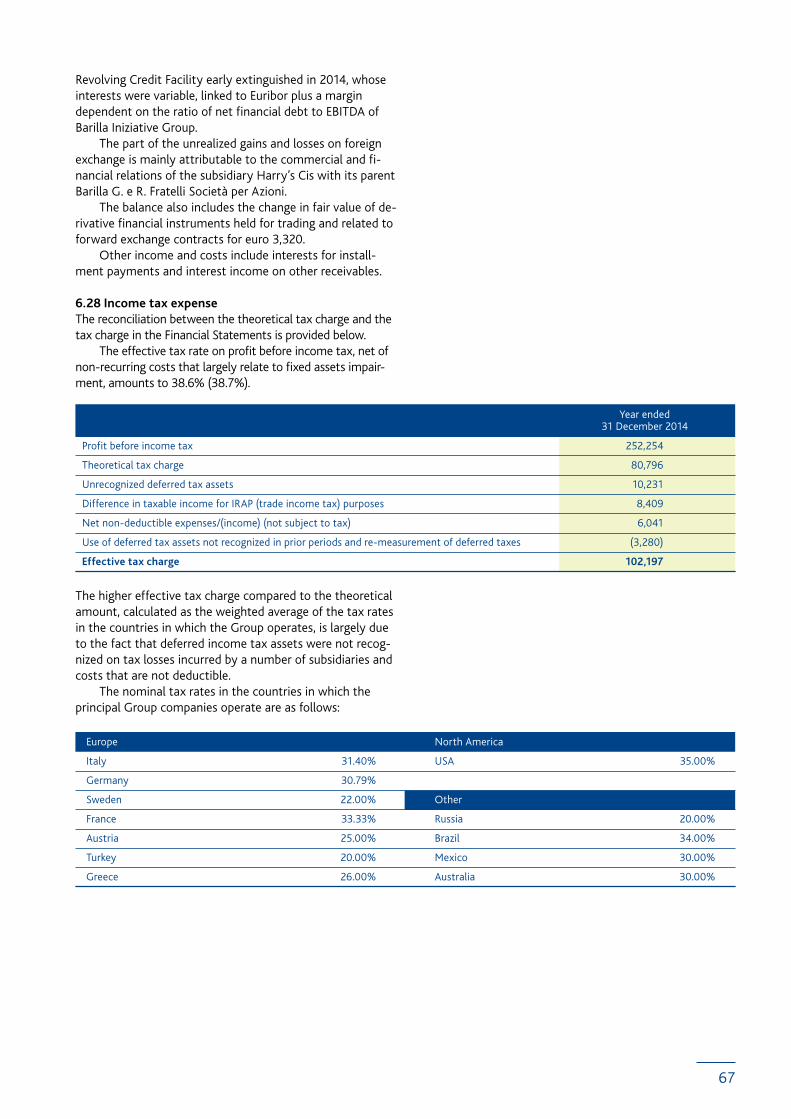
67
Revolving Credit Facility early extinguished in 2014, whose interests were variable, linked to Euribor plus a margin dependent on the ratio of net financial debt to EBITDA of Barilla Iniziative Group. The part of the unrealized gains and losses on foreign exchange is mainly attributable to the commercial and fi-nancial relations of the subsidiary Harry’s Cis with its parent Barilla G. e R. Fratelli Società per Azioni. The balance also includes the change in fair value of de-rivative financial instruments held for trading and related to forward exchange contracts for euro 3,320. Other income and costs include interests for install-ment payments and interest income on other receivables.
6.28 Income tax expenseThe reconciliation between the theoretical tax charge and the tax charge in the Financial Statements is provided below. The effective tax rate on profit before income tax, net of non-recurring costs that largely relate to fixed assets impair-ment, amounts to 38.6% (38.7%).
Profit before income tax 252,254
Theoretical tax charge 80,796
Unrecognized deferred tax assets 10,231
Difference in taxable income for IRAP (trade income tax) purposes 8,409
Net non-deductible expenses/(income) (not subject to tax) 6,041
Use of deferred tax assets not recognized in prior periods and re-measurement of deferred taxes (3,280)
Effective tax charge 102,197
Year ended 31 December 2014
The higher effective tax charge compared to the theoretical amount, calculated as the weighted average of the tax rates in the countries in which the Group operates, is largely due to the fact that deferred income tax assets were not recog-nized on tax losses incurred by a number of subsidiaries and costs that are not deductible. The nominal tax rates in the countries in which the principal Group companies operate are as follows:
Europe North America
Italy 31.40% USA 35.00%
Germany 30.79%
Sweden 22.00% Other
France 33.33% Russia 20.00%
Austria 25.00% Brazil 34.00%
Turkey 20.00% Mexico 30.00%
Greece 26.00% Australia 30.00%

68
Tax losses carried forward and unrecognized deferred in-come tax assets are summarized as follows:
Company Tax losses Period for which losses may be carried forward
Rate % Recognized deferred income
tax assets
Unrecognized deferred income
taxassets
Barilla Gida A.S. 305 5 years 20% 61 -
Academia Barilla S.p.A. - Socio Unico 13,540 Unlimited 27.5% - 3,723
Barilla America Inc. 21,588 20 years various 1,025 -
Barilla Do Brazil LTDA 19,356 Unlimited 34% 6,581 -
Barilla Norge 163 Unlimited 27% - 44
Harry’s Cis LLC 36,993 10 years 20% - 7,399
Barilla Danmark A/S 1,576 Unlimited 23% - 386
Barilla Canada Inc. 9,772 20 years 31% - 3,029
Barilla Belgium S.A. 3,985 Unlimited 33.99% - 1,355
Barilla Poland Sp. Z.o.o. 2,834 5 years 19% - 538
Barilla Singapore 5,425 Unlimited 17% 409 513
Barilla Shanghai 1,950 5 years 25% - 488
Finba Bakery Holding GmbH 99,445 Unlimited various - 15,737
Total 216,932 8,076 33,211
7. Financial instruments and net financial position
Risk management policies
The Group’s activities expose it to a variety of financial risks, among which: market risks (including foreign exchange risk, interest rate risk and price risk), credit risk and liquidity risk. As part of its risk management policy and in order to minimize the impact of these market risks, the Group uses hedging instruments (no speculative instruments are used or held). The Group manages all hedging transactions centrally. Guidelines have been issued that govern risk management and procedures have been introduced to control all transac-tions relating to derivative instruments.
(a) Market risk
(i) Interest rate riskThe exposure to market risk arising from changes in rates is principally linked to changes in euro interest rates, which represents the currency in which almost all Group borrow-ings are denominated. Group policy is to maintain a balance between the fixed and variable rate exposure. At 31 December 2014 approximately 36% (47%) of gross indebtedness was at fixed rates, either directly or through specific derivative financial instruments. The Group analyses its interest rate exposure on a dy-namic basis. In particular, the Group simulates its financing requirements and estimated cash flows applying varying assumptions based on economic expectations, existing posi-tions and potential renewals, alternative financing, hedging policy and potential refinancing.

69
Sensitivity analysisThe potential post-tax effects on the income statement and total equity of a +0.5/–0.25 percentage point change in in-terest rates, linked to euro, with all other conditions remain-ing unchanged, applied to the Group’s variable rate borrow-ings at 31 December would have amounted to:
Income/charge - (cost/increase) 2014 2013
+0.5% –0.25% +0.5% –0.25%
Effect on Net Result (98) 52 (293) 148
Effect on Other Comprehensive Income 93 (47) 414 (211)
The tax effects were calculated applying the Group’s effec-tive tax rates at 31 December 2014 and 2013.
(ii) Foreign exchange riskAs the Group operates an international business, it is ex-posed to the risk that exchange rate fluctuations have on its assets, liabilities and cash flows generated outside the euro area. In general the Group is not heavily exposed to foreign exchange risk: the risk that arises in the normal course of business is managed through a policy of com-pensating assets and liabilities, using where necessary derivative contracts (principally forward foreign exchange contracts).
Sensitivity analysisThe analyses included receivables and payables denomi-nated in foreign currencies and derivative financial instru-ments. At 31 December 2014 and 2013 the potential effects on the net result and on other comprehensive income of a strengthening/devaluation of the euro against the other foreign currencies, mainly USD, with all other conditions re-maining equal, would have amounted to:
Income/charge - (cost/increase) 2014 2013
+10% –10% +10% –10%
Effect on Net Result 1,030 (792) 8,378 (8,378)
Effect on Other Comprehensive Income 102 (102) 133 (133)
(iii) Price riskThe Group manages the mitigation of risks relating to trends in the prices of commodities used in the produc-tion process, mainly through medium-term supplier pur-chasing contracts, using also to a limited extent derivative contracts on wheat. Hedging contracts are entered into in respect of the Swedish electrical energy market using the “Nord Pool” mechanism.

70
Sensitivity analysisThe analysis considers derivatives on commodities, mainly related to derivative contracts on wheat and energy. At 31 December 2014 and 2013, the potential post-tax effects on the income statement and total equity of a strengthening/devaluation of commodities prices, with all other conditions remaining equal, would have amounted to:
Income/charge - (cost/increase) 2014 2013
+5% –5% +5% –5%
Effect on Net Result 1,129 (791) 1,546 (1,279)
Effect on Other Comprehensive Income 356 (356) 298 (311)
(b) Credit risk
Credit risk represents the risk that one of the parties to a transaction does not fulfill the financial obligations under-taken. This risk relates to outstanding trade receivables, se-curities and cash and cash equivalents, and operations with banks and other financial institutions comprising: deposits and other transactions, derivative instruments and the abil-ity to meet the covenants on the irrevocable credit facilities. The Group’s retail counterparties are concentrated in the modern trade channel. The Group periodically assesses the credit quality of its counterparties and utilizes credit limits that are regularly monitored. Insurance policies have been entered into in respect of a portion of commercial receivables in order to cover losses arising from non-recovery. With regard to credit risk on bank deposits and the invest-ments in bonds, the Group has established exposure limits for each bank (that evolves continuously depending on the rating, the level of Credit Default Swaps and market information).
(c) Liquidity risk
The Group’s policy is to render liquidity risk reasonably remote. This is achieved through the constant availability of funding through undrawn irrevocable credit facilities, which allows rea-sonably foreseeable, future financial commitments to be met, also taking into account the Group’s significant cash flows. At 31 December 2014, the Group held undrawn credit fa-cilities maturing in 2019 of approximately euro 700,000 in ad-dition to cash and cash equivalents in excess of euro 183,728. An analysis of financial liabilities by maturity is provid-ed in the table below. The maturity dates were based on the period between the year-end date and the contractual ma-

71
turity of the obligations. The amounts in the table represent the undiscounted cash flows including interest estimated applying year-end exchange rates:
Less than 1 year 1 to 5 years Over 5 years Total
At 31 December 2014
Borrowings with banks, other lenders and finance leases 153,278 120,104 227,226 500,608
Derivative financial instruments through profit or loss 3,320 - - 3,320
Trade and other payables 843,225 4,253 - 847,478
Total 999,823 124,357 227,226 1,351,406
Less than 1 year 1 to 5 years Over 5 years Total
At 31 December 2013
Borrowings with banks, other lenders and finance leases 34,629 274,738 268,622 577,989
Derivative financial instruments through profit or loss 360 - - 360
Trade and other payables 763,029 4,239 - 767,268
Total 798,018 278,977 268,622 1,345,617
Categories of financial instruments
In order to provide full financial risk disclosures, the rec-onciliation between the categories of financial assets and liabilities as reported in the Group financial position and the categories of financial assets and liabilities identified in ac-cordance with IFRS 7, as well as the information of fair value evaluation level, is presented below, provided for by IFRS 13:
31 December 2014
Financial assets at fair value through profit or
loss
Receivables and
financial receivables
Available-for-sale financial assets
Financial liabilities at fair value through
profit or loss
Financial liabilities at amortized
costassets liabilities
Fair value Fair value evaluation
Level
Available-for-sale financial assets not quoted on an active market - - 1,551 - - - -
Not available
Derivatives (assets) - - - - - 3,964 - 3,964 Level 1
Derivatives (assets) 3,667 - - - - 63,279 - 66,946 Level 2
Trade and other receivables - 537,896 - - - - - 537,896
Cash and cash equivalents and financial assets - 183,728 - - - - - 183,728
Borrowings with banks and other lenders - - - - 502,041 - - 503,864
Trade payables - - - - 668,746 - - 668,746
Other payables - - - - 178,732 - - 178,732
Derivatives - - - 347 - - 2,130 2,477 Level 2
Total 3,667 721,624 1,551 347 1,349,519 67,243 2,130 -
Hedging derivatives

72
31 December 2013
Financial assets at fair value through profit or
loss
Receivables and
financial receivables
Available-for-sale financial assets
Financial liabilities at fair value through profit or
loss
Financial liabilities
at amortized
cost
assets liabilities
Fair value Fair value evaluation
Level
Available-for-sale financial assets not quoted on an active market - - 1,251 - - - -
Not available
Derivatives (assets) - - - - - 2,208 - 2,208 Level 1
Derivatives (assets) 399 - - - - 24,107 - 24,506 Level 2
Trade and other receivables - 488,755 - - - - - 488,755
Cash and cash equivalents and financial assets - 112,011 - - - - - 112,011
Borrowings with banks and other lenders - - - - 458,218 - - 466,055
Trade payables - - - - 587,568 - - 587,568
Other payables - - - - 179,700 - - 179,700
Derivatives (liabilities) - - - - - - 51 51 Level 1
Derivatives (liabilities) - - - 1,571 - - 20,720 22,291 Level 2
Total 399 600,766 1,251 1,571 1,225,488 26,315 20,771
During 2014, there were no transfer of financial assets or li-abilities from level 1 to level 2 of the fair value hierarchy. For the valuation techniques of the financial instru-ments in the level 2, refer to chapter “Accounting and valua-tion policies”, previously explained. In 2014, there were no financial asset/liability for which the valuation method has changed (from fair value to amor-tized cost or vice versa). The market value of borrowings with banks and other financial institutions was determined as follows:• withregardtothevariableratesyndicatedloan,con-
sidering the same credit rating, the nominal repayment value was used, as the adjustment of future lending rates in line with Euribor determined by the markets ensures the substantial alignment in values;
• withregardtotheUSDfixedrateUSPrivatePlace-ment, the net present value of future coupon and capi-tal flows, calculated using the current market IRS rate increased by the spread between coupons and the IRS rate at the time of issuance, with all amounts converted to euro at the current exchange rate;
• forallotherborrowings,giventhelowvalueandthefact that these largely relate to short-term and/or vari-able rate instruments, the carrying value is considered to correspond to their fair value.
With regard to equity investments in unquoted companies included in the category available-for-sale financial assets, the fair value cannot be reasonably determined. These in-vestments are recognized at cost, net of any potential im-pairment. Further details are provided in note 6.12.
Hedging derivatives
Hedging derivatives

73
Net financial position (alternative indicator of perform-ance not required by accounting standards)The net financial position of the Group at the year-end rep-resents the sum of financial receivables and payables that originated respectively from borrowings and deposits, cash, bank, and postal accounts, securities classified as financial assets at fair value through profit or loss. The net indebted-ness of the Group at 31 December 2014 amounted to euro 249,880, compared to euro 346,835 in 2013, which included the foreign exchange and interest-rate derivatives mark-to-market evaluation. Derivatives entered into to hedge the risk relating to commodities used in the production process, included in the above total, have a positive mark-to-market of euro 3,965 (2013 - euro 6,807). The Group’s net financial position may be summarized as follows:
12/31/2014 12/31/2013
Cash and cash equivalents 183,728 112,011
Current financial assets at fair value 6,277 5,049
Banks and other borrowings (including derivatives) (142,870) (22,153)
Short-term net financial position 47,135 94,907
Non-current financial assets at fair value 64,633 21,665
Borrowings (including derivative) (361,648) (463,407)
Medium/long-term net financial position (297,015) (441,742)
Total net financial position (249,880) (346,835)
Capital risk managementThe Group’s objectives with regard to capital risk management are to safeguard the ability to continue as a going concern in order to provide returns for shareholders and benefits for other stakeholders. The Group also aims to maintain an optimal capi-tal structure in order to reduce the cost of debt. The Group monitors capital on the basis of the ratio be-tween the net financial position and EBITDA (an alternative performance indicator). This ratio is an indicator of the ability to repay borrowings and is normalized in order to exclude non-recurring items. Analysis of operating profit from continuing operations (EBIT-EBITDA):
2014 2013*
Operating profit 289,907 236,693
Goodwill and intangible fixed assets impairment losses - 28,354
Expenses and losses on discontinued operations 2,782 5,030
Operating profit from continuing operations (EBIT) 292,689 270,077
Amortization and impairment losses of intangible fixed assets (continuing operations) 18,047 19,103
Depreciation and impairment losses of tangible fixed assets (continuing operations) 116,047 120,295
Operating profit from continuing operations before depreciation, amortization and impairment losses on fixed assets (EBITDA) 426,783 409,475
*Discontinued operations not included.
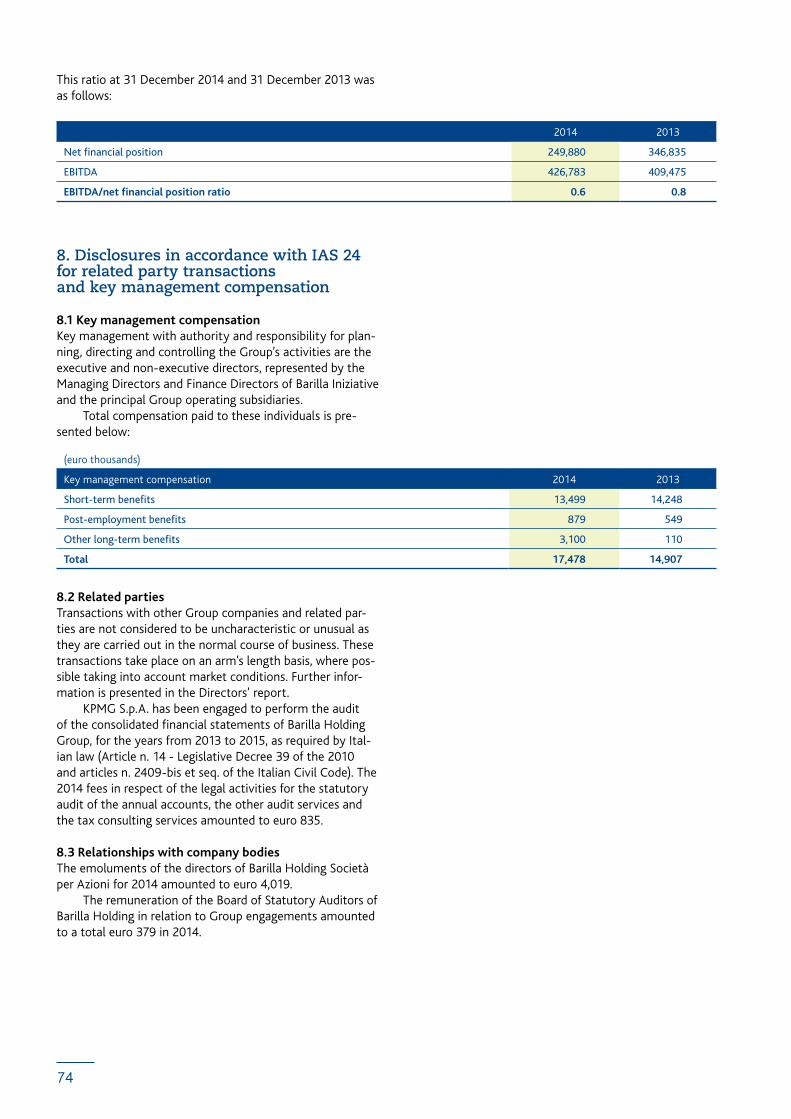
74
This ratio at 31 December 2014 and 31 December 2013 was as follows:
2014 2013
Net financial position 249,880 346,835
EBITDA 426,783 409,475
EBITDA/net financial position ratio 0.6 0.8
8. Disclosures in accordance with IAS 24 for related party transactions and key management compensation
8.1 Key management compensationKey management with authority and responsibility for plan-ning, directing and controlling the Group’s activities are the executive and non-executive directors, represented by the Managing Directors and Finance Directors of Barilla Iniziative and the principal Group operating subsidiaries. Total compensation paid to these individuals is pre-sented below:
(euro thousands)
Key management compensation 2014 2013
Short-term benefits 13,499 14,248
Post-employment benefits 879 549
Other long-term benefits 3,100 110
Total 17,478 14,907
8.2 Related partiesTransactions with other Group companies and related par-ties are not considered to be uncharacteristic or unusual as they are carried out in the normal course of business. These transactions take place on an arm’s length basis, where pos-sible taking into account market conditions. Further infor-mation is presented in the Directors’ report. KPMG S.p.A. has been engaged to perform the audit of the consolidated financial statements of Barilla Holding Group, for the years from 2013 to 2015, as required by Ital-ian law (Article n. 14 - Legislative Decree 39 of the 2010 and articles n. 2409-bis et seq. of the Italian Civil Code). The 2014 fees in respect of the legal activities for the statutory audit of the annual accounts, the other audit services and the tax consulting services amounted to euro 835.
8.3 Relationships with company bodiesThe emoluments of the directors of Barilla Holding Società per Azioni for 2014 amounted to euro 4,019. The remuneration of the Board of Statutory Auditors of Barilla Holding in relation to Group engagements amounted to a total euro 379 in 2014.

75
Mikaela Shiffrin, Olympic gold medalist and Barilla endorser.

76
Barilla Iniziative S.r.l. EURO 101,000,000 85.00 85.000Via Mantova, 166 - Parma (Italy) Barilla Holding Società per AzioniFinancial company Italian Kitchen S.r.l. - Socio Unico EURO 100,000 85.00 100.000Via Mantova, 166 - Parma (Italy) Barilla Iniziative S.r.l.Financial company
Italian Kitchen USA Inc. USD 10,000 85.00 100.0002711 Centerville Road, Suite 400, Wilmington Italian Kitchen S.r.l. - Socio UnicoCounty of New Castle - Delaware (USA)Restaurants coordination
IKRG - Midtown LLC USD 10,000 85.00 100.000c/o Tarter Krinsky & Drogin LLP Italian Kitchen USA Inc. 1350 Broadway, New York - NY (USA) Restaurants coordination
Finba Bakery Holding GmbH EURO 25,000 85.00 100.000Fritz-Vomfelde Strasse 14-20 - Düsseldorf (Germany) Barilla Iniziative S.r.l.Financial company
Barilla G. e R. Fratelli Società per Azioni - Socio Unico EURO 180,639,990 85.00 100.000Via Mantova, 166 - Parma (Italy) Barilla iniziative S.r.l.Production and trade
Barilla Servizi Finanziari S.p.A. - Socio Unico EURO 30,000,000 85.00 100.000Via Mantova, 166 - Parma (Italy) Barilla G. e R. FratelliLeasing Società per Azioni - Socio Unico
Academia Barilla S.p.A. - Socio Unico EURO 1,000,000 85.00 100.000Via Mantova, 166 - Parma (Italy) Barilla G. e R. FratelliTrade Società per Azioni - Socio Unico
F.I.R.S.T. Retailing S.p.A. - Socio Unico EURO 5,000,000 85.00 100.000Via Mantova, 166 - Parma (Italy) Barilla G. e R. FratelliTrade Società per Azioni - Socio Unico
F.I.R.S.T. Commerciale S.r.l. - Socio Unico EURO 10,000 85.00 100.000Via Mantova, 166 - Parma (Italy) F.I.R.S.T. Retailing S.p.A. - Socio UnicoTrade
Barilla Hellas S.A. EURO 7,611,840 85.00 100.00026 Pappou & Akragantos Str. - Athens (Greece) Barilla G. e R. FratelliProduction and trade Società per Azioni - Socio Unico
Barilla America Inc. USD 1,000 85.00 100.0001200 Lakeside Drive, Barilla G. e R. FratelliBannockburn - Illinois (USA) Società per Azioni - Socio UnicoProduction and trade
Barilla Do Brasil LTDA BRL 26,227,667 85.00 99.990A.V. Pinzon, 144 - 7° Andar CJ 71/72 Barilla G. e R. FratelliVila Olimpia - São Paulo (Brazil) Società per Azioni - Socio UnicoTrade 0.010 Barilla Servizi Finanziari S.p.A. - Socio Unico
BRJ KK JPY 10,000,000 85.00 100.000Minami Aoyama, Minato-ku - Tokyo (Japan) Barilla G. e R. FratelliTrade Società per Azioni - Socio Unico
Annexes Annex 1 - List of consolidated companies
Through %Company, headquarter and activity
Currency % Group ownership
Share Capital(nominal values)

77
Barilla Austria GmbH EURO 436,000 85.00 100.000Grabenweg 64 - Innsbruck (Austria) Barilla G. e R. FratelliTrade Società per Azioni - Socio Unico
Barilla Mexico S.A. de C.V. MXN 227,348,096 42.50 50.000Calzada San Bartolo Naucalpan Barilla G. e R. Fratelli 360 Col. Argentina Ponente Deleg. M. Società per Azioni - Socio UnicoHildalgo - Mexico City (Mexico) Production and trade
Serpasta Pastificio S.A. de C.V. MXN 2,050,000 42.50 2.000Calzada San Bartolo Naucalpan Barilla G. e R. Fratelli360 Col. Argentina Ponente Deleg. M. Società per Azioni - Socio UnicoHildalgo - Mexico City (Mexico) 96.000Production and trade Barilla Mexico S.A. de C.V.
Barilla Singapore PTE. Ltd. SGD 1,000,000 85.00 100.00027 Kreta Ayer Road - Singapore (Singapore) Barilla G. e R. FratelliTrade Società per Azioni - Socio Unico
Barilla (SHANGHAI) Trading Company Limited USD 4,120,000 85.00 100.000 Room 4703-35. 300 Huaihai Zhong Road. Barilla Singapore PTE. Ltd.Huangpu District - Shanghai (China) Trade
Barilla Middle East FZE AED 1,000,000 85.00 100.000Office No. LB191803, Jebel Ali Barilla Singapore PTE. Ltd.Dubai (United Arab Emirates)Trade
Barilla España S.L. EURO 3,100 85.00 100.000Zurbano, 43 - Madrid (Spain) Barilla G. e R. FratelliTrade Società per Azioni - Socio Unico
Barilla Canada Inc. USD 10,000 85.00 100.00026, Yonge Street - Toronto (Canada) Barilla G. e R. FratelliTrade Società per Azioni - Socio Unico
Barilla Gida A.S. TRY 2,940,000 84.996 99.995Kosifler Plaza Serin Sk. No. 9 Barilla G. e R. FratelliA Blok Kat 6 Içerenköy Società per Azioni - Socio UnicoIstanbul (Turkey) Production and trade
Barilla Switzerland A.G. CHF 1,000,000 85.00 100.000Zugerstrasse 76B - Baar (Switzerland) Barilla Netherlands B.V.Trade
Barilla Sverige AB SEK 5,000,000 85.00 100.000PO BOX 6722, 113 85 - Stockholm (Sweden) Barilla G. e R. FratelliProduction and trade Società per Azioni - Socio Unico
Barilla Norge AS NOK 1,950,000 85.00 100.000 Sandvikavegen 55 - 2312 Ottestad Barilla Sverige ABN - 2301 Hamar (Norway) Trade
Barilla Danmark A/S DKK 500,000 85.00 100.000c/o Mazanti-Andersen, Korsø Jensen & Partenere Barilla Sverige ABAmeliegade 10 - Copenhagen (Denmark) Trade
Barilla Poland Sp. Z.o.o. PLN 29,050,004 85.00 100.000Ul. Poleczki, 23 - Warsaw (Poland) Barilla Sverige ABTrade
Through %Company, headquarter and activity
Currency % Group ownership
Share Capital(nominal values)

78
Barilla Deutschland GmbH EURO 51,100 85.00 100.000Gustav-Heinemann-Ufer 72c Barilla Sverige ABCologne (Germany)Production and trade
Barilla Australia PTY Ltd AUD 26,050,000 85.00 100.000George Street - NSW Sydney (Australia) Barilla G. e R. FratelliTrade Società per Azioni - Socio Unico
Barilla Netherlands B.V. EURO 18,000 85.00 100.000Lange Dreef, 13i - 4131 NJ Vianen (Netherlands) Barilla G. e R. FratelliTrade Società per Azioni - Socio Unico
Barilla Adriatik D.o.o. EURO 50,000 85.00 100.000Trzaska cesta, 315 - Ljubljana (Slovenia) Barilla G. e R. FratelliTrade Società per Azioni - Socio Unico
Barilla Hrvatska D.o.o. HRK 75,200 85.00 100.000Radnicka cesta, 39 - Zagreb (Croatia) Barilla G. e R. FratelliTrade Società per Azioni - Socio Unico
Barilla America N.Y. Inc. USD 1,000 85.00 100.000Livington County - New York (USA) Barilla G. e R. FratelliProduction and trade Società per Azioni - Socio Unico
Harry’s CIS LLC RUB 500,000,000 85.00 100.000Butyrski Tupik 1 Solnechnogorsk Barilla G. e R. FratelliMoscow (Russia) Società per Azioni - Socio UnicoProduction and trade
ZAO KONDI RUB 10,198,050 85.00 100.000132 Mendelleva - Ufa (Russia) Harry’s CISProduction
Barilla France SAS EURO 126,683,296 85.00 100.000103 Rue de Grenelle - Paris (France) Barilla G. e R. FratelliProduction and trade Società per Azioni - Socio Unico
Harry’s Restauration SAS EURO 153,000 85.00 100.00072 Route de Chauny - Gauchy (France) Barilla France SASProduction and trade
Barilla Belgium S.A. EURO 693,882 85.00 71.2009 Boulevard de France Barilla Netherlands B.V.Braine-L’alleud (Belgium) 28.800Trade Barilla France SAS
Through %Company, headquarter and activity
Currency % Group ownership
Share Capital(nominal values)
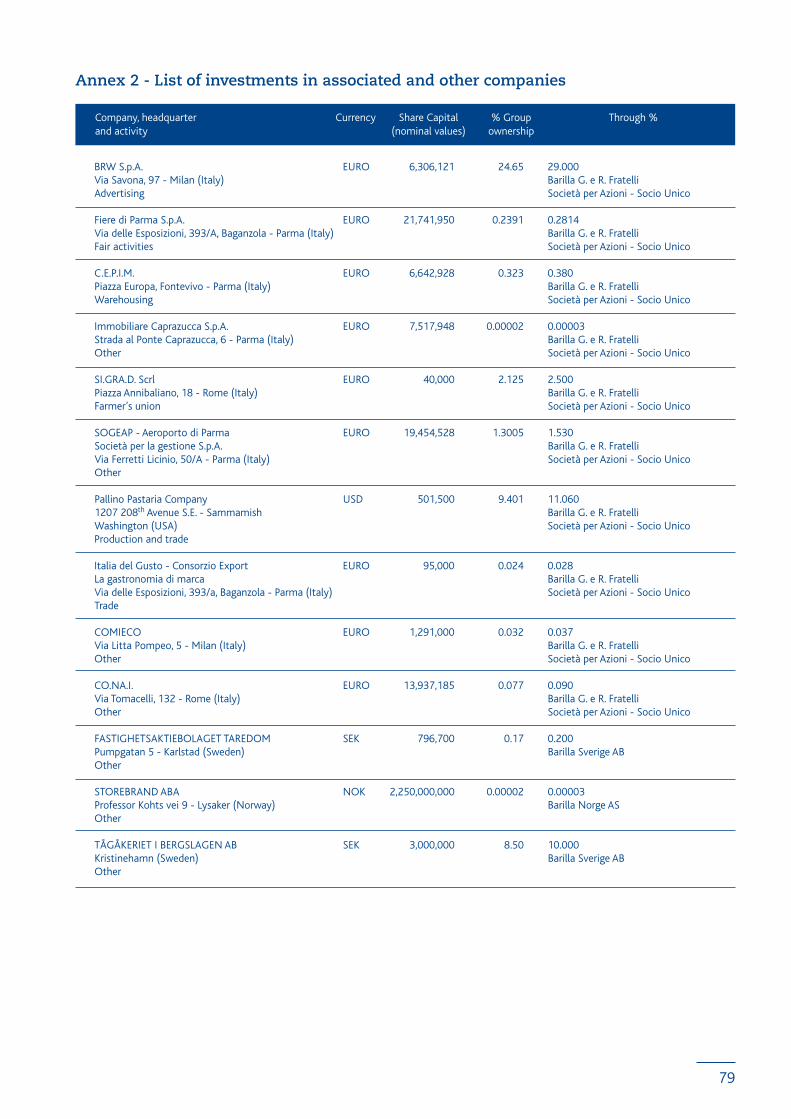
79
Through %Company, headquarter and activity
Currency % Group ownership
Share Capital(nominal values)
BRW S.p.A. EURO 6,306,121 24.65 29.000Via Savona, 97 - Milan (Italy) Barilla G. e R. FratelliAdvertising Società per Azioni - Socio Unico
Fiere di Parma S.p.A. EURO 21,741,950 0.2391 0.2814Via delle Esposizioni, 393/A, Baganzola - Parma (Italy) Barilla G. e R. FratelliFair activities Società per Azioni - Socio Unico
C.E.P.I.M. EURO 6,642,928 0.323 0.380Piazza Europa, Fontevivo - Parma (Italy) Barilla G. e R. FratelliWarehousing Società per Azioni - Socio Unico
Immobiliare Caprazucca S.p.A. EURO 7,517,948 0.00002 0.00003Strada al Ponte Caprazucca, 6 - Parma (Italy) Barilla G. e R. FratelliOther Società per Azioni - Socio Unico
SI.GRA.D. Scrl EURO 40,000 2.125 2.500Piazza Annibaliano, 18 - Rome (Italy) Barilla G. e R. FratelliFarmer’s union Società per Azioni - Socio Unico
SOGEAP - Aeroporto di Parma EURO 19,454,528 1.3005 1.530Società per la gestione S.p.A. Barilla G. e R. FratelliVia Ferretti Licinio, 50/A - Parma (Italy) Società per Azioni - Socio UnicoOther
Pallino Pastaria Company USD 501,500 9.401 11.0601207 208th Avenue S.E. - Sammamish Barilla G. e R. FratelliWashington (USA) Società per Azioni - Socio UnicoProduction and trade
Italia del Gusto - Consorzio Export EURO 95,000 0.024 0.028La gastronomia di marca Barilla G. e R. FratelliVia delle Esposizioni, 393/a, Baganzola - Parma (Italy) Società per Azioni - Socio UnicoTrade
COMIECO EURO 1,291,000 0.032 0.037Via Litta Pompeo, 5 - Milan (Italy) Barilla G. e R. FratelliOther Società per Azioni - Socio Unico
CO.NA.I. EURO 13,937,185 0.077 0.090Via Tomacelli, 132 - Rome (Italy) Barilla G. e R. FratelliOther Società per Azioni - Socio Unico
FASTIGHETSAKTIEBOLAGET TAREDOM SEK 796,700 0.17 0.200Pumpgatan 5 - Karlstad (Sweden) Barilla Sverige ABOther
STOREBRAND ABA NOK 2,250,000,000 0.00002 0.00003Professor Kohts vei 9 - Lysaker (Norway) Barilla Norge ASOther
TÅGÅKERIET I BERGSLAGEN AB SEK 3,000,000 8.50 10.000Kristinehamn (Sweden) Barilla Sverige ABOther
Annex 2 - List of investments in associated and other companies
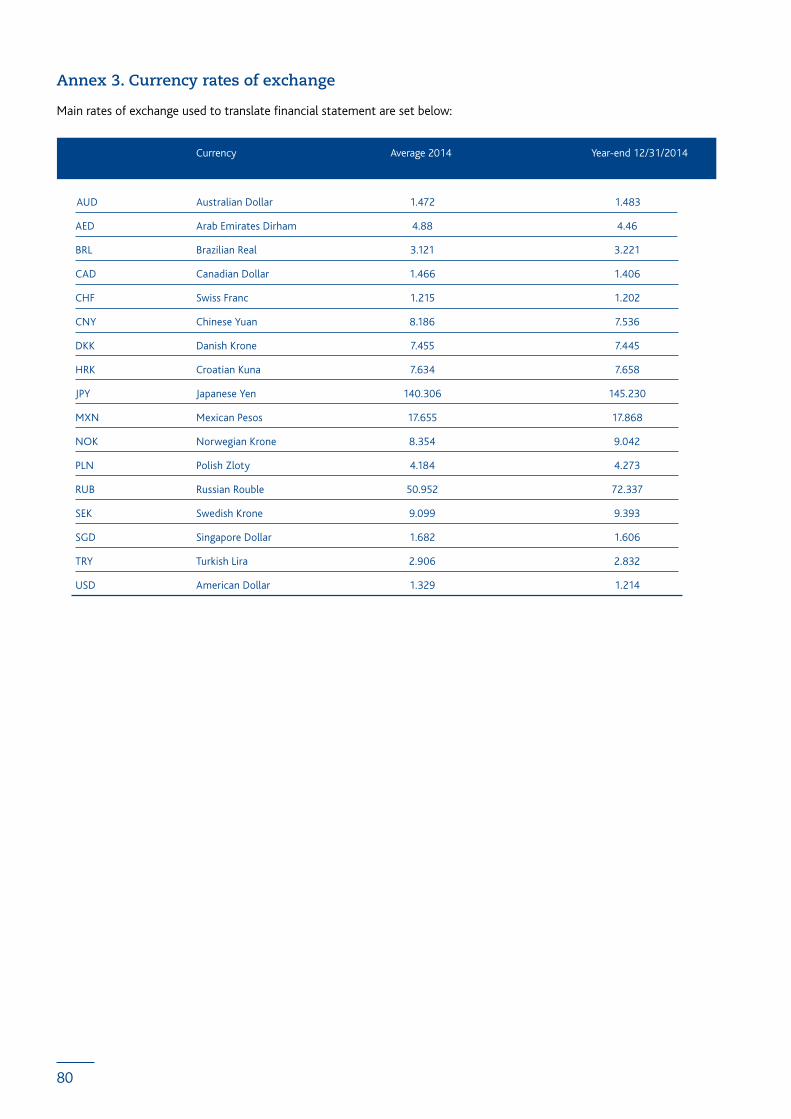
80
Annex 3. Currency rates of exchange Main rates of exchange used to translate financial statement are set below:
AUD Australian Dollar 1.472 1.483
AED Arab Emirates Dirham 4.88 4.46
BRL Brazilian Real 3.121 3.221
CAD Canadian Dollar 1.466 1.406
CHF Swiss Franc 1.215 1.202
CNY Chinese Yuan 8.186 7.536
DKK Danish Krone 7.455 7.445
HRK Croatian Kuna 7.634 7.658
JPY Japanese Yen 140.306 145.230
MXN Mexican Pesos 17.655 17.868
NOK Norwegian Krone 8.354 9.042
PLN Polish Zloty 4.184 4.273
RUB Russian Rouble 50.952 72.337
SEK Swedish Krone 9.099 9.393
SGD Singapore Dollar 1.682 1.606
TRY Turkish Lira 2.906 2.832
USD American Dollar 1.329 1.214
Currency Average 2014 Year-end 12/31/2014

81
The Academia Barilla Restaurant, in the heart of New York, offers people an authentic Italian culinary experience.

82
Report of Independent Auditors

83

84
Corporate informationand contacts
Barilla Holding - Società per Azioni
Registered office and headquartersVia Mantova, 166 - 43122 Parma - Italy
Share capitale: euro 131,000,000.00 fully paid-in.Parma company register, Tax IDand VAT no. 02068780341R.E.A. Parma no. 208304
Tel. +39 0521 2621Fax +39 0521 270621relazioniesterne@barilla.comwww.gruppobarilla.itwww.barillagroup.com
Barilla photo archiveStefano Zardini
Editing and layoutStudio Norma (Parma - Italy)
PrintingGrafiche Step (Parma - Italy)