annual report 2014 2014 - hoist financeir.hoistfinance.com/afw/files/press/hoist_kredit/ar2014.pdf2...
TRANSCRIPT
The Board of Directors and the CEO of
Hoist Kredit AB (publ)
Corporate ID 556329-5699
hereby submit the
Annual report 2014
Hoist Kredit AB
2014
Hoist Kredit AB (publ) Annual report 20142
Administration report
Business overviewHoist Kredit AB (publ) ”Hoist Kredit”, corporate registration number 556329-5699, is a credit market company licensed and supervised by the Swedish Financial Supervisory Authority (Finansinspektionen). The company is domiciled in Stockholm, Box 7848, 103 99 Stockholm.
Hoist Kredit is a leading debt-restructuring partner to international banks, with operations in nine countries across Europe. The Group is specialise in purchasing unsecured non-performing loans (also addressed below as “NPLs”) originated by large international banks and other financial institutions with whom Hoist Kredit has strong and long-term relationships. Hoist Kredit follows its key partners across markets and often purchases portfolios in several countries where they have opera-tions. As at 31 December 2014, 94% of the carrying value of the Group’s purchased portfolios originated from financial institutions. Hoist Kredit is the largest pan-European acquirer of NPLs from financial institu-tions. The Group also selectively purchases overdue debt from utilities, telecommunications companies and other consumer companies and, in certain markets, opportunistically and selectively purchase performing and secured loans. After purchasing a portfolio, Hoist Kredit collect from the customers primarily by agreeing to sustainable payment plans. Hoist Kredit largely manages the collections on the company’s purchased port-folios through its ten in-house collection centers across Europe, which are complemented, where appropriate, by carefully selected local external debt servicing partners. For more than 20 years, the Group has focused exclusively on purchasing debt portfolios. This sets Hoist Kredit apart from many of the company’s competitors who have emerged from the third-party debt collection space and have significantly shorter history of debt purchasing activities. This long-term focus and the Group’s flexible and tailored product offering have allowed Hoist Kredit to develop the expertise and know-how to structure and execute complex transactions.
Since 2009, the Group has operated an internet-based retail deposit service in Sweden under the brand name of HoistSpar. Hoist Kredit can, as a licensed and supervised credit company, offer the public a deposit ser-vice which is fully covered by the Swedish state deposit guarantee scheme
up to an amount of EUR 100 000 for each account. This gives the Group a cost-effective, flexible and reliable source of funding, which the Group mainly uses for acquisition of non-performing loans.
MarketHoist Kredit s geographical focus is Europe. The Group has portfolios in Germany, Austria, France, the UK, Belgium, the Netherlands, Italy, Poland and has a deposit service in Sweden. Through the sale of their NPLs, banks and other originators can focus on their core business, release committed capital, free up management capacity and organisational resources, improve liquidity, mitigate the risk of uncertain payment pro-files and improve important performance ratios. The European market for non-performing loans has recently grown, mainly as a result of the underlying market expansion of the consumer credit market and the new regulatory framework with respect to capital coverage (Basel III) that came into effect in 2014.
Hoist Kredit ’s main competitors include debt purchase and collec-tion companies, integrated players operating a wider range of financial service businesses and specialised investors.
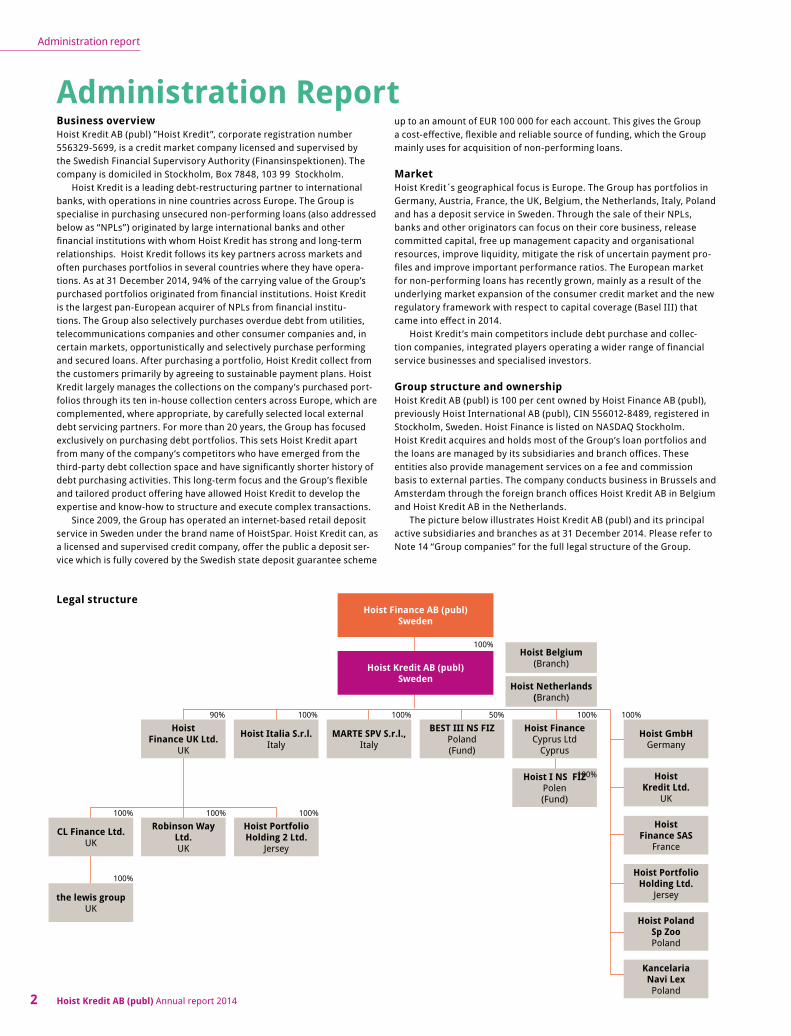
Group structure and ownershipHoist Kredit AB (publ) is 100 per cent owned by Hoist Finance AB (publ), previously Hoist International AB (publ), CIN 556012-8489, registered in Stockholm, Sweden. Hoist Finance is listed on NASDAQ Stockholm.Hoist Kredit acquires and holds most of the Group’s loan portfolios and the loans are managed by its subsidiaries and branch offices. These entities also provide management services on a fee and commission basis to external parties. The company conducts business in Brussels and Amsterdam through the foreign branch offices Hoist Kredit AB in Belgium and Hoist Kredit AB in the Netherlands.
The picture below illustrates Hoist Kredit AB (publ) and its principal active subsidiaries and branches as at 31 December 2014. Please refer to Note 14 “Group companies” for the full legal structure of the Group.
Administration Report
HoistFinance UK Ltd.
UK
Hoist Italia S.r.l. Italy
MARTE SPV S.r.l., Italy
Hoist Portfolio Holding 2 Ltd.
Jersey
CL Finance Ltd.UK
the lewis group UK
Robinson Way Ltd.UK
Hoist I NS FIZPolen(Fund)
BEST III NS FIZPoland(Fund)
Hoist Finance Cyprus Ltd
Cyprus
Hoist Netherlands (Branch)
Hoist Belgium (Branch)Hoist Kredit AB (publ)
Sweden
Hoist Finance AB (publ) Sweden
Hoist GmbH Germany
Hoist Kredit Ltd.
UK
Hoist Finance SAS
France
Hoist Portfolio Holding Ltd.
Jersey
Hoist Poland Sp Zoo Poland
Kancelaria Navi Lex Poland
90% 100% 100%
100%
100%50% 100%
100%
100%100%100%
100%
Legal structure

Hoist Kredit AB (publ) Annual report 2014 3
Administration report
Important events in 2014 The three year senior nonsecured bond of SEK 750 M, which was
issued in December 2013, was listed on Nasdaq Stockholm In April, Hoist Kredit acquired the non-performing loans portfolio
of its Italian partner TRC. The portfolio consisted of approx. 800 000 claims with a nominal value of approx. EUR 1.9 BN
During the spring, additional acquisitions from Crédit Agricole Consumer Finance in the Netherlands further strengthened the Group’s position on the Dutch market
A private placement to Toscafund, an asset management company based in London with focus on global financial institutions, of SEK 333 M was completed in May in the parent company Hoist Finance AB. Issue with corresponding amount in Hoist Kredit AB (publ).
Another strategic expansion in Italy through the acquisition of TRC’s operating business in Rome and Lecce in August with approx. 130 employees
Issuance of a senior nonsecured bond of EUR 100 M in October, was listed on Nasdaq Stockholm
In November, Hoist Kredit acquired the Polish debt collection company Navi Lex”) with approx. 130 employees in Wroclaw
In December, a large loan portfolio was acquired in Italy from a major global bank
During the period, a preferential rights issue of SEK 100 M was made to, and fully subscribed by, existing shareholders. Hoist Finance AB (publ) has contributed SEK 100 M in capital contributions to the com-pany
A new share issue of SEK 100 M against payment in kind by way of perpet-ual convertible debentures issued by its subsidiary Hoist Kredit AB (publ) whereby the holders of the convertible debentures received shares in Hoist Finance AB (publ). Immediately after the receipt of the convertible debentures, the debentures were converted into shares in Hoist Kredit AB (publ) and thereby SEK 100M of Tier I capital was converted into com-mon equity Tier I capital
During the fourth quarter, three new Board members was elected of Hoist Kredit AB (publ) – Ingrid Bonde (Chairman), Annika Poutianen and Gunilla Wikman
Development in 2014 financial yearRevenue and financial itemsAs a result of the high acquisition activity in both 2013 and 2014, gross cash collections increased by 55 per cent to SEK 2,541 M (SEK 1,641 M). Portfolio amortisation and revaluation totalled SEK –1,143 M (SEK –633 M), of which portfolio revaluation accounted for SEK –15 M (SEK –6 M). Interest income from the run-off consumer loan portfolio decreased during the year in line with the portfolio being amortised and totalled SEK 38 M (SEK 69 M). As at 31 December 2014, the carrying value of the run-off portfolio of consumer loans was SEK 119 M (SEK 209 M). Net revenue from acquired loans thus increased by 33 per cent to SEK 1,436 M (SEK 1,077 M).
Fee and commission income has been stable with a slight increase from SEK 149 M in 2013 to SEK 153 M in 2014, primarily as a result of the full-year effect from the lewis group Ltd, which was acquired in August 2013. Profit from shares and participations in the joint venture in Poland (BEST III) has increased by 61 per cent to SEK 59 M. During 2013 fees to BEST III’s external servicing partner were re-negotiated, which had a negative impact upon future cash flows and hence the valuation of the asset. This effect was included in the reported profit for 2013. The holding in BEST III is reported according to the equity method. As a consequence of the accounting principles applied within the BEST III fund, falling market rates during 2014 had , to certain extent, a positive effect on the result.
The acquisition activity in Hoist Kredit ’s joint venture was low in 2013 and no additional acquisitions were made in 2014. As at 31 December
2014, the carrying value of Hoist Kredit ’s share in the joint venture was SEK 215 M (SEK 192 M). The total profit from the joint venture amounted to SEK 59 M. The result from the divestments totalled SEK 28 M.Other income totalled SEK 18 M (SEK 16 M). Total revenue increased to SEK 1,666 M compared to SEK 1,279 M in 2013. Net financial items, i.e. the net of interest income and interest expense excluding interest income from the run-off portfolio of consumer loans, totalled SEK –292 M (SEK –170 M). In order to accommodate higher expected acquisition vol-umes, in 2014 Hoist Kredit has continued to build and maintain liquidity through the issuance of corporate bonds and increased deposits through HoistSpar. Furthermore, falling market rates have resulted in lower interest income from investments in treasury bills and treasury bonds. Net income from financial transactions totalled SEK –19 M (SEK –5 M) and relates to the effects from currency and interest rate hedges using derivatives.
Operating expensesOperating expenses, excluding depreciation and amortisation of tangible and intangible fixed assets totalled SEK –1,126 M, an increase of 22 per cent compared to 2013 (SEK –925 M). The increase in the operating expenses reflects the high portfolio acquisition activity during 2013 and 2014 as well as the acquisition of the two operating platforms in Italy from TRC during the third quarter 2014. In connection with the acqui-sition Hoist Kredit assumed approx. 130 employees. The operating expenses in 2014 include certain one-off items. The cost for the restruc-turing and rationalisation of the French operation of in total SEK 15 M for the full year has been charged on operating expenses. The operating expenses in 2014 also include an acquisition cost of SEK 4 M attributable to the acquisition of Navi Lex in Poland in December 2014 and approx.SEK 2 M in acquisition cost attributable to the two acquired platforms from TRC in August. During the year, Hoist Kredit has continued strength-ening its central functions and internal systems, which has resulted in a certain increase in expenses. The operating expenses in 2013 included a charge of SEK 69 M relating to the restructuring costs for the integration of the lewis group Ltd, whereby the operating expenses were charged with a provision for the integration and the operating revenue increased by a corresponding amount. During 2014, Hoist Kredit has finalised the integration of the lewis group Ltd and Robinson Way Ltd at the previously estimated cost. The restructuring reserve has been fully utilised. Depreciation and amortisation of tangible and intangible fixed assets totalled SEK –25 M (SEK –16 M). The increase in the depreciation between 2013 and 2014 partly relates to the assets acquired from TRC SpA during 2014. The remainder is mainly explained by depreciation on IT-systems, including the deposit platform and increased depreciation in France as a result of the establishment in Lille.
Profit before tax and Net profitThe profit before tax increased to SEK 205 M (SEK 163 M) due to the continued strong performance of the Group. The income tax expense totalled SEK –38 M (SEK–35 M), corresponding to approx. 18 per cent
Cash flow
SEK M
2014
2013 Change %
Cash flow from operating activities –817 1,259 n/mCash flow from investing activities –774 –597 –30Cash flow from financing activities 1,235 1,017 +21Cash flow for the period –356 1,679 n/m

Hoist Kredit AB (publ) Annual report 20144
Administration report
of the Group’s profit before tax. The tax expense has been positively affected by losses carried forward that were not included in the balance sheet and which have been utilised, thus affecting the reported tax expense positively with an effect of approximately SEK 23 M. Further-more, non-taxable income included in the consolidated profit as well as deductible expenses that have not been included in the consolidated profit have had a positive impact upon the tax expense. The other com-prehensive income, including currency translation differences, totalled SEK 175 M, an increase of SEK 45 M compared to 2013.
The cash flow from operating activities decreased to SEK –817 M (SEK 1,259 M) as a result of higher acquisition volume (incl. currency translation differences) in 2014 and a stronger inflow of deposits in HoistSpar during 2013 compared to 2014. The cash flow from investing activities decreased to SEK –774 M (SEK –597 M) due to the acquisitions of operations in Poland and investments in bonds.
During 2014, Hoist Kredit has successively built up and maintained a liquidity to accommodate expected acquisition opportunities. In line with the strategy to diversify its funding structure, Hoist Kredit has issued bonds. In the end of 2013 the Group issued SEK 350 M in subordinated bonds and SEK 750 M in senior unsecured bonds.
In October 2014, the Group issued another senior unsecured bond of EUR 100 M. This provides a natural currency hedge to the Group’s assets that are mostly EUR-denominated. Since January 2014, Hoist Kredit has reallocated its liquidity reserve in accordance with changes in regulatory requirements. This has resulted in an increase in treasury bills/treasury bonds and secured bonds, and a decrease in senior bank debt and corpo-rate bonds with lower rating. During 2014, Hoist Kredit has invested a net amount of approximately SEK 654 M in treasury bills, treasury bonds and other interest-bearing assets.
The cash flow from financing activities increased to SEK 1,235 M (SEK 1,017 M) as a result of capital contribution through the private placement to Toscafund in May as well as a new preferential rights issue in Decem-ber 2014.
The total cash flow for the year totalled SEK –356 M, compared to SEK 1,679 M in 2013.
Hoist Kredit primarily funds its operations through deposits. As at 31 December 2014, deposits to the public totalled SEK 10,987 M (SEK 9,702 M). The Sparkonto Flex (variable) and Sparkonto Fast (fixed
term) 36 months accounts together stood for approximately 67 per cent of the increase.
In line with its strategy to diversify the funding structure, during 2014 Hoist Kredit issued senior unsecured bonds of EUR 100 M, listed on Nasdaq Stockholm.
As at 31 December 2014, the shareholders’ equity of the Group totalled SEK 1,407 M (SEK 825 M). In order to accommodate the oppor-tunities in the market, Hoist Finance has strengthened its capital base during the year. In May 2014, Hoist Finance completed a private place-ment of SEK 333 M to the London-based Toscafund. In December 2014, Hoist Finance AB (publ) completed a share issue against payment in kind of SEK 100 M by way of perpetual convertible debentures issued by its subsidiary Hoist Kredit AB (publ) whereby the holders of the convertible debentures received shares in Hoist Finance AB (publ). Immediately after the receipt of the convertible debentures, the debentures were converted into shares in Hoist Kredit AB (publ) and thereby SEK 100 M of Tier I capital was converted into common equity Tier I capital. In Decem-ber 2014, a preferential rights issue of SEK 100 M was made to existing shareholders. Total capital ratio has increased from 11.56 per cent as at 31 December 2013 to 12.17 per cent as at 31 December 2014. The CET 1 (Common Equity Tier I Capital) ratio totalled 9.35 (5.63) per cent as at 31 December 2014.
Cash and interest-bearing assets totalled SEK 5,620 M as at 31 December 2014 (SEK 5,264 M). The liquidity ratio was 50 (50) per cent of deposits to the public.
During 2014, Hoist Kredit continued to actively acquire loan portfolios resulting in further geographical diversification and penetration of exist-ing markets. The total acquisition volume in 2014 was SEK 3,227 M (SEK 3,266 M). The carrying value of acquired loans totalled SEK 8,921 M
(SEK 6,400 M) as at 31 December 2014, i.e. an increase of 39 per cent. Gross ERC (Estimated Remaining Collections) 120 months (excl. run-off portfolio of consumer loans and portfolios included in the Polish joint venture) totalled SEK 15,576 M (SEK 10,673 M).
In April, Hoist Kredit completed another major portfolio acquisition and entered into a forward-flow agreement) in the Netherlands with Crédit Agricole Consumer Finance Nederland B.V. In April, Hoist Kredit acquired the portfolio of its Italian servicing partner TRC. In August, Hoist Kredit acquired a portfolio of defaulted consumer loans from Citigroup Financial Products Inc. in Germany. During the third quarter Hoist Kredit also acquired a major portfolio from Santander in the UK. In December Hoist Kredit strengthened its market position in Italy through the acquisition of a major portfolio from a major international bank.
Finansiering och kapitalstruktur
SEK M
2014
2013 Change, %
Deposits from the public 10,987 9,702 +13Subordinated loans 333 329 +1Senior unsecured loans 1,493 666 +124
Total interest-bearing liabilities 12,813 10,697 +20
Other liabilities 886 557 +59Shareholders’ equity 1,407 825 +71Total liabilities and shareholders’ equity 15,106 12,079 +25
Cash and interest-bearing assets 5,620 5,264 +7Other assets 9,486 6,815 +39Total assets 15,106 12,079 +25
Liquidity ratio, % 50 50 0
CET 1 ratio, % 9.35 5.63 +4 p.p.Total capital ratio, % 12.17 11.56 +1 p.p.
Portfolio acquisitions
SEK M
2014
2013 Change %
Portfolio acquisitions 3,227 3,266 –1Carrying value acquired loans1) 8,921 6,400 +39Gross ERC 120 months2) 15,576 10,673 +46
1) Including run-off portfolio of consumer loans and portfolios contained in the Polish joint venture.
2) Excluding run-off portfolio of consumer loans and portfolios contained in the Polish joint venture.
Hoist Kredit AB (publ) Annual report 2014 5
Administration report
Segment overviewSet forth below is the result development of each operating segment based on the operating income statement, excluding the operating segment Central functions and elimination. See note 1 for additional information.
Germany and Austria
SEK M 2014 2013 Change %
Gross cash collections 724 666 +9Portfolio amortisation and revaluation –349 –263 +33Interest income from run-off portfolio of consumer loans 38 69 –45
Net revenue from acquired loans 413 472 –13Fee and commission income 18 20 –12Other income 14 13 +8
Total revenue 446 506 –12
Operating expenses –251 –247 +1
EBIT 195 258 –25EBIT margin, % 44 51 –7 p.p.
Expenses/Gross cash collections, % 29 29 0
Carrying value of acquired loans1) 2,350 2,036 +15Gross ERC 120 months2) 3,817 3,253 +17
1) Including run-off consumer loan portfolio2) Excluding run-off consumer loan portfolio
Operating revenueGross cash collections in 2014 increased by 9 per cent to SEK 724 M (SEK 666 M). The development was positively affected by growth in the business area of secured loans. Portfolio amortisation and revaluation totalled SEK –349 M (SEK –263 M) during 2014. The proportionally higher increase in portfolio amortisation is attributable to the positive portfolio revaluation effects in 2013, attributable to, among other, a single large secured asset. Interest income from the run-off consumer loan portfolio decreased from SEK 69 M to SEK 38 M on a full-year basis as a result of the portfolio gradually being amortised. Fee and commission income was lower in 2014 as a result of Hoist Kredit acquiring a portfolio that was previously serviced on behalf of a third party by Hoist Kredit and that is now contributing to gross cash collections. Total revenue decreased to SEK 446 M (SEK 506 M).
Operating expensesOperating expenses have been largely unchanged in 2014 compared to the previous year despite higher volumes. Personnel expenses have decreased by 7 per cent on a full-year basis compared to last year. This is explained by higher costs in 2013 due to the discontinuation of Hoist Kredit ’s office in Eschborn.
EBITThe EBIT for the segment totalled SEK 195 M for the 2014 full year (SEK 258 M) with a corresponding EBIT margin of 44 (51) per cent. The decline in the profitability relates primarily to the lower interest income from the run-off consumer loan portfolio.
AcquisitionsThe acquisition activity was higher in 2014 compared to the previous year. During the year, Hoist Kredit acquired a portfolio of non- performing consumer loans from Citigroup Financial Products Inc. As at 31 December 2014, the carrying value of acquired loans totalled SEK 2,350 M (SEK 2,036 M). Gross ERC increased to SEK 3,817 M as at 31 December 2014 (SEK 3,253 M).
OtherAustria continuously represents an interesting market for Hoist Kredit. During 2014, Hoist Kredit continued to strengthen its presence in the Austrian market through a handful of portfolio acquisitions.
Belgium, the Netherlands and France
SEK M 2014 2013 Change %
Gross cash collections 733 338 +117Portfolio amortisation and revaluation –485 –228 +113
Net revenue from acquired loans 248 110 +126Fee and commission income 7 7 +4Other income 0 0 n/m
Total revenue 256 117 +119
Operating expenses –194 –123 +58
EBIT 61 –6 n/mEBIT margin, % 24 –5 +29 p.p.
Expenses/Gross cash collections1), % 23 34 –9,p.p.
Carrying value of acquired loans 2,194 1,772 +24Gross ERC 120 months 3,512 2,753 +28
1) Excluding non-recurring costs items
Operating revenueGross cash collections increased by 117 per cent for the full year 2014 to SEK 733 M (SEK 338 M). The higher cash collections relate largely to the acquisition of the portfolio from Crédit Agricole in the Netherlands during the second half of 2013 as well as the additional acquisitions made in the first half of 2014. Portfolio amortisation and revaluation totalled SEK –485 M (SEK –228 M) for the full year, of which portfolio revaluation accounted for SEK –32 M (SEK –44 M). The increase is primarily attribut-able to the growth in the underlying assets and secondly to the continued review and revaluation of the French portfolios. Fee and commission income in 2014 was in line with the previous year and relates primarily to the operations in France.
Operating expensesThe operating expenses totalled SEK –194 M during 2014 (SEK –123 M). The increase in the operating expenses reflects the higher portfolio volume as well as the pending restructuring and rationalisation project in France. In spring 2014, a new office was opened in Lille. The operations in the Hoist Kredit Paris office will gradually be transferred to Lille which, among other things, offers better access to workforce. The cost effect for 2014 is SEK 15 M, of which approximately SEK 13 M is part of a restructur-ing reserve. Hoist Kredit expects certain extra costs during the first half of 2015 until the restructuring is completed.

Hoist Kredit AB (publ) Annual report 20146
Administration report
EBITThe EBIT of the segment totalled SEK 61 M in 2014 (SEK –6 M) with a corresponding EBIT margin of 24 (–5) per cent.
AcquisitionsAdjusted for the effect from the acquisition of the portfolio from Crédit Agricole Consumer Finance Nederland B.V. in the end of 2013, the acquisition activity of the segment was higher in 2014 compared to the previous year. The acquisition activity in the Netherlands continued to be high. During the year Hoist Kredit acquired another major portfolio and entered into a forward-flow agreement in the Netherlands with Crédit Agricole Consumer Finance Nederland B.V. The acquisition activ-ity in France continued to be weak as the French market is immature. As at 31 December 2014, the carrying value of acquired loan portfolios totalled SEK 2,194 M (SEK 1,772 M). Gross ERC increased to SEK 3,512 M as at 31 December 2014 (SEK 2,753 M).
UK
SEK M 2014 2013 Change %
Gross cash collections 527 250 +111Portfolio amortisation and revaluation –201 –40 +396
Net revenue from acquired loans 327 210 +56Fee and commission income 128 122 +5Other income 3 6 –54
Total revenue 458 338 +35
Operating expenses –277 –290 –5
EBIT 181 48 +281EBIT margin, % 40 14 +26 p.p.
Expenses/Gross cash collections 1), % 28 37 –9 p.p.
Carrying value of acquired loans 1 798 1 313 +37Gross ERC 120 months 3 391 2 588 +31
1) Excluding non-recurring cost items
Operating revenueGross cash collections totalled SEK 527 M during 2014 (SEK 250 M). The increase in gross cash collections reflects the acquisition of the lewis group Ltd in August 2013 as well as strong portfolio acquisitions in 2014. Portfolio amortisation and revaluation totalled SEK –201 M for the 2014 full year (SEK –40 M). The considerable increase compared to the previous year is attributable to the acquisition of the lewis group Ltd, where a revaluation of the portfolio was made that contributed SEK 64 M to operating revenues. The development of fee and commission income was stable on a full-year basis. A new regulatory framework with higher requirements upon risk and compliance management have resulted in structural changes in the British market with a number of small debt collection companies lacking the required routines and resources going out of business.
Operating expensesOperating expenses in 2013 were charged with a SEK 69 M allocation to a restructuring reserve for the integration of the lewis group Ltd. During 2014, the integration of the lewis group Ltd and Robinson Way Ltd has been completed at estimated cost that was reserved at acquisition. The restructuring reserve has been fully utilised. Thereafter the focus has been on operational improvements and improved profitability. On a full-year basis, operating expenses decreased by 5 per cent to
SEK –277 M (SEK –290 M). Taking into account one-off items in 2013 operating expenses increased by 25 per cent.
EBITIn 2014, the EBIT of the segment totalled SEK 181 M (SEK 48 M) with a corresponding EBIT margin of 40 (14) per cent.
AcquisitionsThe acquisition activity was good in 2014 with an even acquisition pace during the year. In 2014, Hoist Kredit acquired, inter alia, a substantial portfolio from Santander in the UK. As at 31 December 2014, the carrying value of acquired loan portfolios totalled SEK 1,798 M (SEK 1,313 M). Gross ERC increased to SEK 3,391 M as at 31 December 2014 (SEK 2,588 M).
Italy
SEK M 2014 2013 Change %
Gross cash collections 261 213 +23Portfolio amortisation and revaluation –91 –110 –17
Net revenue from acquired loans 170 102 +66Other income 0 0 n/m
Total revenue 170 102 +66
Operating expenses –106 –22 373
EBIT 64 80 –20EBIT margin, % 37 78 –41 p.p.
Expenses/Gross cash collections, % 41 11 +30 p.p.
Carrying value of acquired loans 1,181 308 +283Gross ERC 120 months 2,407 486 +395
Operating revenueIn 2014, gross cash collections increased by 23 per cent to SEK 261 M (SEK 213 M). The increase relates to the acquisition of the portfolio from TRC in April. Portfolio amortisation and revaluation totalled SEK –91 M for the 2014 full year (SEK –110 M). In the annual comparison between 2013 and 2014 of gross cash collections, the portfolios acquired in April and December 2014 had a significant impact. These portfolios have, how-ever, to the same extent not affected portfolio amortisation during 2014. Hoist Kredit did a revaluation of the portfolios at the time of acquisition. This had a positive effect on the portfolios carrying value and, hence, decreased portfolio amortisations during 2014.
Operating expensesThe considerable increase in operating expenses for the 2014 full year relates to the acquisition of TRC’s two platforms (Rome and Lecce) in August comprising approximately 130 employees. The acquisition is an important element in Hoist Kredit ’s strategy to grow and strengthen its position through own market presence in the Italian market. The acquired capacity has scope for additional volume. The later part of 2014 involved integration of TRC’s operations into Hoist Kredit.
EBITIn 2014, the EBIT of the segment totalled SEK 64 M (SEK 80 M) with a corresponding EBIT margin of 37 (78) per cent.
AcquisitionsThe acquisition activity was considerably higher in 2014 compared to the previous year. In April, Hoist Kredit acquired the portfolio from its Italian service partner TRC. The portfolio contained approximately

Hoist Kredit AB (publ) Annual report 2014 7
Administration report
800,000 claims with a total face value of EUR 1.9 billion. In December, another substantial portfolio was acquired from a major international bank. The effect from this acquisition upon gross cash collections has been limited and will result in a more optimal utilisation of the existing capacity. As at 31 December 2014, the carrying value of acquired loan portfolios totalled SEK 1,181 M (SEK 308 M). Gross ERC increased to SEK 2,407 M as at 31 December 2014 (SEK 486 M).
Poland
SEK M 2014 2013 Change %
Gross cash collections 296 171 +72Portfolio amortisation and revaluation –17 11 n/m
Net revenue from acquired loans 279 182 +53
Total revenue 279 182 +53
Operating expenses –77 –64, +19
EBIT 202 118 +71EBIT margin, % 72 65 +7 p.p.
Expenses/Gross cash collections, % 26 38 –12 p.p.
Carrying value of acquired loans 1,182 779 +52Gross ERC 120 months 2,449 1,592 +54
Operating revenueGross cash collections increased by 72 per cent in the 2014 full year to SEK 296 M (SEK 171 M) as a result of strong collections on existing port-folios and an underlying increase in volume. Portfolio amortisation and revaluation totalled SEK –17 M (SEK +11 M). In relation to gross cash collections, portfolio amortisations have been low during 2013 and during the majority of 2014. This is mainly attributable to a large port-folio whose net cash collections (gross cash collections less collection costs) are expected to be unusually concentrated to later stages in the portfolios collection cycle. Consequently, the amortisation of the portfolio during the initial period of its life cycle has been far below the amortisation rate set to the portfolio over its full life cycle. As of the fourth quarter 2014, this initial collection period is over and the relation between gross cash collections and amortisation has normalised. Hoist Kredit has previously reported shares and participations in joint ventures in the Polish segment. In order to better reflect the operations of Hoist Kredit, starting from the fourth quarter 2014, these are reported in the segment “Central Functions”. Consequently, the comparative figures have been adjusted.
Operating expensesOperating expenses have increased slightly in 2014 to SEK –77 M (SEK –64 M). The increase is mainly attributable to the establishment of the office in Warsaw with increased number of staff. In the end of Decem-ber, Hoist Kredit acquired the Wroclaw-based debt collection company Navi Lex with a staff of approximately 130 FTEs. The acquisition has not yet been reflected in the result of the segment except for acquisition-re-lated costs of approximately SEK 4 M. In 2014, Navi Lex had a turnover of SEK 38 M and an operating income of SEK 9 M.
EBIT In 2014, the EBIT of the segment totalled SEK 202 M (SEK 118 M) with a corresponding EBIT margin of 72 (65) per cent.
AcquisitionsA major portfolio acquisition was completed in Poland in 2013. Thus the acquisition activity in 2014 was somewhat lower compared to the previous year. As at 31 December 2014, the carrying value of acquired loan portfolios totalled SEK 1,182 M (SEK 779 M). Gross ERC increased to SEK 2,449 M as at 31 December 2014 (SEK 1,592 M).
Parent CompanyThe Parent Company functions as a business operation in the Hoist Kredit Group.
The Parent Company’s net profit was SEK 125m (82). Contrary to the trend in the overall Hoist Kredit Group, revenues
from acquired loan portfolios in the Parent Company decreased from SEK 380m in 2013 to SEK 292m in 2014. The difference is partly due to the fact that only a minor share of the substantial volumes of loan portfolios that were acquired in the Hoist Kredit Group in 2014 were acquired by the Parent Company. In addition, the structure of the Italian business was altered after the purchase of TRC, and the Parent Company, in conjunc-tion with this, selling the assets that were previously owned by the Parent Company to the subsidiary Marte SPV S.R.L.
The decline in net interest income in the Parent Company is primarily attributable to net interest income from portfolios that were acquired prior to 1 July 2011 (which are recognised separately since they are measured at fair value), which was anticipated since these portfolios are aging.
Personnel expenses in the Parent Company rose alongside an increase in the number of employees. The major change stems from a reinforcement in staffing, predominantly among central support func-tions at the head office in Stockholm.
The trend in the Parent Company’s interest expense from SEK 261m in 2013 to SEK 345m in 2014 is highly similar to that of the Hoist Kredit Group. This is due to the Parent Company accepting deposits from the public and engaging in financing by issuing bonds. In 2014, deposit volumes increased and new, EUR-denominated bonds were issued. At 31 December 2014, equity totalled SEK 1,227m (694). In May 2014, Hoist Finance AB (publ) issued SEK 333m in new shares under a directed share issue to the London-based Toscafund. A corresponding issue was made in Hoist Kredit. In December 2014, Hoist Finance AB (publ) completed a SEK 100m non-cash issue using convertible debt instruments issued by Hoist Kredit AB (publ), whereby the holders of the convertible debt instruments received shares in Hoist Finance AB (publ).
Immediately after receiving the convertibles, they were converted into Hoist Kredit AB (publ) shares, thus converting SEK 100m of Tier 1 capital into Common Equity Tier 1. In December 2014, a SEK 100m prefer-ential rights issue was also issued by Hoist Finance AB (publ) to existing shareholders. A corresponding amount was contributed to the company by way of a shareholders’ contribution.
Non-financial performance indicatorsEmployeesHoist Kredit ’s employees are one of the most important resources for the Group. The Group is an international group with diversity in many aspects such as nationalities, languages, professions and cultures. The Group’s employees have different backgrounds, including persons with previous careers in law, finance, research and other professional fields. The sickness absence per country are generally low. Hoist Kredit also has a comparatively low employee turnover, considering that the single largest group of employees are collection agents who have a work situation similar to a call-center business, which is generally known of having very high staff turnover. Each country sets goals and implements improvements in the personnel area based on their unique needs. The Group have policies within the HR area, the Remuneration policy is an example of these.
Hoist Kredit AB (publ) Annual report 20148
Administration report
In August 2014, Hoist Kredit acquired the collection operations of its service partner TRC. Through the acquisition the Group gained approx. 130 employees in Rome and Lecce.
In November 2014, Hoist Kredit acquired the Polish debt collection company Kancelaria Navi Lex (“Navi Lex”) with approx. 130 employees in Wroclaw.
As at 31 December 2014, the number of employees within the Group was 1,155 (corresponding to 1,077 full time equivalents (FTEs)), of which 60 per cent were women. As at 31 December 2013, the number of employees within the Group was 967 (corresponding to 881 full time equivalents (FTEs)), of which 62 per cent women.
The Hoist Finance Model“The Hoist Finance Model” involves solution-oriented, mutual agree-ments done amicably, where Hoist Kredit together with its customers develop constructive and realistic solutions to improve the customers’ financial situation. Hoist Kredit has a constructive approach to the collec-tion and the goal is to achieve optimum results both for the Group and for the debtors. In practice this means that Hoist Kredit rather focuses on helping debtors to sustainable payment plans instead of taking legal action. In addition, the Group’s own collection platforms ensure that the Group can control the collection process, which in turn ensures good communication with debtors. There are two main advantages to this approach: firstly, the debtor is more inclined to pay voluntarily, which reduces the likelihood of a more costly legal solution; secondly, payment plans with the debtors maximizes the cash flow for the Group over time and entails a stable cash flow over a longer period. Since banks are responsible for their clients even after the customer’s loan has been sold, for example to Hoist Finance, the Group’s reputation for ethical behaviour and accommodating approach is a prerequisite for the debt originators to feel secure in a sale of assets to Hoist Kredit.
Important risks and uncertaintiesA disclosure of risks can also be found at Note 27, Financial Risk and financial policy.
Development of risksDuring 2014, Hoist Kredit has continued its expansion into new markets and increased the volume of its acquired loan portfolios. In order to fund the expansion during the year and to accommodate continued expansion. in the future, Hoist Kredit has both, issued bonds, and increased deposits from the public through competitive terms.
In total, the balance sheet has increased significantly during the year, primarily due to port folio acquisitions. Of course, this has affected the development of risk in a number of ways.
Credit risk has increased proportionally with the volume of acquired loans. However, Hoist Kredit does not believe that the credit quality of the portfolios has increased considerably and is rather assumed to be relatively constant. The increased risk is mainly driven by increased volumes. The geographic diversification has improved during the year mainly driven by increased volume in Italy, UK and Poland.
Market risk has increased slightly primarily as a result of a larger liquid-ity portfolio. The liquidity portfolio has increased by approximately SEK 3 billion during the year and the duration has increased simultaneously. This has led to increased exposure to interest rate risk and credit spread risk. At the same time as the liquidity portfolio’s duration has increased, the deposits from the public is being made on longer duration terms, which has countered the increase of interest risk from the liquidity port-folio in a very efficient manner Credit spread risk remains therefore as the single largest market risk factor.
The credit quality in the portfolio has improved since a reweighting was conducted during the year from unsecured bank bonds to treasury and housing bonds. Accordingly, the portfolio’s sensitivity to major fluc-
tuations in credit spreads has also been reduced. The exposure is thus deemed to be reasonably balanced and well within the limits established by the Board.
The increase shall also be viewed in the light of an increase in credit quality in portfolios, where a re-allocation from non-secured corporate bonds to government bonds have been made. The probability of large movements in credit spreads are therefore deemed to have decreased. The exposure is, however, believed to be reasonably weighted and well within the limits stipulated by the Board
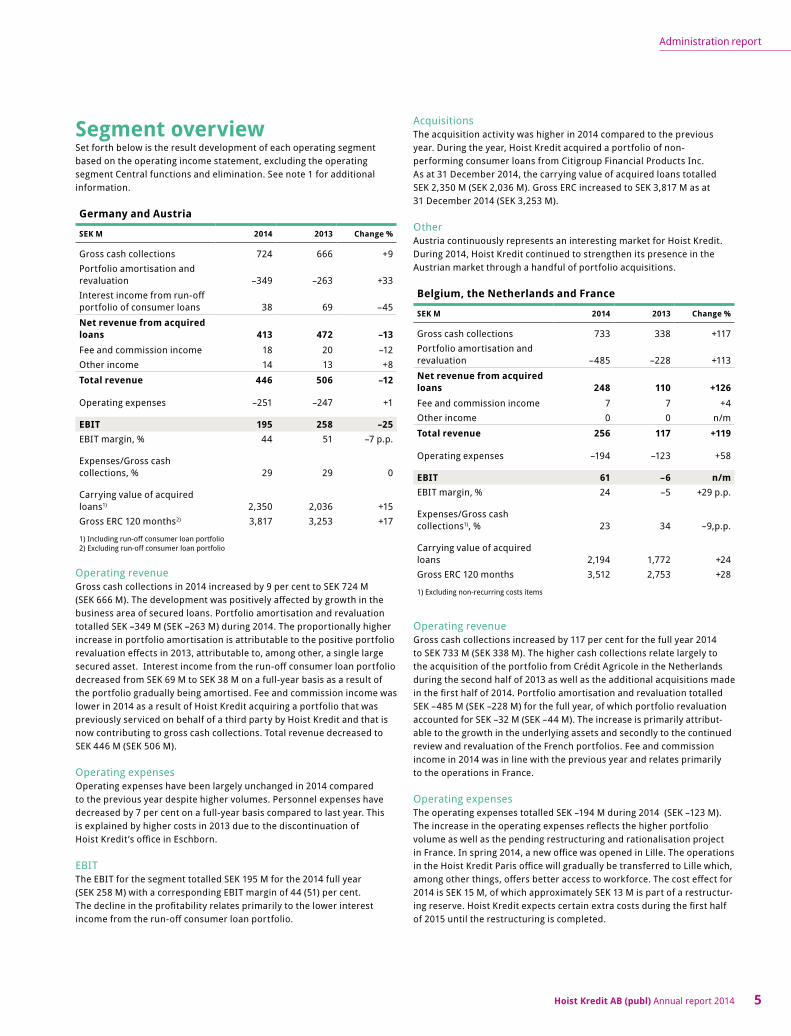
Distribution of acquired portfolios by geographyOperational risk has been a priority area for the Group’s risk manage-ment and risk control during the year and a number of initiatives have been taken to further improve and enforce risk mitigating routines and processes within the Group. Operational risk is believed to be a risk area that has increased as a result of the rapid expansion of the Group. The main sources of the increase are stemming from the increased risks the acquired companies bring in terms of system integrations, differences in company cultures as well as legal and tax risks associated with the Group operating in additional countries in Europe from a headquarter located in Sweden. Hoist Kredit has managed these risks through efficient project management, strict guidelines for incident reporting, risk identification and handling of unacceptable risks. Despite this, Hoist Kredit believes that operational risks have increased and will continue with preventive actions within this area in 2015.
Liquidity risk has decreased during the year, mainly as a result of a larger liquidity portfolio available to alleviate liquidity disturbances as well as an altered funding structure with longer duration funding solu-tions decreasing the liquidity gap between assets and liabilities.
The Company’s view on riskThe Group’s business concept is to profit on the expertise the company has on acquisition and management of non-performing loans. To manage and expose oneself to credit risk constitute a central part of the compa-ny’s business and help the company to reach its highly set goals.
The Group’s view on market risk is that all exposures should be secured and managed as much as practically possible. Certain exposure to market risk is however inevitable as the company needs to hold a large liquidity portfolio in order to be flexible on future portfolio acquisitions. The Board has, therefore, approved certain market risk within strict limits.
Mitigating operational risk is one of the company’s primary areas of focus as it tries to limit it to an absolute minimum. The principle is that risk minimizing activities shall be implemented as long as the measure costs are less than the costs the risk could cause if it materialised. Comprehensive work in Hoist Kredit is continuously performed to identify and limit the operational risks according to this principle.
0
2,000
4,000
6,000
8,000
10,000
2,036
2 200308
463
2,194 1,772
2,350
779192
1,798
1,313
1,181
1,182
215
Germany(Incl. Austria)
PolandJoint venture, Poland
Italy
UK
Belgium,Netherlands,France
479
2013 2014
2 200
2 350
Tyskland
0
2000
4000
6000
8000
10000
479
1 103 1 384
1 313
2 200
190
308779
463
1 798
2 350
347
1 182
1 181
Tyskland
Polen
Italien
Storbritannien
Belgien
Nederländerna
Frankrike
SEK M
Hoist Kredit AB (publ) Annual report 2014 9
Administration report
Liquidity risk is a result of durations on assets/liabilities and/or reve-nues/costs that are not matched. Hoist Kredit aims to match these to the highest possible degree and that potential liquidity gaps shall be covered by generous liquidity reserves. The risk tolerance for liquidity risks is low.
Report on the most important parts of internal control and risk management in financial reportingThe Board’s report on the most important features of the systems for internal control and risk management in the financial reporting of financial year 2014 is presented as a separate section in the corporate governance report.
Information on new or changed international accounting principles See accounting principles described on page 22 in the Annual Report.
Subsequent eventsThe annual general meeting (AGM) of Hoist Finance AB (publ) on 25 Feb-ruary resolved on the issuance of a directed share issue, whereby Cruz Industries Ltd. (“Cruz”) was offered the right to acquire shares. The issue was completed in conjunction with an agreement between Hoist Kredit AB (publ) and Cruz under which (i) Hoist Kredit acquired Cruz’s minority stake of 10 per cent in the company’s subsidiary Hoist Finance UK Ltd., and (ii) Cruz pledged to reinvest the liquidity received for the subscrip-tion of the newly issued shares in Hoist Finance AB (publ). A cash-settled purchase price of SEK 32.5m was given as payment for the newly issued shares in Hoist Finance AB (publ) and was subsequently contributed to Hoist Kredit in March 2015 as an unconditional shareholders’ contribu-tion.
On 25 March 2015, Hoist Kredit ’s Parent Company Hoist Finance AB’s (publ) shares were listed on Nasdaq Stockholm. Under the IPO, Hoist Finance raised about SEK 750m through the subscription of newly issued shares. As at 30 March 2015, net liquidity of SEK 726m has been contrib-uted to Hoist Kredit and strengthened own funds.
Future outlookThe European market for acquisitions of non-performing debt port-folios of unsecured consumer loans continued to grow during 2014. The prolonged solution of the financial crisis in Europe and stricter capital adequacy requirements will probably force banks to continue to strengthen their balance sheets by divesting non-performing loans for some time ahead. The Basel III framework is currently implemented on banks in Europe.
Sweden has a tradition of being in the forefront of implementing upcoming framework as soon as the legal possibility is presented, why Hoist Kredit already has implemented the new capital adequacy require-ments according to Basel III. Hoist Kredit expects, however, that the com-pany’s pillar II capital requirement will grow in controlled forms during the coming two years. The fact that Hoist Finance has, unlike the banks that the Group acquires non-performing debt from, already implemented Basel III results in a unique position to take part in potential transactions of non-performing debt.
The fact that the Group has grown during the past 20 years to become one of the leading debt restructuring partners in Europe to banks and financial institutions regarding acquisition and management of non-secured consumer debt, makes Hoist Kredit well equipped to take advantage of the expected development to come. Hoist Kredit expects acquisition volumes in line with or above those of the past years.

Hoist Kredit AB (publ) Annual report 201410
Five-year overview
Five-year overviewConsolidated income statementSEK thousand 2014 2013 2012 2011 2010
Total operating income 1,296,463 1,068,377 542,371 771,134 614,340
whereof net interest income 1,144,335 907,465 428,554 681,429 627,715 Total operating expenses –1,149,988 –941,764 –543,325 –395,458 –351,378 Profit before tax 205,137 163,019 54,769 22,367 262,962 Net profit for the year 167,222 128,112 47,802 27,504 193,664
Consolidated balance sheet
SEK thousand 31 Dec 2014 31 Dec 2013 31 Dec 2012 31 Dec 2011 31 Dec 2010
Cash and lending to credit institutions 1,249,532 3,921,396 2,242,400 1,930,763 2,189,502
Treasury bills and treasury bonds 2,316,110 – – – –
Lending to the public 157,232 328,951 531,594 83,388 446,907
Acquired loan portfolios 8,586,782 5,997,935 3,363,907 2,363,389 1,985,949
Bonds and other interest-bearing securities 1,951,241 1,297,677 732,672 499,468 49,088
Participations in joint ventures 215,347 192,230 180,843 123,869 –
Fixed assets 168,945 65,393 58,764 99,048 95,501
Other assets 461,126 275,700 304,997 176,076 46,384
Total assets 15,106,315 12,079,282 7,415,177 5,276,001 4,813,331
Deposits from the public 10,987,289 9,701,502 6,366,256 4,495,101 4,222,765
Other liabilities and provisions 2,711,708 1,552,657 417,636 270,100 180,100
Shareholders' equity 1,407,318 825,123 631,285 510,800 410,466
Total liabilities and shareholders’ equity 15,106,315 12,079,282 7,415,177 5,276,001 4,813,331
Key ratios 2014 2013 2012 20111) 2010
Gross collections, SEK M 2,541 1,641 887 688 743
Total revenues, SEK M 1,666 1,279 695 843 739
EBIT, SEK M 516 338 151 448 383
EBIT-margin, % 31.0% 26.4% 21.8% 53.1% 51.8%
Acquired loan portfolios, SEK M2) 3,227 3,266 1,511 289 104
Total capital ratio, % 12.2% 11.6% 9.7% 11.4% 11.2%
Common Equity Tier 1 ratio, % 9.4% 5.6% 8.0% 10.4% 9.9%
Liquidity ratio, % 50.3% 50.4% 36.3% 54.1% 53.1%
ERC 120m, SEK M 15,576 10,673 5,981 3,836 n/a
Return on equity, % 15% 18% 8% 6% 52%
Average number of employees (FTEs) 881 712 404 3661) 267
Return on assets, % 1.2% 1.3% 0.8% 0.5% 4.2%
1) Average of fiscal years 1 January – 30 June 2011 and 1 July – 31 December 20112) Excluding non-matured portfolio of consumer loans and investments in joint venture

Hoist Kredit AB (publ) Annual report 2014 11
Definitions
DefinitionsAcquired loans The total of acquired loan portfolios, run-off consumer loan portfolio and shares and
participations in joint venture.
Acquired loan portfolios An acquired loan portfolio consists of a number of defaulted consumer loans or debt that arise from the same originator.
Average number of employees Average number of employees during the year expressed as a full time equivalent (FTE).
Common Equity Tier 1 ratio Consists of common shares issued by the company, retained earnings, other compre-hensive income, other disclosed reserves after deduction for primarily deferred tax assets, intangible assets and goodwill in the numerator. The denominator of the ratio consist of the company’s Risk Exposure Amount.
Cost/Gross cash collections on acquired loans
Operating expenses less fee and commission income, and other income divided by a total of gross cash collections and income from run-off consumer loan portfolio.
EBIT Earnings Before Interest and Tax.
EBIT margin EBIT divided by Total revenue.
Fee and commission income Commission generated from third-party collection services.
Gross cash collections Gross cash flow from the Group’s customers on loans included in the Group’s acquired loan portfolios.
Gross ERC 120 months ”Estimated Remaining Collections”, i.e. the estimated remaining gross collections amount on acquired loan portfolios for the coming 120 months.
Liquidity ratio Cash at banks and high-grade liquid securities where liquidity is available within three days.
Net revenue from acquired loans Gross cash collections from acquired loan portfolios, income from run-off consumer loan portfolio less portfolio amortisation and portfolio revaluation.
Non performing loans A non-performing loan on the balance sheet of the originator is a loan that is in default or close to being in default.
Portfolio amortisation The share of gross cash collections that will be used for amortising the carrying value of acquired loan portfolios.
Portfolio revaluation Changes in the portfolio value based on revised estimated remaining collections for the portfolio.
Return on assets Net profit for the year divided by average total assets.
Return on shareholders’ equity Net profit for the year divided by average shareholders’ equity during the year.
Total capital ratio The company’s CET1-capital, additional Tier 1 capital and Tier 2 capital divided by the company’s Risk Exposure Amount.
Total revenue Total of net revenue from acquired loans, fee and commission income, profit from joint venture and other income.

Hoist Kredit AB (publ) Annual report 201412
Financial statements
Financial statementsConsolidated income statementSEK thousand Note 2014 2013
Net revenues from acquired loan portfolios 1,2 1,398,291 1,008,317
Interest income 2 90,961 158,568
Interest expense 2 –344,917 –259,420
Net interest income 1,144,335 907,465
Fee and commission income 153,222 149,142
Net result from financial transactions 3 –19,151 –4,581
Other income 4 18,057 16,351
Total operating income 1,296,463 1,068,377
General administrative expenses
Personnel expenses 5 –473,200 –386,757
Other operating expenses 6 –653,268 –538,670
Depreciation and amortisation of tangible and intangible assets 14,15 –23,520 –16,337
Total operating expenses –1,149,988 –941,764
Profit from shares and participations in joint venture 7 58,662 36,406
Profit before tax 205,137 163,019
Income tax expense 9 –37,915 –34,907
Net profit for the period 167,222 128,112
Attributed to the Shareholders of the parent company 167,222 128,112

Hoist Kredit AB (publ) Annual report 2014 13
Financial statements
Consolidated statement of comprehensive incomeSEK thousand 2014 2013
Net profit for the period 167,222 128,112
Other comprehensive income
Items that will not be reclassified to the profit and lossRevaluation of defined pension benefit plans –1,710 –
Revaluation of remuneration after terminated employment –1,120 –
Tax 872 –
Total items that may not be reclassified subsequently to the profit and loss –1,958 –
Items that may be subsequently reclassified to the profit and lossCurrency translation differences on foreign operations –23,154 48,013
Hedging currency risk exposure in foreign operations 32,584 –46,146
Total items that may be reclassified subsequently to the profit and loss 9,430 1,867
Other comprehensive income for the year 7,472 1,867
Total comprehensive income for the year 174,694 129,979
Attributable toShareholders of the Parent Company 174,694 129,979
Hoist Kredit AB (publ) Annual report 201414
Financial statements
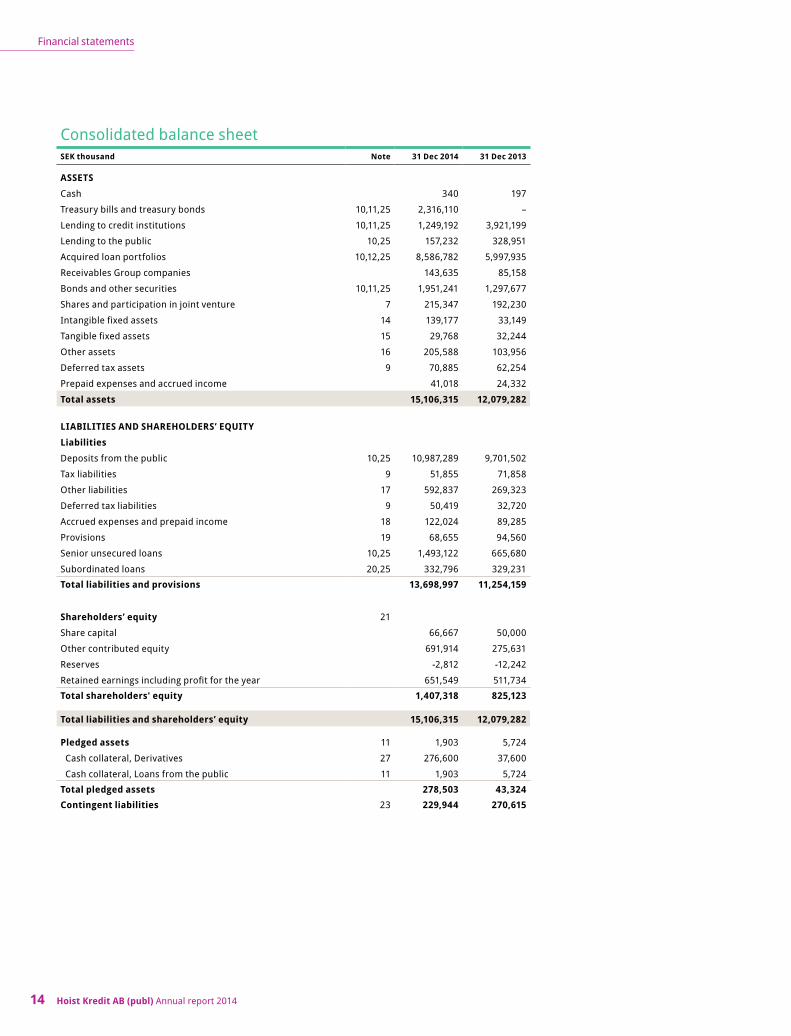
Consolidated balance sheetSEK thousand Note 31 Dec 2014 31 Dec 2013
ASSETSCash 340 197
Treasury bills and treasury bonds 10,11,25 2,316,110 –
Lending to credit institutions 10,11,25 1,249,192 3,921,199
Lending to the public 10,25 157,232 328,951
Acquired loan portfolios 10,12,25 8,586,782 5,997,935
Receivables Group companies 143,635 85,158
Bonds and other securities 10,11,25 1,951,241 1,297,677
Shares and participation in joint venture 7 215,347 192,230
Intangible fixed assets 14 139,177 33,149
Tangible fixed assets 15 29,768 32,244
Other assets 16 205,588 103,956
Deferred tax assets 9 70,885 62,254
Prepaid expenses and accrued income 41,018 24,332
Total assets 15,106,315 12,079,282
LIABILITIES AND SHAREHOLDERS’ EQUITYLiabilitiesDeposits from the public 10,25 10,987,289 9,701,502
Tax liabilities 9 51,855 71,858
Other liabilities 17 592,837 269,323
Deferred tax liabilities 9 50,419 32,720
Accrued expenses and prepaid income 18 122,024 89,285
Provisions 19 68,655 94,560
Senior unsecured loans 10,25 1,493,122 665,680
Subordinated loans 20,25 332,796 329,231
Total liabilities and provisions 13,698,997 11,254,159
Shareholders’ equity 21
Share capital 66,667 50,000
Other contributed equity 691,914 275,631
Reserves -2,812 -12,242
Retained earnings including profit for the year 651,549 511,734
Total shareholders' equity 1,407,318 825,123
Total liabilities and shareholders’ equity 15,106,315 12,079,282
Pledged assets 11 1,903 5,724
Cash collateral, Derivatives 27 276,600 37,600
Cash collateral, Loans from the public 11 1,903 5,724
Total pledged assets 278,503 43,324Contingent liabilities 23 229,944 270,615
Hoist Kredit AB (publ) Annual report 2014 15
Financial statements
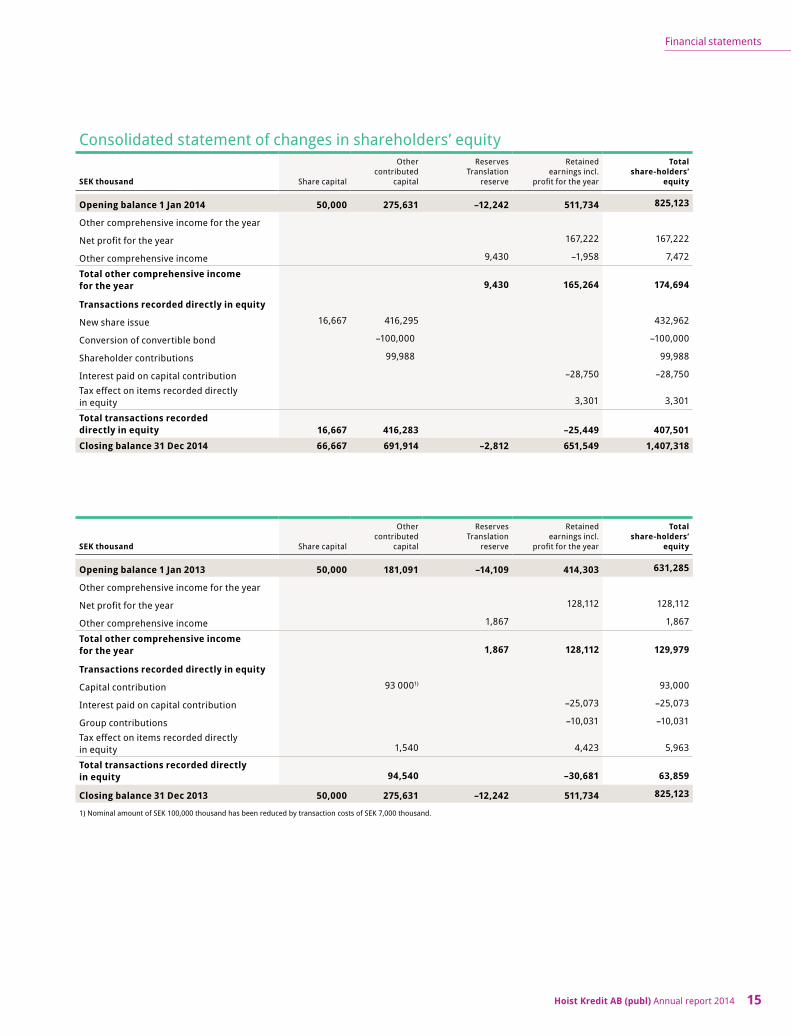
Consolidated statement of changes in shareholders’ equity
SEK thousand Share capital
Other contributed
capital
ReservesTranslation
reserve
Retained earnings incl.
profit for the year
Total share-holders’
equity
Opening balance 1 Jan 2014 50,000 275,631 –12,242 511,734 825,123
Other comprehensive income for the year
Net profit for the year 167,222 167,222
Other comprehensive income 9,430 –1,958 7,472
Total other comprehensive income for the year 9,430 165,264 174,694
Transactions recorded directly in equity
New share issue 16,667 416,295 432,962
Conversion of convertible bond –100,000 –100,000
Shareholder contributions 99,988 99,988
Interest paid on capital contribution –28,750 –28,750
Tax effect on items recorded directly in equity 3,301 3,301
Total transactions recorded directly in equity 16,667 416,283 –25,449 407,501Closing balance 31 Dec 2014 66,667 691,914 –2,812 651,549 1,407,318
SEK thousand Share capital
Other contributed
capital
ReservesTranslation
reserve
Retained earnings incl.
profit for the year
Total share-holders’
equity
Opening balance 1 Jan 2013 50,000 181,091 –14,109 414,303 631,285
Other comprehensive income for the year
Net profit for the year 128,112 128,112
Other comprehensive income 1,867 1,867
Total other comprehensive income for the year 1,867 128,112 129,979
Transactions recorded directly in equity
Capital contribution 93 0001) 93,000
Interest paid on capital contribution –25,073 –25,073
Group contributions –10,031 –10,031
Tax effect on items recorded directly in equity 1,540 4,423 5,963
Total transactions recorded directly in equity 94,540 –30,681 63,859
Closing balance 31 Dec 2013 50,000 275,631 –12,242 511,734 825,123
1) Nominal amount of SEK 100,000 thousand has been reduced by transaction costs of SEK 7,000 thousand.

Hoist Kredit AB (publ) Annual report 201416
Financial statements
Consolidated cash flow statementSEK thousand 2014 2013
OPERATING ACTIVITIESCash flow from gross cash collection 2,541,310 1,641,007
Interest income 90,962 157,817
Fee and commission income 153,222 149,143
Other operating income 18,057 15,622
Interest expense –274,930 –193,595
Operating expenses –1,108,207 –893,298
Net cash flow from financial transactions –19,151 –4,581
Capital gain on redemption of certificates in joint venture 27,941 16,481
Income tax paid –55,886 –5,806
Total 1,373,318 882,790
Increase/decrease in acquired loan portfolios incl. changes in valuation –3,731,866 –3,266,718
Increase/decrease in certificates in joint venture 13,544 11,697
Increase/decrease in lending to the public 107,707 325,025
Increase/decrease in deposits from the public 1,215,800 3,288,496
Increase/decrease in other assets –86,348 –19,728
Increase/decrease in other liabilities 323,514 –28,755
Increase/decrease in provisions –25,905 62,255
Changes in other balance sheet items –6,420 3,955
Total –2,189,974 376,227
Cash flow from operating activities –816,656 1,259,017
INVESTING ACTIVITIESInvestments in intangible fixed assets –57,678 –21,896
Investments in tangible fixed assets –13,629 –10,809
Acquisitions in subsidiaries –49,434 – Investments/divestments of bonds and other securities –653,564 –564,254
Cash flow from investing activities –774,305 –596,959
FINANCING ACTIVITIESCapital contribution 99,988 93,000
New share issue 332,962 –
Issued loans 831,007 665,680
Issued subordinated loans – 329,231
Repayment of subordinated loans – –45,900
Paid interest on capital contribution –28,750 –25,073
Cash flow from financing activities 1,235,207 1,016,938
Cash flow for the year –355,754 1,678,996Cash at the beginning of the year 3,921,396 2,242,400
Cash at the end of the year1) 3,565,642 3,921,3961) Consists of cash, treasury bills/bonds and lending to credit institutions.
Hoist Kredit AB (publ) Annual report 2014 17
Financial statements
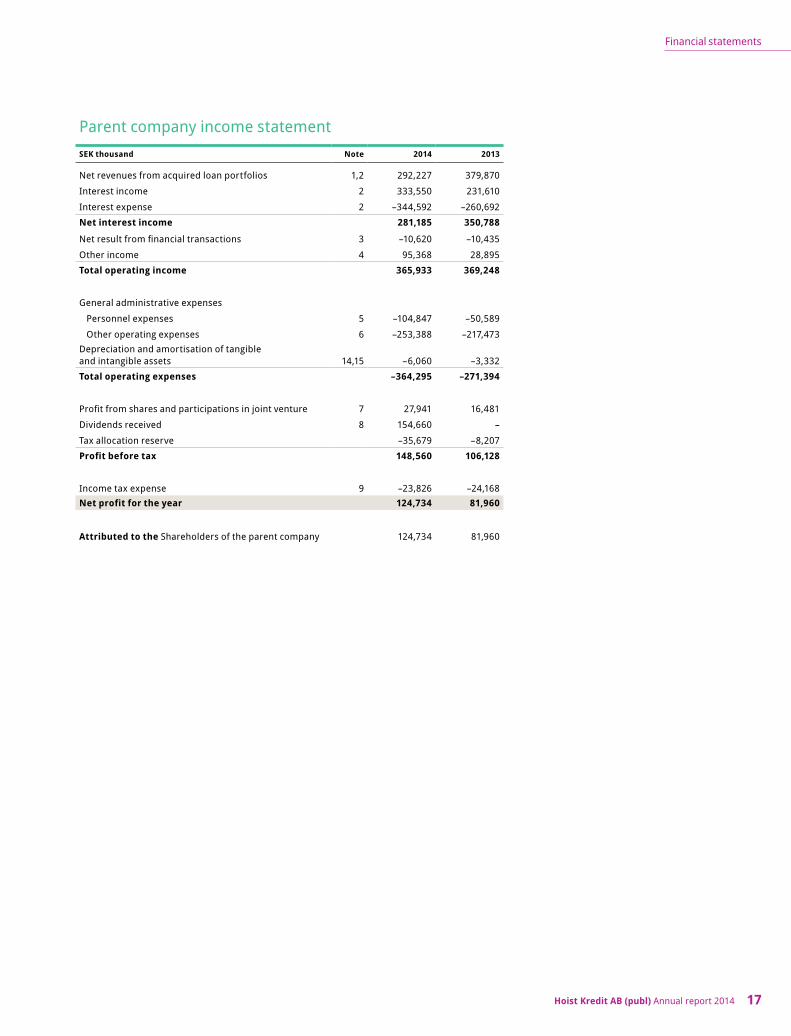
Parent company income statementSEK thousand Note 2014 2013
Net revenues from acquired loan portfolios 1,2 292,227 379,870
Interest income 2 333,550 231,610
Interest expense 2 –344,592 –260,692
Net interest income 281,185 350,788
Net result from financial transactions 3 –10,620 –10,435
Other income 4 95,368 28,895
Total operating income 365,933 369,248
General administrative expenses
Personnel expenses 5 –104,847 –50,589
Other operating expenses 6 –253,388 –217,473Depreciation and amortisation of tangible and intangible assets 14,15 –6,060 –3,332
Total operating expenses –364,295 –271,394
Profit from shares and participations in joint venture 7 27,941 16,481
Dividends received 8 154,660 –
Tax allocation reserve –35,679 –8,207
Profit before tax 148,560 106,128
Income tax expense 9 –23,826 –24,168Net profit for the year 124,734 81,960
Attributed to the Shareholders of the parent company 124,734 81,960

Hoist Kredit AB (publ) Annual report 201418
Financial statements
Parent company statement of comprehensive incomeSEK thousand 2014 2013
Net profit for the period 124,734 81,960
Other comprehensive income
Items that may be subsequently reclassified to the profit and lossCurrency translation differences on foreign operations 602 270
Total items that may be reclassified subsequently to the profit and loss 602 270
Other comprehensive income for the year 602 270
Total comprehensive income for the year 125,336 82,230
Attributable to
Shareholders of the Parent Company 125,336 82,230
Hoist Kredit AB (publ) Annual report 2014 19
Financial statements
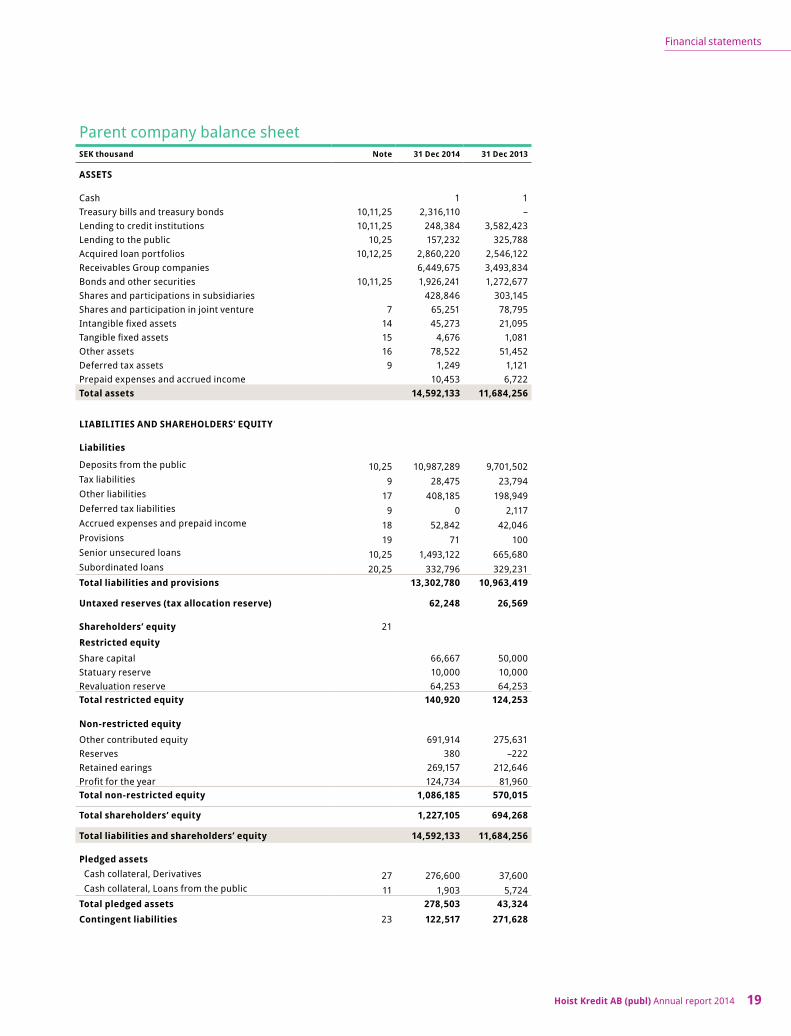
Parent company balance sheetSEK thousand Note 31 Dec 2014 31 Dec 2013
ASSETS
Cash 1 1Treasury bills and treasury bonds 10,11,25 2,316,110 –Lending to credit institutions 10,11,25 248,384 3,582,423Lending to the public 10,25 157,232 325,788Acquired loan portfolios 10,12,25 2,860,220 2,546,122Receivables Group companies 6,449,675 3,493,834Bonds and other securities 10,11,25 1,926,241 1,272,677Shares and participations in subsidiaries 428,846 303,145Shares and participation in joint venture 7 65,251 78,795Intangible fixed assets 14 45,273 21,095Tangible fixed assets 15 4,676 1,081Other assets 16 78,522 51,452Deferred tax assets 9 1,249 1,121Prepaid expenses and accrued income 10,453 6,722Total assets 14,592,133 11,684,256
LIABILITIES AND SHAREHOLDERS’ EQUITY
Liabilities
Deposits from the public 10,25 10,987,289 9,701,502Tax liabilities 9 28,475 23,794Other liabilities 17 408,185 198,949Deferred tax liabilities 9 0 2,117Accrued expenses and prepaid income 18 52,842 42,046Provisions 19 71 100Senior unsecured loans 10,25 1,493,122 665,680Subordinated loans 20,25 332,796 329,231Total liabilities and provisions 13,302,780 10,963,419
Untaxed reserves (tax allocation reserve) 62,248 26,569
Shareholders’ equity 21
Restricted equity
Share capital 66,667 50,000Statuary reserve 10,000 10,000Revaluation reserve 64,253 64,253Total restricted equity 140,920 124,253
Non-restricted equity
Other contributed equity 691,914 275,631Reserves 380 –222Retained earings 269,157 212,646Profit for the year 124,734 81,960Total non-restricted equity 1,086,185 570,015
Total shareholders’ equity 1,227,105 694,268
Total liabilities and shareholders’ equity 14,592,133 11,684,256
Pledged assets Cash collateral, Derivatives 27 276,600 37,600 Cash collateral, Loans from the public 11 1,903 5,724Total pledged assets 278,503 43,324Contingent liabilities 23 122,517 271,628

Hoist Kredit AB (publ) Annual report 201420
Financial statements
Statement of changes in shareholders’ equity, parent companyRestricted equity Unrestricted equity
SEK thousand Share capitalStatutory reserves
Revaluation reserve
ReservesTranslation
reserve
Other contributed
equityRetained earnings
Result for the year2
Total shareholder’s
equity
Opening balance 1 Jan 2014 50,000 10,000 64,253 –222 275,631 212,646 81,960 694,268
Reclassification of result for the previous year 81,960 –81,960
Comprehensive income for the year
Net profit for the year 124,734 124,734
Other comprehensive income 602 602
Total comprehensive income for the year 602 124,734 125,336
Transactions recorded directly in equity
New share issue 16,667 416,295 432,962
Conversion of convertible bond –100,000 –100,000
Shareholder contributions 99,988 99,988
Interest paid on capital contribution –28,750 –28,750
Tax effect on items recorded directly in equity 3,301 3,301
Total transactions recorded directly in equity 16,667 416,283 –25,449 407,501
Closing balance 31 Dec 2014 66,667 10,000 64,253 380 691,914 269,157 124,734 1,227,105
Restricted equity Unrestricted equity
SEK thousand Share capitalStatutory reserves
Revaluation reserve
ReservesTranslation
reserve
Other contributed
equityRetained earnings
Result for the year2)
Total shareholder’s
equity
Opening balance 1 Jan 2013 50,000 10,000 – –492 181,091 296,823 –22,207 515,215
Reclassification of result for the previous year –22,207 22,207
Comprehensive income for the yearNet profit for the year 81,960 81,960
Other comprehensive income 64,253 270 64,523Total comprehensive income for the year 64,253 270 81,960 146,483
Transactions recorded directly in equity
Capital contributions 93 0001) 93,000
Interest paid on capital contribution –25,073 –25,073
Group contributions –50,145 –50,145
Tax effect on items recorded directly in equity 1,540 13,248 14,788
Total transactions recorded directly in equity 94,540 –61,970 32,570
Closing balance 31 Dec 2013 50,000 10,000 64,253 –222 275,631 212,646 81,960 694,268
1) Nominal amount of SEK 100,000 thousand has been reduced by transaction costs.

Hoist Kredit AB (publ) Annual report 2014 21
Financial statements
Parent company cash flow statementSEK thousand 2014 2013
OPERATING ACTIVITIESCash flow from gross cash collection 972,718 875,817
Interest income 333,550 230,859
Other operating income 95,368 28,895
Interest expense –274,605 –194,867
Operating expenses –351,172 –263,097
Net cash flow from financial transactions –10,620 –10,435
Capital gain on redemption of certificates in joint venture 27,941 16,481
Income tax paid –28,819 –3,597
Total 764,361 680,056
Increase/decrease in acquired loan portfolios incl. changes in valuation –994,589 –648,708
Increase/decrease in certificates in joint venture 13,544 11,697
Increase/decrease in lending to the public –2,787,285 –2,214,718
Increase/decrease in deposits from the public 1,215,800 3,288,496
Increase/decrease in other assets 103,659 37,635
Increase/decrease in other liabilities 200,689 –27,242
Changes in other balance sheet items 373 229
Total –2,247,809 447,389
Cash flow from operating activities –1,483,448 1,127,445
INVESTING ACTIVITIESInvestments in intangible fixed assets –29,477 –14,291
Investments in tangible fixed assets –4,155 –338
Investments/divestments of bonds and other securities –653,564 –539,254
Acquisitions in subsidiaries –117,152 48,147
Cash flow from investing activities –804,348 –505,736
FINANCING ACTIVITIESCapital contribution 99,988 93,000New share issue 332,962 –
Paid-in premium for warrants 831,007 665,680
Issued loans – 329,231
Issued subordinated loans – –45,900
Paid interest on capital contribution –28,750 –25,073
Dividend 34,660 –
Cash flow from financing activities 1,269,867 1,016,938
Cash flow for the year –1,017,929 1,638,647Cash at the beginning of the year 3,582,424 1,943,777
Cash at the end of the year1) 2,564,495 3,582,424
1) Consists of cash, treasury bills/bonds and lending to credit institutions.

Hoist Kredit AB (publ) Annual report 201422
Accounting principles
1 Corporate InformationThese financial statements as of 31 December 2014 presents Hoist Kredit AB (publ), 556329-5699. The company is a Swedish limited company, registered in Stockholm, Sweden. The address of the head office is Box 7848, 103 99 Stockholm. The Group is licenced and supervised by the Swedish Financial Supervisory Authority (Finansinspektionen). Hoist Kredit AB (publ) is a fully owned subsidiary to Hoist International AB (publ) 556012-8489.
The consolidated accounts for the financial year 2014 were approved by the Board of Directors on 30 March and will be presented for adoption at the 2014 Annual General Meeting on 30 March 2015.
2 Statement of complianceThe Group’s consolidated accounts have been prepared in accordance with the International Financial Reporting Standards (IFRS) issued by the International Accounting Standard Board (IASB) and interpretation of the IFRS Interpretation Committee as adopted by the EU.
In addition, the Swedish Annual Accounts Act for Credit Institutions and Securities Companies (1995:1559), the accounting regulations of the Swedish Financial Supervisory Authority (FFFS 2008:25), the RFR 1 “Additional rules for Group Accounting” and the supplementary UFR statements have been applied.
The Parent Company applies the same accounting policies as the Group except in the cases where the application of IFRS for legal entities is not permitted by Swedish Accounting regulations. Please refer to the section below concerning the accounting principles for the Parent Company.
3 Changed accounting policies and amendments from prior periods
New and amended standards adopted in the financial statements The accounting policies, basis for calculations and presentation are, in all material aspects, unchanged in comparison with the 2013 financial statement, apart from IFRS 10, 11, 12.
Hoist Kredit has applied the new standard IFRS 10 Consolidated Financial Statements as from 1 January 2014, with no impact on the financial statements.
The Swedish Financial Supervisory Authority has in addition issued amendments to FFFS 2008:25 in FFFS 2013:24 and 2014:18, and the Swedish
Financial Reporting Board has issued amendments to the Supplementary Accounting Rules for Groups (RFR1).
These amendments were implemented as of 1 January 2014 except for the amendments in FFFS 2014:18 that were implemented in August 2014. The amendments in FFFS 2014:18 require changed capital adequacy disclosures (presented in Note 28 “Capital adequacy”), and certain addi-tional requirement of disclosure per country in the consolidation. The amendments in FFFS 2013:24 and in RFR 1 have not had any significant impact on the financial statements.
IFRS 11 ”Joint Arrangements” is applied as of 1 January 2014. It outlines the accounting by entities that jointly control an arrangement. Joint control involves the contractually agreed sharing of control and arrangements subject to joint control are classified either as joint venture or joint arrangement. The assessment is based on the structure of the investment, the legal form and other circumstances. According to pre-vious regulation the assessment was only based on the structure of the investment. In addition, IFRS 11 stipulates that for joint ventures, only the equity method is allowed.
The company has a joint arrangement classified as a joint venture. This is already accounted for according to the equity method in previous periods.
IFRS 12 “Disclosure of Interests in other Entities” has not had any impact on the financials, however, it is expected to add more disclosures for subsidiaries, joint arrangements, associates and unconsolidated “structured entities”. The new standard requires more disclosure on: the nature of the interest in another entity;
assumptions and judgements in determining the nature of its interest in another entity or arrangement;
the risks associated with the entity’s interest in other entities; effects of those interests on the entity’s financial position and financial
performance and cash flows.There are no other changes in accounting policies which have had a significant impact on the financial reporting in the Group or the Parent company.
Commission income previously accounted for as Other income is reclassified to Fee and commission income.
Fees to the Deposit Guarantee Scheme previously accounted for as Other operating expenses, are not shown under Interest expense.
Accounting Principles
1 Corporate information 2 Statement of Compliance 3 Changed accounting policies and amendments from prior periods 4 New standards, amendments and interpretation issued but not
effective for the financial year beginning on 1 January 2015, and not yet adopted
5 Assumptions 6 Consolidation 7 Segment reporting 8 Foreign Currency translation 9 Financial assets and liabilities10 Hedge accounting11 Leasing12 Intangible fixed assets
13 Tangible fixed assets 14 Provisions15 Income and expenses16 Staff costs17 Taxes18 Equity19 Related party transactions20 Cash flow statement21 Parent company Accounting Policies21.1 Group contributions and dividend21.2 Subsidiaries21.3 Untaxed reserves

Hoist Kredit AB (publ) Annual report 2014 23
Accounting principles
Intra-group invoicing to Hoist Finance AB (publ) previously reported gross, are now reported net.
4 New standards, amendments and interpretation issued but not effective for the financial year beginning on 1 January 2015 and not yet adopted
A number of new or amended IFRS standards will be endorsed during the coming financial year and have not been applied at the issuance of these financial statements. News and amendments with future application will not be subject to early application.
IFRS 9 Financial instruments will replace IAS 39 Financial instruments: Recognition and Measurement. IASB has through IFRS 9 issued a package of improvements of the accounting of financial instrument.
The package of improvements includes a new logical model for classification and measurement of financial instruments, a single, forward-looking ‘expected loss’ impairment model and a substantially-reformed approach to hedge accounting.
The IFRS 9 will come into effect on 1 January 2018 with early application permitted. The EU plans to endorse the standard during 2015.
The company has not yet assessed the impact on the financial statement of the new standard.
IFRS 15 was issued in May 2014 and applies to an annual reporting period beginning on or after 1 January 2017.IFRS 15 ”Revenue from Contracts with Cus-tomers”. The purpose of the new standard is to have a single, principles based model to be applied to all contracts with customers in all business sectors. The standard is to replace current revenue standards and interpretations.
Business sectors which most possibly will be effected are telecom, software, property, aerospace, defence, building and construction and contract manufacturing. All companies will, however, be affected of the new exten-sive disclosure requirements. There are three alternative ways to adopt the new standard; the full retrospective approach, the partial retrospective approach or the cumulative effect approach, which requires adjusting retained earnings as per 1 January 2017 for contracts under the old standard (IAS 11/IAS 18).
The standard should be applied in an entity’s IFRS financial statements for annual reporting periods beginning on or after 1 Janu-ary 2017. Earlier application is permitted, sub-ject to EU endorsement. The EU endorsement is expected during the second quarter 2015.
The IASB has issued the IFRIC 21 ”Levies” which includes guidance on debt accounting within IAS 37 ”Provisions, Contingent Liabilities and Contingent Assets and has been endorsed by the EU . The interpretation are effective for annual periods beginning on or after 17 June 2014, and clarifies that the company should recognise a liability for the levy at the end of the year, only given that the company conducts banking activities at the end of the year.
The assessment is that the new interpre-tation will not have any significant impact on the financial statements of Hoist Kredit nor the capital adequacy.
There are no other interpretations of IFRS or IFRIC not yet applied which will have a signif-icant impact on the Group.
5 AssumptionThe preparation of financial reports in accor-dance with IFRS requires the Management to make estimates and assumptions that affect
the application of the accounting principles and the carrying values of assets, liabilities, revenue and expenses. Estimates and assump-tions are based on historical experience and a number of other factors that under current circumstances seem reasonable. The result of these estimates and assumptions is then used to determine the carrying value of assets and liabilities that otherwise is not clearly indicated by other sources. Actual outcomes may deviate from these estimates and assumptions.
Estimates and assumptions are reviewed regularly, and the effect on carrying values is recognised through profit or loss. Changes in estimates are reported in the period in which the change is made, provided it has affected only this period, or the period the change was made and future periods if the change affects both current and future periods.
Estimates made by the Management that have a significant impact on the consolidated financial statements and which could affect the consolidated financial statements in sub-sequent years, are described in more detail in Note 29.
6 ConsolidationSubsidiariesSubsidiaries are all entities over which the Parent Company has the power to govern the financial and operating policies. Control is when the Parent Company has control over an investment, is exposed to or has the right to receive variable return on the engagement and is in the position to govern the engagement to decide on the return. When assessing the power to govern, the potential voting rights are taken into account and if de facto control is applicable.
The Group uses the acquisition method of accounting to account for business acqui-sitions. The Group-wide acquisition value is established in an acquisition analysis in connection with the acquisition. The analysis states both, the acquired identifiable assets and acquired liabilities, as well as contingent liabilities. The acquisition value of the shares in subsidiaries and business operations are determined by the fair values as of the acquisi-tion date for the assets, arising or transferred liabilities and issued equity instruments that have been transferred as consideration in exchange for the acquired net assets. The transaction costs that are directly attributable to the acquisition are directly expensed as incurred. In business acquisitions where the acquisition cost exceeds the net value of the acquired assets and liabilities as well as any possible contingent liabilities, the difference is accounted for as goodwill. When the difference is negative, it is directly recognised in the profit or loss. In the consolidated accounts the contingent acquisition price is recognised at fair value with the change in value over profit or loss.
Other amendments in classificationIn comparancy with the Financial Statements for 2013, the following re-classifications have been made.
GROUP
SEK thousand
2013 in 2013 Financial
Statements
Adjustment Deposit
Guarantee Scheme
Adjustment fee and
commission income
Adjustment Intra-group
invoicing
2013 in 2014 Financial
Statements
Interest expense –250,778 –8,642 –259,420
Fee and commission income 120,854 28,288 149,142
Other income 142,821 –28,288 –98,182 16,351
Other operating expense –645,494 8,642 98,182 –538,670
GROUP
SEK thousand
2013 in 2013 Financial
Statements
Adjustment Deposit
Guarantee Scheme
2013 in 2014 Financial
Statements
Interest expense –252,051 –8,642 –260,692
Other operating expense –226,115 8,642 –217,473

Hoist Kredit AB (publ) Annual report 201424
Accounting principles
Intra-Group receivables and liabilities, revenue and expenses, and unrealised gains and losses that arise from transactions within the Group are eliminated in their entirety in the consolidated financial statements.
Joint venturesFrom an accounting point of view joint ventures are entities where the group has joint control through contractual arrangements with one or several parties, has jointly control where the group has the right to the net assets instead of directly rights to assets and obligation to liabili-ties. In the consolidated accounts the joint venture is accounted for in accordance with the equity method. According to the equity method, the asset is initially accounted for at its acquisition value. The carrying value is increased or decreased subsequently to reflect the profit share in the investment for the owner company. Changes attributable to foreign exchange gains or losses are recognised in other comprehensive income. In the joint venture BEST III Sec Fund the portfolios are recognised at fair value.
7 Segment reportingAn operating segment is part of the Group identified on a separate basis and which can generate income and incur cost and which presents its own isolated financial reports. The segment reporting serves as a gov-ernance tool and is reviewed on a regularly basis by the chief operating decision makers in order to assess their performance and allocate resources to the segment.
For Hoist Kredit the primary segment is geographical and the geo-graphical areas are different countries as well as a set of comparable countries. The geographical segment mirrors the business activities as the portfolios are acquired on a country by country basis. In the context of defining the segments the Company’s executive management is the Chief operating decision maker. See note 1 for more information.
8 Foreign currency translationFunctional currencyThe functional currency of the Parent Company is SEK which is also the presentation currency of the Group as well as the Parent Company. Group companies prepare their accounts in the local functional currency in the country where they have their operations. All transactions in other currencies are converted into SEK at Balance Sheet day for consolidation purposes. All amounts, unless indicated otherwise, are rounded off to the nearest thousand.
Transactions in foreign currencyTransactions in a currency other than the local functional currency are recognised at the exchange rate in effect on the transaction day. When such transactions are offset or settled, the exchange rate may devi-ate from the one that applied on the transaction day, in which case a realised exchange rate difference arises. Moreover, monetary assets and liabilities in foreign currency are translated at the exchange rates on each balance sheet date, due to which an unrealised exchange rate difference arises. Both realised and unrealised exchange rate differences of this type are recognised in the consolidated income statement.
Translation of the financial statements of foreign operations Assets and liabilities in foreign operations, including goodwill and other Group surplus and deficit values, are translated from the functional currency of the operations to the Group’s reporting currency, at the exchange rate on the balance sheet date. Revenues and expenses are translated at the yearly average rate, which serves as an approximation of the rate that was applied on each transaction date.
Translation differences arise in the translation of subsidiary accounts in part because the balance sheet date rate changes each period and in part because the average rate deviates from balance sheet date rate. Translation differences are recognised in other comprehensive income as a separate component of equity.
9 Financial assets and liabilities Recognition and derecognition on the balance sheetFinancial assets of liabilities are recognised on the balance sheet when the company becomes a party to the contractual provisions of the instru-ment. A receivable is recognised on the balance sheet when the company is contractually liable to pay, although an invoice has not been sent.
Receivables, deposits and issued securities as well as subordinated loans are recognised on the balance sheet at the settlement day. An acquisition or sale at sight of financial assets is recognised and with-drawn from the financial report on the trade day.
A financial asset is withdrawn from the balance sheet when the con-tractual rights to the cash flow from the financial asset cease, or at the transfer of the financial asset and the company simultaneously transfer the risks and advantages which are connected to the ownership of the financial asset. Financial liabilities, or part of a liability, are derecognised when extinguished, that is, when the obligation is discharged, cancelled or expired.
An exchange between the company and an existing lender or between the company and an existing borrower of instruments with different terms and conditions, are recognised as extinguished of the old financial liability or asset, respectively, and a new financial instrument.
Financial assets and liabilities are offset and the net amount reported in the balance sheet when there is a legal right to offset transactions and an intention to settle net or realise the asset and settle the liability simultaneously.
Recognition and measurementFinancial instruments are recognised on the balance sheet and are mea-sured at fair value on initial recognition. Transaction costs are included in the fair value on initial recognition except for derivatives and instru-ments in the category financial assets designated at fair value through profit or loss where transaction costs are expensed in profit or loss.
Financial instruments are initially recognised partly based upon the purpose of the acquisition of the instrument, partly depending on the alternatives in IAS 39.
The classification of financial instruments is based on the initial recogni-tion described below.
Financial assets and liabilities at fair value through profit or loss Financial assets at fair value through profit or loss consist of financial assets classified as held for trading, derivatives held for trading unless designated as hedging instruments, treasury bills and treasury bonds (held for trading) and loan portfolios acquired prior to 1 July 2011, which upon initial recognition was measured at fair value through profit or loss.
Financial liabilities at fair value through profit or loss consist of deriva-tives held for trading unless designated as hedging instruments.
Loan portfolios acquired thereafter are classified as loans and receiv-ables measured at amortised cost (see below).
The difference between a valuation at ”fair value” and ”at amortised cost” of acquired loan portfolios is that the former uses a IRR which cor-responds to the market expectations for similar assets at a given time.
Derivatives are initially measured at fair value at the date of the agreement, and are subsequently measured at fair value as per the bal-ance sheet date. Derivatives are always recognised as held for trading, as long as they are not identified as hedge instruments.
All changes in fair values in financial assets and liabilities at fair value through profit or loss, are recognized in the income statement in the item “Net income from financial transactions”, except for acquired loan portfo-lios where the revaluations are recognized in the item “Net revenue from acquired loan portfolios”.
Financial assets available for saleInvestments in equity instruments without a quoted market price in an active market and which fair value cannot be reliably measured are measured at cost, and when applicable net of impairment.
Hoist Kredit AB (publ) Annual report 2014 25
Accounting principles
Determination of fair value of financial instrumentsFair value on financial instruments traded on an actively traded market (level 1), defined as financial assets are based on quoted market price. The assets valued at fair value in the balance sheet, and traded on an actively traded market, consist of investments in bonds and other secu-rities.
Financial instruments, not traded on an actively traded market, are valued based on other valuation techniques where all important indata is directly or indirectly observable in the market (level 2) are currencies and interest derivatives. When assets and liabilities have counteracting mar-ket risks the midmarket price is used to set the fair value. See Note 25.
Loans and receivablesLoans and receivables are non-derivative financial assets with fixed or determinable payments that are not quoted in an active market. Loans and receivables are valued at amortised cost by using the effective rate method, where the carrying value of each acquired loan portfolio corre-sponds to the present value of all projected future cash flows discounted by an initial effective interest rate determined on the date the portfolio was acquired, based on the relation between cost and the projected future cash flows on the acquisition date. Changes in the carrying value of the acquired loan portfolios are comprised of amortisation for the period and are recognised in the income statement. In connection with the purchase of each loan portfolio, a projection is made of the portfo-lio’s cash flows. Projected cash flows include the loan amount and other related fees based on a probability assessment, which are expected to be received from debtors, less forecasted collection costs.
Balance sheet items that are classified as loans and receivables refer to lending to credit institutions, lending to the public and acquired loan portfolios (except the acquired loan portfolios that were acquired prior to 1 July 2011) as well as other assets except derivatives with a positive value.
Acquired loan portfolios consist of portfolios that have been acquired at a discount relative to the capital claim corresponding to a discounted value of expected net collections.
For portfolios recognised at amortised cost an initial IRR is set, based on the acquisition value, including transaction costs, and the initial esti-mated future cash collection. This initial IRR is used for calculating the cash collections during a ten year period.
Based on the updated estimated future cash collection and the initial IRR, a new carrying value as at balance sheet date is calculated for the portfolios. The net cash collection on the portfolios is monitored con-tinuously during the year and updated regularly based on, for instance achieved collection results, agreements with debtors on instalment plans. The variance is recognised either under Net revenue form acquired loans in the income statement and in a note to the financial statements.
Impairments are recognised net together with revaluations in the income statements. Consequently, no provision is recognized in the balance sheet.
Other liabilities The Group’s other liabilities comprise deposits and borrowings from the public as well as other liabilities in the consolidated balance sheet. Other liabilities are initially recognised at fair value including transaction costs that are directly attributable to the acquisition or issue of the liability. Subsequent to acquisition, they are carried at amortised cost according to the effective rate method. Liabilities to credit institutions, short-term liabilities and other liabilities are reported as other financial liabilities. Long-term liabilities have an expected maturity exceeding one year and short-term liabilities have a maturity of less than one year. Financial liabilities at fair value through profit or loss, include financial liabilities held for trading (derivatives).
Unidentified income and receivablesThe Group receives large volumes of payments from debtors for own use and its clients. There are instances where the sender’s reference informa-
tion is missing or incorrect which makes it difficult to allocate the payment to the right case. There are also situations where payments are received on closed cases. In such instances a reasonable search and attempt is made to contact the payment sender. The unidentified payments are treated as other liabilities. When reasonable search of the payer is failing, the payment is recognised as revenue after five years.
10 Hedge accountingDerivatives may be used to hedge (purpose to neutralise) interest- and exchange rate exposures in the Parent company or in the Group.
Hedge accounting is applied to derivatives to reduce currency risk of a net investment in a foreign operation. When hedge accounting is applied on foreign net investments, and derivative utilised is adequately effective to 80–125% when assessed retrospectively, the changes in fair values on the derivatives are recognised in other comprehensive income and are accumulated in (as well as translation effect of net investments) the equity reserve “Translation of foreign operations”.
Provided that the hedge is effective to 101–125%, the inefficiency in recognised in the income statement in the item “Net result from financial transactions”. For derivatives, not used for hedging, any changes in fair value are recognised in the item “Net result from financial transactions”.
11 LeasingLeases in which a significant portion of the risks and rewards of ownership are retained by the lessor are classified as operating leases. Payments made under operating leases (net of any incentives received from the les-sor) are charged to the income statements, on a straight line basis over the period of the lease. Operating leasing is mainly related to office premises contracts and office equipment contracts normal to the business.
Leases in which a significant portion of the risks and rewards of ownership are retained by the Group are classified as financial leases. Finance leases are recognized as assets and liabilities on the balance sheet at the amount equal to the fair value, or if lower, the present value of the minimum lease payments of the leased assets at the inception of the lease. Lease payments are apportioned between finance charge and reduction of the outstanding liability. The finance charge is allocated to periods during the lease term so as remaining balance of the liability for each period. The depreciation policy is consistent with that of the assets in own use.
12 Intangible fixed assetsCapitalised expenses for IT development Expenditures for IT development and maintenance are generally expensed as incurred. Expenditures for software development that can be attributed to identifiable assets under the Group’s control and with anticipated future economic benefits are capitalised and recognised as intangible assets.
Additional expenditures for previously developed software etc. are recognised as assets in the consolidated balance sheet if they increase the future economic benefits of the specific asset to which they are attributable, e.g, by improving or extending a computer program’s func-tionality beyond its original use and estimated period of use.
IT development costs that are recognised as intangible assets are amortised using the straight-line method over their useful lives, though not more than five years. The asset is recognised at cost less accumulated amortisation and impairment losses. Costs associated with the main-tenance of existing computer software are continuously expensed as incurred.
GoodwillWhen the purchase price, any non-controlling interest and fair value at the acquisition date of previous shareholdings exceed the fair value of identifiable net assets acquired, the exceeding amount is recorded as goodwill. Goodwill from acquisitions of subsidiaries is recorded as intangible assets. Goodwill is tested annually, or when there is an indi-

Hoist Kredit AB (publ) Annual report 201426
Accounting principles
cation for impairment and carried at cost less accumulated impairment losses. Impairment losses on goodwill are not reversed. Profit or loss on disposal of an entity includes the remaining carrying amount of goodwill relating to the entity sold. Goodwill is allocated to cash generating units (”CGU”) for the purpose of impairment testing. The allocation is made to the cash generating units, or groups of cash generating units, determined in accordance with the Group’s operating segments, expected to benefit from the business combination in which the goodwill arose.
Other intangible assetsOther intangible fixed assets are amortised on a straight-line basis over their estimated period of use.
ImpairmentsThe carrying value of the Group’s tangible and intangible fixed assets is tested at each balance sheet date for indications of decrease in value. If there are any indications of necessary impairments, the recoverable value of the asset is estimated. Goodwill and other intangible fixed assets with indeterminate periods of use and intangible fixed assets that have not yet come into use, have their recoverable values estimated on an annual basis. If essentially independent cash flows cannot be isolated for individual assets, the assets are grouped at the lowest level where essentially independent cash flows can be identified – a cash-generating unit (CGU).
An impairment is recognised when the carrying value of an asset or a cash generating unit exceeds its recoverable value. The impairment is recognised in the income statement. Impairments that are attributable to a cash generating unit are primarily allocated to goodwill and subse-quently distributed proportionally among other assets in the unit.
The recoverable value for cash generating units is the higher of the carrying value less divestment costs and the value in use. The value in use is calculated by discounting future cash flows using a discount rate that takes into account the risk-free interest rate and the risk that is associated to that particular asset.
Goodwill impairment is not reversed. Impairment of other assets is reversed if there have been changes in the underlying assumptions that were used for the establishment of the recoverable value. Impairments are reversed only to the extent that the carrying value of the assets fol-lowing the reversal does not exceed the carrying value of the assets in the case the impairment had not been reported.
13 Tangible fixed assets Tangible fixed assets consist of IT equipment, improvements in rented premises and equipment. Tangible fixed assets are recognised as an asset in the balance sheet if it is likely that the future economic benefits will accrue to the Company and the cost of the asset can be reliably estimated. Tangible fixed assets are recognised at cost less accumulated depreciation and impairments.
Principles for depreciation/amortisation of assets Depreciation/amortisation is carried out according to the straight-line method over the estimated useful life of the asset. The following depreci-ation/ amortisation periods are applied: Equipment 2–5 years Investments in rented premises 5 years Intangible fixed assets 3–5 years
14 ProvisionsProvisions are recognised for present obligations arising as consequences of past events where it is more likely than not that a transfer of economic benefit will be necessary to settle the obligation, and it can be reliably estimated.
The amount recognised as an assumption corresponds to the best esti-mate of the expenditure required to settle the obligation at the balance sheet date. The expected future date of the settlement is taken into account in the estimate.
15 Income and expensesNet revenue from acquired loansRevenue from acquired loan portfolios is recognised under ”Net revenue from acquired loan portfolios” in the income statement.
As net revenue from acquired loan portfolio the following items are included; (i) the unwinding effect of the discount rate, (ii) adjustments of future expectations of cash-flows, (iii) the effect of actual cash-flows deviating from expected cash-flows and. Income from acquired loan portfolios measured at amortised cost are included in (ii) and (iii).
For the acquired loan portfolios measured at amortised cost the IRR remains constant when a projected cash flow curve is determined. Con-sequently, revaluation effects only occur when the projected cash flow curves are adjusted in arrears.
Interest IncomeInterest income in the income statement is recognised partly under “Net revenue from acquired loan portfolios”, partly under “Interest income” and are disclosed in a note.
Net revenue from acquired loan portfolios consists of interest income accounted for based on the effective discount rate and payments received on acquired loan portfolios, which can both exceed and be less than the forecasted amounts.
The interest income arising from acquired loan portfolios valued at amortised cost contains interest income arising from the effective rate method, using the initial IRR. Other interest income is generated from lending to credit institutions and to the public, as well as bond invest-ments.
Interest expenseInterest expense consists mainly of costs related to the funding of the Group through deposits from the public.
Fee and commission incomeFee and commission income relates to services rendered to external customer for collection business. The fee and commission income is accounted for when incurred.
Net result from financial transactionsNet result from financial transactions include realised and unrealised exchange rate profit or losses, unrealized changes in value on assets and liabilities recognised as “Assets measured at fair value through profit or loss” (except acquired loan portfolios) and the inefficient part of hedge accounting.
Other operating expensesVarious types of costs directly related to the servicing of the acquired loan portfolios are gathered under “Other operating expenses”. Other operating expenses in the Group are mainly direct costs for external collection services. Fee and commission income relates to the income for external services and is recognised when the amount of fee and commis-sion can be reliably measured.
16 Staff costsShort term benefits Short term benefits consist mainly of fixed and variable salary. Both fixed and variable salaries are expensed in the period when the employees have performed services to the Company.

Hoist Kredit AB (publ) Annual report 2014 27
Accounting principles
Redundancy paymentsRedundancy payment which normally is paid when the employment is terminated prior to retirement or if the employee accepts an offer, and in addition, when the company recognises expenses for restructuring. The redundancy payment is expensed in the period Hoist Finance is liable to pay. Any payments after twelve months are recognized at net present value.
PensionsGroup companies operate various pension schemes. The schemes are generally funded through payments to insurance companies or trust-ee-administered funds, determined by periodic actuarial calculations.The Group has both defined benefit and defined contribution plans: Typically, defined benefit plans define an amount of pension benefit
that an employee will receive on retirement, usually dependent on one or several factors, such as age, years of service and compensation.
A defined contribution plan is a pension plan under which the Group pays fixed contributions into a separate entity. The Group has no legal or constructive obligations to pay further contributions if the fund does not hold sufficient assets to pay all employees the benefits relat-ing to employee service in the current and prior periods.
The liability recognised in the consolidated balance sheet in respect of the defined benefit pension plans is the present value of the defined benefit obligation as at the balance sheet date less the fair value of plan assets, adjusted for unrecognised past-service costs. The defined benefit obligation is calculated annually by independent actuaries using the projected unit credit method.
The present value of the defined benefit obligation is determined by discounting the estimated future cash outflows using interest rates of high-quality corporate bonds that are denominated in the currency in which the benefits will be paid, and that have terms to maturity approxi-mating to the terms of the related pension liability.
The net interest expense/income on the defined benefit pension obligation/asset is recognised in the result of the year under the financial net. The interest net is based on the discount rate used in calculating the net obligation, i.e. the interest on the obligation, plan assets and interest on effects of any asset restrictions. Other components are recognised in the net operating result.
Actuarial gains and losses arising from adjustments based on earlier experience and changes in actuarial assumptions are charged or credited to other comprehensive income in the consolidated statement of changes in shareholders’ equity in the period in which they arise.
Changes or reductions of a defined benefit plan are recognised at the earliest;a. when the change or reduction in the plan occurs;b. when the company recognises restructuring costs or redundancy costs.
Changes/reductions are recognised as staff cost directly in the net result of the year.
The special wage tax is part of the actuarial assumptions and is rec-ognised as part of the defined benefit obligation. The part of the special wage tax which is calculated based on the Pension obligation vesting Act in the legal entity, is recognised as an accrued cost instead of part of the defined benefit obligation.
Tax on returns from pension funds is expensed in the net result in the period the tax is referred to, consequently, it is not included in the pension liability. For funded pension plans the tax on returns from plan assets are recognised in other comprehensive income. For non-funded, or partly non-funded plans, the tax is included in the tax expense for the year.
For defined contribution plans, the Group pays contributions to publicly or privately administered pension insurance plans on a manda-tory, contractual or voluntary basis. The Group has no further payment obligations once the contributions have been paid. The contributions
are recognised as employee benefit expense when they fall due. Prepaid contributions are recognised as an asset to the extent that a cash refund or a reduction in the future payments is available.
17 TaxesCorporate taxes consist of current tax and deferred tax. Corporate taxes are recognised through profit or loss unless the underlying transaction is directly recognised in equity or other comprehensive income, in which case the related tax effect is also recognised in equity respectively other comprehensive income.Current tax is the tax paid or received for the current year, applying the tax rates that apply as at balance sheet date, including adjustments for current tax attributable to previous periods. Deferred income tax is calculated according to the balance sheet method based on temporary differences between the carrying value of assets and liabilities and their value for tax purposes. The following temporary differences are not taken into account: Temporary differences that arise in the initial reporting of goodwill. The initial reporting of assets and liabilities in a transaction other than
a business combination and which, at the time of the transaction, does not affect either the recognised or taxable result.
Temporary differences attributable to participations in subsidiaries and associated companies that are not expected to be reversed within the foreseeable future.
The valuation of deferred tax is based on how the carrying values of assets or liabilities are expected to be realised or settled. Deferred tax is calculated by applying the tax rates and tax rules that have been set, or essentially are set, as of the balance sheet date.
Deferred tax assets from deductible temporary differences and tax losses carried forward are only recognised if it is likely that they will be utilised within the foreseeable future. The value of deferred tax assets is reduced when they are utilised or when it is no longer considered likely to be utilised.
18 EquityWhen a financial instrument is issued in the Group it is recognised as a financial liability or as an equity instrument, in accordance with the financial content of the terms for the instrument. These instruments, or part of an instrument are recognized as a liability when the company has an irrevocable obligation to pay cash. Issued financial instruments where the company does not have an irrevocable obligation to pay cash on interest and nominal amount, is recognized as equity. Return to investors is accounted for as dividend in equity on equity instruments, and as interest expense in the result for the instruments classified as debt instruments.
DividendThe proposed dividends are recognised as a liability after having been approved by the Annual General Meeting.
19 Related party transactionsHoist Kredit defines related parties as: Shareholders with significant influence Subsidiaries Associated undertakings Joint ventures Key management personnel Other related parties
All transactions with related parties are made on an arm’s length basis.
Hoist Kredit AB (publ) Annual report 201428
Accounting principles
Shareholders with significant influenceShareholders with significant influence are shareholders that have the power to participate in the financial and operating decisions of Hoist Kredit but do not control these policies.
Subsidiaries and Joint venturesFor the definition of subsidiaries and joint venture, see section 6 ”Con-solidation”. Further information on the group undertakings is found in Note 13 “Group undertakings”. Group internal transactions between legal entities are performed according to arm’s length principles in confor-mity with OECD requirements. These transactions are eliminated in the consolidated accounts.
Key management personnel Key management personnel includes the following positions: The Board of Directors The Chief Executive Officer (CEO) The Excecutive Management Team (EMT)
For information about compensation, pensions and other transactions with key management personnel, see Note 5.
Other related partiesOther related parties comprise close family members to individuals in key management personnel. Other related parties also include compa-nies significantly influenced by key management personnel in the Hoist Kredit Group as well as companies significantly influenced by close family members to these key management personnel.
Information concerning transactions between Hoist Kredit and other related parties is found in Note 30 “Related party transactions”.
20 Cash flow statement The cash flow statement includes changes in the balance of cash and cash equivalents. The Group’s cash and cash equivalents consist of cash and lending to credit institutions. Cash flow is divided into cash flows from operating activities, investment activities and financing activities. Cash flow is reported using the direct method.
Cash flow from investing activities includes only actual disbursements for investments during the year. Foreign subsidiaries’ transactions are translated in the cash flow state-ment at the average exchange rate for the period. Acquired and divested subsidiaries are reported as cash flow from investing activities, net, after deducting cash and cash equivalents in the acquired or divested company.
21 Parent Company Accounting Policies
The Parent Company’s financial statements have been prepared in accordance with the Swedish Annual Accounts Act for Credit Institutions and Securities Companies (1995:1559), the accounting regulations of the Swedish Financial Supervisory Authority (FFFS 2008:25) and RFR 2 “Accounting for legal entities” issued by the Swedish Financial Reporting Board. RFR 2 requires the Parent Company to use the same accounting principles as for the Group, i.e. IFRS to the extent allowed by Swedish financial regulations. The differences between the accounting principles in the group and the parent company are stated below.
21.1 Group contributions and dividendGroup ContributionsHoist Kredit applies the main rule in RFR2 IAS 27.2. Group contributions received from group undertakings are recognized as dividend in the income statement. The net of group contributions paid or received for optimising the tax expense in the group is recognised as appropriation in the parent company.
DividendDividends paid to the shareholders of Hoist Kredit AB (publ) are recorded as a liability following the approval of the Annual General Meeting. Div-idends from group- and associated undertakings are recognized on the separate income line “Dividends”.
21.2 SubsidiariesThe investments are accounted for according to the acquisition cost method. Investments are carried at cost and only dividends are accounted for in the income statement. An impairment test is performed in accordance with IAS 36 “Impairments of assets” and write-downs are made when permanent decline in value is established.
Transaction costs are included in the carrying value of the subsidiary. In the consolidated accounts the transaction costs related to subsidiar-ies, are recognised in the net result when incurred.
Contingent acquisition prices are valued at the possibility of payment. Any deviation of the provision/receivable is reduced/added to the acqui-sition price.
Acquisitions at low price which corresponds to future expected losses and expenses are reversed during the periods when the losses and expenses incur. Acquisitions at low price incurred due to other factors are recognised as appropriation to the extent which does not exceed the fair value on acquired and identified non-monetary assets. The part which exceeds this amount is directly recognised as income. The part which does not exceed fair value of acquired and identified non-mone-tary assets is recognised as income systematically over a period of time which is based on the weighted remaining average usage period for the acquired identified depreciable assets. In the consolidated accounts, acquisitions at low price are accounted for in the net result.
21.3 Untaxed reservesIn the parent company, untaxed reserves are recognised as a separate item in the balance sheet. In the consolidated financial statements, untaxed reserves are reported in deferred tax liability and as part of equity.

Hoist Kredit AB (publ) Annual report 2014 29
Notes
Note 1 Segment reporting
Consolidated income statement
SEK thousand 2014 2013
Net revenues from acquired loan portfolios 1,398,291 1,008,317
Whereof gross cash collections 2,541,311 1,641,007 Whereof portfolio
amortisation and revaluation –1,143,020 –632,690
Interest income 90,961 158,568 Whereof interest income from run-off port-
folio of consumer loans 38,180 69,080 Whereof interest income excl. run-off loan
portfolio 52,780 89,488
Interest expense –344,917 –259,420
Net interest income 1,144,335 907,465
Fee and commission income 153,222 149,142
Net income from financial transactions –19,151 –4,581
Other income 18,057 16,351
Total operating income 1,296,463 1,068,377
General administrative expensesPersonnel expenses –473,200 –386,757
Other operating expenses –653,268 –538,670Depreciation and amortisation of tangible and intangible assets –23,520 –16,337
Total operating expenses –1,149,988 –941,764
Profit from share and participations in joint venture 58,662 36,406
Profit before tax 205,137 163,019
Operating income statement based on segment reporting
SEK thousand 2014 2013
Gross cash collections 2,541,311 1,641,007
Portfolio amortisation and revaluation –1,143,020 –632,690Interest income from run-offconsumer loan portfolio 38,180 69,080
Net revenue from acquired loans 1,436,471 1,077,397
Fee and commission income 153,222 149,142Profit from shares and participation in joint venture 58,662 36,406
Other income 18,057 16,351
Total revenue 1,666,412 1,279,296
Personnel expenses –473,200 –386,757
Other operating expenses –653,268 –538,670Depreciation and amortisation of tangible and intangible fixed assets –23,520 –16,337
Total operating expenses –1,149,988 –941,764
EBIT 516,424 337,532
Interest income excl. run-off portfolio of consumer loans 52,781 89,488
Interest expense –344,917 –259,420
Net income from financial transactions –19,151 –4,581
Total financial items –311,287 –174,513
Profit before tax 205,137 163,019
Segment reporting has been prepared to reflect how the executive management monitors operations, which is different from the statutory accounts. The material differences are as follows:• Revenueincludesincomefrom: − acquired loan portfolios; − run-off portfolio of consumer loans; − fee and commission income from third parties; –profit from shares and participations in joint venture; − certain other income.• Totalfinancialitemsincludeinterestincomefromothersources
than acquired loans, interest expense and net income from finan-cial transactions.
Group expenses containing central and supporting functions are not allocated to the operating segments but reported as Central functions and Eliminations.
A financing cost is allocated to the operating segments based on the acquired loan assets. The difference between the actual financing cost and the standardised cost is included in Central functions and Eliminations.
With respect to the balance sheet, only acquired loan portfolios are monitored, while other assets and liabilities are not monitored on a segment-by-segment basis. These items are of minor importance.

Hoist Kredit AB (publ) Annual report 201430
Notes
Income statement 2014
SEK thousand
Belgium, the Netherlands
and France UK Italy PolandGermany and
Austria
Central functions and
eliminations Group
Gross cash collections 733,474 527,346 260,828 295,619 724,044 0 2,541,311Portfolio amortisation andrevaluation –484,991 –200,802 –91,324 –17,030 –348,873 0 –1,143,020Interest income from run-offconsumer loan portfolio 0 0 0 0 38,180 0 38,180
Net revenue from acquiredloans 248,483 326,544 169,504 278,589 413,351 0 1,436,471Fee and commission income 6,989 128,344 0 0 17,889 0 153,222Profit from shares and participation in joint venture 0 0 0 0 0 58,662 58,662Other income 218 2,686 311 0 14,294 548 18,057
Total revenue 255,690 457,574 169,815 278,589 445,534 59,210 1,666,412
Personnel expenses –86,886 –134,502 –17,854 –2,035 –149,805 –82,118 –473,200Other operating expenses –102,656 –137,601 –86,026 –74,812 –95,259 –156,914 –653,268Depreciation and amortisation of tangible and intangible fixed assets –4,679 –4,588 –2,340 0 –5,951 –5,962 –23,520
Total operating expenses –194,221 –276,691 –106,220 –76,847 –251,015 –244,994 –1,149,988
EBIT 61,469 180,883 63,595 201,742 194,519 –185,784 516,424
Interest income excl. run-off portfolio of consumer loans 170 241 1 1 96 52,272 52,781Interest expense –90 –179 –2 0 –754 –343,892 –344,917Net income from financialtransactions –100,481 –72,627 –25,292 –52,232 –105,135 336,616 –19,151Total financial items –100,401 –72,565 –25,293 –52,231 –105,793 44,996 –311,287
Profit before tax –38,932 108,318 38,302 149,511 88,726 –140,788 205,137
Total revenue for the Netherlands of SEK 199,747 thousand is included in the revenue for Belgium, Netherlands and France.Total revenue for Germany of SEK 437,105 thousand is included in the revenue for Germany and Austria.
Note 1 Segment reporting, continued
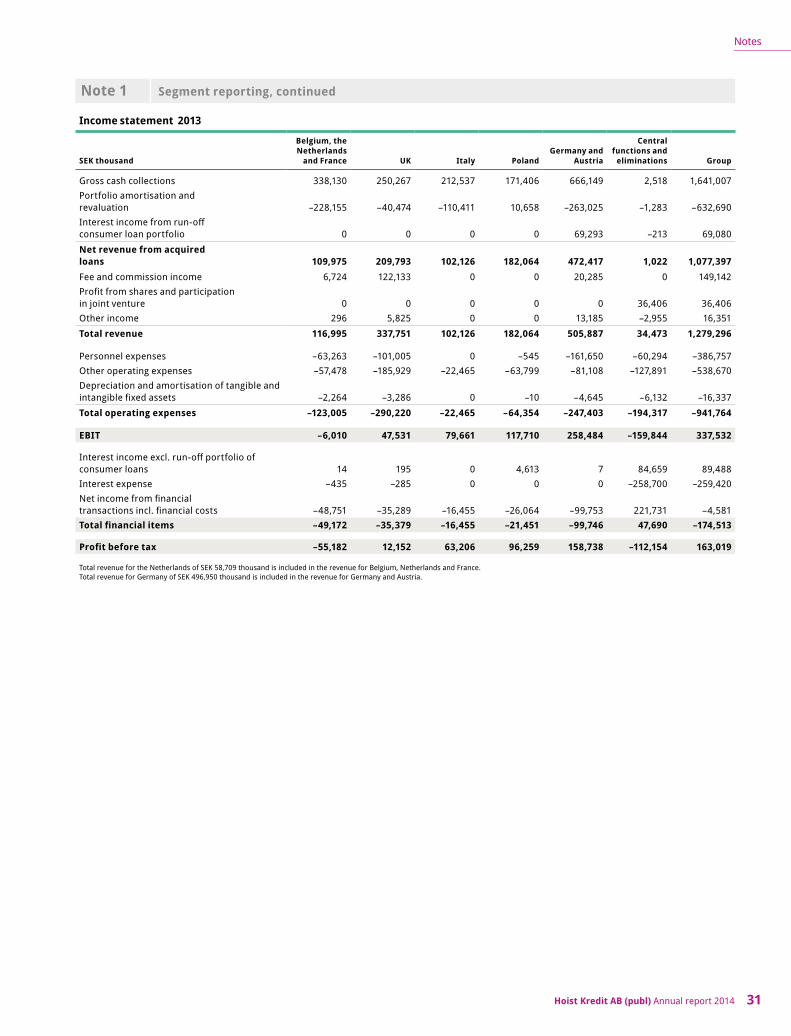
Hoist Kredit AB (publ) Annual report 2014 31
Notes
Income statement 2013
SEK thousand
Belgium, the Netherlands
and France UK Italy PolandGermany and
Austria
Central functions and
eliminations Group
Gross cash collections 338,130 250,267 212,537 171,406 666,149 2,518 1,641,007Portfolio amortisation andrevaluation –228,155 –40,474 –110,411 10,658 –263,025 –1,283 –632,690Interest income from run-offconsumer loan portfolio 0 0 0 0 69,293 –213 69,080
Net revenue from acquiredloans 109,975 209,793 102,126 182,064 472,417 1,022 1,077,397Fee and commission income 6,724 122,133 0 0 20,285 0 149,142Profit from shares and participation in joint venture 0 0 0 0 0 36,406 36,406Other income 296 5,825 0 0 13,185 –2,955 16,351
Total revenue 116,995 337,751 102,126 182,064 505,887 34,473 1,279,296
Personnel expenses –63,263 –101,005 0 –545 –161,650 –60,294 –386,757Other operating expenses –57,478 –185,929 –22,465 –63,799 –81,108 –127,891 –538,670Depreciation and amortisation of tangible and intangible fixed assets –2,264 –3,286 0 –10 –4,645 –6,132 –16,337
Total operating expenses –123,005 –290,220 –22,465 –64,354 –247,403 –194,317 –941,764
EBIT –6,010 47,531 79,661 117,710 258,484 –159,844 337,532
Interest income excl. run-off portfolio of consumer loans 14 195 0 4,613 7 84,659 89,488Interest expense –435 –285 0 0 0 –258,700 –259,420Net income from financialtransactions incl. financial costs –48,751 –35,289 –16,455 –26,064 –99,753 221,731 –4,581Total financial items –49,172 –35,379 –16,455 –21,451 –99,746 47,690 –174,513
Profit before tax –55,182 12,152 63,206 96,259 158,738 –112,154 163,019
Total revenue for the Netherlands of SEK 58,709 thousand is included in the revenue for Belgium, Netherlands and France.Total revenue for Germany of SEK 496,950 thousand is included in the revenue for Germany and Austria.
Note 1 Segment reporting, continued

Hoist Kredit AB (publ) Annual report 201432
Notes
Note 1 Segment reporting, continued
Acquired loans at 31 Dec 2014
SEK thousand
Belgium, the Netherlands
and France UK Italy PolandGermany and
Austria
Central functions and
eliminations Group
Run-off portfolio of consumer loans 118,799 118,799Acquired loan portfolios 2,194,000 1,797,520 1,181,210 1,182,459 2,231,593 8,586,782Shares and participations in joint venture 215,347 215,347Acquired loans 2,194,000 1,797,520 1,181,210 1,182,459 2,350,392 215,347 8,920,928
Acquired loans at 31 Dec 2013
SEK thousand
Belgium, the Netherlands
and France UK Italy PolandGermany and
Austria
Central functions and
eliminations Group
Run-off portfolio of consumer loans 209,373 209,373Acquired loan portfolios 1,771,888 1,312,769 308,327 778,646 1,826,305 5,997,935Shares and participations in joint venture 192,230 192,230Acquired loans 1,771,888 1,312,769 308,327 778,646 2,035,678 192,230 6,399,538

Hoist Kredit AB (publ) Annual report 2014 33
Notes
Net interest income
GROUP PARENT COMPANY
SEK thousand 2014 2013 2014 2013
Net revenue from acquired loan portfolios whereof amortised cost 1,282,636 738,582 175,420 171,547 whereof fair value 115,655 269,735 116,807 208,323
Net revenue from acquired loan 1,398,291 1,008,317 292,227 379,870
Lending to credit institutions Interest income banks 17,343 57,467 16,830 52,548 Interest-bearing securities 34,023 21,310 34,023 21,311Interest rate derivatives – 754 – 754Loan receivables 38,333 76,209 38,333 76,209Loan receivables ICP 1,262 2,828 244,364 80,788
Interest income 90,961 158,568 333,550 231,610Interest expenses related to retail deposits –209,703 –221,991 –209,703 –221,991Other interest expenses related to financial liability – at amortised cost –85,313 –20,359 –85,313 –20,359 – at fair value –49,901 –17,070 –49,576 –18,342
Interest expenses –344,917 –259,420 –344,592 –260,692
Net interest income 1,144,335 907,465 281,185 350,788
Note 3 Net results from financial transactions
GROUP PARENT COMPANY
SEK thousand 2014 2013 2014 2013
Exchange differences, net –2,513 12,418 8,023 6,564Gains/Losses on financial assets and liabilities designated at fair value through profit or loss, net 2,007 –4,257 2 –4,257Gains/Losses on financial assets and liabilities held for trading, net –18,645 –12,742 –18,645 –12,742Total –19,151 –4,581 –10,620 –10,435
Note 4 Other income
GROUP
SEK thousand 2014 2013
Intragroup revenues 5,8371)
4,1991)
Other 12,220 12,152Total 18,057 16,351
PARENT COMPANY
2014 2013
94,954 27,583414 1,312
95,368 28,895
1) Relates to parent company Hoist Finance AB (publ).
Note 2 Net interest income

Hoist Kredit AB (publ) Annual report 201434
Notes
Note 5 Personnel expenses
Personnel costs
GROUP PARENT COMPANY
SEK thousand 2014 2013 2014 2013
Salaries) –357,509 –299,555 –68,115 –34,214Pensions –70,471 –50,914 –18,024 –8,514Social security expenses –16,803 –16,560 –11,873 –4,363Other staff-related expenses –28,417 –19,728 –6,834 –3,498Total –473,200 –386,757 –104,847 –50,589
Of which salaries to executives
GROUP PARENT COMPANY
SEK thousand 2014 2013 2014 2013
To executives2
– Fixed salaries and benefits 25,036 15,252 25,036 15,252
– Performance based compensation 3,459 1,385 3,459 1,385
Total 28,495 16,637 28,495 16,6371) Includes both fixed and variable compensation.2) Senior executives include board members, CEO and Executive management team. Prior
board members are included.
Financial Supervisory Authority’s regulations and general guidelines regarding remuneration policy FFFS 2011:2
Further information can be found in a separate report on remuneration published on Hoist Finance’s website (www.hoistfinance.com).
Remunerations to Members of the Board and Executive Management TeamRemuneration to Members of the BoardThe Members of the Board of the parent company and the subsidiary Hoist Kredit has in 2014 received remuneration from Hoist Kredit for the overlapping Board work of both companies. At the AGM on 5 May 2014 it was decided that the annual Board remuneration of SEK 550,000 shall be paid to Members of the Board and that the Chairman of the Board will receive an annual remuneration of SEK 2,100,000. In addition, it was decided that an annual remuneration shall be paid to Members of board committees of SEK 50,000 and to Chairman of the Board committees of SEK 150,000.
During the EGM on 16 November 2014 as the new independent Board members were elected to the Board, it was decided to adjust the annual
remuneration according to the below. The adjusted figures are in line with the reformation of Board work and the increased number of Board Members.Chairman of the Board SEK 1,800,000Members of the Board SEK 500,000Board committee work:Chairman of Board committee SEK 100,000Members of Board committee SEK 50,000
The Members of the Board who are employed in Hoist Finance ( Jörgen Olsson and Coustas Thoupos) do not receive specific remuneration for their work on the Board. From the EGM in 16 November 2014 and onwards no pension obligations remains to any of the Members of the Board.
Remuneration to the Board of Directors1)
GROUP PARENT COMPANY
SEK thousand 2014 2013 2014 2013
Chairman of the BoardIngrid Bonde2) 236 0 236 0Mikael Wirén3) 2,001 0 2,001 0Other Members of the BoardAnnika Poutiainen4) 68 0 68 0Gunilla Wikman5) 116 0 116 0Achim Prior6) 750 625 750 625Per-Eric Skotthag 737 550 737 550Erik Fällström7) 0 0 0 0Jörgen Olsson 0 0 0 0Costas Thoupos 0 0 0 0Total 3,908 1,175 3,908 1,175
1) The remuneration to the Board consists of a fixed annual amount and remuneration for committee work consists of a fixed annual amount.
2) Ingrid Bonde was elected Chairman of the Board at the EGM November 16 2014.3) Mikael Wirén resigned as Chairman of the Board at the EGM on 16 November 2014.
Mikael Wirén has received remuneration during 2012 and 2013 of SEK 1,000 thousand and SEK 1,225 thousand respectively from Hoist Finance in addition to Board work. The remuneration has during 2012–2013 also been paid out to Beagle Investments S.A., a company related to Mikael Wirén, which is stated in Note 31.
4) Annika Poutiainen was elected as new Member of the Board during the EGM November 16 2014. 5) Gunilla Wikman was elected as a new Board member during the EGM 22 October 2014.6) Achim Prior resigned from the Board in conjunction with the EGM 16 November 2014. 7) Erik Fällström resigned in conjunction with the AGM May 4 2014. Erik Fällström has not
received addition remuneration for Board work since he has worked as an advisor to the business. Remuneration for advisory services has been paid out to European Digital Capital Ltd, a company related to Erik Fällström, which is stated in Note 31.
Salaries and other remunerations, Group
Fixed salary Variable part Other remunerations1) Total
SEK thousand 2014 2013 2014 2013 2014 2013 2014 2013
CEOJörgen Olsson 7,416 4,494 0 0 196 191 7,612 4,685Executive Management Team (EMT)5 (2013:4) excluding CEO 13,060 9,221 3,459 1,385 456 171 16,975 10,777Total 20,476 13,715 3,459 1,385 652 362 24,587 15,462
Salaries and other remunerations, Parent company
CEOJörgen Olsson 7,416 4,494 0 0 196 191 7,612 4,685Executive Management Team (EMT)5 (2013) excluding CEO 13,060 9,221 3,459 1,385 456 171 16,975 10,777Total 20,476 13,715 3,459 1,385 652 362 24,587 15,462
1) Other remunerations have been included in the taxable value of benefits, excluding social costs.
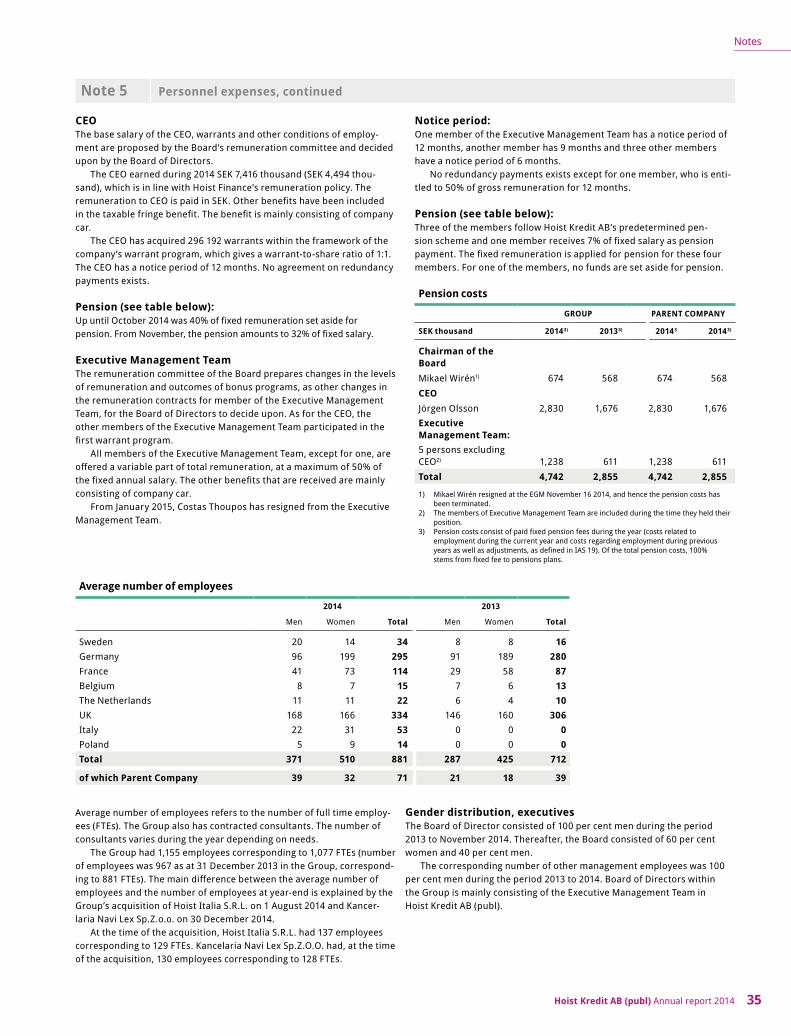
Hoist Kredit AB (publ) Annual report 2014 35
Notes
Note 5 Personnel expenses, continued
CEOThe base salary of the CEO, warrants and other conditions of employ-ment are proposed by the Board’s remuneration committee and decided upon by the Board of Directors.
The CEO earned during 2014 SEK 7,416 thousand (SEK 4,494 thou-sand), which is in line with Hoist Finance’s remuneration policy. The remuneration to CEO is paid in SEK. Other benefits have been included in the taxable fringe benefit. The benefit is mainly consisting of company car.
The CEO has acquired 296 192 warrants within the framework of the company’s warrant program, which gives a warrant-to-share ratio of 1:1. The CEO has a notice period of 12 months. No agreement on redundancy payments exists.
Pension (see table below):Up until October 2014 was 40% of fixed remuneration set aside for pension. From November, the pension amounts to 32% of fixed salary.
Executive Management Team The remuneration committee of the Board prepares changes in the levels of remuneration and outcomes of bonus programs, as other changes in the remuneration contracts for member of the Executive Management Team, for the Board of Directors to decide upon. As for the CEO, the other members of the Executive Management Team participated in the first warrant program.
All members of the Executive Management Team, except for one, are offered a variable part of total remuneration, at a maximum of 50% of the fixed annual salary. The other benefits that are received are mainly consisting of company car.
From January 2015, Costas Thoupos has resigned from the Executive Management Team.
Notice period:One member of the Executive Management Team has a notice period of 12 months, another member has 9 months and three other members have a notice period of 6 months.
No redundancy payments exists except for one member, who is enti-tled to 50% of gross remuneration for 12 months.
Pension (see table below):Three of the members follow Hoist Kredit AB’s predetermined pen-sion scheme and one member receives 7% of fixed salary as pension payment. The fixed remuneration is applied for pension for these four members. For one of the members, no funds are set aside for pension.
Pension costs
GROUP PARENT COMPANY
SEK thousand 20143) 20133) 20143 20143)
Chairman of the BoardMikael Wirén1) 674 568 674 568CEOJörgen Olsson 2,830 1,676 2,830 1,676Executive Management Team:5 persons excluding CEO2) 1,238 611 1,238 611Total 4,742 2,855 4,742 2,855
1) Mikael Wirén resigned at the EGM November 16 2014, and hence the pension costs has been terminated.
2) The members of Executive Management Team are included during the time they held their position.
3) Pension costs consist of paid fixed pension fees during the year (costs related to employment during the current year and costs regarding employment during previous years as well as adjustments, as defined in IAS 19). Of the total pension costs, 100% stems from fixed fee to pensions plans.
Average number of employees
2014 2013
Men Women Total Men Women Total
Sweden 20 14 34 8 8 16Germany 96 199 295 91 189 280France 41 73 114 29 58 87Belgium 8 7 15 7 6 13The Netherlands 11 11 22 6 4 10UK 168 166 334 146 160 306Italy 22 31 53 0 0 0Poland 5 9 14 0 0 0Total 371 510 881 287 425 712
of which Parent Company 39 32 71 21 18 39
Average number of employees refers to the number of full time employ-ees (FTEs). The Group also has contracted consultants. The number of consultants varies during the year depending on needs.
The Group had 1,155 employees corresponding to 1,077 FTEs (number of employees was 967 as at 31 December 2013 in the Group, correspond-ing to 881 FTEs). The main difference between the average number of employees and the number of employees at year-end is explained by the Group’s acquisition of Hoist Italia S.R.L. on 1 August 2014 and Kancer-laria Navi Lex Sp.Z.o.o. on 30 December 2014.
At the time of the acquisition, Hoist Italia S.R.L. had 137 employees corresponding to 129 FTEs. Kancelaria Navi Lex Sp.Z.O.O. had, at the time of the acquisition, 130 employees corresponding to 128 FTEs.
Gender distribution, executivesThe Board of Director consisted of 100 per cent men during the period 2013 to November 2014. Thereafter, the Board consisted of 60 per cent women and 40 per cent men.
The corresponding number of other management employees was 100 per cent men during the period 2013 to 2014. Board of Directors within the Group is mainly consisting of the Executive Management Team in Hoist Kredit AB (publ).
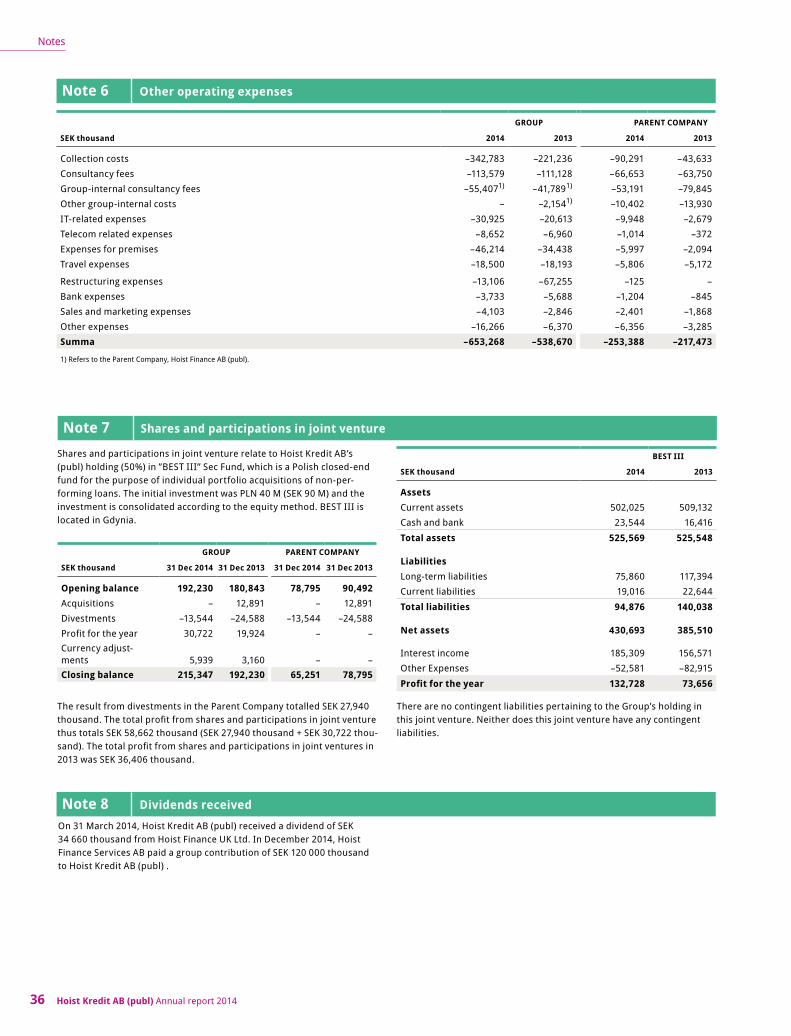
Hoist Kredit AB (publ) Annual report 201436
Notes
Note 6 Other operating expenses
GROUP PARENT COMPANY
SEK thousand 2014 2013 2014 2013
Collection costs –342,783 –221,236 –90,291 –43,633Consultancy fees –113,579 –111,128 –66,653 –63,750Group-internal consultancy fees –55,4071) –41,7891) –53,191 –79,845Other group-internal costs – –2,1541) –10,402 –13,930IT-related expenses –30,925 –20,613 –9,948 –2,679Telecom related expenses –8,652 –6,960 –1,014 –372Expenses for premises –46,214 –34,438 –5,997 –2,094Travel expenses –18,500 –18,193 –5,806 –5,172
Restructuring expenses –13,106 –67,255 –125 –Bank expenses –3,733 –5,688 –1,204 –845Sales and marketing expenses –4,103 –2,846 –2,401 –1,868Other expenses –16,266 –6,370 –6,356 –3,285Summa –653,268 –538,670 –253,388 –217,473
1) Refers to the Parent Company, Hoist Finance AB (publ).
Note 7 Shares and participations in joint venture
Shares and participations in joint venture relate to Hoist Kredit AB’s (publ) holding (50%) in ”BEST III” Sec Fund, which is a Polish closed-end fund for the purpose of individual portfolio acquisitions of non-per-forming loans. The initial investment was PLN 40 M (SEK 90 M) and the investment is consolidated according to the equity method. BEST III is located in Gdynia.
GROUP PARENT COMPANY
SEK thousand 31 Dec 2014 31 Dec 2013 31 Dec 2014 31 Dec 2013
Opening balance 192,230 180,843 78,795 90,492Acquisitions – 12,891 – 12,891Divestments –13,544 –24,588 –13,544 –24,588Profit for the year 30,722 19,924 – –Currency adjust-ments 5,939 3,160 – –Closing balance 215,347 192,230 65,251 78,795
The result from divestments in the Parent Company totalled SEK 27,940 thousand. The total profit from shares and participations in joint venture thus totals SEK 58,662 thousand (SEK 27,940 thousand + SEK 30,722 thou-sand). The total profit from shares and participations in joint ventures in 2013 was SEK 36,406 thousand.
BEST III
SEK thousand 2014 2013
AssetsCurrent assets 502,025 509,132Cash and bank 23,544 16,416
Total assets 525,569 525,548
LiabilitiesLong-term liabilities 75,860 117,394Current liabilities 19,016 22,644
Total liabilities 94,876 140,038
Net assets 430,693 385,510
Interest income 185,309 156,571Other Expenses –52,581 –82,915
Profit for the year 132,728 73,656
There are no contingent liabilities pertaining to the Group’s holding in this joint venture. Neither does this joint venture have any contingent liabilities.
Note 8 Dividends receivedOn 31 March 2014, Hoist Kredit AB (publ) received a dividend of SEK 34 660 thousand from Hoist Finance UK Ltd. In December 2014, Hoist Finance Services AB paid a group contribution of SEK 120 000 thousand to Hoist Kredit AB (publ) .

Hoist Kredit AB (publ) Annual report 2014 37
Notes
Taxes
GROUP PARENT COMPANY
SEK thousand 2014 2013 2014 2013
Current tax expenseTax expense for the period –24,127 –45,480 –26,070 –21,680Tax adjustment pertaining to previous years –336 806 –1 –959
Total –24,463 –44,674 –26,071 –22,639
Deferred tax expense/tax income Deferred tax pertaining to temporary differences –13,452 9,767 2,245 –1,529
Total –13,452 9,767 2,245 –1,529
Total reported tax expense –37,915 –34,907 –23,826 –24,168
GROUP PARENT COMPANY
SEK thousand 2014 2013 2014 2013
Pre-tax income 205,137 163,019 148,560 106,128
Tax calculated with a tax rate of 22% (tax rate in Sweden) –45,130 –35,864 –32,683 –23,348Effect of different tax rates in different countries –4,398 –4,570 –157 –134Non-taxable revenue 4,798 7,483 7,626 7,180Non-taxable expenses –8,319 –11,657 –736 –4,738Exercise of not previously capitalised losses carried forward 23,267 10,124Non-capitalised losses carried forward –7,441 –Other –692 –423 2,124 –3,128Total tax expenses –37,915 –34,907 –23,826 –24,168
Current tax which is accounted for directly in shareholders’ equity in the Group totals SEK 3,301 thousand as at 31 December 2014, relating to taxes on paid interest on capital contribution. In the comprehensive income, tax is included of an amount of SEK 872 thousand regarding revaluation of benefit for pension scheme (SEK 564 thousand) and revalu-ation of remuneration after terminated employment (SEK 308 thousand). Previous year, current tax relating to items accounted for directly in shareholders’ equity totalled SEK 5,963 thousand. Of this amount, SEK 2,216 thousand is related to tax on paid interest on capital contribution, SEK 1,540 thousand is related to taxes on transaction costs for capital
contribution and SEK 2,207 thousand is related to taxes on group contri-bution. There was no taxes during previous year included in other total result.Current tax which is accounted for directly in shareholders’ equity in the parent company totals SEK 3,301 thousand as at 31 December 2014, relating to taxes on paid interest on capital contribution. Previous year, current tax relating to items accounted for directly in shareholders’ equity totalled SEK 14,788 thousand. Of this amount, SEK 2,216 thousand is related to tax on paid interest on capital contribution, SEK 1,540 thou-
GROUP PARENT COMPANY
SEK thousand 31 Dec 2014 31 Dec 2013 31 Dec 2014 31 Dec 2013
Deferred taxDeferred tax receivables 70,885 62,254 1,249 1,121Deferred tax payables –50,419 –32,720 0 –2,117Total 20,466 29,534 1,249 –996
Note 9 Taxes
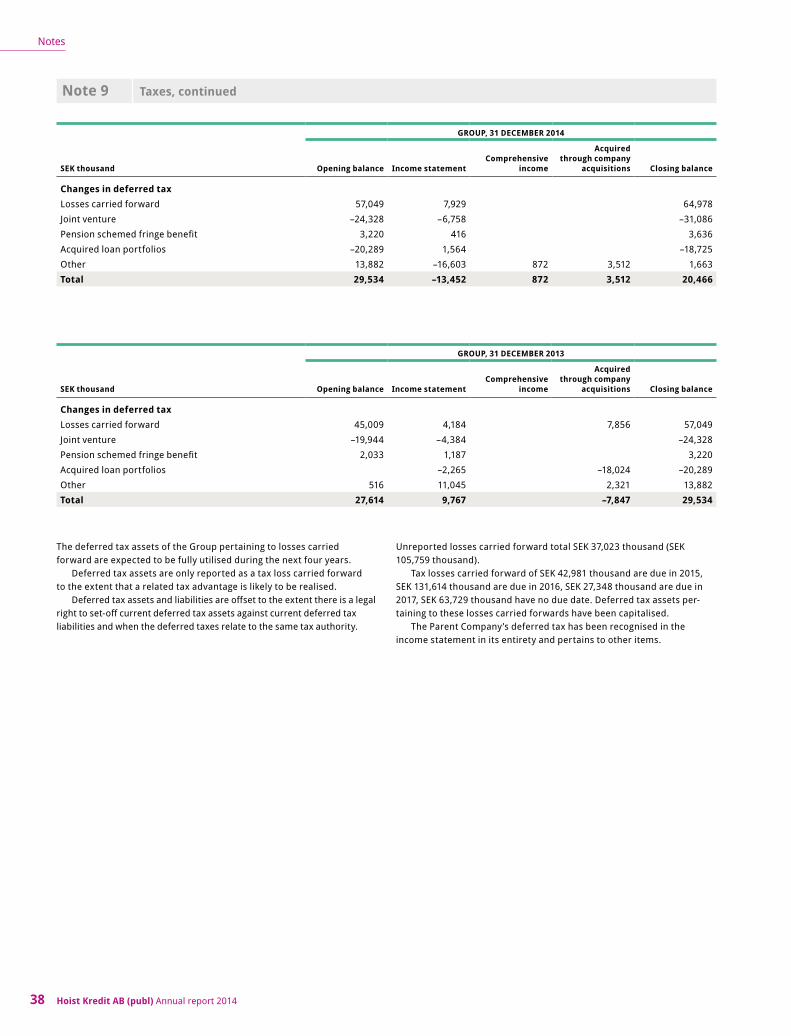
Hoist Kredit AB (publ) Annual report 201438
Notes
Note 9 Taxes, continued
GROUP, 31 DECEMBER 2014
SEK thousand Opening balance Income statementComprehensive
income
Acquired through company
acquisitions Closing balance
Changes in deferred taxLosses carried forward 57,049 7,929 64,978Joint venture –24,328 –6,758 –31,086Pension schemed fringe benefit 3,220 416 3,636Acquired loan portfolios –20,289 1,564 –18,725Other 13,882 –16,603 872 3,512 1,663Total 29,534 –13,452 872 3,512 20,466
GROUP, 31 DECEMBER 2013
SEK thousand Opening balance Income statementComprehensive
income
Acquired through company
acquisitions Closing balance
Changes in deferred taxLosses carried forward 45,009 4,184 7,856 57,049Joint venture –19,944 –4,384 –24,328Pension schemed fringe benefit 2,033 1,187 3,220Acquired loan portfolios –2,265 –18,024 –20,289Other 516 11,045 2,321 13,882Total 27,614 9,767 –7,847 29,534
The deferred tax assets of the Group pertaining to losses carried forward are expected to be fully utilised during the next four years.
Deferred tax assets are only reported as a tax loss carried forward to the extent that a related tax advantage is likely to be realised.
Deferred tax assets and liabilities are offset to the extent there is a legal right to set-off current deferred tax assets against current deferred tax liabilities and when the deferred taxes relate to the same tax authority.
Unreported losses carried forward total SEK 37,023 thousand (SEK 105,759 thousand).
Tax losses carried forward of SEK 42,981 thousand are due in 2015, SEK 131,614 thousand are due in 2016, SEK 27,348 thousand are due in 2017, SEK 63,729 thousand have no due date. Deferred tax assets per-taining to these losses carried forwards have been capitalised.
The Parent Company’s deferred tax has been recognised in the income statement in its entirety and pertains to other items.

Hoist Kredit AB (publ) Annual report 2014 39
Notes
Note 10 Maturity analysis
GROUP, 31 December 2014
SEK thousandPayable on
demand < 3 months 3–12 months 1–5 years >5 yearsWithout fixed
maturity Total
AssetsEligible treasury bonds 2,316,110 2,316,110Lending to credit institutions 1,247,289 1,903 1,292,711Lending to the public 4,404 52,430 94,466 5,933 157,232Bonds and other securities 160,069 149,340 1,616,832 25,000 1,951,241
Total assets with fixed maturities 1,247,289 2,482,486 201,770 1,711,298 5,933 25,000 5,673,775Acquired loan portfolios1) 656,319 1,862,892 6,872,154 4,095,440 13,486,805Total assets without fixed maturities 656,319 1,862,892 6,872,154 4,095,440 13,486,805
LiabilitiesDeposits from the public2)
– retail 7,479,114 514,600 1,858,900 984,758 10,837,373 – corporate 149,916 149,916
Total liabilities with fixed maturities 7,629,030 514,600 1,858,900 984,758 10,987,289Derivatives 208,691 38,033 246,724Issued bonds 1,493,122 1,493,122Subordinated loans 332,796 332,796Total liabilities without fixed maturities 7,629,030 723,291 1,858,900 2,515,913 332,796 13,059,931
GROUP, 31 December 2013
SEK thousandPayable on
demand < 3 months 3–12 months 1–5 years >5 yearsWithout fixed
maturity Total
AssetsLending to credit institutions 3,707,766 218,920 3,926,686Lending to the public 53,624 83,045 157,187 35,095 328,951Bonds and other securities 136,462 259,326 876,889 25,000 1,297,677Derivatives 25,951 25,951
Total assets with fixed maturities 3,707,766 434,957 342,371 1,034,076 35,095 25,000 5,579,266Acquired loan portfolios1) 422,466 1,301,666 4,910,933 3,118,339 9,753,403Total assets without fixed maturities 422,466 1,301,666 4,910,933 3,118,339 9,753,403
LiabilitiesDeposits from the public 2)
– retail 6,947,240 721,593 897,835 959,130 9,525,798 – corporate 175,704 175,704
Total liabilities with fixed maturities 7,122,944 721,593 897,835 959,130 9,701,502Derivatives 16,329 16,329Issued bonds 665,680 665,680Subordinated loans 329,231 329,231Total liabilities without fixed maturities 7,122,944 721,593 897,835 1,641,139 329,231 10,712,742
1) All duration information on acquired loan portfolios is based on net cash flows. For more information on the Group’s handling of credit risk, se note 28.2) All deposits are in Swedish kronor and payable on demand. There is a fee for premature withdrawals from fixed duration accounts.
For more information regarding the Group’s handling of liquidity risk, refer to note 27.

Hoist Kredit AB (publ) Annual report 201440
Notes
Note 10 Maturity analysis, continued
PARENT COMPANY, 31 December 2014
SEK thousandPayable on
demand < 3 months 3–12 months 1–5 years >5 years Total
AssetsEligible treasury bonds 2,316,110 2,316,110Lending to credit institutions 246,481 1,903 248,384Lending to the public 4,404 52,430 94,466 5,933 157,232Receivables Group companies 319,750 11,419 4,910,038 1,208,468 6,449,675Bonds and other securities 160,069 149,340 1,616,832 1,926,241Total assets with fixed maturities 246,481 2,802,236 213,188 6,621,336 1,214,401 11,097,642
Acquired loan portfolios1) 293,084 717,309 1,999,164 1,228,726 4,238,283Total assets without fixed maturities 293,084 717,309 1,999,164 1,228,726 4,238,283
LiabilitiesDeposits from the public2)
– retail 7,479,114 514,600 1,858,900 984,758 10,837,373 – corporate 149,916 149,916
Total deposits from the public 7,629,030 514,600 1,858,900 984,758 10,987,289Derivatives 208,691 38,033 246,724Issued bonds 1,493,122 1,493,122Subordinated loans 332,796 332,796Total liabilities with fixed maturities 7,629,030 723,291 1,858,900 2,515,913 332,796 13,059,931
PARENT COMPANY, 31 December 2013
SEK thousandPayable on
demand < 3 months 3–12 months 1–5 years >5 years Total
AssetsEligible treasury bonds 3,363,266 219,156 3,582,423Lending to credit institutions 53,624 83,045 154,024 35,095 325,788Lending to the public 113,792 3,380,042 3,493,834Receivables Group companies 136,462 259,326 876,889 1,272,677Bonds and other securities 25,951 25,951Total assets with fixed maturities 3,363,266 548,985 342,371 4,410,955 35,095 8,700,673
Acquired loan portfolios1) 255,573 497,494 1,695,283 1,093,308 3,541,658Total assets without fixed maturities 255,573 497,494 1,695,283 1,093,308 3,541,658
LiabilitiesDeposits from the public2)
– retail 6,947,240 721,593 897,835 959,130 9,525,798 – corporate 175,704 175,704
Total deposits from the public 7,122,944 721,593 897,835 959,130 9,701,502Derivatives 16,329 16,329Issued bonds 665,680 665,680Subordinated loans 329,231 329,231Total liabilities with fixed maturities 7,122,944 721,593 897,835 1,641,139 329,231 10,712,742
1) All duration information on acquired loan portfolios is based on net cash flows. For more information on the Group’s handling of credit risk, se note 27.2) All deposits are in Swedish kronor and payable on demand. There is a fee for premature withdrawals from fixed duration accounts.

Hoist Kredit AB (publ) Annual report 2014 41
Notes
Note 11 Financial assets
GROUP PARENT COMPANY
SEK thousand 31 Dec 2014 31 Dec 2013 31 Dec 2014 31 Dec 2013
LENDING TO CREDIT INSTITUTIONSSwedish banks 665,280 3,566,508 150,576 3,545,797Foreign banks 583,912 354,691 97,807 36,626Total, lending to credit institutions 1,249,192 3,921,199 248,384 3,582,423 of which, pledged assets 1) 1,903 5,724 1,903 5,724
Interest-bearing securities Treasury bills, Swedish government 670,915 – 670,915 – Other treasury bills 1,645,195 – 1,645,195 – Total, treasury bills and treasury bonds 2,316,110 – 2,316,110 –
Bonds and other fixed income securitiesCredit institutions – 1,097,380 – 1,097,380Mortgage institutions 1,926,241 54,717 1,926,241 54,717Other – 120,580 – 120 580
Total, bonds and other fixed income securities 1,926,241 1,272,677 1,926,241 1,272,677
Total, interest-bearing securities 4,242,351 1,272,677 4,242,351 1,272,677 of which, unlisted securities – – – –
SHARES AND OTHER EQUITYUnlisted 2) 25,000 25,000 – – Total, shares and other equity 25,000 25,000 – –
1) This amount relates to pledged assets (cash), in favour of Deutsche Bank, to meet any repayment of debts from the public. In case where a borrower would reverse its direct debit payment the money should be returned to the borrower.
2) The unlisted shares have been accounted for at the acquisition price as there are no listed market prices. Fair value of the shares has not been calculated as there is no reliable valuation technique to be used. The shares are not intended to be sold in a near future but is rather held for strategic reasons. Please see note 27 for additional information about credit quality.
Note 12 Acquired loan portfolios,
GROUP PARENT COMPANY
SEK thousand 31 Dec 2014 31 Dec 2013 31 Dec 2014 31 Dec 2013
Opening balance 5,997,935 3,363,907 2,546,122 2,393,361Acquisitions 3,226,795 3,265,806 1,091,392 619,136Divestments – –117,170 – – Intra-Group sales – – –262,316 – Translation differences 505,071 118,082 165,513 29,572
Changes in carrying valueBased on the forecast of opening balances (amorti-sation) –1,128,103 –627,120 –663,134 –537,483
Based on revised estimates (revalua-tions) –14,916 –5,570 –17,357 41,536
Carrying value 8,586,782 5,997,935 2,860,220 2,546,122Profit/loss revalu-ations reported in income statement –1,143,020 –632,690 –680,491 –495,947
Of which, at fair value GROUP PARENT COMPANY
SEK thousand 31 Dec 2014 31 dec 2013 31 Dec 2014 31 Dec 2013
Opening balance 1,607,061 1,768,134 1,295,106 1,405,713Translation differences 94,594 66,978 76,806 53,250
Changes in carrying value Based on the forecast of opening balances (amortisation) –188,953 –183,013 –173,313 –165,442Based on revised estimates (revalua-tions) –52,473 –45,038 –21,133 1,585
Based on revised discount rate – – – –
Carrying value 1,460,229 1,607,061 1,177,466 1,295,106Profit/loss revalu-ations reported in income statement –241,426 –228,051 –194,446 –163,857
Hoist Kredit AB (publ) Annual report 201442
Notes
Note 12 Acquired loan portfolios, continued
The Group acquires portfolios of financial assets primarily from banks, insurance companies and other companies and institutions. These claims are mostly unsecured consumer loans. These loan portfolios have been acquired at a significant discount relative to the capital claim corresponding to the discounted value of expected collections and fulfil the Group’s required rate of return.
The valuation principle at market value is applied to portfolios that have been acquired prior to 1 July 2011 (SEK 1,460,229 thousand, corresponding to 17 per cent) whereas portfolios acquired post that date (SEK 7,126,553 thousand, corresponding to 83 per cent) are valued at amortised cost. For more information on applied accounting principles in accordance with the IFRS, please refer to the section “Accounting Principles”.
Portfolio overviewThe portfolios consist of a large number of debtors with varying charac-teristics, such as payers, partial payers and non-payers. There is, how-ever, a certain versatility within the debtor categories with non-payers becoming payers and vice versa. The Group divides its portfolios within different categories. These are defined as follows:
Countries: Countries where the seller of the portfolio and the debtors are located.
Age: Primary claims are purchased by the Group up to 180 days after termination by the seller, secondary between 180 and 720 days and tertiary claims after 720 days.
Asset class: The type of contract under which the claim against the debtor was originated.
Acquisition type: A spot portfolio is a one-time acquisition, while a forward flow portfolio is determined by monthly pur-chases on a continuous basis, where at the beginning a frame agreement is signed and deliveries under a defined pattern are purchased
The classification in primary, secondary and tertiary portfolios reflects the properties of the portfolios as of the date of the acquisition.
Net collection forecastThe Group values its portfolios based on estimated future cash collec-tions during the next ten years. Collection costs are monitored closely and forecast collection costs are based upon standard cost curves where analysis of actual collection costs is made on a standard portfolio, taking into consideration collection in relation to the character and age of the claims. These curves are then applied for the calculation of the value for all portfolios. In cases where collection is outsourced, or when a port-folio is of significant size, actual collection cost is applied or estimates thereof.
The cash flow forecast is monitored continuously during the year and updated regularly based on, for instance, achieved collection results and agreements with debtors on instalment plans. Based on the updated forecasts, a new carrying value is calculated for the portfolios. The dif-ference is accounted for either as an income or an expense in the income statement and specified in Note 1 (SEK –1,143,020 thousand).
Portfolios valued at fair value through profit or lossThe Group has chosen to categorize portfolios acquired prior to July 1, 2011 as valued at fair value through profit or loss as these financial assets are managed and their performance is evaluated on a fair value basis, in accordance with the Group’s risk management policies. Information about portfolios is provided internally on that basis to the Group’s management team. The underlying concept for valuation at fair value is to assess the book value of an asset by using the best available price for the asset. Loan portfolios are typically not traded publicly and consequently there are no market prices available. Most players in the industry however apply similar pricing methods for portfolio acquisitions and calculate the present value of cash flows that correspond to the market value of a portfolio.
In order to assess fair value, the three main influencing aspects are: (i) the gross collections forecast, (ii) the cost level and (iii) the internal rate of return. Every month, the Group will look at the for-ward ten years’ net collection forecasts for all portfolios and discount the forecasts to present value, which is the basis for the calculation of the fair value for each portfolio.
In the estimation of a market discount rate constituted an import-ant part are the many observations Hoist Finance, acting as one of the industry’s biggest players, get from the many portfolio transactions the company participate in or have knowledge of. The discount rate that corresponds to the market rate of return is updated continuously and reflects actual rate of return on relevant and comparable transac-tions in the market. Portfolios are presently valued at a IRR of 12 per cent over a ten year period.
The estimated market discount rate is only applied on the part of the portfolios that are valued at fair value: for the portfolios that are valued at accrued purchase value, the IRR at which the original acqui-sition was made is applied and the revenues are split at this effective interest rate.
RevaluationsThe Group monitors and evaluates actual collections in relation to forecasts, which are the basis for portfolio valuation during the same period. Should negative deviations occur, the Group first take addi-tional operational measures in order to reduce the risk of deviations in future periods. In the event that additional operational measures do not have, or it is believed that they will not have, the intended effect a revised forecast is done for future collections. The forecast is also adjusted upwards in cases where the portfolios exhibit collections that are estimated to sustainably exceed the current forecast. Fore-cast adjustments are analysed in consultation with the Investment Committee, and are decided on the Group level. Implementation of forecast revisions are implemented by the resources directly under the Chief Financial Officer. Forecast adjustments and earnings effects thereof are reported separately, both internally and externally. The valuation of portfolios is independently audited by the Risk Control function.

Hoist Kredit AB (publ) Annual report 2014 43
Notes
Note 12 Acquired loan portfolios, continued
Sensitivity analysisEven though Hoist Finance believes that the assumptions made for the assessment of fair value are reasonable, another fair value can be obtained by applying other methods and other assumptions. For a Level 3 fair value, a reasonable change in one or several assumptions would have the following impact upon the result:
GROUP
SEK thousand 31 Dec 2014 31 Dec 2013
Carrying value of acquired loan portfolios 8,586,782 5,997,935In case the estimated cash flow over the forecast period (10 years) would increase by 5 per cent, the carrying value would increase by 424,369 297,711Of which valued at fair value 72,804In case the estimated cash flow over the forecast period would decrease by 5 per cent, the carrying value would decrease by –424,369 –297,711
Of which valued at fair value –72,804
Carrying value of portfolios acquired prior to 1 July, 2011 1,460,229 1,607,061In case the IRR would decrease by 1 per cent, the carrying value would decrease by 46,058 51,104In case the IRR would increase by 1 per cent, the carrying value would increase by –43,483 –48,231If the forecast period would be shortened by 1 year, the carrying value should decrease by –48,622If the forecast period would be lengthened by 1 year, the carrying value should increase by1) 43,413
1) Amount calculated to lengthening forecast period of 1 year and under the assumption that the added year’s cash flow estimated to the same level as the forecast period’s entire last year
Note 13 Group Companies
Hoist Kredit AB (publ), corporate registration number 556329-5699, with its registered office in Stock-holm, is the Parent Company of the Group. The list of subsidiaries in the Group is provided below.
SEK thousandCorporate registration number Domicile Ownership % Revenue
Profit before tax
Tax on profit
SwedishHoist Finance Services AB1) 556640-9941 Stockholm 100 –2,055 261,776 –23,060
ForeignHoist B.V.2) 17216080 'S-Hertogenbosch 100 – 85 – Hoist Finance SAS 444611453 Guyancourt 100 119,543 5,278 –312 Hoist GmbH HRB 7736 Duisburg 100 291,790 7,781 –3,854 HECTOR Sicherheiten-Verwaltungs GmbH HRB 74561 Duisburg 100 – –133 – Hoist Portfolio Holding Ltd 101438 St. Helier 100 303,122 39,614 –8,715 Hoist Portfolio Holding 2 Ltd 111085 St. Helier 90 51,480 –27,347 6,016 Hoist Poland SpZ.O.O. 284313 Warszawa 100 5,299 403 –170 HOIST I NS FIZ3) RFI702 Warszawa 100 281,236 216,147 28,022 Hoist Kredit Ltd 7646691 London 100 23,771 1,550 306 Hoist Finance UK Ltd 8303007 London 90 –4,775 –36,877 –4,185 C L Finance Ltd 01108021 London 90 – – – Robinson Way Ltd 6976081 Manchester 90 180,457 –48,345 9,374 The Lewis Group Ltd SC127043 Glasgow 90 77,437 –785,458 –2,805 Marte SPV S.R.L4) 4634710265 Conegliano 100 57,948 15,012 –3,303 Hoist Italia S.R.L4) 12898671008 Rome 100 18,699 –15,383 4,183 Hoist Finance Cyprus Ltd4) HE 338570 Nicosia 100 –4,391 –4,414 – Kancelaria Navi Lex SpZ.O.O4) 0000536257 Wroclaw 100 – – –
1) The Company has in 2014 changed its name from Konstruktur Development AB to Hoist Finance Services AB..2) The Company has been liquidated during 2014.3) Polish Sec-fond.4) Acquired companies during 2014.

Hoist Kredit AB (publ) Annual report 201444
Notes
Note 13 Group Companies, continued
SEK thousand31 Dec
201431 Dec
2013
Accumulated acquisition valuesOpening balance 295,944 408,343Acquired shares and participations 73,432 – Capital contributions 52,977 – Divested shares and participations –708 –112,399
Closing balance 421,645 295,944
Accumulated write-ups/ write-downs
Opening balance 7,201 –57,051Write-ups – 64,253
Closing balance 7,201 7,201
Closing balance 428,846 303,145
The ownership percentage correspond to the percentage of votes. All shares are unlisted. No credit institutions contained. Information about the number of shares in the Group’s companies are available on request.
SEK thousand 31 Dec 2014 31 Dec 2013
Hoist Finance Services AB 160,350 160,350Hoist B.V., the Netherlands – 708Hoist SAS, France 7,183 7,183Hoist GmbH, Germany 70,517 70,517HECTOR Sicherheiten-Verwaltungs GmbH, Germany – – Hoist Portfolio Holding Ltd, Jersey – – Hoist Portfolio Holding 2 Ltd, Jersey – – Hoist Poland SpZ.O.O. Poland 124 124Hoist I NS FIZ , Poland – – Hoist Kredit Ltd, the UK – – Hoist Finance UK Ltd, the UK 98,924 64,263Robinson Way Ltd, the UK – – CL Finance Ltd, the UK – – The Lewis Group Ltd, the UK – – Marte SPV S.R.L 109 – Hoist Italia S.R.L 20,820 – Hoist Finance Cyprus Ltd 9 – Kancelaria Navi Lex SpZ.O.O 70,811 – Total book value 428,846 303,145
During 2014 the Parent company received a capital contribution of SEK 34,660 thousand from Hoist Finance UK Ltd and a capital contribution of SEK 18,317 thousand from Hoist Italia S.R.L.. Divested shares and participations during the year refers to the liquidation of Hoist BV. Hoist Immobilien GmbH and Hoist Aurora GmbH were in 2013 merged in Hoist GmbH. The shares in Hoist Finance UK Ltd were revaluated in 2013.
Acquisitions of operations Hoist Italia S.R.LIn July 2014 Hoist Kredit AB (publ) established a wholly-owned sub-sidiary, Hoist Italia SrL. As at 1 August Hoist Italia SrL acquired the opera-tions of the servicing partner TRC SpA through an asset purchase. Hoist Italia operates and co-ordinates collection activities of Hoist Finance in Italy. Hoist Italia has 129 employees with offices in Rome and in Lecce. The acquisition is another important strategic step in expanding Hoist Finance’s position in the Italian market.
The consideration paid in connection with the acquisition totalled EUR 1.
The acquired net assets as at the acquisition date
SEK thousand
Intangible fixed assets 22,451Tangible fixed assets 876Accounts receivable and other current receivables 45,873Accrued expenses –16,946Accounts payable and other current liabilities –50,019Long-term liabilities –2,235Total identifiable net assets 0
The net amount of acquired operations-related assets and liabilities is SEK 0 thousand. No cash or cash equivalents have been taken over in connection with the acquisition. It is anticipated that the acquired loans will be paid in at reported values.Acquisition-related costs of SEK 1,601 thousand are included in admin-istrative expenses in the consolidated income statement for July – Sep-tember 2014.
The acquired assets are consolidated starting as from August 2014 and have contributed with SEK 18,699 thousand to the consolidated reve-nue and with SEK –15,383 thousand to the operating profit.Since the acquired operations have not previously been disclosed on a stand-alone basis, it is not possible to disclose the effect of the acqui-sition from January 1 2014. There are other items which have affected Group accounts relating to the fact that the commercial agreement with TRC was terminated. The previous commercial commitment contained conditions on deferred commissions to TRC in exchange for some debt collection goals was to be fulfilled. This resulted in a revaluation of the Group’s assets that TRC previously has collected, corresponding to SEK 10 M, which has been accounted for as revenues. An agreement was also met on the deferred part of commissions which was deferred to the time of acquisition and would be paid to TRC in the future, which resulted in a cost of SEK 8 M, accounts for in other operating costs.
The acquisition analysis is preliminary.
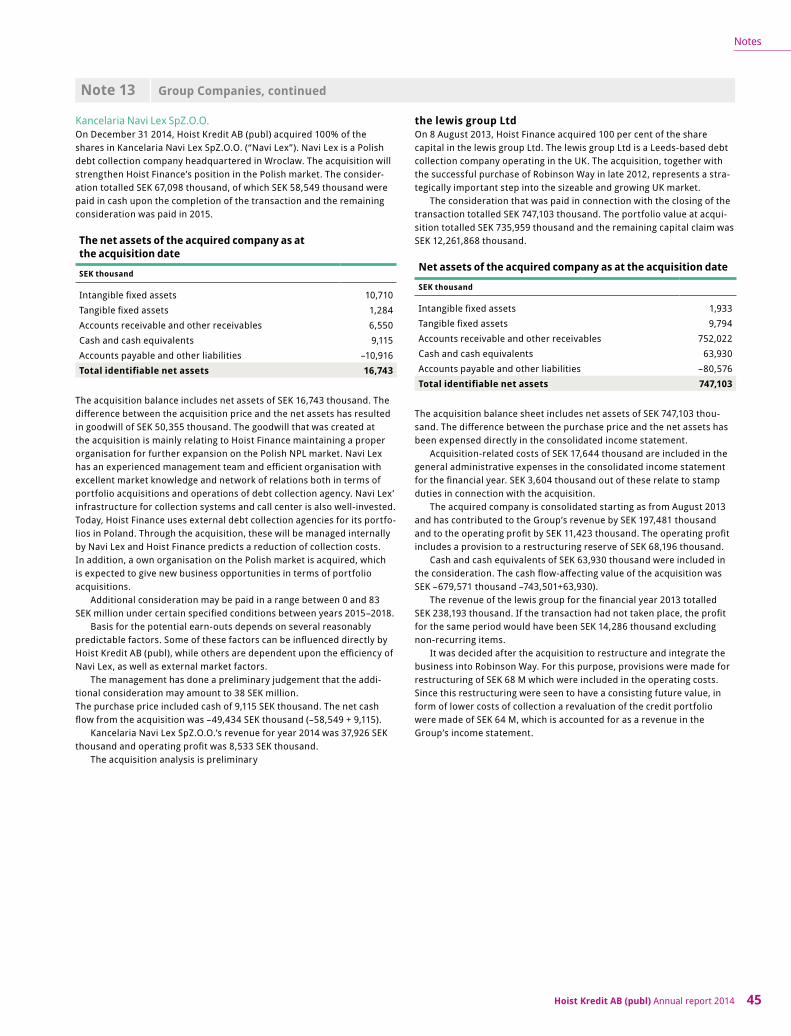
Hoist Kredit AB (publ) Annual report 2014 45
Notes
Note 13 Group Companies, continued
Kancelaria Navi Lex SpZ.O.O.On December 31 2014, Hoist Kredit AB (publ) acquired 100% of the shares in Kancelaria Navi Lex SpZ.O.O. (“Navi Lex”). Navi Lex is a Polish debt collection company headquartered in Wroclaw. The acquisition will strengthen Hoist Finance’s position in the Polish market. The consider-ation totalled SEK 67,098 thousand, of which SEK 58,549 thousand were paid in cash upon the completion of the transaction and the remaining consideration was paid in 2015.
The net assets of the acquired company as at the acquisition date
SEK thousand
Intangible fixed assets 10,710Tangible fixed assets 1,284Accounts receivable and other receivables 6,550Cash and cash equivalents 9,115Accounts payable and other liabilities –10,916Total identifiable net assets 16,743
The acquisition balance includes net assets of SEK 16,743 thousand. The difference between the acquisition price and the net assets has resulted in goodwill of SEK 50,355 thousand. The goodwill that was created at the acquisition is mainly relating to Hoist Finance maintaining a proper organisation for further expansion on the Polish NPL market. Navi Lex has an experienced management team and efficient organisation with excellent market knowledge and network of relations both in terms of portfolio acquisitions and operations of debt collection agency. Navi Lex’ infrastructure for collection systems and call center is also well-invested. Today, Hoist Finance uses external debt collection agencies for its portfo-lios in Poland. Through the acquisition, these will be managed internally by Navi Lex and Hoist Finance predicts a reduction of collection costs. In addition, a own organisation on the Polish market is acquired, which is expected to give new business opportunities in terms of portfolio acquisitions.
Additional consideration may be paid in a range between 0 and 83 SEK million under certain specified conditions between years 2015–2018.
Basis for the potential earn-outs depends on several reasonably predictable factors. Some of these factors can be influenced directly by Hoist Kredit AB (publ), while others are dependent upon the efficiency of Navi Lex, as well as external market factors.
The management has done a preliminary judgement that the addi-tional consideration may amount to 38 SEK million.The purchase price included cash of 9,115 SEK thousand. The net cash flow from the acquisition was –49,434 SEK thousand (–58,549 + 9,115).
Kancelaria Navi Lex SpZ.O.O.’s revenue for year 2014 was 37,926 SEK thousand and operating profit was 8,533 SEK thousand.
The acquisition analysis is preliminary
the lewis group LtdOn 8 August 2013, Hoist Finance acquired 100 per cent of the share capital in the lewis group Ltd. The lewis group Ltd is a Leeds-based debt collection company operating in the UK. The acquisition, together with the successful purchase of Robinson Way in late 2012, represents a stra-tegically important step into the sizeable and growing UK market.
The consideration that was paid in connection with the closing of the transaction totalled SEK 747,103 thousand. The portfolio value at acqui-sition totalled SEK 735,959 thousand and the remaining capital claim was SEK 12,261,868 thousand.
Net assets of the acquired company as at the acquisition date
SEK thousand
Intangible fixed assets 1,933Tangible fixed assets 9,794Accounts receivable and other receivables 752,022Cash and cash equivalents 63,930Accounts payable and other liabilities –80,576Total identifiable net assets 747,103
The acquisition balance sheet includes net assets of SEK 747,103 thou-sand. The difference between the purchase price and the net assets has been expensed directly in the consolidated income statement.
Acquisition-related costs of SEK 17,644 thousand are included in the general administrative expenses in the consolidated income statement for the financial year. SEK 3,604 thousand out of these relate to stamp duties in connection with the acquisition.
The acquired company is consolidated starting as from August 2013 and has contributed to the Group’s revenue by SEK 197,481 thousand and to the operating profit by SEK 11,423 thousand. The operating profit includes a provision to a restructuring reserve of SEK 68,196 thousand.
Cash and cash equivalents of SEK 63,930 thousand were included in the consideration. The cash flow-affecting value of the acquisition was SEK –679,571 thousand –743,501+63,930).
The revenue of the lewis group for the financial year 2013 totalled SEK 238,193 thousand. If the transaction had not taken place, the profit for the same period would have been SEK 14,286 thousand excluding non-recurring items.
It was decided after the acquisition to restructure and integrate the business into Robinson Way. For this purpose, provisions were made for restructuring of SEK 68 M which were included in the operating costs. Since this restructuring were seen to have a consisting future value, in form of lower costs of collection a revaluation of the credit portfolio were made of SEK 64 M, which is accounted for as a revenue in the Group’s income statement.

Hoist Kredit AB (publ) Annual report 201446
Notes
Note 14 Intangible fixed assets
GROUP PARENT COMPANY
SEK thousand 31 Dec 2014 31 Dec 2013 31 Dec 2014 31 Dec 2013
GoodwillAcquisition cost, opening balance 54,237 53,393 – – Acquired companies1) 50,355 – – – Translation differences 1,563 844 – –
Acquisition cost, closing balance 106,155 54,237 – –
Accumulated depreciation, opening balance –54,237 –53,393 – – Translation differences –1,563 –844 – –
Accumulated impairments, closing balance –55,800 –54,237 – –
Carrying value 50,355 0 – –
Licenses and softwareAcquisition cost, opening balance 78,240 50,235 30,194 15,854Investments 57,678 22,023 29,477 14,289Investments, acquired companies 1) 13,135 6,465 – – Disposals –2,330 –2,097 – – Translation differences 4,600 1,614 98 51
Acquisition cost, closing balance 151,323 78,240 59,769 30,194
Accumulated depreciation, opening balance –45,091 –32,432 –9,099 –5,953Accumulated depreciation, acquired companies – opening balance –2,425 –4,438 – – Impairment 756 – – – Depreciation for the year –13,071 –7,085 –5,317 –3,103Translation differences –2,670 –1,136 –80 –43
Accumulated depreciation, closing balance –62,501 –45,091 –14,496 –9,099
Carrying value 88,822 33,149 45,273 21,095
Intangible fixed assets 139,177 33,149 45,273 21,095
1) Acquired companies for the 2014 financial year refers to Kancelaria Navi Lex SpZ.O.O. Acquired companies for the 2013 financial year refers to the lewis group Ltd.
All licenses and software are acquired externally.
Impairment test for goodwillOn 30 December 2014 Hoist Kredit AB (publ) acquired 100% of the shares in Kancerlaria Navi Lex SpZ.O.O.. In relation to the acquisition, goodwill occurred of approx. SEK 50,355 thousand. No impairment test of the goodwill in Kancelaria Navi Lex SpZ.O.O. has been made as of 31 Decem-ber 2014. For more information regarding the acquisition of Kancelaria Navi Lex SpZ.O.O., refer to note 13.
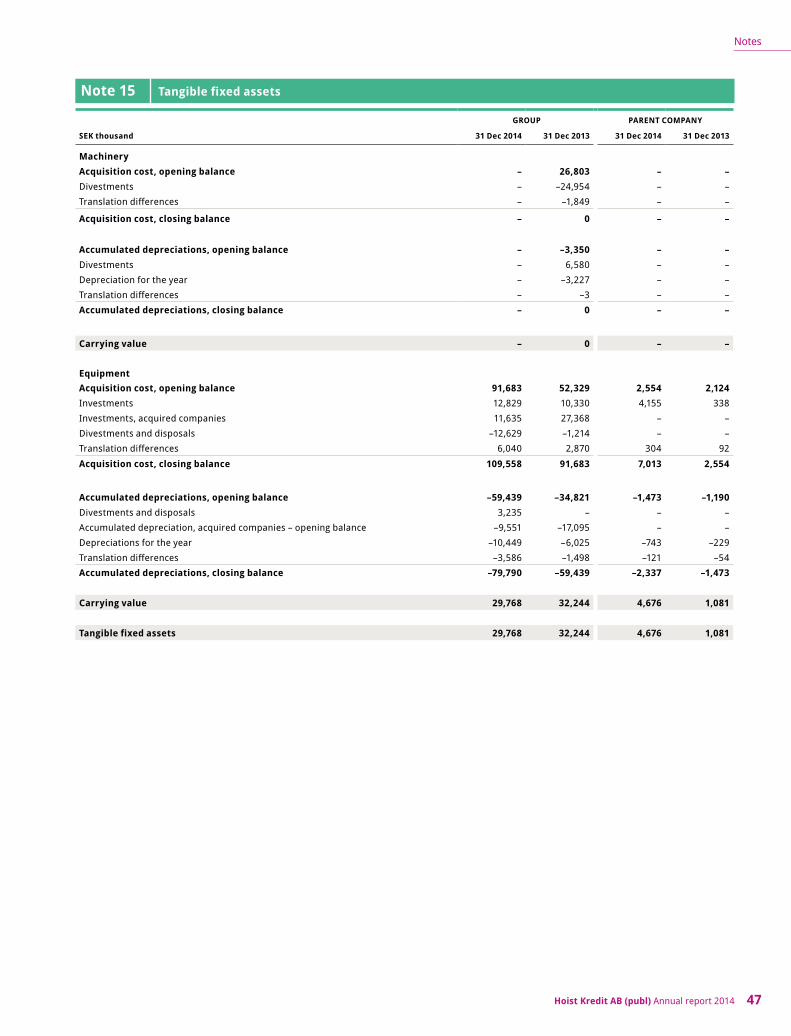
Hoist Kredit AB (publ) Annual report 2014 47
Notes
Note 15 Tangible fixed assets
GROUP PARENT COMPANY
SEK thousand 31 Dec 2014 31 Dec 2013 31 Dec 2014 31 Dec 2013
MachineryAcquisition cost, opening balance – 26,803 – – Divestments – –24,954 – – Translation differences – –1,849 – –
Acquisition cost, closing balance – 0 – –
Accumulated depreciations, opening balance – –3,350 – – Divestments – 6,580 – – Depreciation for the year – –3,227 – – Translation differences – –3 – – Accumulated depreciations, closing balance – 0 – –
Carrying value – 0 – –
EquipmentAcquisition cost, opening balance 91,683 52,329 2,554 2,124Investments 12,829 10,330 4,155 338Investments, acquired companies 11,635 27,368 – – Divestments and disposals –12,629 –1,214 – – Translation differences 6,040 2,870 304 92
Acquisition cost, closing balance 109,558 91,683 7,013 2,554
Accumulated depreciations, opening balance –59,439 –34,821 –1,473 –1,190Divestments and disposals 3,235 – – – Accumulated depreciation, acquired companies – opening balance –9,551 –17,095 – – Depreciations for the year –10,449 –6,025 –743 –229Translation differences –3,586 –1,498 –121 –54Accumulated depreciations, closing balance –79,790 –59,439 –2,337 –1,473
Carrying value 29,768 32,244 4,676 1,081
Tangible fixed assets 29,768 32,244 4,676 1,081

Hoist Kredit AB (publ) Annual report 201448
Notes
Note 16 Other assets
GROUP PARENT COMPANY
SEK thousand 31 Dec 2014 31 Dec 2013 31 Dec 2014 31 Dec 2013
Long-term financial assets 296 278 296 278Long-term receivables 1,843 1,404 – – Derivatives1) – 25,951 – 25,951Short-term tax receivables 18,877 9,128 15,441 4,711VAT receivables 59,385 9,201 2,448 432Accounts receivables 57,872 29,585 5,396 3,270Short-term receivables 67,315 28,409 54,941 16,810Total other assets 205,588 103,956 78,522 51,452
Note 17 Other liabilities
GROUP PARENT COMPANY
SEK thousand 31 Dec 2014 31 Dec 2013 31 Dec 2014 31 Dec 2013
Long-term payables to employees 1,363 – – – Long-term liabilities 47,689 – – – Short-term liabilities 103,479 58,521 209 638Short-term liabilities to Group companies 47,5062) 44,3502) 59,371 95,076Accounts payables 49,531 49,894 28,503 25,624Purchase of portfolios 10,808 5,212 9,777 4,472Liabilities from service billing 3,087 21,690 – – Derivatives1) 246,724 16,329 246,724 16,329VAT liabilities 10,189 10,680 6,660 4,677Tax liabilities on deposit interest 54,812 50,980 54,812 50,980Social security liabilities 15,180 9,586 868 612Other 2,469 2,081 1,261 541Total 592,837 269,323 408,185 198,949
1) Please refer to note 26.2) Refer to Hoist Finance AB (publ).
Note 18 Accrued expenses and prepaid income
GROUP PARENT COMPANY
SEK thousand 31 dec 2014 31 dec 2013 31 dec 2014 31 dec 2013
Short-term provisions for personnel expenses 30,754 24,213 15,021 12,542Unallocated income 13,395 17,419 – – Accrued interest expenses 30,116 22,636 30,116 22,636Accrued commission expenses 13,236 11,079 3,267 2,654Accrued consultancy fees 12,286 10,731 2,134 3,350Other accrued expenses 22,237 3,207 2,304 864Total 122,024 89,285 52,842 42,046
1) Please refer to note 26.

Hoist Kredit AB (publ) Annual report 2014 49
Notes
Note 19 Provisions
Retirement benefits Restructuring reserveOther long term benefits
to employees Other provisions GROUP
SEK thousand31 Dec
201431 Dec
201331 Dec
201431 Dec
201331 Dec
201431 Dec
201331 Dec
201431 Dec
201331 Dec
201431 Dec
2013
Opening balance 26,434 19,199 65,965 11,912 – – 2,161 1,194 94,560 32,305Provision 1,919 2,683 24,023 68,510 1,051 – 1,965 963 28,958 72,156Provision through acquisition – – – – 16,411 – – – 16,411 – Amount released –4,670 – –65,710 –14,457 –1,429 – –1,610 – –73,419 –14,457Changes in value 3,354 4,552 4,271 – 1,936 – 189 – 9,750 4,552Other changes – – –9,168 – – – 1,563 4 –7,605 4Closing balance 27,037 26,434 19,381 65,965 17,969 – 4,268 2,161 68,655 94,560
Retirement benefitsThe Group has defined benefit pension schemes in Hoist GmbH, based on the pensionable remuneration and the length of employee service. Retire-ment benefit obligations are determined using the so-called “Projected Unit Credit Method”, whereby current pensions and vested rights as well as future increases in these parameters are included in the valuation.
GROUP
SEK thousand 31 Dec 2014 31 Dec 2013
Net pension provision, reported in the balance sheetDefined benefit obligations 30,184 29,004Fair value for plan assets 3,147 2,570Outstanding retirement liabilities, net 27,037 26,434
GROUP
SEK thousand 31 Dec 2014 31 Dec 2013
Defined benefit obligationsOpening balance 29,004 19,199Expenses regarding employment during current period 16 2,638Interest expense 754 768Pension payments –872 –1,343Actuarial gains (+)/losses (–) 2,029 – Other increases (–)/decreases (+) –747 7 742Closing balance 30,184 29,004
GROUP
SEK thousand 31 Dec 2014 31 Dec 2013
Plan assetsOpening balance 2,570 – Interest income 74 – Provided funds from employer 872 4 026Paid benefits –872 –1 343Actuarial profits (+)/losses (–) 319 – Currency effects 183 –113Closing balance 3,147 2,570
RestructuringRestructuring provisions of 2013 consists of costs for employee cuts in the lewis group Ltd. Original provision totalled SEK 68,510 thousand and SEK 64,496 thousand remained at year-end 2013. During 2014, SEK 60,046 thousand was used and the SEK 4,452 thousand remaining is expected to be used during 2015. No new provisions are planned to be made, nor any reversals.
Restructuring provisions of 2014 consists of employee cuts in Hoist SAS. Original provision totalled SEK 12,919 thousand and still remained at year-end 2014. The amount is expected to be used during 2015. No new provisions are planned to be made, nor any reversals.
All plan assets are fully placed in investment funds.
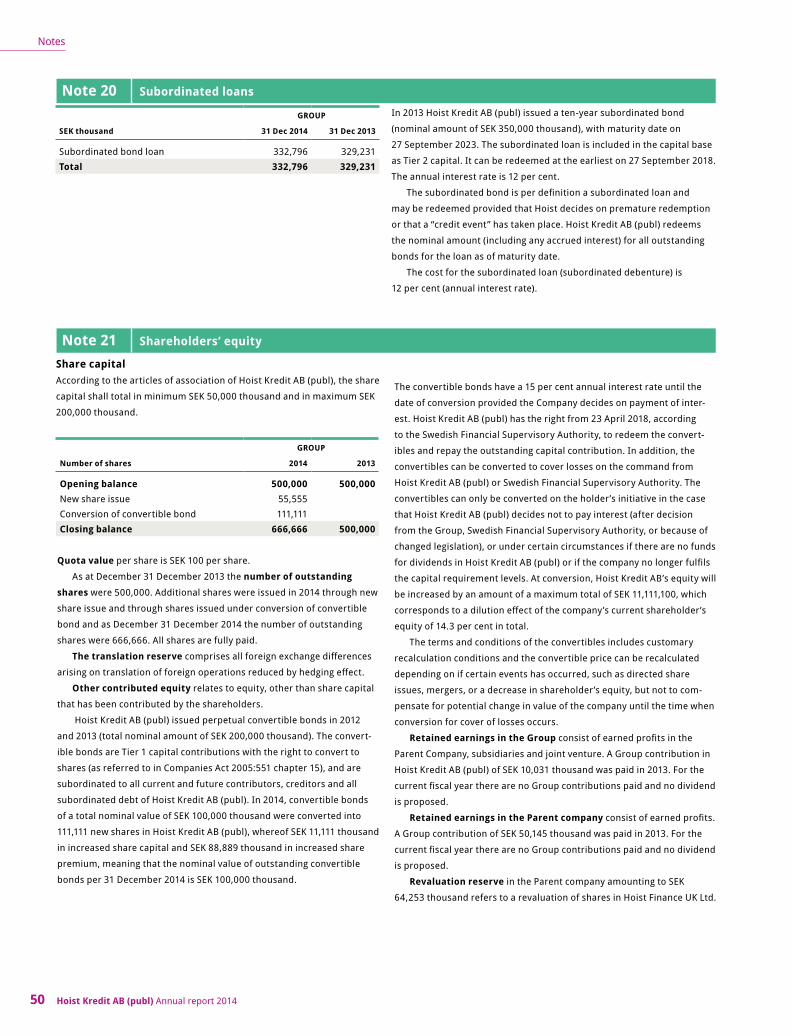
Hoist Kredit AB (publ) Annual report 201450
Notes
Note 20 Subordinated loans
GROUP
SEK thousand 31 Dec 2014 31 Dec 2013
Subordinated bond loan 332,796 329,231Total 332,796 329,231
In 2013 Hoist Kredit AB (publ) issued a ten-year subordinated bond
(nominal amount of SEK 350,000 thousand), with maturity date on
27 September 2023. The subordinated loan is included in the capital base
as Tier 2 capital. It can be redeemed at the earliest on 27 September 2018.
The annual interest rate is 12 per cent.
The subordinated bond is per definition a subordinated loan and
may be redeemed provided that Hoist decides on premature redemption
or that a “credit event” has taken place. Hoist Kredit AB (publ) redeems
the nominal amount (including any accrued interest) for all outstanding
bonds for the loan as of maturity date.
The cost for the subordinated loan (subordinated debenture) is
12 per cent (annual interest rate).
Note 21 Shareholders’ equity
GROUP
Number of shares 2014 2013
Opening balance 500,000 500,000New share issue 55,555Conversion of convertible bond 111,111Closing balance 666,666 500,000
Share capitalAccording to the articles of association of Hoist Kredit AB (publ), the share
capital shall total in minimum SEK 50,000 thousand and in maximum SEK
200,000 thousand.
Quota value per share is SEK 100 per share.
As at December 31 December 2013 the number of outstanding
shares were 500,000. Additional shares were issued in 2014 through new
share issue and through shares issued under conversion of convertible
bond and as December 31 December 2014 the number of outstanding
shares were 666,666. All shares are fully paid.
The translation reserve comprises all foreign exchange differences
arising on translation of foreign operations reduced by hedging effect.
Other contributed equity relates to equity, other than share capital
that has been contributed by the shareholders.
Hoist Kredit AB (publ) issued perpetual convertible bonds in 2012
and 2013 (total nominal amount of SEK 200,000 thousand). The convert-
ible bonds are Tier 1 capital contributions with the right to convert to
shares (as referred to in Companies Act 2005:551 chapter 15), and are
subordinated to all current and future contributors, creditors and all
subordinated debt of Hoist Kredit AB (publ). In 2014, convertible bonds
of a total nominal value of SEK 100,000 thousand were converted into
111,111 new shares in Hoist Kredit AB (publ), whereof SEK 11,111 thousand
in increased share capital and SEK 88,889 thousand in increased share
premium, meaning that the nominal value of outstanding convertible
bonds per 31 December 2014 is SEK 100,000 thousand.
The convertible bonds have a 15 per cent annual interest rate until the
date of conversion provided the Company decides on payment of inter-
est. Hoist Kredit AB (publ) has the right from 23 April 2018, according
to the Swedish Financial Supervisory Authority, to redeem the convert-
ibles and repay the outstanding capital contribution. In addition, the
convertibles can be converted to cover losses on the command from
Hoist Kredit AB (publ) or Swedish Financial Supervisory Authority. The
convertibles can only be converted on the holder’s initiative in the case
that Hoist Kredit AB (publ) decides not to pay interest (after decision
from the Group, Swedish Financial Supervisory Authority, or because of
changed legislation), or under certain circumstances if there are no funds
for dividends in Hoist Kredit AB (publ) or if the company no longer fulfils
the capital requirement levels. At conversion, Hoist Kredit AB’s equity will
be increased by an amount of a maximum total of SEK 11,111,100, which
corresponds to a dilution effect of the company’s current shareholder’s
equity of 14.3 per cent in total.
The terms and conditions of the convertibles includes customary
recalculation conditions and the convertible price can be recalculated
depending on if certain events has occurred, such as directed share
issues, mergers, or a decrease in shareholder’s equity, but not to com-
pensate for potential change in value of the company until the time when
conversion for cover of losses occurs.
Retained earnings in the Group consist of earned profits in the
Parent Company, subsidiaries and joint venture. A Group contribution in
Hoist Kredit AB (publ) of SEK 10,031 thousand was paid in 2013. For the
current fiscal year there are no Group contributions paid and no dividend
is proposed.
Retained earnings in the Parent company consist of earned profits.
A Group contribution of SEK 50,145 thousand was paid in 2013. For the
current fiscal year there are no Group contributions paid and no dividend
is proposed.
Revaluation reserve in the Parent company amounting to SEK
64,253 thousand refers to a revaluation of shares in Hoist Finance UK Ltd.
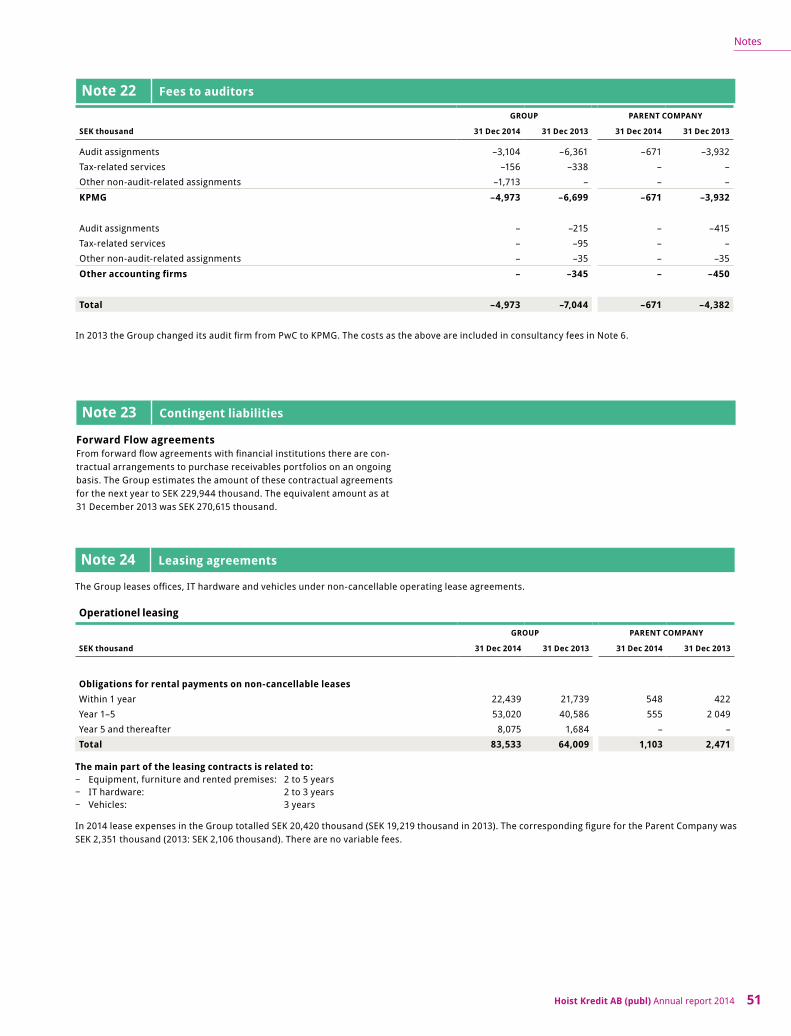
Hoist Kredit AB (publ) Annual report 2014 51
Notes
GROUP PARENT COMPANY
SEK thousand 31 Dec 2014 31 Dec 2013 31 Dec 2014 31 Dec 2013
Audit assignments –3,104 –6,361 –671 –3,932Tax-related services –156 –338 – – Other non-audit-related assignments –1,713 – – –
KPMG –4,973 –6,699 –671 –3,932
Audit assignments – –215 – –415Tax-related services – –95 – – Other non-audit-related assignments – –35 – –35
Other accounting firms – –345 – –450
Total –4,973 –7,044 –671 –4,382
In 2013 the Group changed its audit firm from PwC to KPMG. The costs as the above are included in consultancy fees in Note 6.
Note 22 Fees to auditors
Note 23 Contingent liabilities
Forward Flow agreementsFrom forward flow agreements with financial institutions there are con-tractual arrangements to purchase receivables portfolios on an ongoing basis. The Group estimates the amount of these contractual agreements for the next year to SEK 229,944 thousand. The equivalent amount as at 31 December 2013 was SEK 270,615 thousand.
Note 24 Leasing agreements
The Group leases offices, IT hardware and vehicles under non-cancellable operating lease agreements.
Operationel leasing
GROUP PARENT COMPANY
SEK thousand 31 Dec 2014 31 Dec 2013 31 Dec 2014 31 Dec 2013
Obligations for rental payments on non-cancellable leasesWithin 1 year 22,439 21,739 548 422Year 1–5 53,020 40,586 555 2 049Year 5 and thereafter 8,075 1,684 – – Total 83,533 64,009 1,103 2,471
The main part of the leasing contracts is related to:− Equipment, furniture and rented premises: 2 to 5 years − IT hardware: 2 to 3 years − Vehicles: 3 years
In 2014 lease expenses in the Group totalled SEK 20,420 thousand (SEK 19,219 thousand in 2013). The corresponding figure for the Parent Company was SEK 2,351 thousand (2013: SEK 2,106 thousand). There are no variable fees.

Hoist Kredit AB (publ) Annual report 201452
Notes
Note 25 Financial instruments
Carrying value and fair value of financial instruments
GROUP, 31 DECEMBER 2014
Financial assets/liabilities at fair value through
profit or lossLoans and
receivables
Financial assets
available for sale
Hedge accounting
Other liabilities
Total carrying
value Fair value SEK thousandHeld for trading Identified
Cash 340 340 340Eligible treasury bonds 2,316,110 2,316,110 2,316,110Lending to credit institutions 1,249,192 1,249,192 1,249,192Lending to the public 157,232 157,232 157,232Acquired loan portfolios – of which at fair value 1,460,229 1,460,229 1,460,229 – of which at amortised cost 7,126,553 7,126,553 7,311,207Bonds and other securities 1,926,241 25,000 1,951,241 1,951,241Other financial assets 203,744 203,744 203,744Total 5,702,580 8,737,061 25,000 14,464,640 14,649,295
Deposits from the public 10,987,289 10,987,289 10,987,289Portfolio acquisitions 10,808 10,808 10,808Derivatives1) 243,700 3,024 246,724 246,724Senior unsecured loans 1,493,122 1,493,122 1,681,899Subordinated loans 332,796 332,796 386,750Other financial liabilities 335,305 335,305 335,305Total 243,700 3,024 13,159,320 13,406,044 13,648,775
1) Please refer to note 26.
Carrying value and fair value of financial instruments
GROUP, 31 DECEMBER 2013
Financial assets/liabilities at fair value through
profit or lossLoans and
receivables
Financial assets
available for sale
Hedge accounting
Other liabilities
Total carrying
value Fair value SEK thousandHeld for trading Identified
Cash 197 197 197Lending to credit institutions 3,921,199 3,921,199 3,921,199Lending to the public 328,951 328,951 328,951Acquired loan portfolios – of which at fair value 1,607,061 1,607,061 1,607,061 – of which at amortised cost 4,390,874 4,390,874 4,532,981Bonds and other securities 1,272,677 25,000 1,297,677 1,297,677Derivatives1) 25,021 930 25,951 25,951Other financial assets 76,601 76,601 76,601Total 25,021 2,879,738 8,802,978 25,000 930 11,733,668 11,875,775
Deposits from the public 9,701,502 9,701,502 9,701,502Portfolio acquisitions 5,212 5,212 5,212Derivatives1) 16,329 16,329 16,329Senior unsecured loans 665,680 665,680 676,000Subordinated loans 329,231 329,231 381,500Other financial liabilities 247,783 247,783 247,783Total 16,329 10,949,408 10,965,736 11,028,326
1) Please refer to note 26.

Hoist Kredit AB (publ) Annual report 2014 53
Notes
Carrying value and fair value of financial instruments
PARENT COMPANY, 31 DECEMBER 2014
Financial assets/liabilities at fair value through
profit or lossLoans and
receivables
Financial assets
available for sale
Hedge accounting
Other liabilities
Total carrying
value Fair value SEK thousandHeld for trading Identified
Cash 1 1 1Eligible treasury bonds 2,316,110 2,316,110 2,316,110Lending to credit institutions 248,384 248,384 248,384Lending to the public 157,232 157,232 157,232Acquired loan portfolios – of which at fair value 1,177,466 1,177,466 1,177,466 – of which at amortised cost 1,682,754 1,682,754 1,827,452Receivables Group companies 6,449,675 6,449,675 6,449,675Bonds and other securities 1,926,241 1,926,241 1,926,241Other financial assets 78,522 78,522 78,522Total 5,702,580 8,616,568 14,036,384 14,181,082
Deposits from the public 10,987,289 10,987,289 10,987,289Portfolio acquisitions 9,777 9,777 9,777Derivatives1) 243,700 3,024 246,724 246,724Senior unsecured loans 1,493,122 1,493,122 1,681,899Subordinated loans 332,796 332,796 386,750Other financial liabilities 151,684 151,684 151,684Total 243,700 3,024 12,974,668 13,221,392 13,464,123
1) Please refer to note 26.
Carrying value and fair value of financial instruments
PARENT COMPANY, 31 DECEMBER 2014
Financial assets/liabilities at fair value through
profit or lossLoans and
receivables
Financial assets
available for sale
Hedge accounting
Other liabilities
Total carrying
value Fair value SEK thousandHeld for trading Identified
Cash 1 1 1Lending to credit institutions 3,582,423 3,582,423 3,582,423Lending to the public 325,788 325,788 325,788Acquired loan portfolios – of which at fair value 1,295,106 1,295,106 1,295,106 – of which at amortised cost 1,251,016 1,251,016 1,384,249Receivables Group companies 3,493,834 3,493,834 3,493,834Bonds and other securities 1,272,677 1,272,677 1,272,677Derivatives1) 25,021 930 25,951 25,951Other financial assets 25,500 25,500 25,500Total 25,021 2,567,783 8,678,561 930 11,272,295 11,405,529
Deposits from the public 9,701,502 9,701,502 9,701,502Portfolio acquisitions 4,472 4,472 4,472Derivatives1) 16,329 16,329 16,329Senior unsecured loans 665,680 665,680 676,000Subordinated loans 329,231 329,231 381,500Other financial liabilities 178,149 178,149 178,149Total 16,329 10,879,033 10,895,361 10,957,951
1) Please refer to note 26.
Note 25 Financial instruments, continued

Hoist Kredit AB (publ) Annual report 201454
Notes
Note 25 Financial instruments, continued
Fair value measurements
GroupThe Group uses observable data to the greatest possible extent when assessing the fair value of an asset or a liability. Fair values are catego-rised in different levels in a hierarchy of fair values based on the indata used in the valuation approach according to the following:Level 1) Quoted prices (unadjusted) in active markets for identical
instruments.Level 2) Based on directly or indirectly observable market information
not included in Level 1. This category includes instruments
valued based on quoted prices on active markets for similar instruments, quoted prices for identical or similar instru-ments that are traded on markets that are not active or other valuation techniques where all important indata is directly or indirectly observable in the market.
Level 3) Based on indata that is not observable in the market. This cat-egory includes all instruments where the valuation technique is based on data that is not observable and has substantial impact upon the valuation.
The following table presents the Group’s financial instruments in the balance sheet for information purpose and therefore measured at fair value:
GROUP, 31 DECEMBER 2014
SEK thousand Level 1 Level 2 Level 3 Total
Acquired loan portfolios – – 1,460,229 1,460,229Eligible treasury bonds 2,316,110 – – 2,316,110Bonds and other interest-bearing securities 1,926,241 – – 1,926,241Total assets 4,242,351 – 1,460,229 5,702,579
Derivatives – 246,724 – 246,724Total liabilities – 246,724 – 246,724
GROUP, 31 DECEMBER 2013
SEK thousand Level 1 Level 2 Level 3 Total
Acquired loan portfolios – – 1,607,061 1,607,061Bonds and other interest-bearing securities 1,272,677 – – 1,272,677Derivatives – 25,951 – 25,951Total assets 1,272,677 25,951 1,607,061 2,905,689
Derivatives – 16,329 – 16,329Total liabilities – 16,329 – 16,329
PARENT COMPANY, 31 DECEMBER 2014
SEK thousand Level 1 Level 2 Level 3 Total
Acquired loan portfolios – – 1,177,466 1,177,466Eligible treasury bonds 2,316,110 – – 2,316,110Bonds and other interest-bearing securities 1,926,241 – – 1,926,241Total assets 4,242,351 – 1,177,466 5,419,817
Derivatives – 246,724 – 246,724Total liabilities – 246,724 – 246,724
PARENT COMPANY, 31 DECEMBER 2013
SEK thousand Level 1 Level 2 Level 3 Total
Acquired loan portfolios – – 1,295,106 1,295,106Bonds and other interest-bearing securities 1,272,677 – – 1,272,677Derivatives – 25,951 – 25,951Total assets 1,272,677 25,951 1,295,106 2,593,734
Derivatives – 16,329 – 16,329Total liabilities – 16,329 – 16,329
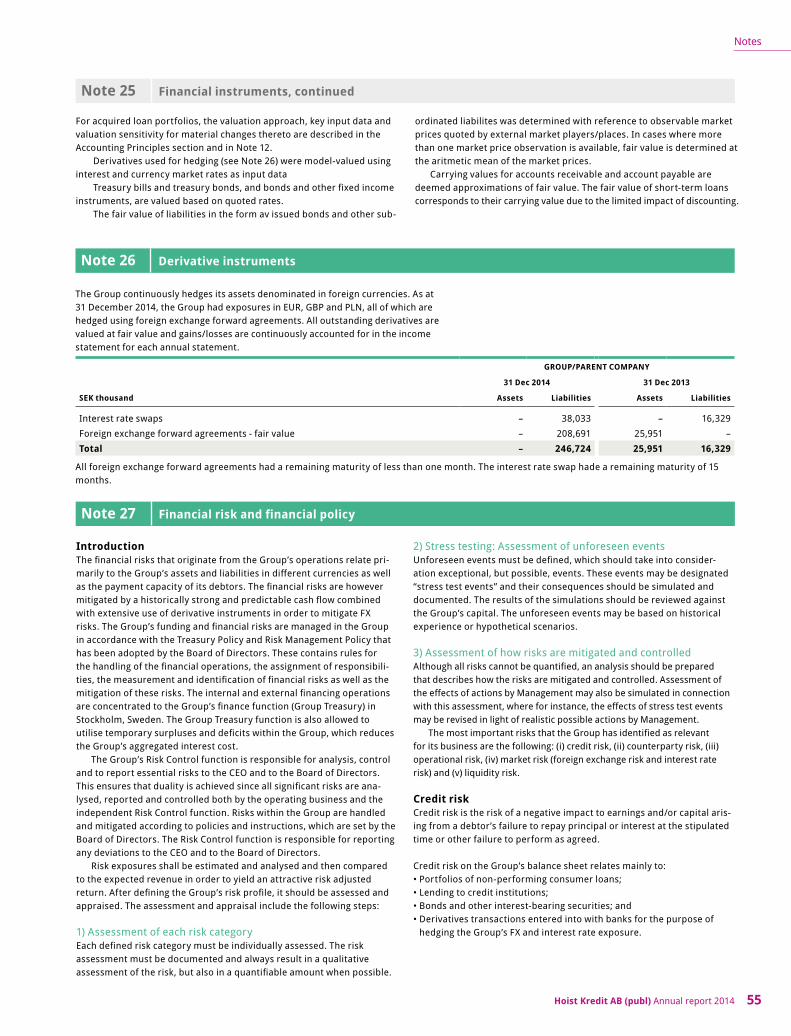
Hoist Kredit AB (publ) Annual report 2014 55
Notes
For acquired loan portfolios, the valuation approach, key input data and valuation sensitivity for material changes thereto are described in the Accounting Principles section and in Note 12.
Derivatives used for hedging (see Note 26) were model-valued using interest and currency market rates as input data
Treasury bills and treasury bonds, and bonds and other fixed income instruments, are valued based on quoted rates.
The fair value of liabilities in the form av issued bonds and other sub-
ordinated liabilites was determined with reference to observable market prices quoted by external market players/places. In cases where more than one market price observation is available, fair value is determined at the aritmetic mean of the market prices.
Carrying values for accounts receivable and account payable are deemed approximations of fair value. The fair value of short-term loans corresponds to their carrying value due to the limited impact of discounting.
Note 25 Financial instruments, continued
Note 26 Derivative instruments
GROUP/PARENT COMPANY
31 Dec 2014 31 Dec 2013
SEK thousand Assets Liabilities Assets Liabilities
Interest rate swaps – 38,033 – 16,329Foreign exchange forward agreements - fair value – 208,691 25,951 – Total – 246,724 25,951 16,329
All foreign exchange forward agreements had a remaining maturity of less than one month. The interest rate swap hade a remaining maturity of 15 months.
The Group continuously hedges its assets denominated in foreign currencies. As at 31 December 2014, the Group had exposures in EUR, GBP and PLN, all of which are hedged using foreign exchange forward agreements. All outstanding derivatives are valued at fair value and gains/losses are continuously accounted for in the income statement for each annual statement.
Note 27 Financial risk and financial policy
IntroductionThe financial risks that originate from the Group’s operations relate pri-marily to the Group’s assets and liabilities in different currencies as well as the payment capacity of its debtors. The financial risks are however mitigated by a historically strong and predictable cash flow combined with extensive use of derivative instruments in order to mitigate FX risks. The Group’s funding and financial risks are managed in the Group in accordance with the Treasury Policy and Risk Management Policy that has been adopted by the Board of Directors. These contains rules for the handling of the financial operations, the assignment of responsibili-ties, the measurement and identification of financial risks as well as the mitigation of these risks. The internal and external financing operations are concentrated to the Group’s finance function (Group Treasury) in Stockholm, Sweden. The Group Treasury function is also allowed to utilise temporary surpluses and deficits within the Group, which reduces the Group’s aggregated interest cost.
The Group’s Risk Control function is responsible for analysis, control and to report essential risks to the CEO and to the Board of Directors. This ensures that duality is achieved since all significant risks are ana-lysed, reported and controlled both by the operating business and the independent Risk Control function. Risks within the Group are handled and mitigated according to policies and instructions, which are set by the Board of Directors. The Risk Control function is responsible for reporting any deviations to the CEO and to the Board of Directors.
Risk exposures shall be estimated and analysed and then compared to the expected revenue in order to yield an attractive risk adjusted return. After defining the Group’s risk profile, it should be assessed and appraised. The assessment and appraisal include the following steps:
1) Assessment of each risk categoryEach defined risk category must be individually assessed. The risk assessment must be documented and always result in a qualitative assessment of the risk, but also in a quantifiable amount when possible.
2) Stress testing: Assessment of unforeseen events Unforeseen events must be defined, which should take into consider-ation exceptional, but possible, events. These events may be designated “stress test events” and their consequences should be simulated and documented. The results of the simulations should be reviewed against the Group’s capital. The unforeseen events may be based on historical experience or hypothetical scenarios.
3) Assessment of how risks are mitigated and controlledAlthough all risks cannot be quantified, an analysis should be prepared that describes how the risks are mitigated and controlled. Assessment of the effects of actions by Management may also be simulated in connection with this assessment, where for instance, the effects of stress test events may be revised in light of realistic possible actions by Management.
The most important risks that the Group has identified as relevant for its business are the following: (i) credit risk, (ii) counterparty risk, (iii) operational risk, (iv) market risk (foreign exchange risk and interest rate risk) and (v) liquidity risk.
Credit riskCredit risk is the risk of a negative impact to earnings and/or capital aris-ing from a debtor’s failure to repay principal or interest at the stipulated time or other failure to perform as agreed.
Credit risk on the Group’s balance sheet relates mainly to:• Portfolios of non-performing consumer loans;• Lending to credit institutions;• Bonds and other interest-bearing securities; and• Derivatives transactions entered into with banks for the purpose of
hedging the Group’s FX and interest rate exposure.

Hoist Kredit AB (publ) Annual report 201456
Notes
The overdue loans are acquired in portfolios at prices that typically vary from less than 1 per cent to 35 per cent of the face value (principal amount) outstanding at the time of acquisition. The price depends on the specific characteristics and composition of the portfolios with respect to, for instance, the size, age, and type of the receivables, as well as the age, location and type of debtors, etc. The credit risk is mainly that the Group overpays for a portfolio and recovers less from the portfolio than expected, ultimately leading to higher than expected impairments of portfolio carrying values. The total credit risk is equal to the fair value of the assets. The majority of the loans are unsecured. However, a limited number of portfolios have properties as collateral. These portfolios had a carrying value of SEK 300 M as at 31 December 2014 (SEK 71 M as at 31 December 2013). Information concerning the geographical distribution of portfolios, the analysis of the opening and closing balances and other portfolio-related information is contained in Note 12. Hoist Finance does not disclose any age analysis of the overdue loans. This information is considered irrelevant as most of Hoist Finance’s portfolios are overdue. A more important parameter in Hoist Finance’s management of credit risk is the cash flow forecast that is disclosed below.
The risk that the acquired loan portfolios do not pay as expected is monitored on a yearly basis by the Risk Management function as actual returns are compared to forecasts. This analysis is also used for the assessment of necessary allocations or portfolio impairments.
The credit risk associated with lending to credit institutions is man-aged in accordance with the Group’s Treasury policy, which regulates the share that may be invested in assets issued by individual counterparties. There are, among other things, restrictions on exposures given the credit ratings of the counterparties.
The table below shows the Standard & Poor’s rating for the Group’s exposures to credit institutions as at 31 December 2014 compared to 31 December 2013
Rating 31 Dec 2014 31 Dec 2013
AAA 40.0% 0.3%AA+ 35.6% 1.6%AA 1.6% 0.0%AA- 0.0% 3.6%A+ 0.9% 14.8%A 14.4% 13.5%A- 4.2% 58.7%BBB+ 0.7% 1.0%BBB 0.9% 0.5%BBB- 0.0% 0.0%BB 0.0% 0.0%B- 0.0% 0.0%N/A 1.5% 6.0%Total, SEK thousand 5,491,543 5,218,876
Whereof bond portfolio 4,242,351 1,297,677
As at 31 December 2014, the weighted average maturity for the assets of the bond portfolio was 1.65 years (1.38 year as of 31 December 2013) and the duration was 3.7 months (2 months 31 December 2013). Duration and maturity are important measures for the assessment of the Company’s interest rate risks and credit spread risks.The credit risks that arise from fixed income instruments or derivative transactions are handled in the same way as other credit risks, i.e. they are co-limited with other exposures and checked against limits.
The Company’s portfolios of performing loans have been classified with respect to risk, taking into account the expected probability of default according to Hoist Finance’s internal scoring model.
Please, refer to “Total credit exposure” in Note 28 for information on total maximal credit exposure. Contingent liabilities are covered in Note 23.
Counterparty riskThe Group has counterparty risk against the institutions which the company conducts its hedging activity with. Derivative transactions are performed solely for the purpose of mitigating FX and interest rate risks in the Group.
Group Treasury manages counterparty risk in accordance with the Treasury policy, which means that whenever Hoist wants to enter into an agreement with a new counterparty, it shall first contact the Group’s Risk Control function. The member of the team who makes contact shall ensure that the Group’s Risk Control has access to information about the counterparty, as well as any draft agreements. Once the counterparty has returned the requested documents, the Group’s Risk Control shall review them.
The Risk Control function controls counterparty risks in accordance with the Risk policy and Risk Control instruction.
The Group has entered into both ISDA and CSA agreements with its counterparties concerning derivative transactions. These agreements facilitate offsetting and daily settlement of credit risk. The counterparty risk against derivative counterparties is therefore at the maximum of one-day fluctuation of the derivative value. The CSA agreement is backed by collaterals in the form of cash.
Note 27 Financial risk and financial policy, continued
Expected cash flow from the Group’s acquired loan portfolios as at 31 December 2014
SEK thousand Up to 1 year 1 to 2 years 2 to 5 yearsOver 5 years
Acquired loan portfolios 2,519,211 2,244,943 4,627,211 4,095,440Total assets 2,519,211 2,244,943 4,627,211 4,095,440
Comparison of expected cash flow from the Group’s acquired loan portfolios as at 31 December 2013
SEK thousand Up to 1 year 1 to 2 years 2 to 5 yearsOver 5 years
Acquired loan portfolios 1,724,132 1,547,590 3,363,343 3,188,339Total assets 1,724,132 1,547,590 3,363,343 3,118,339
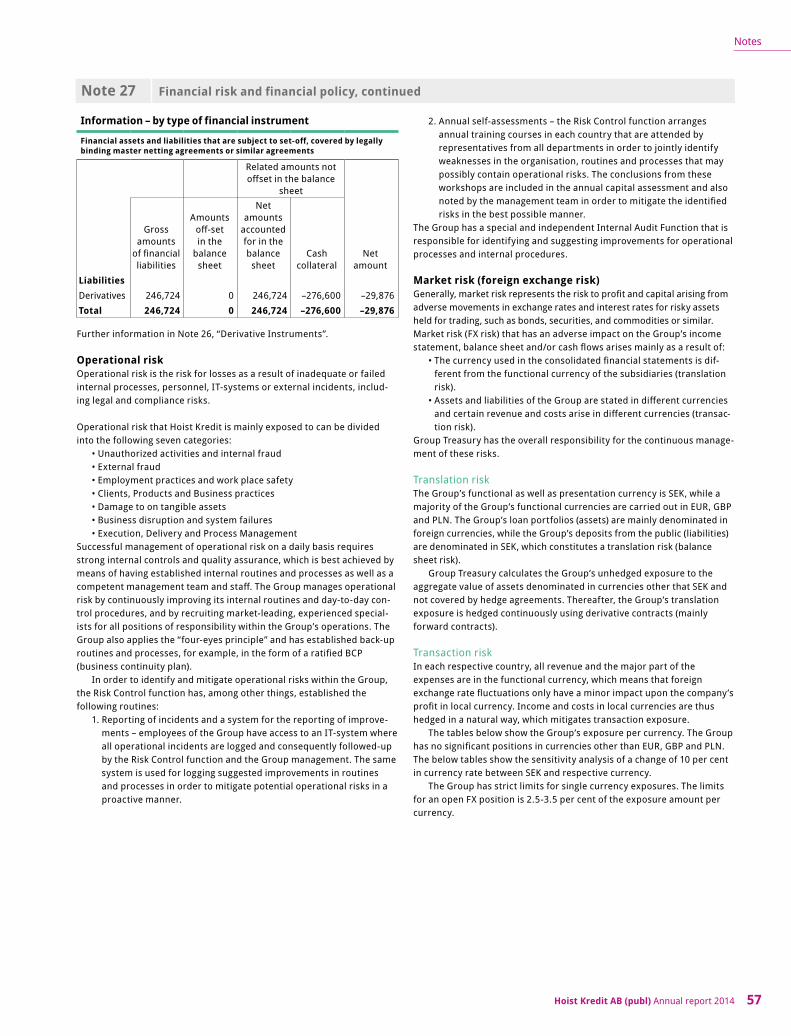
Hoist Kredit AB (publ) Annual report 2014 57
Notes
Information – by type of financial instrument
Financial assets and liabilities that are subject to set-off, covered by legally binding master netting agreements or similar agreements
Related amounts not offset in the balance
sheet
Gross amounts
of financial liabilities
Amounts off-set in the
balance sheet
Net amounts
accounted for in the balance
sheetCash
collateralNet
amountLiabilitiesDerivatives 246,724 0 246,724 –276,600 –29,876Total 246,724 0 246,724 –276,600 –29,876
Further information in Note 26, “Derivative Instruments”.
Operational riskOperational risk is the risk for losses as a result of inadequate or failed internal processes, personnel, IT-systems or external incidents, includ-ing legal and compliance risks.
Operational risk that Hoist Kredit is mainly exposed to can be divided into the following seven categories:
• Unauthorized activities and internal fraud• External fraud• Employment practices and work place safety• Clients, Products and Business practices• Damage to on tangible assets• Business disruption and system failures• Execution, Delivery and Process Management
Successful management of operational risk on a daily basis requires strong internal controls and quality assurance, which is best achieved by means of having established internal routines and processes as well as a competent management team and staff. The Group manages operational risk by continuously improving its internal routines and day-to-day con-trol procedures, and by recruiting market-leading, experienced special-ists for all positions of responsibility within the Group’s operations. The Group also applies the “four-eyes principle” and has established back-up routines and processes, for example, in the form of a ratified BCP (business continuity plan).
In order to identify and mitigate operational risks within the Group, the Risk Control function has, among other things, established the following routines:
1. Reporting of incidents and a system for the reporting of improve-ments – employees of the Group have access to an IT-system where all operational incidents are logged and consequently followed-up by the Risk Control function and the Group management. The same system is used for logging suggested improvements in routines and processes in order to mitigate potential operational risks in a proactive manner.
2. Annual self-assessments – the Risk Control function arranges annual training courses in each country that are attended by representatives from all departments in order to jointly identify weaknesses in the organisation, routines and processes that may possibly contain operational risks. The conclusions from these workshops are included in the annual capital assessment and also noted by the management team in order to mitigate the identified risks in the best possible manner.
The Group has a special and independent Internal Audit Function that is responsible for identifying and suggesting improvements for operational processes and internal procedures.
Market risk (foreign exchange risk)Generally, market risk represents the risk to profit and capital arising from adverse movements in exchange rates and interest rates for risky assets held for trading, such as bonds, securities, and commodities or similar.Market risk (FX risk) that has an adverse impact on the Group’s income statement, balance sheet and/or cash flows arises mainly as a result of:
• The currency used in the consolidated financial statements is dif-ferent from the functional currency of the subsidiaries (translation risk).
• Assets and liabilities of the Group are stated in different currencies and certain revenue and costs arise in different currencies (transac-tion risk).
Group Treasury has the overall responsibility for the continuous manage-ment of these risks.
Translation riskThe Group’s functional as well as presentation currency is SEK, while a majority of the Group’s functional currencies are carried out in EUR, GBP and PLN. The Group’s loan portfolios (assets) are mainly denominated in foreign currencies, while the Group’s deposits from the public (liabilities) are denominated in SEK, which constitutes a translation risk (balance sheet risk).
Group Treasury calculates the Group’s unhedged exposure to the aggregate value of assets denominated in currencies other that SEK and not covered by hedge agreements. Thereafter, the Group’s translation exposure is hedged continuously using derivative contracts (mainly forward contracts).
Transaction riskIn each respective country, all revenue and the major part of the expenses are in the functional currency, which means that foreign exchange rate fluctuations only have a minor impact upon the company’s profit in local currency. Income and costs in local currencies are thus hedged in a natural way, which mitigates transaction exposure.
The tables below show the Group’s exposure per currency. The Group has no significant positions in currencies other than EUR, GBP and PLN. The below tables show the sensitivity analysis of a change of 10 per cent in currency rate between SEK and respective currency.
The Group has strict limits for single currency exposures. The limits for an open FX position is 2.5-3.5 per cent of the exposure amount per currency.
Note 27 Financial risk and financial policy, continued

Hoist Kredit AB (publ) Annual report 201458
Notes
Group’s FX risk in EUR
31 Dec 2014 31 Dec 2013Impact onshareholders’
equity
Assets on the balance sheet, EUR M 532.9 485.4 Forward hedge, EUR M –528.5 –482.0 Net exposure, EUR M 4,417 3,431
If the EUR/SEK rate increases by 10 per cent, this will have an impact on the consolidated profit of SEK thousand 4,203 3,069 <1%If the EUR/SEK rate decreases by 10 per cent, this will have an impact on the consolidated profit of SEK thousand –4,203 –3,069 –<1%
Group’s FX risk in PLN
31 Dec 2014 31 Dec 2013Impact onshareholders’
equity
Assets on the balance sheet, PLN M 624.7 443.9 Forward hedge, PLN M –619.0 –436.5 Net exposure, PLN M 5,676 7,441
If the PLN/SEK rate increases by 10 per cent, this will have an impact on the consolidated profit of SEK thousand 1,256 1,576 <1%If the PLN/SEK rate decreases by 10 per cent, this will have an impact on the consolidated profit of SEK thousand –1,256 –1,576 –<1%
Group’s FX risk in GBP
31 Dec 2014 31 Dec 2013Impact onhareholders’
equity
Assets on the balance sheet, GBP M 158,8 123,7 Forward hedge, GBP M –152,0 –123,0 Net exposure, GBP M 6,836 0,708
If the GBP/SEK rate increases by 10 per cent, this will have an impact on the consolidated profit of SEK thousand 8,298 744 <1%If the GBP/SEK rate decreases by 10 per cent, this will have an impact on the consolidated profit of SEK thousand –8,298 –744 –<1%
Note 27 Financial risk and financial policy, continued
Market risk (interest rate risk)The interest rate risk in the Group arises from two sources: the risk that the net interest income is affected negatively by fluctuations in the prevailing interest rates and the risk of losses due to the effect of interest rate changes upon the values of assets and liabilities.
The difference between interest income and financing cost (net inter-est income) in the Group may result in a weaker profitability. A sudden and permanent interest rate change would have a negative impact on the Group’s profit to the extent interest rates and interest costs on loans and deposits from the public are affected by the increase in market rates at the same time as income from loan portfolios remains unchanged.
Other interest rate risk pertains to the fluctuations in fair values of balance sheet items, primarily certain acquired loan portfolios as well as the Group’s excess liquidity that has been invested in a bond portfolio.
The objective concerning the bond portfolio is to mitigate the interest rate risk at the same time as returns are maximised according to the guidelines in the Treasury policy. In addition, the Group aims at a high level of financial flexibility in order to satisfy future liquidity require-ments. Placements are thus made in interest bearing securities with short maturities and high liquidity. Please, refer to the section concern-ing credit risk above.
Group Treasury mitigates both interest rate risks described above to a certain extent by continuously hedging the Group’s interest rate exposure through interest rate swaps in SEK. Generally, the maturity of the swaps is less than 12 months.
The table below shows the effect upon various assets and liabilities of a sudden and enduring parallel shift in the yield curve, of market rate of interest by 100 basis points.
Interest rate risk of the Group, items valued at fair value
Total items valued at fair value including derivatives (SEK thousand)Impact on profit or loss
Dec 2014 Impact on profit or loss
Dec 2013
Impact onshareholders’
equity
–100 bps +100 bps –100 bps +100 bps Bond portfolios 16,066 –16,066 2,155 –2,155 Interest rate swaps –50,000 50,000 –61,333 61,333 Total –33,934 33,934 –59,178 59,178 2.5%
A sensitivity analysis is presented in not 12 for portfolios at fair value.

Hoist Kredit AB (publ) Annual report 2014 59
Notes
Note 27 Financial risk and financial policy, continued
In terms of an interest rate change, the change in profitability is shown below:
Total items valued at fair value including derivatives (SEK thousand)Impact on profit or loss
Dec 2014 Impact on profit or loss
Dec 2013
Impact onshareholders’
equity
–100 bps +100 bps –100 bps +100 bps Efficient net interest income (over one year) 48,105 –48,105 64,245 –64,245 Efficient derivatives (momentum effect) –50,000 50,000 –61,333 61,333
Total effect of change in short interest rate –1,895 1,895 2,912 –2,912 0.14%
Hoist Kredit has strict limits for maximum allowed interest rate exposure. Currently, no interest rate exposures exceeding a sensitivity
of SEK 50 M for 100 bps interest rate curve parallel shift are allowed.
Liquidity riskLiquidity risk is the risk of the Group being unable to meet its payment obligations due to insufficient availability of cash and cash equivalents in the Group.
The Group’s revenues and costs are relatively stable, therefore Liquidity Risk in the Group is linked primarily to the Group’s funding through deposits from the public and the risk of large redemptions occurring at short notice.
The overall objective for the Group’s liquidity management is to ensure that the Group maintains control over its liquidity situation leaning back on sufficient cash and cash equivalents or instantly sellable assets in order to fulfil its payment obligations in due time without incurring high extra costs. The size of the liquidity reserve is annually determine by Treasury through the ILAA (Internal Liquidity Adequacy Assessment) process. Through ILAA the liquidity demand is determined under stressed conditions and concludes in an amount the Group needs. During the year, the Group has had a total liquidity reserve that has well exceeded the need according to ILAA.
Receivables are mainly fallen due claims, hence a normal duration profile is not applicable. Given that the claims are not statute – barred, they will remain unchanged until the customer has either fully paid or the claim is written off according to a credit decision.
The Group has a diversified funding base with a differentiated maturity structure1) , both in the form of issued senior unsecured bonds and through deposits from the public. Although most of the deposits from the public are payable on demand, the Group believes, based on past client behaviour that a large portion of deposits can be treated as a longer maturity. In addition, some 31 per cent of the Group’s deposits from the public are secured in longer maturities, so-called term deposits, with maturities ranging from 12 to 36 months. In accordance with the Treasury policy, the Group keeps a liquidity reserve of at least 30 per cent of the total deposit base to reflect the nature of the deposits. As at 31 December 2013, the liquidity reserve was 50.3 per cent of the total deposit volume (50.4 per cent as at 31 December 2013 and 36.3% 2012).
Besides a diversified funding structure, the Group conducted a num-ber of activities to minimise liquidity risk:• Centralised liquidity management: The handling of liquidity risk is
centralised and is handled by the Group Treasury. The results of the liquidity management are reported on a regular basis to the Board of Directors.
• Independent analysis: The Group’s Risk Management function acts as the central function for independent liquidity analysis, and the Internal Audit function is responsible for auditing the Group’s liquidity manage-ment tools.
• Continuous monitoring: In order to monitor its liquidity position and mitigate liquidity risk, the Group uses liquidity forecasting systems, which provide on-going information on imminent, medium-term and long-term liquidity needs, and minimise the risk of facing unforeseen liquidity requirements.
• Stress testing: The Group performs stress tests on the liquidity situa-tion. These stress tests vary in nature in order to illustrate the risk from multiple angles and to avoid negative consequences as a result of stress test methodology shortcomings.
• Liquidity reserve: The Group holds a minimum of 30 per cent of the deposits, from the public as a liquidity reserve to meet potential short-term redemption requests.
• Liquidity placements are made in low-risk, high-liquidity interest- bearing securities on the overnight market, i.e. with an established second-hand market which allows for cash conversion if needed.
In addition, a contingency plan regarding liquidity risk have been put in place, which among other things identifies special events that can trigger the contingency plan and what actions must be taken. These events may include:• The aggregate amount of total available liquidity is below 20 per cent of
the total deposit base• An unexpected outflow of more than 20 per cent during a 30-day
period.• Financing sources exceeding SEK 50 M cease or are revoked.
In accordance with an adopted crisis management policy, the crisis management team of the Group jointly decides on the implementation of these instructions.
For the purpose of foreign exchange and interest rate exposure hedg-ing, the Group uses foreign exchange and interest rate derivative instru-ments (Note 26). In order to avoid possible liquidity risk and/or counter-party risk in connection with these derivatives, the Group applies ISDA and CSA agreements with all derivative counterparties. CSA agreements regulate the right to collect collaterals in order to eliminate the exposure that arises in connection with derivatives transactions. CSA agreements also include agreements on netting concerning foreign exchange transac-tions. There are daily settlements of derivative contracts independent of the financial outcome. In such a way, liquidity- and counterparty risks in derivative transactions are mitigated.
Areas of responsibilityThe Group has allocated the responsibilities with regards to the risks involved in its business as follows:
The management bodyThe Internal Capital Adequacy Assessment Process (ICAAP) is the responsibility of the Group’s Board of Directors and Management.As such, the Board of Directors is responsible for ensuring that:• Hoist Finance AB (publ) and the Financial Group of undertaking
have an ICAAP.• The ICAAP is consistent with the Group’s risk profile and operating
environment.• The ICAAP is documented.
1) Tables of maturity analysis for the Group’s liabilities are not discounted. Please refer to Note 10 for asset and liabilities. Possible liquidity effect from CSA agreements totals, according to the latest ILAA, SEK 396 M in a stressed scenario.

Hoist Kredit AB (publ) Annual report 201460
Notes
Note 27 Financial risk and financial policy, continued
• The ICAAP is an integral part of the Group’s strategy and decision mak-ing, and satisfies the usability requirement.
• The ICAAP is reviewed on a regular basis.• The circumstances under which the process and the calculations in the
process shall be reviewed or adjusted are clearly defined.
The Risk Control functionThe Risk Control function is responsible for carrying out the daily work with the ICAAP within the Group. This requires the Risk Control function to:• Drive the process to calculate the capital need by using the model
described in the next section.• Lead the workshops for risk assessments.• Quantify the risks in the model in a way that the requirements on the
risk assessments to be forward-looking are being met.• Review the model itself and suggest improvements if necessary (such
modifications of the model to be decided by the Board of Directors).• Perform the self-assessment process at least once a year or when exter-
nal or internal circumstances so require.
The Compliance functionThe Compliance function is responsible for ensuring that the company complies with all legal requirements and guidelines from Basel III rules and regulations. As such, the Compliance function is required to:• Monitor legal work related to Basel III and the Internal Capital Ade-
quacy Assessment Process.• Verify that internal documents and instructions meet the requirements
of the Basel III guidelines and the Internal Capital Adequacy Assess-ment Process.
• Take initiative for updating any of the Company’s documents related to Basel III and the Internal Capital Adequacy Assessment Process as required.
The Compliance function reports directly to the Board of Directors.
The Internal Audit functionThe Internal Audit function is responsible for evaluating and checking that the Group’s work relating to Basel III follows the instructions set out in any of the Group’s documents related to Basel III. This responsibility means the following:• Verify that the ICAAP-work is performed as prescribed in this docu-ment.• Verify that the results from the ICAAP are used as an integral part of the
business as follows: Plans, investments in new business areas or busi-ness ventures, as well as any other actions undertaken by Management and the Group, are evaluated in light of their impact on the Group’s capital need.
• Capital needs are taken into account when preparing forecasts for future financial years.
An independent review of the Group’s instructions and policies is carried out by the Group’s Internal Audit, or in accordance with an audit plan adopted by the Board of Directors. The result of the review is reported to the Board of Directors on a regular basis. Through this reporting, com-bined with the financial reporting, the Board of Directors is able to con-stantly judge the risk level in the Group and make required adjustments as and when necessary. The Internal Audit function reports directly to the Board of Directors.
The Financial Control functionThe Financial Control function is responsible for ensuring that the Group’s Management and Board always have accurate and timely infor-mation regarding the Group’s performance and operations. The Financial Control function is also responsible for the ICAAP process managing it.
The Financial Control function acts in accordance with strict instruc-tions set by the Management with regards to monitoring and reporting financial performance. The Group’s systems allow for daily monitoring of financial performance, and the Management and the Board of Directors are constantly provided with updated performance measures as and when required.
The Assessment ProcessThe Internal Capital Adequacy Assessment Process (ICAAP) is a contin-uously ongoing process carried out by the Management of the Group, which reviews, assesses and quantifies the risks that the Group is subject to in carrying out its operations. The process and methodology is also reviewed at least once a year.
The focus for the annual review of the process is to make sure that the process is always relevant to the current risk profile and business activities of the Group. The Board of Directors decides on any changes in the process and the Internal Audit verifies that the process is carried out according to the instructions given by the Board of Directors.
The process starts with the Management Group’s plans for the near future as well as the Management Group’s views on the market in which the Company operates, which are formalised into a forecast for the next year. The ICAAP-process takes these forecasts as a starting point and as a first step assesses the risks inherent in these forecasts.
Market risks and credit risks are stress tested rigorously in order to assess the amount of losses that the Company may incur as a result of extremely negative circumstances. This estimated loss is compared to the statutory amount calculated in Pillar I. In the event that the simu-lated amount exceeds the statutory amount, further provisions are made in Pillar II.
The assessment of the operational risks is conducted through a number of workshops lead by the Risk Manager of the Group. During the workshops all material risks in the Group are assessed and quantified, using both qual-itative and quantitative methods. The methods will vary depending on the specific risk that is being measured and are designed to be properly usable as well as relevant to the Group, its business and its associated risks. Once the operational risks are quantified, the next step is to calculate the capital required to cover all identified risks that need to be provided for. Correla-tions between different risks are not taken into account unless it is obvious that certain risks cannot exist simultaneously, or that a certain risk would be over- or understated if not adjusted for its correlation with another risk. A comparison between calculated capital requirements and the statutory amount according to Pillar II is made. Any excess risk of losses is covered by additional provisions in Pillar II. It is also at this stage that provisions for possible regulatory buffers are taken into consideration.
The aggregated capital requirement that emanates from the assessment is used by the Management as a decision-making tool in the context of making future plans for the Group. As such, the Internal Capital Adequacy Assessment Process adds a further dimension to the decision-making in the Group, in addition to strategic and day-to-day planning; strategic plans, forecasts for the future and immediate man-agement decisions are always reviewed in light of the resulting capital requirements before being implemented. Decisions and their implemen-tations will form the basis for formulating new forecasts; once these are completed the process starts all over again.
The Company has sufficient capital base to meet unexpected financial outcomes with regards to the company’s risk exposure.

Hoist Kredit AB (publ) Annual report 2014 61
Notes
Note 28 Capital adequacy assessment
The information in this Note contains such information that shall be disclosed in accordance with FFFS 2008:25 regarding annual reports for credit institutions and concerns such information as specified in FFFS 2014:12. The information relates to the Hoist Finance AB (publ) consoli-dated situation and Hoist Kredit AB (publ) which is the regulated entity. For more information on the legal entities included, see Note 12. The only difference between the consolidated accounts and the consolidated situa-tion for capital adequacy purposes is that the equity method is applied in the consolidated accounts whereas the proportional method is applied for the joint venture in relation to capital adequacy reporting.
When establishing the company’s statutory capital requirements the following laws and regulations apply; the EU Regulation No 575/2013 on prudential requirements for credit institution and investment firms, the Swedish law 2014:968 Supervision on credit institutions and securities companies, and the Swedish law 2014:966 on capital buffers. The purpose of these laws and regulations is to ascertain that the licensed institution and its consolidated situation manages its risks and protects its custom-ers. According to the regulations, the capital base shall cover the capital requirements including the minimum capital requirements (the capital requirements for credit risk, market risk and operational risk) and the capital requirements for all other essential risks i.e. Pillar II risks.
Total Capital
Hoist Finance consolidated situation Hoist Kredit AB (publ)
SEK thousand 31 Dec 2014 31 Dec 2013 31 Dec 2014 31 Dec 2013
Core primary capital in capital adequacy 1,304,189 622,440 1,182,658 457,739Proposed dividend – – – – Intangible fixed assets –171,048 –64,282 –45,273 –21,095Deferred tax assets –70,885 –62,254 –1,249 –1,121Regulatory dividend deduction –5,000 – – –
Core primary capital 1,057,257 495,904 1,136,136 435,523
Additional Tier I capital 93,000 193,000 93,000 193,000
Total Tier I capital 1,150,257 688,904 1,229,136 628,523
Tier II capital instruments 332,796 329,231 332,796 329,231Regulatory adjustments –106,655 – –111,814 –14,969
Tier II capital 226,141 329,231 220,982 314,262
Total capital for capital adequacy purpose1) 1,376,398 1,018,135 1,450,118 942,785
1) Total capital equals Total eligible capital. Hoist Kredit has chosen not to apply article 494 of the EU regulation No 575/2013. This means that Hoist Finance conservatively calculate eligible capital and not include Tier II capital not available for capital adequacy purposes. From the total nominal amount of Tier I and additional Tier I capital contribution transaction costs are deducted, that is why only SEK 93,000 thousand of the total SEK 100,000 thousand is reflected in the table above.
The capital situation for the Financial Group and the regulated Hoist Kredit AB can be summarized as follows:
Total Capital requirement
Hoist Finance consolidated situation Hoist Kredit AB (publ)
SEK thousand 31 Dec 2014 31 Dec 2013 31 Dec 2014 31 Dec 2013
Institutions 54,575 82,736 24,704 77,228 – of which counterparty risk 1,701 1,237 1,701 1,237Corporate 11,702 17,126 425,346 284,215Retail 8,222 13,162 7,849 13,162Exposures in default 707,040 496,413 234,038 209,193Other items 18,641 12,947 139,936 40,477
Credit risk (standardised approach) 800,180 622,384 831,872 624,275
Operational risks (basic indicator approach) 93,379 77,789 41,049 43,280
Foreign exchange risk 11,005 4,346 11,005 3,467
Credit valuation adjustment (standardised approach) – – – –Total capital requirement 904,564 704,519 883,926 671,022
Total risk-weighted amount 11,307,052 8,806,488 11,049,076 8,387,775

Hoist Kredit AB (publ) Annual report 201462
Notes
Note 28 Capital adequacy assessment, continued
Capital requirement and capital buffers
Hoist Finance consolidated situation Hoist Kredit AB (publ)
SEK thousand 31 Dec 2014 31 Dec 2013 31 Dec 2014 31 Dec 2013
Common equity Tier I ratio 9.35% 5.63% 10.28% 5.19%Tier I capital ratio 10.17% 7.82% 11.12% 7.49%Total capital ratio 12.17% 11.56% 13.12% 11.24%
Institution specific requirement on common equity Tier I capital 7.00% – 7.00% – Whereof: Pillar I common equity Tier I capital requirement 4.50% – 4.50% – of which: Capital conservation buffer requirement 2.50% – 2.50% – of which: Contra cyclical capital buffer requirement – – – –
Pillar II common equity Tier I capital requirement 0.61% – 0.62% –
Total common equity Tier I capital requirement 7.61% – 7.62% –
Surplus common equity Tier I capital 1.75% – 2.66% – Surplus Tier I capital 1.07% – 2.00% – Surplus total capital 1.07% – 2.00% –
Pillar II-risks
Hoist Finance consolidated situation Hoist Kredit AB (publ)
SEK thousand 31 Dec 2014 31 Dec 2013 31 Dec 2014 31 Dec 2013
Credit risk – – – – Market risk (Currency risk) 2,925 1,535 2,925 1,535 Liquidity risk – – – – Concentration risk 9,360 – 9,360 – Reputational risk 15,316 1,089 15,316 1,089 Interest rate risk 37,550 5,463 37,550 5,463 Strategic risk 3,300 332 3,300 332 Operational risk – – – – Capital requirement according to Pillar II 68,451 8,419 68,451 8,419
The capital base for the consolidated situation as at December 31 2014 was SEK 1,376 M (SEK 1,018 M as at 31 December 2013), which exceeds the capital requirement by a wide margin.
As is presented in the above tables, there are both issued Tier 1 capital instruments and supplementary capital instruments which are calculated in the capital base of the Group. These instruments are described briefly below.
Tier I capital instrumentsThe tier 1 capital instrument consists of convertibles totalling a nominal amount of SEK 100 M. The convertibles were issued for the purpose of increase Hoist Kredit ABs Tier 1 capital level. The instruments are convertible debentures without amortisation and can only be repaid in a potential liquidation of Hoist Kredit, and then after all other creditor in Hoist Kredit. The convertibles are issued with an annual interest rate of 15 per cent.
Supplementary capital instrumentsA debenture of SEK 350 M was issued during 2013 with a maturity in 2023. The debenture is constructed as a supplementary capital base instrument and has a fixed coupon of 12 per cent the first five years and a variable rate thereafter.
There are no existing or expected actual or legal obstacles for an immediate transaction of liquid funds or repayment of debt between the companies and subsidiaries.
Additional information on capital adequacy is provided in the Company’s Pillar III-report that is published on the Group’s web:www.hoistfinance.com.

Hoist Kredit AB (publ) Annual report 2014 63
Notes
Note 29 Critical estimates and assumptions
The Management and the Board of Directors have discussed the develop-ments, choices and disclosures regarding the Group’s critical accounting principles and estimates as well as the application of these principles and estimates. They have also discussed and assessed future assumptions and other important sources of uncertainty in the assumptions as per balance sheet date that may represent a substantial risk for material restate-ments of the reported amounts in the financial statements in the coming financial years.
Certain critical estimates have been made through the application of the Group’s accounting principles described below.
Valuation of acquired loan portfoliosAs indicated in Note 12, the recognition of purchased receivables is based on the Group’s own forecast of future cash flows from acquired portfo-lios. Although the Group historically has had good forecast accuracy with regard to cash flows, future deviations cannot be ruled out. The Group applies internal rules and a formalized decision-making process for the adjustment of previously adopted cash flow forecasts. The internal rules are based on a constant ten-year period. A 12 per cent IRR over a period of ten years, which is in line with current and relevant transactions within the industry, is applied on portfolios acquired prior to 1 July 2011. An IRR based on the acquisition date for specific portfolios is used on portfolios acquired post 1 July 2011.
The effect of these principles is that during the first year that a port-folio is owned, the cash flow forecast is adjusted only on an exceptional basis. All amendments in cash flow forecasts are finally subject to deci-sions. For a sensitivity analysis, please refer to Note 12.
Changes in tax expensesHoist Finance operates across borders and manages its consolidated tax issues relating to subsidiaries in several jurisdictions. The Group is
therefore exposed to potential tax risks that arise from the interpretation and implementation of existing laws, treaties, regulations, and guidance on taxation varies, inter alia, income tax and VAT.
Classification of group companies in JerseyThe two group companies located on Jersey, Hoist Portfolio Holding Ltd and Hoist Portfolio Holding 2 Ltd, have an ongoing case with the Financial Supervisory Authority on Jersey, JFCS, regarding to what extent the com-panies, primarily in money laundering purposes (AML), shall be deemed to be operating in local lending activities. The companies would then then have to comply with local requirements and local executives. It is unclear to what extent the companies can rely on the expanded AML organization found in the group companies, which handle the Jersey companies’ credit portfolios. The status of the case is, as of the date of this Annual Report, that the companies need to have local procedures and management and this is being developed in consultation with the JFSC. The local AML-or-ganisation is expected to be in place and be approved by the JFSC in 2015. This has not affected the expected cost or the conduct of their operations to any significant degree. The Group does not expect any other conse-quences based on the JFSC’s assessment. This is supported by the advice in the matter of local legal counsel, and from the positive dialogue with the JFSC.
GROUP Hoist Finance AB (publ)
GROUP Other related parties
31 Dec 2014 31 Dec 2013 31 Dec 2014 31 Dec 2013
AssetsReceivables Group companies 143,635 85,158 – –
Lending to the public – – – 9,915Other assets – – – 2,678
LiabilitiesOther liabilities 47,506 44,350 58 –
GROUP Hoist Finance AB (publ)
GROUP Other related parties
2014 2013 2014 2013
Operating incomeInterest income 1,262 2,828 153 1,288Interest expense – 1,373 – –Other income 5,837 102,381 – 1,290
Operating expensesOther expenses 55,407 142,125 2,4331) 21,0251)
Note 30 Related party transactions
The information below is presented from Group’s perspective and shows how the Group’s financial information has been effected by transactions with related parties
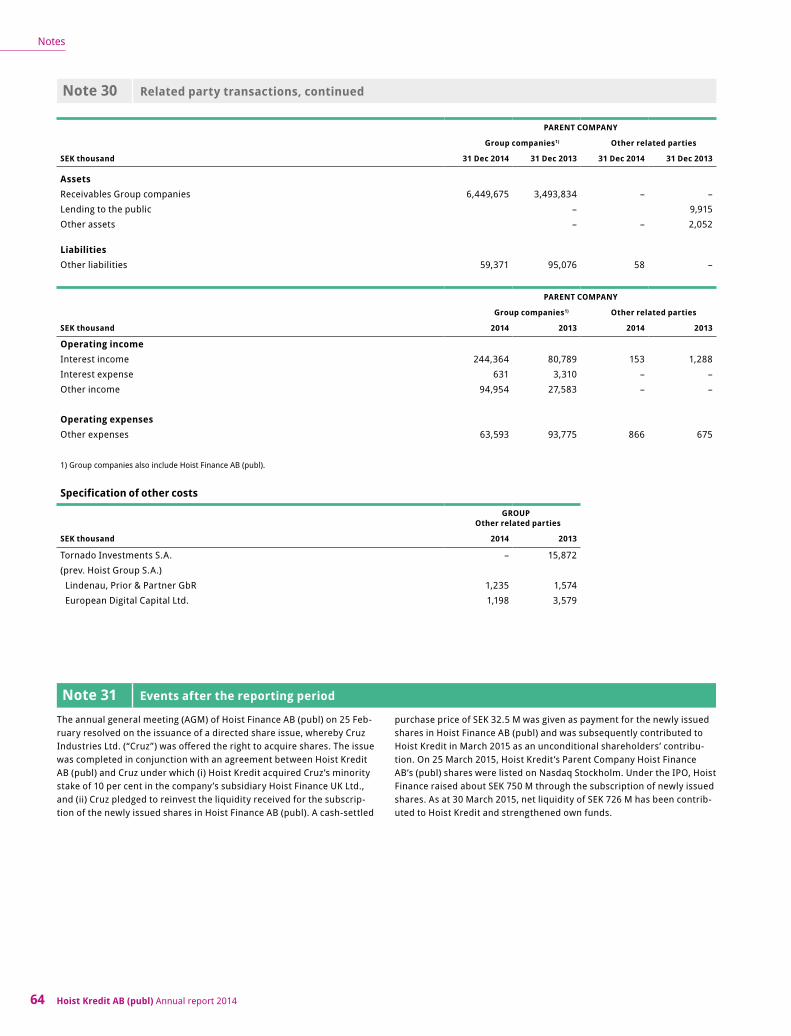
Hoist Kredit AB (publ) Annual report 201464
Notes
Note 30 Related party transactions, continued
PARENT COMPANY
Group companies1) Other related parties
SEK thousand 31 Dec 2014 31 Dec 2013 31 Dec 2014 31 Dec 2013
AssetsReceivables Group companies 6,449,675 3,493,834 – –Lending to the public – 9,915Other assets – – 2,052
LiabilitiesOther liabilities 59,371 95,076 58 –
PARENT COMPANY
Group companies1) Other related parties
SEK thousand 2014 2013 2014 2013
Operating incomeInterest income 244,364 80,789 153 1,288Interest expense 631 3,310 – –Other income 94,954 27,583 – –
Operating expensesOther expenses 63,593 93,775 866 675
1) Group companies also include Hoist Finance AB (publ).
Specification of other costs
GROUP Other related parties
SEK thousand 2014 2013
Tornado Investments S.A. – 15,872(prev. Hoist Group S.A.) Lindenau, Prior & Partner GbR 1,235 1,574 European Digital Capital Ltd. 1,198 3,579
Note 31 Events after the reporting period
The annual general meeting (AGM) of Hoist Finance AB (publ) on 25 Feb-ruary resolved on the issuance of a directed share issue, whereby Cruz Industries Ltd. (“Cruz”) was offered the right to acquire shares. The issue was completed in conjunction with an agreement between Hoist Kredit AB (publ) and Cruz under which (i) Hoist Kredit acquired Cruz’s minority stake of 10 per cent in the company’s subsidiary Hoist Finance UK Ltd., and (ii) Cruz pledged to reinvest the liquidity received for the subscrip-tion of the newly issued shares in Hoist Finance AB (publ). A cash-settled
purchase price of SEK 32.5 M was given as payment for the newly issued shares in Hoist Finance AB (publ) and was subsequently contributed to Hoist Kredit in March 2015 as an unconditional shareholders’ contribu-tion. On 25 March 2015, Hoist Kredit ’s Parent Company Hoist Finance AB’s (publ) shares were listed on Nasdaq Stockholm. Under the IPO, Hoist Finance raised about SEK 750 M through the subscription of newly issued shares. As at 30 March 2015, net liquidity of SEK 726 M has been contrib-uted to Hoist Kredit and strengthened own funds.
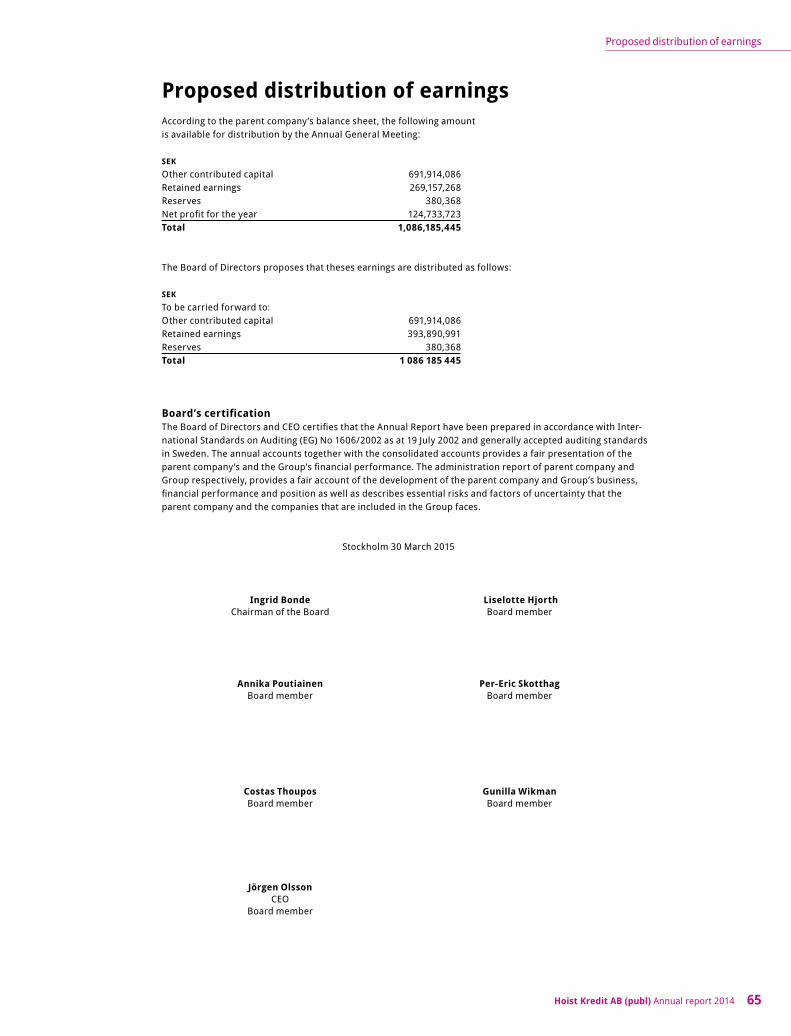
Hoist Kredit AB (publ) Annual report 2014 65
Proposed distribution of earnings
Proposed distribution of earningsAccording to the parent company’s balance sheet, the following amount is available for distribution by the Annual General Meeting:
SEKOther contributed capital 691,914,086Retained earnings 269,157,268Reserves 380,368Net profit for the year 124,733,723Total 1,086,185,445
The Board of Directors proposes that theses earnings are distributed as follows:
SEKTo be carried forward to: Other contributed capital 691,914,086Retained earnings 393,890,991Reserves 380,368Total 1 086 185 445
Board’s certificationThe Board of Directors and CEO certifies that the Annual Report have been prepared in accordance with Inter-national Standards on Auditing (EG) No 1606/2002 as at 19 July 2002 and generally accepted auditing standards in Sweden. The annual accounts together with the consolidated accounts provides a fair presentation of the parent company’s and the Group’s financial performance. The administration report of parent company and Group respectively, provides a fair account of the development of the parent company and Group’s business, financial performance and position as well as describes essential risks and factors of uncertainty that the parent company and the companies that are included in the Group faces.
Stockholm 30 March 2015
Ingrid Bonde Liselotte Hjorth Chairman of the Board Board member
Annika Poutiainen Per-Eric Skotthag Board member Board member
Costas Thoupos Gunilla Wikman Board member Board member
Jörgen Olsson CEO Board member

Hoist Kredit AB (publ) Annual report 201466
Auditors's report
Auditor’s report
Report on the annual accounts and consolidated accountsWe have audited the annual accounts and consolidated accounts of Hoist Kredit AB (publ) for the year 2014.
Responsibilities of the Board of Directors and the Managing Director for the annual accounts and consolidated accounts The Board of Directors and the Managing Director are responsible for the preparation and fair presentation of these annual accounts in accor-dance with the Annual Accounts Act for Credit Institutions and Securities Companies and of the consolidated accounts in accordance with Interna-tional Financial Reporting Standards, as adopt by the EU, and the Annual Accounts Act for Credit Institutions and Securities Companies, and for such internal control as the Board of Directors and the Managing Director determine is necessary to enable the preparation of annual accounts and consolidated accounts that are free from material misstatement, whether due to fraud or error.
Auditor’s responsibilityOur responsibility is to express an opinion on these annual accounts and consolidated accounts based on our audit. We conducted our audit in accordance with International Standards on Auditing and generally accepted auditing standards in Sweden. Those standards require that we comply with ethical requirements and plan and perform the audit to obtain reasonable assurance about whether the annual accounts and consolidated accounts are free from material misstatement.
An audit involves performing procedures to obtain audit evidence about the amounts and disclosures in the annual accounts and consolidated accounts. The procedures selected depend on the auditor’s judgment, including the assessment of the risks of material misstatement of the annual accounts and consolidated accounts, whether due to fraud or error. In making those risk assessments, the auditor considers internal control relevant to the company’s preparation and fair presentation of the annual accounts and consolidated accounts in order to design audit procedures that are appropriate in the circumstances, but not for the pur-pose of expressing an opinion on the effectiveness of the company’s internal control. An audit also includes evaluating the appropriateness of account-ing policies used and the reasonableness of accounting estimates made by the Board of Directors and the Managing Director, as well as evaluating the overall presentation of the annual accounts and consolidated accounts.
We believe that the audit evidence we have obtained is sufficient and appropriate to provide a basis for our audit opinions.
OpinionsIn our opinion, the annual accounts have been prepared in accordance with the Annual Accounts Act for Credit Institutions and Securities Com-panies, and present fairly, in all material respects, the financial position of the parent company as of 31 December 2014 and of their financial per-formance and cash flows for the year then ended in accordance with the Annual Accounts Act for Credit Institutions and Securities Companies. The consolidated accounts have been prepared in accordance with the Annual Accounts Act for Credit Institutions and Securities Companies and present fairly, in all material respects, the financial position of the group as of 31 December 2014 and of their financial performance and cash flows for the year then ended in accordance with International Financial Reporting Standards, as adopted by the EU, and in accordance with the Annual Accounts Act for Credit Institutions and Securities Companies. The statutory administration report is consistent with the other parts of the annual accounts and consolidated accounts.
We therefore recommend that the annual meeting of shareholders adopt the income statement and balance sheet for the Parent Company and the Group.
Report on other legal and regulatory requirementsIn addition to our audit of the annual accounts and consolidated accounts, we have also audited the pro-posed appropriations of the com-pany’s profit or loss and the administration of the Board of Directors and the Managing Director of Hoist Kredit AB (publ) for the year 2014.
Responsibilities of the Board of Directors and the Managing Director The Board of Directors is responsible for the proposal for appropriations of the company’s profit or loss, and the Board of Directors and the Man-aging Director are responsible for administration under the Companies Act.
Auditor’s responsibilityOur responsibility is to express an opinion with reasonable assurance on the proposed appropriations of the company’s profit or loss and on the administration based on our audit. We conducted the audit in accordance with generally accepted auditing standards in Sweden.
As basis for our opinion on the Board of Directors pro-posed appropriations of the company’s profit or loss we examined whether the proposal is in accordance with the Companies Act.
As basis for our opinion concerning discharge from liability, in addition to our audit of the annual accounts and consolidated accounts, we examined significant decisions, actions taken and circumstances of the company in order to determine whether any member of the Board of Directors or the Managing Director is liable to the company. We also examined whether any member of the Board of Directors or the Manag-ing Director has, in any other way, acted in contravention of the Compa-nies Act, the Annual Accounts Act for Credit Institutions and Securities Companies or the Articles of Association.
We believe that the audit evidence we have obtained as above is sufficient and appropriate to provide a basis for our opinions.
OpinionsWe recommend to the annual meeting of shareholders that the profit be appropriated in accordance with the proposal in the statutory adminis-tration report and that the members of the Board of Directors and the Managing Director be discharged from liability for the financial year.
Stockholm 30 March 2015 KPMG AB Anders Bäckström Authorized Public Accountant
To the annual meeting of the shareholders of Hoist Kredit AB (publ), corp. id 556329-5699
Every care has been taken in the translation of this report. In the event of any discrepancy,
the Swedish original will supersede the English translation.