annual report 2013 - · pdf fileannual report 2013 for the year ended ... a corporate group...
TRANSCRIPT

NippoN Telegraph aNd TelephoNe CorporaTioN
AnnuAl RepoRt 2013For the year ended March 31, 2013
http://www.ntt.co.jp/
NT
T a
NN
ua
l re
po
rT
2013

NTT Group—One of the world’s largest telecommunications operators by revenues
A corporate group that offers a wide range of services, from fiber-optic broadband
and mobile communications to cloud services
Leveraging Strengths...
001
The NTT Group has high-quality networks in 160 countries and regions, data
centers with a total floor space that is the second largest in the world, and a
strong foundation as one of the world’s leading security integrators. Leveraging
these strengths, the NTT Group works as an information and communication
technology (ICT) strategic partner, offering proposals ranging from advisory
services that combine business analysis and ICT services to ICT management.
In this way, the NTT Group supports the businesses of its customers around
the world.
Consolidated operating revenues: ¥10.7trillion(Fiscal year ended March 31, 2013)
About 80% of the Fortune Global 100 companies are NTT customers
Network coverage in 160 countries / regions
Direct presence in 72 countries
More than 220,000 employees around the world
Who We Are
NIP
PO
N T
ELE
GR
AP
H A
ND
TE
LEP
HO
NE
CO
RP
OR
AT
ION
A
NN
uA
L R
EP
OR
T 2
01
3

003002
Where We Are Heading
“Global Cloud Services” as the Cornerstone of NTT’s Business Operations
Growth of 60% or more in EPSOur Medium-Term Financial Target
In November 2012, the NTT Group released its new Medium-Term Management
Strategy, “Towards the Next Stage.” Under this plan, the cornerstone of our
business operations will be “Global Cloud Services,” and our strategic focus
will be “Comprehensively Strengthen Network Service Competitiveness.”
On that basis, we will work to become the “Value Partner” that customers
continue to select. In addition, our medium-term financial target is growth of
60% or more in earnings per share (EPS), which we will strive to achieve by
the fiscal year ending March 31, 2016. In this way, we will work to increase
corporate value.
2012/3 by 2016/3
... to Achieve Global Leadership
NIP
PO
N T
ELE
GR
AP
H A
ND
TE
LEP
HO
NE
CO
RP
OR
AT
ION
A
NN
uA
L R
EP
OR
T 2
01
3
NIP
PO
N T
ELE
GR
AP
H A
ND
TE
LEP
HO
NE
CO
RP
OR
AT
ION
A
NN
uA
L R
EP
OR
T 2
01
3

005004
Forward-Looking StatementsThe forward-looking statements and projected figures concerning the future performance of NTT and its subsidiaries and affiliates contained or referred to herein are based on a series of assumptions, projections, estimates, judgments, and beliefs of the management of NTT in light of information currently available to it regarding the economy, the telecom-munications industry in Japan, and other factors. These projections and estimates may be affected by the future busi-ness operations of NTT and its subsidiaries and affiliates, the state of the economy in Japan and abroad, possible fluctuations in the securities markets, the pricing of services, the effects of competition, the perfor-mance of new products, services and new businesses, changes to laws and regulations affecting the telecommunications industry in Japan and elsewhere and other changes in circumstances that could cause actual results to differ materially from the forecasts contained or referred to herein.
Other Information
Shareholders’ newsletter “NTTis...”http://www.ntt.co.jp/ir/library_e/nttis/
Presentation materialshttp://www.ntt.co.jp/ir/library_e/presentation/
Shareholders’ meeting materialshttp://www.ntt.co.jp/ir/library_e/shareholders_meeting/
Financial resultshttp://www.ntt.co.jp/ir/library_e/results/
20-Fhttp://www.ntt.co.jp/ir/library_e/20f/
CSR reporthttp://www.ntt.co.jp/csr_e/
Quick search
Medium-Term Business Strategy “Towards the Next Stage”: Overview and Progress
>> See pages 012–021
Global Cloud Services: Key Points of Difference and Specific Initiatives
>> See pages 022–029
Initiatives to Increase Shareholder Value (Financial Targets)
>> See pages 019–021
Results
>> See pages 006–009
Segment Results and Overview
>> See pages 032–051
Questions Frequently Asked by Shareholders and Investors
>> See pages 037, 041, 045, 049
To help readers broaden their understanding
Glossary of Terms To help readers broaden their understanding of the content of this
report, this section provides explanations of general IT-related terms and
terms related to NTT Group services that are used in the report and may
be difficult to understand.
>> See page 136
To analyze the Company’s results
Fact Sheet Fact sheets that provide an overview of financial and operating data
are available on the Company’s website.
>> See website www.ntt.co.jp/ir/library_e/ff/
006 Performance Highlights
006 Financial Data
008 Operational Data
010 To Our Shareholders and Investors
012 Interview with the PresidentIn this section, President and CEO Hiroo unoura provides an overview of NTT’s Medium-Term Management Strategy, “Towards the Next Stage,” as well as a review of the plan’s progress to date and the Group’s future outlook.
063 Financial Section
064 10-Year Financial Summary
068 Operating and Financial Review and Prospects
084 Consolidated Balance Sheets
086 Consolidated Statements of Income and Consolidated Statements of Comprehensive Income
087 Consolidated Statements of Changes in Equity
088 Consolidated Statements of Cash Flows
089 Notes to Consolidated Financial Statements
130 Report of Independent Registered Public Accounting Firm
131 Reference Information
133 Consolidated Subsidiaries
136 Glossary of Terms
139 Stock Information
030 Operations in Review
032 NTT Group in Brief
034 Regional Communications Business
038 Long Distance and International Communications Business
042 Mobile Communications Business
046 Data Communications Business
050 Other Businesses
052 CSR and Corporate Governance
054 CSR
056 Corporate Governance
060 Directors and Corporate Auditors
Index
022 Feature
“Global Cloud Services” as the Cornerstone of NTT’s Business Operations024 The Extensive Coverage of the NTT Group
025 Our Strengths in Global Cloud Services
027 R&D Supporting Cloud Services
028 Base for the Development of Technology: NTT I3
NIP
PO
N T
ELE
GR
AP
H A
ND
TE
LEP
HO
NE
CO
RP
OR
AT
ION
A
NN
uA
L R
EP
OR
T 2
01
3
NIP
PO
N T
ELE
GR
AP
H A
ND
TE
LEP
HO
NE
CO
RP
OR
AT
ION
A
NN
uA
L R
EP
OR
T 2
01
3
Contents

007006
Performance Highlights
Financial Data
Fiscal years ended March 31Billions of yen
2004/3 2005/3 2006/3 2007/3 2008/3 2009/3 2010/3 2011/3 2012/3 2013/3
Operating revenues*1 ¥11,095.5 ¥10,805.9 ¥10,741.1 ¥10,760.6 ¥10,680.9 ¥10,416.3 ¥10,181.4 ¥10,305.0 ¥10,507.4 ¥10,700.7 1
Operating expenses 9,535.2 9,594.7 9,550.4 9,653.5 9,376.3 9,306.6 9,063.7 9,090.1 9,284.4 9,498.8
Operating income 1,560.3 1,211.2 1,190.7 1,107.0 1,304.6 1,109.8 1,117.7 1,214.9 1,223.0 1,202.0 1
Net income attributable to NTT*1 645.4 714.5 503.1 481.4 635.2 538.7 492.3 509.6 467.7 524.1
Total assets*1 19,413.5 19,064.0 18,820.2 18,291.1 18,518.8 18,796.4 18,939.1 19,665.6 19,389.7 19,653.7
Shareholders’ equity*1 6,380.5 6,740.3 6,734.4 7,120.8 7,410.8 7,298.1 7,788.2 8,020.7 7,882.6 8,319.0
Interest-bearing debt 5,921.7 5,525.8 5,296.2 4,770.8 4,677.2 4,899.3 4,491.7 4,553.5 4,274.0 4,036.0
Debt ratio (%)*2 48.1% 45.0% 44.0% 40.1% 38.7% 40.2% 36.6% 36.2% 35.2% 32.7%
Capital investment*3 2,013.6 2,057.4 2,191.9 2,236.9 2,128.9 2,145.1 1,987.1 1,870.1 1,946.6 1,970.0 2
R&D expenses 354.9 318.1 308.4 272.1 271.1 268.2 278.1 268.2 267.9 269.2
EBITDA*3 3,933.8 3,539.6 3,442.6 3,340.5 3,607.0 3,369.8 3,240.8 3,282.2 3,219.1 3,207.4
EBITDA margin (%) 35.5% 32.8% 32.1% 31.0% 33.8% 32.4% 31.8% 31.9% 30.6% 30.0%
Operating free cash flow*3 1,920.2 1,482.2 1,250.7 1,103.7 1,478.1 1,224.8 1,253.7 1,412.1 1,272.5 1,237.5
ROE (%) 10.7% 10.9% 7.5% 6.9% 8.7% 7.3% 6.5% 6.4% 5.9% 6.5%
ROCE (%) 7.3% 5.8% 5.8% 5.5% 6.4% 5.4% 5.4% 5.8% 5.8% 6.1%
Capex to sales ratio*4 18.1% 19.0% 20.4% 20.8% 19.9% 20.6% 19.5% 18.1% 18.5% 18.4%
Cash dividends, applicable to earnings for the year (Yen) 50 60 60 80 90 110 120 120 140 160 3
Dividend payout ratio (%) 12.3% 13.0% 17.1% 23.0% 19.5% 27.5% 32.3% 31.2% 38.2% 37.0%
Net income attributable to NTT per share (Yen)*1*5 407 462 351 348 461 400 372 385 367 432
*1. In accordance with Accounting Principles Board (“APB”) Opinion No. 18, “The Equity Method of Accounting for Investments in Common Stock,” NTT has retroactively applied the equity method of accounting to prior years for an investment in an affiliate, following the acquisition by the NTT Group of additional shares of the affiliate during the fiscal year ended March 31, 2008. Accordingly, figures for the fiscal year ended March 31, 2007 have been retroactively adjusted from previously announced figures.
*2. Debt ratio = Interest-bearing debt / (Interest-bearing debt + Shareholders’ equity) × 100*3. Please refer to Reconciliation of Operating free cash flows, EBITDA, Capital investment on page 131. •Operatingfreecashflow=(Operatingincome+Depreciationandlossondisposalofproperty,plantandequipment)–Capitalinvestment •EBITDA=Operatingincome+Depreciationandlossondisposalofproperty,plantandequipment •Capitalinvestmentisonanaccrualbasisfortheacquisitionofproperty,plantandequipment.
*4. Capex to sales ratio = Capital investment / Operating revenues*5. With the application of the accounting pronouncement issued by the Financial Accounting Standards Board (“FASB”) in December 2007, relating to noncontrolling interests in consolidated
financial statements, starting from the fiscal year ended March 31, 2010, the name of this line item was changed.
0
4,000
8,000
12,00010,700.7
2004/3 2005/3 2006/3 2007/3 2008/3 2009/3 2010/3 2012/32011/3 2013/3Fiscal year ended March 31
0
600
1,200
1,800
1,202.0
524.1
2004/3 2005/3 2006/3 2007/3 2008/3 2009/3 2010/3 2012/32011/3 2013/3Fiscal year ended March 31
0
1,000
2,000
500
1,500
2,500
1,237.5
2004/3 2005/3 2006/3 2007/3 2008/3 2009/3 2010/3 2012/32011/3 2013/3Fiscal year ended March 31
0
60
120
180
0
20
40
60
160
37.0
2004/3 2005/3 2006/3 2007/3 2008/3 2009/3 2010/3 2012/32011/3 2013/3Fiscal year ended March 31
2006/10/30 Aa2 Aa1Aa2 Aa1
2011/9/1 Aa1 Aa2Aa1 Aa2
Aa2
2007/5/21 AA– AAAA– AA
AA
Baa3/BBB–
Baa1/BBB+
Aa3/AA–
Baa2/BBB
A2/A
A3/A–
Aa2/AA
A1/A+
Aa1/AA+
2004/3 2005/3 2006/3 2007/3 2008/3 2009/3 2010/3 2012/32011/3 2013/3Fiscal year ended March 31
0
1,000
3,000
2,000
4,000
0
30
20
40
50
3,207.4
30.0
2004/3 2005/3 2006/3 2007/3 2008/3 2009/3 2010/3 2012/32011/3 2013/3Fiscal year ended March 31
0
800
1,600
2,400
0
10
20
30
1,970.0
18.4
2004/3 2005/3 2006/3 2007/3 2008/3 2009/3 2010/3 2012/32011/3 2013/3Fiscal year ended March 31
Operating Revenues(Billions of yen)
Operating Income / Net Income Attributable to NTT(Billions of yen)
Operating Free Cash Flow(Billions of yen)
Operating income Net income attributable to NTT Interest-bearing debt (left scale) Debt ratio (right scale)
Dividends per share (left scale) Dividend payout ratio (right scale) Moody’s S&P EBITDA (left scale) EBITDA margin (right scale)
Capital investment (left scale) Capex to sales ratio (right scale)
Dividends per Share / Dividend Payout Ratio(Yen) (%)
RatingsEBITDA / EBITDA Margin(Billions of yen) (%)
Capital Investment / Capex to Sales Ratio(Billions of yen) (%)
0
2,500
5,000
7,500
0
30
45
60
4,036.0
32.7
2004/3 2005/3 2006/3 2007/3 2008/3 2009/3 2010/3 2012/32011/3 2013/3Fiscal year ended March 31
Interest-Bearing Debt / Debt Ratio(Billions of yen) (%)
1 Operating Revenues / Operating IncomeIncrease in operating revenues: ¥193.4 billion Decrease in operating income: ¥21.0 billion
Regional Communications: Decrease in voice-related revenues, decline in expenses, etc.
Decrease in operating revenues: ¥106.6 billion Increase in operating income: ¥5.6 billion
Long Distance and International Communications: Decrease in voice-related revenues, improved results at subsidiaries, etc.
Decrease in operating revenues: ¥20.7 billion Increase in operating income: ¥4.6 billion
Mobile Communications: Increase in smartphone sales, etc.
Increase in operating revenues: ¥230.1 billion Decrease in operating income: ¥40.0 billion
Data Communications: Increase in overseas sales, etc.
Increase in operating revenues: ¥51.7 billion Increase in operating income: ¥14.3 billion
2 Capital Investment Up ¥23.4 billion YOY
[Factors Contributing to Increase] Progress in development of LTE Xi coverage area Strengthening of disaster countermeasures
[Factors Contributing to Decrease] Effective utilization of existing facilities
3 Dividends per Share Enhancement of shareholder returns
Dividends up ¥20 YOY, to ¥160
NIP
PO
N T
ELE
GR
AP
H A
ND
TE
LEP
HO
NE
CO
RP
OR
AT
ION
A
NN
uA
L R
EP
OR
T 2
01
3
NIP
PO
N T
ELE
GR
AP
H A
ND
TE
LEP
HO
NE
CO
RP
OR
AT
ION
A
NN
uA
L R
EP
OR
T 2
01
3
Per
form
ance
Hig
hlig
hts

For other financial data, segment data, and financial data for
principal subsidiaries, please refer to the 10-Year Financial
Summary starting on page 064.
009008
Performance Highlights
Operational Data
End of year / monthThousands of subscriptions
Number of subscriptions*1, etc. 2004/3 2005/3 2006/3 2007/3 2008/3 2009/3 2010/3 2011/3 2012/3 2013/3
Fixed-line communications servicesTelephone subscriber line*2 + INS-Net*3
60,073 58,788 54,770 50,495 46,034 42,085 38,330 34,884 31,672 28,766
Fixed-line broadband services FLET’S ADSL 4,089 5,208 5,682 5,323 4,656 3,992 3,381 2,858 2,322 1,848
FLET’S Hikari *4 (FTTH) 840 1,665 3,419 6,076 8,777 11,134 13,251 15,059 16,564 17,300 1
Hikari Denwa*5 — 4 867 3,174 5,725 8,011 10,142 12,113 13,900 15,169
Video services Hikari TV — — — — — 552 1,009 1,413 2,004 2,453 2
FLET’S TV — — — — — 120 270 592 861 1,003 2
d video — — — — — — — — 740 4,130 2
NOTTV — — — — — — — — — 684 2
Mobile communications servicesXi (LTE) + FOMA (3G) + mova (2G)
46,328 48,825 51,144 52,621 53,388 54,601 56,082 58,010 60,129 61,536
FOMA (3G) 3,045 11,501 23,463 35,529 43,949 49,040 53,203 56,746 57,905 49,970
Xi (LTE) — — — — — — — 26 2,225 11,566 3
ARPu*6 Yen
ARPu of fixed-line (Telephone subscriber line + INS-Net subscriber line)
NTT East ¥ — ¥ — ¥3,190 ¥3,170 ¥3,110 ¥3,050 ¥2,980 ¥2,930 ¥2,860 ¥2,810
NTT West — — 3,050 3,020 2,960 2,900 2,850 2,800 2,760 2,720
ARPu of FLET’S Hikari (FTTH) NTT East — — 4,650 5,050 5,310 5,580 5,740 5,880 5,900 5,840
NTT West — — 4,890 5,120 5,460 5,620 5,780 5,890 5,930 5,860
Mobile aggregate ARPu Mobile aggregate ARPu 7,890 7,200 6,910 6,700 6,360 5,710 5,350 5,070 5,140 4,840
Voice ARPu 5,920 5,330 5,030 4,690 4,160 3,330 2,900 2,530 2,200 1,730
Packet ARPu 1,970 1,870 1,880 2,010 2,200 2,380 2,450 2,540 2,590 2,690
Smart ARPu — — — — — — — — 350 420
*1. As of each fiscal year-end.*2. Number of Telephone subscriber line is the total of individual lines and central station lines (Subscriber Telephone Light Plan is included).*3. Number of INS-Net is the total of INS-Net 64 and INS-Net 1500 (INS-Net 64 Lite Plan is included). In terms of number of channels, transmission rate, and line use rate (base rate),
INS-Net 1500 is in all cases roughly 10 times greater than INS-Net 64. For this reason, one INS-Net 1500 subscription is calculated as 10 INS-Net 64 subscriptions.*4. Number of FLET’S Hikari subscriptions includes B FLET’S, FLET’S Hikari Next, FLET’S Hikari Light, and FLET’S Hikari WiFi Access provided by NTT East, and B FLET’S,
FLET’S Hikari Premium, FLET’S Hikari Mytown, FLET’S Hikari Next, FLET’S Hikari Light, and FLET’S Hikari WiFi Access provided by NTT West.*5. Number of Hikari Denwa subscriptions is calculated by number of channels in thousands.*6. Please see page 131 for the ARPu calculation method and other details.
0
20,000
60,000
40,000
80,000
28,766
2004/3 2005/3 2006/3 2007/3 2008/3 2009/3 2010/3 2012/32011/3 2013/3End of year /month
0
20,000
60,000
40,000
80,000
49,970
11,566
2004/3 2005/3 2006/3 2007/3 2008/3 2009/3 2010/3 2012/32011/3 2013/3End of year /month
0
15,000
10,000
5,000
20,000 1,848
17,30015,169
2004/3 2005/3 2006/3 2007/3 2008/3 2009/3 2010/3 2012/32011/3 2013/3End of year /month
0
2,000
8,000
6,000
4,000
10,000
4,814
3,456
2004/3 2005/3 2006/3 2007/3 2008/3 2009/3 2010/3 2012/32011/3 2013/3End of year /month
0
2,000
6,000
4,000
8,000
5,8605,840
2004/3 2005/3 2006/3 2007/3 2008/3 2009/3 2010/3 2012/32011/3 2013/3Fiscal year ended March 31
0
1,000
3,000
2,000
4,000
2,7202,810
2004/3 2005/3 2006/3 2007/3 2008/3 2009/3 2010/3 2012/32011/3 2013/3Fiscal year ended March 31
0
3,000
6,000
9,000
1,730
4202,690
2004/3 2005/3 2006/3 2007/3 2008/3 2009/3 2010/3 2012/32011/3 2013/3Fiscal year ended March 31
Fixed-Line Communications Services Subscriptions(Thousands of subscriptions)
Mobile Phone Subscriptions(Thousands of subscriptions)
Fixed-Line Broadband Services Subscriptions(Thousands of subscriptions)
Video Services(Thousands of subscriptions)
ARPU of FLET’S Hikari (FTTH)(Yen)
FLET’S Hikari*4 FLET’S ADSL Hikari Denwa*5 Hikari TV + FLET’S TV d video + NOTTV Telephone subscriber line + INS-Net mova (2G) FOMA (3G) Xi (LTE)
NTT East NTT West NTT East NTT West Voice ARPu Packet ARPu Smart ARPu
ARPU of Fixed-Line (Telephone Subscriber Line + INS-Net Subscriber Line)
(Yen)
Mobile Aggregate ARPU(Yen)
1 FLET’S Hikari (FTTH)
Net addition of 736 thousand subscriptions
uptake of discounts for continued use
Had effect of limiting cancellations
Mobile broadband uptake and intensified competition
Weakening of net additions (increase in cancellations)
Going forward, focus on generating new demand
Strengthening of initiatives targeting small and medium-sized companies
2 Video Services
Initiatives supporting use of multiple devices Expansion of services offered
Aiming for additional subscribers
3 LTE Xi
Net addition of 9.341 million subscriptions
Increased uptake of smartphones
Aggressive LTE Xi coverage area expansion
Fiscal year ending March 31, 2014 Target of more than 25 million subscriptions
NIP
PO
N T
ELE
GR
AP
H A
ND
TE
LEP
HO
NE
CO
RP
OR
AT
ION
A
NN
uA
L R
EP
OR
T 2
01
3
NIP
PO
N T
ELE
GR
AP
H A
ND
TE
LEP
HO
NE
CO
RP
OR
AT
ION
A
NN
uA
L R
EP
OR
T 2
01
3
Per
form
ance
Hig
hlig
hts
>> See page 064

011010
To Our Shareholders and Investors
I would like to take this opportunity to express my sincere appreciation for your continued under-
standing and support of the NTT Group.
In the information and communication technology (ICT) market, the adoption of social media
and cloud services is expanding, supported by wider bandwidth resulting from the deployment of
fiber-optic and LTE services and the widespread market acceptance of smartphones, tablets, and
other devices. There is a global trend of new entrants to the market—in addition to telecommuni-
cations carriers—and there is also rapid progress in the variety and sophistication of services.
In this setting, in November 2012 the NTT Group formulated a new Medium-Term Management
Strategy, “Towards the Next Stage.” Under this new initiative, we will respond to the globalization
of the market and the development of cloud services, which we believe will accelerate in the future.
To establish Global Cloud Services as the cornerstone of our operations going forward, we will
promote advanced R&D activities to create high-value-added services and formulate new business
models. As we take action to evolve into a “Value Partner” so that we continue to be selected by
customers, the NTT Group will strive to record further growth and development and to increase
corporate value.
In closing, I look forward to your ongoing understanding and support of the business activities
of the NTT Group in the years ahead.
Aiming to be the “Value Partner” that customers continue to select by accelerating transformation of customers’ business models
NIP
PO
N T
ELE
GR
AP
H A
ND
TE
LEP
HO
NE
CO
RP
OR
AT
ION
A
NN
uA
L R
EP
OR
T 2
01
3
NIP
PO
N T
ELE
GR
AP
H A
ND
TE
LEP
HO
NE
CO
RP
OR
AT
ION
A
NN
uA
L R
EP
OR
T 2
01
3To
Our
Sha
reho
lder
s
and
Inve
stor
s
Hiroo UnouraRepresentative Director and President, Chief Executive Officer
August 2013

013012
Interview with the President
Since I was appointed president and CEO in June 2012, I have felt that competi-
tion in the ICT market is entering into a major transition phase.
The activities of individuals and corporate customers are increasingly taking
place on a global stage, and as a result, ICT coverage needs to be globalized to
ensure comprehensive connectivity among markets. Accordingly, the NTT Group
must expand its operational foundation from a global perspective. The market is
currently undergoing significant change. Information processing capabilities have
undergone a cycle of concentration (from user devices to networks) and dispersion
(from networks to user devices). That process of concentration and dispersion is
now making further advances and is nearing its final form— cloud services. Clearly,
With Global Cloud Services as our growth engine, we will implement our business transformation targeting the “next stage.”
We must implement reforms so that in the next stage we “continue to be selected” by customers.
Hiroo UnouraRepresentative Director and President, Chief Executive Officer
Q1Would you explain the idea
behind the formulation
of the Medium-Term
Management Strategy,
“Towards the Next Stage”?
Next Stage
In this section, President and CEO Hiroo Unoura explains NTT’s Medium-Term Management Strategy, “Towards the
Next Stage.”
Change Enabler
Big Data M2M, Internet of Things Virtualization
HTML5, Web applications Natural language processing Secure dispersion / computation
Cloud forensics Edge computing, etc.
Acceleration of the transformation
Present Next Stage
“Inter-service”
Open and seamless usage environment (device-free, OS-free)
Personalized user interface and user experience (simple and user-friendly)
Internet
Dependent on device, operating system, and network
Uniform user interfaces
Compatibility among Internet-based services and convergence between real-world businesses and Internet-based services will lead to higher value-added services
Obtain a great variety of information over the Internet
Use of applications available on the Internet
we are entering an age in which cloud services will play the central role, and
accordingly, I believe that global markets and cloud services must be considered
the growth pillars of the NTT Group.
Accompanying the transition to a cloud services paradigm, users will be freed
from the constraints of devices, operating systems, and uniform user interfaces. In
other words, in the next stage users themselves will decide what combinations of
services to use, and from what providers. As a result, user choices will expand
dramatically. While there will be many factors that lead customers to choose the
NTT Group even when they have such a wide range of choices, I believe that one
thing is certain. The true nature of our competitiveness will be found in our ability to
“continue to be selected.” It will be possible for users to easily switch services, so
we will need to make ongoing efforts to continue to be selected. We are reaching
the end of the era in which providers unilaterally offered their services and users
simply accepted them.
However, it is not easy for corporate users to shift to the cloud all at once.
First, they must carefully verify security issues and IT costs, specify which parts of
existing systems will start the transition to the cloud, and then confirm their opera-
tional status after the transition. Only then can they move ahead with the actual
transition. In order to continue to be selected by customers during this process, it
is essential that we develop close relationships with our customers—so close that
we could be called a cooperative partner—and then work together to establish the
optimal cloud environment. These kinds of partnerships with customers, combined
with such factors as service quality, technology, and security, will generate trust,
and that trust will be the basis for the selection of the NTT Group. This is why, ever
since I became president, I have repeatedly asked everyone at the NTT Group to
“aim to be a Value Partner.”
Under the Medium-Term Management Strategy, “Towards the Next Stage,” we will build a business model that will ensure that we continue to be selected.
NIP
PO
N T
ELE
GR
AP
H A
ND
TE
LEP
HO
NE
CO
RP
OR
AT
ION
A
NN
uA
L R
EP
OR
T 2
01
3
NIP
PO
N T
ELE
GR
AP
H A
ND
TE
LEP
HO
NE
CO
RP
OR
AT
ION
A
NN
uA
L R
EP
OR
T 2
01
3In
terv
iew
with
the
Pre
side
nt

015014
Suitable for customers’ needs Flexible combination of infrastructure, platforms, and applications Appropriate service-matching support on behalf of customers
Simple and convenient Simple and user-friendly interface & user experience Meet customer demands at reasonable rates
Secure and safe Protect customers from security threats with leading technology and operations
Interview with the President
From a “Provider” to a “Value Partner” Changes in Earnings Structure
“Global Cloud Services” as the Cornerstone of NTT’s Business Operations
Comprehensively Strengthen Network Service Competitiveness
Before Cloud After Cloud
Next Stage
Solution + New business
IP business
Legacy business (fixed voice /
mobile voice, etc.)
Network Services
Global Cloud Services
Advisory Applications (Big Data, M2M, contents, etc.) SI, NI
Cloud platforms (DC, IaaS, PaaS, etc.) Cloud access (Network for corporate users, etc.) Wi-Fi platform
Fixed / mobile broadband, etc.
Fixed / mobile voice, etc.
With strong capabilities in all layers, we have reinforced our competitive edge.
Role of the
NTT Group
The “Value Partner” that customers continue to select
—Linking a wide range of services, connecting users and services—
Supporting business model transformation of our corporate customers (B2B2C business model) Supporting the enriched lifestyles of our individual customers Pursuing growth by self-transformation
Group already possesses all of those functions, including
the ability to manage all of those layers. I believe that this
is also an extremely important competitive edge. In recent
years, we have further enhanced those strengths through
M&A transactions, with a special focus on the cloud.
Our acquisition in October 2010 of Dimension Data,
of South Africa, made a substantial contribution to the
reinforcement of our strategic base. Dimension Data’s
ability to provide IT facility construction, operation, and
maintenance services, and its area coverage, have been
a strong complement to the business fields and area
coverage of the NTT Group. Moreover, in December 2010
we acquired Keane, of the united States. Keane brought
to the NTT Group a customer base in the united States,
the most advanced market in the cloud business, as well
as a global operational base and know-how that support marketing, development,
and maintenance. In Europe, since 2007 we have been steadily strengthening our
customer base and our system for the provision of services. I am confident that
our extensive coverage is one of the NTT Group’s unique strengths.
On the other hand, there will also be customers who decide to move only
specific functions to the cloud while making full use of their existing management
resources. The NTT Group can work together with other companies to provide
total services, and we can also provide services in a specific layer. In addition, we
can assist customers with a specific part of the process of transitioning to the
cloud. I think this ability to offer one-stop solutions, or to work together with
competitors to meet customer needs, is another of our strengths.
Going forward, cloud services will be the engine of growth and business
transformation, and in this field we already have the tools that we will need to
compete on the global stage.
The NTT Group has overseas bases in 72 countries and regions and a
customer base of more than 10,000 global companies. About 80% of the Fortune
Global 100 companies are our customers. In addition, we operate more than 240
data centers with a combined server room floor space of about 380,000 square
meters. This makes us the largest data center operator in Japan and the second
largest in the world. It goes without saying that we offer the highest levels of
reliability and quality in the world. Our data centers are connected by our large-
capacity, low-latency global IP backbone, which is the second largest worldwide
in terms of total traffic. In this way, our major strengths include proximity to our
customers and our foundation for the provision of cloud services. These strengths
have already been solidly established on a global scale.
Telecommunications service layers can be broadly divided into “applications”
and “infrastructure,” with the latter including data centers and networks. The NTT
Our extensive coverage is one of the NTT Group’s unique strengths.
Q2In promoting Global Cloud
Services, what are the
strengths of the NTT Group?
To succeed in the next stage, we must implement our business transformation
with an awareness that the NTT Group itself is just one player among many. On
that basis, we need to build a business model that will ensure that we are selected
as a “Value Partner” for many years to come. Our Medium-Term Management
Strategy, “Towards the Next Stage,” incorporates these ideas.
NIP
PO
N T
ELE
GR
AP
H A
ND
TE
LEP
HO
NE
CO
RP
OR
AT
ION
A
NN
uA
L R
EP
OR
T 2
01
3
NIP
PO
N T
ELE
GR
AP
H A
ND
TE
LEP
HO
NE
CO
RP
OR
AT
ION
A
NN
uA
L R
EP
OR
T 2
01
3In
terv
iew
with
the
Pre
side
nt

017016
Interview with the President
and Secode AB, and NTT Secure Platform Laboratories, is now being rolled out
globally. This type of common platform is merely a necessary condition for
becoming a frontrunner. We also need to clear sufficient conditions, such as the
establishment of a SIEM Engine that is compliant with legal systems and personal
information protection systems that differ by country and region. By meeting both
of these conditions, I believe that we can reinforce our position in the security field.
Next, I would like to discuss the enhancement of our Wi-Fi platform as a
means of strengthening our cloud business. The NTT Group has about 140,000
Wi-Fi access points throughout Japan, such as in train stations, airports, and
convenience stores. These Wi-Fi spots are not simply positioned as access points
or as tools for use in offloading mobile traffic. Rather, we position them as the
“Third Access,” that is, as a combination of access point and service platform that
differs from fixed-line and mobile. Accordingly, we will use these access points as
a platform for cloud services. On that basis, we will leverage the distinctive features
of Wi-Fi—device free, OS free, and location free—as we develop a new business
model incorporating the use of this platform for the provision of information
distribution services to end users. In the near future, our initiatives may center on
the use of these access points as a tool in O2O marketing (Online to Offline: linking
online information and services with real activities, such as purchases at real
stores). We will also aim at the establishment of a new B2B2C business model
(Business to Business to Consumer: operations that support the consumer-
focused businesses of other companies) in the future through active involvement
throughout the value chains that our customers operate.
Maintenance / After-sales care
Strengthen the Wi-Fi Platform
Designating and strengthening Wi-Fi platforms already available in train stations, airports, etc., as the “Third Access”
Providing value chain support, such as production, distribution, and marketing, etc., for corporate customers
Value Chain Support for Corporate Customers
MarketingDistributionProductionR&DMarket research
* Number of wireless LAN-compatible mobile handsets sold from 2009 to 2012. (2011 and 2012 research results by ICT Research & Consulting Inc.)
Data collection / analysis / attracting customers
Activity support for individual customers
Wi-Fi PlatformNo. of Reachable Handsets: Over 100 million*
Area information
Coupons Stamps, etc.Internet
Information distribution portals
Carrier-freeFree Internet
In regard to the cloud, the united States is the most competitive and the most
advanced market in the world. It offers a high degree of freedom in a variety of
areas, and it is possible to develop cloud services and security services more
quickly in the united States than anywhere else in the world. The NTT Group will
center its development activities in this market—the world’s most advanced—and
develop world-leading services with the adoption of the latest technologies through
an open innovation format. On that basis, we will modularize our business success
experiences in the u.S. market in accordance with the needs of other markets.
These modules will then be introduced to the NTT Group’s cloud services, which
will be launched in markets around the world. We may consider introducing u.S.-
originated services in the Japanese market. In emerging countries, meanwhile,
major opportunities are presented by the trend toward “Skip to Cloud,” which
involves the use of the cloud from the initial stages of a system. Moving forward,
we will resolutely continue to take on challenges.
A central role in these initiatives will be played by NTT Innovation Institute, Inc.
(NTT I3), which we established in Silicon Valley in April 2013. The CEO of NTT I3 is
highly knowledgeable about the field of technology, and has technical skills that
encompass both the supplier and user sides. In May, we launched a unified brand
for the NTT Group’s cloud services—NTT clouds. By commencing full-fledged
initiatives on a Groupwide basis while raising recognition of our brand overseas,
we have taken a major step “Towards the Next Stage.”
The field of security will be a special emphasis in our R&D initiatives. Our first
priority will be the development of a global security platform, which will function as
a common platform. We have already developed the Security Information and
Event Management (SIEM) Engine, which features enhanced security risk detection
and analysis functions. This engine, which was jointly developed by NTT
Communications, its subsidiaries NTT Com Security AG (formerly Integralis AG)
We will develop advanced technologies in the United States and introduce them around the world.
Q3What specific direction will
the NTT Group take in
developing its global cloud
operations?
We have made a full-fledged start with Groupwide initiatives.
We will solidify our position in the field of security by constructing a common platform and accommodating systems in different countries and regions.
In the fiscal year ended March 31, 2013, the NTT Group’s R&D expenses
were about ¥270.0 billion, and we currently have about 6,000 staff members
working in R&D. This world-leading R&D program is also a powerful competitive
tool for the NTT Group. For example, to meet needs for the effective use of
Big Data, we have led the world in the development of technological platforms that
enable the high-level analysis of large volumes of data in real time. In addition,
using virtual network technologies, we have made it possible to flexibly and rapidly
transition to cloud services and implement changes in system configuration. The
critical factor in competing with other companies around the world is technical
capabilities in the area of security. As a security integrator, the NTT Group provides
services in more than 50 countries, and the Computer Security Incident
Response Team (CSIRT) has capabilities that place it in the top ranks of
telecommunications carriers. We have already established a position as one of
the world’s top security integrators.
A major strength is our ability to provide total solutions to help customers implement a transition to the cloud, whether the entire transition or just a part of it.
NIP
PO
N T
ELE
GR
AP
H A
ND
TE
LEP
HO
NE
CO
RP
OR
AT
ION
A
NN
uA
L R
EP
OR
T 2
01
3In
terv
iew
with
the
Pre
side
nt
NIP
PO
N T
ELE
GR
AP
H A
ND
TE
LEP
HO
NE
CO
RP
OR
AT
ION
A
NN
uA
L R
EP
OR
T 2
01
3

019018
Interview with the President
In May 2012, we announced that we would work toward an increase of 60% or
more in EPS over the medium term as a financial target. under our Medium-Term
Management Strategy, we continue to position earnings per share (EPS) growth as
our most important indicator. We have set a clear target for reaching that goal by
the fiscal year ending March 31, 2016.
I understand that ROE is the focus of special attention among sales and finan-
cial targets, particularly in Europe and the united States. However, I have met and
exchanged ideas with shareholders and investors, and in consideration of their opin-
ions I concluded that setting EPS as a key target and working to increase it is more
important for shareholders and investors to understand changes in corporate value.
To clearly express our intention to grow over the medium term, we are using
EPS not as a single-year target but as a medium-term target. EPS is calculated with
a numerator (net income) and a denominator (number of shares issued), and we
ultimately settled on growth of more than 60% after considering a variety factors,
such as future profit trends and acquisitions of treasury stock.
The business domains of the NTT Group can be broadly divided into fixed line,
mobile, and, as a growth driver, the cloud. Each of these domains is changing at a
different pace. For example, the fixed-line market is mature, and the mobile market
is undergoing intense competition accompanying the transition to smartphones and
LTE. These are businesses in which, to a certain extent, we can forecast the direc-
tion of the market a few years into the future. On the other hand, in the cloud field, it
is in a preparation stage, and we expect to be able to get the results of seed plant-
ing in the latter half of the plan period. In the past, we set uniform periods for the
achievement of our financial targets, but in the current Medium-Term Management
Strategy our various financial targets are organized in different periods of three to
five years, in accordance with the time span of each business.
Medium-Term Financial Targets
EPS growth of 60% or more by the fiscal year ending March 31, 2016 (compared with the fiscal year ended March 31, 2012)
“Global Cloud Services” as the cornerstone of NTT’s business operations
The Path to Profit Recovery and Growth
Cash Control and Effective Utilization Streamlining capital investment Increasing M&A with a focus on cloud-related businesses Enhancing shareholder returns in the medium term
By the fiscal year ending March 31, 2017:
Proceeds from overseas sales: $20.0 billionProportion of corporate sales represented by overseas sales: 50% or more
By the fiscal year ending March 31, 2015:
At least ¥400.0 billion in cost reductions in fixed-line / mobile access networks (compared with the fiscal year ended March 31, 2012)
By the fiscal year ending March 31, 2016: Capex to sales ratio 15%
We will strive to achieve growth of more than 60% in EPS.
Q5Would you discuss the
background to the
formulation of the medium-
term financial targets?
I believe that EPS is an indicator that makes it comparatively easy to explain corporate value to shareholders and investors.
We will position Global Cloud Services as a future growth driver. On the other
hand, in domestic network services, where the market is intensely competitive, it is
crucial to work to increase investment efficiency and administrative efficiency given
the strategy to step up to the next stage in the future.
under the cloud paradigm, customers will be able to freely select the services
they use, and we expect network services to be sold in bundles with applications
and platforms rather than on a single-item basis. However, this does not mean
that the importance of networks will decline. On the contrary, the importance of
the infrastructure supporting the cloud will increase further in the years ahead. We
will not compromise on investment that is needed to provide high-quality services,
but we will also emphasize facility efficiency and take steps to thoroughly increase
our competitiveness in network services.
One point of pride for the NTT Group is how we have led the world in the
construction of fiber optic and LTE networks. On the other hand, even accounting
for the upfront investment required for the construction of fiber-optic networks, we
admit that our network-related capital investment is high in comparison with other
telecommunications carriers around the world. Capital investment in fiber-optic
networks has already peaked, and we will once again review our entire value chain
and reevaluate our capital investment from the ground up.
In particular, I am emphasizing to all NTT Group companies that we need to
review the business practice of doing everything in-house. The NTT Group has
traditionally constructed its networks on its own. In this way, we have been able to
provide comprehensive, stable telecommunications services, but as I mentioned,
in the future the trend will be toward users freely selecting services, including
infrastructure. The pace at which facilities become obsolete is also likely to increase.
I believe that we need to move beyond a rigid focus on doing everything ourselves,
especially in the fields where products and services quickly become obsolete. In the
next stage, it will be more effective for us to draw on external facilities
and services when necessary. Accordingly, we will continually ask
ourselves if building facilities in-house is really going to make a
difference in our competitiveness, and if doing so will place a heavy
burden on the NTT Group in the years ahead. On that basis, we will
reconsider our traditional practice of doing everything in-house.
Also, with a focus on future changes in the operating and labor
environments, our approach will be to reform our personnel systems
and thoroughly simplify all operational functions, from network
service development and sales to operations and maintenance.
We will take steps to comprehensively enhance the
competitiveness of our network, including quality, reliability, and
cost, and to succeed in the face of strong competition. In this way,
we will put the NTT Group on a growth track in the years ahead.
We will review our business practice of “doing everything in-house,” and we will rigorously strengthen our competitiveness.
Q4How will you strengthen
competitiveness in network
services?
We will review our policy of doing everything in-house and consider drawing on external facilities and services as necessary.
Comprehensively strengthen network service competitiveness
NIP
PO
N T
ELE
GR
AP
H A
ND
TE
LEP
HO
NE
CO
RP
OR
AT
ION
A
NN
uA
L R
EP
OR
T 2
01
3
NIP
PO
N T
ELE
GR
AP
H A
ND
TE
LEP
HO
NE
CO
RP
OR
AT
ION
A
NN
uA
L R
EP
OR
T 2
01
3In
terv
iew
with
the
Pre
side
nt

021020
Interview with the President
In the fiscal year ended March 31, 2013, our overseas sales were $12.0 billion, an
increase of $0.6 billion year on year, and the proportion of corporate sales repre-
sented by overseas sales was 32%. Looking ahead, we are planning overseas
sales of $13.0 billion in the fiscal year ending March 31, 2014, with the proportion
of corporate sales represented by overseas sales at 37%.
In the fiscal year ended March 31, 2013, we reduced our access network
costs by ¥125.0 billion compared with the previous fiscal year. For the fiscal year
For overseas sales, our targets are to reach $20.0 billion by the fiscal year end-
ing March 31, 2017 and to increase the proportion of corporate sales represented
by overseas sales to 50% or more. Our basic policy for sales will be to record
organic growth, but will continue to utilize M&A transactions as we strive to achieve
our sales targets. Of course, we will not consider M&A transactions simply for the
purpose of increasing our sales. Centered on the cloud field, we will consider M&A
transactions with a focus on whether they make a contribution to increasing our
profit margins through the generation of synergies for the NTT Group as a whole.
Next, by the fiscal year ending March 31, 2015 we will work to reduce fixed-
line / mobile access network costs by ¥400.0 billion compared with the fiscal year
ended March 31, 2012. Also, our goal for reducing the Capex to sales ratio to 15%
has been carried over from the previous management strategy, and we will strive
to achieve this objective by the fiscal year ending March 31, 2016. Further, the NTT
Group will advance the effective use of cash, such as focusing M&A activities on
cloud-related businesses and taking steps to further enhance shareholder returns
in the medium term.
6
0
12
18
400
0
800
1,200
13.0
1,200.0
12.011.4
954.1912.7
36.9%31.8%30.6%
2013/3 2014/3(Forecast)
2012/3Fiscal year ended / ending March 31
800
0
1,600
2,400
10
0
20
30
1,870.01,970.01,946.6
17.0%18.4%18.5%
2013/3 2014/3(Forecast)
2012/3Fiscal year ended / ending March 31
–200
–400
–300
–100
0
–330.0
–125.0
0
2013/3 2014/3(Forecast)
2012/3Fiscal year ended / ending March 31
200
100
0
300
400
250.0
150.0
381.7
2013/3 2014/3(Forecast)
2012/3Fiscal year ended / ending March 31
200
0
400
600
503
432
+18%* +37%*367
2013/3 2014/3(Forecast)
2012/3Fiscal year ended / ending March 31
Overseas Sales(Billions of uS$) (Billions of yen)
Capital Investment(Billions of yen) (%)
Amount of Cost Reductions(Billions of yen)
Repurchases of Treasury Stock(Billions of yen)
EPS (earnings per share)(Yen)
Overseas sales (uS$ basis) (left scale) Overseas sales (Yen basis) (right scale) Proportion of corporate sales represented by overseas sales
Capital investment (left scale) Capex to sales ratio (right scale)
* Board of Directors’ resolution on acquisition of treasury stock, with upper limits of 50 million shares and ¥250.0 billion in May 2013.
* Compared with fiscal year ended March 31, 2012
We have gotten off to a solid start in implementing the Medium-Term Management Strategy.
Q6Please discuss progress
with the Medium-Term
Management Strategy.
ending March 31, 2014, we are planning a two-year cumulative total of ¥330.0
billion in cost reductions. We are advancing at a faster pace than we originally
expected toward our target of ¥400.0 billion.
Accompanying the expansion of the LTE Xi service area, our capital invest-
ment in the fiscal year ended March 31, 2013, was ¥1,970.0 billion, an increase of
¥23.4 billion year on year, and our Capex to sales ratio was 18.4%. Targeting LTE
area enhancement, we will continue to implement capital investment in the fiscal
year ending March 31, 2014. However, we will make progress in increasing effi-
ciency by simplifying our networks in the fixed-line field, and in the mobile field, the
dispersion of important facilities as a disaster countermeasure has basically been
completed. Consequently, we are planning capital investment of ¥1,870.0 billion,
down by ¥100.0 billion year on year. Considering the increase in operating rev-
enues, we are aiming for a Capex to sales ratio of 17.0%, a record low level.
Looking at shareholder returns, dividends in the fiscal year ended March 31,
2013, were ¥160 per share, an increase of ¥20 year on year. There has been no
change to our basic policy of enhancing dividends over the medium term. In
regard to purchases of treasury stock, in the fiscal year ended March 31, 2013, we
implemented ¥150.0 billion in acquisitions, and we have substantially increased
our planned purchase amount for the fiscal year ending March 31, 2014, to ¥250.0
billion. EPS in the fiscal year ended March 31, 2013, was ¥432, an increase of
18% year on year, and for the fiscal year ending March 31, 2014, we are planning
an increase of 37%, to ¥503, compared with the fiscal year ended March 31,
2012. Excluding a special factor—¥60.0 billion in other income accompanying the
redevelopment of Otemachi 2-chome—this EPS figure would be ¥471, an increase
of 29%.
Moving forward, the NTT Group will do its utmost to implement its initiatives in
accordance with its Medium-Term Management Strategy.
Reductions in access network costs are progressing at a faster than expected pace.
We will consider M&A transactions, with a focus on whether they make a contribution to increasing our profit margins through the generation of synergies, centered on the cloud field.
Overseas Sales:
$20.0 billion by fiscal year ending March 31, 2017
Proportion of corporate sales represented by overseas sales: 50% or more by fiscal year ending March 31, 2017
Access Network Cost Reduction:
More than ¥400.0 billion by fiscal year ending March 31, 2015
Capex to sales ratio:
15% by fiscal year ending March 31, 2016
Amount of Repurchases of Treasury Stock:
¥150.0 billion during fiscal year ended March 31, 2013
¥250.0 billion in fiscal year ending March 31, 2014*
EPS:
Growth of 60% or more by fiscal year ending March 31, 2016Plan
NIP
PO
N T
ELE
GR
AP
H A
ND
TE
LEP
HO
NE
CO
RP
OR
AT
ION
A
NN
uA
L R
EP
OR
T 2
01
3
NIP
PO
N T
ELE
GR
AP
H A
ND
TE
LEP
HO
NE
CO
RP
OR
AT
ION
A
NN
uA
L R
EP
OR
T 2
01
3In
terv
iew
with
the
Pre
side
nt

022 023
Feature: Contents
The Extensive Coverage of the NTT Group 024
Our Strengths in Global Cloud Services 025
R&D Supporting Cloud Services 027
Base for the Development of Technology: NTT I3 028
The NTT Group’s new Medium-Term Management Strategy: “Towards the Next
Stage,” includes the key concept of being the “Value Partner” that continues
to be selected by customers. The two key pillars of the strategy are “Global
Cloud Services as the Cornerstone of NTT’s Business Operations” and
“Comprehensively Strengthen Network Service Competitiveness.”
The management strategy positions Global Cloud Services as the future
growth driver of the NTT Group and spells out two objectives for overseas sales.
Specifically, we aim to reach $20.0 billion in overseas sales by the fiscal year end-
ing March 31, 2017, and to increase the proportion of corporate sales represented
by overseas sales to 50% or more.
“Global Cloud Services” as the Cornerstone of NTT’s Business Operations
NIP
PO
N T
ELE
GR
AP
H A
ND
TE
LEP
HO
NE
CO
RP
OR
AT
ION
A
NN
uA
L R
EP
OR
T 2
01
3F
eatu
re
Feature
NIP
PO
N T
ELE
GR
AP
H A
ND
TE
LEP
HO
NE
CO
RP
OR
AT
ION
A
NN
uA
L R
EP
OR
T 2
01
3

InitiativesPosition InitiativesPosition
025024
Existing IT systems Advisory servicesICT services
ICT managementIndustrially developed countries Emerging countries
Applications
On-premises Off-premises
Total system visualization, from applications to devices
Security management
PF
Infrastructure
Focus on value for customers
Proposals combining business analysis and ICT services
Provision of flexible, high-quality ICT services, even incorporating the services of other companies Provision of end-to-end,
secure ICT management
Support for the business model transformations of customers as an ICT strategy partner
Feature: “Global Cloud Services” as the Cornerstone of NTT’s Business Operations
The Extensive Coverage of the NTT Group Our Strengths in Global Cloud Services
The NTT Group offers a wide range of services in markets around the world, including network / data center, managed ICT, and solution / application services. The ability to provide this comprehensive range of services is one of the NTT Group’s key strengths.
(1) Network / Data center services
Currently, the NTT Group provides more than 10,000 global companies in 160 countries and regions with IP-VPN and other data network services as well as Internet access and other global network services. The NTT Group operates the world’s second largest global IP backbone. As infrastructure that stores customer information, data centers—in combination with networks—are an important business platform for the provision of ICT services to cus-tomers. The NTT Group operates more than 240 data cen-ters around the world. We offer colocation services, in which we provide data center space, and hosting services, where we provide bundles of equipment and data center space. The NTT Group is number two in the world in terms of server room floor space.
The NTT Group’s Global Services
(2) Managed ICT services
The NTT Group provides end-to-end ICT services, such as network integration and IT outsourcing.
(3) Solution / Application services (including systems integration)
The NTT Group has about 29,000 IT consultants and system engineers in 136 cities in 34 overseas countries. These employees provide IT consulting, systems integration services, outsourcing services, such as Application Management Outsourcing (AMO) and Business Process Outsourcing (BPO), and application services that utilize management systems such as SAP and Oracle. The NTT Group has built a system that can provide a full-service lineup, from networks and data centers to man-aged ICT services and systems integration. In markets characterized by competition among large numbers of global companies, the NTT Group has a unique position. Leveraging this strength, the NTT Group is aiming to achieve growth through progress in Global Cloud Services. NTT Group companies overseas are generating synergies by leveraging the service provision capabilities and customer bases of other NTT Group companies.
To strengthen cloud services, in November 2012 we acquired Centerstance Inc., of the united States, a consult-ing company that specializes in corporate business process analysis and support for the migration of existing systems to the cloud. Centerstance Inc., is also one of a limited number of Salesforce.com Platinum Partners. Through this acquisi-tion, the NTT Group has strengthened its cloud advisory and application migration capabilities. In addition, in June 2013 we agreed to acquire all of the shares of Solutionary, Inc., which is based in the united States and offers managed security services. With this acquisition, we are further advancing our business in North America through the reinforcement of our security services, which will play a key role in the maintenance and expansion of our ICT business, centered on the cloud. Specifically,
Recent Initiatives to Strengthen Cloud Services
Solutionary, Inc., has the ability to provide security platforms and security operations as well as security consulting resources, while the NTT Group has established a total ICT business, from infrastructure and networks to solutions. Moving forward, we will work to establish a new business model that leverages these strengths. We believe that the source of our competitiveness is our ability to continue to be selected by customers. Overall, the NTT Group’s business is defined by a phrase that uses the letters ‘N,’ ‘T,’ and ‘T’: Next Value Partner for Transformation by Total Solutions. In other words, through differentiation in services and technologies, we will help our customers to implement business model transformations, and thereby earn their trust.
Global Cloud Business Promotion SystemDirect Presence in 72 Countries, Service Provision in 160 Countries / Regions
Group Global Business Development
World’s second-largest
data center operator
The Americas EMEA APAC Japan TOTAL
Number of countries with offices 6 49 16 1 72
Number of data centers 7 23 28 185 243
Number of employees 11,000 17,000 23,000 176,000 227,000
(As of March 31, 2013)
World’s second-largest
IP backbone provider
Clie
nt c
om
pan
ies
R&D
Advisory services
Migration services
Operational services
Management services
Application services
Managed ICT
Data center network
Mobile networksWi-Fi
Bus
ines
s an
alys
is
Clo
udS
ecur
ityM
ob
ility
Big
Dat
aM
2M
Mobile networks
Global networks
Global data centers
Wi-Fi
Cloud platformGlobal data centers
Global networks
Industry platform
Migration of business applications to the cloud
Security
Standardized cloud, etc.
NIP
PO
N T
ELE
GR
AP
H A
ND
TE
LEP
HO
NE
CO
RP
OR
AT
ION
A
NN
uA
L R
EP
OR
T 2
01
3
NIP
PO
N T
ELE
GR
AP
H A
ND
TE
LEP
HO
NE
CO
RP
OR
AT
ION
A
NN
uA
L R
EP
OR
T 2
01
3Fe
atur
e

Initiatives Technological AdvantagesInitiatives Technological AdvantagesInitiatives Technological Advantages
027026
We helped a North American financial services company with more than $1.0 billion in sales migrate their legacy IT environments to the
cloud. The NTT Group also provided managed services after the migration. We planned and built the optimal cloud environment consider-
ing the client’s previous environments and provided support for the migration of its applications and data. Since the move to the cloud was
completed, we have provided 24/7 infrastructure / application monitoring and managed services, including disaster recovery. Through the
introduction of managed services, we achieved a reduction of 25% to 40% in the client’s operating costs.
Case Study: Introduction of Cloud Services by Global Companies
Feature: “Global Cloud Services” as the Cornerstone of NTT’s Business Operations
As the only truly global partner that supports customers with an integrated perspective that extends across applications, infrastructure, and networks, the NTT Group will provide
Advisory services Migration services Operational services Management services
Hardware / Software / vendor and architecture neutral
No “legacy / incumbent” bias
Cross layer optimized advisory experience and capability
Any to any capability—”Any” legacy to “any” cloud infrastruc-ture migration
Leading Salesforce.com migra-tion capability
Combines deep understanding of legacy architecture and leading cloud technology
“Application aware” infrastructure
Seamless federation between NTT public / private clouds and customer clouds—globally
Optimized cost / performance (by workload, location)
Best in class network security & integration expertise
Pre-configured & tuned environments for highly productized applications
Integrated monitoring and management across network, infrastructure and applications
24x7 global coverage with service operation centers that leverage onsite, offshore & near-shore resources
NTT Group Cloud Services: Key Points of Difference
comprehensive cloud services that accommodate the diverse business environments of its clients. The key points of difference for our products and services are as follows.
NTT Laboratories are working to add further value to the NTT Group’s cloud services. To that end, we are advancing open innovation, which does not rely solely on in-house technologies, and moving ahead with R&D in network virtu-alization technologies to provide high added value to cus-tomersthroughcloud–networkcooperation. In this way, through the Web portal customers can arrange on-demand deployment of needed virtual equipment and network resources, and we can support a smooth migration from legacy systems to the cloud. Furthermore, we can increase robustness by flexibly changing network con-figuration and moving virtual equipment used to another data center when there is a service interruption.
Increasing User Convenience through Cloud / Virtual Network Comprehensive Management Technologies
Reinforcing the Security Platform
When information is entrusted to the cloud, there are still many concerns about such issues as security threats, including unauthorized access, and the loss of data if a server crashes. At NTT Laboratories, we have drawn on world-class malware countermeasure technologies, security management technologies, and encryption technologies to develop strong defenses against cyber attacks and other security threats, and we are working to leverage these tech-nologies to differentiate our cloud services. With secure dispersion technology, the important infor-mation of customers is encrypted and split into multiple files,
which are stored on the cloud. This strengthens the protec-tion against unauthorized access and server crashes. Moreover, with secure computation technology, informa-tion that has been split up through secret sharing technology can be statistically processed at the world’s highest level without returning the information to its original form and with-out anyone seeing the information. In this way, the important information of customers can be both stored and utilized. By further bolstering these and other security technolo-gies, we will offer cloud services that can be used with peace of mind.
R&D Supporting Cloud Services
25% to 40% reduction in operating costs with managed services
Achievement of robust business continuity plan, with a limited effect on system performance even during disaster recovery
Application and Data Migration Support
Applications
Database
Infrastructure
Provision of 24/7 infrastructure / application monitoring and managed services, including disaster recovery
Cloud Infrastructure Construction and Operation
Private cloud
StorageDatabase serverDatabase server
ERP E-mail
Web portal
Cloud migration
Cloud
Entrusted information(data files, etc.)
Data utilization(statistical processing, etc.)
Cloud
Cloud
Cooperation
Customer base
Integrated application
Results of Introduction
Physical network
Network controller Cloud controller
Virtual networkVirtual network
Virtual networkVirtual network
* Realization of world No. 1 capabilities
With secret sharing technology, data is encrypted and split into multiple files, which are stored on separate servers.
Calculations can be performed while the secret data is still split into separate files, with only the results output.
Safe data usage
Secure computation technology
Safe data storage
Secret sharing technology
Interruption response
NIP
PO
N T
ELE
GR
AP
H A
ND
TE
LEP
HO
NE
CO
RP
OR
AT
ION
A
NN
uA
L R
EP
OR
T 2
01
3
NIP
PO
N T
ELE
GR
AP
H A
ND
TE
LEP
HO
NE
CO
RP
OR
AT
ION
A
NN
uA
L R
EP
OR
T 2
01
3Fe
atur
e

Strategic BaseStrategic BaseStrategic Base
029028
To further establish a unique position for the NTT Group in the global market, we have established
NTT clouds as a unified brand. The NTT clouds brand will be used to represent the various cloud services
provided by Group companies when comprehensive proposals are made to corporate customers
overseas. With North America as a starting point, we will launch comprehensive proposals of cloud
services to corporate customers and aggressively reinforce the appeal of the NTT Group brand.
NTT clouds: The Unified Brand for NTT Cloud Services
Feature: “Global Cloud Services” as the Cornerstone of NTT’s Business Operations
new services, it will strengthen its partnerships with these companies and take steps to accumulate the latest information.
(3) Development of IP for global corporate businessAs rapidly as possible, NTT I3 will develop IP in the form of technologies that meet the needs of NTT Group busi-nesses in the North American market, where these new technologies will be rolled out. Plans call for this IP to be modularized and introduced globally, including in Japan and emerging countries.
(4) Source of differentiation for the NTT GroupBy advancing applied research in accordance with market needs, NTT I3 will further strengthen the NTT Group’s R&D and generate results that become a source of differentiation for the NTT Group. Through those results, NTT I3 is expected to make a substantial contribution to NTT Group companies.
NTT I3 will be a global hub for the R&D activities of NTT Group companies, and support the creation of new services. It will contribute to growth in the global business of the NTT Group.
Role of NTT I3
Base for the Development of Technology: NTT I3
In accordance with the Medium-Term Management Strategy announced in November 2012, “Towards the Next Stage,” the NTT Group is working to achieve the rapid development and market roll out of world class security and cloud tech-nologies. To that end, in the North American market, where competition is most intense, we established NTT Innovation Institute, Inc. (NTT I3), in Silicon Valley in April 2013. NTT I3 will work from the perspectives of developing innovative ser-vices and providing superior operations, taking into account the needs of NTT Group clients—more than 10,000 global companies around the world. On that basis, NTT I3 will develop intellectual property (IP), centered on security tech-nologies in the cloud, mobile, and operations fields. For the time being, cloud computing and security technologies will play the central role in NTT I3’s activities, and through close cooperation with the basic R&D initiatives of NTT Laboratories in Japan, NTT I3 will advance applied research
Establishment of R&D Base in North America
for the NTT Group as a whole while avoiding overlapping development initiatives. There are four key points to the activities of NTT I3.
(1) Market driven
North America is a leader in many ICT areas, such as secu-rity and cloud computing. Accordingly, NTT I3 will advance market-driven development activities suitable for rapid appli-cation in business settings, leading to business development initiatives in areas where the NTT Group needs to enhance its market presence as well as to the reinforcement of its competitiveness.
(2) Leveraging the Silicon Valley ecosystem
Silicon Valley boasts a concentration of leading-edge infor-mation in the area of technology as well as companies that possess advanced technologies. As NTT I3 works to develop
New R&D center in North AmericaNTT Innovation Institute, Inc. (NTT I3)
Establishment of NTT I3
Advancing development of services originated in North America through R&D centered on security and cloud computing.
NTT I3 will be a global hub for NTT Group companies, R&D, and the creation of new services, and will support growth in the global business of the NTT Group.
NTT
NTT clouds overview
More than 10,000 global companies worldwide
Large companies
Global customers
Partners
Analysts
Industrially developed countries
Small and medium-sized
companies
Emerging market
User needs
Cooperation
NTT Innovation Institute, Inc.
Cloud
Mobile
Operations
Security
Innovative services
Operational excellence
Supply of newly developed IP
Supply of standardized services
Cooperation inside and outside the Group
NTT R&D
NTT
NIP
PO
N T
ELE
GR
AP
H A
ND
TE
LEP
HO
NE
CO
RP
OR
AT
ION
A
NN
uA
L R
EP
OR
T 2
01
3
NIP
PO
N T
ELE
GR
AP
H A
ND
TE
LEP
HO
NE
CO
RP
OR
AT
ION
A
NN
uA
L R
EP
OR
T 2
01
3Fe
atur
e

031030
Operations in Review
Operations in Review: Contents
NTT Group in Brief 032
Regional Communications Business 034
Long Distance and International Communications Business 038
Mobile Communications Business 042
Data Communications Business 046
Other Businesses 050
NIP
PO
N T
ELE
GR
AP
H A
ND
TE
LEP
HO
NE
CO
RP
OR
AT
ION
A
NN
uA
L R
EP
OR
T 2
01
3
NIP
PO
N T
ELE
GR
AP
H A
ND
TE
LEP
HO
NE
CO
RP
OR
AT
ION
A
NN
uA
L R
EP
OR
T 2
01
3O
pera
tions
in R
evie
w

033032
Total Assets: ¥19,653.7 billion
Consolidated Operating Revenues: ¥10,700.7 billion
Number of Employees: 227,150
Consolidated Subsidiaries: 827
Nippon Telegraph and Telephone Corporation
(Holding Company)
Total Assets: ¥7,467.9 billion
Operating Revenues: ¥432.8 billion
Number of Employees: 2,900
Common Stock: ¥937.9 billion
Main Businesses: For the NTT Group as a whole, formulation of management strategies and promotion of basic research
NTT Group in BriefFiscal year ended March 31, 2013 / As of March 31, 2013
Regional Communications BusinessNTT Group
Other Businesses
Mobile Communications Business
Data Communications Business
Long Distance and International Communications Business
NIP
PO
N T
ELE
GR
AP
H A
ND
TE
LEP
HO
NE
CO
RP
OR
AT
ION
A
NN
uA
L R
EP
OR
T 2
01
3
NIP
PO
N T
ELE
GR
AP
H A
ND
TE
LEP
HO
NE
CO
RP
OR
AT
ION
A
NN
uA
L R
EP
OR
T 2
01
3N
TT G
roup
in B
rief
Operating Revenues: ¥3,658.2 billion
Operating Income: ¥92.5 billion
Capital Investment: ¥785.9 billion
R&D Expenses: ¥118.5 billion
Number of Employees: 81,300
Consolidated Subsidiaries: 80
Principal Subsidiaries
Principal Subsidiaries
Principal Subsidiary
Principal Subsidiary
Voting rights 100%
Voting rights 100%
Voting rights 100%
Voting rights 100%
Voting rights 66.6%
Voting rights54.2%
Operating Revenues: ¥1,657.9 billion
Operating Income: ¥121.3 billion
Capital Investment: ¥147.5 billion
R&D Expenses: ¥15.6 billion
Number of Employees: 33,450
Consolidated Subsidiaries: 270
Operating Revenues: ¥4,470.1 billion
Operating Income: ¥836.4 billion
Capital Investment: ¥753.7 billion
R&D Expenses: ¥111.3 billion
Number of Employees: 23,900
Consolidated Subsidiaries: 181
Operating Revenues: ¥1,303.5 billion
Operating Income: ¥85.8 billion
Capital Investment: ¥122.1 billion
R&D Expenses: ¥12.1 billion
Number of Employees: 61,350
Consolidated Subsidiaries: 217
Operating Revenues: ¥1,257.6 billion
Operating Income: ¥53.6 billion
Capital Investment: ¥160.8 billion
R&D Expenses: ¥132.7 billion
Number of Employees: 27,150
Consolidated Subsidiaries: 79
Business Activities: Regional telecommunications operations in Japan and related businesses
Competitors: Regional telecommunications companies, electric power company-related telecommunications companies, etc.
Competitive Advantages: In the field of regional telecommunications, comprehensive strengths (reliability / stability of services and area coverage), high market share, and extensive customer base
Business Activities: Long-distance telecommunications operations in Japan, international telecommunications operations, solutions business, related businesses, etc.
Competitors: Long-distance telecommunications companies, ISP companies, domestic and overseas IT services companies, etc.
Competitive Advantages: In the fields of long-distance and international telecommunications, comprehensive strengths (reliability / stability of services and area coverage), extensive service lineup, including application services and cloud services, high market share, and extensive customer base
Business Activities: Mobile phone business in Japan and overseas, related businesses, etc.
Competitors: Mobile telecommunications companies, etc.
Competitive Advantages: In the mobile telecommunications market, technical and R&D capabilities, as demonstrated by the LTE Xi service, network quality, service development capabilities, including partnerships with related companies, high market share, and extensive customer base
NTT DOCOMOAnnual Report 2013
Business Activities: Systems integration, network system services, etc., in Japan and overseas
Competitors: IT services companies, etc., in Japan and overseas
Competitive Advantages: In the IT services market, neutrality, technical capabilities and reliability, and foresight, as well as results and know-how in large-scale systems that leverage these capabilities in such fields as the public sector and finance
Business Activities: Real estate, finance, construction / electric power, system development, advanced technology development, etc.
NTT DATA Corporation
ANNUAL REPORT 2013Fiscal Year Ended March 31, 2013
NT
T D
ATA C
OR
PO
RAT
ION
AN
NU
AL R
EP
OR
T 2013
Regional Communications Business 29.6%
Long Distance and International Communications Business 13.4%
Mobile Communications Business 36.2%
Data Communications Business 10.6%
Other Businesses 10.2%
¥12,347.4billion
Composition of Operating RevenuesPercentage of simple sum of all segments (including inter-segment transactions)
Regional Communications Business 7.8%
Long Distance and International Communications Business 10.2%
Mobile Communications Business 70.3%
Data Communications Business 7.2%
Other Businesses 4.5%
¥1,189.6billion
Composition of Operating IncomePercentage of simple sum of all segments (including inter-segment transactions)
Regional Communications Business 39.9%
Long Distance and International Communications Business 7.5%
Mobile Communications Business 38.3%
Data Communications Business 6.2%
Other Businesses 8.1%
¥1,967.0billion
Composition of Capital Investment
NTT DATAAnnual Report 2013
>> See page 034
>> See page 038
>> See page 042
>> See page 046
>> See page 050

035034
Regional Communications Business
Basic Business Policy
Business Environment
Number of Fixed-Line Broadband Service Subscriptions in Japan(Millions of subscriptions) (%)
FTTH DSL CATV
FTTH market share: NTT East and NTT West (right scale)Sources: MIC, TCA
The regional communications market is undergoing substan-tial changes. In broadband services, competition among carriers is intensifying, including services using fiber-optic access and those utilizing CATV. In addition, a growing range of new services leverage the capabilities of smartphones, tablets, and other mobile devices. As a result, customers are using diversifying services in new ways and there is an increased need for the offloading of mobile traffic to fixed networks due to growing mobile data traffic.
NTT East and NTT West are working to enhance the broad-band environment and expand customer use of fiber-optic services by providing services and products that utilize next-generation networks (NGN) and by offering billing plans that foster customer retention. In addition, NTT East and NTT West endeavor to provide high-quality, stable universal
services while taking steps to further increase the stability and strength of their management foundations. NTT East and NTT West strive to assure the reliability of their networks as social infrastructure through such activities as the rapid restoration of service in the event of a large-scale natural disaster or other emergency.
0
10
30
20
40
0
20
40
60
80
2009/3 2010/3 2012/32011/3 2013/3
74.3 72.5
34.935.36.0
5.4
23.9
32.9 34.130.3
74.1 74.4 74.5
End of year /month
IP / packet communications service revenues increased due to growth in subscriptions for FLET’S Hikari, a fiber-optic access service, and Hikari Denwa, a fiber-optic IP telephone service. However, this increase was not enough to offset a decline in fixed voice-related revenues stemming from a decrease in the number of fixed-line telephone subscriptions. Consequently, operating revenues were down 2.8% from the
Financial Results for the Fiscal Year Ended March 31, 2013
0
3,000
2,000
1,000
5,000
4,000
2012/3 2013/3
3,658.23,764.8
–2.8%
Fiscal year ended March 31
0
100
50
150
2012/3 2013/3
+6.5%
92.586.9
Fiscal year ended March 31
0
600
400
200
1,000
800
2012/3 2013/3
785.9811.8
–3.2%
Fiscal year ended March 31
previous fiscal year, to ¥3,658.2 billion. Operating expenses decreased 3.0%, to ¥3,565.7 billion, due in part to lower personnel expenses as a result of a smaller workforce, and to cost of services and equipment sold, and selling, general and administrative expenses. As a result, operating income was ¥92.5 billion, an increase of 6.5% from the previous fiscal year.
The number of FLET’S Hikari subscriptions reached 17.30 million as of March 31, 2013, an increase of 0.74 million from a year earlier. In the fiscal year ending March 31, 2014, we are targeting an increase of 1.0 million subscriptions, to 18.30 million at year-end. The number of Hikari Denwa channels reached 15.17 million, and the number of FLET’S TV subscriptions was 1.0 million. In addition, the number of subscriptions for Remote Support Service, which provides remote responses to a broad range of customer inquiries concerning all aspects of broadband services, reached 4.53 million, an increase of 0.23 million from a year earlier.
Basic monthly charges declined due to the uptake of economical billing plans and discount services. Consequently, FLET’S Hikari ARPu declined ¥60 at NTT East, to ¥5,840, and ¥70 at NTT West, to ¥5,860. On the other hand, the ARPu from value-added services increased due to the growth of Hikari Denwa, Remote Support Service, and other services. Moving forward, NTT East and NTT West will continue working to maintain and expand ARPu through growth in value-added services.
0
2,000
6,000
4,000
8,000
2009/3 2010/3 2011/3 2013/32012/3 2014/3(Forecast)
5,770
1,720
4,050
1,710
4,150
1,650
4,280
1,580
4,310
1,330
4,290
1,460
4,320
5,890 5,930 5,8605,7805,620
Fiscal year ended / ending March 31
Number of Subscriptions for Major Services
Trend in FLET’S Hikari ARPU
0
2,000
6,000
4,000
8,000
2009/3 2010/3 2011/3 2013/32012/3 2014/3(Forecast)
5,700
1,790
3,910
1,700
4,140
1,620
4,280
1,570
4,310
1,450
4,290
1,320
4,260
5,880 5,900 5,8405,7405,580
Fiscal year ended / ending March 31
Basic monthly charges Value-added services
* Please see page 131 for the ARPu calculation method and other details. Basic monthly charges Value-added services
FLET’S Hikari (FTTH) (Millions of subscriptions)
FLET’S TV (Millions of subscriptions)
Remote Support Service (Millions of subscriptions)
Hikari Denwa (Millions of channels)
Operating Revenues(Billions of yen)
Operating Income(Billions of yen)
Capital Investment(Billions of yen)
NIP
PO
N T
ELE
GR
AP
H A
ND
TE
LEP
HO
NE
CO
RP
OR
AT
ION
A
NN
uA
L R
EP
OR
T 2
01
3
NIP
PO
N T
ELE
GR
AP
H A
ND
TE
LEP
HO
NE
CO
RP
OR
AT
ION
A
NN
uA
L R
EP
OR
T 2
01
3R
egio
nal C
omm
unic
atio
ns
Bus
ines
s
0
15
10
5
20
2011/3 2012/3 2014/3(Forecast)
2013/3
17.3015.06
16.5618.30
End of year /month
0
0.9
0.6
0.3
1.2
2011/3 2012/3 2014/3(Forecast)
2013/3
1.00
0.59
0.86
1.19
End of year /month
0
10
20
2011/3 2012/3 2014/3(Forecast)
2013/3
15.1712.1113.90 16.42
80% 84%90%88%
End of year /month
0
4
2
6
2011/3 2012/3 2014/3(Forecast)
2013/3
4.53
3.34
4.304.66
End of year /month
Number of channels
Percentage of FLET’S Hikari users* Number of Hikari Denwa channels divided
by number of FLET’S Hikari subscriptions multiplied by 100.
+0.74 millionsubscriptions
+1.27 millionchannels
NTT West(Yen)
NTT East(Yen)

037036
Expansion of Service MenusNTT East and NTT West worked to disseminate and expand convenient, high-value added services that meet diverse customer needs, as well as to enhance and strengthen billing plans. To promote new subscriptions for FLET’S Hikari, NTT East began the Omoikkiri Wari discount campaign for new customers. This campaign, which is designed to pro-mote new subscriptions, featured the largest discounts ever offered by NTT East on monthly service charges. In addition, NTT East began to offer Ninen-wari, a discount plan that is conditional upon 24 consecutive months of use, for multiple-dwelling units in addition to single-dwelling units. NTT West began to offer FLET’S Hikari Next Super High-Speed Type Hayabusa, a fiber-optic broadband service with a maximum transmission speed of 1 Gbp. NTT West also began to offer Hikari Motto Motto Wari, a billing plan that provides discounts on monthly charges for FLET’S Hikari Next depending on the number of years of subscrip-tion, under the condition of continuous use within the appli-cable discount period. These initiatives had a certain degree of results in attracting new customers and limiting cancellations.
NTT East and NTT West conducted efficient and effective marketing activities to meet the needs of regional customers through the use of ICT. These initiatives were implemented in such fields as municipal services, medicine, and education, with a focus on industry-specific solutions that have been developed based on each industry’s unique characteristics and trends.
Initiatives for MunicipalitiesAfter the Great East Japan Earthquake, many municipalities expressed a need to back up their important data in remote locations. In response, NTT East and the NTT West Group are leveraging their data centers in all 47 prefectures to offer new services that address these growing needs for Business Continuity Planning (BCP). These include a service to backup customer data and a service to lease virtual servers on the cloud to customers. NTT East and the NTT West Group are increasing sales of these kinds of cloud services, which are useful in BCP to companies and municipalities that want to ensure that their important systems are oper-ated in a secure and safe manner.
Initiatives in MedicineIn consideration of the growing interest in the use of ICT to share information among medical institutions, NTT East
Business Development
Initiatives to Advance Fiber-Optic and IP-Related Services Solutions Business Initiatives
Regional Communications Business
Expanding Opportunities to Use Hikari (FTTH) through Wi-FiIn response to the growing use of smartphones and tablets, NTT East and NTT West began to offer FLET’S Hikari Wi-Fi Access, an Internet connection service for small multiple-dwelling units, such as apartment buildings. With this ser-vice, multiple customers can access the Internet by sharing a wireless LAN that is connected to the fiber-optic network. In addition, NTT East worked in cooperation with the shopping district association in Jiyugaoka, Tokyo, to establish a Wi-Fi area in front of the station and in the shopping district, enabling shopping district information to be sent to smart-phones and other devices. Furthermore, working in conjunc-tion with local governments and tourism associations in Yamanashi Prefecture, Miyagi Prefecture, and other areas, NTT East established Wi-Fi environments that enable the growing number of tourists from overseas to access tourism-related information on their smartphones. NTT West, in con-junction with Fukuoka City, is taking steps to contribute to increased convenience and bolstered information provision capabilities, such as establishing free Wi-Fi environments at train stations, airports, and tourist information centers. Going forward, NTT East and NTT West will further expand their links with local communities, distribute coupons through Wi-Fi, and enhance support for store owners who distribute coupons. In this way, NTT East and NTT West will strive to increase usage value for both users and store own-ers and to encourage the regular use of Wi-Fi.
launched a medical information sharing system that gathers the electronic medical records of different medical institutions in chronological order. This system uses ICT to contribute to seamless cooperation among regional medical institutions. The NTT West Group is providing networks, data cen-ters, and cloud services to medical institutions and the health care industry. These initiatives address the pressure on hospital management from the increasing sophistication and complexity of medical information systems and the need to protect patient information from a variety of risks, such as natural disasters.
Initiatives in EducationNTT East and the NTT West Group are working with infor-mation solutions for educational institutions at all levels, such as boards of education and universities. For elementary schools and junior high schools, NTT East and the NTT West Group are offering a school administration support system that reduces the administrative burden on teachers and is building an ICT environment for education that realizes new styles of learning. For universities, NTT East and the NTT West Group are taking steps to establish an environment for the use of ICT on campuses, such as providing academic systems using the cloud. Moving forward, NTT East and the NTT West Group will aggressively take steps to further expand usage, such as offering solutions to meet growing needs for cloud-based services.
With mobile broadband expanding and becoming faster, what is the outlook for the fixed-line business?
The uptake of smartphones is a factor, and the pace of net additions in fixed-line broad-
band has tapered off from previous levels. Nonetheless, fixed-line broadband is superior in
terms of communications quality and capacity, and in the future we expect fixed-line to be
used for the 4K ultra high-definition video service and to handle the offloading of mobile
traffic, which is growing rapidly. In addition, by uncovering demand among small and
medium-sized businesses, we will continue working to expand our user base.
Operating revenues continue
to decline, due in part to lower
fixed-line voice revenues. What
are the results forecasts?
Looking ahead in the domestic market, where competition is intense, we believe that it
will be possible to secure profits by increasing efficiency in investments and operations.
Specifically, we will work to increase facility efficiency by simplifying networks and thereby
reducing construction and operating costs. Also, through such measures as consolidating
operations, we will aim for more-efficient operational administration with a smaller work-
force. In addition, we will reevaluate sales methods with a focus on cost-effectiveness.
Questions frequently asked by shareholders and investorsEnhancement of Support Services for Corporate Customers
One reason for the lack of progress in the use of ICT in business, especially by small and medium-sized businesses, is that many customers do not have full-time IT specialists. NTT East offers Office Marugoto Support, which provides centralized support for customers from installation to operation, so that even customers that do not have any IT staff can use these services in a worry-free manner. In addition, in February 2013 NTT East announced a collaborative project with Microsoft Japan and Dell Japan. This project will offer one-stop solutions under which the latest operating systems, applications, and cloud services from Microsoft Japan and the fiber-optic broadband services and support services from NTT East are to be provided together through Dell Japan’s newest PCs and tablets. In this way, NTT East expects to be able to expand sales of FLET’S Hikari to businesses and to generate stable revenues through maintenance and operations.
NIP
PO
N T
ELE
GR
AP
H A
ND
TE
LEP
HO
NE
CO
RP
OR
AT
ION
A
NN
uA
L R
EP
OR
T 2
01
3
NIP
PO
N T
ELE
GR
AP
H A
ND
TE
LEP
HO
NE
CO
RP
OR
AT
ION
A
NN
uA
L R
EP
OR
T 2
01
3
D e p t hin
DevicesOS / Applications / Cloud
Reg
iona
l Com
mun
icat
ions
B
usin
ess

039038
Long Distance and International Communications Business
For the fiscal year ended March 31, 2013, operating revenues in the Long Distance and International Communications Business segment were ¥1,657.9 billion, a decrease of 1.2% from the previous fiscal year. This decline was due in part to a decrease in fixed voice-related reve-nues, which offset growth in revenues stemming from an increase in the number of consolidated subsidiaries and
expansion in the number of subscriptions for video services. Operating expenses were ¥1,536.7 billion, a decrease of 1.6% from the previous fiscal year, due to a reduction in costs resulting largely from an increase in administrative effi-ciency. Consequently, operating income was ¥121.3 billion, an increase of 4.0% from the previous fiscal year.
In the global ICT market, growth in past years has been led by the united States, and in the future the united States is expected to continue to record a high rate of growth. In addition, substantial growth is also expected in emerging countries, such as in the Asia-Pacific region. To capture ICT growth potential, market players are implementing a range of strategic initiatives in countries and regions around the world, centered on measures to enhance broadband plat-forms and promote the use of ICT. Against this backdrop, competition is intensifying on a global level.
By optimizing the allocation of functions and responsibilities at the global level, NTT Communications is working to develop service, sales, and operational capabilities that are competitive in global markets. In the corporate market, NTT Communications is providing total ICT outsourcing services on a global basis. These services are a combination
6th Cloud Ranking Award(Nikkei Computer, March 7, 2013 issue)
NTT Communications selected as one of the Best Brands (6th consecutive selection since the 1st Cloud Ranking).
Five services were selected as Best Services in five divisions, including Biz Hosting in the Cloud Platform Service (Iaas / PaaS) Division.
1st Business Cloud Comprehensive Evaluation
(MM Research Institute, announced February 19, 2013)
NTT Communications Biz Hosting was ranked No. 1, with an overall rating of AAA.
Out of a total of six categories, the highest evaluation was received in five: basic functions, service functions, network, reliability, and opera-tional support.
Telecom Asia Awards 2013(Telecom Asia Group, received April 17, 2013)
NTT Communications was selected for Best Cloud-Based Service as a result of high marks earned for innovativeness for the world’s first enterprise cloud service deploying network virtualization technology.
NTT Communications was selected as Best Asian Telecom Carrier based on high evalua-tions of its innovation, financial performance, and market leadership, and other factors as a telecommunications carrier.
Financial Results for the Fiscal Year Ended March 31, 2013
0
1,500
1,000
500
2,000
2012/3 2013/3
1,657.91,678.7
–1.2%
Fiscal year endedMarch 31
0
100
50
150
2012/3 2013/3
121.3116.7
+4.0%
Fiscal year endedMarch 31
0
120
60
180
2012/3 2013/3
147.5152.3
–3.2%
Fiscal year endedMarch 31
Due to the uptake of mobile broadband and other factors, the total number of subscriptions to OCN and Plala fixed-line ISP services declined 280 thousand from the previous fiscal year, to 11.28 million. However, Hikari TV, a video distribution service, registered favorable growth in the number of subscriptions, which were up 450 thousand, to 2.45 million. In the fiscal year ending March 31, 2014, NTT Communications will work to further expand sales of Hikari TV and promote customer retention programs, targeting the achievement of three million subscriptions.
NTT Communications’ initiatives in the fields of cloud and network services have been highly evaluated in Japan and overseas, resulting in the receipt of many awards, including those outlined below. Dimension Data has also been widely recognized and has received more than 30 awards, including Enterprise Partner of the Year and Private Cloud Partner of the Year from Microsoft Corporation.
Number of Subscriptions for Major Services
Awards Received
Operating Revenues(Billions of yen)
Operating Income(Billions of yen)
Capital Investment(Billions of yen)
Basic Business Policy
Business Environment
Global ICT Market(Billions of uS$)
of cloud services, networks, data centers, applications, security, and other services. In the consumer market, NTT Communications is working to enable new lifestyle offerings for its customers by providing highly convenient applications and content.
Japan Asia Pacific united States Canada Latin America Western Europe Central-Eastern Europe Middle East, Africa
Source: Gartner, “Gartner Market Databook, 2Q13 update” Ken Newbury et al. 28 June 2013
0
1,000
3,000
2,000
5,000
4,000
2011 2012 2014 20152013 2016 2017Japan –1.8%
Asia Pacific
+6.9%
U.S. +4.0%
2013–2017: Average Annual
Growth Rate
Worldwide: +3.6%
Year
The Gartner Report(s) described herein, (the “Gartner Report(s)”) represent(s) data, research opinion, or viewpoints published, as part of a syndicated subscription service, by Gartner, Inc. (“Gartner”), and are not representations of fact. Each Gartner Report speaks as of its original publication date (and not as of the date of this annual report) and opinions expressed in the Gartner Report(s) are subject to change without notice.
NIP
PO
N T
ELE
GR
AP
H A
ND
TE
LEP
HO
NE
CO
RP
OR
AT
ION
A
NN
uA
L R
EP
OR
T 2
01
3
NIP
PO
N T
ELE
GR
AP
H A
ND
TE
LEP
HO
NE
CO
RP
OR
AT
ION
A
NN
uA
L R
EP
OR
T 2
01
3
Hikari TV (Millions of subscriptions)
0
2
1
4
3
2011/3 2012/3 2014/3(Forecast)
2013/3
2.45
1.41
2.00
3.00
End of year /month
Plala (Millions of subscriptions)
0
3
2
1
4
2011/3 2012/3 2014/3(Forecast)
2013/3
3.073.10 3.12 3.00
End of year /month
OCN (Millions of subscriptions)
0
7.5
5.0
2.5
10.0
2011/3 2012/3 2014/3(Forecast)
2013/3
8.218.23 8.44 7.98
End of year /month
Long
Dis
tanc
e an
d In
tern
atio
nal
Com
mun
icat
ions
Bus
ines
s

041040
Enhancing the Cloud PlatformNTT Communications has worked to enhance the cloud platform in accordance with its Global Cloud Vision, which was formulated in October 2011. For example, in June 2012 NTT Communications began the global provision of Biz Hosting Enterprise Cloud. This service for corporate customers can be used even for enterprise management systems, which require the highest degree of security and reliability, and it is the world’s first cloud service that utilizes network virtualization technology not only within data centers but also on networks between data centers. The benefits of using network virtualization technology include the ability to configure network equipment as needed on the same day the request is made via the customer portal, in comparison with the several days that were required under previous systems. This service was available at 10 bases in eight countries as of July 2013, and plans call for it to be expanded to 11 bases in nine countries by the end of 2013. NTT Communications is also providing Biz Hosting Cloud n, a simple, low cost public cloud service that is suitable for web applications. Plans call for the number of overseas bases offering this service to be steadily expanded while new functions are added. Moreover, NTT Communications continues to expand its data centers in Japan and overseas. New data centers have been launched in Singapore and Malaysia, and in Japan construction work has been completed on one of the largest data centers in the Tokyo metropolitan area. The number of data centers had surpassed 140 as of July 2013. These new facilities are demonstrating favorable sales trends, with many data centers sold out during the reservation stage. Going forward, NTT Communications will further expand its core data centers, which are the cornerstone of its cloud plat-forms. For example, in May 2013 new data centers were opened in Hong Kong and the united Kingdom.
Expansion of Global Network ServicesNTT Communications began operating the Asia Submarine-cable Express (ASE), a submarine cable with the lowest latency level in the industry. ASE links major Asian cities, such as Japan, Singapore, and Hong Kong. Moreover, NTT Communications obtained a license necessary for providing telecommunications services in Vietnam, and launched a data network service for corporate customers to provide inter-office connections within Vietnam. In these ways, NTT Communications worked to enhance its highly reliable global network platform.
Dimension Data worked to reinforce its cloud business, cen-tered on the Cloud Solution Business unit, which was estab-lished in 2011. Leveraging the technologies and know-how of OpSource, which became a subsidiary in June 2011, Dimension Data is implementing global development of a comprehensive managed cloud platform. Dimension Data’s
Business Development
Initiatives Implemented by the NTT Communications Group Dimension Data Group Initiatives
Long Distance and International Communications Business
Development of IP-Related ServicesThrough Hikari TV, a video distribution service, NTT Communications began to provide Hikari TV Book, a service that enables e-books to be enjoyed on a TV, and Hikari TV Music, a music distribution service that allows unlimited listening at a flat rate. Also, Hikari TV Game, Japan’s first cloud game service for TVs, was launched in June 2013. Through these services, NTT Communications has worked to enhance content, expand new sales, and promote cus-tomer retention. In addition, for corporate customers, the Arcstar IP Voice service, which provides corporate customers with inexpensive and stable quality voice communications ser-vice, was launched in August 2012. With this service, voice communications are converted to IP and integrated into data communication circuits, lowering communication network cost and operational burden.
On a non-consolidated basis, NTT Communications continues to record declining revenues. What is the future outlook?
NTT Communications’ non-consolidated operating revenues are expected to continue to
decline due to decreasing voice revenues. NTT Communications Group companies, how-
ever, are active in growth fields, such as global, cloud, and video services. In the future, the
NTT Communications Group will strive to increase revenues as a whole by steering these
growth businesses onto the right course and increasing the revenues of subsidiaries.
How are you implementing operational cooperation between NTT Communications and Dimension Data?
The two companies are making joint proposals in regard to network construction and the
procurement and installation of related equipment. In Dimension Data’s IT outsourcing
services, a cooperative sales system has been established to engage in a range of activi-
ties, such as reselling NTT Communications’ networks and data centers. Also, when there
are issues in customer service, we respond quickly by sharing, in real time, the operational
status of the services and equipment provided by each company. In these ways, we have
reinforced our cooperation at the operational level as well.
Questions frequently asked by shareholders and investors
Highly Reliable, Low Latency, Large Capacity Submarine Cable
Hong Kong
The Philippines
Singapore
Malaysia
Japan PC-1
ASE began operating in August 2012
ASE* Hong Kong route began operating in
February 2013To the U.S.
cloud revenues doubled in the year to December 2012, and its cloud business customer base grew to more than 2,000 companies. In the future, leveraging the global customer base cultivated through the system integration business, Dimension Data will aggressively advance its cloud services in this growing market.
Hong Kong Financial Data Centre
In May 2013, NTT Communications opened the Hong Kong Financial Data Centre in the Tseung Kwan O Industrial Estate in Eastern Kowloon. With a total gross floor area of more than 70,000 square meters, this data center is one of the Group’s largest. The design includes redundancy for all facilities, including power source, air conditioning, and electricity supply route, making the center resis-tant to natural disasters. In this way, the Hong Kong Financial Data Centre offers the industry’s highest level of reliability. In addition, the Asia Submarine-cable Express (ASE) is linked directly to the server room. Accordingly, customers can use a low latency, low cost dedicated line service linking the center with major cities in Asia. The center is located near the Hong Kong stock exchange, and inquiries have been received from many companies, centered on financial institutions that conduct high-frequency financial product transactions and other operations where microseconds make a difference. In the future, the Hong Kong Financial Data Centre will be used as an important base for cloud services.
* ASE: Asia Submarine-cable Express
NIP
PO
N T
ELE
GR
AP
H A
ND
TE
LEP
HO
NE
CO
RP
OR
AT
ION
A
NN
uA
L R
EP
OR
T 2
01
3
NIP
PO
N T
ELE
GR
AP
H A
ND
TE
LEP
HO
NE
CO
RP
OR
AT
ION
A
NN
uA
L R
EP
OR
T 2
01
3
D e p t hin
Long
Dis
tanc
e an
d In
tern
atio
nal
Com
mun
icat
ions
Bus
ines
s

043042
Financial Results for the Fiscal Year Ended March 31, 2013
Mobile Communications Business
Basic Business Policy
Business Environment
Number of Mobile Phone Subscriptions in Japan (Millions of subscriptions) (%)
Subscriptions (left scale) NTT DOCOMO’s market share (right scale)Source: TCA research (Number of subscriptions for certain companies are from financial
results presentation materials)
Japan’s mobile telecommunications market is undergoing dramatic change, due in part to the rapid adoption of smart-phones and the growth of social networking services (SNS). With the smartphone market continuing to expand, the com-petition among mobile phone carriers remains intense, and consumers are actively utilizing the mobile number portability (MNP) system. On the other hand, the uptake of smartphones and data communications devices has led to rapid growth in data traffic. As a result, the carriers continue working to reinforce their high-speed mobile network infrastructure technologies, such as LTE, while increasing public wireless LAN access points to facilitate data offloading.
To help provide consumers and businesses with safety and security, as well as convenience and efficiency, NTT DOCOMO worked to further increase the speed of Xi (pro-nounced “crossy”), an LTE service that facilitates high-speed, large-capacity communications, and to expand the Xi service areas. We also worked to enhance our Xi-compatible handset lineup. In these ways, we endeavored to increase smartphone
convenience. In addition, NTT DOCOMO introduced a range of billing plans and improved after-sales services in order to provide its customers with a customer-friendly environment for the use of smartphones and LTE services. We also took steps to create new value and to expand business in new fields through cooperative ventures with alliance partners and industry / service convergence initiatives.
0
50
150
100
200
0
15
30
45
60
2009/3 2010/3 2012/32011/3 2013/3
46.9 45.2
128.2 136.0
112.2 119.5107.5
50.8 50.0 48.5
End of year /month
Voice revenues declined, due in part to the influence of the Monthly Support discount program. However, packet communications revenues and equipment sales revenues increased, and growth was recorded in new business fields. As a result, operating revenues in the Mobile Communications Business segment were ¥4,470.1 billion, an increase of 5.4% from the previous fiscal year.
0
3,000
2,000
1,000
5,000
4,000
2012/3 2013/3
4,470.14,240.0
+5.4%
Fiscal year ended March 31
0
600
400
200
1,000
800
2012/3 2013/3
836.4876.4
–4.6%
Fiscal year ended March 31
0
600
400
200
1,000
800
2012/3 2013/3
753.7726.8
+3.7%
Fiscal year ended March 31
As a result of costs involved in the expansion of new businesses as well as an increase in the cost of equipment sold due to growth in sales of smartphones, operating expenses were ¥3,633.7 billion, a rise of 8.0% from the pre-vious fiscal year. As a result, operating income was ¥836.4 billion, a decline of 4.6% from the previous fiscal year.
Operating Revenues(Billions of yen)
Operating Income(Billions of yen)
Capital Investment(Billions of yen)
Mobile phone subscriptions at year-end were 61.54 million, an increase of 1.41 million from the previous fiscal year-end. We will strive to achieve 63.40 million subscriptions at the end of March 2014. The number of LTE Xi subscriptions grew rapidly, rising to 11.57 million at year-end, 5.2 times the year-earlier level. Accordingly, LTE Xi subscribers accounted for about 60% of all smartphone users. NTT DOCOMO’s smartphone sales campaigns were successful, and the number of units sold rose 50.7%, to 13.29 million.
While voice revenues decreased by ¥267.3 billion from the previous fiscal year, due mainly to the influence of the Monthly Support discount program, packet revenues*2 increased by ¥109.3 billion. The mobile phone aggregate ARPu was ¥4,840, a decline of ¥300. This decline was attributable to a decrease of ¥470 in voice ARPu. On the other hand, packet ARPu increased by ¥100 due to growth in the number of smartphone users. Smart ARPu rose by ¥70, due in part to growth in d market revenues.
0
6,000
4,000
2,000
8,000
2009/3 2010/3 2011/3 2013/32012/3 2014/3(Forecast)
4,570510
420350
1,3401,7302,2002,5302,9003,330
2,7202,690
2,5902,5402,4502,380
5,070 5,140 4,8405,350
5,710
Fiscal year ended / ending March 31
Number of Subscriptions for Major Services
Mobile Communications Service Revenues and Aggregate ARPU*1
0
3,000
2,000
1,000
4,000
2009/3 2010/3 2011/3 2013/32012/3 2014/3(Forecast)
2,990.0
1,034.01,274.61,541.91,712.21,910.52,149.6
1,956.01,893.9
1,784.61,642.41,546.0
1,475.2
3,354.6 3,326.5 3,168.53,456.5
3,624.9
Fiscal year ended / ending March 31
Voice revenues Packet revenues *2 From the fiscal year ended March 31, 2013, the definition of items comprising packet
communications has been changed. Packet revenues for the fiscal year ended March 31, 2009 and thereafter have been restated to reflect this change.
Voice ARPu Packet ARPu Smart ARPu *1 Please see page 132 for the ARPu calculation method and other details. Packet ARPu
from the fiscal year ended March 31, 2009 to the fiscal year ended March 31, 2011 includes amounts corresponding to smart ARPu.
Mobile Phone Subscriptions (Millions of subscriptions)
Smartphone Sales (Millions of units)
Net Additions and Churn Rate (Millions of subscriptions) (%)
NIP
PO
N T
ELE
GR
AP
H A
ND
TE
LEP
HO
NE
CO
RP
OR
AT
ION
A
NN
uA
L R
EP
OR
T 2
01
3
NIP
PO
N T
ELE
GR
AP
H A
ND
TE
LEP
HO
NE
CO
RP
OR
AT
ION
A
NN
uA
L R
EP
OR
T 2
01
3
0.03
56.75
1.24
2.22
57.91
11.57
49.97
25.30
38.11
0
40
80
20
60 61.5458.01 60.13 63.40
2011/3 2012/3 2014/3(Forecast)
2013/3End of year /month
0
15
10
5
20
2011/3 2012/3 2014/3(Forecast)
2013/3
13.29
2.52
8.82
16.00
End of year /month
0
2.0
1.5
0.5
1.0
2.5
0
0.8
0.6
0.2
0.4
1.0
2011/3 2012/3 2014/3(Forecast)
2013/3
1.41
1.932.12
1.85
0.47%
0.60%
0.82%
End of year /month
mova (2G) FOMA (3G) Xi (LTE)
Xi achieved 10 million subscriptions
Aggregate ARPU(Yen)
Mobile Communications Service Revenues(Billions of yen)
Net additions (left scale) Churn rate (right scale)
Mob
ile C
omm
unic
atio
ns
Bus
ines
s

045044
Maximum throughput
2012/3 2013/3 2014/3(Forecast)
2015/3(Forecast)
2016/3(Forecast)
75 Mbps 112.5 Mbps 150 Mbps
Population coverage
Local citiesAll municipalities
End of March 2013Number of base stations: about 24,400
End of March 2014Number of base stations: about 50,000
Prefectural capital-size citiesMajor cities
2012/3
Approx. 30%
2013/3
Approx. 77%
Fiscal year ended / ending March 31
Boosting Handset Competitiveness / Enhancing Handset LineupAccompanying growth in the number of LTE Xi users, NTT DOCOMO shifted the focus of its handset lineup to Xi-compatible smartphones and took steps to help users make the most of services that leverage the distinctive capa-bilities of smartphones. These included the development of high-capacity batteries that can accommodate high levels of power consumption and the introduction of quad-core CPus that facilitate high-speed processing. In addition, we followed a sales strategy of thoroughly focusing on the appeal of highly competitive, advanced handsets, which we introduced as our recommended devices. We also developed a lineup of handsets that are easy to use, even for people who are using a smartphone for the first time. In this way, we worked to expand the portfolio of smartphone users.
NTT DOCOMO is working to enhance the network environ-ment to ensure customers can enjoy its services comfort-ably. For example, NTT DOCOMO expanded the Xi service area, centered on major cities throughout Japan, and achieved population coverage of approximately 77% at the end of March 2013. Moving forward, NTT DOCOMO will continue taking steps to meet customer needs and expand the Xi service area. The communications speed of the Xi service was further increased in 130 cities around Japan (as of the end of June 2013), and ultra-high-speed communica-tions services were launched. These services offer a maxi-mum downlink transmission speed of 112.5 Mbps, the highest in Japan. During the fiscal year ending March 31,
2014, NTT DOCOMO plans to achieve a maximum downlink transmission speed of 150 Mbps.
Development of NTT DOCOMO CloudNTT DOCOMO promoted docomo cloud, which allows cus-tomers to use their smartphones or tablets to receive conve-nient services that are uniquely offered by NTT DOCOMO through access to its servers on the network. On the cloud, d market offers a rich suite of digital content, such as videos, music, and e-books, as well as a variety of physical mer-chandise, such as groceries and daily necessities. d market recorded favorable growth, with sales increasing to ¥23.0 billion, 11.5 times the level of a year earlier.
Efforts in New FieldsNTT DOCOMO worked to create new value through coop-erative ventures with other companies and through industry /
Business Development
Initiatives to Reinforce the Smartphone User Base
Accelerating LTE Xi Service Development
Activities for New Value Creation
Mobile Communications Business
service convergence. For example, several companies were brought into the NTT DOCOMO Group as subsidiaries. These include Radishbo-ya, which is a pioneer in membership-based organic vegetable home delivery operations; Tower Records Japan Inc., which has substantial brand strength in music sales; and MAGASeek Corporation, which operates one of Japan’s leading e-commerce sites for fashion items. In this way, NTT DOCOMO is providing high-value-added services that leverage synergies with mobile communications. Moreover, to reinforce our service development capabili-ties in new business fields, we launched an incubation pro-gram, Docomo Innovation Village, to support startups and ventures. Through this program, NTT DOCOMO is support-ing entrepreneurs in both tangible and intangible ways, such as the provision of office space as well as advice from spe-cialists on management and development. This program helps to advance the development of services and business models that will expand the ways in which the mobile Internet is used. NTT DOCOMO plans to further expand its business, aiming for revenue of ¥1 trillion in new fields in the fiscal year ending March 31, 2016.
Enhancing Billing PlansTo respond to the diverse needs of users, NTT DOCOMO introduced new flat-rate billing plans and discount promo-tions. The key drivers of the increase in Xi subscriptions were the NTT DOCOMO Family Set Discount, which offers dis-counts when multiple family members purchase handsets at the same time, and a campaign of limited-time discounts on the basic monthly charges for customers who purchase a smartphone compatible with LTE Xi. Other plans also contrib-uted to the growth in Xi subscriptions. These included a flat-rate voice plan offering 24-hour unlimited domestic voice calls to other NTT DOCOMO subscribers and a low-cost flat-rate packet communications plan for customers who do not use video and other rich content on a daily basis. Moving forward, NTT DOCOMO will continue working to establish a framework that offers ease-of-use for customers without adversely affect-ing profitability, while at the same time maintaining a balance between handset sales prices and communications charges.
Results remain sluggish in sales of mobile phone subscriptions. What are NTT DOCOMO’s countermeasures for this situation?
With the mobile phone market shifting from feature phones to
smartphones, competition among companies to acquire custom-
ers is intensifying. In the past, NTT DOCOMO focused on offering
a broad lineup of handsets to meet diverse customer needs, but
from January 2013 strategic models were selected from the new
releases and introduced as DOCOMO’s recommended handsets.
With the summer models, which were announced in May 2013,
we streamlined our lineup and focused our efforts on two highly
competitive handsets, which we presented as our Top Two mod-
els. Moving forward, in addition to changing our handset sales
strategy, we will thoroughly enhance our networks and services,
which are the basic elements of the communications business.
With mobile traffic increasing rapidly, will it really be possible to reduce capital investment?
Network-related capital investment will be maintained to support a steady response to
the increase in data traffic resulting from growth in the number of smartphone users.
Investment in 3G networks has run its course, and in the future the focus will be on LTE-
related investment. In addition, NTT DOCOMO will focus on increasing efficiency in such
fields as information systems and R&D. NTT DOCOMO believes it is possible to reduce
overall capital investment while simultaneously increasing convenience for customers and
securing a competitive edge over other companies.
Questions frequently asked by shareholders and investors
NIP
PO
N T
ELE
GR
AP
H A
ND
TE
LEP
HO
NE
CO
RP
OR
AT
ION
A
NN
uA
L R
EP
OR
T 2
01
3
NIP
PO
N T
ELE
GR
AP
H A
ND
TE
LEP
HO
NE
CO
RP
OR
AT
ION
A
NN
uA
L R
EP
OR
T 2
01
3M
obile
Com
mun
icat
ions
B
usin
ess
Advancing New Development in Cloud Service
Hanashite Hon’yaku is a cloud service that uses mobile phones to provide instant translation of a conversation between two people speaking different languages. Its accuracy and speed have been highly evaluated in international venues, and it won the GrandPrix in the u.S. Media Panel Innovation Awards at CEATEC JAPAN 2012. Shabette Concier is a free voice interface that makes it possible to operate handsets, as well as search for content, by simply speaking into a smartphone. This service also leverages NTT DOCOMO’s original, leading-edge voice-recognition technologies. Shabette Concier has recorded more than 340 million uses and is contributing to growth in revenues by serving as a pathway that guides customers to a variety of fee-based services, such as d shopping.
D e p t hin
LTE Xi Service Area Development
GrandPrix in the u.S. Media Panel Innovation Awards 2012 at CEATEC JAPAN 2012
GALAXY S4
d shopping d video d music d book
Top Two models for summer 2013
Xperia™ A
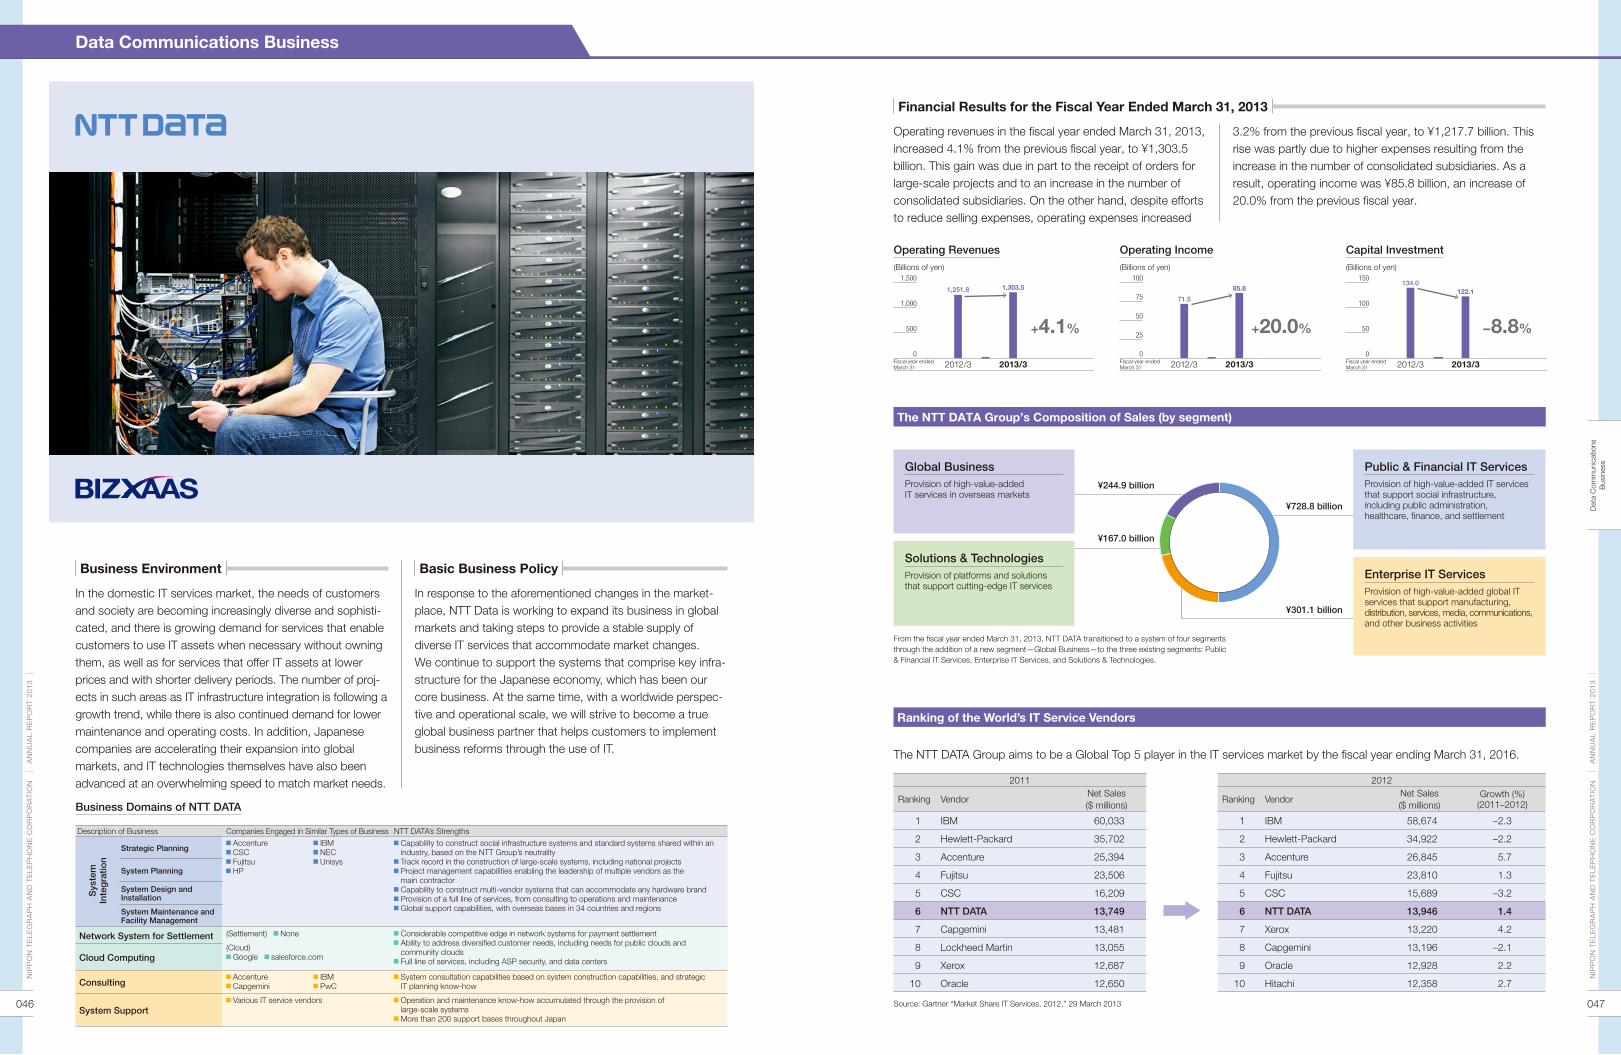
047046
2011
Ranking VendorNet Sales ($ millions)
1 IBM 60,033
2 Hewlett-Packard 35,702
3 Accenture 25,394
4 Fujitsu 23,506
5 CSC 16,209
6 NTT DATA 13,749
7 Capgemini 13,481
8 Lockheed Martin 13,055
9 Xerox 12,687
10 Oracle 12,650
Source: Gartner “Market Share IT Services, 2012,” 29 March 2013
2012
Ranking VendorNet Sales ($ millions)
Growth (%)(2011–2012)
1 IBM 58,674 –2.3
2 Hewlett-Packard 34,922 –2.2
3 Accenture 26,845 5.7
4 Fujitsu 23,810 1.3
5 CSC 15,689 –3.2
6 NTT DATA 13,946 1.4
7 Xerox 13,220 4.2
8 Capgemini 13,196 –2.1
9 Oracle 12,928 2.2
10 Hitachi 12,358 2.7
Financial Results for the Fiscal Year Ended March 31, 2013
Data Communications Business
Business Environment Basic Business Policy
In the domestic IT services market, the needs of customers and society are becoming increasingly diverse and sophisti-cated, and there is growing demand for services that enable customers to use IT assets when necessary without owning them, as well as for services that offer IT assets at lower prices and with shorter delivery periods. The number of proj-ects in such areas as IT infrastructure integration is following a growth trend, while there is also continued demand for lower maintenance and operating costs. In addition, Japanese companies are accelerating their expansion into global markets, and IT technologies themselves have also been advanced at an overwhelming speed to match market needs.
In response to the aforementioned changes in the market-place, NTT Data is working to expand its business in global markets and taking steps to provide a stable supply of diverse IT services that accommodate market changes. We continue to support the systems that comprise key infra-structure for the Japanese economy, which has been our core business. At the same time, with a worldwide perspec-tive and operational scale, we will strive to become a true global business partner that helps customers to implement business reforms through the use of IT. The NTT DATA Group aims to be a Global Top 5 player in the IT services market by the fiscal year ending March 31, 2016.
Operating revenues in the fiscal year ended March 31, 2013, increased 4.1% from the previous fiscal year, to ¥1,303.5 billion. This gain was due in part to the receipt of orders for large-scale projects and to an increase in the number of consolidated subsidiaries. On the other hand, despite efforts to reduce selling expenses, operating expenses increased
0
1,000
500
1,500
2012/3 2013/3
1,303.51,251.8
+4.1%
Fiscal year ended March 31
0
50
75
25
100
2012/3 2013/3
85.8
71.5
+20.0%
Fiscal year ended March 31
0
100
50
150
2012/3 2013/3
122.1134.0
–8.8%
Fiscal year ended March 31
3.2% from the previous fiscal year, to ¥1,217.7 billion. This rise was partly due to higher expenses resulting from the increase in the number of consolidated subsidiaries. As a result, operating income was ¥85.8 billion, an increase of 20.0% from the previous fiscal year.
Operating Revenues(Billions of yen)
Business Domains of NTT DATA
Operating Income(Billions of yen)
Capital Investment(Billions of yen)
The NTT DATA Group’s Composition of Sales (by segment)
Ranking of the World’s IT Service Vendors
Description of Business Companies Engaged in Similar Types of Business NTT DATA’s Strengths
Strategic Planning Accenture CSC Fujitsu HP
IBM NEC unisys
Capability to construct social infrastructure systems and standard systems shared within an industry, based on the NTT Group’s neutrality Track record in the construction of large-scale systems, including national projects Project management capabilities enabling the leadership of multiple vendors as the main contractor Capability to construct multi-vendor systems that can accommodate any hardware brand Provision of a full line of services, from consulting to operations and maintenance Global support capabilities, with overseas bases in 34 countries and regions
System Planning
System Design and Installation
System Maintenance and Facility Management
Network System for Settlement (Settlement) None Considerable competitive edge in network systems for payment settlement Ability to address diversified customer needs, including needs for public clouds and community clouds Full line of services, including ASP security, and data centersCloud Computing
(Cloud) Google salesforce.com
Consulting Accenture Capgemini
IBM PwC
System consultation capabilities based on system construction capabilities, and strategic IT planning know-how
System Support Various IT service vendors Operation and maintenance know-how accumulated through the provision of
large-scale systems More than 200 support bases throughout Japan
Sys
tem
Inte
gra
tion
From the fiscal year ended March 31, 2013, NTT DATA transitioned to a system of four segments through the addition of a new segment —Global Business—to the three existing segments: Public & Financial IT Services, Enterprise IT Services, and Solutions & Technologies.
NIP
PO
N T
ELE
GR
AP
H A
ND
TE
LEP
HO
NE
CO
RP
OR
AT
ION
A
NN
uA
L R
EP
OR
T 2
01
3
NIP
PO
N T
ELE
GR
AP
H A
ND
TE
LEP
HO
NE
CO
RP
OR
AT
ION
A
NN
uA
L R
EP
OR
T 2
01
3
Public & Financial IT ServicesProvision of high-value-added IT services that support social infrastructure, including public administration, healthcare, finance, and settlement
Enterprise IT ServicesProvision of high-value-added global IT services that support manufacturing, distribution, services, media, communications, and other business activities
Global BusinessProvision of high-value-added IT services in overseas markets
Solutions & TechnologiesProvision of platforms and solutions that support cutting-edge IT services
¥728.8 billion
¥244.9 billion
¥167.0 billion
¥301.1 billion
Dat
a C
omm
unic
atio
ns
Bus
ines
s

049048
Streamlining through the Introduction of the Global SSC
Expansion of New Fields and Reinforcement of Product CompetitivenessThe NTT DATA Group worked to expand its business in the provision of solutions for the reduction of IT costs, such as cloud computing and Application Management Outsourcing (AMO). In addition, the NTT DATA Group worked to advance and diversify its services for customers requiring the applica-tion of IT to operations that are more sophisticated and com-plex. These include Big Data utilization, business analytics, and Business Process Outsourcing (BPO) of core opera-tions. In addition, the NTT DATA Group is aggressively investing to expand new fields of business and strengthen its products, including the improvement of software production technologies, such as the automation of software develop-ment, and R&D into advanced technologies in cooperation with research institutions that are in the top class worldwide.
Public & Financial IT ServicesAs one facet of Japan’s export of infrastructure solutions, NTT DATA contracted with the Vietnamese government to develop systems for which NTT DATA will draw on its exten-sive knowledge of Japan’s trade procedures and customs clearance systems. NTT DATA will also procure hardware for these systems.
Enterprise IT ServicesNTT DATA established a capital tie-up with Kirin Business System Company, Limited, a subsidiary of Kirin Holdings Company, Limited. Consequently, as a reform partner we have contributed to strengthening the business competitive-ness of the Kirin Group using IT and to helping the Kirin Group to enhance its competitive advantage in the food and beverage industry.
Business Development
Management Policies Status of Business Activity
Data Communications Business
Questions frequently asked by shareholders and investors
Solutions & TechnologiesProgress was made with a service to support customer information analysis utilizing Big Data. For example, we began to provide BIZXAAS BA, a total service that extends from support for the installation of Big Data analysis plat-forms to consulting on analysis and utilization.
Global BusinessWe took steps to integrate and restructure overseas the NTT DATA Group companies and to unify the NTT DATA brand. We are aiming to provide local customers with meticulous services and global customers with timely services, as well as to enhance the presence of the NTT DATA brand overseas.
Pursuit of Overall OptimizationTo standardize, streamline, and consolidate operations on a global level, the NTT DATA Group is taking steps to increase management efficiency through the restructuring and consoli-dation of the NTT DATA Group companies and organizations. Specifically, in the domestic market we have consolidated finance, human resources, procurement, and other opera-tions, and made a full-scale launch of a Group Shared Service Center (SSC) that will facilitate the leveraging of offshore bases. Plans call for this Group SSC to be introduced by 71 companies, and 33 companies have already introduced it in the fiscal year ended March 31, 2013. In addition, the roll out of the global SSC for overseas subsidiaries has commenced in Europe and North America, and steady progress is being made with consolidation into the integrated system and the use of bases in India for BPO in such areas as finance and human resources. Through these initiatives, we expect to achieve substantial cost reductions in the future, and currently progress is being made with the introduction of the Global SSC at other NTT DATA Group companies.
Launch of Value-Added Service Based on Twitter Data
At the end of December 2012, we launched a service for the provision of high-precision, high-value-added data based on the acquisition and accumulation of all tweet data in Japanese and all tweet data posted in Japan. The data is acquired from Twitter, of the united States. By adding original information to the tweet data, the service facilitates not only analysis of tweet data topics but also more complex analysis. Through this service, we provide the day’s key topics for NHK’s NEWS WEB TV program through high-speed processing and analysis of all Japanese-language tweet data for that day. Moving forward, we plan to offer consulting related to the use of tweet data and to implement individual development in line with the ways in which individual companies use the data. A high level of interest has been shown by various industries, including advertising, logistics, and finance, and the use of these services is growing.
User companies
Service provision partners
AnalyticsIndividual
development / services
Engagement
Data reseller
Tweet data
Increase in the Number of Companies Introducing the Group SSC
A number of overseas companies have been made subsidiaries. How are these companies being managed?
under the NTT DATA brand, overseas subsidiaries have been integrated and restructured
based on four regions and solutions. Through the Global One Team initiative, we are shar-
ing know-how in areas where we have special skills, such as SAP-related SI and telecom-
munications services. In July 2012, we gathered about 300 global business leaders from
17 countries for discussions. In this way, we are engaging in activities as Global One NTT
DATA, including companies that have been acquired and their human resources.
What initiatives is the Company implementing in the automation of software development?
The previous model of software development was labor intensive, with processes extend-
ing from specification and design to programming and testing. However, progress is being
made with efforts to automate these processes using computers. With many projects,
we have already achieved results with the use of this development automation, such as
improved quality, reduced time to completion, and lower development costs. We have
already commenced trial of the actual application in customer projects, not only in Japan
but also in North America. Moving forward, we will take steps to utilize this automation as
a tool for business expansion in the global market.
Japan united States EMEA APAC China
NTT DATANTT DATA, Inc.
NTT DATA EMEA Ltd.
NTT DATA Asia Pacific Pte. Ltd.
NTT DATA (China) Co., Ltd.
“NTT DATA Business Solutions” Providing SAP-related and other solutions globally
NIP
PO
N T
ELE
GR
AP
H A
ND
TE
LEP
HO
NE
CO
RP
OR
AT
ION
A
NN
uA
L R
EP
OR
T 2
01
3
NIP
PO
N T
ELE
GR
AP
H A
ND
TE
LEP
HO
NE
CO
RP
OR
AT
ION
A
NN
uA
L R
EP
OR
T 2
01
3
D e p t hin
0
20
60
40
80
64
50
33
2015/3(Plan)
2013/3 2014/3(Plan)
Fiscal year ended / ending March 31
Use of the integrated system and BPO operations in the U.K. started in April 2013.
Plans call for the roll out to European countries, such as Italy and Germany, and to North America during the fiscal year ending March 31, 2014.
Consolidation of operations
Consolidation of systems
Number of companies planning to introduce the Global SSC: 71
Dat
a C
omm
unic
atio
ns
Bus
ines
s

051050
Others
etc.
Real Estate Business
NTT urban Development, which is the Group’s only comprehensive real estate company, conducts real estate leasing operations, centered on office buildings and commercial facilities, and condominium operations, principally through the WELLITH brand. Leveraging the know-how acquired through these operations, NTT urban Development is expand-ing into new fields of business, such as the overseas, real estate fund, and real estate solutions businesses.
Finance Business
NTT FINANCE, which is the core finance company of the NTT Group, contributes to the reinforcement of financial and operating foundations for the NTT Group through lease finance and Group finance operations. NTT FINANCE is developing leading-edge financial services in Japan and overseas, from leasing and installment sales to asset finance and project finance. From July 2012, NTT FINANCE began billing and receipt operations for service and other charges for NTT East, NTT West, NTT Communications, and NTT DOCOMO. In this way, NTT FINANCE took a step forward as a Financial Solution Partner providing billing and other settlement services.
Construction and Electric Power Business
NTT FACILITIES provides one-stop services for buildings and structures, ranging from planning, design, and construction to maintenance, opera-tion, and upkeep. In energy operations, NTT FACILITIES helps to build optimal energy environments from a comprehensive perspective, extend-ing from consulting to monitoring, maintenance, and improvement propos-als. In construction, NTT FACILITIES combines the technical capabilities acquired as a first-class registered architect office with IT and energy technologies to contribute to increases in the asset values of buildings and structures and to stronger management foundations for customers.
System Development Business
NTT COMWARE, which has core competencies in network technologies, systems and applications, and support and maintenance, is taking steps to build full IP networks which will be the foundation of broadband and ubiquitous services and to develop operation systems and application services for use in traffic control to ensure communications quality in NGNs. Through these initiatives, NTT COMWARE, is promoting the expansion and the spread of NGNs together with NTT Laboratories and other Group companies.
Advanced Technology Development Business
NTT Group companies in this business segment offer design, develop-ment, maintenance, and operation as well as the provision of services backed by the advanced technologies of NTT Laboratories. These ser-vices include technology consulting backed by combinations of the latest technologies, such as network technologies, media interface processing technologies, and other advanced technologies from Japan and overseas; development, production, and sales of custom LSIs for communications use and optical devices that are indispensable in the realization of high-capacity communications networks; and total solutions related to software design / development and information / communications networks.
Other Businesses
Financial Results for the Fiscal Year Ended March 31, 2013
Business Development
Operating revenues in the fiscal year ended March 31, 2013, were ¥1,257.6 billion, an increase of 15.5% from the previ-ous fiscal year. This gain was due in part to an increase in the number of condominium units delivered in the real estate business and to higher revenues in the finance business. On the other hand, operating expenses were ¥1,204.0 billion, an
Advancing and Expanding Overseas OperationsNTT urban Development Corporation is advancing overseas operations as a new growth driver. In September 2012, we acquired 20 Finsbury Circus, in London, and in April 2013 we acquired 265 Strand, also in London. In the future, we will work to expand our stable earnings foundation by acquiring and managing investment properties in Europe and the united States, as well as by achieving increases in value through renovation and other measures. Moreover, through cooperation with local NTT Group companies in Southeast
Building Solar Power Generation Systems / Advancing the Environment Creation BusinessNTT FACILITIES provides large-scale solar power system solutions that combine energy operations and construction operations. We have an installation track record that is among the most extensive in Japan. As of the end of March 2013, NTT FACILITIES had installed solar power generation systems in about 940 locations with a total generating capacity of more than 75 megawatts. NTT FACILITIES also offers a condominium electricity provision service. We have received high evaluations for our support for the electricity / energy conservation efforts of residents of condominium buildings in which this service has been installed. Given this performance, NTT FACILITIES received the Minister’s Award from the Ministry of Economy, Trade and Industry at the Energy Conservation Grand Prize event and at the 22nd
Grand Prize for the Global Environment Award event in February 2013. In the future, NTT FACILITIES will advance the environment creation business in accordance with the keywords “smart and safe towns,” so that a sustainable society can be handed down to the next generation.
0
1,000
500
1,500
2012/3 2013/3
1,257.61,089.0
+15.5%
Fiscal year ended March 31
0
40
20
60
2012/3 2013/3
53.656.9
–5.8%
Fiscal year ended March 31
0
100
50
200
150
2012/3 2013/3
160.8
121.7
+32.5%
Fiscal year ended March 31
increase of 16.6% from the previous fiscal year, due in part to an increase in expenses associated with the higher rev-enues and to a rise in expenses in the advanced technology development business. Consequently, operating income was ¥53.6 billion, a decline of 5.8% from the previous fiscal year.
Asia and other growth markets, we will work to find business partners and to generate business opportunities through cooperative alliances with them. We will continue to imple-ment investment targeting the generation of stable profits, and we will strive to achieve steady growth in overseas operations.
Operating Revenues(Billions of yen)
Operating Income(Billions of yen)
Capital Investment(Billions of yen)
NTT Urban Development Corporation
NTT FACILITIES, INC.
NIP
PO
N T
ELE
GR
AP
H A
ND
TE
LEP
HO
NE
CO
RP
OR
AT
ION
A
NN
uA
L R
EP
OR
T 2
01
3
NIP
PO
N T
ELE
GR
AP
H A
ND
TE
LEP
HO
NE
CO
RP
OR
AT
ION
A
NN
uA
L R
EP
OR
T 2
01
3O
ther
Bus
ines
ses
20 Finsbury Circus
F Sakura Solar Power Generation Facility

053052
CSR and Corporate GovernanceN
IPP
ON
TE
LEG
RA
PH
AN
D T
ELE
PH
ON
E C
OR
PO
RA
TIO
N
AN
Nu
AL
RE
PO
RT
20
13
NIP
PO
N T
ELE
GR
AP
H A
ND
TE
LEP
HO
NE
CO
RP
OR
AT
ION
A
NN
uA
L R
EP
OR
T 2
01
3C
SR
and
C
orpo
rate
Gov
erna
nce
CSR and Corporate Governance: Contents
CSR 054
Corporate Governance 056
Directors and Corporate Auditors 060
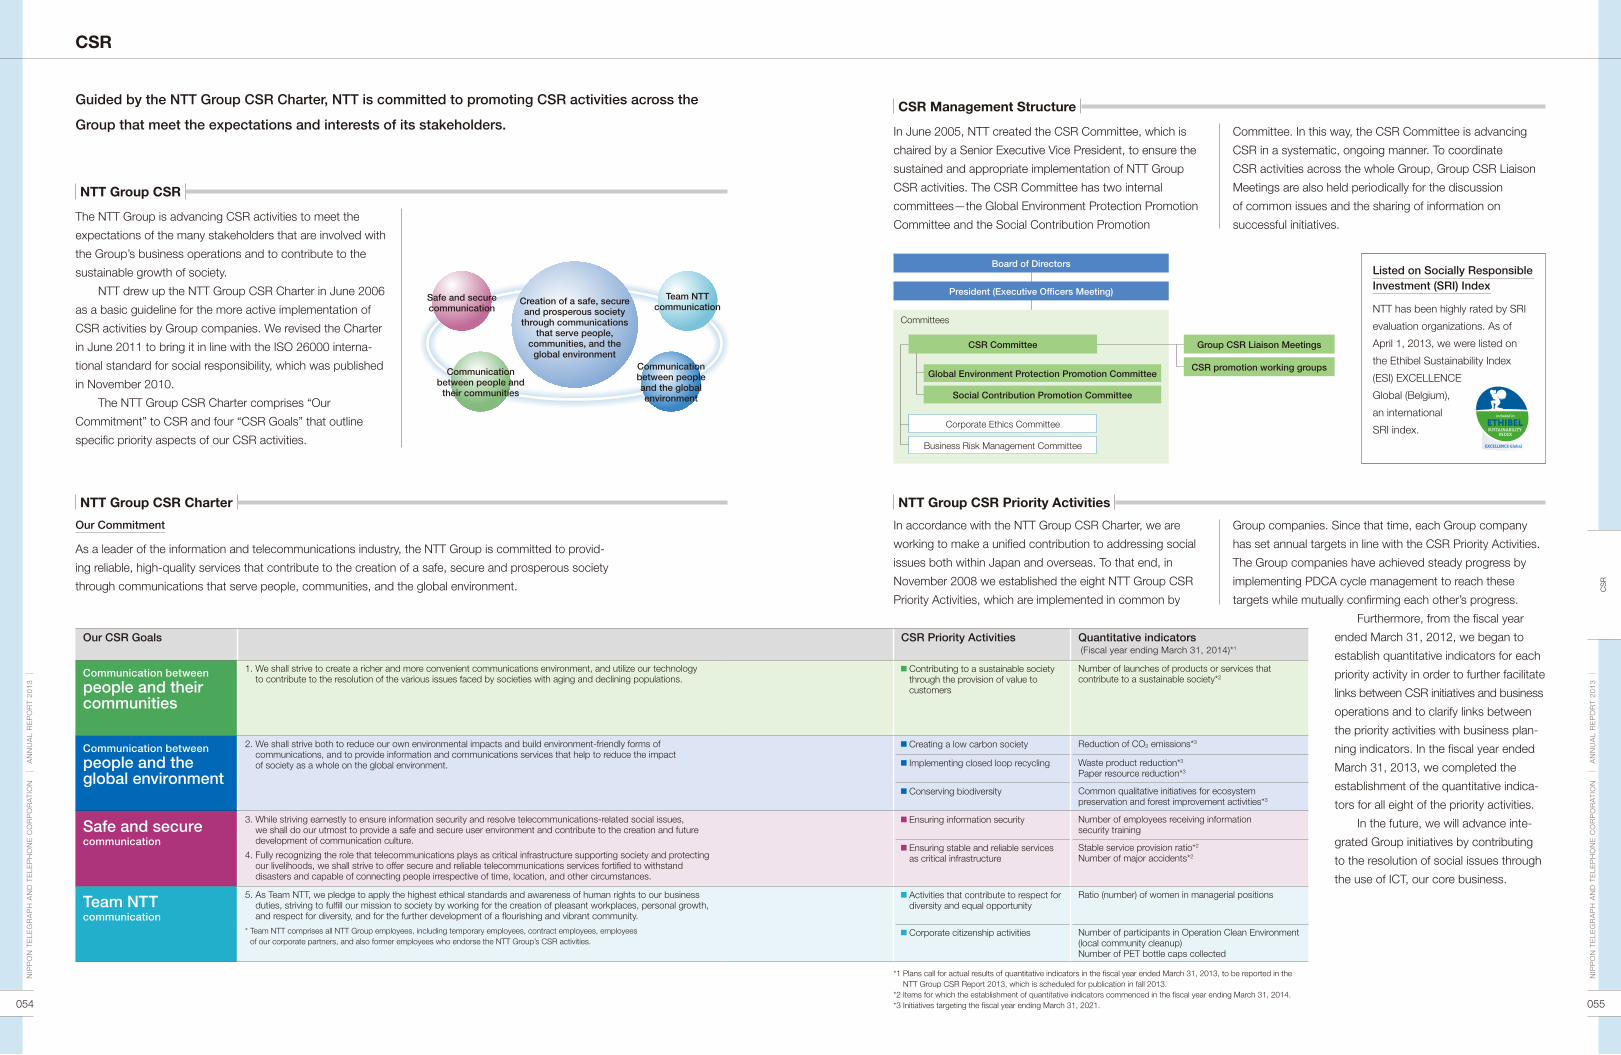
055054
Listed on Socially Responsible Investment (SRI) Index
NTT has been highly rated by SRI
evaluation organizations. As of
April 1, 2013, we were listed on
the Ethibel Sustainability Index
(ESI) EXCELLENCE
Global (Belgium),
an international
SRI index.
CSR
NTT Group CSR
NTT Group CSR Charter NTT Group CSR Priority Activities
CSR Management Structure
The NTT Group is advancing CSR activities to meet the
expectations of the many stakeholders that are involved with
the Group’s business operations and to contribute to the
sustainable growth of society.
NTT drew up the NTT Group CSR Charter in June 2006
as a basic guideline for the more active implementation of
CSR activities by Group companies. We revised the Charter
in June 2011 to bring it in line with the ISO 26000 interna-
tional standard for social responsibility, which was published
in November 2010.
The NTT Group CSR Charter comprises “Our
Commitment” to CSR and four “CSR Goals” that outline
specific priority aspects of our CSR activities.
In June 2005, NTT created the CSR Committee, which is
chaired by a Senior Executive Vice President, to ensure the
sustained and appropriate implementation of NTT Group
CSR activities. The CSR Committee has two internal
committees—the Global Environment Protection Promotion
Committee and the Social Contribution Promotion
Committee. In this way, the CSR Committee is advancing
CSR in a systematic, ongoing manner. To coordinate
CSR activities across the whole Group, Group CSR Liaison
Meetings are also held periodically for the discussion
of common issues and the sharing of information on
successful initiatives.
Our Commitment
As a leader of the information and telecommunications industry, the NTT Group is committed to provid-
ing reliable, high-quality services that contribute to the creation of a safe, secure and prosperous society
through communications that serve people, communities, and the global environment.
In accordance with the NTT Group CSR Charter, we are
working to make a unified contribution to addressing social
issues both within Japan and overseas. To that end, in
November 2008 we established the eight NTT Group CSR
Priority Activities, which are implemented in common by
Group companies. Since that time, each Group company
has set annual targets in line with the CSR Priority Activities.
The Group companies have achieved steady progress by
implementing PDCA cycle management to reach these
targets while mutually confirming each other’s progress.
Furthermore, from the fiscal year
ended March 31, 2012, we began to
establish quantitative indicators for each
priority activity in order to further facilitate
links between CSR initiatives and business
operations and to clarify links between
the priority activities with business plan-
ning indicators. In the fiscal year ended
March 31, 2013, we completed the
establishment of the quantitative indica-
tors for all eight of the priority activities.
In the future, we will advance inte-
grated Group initiatives by contributing
to the resolution of social issues through
the use of ICT, our core business.
Our CSR Goals CSR Priority Activities Quantitative indicators (Fiscal year ending March 31, 2014)*1
Communication between
people and their communities
1. We shall strive to create a richer and more convenient communications environment, and utilize our technology to contribute to the resolution of the various issues faced by societies with aging and declining populations.
Contributing to a sustainable society through the provision of value to customers
Number of launches of products or services that contribute to a sustainable society*2
Communication between
people and the global environment
2. We shall strive both to reduce our own environmental impacts and build environment-friendly forms of communications, and to provide information and communications services that help to reduce the impact of society as a whole on the global environment.
Creating a low carbon society Reduction of CO2 emissions*3
Implementing closed loop recycling Waste product reduction*3
Paper resource reduction*3
Conserving biodiversity Common qualitative initiatives for ecosystem preservation and forest improvement activities*3
Safe and securecommunication
3. While striving earnestly to ensure information security and resolve telecommunications-related social issues, we shall do our utmost to provide a safe and secure user environment and contribute to the creation and future development of communication culture.
4. Fully recognizing the role that telecommunications plays as critical infrastructure supporting society and protecting our livelihoods, we shall strive to offer secure and reliable telecommunications services fortified to withstand disasters and capable of connecting people irrespective of time, location, and other circumstances.
Ensuring information security Number of employees receiving information security training
Ensuring stable and reliable services as critical infrastructure
Stable service provision ratio*2
Number of major accidents*2
Team NTTcommunication
5. As Team NTT, we pledge to apply the highest ethical standards and awareness of human rights to our business duties, striving to fulfill our mission to society by working for the creation of pleasant workplaces, personal growth, and respect for diversity, and for the further development of a flourishing and vibrant community.
* Team NTT comprises all NTT Group employees, including temporary employees, contract employees, employees of our corporate partners, and also former employees who endorse the NTT Group’s CSR activities.
Activities that contribute to respect for diversity and equal opportunity
Ratio (number) of women in managerial positions
Corporate citizenship activities Number of participants in Operation Clean Environment (local community cleanup)Number of PET bottle caps collected
*1 Plans call for actual results of quantitative indicators in the fiscal year ended March 31, 2013, to be reported in the NTT Group CSR Report 2013, which is scheduled for publication in fall 2013.
*2 Items for which the establishment of quantitative indicators commenced in the fiscal year ending March 31, 2014.*3 Initiatives targeting the fiscal year ending March 31, 2021.
NIP
PO
N T
ELE
GR
AP
H A
ND
TE
LEP
HO
NE
CO
RP
OR
AT
ION
A
NN
uA
L R
EP
OR
T 2
01
3
NIP
PO
N T
ELE
GR
AP
H A
ND
TE
LEP
HO
NE
CO
RP
OR
AT
ION
A
NN
uA
L R
EP
OR
T 2
01
3C
SR
Guided by the NTT Group CSR Charter, NTT is committed to promoting CSR activities across the
Group that meet the expectations and interests of its stakeholders.
Creation of a safe, secure and prosperous society
through communications that serve people,
communities, and the global environment
Board of Directors
President (Executive Officers Meeting)
Committees
Global Environment Protection Promotion Committee
Social Contribution Promotion Committee
Corporate Ethics Committee
Business Risk Management Committee
Group CSR Liaison Meetings
CSR promotion working groups
CSR Committee
Team NTT communication
Communication between people and the global environment
Communication between people and
their communities
Safe and secure communication

057056
Corporate Governance
Name Reason for Selection
Outside Directors
Katsuhiko ShiraiMr. Katsuhiko Shirai has a wealth of experience as operational director of an educational institution and a high level of integrity and insight. The Company believes that he will help strengthen its supervisory function in business execution and expects to incorporate the advice he provides from his wide-ranging experience and his managerial perspective.
Sadayuki SakakibaraMr. Sadayuki Sakakibara has a wealth of experience as a corporate manager, and a high level of integrity and insight. The Company believes that he will help strengthen its supervisory function in business execution and expects to incorporate the advice he provides from his wide-ranging experience and his managerial perspective.
Outside Corporate Auditors
Toru MotobayashiMr. Toru Motobayashi has worked for many years in law-related occupations, and the Company expects that he will conduct future audits based on the knowledge and insight that he has gained through his career.
Michiko TomonagaMs. Michiko Tomonaga has worked for many years as a Certified Public Accountant, and the Company expects that she will conduct future audits based on the knowledge and insight that she has gained through her career.
Seiichi OchiaiMr. Seiichi Ochiai has been serving for many years as a university professor specializing in the study of law, and the Company expects that he will conduct future audits based on the knowledge and insight that he has gained through his career.
Form Company with board of corporate auditors
Number of directors 12
Of which, number of outside directors 2
Of which, independent directors 2
Term of office for directors 2 years
Number of corporate auditors 5
Of which, number of outside corporate auditors 3
Functions of the Board of Directors The Board of Directors makes decisions on matters stipulated by law and, as the holding company that supervises and coordinates the NTT Group, on important matters related to company management and Group management. In addition, the Board of Directors supervises the business execution of directors.
Decisions on important matters The important corporate matters to be decided are, in principle and in advance, discussed by the Executive Officers Meeting, which includes the President, Senior Executive Vice Presidents, Executive Vice Presidents, and relevant directors.
Frequency of meetings of the Executive Officers Meeting
In principle, meetings of the Executive Officers Meeting are held about once a week.
Framework for increasing transparency of decision-making
One corporate auditor also participates in the Executive Officers Meeting.
Discussions regarding the management strategies of NTT Group companies
Committees have been created under the Executive Officers Meeting to discuss specific issues related to the management strategies of NTT Group companies. These committees, which are held as necessary throughout the year, are in principle chaired by the President or a Senior Executive Vice President, and are attended by relevant directors.
Audit firm KPMG AZSA LLC
Names of Certified Public Accountants conducting auditing in the fiscal year ended March 31, 2013
Toshiharu Kawai, Hiroto Kaneko, and Atsuji Maeno
Status and details of non-audit services The Company asks KPMG AZSA LLC to perform non-audit services. (Provision of guidance and advice in relation to International Financial Reporting Standards (IFRS))
As the holding company of the NTT Group, NTT believes that raising the effectiveness of corporate governance is an impor-tant management issue for meeting the expectations of vari-ous stakeholders, including shareholders and other investors, as well as customers, business partners, and employees, and
NTT maintains a Board of Directors with 12 members, including two outside directors. In principle, the Board of Directors meets once per month to make decisions and report on important management issues. In addition, extraor-dinary meetings are held as needed. The Board of Directors makes decisions on matters stipulated by law and, as the
The important corporate matters to be decided are, in prin-
ciple and in advance, discussed by NTT’s Executive Officers
Meeting. In principle, meetings of the Executive Officers
Meeting are held about once a week. To improve the trans-
parency of management decision-making, one corporate
auditor participates in the Executive Officers Meeting. In
NTT uses the Board of Corporate Auditors system of corpo-rate governance. The Company believes that an auditing sys-tem based on the establishment of a Board of Corporate Auditors and the conduct of audits by the members of that board, including outside members, is an effective means of supervising management. Accordingly, NTT chose the Board of Corporate Auditors system. The Board of Corporate Auditors, has a total of five members (two internal members and three outside members, one of whom is a woman). The corporate auditors attend important meetings, such as
NTT has elected two outside directors to strengthen the func-tion of supervising the fairness of business execution. Each of the outside directors has a wealth of experience, either as operational director of an educational institution or as a corpo-rate manager, and a high level of integrity and insight. NTT believes that the outside directors will help strengthen the
Basic Philosophy Ensuring Sound Management / Conducting Appropriate Decision-Making and Business Activities
Board of Directors
Overview of Corporate Governance Structure
Executive Officers Meeting and Committees
Board of Corporate Auditors
Outside Directors and Outside Corporate Auditors
holding company that supervises and coordinates the NTT Group, on important matters related to company manage-ment and Group management. Moreover, through such means as periodic reports from directors on the status of business execution, the Board of Directors supervises the business execution of directors.
addition, committees have been created under the Executive
Officers Meeting to discuss specific issues related to the man-
agement strategies of NTT Group companies. These commit-
tees, which are held as necessary throughout the year, are in
principle chaired by the President or a Senior Executive Vice
President, and are attended by relevant directors.
meetings of the Board of Directors, and conduct appropriate audits regarding the status of business execution by the direc-tors. They work closely with the Independent Auditor, such as periodically exchanging information on audit plans and audit results, to bolster the audit system. Furthermore, the Board of Corporate Auditors’ members exchange information with the Internal Control Office, such as receiving reports on the results of internal audits. The Board of Corporate Auditors also con-ducts audits in partnership with the Board of Corporate Auditors’ members of NTT Group companies.
Company’s supervisory function in business execution and expects to incorporate the advice they provide from their wide-ranging managerial perspective. In addition, the Company expects that the three outside corporate auditors will conduct future audits based on the specialized experience and insight that they have gained through their careers.
for maximizing corporate value. Accordingly, NTT is working to strengthen corporate governance based on its fundamen-tal policies of ensuring sound management, conducting appropriate decision-making and business activities, clarifying accountability, and maintaining thorough compliance.
NIP
PO
N T
ELE
GR
AP
H A
ND
TE
LEP
HO
NE
CO
RP
OR
AT
ION
A
NN
uA
L R
EP
OR
T 2
01
3
NIP
PO
N T
ELE
GR
AP
H A
ND
TE
LEP
HO
NE
CO
RP
OR
AT
ION
A
NN
uA
L R
EP
OR
T 2
01
3C
orpo
rate
Gov
erna
nce
Corporate Governance Structure (Including an Outline of the Internal Control System)
取取取取
Audit Board of Corporate Auditors
Accounting Audit Independent AuditorCommittees
Election / removal
NTT (Holding
company)
Election / removal and supervision
Instruction, reportingCooperation
Instruction, reporting, etc.
Election / removal Election / removal
Group companies
General Meeting of Shareholders
Board of Directors
President (Executive Officers Meeting)
Business sections
Appointment and Compensation Committee
Internal Control OfficeInternal Audit
•CSRCommittee•CorporateEthicsCommittee•TechnologyStrategyCommittee•InvestmentStrategyCommittee•FinanceStrategyCommittee•BusinessRiskManagementCommittee•U.S.Sarbanes-OxleyActInternal
Control Committee, etc.

059058
NTT strives to maintain appropriate, timely, and fair informa-tion disclosure and is aware that obtaining proper corporate valuations in the market through such disclosure is essential. Accordingly, NTT conducts presentations on financial results and promptly discloses information on the NTT website to clarify the NTT Group’s accountability to stakeholders. NTT’s IR activities are outlined below:
Regular Presentations Held for Analysts and Institutional InvestorsNTT conducts financial results presentations every quarter. At the presentations, the President or a Senior Executive Vice President explains business results and other matters. In addition to the live streaming of presentations over the Internet, NTT conducts various activities, including individual meetings with analysts and insti-tutional investors worldwide.
Regular Presentations Held for Overseas InvestorsNTT explains its business results and other matters by con-ducting overseas road shows several times a year, wherein the President or a Senior Executive Vice President participates.
Presentations Held for Individual InvestorsIn the fiscal year ended March 31, 2013, NTT held presenta-tions for individual investors in nine locations, including Tokyo, Osaka, and Nagoya. In the fiscal year ending March 31, 2014, NTT plans to further increase the number and scope of these presentations.
IR Materials Posted on WebsiteNTT posts various IR-related materials on its website. Examples of these materials include annual financial results and other financial information, press releases, Yuho (mar-ketable securities reports), quarterly reports, notices of con-vocation for Ordinary General Meetings of Shareholders, financial data, presentation materials (including video stream-ing), stock information, and Q&As.
Presentation for analysts and institutional investors
NTT Group IR website
In regard to matters concerning the compensation of direc-tors, in order to improve objectivity and transparency, NTT established the Appointment and Compensation Committee, comprised of four directors, including two outside directors, and such matters are decided by the Board of Directors after deliberation by this committee. Compensation of directors (excluding outside directors) consists of a base salary and a bonus. The base salary is paid monthly on the basis of the scope of each director’s roles and responsibilities. The bonus is paid taking into account NTT’s business results for the current term. Also, directors make monthly contributions of at least a certain amount for the purchase of NTT shares through the Director Shareholders Association, to reflect NTT’s medium-and long-term business results in compensa-tion. Purchased shares are owned by the directors during their terms of office. In order to maintain a high level of independence, com-pensation of outside directors consists of a base salary only, and is not linked to NTT’s business results.
The NTT Group faces a rapidly changing business environ-ment, including intensified competition in the information and telecommunications sector. In this context, NTT Group com-panies are exposed to an increasing amount of business risk. The NTT Group strives to minimize the impact of losses that could result from the materialization of risk by anticipat-ing and preventing the occurrence of potential risks. As part
NTT has established a basic policy on the maintenance of an internal control system for the NTT Group through a resolu-tion of the Board of Directors to put in place a structure for ensuring the appropriate execution of duties within each Group company, while continuing efforts to establish further rules and systems related to internal controls based on the abovementioned basic policy. In terms of ensuring the reliability of internal control over financial reporting based on the u.S. Sarbanes-Oxley Act and Japan’s Financial Instruments and Exchange Law, the NTT
Compensation of corporate auditors is determined by resolution of the Board of Corporate Auditors and consists of a base salary only, for the same reasons as those cited above with respect to outside directors.
Total Compensation of Directors and Corporate Auditors
Position Number of persons
Monthly compensation Bonuses Total
compensation
Directors(Excluding outside directors)
15 ¥414 million ¥90 million ¥504 million
Corporate Auditors(Excluding outside corporate auditors)
3 ¥74 million — ¥74 million
Total 18 ¥489 million ¥90 million ¥579 million
(Notes) 1. Compensation amounts shown above include compensation paid to five direc-tors and one corporate auditor who retired as of the end of the 27th Ordinary General Meeting of Shareholders held on June 22, 2012.
2. upper limits on total compensation of directors and corporate auditors were set at ¥750 million annually for directors and ¥200 million annually for corporate auditors at the 21st Ordinary General Meeting of Shareholders held on June 28, 2006.
3. In addition to the above, ¥15 million is to be paid as executive bonuses to eight directors who also hold executive management positions.
Group is working to document business processes and con-duct repeated tests to provide reasonable assurance as to the effectiveness of internal control over financial reporting. NTT’s Internal Control Office plays a primary role in mon-itoring the status and verifying the effectiveness of internal controls across the Group as a whole through such mea-sures as conducting standardized audits that target all Group companies and checking the status of progress of internal audits in each Group company, as well as leading efforts to improve the Group’s internal control systems.
Policies Concerning the Compensation of Directors and Corporate Auditors
Internal Control Systems
Corporate Governance
Recognizing that it is imperative to conduct business in compliance with laws and regulations, and maintain high ethical standards in order to promote sound corporate activi-ties, NTT drew up the NTT Group Corporate Ethics Charter in November 2002. The Charter, which applies to all officers and employees of the NTT Group, lays out the basic principles of corporate ethics and provides specific guidelines for ethical behavior.
To ensure the effectiveness of the NTT Group Corporate Ethics Charter, NTT Group companies offer training sessions on corporate ethics and CSR to employees, and conduct surveys to monitor employee awareness. By conducting
To prevent dishonesty and misconduct, each company has in place a system for employees to file reports on ethical issues. The NTT Group has also established a Groupwide Corporate Ethics Help Line to enable employees to file reports outside their company if required.
Defining Accountability
Ensuring Compliance
NTT Group Corporate Ethics Charter
Ethics Education and Awareness Surveys
Help Line
The stipulations in the guidelines are intended to remind everyone of their duty as members of an information and tele-communications group which bears significant responsibility to society in terms of preventing dishonesty, misconduct, and the disclosure of corporate secrets, as well as refraining from exchanging excessive favors with customers and suppliers, and ensuring that they conduct themselves according to the highest ethical standards in both private and public activities.
surveys of regular employees, as well as temporary and contract staff, every year, the NTT Group is working to raise awareness of corporate ethics and CSR among its workforce.
In line with Japan’s Whistleblower Protection Act, which came into force in April 2006, and other laws, the NTT Group also accepts reports from companies outside the Group that do business with the NTT Group.
of these efforts, NTT has formulated a standard manual and distributed it to all Group companies so that the entire Group can work together to conduct risk management. In addition, each Group company has formulated its own manuals and other guidelines, which reflect its specific business operations, business environment, and other fac-tors. These materials are used to control business risks.
Establishment and Promotion of Risk Management Framework
Shareholders’ Newsletter “NTTis...”
NIP
PO
N T
ELE
GR
AP
H A
ND
TE
LEP
HO
NE
CO
RP
OR
AT
ION
A
NN
uA
L R
EP
OR
T 2
01
3
NIP
PO
N T
ELE
GR
AP
H A
ND
TE
LEP
HO
NE
CO
RP
OR
AT
ION
A
NN
uA
L R
EP
OR
T 2
01
3C
orpo
rate
Gov
erna
nce
Basic Policy on the Maintenance of an Internal Control System for the NTT Group (Board of Directors’ Resolution)
1. NTT maintains a system of internal controls, including measures for the prevention and minimization of losses, to ensure compliance with applicable laws, appropriate risk management, and proper and efficient business operations.
2. To maintain the internal control system outlined above, NTT has established an Internal Control Office to oversee the establishment and maintenance of rules and structures. This body also evaluates the effectiveness of the internal control system and makes neces-sary system revisions by conducting audit reviews and coordinating audits of high-risk matters common to Group companies.
3. NTT also takes appropriate measures to ensure the reliability of its internal control system based on the u.S. Sarbanes-Oxley Act Sections 302 (disclosure controls) and 404 (internal control relating to financial reporting).
4. As the Chief Executive Officer, the President is responsible for ensuring the establishment, maintenance, and operation of the system of internal controls.

061060
Directors and Corporate AuditorsAs of June 30, 2013
Katsuhiko ShiraiE xecutive Advisor for Academic Affairs of
Waseda university C hairperson of the Foundation for the Open university
of JapanDirector of Japan Display, Inc.
Sadayuki SakakibaraC hairman of the Board, Chief Executive Officer
and Representative Member of the Board of Toray Industries, Inc.
Director of Mitsui O.S.K. Lines, Ltd.Director of Hitachi, Ltd.
Outside Directors
Director and Chairman of Board of Directors
Satoshi Miura
Representative Director and President, Chief Executive Officer
Hiroo Unoura
Representative Directors and Senior Executive Vice Presidents
Yasuyoshi KatayamaIn charge of technical strategy; in charge of risk management; Chief Technology Officer; and Chief Information Officer
Hiroki WatanabeIn charge of business strategy; Chief Financial Officer; and Chief Compliance Officer
Director and Executive Vice President
Hiromichi ShinoharaDirector of Research and Development Planning Department; and in charge of international standardization
Directors and Senior Vice Presidents
Yoshikiyo SakaiDirector of Finance and Accounting Department
Mitsuyoshi KobayashiDirector of Technology Planning Department; and Director of Strategic Business Development Division
Akira ShimadaDirector of General Affairs Department; and Director of Internal Control Office, General Affairs Department
Hiroshi TsujigamiDirector of Corporate Strategy Planning Department
Tsunehisa OkunoDirector of Global Business Office
Outside Directors
Katsuhiko Shirai
Sadayuki Sakakibara
Satoshi MiuraDirector and
Chairman of Board of Directors
Hiroo UnouraRepresentative Director and
President, Chief Executive Officer
Yasuyoshi KatayamaRepresentative Director and
Senior Executive Vice President
Hiroki WatanabeRepresentative Director and
Senior Executive Vice President
Hiromichi ShinoharaDirector and
Executive Vice President
Yoshikiyo SakaiDirector and
Senior Vice President
Mitsuyoshi KobayashiDirector and
Senior Vice President
Hiroshi TsujigamiDirector and
Senior Vice President
Tsunehisa OkunoDirector and
Senior Vice President
Back row
Front row
Akira ShimadaDirector and
Senior Vice President
Directors
NIP
PO
N T
ELE
GR
AP
H A
ND
TE
LEP
HO
NE
CO
RP
OR
AT
ION
A
NN
uA
L R
EP
OR
T 2
01
3
NIP
PO
N T
ELE
GR
AP
H A
ND
TE
LEP
HO
NE
CO
RP
OR
AT
ION
A
NN
uA
L R
EP
OR
T 2
01
3D
irect
ors
and
C
orpo
rate
Aud
itors

063062
Background of Outside Corporate Auditors (As of June 30, 2013)
Message from the Board of Corporate Auditors
Michiko Tomonaga Corporate Auditor
Toru MotobayashiCorporate Auditor
Yoshitaka Makitani Corporate Auditor
Seiichi OchiaiCorporate Auditor
Toru MotobayashiLawyerOutside Director of Hitachi, Ltd.O utside Corporate Auditor of
Sumitomo Life Insurance Company
Michiko TomonagaCertified Public AccountantOutside Corporate Auditor of Keikyu CorporationO utside Corporate Auditor of the Corporation for
Revitalizing Earthquake-Affected Business
Seiichi OchiaiProfessor of Chuo Law SchoolEmeritus Professor of the university of TokyoO utside Director of Meiji Yasuda Life
Insurance CompanyOutside Auditor of ube Industries, Ltd.
Corporate Auditors
Kiyoshi KosakaCorporate Auditor
Directors and Corporate Auditors
NIP
PO
N T
ELE
GR
AP
H A
ND
TE
LEP
HO
NE
CO
RP
OR
AT
ION
A
NN
uA
L R
EP
OR
T 2
01
3
NIP
PO
N T
ELE
GR
AP
H A
ND
TE
LEP
HO
NE
CO
RP
OR
AT
ION
A
NN
uA
L R
EP
OR
T 2
01
3D
irect
ors a
nd C
orpo
rate
Aud
itors
NTT’s Board of Corporate Auditors comprises three outside corporate auditors, who have experience and knowledge in a range of fields—as a lawyer, CPA, and university professor—and two inside corporate audi-tors. In addition, two of the corporate auditors have extensive knowl-edge concerning finance and accounting matters. Each corporate auditor attends meetings of the Board of Directors and other important meetings. In addition, corporate auditors meet periodically with the representative directors to exchange ideas and opinions and hold dis-cussions on various topics with the directors, etc. In this way, the corpo-rate auditors grasp the status of the performance of directors’ duties and provide their opinions as needed. Moreover, separate from meetings of the Board of Corporate Auditors, meetings of the Corporate Auditors Preliminary Deliberation Meetings are held, in principle, each week. These meetings, which are attended by all corporate auditors, provide a venue for the sharing of information. For example, at these meetings the corporate auditors listen to explanations from corporate officers of matters to be discussed at the Executive Officers Meeting. In regard to on-site audits, the corporate auditors receive information from the presidents of major subsidiaries in Japan and overseas regard-ing the status of internal control and initiatives to maintain and enhance corporate governance, and discussions are conducted on those matters. The corporate auditors of NTT work in cooperation with the
corporate auditors of principal subsidiaries. NTT’s corporate auditors receive annual reports regarding audit results from the corporate audi-tors of principal subsidiaries and exchange opinions with them. In addi-tion, the corporate auditors have opportunities to listen to talks given from a specialist viewpoint by outside experts and by in-house execu-tives. In this way, NTT is implementing initiatives that contribute to enhancing the auditing activities of each corporate auditor. In addition, the corporate auditors periodically exchange opinions with the Independent Auditor and the Internal Control Office. The corporate auditors also receive explanations of audit plans and reports on the status of internal control systems and provide opinions and advice as needed. To support the corporate auditors, the Company has established the Auditor’s Office, which has four staff members who work full time in assist-ing the corporate auditors in the performance of their duties. In this way, the Company has established a flexible system for the support of the corporate auditors. Through these types of activities, the corporate auditors support the sound, sustained growth of the Company and its subsidiaries in Japan and overseas, from an independent perspective that differs from that of execu-tives. In addition, the corporate auditors strive to maintain and enhance corporate governance by strengthening the corporate governance system on a Groupwide basis, which has become increasingly important in recent years, and by fostering a thorough awareness of compliance matters.
Fina
ncia
l Sec
tionFinancialSection
NIP
PO
N T
ELE
GR
AP
H A
ND
TE
LEP
HO
NE
CO
RP
OR
AT
ION
A
NN
uA
L R
EP
OR
T 2
01
3
063
Financial Section: Contents
10-Year Financial Summary 064
Operating and Financial Review and Prospects 068
Consolidated Balance Sheets 084
Consolidated Statements of Income and Consolidated Statements of Comprehensive Income 086
Consolidated Statements of Changes in Equity 087
Consolidated Statements of Cash Flows 088
Notes to Consolidated Financial Statements 089
Report of Independent Registered Public Accounting Firm 130
Reference Information 131
Consolidated Subsidiaries 133

10-Y
ear
Fina
ncia
l Sum
mar
y
10-Year Financial SummaryNippon Telegraph and Telephone Corporation and its subsidiariesFiscal years ended March 31
Billions of yen
2004 2005 2006 2007 2008 2009 2010 2011 2012 2013
Profit and loss (For the year)
Operating revenues ¥11,095.5 ¥10,805.9 ¥10,741.1 ¥10,760.6 ¥10,680.9 ¥10,416.3 ¥10,181.4 ¥10,305.0 ¥10,507.4 ¥10,700.7
Operating expenses 9,535.2 9,594.7 9,550.4 9,653.5 9,376.3 9,306.6 9,063.7 9,090.1 9,284.4 9,498.8
Operating income 1,560.3 1,211.2 1,190.7 1,107.0 1,304.6 1,109.8 1,117.7 1,214.9 1,223.0 1,202.0
Other income (expenses) (2) (33.0) 512.1 111.4 25.7 17.7 (4.6) 2.4 (39.1) 16.4 (0.9)
I ncome before income taxes, and equity in earnings (losses) of affiliated companies (2) 1,527.3 1,723.3 1,302.1 1,132.7 1,322.3 1,105.2 1,120.1 1,175.8 1,239.3 1,201.1
Income tax expenses (benefits) (2) 603.2 713.9 540.8 466.6 520.8 370.1 447.0 475.6 587.8 481.2
Equity in earnings (losses) of affiliated companies (2) (18.8) (4.6) (12.1) 10.0 31.0 (1.9) 8.8 1.7 (3.0) (10.1)
Net income (2)(3) 905.4 1,004.8 749.2 676.2 832.5 733.2 681.9 701.9 648.6 709.7
Less—Net income attributable to noncontrolling interests (2)(3) 260.0 290.2 246.1 194.8 197.4 194.5 189.6 192.2 180.9 185.7
Net income attributable to NTT Corporation (2)(3) ¥ 645.4 ¥ 714.5 ¥ 503.1 ¥ 481.4 ¥ 635.2 ¥ 538.7 ¥ 492.3 ¥ 509.6 ¥ 467.7 ¥ 524.1
Cash flows (For the year)
Net cash provided by operating activities ¥ 3,480.6 ¥ 2,829.8 ¥ 3,242.9 ¥ 2,361.3 ¥ 3,090.8 ¥ 2,514.1 ¥ 2,817.8 ¥ 2,830.9 ¥ 2,508.3 ¥ 2,453.7
Net cash used in investing activities (2,136.8) (1,768.4) (2,077.3) (2,151.0) (1,990.6) (2,269.7) (2,308.9) (2,052.2) (1,971.2) (1,776.3)
Net cash provided by (used in) financing activities (1,222.5) (1,112.0) (1,139.9) (831.8) (726.4) (353.3) (651.3) (249.6) (948.1) (745.2)
Balance sheet (At year-end)
Property, plant and equipment (net) ¥10,769.6 ¥10,480.6 ¥10,435.9 ¥10,423.8 ¥10,385.6 ¥10,201.5 ¥10,057.5 ¥ 9,900.6 ¥ 9,806.4 ¥ 9,776.7
Total assets (2) 19,413.5 19,064.0 18,820.2 18,291.1 18,518.8 18,796.4 18,939.1 19,665.6 19,389.7 19,653.7
Current liabilities 3,808.8 3,679.6 3,972.6 3,730.8 3,911.9 3,694.2 3,588.3 3,689.1 3,494.3 3,499.4
Long-term liabilities (2) 7,611.0 6,914.8 6,276.9 5,605.0 5,332.1 5,956.6 5,579.9 5,895.6 5,847.7 5,527.7
Interest-bearing debt 5,921.7 5,525.8 5,296.2 4,770.8 4,677.2 4,899.3 4,491.7 4,553.5 4,274.0 4,036.0
Capital stock (common stock plus additional paid-in capital) 3,660.0 3,737.8 3,781.1 3,782.1 3,779.0 3,779.0 3,776.9 3,772.0 3,770.1 3,765.6
Shareholders’ equity (2)(3) 6,380.5 6,740.3 6,734.4 7,120.8 7,410.8 7,298.1 7,788.2 8,020.7 7,882.6 8,319.0
Noncontrolling interests (3) 1,613.2 1,729.3 1,836.3 1,834.5 1,864.0 1,847.5 1,982.7 2,060.2 2,165.1 2,307.6
Equity (2)(3) ¥ 7,993.7 ¥ 8,469.5 ¥ 8,570.6 ¥ 8,955.3 ¥ 9,274.8 ¥ 9,145.6 ¥ 9,770.9 ¥10,080.9 ¥10,047.7 ¥10,626.6
Other financial data
Capital investment (For the year) (4) ¥ 2,013.6 ¥ 2,057.4 ¥ 2,191.9 ¥ 2,236.9 ¥ 2,128.9 ¥ 2,145.1 ¥ 1,987.1 ¥ 1,870.1 ¥ 1,946.6 ¥ 1,970.0
Research and development expenses (For the year) 354.9 318.1 308.4 272.1 271.1 268.2 278.1 268.2 267.9 269.2
Employees (thousands) (At year-end) 205 201 199 199 193 196 194 219 224 227
Performance indicators
EBITDA margin (4) 35.5% 32.8% 32.1% 31.0% 33.8% 32.4% 31.8% 31.9% 30.6% 30.0%
Operating free cash flow (4) 1,920.2 1,482.2 1,250.7 1,103.7 1,478.1 1,224.8 1,253.7 1,412.1 1,272.5 1,237.5
ROCE (4) 7.3% 5.8% 5.8% 5.5% 6.4% 5.4% 5.4% 5.8% 5.8% 6.1%
Per share of common stock (yen) (1)
Weighted average number of shares outstanding 1,585,568,415 1,547,536,620 1,431,504,928 1,382,076,916 1,377,561,362 1,345,302,411 1,323,262,483 1,323,173,389 1,275,519,400 1,211,880,769
Net income attributable to NTT (2)(3) ¥ 407.05 ¥ 461.73 ¥ 351.46 ¥ 348.29 ¥ 461.07 ¥ 400.41 ¥ 372.01 ¥ 385.16 ¥ 366.67 ¥ 432.44
Cash dividends, applicable to earnings for the year ¥ 50.00 ¥ 60.00 ¥ 60.00 ¥ 80.00 ¥ 90.00 ¥ 110.00 ¥ 120.00 ¥ 120.00 ¥ 140.00 ¥ 160.00
(1) Financial data per share of common stock for the fiscal year ended March 31, 2008 and previous years have been adjusted to reflect the 100-for-1 stock split (see Note 13 to the Consolidated Financial Statements) conducted in the fiscal year ended March 31, 2009.
(2) NTT has retroactively applied the equity method of accounting to prior years for an affiliate investment as a result of the acquisition by the NTT Group of additional shares of the affiliate during the fiscal year ended March 31, 2008. The amounts in the table above for the fiscal years ended March 31, 2004 to March 31, 2007 have been adjusted accordingly.
(3) With the application of the accounting pronouncement issued by the Financial Accounting Standards Board (“FASB”) in December 2007, relating to noncontrolling interests in consoli-dated financial statements, starting from the fiscal year ended March 31, 2010, the name of this line item was changed.
(4) Please refer to Reconciliation of Capital Investment, EBITDA Margin, Operating Free Cash Flow, and ROCE on page 131. •Capitalinvestmentisonanaccrualbasisfortheacquisitionofproperty,plantandequipment. •EBITDAmargin=(Operatingincome+Depreciationandlossondisposalofproperty,plantandequipment)/Operatingrevenues×100 •Operatingfreecashflow=(Operatingincome+Depreciationandlossondisposalofproperty,plantandequipment)–Capitalinvestment •ROCE=Operatingincome×(1–Statutorytaxrate)/Operatingcapitalemployed×100
NIP
PO
N T
ELE
GR
AP
H A
ND
TE
LEP
HO
NE
CO
RP
OR
AT
ION
A
NN
uA
L R
EP
OR
T 2
01
3
064
NIP
PO
N T
ELE
GR
AP
H A
ND
TE
LEP
HO
NE
CO
RP
OR
AT
ION
A
NN
uA
L R
EP
OR
T 2
01
3
065
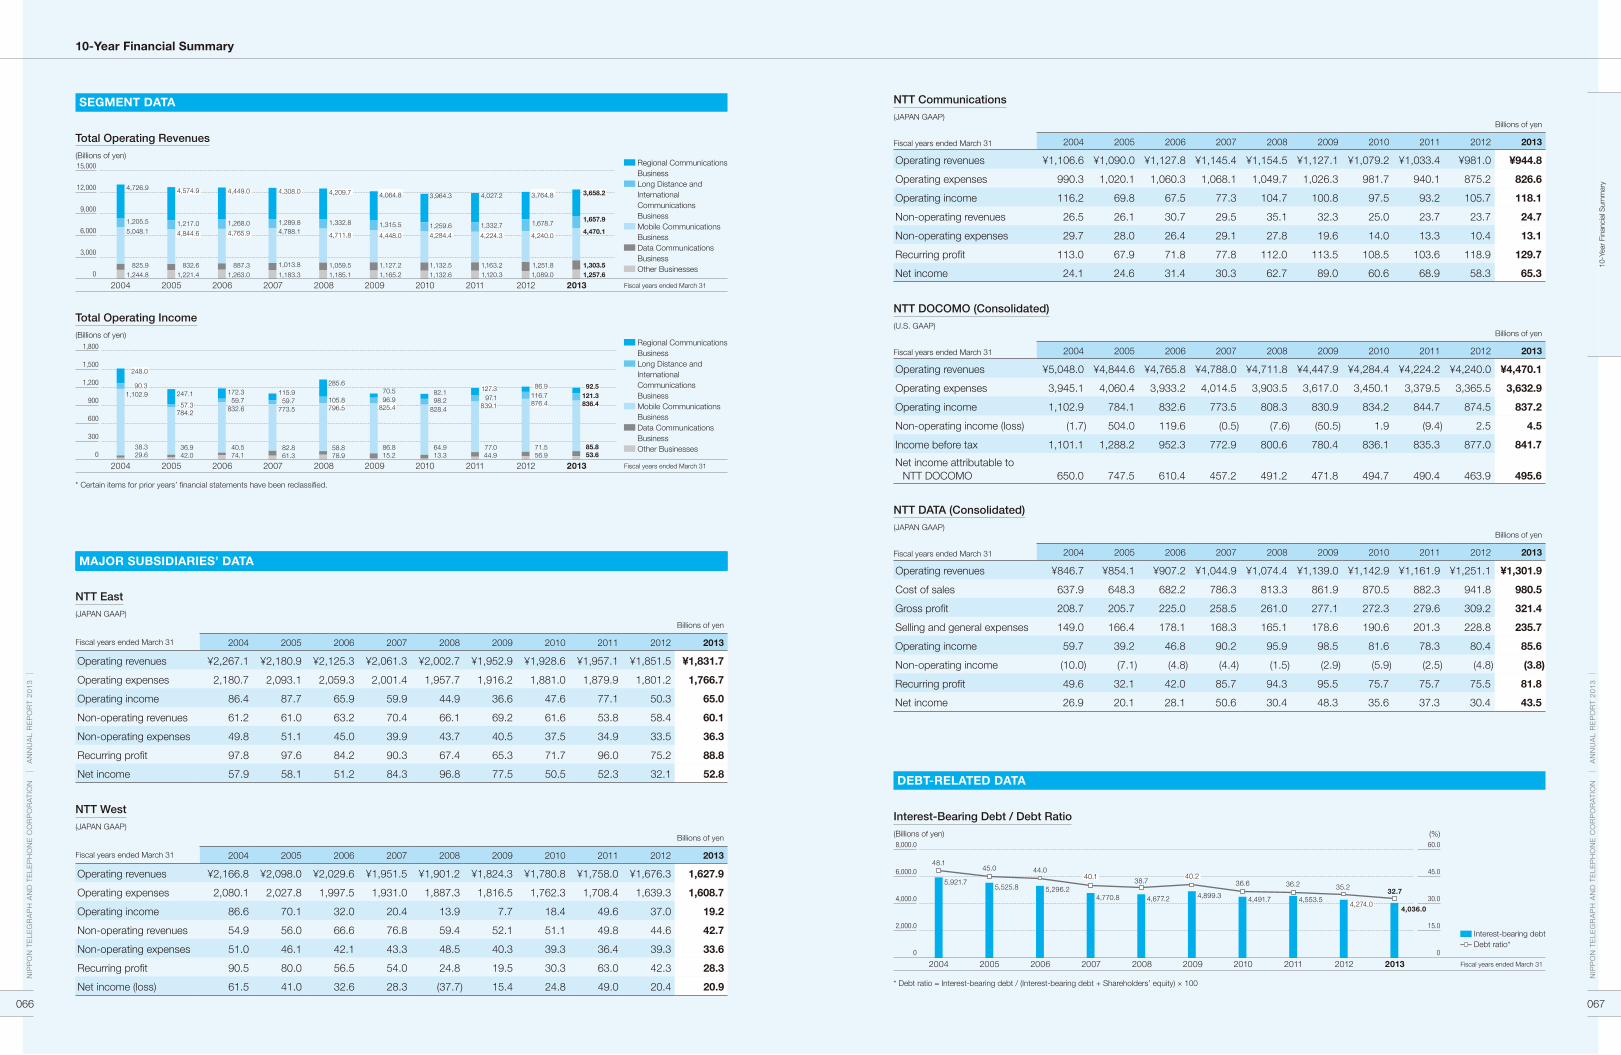
10-Y
ear
Fina
ncia
l Sum
mar
y
2004 2005 2006 2007 2008 2009 2010 20122011 20130
600
300
1,200
900
1,800
1,500
90.3
248.0
36.9
784.257.3
172.359.7 96.9
82.1 116.7247.1
832.6
115.9105.8
70.5285.6
64.9
86.9
38.3
1,102.9
42.040.5
59.7
61.358.8
825.498.2 876.4
29.6 74.182.8
78.986.8
828.4
71.5
773.5 796.5
15.2 13.3 56.9
121.392.5
836.4
85.853.6
97.1127.3
839.1
77.044.9
Fiscal years ended March 31
2004 2005 2006 2007 2008 2009 2010 20122011 20130
3,000
9,000
6,000
15,000
12,000 4,726.9
1,217.0
4,449.0
1,289.8
4,209.7
1,315.5
3,964.3
1,657.9
1,244.8
4,574.9
887.3
4,308.0
1,185.1
4,064.8
1,132.5
3,658.2
1,205.5
4,844.6
1,268.04,788.1
4,448.01,259.6
4,470.15,048.1
832.6
4,765.9
1,013.8
4,711.8
1,127.2
4,284.4
1,303.5825.91,221.4 1,263.0 1,183.3
1,059.51,165.2 1,132.6 1,257.6
1,678.7
3,764.8
4,240.0
1,251.8 1,089.0
1,332.7
4,027.2
4,224.3
1,163.21,120.3
1,332.8
Fiscal years ended March 31
2004 2005 2006 2007 2008 2009 2010 20122011 20130
4,000.0
2,000.0
6,000.0
8,000.0
0
30.0
15.0
45.0
60.0
4,036.0
32.7
48.144.0
38.7 36.640.1 40.2
36.25,921.7 5,296.2
4,677.2 4,491.7
5,525.8
4,770.8 4,899.3 4,553.5
35.2
4,274.0
45.0
Fiscal years ended March 31
Regional Communications Business
Long Distance and International Communications Business
Mobile Communications Business
Data Communications Business
Other Businesses
Regional Communications Business
Long Distance and International Communications Business
Mobile Communications Business
Data Communications Business
Other Businesses
* Certain items for prior years’ financial statements have been reclassified.
10-Year Financial Summary
Total Operating Revenues(Billions of yen)
Total Operating Income(Billions of yen)
NTT East(JAPAN GAAP)
Billions of yen
Fiscal years ended March 31 2004 2005 2006 2007 2008 2009 2010 2011 2012 2013
Operating revenues ¥2,267.1 ¥2,180.9 ¥2,125.3 ¥2,061.3 ¥2,002.7 ¥1,952.9 ¥1,928.6 ¥1,957.1 ¥1,851.5 ¥1,831.7
Operating expenses 2,180.7 2,093.1 2,059.3 2,001.4 1,957.7 1,916.2 1,881.0 1,879.9 1,801.2 1,766.7
Operating income 86.4 87.7 65.9 59.9 44.9 36.6 47.6 77.1 50.3 65.0
Non-operating revenues 61.2 61.0 63.2 70.4 66.1 69.2 61.6 53.8 58.4 60.1
Non-operating expenses 49.8 51.1 45.0 39.9 43.7 40.5 37.5 34.9 33.5 36.3
Recurring profit 97.8 97.6 84.2 90.3 67.4 65.3 71.7 96.0 75.2 88.8
Net income 57.9 58.1 51.2 84.3 96.8 77.5 50.5 52.3 32.1 52.8
NTT West(JAPAN GAAP)
Billions of yen
Fiscal years ended March 31 2004 2005 2006 2007 2008 2009 2010 2011 2012 2013
Operating revenues ¥2,166.8 ¥2,098.0 ¥2,029.6 ¥1,951.5 ¥1,901.2 ¥1,824.3 ¥1,780.8 ¥1,758.0 ¥1,676.3 1,627.9
Operating expenses 2,080.1 2,027.8 1,997.5 1,931.0 1,887.3 1,816.5 1,762.3 1,708.4 1,639.3 1,608.7
Operating income 86.6 70.1 32.0 20.4 13.9 7.7 18.4 49.6 37.0 19.2
Non-operating revenues 54.9 56.0 66.6 76.8 59.4 52.1 51.1 49.8 44.6 42.7
Non-operating expenses 51.0 46.1 42.1 43.3 48.5 40.3 39.3 36.4 39.3 33.6
Recurring profit 90.5 80.0 56.5 54.0 24.8 19.5 30.3 63.0 42.3 28.3
Net income (loss) 61.5 41.0 32.6 28.3 (37.7) 15.4 24.8 49.0 20.4 20.9
NTT Communications(JAPAN GAAP)
Billions of yen
Fiscal years ended March 31 2004 2005 2006 2007 2008 2009 2010 2011 2012 2013
Operating revenues ¥1,106.6 ¥1,090.0 ¥1,127.8 ¥1,145.4 ¥1,154.5 ¥1,127.1 ¥1,079.2 ¥1,033.4 ¥981.0 ¥944.8
Operating expenses 990.3 1,020.1 1,060.3 1,068.1 1,049.7 1,026.3 981.7 940.1 875.2 826.6
Operating income 116.2 69.8 67.5 77.3 104.7 100.8 97.5 93.2 105.7 118.1
Non-operating revenues 26.5 26.1 30.7 29.5 35.1 32.3 25.0 23.7 23.7 24.7
Non-operating expenses 29.7 28.0 26.4 29.1 27.8 19.6 14.0 13.3 10.4 13.1
Recurring profit 113.0 67.9 71.8 77.8 112.0 113.5 108.5 103.6 118.9 129.7
Net income 24.1 24.6 31.4 30.3 62.7 89.0 60.6 68.9 58.3 65.3
NTT DOCOMO (Consolidated)(u.S. GAAP)
Billions of yen
Fiscal years ended March 31 2004 2005 2006 2007 2008 2009 2010 2011 2012 2013
Operating revenues ¥5,048.0 ¥4,844.6 ¥4,765.8 ¥4,788.0 ¥4,711.8 ¥4,447.9 ¥4,284.4 ¥4,224.2 ¥4,240.0 ¥4,470.1
Operating expenses 3,945.1 4,060.4 3,933.2 4,014.5 3,903.5 3,617.0 3,450.1 3,379.5 3,365.5 3,632.9
Operating income 1,102.9 784.1 832.6 773.5 808.3 830.9 834.2 844.7 874.5 837.2
Non-operating income (loss) (1.7) 504.0 119.6 (0.5) (7.6) (50.5) 1.9 (9.4) 2.5 4.5
Income before tax 1,101.1 1,288.2 952.3 772.9 800.6 780.4 836.1 835.3 877.0 841.7
N et income attributable to NTT DOCOMO 650.0 747.5 610.4 457.2 491.2 471.8 494.7 490.4 463.9 495.6
NTT DATA (Consolidated)(JAPAN GAAP)
Billions of yen
Fiscal years ended March 31 2004 2005 2006 2007 2008 2009 2010 2011 2012 2013
Operating revenues ¥846.7 ¥854.1 ¥907.2 ¥1,044.9 ¥1,074.4 ¥1,139.0 ¥1,142.9 ¥1,161.9 ¥1,251.1 ¥1,301.9
Cost of sales 637.9 648.3 682.2 786.3 813.3 861.9 870.5 882.3 941.8 980.5
Gross profit 208.7 205.7 225.0 258.5 261.0 277.1 272.3 279.6 309.2 321.4
Selling and general expenses 149.0 166.4 178.1 168.3 165.1 178.6 190.6 201.3 228.8 235.7
Operating income 59.7 39.2 46.8 90.2 95.9 98.5 81.6 78.3 80.4 85.6
Non-operating income (10.0) (7.1) (4.8) (4.4) (1.5) (2.9) (5.9) (2.5) (4.8) (3.8)
Recurring profit 49.6 32.1 42.0 85.7 94.3 95.5 75.7 75.7 75.5 81.8
Net income 26.9 20.1 28.1 50.6 30.4 48.3 35.6 37.3 30.4 43.5
Interest-Bearing Debt / Debt Ratio(Billions of yen) (%)
Interest-bearing debt Debt ratio*
Debt-RelateD Data
*Debtratio=Interest-bearingdebt/(Interest-bearingdebt+Shareholders’equity)×100
Segment Data
majoR SubSiDiaRieS’ Data
NIP
PO
N T
ELE
GR
AP
H A
ND
TE
LEP
HO
NE
CO
RP
OR
AT
ION
A
NN
uA
L R
EP
OR
T 2
01
3
066
NIP
PO
N T
ELE
GR
AP
H A
ND
TE
LEP
HO
NE
CO
RP
OR
AT
ION
A
NN
uA
L R
EP
OR
T 2
01
3
067

Ope
ratin
g an
d Fi
nanc
ial R
evie
w a
nd P
rosp
ects
oveRview oF buSineSS ReSultS
During the fiscal year ended March 31, 2013, NTT Group has
worked to expand its provision of broadband and ubiquitous ser-
vices pursuant to its Medium-Term Management Strategy, adopted
in May 2008, entitled “Road to Service Creation Business Group.”
The fiscal year ended March 31, 2013 marked the final fiscal year of
this Medium-Term Management Strategy. In November 2012, NTT
Group formulated its new Medium-Term Management Strategy,
entitled “Towards the Next Stage,” in order to respond to the
increasingly faster pace of globalization of the market and the devel-
opment of cloud services.
broadband Services
In the fixed-line communications field, NTT Group continued to
take measures to expand the use of its “FLET’S Hikari” services and
to improve its customer support services. NTT Group began offering
“Omoikkiri Wari,” a program designed to attract new subscribers,
and “Hikari Motto Motto Wari,” a program designed to promote
long-term continuous use.
In the mobile communications field, NTT Group worked to fur-
ther increase the speed of “Xi” (pronounced “crossy”), with high-
speed and large-capacity capabilities, in order to operate safe,
secure and high quality networks and to expand service areas. NTT
Group also worked to further enhance smartphone convenience by
launching the “Xperia™ Z” phone, which is equipped with a Quad-
Core CPu, a large-capacity battery, and high-speed processing
capability. In addition, NTT Group introduced various rate plans and
improved after-sales services in order to provide its users with a
customer-friendly environment for smartphone and “Xi” use.
NTT Group engaged in cooperative projects with convenience
store operators, railroad companies, shopping district promotion
associations and local governments to strengthen Wi-Fi environ-
ments in order to improve the convenience of data communication
using devices such as smartphones and increase the use of Hikari
services. Customers can also use the Wi-Fi environment as a plat-
form for distributing information.
upper layer Services—Solutions businesses
NTT Group has put significant effort into enhancing its contents
services. Specifically, NTT Group introduced new services that can
be conveniently used on smartphones and tablet devices, such as
“d shopping,” an easy-to-use online shopping service, and “d
game,” a gaming service offered in collaboration with a leading
game maker. Subscriptions for “d video,” a flat-rate video distribu-
tion service for smartphones, exceeded four million at the end of the
fiscal year ended March 31, 2013.
NTT provided highly convenient services in the fields of medicine
and education, with a focus on industry-specific solutions which
have been developed based on each industry’s unique characteris-
tics and trends. In the field of medicine, for example, NTT launched
“Hikari Timeline,” which enables information sharing among medical
institutions by compiling the electronic medical records of different
medical institutions in chronological order. For corporate customers,
NTT Group launched “BizXaaS BA,” a customer information analysis
support service utilizing big data, which enables quick and cost-
effective use of client information analysis reports.
global businesses
NTT Group acquired all of the shares of Centerstance, Inc., a
u.S.-based company that supports cloud migration, making it a
wholly-owned subsidiary (“NTT Centerstance, Inc.”) in order to
expand NTT Group’s global operations and enhance its provision of
cloud services. Through close collaboration between NTT Center-
stance, Inc. and each NTT Group company, NTT Group has estab-
lished an infrastructure that enables the integrated provision to its
customers of information and telecommunications environments.
As part of its expansion of cloud services, NTT Group estab-
lished a global Research and Development committee in October
2012 in order to strengthen NTT Group’s research and development
capabilities, and began preparations to expand and enhance
research and development based in North America.
In order to strengthen its ability to seamlessly provide global
services to Japanese companies operating overseas and to local
corporations, NTT Group built new data centers in Singapore and
Malaysia. These countries are receiving attention as major system
hubs for the Asia region because they are located in areas which are
believed to be the least impacted by potential natural disasters.
Research and Development
As part of its efforts to create new services, NTT Group
engaged in research and development directed at the advancement
of video services and mobile communications services, strengthen-
ing the network platforms that support these services, and the
development of the fourth-generation mobile communications sys-
tems that will succeed Long Term Evolution (“LTE”) (a communica-
tion method characterized by high speed, high capacity, efficient use
of signals and low latency with specifications formulated by the 3rd
Generation Partnership Project). At the same time, NTT Group pro-
moted research and development efforts in areas that serve as step-
ping stones to developing new growth strategies, such as cloud
networks and security. In addition, NTT Group conducted research
and development focused on developing solutions for societal
issues, such as healthcare and the environment, and disaster-resis-
tant network services. Further, NTT Group promoted research in
high-capacity optical transmission technology and quantum infor-
mation processing as initiatives to develop advanced technologies
for the future.
CSR (Corporate Social Responsibility)
In order to contribute to the sustainable development of society,
NTT Group companies have worked collectively to achieve each of
the goals of set out in the “NTT Group CSR Priority Activities” plan
which was established in accordance with the NTT Group CSR
Charter. During the fiscal year ended March 31, 2013, by setting
quantitative indicators for the eight Priority Activities, NTT Group
further promoted and clarified the link between CSR activities and its
businesses. One of the themes of NTT Group’s environmental vision
is “creating a low-carbon society.” In furtherance of that theme, in
the fiscal year ended March 31, 2009, NTT Group adopted a policy
known as “Green NTT” as a means of promoting the use of renew-
able energy. By the end of the fiscal year ended March 31, 2013,
NTT achieved its target of installing a total of 5.0 megawatts of solar
power production facilities.
Restoration and Disaster Countermeasures
NTT Group has continued to build upon its disaster counter-
measure efforts following the Great East Japan Earthquake. Specifi-
cally, NTT Group worked to improve the earthquake resistance and
water resistance of exchange offices, re-examine its transmission
lines, build backup smartphone-related facilities (packet communi-
cations platforms), augment electric power facilities and expand
disaster countermeasure facilities. In order to further enhance user
convenience, NTT Group has increased the storage capacity of
messages on the Web171 Disaster Message Board, in terms of
number and storage time, linked the mobile and PHS versions of
the disaster message board services and added certain functions
such as the ability to provide message registration details via email
and voice.
Consolidated operating Revenues, operating
expenses, operating income, income before income
taxes and net income attributable to ntt
NTT Group’s consolidated operating revenues for the fiscal year
ended March 31, 2013 were 10,700.7 billion yen (an increase of
1.8% from the previous fiscal year). Consolidated operating
expenses were 9,498.8 billion yen (an increase of 2.3% from the
previous fiscal year). As a result, consolidated operating income was
1,202.0 billion yen (a decrease of 1.7% from the previous fiscal
year), consolidated income before income taxes was 1,201.1 billion
yen (a decrease of 3.1% from the previous fiscal year), and consoli-
dated net income attributable to NTT was 524.1 billion yen (an
increase of 12.1% from the previous fiscal year). See “Results of
Operations—The fiscal year ended March 31, 2013 compared with
the fiscal year ended March 31, 2012—” for an analysis of consli-
dated results of operations.
buSineSS outlook
Development of business Pursuant to the medium-
term management Strategy
In November 2012, NTT Group released its new Medium-Term
Management Strategy, “Toward the Next Stage.” NTT Group has set
a goal of achieving further growth and transformation by becoming a
“valued partner” that customers continue to select.
Specifically, NTT Group will seek to implement the following
initiatives.
expansion of global Cloud Services
In order to strengthen its individual services and to swiftly
respond to a variety of customer needs, NTT Group will bolster its
service structure by taking advantage of its ability as a group com-
pany to provide comprehensive and integrated cloud services from
the information and telecommunications platform stage, such as
providing data centers and an IP backbone, to the ICT management
and applications stage.
In addition, in order to accelerate research and development
in the cloud and the security sectors, NTT Group established a
new company, NTT Innovation Institute, Inc. (“NTT I3”), in the cut-
ting-edge and fiercely competitive North American market. Based
on the technology developed at NTT I3, NTT Group will offer North
America-based cloud services globally, including to Japan. In
particular, in the security sector, global security platforms (i.e.,
shared platforms) will be built and deployed. At the same time,
NTT Group will promote efforts to provide services with further
improvements in customer safety and security, by working to
strengthen its ability to operate under diverse legal systems that
differ by country and region.
As a result of the above, NTT aims to increase sales from its
global businesses to approximately twice the level of current sales
by the fiscal year ending March 31, 2017 and to increase revenues
from its overseas business to approximately half of corporate rev-
enues by establishing “Global Cloud Services” as the cornerstone of
NTT’s business operations going forward.
Strengthening network Service Competitiveness
NTT Group will work to further improve the effectiveness of its
network equipment which NTT Group has established to date by
allocating capital investment as appropriate according to the
changes in business models and the market. Additionally, by
expanding construction projects that do not require the dispatch of
NTT employees, NTT Group has reduced costs associated with
initiating optical transmission lines and has further improved the
efficiency of its maintenance and operational business. NTT Group
will work to establish simple and highly efficient business operations
while taking into account future business environment changes.
As a result of the above efforts, NTT Group expects to reduce
costsrelatedtofixed-line/mobilecommunicationsservicebyatleast
¥400 billion by the end of the fiscal year ending March 31, 2015
(compared with the fiscal year ended March 31, 2012), and will
comprehensively strengthen the competitiveness of its existing net-
work services.
operating and Financial Review and ProspectsN
IPP
ON
TE
LEG
RA
PH
AN
D T
ELE
PH
ON
E C
OR
PO
RA
TIO
N
AN
Nu
AL
RE
PO
RT
20
13
068
NIP
PO
N T
ELE
GR
AP
H A
ND
TE
LEP
HO
NE
CO
RP
OR
AT
ION
A
NN
uA
L R
EP
OR
T 2
01
3
069

Ope
ratin
g an
d Fi
nanc
ial R
evie
w a
nd P
rosp
ects
Furthermore, NTT aims to further expand fiber-optic access by
creating new ICT use scenarios and developing a smartphone user
platform by improving the quality of LTE service.
In addition, NTT Group aims to reduce its capital investment as
a percentage of operative revenues (Capex to Sales ratio) to 15% by
the fiscal year ending March 31, 2016 through drastic streamlining
of capital investments. Further, NTT Group plans to increase merg-
ers and acquisitions activity with a focus on cloud-related busi-
nesses with the goal of enhancing shareholder returns.
Through these efforts, NTT Group will work towards earnings
per share (“EPS”) growth of 60% or more (compared with the fiscal
year ended March 31, 2012) by the fiscal year ending March 31, 2016.
Responding to environmental issues
With respect to environmental issues, which are a global con-
cern, NTT Group will bolster its efforts to reduce its environmental
burden through the three initiatives below.
•“GreenofICT”—Thisinitiativeisaimedatreducingtheenviron-
mental burden resulting from ICT, through measures such as
energy conservation at NTT Group’s data centers and communi-
cation facilities, and promoting renewable energy generation.
•“GreenbyICT”—ThisinitiativepromotestheuseofICT,suchas
telecommuting and teleconferencing, to help reduce the environ-
mental burden on society as a whole.
•“GreenwithTeamNTT”—Underthisinitiative,eachNTTGroup
employee’s action will help reduce the environmental burden at the
workplace, at home and in the community.
Through innovative uses of ICT, NTT will contribute to the real-
ization of environmentally friendly and smart communities (next gen-
eration energy, social systems) by promoting a power visualization
service for customers’ power consumption in office buildings and
condominium complexes to support the reduction of electric power
consumption and energy saving.
initiatives for Secure and Safe networks
Based on experience gained from the Great East Japan Earth-
quake and other disasters, NTT Group will continue to work towards
the development of disaster-resistant facilities. Additionally, with
respect to the disaster message dial and other support services,
NTT Group will strive to achieve further growth and increased con-
venience, participate in drills through collaboration with external
institutions, such as the national and local governments, and work
to bolster its disaster countermeasures.
In light of the dramatic increase of smartphone users, NTT
Group will continue to provide stable operation of its network envi-
ronment through appropriate enhancement of its facilities and further
improvements to network reliability.
NTT Group will put together necessary security countermea-
sures in order to deal with wide-scale and diversified cyberattacks.
RiSk FaCtoRS
In addition to the other information contained in this annual
report, prospective investors should carefully consider the risks
described below related to NTT Group’s business environment,
business strategy and operations, regulations to which NTT is sub-
ject and NTT’s relationship with the Government. Additional risks not
currently known to NTT or that NTT now deems immaterial may also
impair NTT Group’s business operations. This annual report also
contains forward-looking statements that involve risks and uncer-
tainties. NTT Group’s actual results could differ materially from those
anticipated in these forward-looking statements as a result of a
number of factors, including the risks NTT Group faces as described
below and elsewhere in this annual report.
Risks associated with the business environment and
ntt group’s Corresponding business Strategiesntt group’s business may be affected by the economic
situation globally and in japan.
In the fiscal year ended March 31, 2013, despite the relative
stabilization of the u.S. economy, Europe’s bond-related economic
downturn had a ripple effect on China and other emerging market
countries, leading to continued global economic stagnation. The
Japanese economy, despite showing signs of mild recovery, mainly
from domestic demand stemming from rebuilding after the Great
East Japan Earthquake, has shown weakened growth from the
effects of the global economic slowdown.
The Japanese economy is expected to gradually recover as a
result of an improved export environment, the effects of Japan’s
economic measures and monetary policies and improved consumer
confidence. Nevertheless, the risk of economic stagnation in Japan
remains due to the potential negative influence of overseas econo-
mies. Changes in the state of employment and consumer income
levels also need to be monitored. In the event that the state of the
Japanese economy does not improve or worsens, NTT Group’s
financial condition and results of operations may be adversely
affected as a large amount of NTT Group’s business revenues are
attributable to the provision of services in Japan. In the solutions
business in particular, corporate IT investments have been restrained
by, among other things, a decline in corporate earnings. Meanwhile,
customers are becoming increasingly cost-conscious and requiring
stringent evaluations of potential IT investments, which may lead to
declines in the sales prices of systems and services provided by
NTT Group in the current market environment.
NTT Group’s other businesses include the real estate business
and finance business. In the real estate business, NTT Group’s
financial condition and results of operations may be impacted by a
decrease in the profitability of investments if there is a decrease in
demand in the real estate leasing market or apartment sales market
as a result of an economic slowdown. In the finance business, in
order to minimize losses incurred as a result of the insolvency of
operating and Financial Review and Prospects
NIP
PO
N T
ELE
GR
AP
H A
ND
TE
LEP
HO
NE
CO
RP
OR
AT
ION
A
NN
uA
L R
EP
OR
T 2
01
3
070
NIP
PO
N T
ELE
GR
AP
H A
ND
TE
LEP
HO
NE
CO
RP
OR
AT
ION
A
NN
uA
L R
EP
OR
T 2
01
3
071
counterparties, NTT Group has been making an effort to manage
the extension of credit based on the creditworthiness of its counter-
parties. However, the economic circumstances of these counterpar-
ties may change due to the impact of an economic slowdown,
which may lead to unrecoverable loans, potentially affecting NTT
Group’s financial condition and results of operations.
NTT Group evaluates various means of capital procurement,
including the issuance of corporate bonds and incurring debt.
Although NTT is working toward securing low interest financing and
stable sources of funds, NTT Group’s capital procurement costs
may increase if there are major fluctuations in the financial markets.
Further, if the asset value of investment securities and other assets
owned by NTT Group declines because of depressed stock and
financial markets, impairment losses may adversely affect NTT
Group’s results of operations. In addition, real estate sales and pen-
sion investments by NTT Group may suffer further effects from a
slower economy.
ntt group’s market share and revenues may suffer
from competition.
It is anticipated that competition in the information and commu-
nications market in Japan will grow increasingly fierce with the entry
of companies employing a variety of business models. NTT Group
faces competition in all of its business segments.
In particular, there has been a rapid spread of fiber-optic and
LTE broadband services and an increase in the number of smart-
phone and tablet devices in the information and communications
market, resulting in a worldwide expansion of the use of social
media. As a result, a variety of Japanese and overseas businesses
have entered the market, leading to the diversification and sophisti-
cation of services and devices. Going forward, NTT Group expects
further rapid changes in the information and communications market
centered around cloud services.
NTT Group believes that it maintains a competitive advantage
over other companies in Japan’s information and communications
market. However, in light of the changing competitive environment,
there is no guarantee that NTT Group will be able to maintain its
current competitive advantage. Such competition from other
market participants may have an effect on NTT Group’s future
growth and profitability.
In the fixed-line communications market, competition based on
technological reform continues to develop.
The conventional fixed-line telephone services market continues
to shrink as a result of the shift to IP telephone services and other
factors. To increase its competitiveness, NTT Group plans to
strengthen its “Hikari Denwa” and other IP telephone services. How-
ever, revenues could fall more than expected if customers of NTT
East and NTT West switch to competitors offering IP telephone
services using fiber-optic services or CATV lines.
In the fixed-line broadband business market, access lines are
becoming faster and less expensive. In addition to increasing facility
and service competition among service providers, the market envi-
ronment is undergoing major changes as a result of the expansion
of triple-play service offerings, which include video distribution and
IP telephony, and the appearance of new services for information
devices other than personal computers. In this market environment,
fiber-optic services have expanded to account for over half of broad-
band services in Japan. NTT Group expects that competition with
providers of other fiber-optic services, increased speeds of wireless
and broadband services such as LTE, CATV and wireless broad-
band will continue, due to the spread of smartphones and tablet
devices. As a result, NTT Group may experience a decrease in mar-
ket share or a slowdown in the growth of its subscriber base and
need to reduce its rates further. To address such competition, NTT
may be required to incur more expenses than anticipated to
increase its customer base, which may have an effect on NTT
Group’s financial condition and results of operations.
In the mobile communications market, there has been a shift
away from the conventional vertically integrated market, as the
application market is expanding in conjunction with the popularity of
smartphones, ultra-high-speed broadband using LTE and other
technologies, and competition is growing more intense not only
within each market layer (handset, network, communication plat-
form, and content and application layers), but across the layers as
well. For example, NTT Group faces fierce competition resulting
from Mobile Number Portability (“MNP”), the emergence of new
businesses, the merging of other business operators, the rollout of
attractive mobile devices from other service providers that appeal to
customers, the diversification of rate plans, and the introduction of
new services. Moreover, some carriers are already offering fixed-
mobile convergence services with features such as combined point
programs for both mobile and fixed-line services, free calls between
mobile and fixed-line phones and set discounts on fixed-line broad-
band services, and it is possible that these carriers will further
develop their service offerings to provide a high level of customer
convenience. In addition, NTT Group’s ability to provide such fixed-
mobile convergence services may be restricted by regulations.
under these market conditions, the number of subscriptions
that NTT Group acquires or retains may be lower than anticipated,
and the costs required to acquire or retain subscribers may be
greater than anticipated, which consequently may adversely affect
the financial condition and performance of NTT Group. In this com-
petitive market environment, in order to provide more advanced and
wide-ranging services and increase convenience for its customers,
NTT Group has provided various new rate plans and services and
has revised its rate structure. However, NTT Group cannot be cer-
tain that these measures will enable it to acquire new subscribers or
maintain existing subscription levels and the diversification of rate
plans could lead to a decline in Average Monthly Revenue per unit
(“ARPu”). If the subscription rate for various discount services or the
trend of subscribers using and switching to flat-rate services is not
in accordance with NTT Group’s expectation, its ARPu may

Ope
ratin
g an
d Fi
nanc
ial R
evie
w a
nd P
rosp
ects
operating and Financial Review and Prospects
NIP
PO
N T
ELE
GR
AP
H A
ND
TE
LEP
HO
NE
CO
RP
OR
AT
ION
A
NN
uA
L R
EP
OR
T 2
01
3
072
NIP
PO
N T
ELE
GR
AP
H A
ND
TE
LEP
HO
NE
CO
RP
OR
AT
ION
A
NN
uA
L R
EP
OR
T 2
01
3
073
decrease more than expected. The foregoing factors may have an
effect on NTT Group’s financial condition and operating results.
The solutions business, which is the focal area of NTT DATA’s
business, is expected to be a major area of growth in the informa-
tion services market, and hardware vendors and others are commit-
ting their efforts to this business. Moreover, the growth of
information service companies in rapidly developing nations, such as
India and China, is bringing about global competition, and the inten-
sification of competition resulting from the aggressive market entry
of competing companies may have an effect on NTT Group’s finan-
cial condition and its operating results.
Further, with regard to the upper layer services (platforms, con-
tent and applications), which are expected to have increasing impor-
tance for the development of NTT Group, new companies are
expected to continue entering the market in a variety of forms from a
multitude of fields. If the competitive environment going forward is
more intense than anticipated, NTT may not be able to secure its
anticipated market share.
growth of new ntt group businesses and migration from
existing businesses accompanying the expansion of iP, broad-
band and cloud services and other market developments may
not progress as anticipated.
Optical broadband services and LTE broadband service speeds
have increased in Japan’s information and telecommunications mar-
ket, and smartphones, tablets and other devices have gained wide-
spread market acceptance, together with the increased use of social
media and cloud services. There has also been a worldwide trend
toward the entry of various new participants into the market, in addi-
tion to telecommunications companies, and a rapid growth in the
variety and sophistication of services. NTT Group expects that the
further development of broadband services will lead to increased
distribution of content and applications, and the importance of the
content and applications layer in business development will grow.
NTT Group has put significant effort into its content services and
application layers, which are becoming more important. Specifically,
NTT Group introduced new services that can be conveniently used
on smartphones and tablet devices, such as “d shopping,” an easy-
to-use online shopping service, and “d game,” a service that allows
users to securely and safely enjoy carefully selected games. NTT
Group’s initiatives with respect to cloud services, which are
expected to grow, include the development and provision of client
systems by enhancing the service offerings of “BizCity” and “BizX-
aas,” and the provision of cloud services for individual customers,
such as “Shabette Concier.” However, revenues may not increase as
anticipated if the contents services provided by NTT Group and
cloud services do not grow as expected.
In an effort to expand its broadband user base in the fixed-line
communications business, NTT Group launched discount cam-
paigns to attract new subscribers, offered rate plans to promote
long-term and continuous use, and collaborated with other
businesses and local governments with the goal of further expand-
ing fiber-optic services.
However, revenues may not grow as anticipated if any of the
following were to occur: the market for fiber-optic services does not
expand as anticipated due to less than anticipated expansion of
video distribution services and other fiber-optic services; rate reduc-
tions for fiber-optic access services are greater than anticipated; any
issues relating to the formulation of business models, construction
of networks or development of technology for the provision of
broadband services cannot be easily resolved; or ICT use in the
public sector, including in medicine, education and government,
does not progress as anticipated.
In both the corporate and residential markets, fiber-optic IP
telephone services that permit the use of conventional fixed-line
telephone numbers have grown in popularity. Although NTT Group is
working to increase the number of subscribers for the high quality
“Hikari Denwa” fiber-optic access IP telephone service and its other
IP telephone services, NTT expects that the migration of customers
to these IP telephone services will have a negative effect on the
profitability of conventional fixed-line telephone services. Growth in
revenues from the expansion of fiber-optic services and broadband
services, as well as cost reductions achieved through the efficiencies
of IP technology, are projected to offset the negative effect on fixed-
line telephone services. Nevertheless, as discussed above, if rev-
enues in these areas do not grow as anticipated, there is a risk that
NTT Group’s earnings and expenses may be adversely affected.
NTT Group announced its migration plan from existing PSTN
(Public Switched Telephone Networks) networks to the Next Gen-
eration Network (the “NGN”) in November 2010. However, if the
migration to the NGN does not progress as anticipated, the mainte-
nance costs for duplicative facilities for a prolonged period and other
transient costs may affect the financial condition and results of oper-
ations of NTT Group.
In the mobile communications business, NTT Group believes
that an increase in revenues from factors such as the expansion of
smartphone services and “Xi,” an LTE service, and the related
increase in packet and other communications services, and mea-
sures for new value creation in collaboration with various services
and industries, is a critical element for future growth. Nevertheless,
growth of these services may potentially be curtailed and NTT’s
financial condition and results of operations may be negatively
impacted if operating systems, applications and content-providing
partners required for the provision of services do not cooperate or
collaborate as expected or on acceptable terms, new services fail to
meet expectations in terms of scheduling, costs, customer demand
and appeal, the various current or future services of NTT DOCOMO
are insufficient or not attractive enough to maintain current subscrib-
ers or attract new ones, market demand for handset functions is not
as envisioned, or higher communication speed through LTE cannot
be expanded as scheduled.
ntt group’s international and domestic investments, alliances
and collaborations and investments directed at new fields of
business may not produce the returns or provide the opportu-
nities ntt group expects.
NTT Group has sought to enter into joint ventures, alliances and
collaborations with both domestic and overseas companies and
organizations to more actively respond to changes in the telecom-
munications market, such as globalization, migration to cloud ser-
vices and the diversification of user devices. NTT has focused on
the steady expansion of total ICT services by utilizing the group’s
abilities in order to respond to the need for high-quality, comprehen-
sive ICT services from corporate customers in Japan and abroad
with global end-to-end, one-stop services. However, NTT Group
may not be able to maintain or enhance the value or financial perfor-
mance of domestic and overseas operations in which it has invested
or agreed to invest, or which NTT Group will invest in or ally with in
the future, or achieve sufficient synergies with these operations.
Over the past few years, NTT Group has proactively strived to
strengthen its global businesses. With a global customer base of
10,000 companies, including the overseas subsidiaries of group
companies, along with the ability to provide rapid and low-cost ser-
vices by harnessing group company synergies and cross-selling
efforts, NTT Group is working to expand its global area coverage
and ICT service offerings in order to strengthen its services. NTT
Group has established a “Global Strategy Committee,” “Global HR
Committee” and a “Global R&D Committee” consisting of represen-
tatives from group companies, including foreign subsidiaries, to
strengthen the framework for promoting such global strategy. How-
ever, the merits of diversification may be outweighed by the inability
to implement appropriate controls, and differences in thinking and
awareness with respect to managerial ideas and vision may lead to
difficulties in the implementation of business strategies and conduct
of operations.
For the reasons stated above, NTT’s global businesses may not
expand as anticipated and NTT may record write-downs related to
the impaired value of investments in future periods.
ntt group may not achieve anticipated cost savings.
NTT Group intends to continue to reduce personnel costs and
improve overall operating efficiency in its fixed-line communications
business. Moreover, with the transition to fiber-optic access and IP
networks, NTT Group is seeking to reduce costs by improving oper-
ational systems efficiency and reengineering the business processes
of its call center operations. However, sufficient cost reductions may
not be achieved if countermeasures become necessary to address
changes in the competitive environment or changes in the market
environment due to an economic slowdown.
NTT Group is working to improve the operational efficiency of its
networks, sales and services, research and development and
devices in its mobile communications business in order to
strengthen its business structure. However, NTT Group may not be
able to achieve expected cost reductions if operational efficiency
does not progress as planned due to intensified competition with
other businesses or changes in market conditions.
NTT Group also expects to achieve significant cost reductions
by reducing capital expenditures for fiber-optic access, the NGN
and mobile communications networks by deploying the results of
technical innovations, lowering the cost of equipment, improving
construction methods and centralizing, increasing the capacity of
and optimizing the configuration of base station facilities. NTT Group
aims to reduce the total amount of capital expenditures as a per-
centage of operating revenues by shifting the focus of capital expen-
ditures to service creation businesses after capital expenditures in
fiber optic access and the NGN stabilize at a lower level. However, in
the event capital expenditure is not as efficient as envisioned due to
such factors as network capacity expansion in response to
increased data traffic resulting from the spread of smartphones and
other tablet devices and the migration to Xi, or the enhancement of
data centers in conjunction with the development of cloud services,
it is possible that capital expenditures will exceed expectations.
other mobile service providers in the world may not adopt or
may discontinue use of technologies and frequency bands that
are compatible with those used by ntt DoComo’s mobile
communications systems, which could affect ntt group’s
ability to offer international services.
NTT DOCOMO is able to offer global roaming services on a
worldwide basis because a sufficient number of other mobile service
providers have adopted technologies that are compatible with the
technologies it uses on its mobile communications systems. How-
ever, NTT Group cannot guarantee that its overseas affiliates, strate-
gic partners and other mobile service providers will continue to use
technologies compatible with NTT DOCOMO’s systems.
If a sufficient number of mobile service providers switch to other
technologies, or if there is a delay in the introduction of compatible
technologies, NTT DOCOMO may not be able to offer international
roaming or other services as expected and may not be able to offer
its subscribers the convenience of overseas services.
Also, NTT DOCOMO cannot ensure that handset and network
vendors will be able to modify their handsets and networks appro-
priately and promptly if the actions of standardization organizations
result in changes to the standardized technologies that NTT
DOCOMO adopts, which would require modifications to the hand-
sets and networks that NTT DOCOMO uses.
If compatible technologies do not develop as expected and NTT
DOCOMO is not able to maintain or improve the quality of its over-
seas services or enjoy the benefits of global economies of scale,
NTT Group’s financial condition and results of operations may be
adversely affected.

Ope
ratin
g an
d Fi
nanc
ial R
evie
w a
nd P
rosp
ects
operating and Financial Review and Prospects
NIP
PO
N T
ELE
GR
AP
H A
ND
TE
LEP
HO
NE
CO
RP
OR
AT
ION
A
NN
uA
L R
EP
OR
T 2
01
3
074
NIP
PO
N T
ELE
GR
AP
H A
ND
TE
LEP
HO
NE
CO
RP
OR
AT
ION
A
NN
uA
L R
EP
OR
T 2
01
3
075
if ntt group and its business partners are unable to obtain
licenses or other rights to use the intellectual properties of
third parties that are necessary for ntt group to conduct its
business, ntt group may not be able to offer certain technolo-
gies, products, or services. in addition, ntt group may be
liable for damages due to infringement of the intellectual prop-
erty rights of other companies. Further, ntt group’s contem-
plated license revenues may be lower than expected and ntt
group’s competitive advantage may be compromised if intel-
lectual property and other rights owned by ntt group are used
improperly by third parties.
In order for NTT Group and its business partners to carry out
their business operations, it is necessary for NTT Group and its
business partners to obtain licenses and other rights to use the
intellectual property and other rights of third parties. Currently, NTT
Group and its business partners have obtained licenses from the
holders of such rights by concluding agreements with such holders,
and NTT Group plans to continue to obtain licenses from the hold-
ers of other intellectual property rights that are necessary for carry-
ing out its future business. However, if agreements cannot be
reached with the holders of such rights or if agreements concerning
rights previously granted cannot be maintained thereafter, NTT
Group and its business partners may not be able to provide certain
technologies, products or services.
Further, as NTT Group companies acquire foreign corporations,
NTT Group businesses are becoming increasingly internationalized,
and as a result, it is increasingly possible that a foreign corporation
will assert infringement of intellectual property or other rights against
NTT Group. If NTT Group is subject to claims of infringement of
intellectual property rights, NTT Group may be required to expend
considerable time and incur costs in reaching a resolution, and if
such claims are determined adversely to NTT Group through a court
judgment or through a settlement between the relevant parties,
revenues from businesses related to such rights may decrease and
NTT Group may be liable for damages for infringement of such
rights, and NTT Group’s relevant business may be subject to an
injunction, which may in turn adversely affect its financial condition
and results of operations. Further, NTT Group’s contemplated
license revenues may be lower than expected and NTT Group’s
competitive advantage may be compromised due to third parties
improperly using the intellectual property and other rights owned by
NTT Group.
Risks associated with business managementSystem and network disruptions and issues with system archi-
tecture may affect ntt group’s financial condition and results
of operations.
In order to provide fixed and mobile voice and data communica-
tions services to subscribers, NTT Group has deployed and main-
tains fixed-line subscriber telephone, fiber-optic access, W-CDMA
and LTE networks nation-wide. NTT Group has implemented a vari-
ety of measures with respect to its networks and systems in order to
ensure safe and stable services, including strengthening the durabil-
ity and water resistance of exchange offices and re-assessing its
transmission lines, but it is possible that notwithstanding these mea-
sures, natural disasters such as earthquakes, tsunamis, typhoons
and floods, and other issues including hardware and software fail-
ure, cyber-terrorism, terrorism, armed action, regional conflict and
various other events could cause system and network failure or
result in an inability to provide stable services. In such an event, NTT
Group’s financial condition and results of operations may be affected.
In particular, the occurrence of a large scale disaster could
cause severe damage to NTT Group’s telecommunications networks
which could take a long time to restore, and emergency electricity
use restrictions which could hinder NTT Group’s ability to provide
stable services. These events may result in the deterioration of NTT
Group’s reputation for reliability and its corporate image, as well as
lead to reductions in income and substantial repair costs.
The number of NTT Group services and products using
advanced technology has increased, resulting in increased quality
control risk. In particular, smartphone and tablet device applications
contain elements which could increase the load on NTT Group’s
network facilities beyond the level contemplated, such as communi-
cations applications that can secure or cut off connections, which
cause an increase in control signals between devices and the net-
work. While NTT Group is endeavoring to enhance quality and reli-
ability by making capital investments in its network facilities to
strengthen network resilience and to accelerate response time, if
such traffic cannot be processed or a service or product of NTT
Group has a defect or there is a human error, such as an error in
equipment settings, NTT may be held liable for damages, and the
reputation of NTT Group’s services and products may be affected.
In addition, in recent years, information security countermea-
sures for smartphones, cloud services and other new ICT services
are becoming an increasing concern. As a responsible service pro-
vider in the information and communications industry, NTT Group is
actively working on security countermeasures, but if an unforesee-
able event occurs, it is possible that there will be cases of unauthor-
ized access and virus infections, causing customers’ trust in NTT
Group to diminish. Further, NTT DOCOMO’s mobile phones are
equipped with various functions, such as payment settlement func-
tions, and NTT DOCOMO provides the services of many other ser-
vice providers on its mobile phones, which may increase the risk of
malfunctions, defects, leaks of personal information from mobile
phones and other issues caused by flaws or deficiencies in the ser-
vices of such service providers.
With respect to the solutions business, NTT Group generally
assumes full contractual responsibility at all stages—from the receipt
of orders to delivery to the building of systems and the delivery of
such systems to clients. There is the possibility that a deviation
from initial estimates or problems in project management at the
development stage could result in cost overruns or losses due to
delivery delays.
ntt’s reputation and credibility may be affected by
fraud or misconduct in japan or abroad, or by inappropriate
use or leaks of confidential business information and
personal information.
NTT Group is subject to a wide variety of related laws and
regulations because of its network of business locations which
handle a variety of products and services both in Japan and abroad.
As a result, some of NTT Group’s business activities require licenses,
notifications, and permit approvals. In addition, with respect to
business operations outside of Japan, there is a possibility that the
burden on the overseas business will increase from, among other
things, the local rules and regulations of the countries in which
NTT operates, or the lack thereof, the unpredictable interpretations
of such local laws, the adoption of new laws and the revision
of existing laws.
NTT Group considers legal compliance to be an extremely
important corporate responsibility and works to strengthen its com-
pliance systems and ensure thorough compliance. In addition, in
light of the recent tightening of bribery and anti-corruption laws in
foreign countries, particularly the united States and the united King-
dom, NTT is working towards further strengthening its compliance
systems. However, even with such countermeasures, there may be
cases where it is not possible to eliminate compliance risks and
reputation risks, including cases of improper personal behavior on
the part of an employee. In such cases, there may be an impact on
NTT Group’s financial conditions and results of operations.
In addition, mindful of its position of responsibility in the tele-
communications business, NTT Group has historically made efforts
to protect confidential information obtained in the course of its busi-
ness, including the personal information of customers. At the same
time, NTT Group is currently implementing the “NTT Group Informa-
tion Security Policy,” which includes enhanced internal information
management, training and awareness-raising for officers and
employees, publication of manuals and other measures intended to
fully address the issue of protection of confidential information
including personal information. NTT Group expects to be able to
ensure proper management of confidential information including
personal information in accordance with its policy. However, if there
is a leak or other misuse of such confidential information, such
action may affect NTT Group’s business, including its reputation and
credibility, and NTT Group’s ability to obtain new subscribers or
secure governmental contracts may be adversely impacted.
misuse of products and services offered by ntt group may
have an adverse impact on the credibility and corporate image
of ntt group and could expose ntt group to liability.
Inappropriate use of NTT Group’s products and services by
users may result in a decrease in the credibility of NTT Group’s
products and services and tarnish NTT Group’s corporate image,
which may in turn affect NTT Group’s financial condition and results
of operations.
For example, with respect to unsolicited bulk e-mails being sent
through NTT DOCOMO’s e-mail services, including “i-mode” mail
service, “sp-mode” mail service and “Short Message Service,”
despite NTT DOCOMO’s extensive efforts to address this issue by
protecting its subscribers from incurring any economic disadvantage
caused by unsolicited bulk e-mails, including notifying its subscrib-
ers via various brochures, providing unsolicited bulk e-mail filtering
functions with its handsets and suspending the use of or terminating
contracts with companies which distribute large amounts of such
unsolicited bulk e-mails, the problem has not yet been eliminated. If
NTT DOCOMO’s subscribers receive a large amount of unsolicited
e-mail, it may cause a decrease in customer satisfaction and dam-
age NTT DOCOMO’s corporate image, leading to a reduction in the
number of “i-mode” and “sp-mode” subscriptions.
Further, there has been a wide range of debate regarding issues
such as the potential negative impact caused by access by minors
to illegal or harmful websites, and regarding the effectiveness of
filtering services intended to restrict minors from accessing such
harmful sites. These issues may similarly damage NTT DOCOMO’s
corporate image.
Mobile phones have also been used in crimes such as the bank
transfer scam, wherein callers request an emergency bank remit-
tance of funds pretending to be a close relative of the person called.
To combat such misuses of NTT DOCOMO’s services, NTT
DOCOMO introduced various measures such as stricter identifica-
tion confirmation requirements at points of purchase, and ending
the provision of pre-paid mobile phones capable of making voice
calls as of the end of March 2012 because such pre-paid mobile
phones are easier to use in criminal activities. However, in the event
criminal usage increases, mobile phones may be regarded as a
social problem and this may lead to an increase in the cancellation
of subscriptions.
In addition, as handsets and services become more sophisti-
cated, new issues may arise when subscribers are charged higher
fees for packet transmission than they are aware of as a result of
using handsets without fully recognizing the extent of their use of
packet transmission in terms of frequency and volume. There are
also concerns over the occurrence of accidents caused by the use
of mobile phones while operating vehicles or bicycles. In addition,
there are issues concerning the high fees charged from the excess
use of paid content by subscribers and, in conjunction with the
spread of smartphones, the leaking of private information by fraudu-
lent applications (software) on the Internet.
NTT Group believes that it has properly addressed these social
issues by providing services such as filtering functions and restric-
tions on sites that can be accessed, as well as mobile phones
designed specifically for young people, but it is not certain whether
NTT Group will be able to continue to carry out proper measures in
the future. If NTT Group is unable to address these issues in an
appropriate manner, this may result in an increasing number of can-
cellations among current subscribers and an inability to acquire the

Ope
ratin
g an
d Fi
nanc
ial R
evie
w a
nd P
rosp
ects
ReSultS oF oPeRationS
the fiscal year ended march 31, 2013 compared with the fiscal year ended march 31, 2012
Billions of yen
Years ended march 31 2012 2013 Change Percent Change
Operating revenues: ¥10,507.4 ¥10,700.7 193.4 1.8%
Fixed voice related services 1,949.6 1,769.4 (180.1) (9.2)%
Mobile voice related services (1) 1,870.1 1,701.1 (169.0) (9.0)%
IP/Packetcommunicationsservices(2) 3,602.5 3,779.3 176.7 4.9%
Sales of telecommunications equipment 580.9 844.9 264.0 45.4%
System integration 1,776.9 1,824.6 47.7 2.7%
Other 727.4 781.5 54.1 7.4%
Operating expenses 9,284.4 9,498.8 214.4 2.3%
Operating income 1,223.0 1,202.0 (21.0) (1.7)%
Other income (expenses) 16.4 (0.9) (17.2) —
I ncome before income taxes and equity in earnings (losses) of affiliated companies
1,239.3 1,201.1 (38.2) (3.1)%
Income tax expense (benefit) 587.8 481.2 (106.6) (18.1)%
Equity in earnings (losses) of affiliated companies (3.0) (10.1) (7.1) —
Net income 648.6 709.7 61.2 9.4%
Less—net income attributable to noncontrolling interests 180.9 185.7 4.8 2.7%
Net income attributable to NTT 467.7 524.1 56.4 12.1%
(1) Revenues for the fiscal year ended March 31, 2012 account for mova voice communications services, which were terminated as of March 31, 2012.(2) Revenues for the fiscal year ended March 31, 2012 account for mova packet communications services, which were terminated as of March 31, 2012.
operating and Financial Review and Prospects
NIP
PO
N T
ELE
GR
AP
H A
ND
TE
LEP
HO
NE
CO
RP
OR
AT
ION
A
NN
uA
L R
EP
OR
T 2
01
3
076
NIP
PO
N T
ELE
GR
AP
H A
ND
TE
LEP
HO
NE
CO
RP
OR
AT
ION
A
NN
uA
L R
EP
OR
T 2
01
3
077
anticipated number of new subscribers, which may impact NTT
Group’s financial condition and results of operations.
Risks associated with the government, including
Rules, Regulations, and othersChanges or decisions regarding telecommunications regula-
tions may affect ntt group’s business.
The regulation of the Japanese telecommunications industry has
been changed in many areas, including the elimination of foreign
ownership restrictions (except in the case of NTT), retail price dereg-
ulation and the implementation of a Long Run Incremental Cost
Methodology (“LRIC Methodology”) for interconnection charges,
together with amendments to telecommunications laws aimed at
promoting competition. Decisions relating to Government regula-
tions and the resulting changes in the telecommunications industry
may affect NTT Group’s financial condition and results of operations.
the frequencies that ntt DoComo can use are limited, and it
is possible that it will not be able to secure adequate frequency
spectrum for its operations.
NTT DOCOMO has limited frequencies available for its services.
In areas such as the vicinity of major train stations in Tokyo and
Osaka, NTT DOCOMO’s mobile communications network may suf-
fer deterioration of service quality at peak times, when use of avail-
able frequencies is at or near its limit.
In addition, while the number of NTT DOCOMO subscribers and
the traffic per subscriber increase in conjunction with the expansion
of devices, such as smartphones and tablet devices, there may be a
decline in the quality of services if government agencies do not allo-
cate the frequency spectrum required for unhindered operation, or if
changes are made to the frequency spectrum allocation system, for
example, through the introduction of reallocation through an auction
system, and the necessary frequency spectrum cannot be obtained.
NTT DOCOMO is planning to use the newly allocated 700MHz band
frequency. However, it may not be able to smoothly operate its
mobile communications network, may suffer degradation of service
quality and may incur additional costs if the measures to transfer
existing wireless systems that currently use the 700MHz band fre-
quency to a different band frequency do not progress as planned.
NTT DOCOMO is working to obtain new frequencies and to
improve the efficiency of frequency usage through the application of
its technologies, such as LTE, and through the promotion of the
migration to LTE. However, there can be no assurance that NTT
DOCOMO’s efforts will be sufficient to avoid a deterioration in ser-
vice quality. If NTT DOCOMO is unable to address such problems
sufficiently and in a timely manner, it is possible that NTT Group’s
financial condition or results of operations will be materially affected
due to constraints in providing its wireless services or to the loss of
subscribers to competitors.
ntt group may be impacted by laws, regulations and systems
relating to the environment, such as those relating to reduction
of greenhouse gas emissions.
NTT Group is subject, both in Japan and overseas, to laws and
regulations relating to the environment such as those regarding to the
reduction of greenhouse gas emissions, energy conservation, waste
disposal and harmful substance removal. In order to comply with
such laws and regulations relating to the environment, NTT has imple-
mented various measures, such as introducing highly efficient power
sources and reusing and recycling telecommunications facilities. In
the event that stricter laws and regulations and societal demands with
respect to the environment materialize in the future, or new laws and
regulations are introduced, costs may increase, which may impact
NTT Group’s financial condition and results of operations.
the government owns enough ntt Shares to give it
considerable influence over whether resolutions at ntt
shareholder meetings are adopted, and rules and regulations in
japan provide the government with regulatory authority over
ntt group companies.
The Government, through the Minister of Finance, currently
owns 32.59% of NTT’s issued Shares (36.38% of NTT’s outstanding
Shares excluding treasury stock), which equates to 36.43% of the
voting rights, calculated on the basis of issued Shares minus trea-
sury stock and less-than-one-unit shares. The Government, in its
capacity as a shareholder, votes at shareholder meetings of NTT
and, by virtue of its statutorily mandated position as the largest
shareholder, has the power to exert considerable influence over
decisions made at such meetings. In 1997, in a statement at the
Diet, it was stated that the Government did not intend to actively
use its position as a shareholder to direct the management of NTT.
In fact, the Government has not used its power as a shareholder to
direct the management of NTT in the past.
the issuance or sale of additional ntt Shares or concerns
regarding additional supply of ntt Shares in the stock market
may affect the trading price of ntt Shares and aDSs.
until October 1986, the Government owned 100% of the issued
Shares of NTT. As a result of sales of Shares by the Government to
the public and sales of Shares by the Government to NTT as part of
NTT’s Share repurchase programs, as of March 31, 2013, the Gov-
ernment’s ownership of Shares was 32.59% of NTT’s issued Shares
(36.38% of NTT’s outstanding Shares excluding treasury stock). In
the event the NTT Law is revised again in order to ease or repeal the
requirements regarding Government ownership of Shares, or if NTT
cancels treasury stock, the number of Shares the Government is
allowed to sell would increase.
The sale of Shares by the Government or the issuance, sale or
other disposal of treasury stock by NTT (or the potential for such
transactions) could have an impact on the market price of Shares
and ADSs.
investors may have difficulty enforcing judgments under the
laws of foreign countries, including the u.S. securities laws
regarding the civil liabilities of ntt.
NTT is a limited liability, joint-stock corporation established
under the laws of Japan. All of NTT’s directors and management
reside in Japan. All or a substantial portion of the assets of such
persons or NTT are located in Japan. As a result, it may not be
possible for investors to effect legal service of process outside
Japan upon such persons or NTT or to enforce against them judg-
ments predicated upon the laws of foreign countries, including the
civil liability provisions of the u.S. securities laws, in federal or state
courts in the united States or other foreign courts. NTT has been
advised by its Japanese counsel that there is uncertainty as to the
enforceability, in actions originated in Japan, of liabilities predicated
solely upon the laws of foreign countries, including the u.S. securi-
ties laws, and as to the enforceability in Japan of judgments of fed-
eral or state courts in the united States or other foreign courts
obtained in actions predicated upon the laws of foreign countries,
including the civil liability provisions of the u.S. securities laws.
operating Revenues and expensesoperating Revenues
NTT Group’s operating revenues are divided into the six service
categories comprised of fixed voice related services, mobile voice
relatedservices,IP/packetcommunicationsservices,salesoftele-
communications equipment, system integration and other services.
Operating revenues in the fiscal year ended March 31, 2013
increased 1.8% from the previous fiscal year to ¥10,700.7 billion.
While voice related revenues continued to decline, the increase was
duetosuchfactorsasanincreaseinIP/packetcommunications
service revenues attributable to increases in FLET’S Hikari and
supplementary service subscriptions, an increase in mobile business
packet ARPu resulting from an increase in the number of smart-
phone subscriptions, an increase in handset sales revenues
resulting from an increase in smartphone sales, and an increase in
overseas sales.
Operating revenues for each service category for the fiscal year
ended March 31, 2013 are summarized as follows:
• Fixed Voice Related Services
NTT Group’s fixed voice related services include a portion of the
services in the regional communications business segment and long
distance and international communications business segment, such
as telephone subscriber lines, INS-Net, conventional leased circuits
and high speed digital.
Fixed voice related revenues for the fiscal year ended March 31,
2013 decreased 9.2% from the previous fiscal year to ¥1,769.4
billion, accounting for 16.5% of total operating revenues. This was
due to a continued decline in the number of subscriptions for

Ope
ratin
g an
d Fi
nanc
ial R
evie
w a
nd P
rosp
ects
operating and Financial Review and Prospects
NIP
PO
N T
ELE
GR
AP
H A
ND
TE
LEP
HO
NE
CO
RP
OR
AT
ION
A
NN
uA
L R
EP
OR
T 2
01
3
078
NIP
PO
N T
ELE
GR
AP
H A
ND
TE
LEP
HO
NE
CO
RP
OR
AT
ION
A
NN
uA
L R
EP
OR
T 2
01
3
079
telephone subscriber lines and INS-Net caused by the increasing
popularity of mobile phones, competition with optical IP telephones
and fixed line services provided by other businesses.
• Mobile Voice Related Services
Mobile voice related services include a portion of services from the
mobile communications business segment, such as Xi and FOMA.
Mobile voice related revenues for the fiscal year ended March
31, 2013 decreased 9.0% from the previous fiscal year to ¥1,701.1
billion, accounting for 15.9% of total operating revenues. This was
due to a decrease in voice ARPu arising from the decrease in bill-
able MOu and the penetration of the “Monthly Support” discount
programs in conjunction with the expansion of smartphone sales,
despite an increase in revenues resulting from an increase in Mobile
Phone Protection & Delivery Service subscriptions. MOu refers to
the average monthly minutes of use per subscriber.
• IP/Packet Communications Services
NTTGroup’sIP/packetcommunicationsservicesincludeapor-
tion of the services in the regional communications business segment
such as FLET’S Hikari and FLET’S ADSL, and a portion of the ser-
vices in the long distance and international communications business
segment such as IP-VPN, wide area Ethernet and OCN, as well as a
portion of the services in the mobile communications business seg-
ment such as the packet communications services of Xi and FOMA.
InthefiscalyearendedMarch31,2013,revenuesfromIP/
packet communications services increased 4.9% from the previous
fiscal year to ¥3,779.3 billion, accounting for 35.3% of total operat-
ing revenues. This was due to an increase in subscriptions for
FLET’S Hikari and Hikari Denwa in the regional communications
business segment, and an increase in smartphone sales in the
mobile communications business segment.
• Sales of Telecommunications Equipment
This category includes a portion of the services in the regional
communications business segment and the mobile communications
business segment.
In the fiscal year ended March 31, 2013, revenues from tele-
communications equipment sales increased 45.4% from the previous
fiscal year to ¥844.9 billion, accounting for 7.9% of total operating
revenues. This increase was due to strong sales of handsets such
as smartphones in the mobile communications business segment.
• System Integration
NTT Group’s system integration services include the data com-
munications business segment and a portion of the services in the
long distance and international communications business segment
and the regional communications business segment.
In the fiscal year ended March 31, 2013, revenues from system
integration increased 2.7% from the previous fiscal year to ¥1,824.6
billion, accounting for 17.1% of total operating revenues. This was
due to an increase in the number of consolidated subsidiaries as a
result of mergers and acquisitions in the long distance and interna-
tional communications business segment and the data communica-
tions business segment.
• Other
Other services principally comprises the real estate business,
financing business, construction and electricity business, system
development business and advanced technology development
business.
In the fiscal year ended March 31, 2013, revenues from other
services increased 7.4% from the previous fiscal year to ¥781.5
billion, accounting for 7.3% of total operating revenues. This was
due mainly to an increase in revenues from the real estate business,
and construction and electricity businesses.
operating expenses
Operating expenses in the fiscal year ended March 31, 2013
increased 2.3% from the previous fiscal year to ¥9,498.8 billion. The
reasons for the increase are discussed below. Personnel expenses
and expenses for purchase of goods and services and other
expenses below are included in cost of services, cost of equipment
sold, cost of system integration, and selling, general and administra-
tive expenses in the consolidated statements of income.
• Personnel Expenses
Personnel expenses in the fiscal year ended March 31, 2013
increased 0.2% from the previous fiscal year to ¥2,130.8 billion.
Although the number of employees in the regional communications
business segment continued to decline, personnel expenses
increased compared with the previous fiscal year due to the increase
in the total number of employees as a result of, among other things,
the increase in the number of consolidated subsidiaries as a result of
mergers and acquisitions in the long distance and international com-
munications business segment, the mobile communications busi-
ness segment and the data communications business segment.
• Expenses for Purchase of Goods and Services and Other Expenses
In the fiscal year ended March 31, 2013, cost of services and
equipment sold and selling, general and administrative expenses
collectively increased 3.2% from the previous fiscal year to ¥5,026.1
billion. Although expenses were reduced by improving operational
efficiency in the regional communications business segment and
long distance and international communications business segment,
overall expenses increased compared with the previous fiscal year
as a result of an increase in the wholesale unit prices of handsets
and distributor commissions resulting from the expansion of smart-
phone sales in the mobile communications business segment and
an increase in the number of consolidated subsidiaries in the data
communication business segment, the mobile communications
business segment and the data communications business segment.
• Depreciation and Amortization Expenses
Depreciation and amortization expenses in the fiscal year ended
March 31, 2013 decreased 0.6% from the previous fiscal year to
¥1,899.2 billion. This was due to the improved efficiency in capital
investments in the regional communications business segment,
despite the increase in depreciation and amortization expenses from
the expansion of LTE base stations in the mobile communications
business segment.
operating income
As a result of the foregoing, operating income for the fiscal year
ended March 31, 2013 was ¥1,202.0 billion, a decrease of 1.7%
over the previous fiscal year.
other operating Revenues and expensesother income (expenses)
Other expenses for the fiscal year ended March 31, 2013 was
¥0.9 billion, compared to other income of ¥16.4 billion in the previ-
ous fiscal year. This was mainly due to a decrease of ¥12.6 billion in
gains on sales of property, plant and equipment from the previous
fiscal year and an increase of ¥7.3 billion in loss on valuation of
securities from the previous fiscal year.
income before income taxes and equity in earnings (losses) of
affiliated Companies
Net income before income taxes in the fiscal year ended March
31, 2013 decreased 3.1% from the previous fiscal year to ¥1,201.1
billion for the reasons discussed above.
income tax expense (benefit)
In the fiscal year ended March 31, 2013, income tax expense
decreased 18.1% from the previous fiscal year to ¥481.2 billion. The
decrease was due to the re-measurement of the existing net
deferred tax assets using the lower statutory tax rates that were
enacted in Japan in November 2011, which resulted in the recogni-
tion of additional income tax expense of ¥89.9 billion as income tax
expense in the previous fiscal year. In addition, the actual effective
tax rate decreased from 47.4% for the year ended March 31, 2012
to 40.1% for the year ended March 31, 2013, primarily because the
effect of the re-measurement of the existing net deferred tax assets
in the year ended March 31, 2012 did not reoccur for the year
ended March 31, 2013.
net income and net income attributable to ntt
As a result, net income for the fiscal year ended March 31, 2013
was ¥709.7 billion, an increase of 9.4% from the previous fiscal year.
Net income attributable to NTT (excluding the portion attributable
to noncontrolling interests) for the fiscal year ended March 31, 2013
was ¥524.1 billion, an increase of 12.1% from the previous fiscal year.
liquiDitY anD CaPital ReSouRCeS
Financing, Capital Resources and use of Funds
Net cash provided by operating activities in the fiscal year ended
March 31, 2013 amounted to ¥2,453.7 billion, a decrease of ¥54.6
billion from ¥2,508.3 billion in the fiscal year ended March 31, 2012.
This decrease was primarily due to a decrease in cash collected
from customers resulting from an increase in installment sales of
mobile devices, an increase in the wholesale unit costs of handsets
and an increase in the payment of distributor commissions caused
by the expansion of smartphone sales. This was partially offset by
the last day of the previous fiscal year being a bank holiday which
resulted in the collection of a portion of telephone and certain other
charges from the previous fiscal year being carried over to this fiscal
year ended March 31, 2013.
NTT Group used net cash provided by operating activities
mainly to acquire property, plant and equipment, repay interest-
bearing debt and pay dividends.
Net cash used in investing activities in the fiscal year ended
March 31, 2013 amounted to ¥1,776.3 billion, a decrease of ¥195.0
billion from ¥1,971.2 billion in the fiscal year ended March 31, 2012.
This decrease was due to, among other things, a decrease of
¥387.5 billion in net expenditures for short-term investments in con-
junction with fund management investments in instruments of
greater than three months duration offset in part by a ¥131.4 billion
increase in payments for property, plant and equipment and in intan-
gible fixed assets computed on a cash basis.
The increase of investment in payments for property, plant and
equipment and in intangible fixed assets for the fiscal year ended
March 31, 2013 resulted from, among other things, the increase of
investments directed towards expansion of the “Xi” coverage area
and the reinforcement of network facilities in order to respond to the
rapid increase in the number of smartphones users in the mobile
communications business, which more than offsetting both a
decrease in investments related to the full-fledged recovery following
the Great East Japan Earthquake and IP migration in the regional
communications business. For the fiscal year ended March 31,
2013, capital investments amounted to ¥1,970.0 billion on an
accrual basis, of which ¥785.9 billion was invested by the regional
communications business and ¥753.7 billion was invested by the
mobile communications business.
Net cash used in financing activities in the fiscal year ended
March 31, 2013 amounted to ¥745.2 billion, a decrease of ¥202.9
billion from ¥948.1 billion in the fiscal year ended March 31, 2012.
The decrease was due to, among other things, a decrease of
¥231.8 billion in expenditures associated with the acquisition of
treasury stock.
As of March 31, 2013, the interest-bearing debt of NTT Group
was ¥4,036.0 billion, a decrease of ¥238.0 billion from the amount
as of March 31, 2012 (in the fiscal year ended March 31, 2012, the
interest-bearing debt of NTT Group decreased ¥279.4 billion from
the fiscal year ended March 31, 2011). The ratio of interest-bearing
debt to shareholders’ equity stood at 48.5% on March 31, 2013
(compared to 54.2% as of March 31, 2012). Interest-bearing debt
comprises short-term borrowings and long-term debt, shown in
Note 9 to the Consolidated Financial Statements, as well as ¥20.6
billion in deposits received pursuant to depositary agreements.
NTT Group believes that net cash expected to be generated
from operating activities, borrowings made available to NTT Group
frombanksandotherfinancialinstitutionsand/orofferingsofequity
or debt securities in the capital markets will provide the requisite
financial resources to meet NTT Group’s currently anticipated capital
investment and expenditure needs and debt service requirements.

Ope
ratin
g an
d Fi
nanc
ial R
evie
w a
nd P
rosp
ects
operating and Financial Review and Prospects
NIP
PO
N T
ELE
GR
AP
H A
ND
TE
LEP
HO
NE
CO
RP
OR
AT
ION
A
NN
uA
L R
EP
OR
T 2
01
3
080
NIP
PO
N T
ELE
GR
AP
H A
ND
TE
LEP
HO
NE
CO
RP
OR
AT
ION
A
NN
uA
L R
EP
OR
T 2
01
3
081
Management believes the working capital is sufficient for NTT
Group’s present requirements.
For the fiscal year ending March 31, 2014, NTT Group expects
capital investments totaling ¥1,870.0 billion on an accrual basis, a
decrease of ¥100.0 billion from the fiscal year ended March 31,
2013, due to, among other things, a decrease in investments in IP
migration and in disaster-prevention measures in the regional com-
munications business and a decrease in investment in FOMA base
stations in the mobile communications business. The total amount
of capital investments includes approximately ¥690.0 billion by the
regional communications business (aggregate of NTT East and NTT
West) and approximately ¥700.0 billion by the mobile communica-
tions business. The actual amount of capital investments may vary
from expected levels, since capital investments may be influenced
by trends in demand, the competitive environment and other fac-
tors. In addition, the actual amount of NTT Group’s funding will
depend on its future performance, market conditions and other
factors, and is therefore difficult to predict with certainty.
liquidity
As of March 31, 2013, NTT Group had cash and cash equiva-
lents (including short-term investments with principal maturities for a
period of less than three months) of ¥961.4 billion (compared with
¥1,020.1 billion as of March 31, 2012). Cash equivalents represent a
temporary cash surplus used to repay debts and make capital invest-
ments, among other things, and are used for working capital. Accord-
ingly, the balance of cash equivalents fluctuates each fiscal year
depending on particular funding and working capital requirements.
oFF-balanCe Sheet aRRangementS
As of March 31, 2013, contingent liabilities for guaranteed loans
and other loans amounted to ¥40.9 billion.
aPPliCation oF new aCCounting StanDaRDS not Yet aDoPteD
In February 2013, the Financial Accounting Standards Board
issued Accounting Standards update (“ASu”) 2013-02 “Reporting
of Amounts Reclassified Out of Accumulated Other Comprehensive
Income.” This pronouncement addresses the requirement to report
the effect of significant reclassifications out of accumulated other
comprehensive income on the respective line items on the income
statement in which net income is disclosed (if the amount being
reclassified is required to be reclassified in its entirety) or by way of
cross-reference (if a partial reclassification). This ASu is effective for
annual reporting periods beginning after December 15, 2012 and
interim periods within those years.
CRitiCal aCCounting PoliCieS
NTT Group’s consolidated financial statements are prepared in
accordance with accounting principles generally accepted in the
united States. Note 2 to the Consolidated Financial Statements
includes a summary of significant accounting policies used in the
preparation of these financial statements. NTT believes that, of its
significant accounting policies, the following may involve a higher
degree of judgment or complexity.
Revenue recognition
Revenues arising from fixed voice related services, mobile voice
relatedservices,IP/packetcommunicationsservicesandotherser-
vices are recognized at the time these services are provided to cus-
tomers. Revenues from non-recurring upfront fees, such as
activation fees, are deferred and recognized as revenue over the
estimated average period of the contracts with customers for each
service. The related direct costs are deferred only to the extent of
the non-recurring upfront fee amount and are amortized over the
same period. While this policy does not have a material impact on
net income, the reported amounts of revenue and cost of services
are affected by the level of revenues from non-recurring upfront fees
and related direct costs and the estimated average customer rela-
tionship period. Factors that affect management’s estimate of the
average customer relationship period over which such fees and
costs are amortized include subscriber churn rates and newly intro-
duced or anticipated products, services and technologies. The cur-
rent amortization periods are based on an analysis of historical
trends and the experience of NTT and its subsidiaries adjusted for
the estimated impact of future events and circumstances. Revenues
for expected future usage of telephone cards issued by NTT Group
are deferred and are recognized as revenue as of the time they are
actually used. Estimates of expected future usage are based on
past records of use and experience and are affected by changes in
trends of telephone card usage. Sales of telecommunications equip-
ment less certain amounts of agency commissions are recognized
as revenue upon delivery of the equipment to agent resellers, which
is considered to have occurred when the agent resellers have taken
title to the product, and the risks and rewards of ownership have
been substantially transferred. In connection with revenues from
system integration projects, provision for estimated losses, if any, is
made in the fiscal year in which the loss first becomes probable and
reasonably quantifiable. NTT Group recognizes such losses based
on estimates of total expected contract revenues and costs upon
completion. NTT Group follows this method because it permits
reasonably dependable estimates of revenues and costs to be made
at various stages of a contract. Recognized losses are subject to
revision as the contract progresses to completion. Revisions in loss
estimates are charged to income in the period in which the facts
that give rise to the revision become known.
estimated useful lives and impairments of property,
plant and equipment, software and certain other
intangibles
NTT Group estimates the useful lives and the residual values of
property, plant and equipment, software and certain other intan-
gibles with finite useful lives, in order to determine the amount of
depreciation and amortization expense to be recorded during any
reporting period. The useful lives and the residual values are esti-
mated at the time the assets are acquired and are based on histori-
cal experience with similar assets as well as anticipated
technological or other changes. If technological changes were to
occur more rapidly than anticipated or in a different form than antici-
pated, the useful lives assigned to these assets may need to be
shortened, resulting in the recognition of increased depreciation and
amortization expenses in future periods. Alternatively, these types of
technological changes could result in the recognition of an impair-
ment charge to reflect a write-down in the value of the assets. NTT
Group also reviews such assets for impairment whenever events or
changes in circumstances indicate that their carrying amount may
not be recoverable. If the total of the expected future undiscounted
cash flow is less than the carrying amount of the asset, an impair-
ment loss is recognized for the difference between the carrying
amounts of the asset and its fair value as measured through various
valuation techniques, including discounted cash flow models,
quoted market value and third-party independent appraisals, as
considered necessary. NTT Group’s total “Impairment losses” in the
fiscal years ended March 31, 2011, 2012 and 2013 were ¥1.1 bil-
lion, ¥9.6 billion and ¥5.4 billion, respectively. NTT Group considered
the Great East Japan Earthquake as a triggering event necessitating
a review for impairment losses. As a result of the review, NTT Group
determined that it was not necessary to record any impairment
losses on property, plant and equipment in relation thereto.
goodwill and indefinite life intangible assets
Goodwill is tested for impairment at the reporting unit level, which
is either at the operating segment level or one level below, at least
annually and more frequently if there are indications of impairment,
using a two-step process that begins with an estimation of the fair
value of the reporting unit. under the first step, the fair value of the
reporting unit, which is calculated based on assumptions such as
discounted cash flow projections, is compared with its carrying
amount (including goodwill). under the second step, an impairment
loss is recognized for any excess of the carrying amount of the
reporting unit’s goodwill over the implied fair value of the goodwill.
The determinants used for the fair value measurement include man-
agement’s estimate of the reporting unit’s continuing ability to gener-
ate income from operations and cash flows in future periods, and
the strategic significance of the reporting unit to NTT’s business
objectives. If an entity concludes that it is not more likely than not
that the fair value of a reporting unit is less than its carrying amount,
it would not be required to perform the two-step impairment test for
that reporting unit. Intangible assets with indefinite lives are not
amortized and are tested for impairment at least once a year. NTT
Group measures fair value based on certain assumptions that are
determined to be currently reasonable. However, actual values may
differ from those stated in the consolidated financial statements if
unexpected changes occur in the business operation environment in
the future. NTT Group’s total “Goodwill and other intangible asset
impairments” in the fiscal years ended March 31, 2011, 2012 and
2013 were ¥2.8 billion, ¥5.5 billion and ¥31.3 billion, respectively. As
of March 31, 2013, out of the material reporting units, the carrying
amounts of goodwill attributable to Dimension Data in the long dis-
tance and international communications business segment and the
Contractual obligations
The following table summarizes NTT Group’s existing contractual obligations as of March 31, 2013:
Millions of yen
Payments Due by Period
Total 1 year or lessAfter 1 year
through 3 yearsAfter 3 years
through 5 years After 5 years
Contractual Obligations
Long-term debt (1)
Bonds ¥2,053,135 ¥ 342,182 ¥414,800 ¥618,674 ¥ 677,479
Bank loans 1,884,800 361,122 367,591 277,862 878,225
Interest payments on long-term debt 296,997 52,276 80,601 63,136 100,984
Capital lease obligations (2) 65,207 19,661 26,715 11,602 7,229
Operating leases 83,757 20,936 28,540 17,270 17,011
Purchase obligations (3) 391,421 346,677 39,673 2,533 2,538
Other long-term obligations (4) — — — — —
Total contractual obligations ¥4,775,317 ¥1,142,854 ¥957,920 ¥991,077 ¥1,683,466
(1) See Note 9 to the Consolidated Financial Statements for details. (2) Capital lease obligations include interest. (3) Purchase obligations include outstanding commitments for the purchase of property, plant and equipment and other assets. (4) The amount of other long-term obligations is not shown in the above table since some obligations are immaterial or the timing of payments is uncertain. In addition, NTT Group expects to
contribute a total amount of ¥46,964 million to its pension plans in the fiscal year ending March 31, 2014 (see Note 10 to the Consolidated Financial Statements).
As of March 31, 2013, NTT Group had outstanding commitments for the purchase of property, plant and equipment and other assets of
approximately ¥391.4 billion. NTT Group expects to fund such commitments with cash provided by operating activities.

Ope
ratin
g an
d Fi
nanc
ial R
evie
w a
nd P
rosp
ects
operating and Financial Review and Prospects
NIP
PO
N T
ELE
GR
AP
H A
ND
TE
LEP
HO
NE
CO
RP
OR
AT
ION
A
NN
uA
L R
EP
OR
T 2
01
3
082
NIP
PO
N T
ELE
GR
AP
H A
ND
TE
LEP
HO
NE
CO
RP
OR
AT
ION
A
NN
uA
L R
EP
OR
T 2
01
3
083
carrying amounts of goodwill attributable to Global Business in the
data communications business segment was ¥174.5 billion and
¥162.4 billion, respectively. As a result of the annual impairment test
conducted for the fiscal year ended March 31, 2013, the fair value of
the reporting unit attributable to Dimension Data in the long distance
and international communications business segment and the fair
value of the reporting unit attributable to Global Business in the data
communications business segment exceeded their carrying amounts
by 9.7% and 12.7%, respectively. NTT Group considered the Great
East Japan Earthquake as a triggering event necessitating a review
for impairment losses. As a result of the review, NTT Group deter-
mined that it was not necessary to record any impairment losses
on goodwill and indefinite life intangible assets in relation thereto.
investments
NTT Group holds investments in other companies, which NTT
Group accounts for under the cost method, equity method or at fair
value. NTT Group recognizes an impairment loss when the decline
in value below the carrying amount of the investment is other than
temporary, which then establishes a new cost basis in the invest-
ment. When determining if the decline in value is other than tempo-
rary, NTT Group considers, among other items, the magnitude of
the decline in value below carrying amounts, the length of time the
value has been below the carrying amounts, the financial condition
of the investee company, the strength of the industry in which it
operates, and NTT Group’s ability or intent to retain the investment.
NTT Group performs a review for impairment whenever events or
changes in circumstances indicate that the carrying amount of an
investment may not be recoverable. Further, NTT Group utilizes a
variety of information, including cash flow projections, independent
valuations and, if applicable, stock price analyses, in performing its
evaluations. Such projections and valuations necessarily require
estimates involving, among others, demographics (e.g., population,
penetration rates and penetration speed, churn rates, etc.), technol-
ogy changes, capital investments, market growth and share, ARPu
and terminal values. NTT Group’s total impairment loss for “Market-
able securities and other investments” in the fiscal years ended
March 31, 2011, 2012 and 2013 was approximately ¥19.0 billion,
¥4.0 billion and ¥11.0 billion, respectively. NTT Group reviews fac-
tors such as the financial condition and near-term prospects of
those investees in order to determine if the value of any of its invest-
ments in them have suffered a decline that was other than tempo-
rary due to the recent economic and financial environment
surrounding the industry of those equity method investees. During
the fiscal year ended March 31, 2013, estimated future cash flows
of some equity method investees, which were supported by the
historical operating results and NTT Group’s most recent views of
the long term outlook, changed significantly downward, and the
impairment charges for “Investments in affiliates” for the fiscal year
ended March 31, 2013 were ¥25.9 billion, which include impairment
of NTT Group’s investment in Tata Teleservices Limited. In the past,
NTT Group experienced material impairments in the value of its
investments in equity method affiliates that were included in “Equity
in earnings (losses) of affiliated companies” in its consolidated state-
ments of income and comprehensive income for relevant years. NTT
Group may experience similar impairments with respect to “Market-
able securities and other investments” and “Investments in affiliated
companies” again in the future. NTT Group may also experience
material gains or losses on the sale of investments.
employees’ retirement benefits
The total costs of employees’ retirement benefits and pension
plans represented approximately 1.6% and 1.6% of NTT Group’s
total operating expenses for the fiscal years ended March 31, 2012
and 2013, respectively. The amounts recognized in the consolidated
financial statements related to employees’ retirement benefits and
pension plans are determined on an actuarial basis, which utilizes
certain assumptions in the calculation of such amounts. The
assumptions used in determining net periodic costs and liabilities for
retirement benefits and pension plans include the expected long-
term rate of return on plan assets, a discount rate, the rate of
increase in compensation levels, average remaining years of service,
and other factors. Specifically, the expected long-term rate of return
on assets and the discount rate are two critical assumptions.
Assumptions are evaluated at least annually, and events may occur
or circumstances change that may have a significant effect on the
critical assumptions. In accordance with accounting principles gen-
erally accepted in the united States, actual results that differ from
the assumptions are accumulated and amortized over future peri-
ods, thereby reducing the year-to-year volatility in pension expenses.
As of March 31, 2013, the total amount of net actuarial loss was
¥481.5 billion. The net actuarial loss exceeding 10% of the greater
of the projected benefit obligation or the fair value of plan assets will
be amortized over the average remaining years of employee service
(approximately 10 years). That amortization will increase future pen-
sion costs.
NTT Group used an expected long-term rate of return on pen-
sion plan assets of 2.0% to 2.5% for the fiscal years ended March
31, 2012 and March 31, 2013. In determining the expected long-
term rate of return on pension plan assets, NTT considers the cur-
rent and projected asset allocations, as well as expected long-term
investment returns and risks for each category of plan assets based
on NTT’s analysis of historical results. The projected allocation of
plan assets is developed in consideration of the expected long-term
investment returns for each category of plan assets. For lump-sum
retirement allowances and for the contract-type corporate pension
plan, approximately 53.0%, 13.0%, 10.0%, 10.0% and 14.0% of the
plan assets will be allocated to domestic bonds, domestic stocks,
international bonds, international stocks and life insurance company
general accounts, respectively, and for the NTT Corporate Defined
Benefit Pension Plan, approximately 47.7%, 20.9%, 10.0%, 14.4%
and 7.0% (weighted-average) of plan assets will be allocated to
domestic bonds, domestic stocks, international bonds, international
stocks and life insurance company general accounts, respectively,
to moderate the level of volatility in pension plan asset returns and
reduce risks. As of March 31, 2013, the actual allocations of assets
were generally consistent with the projected allocations stated
above. The actual returns for the fiscal years ended March 31, 2012
and 2013 were approximately 2.0% and 11.0%, respectively. The
actual returns on pension plan assets may vary in future periods,
depending on market conditions. The market value of plan assets is
measured using fair values on the plan measurement date.
Another critical assumption is the discount rate used in the
annual actuarial valuation of net periodic costs and benefit obliga-
tions. In determining the net periodic costs, NTT Group used a dis-
count rate of 2.0% as of March 31, 2012 and 1.9% as of March 31,
2013. In determining the benefit obligations, NTT Group used a
discount rate of 1.9% as of March 31, 2012 and 1.5% as of March
31, 2013. In determining the appropriate discount rate, NTT consid-
ers available information about the current yield on high-quality
fixed-income investments with maturities corresponding to the
expected duration of the pension benefit obligations (“PBO”).
The following table illustrates the sensitivity to changes in the discount rate and the expected return on pension plan assets, while holding
all other assumptions constant, for NTT Group’s pension plans as of March 31, 2013:
Billions of yen
Change in Assumption Change in PBO
Change in Pre-Tax Pension
ExpensesChange in Equity
(Net of Tax)
50basispointincrease/decreaseindiscountrate –/+210.0 +/–4.0 +/–130.0
50basispointincrease/decreaseinexpectedreturnonassets — –/+10.0 —
income taxes
NTT Group recognizes deferred tax assets and liabilities for the
expected future tax consequences attributable to temporary differ-
ences between the financial statement carrying amounts and the tax
bases of assets or liabilities and operating loss carryforwards.
Deferred tax assets and liabilities are measured using enacted tax
rates that are expected to be applicable during the periods in which
existing temporary differences reverse and loss carryforwards are
utilizable. The effect on deferred tax assets and liabilities of a change
in tax rates is recognized in income tax expenses in the period that
includes the enactment date. “The Act to Amend Sections of the
Income Tax Act for Tax Reform in Accordance with Changes to the
Economic Social Structure” and “The Act on Special Measures for
Reconstruction and Rehabilitation in Response to the Great East
Japan Earthquake” were enacted on November 30, 2011. Income
tax rates were adjusted for consolidated accounting periods that
began on or after April 1, 2012. As a result of this change in tax rate,
net deferred tax assets existing on the enactment date decreased
¥89.9 billion, and these adjustments are included in “Income tax
expense(benefit)–Deferred”intheconsolidatedstatementsof
income for the fiscal year ended March 31, 2012. Net income attrib-
utable to NTT decreased ¥80.2 billion for the fiscal year ended
March 31, 2012. NTT Group recognizes a valuation allowance on
deferred tax assets to reflect the amount of future tax benefits that
are not expected to be realized. In determining the appropriate valu-
ation allowance, NTT Group takes into account the level of expected
future taxable income and available tax planning strategies. If future
taxable income is lower than expected or if expected tax-planning
strategies are not available as anticipated, NTT Group may recog-
nize an additional valuation allowance through income tax expense
in the period in which such judgment is made.
As of March 31, 2012 and 2013, NTT Group had gross deferred
tax assets of ¥1,567.1 billion and ¥1,541.9 billion, which included a
valuation allowance of ¥242.2 billion and ¥253.7 billion, respectively.
The valuation allowance mainly related to deferred tax assets of NTT
and certain subsidiaries with operating loss carryforwards for tax
purposes that are not expected to be realized. The change in the
valuation allowance did not have a material impact on income tax
expense and reflected the write-off of deferred tax assets that
expired unused.
accrued liabilities for point programs
NTT Group offers mobile phone services subscribers “points”
based on the usage of mobile, FLET’S Hikari and other services.
Points may be exchanged for benefits, including discounts on hand-
sets. NTT Group records “Accrued liabilities for point programs”
relating to the points that customers earn. The aggregate total
amount of accrued liabilities for point programs recognized as short-
term and long-term liabilities as of March 31, 2012 and 2013 was
¥197.7 billion and ¥160.0 billion, respectively. Point program
expenses for the years ended March 31, 2011, 2012 and 2013 were
¥136.8 billion, ¥103.6 billion and ¥81.8 billion, respectively.
In determining the accrued liabilities for point programs, NTT
Group estimates such factors as the point utilization rate, taking into
account the forfeitures caused by, among other things, expected
future subscription cancellations. Higher than estimated point utiliza-
tion rates could result in the need to recognize additional expenses
or accrued liabilities in the future.
In determining the accrued liabilities for point programs, NTT
Group estimates that as of March 31, 2013, a one-percent increase
in the point utilization rate would result in an additional liability accrual
of approximately ¥1.5 billion, if all other factors are held constant.

Con
solid
ated
Bal
ance
She
ets
Consolidated balance SheetsNippon Telegraph and Telephone Corporation and its subsidiariesMarch 31
Millions of yen
2012 2013
aSSetS
Current assets (Note 2):
Cash and cash equivalents (Notes 4 and 7) ¥ 1,020,143 ¥ 961,433
Short-term investments (Note 7) 306,921 53,753
Notes and accounts receivable, trade (Note 3) 2,287,986 2,428,099
Allowance for doubtful accounts (Note 21) (48,356) (44,961)
Accounts receivable, other 277,277 357,255
Inventories (Note 5) 329,373 350,721
Prepaid expenses and other current assets (Note 20) 315,566 338,794
Deferred income taxes (Note 11) 223,021 224,194
Total current assets 4,711,931 4,669,288
Property, plant and equipment (Notes 2 and 16):
Telecommunications equipment 14,425,252 13,432,047
Telecommunications service lines 14,830,873 15,143,239
Buildings and structures 5,915,743 5,993,215
Machinery, vessels and tools 1,820,648 1,868,972
Land 1,133,077 1,139,636
Construction in progress 363,201 334,326
38,488,794 37,911,435
Accumulated depreciation (28,682,438) (28,134,748)
Net property, plant and equipment 9,806,356 9,776,687
investments and other assets (Note 2):
Investments in affiliated companies (Note 6) 543,273 411,371
Marketable securities and other investments (Note 7) 295,254 660,823
Goodwill (Notes 8 and 23) 771,420 824,216
Software (Note 8) 1,344,356 1,340,682
Other intangible assets (Notes 8 and 23) 263,964 278,272
Other assets (Notes 10 and 20) 863,852 997,989
Deferred income taxes (Note 11) 789,293 694,361
Total investments and other assets 4,871,412 5,207,714
Total assets ¥ 19,389,699 ¥ 19,653,689
The accompanying notes are an integral part of these financial statements.
Millions of yen
2012 2013
liabilitieS anD equitY
Current liabilities (Note 2):
Short-term borrowings (Note 9) ¥ 83,507 ¥ 77,455
Current portion of long-term debt (Notes 9 and 20) 656,963 703,304
Accounts payable, trade (Note 3) 1,482,594 1,436,643
Current portion of obligations under capital leases (Note 16) 18,709 16,368
Accrued payroll 476,442 437,609
Accrued interest 9,832 8,971
Accrued taxes on income 198,281 228,736
Accrued consumption tax 46,255 54,667
Advances received 189,007 183,723
Other (Notes 11 and 20) 332,663 351,913
Total current liabilities 3,494,253 3,499,389
long-term liabilities (Note 2):
Long-term debt (excluding current portion) (Notes 9 and 20) 3,509,820 3,234,631
Obligations under capital leases (excluding current portion) (Note 16) 36,919 36,254
Liability for employees’ retirement benefits (Note 10) 1,534,885 1,505,571
Accrued liabilities for point programs 187,432 156,233
Deferred income taxes (Note 11) 169,591 198,824
Other (Note 20) 409,070 396,162
Total long-term liabilities 5,847,717 5,527,675
equity (Note 13):
Nippon Telegraph and Telephone Corporation (“NTT”) shareholders’ equity
Common stock, no par value—
Authorized—6,192,920,900 shares in 2012 and 2013
Issued—1,323,197,235 shares in 2012 and 2013 937,950 937,950
Additional paid-in capital (Note 18) 2,832,165 2,827,612
Retained earnings (Notes 6 and 13) 4,888,746 5,229,407
Accumulated other comprehensive income (loss) (Notes 7, 10, 13 and 20) (357,843) (107,476)
Treasury stock, at cost (Note 13)—
99,431,812 shares in 2012 and 137,822,603 shares in 2013 (418,431) (568,459)
Total NTT shareholders’ equity 7,882,587 8,319,034
Noncontrolling interests 2,165,142 2,307,591
Total equity 10,047,729 10,626,625
Commitments and contingent liabilities (Note 22)
Total liabilities and equity ¥19,389,699 ¥19,653,689
The accompanying notes are an integral part of these financial statements.
NIP
PO
N T
ELE
GR
AP
H A
ND
TE
LEP
HO
NE
CO
RP
OR
AT
ION
A
NN
uA
L R
EP
OR
T 2
01
3
084
NIP
PO
N T
ELE
GR
AP
H A
ND
TE
LEP
HO
NE
CO
RP
OR
AT
ION
A
NN
uA
L R
EP
OR
T 2
01
3
085

Consolidated Statements of income and Consolidated Statements of Comprehensive income
Nippon Telegraph and Telephone Corporation and its subsidiariesYear ended March 31
Consolidated Statements of Changes in equityNippon Telegraph and Telephone Corporation and its subsidiariesYear ended March 31
Consolidated Statements of incomeMillions of yen
2011 2012 2013
operating revenues (Note 3):
Fixed voice related services ¥ 2,180,778 ¥ 1,949,557 ¥ 1,769,416
Mobile voice related services 2,021,579 1,870,064 1,701,070
IP/packetcommunicationsservices 3,341,112 3,602,541 3,779,284
Sale of telecommunication equipment 565,874 580,900 844,883
System integration 1,382,195 1,776,941 1,824,617
Other 813,465 727,359 781,470
10,305,003 10,507,362 10,700,740
operating expenses (Notes 3, 15 and 17):
Cost of services (excluding items shown separately below) 2,458,029 2,379,388 2,461,393
Cost of equipment sold (Note 2) (excluding items shown separately below) 760,832 787,681 864,251
Cost of system integration (excluding items shown separately below) 915,018 1,209,870 1,244,538
Depreciation and amortization (Note 8) 1,962,534 1,910,698 1,899,245
Impairment losses 1,094 9,555 5,416
Selling, general and administrative expenses (Notes 17 and 23) 2,989,814 2,981,734 2,992,588
Goodwill and other intangible assets impairments (Note 8) 2,773 5,470 31,341
9,090,094 9,284,396 9,498,772
operating income 1,214,909 1,222,966 1,201,968
other income (expenses):
Interest and amortization of bond discounts and issue costs (Note 2) (55,267) (56,326) (54,339)
Interest income 21,600 19,298 17,638
Other, net (Notes 19 and 20) (5,445) 53,392 35,832
(39,112) 16,364 (869)
i ncome before income taxes and equity in earnings (losses) of affiliated companies 1,175,797 1,239,330 1,201,099
income tax expense (benefit) (Note 11):
Current 448,813 451,222 461,496
Deferred 26,779 136,571 19,733
475,592 587,793 481,229
income before equity in earnings (losses) of affiliated companies 700,205 651,537 719,870
Equity in earnings (losses) of affiliated companies (Notes 6 and 15) 1,670 (2,986) (10,131)
net income 701,875 648,551 709,739
Less—Net income attributable to noncontrolling interests 192,246 180,850 185,668
net income attributable to ntt ¥ 509,629 ¥ 467,701 ¥ 524,071
Share or yen
2011 2012 2013
Per share of common stock:
Weighted average number of shares outstanding (shares) 1,323,173,389 1,275,519,400 1,211,880,769
Net income attributable to NTT (yen) ¥385.16 ¥366.67 ¥432.44
Cash dividends to be paid to shareholders of record date (yen) ¥120.00 ¥140.00 ¥160.00
Consolidated Statements of Comprehensive incomeMillions of yen
2011 2012 2013
Net income ¥ 701,875 ¥648,551 ¥ 709,739
Other comprehensive income (loss), net of tax
unrealized gain (loss) on securities (6,291) 8,238 146,849
unrealized gain (loss) on derivative instruments (1,533) (2,231) (4,756)
Foreign currency translation adjustments (44,116) (69,369) 114,739
Pension liability adjustments (80,503) (8,542) 36,458
Total other comprehensive income (loss) (132,443) (71,904) 293,290
total comprehensive income (loss) 569,432 576,647 1,003,029
Less—Comprehensive income attributable to noncontrolling interests 173,905 163,081 228,591
total comprehensive income (loss) attributable to ntt ¥ 395,527 ¥413,566 ¥ 774,438
The accompanying notes are an integral part of these financial statements.
Millions of yen
NTT shareholders’ equity
Common
stock
Additional paid-in capital
(Note 18)
Retained earnings (Notes 6 and 13)
Accumulatedcomprehensive
income (loss) (Notes 7, 10,
13 and 20)
Treasury stock, at cost
(Note 13) TotalNoncontrolling
interestsTotal Equity
(Note 13)
Year ended march 31, 2011At beginning of year ¥937,950 ¥2,838,927 ¥5,406,726 ¥(189,606) ¥(1,205,844) ¥7,788,153 ¥1,982,726 ¥ 9,770,879 Comprehensive income (loss): Net income 509,629 509,629 192,246 701,875 Other comprehensive income (loss): unrealized gain (loss) on securities (4,155) (4,155) (2,136) (6,291) u nrealized gain (loss) on derivative
instruments (1,643) (1,643) 110 (1,533) F oreign currency translation
adjustments (32,770) (32,770) (11,346) (44,116) Pension liability adjustments (75,534) (75,534) (4,969) (80,503) Total other comprehensive income (loss) (114,102) (18,341) (132,443) Total comprehensive income (loss) 395,527 173,905 569,432 Cash dividends (158,783) (158,783) (86,063) (244,846) C hanges in NTT’s ownership interest in
subsidiaries (3,929) (3,929) (10,370) (14,299) Acquisition of treasury stock (417) (417) (417) Resale of treasury stock (53) 236 183 183 Cancellation of treasury stock (916) (601,976) 602,892 — —At end of year ¥937,950 ¥2,834,029 ¥5,155,596 ¥(303,708) ¥ (603,133) ¥8,020,734 ¥2,060,198 ¥10,080,932Year ended march 31, 2012At beginning of year ¥937,950 ¥2,834,029 ¥5,155,596 ¥(303,708) ¥ (603,133) ¥8,020,734 ¥2,060,198 ¥10,080,932 Comprehensive income (loss): Net income 467,701 467,701 180,850 648,551 Other comprehensive income (loss): unrealized gain (loss) on securities 6,626 6,626 1,612 8,238 u nrealized gain (loss) on derivative
instruments (935) (935) (1,296) (2,231) F oreign currency translation
adjustments (54,924) (54,924) (14,445) (69,369) Pension liability adjustments (4,902) (4,902) (3,640) (8,542) Total other comprehensive income (loss) (54,135) (17,769) (71,904) Total comprehensive income (loss) 413,566 163,081 576,647 Cash dividends (167,980) (167,980) (87,440) (255,420) C hanges in NTT’s ownership interest in
subsidiaries (1,864) (1,864) 29,303 27,439 Acquisition of treasury stock (381,978) (381,978) (381,978) Resale of treasury stock (20) 129 109 109 Cancellation of treasury stock (566,551) 566,551 — —At end of year ¥937,950 ¥2,832,165 ¥4,888,746 ¥(357,843) ¥ (418,431) ¥7,882,587 ¥2,165,142 ¥10,047,729Year ended march 31, 2013At beginning of year ¥937,950 ¥2,832,165 ¥4,888,746 ¥(357,843) ¥ (418,431) ¥7,882,587 ¥2,165,142 ¥10,047,729 Comprehensive income (loss): Net income 524,071 524,071 185,668 709,739 Other comprehensive income (loss): unrealized gain (loss) on securities 118,689 118,689 28,160 146,849 u nrealized gain (loss) on derivative
instruments (687) (687) (4,069) (4,756) F oreign currency translation
adjustments 92,840 92,840 21,899 114,739 Pension liability adjustments 39,525 39,525 (3,067) 36,458 T otal other comprehensive income (loss) 250,367 42,923 293,290 Total comprehensive income (loss) 774,438 228,591 1,003,029 Cash dividends (183,405) (183,405) (92,012) (275,417) C hanges in NTT’s ownership interest in
subsidiaries (4,553) (4,553) 5,870 1,317 Acquisition of treasury stock (150,066) (150,066) (150,066) Resale of treasury stock (5) 38 33 33 Cancellation of treasury stock — —At end of year ¥937,950 ¥2,827,612 ¥5,229,407 ¥(107,476) ¥ (568,459) ¥8,319,034 ¥2,307,591 ¥10,626,625
The accompanying notes are an integral part of these financial statements.
Con
solid
ated
Sta
tem
ents
of I
ncom
e an
d C
onso
lidat
ed S
tate
men
ts o
f Com
preh
ensiveIn
come/Con
solidated
Statemen
tsofC
hang
esinEqu
ity
NIP
PO
N T
ELE
GR
AP
H A
ND
TE
LEP
HO
NE
CO
RP
OR
AT
ION
A
NN
uA
L R
EP
OR
T 2
01
3
086
NIP
PO
N T
ELE
GR
AP
H A
ND
TE
LEP
HO
NE
CO
RP
OR
AT
ION
A
NN
uA
L R
EP
OR
T 2
01
3
087

Consolidated Statements of Cash FlowsNippon Telegraph and Telephone Corporation and its subsidiariesYear ended March 31
notes to Consolidated Financial StatementsNippon Telegraph and Telephone Corporation and its subsidiaries
Nippon Telegraph and Telephone Corporation (“NTT”) and its
subsidiaries (collectively with NTT, “NTT Group”) conduct the follow-
ing main business activities: regional communications (domestic
intra-prefectural communication services and incidental services),
principally operated by Nippon Telegraph and Telephone East Cor-
poration (“NTT East”) and Nippon Telegraph and Telephone West
Corporation (“NTT West”); long-distance and international communi-
cations (domestic inter-prefectural communication services, interna-
tional communication services, solution services and related
services), principally operated by NTT Communications Corporation
(“NTT Communications”); mobile communications (mobile phone
services and related services), principally operated by NTT
DOCOMO, Inc. (“NTT DOCOMO”); and data communications (sys-
tem integration, network system services, etc.), principally operated
by NTT DATA CORPORATION (“NTT DATA”). NTT’s mobile commu-
nications business terminated mova services on March 31, 2012.
Pursuant to the Nippon Telegraph and Telephone Corporation
Act (“NTT Law”) as approved by the Japanese Diet, NTT was incor-
porated on April 1, 1985, upon which all the assets and liabilities of
Nippon Telegraph and Telephone Public Corporation (“Public Corpo-
ration”) were transferred to NTT. As provided for in the supplemen-
tary provisions of the NTT Law, all the new shares held by Public
Corporation were transferred to the Japanese Government upon the
dissolution of Public Corporation on April 1, 1985. The NTT Law
specifies, however, that such government ownership may eventually
be reduced to one-third. Since NTT’s incorporation, the Japanese
Government has sold NTT’s common stock to the public. As a nor-
mal part of its business operations, NTT provides various telecom-
munications and other services to the Japanese Government.
In December 2000, NTT issued new shares in a public offering.
These shares are not included in the total number of issued shares
when calculating the percentage of Government-owned shares by
special provisions regarding the method for calculating the total
number of issued shares of NTT (NTT Law, Supplementary Provi-
sions, Article 13). The total number of Government-owned shares
includes shares which are unregistered because of a failure in the
transfer of title and such shares are therefore not actually owned by
the Government. These shares are nominally owned by the Govern-
ment but excluded from the total number of shares owned by the
Government when calculating the percentage of Government-
owned shares. The Japanese Government’s ownership ratio of
NTT’s issued stock was 32.6% as of March 31, 2013. However,
taking these conditions into account, the percentage of Govern-
ment-owned shares is 33.3%.
The accompanying consolidated financial statements are pre-
pared and presented in accordance with accounting principles gen-
erally accepted in the united States of America.
Significant accounting policies are as follows:
(1) application of new accounting Standards Presentation of Comprehensive income
Effective April 1, 2012, NTT Group adopted Accounting Stan-
dards update (“ASu”) 2011-05 “Presentation of Comprehensive
Income.” This ASu requires comprehensive income to be reported
in either a single continuous statement or in two separate but con-
secutive statements reporting net income and other comprehensive
income. In adopting the ASu, NTT Group implemented the two
statement approach which has been applied retrospectively for all
periods presented.
(2) Principal accounting Policies basis of Consolidation and accounting for investments
in affiliated Companies—
The consolidated financial statements include the accounts of
NTT, its subsidiaries, and variable interest entities (“VIEs”). All signifi-
cant intercompany transactions and accounts are eliminated in
consolidation.
The fiscal years of certain foreign subsidiaries end on December
31, however any significant subsequent transactions for the period
from January 1 to March 31 are reflected in the results of operations
of NTT Group.
Investments in affiliated companies where NTT Group has the
ability to exercise significant influence over the affiliated companies,
but does not have a controlling financial interest, are accounted for
under the equity method. NTT evaluates its investments in affiliates
for impairment due to declines in value considered to be other than
temporary. In performing its evaluations, NTT utilizes various infor-
mation, as available, including cash flow projections, independent
valuations and, if applicable, stock price analysis. In the event of a
determination that a decline in value is other than temporary, a
charge to earnings is recorded for the loss and a new cost basis in
the investment is established.
use of estimates—
The preparation of NTT’s consolidated financial statements in
conformity with accounting principles generally accepted in the
united States of America requires management to make estimates
and assumptions that affect the reported amounts of assets and
liabilities and disclosure of contingent assets and liabilities at the
date of the consolidated financial statements and the reported
1. natuRe oF oPeRationS:
2. SummaRY oF SigniFiCant aCCounting PoliCieS:
Millions of yen
2011 2012 2013
Cash flows from operating activities:
Net income ¥ 701,875 ¥ 648,551 ¥ 709,739
Adjustments to reconcile net income to net cash provided by operating activities—
Depreciation and amortization (Note 8) 1,962,534 1,910,698 1,899,245
Impairment losses 1,094 9,555 5,416
Deferred taxes (Note 11) 26,779 136,571 19,733
Goodwill and other intangible assets impairments (Note 8) 2,773 5,470 31,341
Loss on disposal of property, plant and equipment 104,730 85,452 106,215
Gains on sales of property, plant and equipment (4,716) (31,083) (18,469)
Equity in (earnings) losses of affiliated companies (Note 6) (1,670) 2,986 10,131
(Increase) decrease in notes and accounts receivable, trade 24,299 (175,606) (119,381)
(Increase) decrease in inventories (Note 5) (11,745) (13,353) (2,139)
(Increase) decrease in other current assets (53,605) (9,877) (90,565)
Increase (decrease) in accounts payable, trade and accrued payroll (28,533) 23,499 (81,297)
Increase (decrease) in accrued consumption tax 512 7,975 7,236
Increase (decrease) in accrued interest 841 (973) (1,089)
Increase (decrease) in advances received 26,392 (17,330) (9,770)
Increase (decrease) in accrued taxes on income (56,536) (10,883) 28,449
Increase (decrease) in other current liabilities (12,355) 17,873 4,489
Increase (decrease) in liability for employees’ retirement benefits (32,312) (19,382) 26,476
Increase (decrease) in other long-term liabilities 68,856 (36,923) (50,234)
Other 111,659 (24,921) (21,844)
Net cash provided by operating activities 2,830,872 2,508,299 2,453,682
Cash flows from investing activities:
Payments for property, plant and equipment (1,410,827) (1,395,087) (1,538,115)
Payments for acquisitions of intangible assets (484,159) (458,176) (446,588)
Proceeds from sale of property, plant and equipment 13,445 64,789 38,929
Payments for purchase of non-current investments (43,017) (59,400) (35,309)
Proceeds from sale and redemption of non-current investments 23,921 14,756 19,812
Acquisitions of subsidiaries, net of cash acquired (382,780) (47,632) (38,490)
Payments for purchase of short-term investments (768,594) (1,181,657) (682,359)
Proceeds from redemption of short-term investments 988,780 1,048,024 936,211
Other 11,019 43,137 (30,344)
Net cash used in investing activities (2,052,212) (1,971,246) (1,776,253)
Cash flows from financing activities:
Proceeds from issuance of long-term debt (Note 9) 801,185 680,055 402,271
Payments for settlement of long-term debt (Note 9) (782,512) (719,232) (675,295)
Proceeds from issuance of short-term debt (Note 9) 2,554,569 1,261,125 3,015,099
Payments for settlement of short-term debt (Note 9) (2,524,709) (1,520,909) (3,029,279)
Dividends paid (158,783) (167,980) (183,405)
Proceeds from sale of (payments for acquisition of) treasury stock, net (Note 13) (234) (381,869) (150,033)
Acquisition of treasury stocks by subsidiary (Note 18) (30,092) (2,914) (15,558)
Other (109,002) (96,334) (108,981)
Net cash used in financing activities (249,578) (948,058) (745,181)
Effect of exchange rate changes on cash and cash equivalents (4,986) (4,010) 9,042
Net increase (decrease) in cash and cash equivalents 524,096 (415,015) (58,710)
Cash and cash equivalents at beginning of year 911,062 1,435,158 1,020,143
Cash and cash equivalents at end of year (Note 4) ¥ 1,435,158 ¥ 1,020,143 ¥ 961,433
Cash paid during the year for:
Interest ¥ 54,483 ¥ 58,683 ¥ 55,200
Income taxes, net 519,205 449,405 433,344
noncash investing and financing activities:
Capital lease obligations incurred during the year 21,969 20,299 24,022
Cancellation of treasury stock (Note 13) ¥ 602,892 ¥ 566,551 ¥ —
The accompanying notes are an integral part of these financial statements.
Con
solidated
StatementsofC
ashFlow
s/
Not
es to
Con
solid
ated
Fin
anci
al S
tate
men
ts
NIP
PO
N T
ELE
GR
AP
H A
ND
TE
LEP
HO
NE
CO
RP
OR
AT
ION
A
NN
uA
L R
EP
OR
T 2
01
3
088
NIP
PO
N T
ELE
GR
AP
H A
ND
TE
LEP
HO
NE
CO
RP
OR
AT
ION
A
NN
uA
L R
EP
OR
T 2
01
3
089

Not
es to
Con
solid
ated
Fin
anci
al S
tate
men
ts
amounts of revenues and expenses during the reporting period.
Actual results could differ from those estimates. Significant items
subject to such estimates and assumptions include revenue recog-
nition, estimated useful lives and recovery of the carrying amount of
property, plant and equipment, software and certain other intangible
assets, goodwill, investments, employees’ retirement benefit obliga-
tions, income tax uncertainties and realizability of deferred tax assets
and accrued liabilities for point programs.
Revenue Recognition—
Revenues arising from fixed voice related services, mobile voice
relatedservices,IP/packetcommunicationsservicesandotherser-
vices are recognized at the time these services are provided to cus-
tomers. With regard to revenues from mobile voice related services
andIP/packetcommunicationsservices,monthlybillingplansfor
cellular (FOMA (3G wireless services) and mova (2G wireless ser-
vices, which were terminated on March 31, 2012)) services generally
includeacertainamountofallowances(freeminutesand/orpack-
ets), and the used amount of the allowances is subtracted from total
usage in calculating the airtime revenue from a subscriber for the
month. NTT Group introduced a billing arrangement, called “Nikag-
etsu Kurikoshi” (two-month carry over), in which the unused allow-
ances are automatically carried over up to the following two months.
In addition, NTT Group then introduced an arrangement which
enables the unused allowances that were carried over for two
monthstobeautomaticallyusedtocovertheairtimeand/orpacket
fees exceeding the allowances of the other subscriptions in the
“Family Discount” group, a discount billing arrangement for families
with between two and ten subscriptions. Out of the unused allow-
ance in a month, NTT Group defers the revenues based on the por-
tion which is estimated to be used in the following two months. As
for the portion which is estimated to expire, NTT Group recognizes
the revenue attributable to such portion of allowances ratably as the
remaining allowances are utilized, in addition to the revenue recog-
nized when subscribers make calls or utilize data transmissions.
Non-recurring upfront fees such as activation fees are deferred
and recognized as revenues over the estimated average period of
the subscription for each service. The related direct costs are
deferred only to the extent of the non-recurring upfront fee amount
and are amortized over the same period.
Revenues for expected future usage of telephone cards issued
by NTT Group are deferred and are recognized as revenue as of the
time they are actually used. The amount of the expected future
usage is estimated based on past records of use and experience.
Sales of telecommunication equipment are recognized as
income upon delivery of the equipment to purchasers, primarily
agent resellers, when title to the product, and the risk and rewards
of ownership have been substantially transferred. Certain commis-
sions paid to purchasers, primarily agent resellers, are recognized as
a reduction of sales of telecommunication equipment.
With regard to sales of telecommunication equipment in the
mobile communications business, NTT Group enables subscribers
to select installment payments over a period of 12 or 24 months.
When installment payments are selected, under an agreement
entered into among NTT Group, the subscribers and the agent
resellers, NTT Group provides financing by providing funds to the
agent reseller for the purchase of mobile handsets by the subscriber.
NTT Group then includes the current installment for the receivable
for the purchased handset in its invoices for basic monthly charges
and airtime charges for the installment payment term. Because
equipment sales are recognized upon delivery of handsets to agent
resellers, the advance payment for the purchased handset to agent
resellers and subsequent cash collection of the installment receiv-
able for the purchased handset from subscribers do not have an
impact on our equipment sales.
Revenues from system integration services are recognized as
work on contracts progress. However, in cases where the contract
period is short and the difference in the impact on the financial posi-
tionand/orresultsofoperationsisimmaterial,orincaseswhereitis
difficult to make a reasonable estimate on the progress of the con-
tracted work, revenues are recognized upon completion of the con-
tracted services.
Provision for estimated losses on system integration projects, if
any, is made in the fiscal period in which the loss becomes evident.
Cash and Cash equivalents, Short-term investments—
Excess cash is mainly invested in time deposits, marketable
bonds of the Japanese Government or commercial paper. Those
with original maturities of three months or less are classified as “Cash
and cash equivalents” in the consolidated balance sheets. Those
with original maturities of longer than three months and remaining
maturities of 12 months or less at the end of the fiscal year are classi-
fied as “Short-term investments” in the consolidated balance sheets.
Foreign Currency translation and transactions—
All asset and liability accounts of foreign subsidiaries and affili-
ates are translated into Japanese yen at appropriate year-end
exchange rates and all income and expense accounts are translated
at rates that approximate those rates prevailing at the time of trans-
actions. The resulting translation adjustments are recognized as a
component of accumulated other comprehensive income (loss).
Foreign currency receivables and payables are re-measured at
appropriate year-end exchange rates and the resulting foreign cur-
rency transaction gains or losses are recorded as “Other, net” in the
consolidated statements of income.
NTT Group transacts limited business in foreign currencies. The
effect of exchange rate fluctuations from the initial transaction date
to the settlement date is recorded as “Other, net” in the consolidated
statements of income.
marketable Securities and other investments—
unrealized gains and losses on available-for-sale securities,
whose fair values are readily determinable, are reported as a com-
ponent of accumulated other comprehensive income (loss), net of
taxes. Equity securities whose fair values are not readily determin-
able and equity securities for which sales are restricted by contrac-
tual requirements are carried at cost. NTT Group periodically reviews
the carrying amounts of its marketable securities for impairments
that are other than temporary. If this evaluation indicates there is an
impairment that is other than temporary, the security is written down
to its estimated fair value. Debt securities designated as held-to-
maturity are carried at amortized cost and are reduced to net realiz-
able value for declines in market value unless such declines are
deemed to be temporary. Realized gains and losses, which are
determined on the average cost method, are reflected in income.
inventories—
Inventories consist of telecommunications equipment to be sold,
projects in progress, materials and supplies, which are stated at the
lower of cost or market. The cost of telecommunications equipment
to be sold and materials is determined on a first-in first-out basis.
The cost of projects in progress is mainly attributable to that of soft-
ware production for customers or that of construction of real estate
held for resale, including labor and subcontractors’ cost base. The
cost of supplies is determined by the average cost method or by the
specific identification method. Due to the rapid technological
changes associated with the wireless communications business,
NTT DOCOMO recognized losses on write-downs and disposals of
obsolete handsets during the fiscal years ended March 31, 2011,
2012 and 2013 totaling ¥9,821 million, ¥14,651 million and ¥12,662
million, respectively, which are included in “Cost of equipment sold”
in the consolidated statements of income.
Property, Plant and equipment and Depreciation—
Property, plant and equipment are stated at cost. Depreciation
is computed principally using a declining-balance method at rates
based on estimated useful lives of the assets with the exception of
buildings for which the straight-line method is generally used. With
minor exceptions, the estimated useful lives of depreciable proper-
ties (estimated economic life) are as follows:
D igital switch equipment (including wireless
telecommunications equipment) 8 to 16 years
Cables 13 to 21 years
Tubes and tunnels 50 years
Reinforced concrete buildings 42 to 56 years
Machinery, vessels and tools 3 to 26 years
Depreciation expense is computed based on the total depre-
ciable amount, which is cost, net of estimated residual value. Main-
tenance and repairs, including minor renewals and betterments, are
charged to income as incurred.
Capitalized interest—
Interest is capitalized where it relates to the construction of
property, plant and equipment over the period of construction. NTT
Group also capitalizes interest associated with the development of
internal-use software. NTT Group amortizes such capitalized interest
over the estimated useful lives of the related assets. Total interest
costs incurred were ¥58,826 million, ¥59,913 million and ¥58,267
million, of which ¥3,559 million, ¥3,587 million and ¥3,928 million
were capitalized for the fiscal years ended March 31, 2011, 2012
and 2013, respectively.
impairment of long-lived assets—
Long-lived assets to be held and used, including property, plant
and equipment, software and certain other intangible assets with finite
useful lives are reviewed for impairment whenever events or changes in
circumstances indicate that the carrying amount may not be recover-
able. If the total of the expected future undiscounted cash flows is less
than the carrying amount of the asset, the loss recognized is the
amount by which the carrying amount of the asset exceeds its fair
value as measured through various valuation techniques, including
discounted cash flow models, quoted market value and third-party
independent appraisals, as considered necessary. Assets to be dis-
posed of by sale are reported at the lower of the carrying amount or
estimated fair value less costs to sell. NTT Group considered the Great
East Japan Earthquake as a triggering event necessitating a review,
and determined that it was not necessary to record any impairment
losses on property, plant and equipment in relation thereto.
goodwill, Software and other intangible assets—
Goodwill is an asset representing the future economic benefits
arising from other assets acquired in a business combination that are
not individually identified and recognized. Goodwill is not amortized,
but tested for impairment at least annually and more frequently when
indicators of impairment are present. The goodwill impairment test is
a two-step process. under the first step, the fair value of the report-
ing unit is compared with its carrying amount (including goodwill). If
the fair value of the reporting unit is less than its carrying amount, an
indication of goodwill impairment exists for that reporting unit and
NTT Group must perform the second step of the impairment test
(measurement). Fair values of the reporting units are determined
using a discounted cash flow analysis, among other methods. under
the second step, an impairment loss is recognized for any excess of
the carrying amount of the reporting unit’s goodwill over the implied
fair value of the goodwill. The implied fair value of goodwill is deter-
mined by allocating the fair value of the reporting unit in a manner
similar to a purchase price allocation and the residual fair value after
this allocation is the implied fair value of the reporting unit goodwill. If
the fair value of the reporting unit exceeds its carrying amount, the
second step does not need to be performed.
In September 2011, the FASB issued ASu 2011-08 “Testing
Goodwill for Impairment.” This ASu permits an entity to make a
qualitative assessment before applying the two-step goodwill impair-
ment test. If an entity concludes that it is not more likely than not
that the fair value of a reporting unit is less than its carrying amount,
it would not be required to perform the two-step impairment test for
that reporting unit. NTT group adopted this guidance in 2012.
notes to Consolidated Financial Statements
NIP
PO
N T
ELE
GR
AP
H A
ND
TE
LEP
HO
NE
CO
RP
OR
AT
ION
A
NN
uA
L R
EP
OR
T 2
01
3
090
NIP
PO
N T
ELE
GR
AP
H A
ND
TE
LEP
HO
NE
CO
RP
OR
AT
ION
A
NN
uA
L R
EP
OR
T 2
01
3
091

Not
es to
Con
solid
ated
Fin
anci
al S
tate
men
ts
NTT Group considered the Great East Japan Earthquake, as a
triggering event necessitating a review, and determined that it was
not necessary to record any impairment losses on goodwill in rela-
tion thereto.
Intangible assets other than goodwill primarily consist of com-
puter software. NTT Group capitalizes the cost of internal-use soft-
ware, which has a useful life in excess of one year. Subsequent
additions, modifications or upgrades to internal-use software are
capitalized only to the extent that they allow the software to perform
a task it previously did not perform. Software maintenance and train-
ing costs are expensed in the period in which they are incurred.
Capitalized computer software costs are amortized on a straight-line
basis over a period of generally five years.
The intangible assets with indefinite lives are not amortized, but
tested for impairment on an annual basis and when indicators of
impairment are present.
income taxes—
Income taxes are accounted for under the asset and liability
method. Deferred tax assets and liabilities are recognized for the
expected future tax consequences attributable to temporary differ-
ences between the financial statement carrying amounts and the tax
bases of assets or liabilities and operating loss carryforwards.
Deferred tax assets and liabilities are measured using enacted tax
rates, which are expected to be applicable during the periods in
which existing temporary differences reverse and loss carryforwards
are utilizable. The effect on deferred tax assets and liabilities of a
change in tax rates is recognized in income in the period that
includes the enactment date. Details of such effects are described
in note 11.
A valuation allowance is recognized to reduce deferred tax assets
when it is more likely than not that a tax benefit will not be realized.
The effect of income tax positions are recognized only if those
positions are more likely than not of being sustained. Recognized
income tax positions are measured at the largest amount that is
greater than 50% likely of being realized. Changes in recognition or
measurement are reflected in the period in which the change in
judgment occurs.
Derivative Financial instruments—
NTT Group uses several types of derivative financial instruments
to manage foreign currency exchange rate and interest rate risks.
NTT Group does not use derivative instruments for trading or specu-
lative purposes.
All derivatives are recognized as either assets or liabilities in the
balance sheet at fair value and are reported in “Prepaid expenses
and other current assets,” “Other assets,” “Current liabilities—Other”
and “Long-term liabilities—Other” in the consolidated balance
sheets. Classification of each derivative as current or non-current is
based upon whether the maturity of each instrument is less than or
greater than 12 months. Changes in fair value of derivative financial
instruments are either recognized in income or shareholders’ equity
(as a component of accumulated other comprehensive income
(loss)), depending on whether the derivative financial instrument
qualifies as a hedge and the derivative is being used to hedge
changes in fair value or cash flows.
The fair values of forward exchange contracts, interest rate
swap agreements, and currency swap agreements are measured by
inputs derived principally from observable market data provided by
financial institutions.
For derivatives classified as fair value hedges, changes in the fair
value of derivatives designated and effective as fair value hedges for
recognized assets or liabilities or unrecognized firm commitments
are recognized in earnings as offsets to changes in the fair value of
the related hedged assets or liabilities.
For derivatives classified as cash flow hedges, changes in the
fair value of derivatives designated and effective as cash flow
hedges for forecasted transactions or exposures associated with
recognized assets or liabilities are initially recorded in other compre-
hensive income (loss) and reclassified into earnings when the
hedged transaction affects earnings.
From time to time, however, NTT Group may enter into deriva-
tives that economically hedge certain of its risks, even though hedge
accounting does not apply. In these cases, changes in the fair val-
ues of these derivatives are recognized in current period earnings.
NTT Group formally documents all relationships between hedging
instruments and hedged items, as well as its risk management objec-
tive and strategy for undertaking various hedging transactions. This
process includes linking all derivatives that are designated as fair value
or cash flow hedges to (1) specific assets or liabilities on the balance
sheet or (2) specific firm commitments or forecasted transactions. NTT
Group also assesses (both the hedge’s inception and on an ongoing
basis at least quarterly) whether the derivatives that are used in hedg-
ing transactions have been highly effective in offsetting changes in the
fair value or cash flows of hedged items and whether those derivatives
may be expected to remain highly effective in future periods. When it is
determined that a derivative is not highly effective as a hedge, NTT
Group discontinues hedge accounting. The amounts representing
hedges’ ineffectiveness and the component of derivative instruments’
gain or loss excluded from the assessment of hedge effectiveness are
reported as “Other, net” in the consolidated statements of income.
Cash flows from financial instruments accounted for as hedges
are classified in the consolidated statements of cash flows under the
same category as the items being hedged.
earnings per Share—
Basic earnings per share (“EPS”) is computed based on the
average number of shares outstanding during the year and is appro-
priately adjusted for any free distribution of common stock. Diluted
EPS assumes the dilution that could occur if securities or other
contracts to issue common stock were exercised or converted into
common stock or resulted in the issuance of common stock. Since
NTT did not issue dilutive securities, there is no difference between
basic EPS and diluted EPS.
variable interest entities—
NTT consolidates VIEs if NTT has both the power to direct the
activities of a VIE that most significantly impact the VIE’s economic
performance and the obligation to absorb losses of the VIE that
could potentially be significant to the VIE or the right to receive ben-
efits from the VIE that could potentially be significant to the VIE.
VIEs with assets totaling approximately ¥223 billion and ¥221
billion as of March 31, 2012 and 2013, respectively, which were
established to develop and lease real estate for rental, and VIEs with
assets totaling approximately ¥2 billion and ¥2 billion as of March
31, 2012 and 2013, respectively, which were established to lease
software, for the purpose of securitization of mainly real estate and
software, have been recognized and consolidated as VIEs in which
NTT Group is the primary beneficiary.
Assets and liabilities of VIEs established to develop and lease real estate and to lease software at March 31, 2012 and 2013 are included
in the consolidated balance sheets as follows:
Millions of yen
2012
Develop and lease real estate (1,2) Lease software
Current assets ¥ 15,644 ¥ 16
Property, plant and equipment 201,735 2,463
Investments and other assets 5,935 2
Current liabilities 3,411 129
Long-term liabilities 121,321 874
(1) Property, plant and equipment, Current liabilities and Long-term liabilities of VIEs established to develop and lease real estate included “Land” totaling ¥135,677 million, “Current portion of long-term debt” totaling ¥1,825 million and “Long-term debt” (excluding current portion) totaling ¥87,338 million, respectively.
(2) “Current portion of long-term debt” and “Long-term debt” above are secured by the Company’s land and buildings totaling ¥250,824 million.
Millions of yen
2013
Develop and lease real estate (1,2) Lease software
Current assets ¥ 20,477 ¥ 17
Property, plant and equipment 198,255 2,277
Investments and other assets 2,197 1
Current liabilities 64,243 883
Long-term liabilities 54,751 —
(1) Property, plant and equipment, Current liabilities and Long-term liabilities of VIEs established to develop and lease real estate included “Land” totaling ¥135,677 million, “Current portion of long-term debt” totaling ¥62,257 million and “Long-term debt” totaling ¥20,701 million, respectively.
(2) “Current portion of long-term debt” and “Long-term debt (excluding current portion)” above are secured by the Company’s land and buildings totaling ¥247,114 million.
There is no VIE in which NTT Group holds a significant variable interest but is not the primary beneficiary as of March 31, 2013.
asset Retirement obligations—
NTT Group’s legal obligations associated with the retirement of
tangible long-lived assets are recorded as liabilities, measured at fair
value, when those obligations are incurred if a reasonable estimate
of fair value can be made. upon initially recognizing liabilities for
asset retirement obligations, an entity must capitalize the cost by
recognizing an increase in the carrying amount of the related long-
lived assets.
NTT Group’s asset retirement obligations primarily relate to obli-
gations to restore leased land and buildings for NTT Group’s tele-
communications equipment to their original condition. NTT’s
estimates of the fair value of these liabilities and has concluded that
the amount is immaterial.
employees’ Retirement benefits—
NTT recognizes the funded status of its benefit plan, measured
as the difference between the plan assets at fair value and the
benefit obligation, in the consolidated balance sheets. Changes in
the funded status are recognized as changes in comprehensive
income (loss) during the fiscal period in which such changes occur.
Pension benefits earned during the year as well as interest on
projected benefit obligations are currently accrued. Prior service cost
and net actuarial loss in excess of 10% of the greater of the pro-
jected benefit obligation or the fair value of plan assets, both of
which are included in “Accumulated other comprehensive income
(loss),” are amortized over the expected average remaining service
period of employees on a straight-line basis.
accrued liabilities for Point Programs—
NTT Group grants “points” to customers based on the usage of
mobile, FLET’S Hikari and other services, which provide benefits,
including discounts on merchandise, and records “Accrued liabilities
for point programs” relating to the points that customers earn.
notes to Consolidated Financial Statements
NIP
PO
N T
ELE
GR
AP
H A
ND
TE
LEP
HO
NE
CO
RP
OR
AT
ION
A
NN
uA
L R
EP
OR
T 2
01
3
092
NIP
PO
N T
ELE
GR
AP
H A
ND
TE
LEP
HO
NE
CO
RP
OR
AT
ION
A
NN
uA
L R
EP
OR
T 2
01
3
093

Not
es to
Con
solid
ated
Fin
anci
al S
tate
men
ts
Related party transactions mainly consist of transactions with affiliated companies. NTT Group has entered into a number of different types
of transactions with affiliated companies, the significant of which are the sales of telecommunications equipment, the purchases of terminal
equipment and materials and the receipt of certain services.
Transactions with affiliated companies for each of the three years in the period ended March 31, 2013 and the related balances at March
31, 2012 and 2013 were as follows:
Millions of yen
2011 2012 2013
Operating revenues ¥ 23,145 ¥ 25,788 ¥ 26,001
Operating expenses ¥105,682 ¥104,435 ¥105,295
Receivables ¥ 14,225 ¥ 17,257
Payables ¥ 83,559 ¥ 89,623
Dividends from affiliated companies accounted for by the equity method for the fiscal years ended March 31, 2011, 2012 and 2013 were
¥18,527 million, ¥17,839 million and ¥16,924 million, respectively.
Cash and cash equivalents at March 31, 2012 and 2013 comprised the following:
Millions of yen
2012 2013
Cash ¥ 672,018 ¥ 518,555
C ommercial paper and certificates of deposit, commercial paper and marketable securities purchased under agreements to resell 210,972 69,989
Time deposits, certificates of deposit and other 137,153 372,889
Total ¥1,020,143 ¥ 961,433
Commercial paper and certificates of deposit, commercial paper and marketable securities purchased under agreements to resell and
other deposits are stated at amounts that approximate fair value.
Cash is mainly deposited into several domestic financial institutions and there is no significant concentration of cash deposits in any par-
ticular financial institution.
Inventories at March 31, 2012 and 2013 comprised the following:
Millions of yen
2012 2013
Telecommunications equipment to be sold and materials ¥160,482 ¥179,499
Projects in progress 101,052 86,382
Supplies 67,839 84,840
Total ¥329,373 ¥350,721
3. RelateD PaRtY tRanSaCtionS:
4. CaSh anD CaSh equivalentS:
5. inventoRieS:
Philippine long Distance telephone Company—
From March 2007 to February 2008, NTT DOCOMO additionally
acquired approximately 7% of the outstanding common shares of
Philippine Long Distance Telephone Company (“PLDT”), a
telecommunications operator in the Philippines, for ¥98,943 million
in the market. Together with the approximately 13% of PLDT’s out-
standing common shares held before the additional acquisition by
NTT DOCOMO, NTT Group held approximately 21% of the total
6. inveStmentS in aFFiliateD ComPanieS:
outstanding common shares of PLDT as of March 31, 2008 and
obtained the ability to exercise significant influence over PLDT.
Accordingly, NTT Group accounted for its investment in PLDT by
applying the equity method during the fiscal year ended March 31,
2008. Furthermore, NTT DOCOMO acquired an additional common
equity interest for ¥19,519 million in November, 2011, because
PLDT acquired Digital Telecommunications Philippines, Inc. through
a stock swap; and this was projected to decrease NTT Group’s
interest in PLDT. As a result, NTT Group held approximately 20% of
PLDT’s outstanding common shares.
In June 2011, the Supreme Court of the Philippines promul-
gated a decision, in which the Court held that non-voting preferred
shares should not be included in the computation of the Filipino-
alien equity requirement of public utilities companies. This tentative
decision was upheld and finalized in October 2012. In the Philip-
pines, there is a restriction on a foreign ownership which limits for-
eign ownership to 40%. This Supreme Court decision increased the
foreign ownership percentage of PLDT in excess of 40% limit.
In October 2012, PLDT issued additional voting preferred stocks
in order to dilute the foreign ownership interest in PLDT to less than
the 40% limit and as a result, NTT Group’s voting interest in PLDT
decreased to approximately 12% from 20%. At this time, the guide-
lines of foreign ownership requirements were not clearly finalized yet,
and therefore there was uncertainty about the foreign ownership
requirements.
As a result, NTT Group determined it no longer has the ability to
exercise significant influence over PLDT during the three-month
period ended December 31, 2012 and discontinued the application
of the equity method of accounting for the investment in PLDT and
also reclassified the investment in PLDT from “Investments in affili-
ates” to “Marketable securities and other investments” as available-
for-sale securities. Information regarding “Marketable securities and
other investments” is disclosed in note7.
In May 2013, the Securities and Exchange Commission in the
Philippines announced the memorandum to clarify the guideline of
foreign ownership requirements. Accordingly, NTT Group has com-
prehensively reviewed the facts such as approximately 12% of the
voting interest of PLDT, the board representation, and other circum-
stances, and NTT Group will reinstate accounting for its investment
in PLDT using the equity method beginning April 1, 2013. NTT
Group’s consolidated financial statements for the year ended March
31, 2013 have not been adjusted because the impact to retrospec-
tively apply the equity method of accounting for the investment in
PLDT for the three-month period ended March 31, 2013 is not
material to these annual consolidated financial statements.
tata teleservices limited—
On November 12, 2008, NTT DOCOMO entered into a capital
alliance with Tata Teleservices Limited (“TTSL”) and Tata Sons Lim-
ited, the parent company of TTSL. On March 25, 2009, NTT Group
acquired approximately 26% of outstanding common shares of
TTSL for ¥252,321 million pursuant to the capital alliance, and
accounted for the investment by applying the equity method. NTT
Group determined fair value of tangible, intangible and other assets
and liabilities of TTSL with the assistance of an independent third
party appraiser in order to recognize and account for NTT Group’s
share of identifiable intangible assets and embedded goodwill of its
investment in equity in TTSL. During the fiscal year ended March 31,
2010, upon the completion of the evaluation, adjustments to reflect
the earnings impact of the final allocation of the investment in TTSL
were charged to equity in earnings (losses) of affiliated companies.
As a result, “Equity in earnings (losses) of affiliated companies” in the
consolidated statement of income for the fiscal year ended March
31, 2010 decreased by ¥2,788 million and “Investments in affiliated
companies” in consolidated balance sheets as of March 31, 2010
decreased by ¥4,710 million.
NTT DOCOMO made additional investments totaling ¥14,424
million in response to a rights offering that TTSL commenced in
March and May, 2011. TTSL decided to use the capital increase to
strengthen the quality of the 3G network in India’s market. As a
result of its participation in the rights offering, NTT Group’s interest in
TTSL slightly increased to approximately 27%.
In the fiscal year ended March 31, 2013, the decrease in the
value of TTSL was determined to be other than temporary, and an
impairment loss of ¥6,813 million before taxes was recognized.
impairment—
NTT Group reviews factors such as the financial condition and
near-term prospects of its affiliates on a regular basis in order to
determine if any decline in investment values was other than
temporary.
As a result of this review and evaluation, NTT Group determined
that there were other-than-temporary declines in values of certain
investments including TTSL and recorded impairment charges
aggregating ¥16,636 million, net of deferred income taxes of ¥9,277
million, for the fiscal year ended March 31, 2013. The impairment
loss is recorded in the consolidated statements of income under
“Equity in earnings (losses) of affiliated companies.”
NTT’s shares of undistributed earnings of its affiliated companies
included in its consolidated retained earnings were ¥61,016 million,
¥68,779 million and ¥62,695 million as of March 31, 2011, 2012
and 2013, respectively.
NTT’s total investment in its affiliated publicly-held companies at
March 31, 2012 and 2013 were ¥128,821 million and ¥10,490 mil-
lion, respectively, and based on quoted market prices at that date,
the related market values were ¥247,718 million and ¥40,093 mil-
lion, respectively.
The total carrying amounts of NTT’s investments in affiliates in
the consolidated balance sheets at March 31, 2012 and 2013 were
greater by ¥313,088 million and by ¥159,949 million than its aggre-
gate underlying equity in net assets of such affiliates as of the date
of the most recent available financial statements of the investees,
respectively. The differences mainly consist of investor level goodwill
and fair value adjustments for amortizable intangible assets.
notes to Consolidated Financial Statements
NIP
PO
N T
ELE
GR
AP
H A
ND
TE
LEP
HO
NE
CO
RP
OR
AT
ION
A
NN
uA
L R
EP
OR
T 2
01
3
094
NIP
PO
N T
ELE
GR
AP
H A
ND
TE
LEP
HO
NE
CO
RP
OR
AT
ION
A
NN
uA
L R
EP
OR
T 2
01
3
095

Not
es to
Con
solid
ated
Fin
anci
al S
tate
men
ts
Marketable securities and other investments include available-for-sale securities composed of equity securities and debt securities and
held-to-maturity debt securities. The aggregate carrying amounts, gross unrealized holding gains, gross unrealized holding losses and fair value
of available-for-sale and held-to-maturity securities at March 31, 2012 and 2013 are as follows:
Millions of yen
2012
Cost Gross unrealized gains Gross unrealized losses Fair value
Available-for-sale:
Equity securities ¥133,440 ¥59,965 ¥12,638 ¥180,767
Debt securities 44,757 621 793 44,585
Held-to-maturity:
Commercial paper* 259,953 — — 259,953
Other debt securities 4,604 11 2 4,613
Total ¥442,754 ¥60,597 ¥13,433 ¥489,918
* Commercial paper are considered “Cash and cash equivalents” totaling ¥199,979 million and “Short-term investments” totaling ¥59,974 million.
Millions of yen
2013
Cost Gross unrealized gains Gross unrealized losses Fair value
Available-for-sale:
Equity securities ¥268,551 ¥266,993 ¥1,863 ¥533,681
Debt securities 47,721 1,256 481 48,496
Held-to-maturity:
Commercial paper* 69,989 — — 69,989
Other debt securities 4,662 33 — 4,695
Total ¥390,923 ¥268,282 ¥2,344 ¥656,861
* Commercial paper are considered “Cash and cash equivalents” totaling ¥69,989 million.
Gross unrealized holding losses and the fair value of available-for-sale securities and held-to-maturity securities, aggregated by investment cat-
egory and length of time that individual securities have been in a continuous unrealized loss position, at March 31, 2012 and 2013 are as follows:
Millions of yen
2012
Less than 12 months 12 months or longer
Fair valueGross unrealized
holding losses Fair valueGross unrealized
holding losses
Available-for-sale:
Equity securities ¥43,049 ¥11,481 ¥3,382 ¥1,157
Debt securities 983 320 4,612 473
Held-to-maturity:
Debt securities 198 2 — —
Millions of yen
2013
Less than 12 months 12 months or longer
Fair valueGross unrealized
holding losses Fair valueGross unrealized
holding losses
Available-for-sale:
Equity securities ¥4,524 ¥1,162 ¥2,440 ¥701
Debt securities 4,852 231 865 250
Held-to-maturity:
Debt securities — — — —
7. maRketable SeCuRitieS anD otheR inveStmentS: In the ordinary course of business, NTT maintains long-term
investment equity securities accounted for under the cost method,
which are included in “Marketable securities and other investments.”
The total carrying amounts of those securities were ¥70,888 million
and ¥80,534 million at March 31, 2012 and 2013, respectively. NTT
did not evaluate fair values of investment securities with an
aggregate carrying amount of ¥68,916 million and ¥77,376 million of
these securities for impairment at March 31, 2012 and 2013,
respectively, because it is not practicable to evaluate fair value and
there are no events or changes in circumstances that have material
effects on the fair value.
Proceeds, gross realized gains and losses from sales of available-for-sale securities for each of the three years in the period ended March
31, 2013 are as follows:
Millions of yen
2011 2012 2013
Proceeds ¥15,749 ¥9,995 ¥4,433
Gross realized gain 3,248 5,559 2,264
Gross realized loss 401 532 37
Maturities of debt securities classified as held-to-maturity at March 31, 2012 and 2013 are as follows.
Millions of yen
2012 2013
Carrying amount Fair value Carrying amount Fair value
Due within 1 year ¥260,753 ¥260,753 ¥69,999 ¥69,999
Due after 1 year through 5 years 2,335 2,346 3,217 3,238
Due after 5 years through 10 years 1,166 1,166 1,033 1,033
Due after 10 years 303 301 402 414
Total ¥264,557 ¥264,566 ¥74,651 ¥74,684
NTT Group reclassified its equity investment in PLDT from “Investments in affiliated companies” to “Available-for-sale securities” under
“Marketable securities and other investments.” For information regarding investments in affiliated companies, please see note 6.
goodwill—
A goodwill impairment charge of ¥23,042 million was recognized
during the fiscal year ended March 31, 2013 for goodwill attributable
to the NTT America reporting unit in the long distance and international
communications business segment. The fair value of the reporting
unit was determined using the discount cashflow method.
The amount of goodwill included in the mobile communications
business segment is mainly related to NTT DOCOMO’s share repur-
chase program. The repurchases of shares by NTT DOCOMO
resulting in increases in NTT’s ownership interest in NTT DOCOMO
were accounted for as acquisitions of minority interests using the
purchase method, but have been accounted for as equity transactions
with noncontrolling interests since April 2009. Further explanation is
given in note 18.
8. gooDwill, SoFtwaRe anD otheR intangible aSSetS:
The changes in goodwill by reportable segment for the fiscal years ended March 31, 2012 and 2013 are as follows:
Millions of yen
2012
Long distance and international
communications business
Mobile communications
business
Data communications
business Other Total
Balance at March 31, 2011 ¥191,870 ¥426,534 ¥126,551 ¥2,571 ¥747,526
Goodwill acquired during year 5,316 7,256 28,927 — 41,499
Impairment losses — — (4,764) — (4,764)
F oreign currency translation adjustments (10,020) (1,539) (1,277) — (12,836)
Other (5) — — — (5)
Balance at March 31, 2012 ¥187,161 ¥432,251 ¥149,437 ¥2,571 ¥771,420
notes to Consolidated Financial Statements
NIP
PO
N T
ELE
GR
AP
H A
ND
TE
LEP
HO
NE
CO
RP
OR
AT
ION
A
NN
uA
L R
EP
OR
T 2
01
3
096
NIP
PO
N T
ELE
GR
AP
H A
ND
TE
LEP
HO
NE
CO
RP
OR
AT
ION
A
NN
uA
L R
EP
OR
T 2
01
3
097

Not
es to
Con
solid
ated
Fin
anci
al S
tate
men
ts
Millions of yen
2013
Long distance and international
communications business
Mobile communications
business
Data communications
business Other Total
Balance at March 31, 2012 ¥187,161 ¥432,251 ¥149,437 ¥2,571 ¥771,420
Goodwill acquired during year 17,854 20,263 2,440 — 40,557
Impairment losses (23,042) (7,281) — — (30,323)
F oreign currency translation adjustments 22,906 3,779 19,160 — 45,845
Other — (3,283) — — (3,283)
Balance at March 31, 2013 ¥204,879 ¥445,729 ¥171,037 ¥2,571 ¥824,216
Software and other intangible assets—
The following table displays the major components of software and other intangible assets as of March 31, 2012 and 2013.
Millions of yen
2012 2013
Amortizable intangible assets:
Computer software ¥ 5,565,146 ¥ 5,709,739
Rights to use utility facilities 335,998 335,578
Other 274,031 316,056
Accumulated amortization (4,594,801) (4,774,253)
Total amortizable intangible assets 1,580,374 1,587,120
Non-amortizable intangible assets:
Trademarks and trade names 27,946 31,834
Total non-amortizable intangible assets 27,946 31,834
Total ¥ 1,608,320 ¥ 1,618,954
The aggregate amortization expense for amortizable intangible
assets for the fiscal years ended March 31, 2011, 2012 and 2013
were ¥462,649 million, ¥481,043 million and ¥473,247 million,
respectively.
Computer software is recorded at cost and is amortized on a
straight-line basis over its estimated useful life, which is generally five
years. Rights to use utility facilities are acquired using lump-sum cash
payments and mainly consist of cable tunnel and public use joint
tunnels. Such rights are recorded at cost and are amortized on a
straight-line basis over their estimated useful lives of 50 years. Other
intangible assets are also recorded at cost and amortized on a
straight-line basis over their estimated useful lives averaging 11 years.
Non-amortizable intangible assets, such as trademarks, are the
intangible assets with indefinite lives acquired through business
combinations totaling ¥27,946 million and ¥31,834 million as of
March 31, 2012 and 2013.
The estimated aggregate amortization expenses for intangible
assets during each of the five years ending March 31 are as follows:
Fiscal year ending March 31 Millions of yen
2014 ¥467,409
2015 373,713
2016 273,933
2017 179,424
2018 101,622
Short-term borrowings at March 31, 2012 and 2013 comprised the following:
Millions of yen
2012 2013
Borrowing denominated in Japanese yen:
u nsecured short-term loans from financial institutions bearing interest at weighted average rates of 0.54% and 0.34% per annum at March 31, 2012 and 2013, respectively ¥50,259 ¥47,409
C ommercial paper bearing interest at weighted average rates of 0.11% per annum at March 31, 2012 20,000 —
Borrowing denominated in foreign currencies:
unsecured short-term loans from financial institutions 13,248 30,046
Total short-term debt ¥83,507 ¥77,455
Long-term debt at March 31, 2012 and 2013 comprised the following:
Millions of yen
2012 2013
Debt denominated in Japanese yen:
0.21%–2.06%couponbondsdue2013–2031 ¥2,114,079 ¥1,887,207
0.42% floating rate bond due 2022 100 100
Secured indebtedness to financial institutions—
1.82%(weightedaverage)loansdue2014–2029 38,545 23,115
unsecured indebtedness to financial institutions—
1.30%(weightedaverage)loansdue2013–2032 1,737,031 1,635,348
0.44%(weightedaverage)floatingrateloansdue2013–2022 87,588 86,474
3,977,343 3,632,244
Debt denominated in foreign currencies:
1.40%–2.15%U.S.dollarnotesdue2017–2020 — 166,338
Swiss franc bonds 73,568 —
unsecured indebtedness to financial institutions—
2.27%(weightedaverage)U.S.dollarloansdue2013–2032 15,352 16,004
0.65%(weightedaverage)U.S.dollarfloatingrateloansdue2013–2027 70,850 92,242
17.37% (weighted average) South African Rand loans due 2018 12,309 12,193
Otherloansdue2013–2028 17,749 19,424
189,828 306,201
Total long-term debt principal 4,167,171 3,938,445
Less—Deferred bond discounts (388) (510)
4,166,783 3,937,935
Less—Current portion (656,963) (703,304)
Total long-term debt ¥3,509,820 ¥3,234,631
9. ShoRt-teRm boRRowingS anD long-teRm Debt:
Interest rates and due dates in the above table are stated at
March 31, 2013.
All holders of the bonds and notes totaling ¥1,178,528 million
issued by NTT, referred to in the above table, generally have prefer-
ential rights under the NTT Law to be paid prior to other unsecured
indebtedness, subject to certain general preferential rights provided
for in the Japanese Civil Code, such as preferential rights of employ-
ees to wages.
The bond and note agreements relating to NTT’s long term debt
at March 31, 2013 generally provide that the bonds and notes may
be purchased by NTT in the market or directly from the holders.
Additionally, certain of the bonds and notes are redeemable at the
option of NTT, generally at the principal amount.
The balance of long-term debt as of March 31, 2013, and the
aggregate amounts of annual maturities from the fiscal year ending
March 31, 2014 to the fiscal year ending March 31, 2018 and there-
after are as follows:
Fiscal year ending March 31 Millions of yen
2014 ¥ 703,304
2015 413,115
2016 369,276
2017 327,473
2018 569,063
Thereafter 1,555,704
Total ¥3,937,935
As of March 31, 2013, NTT Group has unused committed lines
of credit amounting to ¥133.4 billion.
notes to Consolidated Financial Statements
NIP
PO
N T
ELE
GR
AP
H A
ND
TE
LEP
HO
NE
CO
RP
OR
AT
ION
A
NN
uA
L R
EP
OR
T 2
01
3
098
NIP
PO
N T
ELE
GR
AP
H A
ND
TE
LEP
HO
NE
CO
RP
OR
AT
ION
A
NN
uA
L R
EP
OR
T 2
01
3
099

Not
es to
Con
solid
ated
Fin
anci
al S
tate
men
ts
(1) Severance Payments and Contract-type Corporate
Pension Plans
Employees are generally entitled to lump-sum severance pay-
ments based on NTT’s severance payment plans, determined by
reference to the employee’s basic rate of pay, length of service and
other conditions.
NTT and certain subsidiaries introduced non-contributory
funded contract-type corporate pension plans, which cover 28% of
the severance benefits under the severance payment plans to
employees who are more than 50 years old and retire after twenty or
more years of service. The benefits are also payable in a lump sum
at the option of the employee.
10. emPloYeeS’ RetiRement beneFitS:
The following table presents the reconciliation of the changes in the plans’ benefit obligations and fair value of plan assets during the fiscal
years ended March 31, 2012 and 2013. NTT uses a March 31 measurement date.
Millions of yen
2012 2013
Change in benefit obligations:
Benefit obligation, beginning of year ¥2,094,807 ¥2,037,901
Service cost 72,542 72,628
Interest cost 40,840 37,511
Plan amendment 197 178
Actuarial loss (gain) 21,493 36,155
Other 12,594 3,027
Benefit payments (Lump-sum severance payments and Pension) (204,572) (174,476)
Benefit obligation, end of year 2,037,901 2,012,924
Change in fair value of plan assets:
Fair value of plan assets, beginning of year 1,086,800 1,072,879
Actual return on plan assets 25,372 98,448
Employer contributions 69,851 66,736
Other 3,588 1,600
Benefit payments (Pension) (112,732) (114,498)
Fair value of plan assets, end of year 1,072,879 1,125,165
At March 31:
under funded status ¥ (965,022) ¥ (887,759)
The following table provides the amounts recognized in the consolidated balance sheets:
Millions of yen
2012 2013
At March 31:
Liability for employees’ retirement benefits ¥(965,068) ¥(887,816)
Other assets 46 57
Accumulated other comprehensive loss (income) 330,090 277,469
Net amount recognized ¥(634,932) ¥(610,290)
The following table provides the amounts recognized as accumulated other comprehensive loss (income):
Millions of yen
2012 2013
At March 31:
Net actuarial loss ¥356,081 ¥298,130
Transition obligation 943 776
Prior service cost* (26,934) (21,437)
Total ¥330,090 ¥277,469
* Prior service cost has been amortized on the straight-line method over the average remaining service period of employees expected to receive benefits under the plans.
The accumulated benefit obligation was ¥2,017,742 million and ¥1,987,894 million at March 31, 2012 and 2013, respectively.
The projected benefit obligation and the fair value of plan assets in the plans with projected benefit obligations in excess of fair value of
plan assets at March 31, 2012 and 2013 are as follows:
Millions of yen
2012 2013
At March 31:
Projected benefit obligation ¥2,037,514 ¥2,012,842
Fair value of plan assets 1,072,776 1,125,027
The accumulated benefit obligation and the fair value of plan assets in the plans with accumulated benefit obligations in excess of fair value
of plan assets at March 31, 2012 and 2013 are as follows:
Millions of yen
2012 2013
At March 31:
Accumulated benefit obligation ¥2,017,684 ¥1,987,813
Fair value of plan assets 1,072,776 1,125,027
The charges to income for employees’ retirement benefits for each of the three years in the period ended March 31, 2013 included the
following components:
Millions of yen
2011 2012 2013
Service cost ¥ 75,251 ¥ 72,542 ¥ 72,628
Interest cost on projected benefit obligation 43,854 40,840 37,511
Expected return on plan assets (24,819) (21,562) (21,179)
Amortization of net actuarial loss 11,936 16,624 16,891
Amortization of transition obligation 169 169 167
Amortization of prior service cost (22,279) (15,738) (5,266)
Total ¥ 84,112 ¥ 92,875 ¥100,752
Other changes in plan assets and benefit obligations recognized as other comprehensive loss (income) for the fiscal years ended March
31, 2012 and 2013 are as follows:
Millions of yen
2012 2013
Other comprehensive loss (income)
Net loss (gain) arising during period ¥ 17,681 ¥ (41,114)
Amortization of net actuarial loss (16,624) (16,891)
Amortization of transition obligation (169) (167)
Accrued past service liability 173 178
Amortization of prior service cost 15,738 5,266
Other 3,146 107
Total ¥ 19,945 ¥ (52,621)
The amounts of net actuarial loss, transition obligation and prior service cost included as accumulated other comprehensive loss (income)
expected to be recognized as components of net periodic benefit cost for the fiscal year ending March 31, 2014 amount to ¥7,734 million,
¥123 million and ¥(4,702) million, respectively.
notes to Consolidated Financial Statements
NIP
PO
N T
ELE
GR
AP
H A
ND
TE
LEP
HO
NE
CO
RP
OR
AT
ION
A
NN
uA
L R
EP
OR
T 2
01
3
100
NIP
PO
N T
ELE
GR
AP
H A
ND
TE
LEP
HO
NE
CO
RP
OR
AT
ION
A
NN
uA
L R
EP
OR
T 2
01
3
101

Not
es to
Con
solid
ated
Fin
anci
al S
tate
men
ts
The following table reflects the weighted-average assumptions used to determine the benefit obligations and net periodic benefit cost:
Millions of yen
2011 2012 2013
Weighted-average assumption used to determine benefit obligations at March 31
Discount rate 2.0% 1.9% 1.5%
Rate of compensation increase 2.4–3.4% 2.4–3.4% 2.4–3.4%
W eighted-average assumption used to determine net periodic benefit cost for years ended March 31
Discount rate 2.1% 2.0% 1.9%
Rate of compensation increase 1.9–3.2% 2.4–3.4% 2.4–3.4%
Expected long-term return on plan assets 2.3% 2.0% 2.0%
In determining the expected long-term rate of return on plan assets, NTT considers the current and projected asset allocations, as well as
expected long-term investment returns and risks for each category of plan assets based on analysis of historical results.
The following table presents the fair values of pension plan assets of contract-type corporate pension plans as of March 31, 2012 and
2013. Descriptions of fair value hierarchy and the inputs used in measuring fair value are presented in note 14.
Millions of yen
2012
Fair value measurements using
Total Level 1 Level 2 Level 3
Cash and cash equivalents ¥ 6,226 ¥ 6,226 ¥ — ¥ —
Debt securities
Japanesegovernmentbonds/localgovernmentbonds 367,251 354,172 13,079 —
Domestic corporate bonds 112,217 — 112,217 —
Foreign government bonds 84,180 82,886 1,294 —
Foreign corporate bonds 4,060 306 3,754 —
Equity securities
Domestic 130,239 130,239 — —
Foreign 85,101 85,101 — —
Securities investment trust
Domestic/debtsecurities 13,179 — 13,179 —
Domestic/equitysecurities 11,064 — 11,064 —
Foreign/debtsecurities 7,845 — 7,845 —
Foreign/equitysecurities 10,683 — 10,683 —
Pooled funds 89,983 — 89,983 —
Life insurance company general accounts 148,643 — 148,643 —
Others 2,208 — 10 2,198
Total ¥1,072,879 ¥658,930 ¥411,751 ¥2,198
Millions of yen
2013
Fair value measurements using
Total Level 1 Level 2 Level 3
Cash and cash equivalents ¥ 9,372 ¥ 9,372 ¥ — ¥ —
Debt securities
Japanesegovernmentbonds/localgovernmentbonds 393,379 381,676 11,703 —
Domestic corporate bonds 104,626 — 104,626 —
Foreign government bonds 86,897 37,786 49,111 —
Foreign corporate bonds 3,124 216 2,908 —
Equity securities
Domestic 137,846 137,781 65 —
Foreign 89,903 89,879 — 24
Securities investment trust
Domestic/debtsecurities 13,505 — 13,505 —
Domestic/equitysecurities 12,233 — 12,233 —
Foreign/debtsecurities 8,366 — 8,366 —
Foreign/equitysecurities 10,367 — 10,367 —
Pooled funds 102,896 — 102,896 —
Life insurance company general accounts 150,375 — 150,375 —
Others 2,276 — 91 2,185
Total ¥1,125,165 ¥656,710 ¥466,246 ¥2,209
Cash and cash equivalents
Cash and cash equivalents include foreign currency deposits
and call loans, and are all classified as Level 1.
Debt securities
Debt securities include Japanese government bonds and local
government bonds, domestic corporate bonds, foreign government
bonds and foreign corporate bonds. If active market prices are avail-
able, fair value is measured by quoted prices for identical assets in
active markets, which is classified as Level 1. If active market prices
are not available, fair value is measured by inputs derived principally
from observable market data provided by financial institutions, which
is classified as Level 2. In case the fair value is measured by inputs
derived from unobservable data, it is classified as Level 3.
Equity securities
Equity securities include domestic stocks and foreign stocks. If
active market prices are available, fair value is measured by quoted
prices for identical assets in active markets, which is classified as
Level 1. If active market prices are not available, fair value is mea-
sured by inputs derived principally from observable market data
provided by financial institutions, which is classified as Level 2.
Securities investment trust
Securities investment trust beneficiary certificates include bond
investment trusts and foreign stock investment trusts. Fair value is
measured by inputs derived principally from observable market data
provided by financial institutions, which is classified to Level 2.
Pooled funds
Pooled funds include government bonds, local government
bonds, domestic stocks and foreign stocks. Pooled funds are evalu-
ated based on the fair value as reported by the trust operator, and
are classified as Level 2.
Life insurance company general accounts
Life insurance company general accounts are the financial
assets which guarantee an expected rate of return and principal and
they are all classified as Level 2.
Others
Others include fund of hedge funds, among other things. Fair
value is measured by inputs derived from unobservable data, which
is classified as Level 3.
Level 3 reconciliation is not disclosed, since the amounts in
Level 3 are immaterial.
NTT Group’s policy with respect to plan asset management
planning is formulated with the ultimate objective of ensuring the
steady disbursement of benefits in future periods. Therefore, the
long-term objective of asset management is to secure the total prof-
its deemed necessary to ensure pension financing. To achieve this,
NTT Group selects various investments and takes into consideration
their expected returns and risks and the correlation among them.
NTT Group then sets the target allocation ratio for plan assets and
endeavors to maintain that ratio. The target allocations are formu-
lated from a mid- to long-term perspective and are reviewed annu-
ally. In the event that there is a significant change in the investment
environment, NTT Group also reviews the asset allocations as nec-
essary. The target allocations in March 2013 are: domestic bonds,
notes to Consolidated Financial Statements
NIP
PO
N T
ELE
GR
AP
H A
ND
TE
LEP
HO
NE
CO
RP
OR
AT
ION
A
NN
uA
L R
EP
OR
T 2
01
3
102
NIP
PO
N T
ELE
GR
AP
H A
ND
TE
LEP
HO
NE
CO
RP
OR
AT
ION
A
NN
uA
L R
EP
OR
T 2
01
3
103

Not
es to
Con
solid
ated
Fin
anci
al S
tate
men
ts
53.0%; domestic stocks, 13.0%; foreign bonds, 10.0%; foreign
stocks, 10.0%; and life insurance company general accounts,
14.0%.
Domestic stocks include NTT Group’s and its affiliates’ common
stock with an aggregate fair value of ¥3,020 million (0.3% of total
plan assets) and ¥2,701 million (0.2% of total plan assets) at March
31, 2012 and 2013, respectively.
NTT Group expects to contribute ¥39,870 million to the con-
tract-type corporate pension plans in the fiscal year ending March
31, 2014.
The estimated future benefit payments are as follows:
Year ending March 31 Millions of yen
2014 ¥ 135,073
2015 136,279
2016 138,105
2017 135,848
2018 148,478
2019-2023 599,184
Total ¥1,292,967
(2) Social welfare Pension Scheme and
ntt kigyou-nenkin-kikin (ntt Corporate Defined
benefit Pension Plan)
Since its incorporation in April 1985, both NTT Group and its
employees made contributions every year to the Nippon Telegraph
and Telephone Mutual Aid Plan (“the NTT Mutual Aid Plan”), which
was one of the Japanese government-regulated social welfare pen-
sion schemes, based on the Public Corporation Employee Mutual
Aid Association Law, and was operated to pay pension benefits to
theretired/existingemployeesofNTT,PublicCorporationand/or
their predecessor government organizations (Ministry of Communi-
cations in the area of telecommunications and the Ministry of Tele-
communications). The NTT Mutual Aid Plan was considered as a
multi-employer plan and, accordingly, contributions were recognized
as an expense when they were required for the period.
As part of the Japanese social welfare pension scheme restruc-
turing in 1997, the Japanese Welfare Pension Insurance Law was
amended effective April 1, 1997 to integrate the NTT Mutual Aid
Plan under the Public Corporation Employee Mutual Aid Association
Law with the Welfare Pension Insurance Scheme under the Japa-
nese Welfare Pension Insurance Law. This converted the NTT
Mutual Aid Plan into (a) the national Kosei-Nenkin (“the National
Plan”), (b) NTT Kosei-Nenkin-Kikin (the “NTT Plan”) and (c) the Spe-
cial Accounting Fund for the NTT Plan (former NTT Mutual Aid Plan).
Based on the Law Concerning Defined-Benefit Corporate Pension
Plans which came into force in June 2001, the NTT Plan completed
the transfer to the Japanese Government of the substitutional por-
tion of the benefit obligations, as described below. In July 2007, the
NTT Plan was converted to NTT Kigyou-Nenkin-Kikin or the NTT
Corporate Defined Benefit Pension Plan (“NTT CDBP”) that suc-
ceeded the pension benefit obligations after the transfer to the Jap-
anese Government of the substitutional portion of the benefit
obligations.
(a) the national Plan
The National Plan is a government-regulated social welfare pen-
sion plan under the Japanese Welfare Pension Insurance Law and
since April 1997, both NTT Group and its employees have made
contributions to such plan every year. It is considered as a multi-
employer plan and contributions are recognized as expenses when
contributions are required. The total amounts of contributions were
¥121,025 million, ¥122,215 million and ¥124,405 million for the
fiscal years ended March 31, 2011, 2012 and 2013, respectively. In
addition, the National Plan is a social welfare pension scheme, and
because the information required by its accounting standards is
limited, additional quantitative information relating to participation in
the multi-employer plan is not disclosed.
(b) the ntt CDbP (former ntt Plan)
NTT established the NTT Plan in April 1997. Both NTT Group
and its employees made contributions to such plan to supplement
the pension benefits to which the employees were entitled under the
National Plan. The NTT Plan was regulated under the Japanese
Welfare Pension Insurance Law and covered a substitutional portion
of the National Plan.
The NTT Plan is considered a defined benefit pension plan and
is accounted for separately from the severance payments and the
contract-type corporate pension plans as described in (1) above.
In June 2003, under the Law Concerning Defined-Benefit Cor-
porate Pension Plans, the NTT Plan applied to the Japanese Gov-
ernment for permission to be relieved of the obligations related to
future employee services to disburse the NTT Plan benefits covering
the substitutional portion and in September 2003, the approval was
granted. In April 2007, the NTT Plan applied for permission to be
relieved of the remaining obligations related to past services to dis-
burse the benefits covering the substitutional portion, and in July
2007, the approval was granted. As a result, the NTT Plan was con-
verted to the NTT CDBP, a defined-benefit corporate pension fund.
In February 2008, the NTT CDBP completed the transfer to the
Japanese Government of the substitutional portion of the benefit
obligations and related plan assets, determined pursuant to the
government formula, of the pension fund to the government agency.
The following table presents a reconciliation of the changes in the benefit obligations and fair value of assets of the NTT CDBP at March
31, 2012 and 2013. NTT uses a March 31 measurement date.
Millions of yen
2012 2013
Change in benefit obligations:
Benefit obligation, beginning of year ¥1,426,059 ¥1,467,064
Service cost 37,896 37,647
Interest cost 27,980 27,260
Actuarial loss (gain) (48) 98,532
Other 2,235 790
Benefit payments (27,058) (30,202)
Benefit obligation, end of year 1,467,064 1,601,091
Change in fair value of plan assets:
Fair value of plan assets, beginning of year 898,141 897,247
Actual return on plan assets 12,654 104,996
Employer contributions 7,542 7,236
Employee contributions 3,567 3,573
Other 2,401 486
Benefits payments (27,058) (30,202)
Fair value of plan assets, end of year 897,247 983,336
At March 31:
under funded status ¥ (569,817) ¥ (617,755)
The following table provides the amounts recognized in the consolidated balance sheets:
Millions of yen
2012 2013
At March 31:
Liability for employees’ retirement benefits ¥(569,817) ¥(617,755)
Accumulated other comprehensive loss 178,539 181,536
Net amount recognized ¥(391,278) ¥(436,219)
The following table provides the amounts recognized as accumulated other comprehensive loss (income):
Millions of yen
2012 2013
At March 31:
Net actuarial loss ¥183,549 ¥183,359
Prior service cost* (5,010) (1,823)
Total ¥178,539 ¥181,536* Prior service cost has been amortized on the straight-line method over the average remaining service period of employees expected to receive benefits under the plan.
The accumulated benefit obligation was ¥1,255,295 million and ¥1,355,816 million at March 31, 2012 and 2013, respectively.
The charges to income for employees’ retirement benefits for each of the three years in the period ended March 31, 2013 included the
following components:
Millions of yen
2011 2012 2013
Service cost ¥ 36,591 ¥ 37,896 ¥ 37,647
Interest cost on projected benefit obligation 27,866 27,980 27,260
Expected return on plan assets (22,858) (21,901) (21,743)
Amortization of net actuarial loss 12,488 17,232 15,982
Amortization of prior service cost (4,526) (3,857) (3,187)
Employee contributions (3,615) (3,567) (3,573)
Total ¥ 45,946 ¥ 53,783 ¥ 52,386
notes to Consolidated Financial Statements
NIP
PO
N T
ELE
GR
AP
H A
ND
TE
LEP
HO
NE
CO
RP
OR
AT
ION
A
NN
uA
L R
EP
OR
T 2
01
3
104
NIP
PO
N T
ELE
GR
AP
H A
ND
TE
LEP
HO
NE
CO
RP
OR
AT
ION
A
NN
uA
L R
EP
OR
T 2
01
3
105

Not
es to
Con
solid
ated
Fin
anci
al S
tate
men
ts
Other changes in plan assets and benefit obligations recognized as other comprehensive loss (income) for the fiscal years ended March
31, 2012 and 2013 are as follows:
Millions of yen
2012 2013
Other comprehensive loss (income)
Net loss (gain) arising during period ¥ 9,199 ¥ 15,279
Amortization of net actuarial loss (17,232) (15,982)
Amortization of prior service cost 3,857 3,187
Other 4 513
Total ¥ (4,172) ¥ 2,997
The amounts of net actuarial loss and prior service cost included as accumulated other comprehensive loss (income) expected to be recognized
as components of net periodic benefit cost for the fiscal year ending March 31, 2014 amount to ¥15,265 million and ¥(1,781) million, respectively.
The following table reflects the weighted-average assumptions used to determine the benefit obligations and net periodic benefit cost:
Millions of yen
2011 2012 2013
Weighted-average assumption used to determine benefit obligations at March 31
Discount rate 2.0% 1.9% 1.5%
Rate of compensation increase 3.4% 3.4% 3.9%
W eighted-average assumption used to determine net periodic benefit cost for years ended March 31
Discount rate 2.1% 2.0% 1.9%
Rate of compensation increase 3.4% 3.4% 3.4%
Expected long-term return on plan assets 2.5% 2.5% 2.5%
In determining the expected long-term rate of return on plan assets, NTT Group considers the current and projected asset allocations, as
well as expected long-term investment returns and risks for each category of the plan assets based on analysis of historical results.
The following table presents the fair values of pension plan assets of NTT CDBP as of March 31, 2012 and 2013. Descriptions of fair value
hierarchy and the inputs used in measuring fair value are presented in note 14.
Millions of yen
2012
Fair value measurements using
Total Level 1 Level 2 Level 3
Cash and cash equivalents ¥ 5,650 ¥ 5,650 ¥ — ¥ —
Debt securities
Japanesegovernmentbonds/localgovernmentbonds 256,288 247,161 9,127 —
Domestic corporate bonds 81,363 — 81,363 —
Foreign government bonds 60,576 59,927 649 —
Foreign corporate bonds 2,417 123 2,294 —
Equity securities
Domestic 154,912 154,899 13 —
Foreign 94,772 94,772 — —
Securities investment trust
Domestic/debtsecurities 14,997 — 14,997 —
Domestic/equitysecurities 19,660 — 19,660 —
Foreign/debtsecurities 12,547 — 12,547 —
Foreign/equitysecurities 13,831 — 13,831 —
Pooled funds 114,020 — 114,020 —
Life insurance company general accounts 61,529 — 61,529 —
Others 4,685 — (2) 4,687
Total ¥897,247 ¥562,532 ¥330,028 ¥4,687
Millions of yen
2013
Fair value measurements using
Total Level 1 Level 2 Level 3
Cash and cash equivalents ¥ 7,245 ¥ 7,245 ¥ — ¥ —
Debt securities
Japanesegovernmentbonds/localgovernmentbonds 290,222 281,605 8,617 —
Domestic corporate bonds 82,001 — 82,001 —
Foreign government bonds 65,432 29,090 36,342 —
Foreign corporate bonds 1,672 60 1,612 —
Equity securities
Domestic 182,455 182,326 129 —
Foreign 104,945 104,865 — 80
Securities investment trust
Domestic/debtsecurities 16,726 — 16,726 —
Domestic/equitysecurities 22,944 — 22,944 —
Foreign/debtsecurities 14,274 — 14,274 —
Foreign/equitysecurities 14,586 — 14,586 —
Pooled funds 114,828 — 114,828 —
Life insurance company general accounts 62,246 — 62,246 —
Others 3,760 — 14 3,746
Total ¥983,336 ¥605,191 ¥374,319 ¥3,826
Cash and cash equivalents
Cash and cash equivalents include foreign currency deposits
and call loans, and are all classified as Level 1.
Debt securities
Debt securities include Japanese government bonds and local
government bonds, domestic corporate bonds, foreign government
bonds and foreign corporate bonds. If active market prices are avail-
able, fair value is measured by quoted prices for identical assets in
active markets, which is classified as Level 1. If active market prices
are not available, fair value is measured by inputs derived principally
from observable market data provided by financial institutions, which
is classified as Level 2. In case the fair value is measured by inputs
derived from unobservable data, it is classified as Level 3.
Equity securities
Equity securities include domestic stocks and foreign stocks. If
active market prices are available, fair value is measured by quoted
prices for identical assets in active markets, which is classified as
Level 1. If active market prices are not available, fair value is mea-
sured by inputs derived principally from observable market data
provided by financial institutions, which is classified as Level 2.
Securities investment trust
Securities investment trust beneficiary certificates include bond
investment trusts and foreign stock investment trusts. If active mar-
ket prices are not available, fair value is measured by inputs derived
principally from observable market data provided by financial institu-
tions, which is classified as Level 2.
Pooled funds
Pooled funds include government bonds, local government
bonds, domestic stocks and foreign stocks. Pooled funds are evalu-
ated based on the fair value as reported by the trust operator, and
are classified as Level 2.
Life insurance company general accounts
Life insurance company general accounts are the financial
assets which guarantee an expected rate of return and principal and
they are all classified as Level 2.
Others
Others include loans to employees and leasing receivables,
which are classified as Level 3.
Level 3 reconciliation is not disclosed, since the amounts in
Level 3 are immaterial.
NTT Group’s policy with respect to plan asset management plan-
ning is formulated with the ultimate objective of ensuring the steady
disbursement of benefits in future periods. Therefore, the long-term
objective of asset management is to secure the total profits deemed
necessary to ensure pension financing. To achieve this, NTT Group
selects various investments and takes into consideration their
expected returns and risks and the correlation among them. NTT
Group then sets the target allocation ratio for plan assets and endeav-
ors to maintain that ratio. The target allocations are formulated from a
mid- to long-term perspective and are reviewed annually. In the event
that there is a significant change in the investment environment, NTT
Group also reviews the asset allocations as necessary. The weighted-
average target allocations in March 2013 are: domestic bonds,
47.7%; domestic stocks, 20.9%; foreign bonds, 10.0%; foreign
stocks, 14.4%; and life insurance company general accounts, 7.0%.
notes to Consolidated Financial Statements
NIP
PO
N T
ELE
GR
AP
H A
ND
TE
LEP
HO
NE
CO
RP
OR
AT
ION
A
NN
uA
L R
EP
OR
T 2
01
3
106
NIP
PO
N T
ELE
GR
AP
H A
ND
TE
LEP
HO
NE
CO
RP
OR
AT
ION
A
NN
uA
L R
EP
OR
T 2
01
3
107

Not
es to
Con
solid
ated
Fin
anci
al S
tate
men
ts
Domestic stocks include NTT Group’s and its affiliates’ common
stock with an aggregate fair value of ¥4,727 million (0.5% of total
plan assets) and ¥4,473 million (0.5% of total plan assets) at March
31, 2012 and 2013, respectively.
NTT Group expects to contribute ¥7,094 million to the NTT
CDBP in the fiscal year ending March 31, 2014.
The estimated future benefit payments of the NTT CDBP are as
follows:
Year ending March 31 Millions of yen
2014 ¥ 34,749
2015 41,721
2016 44,563
2017 46,918
2018 48,894
2019-2023 264,905
Total ¥481,750
(c) the Special accounting Fund for the ntt CDbP
(former Special accounting Fund for the ntt Plan)
The Special Accounting Fund for the NTT Plan (former NTT
Mutual Aid Plan) was a transitional pension plan created to settle the
former NTT Mutual Aid Plan in accordance with the Law to Partially
Amend the Japanese Welfare Pension Insurance Law and other
legislation. The NTT Mutual Aid Plan was integrated with the
National Plan in April 1997, and the Special Accounting Fund for the
NTT Plan aims to provide pension benefits for employees who
retired before the 1997 shift in the scheme based on the Former
Public Corporation Employee Mutual Aid Association Law.
In July 2007, the Special Accounting Fund for the NTT Plan was
converted to the Special Accounting Fund for the NTT CDBP as the
NTT Plan was converted to the NTT CDBP.
Based on the provisions of the Law to Partially Amend the Japa-
nese Welfare Pension Insurance Law and other legislation, NTT pays
contributions set by the Japanese Government every year to the
Special Accounting Fund for the NTT CDBP to cover the costs of
pension benefits based on the Former Public Corporation Employee
Mutual Aid Association Law to cover benefits for the period of ser-
vice in and prior to June 1956 of employees who retired in July 1956
orlaterfromNTT,PublicCorporation,and/ortheirpredecessor
government organizations (Ministry of Communications in the area
of telecommunications and the Ministry of Telecommunications).
The Special Accounting Fund for the NTT CDBP is a social
welfare pension scheme, as are the former NTT Mutual Aid Plan and
the current National Plan. It is considered as a multi-employer plan
and therefore contributions are recognized as expenses when con-
tributions are required. The amounts of contributions were ¥55,070
million, ¥50,574 million and ¥47,113 million for the fiscal years
ended March 31, 2011, 2012 and 2013, respectively, and NTT
expects such contributions will decrease year by year. In addition,
the Special Accounting Fund for the NTT CDBP is a social welfare
pension scheme, and because the information required by its
accounting standards is limited, additional quantitative information
relating to participation in the multi-employer plan is not disclosed.
Total income taxes recognized for the fiscal years ended March 31, 2011, 2012 and 2013 are as follows:
Millions of yen
2011 2012 2013
Income from continuing operations ¥475,592 ¥587,793 ¥481,229
Equity in earnings (losses) of affiliated companies (1,027) (4,540) (8,407)
Other comprehensive income (loss):
unrealized gain (loss) on securities (1,306) (580) 77,297
unrealized gain (loss) on derivative instruments (1,302) 459 (103)
Foreign currency translation adjustments (12,818) (15,622) 21,461
Pension liability adjustments (49,557) (5,920) 12,924
Total income taxes ¥409,582 ¥561,590 ¥584,401
11. inCome taxeS:
Substantially all of NTT Group’s income before income taxes
and equity in earnings (losses) of affiliated companies for all periods
presented and the related income tax expenses (benefits) are related
to domestic operations. During the fiscal years ended March 31,
2011 and 2012, NTT and its domestic subsidiaries were subject to a
National Corporate Tax of 30%, a Corporate Inhabitant Tax of
approximately 6% and a deductible Corporate Enterprise Tax of
approximately 8%, which in the aggregate resulted in a combined
statutory income tax rate of approximately 41%. During the fiscal
year ended March 31, 2013, NTT and its domestic subsidiaries were
subject to a National Corporate Tax of 28.05%, a Corporate Inhabit-
ant Tax of approximately 5% and a deductible Corporate Enterprise
Tax of approximately 8%, which in the aggregate resulted in a com-
bined statutory income tax rate of approximately 38%. The rate of
the Corporate Inhabitant Tax and Corporate Enterprise Tax differs
depending on the municipalities.
“The Act to Amend Sections of the Income Tax Act for Tax
Reform in Accordance with Changes to the Economic Social Struc-
ture” and “The Act on Special Measures for Reconstruction and
Rehabilitation in Response to the Great East Japan Earthquake”
were enacted on November 30, 2011. Income tax rates will be
adjusted from consolidated accounting periods that begin on or
after April 1, 2012. The aggregate statutory income tax rate will
decline from approximately 41% to approximately 38% for the fiscal
years ending March 31, 2013-2015, and then to approximately 36%
for fiscal years ending March 31, 2016 and thereafter. As a result of
this change in the income tax rate, net deferred tax assets existing
on the enactment date decreased by ¥89,936 million, and these
adjustments are included in “Income tax expense (benefit) -Deferred”
in the consolidated statements of income for the fiscal year ended
March 31, 2012. Net income attributable to NTT decreased ¥80,232
million for the fiscal year ended March 31, 2012.
NTT files a consolidated tax return with its wholly owned subsid-
iaries for National Corporate Tax purposes. The realizable amounts
of deferred tax assets related to National Corporate Tax are
assessed on the basis of the projected future taxable income of NTT
and its wholly owned subsidiaries. As of March 31, 2013, NTT had
108 wholly owned subsidiaries in Japan, including NTT East, NTT
West and NTT Communications.
Reconciliations of the difference between the actual effective income tax rate of NTT and the statutory tax rate are as follows:
Percent of income before income taxes and equity in earnings of affiliated companies
2011 2012 2013
Statutory tax rate 40.65% 40.65% 37.98%
Expenses not deductible for tax purposes 0.07 0.39 1.03
Tax credit (1.61) (1.47) (1.61)
Net change in valuation allowance 0.59 (0.27) 0.95
Effect of changes in the enacted tax rates — 6.99 0.75
Other 0.75 1.14 0.97
Effective tax rate 40.45% 47.43% 40.07%
Significant components of deferred tax assets and liabilities at March 31, 2012 and 2013 are as follows:
Millions of yen
2012 2013
Deferred tax assets:
Liability for employees’ retirement benefits ¥ 558,175 ¥ 543,115
Accrued enterprise tax 17,215 21,045
Property, plant and equipment and intangible assets principally due to differences in depreciation 386,961 382,626
Compensated absences 96,101 94,207
Accrued bonus 42,895 41,941
unamortized purchases of leased assets 9,152 7,956
Operating loss carryforwards 149,813 170,523
Accrued liabilities for loyalty programs 97,536 80,389
Deferred revenues regarding Nikagetsu Kurikoshi 20,794 16,769
Foreign currency translation adjustments 36,812 20,085
Other 151,627 163,289
Total gross deferred tax assets 1,567,081 1,541,945
Less—Valuation allowance (242,158) (253,693)
Total deferred tax assets 1,324,923 1,288,252
Deferred tax liabilities:
unrealized gains on securities (5,843) (85,761)
Investment in subsidiary, principally arising upon issuance of stock (303,363) (301,832)
Other (172,997) (185,700)
Total gross deferred tax liabilities (482,203) (573,293)
Net deferred tax assets ¥ 842,720 ¥ 714,959
notes to Consolidated Financial Statements
NIP
PO
N T
ELE
GR
AP
H A
ND
TE
LEP
HO
NE
CO
RP
OR
AT
ION
A
NN
uA
L R
EP
OR
T 2
01
3
108
NIP
PO
N T
ELE
GR
AP
H A
ND
TE
LEP
HO
NE
CO
RP
OR
AT
ION
A
NN
uA
L R
EP
OR
T 2
01
3
109

Not
es to
Con
solid
ated
Fin
anci
al S
tate
men
ts
The valuation allowance at March 31, 2012 and 2013 mainly
related to deferred tax assets of NTT and certain subsidiaries with
operating loss carryforwards for tax purposes that are not expected
to be realized. The net change in the total valuation allowance for
the year ended March 31, 2011 was an increase of ¥8,709 million,
and for the year ended March 31, 2012 was a decrease of ¥32,401
million, and for the year ended March 31, 2013 was an increase of
¥11,535 million.
Realization of the deferred tax assets depends upon the genera-
tion of future taxable income during the periods in which those
temporary differences become deductible and loss carryforwards
are utilizable. Management considers the projected future taxable
income, tax-planning strategies and scheduled reversal of deferred
tax liabilities in making this assessment. Although realization is not
assured, management believes it is more likely than not that all of
the deferred tax assets, less valuation allowance, will be realized.
The amount of such net assets considered realizable, however,
could be reduced in the near term if estimates of future taxable
income during the carryforward period are reduced.
At March 31, 2013, NTT and certain subsidiaries had operating
loss carryforwards for tax purposes of ¥660,750 million, which may
be used as a deduction in determining taxable income in future
periods. The period available to offset future taxable income varies in
each tax jurisdiction as follows:
Year ending March 31 Millions of yen
Within 5 years ¥199,867
6 to 20 years 379,745
Indefinite periods 81,138
Total ¥660,750
Deferred tax liabilities recognized for certain portions of the
undistributed earnings of NTT’s foreign subsidiaries are immaterial.
A reconciliation of the beginning and ending amount of unrecog-
nized tax benefits is as follows:
Millions of yen
2012
Balance at March 31, 2011 ¥5,437
Increase in tax position of current year 632
Decrease in tax position of prior year (903)
Settlements (165)
Foreign currency translation adjustments (466)
Balance at March 31, 2012 ¥4,535
Millions of yen
2013
Balance at March 31, 2012 ¥ 4,535
Increase in tax position of current year 450
Decrease in tax position of prior year (1,080)
Settlements —
Foreign currency translation adjustments 451
Balance at March 31, 2013 ¥ 4,356
The unrecognized tax benefit which would favorably affect the
effective income tax rate in future periods was ¥4,535 million and
¥4,356 million at March 31, 2012 and 2013, respectively. NTT does
not expect any material changes in its reserves for unrecognized tax
benefits in the next 12 months. NTT Group has elected to classify
interest and penalties related to unrecognized tax benefits, if and
when required, as part of income tax expense (benefit) in the con-
solidated statements of income. The total amounts of interest and
penalties related to unrecognized tax benefits for the fiscal years
ended March 31, 2011, 2012 and 2013 were immaterial. As of
March 31, 2013, tax inquiries for NTT and its principal subsidiaries
for fiscal years ended March 31, 2011 and prior have been com-
pleted by the tax authorities.
Net deferred tax assets at March 31, 2012 and 2013 are included in the consolidated balance sheets as follows:
Millions of yen
2012 2013
Deferred income taxes (current assets) ¥ 223,021 ¥ 224,194
Deferred income taxes (investments and other assets) 789,293 694,361
Other current liabilities (3) (4,772)
Deferred income taxes (long-term liabilities) (169,591) (198,824)
Total ¥ 842,720 ¥ 714,959
Consumption tax payable or receivable is determined based on consumption taxes levied on operating revenues offset by consumption
taxes directly incurred by the company when purchasing goods and services. Items in the consolidated statements of income are presented
on a net basis of consumption tax.
12. ConSumPtion tax:
Change in NTT’s shares of common stock and treasury stock for the fiscal years ended March 31, 2011, 2012 and 2013 are as follows:
Change in shares
Issued shares Treasury stock
Balance at March 31, 2010 1,574,120,900 250,923,665
Acquisition of treasury stock through purchase of less-than-one-unit shares — 111,369
Resale of treasury stock to holders of less-than-one-unit shares — (49,201)
Cancellation of treasury stock under resolution of the board of directors (125,461,833) (125,461,833)
Balance at March 31, 2011 1,448,659,067 125,524,000
Acquisition of treasury stock under resolution of the board of directors — 99,334,200
Acquisition of treasury stock through purchase of less-than-one-unit shares — 64,112
Resale of treasury stock to holders of less-than-one-unit shares — (28,668)
Cancellation of treasury stock under resolution of the board of directors (125,461,832) (125,461,832)
Balance at March 31, 2012 1,323,197,235 99,431,812
Acquisition of treasury stock under resolution of the board of directors — 38,382,300
Acquisition of treasury stock through purchase of less-than-one-unit shares — 17,631
Resale of treasury stock to holders of less-than-one-unit shares — (9,140)
Cancellation of treasury stock under resolution of the board of directors — —
Balance at March 31, 2013 1,323,197,235 137,822,603
13. equitY:
According to the NTT Law, NTT must obtain authorization from
the Minister of Internal Affairs and Communications for certain finan-
cial matters including (1) certain new share issuance, including
shares issuable upon the exercise of stock acquisition rights; (2) any
resolution for (i) a change in the Articles of Incorporation, (ii) an
appropriation of profits or (iii) any merger or dissolution; and (3) any
disposition of major telecommunications trunk lines and equipment
or providing mortgages on such properties.
On November 24, 1995, based upon the resolution of the board
of directors’ meeting held on April 28, 1995, NTT capitalized the
aggregate amount of ¥15,600 million of its additional paid-in capital
to the common stock account and made a free share distribution of
312,000 shares to shareholders of record at September 30, 1995
representing 2% of outstanding shares. under generally accepted
accounting principles in Japan, no accounting entry is required for
such a free share distribution. Had the distribution been accounted
for entities in the united States, ¥234,624 million would have been
transferred from retained earnings to the applicable capital account.
Effective May 1, 2006, the Japanese Corporation Law provides
that (i) dividends of earnings require approval at a general meeting of
shareholders, (ii) interim cash dividends can be distributed upon the
approval of the board of directors, if the Articles of Incorporation provide
for such interim cash dividends, and (iii) an amount equal to at least
10% of the decrease in retained earnings resulting from a dividend
payment be appropriated from retained earnings to a legal reserve until
such reserve is equal to 25% of capital stock. The legal reserve is avail-
able for distribution upon approval at a shareholders’ meeting.
The Japanese Corporation Law provides that corporations are
able to repurchase their own shares in market transactions by reso-
lution of the board of directors in case that articles of incorporation
prescribe so.
On May 14, 2010, the board of directors adopted the basic
policy on cancellation of treasury stock. Pursuant to this policy, all
treasury stock owned by NTT as of March 31, 2010 (250,923,665
shares) would be cancelled over two fiscal years, with one-half of
the treasury stock cancelled during the 2010 calendar year and the
remainder of the treasury stock to be cancelled during the fiscal year
ended March 31, 2012.
On November 9, 2010, the board of directors resolved that NTT
will cancel 125,461,833 shares held as treasury stock and on
November 15, 2010, NTT cancelled these shares. As a result of this
cancellation, “Additional paid-in capital” and “Retained earnings”
decreased by ¥916 million and ¥601,976 million, respectively.
On May 13, 2011, the board of directors resolved that NTT may
acquire up to a total not exceeding 60 million outstanding shares of
its common stock at an amount in total not exceeding ¥280 billion
from May 16, 2011 through September 30, 2011. Based on this
resolution, NTT repurchased 57,513,600 shares of its common
stock at ¥223,440 million on July 5, 2011 using the Tokyo Stock
Exchange Trading Network Off-Auction Own Share Repurchase
Trading System (“ToSTNeT-3”).
On November 9, 2011, the board of directors resolved that NTT
will cancel 125,461,832 shares held as treasury stock on November
15, 2011, and that NTT may acquire up to a total not exceeding 44
million outstanding shares of its common stock at an amount in total
not exceeding ¥220 billion from November 16, 2011 through March
30, 2012. As a result of this cancellation, “Retained earnings”
decreased by ¥566,551 million. NTT repurchased 41,820,600
shares of its common stock at ¥158,291 million on February 8,
2012 using ToSTNeT-3.
On September 19, 2012, the board of directors resolved that
NTT may acquire up to 42 million outstanding shares of its common
notes to Consolidated Financial Statements
NIP
PO
N T
ELE
GR
AP
H A
ND
TE
LEP
HO
NE
CO
RP
OR
AT
ION
A
NN
uA
L R
EP
OR
T 2
01
3
110
NIP
PO
N T
ELE
GR
AP
H A
ND
TE
LEP
HO
NE
CO
RP
OR
AT
ION
A
NN
uA
L R
EP
OR
T 2
01
3
111
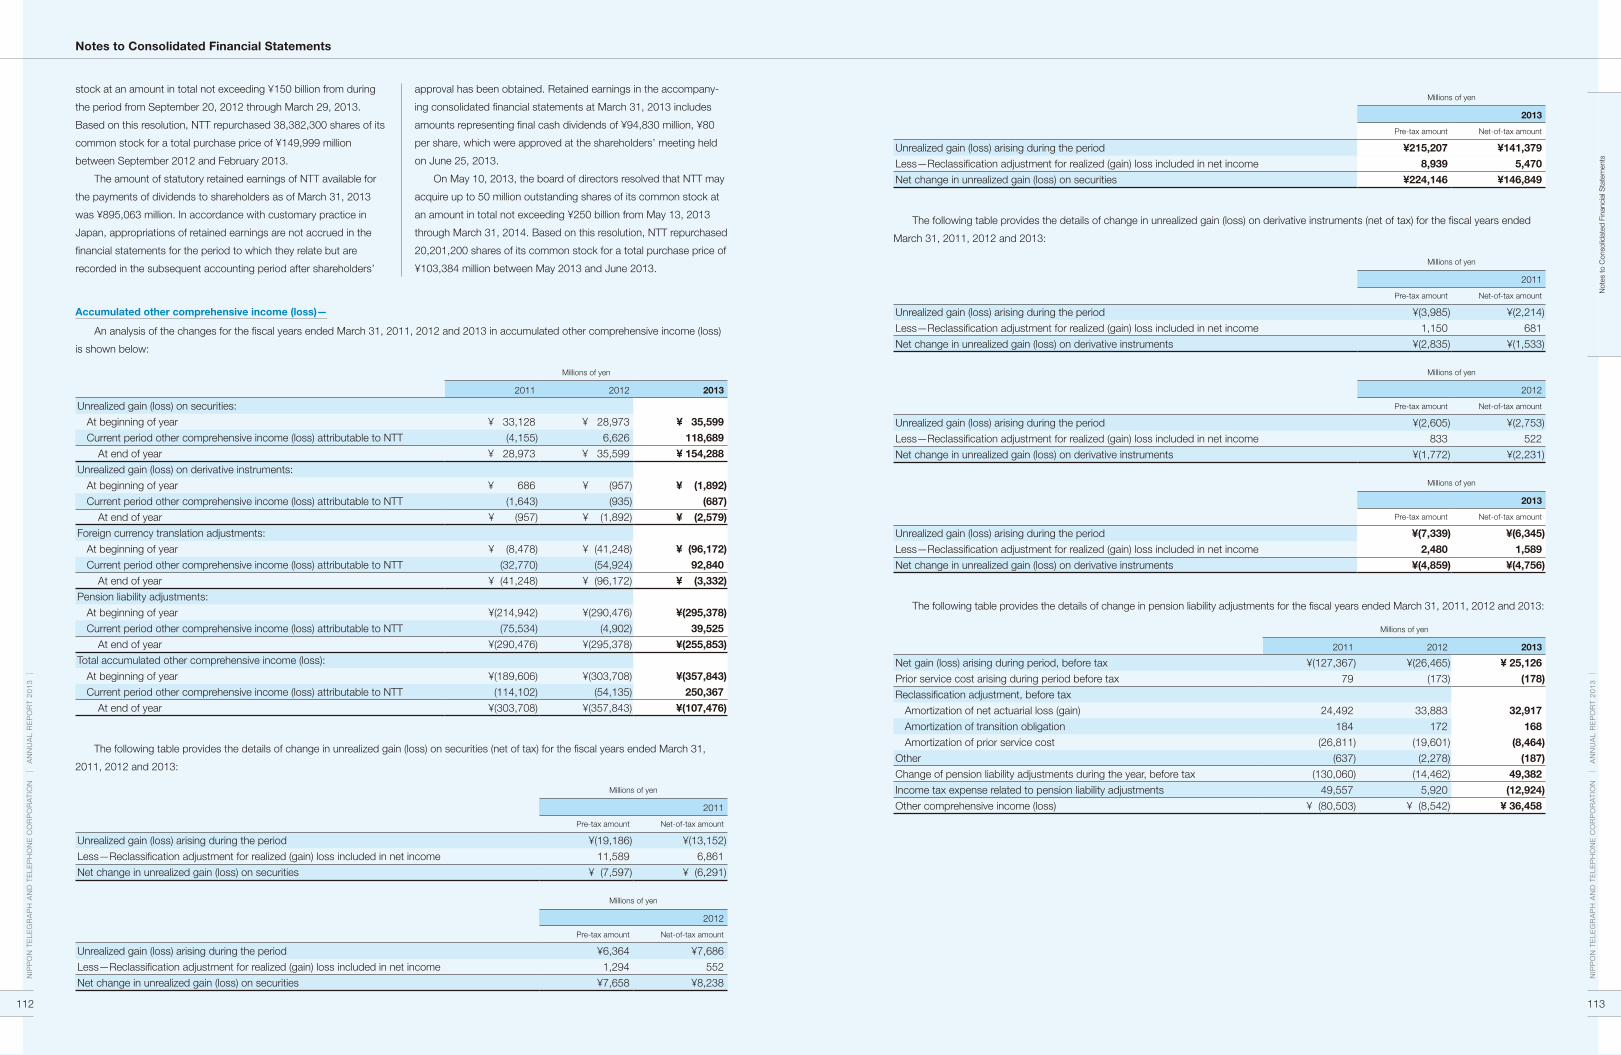
Not
es to
Con
solid
ated
Fin
anci
al S
tate
men
ts
stock at an amount in total not exceeding ¥150 billion from during
the period from September 20, 2012 through March 29, 2013.
Based on this resolution, NTT repurchased 38,382,300 shares of its
common stock for a total purchase price of ¥149,999 million
between September 2012 and February 2013.
The amount of statutory retained earnings of NTT available for
the payments of dividends to shareholders as of March 31, 2013
was ¥895,063 million. In accordance with customary practice in
Japan, appropriations of retained earnings are not accrued in the
financial statements for the period to which they relate but are
recorded in the subsequent accounting period after shareholders’
approval has been obtained. Retained earnings in the accompany-
ing consolidated financial statements at March 31, 2013 includes
amounts representing final cash dividends of ¥94,830 million, ¥80
per share, which were approved at the shareholders’ meeting held
on June 25, 2013.
On May 10, 2013, the board of directors resolved that NTT may
acquire up to 50 million outstanding shares of its common stock at
an amount in total not exceeding ¥250 billion from May 13, 2013
through March 31, 2014. Based on this resolution, NTT repurchased
20,201,200 shares of its common stock for a total purchase price of
¥103,384 million between May 2013 and June 2013.
accumulated other comprehensive income (loss)—
An analysis of the changes for the fiscal years ended March 31, 2011, 2012 and 2013 in accumulated other comprehensive income (loss)
is shown below:
Millions of yen
2011 2012 2013
unrealized gain (loss) on securities:
At beginning of year ¥ 33,128 ¥ 28,973 ¥ 35,599
Current period other comprehensive income (loss) attributable to NTT (4,155) 6,626 118,689
At end of year ¥ 28,973 ¥ 35,599 ¥ 154,288
unrealized gain (loss) on derivative instruments:
At beginning of year ¥ 686 ¥ (957) ¥ (1,892)
Current period other comprehensive income (loss) attributable to NTT (1,643) (935) (687)
At end of year ¥ (957) ¥ (1,892) ¥ (2,579)
Foreign currency translation adjustments:
At beginning of year ¥ (8,478) ¥ (41,248) ¥ (96,172)
Current period other comprehensive income (loss) attributable to NTT (32,770) (54,924) 92,840
At end of year ¥ (41,248) ¥ (96,172) ¥ (3,332)
Pension liability adjustments:
At beginning of year ¥(214,942) ¥(290,476) ¥(295,378)
Current period other comprehensive income (loss) attributable to NTT (75,534) (4,902) 39,525
At end of year ¥(290,476) ¥(295,378) ¥(255,853)
Total accumulated other comprehensive income (loss):
At beginning of year ¥(189,606) ¥(303,708) ¥(357,843)
Current period other comprehensive income (loss) attributable to NTT (114,102) (54,135) 250,367
At end of year ¥(303,708) ¥(357,843) ¥(107,476)
The following table provides the details of change in unrealized gain (loss) on securities (net of tax) for the fiscal years ended March 31,
2011, 2012 and 2013:
Millions of yen
2011
Pre-tax amount Net-of-tax amount
unrealized gain (loss) arising during the period ¥(19,186) ¥(13,152)
Less—Reclassification adjustment for realized (gain) loss included in net income 11,589 6,861
Net change in unrealized gain (loss) on securities ¥ (7,597) ¥ (6,291)
Millions of yen
2012
Pre-tax amount Net-of-tax amount
unrealized gain (loss) arising during the period ¥6,364 ¥7,686
Less—Reclassification adjustment for realized (gain) loss included in net income 1,294 552
Net change in unrealized gain (loss) on securities ¥7,658 ¥8,238
Millions of yen
2013
Pre-tax amount Net-of-tax amount
unrealized gain (loss) arising during the period ¥215,207 ¥141,379
Less—Reclassification adjustment for realized (gain) loss included in net income 8,939 5,470
Net change in unrealized gain (loss) on securities ¥224,146 ¥146,849
The following table provides the details of change in unrealized gain (loss) on derivative instruments (net of tax) for the fiscal years ended
March 31, 2011, 2012 and 2013:
Millions of yen
2011
Pre-tax amount Net-of-tax amount
unrealized gain (loss) arising during the period ¥(3,985) ¥(2,214)
Less—Reclassification adjustment for realized (gain) loss included in net income 1,150 681
Net change in unrealized gain (loss) on derivative instruments ¥(2,835) ¥(1,533)
Millions of yen
2012
Pre-tax amount Net-of-tax amount
unrealized gain (loss) arising during the period ¥(2,605) ¥(2,753)
Less—Reclassification adjustment for realized (gain) loss included in net income 833 522
Net change in unrealized gain (loss) on derivative instruments ¥(1,772) ¥(2,231)
Millions of yen
2013
Pre-tax amount Net-of-tax amount
unrealized gain (loss) arising during the period ¥(7,339) ¥(6,345)
Less—Reclassification adjustment for realized (gain) loss included in net income 2,480 1,589
Net change in unrealized gain (loss) on derivative instruments ¥(4,859) ¥(4,756)
The following table provides the details of change in pension liability adjustments for the fiscal years ended March 31, 2011, 2012 and 2013:
Millions of yen
2011 2012 2013
Net gain (loss) arising during period, before tax ¥(127,367) ¥(26,465) ¥ 25,126
Prior service cost arising during period before tax 79 (173) (178)
Reclassification adjustment, before tax
Amortization of net actuarial loss (gain) 24,492 33,883 32,917
Amortization of transition obligation 184 172 168
Amortization of prior service cost (26,811) (19,601) (8,464)
Other (637) (2,278) (187)
Change of pension liability adjustments during the year, before tax (130,060) (14,462) 49,382
Income tax expense related to pension liability adjustments 49,557 5,920 (12,924)
Other comprehensive income (loss) ¥ (80,503) ¥ (8,542) ¥ 36,458
notes to Consolidated Financial Statements
NIP
PO
N T
ELE
GR
AP
H A
ND
TE
LEP
HO
NE
CO
RP
OR
AT
ION
A
NN
uA
L R
EP
OR
T 2
01
3
112
NIP
PO
N T
ELE
GR
AP
H A
ND
TE
LEP
HO
NE
CO
RP
OR
AT
ION
A
NN
uA
L R
EP
OR
T 2
01
3
113

Not
es to
Con
solid
ated
Fin
anci
al S
tate
men
ts
Tax effects allocated to each component of other comprehensive income (loss) for the fiscal years ended March 31, 2011, 2012 and 2013
are shown below:
Millions of yen
Pre-tax amount Taxbenefit/(expense) Net-of-tax amount
For the fiscal year ended March 31, 2011:
unrealized gain (loss) on securities ¥ (7,597) ¥ 1,306 ¥ (6,291)
unrealized gain (loss) on derivative instruments (2,835) 1,302 (1,533)
Foreign currency translation adjustments (56,934) 12,818 (44,116)
Pension liability adjustments (130,060) 49,557 (80,503)
Other comprehensive income (loss) ¥(197,426) ¥ 64,983 ¥(132,443)
For the fiscal year ended March 31, 2012:
unrealized gain (loss) on securities ¥ 7,658 ¥ 580 ¥ 8,238
unrealized gain (loss) on derivative instruments (1,772) (459) (2,231)
Foreign currency translation adjustments (84,991) 15,622 (69,369)
Pension liability adjustments (14,462) 5,920 (8,542)
Other comprehensive income (loss) ¥ (93,567) ¥ 21,663 ¥ (71,904)
For the fiscal year ended March 31, 2013:
unrealized gain (loss) on securities ¥ 224,146 ¥ (77,297) ¥ 146,849
unrealized gain (loss) on derivative instruments (4,859) 103 (4,756)
Foreign currency translation adjustments 136,200 (21,461) 114,739
Pension liability adjustments 49,382 (12,924) 36,458
Other comprehensive income (loss) ¥ 404,869 ¥(111,579) ¥ 293,290
The inputs to valuation techniques used to measure fair value
are required to be categorized by fair value hierarchy. The fair value
hierarchy gives the highest priority to unadjusted quoted prices in
active markets for identical assets or liabilities (Level 1 measure-
ments) and the lowest priority to measurements involving significant
unobservable inputs (Level 3 measurements). The three levels of the
fair value hierarchy are as follows:
•Level1—Inputsarequotedprices(unadjusted)inactivemarkets
for identical assets or liabilities that the Company has the ability to
access at the measurement date.
•Level2—Inputsareotherthanquotedpricesincludedwithin
Level 1 that are observable for the asset or liability, either directly
or indirectly.
•Level3—Inputsareunobservableinputsfortheassetorliability.
14. FaiR value meaSuRementS:
Assets and liabilities measured at fair value on a recurring basis as of March 31, 2012 and 2013 are as follows:
Millions of yen
2012
Fair value measurements using
Total Level 1 (1) Level 2 (2) Level 3 (3)
Assets
Available-for-sale securities:
Domestic equity securities ¥81,850 ¥81,747 ¥ 103 ¥ —
Foreign equity securities 98,917 98,917 — —
Domestic debt securities 32,516 6,272 23,516 2,728
Foreign debt securities 12,069 419 11,650 —
Derivatives:
Forward exchange contracts 920 — 920 —
Interest rate swap agreements 153 — 153 —
Currency swap agreements 2,160 — 2,160 —
Liabilities
Derivatives:
Forward exchange contracts 995 — 995 —
Interest rate swap agreements 1,676 — 1,676 —
Currency swap agreements 1,769 — 1,769 —
Currency option agreements ¥ 1,096 ¥ — ¥ 1,096 ¥ —
There were no transfers between Level 1 and Level 2.
Level 3 reconciliation is not disclosed, since the amounts in Level 3 are immaterial.
Millions of yen
2013
Fair value measurements using
Total Level 1 (1) Level 2 (2) Level 3 (3)
Assets
Available-for-sale securities:
Domestic equity securities ¥ 94,592 ¥ 94,482 ¥ 110 ¥ —
Foreign equity securities 439,089 439,089 — —
Domestic debt securities 31,125 5,023 22,629 3,473
Foreign debt securities 17,371 5 17,366 —
Derivatives:
Forward exchange contracts 737 — 737 —
Interest rate swap agreements 96 — 96 —
Currency swap agreements 21,905 — 21,905 —
Liabilities
Derivatives:
Forward exchange contracts 652 — 652 —
Interest rate swap agreements 1,972 — 1,972 —
Currency swap agreements 277 — 277 —
Currency option agreements ¥ 369 ¥ — ¥ 369 ¥ —
(1) Quoted prices for identical assets or liabilities in active markets (2) Quoted prices for similar assets or liabilities in active markets, quoted prices for identical or similar assets or liabilities in inactive markets, inputs derived principally from observable market data (3) unobservable inputs
There were no transfers between Level 1 and Level 2.
Level 3 reconciliation is not disclosed, since the amounts in Level 3 are immaterial.
available-for-Sale Securities—
Available-for-sale securities comprised marketable equity securi-
ties and debt securities, and financial instruments classified as avail-
able-for-sale securities. If active market prices are available, fair
value is measured by quoted prices for identical assets in active
markets, which is classified as Level 1. If active market prices are
not available, fair value is measured by inputs derived principally
from observable market data provided by financial institutions, which
is classified as Level 2. In case fair value is measured by inputs
derived from unobservable data, it is classified as Level 3.
Derivatives—
Derivatives comprised forward exchange contracts, interest rate
swap agreements, currency swap agreements and currency option
agreements. Fair value of derivatives is measured by inputs derived
principally from observable market data provided by financial institu-
tions, which is classified as Level 2.
Assets and liabilities measured at fair value on a nonrecurring basis for the fiscal years ended March 31, 2012 and 2013 are as follows:
Millions of yen
2012
Fair value measurements using
Total Level 1 (1) Level 2 (2) Level 3 (3) Losses (before tax)
Assets
Real estate ¥1,896 ¥— ¥— ¥1,896 ¥1,015
Cost method investments 418 — — 418 1,153
Goodwill 5,103 — — 5,103 4,764
Long-lived assets 5,014 — — 5,014 9,555
notes to Consolidated Financial Statements
NIP
PO
N T
ELE
GR
AP
H A
ND
TE
LEP
HO
NE
CO
RP
OR
AT
ION
A
NN
uA
L R
EP
OR
T 2
01
3
114
NIP
PO
N T
ELE
GR
AP
H A
ND
TE
LEP
HO
NE
CO
RP
OR
AT
ION
A
NN
uA
L R
EP
OR
T 2
01
3
115

Not
es to
Con
solid
ated
Fin
anci
al S
tate
men
ts
Millions of yen
2013
Fair value measurements using
Total Level 1 (1) Level 2 (2) Level 3 (3) Losses (before tax)
Assets
Real estate ¥ 1,585 ¥— ¥— ¥ 1,585 ¥ 538
Investments in affiliated companies 132,010 — — 132,010 25,913
Cost method investments 313 — — 313 1,287
Goodwill 13,500 — — 13,500 30,323
Long-lived assets 2,418 — — 2,418 5,416
(1) Quoted prices for identical assets or liabilities in active markets (2) Quoted prices for similar assets or liabilities in active markets, quoted prices for identical or similar assets or liabilities in inactive markets, inputs derived principally from observable market data (3) unobservable inputs
Real estate—
If a decline in value or an increase in estimated costs of comple-
tion of real estate held for resale included in inventories causes
inventory cost to be unrecoverable, the real estate is written down to
its fair value. In measuring fair value of such inventories, fair value is
measured by using various evaluation models based on inputs that
are unobservable in the market, such as a salable price based on a
real-estate appraisal, which is classified as Level 3.
Real estate in the table above includes that transferred from
inventories to property, plant and equipment as a result of a change
in use or sold to others after measuring fair value.
investments in affiliated Companies—
The fair value of investments in affiliated companies that are
impaired as a result of an other than temporary decline in value are
measured at fair value based on the discounted cash flow method
using unobservable inputs, which resulted in a classification of such
investments as Level 3 investments. The discount rate used for the
weighted average cost of capital amounted to 11.3%-15.9%.
Cost method investments—
If a decline in value of cost method investments is evaluated as
other than temporary, the investment is written down to its fair value.
In measuring fair value of such investments, if active market prices
of similar assets are available, fair value is measured by quoted
prices for similar assets, which is classified as Level 2. If active mar-
ket prices of similar assets are not available, fair value is measured
by using various evaluation models based on inputs that are unob-
servable in the market such as discounted cash flow projection,
which is classified as Level 3.
goodwill—
The fair value of the reporting units is determined by using vari-
ous evaluation models based on inputs that are unobservable in the
market such as discounted cash flow projections, which are classi-
fied as Level 3. For the fiscal year ended March 31, 2013, the
weighted average cost of capital and the permanent growth rate
amounted to 11.0% and 3.0%, respectively. For segment informa-
tion related to goodwill impairments, see note 8.
long-lived assets—
If the carrying amount of a long-lived asset is evaluated to be
unrecoverable, the long-lived asset is written down to its fair value.
In measuring fair value of such long-lived assets, fair value is mea-
sured by using various evaluation models based on inputs that are
unobservable in the market such as discounted cash flow projec-
tion, which is classified as Level 3. The discount rate used for the
weighted average cost of capital amounted to 4.2%-5.0%.
Operating segments are components of the NTT Group that
1) engage in business activities, 2) whose operating results are regu-
larly reviewed by NTT Group’s chief operating decision maker to
make decisions on the allocation of financial resources and to evalu-
ate business performance, and 3) for which discrete financial infor-
mation is available. Accounting policies used to determine segment
profit/lossandsegmentassetsareconsistentwiththoseusedto
prepare the consolidated financial statements in accordance with
accounting principles generally accepted in the united States.
The regional communications business segment principally
comprisesrevenuesfromfixedvoicerelatedservices,IP/packet
communications services, sales of telecommunications equipment,
and other operating revenues.
The long distance and international communications business
segment principally comprises revenues from fixed voice related
services,IP/packetcommunicationsservices,systemintegration
services and other operating revenues.
The mobile communications business segment principally com-
prisesrevenuesfrommobilevoicerelatedservices,IP/packetcom-
munications services and sales of telecommunications equipment.
The data communications business segment principally com-
prises revenues from system integration services.
The other segment principally comprises operating revenues
from such activities as building maintenance, real estate rental, sys-
tems development, leasing, and research and development.
15. Segment anD geogRaPhiC inFoRmation:
operating Revenue:
Millions of yen
Year ended March 31 2011 2012 2013
Operating revenue:
Regional communications business—
External customers ¥ 3,529,551 ¥ 3,306,656 ¥ 3,203,926
Intersegment 497,657 458,115 454,291
Total 4,027,208 3,764,771 3,658,217
Long distance and international communications business—*
External customers 1,223,429 1,573,150 1,554,706
Intersegment 109,223 105,506 103,241
Total 1,332,652 1,678,656 1,657,947
Mobile communications business—
External customers 4,191,795 4,211,099 4,431,032
Intersegment 32,478 28,904 39,090
Total 4,224,273 4,240,003 4,470,122
Data communications business—
External customers 1,031,107 1,108,212 1,154,143
Intersegment 132,081 143,598 149,373
Total 1,163,188 1,251,810 1,303,516
Other—
External customers 329,121 308,245 356,933
Intersegment 791,146 780,794 900,644
Total 1,120,267 1,089,039 1,257,577
Elimination (1,562,585) (1,516,917) (1,646,639)
Consolidated operating revenue ¥10,305,003 ¥10,507,362 ¥10,700,740
* The operating revenues (External customers and Total) for the long-distance and international communications business segment for the fiscal year ended March 31, 2012 and 2013 includes Dimension Data’s operating revenues of ¥465,729 million and ¥461,559 million, respectively.
notes to Consolidated Financial Statements
NIP
PO
N T
ELE
GR
AP
H A
ND
TE
LEP
HO
NE
CO
RP
OR
AT
ION
A
NN
uA
L R
EP
OR
T 2
01
3
116
NIP
PO
N T
ELE
GR
AP
H A
ND
TE
LEP
HO
NE
CO
RP
OR
AT
ION
A
NN
uA
L R
EP
OR
T 2
01
3
117

Not
es to
Con
solid
ated
Fin
anci
al S
tate
men
ts
Segment Profit:
Millions of yen
Year ended March 31 2011 2012 2013
Segment profit:
Regional communications business ¥ 127,252 ¥ 86,906 ¥ 92,515
Long distance and international communications business 97,089 116,669 121,293
Mobile communications business 839,102 876,406 836,446
Data communications business 76,978 71,542 85,818
Other 44,857 56,857 53,576
Total segment profit 1,185,278 1,208,380 1,189,648
Elimination 29,631 14,586 12,320
Consolidated operating income 1,214,909 1,222,966 1,201,968
Other income 73,829 103,737 96,448
Other expenses 112,941 87,373 97,317
C onsolidated income before income taxes and equity in earnings (losses) of affiliated companies ¥1,175,797 ¥1,239,330 ¥1,201,099
Equity in earnings (losses) of affiliated companies:
Regional communications business ¥ 77 ¥ 93 ¥ 153
Long distance and international communications business 432 900 594
Mobile communications business (9,913) (14,231) (22,091)
Data communications business 91 27 96
Other 10,983 10,225 11,117
Consolidated total ¥ 1,670 ¥ (2,986) ¥ (10,131)
Segment assets:
Millions of yen
As of March 31 2011 2012 2013
Segment Assets:
Regional communications business ¥ 7,659,004 ¥ 7,456,797 ¥ 7,334,964
Long distance and international communications business 1,770,589 1,770,522 1,934,211
Mobile communications business 6,945,024 7,090,883 7,518,323
Data communications business 1,502,352 1,515,686 1,597,446
Other 10,009,775 9,924,722 10,283,920
Total segment assets 27,886,744 27,758,610 28,668,864
Elimination (8,221,148) (8,368,911) (9,015,175)
Consolidated total assets ¥19,665,596 ¥19,389,699 ¥19,653,689
(Note) Elimination includes offsetting the carrying amount of the parent’s investment in each subsidiary and the parent’s portion of equity of each subsidiary. Goodwill resulting from an acquisition is included in segment assets of the respective business in which the acquired business has been included. See note 8.
other Significant items:
Millions of yen
Year ended March 31 2011 2012 2013
Depreciation and amortization:
Regional communications business ¥ 847,483 ¥ 816,307 ¥ 794,192
Long distance and international communications business 134,423 137,176 142,309
Mobile communications business 698,690 688,518 701,658
Data communications business 148,404 140,075 137,961
Other 127,419 122,728 117,505
Total segment 1,956,419 1,904,804 1,893,625
Elimination 6,115 5,894 5,620
Consolidated total ¥1,962,534 ¥1,910,698 ¥1,899,245
Capital investments for segment assets:
Regional communications business ¥ 806,953 ¥ 811,803 ¥ 785,929
Long distance and international communications business 135,452 152,348 147,503
Mobile communications business 668,476 726,833 753,660
Data communications business 139,070 133,966 122,113
Other 120,155 121,660 160,770
Consolidated total ¥1,870,106 ¥1,946,610 ¥1,969,975
Point program expenses:
Regional communications business ¥ 7,760 ¥ 5,615 ¥ 5,801
Long distance and international communications business 2,145 2,166 1,321
Mobile communications business 126,847 95,790 74,651
Consolidated total ¥ 136,752 ¥ 103,571 ¥ 81,773
Goodwill impairment losses:
Long distance and international communications business ¥ — ¥ — ¥ 23,042
Mobile communications business — — 7,281
Data communications business 1,912 4,764 —
Consolidated total ¥ 1,912 ¥ 4,764 ¥ 30,323
The capital investments in the above table represent the addi-
tions to fixed assets of each segment.
Transfers between operating segments are made at arms-length
prices. Operating income is operating revenue less costs and oper-
ating expenses.
Geographic information is not presented due to immateriality of
revenue and tangible long-lived assets attributable to customers and
operations outside of Japan.
There have been no operating revenue from transactions with a
single external customer amounting to 10% or more of NTT Group’s
revenues for the fiscal years ended March 31, 2011, 2012 and 2013.
Due to the impact of the Great East Japan Earthquake which
occurred on March 11, 2011, NTT Group’s telecommunications
facilities and buildings, among other things, were damaged. For the
fiscal year ended March 31, 2011, ¥28,225 million was recorded in
consolidated operating expenses as a loss on retirement of dam-
aged facilities, expenses incurred for restoration work and other
expenses which resulted from this earthquake. The expenses
incurred by business segments were: regional communications,
¥15,700 million; long-distance and international communications,
¥1,042 million; mobile communications, ¥5,843 million; data com-
munications, ¥345 million; and other, ¥5,295 million.
For the fiscal year ended March 31, 2012, ¥19,505 million was
recorded in consolidated operating expenses as expenses incurred
for restoration work and other expenses which resulted from this
earthquake.
notes to Consolidated Financial Statements
NIP
PO
N T
ELE
GR
AP
H A
ND
TE
LEP
HO
NE
CO
RP
OR
AT
ION
A
NN
uA
L R
EP
OR
T 2
01
3
118
NIP
PO
N T
ELE
GR
AP
H A
ND
TE
LEP
HO
NE
CO
RP
OR
AT
ION
A
NN
uA
L R
EP
OR
T 2
01
3
119

Not
es to
Con
solid
ated
Fin
anci
al S
tate
men
ts
NTT Group leases certain office space, employees’ residential facilities and other assets, recorded as either capital leases or operating leases.
Capital lease—lessee—
Assets acquired under capital leases at March 31, 2012 and 2013 were as follows:
Millions of yen
Class of property 2012 2013
Buildings ¥ 8,339 ¥ 9,938
Machinery, vehicles and tools 91,773 81,497
Accumulated depreciation (57,293) (49,847)
Total ¥ 42,819 ¥ 41,588
Future minimum lease payments by year under capital leases together with the present value of the net minimum lease payments at March
31, 2013 are as follows:
Year ending March 31 Millions of yen
2014 ¥ 19,661
2015 15,372
2016 11,343
2017 7,493
2018 4,109
Thereafter 7,229
Total minimum lease payments 65,207
Less—Amount representing interest (12,585)
Present value of net minimum lease payments 52,622
Less—Current obligation (16,368)
Long-term capital lease obligations ¥ 36,254
operating lease—lessee—
Rental expenses under operating leases for land, buildings and equipment for the fiscal years ended March 31, 2011, 2012 and 2013
were ¥204,999 million, ¥223,811 million and ¥227,024 million, respectively.
Minimum future rental payments under operating leases that have initial or remaining non-cancellable lease terms in excess of one year at
March 31, 2013 are as follows:
Year ending March 31 Millions of yen
2014 ¥20,936
2015 16,707
2016 11,833
2017 9,250
2018 8,020
Thereafter 17,011
Total ¥83,757
16. leaSeS:
Research and Development expenses—
Research and development expenses are charged to income as
incurred and such amounts charged to income for the fiscal years
ended March 31, 2011, 2012 and 2013 were ¥268,221 million,
¥267,853 million and ¥269,192 million, respectively.
advertising costs—
Advertising costs are expensed as incurred. Advertising costs
were ¥90,977 million, ¥94,821 million and ¥104,209 million, which
are included in the selling, general and administrative expenses in
the consolidated statements of income, for the fiscal years ended
March 31, 2011, 2012 and 2013, respectively.
For the fiscal year ended March 31, 2011, NTT DOCOMO
repurchased a total of 138,141 shares of its stock for ¥20,000 mil-
lion. As a result, NTT’s interest in NTT DOCOMO increased from
66.4% to 66.7%. “Additional paid-in capital” increased by ¥1,964
million in the consolidated balance sheet as of March 31, 2011 as a
result of the repurchases. The repurchases of shares by NTT
DOCOMO resulting in changes in NTT’s ownership interest in NTT
DOCOMO have been accounted for as equity transactions with
noncontrolling interests since April 2009.
Foreign currency exchange results (mainly arising from foreign
currency borrowings) for the fiscal years ended March 31, 2011,
2012 and 2013 were losses of ¥17,424 million, ¥1,535 million and a
gain of ¥3,250 million, respectively, and are included in “Other, net”
in the consolidated statements of income. Foreign currency
exchange loss for the fiscal year ended March 31, 2011 is mainly
attributable to the derivative contract to manage the foreign
exchange risk associated with overseas investments.
Derivative instruments and, hedging activities—
In the normal course of business, NTT Group has certain finan-
cial instruments including long-term debt and other financial assets
and liabilities incurred. Such financial instruments are exposed to the
market risk of interest rate changes and foreign currency fluctua-
tions. In applying a consistent risk management strategy for the
purpose of reducing such risk, NTT Group uses derivative financial
instruments, such as forward exchange contracts, interest rate
swap agreements and currency swap agreements. NTT Group
does not use derivative financial instruments for trading or specula-
tive purposes.
Foreign Currency exchange Rate Risk management—
NTT Group from time to time enters into forward foreign
exchange contracts, currency swap agreements and currency option
agreements to hedge the risk of fluctuations in foreign currency
exchange rates principally associated with long-term debt issued by
NTT Group denominated in foreign currencies. Such contracts and
agreements have the same maturity as the underlying debt.
interest Rate Risk management—
NTT Group’s exposure to market risk for changes in interest
rates relates principally to its debt obligations. NTT Group has long-
term debt primarily with fixed rates. Interest rate swap agreements
are entered into from time to time to convert floating rate underlying
debt or assets into fixed rate debt or assets, or vice versa. Interest
rate option contracts are entered into from time to time to hedge the
risk of a rise in the interest rate of underlying debt. These instru-
ments are executed with creditworthy financial institutions.
17. ReSeaRCh anD DeveloPment exPenSeS anD aDveRtiSing CoStS:
18. SubSiDiaRY StoCk tRanSaCtionS:
19. FoReign CuRRenCY exChange gain anD loSS:
20. FinanCial inStRumentS:
notes to Consolidated Financial Statements
NIP
PO
N T
ELE
GR
AP
H A
ND
TE
LEP
HO
NE
CO
RP
OR
AT
ION
A
NN
uA
L R
EP
OR
T 2
01
3
120
NIP
PO
N T
ELE
GR
AP
H A
ND
TE
LEP
HO
NE
CO
RP
OR
AT
ION
A
NN
uA
L R
EP
OR
T 2
01
3
121

Not
es to
Con
solid
ated
Fin
anci
al S
tate
men
ts
Fair value hedge—
The derivatives designated as fair value hedges include interest
rate swap agreements that are used for reducing the risk arising from
the changes in the fair value of fixed rate debt. The notional principal
amounts of these derivatives were ¥1,287 million at March 31, 2012.
As discussed in note 9, NTT Group issues a variety of long-term debt
bearing several types of interest and denominated in several curren-
cies. NTT Group has a strategy to fix the anticipated cash flow
related to those debts. From time to time, however, NTT Group
entersintopay-floating/receive-fixedinterestrateswaps,toprotect
the fair value of certain fixed rate debts in asset and liability
management. Both the derivatives designated as fair value hedges
and hedged items are reflected at fair value in the consolidated bal-
ance sheets. Changes in the fair value of the derivatives that are
highly effective as, and that are designated and qualified as fair value
hedges, along with changes in the fair value of the hedged items that
are attributable to the hedged risk, are recognized as “Other, net” in
the consolidated statements of income. Changes in the fair value of
the derivatives designated as fair value hedges and the hedged items
recorded in the consolidated statements of income for the fiscal year
ended March 31, 2011, 2012 and 2013 were as follows:
Cash Flow hedge—
The derivatives designated as cash flow hedges include forward
exchange contracts, currency swap agreements and interest rate
swap agreements. As discussed in note 9, NTT Group has foreign
currency exposures related to its long-term debt denominated in
currencies other than yen. In accordance with NTT Group’s strategy,
NTT Group fixes the anticipated cash flows of paying interest and
principal amounts by entering into foreign currency contracts and
foreign currency swaps, to ensure its cash flows are fixed in yen.
Also, as discussed in note 9, NTT Group has floating rate debt
exposures related to its long-term debt. In accordance with NTT
Group strategy, NTT Group fixes the anticipated cash flows of inter-
estpaymentbyenteringintopay-fixed/receive-floatinginterestrate
swaps. Changes in the fair value of derivatives that are highly effec-
tive as, and that are designated and qualified as cash flow hedges
are recorded in other comprehensive income (loss), until changes in
cash flows from the hedged transactions are recognized as “Other,
net” in the consolidated statements of income. For all periods pre-
sented, these cash flow hedges were effective and the amount rep-
resenting the ineffectiveness of the hedges was not material. In
addition, there was no material amount excluded from the assess-
ment of hedge effectiveness of cash flow hedges.
Millions of yen
2011 2012 2013
Consolidated statement of income item
Changes in the fair value of the derivatives
Changes in the fair value of the hedged items
Changes in the fair value of the derivatives
Changes in the fair value of the hedged items
Changes in the fair value of the derivatives
Changes in the fair value of the hedged items
Other, net ¥(1,647) ¥1,647 ¥(1,650) ¥1,650 ¥(0) ¥0
The amount of ineffectiveness of these fair value hedges, which were reflected in earnings, was not material for all periods presented. In
addition, there was no amount excluded from the assessment of hedge effectiveness of fair value hedges.
The notional principal amounts of cash flow hedges at March 31, 2012 and 2013 were as follows:
Millions of yen
2012 2013
Forward exchange contracts ¥ 13,059 ¥ 10,545
Interest rate swap agreements 124,280 97,686
Currency swap agreements ¥ 77,966 ¥152,204
Changes in the fair value of cash flow hedges recorded in other comprehensive income (loss) for the fiscal years ended March 31, 2012
and 2013 were as follows:
Millions of yen
2012 2013
Forward exchange contracts ¥(294) ¥ (472)
Interest rate swap agreements (822) (1,327)
Currency swap agreements 350 2,158
Total ¥(766) ¥ 359
Amounts of gain (loss) on cash flow hedges reclassified from accumulated other comprehensive income (loss) into earnings for the fiscal
years ended March 31, 2011, 2012 and 2013 were as follows:
Millions of yen
Consolidated statements of income item 2011 2012 2013
Forward exchange contracts Other, net ¥ (114) ¥ (264) ¥ 32
Interest rate swap agreements Other, net (654) (1,173) (914)
Currency swap agreements Other, net 1,919 604 3,362
Total ¥1,150 ¥ (833) ¥2,480
As of March 31, 2013, approximately ¥967 million of deferred net income on derivative instruments in accumulated other comprehensive
income (loss) are expected to be reclassified as earnings during the next twelve months when the related interest expense is recognized.
Derivatives not Designated as hedging instruments—
NTT Group has forward exchange contracts, currency swap agreements and currency option agreements to hedge currency exchange
risks and also has interest rate swap agreements to manage interest rate risks. Some of these derivative financial instruments are not desig-
nated as hedging instruments.
The notional principal amounts of the derivatives not designated as hedging instruments at March 31, 2012 and 2013 were as follows:
Millions of yen
2012 2013
Forward exchange contracts ¥52,253 ¥ 49,367
Interest rate swap agreements 89,376 306,162
Currency swap agreements 288 147
Currency option agreements 7,520 17,728
Changes in the fair value of the derivatives not designated as hedging instruments recorded in the consolidated statements of income for
the fiscal years ended March 31, 2011, 2012 and 2013 were as follows:
Millions of yen
Consolidated statements of income item 2011 2012 2013
Forward exchange contracts Other, net ¥(4,815) ¥1,254 ¥(815)
Interest rate swap agreements Other, net 74 (118) 152
Currency swap agreements Other, net (14) 30 (34)
Currency option agreements Other, net (3,426) 763 727
Total ¥(8,181) ¥1,929 ¥ 30
Changes in the fair value of the derivatives for the fiscal year ended March 31, 2011 in the table above include forward exchange contracts
and call option agreements entered into to manage the foreign exchange risk associated with overseas investments.
Fair value of Financial instruments—
The table that follows provides the estimated fair value of financial instruments. Assets and liabilities with carrying amounts that approxi-
mate fair values are not included in the table; such as cash and cash equivalents, notes and accounts receivable, trade, short-term borrow-
ings, accounts payable, trade, and accrued payroll. Fair value information regarding “Marketable securities and other investments” is disclosed
in note 7.
Millions of yen
2012 2013
Carrying amount Fair value Carrying amount Fair value
Long-term debt including current portion ¥4,166,783 ¥4,386,409 ¥3,937,935 ¥4,178,710
The fair value of long-term debt, including the current portion, is measured at discount rates for similar debt instruments of comparable
maturities currently offered by NTT Group, which is classified as Level 2.
notes to Consolidated Financial Statements
NIP
PO
N T
ELE
GR
AP
H A
ND
TE
LEP
HO
NE
CO
RP
OR
AT
ION
A
NN
uA
L R
EP
OR
T 2
01
3
122
NIP
PO
N T
ELE
GR
AP
H A
ND
TE
LEP
HO
NE
CO
RP
OR
AT
ION
A
NN
uA
L R
EP
OR
T 2
01
3
123

Not
es to
Con
solid
ated
Fin
anci
al S
tate
men
ts
The fair value of derivative instruments and amounts recorded in the consolidated balance sheets at March 31, 2012 and 2013 are as follows.
The fair value of derivative instruments are measured by inputs derived principally from observable market data provided by financial institutions.
Millions of yen
Assets 2012 2013
Derivatives designated as hedging instruments:
Forward exchange contracts
Prepaid expenses and other current assets ¥ 76 ¥ 202
Interest rate swap agreements
Other assets 153 4
Currency swap agreements
Prepaid expenses and other current assets 1,809 1
Other assets 321 21,902
Subtotal 2,359 22,109
Derivatives not designated as hedging instruments:
Forward exchange contracts
Prepaid expenses and other current assets 822 518
Other assets 22 18
Interest rate swap agreements
Other assets — 92
Currency swap agreements
Prepaid expenses and other current assets — 1
Other assets 30 —
Subtotal 874 629
Total ¥3,233 ¥22,738
Millions of yen
Liabilities 2012 2013
Derivatives designated as hedging instruments:
Forward exchange contracts
Other (Current liabilities) ¥ 304 ¥ 10
Interest rate swap agreements
Other (Current liabilities) 248 196
Other (Long-term liabilities) 728 1,135
Currency swap agreements
Other (Current liabilities) 1,769 3
Other (Long-term liabilities) — 269
Subtotal 3,049 1,613
Derivatives not designated as hedging instruments:
Forward exchange contracts
Other (Current liabilities) 609 540
Other (Long-term liabilities) 82 101
Interest rate swap agreements
Other (Current liabilities) 168 53
Other (Long-term liabilities) 533 588
Currency swap agreements
Other (Current liabilities) — 5
Currency option agreements
Other (Current liabilities) 235 40
Other (Long-term liabilities) 861 329
Subtotal 2,488 1,656
Total ¥5,537 ¥3,269
Contingent Features in Derivative instruments—
At March 31, 2013, NTT Group had no material derivative
instruments that contain credit-risk-related contingent features,
which would have a material adverse effect on NTT’s consolidated
financial position or results of operations.
Concentrations of Credit Risk—
NTT Group does not have any significant concentration of busi-
ness transacted with an individual counter-party or groups of coun-
ter-parties that could, if suddenly eliminated, severely impact its
operations at March 31, 2013.
NTT Group has certain “Financing receivables” including
loans and lease receivables. These financing receivables are mainly
held by the financial subsidiaries of NTT. NTT manages these
financing receivables by classifying them into “Installment sales
receivable,” “Lease receivable,” “Loans receivable,” “Credit receivable”
and “Others.”
The allowance for doubtful accounts against financing receiv-
ables collectively evaluated for impairment is computed based on
each historical bad debt experience. The allowance for doubtful
accounts against financing receivables individually evaluated for
impairment is computed based on the estimated uncollectible
amount based on the analysis of certain individual accounts. In
addition, financial receivables that are determined to be uncollectible
due to, among other factors, the condition of the debtor are written
off at the time of determination.
21. FinanCial ReCeivableS:
Rollforward of allowance for credit losses and recorded investment in financing receivables for the fiscal years ended March 31, 2012 and
2013 are as follows:
Millions of yen
2012
Installment sales receivable Lease receivable Loans receivable Credit receivable Others Total
Allowance for credit losses:
Balance at March 31, 2011 ¥ 7,593 ¥ 26,391 ¥12,091 ¥ 4,877 ¥ 73 ¥ 51,025
Provision 3,568 (5,924) (1,238) 2,546 59 (989)
Charge off (3,688) (3,673) (2,481) (2,740) (54) (12,636)
Balance at March 31, 2012 7,473 16,794 8,372 4,683 78 37,400
collectively evaluated for impairment 6,439 7,686 3,935 4,683 6 22,749
individually evaluated for impairment 1,034 9,108 4,437 — 72 14,651
Financing receivable:
Balance at March 31, 2012 ¥336,980 ¥375,506 ¥65,564 ¥223,821 ¥1,439 ¥1,003,310
collectively evaluated for impairment 335,597 363,345 57,233 223,821 1,367 981,363
individually evaluated for impairment 1,383 12,161 8,331 — 72 21,947
Millions of yen
2013
Installment sales receivable Lease receivable Loans receivable Credit receivable Others Total
Allowance for credit losses:
Balance at March 31, 2012 ¥ 7,473 ¥ 16,794 ¥ 8,372 ¥ 4,683 ¥ 78 ¥ 37,400
Provision 2,900 (2,967) (1,957) 2,132 29 137
Charge off (3,558) (2,547) (285) (3,428) — (9,818)
Recovery 14 143 24 3 — 184
Balance at March 31, 2013 6,829 11,423 6,154 3,390 107 27,903
collectively evaluated for impairment 6,275 4,375 1,002 3,390 3 15,045
individually evaluated for impairment 554 7,048 5,152 — 104 12,858
Financing receivable:
Balance at March 31, 2013 ¥574,375 ¥347,417 ¥92,624 ¥239,529 ¥442 ¥1,254,387
collectively evaluated for impairment 573,698 338,046 84,294 239,529 338 1,235,905
individually evaluated for impairment 677 9,371 8,330 — 104 18,482
notes to Consolidated Financial Statements
NIP
PO
N T
ELE
GR
AP
H A
ND
TE
LEP
HO
NE
CO
RP
OR
AT
ION
A
NN
uA
L R
EP
OR
T 2
01
3
124
NIP
PO
N T
ELE
GR
AP
H A
ND
TE
LEP
HO
NE
CO
RP
OR
AT
ION
A
NN
uA
L R
EP
OR
T 2
01
3
125

Not
es to
Con
solid
ated
Fin
anci
al S
tate
men
ts
Among financing receivables, the main receivables held by the financial subsidiaries are recognized as being in arrears on the basis of time
passed since the payment date. Financing receivables determined to have no prospects for collecting contractual interest on the basis of past
due date and other factors are no longer recorded as accruing interest.
Financing receivables on nonaccrual status at March 31, 2012 and 2013 are as follows:
Millions of yen
2012 2013
Installment sales receivable ¥ 434 ¥ 320
Lease receivable 8,922 7,239
Loans receivable 9,251 9,035
Credit receivable 1,342 848
Others 74 240
Total ¥20,023 ¥17,682
NTT determines the credit quality of financial receivables on the basis of arrearages of receivables and the conditions of debtors, among
other factors. Financing receivables for which arrearages continue over a long period are classified as “nonperforming receivables,” and all
other receivables are classified as “performing receivables.” Analysis of the age of the recorded investment in financing receivables at March
31, 2012 and 2013 are as follows:
Millions of yen
2012
Performing Nonperforming
Total
Greater than 90 days
and accruingCurrent 1-89 days past due Greater than 90 days
Installment sales receivable ¥330,976 ¥1,576 ¥ 4,428 ¥336,980 ¥ 186
Lease receivable 400,128 3,453 10,368 413,949 1,447
Credit receivable 219,617 2,943 1,342 223,902 —
Others 2,191 5 69 2,265 —
Total ¥952,912 ¥7,977 ¥16,207 ¥977,096 ¥1,633
Millions of yen
2012
Performing Nonperforming
TotalPast due
and accruingCurrent Past due
Loans receivable ¥196,056 ¥9,372 ¥205,428 ¥—
Millions of yen
2013
Performing Nonperforming
Total
Greater than 90 days
and accruingCurrent 1-89 days past due Greater than 90 days
Installment sales receivable ¥ 569,533 ¥1,610 ¥ 3,232 ¥ 574,375 ¥ 649
Lease receivable 381,643 4,429 8,265 394,337 1,026
Credit receivable 236,375 2,306 848 239,529 —
Others 1,883 — 56 1,939 —
Total ¥1,189,434 ¥8,345 ¥12,401 ¥1,210,180 ¥1,675
Millions of yen
2013
Performing Nonperforming
TotalPast due
and accruingCurrent Past due
Loans receivable ¥227,050 ¥8,672 ¥235,722 ¥—
NTT Group classifies financing receivables as impaired when, based on current information and events, it is probable that NTT will be
unable to collect all amounts due according to the contractual terms of the loan agreement, and identifies such impaired receivables as
“Impaired financing receivables.” Impaired financing receivables at March 31, 2012 and 2013 are as follows:
Millions of yen
2012
Recorded Investment Related Allowance unpaid Principal BalanceAverage Recorded
Investment
With an allowance recorded ¥9,071 ¥5,236 ¥9,071 ¥10,405
With no related allowance recorded 5 — 56 20
Millions of yen
2013
Recorded Investment Related Allowance unpaid Principal BalanceAverage Recorded
Investment
With an allowance recorded ¥8,337 ¥5,281 ¥8,337 ¥8,584
With no related allowance recorded 6 — 459 5
The aggregate amount of payments for commitments outstanding at March 31, 2013, including commitments for purchase of property,
plant and equipment and other assets is as follows:
Fiscal year ending March 31 Millions of yen
2014 ¥346,677
2015 34,691
2016 4,982
2017 1,434
2018 1,099
Thereafter 2,538
Total ¥391,421
Contingent liabilities at March 31, 2013 for loans guaranteed, among other things, amounted to ¥40,949 million.
At March 31, 2013, NTT Group had no material litigation or claims outstanding, pending or threatened against it, which would be expected
to have a material adverse effect on NTT’s consolidated financial position or results of operations.
22. CommitmentS anD Contingent liabilitieS:
notes to Consolidated Financial Statements
NIP
PO
N T
ELE
GR
AP
H A
ND
TE
LEP
HO
NE
CO
RP
OR
AT
ION
A
NN
uA
L R
EP
OR
T 2
01
3
126
NIP
PO
N T
ELE
GR
AP
H A
ND
TE
LEP
HO
NE
CO
RP
OR
AT
ION
A
NN
uA
L R
EP
OR
T 2
01
3
127

Not
es to
Con
solid
ated
Fin
anci
al S
tate
men
ts
There were no significant business combinations for the fiscal
year ended March 31, 2012 and 2013.
Business combinations for the fiscal year ended March 31, 2011
were mainly as follows.
Dimension Data—
On October 25, 2010, NTT completed its acquisition of 96.6%
of the ordinary shares of Dimension Data Holdings plc, an English
public limited company based in the Republic of South Africa whose
shares were traded on the London Stock Exchange and the Johan-
nesburg Stock Exchange, by means of a recommended cash offer
for ¥260,571 million. On December 13, 2010, Dimension Data
become a wholly-owned subsidiary after NTT acquired the remain-
ing 3.4% of the ordinary shares for ¥9,421 million.
This acquisition is expected to increase NTT’s competitiveness
by integrating NTT’s strength in providing managed network services
and data centers with Dimension Data’s strength in offering develop-
ment, operation and maintenance of IT infrastructure.
Amortizable intangible assets acquired of ¥85,521 million con-
sist of customer-related assets having a weighted average useful life
of eleven years. Non-amortizable intangible assets acquired of
¥23,170 million consist of trademarks for which useful lives cannot
be determined.
Operating revenues and operating income (loss) of Dimension
Data and its subsidiaries included in the consolidated statements of
operations for the fiscal year ended March 31, 2011 were ¥78,461
million and ¥(813) million, respectively, including the amortization
expense for intangible assets and other items of ¥3,011 million
noted above. The results of operations of Dimension Data and its
subsidiaries are consolidated with the NTT Group on a three months
lag period. Therefore, the results of operations of Dimension Data
and its subsidiaries for the period from the acquisition date to
December 31, 2010 are included in the consolidated statement of
income for the fiscal year ended March 31, 2011.
23. buSineSS CombinationS:
Acquisition-related costs totaling ¥2,031 million are included in “Selling, general and administrative expenses” in the consolidated state-
ments of income for the year ended March 31, 2011. The business combination of Dimension Data was accounted for by applying the acquisi-
tion method. The following table summarizes the amounts of the assets acquired and liabilities assumed at the acquisition date, as well as the
fair value at the acquisition date of the noncontrolling interest in Dimension Data.
Millions of yen
Recognized amounts of identifiable assets acquired and liabilities assumed
Cash and cash equivalents ¥ 48,623
Notes and accounts receivable, trade 82,566
Current assets (other) 47,905
Property, plant and equipment 30,090
Other intangible assets 108,705
Other assets 18,047
Total assets acquired 335,936
Accounts payable, trade 48,321
Current liabilities (other) 107,733
Long-term liabilities 49,868
Total liabilities assumed 205,922
Total net assets acquired 130,014
Noncontrolling interest in Dimension Data (20,931)
Goodwill 151,488
Acquisition cost 260,571
Operating revenues, Operating income, Net income attributable to NTT and Earnings per share for the fiscal years ended March 31, 2011,
on an unaudited pro forma basis as though Dimension Data and its subsidiaries had been consolidated as of April 1, 2009, were as follows:
Millions of yen
2011
Operating revenues ¥10,670,714
Operating income 1,225,016
Net income attributable to NTT 514,881
Earnings per share (Yen) 389.13
keane—
On December 31, 2010, NTT DATA completed its business
combination with Keane International Inc., a u.S. based company,
for total cash consideration of ¥95,342 million, and Keane became a
wholly owned subsidiary of NTT DATA. This acquisition is expected
to enable NTT DATA to provide fully integrated IT services in the u.S.
in addition to the strong global SAP service capabilities it has built to
date. This business combination has been accounted for by apply-
ing the acquisition method. The fair values of the assets acquired
and liabilities assumed, as well as the resulting goodwill recognized
as of the acquisition date were ¥74,786 million, ¥60,843 million and
¥81,399 million, respectively. Certain required disclosures such as
pro forma information are not provided due to the immateriality of
this business combination. Due to the integration and reorganization
of business at NTT DATA group companies in North America, Keane
International, Inc. changed its name to NTT DATA International Ser-
vices, Inc. on January 31, 2012.
Please see note 13 regarding NTT’s repurchase of its common stock.
24. SubSequent eventS:
notes to Consolidated Financial Statements
NIP
PO
N T
ELE
GR
AP
H A
ND
TE
LEP
HO
NE
CO
RP
OR
AT
ION
A
NN
uA
L R
EP
OR
T 2
01
3
128
NIP
PO
N T
ELE
GR
AP
H A
ND
TE
LEP
HO
NE
CO
RP
OR
AT
ION
A
NN
uA
L R
EP
OR
T 2
01
3
129

Rep
orto
fInd
epen
dentReg
isteredPub
licAcc
ountingFirm
/
Ref
eren
ce In
form
atio
n
Report of independent Registered Public accounting Firm Reference information
Reconciliation of management indices
Billions of yen
Reconciliation of Management Indices 2009 2010 2011 2012 2013
Operating income ¥ 1,109.8 ¥ 1,117.7 ¥ 1,214.9 ¥ 1,223.0 ¥ 1,202.0 D epreciation and loss on disposal of property,
plant and equipment 2,260.1 2,123.1 2,067.3 1,996.2 2,005.5 EBITDA 3,369.8 3,240.8 3,282.2 3,219.1 3,207.4 Operating revenues 10,419.8 10,181.4 10,305.0 10,507.4 10,700.7 EBITDA margin 32.4% 31.8% 31.9% 30.6% 30.0%
Operating income 1,109.8 1,117.7 1,214.9 1,223.0 1,202.0 D epreciation and loss on disposal of property,
plant and equipment 2,260.1 2,123.1 2,067.3 1,996.2 2,005.5 EBITDA 3,369.8 3,240.8 3,282.2 3,219.1 3,207.4 Capital investment 2,145.1 1,987.1 1,870.1 1,946.6 1,970.0 Operating free cash flow 1,224.8 1,253.7 1,412.1 1,272.5 1,237.5
Operating income 1,109.8 1,117.7 1,214.9 1,223.0 1,202.0 Statutory tax rate 41% 41% 41% 41% 38%Operatingincomex(1–Statutorytaxrate) 655.8 660.3 717.8 722.5 742.1 Operating capital employed1 ¥12,142.7 ¥12,238.6 ¥12,427.0 ¥12,365.4 ¥12,255.8 ROCE 5.4% 5.4% 5.8% 5.8% 6.1%
Note 1. Operating capital employed is total of average value of shareholders’ equity and interest-bearing liabilities for the current term, and the previous term.
Reconciliation of Capital investmentBillions of yen
Reconciliation of Capital Investment 2009 2010 2011 2012 2013
Payments for property, plant and equipment ¥1,412.0 ¥1,370.9 ¥1,410.8 ¥1,395.1 ¥1,538.1 Payments for acquisition of intangible fixed assets — 545.4 484.2 458.2 446.6 Acquisition of intangible assets and other assets 617.0 — — — —Total ¥2,029.0 ¥1,916.3 ¥1,895.0 ¥1,853.3 ¥1,984.7 Differences between capital investment (116.1) (70.8) 24.9 (93.3) 14.7
Calculation of aRPu
Average monthly revenue per unit, or ARPu, is used to measure average monthly operating revenues attributable to each designated service
on a per user basis. In the case of NTT Group’s fixed-line business, ARPu is calculated by dividing revenue items included in the operating
revenues of NTT Group’s regional communications business segment, that is, telephone subscriber lines, INS-NET and FLET’S Hikari, by the
number of Active Subscribers to the relevant services. In the case of mobile communications business, ARPu is calculated by dividing revenue
items included in operating revenues from NTT Group’s mobile communications business segment, such as revenues from FOMA mobile
phoneservicesandXimobilephoneservices,thatareincurredconsistentlyeachmonth(i.e.,basicmonthlychargesandvoice/packettrans-
mission charges), by the number of Active Subscribers to the relevant services. The calculation of these figures excludes revenues that are not
representative of monthly average usage, such as telecommunications equipment sales, activation fees and universal service charges.
NTT believes that its ARPu figures calculated in this way provide useful information regarding the monthly average usage of its subscribers.
The revenue items included in the numerators of NTT Group’s ARPu figures are based on its financial results comprising its u.S. GAAP results
of operations.
Notes:
1 NTT separately computes the following four categories of ARPu for the fixed-line business conducted by each of NTT East and NTT
West, using the following measures:
•AggregateFixed-lineARPU(TelephoneSubscriberLines+INS-NETSubscriberLines):Calculatedbasedonrevenuesfrommonthly
charges and call charges for Telephone Subscriber Lines and INS-NET Subscriber Lines, which are included in operating revenues
from Voice Transmission Services (excluding IP Services), and revenues from FLET’S ADSL and FLET’S ISDN, which are included in
operating revenues from IP Services.
• Telephone Subscriber Lines ARPu: Calculated based on revenues from monthly charges and call charges for Telephone Subscriber
Lines and revenues from FLET’S ADSL.
NIP
PO
N T
ELE
GR
AP
H A
ND
TE
LEP
HO
NE
CO
RP
OR
AT
ION
A
NN
uA
L R
EP
OR
T 2
01
3
130
NIP
PO
N T
ELE
GR
AP
H A
ND
TE
LEP
HO
NE
CO
RP
OR
AT
ION
A
NN
uA
L R
EP
OR
T 2
01
3
131

Referen
ceIn
form
ation/Con
solidated
Sub
sidiaries
Consolidated SubsidiariesAs of March 31, 2013
Company Capital Voting rights ratio Main line(s) of business
Consolidated subsidiaries Millions of yen %
Regional CommuniCationS buSineSS SegmentNIPPON TELEGRAPH AND TELEPHONE EAST CORPORATION
335,000 100.00 Regional telecommunications services in eastern Japan. NTT (Holding Company) is making long-term capital loans to NTT East.
NIPPON TELEGRAPH AND TELEPHONE WEST CORPORATION
312,000 100.00 Regional telecommunications services in western Japan. NTT (Holding Company) is making long-term capital loans to NTT West.
NTT EAST-TOKYO CORPORATION 50 100.00 Consigned sales of telecommunications services provided by NTT East
NTT-ME CORPORATION 100 100.00 IT-related consulting, products and services planning, development, sales, and maintenance
NTT INFRASTRuCTuRE NETWORK CORPORATION
2,000 100.00 Survey, engineering, installation, and maintenance of telecommunications facilities
NTT WEST-KANSAI CORPORATION 100 100.00 Consigned sales of telecommunications services provided by NTT West
NTT NEOMEIT CORPORATION 100 100.00 Maintenance and operation of information sharing networks, planning, development, and sales of IT solutions
NTT MARKETING ACT CORPORATION 100 100.00 Systems integration, IT solution service provider, telemarketing, and human resource solutions
NTT DIRECTORY SERVICES Co. 3,500 100.00 Publishing of telephone directories; directory assistance and related services
NTT Quaris Corporation 558 100.00 Printing of telephone directories and commercial printing
TelWel East Japan Corporation 3,000 100.00 Staffing, telegraph, and office solution services
NTT Solco Corporation 100 100.00 Planning and implementation of telemarketing services
NTT CARD SOLuTION CORP. 100 84.54 Telephone card planning and sales, encoding practice, and pre-paid card planning and sales
NTT TELECON Co., Ltd. 400 86.95 Remote meter reading and control, development of security and other systems, sales and construction work, and maintenance services
NTT SOLMARE CORPORATION 100 100.00 Various content distribution businesses, including distribution of comics to mobile phones
NTT WEST ASSET PLANNING CORPORATION 110 100.00 Real estate leasing and brokerage, as well as maintenance and management
TelWel West Nippon Corporation 3,000 100.00 Staffing, telegraph, and office solution services
long DiStanCe anD inteRnational CommuniCationS buSineSS SegmentNTT COMMuNICATIONS CORPORATION 211,763 100.00 Long distance and international telecommunications services, and multimedia
network services. NTT (Holding Company) is making long-term capital loans to NTT Communications.
Dimension Data Holdings plc uSD388.52 million
100.00 Management of Dimension Data Group
NTT PC Communications Incorporated 4,000 100.00 Telecommunications business as defined in the Telecommunications Business Law
NTT Plala Inc. 12,321 95.39 Provision of Internet connection and video distribution services
NTT Resonant Inc. 25,000 100.00 Development and provision of broadband portal services and search services
NTT America, Inc. uSD985.74 million
100.00 Provision of Arcstar services in the u.S.
NTT EuROPE LTD. GBP153.83 million
100.00 Provision of Arcstar services in Europe
NTT COM ASIA LIMITED HKD324.55 million
100.00 Provision of Arcstar services in Hong Kong
NTT WT HK Limited HKD1,540.18 million
100.00 Construction and operation of data center facilities in Hong Kong
NTT AuSTRALIA PTY. LTD. AuD218.73 million
100.00 Provision of Arcstar services in Australia
Verio Inc. uSD7,489.91 million
100.00 Provision of Internet solution services in the u.S.
Integralis AG EuR35.94 million
80.13 Consulting on security solutions, provision of integration, and security services
NTT WORLD ENGINEERING MARINE CORPORATION
1,400 100.00 Laying, maintenance, repair, and management of underwater cabling
NTT WORLDWIDE TELECOMMuNICATIONS CORPORATION
16,200 100.00 Construction and implementation of overseas data centers
Spectrum Holdings Inc uSD3,987.32 million
100.00 Management of Dimension Data Holdings plc’s subsidiary companies in Europe
Dimension Data Commerce Centre Ltd uSD1,420.02 million
100.00 Sales of communications equipments in the u.S.
Dimension Data (uS) II Inc uSD822.86 million
100.00 Investment in the u.S.
Dimension Data (uS) Inc uSD480.24 million
100.00 Management of Dimension Data Holdings plc’s subsidiary companies in the u.S.
Dimension Data North America, Inc uSD375.56 million
100.00 Provision of IT facility infrastructure development, and maintenance support
• INS-NET Subscriber Lines ARPu: Calculated based on revenues from monthly charges and call charges for INS-NET Subscriber
Lines and revenues from FLET’S ISDN.
• FLET’S Hikari ARPu: Calculated based on revenues from FLET’S Hikari (including FLET’S Hikari optional services), which are
included in operating revenues from IP Services and Supplementary Business, and revenues from monthly charges, call charges and
device connection charges for Hikari Denwa, which are included in operating revenues from IP Services.
–FLET’SHikariincludesBFLET’S,FLET’SHikariNext,FLET’SHikariLightandFLET’SHikariWiFiAccessprovidedbyNTT
East, and B FLET’S, FLET’S Hikari Premium, FLET’S Hikari Mytown, FLET’S Hikari Next, FLET’S Hikari Light and FLET’S
Hikari WiFi Access provided by NTT West.
2 Revenues from interconnection charges are excluded from the calculation of Aggregate Fixed-line ARPu (Telephone Subscriber Lines
+INS-NETSubscriberLines),TelephoneSubscriberLinesARPU,INS-NETSubscriberLinesARPU,andFLET’SHikariARPU.
3 ForpurposesofcalculatingAggregateFixed-lineARPU(TelephoneSubscriberLines+INS-NETSubscriberLines),Telephone
Subscriber Lines ARPu and INS-NET Subscriber Lines ARPu, the number of subscribers is determined using the number of lines
for each service.
4 In terms of number of channels, transmission rate, and line use rate (base rate), INS-Net 1500 is in all cases roughly ten times greater
than INS-Net 64. For this reason, one INS-Net 1500 subscription is calculated as ten INS-Net 64 subscriptions.
5 For purposes of calculating FLET’S Hikari ARPu, number of subscribers is determined based on number of FLET’S Hikari subscribers
(including B FLET’S, FLET’S Hikari Next, FLET’S Hikari Light and FLET’S Hikari WiFi Access provided by NTT East and B FLET’S,
FLET’S Hikari Premium, FLET’S Hikari Mytown, FLET’S Hikari Next, FLET’S Hikari Light and FLET’S Hikari WiFi Access provided by
NTT West).
6 NTT computes ARPu for NTT DOCOMO as follows:
•MobileAggregateARPU=VoiceARPU+PacketARPU+SmartARPU.
• NTT DOCOMO’s Voice ARPu is based on operating revenues related to voice services, such as basic monthly charges and voice
communication charges, and its Packet ARPu is based on operating revenues related to packet services, such as basic monthly
charges, flat monthly fees and packet communication charges attributable to its “FOMA” and “Xi” services and its Smart ARPu is
based on operating revenues from providing services incidental to “FOMA” and “Xi” wireless communications services (content
services related revenues, fee collection agency commissions, handset warranty service revenues, advertising revenues, etc.).
• NTT DOCOMO started to use the Smart ARPu metric during the three months ended September 30, 2012. As a result, Smart ARPu
will now be included in Mobile Aggregate ARPu. In addition, the following amounts (content services related revenues) that were
formerly included in Packet ARPu will now be reclassified as Smart ARPu: 80 yen out of Packet ARPu revenues for the year ended
March 31, 2012 and 80 yen out of Packet ARPu revenues for the year ended March 31, 2013.
7 “mova” services were terminated as of March 31, 2012. “mova” service subscriptions are included in the calculations of MOu, Mobile
Aggregate ARPu, Voice ARPu and Packet ARPu for the year ended Mar. 31, 2012.
8 Communications module service subscribers, “Phone Number Storage” and “Mail Address Storage” services, and the revenues
therefrom are not included in the calculations of mobile ARPu.
9 Number of active subscribers used in the ARPu calculation of NTT East and NTT West are as below.
–FYResults:Sumofnumberofactivesubscribers*foreachmonthfromApr.toMar.
–FYForecast:Sumoftheaverageexpectedactivenumberofsubscribersduringthefiscalyear((Numberofsubscribersat
Mar.31,2012+NumberofexpectedsubscribersatMar.31,2013)/2)x12
10 Number of active subscribers used in the ARPu calculation of NTT DOCOMO are as below.
–FYResults/FYForecast:Sumofnumberofactivesubscribers*foreachmonthfromApr.toMar.
Reference information
NIP
PO
N T
ELE
GR
AP
H A
ND
TE
LEP
HO
NE
CO
RP
OR
AT
ION
A
NN
uA
L R
EP
OR
T 2
01
3
132
NIP
PO
N T
ELE
GR
AP
H A
ND
TE
LEP
HO
NE
CO
RP
OR
AT
ION
A
NN
uA
L R
EP
OR
T 2
01
3
133

Con
solid
ated
Sub
sidi
arie
s
Company Capital Voting rights ratio Main line(s) of business
Consolidated subsidiaries Millions of yen %
Datacraft Australia Pty Ltd AuD203.46 million
100.00 Management of Dimension Data Holdings plc’s subsidiary companies in Australia
NTT Com CHEO CORPORATION 495 100.00 Training, staffing and placement services, and ICT outsourcing business
NTT Com Technology Corporation 400 100.00 Planning, design, development, and sales of communications systems and information processing systems
NTT BizLink, Inc. 100 100.00 Data center maintenance and operations and visual communications
NTT Com Solution & Engineering Corporation 400 100.00 Network-related maintenance and operations and delivery
mobile CommuniCationS buSineSS SegmentNTT DOCOMO, INC. 949,679 66.66 Mobile telecommunications services, development, maintenance, and sales of
mobile telecommunications
DOCOMO Service Inc. 100 100.00 Mobile telephone market support operations
DOCOMO Engineering Inc. 100 100.00 Construction, maintenance, and operation of telecommunications equipment
DOCOMO Mobile Inc. 30 100.00 Repair of mobile telecommunications terminals and peripherals
DOCOMO Support Inc. 20 100.00 Consignment of telephone reception, transactions, etc.
DOCOMO Systems, Inc. 652 100.00 Development and operation of information systems, software, and equipment
DOCOMO Technology, Inc. 100 100.00 Research and development of telecommunications systems
DOCOMO Business Net, Inc. 100 100.00 Marketing and sales of mobile phones
DOCOMO Deutschland GmbH EuR312.16 million
100.00 Holding company for Buongiorno S.p.A. and net mobile AG
DOCOMO Communications Laboratories Europe GmbH
EuR7.50 million
100.00 Research and international standardization activities in Europe, centered on future mobile network technologies
DOCOMO Innovations, Inc. uSD7.00 million
100.00 Development of new technologies and new services and R&D activities centered on future mobile platform technologies
DOCOMO PACIFIC, INC. uSD36.67 million
100.00 Mobile telecommunications services in Guam and the Commonwealth of the Northern Mariana Islands
net mobile AG EuR84.56 million
87.36 Operation of platform for mobile content distribution, billing, and other services
NTT DOCOMO uSA, Inc. uSD30.29 million
100.00 Support of DOCOMO’s overseas business activities in the united States
PacketVideoCorporation uSD46.76 million
100.00 Development of software for mobile phones and the provision of content distribution services
D2C Inc. 3,480 54.00 Advertising creation and management using mobile content sites as media
mmbi, Inc. 24,890 60.45 Provision of basic broadcasting business specified by the Broadcast Law and its related services
OAK LAWN MARKETING, INC. 1,467 51.00 Mail-order sales centered on TV media
Tower Records Japan Inc. 6,545 50.25 Sales of music and visual products as well as music-related goods
NTT docomo Anime Store, Inc. 1,000 60.00 Animation distribution
DOCOMO Innovation Ventures, Inc 50 100.00 Fund management
DOCOMO. COM, INC. 100 100.00 Consulting services for mobile content providers
docomo Healthcare, Inc. 1,300 66.00 Provision of a platform for the management, use, and sharing of health-related data
MAGASeek Corporation 1,156 71.28 Sales of womenswear and menswear over the Internet
Radishbo-ya Co., Ltd. 867 90.00 Provides membership-based home-delivery of organic and low-pesticide vegetables and additive-free foods
Buongiorno S.p.A. EuR103.78 million
100.00 Distribution of mobile content and provision of platform services
DOCOMO Capital, Inc. uSD111.27 million
100.00 Discovery of and investment in venture companies that possess advanced technologies that can be used with mobile communications services or other innovative technologies
DOCOMO interTouch Pte. Ltd. uSD218.71 million
100.00 High-speed Internet access and video distribution for hotels
Data CommuniCationS buSineSS SegmentNTT DATA CORPORATION 142,520 54.21 Systems integration, and network systems services
NTT DATA SYSTEM TECHNOLOGIES INC. 200 100.00 Design and development of systems
NTT DATA i CORPORATION 100 100.00 Design and development of systems
NTT DATA KANSAI CORPORATION 400 100.00 Design, development, and sales of systems
NTT DATA FORCE CORPORATION 285 100.00 Design of data telecommunications systems and software development
Nihon Card Processing Co., Ltd. 2,675 71.50 Services related to credit card business
NTT DATA FINANCIAL CORE CORPORATION 100 100.00 Design and development of systems
NTT DATA FRONTIER CORPORATION 280 56.93 Design of data telecommunications systems and software development
NTT DATA SOFIA Corporation 80 95.00 Design and development of systems
NTT DATA NCB Corporation 50 70.00 Design and development of systems
Company Capital Voting rights ratio Main line(s) of business
Consolidated subsidiaries Millions of yen %
NTT DATA Getronics Corporation 831 70.00 Design and development of systems
XNET Corporation 783 51.00 Sales of systems
Japan Information Processing Service Co., Ltd. 2,460 80.00 Design and development of systems
NTT DATA INTRAMART CORPORATION 738 56.91 Sales of packaged software
NTT DATA WAVE CORPORATION 100 80.10 Design of data telecommunications systems and software development
NTT DATA BuSINESS SYSTEMS CORPORATION
100 100.00 Design, development, and sales of systems
NTT DATA CCS CORPORATION 330 60.00 Design and development of systems
NTT DATA MSE CORPORATION 200 60.00 Design and development of systems
JSOL CORPORATION 5,000 50.00 Design and development of systems
NTT DATA INTELLILINK CORPORATION 100 100.00 Design and development of systems
NJK Corporation 4,222 51.20 Design and development of systems
NTT DATA INTERNATIONAL L.L.C. uSD1,465.17 million
100.00 Management of NTT DATA CORPORATION’s subsidiary companies in North America
NTT DATA EuROPE GmbH & Co. KG EuR307.39 million
100.00 Management of NTT DATA CORPORATION’s subsidiary companies in Europe
itelligence AG EuR82.78 million
98.43 Consulting and design and development of systems
NTT DATA Deutschland GmbH EuR165.12 million
100.00 Consulting and design and development of systems
NTT DATA International Services, Inc. uSD1,171.87 million
100.00 Consulting and design and development of systems
NTT DATA, Inc. uSD1,619.46 million
100.00 Consulting and design and development of systems
NTT DATA Italia S.p.A. EuR178.06 million
100.00 Consulting and design and development of systems
NTT DATA EMEA Ltd. EuR375.83 million
100.00 Management of NTT DATA CORPORATION’s subsidiary companies in Europe
NTT DATA CuSTOMER SERVICE CORPORATION
2,000 100.00 System operations and maintenance
NTT DATA SMS CORPORATION 100 100.00 System operations
NTT DATA MANAGEMENT SERVICE CORPORATION
100 100.00 Proxy services for a variety of office work
otheR buSineSSeSNTT uRBAN DEVELOPMENT CORPORATION 48,760 67.30 Acquisition, construction, management, and rental of real estate
uD EuROPE LIMITED GBP81.80 million
100.00 Investment and operation of real estate in the u.K.
NTT FINANCE CORPORATION 16,770 99.32 Leasing and installment sales of communications equipment, office equipment, and other non-fixed equipment
NTT FACILITIES, INC. 12,400 100.00 Design, management, and maintenance of buildings, equipment, and electric power facilities
NTT COMWARE CORPORATION 20,000 100.00 Development, operation, and maintenance of telecommunications systems and software
NTT ADVANCED TECHNOLOGY CORPORATION
5,000 100.00 Technology transfer; design and development of hardware, software, and computing/telecommunicationssystems;analyticalresearchontechnicaltrends;technical consulting
NTT Electronics Corporation 6,576 95.76 Development, design, manufacture, and sales of custom LSIs and optical components for communications applications and related electronic installations and systems
NTT Software Corporation 500 100.00 Systems development; systems integration; total solutions and e-commerce consulting; product development and sales; development of advanced technologies
NTT ADVERTISING, INC. 115 100.00 Advertising and related businesses
InfoCom Research, Inc. 100 100.00 Investigation and research concerning the information and communications industry
NTT Human Solutions Corporation 100 100.00 Staffing and placement business
NTT LEARNING SYSTEMS CORPORATION 3,220 100.00 Training and development
NTT BuSINESS ASSOCIE Corporation 7,750 100.00 Real estate-related business, consigned business for company housing management, management systems, and settlement services
NTT LOGISCO Inc. 4,000 100.00 Comprehensive logistics services
Other 676 companies
Consolidated Subsidiaries
NIP
PO
N T
ELE
GR
AP
H A
ND
TE
LEP
HO
NE
CO
RP
OR
AT
ION
A
NN
uA
L R
EP
OR
T 2
01
3
134
NIP
PO
N T
ELE
GR
AP
H A
ND
TE
LEP
HO
NE
CO
RP
OR
AT
ION
A
NN
uA
L R
EP
OR
T 2
01
3
135

■ Access PointAccess point for connecting to the Internet.
■ AdvisoryServices entailing the provision of advice and proposals to customers and the resolution of issues utilizing specialized knowledge and technologies.
■ AMO (Application Management Outsourcing)The outsourcing of such tasks as the operation, maintenance, and management of business information systems and administrative software. Also, contracting to handle the various tasks provided by IT service companies, etc.
■ ARPU (Average Revenue Per User)Monthly average telecommunications revenue per subscriber.
■ B2B2C (Business to Business to Consumer)Operations that support the consumer-focused businesses of other companies.
■ Base StationAntenna and other network devices that communicate directly with mobile phones.
■ BCP (Business Continuity Plan)Plan for how to avoid the interruption of important operations when a disaster or other risk event occurs. Also, plan for the implementation of strategic business continuity preparations when conditions are normal so that, even if work activities are interrupted, important functions can be restarted during the target restoration time period and the risks associated with the interruption of important work can be minimized.
■ Big DataLarge-scale, complex collections of data, including text, graphic, chart, and voice data, that are difficult to manage or process with conventional technology.
■ BPO (Business Process Outsourcing)Outsourcing certain business processes to an outside company.
■ Business AnalyticsThe collection, analysis, and processing of information accumulated in business systems and its use in corporate management decision-making.
■ Cloud ForensicsTechnologies for the visualization and confirmation of security and safety regarding the use of data on the cloud.
■ Cloud ServicesA service format in which software and other resources are provided via a “cloud,” or a network. From the user’s perspective, cloud services provide access to services only when needed and in the amount needed, eliminating the need to purchase servers and other hardware or software.
■ CSIRT (Computer Security Incident Response Team)Team dedicated to handling information security-related problems in an organization.
■ Data CenterA facility entrusted with servers and other systems by customers that provides operation and management services, including Internet connectivity.
■ Data OffloadingDistribution of mobile phone communications to networks other than mobile phone networks to facilitate better communications.
■ Disaster RecoveryRestoration/recoveryofsystemsthathaveincurreddamage,suchasfromanatural disaster. Also refers to equipment, systems, and methods used in such restoration.
■ Edge ComputingThe use of technologies that facilitate high-speed processing on the cloud of computationally intensive tasks, making possible a variety of services without regard to the capabilities or types of the user’s devices.
■ End to EndEverything over a communications interval from the sender (one end) to the receiver (the other end).
■ Fortune Global 100Ranking of companies around the world that is released annually by Fortune, a u.S. business magazine.
■ HTML5Version 5 of the HTML markup language. A key feature of HTML5 is that it can be used to develop Web applications.
■ IaaS (Infrastructure as a Service)Service through which equipment and circuits necessary for the operation of information systems are provided through networks.
■ ICT (Information and Communications Technology)Collectively refers to technologies related to information and communications, including hardware and software used for information and communications functions of computers, and technologies used in IT systems and data communications.
■ Internet of ThingsGeneral name for technology that facilitates the concept of the Internet linking various things and linking people and things.
■ Inter-ServiceHigher-value-added services that integrate existing services with a wide range of services on the Internet. (This term was created by NTT.)
■ IP (Intellectual Property)Includes not only traditional intellectual property but also know-how in such areas as development of modularized systems and software by the NTT Group in the development of services.
■ IP BackboneBackbone network for the distribution of data throughout the world over the Internet.
■ Legacy-TypeAnalog telephone, DSL, and similar services.
■ LTE (Long Term Evolution)Telecommunications standard with features including high transmission speeds, large capacity, efficient use of radio waves, and low delay. Achieves high-speed telecommunication in a mobile phone at speeds on a par with optical fiber.
■ M2M (Machine to Machine)Technologies and mechanisms for the automatic exchange of information among machines. Collection, monitoring, and control of data from remote locations facilitates streamlined administrative processes, more-advanced services, and the creation of new services.
■ MalwareMalicious software or code that was created with the intention of conducting inappropriate or harmful actions.
■ ManagedThe provision of integrated services, including the installation, set-up, maintenance, and management operations that are necessary for the use of communications services, such as VPN.
■ Market DrivenProviding products that were planned and developed from the customer’s viewpoint, with a focus on customer needs and market feedback rather than product specifications.
■ ModularizationConsolidating structural elements into independent units by function.
■ Multi-Devicesusing multiple devices with a single common ID, facilitating the use of the optimal device in line with circumstances and preferences.
■ Natural Language ProcessingGeneral term for technologies and software for the computer processing of languages used by humans, such as Japanese and English
■ Near ShoreContracting out computer system development, operation, maintenance, management, etc., to a nearby foreign country or region or to a remote domestic location.
■ NGN (Next Generation Network)Next-generation communications network that provides the reliability and stability of conventional telephone networks while offering the flexibility and economies of IP networks.
■ NI (Network Integration)Integrated provision of such operations as network design, construction, and operation for corporations, etc.
■ O2O (Online to Offline)Linking on-line information and services with purchasing behavior, etc., at real stores.
■ OffshoreCommissioning overseas companies to handle various tasks, such as administrative work or systems development, operation, maintenance, management, etc.
■ On-PremisesMethod by which companies purchase and operate their own computer systems.
■ OnsiteA method of providing support in which an engineer goes to the user’s premises to make a repair when a system or product malfunctions.
■ Open InnovationA method of creating new products and business models through the use of in-house technologies in combination with the technologies and ideas of other companies and the visualization of product development processes.
■ Packet TelecommunicationsMethod of computer telecommunication in which data is sent and received as individual small packets.
■ PlatformA shared platform for providing various applications by linking various networks and devices, such as those for authentication, billing, intermediation, and credit.
■ Private CloudCloud service exclusively for in-house use by a company or organization.
■ Public CloudCloud service offered to the general public.
■ Salesforce.comWorldwide software company, based in California, u.S.A. Provides sales support systems and customer management systems as online services. Also used as the brand name of the services. Japanese corporation was established in 2000.
■ SeamlessNot having seams. For example, if an ATM LAN is connected to a WAN using ATM,therearenotechnologybarriers/gapsbetweenthetwosidesbecausecommon technologies are utilized, and the parties are not aware of any seams.
■ Secret SharingTechnology for dividing encrypted information into multiple files in such a way that the original information cannot be determined even if certain portions of the split-up data are leaked.
■ Secure ComputationData that has been split up through secret sharing technology is processed in such a way that the entity conducting the processing is able to obtain only the results of the processing, while the data itself remains secret.
■ SI (System Integration)Comprehensive provision of system planning, construction, operation, etc., in accordance with customer operations.
■ Social MediaMedia comprising connections among people over the Internet. unlike newspapers and broadcast media, a distinctive feature of social media is the relative ease in which individuals can send information to large numbers of other people.
■ SSC (Shared Service Center)Method of management intended to reduce costs by consolidating indirect operations, such as human resources, accounting, and general affairs, into a single location within the Group.
■ TrafficVolume of information flowing through a communications network.
■ UbiquitousThe ability to access the Internet and other information networks anytime, anywhere.
■ UI (User Interface)General term for the method of operation, usability, graphical display, etc., when a user uses a computer system.
■ Universal ServicesServices that can be used anywhere in the country with basically the same pricing and conditions. Services that are indispensable in daily life and should be provided in a fair and stable manner to all residents.
■ UX (User Experience)General term for the experience, etc., of a user when they use a product or service.
■ Value ChainThe chain of processes that create added value in the manufacturing industry, extending up to the point where products are delivered to consumers.
■ Virtual Network TechnologiesWith network devices, such as network switches and routers, technology to make a single device look like multiple devices or to make multiple devices look like a single device.
■ VPN (Virtual Private Network)A service that establishes a private virtual network inaccessible by third parties over a network. Communications services may be provided as if the VPN were a dedicated network for a specific group of users.
■ Web PortalWebsites that serve as entrances to the Internet and are the first website visited when browsing.
■ 4K Video (Ultra High Definition)High definition resolution with four times the number of pixels as the current full high definition.
Explanations of specialized terms as used in this report
geneRal it-RelateD teRmS
glossary of termsN
IPP
ON
TE
LEG
RA
PH
AN
D T
ELE
PH
ON
E C
OR
PO
RA
TIO
N
AN
Nu
AL
RE
PO
RT
20
13
136
NIP
PO
N T
ELE
GR
AP
H A
ND
TE
LEP
HO
NE
CO
RP
OR
AT
ION
A
NN
uA
L R
EP
OR
T 2
01
3
137
Glo
ssar
y of
Ter
ms

glossary of terms
■ Arcstar IP Voice (Arcstar IP Voice over Universal One)IP telephone service utilizing the Arcstar Universal One enterprise network service. With this service, voice communications are converted to IP and integrated into data communication circuits, substantially lowering communication-line maintenance and operational costs.
■ Arcstar Universal OneNew VPN service for clouds provided by NTT Communications that enables flexible packaging of different telecommunications layers and access line qualities.http://www.ntt.com/universalone_e/
■ Biz Hosting Enterprise CloudCloud service for corporate customers offered by NTT Communications. World’s first cloud service to incorporate network virtualization technology, not only in data centers but also on networks connecting data centers.http://www.ntt.com/enterprise_cloud_e/
■ BizXaaS BAAn NTT DATA service for corporate customers providing support for customer information analysis utilizing Big Data. Big Data analysis platform and standard customer information analysis reports are offered as a low-priced set.http://www.nttdata.com/global/en/services/bds/solution_platform.html
■ d marketSmartphone content marketplace operated by NTT DOCOMO. Comprises content stores and the “Applications and Reviews” section, which introduces recommended applications.http://www.nttdocomo.co.jp/english/service/entertainment/index.html
■ DOCOMO Innovation VillageA program through which NTT DOCOMO supports venture companies that have innovative services or technologies.http://www.nttdocomo.co.jp/english/info/media_center/pr/2012/001618.html
■ d videoFlat-rate video distribution service for smartphones provided through NTT DOCOMO’s d market. For ¥525 a month, subscribers can enjoy about 13,000 content items, including movies, dramas, animations, music, and BeeTV.
■ EMEAEurope, the Middle East, and Africa.
■ FLET’S HikariThe NTT Group’s fiber-optic broadband service. Services names include B FLET’S, FLET’S Hikari Next, and FLET’S Hikari Light provided by NTT East, and B FLET’S, FLET’S Hikari Premium, FLET’S Hikari Mytown, FLET’S Hikari Next, and FLET’S
Hikari Light provided by NTT West.http://www.ntt-east.co.jp/en/product/internet_flets_hikari.htmlhttp://flets-w.com/english/flets_hikari/
■ FLET’S Hikari Next Super High-Speed Type HayabusaNTT West fiber-optic broadband services offering a maximum transmission speed of 1 Gbps for both uploading and downloading data. FLET’S Hikari Next Family
Type is offered for single-dwelling units and FLET’S Hikari Next Mansion Type for multiple-dwelling units. The price is the same for either service.http://flets-w.com/english/flets_hikari/type/hikari_next_fe.html
■ FLET’S Hikari WiFi AccessService provided by NTT East and NTT West under which multiple residents of small multiple-dwelling units, such as apartments, can access the Internet by sharing a wireless LAN that is linked to a fiber-optic network.
■ FLET’S TVService provided by NTT East and NTT West that enables subscribers to receive terrestrial/BSdigitalbroadcastsusingFLET’S Hikari optical fiber.http://flets.com/english/ftv/index.html
■ Hikari DenwaA value-priced IP- and optical fiber-based telephone service using FLET’S Hikari.http://flets.com/english/hikaridenwa/index.htmlhttp://flets-w.com/english/hikari_denwa/
■ Hikari Motto Motto WariNTT West campaign offering discounts on monthly charges for FLET’S Hikari depending on the number of years of subscription, under the condition of continuous use within the applicable discount period.http://flets-w.com/english/flets_hikari/details/motto2_discount.html
■ Hikari TVA service that allows users to enjoy multi-channel broadcasting, video, karaoke, and other services by connecting FLET’S Hikari links to their TVs.http://flets.com/english/bb/hikaritv/index.html
■ Hikari TV GameJapan’s first cloud game service for TVs, offered in conjunction with the provision of a new tuner compatible with smart TVs based on Android™4.0. Available through the Hikari TV video distribution service provided by NTT Plala.
■ Monthly SupportNTT DOCOMO service that provides a discount from the monthly usage fees, with the discount varying in accordance with the model of handset purchased.http://www.nttdocomo.co.jp/english/charge/discount/monthly_support/index.html
■ Ninen-wariAn NTT East plan offering discounts on the monthly service charges for FLET’S
Hikari Next and B FLET’S services for single-dwelling units and multiple-dwelling units, conditional upon 24 consecutive months of use.https://flets.com/english/promotion/index.html
■ NOTTVNew broadcast channel for smartphones, offered by NTT DOCOMO. Provides a new method of enjoying TV in every possible location without having to select a place or time.http://www.nttdocomo.co.jp/english/service/entertainment/index.html
■ Omoikkiri WariAn NTT East campaign offering a discount on the FLET’S Hikari monthly service charges for single-dwelling units and multi-dwelling units, conditional upon 24 consecutive months of use, in an effort to increase new FLET’S Hikari subscriptions.https://flets.com/english/promotion/index.html
■ Packet Flat-Rate ServicesNTT DOCOMO service providing unlimited use of packet communications for a flat rate. General term for the following services: Xi Pake-hodai Light, Xi Pake-
hodai Flat, Xi Pake-hodai Double, Xi Raku-Raku Pake-hodai, Xi Pake-hodai for
Junior, Pake-hodai FLAT, Raku-Raku Pake-hodai, Pake-hodai simple, Pake-hodai
double, Pake-hodai double 2, and Global Pake-hodai
http://www.nttdocomo.co.jp/english/charge/packet/
■ Remote Support ServiceService provided by NTT East and NTT West in which a specialist operator provides support in response to customer inquiries regarding set-up and use of PCs and peripherals (routers, printers, software).http://flets.com/english/service/index.html
■ Shabette ConcierVoice-agent application provided by NTT DOCOMO that searches for and provides information, as well as handling mobile phone functions. Operated simply by talking into the smartphone.http://www.nttdocomo.co.jp/english/service/customize/index.html
teRmS RelateD to ntt gRouP SeRviCeS
NIP
PO
N T
ELE
GR
AP
H A
ND
TE
LEP
HO
NE
CO
RP
OR
AT
ION
A
NN
uA
L R
EP
OR
T 2
01
3
138
NIP
PO
N T
ELE
GR
AP
H A
ND
TE
LEP
HO
NE
CO
RP
OR
AT
ION
A
NN
uA
L R
EP
OR
T 2
01
3
139
Glo
ssar
y of
Ter
ms
Who We Are
ntt Group—one of the world’s largest telecommunications operators by revenues
a corporate group that offers a wide range of services, from fiber-optic broadband
and mobile communications to cloud services
Government and Public Bodies 431,231 (32.63)
Japanese Financial Institutions 202,525 (15.33)
Japanese Securities Firms 11,005 (0.83)
Other Japanese Corporations 17,125 (1.30)
Foreign Corporations, etc. 303,959 (23.00)
Japanese Individuals and Others 217,811 (16.48)
Treasury Stock 137,822 (10.43)
Corporate information
Company name NIPPON TELEGRAPH AND TELEPHONE
CORPORATION
Date of establishment April 1, 1985
Head office 3-1, Otemachi 2-chome, Chiyoda-ku,
Tokyo 100-8116, Japan
Telephone 81 (3) 5205-5111
Common stock ¥937,950,000,000
Total number of shares authorized to be issued by NTT
6,192,920,900 shares
Total number of shares issued 1,323,197,235 shares
Aggregate voting rights 11,836,580
Number of shareholders (excluding holders of fractional shares)
1,112,407
Stock exchanges on Which the Company is listed As of July 31, 2013
Tokyo (Stock Code: 9432)
New York (Ticker Symbol: NTT)
London (Ticker Symbol: NPN)
investor relations
http://www.ntt.co.jp/ir/contact_e/
Telephone: 81 (3) 5205-5581
depositary for NTT american depositary receipts (“adrs”)
JPMorgan Chase Bank N.A.
1 Chase Manhattan Plaza, Floor 58
New York, NY 10005, U.S.A.
inquiries
JPMorgan Service Center
P.O. Box 64504
St. Paul, MN 55164-0504, U.S.A.
Telephone 1-800-990-1135 (General)
1-651-453-2128 (From outside the U.S.A.)
distribution of ownership among ShareholdersThe number of shares is rounded down to the nearest thousand.Figures in parentheses represent the composition ratio in percentage terms.
Stock InformationAs of March 31, 2013
principal Shareholders
Name
Number of shares held (thousands)
Ratio of the number of shares held to
the total number of shares issued (%)
The Minister of Finance 431,231 32.59
Japan Trustee Services Bank, Ltd. (Trust Account) 49,760 3.76
The Master Trust Bank of Japan, Ltd. (Trust Account) 36,772 2.78
Japan Trustee Services Bank, Ltd. (Trust Account 9) 19,253 1.46
SSBT OD05 Omnibus Account - Treaty Clients 16,201 1.22
Moxley and Co LLC 15,279 1.15
The Chase Manhattan Bank, N.A. London Secs Lending Omnibus Account 14,265 1.08
NTT Employee Share-Holding Association 11,662 0.88
State Street Bank and Trust Company 505224 9,075 0.69
Nippon Life Insurance Company 8,500 0.64
Notes: 1. On January 4, 2009, NTT carried out a 100-for-1 stock split and introduced a unit share system whereby one unit is set at 100 shares.
2. The number of shares held is rounded down to the nearest thousand. 3. NTT’s holdings of 137,822,603 shares of treasury stock are not included in
the above list of principal shareholders.
Notes: 1. The composition ratio is the ratio of shares relative to the total number of issued shares, excluding fractional shareholdings less than one unit share (1,716,335 shares).
2. “Other Japanese Corporations” includes 16,000 units nominally held by Japan Securities Depository Center, Inc.
3. There are 225,485 odd-lot shareholders who hold only odd-lot shares.
restrictions under the NTT lawThe NTT Law requires the government to own at least one-third of the total number of issued shares*. Pursuant to the NTT Law, the proportion of voting rights of foreign nationals and foreign corporations is limited to less than one-third of the total voting rights. If the proportion of voting rights of foreign nationals and foreign corporations should exceed one-third, pursuant to the NTT Law, NTT is prohibited from registering ownership of shareholders in excess of such limit. As of the end of March 2013, 3,039,591 of the voting rights were owned by foreign nationals and foreign corporations.
* For the time being, pursuant to Article 13 of the NTT Law, any increase in the number of shares attributable to the issuance of new shares is not included in calculating the total number of issued shares for the purposes of the NTT Law.
50,000
0
100,000
150,000
3,000
0
6,000
9,000
1,000
0
2,000
3,000
2004 2005 2006 2007 2008 2009 2010 2011 2012 2013
NTT’s Share price on the Tokyo Stock exchange(Yen) (Points)
(Thousands of shares)
NTT’s share price (upper left scale) TOPIX Index (right scale) NTT’s trading volume (lower left scale)
Notes: 1. NTT’s stock price and TOPIX Index are the simple average closing prices on the last trading day every month. 2. NTT’s trading volume refers to the number of NTT shares traded every month. 3. Figures have been adjusted to reflect the 100-for-1 stock split that NTT conducted on January 4, 2009.
Glo
ssar
y of
Ter
ms
/ S
tock
Info
rmat
ion
NIP
PO
N T
ELE
GR
AP
H A
ND
TE
LEP
HO
NE
CO
RP
OR
AT
ION
A
NN
UA
L R
EP
OR
T 2
01
3
139

NippoN Telegraph aNd TelephoNe CorporaTioN
AnnuAl RepoRt 2013For the year ended March 31, 2013
http://www.ntt.co.jp/
NT
T a
NN
ua
l re
po
rT
2013