annual report 2013 - atalian · pdf filefounding of the tfn group - franck julien appointed...
TRANSCRIPT

Annual report 2013
LANDSCAPING
CONSTRUCTION & RENOVATION
CLEANING
RECEPTION SECURITY
AIRPORTSERVICES
LOGISTICS
TECHNICAL MAINTENANCE


Profile ................................................................................................................................................................................................................. p 6
Interview with Franck JULIEN ....................................................................................................p 10
Governance .........................................................................................................................................................................p 12
An independent French group that combines local presence with international reach ......................................................................p 14
Strategy ........................................................................................................................................................................................................p 18
Highlights ................................................................................................................................................................................p 21
Our main lines of development: International and Facility Management .....................................................................p 22
Businesses ................................................................................................................................................................................................p 32
Cleaning and Associated Services .....................................................................................p 34
Multi-technical & Multiservice ....................................................................................................p 38
Safety, Security, Surveillance .......................................................................................................p 40
Reception .............................................................................................................................................................................p 42
Landscaping – New Projects & Maintenance ................................................p 44
Parquet Finishing & Floor Coverings ................................................................................p 46
Airport Services ......................................................................................................................................................p 48
Transportation & Logistics ................................................................................................................p 49
Sense of Responsibility ....................................................................................................................................................p 50
Social & corporate ..............................................................................................................................................p 54
Environment/Sustainable development ...................................................................p 58
Financial Statements ...........................................................................................................................................................p 62
1
2
3
4
5
CONTENTS

1944Creation of TFN. Its original business: cleaning services.
1977First diversification: creation of Lancry. (Security and Safety).
1999Launch of Technical activity. (Multiservice - Multi-technical).
2000Founding of the TFN Group - Franck JULIEN appointed Chairman of the Management Board. The TFN Group brought togetherthe Cleaning and Safety domains under a single brand name.
2001Opening of the Group’s first foreign subsidiaries in Hungary and Poland.
2002Launch of the Construction business with the purchase of Lagrange.(HVAC, roofing, plumbing).
2003Creation of MTO (Optimized Technical Maintenance).(Facility management - Multiservice - Multi-technical).
2006Development of Reception business with the acquisition of Hôtesses et Grooms de Paris. (In-company front of house services, special event management, airport assistance, field marketing).
2007Launch of the Landscaping business with the purchase of Pinson Paysage. (Development and maintenance of parks and gardens).Signature of an exclusive partnership with the City One Group (Reception business).
2009TFN becomes ATALIAN Global Services. International Development with openings of the Group's first
subsidiaries in Slovakia and the Czech Republic.
2009Acquisition of VEOLIA Cleaning and Multiservices(Ranked sixth on the French cleaning services market) and EUROGEM (subsidiary of the ICADE group and pioneer in multi-technical and services engineering).
2010
ATALIANKEY DATES
2013 ANNUAL REPORT

Purchase of the companies EKUS and KADUS in Croatia, ESCORT and BFM in Hungary and PFM in the Czech Republic.
2011Purchase of AGOM and ATLANTIS in Belgium, VIP GROUP in Morocco and KAF Facility in the Czech Republic.
2012ATALIAN becomes 100% JULIEN family-owned.The Group sought new investors in 2009 at Marceau Capital, which acquired 8.22% of the shares. Transfer of operating facilities in Spain.
2013The Group placed a 250-million-euro bond issuematuring in 2020 at the rate of 7.25%. Purchase of Carrard Services.Establishment in Turkey with the acquisition of ARTEM. United Facility Solutions: creation of a pan-European alliance.
Our key brands, businesses and companies
LA FINANCIÈRE ATALIAN
ATALIAN
BELGIUMLUXEMBOURGCROATIAHUNGARYPOLAND
CZECH REPUBLICROMANIASLOVAKIAMOROCCOTURKEY
LEBANONMAURITIUSTHAILANDINDONESIAMALAYSIA
INTERNATIONAL
TFN AFFRÈTEMENT ET LOGISTIQUELOGISMARK
TRANSPORTATION
JEAN LÉTUVÉLAGRANGE COUVERTUREGERMOT & CRUDENAIRE IDF
PARQUET FINISHING AND FLOOR COVERINGS
PINSON PAYSAGEARPAJASUPERSOL
LANDSCAPING
CITY ONE EXCLUSIVE PARTNERRECEPTION
ATALIAN FACILITIESFACILITY MANAGEMENT
TFN PROPRETÉCARRARD SERVICESRIPTNEX
CLEANING
MTOEUROGEMTFN BÂTIMENT- MTO TRAVAUXELALE - MTO ÉCLAIRAGE PUBLIC
SERVICES ENGINEERING
LANCRYAPFSSAFETY
SUPPORT FUNCTIONS
• Information Technology• Quality, Safety, Environment• Finance• Human Resources• Legal• Purchasing
4 - 5

OUR GOALS AND VALUES p 8
INTERVIEW WITH FRANCK JULIEN p 10Chairman of the ATALIAN Group
GOVERNANCE p 12
AN INDEPENDENT FRENCH GROUP p 14that combines local presence with international reach
An independent French group of
companies,
ATALIAN Global Services is
a major global services provider for
businesses and local authorities.
With more than 60,000 employees,
ATALIAN is operational in 13 countries
off ering solutions to more than 25,000
customers in both the public and private
sectors. ATALIAN deploys its activities
along two lines of development:
International and Facility Management.
2013 ANNUAL REPORT

1PROFILE
6 - 7 6 - 7
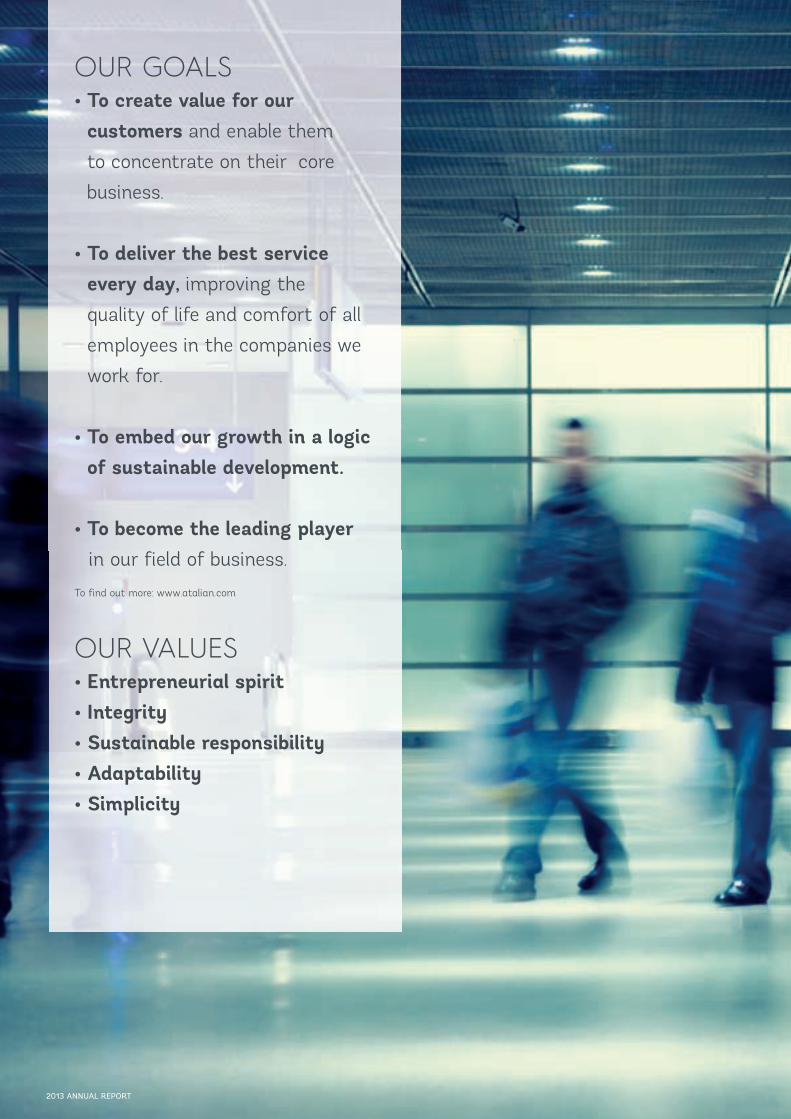
OUR GOALS• To create value for our
customers and enable them
to concentrate on their core
business.
• To deliver the best service every day, improving the
quality of life and comfort of all
employees in the companies we
work for.
• To embed our growth in a logic of sustainable development.
• To become the leading player in our field of business.
To find out more: www.atalian.com
OUR VALUES• Entrepreneurial spirit• Integrity• Sustainable responsibility• Adaptability• Simplicity
2013 ANNUAL REPORT

8 - 9

INTERVIEW WITH FRANCK JULIEN, ATALIAN GROUP CHAIRMAN
ECONOMIC CONDITIONS ARE DIFFICULT IN FRANCE AND EUROPE. HOW DID ATALIAN NAVIGATE THE 2012-2013 FISCAL YEAR?
Overall, the past year went well, despite a difficult economic context and tougher competition. We met our objectives and the results reflect that achievement. We’re proud to announce that ATALIAN succeeded in recording nearly 3% growth despite some very aggressive competitors that lowered their margins considerably, in an attempt to conquer new markets. We also succeeded in renewing 96% of our contracts under tender while maintaining our margins.
HOW DO YOU ACHIEVE THIS?DO YOU HAVE A WINNING FORMULA?
I think that our first asset is being fundamentally and viscerally, entrepreneurs. I’m an entrepreneur, the staff who have supported me for many years are entrepreneurs. Being an entrepreneur means being attentive to the market, being proactive, acting in time and quickly, taking the lead.... This attitude is vital for success today, especially in our businesses, which are increasingly complex, and where margins are trending downward. More precisely, in the field, this means always
offering higher quality, greater responsiveness and greater proximity to our customers. We work in a partnership approach, continuously suggesting new ideas and proposing solutions to our customers. And of course, we stick to a “one-stop” approach, a strategy that enables us to constantly offer our customers new services within our businesses, and expand the volume of our local sales, but also, where necessary, to support them as they set up operations abroad.
SO YOU'RE PURSUING THE STRATEGY THAT YOU COMMITTED TO SEVERAL YEARS AGO?
Absolutely! We started out as a single-business company, a cleaning services firm. We've gradually brought in the other businesses that make ATALIAN a key player in the field of Total Facility Management.We quickly realised that we also needed to develop our know-how beyond France. We have managed to do this: in all of the countries where we've established operations, we’re profitable and growing. I think you need a simple strategy. Ours is strong and effective. Our results indicate this. So I don’t see any reason to change it. The French and European economic climate is complicated, we must keep moving and look to even more distant horizons….
Objectives achieved, a clear vision, a restored agility
2013 ANNUAL REPORT

…KEEP MOVING AND HAVE TRUE FREEDOM OF MOVEMENT. IS THAT THE IDEA BEHIND ATALIAN'S NEW FINANCIAL STRUCTURE?
Yes, and it was actually the major action of the year. In January 2013 we announced the placement of our 250-million-euro bond issue maturing in 2020, at a 7.25% interest rate, aimed at refinancing our debt and freeing us from any restraints on our capital.We gained new financial freedom. Today, we realize that with the decline in the economic situation and the reinforcement of the Basel III criteria, banks find it more difficult to support companies. Because of disintermediation, we address investors directly. We are one of the first French players to do this in our sector, and we’re pleased that it enabled our company to bounce back. This operation has given our teams a new burst of energy. The Group has gained in agility and flexibility, which is essential for us because we’re an external growth company in a historically highly fragmented market, currently under reconstruction and in a state of permanent change.
WHAT ARE YOUR PLANS FOR THE COMING YEAR?
Without question, our ambition is to continue growing. We will pursue the sales strategy to which we committed more than four years ago with key accounts. During the 2012-2013 fiscal year, we also won more than €20 million in new business. We will continue in this direction, both for our business expertise and internationally. The reality is that our future is undeniably global
because our customers are becoming global. We began our international expansion in Central Europe, when it was still emerging and the markets were relatively unstructured. Today, it increasingly resembles Western Europe… which penalizes it… so we must go to where things are moving. This is particularly true of Asia.
ASIA IS A LONG WAY FROM WHERE YOU ARE BASED. WHAT ARE YOUR PLANS ON THIS CONTINENT?
We initiated buisinss there last year, and I’m happy to announce that a certain number of transactions are already under way in Thailand and Indonesia. Others may also see the light of day in Malaysia and Vietnam. Africa is also of great interest and today looks more promising than Latin America, which is restrained by its slowing growth. Whoever fails to move forward, falls behind. That’s not happening to us!
THE INTERNATIONAL DEVELOPMENT IS A GROWTH DRIVER. WHAT ABOUT FRANCE?
We will pursue our internationalization because the strongest growth drivers are clearly outside Europe. But this development does not change our attachment to our roots - in less than 20 years, we’ve directly or indirectly created 40,000 jobs in France! We shall continue because our development is in hand and uninterrupted. With organic growth of 2% in 2013, we demonstrate that it’s possible to combine employment and profitability. As long as we make the right choices!
We gained new financial freedom.
10 - 11 10 - 11

GOVERNANCE
In 2013 the ATALIAN group was reorganized and strengthened its governance.
EAB Finances S.A. became ATALIAN Holding Development and Strategy S.A.
ATALIAN HOLDING - Development and Strategy SA - (JULIEN family)
€250 MBond Issue
96,1 %
3,9 %
Subsidiaries
TFN Val S.A
JPF DÉVELOPPEMENT SA(JULIEN family)
100 %
90 %Issuer
Bond issueunderwriter
La Financière ATALIAN S.A.S.
CORPORATE STRUCTURE
Franck JULIEN Thierry BRÉMENT Antoine TERZIKHAN Richard TRANCHE Jean-Claude SALTIEL
2013 ANNUAL REPORT

ATALIAN HOLDING - DEVELOPMENT AND STRATEGY (AHD&S) BOARD OF DIRECTORS
FRANCK JULIEN
SOPHIE PÉCRIAUX-JULIEN
JEAN-PIERRE JULIEN
LOÏC ÉVRARD
DAVID HUDSON
QUENTIN VERCAUTEREN DRUBBEL
LA FINANCIÈRE ATALIAN
The company La Financière ATALIAN changed its status from an incorporated company to that of a simplified joint stock company held 100% by the JULIEN family, and three management committees were set up.
CHAIRMAN OF THE BOARD
JEAN-CLAUDE SALTIEL
INVESTMENT COMMITTEEJEAN-CLAUDE SALTIELLOÏC ÉVRARDMATTHIEU DE BAYNAST DE SEPTFONTAINESANTOINE TERZIKHANPIERRE VACHERONRICHARD TRANCHÉ
ACCOUNT CLOSING COMMITTEEAHD&S (formerly EAB) represented by FRANCK JULIENJEAN-CLAUDE SALTIELLOÏC ÉVRARD
REMUNERATION COMMITTEEAHD&S (formerly EAB) represented by FRANCK JULIENJEAN-CLAUDE SALTIELLOÏC ÉVRARD
Pierre VACHERON Matthieu de BAYNAST Loïc ÉVRARD Serge VIVIER Sophie PÉCRIAUX-JULIEN
12 - 13

AN INDEPENDENT FRENCH GROUP
€1.274bnPRO FORMAREVENUE*
60,000EMPLOYEES 25,000CUSTOMERS
2013 MILESTONES
CONSOLIDATED REVENUE IN MILLIONS OF EUROS
2007
477
2008
507
2009 2010 2011
1,081
1,033
2012
1,173
2013
1,206
117
2014
1,280
544
20092010
20102011
20122013
20132014
20112012
20092010
20102011
20122013
20132014
20112012
68,565,472,9 74,9
93
52,357,9
70
52,947,9
CITY ONE*
x 2,7
*Including Carrard and ARTEM in full year
*Exclusive Partner
(Projected)
2013 ANNUAL REPORT

PRO FORMAREVENUE*
EBITDA IN MILLIONS OF EUROS EBIT IN MILLIONS OF EUROS
2007
477
2008
507
2009 2010 2011
1081
1033
2012
1173
2013
1206
117
2014
1280
544
20092010
20102011
20122013
20132014
20112012
20092010
20102011
20122013
20132014
20112012
68.565.472.9 74.9
93
52.357.9
70
52.947.9
2007
477
2008
507
2009 2010 2011
1081
1033
2012
1173
2013
1206
117
2014
1280
544
20092010
20102011
20122013
20132014
20112012
20092010
20102011
20122013
20132014
20112012
68.565.472.9 74.9
93
52.357.9
70
52.947.9
BREAKDOWN OF REVENUE BY ACTIVITY
Cleaning
Safety
Multi-technical
ReceptionConstruction1.5%9%
16.5%
Transportation2%
10%
56%
Landscaping5%
(Projected) (Projected)
14 - 15

ATALIAN continues to develop its geographic network to better accompany every one
of its customers in France.
IN FRANCE, ATALIAN RELIES
ON A NETWORK OF MORE THAN
100 LOCAL OFFICES
…THAT COMBINES LOCAL PRESENCE…
Lille
Calais
LensAmiens
Lillebonne
Rouen
Metz
Mulhouse
Nancy
Reims
Châlons-enChampagne
Sens Juvaincourt
Dijon
Montargis
Orléans
Blois
Tours
Angers
Le Mans
Soudan
Laval
Caen
Rennes
St-Brieuc
Lorient
Loudéac
St-Nazaire
Nantes
La Roche-sur-Yon
Cholet
Saintes
Angoulême
Bayonne
Pau
Agen
Toulouse
Perpignan
Montpellier
Aix-en-Provence
Valence
St-Etienne
Grenoble
Annecy
MeyzieuLyon
RoanneClermont
Montluçon
Ferrand
Strasbourg
Limoges
Bordeaux
Marseille
Nice
Rodez
Pont
Avignon
Le
Brest
Louviers
Darnétal
Poitiers
Aix-les-Bains
Chambéry
OrangeSaint-Rémyde-Provence
ATALIAN Sites Headquarters
1- Andilly2- Arcueil3- Bobigny4- Bonneuil-sur-Marne5- Clichy6- Crosne7- Fontenay-sous-Bois
8- Paris9- Poissy10- Quincy11- Rungis12- Sarcelles13- Villejuif14- Vitry-sur-Seine
1
28
37
4
61110
13 14
1259
2013 ANNUAL REPORT

EUROPE
MIDDLE EAST
ASIA
NORTH AFRICA
FranceBelgiumLuxembourgPolandHungaryCzech RepublicSlovakiaRomaniaCroatia
LebanonTurkey
ThailandIndonesiaMalaysia
Morocco
Internationally, ATALIAN is present in nine European countries and in Lebanon, Morocco,
Mauritius and Turkey. In 2014, it will also be present in Thailand, Indonesia and Malaysia.
…AND INTERNATIONAL REACH
8- Paris9- Poissy10- Quincy11- Rungis12- Sarcelles13- Villejuif14- Vitry-sur-Seine
16 - 17
HIGHLIGHTS p 21
GROWTH AREAS:INTERNATIONAL p 22
FACILITY MANAGEMENT p 28
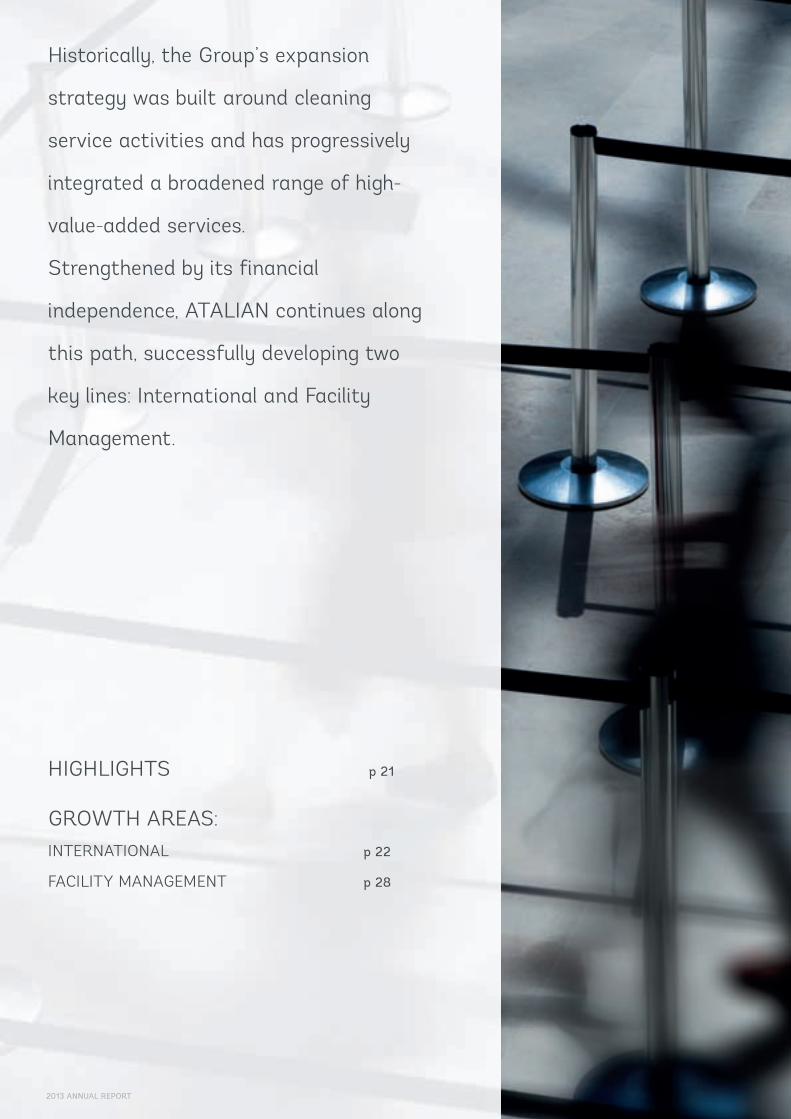
Historically, the Group’s expansion
strategy was built around cleaning
service activities and has progressively
integrated a broadened range of high-
value-added services.
Strengthened by its financial
independence, ATALIAN continues along
this path, successfully developing two
key lines: International and Facility
Management.
2013 ANNUAL REPORT

2STRATEGY
18 - 19


2013 HIGHLIGHTS
IN FRANCEIn June and July, ATALIAN made several acquisitions that strengthen its positions in France:
• CARRARD SERVICES - Established throughout France, this Rheims-based company brings an annual
revenue of €75 million and 4,500 employees. With 40 years’ experience, Carrard Services offers services
to 2,500 customers for cleaning, multiservice and special works.
• TDN and ANAPURNA, two companies in southwestern France with consolidated revenue
of €10.2 million.
OUTSIDE FRANCEARTEM - In February 2013, ATALIAN entered the Turkish market by purchasing ARTEM, a cleaning services
specialist based in Ankara and present in Istanbul, Izmir, Kayzeri, Bursa and Batman. Founded in 1984, ARTEM
generates annual revenue in excess of €10 million and employs more than 1,500 full-time employees. It is
also ISO 9001, 14001 and 18001 certified.
UFS-UNITED FACILITY SOLUTIONS - In July 2013, ATALIAN formed an alliance with CLECE and
MANUTENCOOP, Facility Management leaders in Spain and Portugal, and Italy respectively, to create
the United Facility Solutions (UFS) joint venture based in Brussels.
With their membership, the MITIE (United Kingdom, Ireland and Norway), PIEPENBROCK (Germany
and Austria) and FACILICOM (the Netherlands) groups strengthen the European Facility Management
alliance, whose mission is to offer major international groups a complete range of standardized services,
on a Europe-wide basis.
20 - 21

INTERNATIONAL
For some 15 years, ATALIAN has served its international customers far from their geographical
location. The development of international activities, a true growth lever for the Group, is a
strategic priority.
Our goal: to off er the same quality of service to our customers everywhere by entering those
markets that off er the strongest growth potential.
After Central Europe, our course is set for Asia!
I.e. ~ 5,700 FTE (full-time equivalent)
REVENUE OUTSIDE FRANCE (IN MILLIONS OF EUROS)
BREAKDOWN OF INTERNATIONALREVENUE BY COUNTRY
€155 MPROFORMA REVENUE
10, 400EMPLOYEES
2013 MILESTONES
2007
9
2008
17
2009
37
2010
67,2
2011
100
2012
126
2013
155 12%30%
9%12%
6%
8%
12%
3%
10 %2%8%
x 17
2007
9
2008
17
2009
37
2010
67,2
2011
100
2012
126
2013
155 12%30%
9%12%
6%
8%
12%
3%
10 %2%8%
Turkey
Czech Republic
Luxembourg
Romania
Hungary
Croatia
Belgium
Slovakia
Morocco
2013 ANNUAL REPORT
Poland
PROFORMA REVENUE
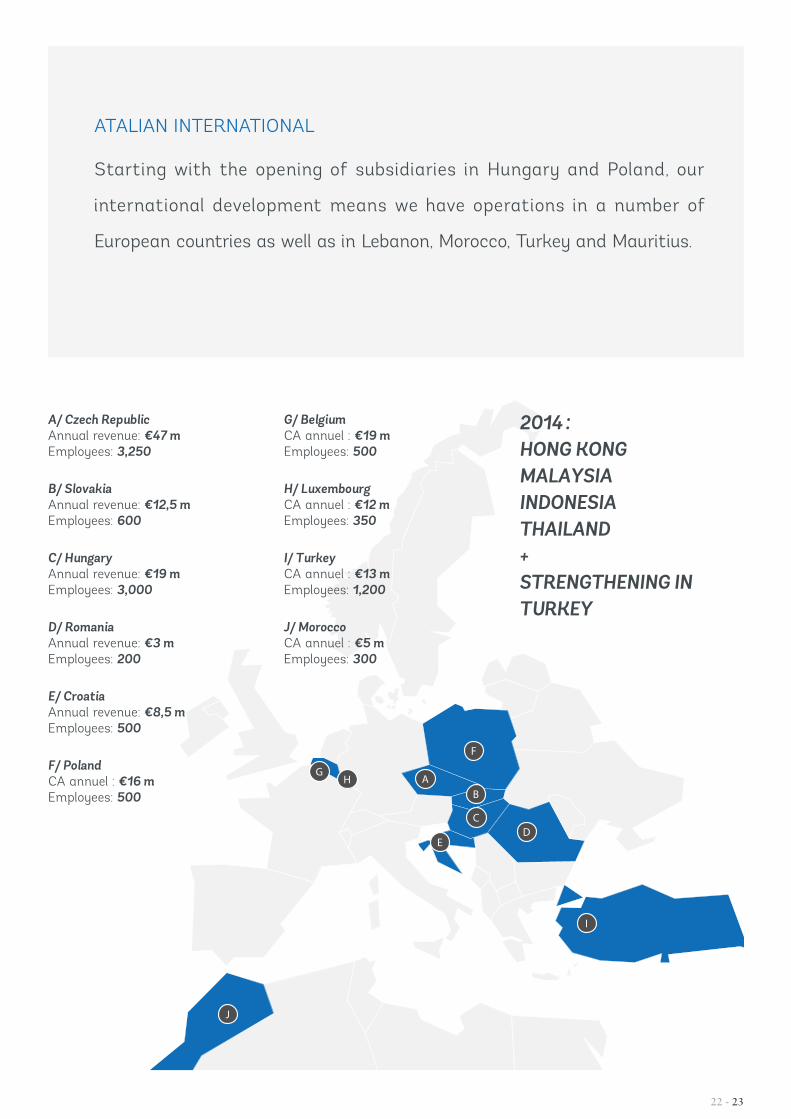
ATALIAN INTERNATIONAL
Starting with the opening of subsidiaries in Hungary and Poland, our
international development means we have operations in a number of
European countries as well as in Lebanon, Morocco, Turkey and Mauritius.
22 - 23
AG
H
J
B
CD
E
I
F
A/ Czech RepublicAnnual revenue: €47 mEmployees: 3,250
B/ SlovakiaAnnual revenue: €12,5 mEmployees: 600
C/ HungaryAnnual revenue: €19 mEmployees: 3,000
D/ RomaniaAnnual revenue: €3 mEmployees: 200
E/ CroatiaAnnual revenue: €8,5 mEmployees: 500
F/ PolandCA annuel : €16 mEmployees: 500
G/ BelgiumCA annuel : €19 mEmployees: 500
H/ LuxembourgCA annuel : €12 mEmployees: 350
I/ TurkeyCA annuel : €13 mEmployees: 1,200
J/ MoroccoCA annuel : €5 mEmployees: 300
2014 : HONG KONG MALAYSIA INDONESIA THAILAND+STRENGTHENING IN TURKEY

MEDITERRANEAN BASIN & CENTRAL EUROPE: INCREASINGLY MATURE MARKETS
For the first year of activity, the performance of our sites in Turkey was promising. The signature of
several new contracts is planned in 2014 in addition to the development of activities in the safety sector.
In Central Europe, we have continued to improve our productivity by reinforcing the integration process,
applying economies of scale and transferring skills. New contracts have been won in various countries
(including Poland and Romania) whose markets are still dynamic. However, this area is maturing, a trend
that reduces profitability as margins are pushed downward.
We will therefore seek new growth areas in the emerging countries of Southeast Asia, which are
enjoying double-digit growth rates.
ASIA: GROWING MARKETSWITH NUMEROUS NEEDS
Announced in 2012, our external growth
operations in Asia are currently being
finalized. ATALIAN acquired three cleaning
services companies: two in Indonesia and
one in Thailand. Another cleaning company
is planned for the beginning of 2014.
The headquarters of the Asian activities
holding company is based in Hong Kong,
and a management coordination center is
located in Malaysia, Kuala Lumpur. In light of
local needs and the economic force of these
countries, we project 10% to 15% growth in
this zone.
2013 ANNUAL REPORT

MEETINGWITH MATTHIEU DE BAYNAST CHAIRMAN OF ATALIAN INTERNATIONAL
Compared to ATALIAN Group’s history, our international network is young, but it is being built on
the same foundations and with the same methods as those used in Central Europe. We remain
clearly and totally in line with the ATALIAN model. We invest in entrepreneur-founded companies,
who have become leaders in their markets. We hold the majority market share 51% and we will
progressively increase our share. We bring our experience and tools to optimize their performance.
The idea is to also play the business diversification card to develop our off ering and increase our
market share.
We are still facing a number of challenges, but with our new UFS-United Facility Solutions European
alliance, the broadening of our range of services and the force of the Asian continent, we have
every reason to be optimistic! We will continue to pursue our organic growth! Our objective is to
reach revenue of €500 million in our international businesses in four years.
We invest in We invest in entrepreneur founded entrepreneur founded companies who have companies who have become leaders in their become leaders in their market.
”
” 24 - 25

WESTERN EUROPE: UFS-UNITED FACILITY SOLUTIONS,
THE ALLIANCE OF EUROPEAN LEADERS
Formalized in the summer of 2013, this alliance brings together partners that are all leaders on
their domestic markets. UFS-United Facility Solutions’ annual turnover exceeds €7 billion and the
Group has a workforce of over 250,000 employees in 18 European countries.
Each of the companies within the Group has a solid background in their respective fields of opera-
tion and thus benefit from a strong and widely recognized image. By combining local presence with
a global vision, UFS provides its clients with tailor-made solutions, guaranteeing a homogenous level
of quality and efficiency throughout the countries in which it operates.
UFS - UNITED FACILITY SOLUTIONS IS:
• partners that are leaders in their countries,
• full coverage throughout Europe,
• internal control of all the SOFT and FULL FM services,
• legal structures suited to international tenders,
• teams of specialized experts in eight different industries.
2013 ANNUAL REPORT

ATALIAN
Annual revenue: €1.3 billion
Employees: 60,000
Sites:
Belgium, Croatia, France,
Hungary, Lebanon, Luxembourg,
Poland, Czech Republic,
Romania, Slovakia,
Mauritius, Morocco and Turkey.
CLECE
Annual revenue: €1.14 billion
Employees: 65,000
Sites:
Spain and Portugal
Website: www.clece.es
MITIE
Annual revenue: €2.5 billion
Employees: 63,000
Sites:
United Kingdom, Ireland and
Norway
Website: www.mitie.com
FACILICOM
Annual revenue: €1 billion
Employees: 30,000
Sites:
The Netherlands and Belgium
Website: www.facilicom.com
MANUTENCOOP
Annual revenue: €1.07 billion
Employees: 18,000
Sites: Italy
Website: www.manutencoopfm.it
PIEPENBROCK
Annual revenue: €0.5 billion
Employees: 27,000
Sites:
Germany and Austria
Website: www.piepenbrock.de
KEY FIGURES
MEMBERS OF UFS-UNITED FACILITY SOLUTIONS
26 - 27

FACILITY MANAGEMENT
The ATALIAN Group strengthens its Facility Management (FM) approach through a
dedicated entity: ATALIAN Facilities. This entity coordinates the Group's various
business lines in and outside France.
Facility Management comprises Multi-technical (“hard” FM) which includes heavy
technical services (building and office maintenance, support services, fluid and energy
management, etc.) and Multiservices (“soft” FM), which includes cleaning, Reception
services, mail, safety, catering services and the maintenance of landscaped areas.
These diverse fields of expertise are all essential for the smooth functioning of a
business or community.
2013 ANNUAL REPORT

GREAT POTENTIAL FOR AN UNDER-DEVELOPED MARKET In France, the facility management market progressed primarily for cost efficiency reasons.
The recession strengthened demand, forcing private companies and public bodies to outsource services.
However, it also increased pressure on prices.
Yet we believe that facility management still offers significant potential. In particular, there is a strong
need for services related to the improvement of buildings’ and facilities’ energy performance, waste
management, etc. We strive to reinforce the added value that we offer through the quality of our
services, efficient operations management and our capacity to innovate. At the heart of our system
lies the technical, advisory, organizational and social engineering expertise of our teams.
A FULL RANGE OF SERVICESStrengthened by its expertise and the reputation of its brands, ATALIAN is one of the few market players
to propose an integrated offer with a broad spectrum of services for different tertiary activity sectors,
mass retailing and distribution, industries, health care, education…. We can therefore offer increasingly
complex multiservice and multi-technical solutions that enable our offer to be as close as possible to
companies and local authorities expectations.
And thanks to UFS-United Facility Solutions, the Multiservice/Multi-technical activities are offered on
a Europe-wide basis.
28 - 29

FOR EXAMPLE:
• The service request module enables us to be highly responsive. The request may be transmitted either
internally or by the customer. The requests are rerouted to the technician, who notified by an SMS on
his cell phone, consults his PDA and can deliver the service needed in the shortest time. This enables
true priority management for optimum responsiveness in our operations.
• The document management module can also operate either internally or as an exchange with the
customer. This module renders quality plans, reports and other operational procedures accessible.
• The Building Sanitation and Technical Dossier (BSTD) enables us to share with our customers,
regulatory documents, updated in real time.
• Among the other services that our customers particularly appreciate are: the energy management
and monitoring module, a Reception module for visitor management, the electronic guest ledger
for security, which enables customers to check events on their site even when they are not present...
•The CMMO application is used for multi-technical service provisions, and offers comprehensive
monitoring of site management. It is composed of several modules: planning, preventive and
corrective maintenance, management of quotations, service requests and energy metering.
The AMDEC module is specifically designed for critical facilities that require essential maintenance.
AN ORGANIZATION AND TOOLS THAT ENSURE EFFECTIVENESS AND RESPONSIVENESS
As the sixth French player in the multi-technical/multiservice market, ATALIAN Facilities drives
facility management projects and develops high-performance tools to strengthen the quality of
its services.
Service provision coordination is supported by a three-pronged computer system: an internet
workflow portal called “FM Space", a Computerized Maintenance Management System (CMMO)
and mobile Personal Digital Assistant (PDA) entrusted to each manager. These tools are all
interconnected.
2013 ANNUAL REPORT

Our organization and
methodology favor the
development of synergies
between businesses, resulting
in an integrated approach,
enabling our customers to
optimize costs
…
Each customer benefits from
a dedicated contact person
who manages diff erent
interventions, and optimizes
them on a large and small
scale, to favor a dynamic that
creates value.
”
” 30 - 31
A LAISSER ? A LAISSER ?
CLEANING AND p 34
ASSOCIATED SERVICES
MULTI-TECHNICAL/ p 38
MULTISERVICE
SAFETY, SECURITY, p 40
SURVEILLANCE
RECEPTION p 42
LANDSCAPING p 44
PARQUET FINISHING p 46
AND FLOOR COVERING
AIRPORT p 48
SERVICES
TRANSPORTATION p 49
& LOGISTICS
2013 ANNUAL REPORT

3BUSINESSES
32 - 33

CLEANING &
ASSOCIATED SERVICES
Cleaning, on-site waste management, sanitation, pest control, air purification, minor
maintenance, handling, stock and supplies management, meeting room set-up, shared
space management, off ice-to-off ice moves….
Our know-how and services are numerous, but our teams are dedicated and trained in
the characteristics and requirements specific to our customers' various activity sectors.
2013 MILESTONES
*18 400 FTE
35,000EMPLOYEES*
€692MREVENUE*
* PROFORMA
2 ND
OPERATOR
IN THE FRENCH CLEANING INDUSTRY
OF CONTRACTS RENEWED
96 %
41%
2013 ANNUAL REPORT

* PROFORMA
ACTIVITY DISTRIBUTION
A FRAGMENTED MARKET AND HEIGHTENED COMPETITION
Our Cleaning Services business recorded good results in 2012-2013: consolidated revenue was
€626. 9 million, producing an EBITDA of €63.1 million. These results are even more remarkable in light
of the fierce competition that has emerged over the past few years, bringing with it a significant risk
of eroded margins. For the record, the cleaning services market in France generates revenue of around
€10 billion and comprises 15,000 staff .
SERVICE STRATEGY: EVER GREATER RESPONSIVENESS, CLOSER CONTACT AND MORE PARTNERSHIPS WITH OUR CUSTOMERS
To maintain our margins while continuing to off er our customers quality services, we have continued
to strengthen our organization, quality management system and operational support tools. Of
our many advantages, the quality of our teams is unquestionably the most significant. In addition, we
rely on a strong network of off ices in France, that enable us rapid optimization of synergies following
acquisitions. Within this logic, we acquired Carrard Services this year (annual revenue of €75 million;
4,500 employees, more than 2,500 customers). Outside France, the cleaning services business remains
a lever for market penetration. When the Group sets up operations in a new country, it often seeks
acquisitions in the same sector to expand its activities to other businesses.
41%
2007
274
2008
297
2009 2010
284
2011
624610
2012
643
2013
692 12%12%
12 %
12 %
34 %
18 %
9 %
6%
4 %
5 %
Industry
Agri-food
Health care
Networks
and Transportation
The state
and local authorities
Retail and Distribution
Real estate
Tertiary
34 - 35

INDUSTRIAL
- LAFARGE
- CALCIA
- EADS
- EBREX
- GEFCO
- FAURECIA
- DCNS
- HUNTSMAN TIOXIDE
AGRIFOOD
- SOCOPA
- LABEYRIE
- DAVIGEL
- ENTRACTE (LDC)
TERTIARY
- BNP PARIBAS
- CREDIT AGRICOLE
- ERNST & YOUNG
- DEXIA
- MINISTÈRE DU BUDGET ET DES FINANCES
LARGE RETAIL
- CARREFOUR
- AUCHAN
- GALERIES LAFAYETTE
HOSPITALS
- HIA PERCY
- INSTITUT CURIE
- APHP
- HIA VAL DE GRÂCE
PHARMACEUTICAL,
COSMETICS, ULTRA-CLEAN
- APTAR
- GALDERMA
- ST MICROELECTRONICS
- SANOFI
- STALLERGENES
- ASTRIUM
Customer References
”

At ATALIAN, we prefer the ‘service war’ to the price war
The price war is very fierce in our industry.
Some of our competitors are very aggressive,
lowering their margins substantially, when trying
to win new markets.
At ATALIAN we prefer the service war to the price
war and we have succeeded in renewing 96% of
our contracts under tender while maintaining
our margins. We have also eliminated from our
portfolio, customers who are not profitable and/
or bad payers. Some were large accounts, but we
considered their demands to be unacceptable and
incompatible with the way operate. In terms of
cash flow, we have been able to reduce our working
capital requirements (WCR) by €8 million, and our
Days Sales Outstanding (DSO) currently stands
at 64 days, a 2-day improvement.
MEETING WITH PIERRE VACHERONPresident of Cleaning and Associated Services
””
36 - 37

MULTI-TECHNICAL&
MULTISERVICEBuilding management, multi-technical maintenance, air-conditioning, heating, plumbing,
ventilation, lighting, laying underground electricity and telecom services (ERDF and
France Telecom), remote network monitoring... MTO-EUROGEM manages 85% of
support services using ATALIAN’s own resources.
MILESTONES 2013
1, 600EMPLOYEES
€192 MREVENUE
6 TH LARGEST
M2 USED6 M DEPARTMENTS14 REGIONAL
41%
BREAKDOWN OF ACTIVITY
2007 2008 2009 2010 2011 2012
180
127,9
192
2013
138,2
116,4
43,236
57%
4 %9 %
63 %
24 %
Industrial
Health
Retail
Tertiary
FRENCH OPERATOR
2013 ANNUAL REPORT
41%
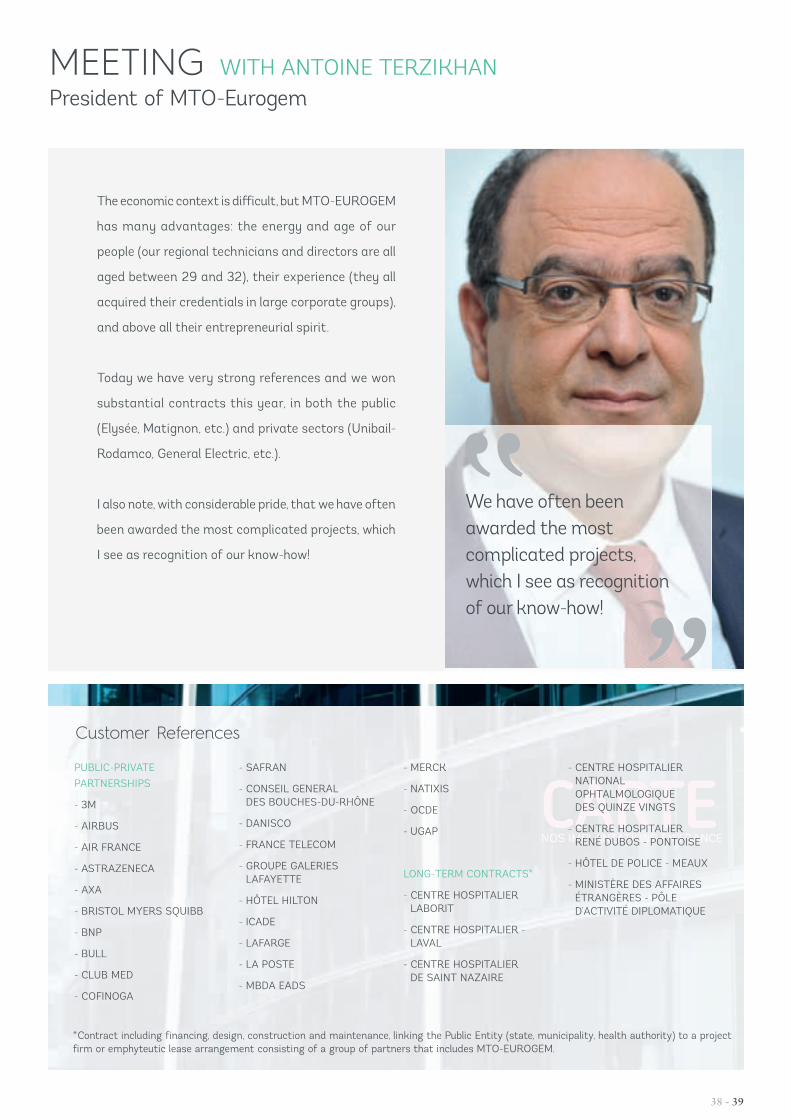
MEETING WITH ANTOINE TERZIKHAN President of MTO-Eurogem
The economic context is diff icult, but MTO-EUROGEM
has many advantages: the energy and age of our
people (our regional technicians and directors are all
aged between 29 and 32), their experience (they all
acquired their credentials in large corporate groups),
and above all their entrepreneurial spirit.
Today we have very strong references and we won
substantial contracts this year, in both the public
(Elysée, Matignon, etc.) and private sectors (Unibail-
Rodamco, General Electric, etc.).
I also note, with considerable pride, that we have often
been awarded the most complicated projects, which
I see as recognition of our know-how!””
We have often been awarded the most complicated projects, which I see as recognition of our know-how!
CARTENOS IMPLANTATIONS EN FRANCECARTENOS IMPLANTATIONS EN FRANCE
PUBLIC-PRIVATE
PARTNERSHIPS
- 3M
- AIRBUS
- AIR FRANCE
- ASTRAZENECA
- AXA
- BRISTOL MYERS SQUIBB
- BNP
- BULL
- CLUB MED
- COFINOGA
- SAFRAN
- CONSEIL GENERAL DES BOUCHES-DU-RHÔNE
- DANISCO
- FRANCE TELECOM
- GROUPE GALERIES LAFAYETTE
- HÔTEL HILTON
- ICADE
- LAFARGE
- LA POSTE
- MBDA EADS
- MERCK
- NATIXIS
- OCDE
- UGAP
LONG-TERM CONTRACTS*
- CENTRE HOSPITALIER LABORIT
- CENTRE HOSPITALIER - LAVAL
- CENTRE HOSPITALIER DE SAINT NAZAIRE
- CENTRE HOSPITALIER NATIONAL OPHTALMOLOGIQUE DES QUINZE VINGTS
- CENTRE HOSPITALIER RENÉ DUBOS - PONTOISE
- HÔTEL DE POLICE - MEAUX
- MINISTÈRE DES AFFAIRES ÉTRANGÈRES - PÔLE D’ACTIVITÉ DIPLOMATIQUE
*Contract including financing, design, construction and maintenance, linking the Public Entity (state, municipality, health authority) to a project firm or emphyteutic lease arrangement consisting of a group of partners that includes MTO-EUROGEM.
Customer References
38 - 39

SAFETY, SECURITY, SURVEILLANCE
Premises security/Reception, security screening, central security station manning, event
services, security for sensitive and classified sites, patrol and intervention services,
audits and advisory... Under the Lancry brand, ATALIAN’s Safety and Security services
have long been synonymous with quality and trust. A leader in the French market,
ATALIAN Sécurité has seen its revenue climb from €109 million to €125 million.
MILESTONES 2013
IN SECURITY IN FRANCE
90%SATISFIED CUSTOMERS
€125 MREVENUE
5TH LARGEST OPERATOR
4,000EMPLOYEES
12 7 OF WHICH ARE OVER 10 YEARS OLD
BRANCHES
ADMINISTRATIVE SITES/HEADQUARTERS - FNAC - DIOR PARFUMS- CBRE- GAÏA
SERVICES- ACCOR- DISNEY- LA POSTE- FRANCE TELECOM- FRANCE
TÉLÉVISIONS- PARIS
SAINT-GERMAIN
TRANSPORTATION- SNCF- RTE- HERTZ- SEDP/RATP- AD TOULOUSE
INDUSTRIAL SITES- TRAPIL- PSA- TOTAL - LAFARGE CIMENTS - BOSCH - SCHLUMBERGER - EDF
RETAIL- CARREFOUR - PPR - MONOPRIX - CONFORAMA- LEROY MERLIN - LECLERC- SYSTEM U- GROUPE GALERIES -
LAFAYETTE- PRINTEMPS
BANKS & INSURANCE- BNP PARIBAS - AXA- CREDIT AGRICOLE- CAISSE
DES DÉPÔTS ET CONSIGNATIONS
- GOLDMAN SACHS- GROUPAMA- NATIXIS- BPCE
LABORATORIES- ASTRAZENECA - SANOFI-AVENTIS- BOEHRINGER- FRÉSENIUS
PUBLIC CONTRACTS- CPAM- MINISTÈRE
DES FINANCES- CH DE LENS
Customer References
2013 ANNUAL REPORT

At the heart of our business is our customers'
trust, and with that the management of our
teams who work on our customers' sites.
Knowledge and recognition of our security
guards are essential in our business. We must
be close to them, to manage the incidents they
encounter daily during their working hours.
Some 75% of our business covers nights or
weekends!
Being highly eff icient in security, also means
having the right tools for time management and
for monitoring day-to-day activity. The trust
in our teams and in their management ability
has certainly played a decisive role in our 23%
growth in sales this year. We are confident for
2014, as the security market is growing and our
customers include several key accounts, with
needs which are economically or structurally
growing. Carrefour, the SNCF with Paris Gare
du Nord (3rd busiest train station in the world),
France Telecom, FNAC, Monoprix and EDF that
wiill streamline four of its plants and whose
needs are ever growing. We are prepared: we
have already hired the right people to tackle
this constant growth.
MEETING WITH RICHARD TRANCHE President of ATALIAN Sécurité
At the heart of our business is our customers' trust in us
””
40 - 41

RECEPTION
For 21 years, the CITY ONE Group has won the trust of major manufacturing corporations
thanks to its innovative approach to the organization and management of Reception
activities. Today, CITY ONE is ATALIAN’s exclusive partner and manages its Reception
business.
MILESTONES 2013
3,400EMPLOYEES
2NDLARGEST OPERATOR IN FRANCE
€117MREVENUE
OF EXPERIENCE21 YEARS
Customer ReferencesBREAKDOWN OF ACTIVITY
CITY ONE RECEPTION
- FRANCE TÉLÉVISIONS
- DASSAULT
- BANQUE LAZARD
CULTURAL RECEPTION
SERVICES
- MAISON DE LA CULTURE DU JAPON À PARIS
- RENNES MÉTROPOLE
- LA CINÉMATHÈQUE FRANÇAISE
SALES PROMOTION INITIATIVES
- L’ORÉAL
- PERNOD RICARD
- FFA
AIRPORT RECEPTION SERVICES
- ADP
- ACNA
- AIR FRANCE
Events
2007 2008 2009 2010 2011 2012
104
75
115
2013
90
605345
57%
13 %
41 %
28 %
18 %
Field Marketing
Front of house services
Airport
2013 ANNUAL REPORT

For over 23 years our priority has been client
satisfaction. This satisfaction is attained
through proximity, fl exibility, listening to our
clients, and also creativity. It’s our ability to
think outside the box, to anticipate our clients’
needs that now enables us to off er a complete,
diversified and homogenous range of services
in France, Belgium and Luxembourg. Our €117
million turnover in 2013, and our 10% growth
already achieved in 2014 have placed us as the
second biggest player on the French market.
City One is an independent group, which strives
off excellence and service, two values that
ensure we are responsive enough to roll out
our diversification strategy. We thus operate
in various diff erent areas such as:
Reception desks, event host staffing, sales
promotion, cultural event host staff ing, airport
and train station welcoming staff .
We maintain our position amongst the leaders
in the hospitality industry by building win-win
relationships with our clients, our teams, and
our partners; eff icient exchanges in which each
party finds its place and is valued as it should
be. A winning strategy, as our clients have
rewarded us with a 98% satisfaction rate.
It’s our ability to think outside the box, that now enables us to off er a complete, diversified and homogenous range of services
MEETING WITH SOPHIE PÉCRIAUX-JULIENPresident of City One
42 - 43 42 - 43

LANDSCAPING
Size and tree care, pruning, “Activasport” smart fertilization, guying, thermal weed
control, mulching, eco-pasturing, reforestation, tree management, protection and
rehabilitation of natural sites... Pinson Paysage has been a leading landscaper for
over a century.
MILESTONES 2013
BREAKDOWN OF ACTIVITY
1 , 575 PROJECTSIN 2013 (AND 4,150 STUDIES)
650EMPLOYEES€62 M
REVENUE
Maintenance
2007 2008 2009 2010 2011 2012
54
37,3
62
2013
47,5
29,22827
57 %
43 %
Works
MUNICIPALITIES- DOMONT- ENGHIEN LES BAINS- PARMAIN
CORPORATE HEADQUARTERS- GROUPAMA- LAFARGE- LA MONDIALE
LEISURE- PARC ASTERIX - DISNEYLAND PARIS
STADIUMS- DOMONT- GARGENVILLE- SARCELLES
URBAN COMMUNITIES- SAINT QUENTIN - EN YVELINES- CERGY PONTOISE
Customer References
ND LEADING PLAYER LANDSCAPING
IN FRANCE2
2013 ANNUAL REPORT

MEETING WITH THIERRY BRÉMENT President of ATALIAN Espaces Verts
The landscaping business is extremely
fragmented and largely subject to the
weather. This sector is valued at €5 billion in
France, 42% for private individuals, and 58%
for public and private contracts which is our
business segment.
It is served by 28,400 companies in France,
90% of which have fewer than 10 staff and it
employs 92,000 people.
These figures are key to understanding how
we work and how we diff er from competition.
ATALIAN’s Landscaping division is made up
of 650 people who bring added value to our
customers, following specifications rigourously
in liaison with our design off ices. This enabled
us to win market share and increase our sales
by 13.5% (and EBITDA by 25%) this year.
Another reason for satisfaction is that in
France, we won €245 million of competitive
tenders (versus €209 million the previous
year) with a final conversion rate of nearly
21%!
So we are confident about the future!
OUR STRENGTHS• Regional and national sites, combined with international projects
• A QHSE policy that guarantees the safety of our employees and the public
• A dedicated organization (design off ice, supervision structures, field teams, training service)
• Highly eff icient technical resources and equipment with an integrated maintenance workshop
QUALIFICATIONS AND GUARANTEESQualipaysage, Qualigolf, Qualisport, ISO 9001 version 2008, Certificates (phytosanitary,…),
Certiphyto, MASE…, Member of UNEP, Member of the Regesports Group, F2S
Another reason for satisfaction is that in France, we won €245 million of competitive tenders
””
44 - 45

PARQUET FINISHING & FLOOR COVERINGS
Flooring, parquets, paint and wall coverings, masonry, joinery and premises refurbishment,
plumbing and heating systems, troubleshooting and maintenance... Our position as
contractor for the finshing industries, our ability to meet deadlines and budgets, the
excellent finish and recognized quality of our services have all led to a 7% increase in sales
this year.
MILESTONES 2013
BREAKDOWN OF ACTIVITY(% OF SALES)
200EMPLOYEES
€20MREVENUE
45 %
20 %
20 %
15 %
Coverings New Projects Interior painting
New ProjectsParquet and fl exible fl ooring
Renovation
2013 ANNUAL REPORT

New Projects Interior painting
MEETING WITH SERGE VIVIERPresident of ATALIAN Peinture, Parquet et Revêtement de sol
Nous sommes principalement dans les métiers
de la finition. Nos clients sont les majors du
Bâtiment : Bouygues, Eiff age, Vinci, ou encore
des promoteurs/constructeurs comme BNP
Immobilier, Kaufman et Broad et Cogedim …
Chaque année, nous gagnons de nouveaux
clients et ceux que nous avons comme SPIE
SCGPM nous confient de plus en plus de
travaux. Notre centre de gravité reste l’Ile de
France car, quelle que soit la conjoncture, pour
de simples raisons démographiques, cette
région reste un marché porteur.
Résultat : notre chiff re d’aff aires progresse, et je
suis fier de dire qu’avec près de 12 % d’EBITDA,
nous sommes parmi les plus performants du
Groupe. Et nous comptons bien poursuivre
dans cette voie !
We are mainly present in the finishing
business. Our customers are key players
in construction: Bouygues, Eiff age, Vinci,
and other developers/construction
players such as BNP Immobilier, Kaufman
& Broad et Cogedim…
Every year we win new customers, and our
existing ones such as SPIE SCGPM trust
us with an increasing number of projects.
Our center of gravity remains the Ile de
France region, because regardless of
the economic climate, for demographic
reasons alone, this zone is always a
booming market.
As a result, our sales are growing, and
I am proud to say that with close to
12% EBITDA, we are one of the highest-
performing businesses in the Group.
And we are going to stay that way!
- LE PETIT PALAIS
- MUSÉE GREVIN
- ECOLE BOULLE
- BOUYGUES BÂTIMENT
- KAUFMAN & BROAD
- EIFFAGE CONSTRUCTION
- VINCI
- BNP PARIBAS IMMOBILIER
- NEXITY
- CRÉDIT AGRICOLE IMMOBILIER
- SOGEPROM
- ALTAREA
- COGEDIM
Customer References
46 - 47

AIRPORT SERVICES
Runway assistance and baggage handling, passenger assistance, installation of cabin
equipment (blankets, pillows, earphones, etc.) and cabin cleaning, baggage handling and
sorting, taxi rank management, VIP services, etc.
AIRLINES
- AIR FRANCE
- MALAYSIA AIRLINES
- THAI AIRWAYS
- JAL
- EVA AIR
- CYPRUS AIRWAYS
- ROYAL AIR MAROC
- AIR MOLDOVA
- FLYBE
- TWIN JET
- EASY JET
- NWA
- AIR ALGÉRIE
- DELTA AIRLINES
- SERVAIR
- YEMENIA
- AIR CHINA
- QATAR AIRWAYS
- SRI LANKAN AIRLINES
AIRPORTS
- PARIS
- NICE CÔTE D’AZUR
- BRUXELLES
- TOULOUSE-BLAGNAC
- LYON
- LE HAVRE
€90MIN AIRPORT INTERVENTIONS FOR ALL ACTIVITIES
MILESTONES 2013
Customer References
REVENUE
2013 ANNUAL REPORT

TRANSPORTATION & LOGISTICS
Logistics and storage, order preparation, chartering, handling, product packaging…
- AUCHAN
- BOUYGUES
- CARREFOUR
- CHEP FRANCE
- CHRONOPOST
- DHL
- DUCROS - EXPRESS
- GEODIS
- HABITAT
- KUEHNE & NAGEL
- LA POSTE
- PANALPINA
- PONTICELLI
- SDV
- SERVAIR
- SNECMA
300EMPLOYEES
€28MREVENUE
WAREHOUSESTORAGE
50, 000M2
BREAKDOWN OF ACTIVITY
50%
5 %
45 %
50 %
Logistics
Chartering
Transportation
Customer references
MILESTONES 2013
48 - 49

(1) Equivalent Temps Plein
A LAISSER ?
A LAISSER ?
(1) Equivalent Temps Plein
A LAISSER ?
A LAISSER ?
SOCIAL AND SOCIETAL COMMITMENTS p 54
ENVIRONMENT/SUSTAINABLE DEVELOPMENT p 58
For 20 years, ATALIAN has
demonstrated that it is possible
to reconcile strong economic
growth, social progress
and environmental protection.
As this is a guarantee of the
quality and sustainability of its
business, the Group is continuing
this strategy...
2013 ANNUAL REPORT

4SENSE OF RESPONSIBILITY
50 - 51

MEETING WITH TAYEB BELDJOUDI QSE Director of the ATALIAN Group
WHY IS ATALIAN COMMITTED TO ISO 26000?
To go further! Our business primarily covers
technical trades, which require certification to
guarantee expertise. Our Environment Management
System, implemented at certain sites enables us to
strengthen our environmental awareness through
more ambitious deployment on other sites. In
addition, our environmental and social practices as
a supplier are already evaluated by some of our Key
Accounts via the EcoVadis collaborative platform,
a tool for assessing our Sustainable Development
performance. It therefore seemed timely to make
this a Group-wide assessement initiative.
THIS IS A COMPLEX AND AMBITIOUS PROJECT. IS THE WHOLE COMPANY BEHIND
IT?
We took the first step by signing a Quality-Safety-
Environment Charter in October 2011. This sets out
the framework for all Group entities and alongside
customer satisfaction, prioritizes the health
and safety of our people and protection of the
environment. It also advocates a management style
of leading by example and a true corporate culture
based on these principles and eco-citizenship.
It certainly is a complex project. It brings our eight
businesses together. The initiative for an assessment
was developed in conjunction with the Human
Resources Department and management from
Business Development and Customer Relations. Its
scope extends to the Group’s stakeholders, notably
institutions, service providers and customers.
2013 ANNUAL REPORT

Since 2012, ATALIAN has been a signatory of the
United Nations Global Compact. Through this initative,
the Group aff irms its commitment to the 10 founding
principles, grouped into four fundamental themes:
human rights, labor standards, the environment and
the work against corruption.
ATALIAN’S CODE OF ETHICSThe commitment shown by ATALIAN’s senior
management to the Group’s Code of Ethics
provides a shared vision of sound professional
conduct that refl ects the culture and values of the
Group: entrepreneurial spirit, integrity, long-term
responsibility, adaptability and simplicity.
ISO 26 000: an initiative that fosters a culture of eco-citizenship and provides a global, consistent
means of evaluation. With certifications such as ISO 9001:2008 (Quality), MASE (Safety, Security and
Environment) and ISO 14001 (Environment) for certain entities, ATALIAN is unifying its global Quality,
Safety, and Environment policy.
For over a year, the Group has engaged in a global eco-environmental evaluation process that incorporates
the ethical dimension of social responsibility, as laid out by the new ISO 26000 international standard.
52 - 53

SOCIAL & SOCIETAL COMMITMENTS
Our employees work on our customers premises, not on our premises. Issues or problems
that we do not see, that have not been discussed or anticipated, will be felt by our
customers. For ATALIAN, respect for individuals and recognition of the work accomplished
are more than simple words in a charter. It is how we behave on a daily basis and a
question of culture that we share with our teams, whether in France or elsewhere.
41%
MILESTONES 2013
131 NATIONALITIES
EMPLOYEES+60,000
TRAINING IN 2012 192,889 H
44 % MEN
WOMEN 56 %
2013 ANNUAL REPORT

TRAINING TO BOOST LOYALTY, QUALIFICATIONS AND EMPLOYABILITY
ATALIAN is a group on the move: our businesses are too. To anticipate change, support the development
of new business sectors and promote the integration and personal development of all its employees,
the Group has been reorganized and is continually strengthening its training policy.
A large number of occupations today do not correspond to specific study courses. Work/study programs
and vocational training contracts are an excellent way of training young people, creating a pool of
candidates for our medium-term hiring needs.
41%
A PARTNERSHIP WITH IDRAC
To pursue its school-to-work transition program, ATALIAN has teamed up with IDRAC, a multi-campus
business school with locations in 10 major cities in France. The objective is to offer high school graduates
who already have a two-year university level, a vocational training program, leading to a degree.
This paid training program will enable young people with a vocational training contract to obtain a
state-certified diploma, equivalent to three years higher education. At the end of their training, they
can apply for a permanent job as a Junior Operations Manager within the Group.
With this partnership, employees are encouraged, along with the teachers at IDRAC, to offer courses
applicable to the Group. This original approach anchors ATALIAN’s values right from the start of the
course and facilitates the students’ future professional integration.
AN INTEGRATED TRAINING CENTER
Created in 2011, FORMATIO harmonizes know-how across all the international subsidiaries, to raise the
quality of our services and ensure long-term customer satisfaction.
Based in the Czech Republic, FORMATIO offers technical training in each of the Group’s activities
(Cleaning, Safety, Technical Maintenance, etc.) in addition to specific training for strategic functions
such as Commerce, Finance, Procurement, Reception, etc.
54 - 55

PROMOTING DIVERSITY AND INCLUSION
Men, women, young, not so young, engineers, non-graduates, French, other nationalities, people with
disabilities... At ATALIAN, diversity is part of our structure. It is not an objective, but a fact. Moreover,
it is a source of pride: the nature of our businesses allows us to open doors to the job market, for many
people struggling to enter employment.
OUR INCLUSION AND DISABILITY MISSION
The Recruitment and Employment department
centralizes the recruitment of managers for the
entire Group. The Inclusion and Disability Mission
is part of the Group's HR department, providing
advice and support for recruitment in diff erent
regions.
To go one step further and contribute to a better
global Corporate Social Responsibility (CSR)
initiative for the Group, eff orts are being made to
harmonize procedures between regional agencies.
This will primarily include extended annual
reporting for all businesses, to obtain consolidated
indicators on disability and inclusion.
A pioneer in this initiative, the Cleaning business
(accounting for nearly two thirds of total
employees) has already set up monthly reporting ,
showing a consolidated ratio of 7.3% of employees
with declared disabilities, far higher than the
legally required 6%.
To assist ATALIAN’s regional HR managers in
developing good practices, the mission provides a
dedicated tool: the Disability diagnosis.
The development of work/study contracts
constitutes another major challenge for the
inclusion of job seekers. To encourage inclusion
contracts, regional HR teams schedule meetings
with schools, apprenticeship centers and training
bodies. This partnership model is already
operational in the Ile-de-France region.
KEEPING SENIORS IN EMPLOYMENT
At ATALIAN, nearly 30% of employees are seniors
(over 45) who joined the company 15 or 20 years
ago. Their experience is an important advantage
for the Group. Consistent with this, ATALIAN
fully respects the Seniors Agreements signed in
2009. In line with these agreements, ATALIAN is
commited to maintaining the same level of senior
employees and to ensuring that more than 5% of
hires are seniors. More specifically, the Group has
institutionalized a mentoring program and closely
monitors the individuals involved (training for job
changes, rearranging working conditions, etc.).
2013 ANNUAL REPORT

SAFETY IN THE WORKPLACE: CONSTANT TRAINING AND AWARENESS
A priority for the Group, safety in the
workplace is part of ATALIAN’s culture.
It is reiterated through information
campaigns and continuous training. Since
1998, the Group uses a Safety Management
System (SMS) based on the industry-
standard occupational safety improvement
manual MASE (Manuel d’Amélioration
Sécurité des Entreprises). One in 20
employees is a certified first aid officer.
Training is given at ATALIAN’s internal
training center. Industrial risk reduction plans
are rolled out on a continual basis and a panel
of experts accompanies teams throughout
France. ATALIAN also regularly holds "Safety
Discussions”.
56 - 57
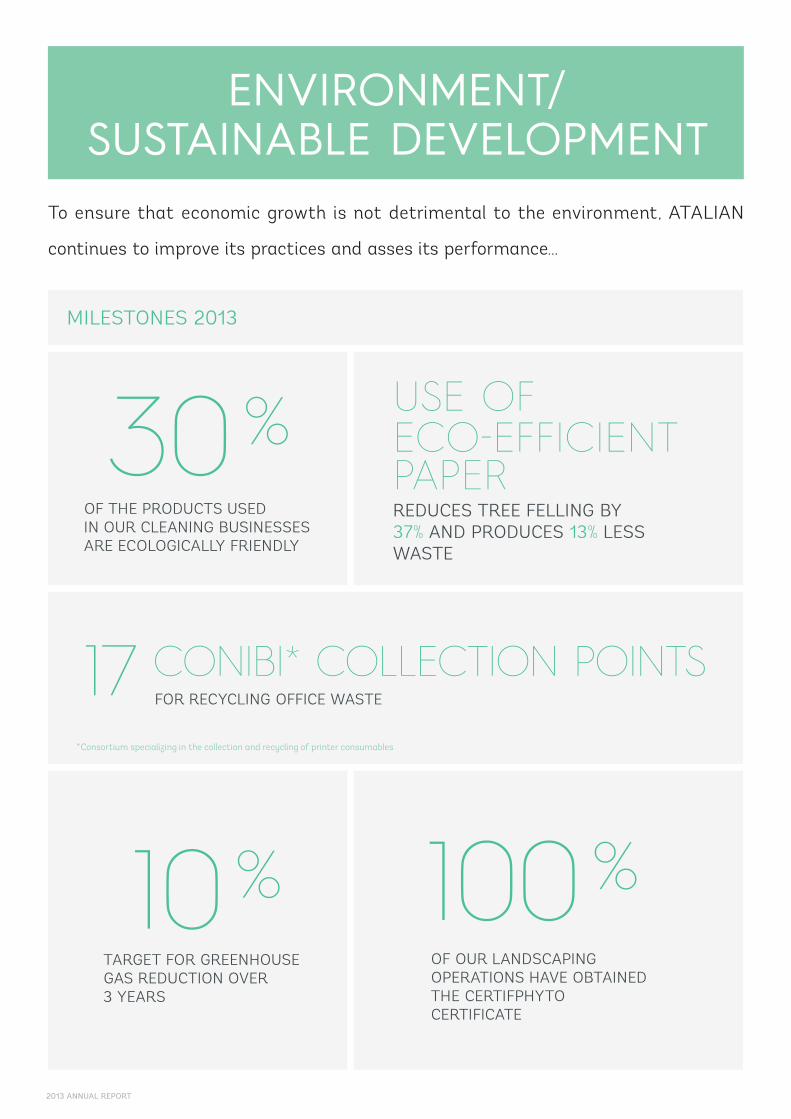
ENVIRONMENT/SUSTAINABLE DEVELOPMENT
To ensure that economic growth is not detrimental to the environment, ATALIAN
continues to improve its practices and asses its performance...
41%
MILESTONES 2013
OF THE PRODUCTS USED IN OUR CLEANING BUSINESSES ARE ECOLOGICALLY FRIENDLY
TARGET FOR GREENHOUSE GAS REDUCTION OVER 3 YEARS
OF OUR LANDSCAPING OPERATIONS HAVE OBTAINED THE CERTIFPHYTO CERTIFICATE
17 CONIBI* COLLECTION POINTS FOR RECYCLING OFFICE WASTE
30 %
10 % 100 %
USE OFECO-EFFICIENT PAPERREDUCES TREE FELLING BY37% AND PRODUCES 13% LESS WASTE
*Consortium specializing in the collection and recycling of printer consumables
2013 ANNUAL REPORT

RESULTS OF ATALIAN’S GREENHOUSE GAS EMISSIONS REPORT
TRAIN, INVOLVE AND INCREASE THE RESPONSIBILITY OF OUR TEAMSTraining plays a key role in adopting the right behavior, to provide our customers with added value. Our
people are continually reminded of good environmental practices – key topics include product recyclability
and waste recovery.
For companies, waste sorting and recycling has become a prime element in economic performance. Some
of our customers are able to recycle up to 80% of their waste: quite significantly, saving hundreds and
even thousands of euros.
Because environmental protection means implementing good practices as well as the small gestures
that make a difference, we also regularly ask our teams in the field to submit suggestions for improving
our operations.
LIMITING OUR ENVIRONMENTAL IMPACTAt our customers’ premises, our main actions consist of reducing our consumption of raw materials,
water, power and reducing toxic emissions. The use of clean vehicles, EU Ecolabel* products, using water
to clean windows, and recyclable waste sorting are part of our day-to-day actions. Our ISO 14001 and
18001 initiatives are the foundations that confirm the Group’s eco-efficiency.
On our own sites, we commit to communicating transparently on our environmental impact. In 2013
for the second year running, ATALIAN produced a report on the Greenhouse Gas impact of its various
businesses. It followed the "Method for producing greenhouse gas emission reports" in the carbon audit
tool Bilan Carbone® V 7.1.02.
The report follows MEDDTL guidelines (French Ministry of Ecology, Sustainable Development, Transportation
and Housing) entitled "Method for producing greenhouse gas emissions reports in accordance with article
75 of law 2010-788 of July 12, 2010, on the national commitment to the environment (ENE) – Version 2".
* EU: the official Europe-wide ecolabel is the only label that guarantees the efficiency of products and the limitation of their environmental impacts (water, air, waste, energy).
41%
CLEANING SAFETY MULTI-TECHNICAL LANDSCAPING
Combustion engines 4 ,824 248 359 85
Cooling fluid 36 4 51 0
Electricity consumption 182 34 48 10
TOTAL 5,042 286 458 95
TOTAL after 10% reduction 4 ,538 257 412 86
*The unit of value used in the table is "tonnes of CO2 equivalent” abbreviated as “TCO2e”
58 - 59

A PROACTIVE POLICY OF CERTIFICATION
CLEANING & ASSOCIATED SERVICESISO 9001 VERSION 2008
OHSAS 18001
ISO 14001
M.A.S.E (SECURITY IMPROVEMENT MANUAL)
CERTIPHYTO
ACTIVITÉS 3D
TRANSPORTATIONISO 9001 VERSION 2008
ECOCERT
RECEPTIONNF SERVICE
SECURITYISO 9001 VERSION 2008
MASE (SECURITY IMPROVEMENT
MANUAL)
TECHNICAL & CONSTRUCTION SERVICESQUALIBAT
QUALIFELEC
MASE 9001, VERSION 2008
HQE BUILDING OPERATIONS
LANDSCAPING ISO 9001 VERSION 2008
QUALIPAYSAGE
QUALISPORT
QUALIGOLF
MASE
CERTIPHYTO
NUCLEARCEFRI E
UTO 85-114
2013 ANNUAL REPORT

60 - 61

The ATALIAN Group continues its growth both in France and abroad with a €1,206 million turnover in FY 2012-2013, up by 3%.
The €150M point (+19%) has been reached on our international markets, with the inauguration of our new and first ever subsidiary in Turkey. We will continue our international development strategy, in particular in Asia, as we firmly believe it is the key to the Group’s future success.
In France, our territorial coverage was further developed through the acquisition of Carrard services, as well as two other companies in the Southwest of the country, in June 2013.
We have thus strengthened our regional presence and aim to increase our market shares on the French territory.
EBITDA has reached €75M (highest level ever for the ATALIAN Group) and the WCR has remained stable in a very complex French economic environment.
Over the last year we have also successfully implemented our disintermediation by proceeding to a debt restructuring on the high yield market. By doing so, the ATALIAN Group has entirely refinanced its debt through a 250 million euro bond issue at a 7.25% rate, quite a success for a family-owned group. Moreover, we opened the issue to the European market in 2013, and our bond is currently performing at a 5.56% rate. We will remain driven and confident in 2014 in order to reach our goals.
2013 ANNUAL REPORT

5FINANCIAL STATEMENTS
62 - 63

PricewaterhouseCoopers Audit 63, rue de Villiers 92200 Neuilly-sur-Seine
Robert Mirri 18, rue Spontini 75016 Paris
Statutory Auditors' report on the consolidated financial statements For the year ended 31 August 2013 This is a free translation into English of the Statutory Auditors' report issued in French and is provided solely for the convenience of English speaking readers. The Statutory Auditors' report includes information specifically required by French law in such reports, whether modified or not. This information is presented below the opinion on the financial statements and includes an explanatory paragraph discussing the Auditors’ assessments of certain significant accounting and auditing matters. These assessments were considered for the purpose of issuing an audit opinion on the consolidated financial statements taken as a whole and not to provide separate assurance on individual account captions or on information taken outside of the consolidated financial statements. This report should be read in conjunction with, and construed in accordance with, French law and professional auditing standards applicable in France. La Financière Atalian SAS 110, rue de l'Ourcq 75019 Paris To the Shareholders, In compliance with the assignment entrusted to us by your General Meeting, we hereby report to you, for the year ended 31 August 2013, on: - the audit of the accompanying consolidated financial statements of La Financière Atalian; - the justification of our assessments; - the specific verification required by law. These consolidated financial statements have been approved by the Chairman. Our role is to express an opinion on these financial statements based on our audit. I - Opinion on the consolidated financial statements We conducted our audit in accordance with professional standards applicable in France. Those standards require that we plan and perform the audit to obtain reasonable assurance about whether the consolidated financial statements are free of material misstatement. An audit involves performing procedures, using sampling techniques or other methods of selection, to obtain audit evidence about the amounts and disclosures in the consolidated financial statements. An audit also includes evaluating the appropriateness of accounting policies used and the reasonableness of accounting estimates made, as well as the overall presentation of the consolidated financial statements. We believe that the audit evidence we have obtained is sufficient and appropriate to provide a basis for our audit opinion. In our opinion, the consolidated financial statements give a true and fair view of the assets and liabilities and of the financial position of the Group at 31 August 2013 and of the results of its operations for the year then ended in accordance with International Financial Reporting Standards as adopted by the European Union. Without qualifying our opinion, we draw your attention to the following matters set out in the notes to the consolidated financial statements:
• Note 2.3 describes the impact on comparative information of error corrections that have been accounted for in accordance with IAS 8 – Accounting Policies, Changes in Accounting Estimates and Errors. This note indicates that these errors are due to certain long-term leases of operating equipment, which are now treated as finance leases rather than operating leases as was previously the case, as well as errors identified in prior-year calculations of provisions for paid leave of the
La Financière Atalian Statutory Auditors' report on the consolidated financial statements Year ended 31 August 2013 - Page 2
employees of certain subsidiaries. These errors were identified when reliability tests were conducted during the year on the pay systems of the subsidiaries concerned. The impact of these corrections on the consolidated financial statements is as follows: − With respect to the corrections relating to long-term leases: "Equity attributable to
owners of the parent" decreased by €0.05 million at 31 August 2011; "External charges" for the 2011-2012 financial year decreased by €1.5 million with a contra-entry recognised as an increase in "Depreciation and amortisation, net" and "Financial expenses" of €1.1 million and €0.3 million respectively. Accordingly, "Profit attributable to owners of the parent" increased by €0.2 million. "Property, plant and equipment" increased by €5.0 million at 31 August 2012. Accordingly, "Long-term financial liabilities" and "Short-term portion of long-term financial liabilities" increased by €2.8 million and €1.9 million respectively.
− With respect to corrections relating to paid leave: "Equity attributable to owners of the parent" decreased by €0.8 million at 31 August 2011 with a contra-entry recognised in payables to employees.
• Note 2.2.2b ("Long-term provisions") which describes the impact on the consolidated financial
statements of the first-time application of IAS 19R – Employee Benefits, which your company elected to early adopt.
II - Justification of our assessments In accordance with the requirements of article L.823-9 of the French Commercial Code (Code de commerce) relating to the justification of our assessments, we bring to your attention the following matter:
• The Group systematically tests goodwill and assets with indefinite useful lives for impairment at the end of each financial year and also determines whether there is an indication of impairment of non-current assets. We reviewed the methods used by the Group to test for impairment and the cash flow forecasts and assumptions used, and verified that Note 2.2.1.a (“Non-current assets”) and Note 3.1 (“Goodwill”) provided appropriate disclosures.
• The Group recognises deferred tax assets in accordance with the methods described in Note 2.1.5 (“Current and deferred income tax”). We verified the consistency of the assumptions used and the calculations made by the Group.
These assessments were made as part of our audit of the consolidated financial statements taken as a whole, and therefore contributed to the opinion we formed which is expressed in the first part of this report. III - Specific verification As required by law and in accordance with professional standards applicable in France, we have also verified the information relating to the Group presented in the management report. We have no matters to report as to its fair presentation and its consistency with the consolidated financial statements.
Neuilly-sur-Seine and Paris, 4 December 2013
The Statutory Auditors
PricewaterhouseCoopers Audit Robert Mirri
La Financière Atalian Rapport des commissaires aux comptes sur les comptes consolidés Exercice clos le 31 août 2013 - Page 3
Fait à Neuilly-sur-Seine et Paris, le 4 décembre 2013
Les commissaires aux comptes
PricewaterhouseCoopers Audit ROBERT MIRRI Eric Bertier
2013 ANNUAL REPORT

PricewaterhouseCoopers Audit 63, rue de Villiers 92200 Neuilly-sur-Seine
Robert Mirri 18, rue Spontini 75016 Paris
Statutory Auditors' report on the consolidated financial statements For the year ended 31 August 2013 This is a free translation into English of the Statutory Auditors' report issued in French and is provided solely for the convenience of English speaking readers. The Statutory Auditors' report includes information specifically required by French law in such reports, whether modified or not. This information is presented below the opinion on the financial statements and includes an explanatory paragraph discussing the Auditors’ assessments of certain significant accounting and auditing matters. These assessments were considered for the purpose of issuing an audit opinion on the consolidated financial statements taken as a whole and not to provide separate assurance on individual account captions or on information taken outside of the consolidated financial statements. This report should be read in conjunction with, and construed in accordance with, French law and professional auditing standards applicable in France. La Financière Atalian SAS 110, rue de l'Ourcq 75019 Paris To the Shareholders, In compliance with the assignment entrusted to us by your General Meeting, we hereby report to you, for the year ended 31 August 2013, on: - the audit of the accompanying consolidated financial statements of La Financière Atalian; - the justification of our assessments; - the specific verification required by law. These consolidated financial statements have been approved by the Chairman. Our role is to express an opinion on these financial statements based on our audit. I - Opinion on the consolidated financial statements We conducted our audit in accordance with professional standards applicable in France. Those standards require that we plan and perform the audit to obtain reasonable assurance about whether the consolidated financial statements are free of material misstatement. An audit involves performing procedures, using sampling techniques or other methods of selection, to obtain audit evidence about the amounts and disclosures in the consolidated financial statements. An audit also includes evaluating the appropriateness of accounting policies used and the reasonableness of accounting estimates made, as well as the overall presentation of the consolidated financial statements. We believe that the audit evidence we have obtained is sufficient and appropriate to provide a basis for our audit opinion. In our opinion, the consolidated financial statements give a true and fair view of the assets and liabilities and of the financial position of the Group at 31 August 2013 and of the results of its operations for the year then ended in accordance with International Financial Reporting Standards as adopted by the European Union. Without qualifying our opinion, we draw your attention to the following matters set out in the notes to the consolidated financial statements:
• Note 2.3 describes the impact on comparative information of error corrections that have been accounted for in accordance with IAS 8 – Accounting Policies, Changes in Accounting Estimates and Errors. This note indicates that these errors are due to certain long-term leases of operating equipment, which are now treated as finance leases rather than operating leases as was previously the case, as well as errors identified in prior-year calculations of provisions for paid leave of the
La Financière Atalian Statutory Auditors' report on the consolidated financial statements Year ended 31 August 2013 - Page 2
employees of certain subsidiaries. These errors were identified when reliability tests were conducted during the year on the pay systems of the subsidiaries concerned. The impact of these corrections on the consolidated financial statements is as follows: − With respect to the corrections relating to long-term leases: "Equity attributable to
owners of the parent" decreased by €0.05 million at 31 August 2011; "External charges" for the 2011-2012 financial year decreased by €1.5 million with a contra-entry recognised as an increase in "Depreciation and amortisation, net" and "Financial expenses" of €1.1 million and €0.3 million respectively. Accordingly, "Profit attributable to owners of the parent" increased by €0.2 million. "Property, plant and equipment" increased by €5.0 million at 31 August 2012. Accordingly, "Long-term financial liabilities" and "Short-term portion of long-term financial liabilities" increased by €2.8 million and €1.9 million respectively.
− With respect to corrections relating to paid leave: "Equity attributable to owners of the parent" decreased by €0.8 million at 31 August 2011 with a contra-entry recognised in payables to employees.
• Note 2.2.2b ("Long-term provisions") which describes the impact on the consolidated financial
statements of the first-time application of IAS 19R – Employee Benefits, which your company elected to early adopt.
II - Justification of our assessments In accordance with the requirements of article L.823-9 of the French Commercial Code (Code de commerce) relating to the justification of our assessments, we bring to your attention the following matter:
• The Group systematically tests goodwill and assets with indefinite useful lives for impairment at the end of each financial year and also determines whether there is an indication of impairment of non-current assets. We reviewed the methods used by the Group to test for impairment and the cash flow forecasts and assumptions used, and verified that Note 2.2.1.a (“Non-current assets”) and Note 3.1 (“Goodwill”) provided appropriate disclosures.
• The Group recognises deferred tax assets in accordance with the methods described in Note 2.1.5 (“Current and deferred income tax”). We verified the consistency of the assumptions used and the calculations made by the Group.
These assessments were made as part of our audit of the consolidated financial statements taken as a whole, and therefore contributed to the opinion we formed which is expressed in the first part of this report. III - Specific verification As required by law and in accordance with professional standards applicable in France, we have also verified the information relating to the Group presented in the management report. We have no matters to report as to its fair presentation and its consistency with the consolidated financial statements.
Neuilly-sur-Seine and Paris, 4 December 2013
The Statutory Auditors
PricewaterhouseCoopers Audit Robert Mirri
La Financière Atalian Rapport des commissaires aux comptes sur les comptes consolidés Exercice clos le 31 août 2013 - Page 3
Fait à Neuilly-sur-Seine et Paris, le 4 décembre 2013
Les commissaires aux comptes
PricewaterhouseCoopers Audit ROBERT MIRRI Eric Bertier
64 - 65

in thousands of euros
ASSETS Note 31 Aug. 2013 31 Aug. 2012restated(1)
Goodwill 3.1 403,819 377,113 Intangible assets 3.2 8,166 9,192 Property, plant and equipment 3.3 43,059 45,465 Other non-current financial assets 3.4 12,418 7,744 Deferred tax assets 7.1 48,907 48,020
NON-CURRENT ASSETS 516.369 487.534 Inventories 4.1 2,201 2,652 Prepayments to suppliers 4.2 4,980 2,247 Trade receivables 4.3 212,405 295,538 Other receivables 4.3 1,196 795 Cash and cash equivalents 4.3 85,649 67,338 Financial instruments 4.5 52,641 29,721
CURRENT ASSETS 359,072 398,291
Assets held for sale and discontinued operations
TOTAL ASSETS 875,441 885,825
EQUITY AND LIABILITIES Note 31 Aug. 2013 31 Aug. 2012restated(1)
Equity• Share capital 5.1 117,363 122,674 • Share premium and other reserves (1,681) 15,888 • Translation reserve 5.2 (30) 335 • Fair value reserves 5.2 (1,804)• Profit for the period 7,006 11,105
EQUITY ATTRIBUTABLE TO OWNERS OF THE PARENT 122,658 148,198 Non-controlling interests 7,815 6,249
TOTAL EQUITY 130,473 154,448 Long-term financial liabilities 8.1 258,214 196,223 Long-term provisions 6.1 6,190 6,147 Deferred tax liabilities 7.1 129 145
NON-CURRENT LIABILITIES 264,533 202,515 Customer prepayments 10.1 620 914 Short-term portion of long-term financial liabilities 8.1 34,611 119,581 Current tax liabilities 10.1 2,718 5,294 Trade payables 10.1 122,149 105,965 Short-term provisions 6.2 18,193 19,534 Other current liabilities 10.1 300,416 271,200 Short-term bank loans and overdrafts 10.2 1,728 3,541 Financial instruments 10.3 / 15 2,833
CURRENT LIABILITIES 480,435 528,862 Liabilities related to assets held for sale and discontinued operations -
TOTAL EQUITY AND LIABILITIES 875,441 885,825 (1) The figures presented in the consolidated balance sheet at 31 August 2012 have been restated to take into account the error corrections and IAS 19R applying, described in Note 2.3.
CONSOLIDATED BALANCE SHEET31 AUGUST 2013
ANNUAL FINANCIAL STATEMENTS 2013/2014

in thousands of euros
ASSETS Note 31 Aug. 2013 31 Aug. 2012restated(1)
REVENUE 11 1,206,199 1 172 945Goodwill (226,524) (214,515)External charges (128,151) (131,486)Payroll costs (760,368) (742,902)Taxes other than on income (20,373) (18,396)Other recurring operating income 11,922 11,520Other recurring operating expenses (7,781) (6,950)
RECURRING OPERATING PROFIT BEFORE DEPRECIATION, AMORTISATION, PROVISIONS AND IMPAIRMENT LOSSES 74,924 70,216
Depreciation and amortisation, net (20,240) (18,942)Provisions and impairment losses, net 3,240 (896)
RECURRING OPERATING PROFIT 12 57,924 50,378Other operating income 3 294Other operating expenses
OPERATING PROFIT 12 57 924 53 672Financial income 103 177Financial expenses (35,715) (25,201)
FINANCE COSTS, NET 13 (35,612) (25,024)Other financial income and expenses (1,474) (694)
NET FINANCIAL EXPENSE 13 (37,086) (25,718)Income tax expense 14 (13,178) (15,770)Share of profit (loss) of associates 441 (292)
PROFIT FROM CONTINUING OPERATIONS 8,101 11,892Profit for the period from discontinued operations 0 0
PROFIT FOR THE PERIOD 8,101 11,892
Profit attributable to owners of the parent 7,006 11,105
Profit attributable to non-controlling interests 1,095 787(1) The figures presented in the consolidated income statement for the year ended 31 August 2012 have been restated to take into account the error corrections and IAS 19R applying, described in Note 2.3.
CONSOLIDATED INCOME STATEMENT31 AUGUST 2013
66 - 67

in thousands of euros
31 Aug. 2013 31 Aug. 2012restated(1)
PROFIT FOR THE PERIOD 8,101 11,892Exchange differences on translating foreign operations (365) (35)Change in value of hedging instruments 2,833 (1,705)Change in value of available-for-sale financial assetsChange in value of non-current assetsTaxes on equity transactions (1,029) 587Other net changesChange in actuarial gains or losses IAS 19R (439)EQUITY WARRANT BUY-BACK (359) (859)
OTHER COMPREHENSIVE INCOME (EXPENSE) FOR THE PERIOD 1,080 (2,451)
TOTAL COMPREHENSIVE INCOME FOR THE PERIOD 9,181 9,441
Attributable to owners of the parent 8,086 8,654
Attributable to non-controlling interests 1,095 787(1) The figures presented in the consolidated income statement for the year ended 31 August 2012 have been restated to take into account the error corrections and IAS 19R applying, described in Note 2.3.
CONSOLIDATED STATEMENT OF COMPREHENSIVE INCOME
31 AUGUST 2013
ANNUAL FINANCIAL STATEMENTS 2013/2014

CONSOLIDATED STATEMENT OF CASH FLOWS - 31 AUGUST 2013
in thousands of euros
GOODWILL 31 Aug. 2013 31 Aug. 2012restated(1)
A - OPERATING ACTIVITIESCash generated from operations: • Profit from continuing operations 8,101 11,892• Elimination of share of profit (loss) of associates (441) 292• NON-CURRENT ASSETS • Elimination of net additions to (reversals of) depreciation, amortisation, impair-
ment and long-term provisions» 17,200 19,610
• Elimination of gains and losses on asset disposals (2,395) (4,676)• Elimination of other non-cash items 50 (3,135)Total cash generated from operations 22,515 23,983• Elimination of net finance costs 35,612 25,024• Elimination of income tax expense for the period 13,178 15,770• Elimination of post-acquisition dividends received
Cash generated from operations before financial expenses and tax 71,305 64,777• Income tax paid (18,433) (12,563)• Change in operating working capital 85,861 11,195
NET CASH GENERATED BY OPERATING ACTIVITIES (A) 138,733 63,409B - INVESTING ACTIVITIESPurchases of property, plant and equipment and intangible assets (12,211) (14,346)Change in net payables due on property, plant and equipment and intangible assetsProceeds from sales of property, plant and equipment and intangible assets 1,348 6,210Impact of changes in Group structure• Purchases of consolidated companies less cash held by subsidiaries acquired or sold (4,329) (6,790)• Change in net payables due on consolidated companies • Proceeds from sales of consolidated companies• Other cash flows from investing activities (changes in loans, dividends received
from non-consolidated companies) 436 (713)
NET CASH USED IN INVESTING ACTIVITIES (B) (14,756) (15,639)C - FINANCING ACTIVITIESProceeds from issuance of ordinary shares (11,000)Equity warrant buy-back (19,200)Dividends paid during the period• Dividends paid to shareholders of the parent company (3,000) (3,000)• Dividends paid to non-controlling interests in consolidated companiesProceeds from new borrowings 241,337 32,895Repayments of borrowings (260,797) (46,765)Finance costs, net (35,612) (25,024)Non-cash interest expense 11,725 10,559Capitalised interest from prévious period, paid (22,701)Other cash flows from financing activities 23
NET CASH USED IN FINANCING ACTIVITIES (C) (99,225) (31,335)D - EXCHANGE GAINS (LOSSES) ON CASH AND CASH EQUIVALENTS (D) (19) (42)
CHANGE IN NET CASH AND CASH EQUIVALENTS (A+B+C+D) 24,733 16,393
Net cash and cash equivalents at the begining of the period 26,180 9,787
(1) The figures presented in the consolidated balance sheet at 31 August 2012 have been restated to take into account the error corrections and IAS 19R applying, described in Note 2.3.
24,733 16,393
NET CASH AND CASH EQUIVALENTS AT THE PERIOD-END 50,913 26,180(1) The figures presented in the consolidated income statement for the year ended 31 August 2012 have been restated to take into account the error corrections and IAS 19R applying, described in Note 2.3.
68 - 69

CONSOLIDATED STATEMENT OF CHANGES IN EQUITY - 31 AUGUST 2013
Milliers d’euros
PART GROUPE
Share capital
and share premium
Reserves/ Retained earnings
Profit for the period
Trans-lation
reserve
Fair value reserves
EQUITY ATTRIBU-TABLE TO
OWNERS OF THE PARENT
Non- controlling interests
TOTAL EQUITY
AT 31 AUGUST 2011 127,728
Error correction (820) 48 (772) (89) (861)
AT 31 AUGUST 2011 (RESTATED) (1) 127,728 1,144 14,574 370 (686) 143,130 5,456 148,586
Other changes in equityAppropriation of FY 2011 profit 14,574 (14,574)Dividends paid (3,000) (3,000) (3,000)Translation differences (35) (35) (35)Profit for the period 10,029 10,029 763 10,792Income and expenses recognised directly in equity (436) (1,118) (1,554) (1,554)
PROFIT FOR THE PERIOD AND INCOME AND EXPENSES RECOGNISED DIRECTLY IN EQUITY
(436) 10,029 (35) (1,118) 8,440 763 9,203
Impact of changes in Group structure (589) (589) 6 (583)
AT 31 AUGUST 2012 127,728 11,693 10,029 335 (1,804) 147,981 6,225 154,206
Error correction 217 217 24 242EQUITY AND LIABILITIES (859) 859
AT 31 AUGUST 2012 (restated)(1) 127,728 10,834 11,105 335 (1,804) 148,198 6,249 154,448
Other changes in equity (11,000) (19,200) (30,200) (30,200)Appropriation of FY 2012 profit 11,105 (11,105)Dividends paid (3,000) (3,000) (3,000)Translation differences (365) (365) (365)Profit for the period 7,006 7,006 1,095 8,101Income and expenses recognised directly in equity (359) 1,804 1,445 1,445
PROFIT FOR THE PERIOD AND INCOME AND EXPENSES RECO-GNISED DIRECTLY IN EQUITY
(359) 7,006 (365) 1,804 8,086 1,095 9,181
Impact of changes in Group structure (426) (426) 471 45
AT 31 AUGUST 2013 116,728 (1,046) 7,006 (30) 122,658 7,815 130,473(1) The figures presented in the consolidated statement of changes in equity at 31 August 2012 have been restated to take into account the error corrections and IAS 19R applying, described in Note 2.3.
ANNUAL FINANCIAL STATEMENTS 2013/2014

APPENDICES TO THE CONSOLIDATED ACCOUNTS
NOTE 1. General information and significant events .........................................................................................................................................................p. 72
NOTE 2. Summary of significant accounting policies (IFRS) ..........................................................................................................................p. 74
NOTE 3. Non-current assets ....................................................................................................................................................................................................................................................p. 95
NOTE 4. Current assets .....................................................................................................................................................................................................................................................................p. 100
NOTE 5. Equity .......................................................................................................................................................................................................................................................................................................p. 102
NOTE 6. Long-and short-term provisions....................................................................................................................................................................................................p. 104
NOTE 7. Non-current tax assets and liabilities .............................................................................................................................................................................p. 105
NOTE 8. Long-and short-term financial liabilities .................................................................................................................................................................p. 107
NOTE 9. Change in net debt .....................................................................................................................................................................................................................................................p. 109
NOTE 10. Other current liabilities ..............................................................................................................................................................................................................................p. 111
NOTE 11. Segment reporting ...................................................................................................................................................................................................................................................p. 113
NOTE 12. Recurring operating profit/operating profit ....................................................................................................................................................p. 114
NOTE 13. Finance costs, net & other financial income and expenses .........................................................................................p. 115
NOTE 14. Income tax expense ..............................................................................................................................................................................................................................................p. 116
NOTE 15. Financial instruments ......................................................................................................................................................................................................................................p. 117
NOTE 16. Off-balance sheet commitments ............................................................................................................................................................................................p. 118
NOTE 17. Headcount ..................................................................................................................................................................................................................................................................................p. 119
NOTE 18. List of consolidated companies ..................................................................................................................................................................................................p. 120
NOTE 19. Statutory auditors’ fees .............................................................................................................................................................................................................................p. 122
70 - 71
The terms «the Atalian Group» and «the Group» refer to the parent company, La Financière Atalian, and its consolidated subsidiaries. The term «the Company» refers solely to the parent company, La Financière Atalian.
La Financière Atalian - the Group holding company - is a simplified joint-stock company incorporated under French law (société par actions simplifiée), whose registered office is located at 110 rue de l’Ourcq, 75019 Paris, France. The Atalian Group provides cleaning services and other support services to companies and organisations, in France and abroad.
The consolidated financial statements are presented in thousands of euros unless otherwise specified and were approved by the Chairman on 3 December 2013.
At 31 August 2013 the Company’s share capital was composed of 117,362,871 ordinary shares with a par value of €1 each. A breakdown of the Company’s share capital is provided in Note 5 - «Equity».
NOTE 1GENERAL INFORMATION
AND SIGNIFICANT EVENTS
SIGNIFICANT EVENTS DURING THE FINANCIAL YEAR
During FY 2012-2013 the Group carried out a major restructuring of its long-term and short-term debt and also reviewed a number of its asset leasing arrangements.
Bond issueIn January 2013 the Group refinanced its long-term debt and reviewed its entire financing structure as shown in Note 8 - «Long- and short-term financial liabilities».
As part of this refinancing, on 10 January 2013 the Group issued €250 million worth of bonds redeemable at par on 15 January 2020, with a 7.25% p.a. fixed-rate coupon.
Atalian used the proceeds from the bond issue to repay its various financing facilities set up in 2009, notably a senior bank loan, senior and junior mezzanine debt (including the buyback of the embedded equity warrants), and a revolving credit facility which has since been renegotiated and now has available drawdowns of up to €18 million.
The €9.9 million in arranging fees for this new financing are being recognized in net finance costs by the effective interest method over the life of the borrowings, while the €8.1 million in unamortised arranging fees related to the refinanced debt have been written off in full to the income statement under «Finance costs, net».
New factoring contractAt the same time as refinancing its long-term debt, the Group also reviewed its trade receivables factoring programme in France which is aimed at financing working capital.
As part of this process the programme’s ceiling was increased from €80 million to €130 million and its contractual framework was renegotiated so that the Group can now derecognise a significant portion of its factored receivables.
A description of the characteristics of the Group’s factoring contracts in place at the year-end is provided in Note 8.3 - «Factoring».
ANNUAL FINANCIAL STATEMENTS 2013/2014

New method of accounting for certain asset leasing arrangementsWhen the Group restructured its financing it also undertook a major review of its asset leasing arrangements.
In order to perform certain cleaning and multi-service contracts, the Group has to make significant investments in industrial equipment, which are financed either through equity or through finance or long-term leases.
Most of the Group’s long-term leases are treated as operating leases.
However, during the review of its leasing arrangements, the Group identified that a number of long-term leases recently entered into concern operating equipment that is similar to that financed with equity or through finance leases and should therefore be accounted for as finance leases, particularly as in practice the Group uses the assets concerned for substantially the whole of their useful lives.
The impact on the Group’s financial statements and comparative disclosures of this new method of accounting for long-term leases is provided in Note 2.3 - «Comparability of the financial statements».
Business combination - Acquisition of Carrard ServicesIn June 2013, the Group finalised its acquisition of Carrard Services, a company specialised in cleaning, multi-services and special works which operates throughout France.
The acquisition of Carrard Services - which has 4,500 employees and generated €75 million in revenue in 2012 - has further strengthened Atalian’s positions in the cleaning services sector.
The Group acquired control of Carrard Services on 3 July 2013 after the applicable conditions for completion of the deal had been met, notably when clearance had been obtained from the Commercial Court overseeing Carrard Services’ bankruptcy protection proceedings (plan de sauvegarde).
The impacts of this business combination on the Group’s financial statements are presented in Note 3 - «Non-current assets».
Also during FY 2012-2013 the Group changed its legal form to become a simplified joint-stock company (société par actions simplifiée).
SIGNIFICANT EVENTS AFTER 31 AUGUST 2013At the Extraordinary General Meeting held on 17 September 2013, the shareholders resolved to reduce the Company’s capital by €1,738,290 from €117,362,871 to €115,624,581.
No significant changes in Group structure took place between 31 August 2013 and the issue date of these financial statements.
72 - 73
The principal accounting policies applied in the preparation of the Group’s consolidated financial statements for the year ended 31 August 2013 are set out below. These policies have been consistently applied to all the financial years presented, unless otherwise stated.
In compliance with Regulation (EC) No. 1606/2002 of the European Parliament and Council dated 19 July 2002, these consolidated financial statements have been prepared in accordance with International Financial Reporting Standards (IFRS) as adopted by the European Union as at the preparation date, including IASs, IFRSs and the interpretations issued by IFRIC and its predecessor the SIC.
The standards and interpretations adopted by the European Union can be viewed on the European Commission’s website at http://ec.europa.eu/internal_market/accounting/ias/index_en.htm.
A) NEW STANDARDS AND INTERPRETATIONS WHOSE APPLICATION WAS MANDATORY IN FY 2012-2013
The Group has not identified any new standards, interpretations or amendments to existing standards whose application was mandatory for the first time in the financial year ended 31 August 2013, except for the amendments to IAS 1 - Presentation of Financial Statements, which require items of other comprehensive income in the statement of comprehensive income to be grouped into those that may subsequently be reclassified to profit or loss and those that will not be reclassified to profit or loss. The main impact of these amendments for the Group was on the presentation of the statement of comprehensive income.
B) STANDARDS AND INTERPRETATIONS EARLY ADOPTED IN FY 2012-2013
In FY 2012-2013 the Group early adopted the revised version of IAS 19 - Employee Benefits, issued in June 2011 by the IASB and adopted by the European Union in June 2012.
The new standard (IAS 19R) eliminates (i) the option of using the corridor method in accounting for actuarial gains and losses on defined benefit plans, and (ii) the possibility of deferring the recognition of past service cost. Actuarial gains and losses on defined benefit plans now have to be recognised immediately in other comprehensive income (not reclassifiable to profit). In the event of a plan amendment, past service cost (both vested and unvested) must be recognised in full in profit. IAS 19R also modifies the method for determining the expected return on plan assets and requires additional disclosures about defined benefit plans. The IASB’s effective date for IAS 19R is annual periods beginning on or after 1 January 2013, with earlier application permitted.
The impacts of applying IAS 19R are described in Note 2.2.2.b - «Long-term provisions».
NOTE 2SUMMARY OF SIGNIFICANT
ACCOUNTING POLICIES (IFRS)
ANNUAL FINANCIAL STATEMENTS 2013/2014

C) STANDARDS AND INTERPRETATIONS PUBLISHED BUT NOT YET APPLICABLE
In general, apart from IAS 19R the Group has not early adopted any standards or interpretations that have been endorsed by the European Union but whose application was not mandatory in FY 2012-2013.
The Group is currently analysing the impacts of other new and revised standards, notably IFRS 13 - Fair Value Measurement, effective from 1 January 2013, IFRS 10 - Consolidated Financial Statements, IFRS 11 - Joint Arrangements, and IFRS 12 - Disclosure of Interests in Other Entities, as well as the revised versions of IAS 27 - Separate Financial Statements and IAS 28 - Investments in Associates and Joint Ventures, issued by the IASB in May 2011 and adopted by the European Union with an effective date of 1 January 2014.
D) USE OF ESTIMATES
The consolidated financial statements have been prepared according to the historical cost convention apart from certain items, particularly available-for-sale financial assets and derivatives, which are measured at fair value.
The preparation of these consolidated financial statements required Group Management to use certain estimates and assumptions that may have an impact on the reported values of assets and liabilities at the balance sheet date, and on items of income and expense for the period. These estimates and assumptions are reviewed on a continuous basis by reference to past experience, as well as various other factors considered as reasonable which form the basis for assessing the carrying amount of assets and liabilities. Actual results could differ significantly from these estimates if different assumptions or circumstances apply.
The estimates and assumptions that may have a significant impact on the assets and liabilities and income and expense items in the consolidated financial statements are as follows:
Goodwill impairment testing Goodwill is tested for impairment at least annually, at the same time each year, using the method described in Note 2.2.1 below. The recoverable amount of cash-generating units (CGUs) is determined using a multi-criteria valuation method and is based on estimates of future cash flows.
Provisions for pension and other long-term employee benefit obligations The present value of the Group’s pension and other long-term employee benefit obligations depends on the actuarial assumptions adopted at each reporting date, including the discount rate. Changes in these assumptions affect the carrying amount of pension and other long-term employee benefit obligations.
At each reporting date the Group determines the discount rate to be used for measuring these obligations by reference to market yields on bonds issued by companies with high credit ratings assigned by well-known rating agencies, and which are denominated in the currency in which the benefits will be paid and have terms to maturity approximating the terms of the benefit obligations.
The Group also uses other assumptions that notably depend on market conditions.
74 - 75

Fair value of derivatives and other financial instruments The fair value of financial instruments that are not traded in an active market is calculated by using valuation techniques. The Group uses its judgement to determine the methods and assumptions applied at each reporting date based on market conditions.
Deferred tax assetsDeferred tax assets are recognised to the extent that it is probable that future taxable profit will be available to realise the related tax benefit, based on fiscal forecasts drawn up for each taxable entity or tax consolidation group.
Other provisions These provisions mainly concern provisions for legal risks and restructuring costs.
A provision is recorded when the Group has a present obligation resulting from a past event, the amount of the obligation can be reliably estimated and it is probable that an outflow of resources will be required to settle the obligation. The provisions are determined and updated based on assumptions made by the Group at each reporting date and are discounted if the time value of money is material.
II.1 - CONSOLIDATION2.1.1 Financial year-end
The Group’s companies have been consolidated based on their financial statements for the twelve-month period ended 31 August 2013. However, companies acquired during the course of the financial year have only been included in the income statement as from the date on which the Group effectively acquired control.
2.1.2 Consolidation methods and scope of consolidation
• 2.1.2.1 SUBSIDIARIES
Subsidiaries are entities over which La Financière Atalian exercises control, either directly or indirectly. Control is presumed to exist when the Group has the power to govern an entity’s financial and operating policies so as to obtain benefits from its activities, generally accompanying a shareholding representing more than one half of the voting rights. Subsidiaries are fully consolidated taking into account the existence and effect of the voting rights of non-controlling interests. Control may also arise when a contract exists entitling the Group to govern an entity’s financial and operating policies, or when the Group is able to govern the financial and operating policies by virtue of de facto control. The existence and effect of potential voting rights that are currently exercisable or convertible are considered when assessing whether the Group controls another entity.
Intra-group transactions and balances and unrealised gains on transactions between Group companies are eliminated in consolidation.
ANNUAL FINANCIAL STATEMENTS 2013/2014

Subsidiaries are fully consolidated from the date on which control is transferred to the Group and are deconsolidated from the date that control ceases.
The profit or loss of subsidiaries is allocated between the Group and non-controlling interests based on their percentage interest in the subsidiary concerned, even if this results in the recognition of negative amounts.
The Group gives firm or optional purchase commitments to the minority shareholders of certain consolidated subsidiaries. For optional commitments, if the underlying options are exercised, the commitments - which are contractual in nature - enable the minority shareholders to sell their interests in the subsidiaries concerned to the Group, which is obliged to purchase them. At the year-end, the Group recognises a financial liability in relation to such commitments, corresponding to the present value of the estimated future exercise price of the options (see Note 8 - «Long- and short-term financial liabilities», under «Other borrowings and financial liabilities»). The contra-entry for this financial liability is a cancellation of the value of non-controlling interests. If the value of the financial liability exceeds the carrying amount of the related non-controlling interests, the excess is recorded as a deduction from equity attributable to owners of the parent. Any subsequent changes in the financial liability are recognised in equity. These commitments have no impact on the allocation of subsidiaries’ profit or loss between the Group and non-controlling interests.
A list of La Financière Atalian’s subsidiaries is provided in Note 18.
Entities that are owned by several shareholders exercising joint control are proportionately consolidated (joint ventures).
• 2.1.2.2 ASSOCIATES
Associates are entities over which the Group has significant influence but not control, generally accompanying a shareholding representing between 20% and 50% of the voting rights.
Investments in associates are accounted for using the equity method. Under the equity method, the investment is initially recognised at cost, and the carrying amount is increased or decreased to recognise the investor’s share of the profit or loss of the investee after the date of acquisition. The Group’s investment in associates includes goodwill (net of any accumulated impairment losses) identified at the time of acquisition. If the Group’s interest in an associate is reduced to zero, additional losses are provided for and a liability is recognised only to the extent that the Group has incurred legal or constructive obligations on behalf of the associate.
The Group’s share of the profit or loss of associates is recognised in the consolidated income statement, and its share of movements in other comprehensive income is recognised in other comprehensive income. Unrealised gains on transactions between the Group and its associates are eliminated pro rata to the Group’s interest in the associates concerned. Accounting policies of subsidiaries and associates have been changed where necessary to ensure consistency with the policies adopted by the Group.
A list of the Group’s associates is provided in Note 18.
Shares in companies that do not represent material amounts for the Group or over which La Financière Atalian does not exercise any influence are recognised as investments in non-consolidated companies and measured at fair value as «Available-for-sale» financial assets.
76 - 77

• 2.1.2.3 CHANGES IN THE SCOPE OF CONSOLIDATION
At 31 Aug. 2013 At 31 Aug. 2012
. Fully consolidated companies 114 121
. Proportionately consolidated companies 1 1
. Companies accounted for by the equity method 2 5
117 127
2.1.3 Translation of the financial statements of foreign subsidiaries
The results and financial position of consolidated subsidiaries that have a functional currency other than the euro are translated into euros as follows: (i) assets and liabilities for each balance sheet presented are translated at the closing rate at the date of that balance sheet (except for equity which is translated at historical rates), and (ii) income and expenses and cash flow statement items are translated at average exchange rates for the year, unless the rate concerned underwent major fluctuations during the period in which case transaction date exchange rates are used. All resulting exchange differences are recognised in other comprehensive income.
2.1.4 Translation of foreign-currency transactions
Foreign-currency transactions are translated into the functional currency using the exchange rates prevailing at the dates of the transactions. Monetary assets and liabilities denominated in foreign currencies at the reporting date are translated at the closing rate. Any resulting exchange differences are recognised in the income statement.
2.1.5 Current and deferred income tax
In accordance with IAS 12, the income tax expense for the period comprises the current taxes of each consolidated company as well as deferred taxes.
Deferred taxes are determined by each taxable entity, using the liability method, on temporary differences arising between the tax bases of assets and liabilities and their carrying amounts in the consolidated financial statements.
A deferred tax asset/liability is recognised for all deductible/taxable temporary differences. However, deferred tax assets are recognised only to the extent that it is probable that future taxable profit will be available within a reasonable timeframe against which the temporary differences can be utilised.
Temporary differences between the tax bases of assets and liabilities and their carrying amounts may arise as a result of the following:• Sources of future taxation (deferred tax liabilities): mainly corresponding to income on which
taxation has been deferred.• Sources of future deductions (deferred tax assets): mainly relating to provisions that are temporarily non-deductible for tax purposes, as well as tax loss carryforwards where the realisation of the related tax benefit through future taxable profits is highly probable.
Income tax expense is recognised in the income statement except where it relates to items recognised directly in equity/other comprehensive income, in which case, the tax is also recorded in equity/other comprehensive income.
Deferred taxes are recognised at the tax rate prevailing at the reporting date, adjusted where appropriate to take into account the effect of any changes in tax laws. The effect of any change
ANNUAL FINANCIAL STATEMENTS 2013/2014

in rates of corporation tax is included in either the income statement or in equity, depending on the initial method of recognition of the deferred tax concerned.
Deferred tax assets and liabilities are offset when there is a legally enforceable right to offset current tax assets against current tax liabilities and when the deferred tax assets and liabilities relate to income taxes levied by the same taxation authority on the same taxable entity.
2.1.6 Share-based payments
Stock options and free shares may be granted to the Group’s executives and certain non-executive employees. In accordance with IFRS 2 - Share-based Payment, these options and shares are measured at the fair value of the services received, based on the grant-date fair value of the equity instruments concerned. The related expense is recognised over the beneficiaries’ vesting period under «Payroll costs» in the income statement with a corresponding adjustment to equity.
The measurement of the expense takes into account the probability of whether the underlying non-market performance and service conditions will be met by the beneficiaries.
At the end of each reporting period, the Group revises its estimates of the number of options and/or shares that are expected to vest. It recognises the impact of the revision to original estimates, if any, in the income statement.
II.2 - ACCOUNTING PRINCIPLES AND MEASUREMENT METHODS
For the presentation of its IFRS financial statements the Group follows recommendation 2009-R-03 issued by the French National Accounting Board (Conseil National de la Comptabilité - CNC) on 2 July 2009.
2.2.1 ASSETS
A) NON-CURRENT ASSETS
• PROPERTY, PLANT AND EQUIPMENT
Property, plant and equipment are measured at cost less any accumulated depreciation and impairment losses.
As the Group’s buildings do not represent material amounts, it does not apply the method of separately depreciating each component of a building.
The cost of an item of property, plant and equipment consists of its purchase price, including import duties and non-recoverable taxes, after deducting trade discounts and rebates, as well as any costs directly attributable to bringing the asset to its required working condition.
Subsequent costs are recognised as expenses except when they improve the originally expected performance of the asset, increase its useful life, or reduce predefined operating costs.
78 - 79

After recognition as an asset, an item of property, plant and equipment is carried at cost less any accumulated depreciation and any accumulated impairment losses. This complies with the cost model prescribed in the applicable accounting standard.
Depreciation is calculated based on an asset’s estimated useful life, which corresponds to the period over which the entity expects to use the asset.
Depreciable amount is the cost of an asset less any residual value. Residual value is the estimated amount that an entity would currently obtain from disposal of the asset, after deducting the estimated costs of disposal, if the asset were already of the age and in the condition expected at the end of its useful life (excluding the effects of inflation).
The main estimated useful lives applied are as follows:• Buildings: 20 years;• Equipment and machinery: 3 to 5 years;• Other items of property, plant and equipment: 4 to 10 years depending on the type of asset
(vehicles, office furniture etc.).
These useful lives are reviewed annually and are adjusted if current estimated useful lives differ from previous estimates. Any such adjustments are treated as a change in an accounting estimate and are recognised prospectively.
Finance leases: As defined in IAS 17, a finance lease is a lease that transfers to the lessee substantially all the risks and rewards incidental to ownership of an asset. Title may or may not eventually be transferred under these leases.
Significant assets acquired under finance leases are recognised in the balance sheet under «Property, plant and equipment» and are measured at the lower of the fair value of the leased asset and the present value of the minimum lease payments, with a corresponding financial liability recorded on the liabilities side of the balance sheet. These assets are depreciated over their estimated useful lives.
Investment properties:• The Group has not identified any investment properties amongst its property, plant and equipment.
• INTANGIBLE ASSETS
IAS 38 defines an intangible asset as an identifiable non-monetary asset without physical substance. The Standard states that an asset meets the identifiability criterion in this definition when it:• is separable, i.e. capable of being sold, rented, exchanged independently or transferred; or arises from contractual or other legal rights, regardless of whether those rights are separable.
Intangible assets with finite useful lives (software, licences, capitalised IT development costs, etc.) are amortised. Assets that have indefinite useful lives are not amortised but, as required under IAS 36, are tested for impairment at least once a year at a date close to the year-end or whenever there is an indication that they may be impaired.
• REGROUPEMENTS D’ENTREPRISES
Business combinations carried out since 1 September 2010 are accounted for under the acquisition method in accordance with the revised version of IFRS 3. Under this method, the purchase price of the business concerned is allocated to the identifiable assets acquired
ANNUAL FINANCIAL STATEMENTS 2013/2014

and liabilities assumed based on their acquisition-date fair values. These fair values are based on best estimates at the acquisition date and may be adjusted within twelve months of that date.
Costs directly related to the acquisition are expensed as incurred and are included in «External charges» in the consolidated income statement.
Goodwill corresponds to the excess of (i) the aggregate of the consideration transferred and the amount of any non-controlling interests in the acquiree, as measured at fair value, over (ii) the net of the acquisition-date fair values of the identifiable assets acquired and liabilities assumed. Positive goodwill is recognised in the balance sheet under “Goodwill” and negative goodwill is recorded in the income statement in the year of the acquisition.
For the acquisitions carried out during the year the Group elected to apply the option in IFRS 3R of recognising goodwill in accordance with the full goodwill method.
Goodwill is not amortised but, as required under IAS 36 - Impairment of Assets, is tested for impairment at least annually, at the same time each year, and whenever there is an indication that it may be impaired. Any impairment identified is recognised immediately and may not be subsequently reversed.
Goodwill is allocated to each cash-generating unit (CGU) that is expected to benefit from the synergies of the business combination, or to the group of CGUs at the level at which Management monitors the return on investment of the acquired businesses.
The value in use of a CGU is determined using the discounted cash flow method. At 31 August 2013, the following principles were used for the related calculations:• The discount rate for future cash flows was determined based on the weighted average cost
of capital. The rates used at 31 August 2013 and 2012 are stated in Note 3.1.3.• Cash flow projections were derived from the medium-term business plans drawn up by the
management team of the CGU concerned and approved by the Group’s governance bodies.• Terminal value is extrapolated by applying to normative cash flows for subsequent years a
growth rate to perpetuity (see Note 3.1.3 for the rates applied at 31 August 2013 and 2012). This growth rate reflects the expected long-term growth in the markets in which the Group’s CGUs operate, as well as their competitive positioning in these markets.
An impairment loss is recognised if the carrying amount of the CGU exceeds its recoverable amount. Any impairment losses on a CGU are deducted to the extent possible from the goodwill allocated to that CGU and then from the CGU’s other assets proportionately to their respective carrying amounts.
The Group’s CGUs are as follows:• A «Cleaning» CGU, comprising all of the companies in the Cleaning division as well as those
in the Hygiene division, until its sale in 2012. • An «International» CGU, comprising all companies outside France, as the cash flows of these
companies are independent from those of France. • A «Multi-technical» CGU, comprising all the business lines specialised in technical fields
(the Technical, Landscaping, Security divisions etc.), for which the Atalian Group can propose its customers a comprehensive «Facilities Management» offering and whose cash flows are therefore closely related.
80 - 81
• FINANCIAL ASSETS
CLASSIFICATION
On initial recognition, the Group classifies its financial assets in one of the four categories defined in IAS 39 - Financial Instruments: Recognition and Measurement, based on their nature and the purpose for which they were acquired. These categories are then used to determine whether the financial assets are subsequently measured at amortised cost or fair value.
The categories of financial assets held by the Group are as follows:
Investments in non-consolidated companies and other long-term investmentsInvestments in non-consolidated companies and other long-term investments are classified as «available-for-sale» and are recorded in the balance sheet at fair value.
Changes in fair value - including unrealised gains and losses - are recognised in other comprehensive income except in the event of a prolonged decline in the value of the investment, in which case a corresponding impairment loss is recorded in the income statement for the period. When the financial asset is derecognised the change in fair value previously recognised in other comprehensive income is taken to the income statement.
Shares held in certain companies that do not represent material amounts for the Group are recognised as investments in non-consolidated companies.
Loans, guarantees and depositsLoans (including loans and advances to subsidiaries and associates), guarantees and deposits are measured at fair value on initial recognition and subsequently at amortised cost.
RECOGNITION AND MEASUREMENT
Purchases and sales of financial assets are recognised on the trade date, which is the date on which the Group commits to purchase or sell the asset.
A financial asset is derecognised when the Group’s contractual rights to receive cash flows from the asset have expired or the Group has transferred the financial asset to a third party without retaining control or substantially all of the risks and rewards of ownership of the asset.
Financial assets are initially recognised at fair value plus, in the case of a financial asset not at fair value through profit, transaction costs that are directly attributable to the acquisition or issue of the financial asset. Transaction costs for financial assets classified as at fair value through profit are expensed in the income statement.
A financial asset is classified as a current asset when the cash flows from the instrument are expected to be received within one year.
The amortised cost of a financial asset is the amount at which the asset was initially recognised minus principal repayments, plus or minus the cumulative amortisation calculated using the effective interest method of any difference between that initial amount and the maturity amount.
For instruments quoted in an active market, fair value corresponds to a market price. For instruments not quoted in an active market, fair value is determined using valuation techniques. Valuation techniques include using recent arm’s length market transactions or transactions in other instruments that are substantially the same, discounted cash flow analysis and option pricing models. In so far as possible, they include inputs based on observable market data. However, when the fair value of an equity instrument cannot be reasonably estimated, it is kept at historical cost.
ANNUAL FINANCIAL STATEMENTS 2013/2014

B) CURRENT ASSETS
• INVENTORIES
The Group’s inventories do not represent a material amount and essentially correspond to maintenance products.
Inventories are stated at the lower of cost (weighted average unit cost) and market price. An impairment loss is recognised when the cost of an item of inventory falls below its realisable value.
• TRADE AND OTHER RECEIVABLES
Trade and other receivables are initially recognised at fair value and subsequently measured at amortised cost using the effective interest method, less any impairment losses. In practice, trade receivables are measured at their nominal value in view of their short-term nature.
If there is an objective indication of impairment or a risk that the Group may not be able to collect all of the contractual amounts of a receivable (principal plus interest) at the dates set in the contractual payment schedule, an impairment loss is recognised in the income statement. The amount of the impairment loss recorded represents the difference between the carrying amount of the asset and the estimated value of the future recoverable cash flows, discounted at the initial effective interest rate.
The Group sells receivables to factoring companies. Until 2013, the Group’s analysis of its factoring contracts concluded that they did not transfer substantially all the risks and rewards of ownership of the receivables concerned to the factoring companies. Consequently, the factored receivables were not derecognised and were kept on the balance sheet under «Trade receivables», with the recognition of a corresponding short-term financial liability.
Following the renegotiation and extension of the Group’s factoring programmes in 2013, a portion of its factored receivables for which substantially all the rights and rewards of ownership are transferred to the factoring companies can now be derecognised.
Details of receivables sold during FY 2012-2013 are provided in Note 8 - «Long- and short-term financial liabilities».
• CASH AND CASH EQUIVALENTS
Cash and cash equivalents include cash in hand, deposits held at call with banks, and other short-term highly liquid investments that are readily convertible to known amounts of cash, are subject to an insignificant risk of changes in value and have a term of three months or less (notably units in money market mutual funds (OPCVM) carried at fair value through profit or loss). This item may also include cash deposits in term accounts that have terms of more than three months but which the Group can withdraw from at any time without incurring significant rate penalties.
82 - 83

2.2.2 EQUITY AND LIABILITIES
A) CONSOLIDATED EQUITY
When the Group’s interest in a fully consolidated company is less than 100%, a non-controlling interest is recognised in the consolidated financial statements.
Since the effective date of IAS 27R, for investments in associates where non-controlling interests’ commitments are limited to their portion of the companies’ capital, the Group has discontinued recognising its share of further losses of associates in a negative net equity position if its shares of losses already recognised equals or exceeds its interest in the associate.
B) NON-CURRENT LIABILITIES
• LONG-TERM PROVISIONS
In accordance with IAS 37, a provision is recognised when at the financial year-end the Group has a present obligation (legal or constructive) as a result of a past event, it is probable that an outflow of resources embodying economic benefits will be required to settle the obligation, and a reliable estimate can be made of the amount of the obligation.
These provisions essentially concern: • Employee benefits
Provisions for statutory retirement bonuses (indemnités de fin de carrière):
In accordance with IAS 19R, the Group recognises a provision for statutory retirement bonuses receivable by employees on the day of their retirement which are not covered by insurance policies. The amount of the provision is calculated using a valuation method based on projected end-of-career salaries (the projected unit credit method). This valuation typically takes into account the following elements and assumptions:• Classification of employees into groups with similar characteristics in terms of status,
age and seniority.• Voluntary departure at the age of 65 for all employees.• Monthly salary plus a coefficient of currently applicable employer social security
contributions.• Salary increase rate of 3% for managers and 1.5% for non-managerial staff.• Discount rate for statutory retirement bonus obligation, projected to the retirement date
(10-year iBoxx ++ at 31 August 2013, i.e. 2.94%). • Staff turnover rate determined based on age bracket, business sector and socio-professional
category. The turnover rates of acquired companies are aligned with the rates used for the Group’s historic businesses.
• Life expectancy: «INSEE 2009» table.
All actuarial gains and losses on defined benefit post-employment benefit plans are recorded in «Long-term provisions» with a contra-entry in other comprehensive income.
Certain Group companies fund a portion of their obligation through insured plans, in which case the fair value of the plan assets is deducted from the company’s overall obligation and the net amount of the obligation is recognised as a provision. The actual rate of return on plan assets in FY 2012-2013 was 3.1%.
ANNUAL FINANCIAL STATEMENTS 2013/2014

Provisions for long-service awards:
The Group sets aside a provision for the cost of statutory long-service awards payable in France. The amount of the provision is calculated using the projected unit credit method based on the date on which the awards are granted.
The actuarial assumptions used to calculate the present value of the Group’s obligation for statutory retirement bonuses and long-service awards were updated at 31 August 2013, particularly the discount rate, which was determined by reference to market yields at the reporting date on bonds issued by companies with high credit ratings.
• LONG-AND SHORT-TERM FINANCIAL LIABILITIES
Financial liabilities comprise the following:• Bond debt representing a principal amount of €250 million and maturing in 2020;• Borrowings taken out with leading banks; • Employee profit-sharing liabilities;• Factoring liabilities;• Finance lease liabilities;• Minority put liabilities.
A portion of the Group’s bank borrowings is subject to covenants that require compliance with certain financial ratios (see Note 8 - «Long- and short-term financial liabilities»).
Debt issuance costs are recognised in the year of the transaction concerned as a deduction from the underlying financial liabilities and are included in the effective interest rate used to calculate finance costs for the year.
C) CURRENT LIABILITIES
• TRADE AND OTHER PAYABLES
Owing to their short-term nature, the historical amounts recognised in the consolidated financial statements for trade and other payables are reasonable estimates of their market value.
• CUSTOMER PREPAYMENTS
This item includes include advances and downpayments received from clients for the commencement of building works contracts.
• SHORT-TERM PROVISIONS
In view of the nature of the Group’s business, short-term provisions primarily correspond to provisions for legal claims and disputes, and foreseeable difficulties in the Group’s operations.
84 - 85
2.2.3 INCOME STATEMENT
The Group presents its income statement by nature and provides a number of different sub-totals which are relevant to the understanding of the components making up its profit.
A) REVENUE
Consolidated revenue represents the total amount generated by the Group for sales of goods, services and building works, net of discounts and rebates. It includes the revenue of fully consolidated companies after eliminating intra-group transactions.
For the Cleaning, Security, Landscaping, Hygiene and Fire Safety divisions, the amount of revenue recognised corresponds to services performed as at the reporting date.
For the Technical and Landscaping division, the amount of revenue is recognised by reference to the actual stage of completion of projects in progress based on operations budgets updated at the reporting date. The duration of these projects is generally less than 12 months.
For repair works, the amount of revenue recognised corresponds to services performed as at the reporting date.
When the outcome of a transaction involving the rendering of services cannot be estimated reliably, revenue is only recognised to the extent of the expenses recognised that are recoverable.
B) RECURRING OPERATING PROFIT BEFORE DEPRECIATION, AMORTISATION, PROVISIONS AND IMPAIRMENT LOSSES
This item includes revenue and related income less expenses directly attributable to operations, which mainly comprise purchases consumed, other external charges, payroll costs and taxes other than on income. It also includes other recurring operating income and expenses.
C) RECURRING OPERATING PROFIT
In addition to recurring operating profit before depreciation, amortisation, provisions and impairment losses, recurring operating profit includes the majority of items that do not have a cash impact (depreciation, amortisation, impairment of non-financial assets, provisions, etc.), as well as various other items that cannot be directly attributed to another income statement heading.
D) OPERATING PROFIT
The impact of any operations that are unusual either in terms of their frequency or their amount is shown on a separate line beneath recurring operating profit, notably gains or losses on the sale of assets or subsidiaries, or of businesses that do not constitute discontinued operations within the meaning of IFRS 5. The Group has elected to present these items separately in order to provide users of its financial statements with the truest possible image of its recurring performance.
ANNUAL FINANCIAL STATEMENTS 2013/2014

E) NET FINANCIAL INCOME/EXPENSE
This line of the consolidated income statement reflects the impacts of the Group’s financing transactions and comprises the following: • Finance costs, net, which include interest paid on the Group’s borrowings and interest
received on available cash. The amounts recognised are presented after hedging transactions and also include changes in the value of derivatives that do not qualify for hedge accounting under IFRS.
• Other financial income and expenses
2.2.4 FINANCIAL RISKS AND HEDGING INSTRUMENTS
Certain Group entities use financial instruments for the purpose of reducing the impact of interest-rate fluctuations on their income statements. The framework within which the Group uses these financial instruments is described below.
The instruments used correspond solely to interest-rate hedges and only one interest-rate cap was in place at 31 August 2013.
Financial instruments are used purely for hedging purposes, are set up with leading French banks and do not present any risk of illiquidity if the hedges need to be unwound.
Reports are regularly provided to the management and supervisory bodies of the companies concerned on the use of these instruments, the choice of counterparties, and more generally the management of exposure to currency risk and interest-rate risk.
Type of financial risks to which the Group is exposed and related risk management principles
• CURRENCY RISK
Overall, the Group is only slightly exposed to currency risk in its routine commercial transactions. Contracts invoiced in foreign currency give rise to expenses which are mainly denominated in the same currency. This is particularly the case for most projects and services performed outside France, for which the portion of expenses denominated in local currency is much greater than the portion denominated in euros.
• INTEREST-RATE RISK
The Group’s interest-rate risk relates to variable-rate financial liabilities shown on the balance sheet. A portion of this risk is hedged by the Group using derivatives adapted to the characteristics of the hedged liabilities.
• COUNTERPARTY RISK
The Group has been instructed to take great care in analysing counterparty risk. Consequently, only financial transactions with leading financial institutions are authorised.
86 - 87

• CREDIT RISK
Credit risk arises from the probability that the Group’s customers may default, requiring a write-off of the related trade receivables.
The Group considers the credit risk on its trade receivables to be extremely low as these receivables are spread over a large number of customers in France and abroad, with no single customer accounting for more than 10% of consolidated revenue. Further details on the Group’s trade receivables are provided in Note 4 - «Current assets».
• LIQUIDITY RISK
The Group manages liquidity risk by using credit facilities set up with banks. The amounts and maturities of these facilities are adapted to ensure that the Group has sufficient cash to respect its commitments.
In addition, the Group finances a portion of its working capital through a trade receivables sale programme comprising factoring agreements which at the year-end represented a maximum of €130 million worth of factored receivables.
Detailed information on the Group’s credit facilities and factoring is provided in Note 8 - «Long- and short-term financial liabilities».
Principles and methods used by the Group for recognising hedging transactions
The Group uses the recognition principles and methods prescribed in IAS 39, namely:Hedge accounting is applied when derivative instruments offset - either in whole or in part - changes in fair value or cash flows of an underlying hedged item. Hedge effectiveness is assessed at regular intervals and at least every quarter and at the year-end.
Financial instruments only qualify for hedge accounting if the following conditions are met:• At the inception of the hedge there is formal designation and documentation of the hedging
relationship (identification of the hedging instrument, the hedged item, the nature of the risk being hedged and the accounting method applied).
• The Group expects the hedge to be highly effective throughout the life of the hedge.• The effectiveness of the hedge is assessed throughout the life of the financial instrument
and the actual results of the hedge are within a range of 80% to 125%.• If a forecast transaction is the subject of the hedge this forecast transaction is highly probable.
If a hedging relationship cannot be demonstrated, any changes in fair value of the financial instrument are recognised in profit.
All derivatives are measured at fair value. For instruments quoted in an active market, fair value corresponds to market value, and for other instruments it is determined using calculation and valuation models that incorporate market data (e.g., interest rate curves, exchange rates etc.).
The Group has not identified any use of embedded derivatives within the meaning of IAS 39.
• CASH FLOW HEDGES
A cash flow hedge is a hedge of the exposure to changes in cash flows of the underlying hedged item or of a future transaction.
ANNUAL FINANCIAL STATEMENTS 2013/2014

When a derivative is used to hedge the Group’s exposure to changes in cash flows of a firm commitment or a forecast transaction, the portion of the gain or loss on the hedging instrument that is determined to be an effective hedge is recognised in other comprehensive income. The gain or loss relating to the ineffective portion is recognised immediately in the income statement, except when the cumulative gains or losses on the hedging instrument are lower than the aggregate gains or losses on the hedged item.
Gains or losses recognised in equity are recycled to the income statement when the hedged forecast cash flows affect profit.
• FAIR VALUE HEDGES
A fair value hedge is a hedge of the exposure to changes in fair value of a recognised asset or liability.
When a derivative is used to hedge the Group’s exposure to changes in the fair value of a receivable or payable, changes in the fair value of the hedging instrument are recognised immediately in the income statement. The gain or loss on the hedged item attributable to the hedged risk adjusts the carrying amount of the hedged item and is recognised in the income statement.
The fair value of hedged items corresponds to their carrying amount translated into euros at the exchange rate prevailing at the reporting date.
2.2.5 CVAE
The French Finance Act for 2010 abolished local business tax (taxe professionnelle) in France as from 2010 and replaced it with the Contribution Economique Territoriale, or CET. The CET is mainly composed of two contributions: (i) a business property tax (Cotisation Foncière des Entreprises or CFE), which is based on the rental values of property subject to property tax, and (ii) a value-added contribution (Cotisation sur la Valeur Ajoutée des Entreprises or CVAE) which is based on the value added by businesses each year as shown in their financial statements.
Following the introduction of these new contributions, the Group re-examined the accounting treatment it applies to taxes in France in line with IFRS, taking into consideration the latest available information on tax accounting, and especially the guidance issued by the IFRIC. Consequently, in accordance with IAS 12, the Group has elected to classify the CVAE contribution as an income tax and therefore to recognise the CVAE expense under the «Income tax expense» line in the consolidated income statement.
88 - 89

2.2.6 CICE tax credit
The CICE tax credit was introduced by the Amended French Finance Act for 2012 (Act 2012-1510 dated 29 December 2012). It is aimed at helping French companies to finance measures to enhance their competitiveness, notably in the areas of investment, research, innovation, recruitment, exploring new markets, ecology and energy efficiency, and rebuilding their working capital. The calculation of the CICE is based on the salaries not exceeding 2.5 times the French minimum wage that are paid to employees in a given calendar year.
The CICE rate has been set at 4% of eligible salaries paid from 1 January 2013 to 31 December 2013 and will be increased to 6% for subsequent years.
The CICE is set off against corporate income tax due for the year in which the eligible salaries are paid. Any receivables due from the French State corresponding to amounts that cannot be set off against income tax due for the year can be used as payment for tax due for the three years following the year in which the CICE tax credit is recognised. Beyond this three-year period any excess amount not set off against corporate income tax is repaid to the company.
The Group considers that as (i) the CICE is aimed at financing expenditure to enhance competitiveness, and (ii) the methods used for calculating and paying the CICE do not meet the definition of corporate income tax in IAS 12, it should be treated as a government grant within the scope of application of IAS 20. Consequently, it recognises the CICE as a deduction from payroll costs within recurring operating profit in the consolidated income statement and a corresponding accrued tax receivable is recognised in «Other receivables».
The Group pre-finances its future CICE tax credit receivables through the Banque Public d’Investissement (BPI). Financing contracts are entered into through which the Group sells to BPI its estimated future receivables for the calendar year as a guarantee for financing received from BPI. At the end of the financial year the Group recognises a liability under «Other current liabilities» in an amount corresponding to the cash received from BPI through the pre-financing mechanism. Financing received in this way amounted to €16.5 million at 31 August 2013.
2.2.7 Statement Of Cash Flows
The Group has opted to use the indirect method for presenting the consolidated statement of cash flows, which consists of determining cash flows from operating activities by adding back to or deducting from profit for the period all non-cash transactions and all cash flows relating to investing and financing activities.
Net cash and cash equivalents - whose movements are analysed in the statement of cash flows - are defined as cash and cash equivalents less short-term bank loans and overdrafts.
2.2.8 Off-balance sheet commitments
The Group’s main off-balance sheet commitments are summarised in Note 16.
2.2.9 Assets and liabilities held for sale
The Group classifies a non-current asset as «held for sale» when it expects to recover the cost of that asset through a sale transaction rather than through continuing use, and the sale is highly probable. In accordance with IFRS 5, an asset classified as held for sale is measured at the lower of its carrying amount and fair value less costs to sell. The asset is then no longer
ANNUAL FINANCIAL STATEMENTS 2013/2014
depreciated and any changes in fair value less costs to sell (identified either at the time of classification or subsequently) are recognised as impairment losses (or reversals of impairment in the event of an increase in value).
If the sale concerns a group of assets and associated liabilities that the Group intends to dispose of in a single transaction, the assets and liabilities of that group (a «disposal group») are classified as «held for sale» on separate lines of the balance sheet, without offsetting said assets and liabilities or presenting them as a single amount. The disposal group is measured at the lower of its carrying amount and fair value less costs to sell.
2.2.10 Related parties
The parties considered as related to the Group, as well as the material transactions carried out with these parties during FY 2012-2013, are as follows:• The members of the Group’s governance bodies. • The non-trading property companies that are managed by the Company’s Chairman
and which lease buildings to the Group at market rates. The rent paid under these leases amounted to €3.8 million in FY 2012-2013.
• EAB Finance, which is the Group’s controlling entity, and JPF Développement, a minority shareholder. These companies do not carry out any transactions with the Group other than in their capacity as shareholders (i.e. dividend payments and shareholder current account transactions).
• Associates, which are accounted for by the equity method (see Note 18).
II.3 COMPARABILITY OF THE FINANCIAL STATEMENTS As explained in Note 1 - «Significant events during the financial year», the Group has changed its method of accounting for certain long-term leases of operating equipment, which it now treats as finance leases rather than operating leases as was previously the case.
The Group has also corrected a number of errors identified in prior-year calculations of provisions for paid leave of the employees of certain subsidiaries. These errors were identified when reliability tests were conducted during the year on the pay systems of the subsidiaries concerned. The impact of these error corrections is presented in the «Other corrections» line of the table below.
Lastly, during FY 2012-2013 the Group early adopted the revised version of IAS 19 - Employee Benefits, with retroactive effect.
As a result of the above, the FY 2011-2012 financial statements presented for comparative purposes have been restated, with the change in the accounting treatment for long-term leases accounted for in accordance with IAS 8 - Accounting Policies, Changes in Accounting Estimates and Errors.
The segment information provided in Note 11 has also been restated to reflect the above - described corrections.
90 - 91

In €m
Financial statements at 31 Aug.
2012 reported
Impact of long-term
leases
Impact of IAS 19R
Other corrections
Financial statements at 31 Aug. 2012
restated
Goodwill 377.1 377.1Intangible assets 9.2 9.2Property, plant and equipment 40.5 5,0 45.5Other non-concurrent financial assets 7.7 7.7Deferred tax assets 47.6 0,5 48
Non-current assets 482.1 5,0 0 0,5 485.5
Inventories 2.7 2.7Prepayments to suppliers 2.2 2.2Trade receivables 295.5 295.5Current tax assets 0.8 0.8Other receivables 67.3 67.3Cash and cash equivalents 29.7 29.7
Current assets 398.3 0 0 0 398.3
TOTAL ASSETS 880.4 5.0 0 0.5 885.8
IMPACTS ON THE CONSOLIDATED BALANCE SHEET AT 31 AUGUST 2012
In €m
Financial statements at 31 Aug.
2012 reported
Impact of long-term
leases
Impact of IAS 19R
Other corrections
Financial statements at 31 Aug. 2012
restated
Equity attributable to owners of the parent 148.8 0.2 (0.8) 148.2Non-controlling interests 6.3 (0.1) 6.2
TOTAL EQUITY 155.1 0.2 0 (0.9) 154.4
Long-term financial liabilities 193.4 2.8 196.2Long-term provisions 6.1 6.1Deferred tax liabilities 0.1 0.1
Non-current liabilities 199.7 2.8 0 0 202.5
Customer prepayments 0.9 0,9Short-term portion of financial liabilities 117.6 1.9 119.6Current tax liabilities 5.3 5.3Trade payable 106 106Short-term provisions 19.5 19.5Other current liabilities 269.9 1.3 271.2Short-term bank loans 3.5 3.4Financial instruments 2.8 2.8
CURRENT LIABILITIES 525.6 1.9 0 1.3 528.9
TOTAL EQUITY AND LIABILITIES 880.4 5 0 0.5 885.8
ANNUAL FINANCIAL STATEMENTS 2013/2014

IMPACTS ON THE CONSOLIDATED INCOME STATEMENT AND STATEMENT OF COMPREHENSIVE INCOME
In €m
Financial statements at 31 Aug.
2012 reported
Impact of long-term
leases
Impact of IAS 19R
Other corrections
Financial statements at 31 Aug. 2012
restated
REVENUE 1,172.9 1,172.9
Purchases consumed (214.5) (214.5)External charges (133.1) 1.6 (131.5)Payroll costs (742.9) (742.9)Taxes other than on income (18.4) (18.4)Other operating income 11.5 11.5Other operating expenses (7.0) (7.0)
RECURRING OPERATING INCOME BEFORE DEPRECIATION, AMORTISATION, PROVISIONS AND IMPERMENT LOSSES
68.6 1.6 0 0 70.2
Depreciation and amortisation, net (17.8) (1.2) (19.0)Provisions and impairment losses, net (1.8) 0.9 (0.9)
RECURRING OPERATING PROFIT 49.0 0.4 0.9 0 50.3
Other operating income 3.3 3.3Other operating expenses
OPERATING PROFIT 52.3 0.4 0.9 0 53.6
Net financial expense (25.4) (0.3) (25.7)Income tax expense (15.8) (15.8)Share of loss of associates (0.3) (0.3)
PROFIT FOR THE PERIOD 10.8 0.2 0.9 0 11.8
Attribuatable to owners of the parent 10 0.2 0.9 0 11.1Attribuatable to non-controlling interests 0.8 0 0 0 0.8
In €m
Financial statements at 31 Aug.
2012 reported
Impact of long-term
leases
Impact of IAS 19R
Other corrections
Financial statements at 31 Aug. 2012
restated
PROFIT FOR THE PERIOD 10.8 0.2 0.9 0 11.8
Change in actuarial gains or losses (0.9) (0.9)Other comprehensive income (2.2) (2.2)Tax on comprehensive income 0.6 0.6
TOTAL COMPREHENSIVE INCOME 9.2 0.2 0 0 9.4
Attributable to owners of the parent 8.4 0.2 0 0 8.6Attributable to non-controlling interests 0.8 0 0 0 0.8
92 - 93

2.4 SEGMENT INFORMATION 2.4.1 Identification of segments
The Group’s business activities are structured around three divisions which each constitute an operating segment within the meaning of IFRS 8 as they sell distinct products and services or serve different customer segments. This segmentation is used by Management for assessing performance and forms the basis of the internal reporting system. The three divisions are as follows:• A «Cleaning» division, comprising all of the companies in the Cleaning business as well
as the companies in the Hygiene business, until its sale in 2012.• A «Multi-technical» division, comprising all the business lines specialised in technical fields,
for which the Atalian Group can propose its customers a comprehensive offering and whose cash flows are therefore closely related.
• An «International» division, comprising all companies outside France, as the cash flows of these companies are independent from those of France.
Information on the above-described operating segments is provided in Note 11. In this note, the «Other» column includes items that are not components of an operating segment but which the Group has elected to monitor separately, notably the operations of the Group’s holding entities (Executive Management services and central administrative costs) and other items that reconcile the aggregate figures of the segments with the Group’s total consolidated figures.
2.4.2 Segment indicators
For each of its operating segments, the Group presents the following income statement items which are monitored by the chief operating decision maker:• revenue; and• recurring operating profit before depreciation, amortisation, provisions and impairment losses
The accounting methods applied for each operating segment are those used for preparing the consolidated financial statements.
The information presented for each operating segment corresponds to «contributive data», i.e. after eliminating inter-segment transactions.
ANNUAL FINANCIAL STATEMENTS 2013/2014

NOTE 3NON-CURRENT ASSETS
Gross Impairment Net
31 AUGUST 2011 379,960 (4,475) 375,485Inter-item transfers 0Impact of changes in Group structure, exchange rates & other 1,728 41 1,769Impairment (141) (141)31 AUGUST 2012 381,688 (4,575) 377,113Inter-item transfers 2,250Impact of changes in Group structure, exchange rates & other 24,591 24,591Impairment (135) (135)31 AUGUST 2013 408,529 (4,710) 403,819
in millions of euros
Acquisition price 12.0
Assets acquired and liabilities assumed: Non-current assets 2.9Current assets 32.2Provisions (3.4)Trade and other payables (36.8)
Net identifiable liabilities assumed (5.1)
Provisional goodwill 17.1
31 Aug. 2013 31 Aug. 2012
Cleaning 295,438 268,921Multi-technical 76,729 79,376International 31,652 28,816
403,819 377,113
3.1. GOODWILL 403,819
3.1.2 Breakdown of goodwill by CGU
In June 2013, the Group acquired all of the shares in Carrard Services for a total of €12.0 million.
Provisional goodwill arising on this acquisition amounted to €17.1 million and has been allocated to the Cleaning CGU.
The fair values of the company’s working capital, non-current assets and other liabilities were in the process of being evaluated at the year-end.
Carrard Services generated €93.0 million in revenue during calendar 2012 and has been consolidated by the Group since the date on which Atalian acquired control.
The table below sets out the allocation - estimated on a provisional basis at 31 August 2013 - of Carrard Services identifiable assets acquired and liabilities assumed.
3.1.1 Mouvements
94 - 95

CGU at 31 August 2013 Discount rate Long-term growth rate
Impact on recoverable amount in €m Impact of +0,50% Impact of -0,50%
Cleaning (19.7) (15.0)Multi-technical (9.2) (6.6)International (2.5) (1.8)
31 Aug. 2013 31 Aug. 2012
CLEANING CGUCapital employed 279 M€ 260 M€Cash flow projections 4-year business plan
+ annual rate of growth after the last forecast period
4-year business plan+ annual rate of growth after
the last forecast periodDiscount rate 8.5% 8.5%Long-term growth rate 2.0 % 2.0 %
MULTI-TECHNICAL CGUCapital employed 107 M€ 103 M€
Cash flow projections4-year business plan
+ annual rate of growth after the last forecast period
4-year business plan+ annual rate of growth after
the last forecast periodDiscount rate 8.5% 8.5%Long-term growth rate 2.0 % 2.0 %
INTERNATIONAL CGUCapital employed 29 M€ 29 M€
Cash flow projections4-year business plan
+ annual rate of growth after the last forecast period
4-year business plan+ annual rate of growth after
the last forecast periodDiscount rate 11.0 % 11.0 %Long-term growth rate 2.0 % 2.0 %
3.1.3 CGU impairment testing
As described in Note 2.2.1, on an annual basis at the same time each year, the Group carries out impairment tests on its CGUs that contain goodwill. The assumptions used for determining the recoverable amount of the CGUs at 31 August 2013 and 2012 were as follows:
No impairment losses were recorded at 31 August 2013 as the recoverable amount of each CGU exceeded the carrying amount of their capital employed.
Consequently, with all other factors remaining constant, in the event of a 0.50% increase in the discount rate or a 0.50% decrease in the long-term growth rate, the recoverable amount of the CGUs would be reduced by the amounts shown in the table below, but in each case would remain higher than the carrying amount of their capital employed at 31 August 2013.
ANNUAL FINANCIAL STATEMENTS 2013/2014

GROSS Concessions, patents and similar rights Other intangible assets TOTAL
31 AUGUST 2011 13,903TRANSLATION DIFFERENCES (9) (39) (48)Inter-item transfers (9) 78 69Changes in Group structure 103 103Investments 3,069 2,340 5,409Sundry disposals and reductions (77) (49) (126)31 AUGUST 2012 12,671 6,639 19,310Translation differences (41) (54) (95)Inter-item transfers 1,227 (4,243) (3,016)Changes in Group structure 876 569 1,445Investments 1,333 1,945 3,278Sundry disposals and reductions (1,025) (1,025)31 AUGUST 2013 15,041 4,856 19,897
AMORTISATION AND IMPAIRMENT
31 AUGUST 2011 (7,944) (640) (8,584)TRANSLATION DIFFERENCES 6 6Inter-item transfers 11 11Changes in Group structure (47) (47)Sundry disposals and reductionsAmortisation expense (1,384) (196) (1,580)Impairment lossesReversals of impairment losses 69 7 7631 AUGUST 2012 (9,306) (812) (10,118)Translation differences 37 19 56Inter-item transfersChanges in Group structure (749) (749)Sundry disposals and reductions 1,015 81 1,096Amortisation expense (1,857) (159) (2,016)Impairment lossesReversals of impairment losses31 AUGUST 2013 (10,860) (871) (11,731)
NET
31 August 2012 3,365 5,827 9,19231 AUGUST 2013 4,181 3,985 8,166
3.2. INTANGIBLE ASSETS 8,166
As in FY 2011-2012, the Group recognised certain internal IT development costs as intangible assets.
These costs - which principally correspond to the value of the time spent by the Group’s teams on developing the IT systems concerned - represented a gross amount of €1.8 million and a €0.4 million amortisation expense for the year.
96 - 97
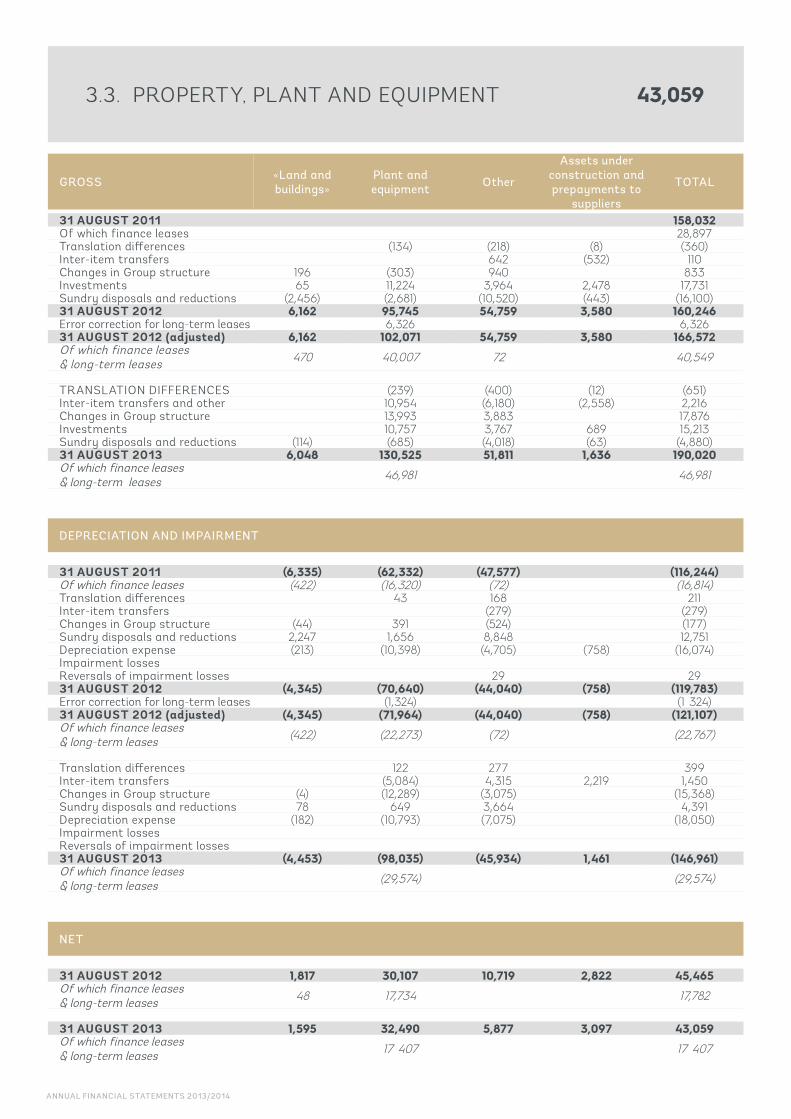
3.3. PROPERTY, PLANT AND EQUIPMENT 43,059
GROSS «Land and buildings»
Plant and equipment Other
Assets under construction and prepayments to
suppliers
TOTAL
31 AUGUST 2011 158,032Of which finance leases 28,897Translation differences (134) (218) (8) (360)Inter-item transfers 642 (532) 110Changes in Group structure 196 (303) 940 833Investments 65 11,224 3,964 2,478 17,731Sundry disposals and reductions (2,456) (2,681) (10,520) (443) (16,100)31 AUGUST 2012 6,162 95,745 54,759 3,580 160,246Error correction for long-term leases 6,326 6,32631 AUGUST 2012 (adjusted) 6,162 102,071 54,759 3,580 166,572Of which finance leases & long-term leases 470 40,007 72 40,549
TRANSLATION DIFFERENCES (239) (400) (12) (651)Inter-item transfers and other 10,954 (6,180) (2,558) 2,216Changes in Group structure 13,993 3,883 17,876Investments 10,757 3,767 689 15,213Sundry disposals and reductions (114) (685) (4,018) (63) (4,880)31 AUGUST 2013 6,048 130,525 51,811 1,636 190,020Of which finance leases & long-term leases 46,981 46,981
DEPRECIATION AND IMPAIRMENT
31 AUGUST 2011 (6,335) (62,332) (47,577) (116,244)Of which finance leases (422) (16,320) (72) (16,814)Translation differences 43 168 211Inter-item transfers (279) (279)Changes in Group structure (44) 391 (524) (177)Sundry disposals and reductions 2,247 1,656 8,848 12,751Depreciation expense (213) (10,398) (4,705) (758) (16,074)Impairment lossesReversals of impairment losses 29 2931 AUGUST 2012 (4,345) (70,640) (44,040) (758) (119,783)Error correction for long-term leases (1,324) (1 324)31 AUGUST 2012 (adjusted) (4,345) (71,964) (44,040) (758) (121,107)Of which finance leases & long-term leases (422) (22,273) (72) (22,767)
Translation differences 122 277 399Inter-item transfers (5,084) 4,315 2,219 1,450Changes in Group structure (4) (12,289) (3,075) (15,368)Sundry disposals and reductions 78 649 3,664 4,391Depreciation expense (182) (10,793) (7,075) (18,050)Impairment lossesReversals of impairment losses31 AUGUST 2013 (4,453) (98,035) (45,934) 1,461 (146,961)Of which finance leases & long-term leases (29,574) (29,574)
NET
31 AUGUST 2012 1,817 30,107 10,719 2,822 45,465 Of which finance leases & long-term leases 48 17,734 17,782
31 AUGUST 2013 1,595 32,490 5,877 3,097 43,059 Of which finance leases & long-term leases 17 407 17 407
ANNUAL FINANCIAL STATEMENTS 2013/2014

3.4. OTHER NON-CURRENT FINANCIAL ASSETS 12 418
Equity-accounted companies
Factoring security deposits
Investments in non-consolidated
companies and related receivables
Other Total gross value
Amortisation and impairment Net value
31 AUGUST 2011 881 6,227 7,108 (356) 6,752TRANSLATION DIFFERENCESChanges in Group structureInter-item transfers 323 323 323Sundry increases and reductions 72 615 687 687Additions and reversals (18) (18)31 AUGUST 2012 1,276 6,842 8,118 (374) 7,744Changes in Group structure 489 480 969 969Inter-item transfers (788) (715) 468 (1,035) (1,035)Sundry increases and reductions 429 5,235 (562) 5,102 5,102Additions and reversals (362) (362)31 AUGUST 2013 130 5,235 561 7,228 13,154 (736) 12,418
The «Equity-accounted companies» column relates to the Group’s share of the net equity of entities over which it exercises significant influence.
At 31 August 2012 this total constituted a liability (see Notes 6.1 and 18).
Factoring security deposits concern factoring contracts that transfer substantially all the risks and rewards of ownership of the underlying receivables to the factoring company (see Notes 8.1 and 8.2).
98 - 99
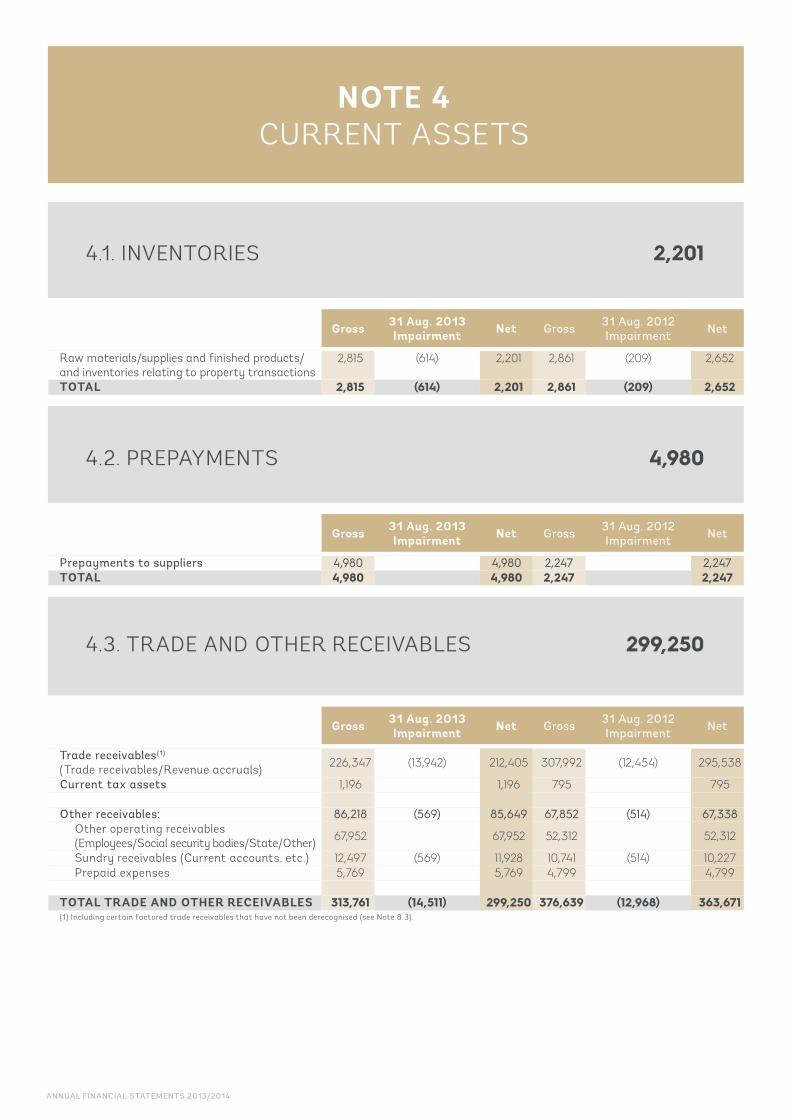
NOTE 4CURRENT ASSETS
Gross 31 Aug. 2013Impairment Net Gross 31 Aug. 2012
Impairment Net
Raw materials/supplies and finished products/and inventories relating to property transactions
2,815 (614) 2,201 2,861 (209) 2,652
TOTAL 2,815 (614) 2,201 2,861 (209) 2,652
4.1. INVENTORIES 2,201
Gross 31 Aug. 2013Impairment Net Gross 31 Aug. 2012
Impairment Net
Prepayments to suppliers 4,980 4,980 2,247 2,247TOTAL 4,980 4,980 2,247 2,247
4.2. PREPAYMENTS 4,980
Gross 31 Aug. 2013Impairment Net Gross 31 Aug. 2012
Impairment Net
Trade receivables(1)
(Trade receivables/Revenue accruals) 226,347 (13,942) 212,405 307,992 (12,454) 295,538
Current tax assets 1,196 1,196 795 795
Other receivables: 86,218 (569) 85,649 67,852 (514) 67,338Other operating receivables(Employees/Social security bodies/State/Other) 67,952 67,952 52,312 52,312
Sundry receivables (Current accounts, etc.) 12,497 (569) 11,928 10,741 (514) 10,227Prepaid expenses 5,769 5,769 4,799 4,799
TOTAL TRADE AND OTHER RECEIVABLES 313,761 (14,511) 299,250 376,639 (12,968) 363,671(1) Including certain factored trade receivables that have not been derecognised (see Note 8.3).
4.3. TRADE AND OTHER RECEIVABLES 299,250
ANNUAL FINANCIAL STATEMENTS 2013/2014

Amounts not past due
Amounts past dueTOTAL
< 12 months > 12 months
Trade receivables 153,059 67,751 5,537 226,347Impairment (11,845) (2,097) (13,942)
TOTAL TRADE RECEIVABLES 153,059 55,906 3,440 212,405
4.4. BREAKDOWN OF TRADE RECEIVABLES BETWEEN AMOUNTS PAST DUE AND AMOUNTS NOT PAST DUE AT 31 AUGUST 2013
4.5. CASH AND CASH EQUIVALENTS 52,641
Gross 31 Aug. 2013 Impairment Net Gross 31 Aug. 2012
Impairment Net
Cash 41,259 41,259 29,564 29,564
Marketable securities 11,382 11,382 157 157
TOTAL CASH AND CASH EQUIVALENTS 52,641 52,641 29,721 29,721
The Group’s cash and cash equivalents are primarily in euros.
Marketable securities mainly comprise money market mutual funds (OPVCM).
100 - 101

NOTE 5EQUITY
5.1. SHARE CAPITAL 117,363
31 Aug. 2012 Decrease Increase 31 Aug. 2013
Shares (number) 122,674,371 (5,311,500) 117,362,871Number of shares outstanding 122,674,371 117,362,871Par value 1 € - 1 €SHARE CAPITAL IN € 122,674,371 (5,311,500) 117,362,871
At 31 August 2013 the Company’s share capital was composed of 117,362,871 fully paid-up shares with a par value of €1 each.
In February 2013 the Company carried out a capital reduction by buying back and cancelling 5,311,500 shares.
At 31 August 2013, in accordance with the Company’s articles of association, all of the 117,362,871 shares making up its capital were ordinary shares.
ANNUAL FINANCIAL STATEMENTS 2013/2014

5.2. TRANSACTIONS RECOGNISED DIRECTLY IN EQUITY
5.2.1. Translation reserve
Principaux écarts de conversion au 31/08/2013 déterminés sur les sociétés étrangères dont les états financiers sont exprimés en devises :
5.2.2. Fair value reserve
The main translation differences at 31 August 2013 resulting from the conversion into euros of the financial statements of foreign subsidiaries were as follows:
5.2.3. Buyback of equity warrants
When the Group redeemed the mezzanine debt (OBSA - bonds with equity warrants) that it had taken on to finance its purchase of VPNM in 2009, it bought back the equity warrants embedded in the bonds for a total of €19.2 million.This transaction resulted in a €19.2 million reduction in equity attributable to owners of the parent.
31 Aug. 2012 Change 31 Aug. 2013
Divers 335 (365) (30)TOTAL 335 (365) (30)
Devises 31 Aug. 2012 Change 31 Aug. 2013
Miscellaneous foreign currencies (1,804) 1,804 0TOTAL (1,804) 1,804 0
102 - 103

NOTE 6LONG- AND SHORT-TERM PROVISIONS
6.1. LONG-TERM PROVISIONS 6,190
6.2. SHORT-TERM PROVISIONS 18,193
Employee benefits
Long-service awards and other
Equity-accounted companies TOTAL
31 AUGUST 2011 3,927 582 531 5,040Translation differencesInter-item transfers 257 257Changes in accounting methods and Group structure (10) (36) (46)Additions (net of reversals) 1,240 (369) 87131 AUGUST 2012 5,157 177 788 6,122Translation differencesInter-item transfers and other (788) (788)Changes in accounting methods and Group structure 170 170Change in actuarial gains and losses 362 362Additions (net of reversals) 294 30 32431 AUGUST 2013 5,983 207 0 6,190
Other short-term provisions
TOTAL
31 AUGUST 2011 19,271 19,271TRANSLATION DIFFERENCES Inter-item transfers (130) (130)Changes in accounting methods and Group structure (241) (241)Additions (net of reversals) 634 63431 AUGUST 2012 19,534 19,534TRANSLATION DIFFERENCESChanges in Group structure 3,339 3,339Inter-item transfersChanges in accounting methods and Group structure Additions (net of reversals) (4,680) (4,680)31 AUGUST 2013 18,193 18,193
Details of the actuarial assumptions used to calculate these obligations are provided in Note 2.2.2.b. The «Equity-accounted companies» column relates to the Group’s share of the net equity of entities over which it exercises significant influence. This total was positive at 31 August 2013, compared with a negative figure one year earlier (see Notes 3.4 and 18).
ANNUAL FINANCIAL STATEMENTS 2013/2014

NOTE 7 NON-CURRENT TAX ASSETS
AND LIABILITIES
7.1. MAIN SOURCES OF DEFERRED TAXES BY NATURE
In accordance with IAS 12.74, deferred tax assets and liabilities are offset when they relate to income taxes levied by the same taxation authority on the same taxable entity. Deferred tax liabilities relate to the Group’s non-French subsidiaries.
The year-on-year change in this item essentially corresponds to the following:Increase:• Increase in the Group’s obligations concerning statutory retirement bonuses
and other temporary differences (€0.2 million in deferred tax assets).• Recognition of €6.4 million worth of tax loss carryforwards from the TFN Val tax group,
representing a €2.2 million deferred tax asset.• A €1.3 million error correction relating to employees’ paid leave, generating a deferred
tax asset of €0.5 million.
Decrease:• Utilisation of €1.6 million in tax loss carryforwards of the Eurogem tax group,
representing a €0.6 million deferred tax asset.• Unwinding of the hedge related to the Group’s former variable-rate bank borrowings (€1 million).
31 Aug. 2013 31 Aug. 2012
Deferred tax assets 47,568. Employee benefits 1,766. Financial instruments 975. Temporary differences 2,479. Tax loss carryforwards 42,885. Other sources of deferred tax assets (537)Deferred tax liabilities 145. CVAE. Other sources of deferred tax liabilities 145TOTAL 48,778 47,423
104 - 105

7.2. RECOVERY PERIODS FOR DEFERRED TAX ASSETS
7.3. TAX BASE OF UNRECOGNISED DEFERRED TAX ASSETS
Recovery within 2 years
Recovery in 2 to 5 years
Recovery in 5 to 10 years TOTAL
Deferred tax assets (in €m) 6.13 11.82 30.9 48.9
The recovery periods for deferred tax assets are based on the Group’s taxable profit forecasts at 31 August 2013.
31 Aug. 2013 31 Aug. 2012
Tax consolidation 27,362 18,320 Tax loss carryforwards of companies not included in the tax group 807 1,055 TOTAL 28,169 19,375
ANNUAL FINANCIAL STATEMENTS 2013/2014

NOTE 8LONG- AND SHORT-TERM
FINANCIAL LIABILITIES
8.1. BREAKDOWN OF INTEREST-BEARING BORROWINGS BY MATURITY
Short-term Long-term TOTAL31 Aug. 2013- 1 an 1 à 5 ans 5 ans et +
Bonds 1,304 (5,709) 247,544 243,139Bank borrowings 1,959 1,987 32 3,978Finance lease liabilities 6,661 9,093 478 16,232Other borrowings and financial liabilities 2,766 2,961 5,727Loans from subsidiaries and associates 457 1,828 2,285Factoring loans 21,434 21,434TOTAL INTEREST-BEARING BORROWINGS 34,581 10,160 248,054 292,79531 AUG. 2012 RESTATED 119,581 195,450 761 315,792Error correction for long-term leases(1) 1,945 2,826 4,77131 AUGUST 2012 REPORTED 117,636 192,624 761 311,021(1) Long-term leases have been capitalised since this year (see Notes 1 and 2.3).The line entitled “Error correction for long-term leases” has been added in order to facilitate year-on-year comparisons.
In 2009, the Group set up long-term financing comprising senior debt and mezzanine bonds for the purpose of acquiring VPNM and Eurogem.
In January 2013, the Group restructured and refinanced its debt through the issuance of €250 million worth of bonds maturing in 2020 with a nominal coupon rate of 7.25% p.a. In addition, factoring contracts that transfer substantially all the risks and rewards of ownership of receivables to the factoring companies were set up in FY 2012-2013. As a result of these new contracts, the receivables concerned can now be derecognised (see Note 8.3)
The Group has an €18 million revolving credit facility, none of which had been drawn down at the year-end.
This financing is subject to limited financial covenants based on the Group’s consolidated accounts. At 31 August 2013, all of these covenants were respected.
106 - 107
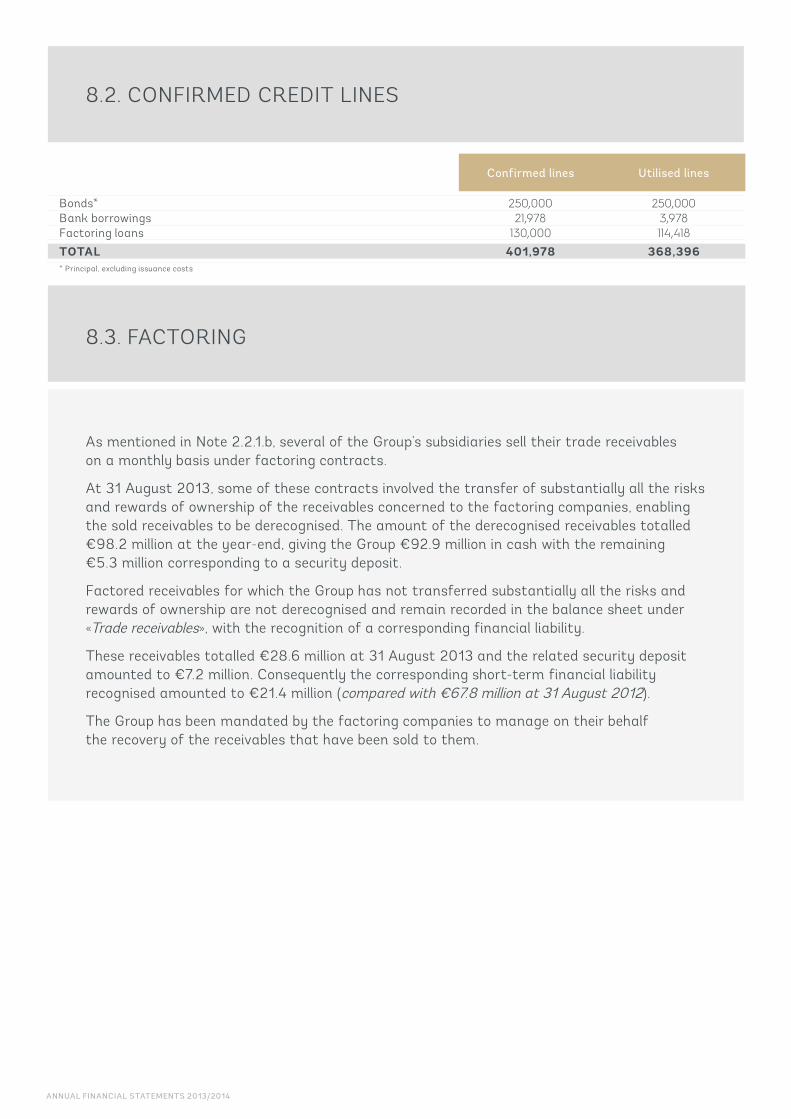
8.2. CONFIRMED CREDIT LINES
8.3. FACTORING
As mentioned in Note 2.2.1.b, several of the Group’s subsidiaries sell their trade receivables on a monthly basis under factoring contracts.
At 31 August 2013, some of these contracts involved the transfer of substantially all the risks and rewards of ownership of the receivables concerned to the factoring companies, enabling the sold receivables to be derecognised. The amount of the derecognised receivables totalled €98.2 million at the year-end, giving the Group €92.9 million in cash with the remaining €5.3 million corresponding to a security deposit.
Factored receivables for which the Group has not transferred substantially all the risks and rewards of ownership are not derecognised and remain recorded in the balance sheet under «Trade receivables», with the recognition of a corresponding financial liability.
These receivables totalled €28.6 million at 31 August 2013 and the related security deposit amounted to €7.2 million. Consequently the corresponding short-term financial liability recognised amounted to €21.4 million (compared with €67.8 million at 31 August 2012).
The Group has been mandated by the factoring companies to manage on their behalf the recovery of the receivables that have been sold to them.
Confirmed lines Utilised lines
Bonds* 250,000 250,000Bank borrowings 21,978 3,978Factoring loans 130,000 114,418TOTAL 401,978 368,396* Principal, excluding issuance costs
ANNUAL FINANCIAL STATEMENTS 2013/2014

NOTE 9 CHANGE IN NET DEBT
9.1. MOVEMENTS IN NET DEBT
31 Aug. 2012
Error correction
for long-term
leases
31 Aug. 2012 restated
Movements
Long-term lease
liabilities at 31 Aug. 2013
31 Aug. 2013
Cash and cash equivalents 29,721 29,721 22,920 52,641Short-term bank loans and overdrafts (3,541) (3,541) 1,813 (1,728)NET CASH AND CASH EQUIVALENTS (1) 26,180 26,180 24,733 50,913
0Long-term financial liabilities (4) (193,407) (2,816) (196,223) (60,046) 2,805 (256,269)Short-term portion of long-term financial liabilities (4) (117,636) (1,945) (119,581) 83,025 2,578 (36,556)
Financial instruments (2) (2,833) (2,833) 2,833DEBT (313,876) (4,761) (318,637) 25,812 5,383 (292,825)
NET DEBT (287,696) (4,761) (292,457) 50,545 5,383 (241,912)Derecognised factored receivables(3) (92,983)(1) Net cash and cash equivalents as analysed in the statement of cash flows. (2) Fair value hedges of debt (see Note 15).(3) Trade receivables sold under factoring contracts involving the full transfer of the risks and rewards of ownership to the factoring companies resulted in a derecognised liability
of €92,983 thousand at 31 August 2013.(4) Movements for the period mainly correspond to the repayment of debt as part of the Group’s financial restructuring process, representing some €230 million, and €250 million in
proceeds from the bond issue.
108 - 109

9.2. MAIN CHANGES DURING THE PERIOD
NET DEBT AT 31 AUGUST 2011 (301,741)
- Cash generated from operations before financial expenses and tax 63,131 - Change in operating working capital 11,195 - Income tax paid (including CVAE) (12,563)TOTAL - OPERATING ACTIVITIES 61,763 - Capital expenditure (8,849) - Financial investments (6,790) - Impact of minority puts 2,965 - Finance leases (5,716) - Changes in Group structure 94TOTAL - INVESTING ACTIVITIES (18,296) - Dividends paid (3,000) - Finance costs, net (24,771) - Other (translation adjustments on borrowings etc.) (1,651)TOTAL - FINANCING ACTIVITIES (29,422)
NET DEBT AT 31 AUGUST 2012 (REPORTED) (287,696)
- Error correction for long-term leases (4,761)
NET DEBT AT 31 AUGUST 2012 (RESTATED) (292,457)
- Cash generated from operations before financial expenses and tax 71,305 - Change in operating working capital 85,861 - Income tax paid (including CVAE) (18,433)TOTAL - OPERATING ACTIVITIES 138,733 - Capital expenditure (10,427) - Financial investments (4,329) - Impact of minority puts (743) - Finance leases and long-term leases (6,953) - Changes in Group structure (469)TOTAL - INVESTING ACTIVITIES (22,921) - Dividends paid (3,000) - Finance costs, net (25,070) - Impact of refinancing (swaps, equity warrants, debt issuance costs) (37,909) - Other (translation adjustments on borrowings etc.) 712TOTAL - FINANCING ACTIVITIES (65,267)
NET DEBT AT 31 AUGUST 2013 (241,912)
ANNUAL FINANCIAL STATEMENTS 2013/2014

NOTE 10OTHER CURRENT LIABILITIES
10.1 OTHER CURRENT LIABILITIES
31 Aug. 2013 31 Aug. 2012 Error correction (1) 31 Aug. 2012
CUSTOMER PREPAYMENTS 620 914 914
CURRENT TAX LIABILITIES 2,718 5,294 5,294
TRADE PAYABLES 122,149 105,965 105,965
OTHER CURRENT LIABILITIES 300,416 271,200 269,888Employee-related liabilities and accrued payroll taxes 161,193 138,490 1,312 137,178
OTHER ACCRUED TAXES 102,512 102,606 102,606Other current payables 32,673 22,384 22,384Deferred income 4,038 7,720 7,720(1) Correction of error for paid leave liabilities (see Note 2.3).
This item also includes the contra-entry for the pre-financing of CICE receivables carried out by the Group in 2013 in relation to the estimated future CICE tax credits of Group companies. This pre-financing amounted to €16.5 million at 31 August 2013.
110 - 111

10.2. SHORT-TERM BANK LOANS AND OVERDRAFTS 1,728
10.3. FINANCIAL INSTRUMENTS 0
This item also includes the contra-entry for the pre-financing of CICE receivables carried out by the Group in 2013 in relation to the estimated future CICE tax credits of Group companies. This pre-financing amounted to €16.5 million at 31 August 2013
At 31 August 2013 the Group no longer had any derivative financial instruments as the borrowings hedged in FY 2011-2012 were repaid as part of the debt restructuring
carried out in January 2013. The Group’s total liability related to the remeasurement of derivative financial instruments amounted to €2,833 thousand at 31 August 2012
ANNUAL FINANCIAL STATEMENTS 2013/2014
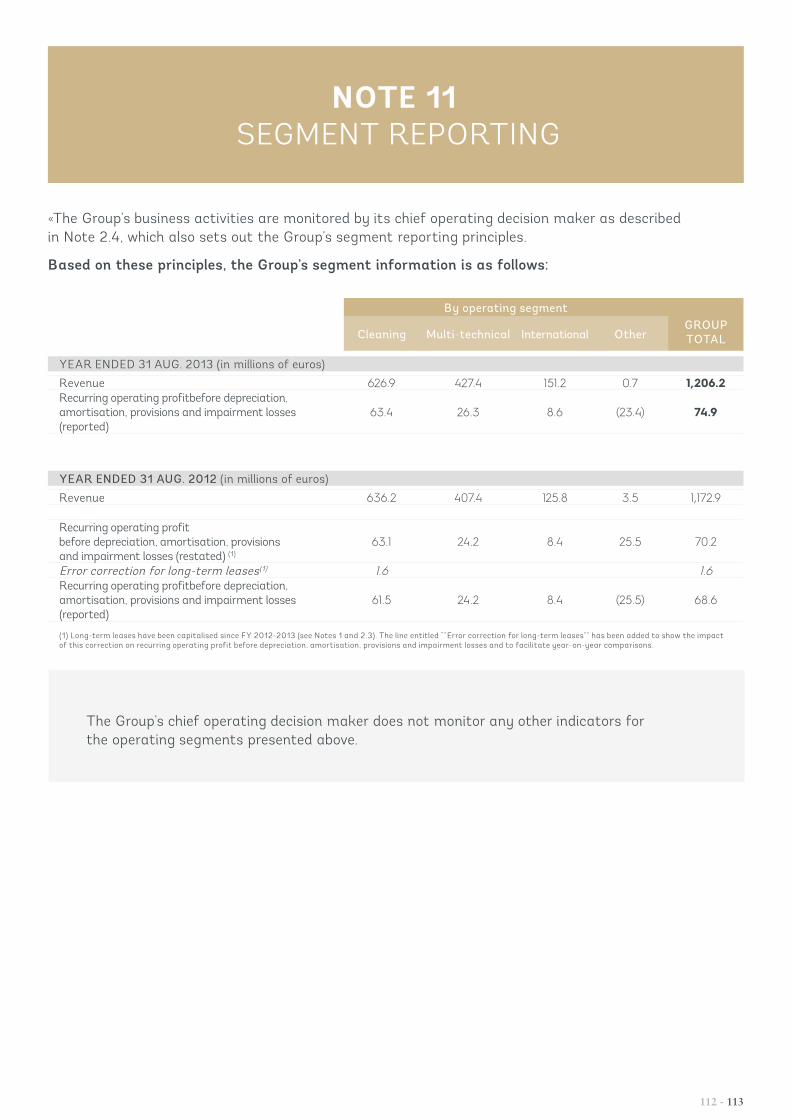
NOTE 11 SEGMENT REPORTING
«The Group’s business activities are monitored by its chief operating decision maker as described in Note 2.4, which also sets out the Group’s segment reporting principles.
Based on these principles, the Group’s segment information is as follows:
By operating segmentGROUP TOTALCleaning Multi-technical International Other
YEAR ENDED 31 AUG. 2013 (in millions of euros)
Revenue 626.9 427.4 151.2 0.7 1,206.2Recurring operating profitbefore depreciation, amortisation, provisions and impairment losses (reported)
63.4 26.3 8.6 (23.4) 74.9
YEAR ENDED 31 AUG. 2012 (in millions of euros)
Revenue 636.2 407.4 125.8 3.5 1,172.9
Recurring operating profitbefore depreciation, amortisation, provisions and impairment losses (restated) (1)
63.1 24.2 8.4 25.5 70.2
Error correction for long-term leases(1) 1.6 1.6Recurring operating profitbefore depreciation, amortisation, provisions and impairment losses (reported)
61.5 24.2 8.4 (25.5) 68.6
(1) Long-term leases have been capitalised since FY 2012-2013 (see Notes 1 and 2.3). The line entitled “”Error correction for long-term leases”” has been added to show the impact of this correction on recurring operating profit before depreciation, amortisation, provisions and impairment losses and to facilitate year-on-year comparisons.
The Group’s chief operating decision maker does not monitor any other indicators for the operating segments presented above.
112 - 113

NOTE 12 RECURRING OPERATING
PROFIT/OPERATING PROFIT
12.1. OPERATING PROFIT
Year ended 31 Aug. 2013
31 août 2012restated
Error corrections(1)
Year ended 31 Aug. 2012
reported
Revenue 1,206,199 1,172,945 1,172,945Purchases consumed (including outsourcing) (226,524) (214,515) (214,515)External charges (128,151) (131,486) 1,646 (133,132)Payroll costs (760,368) (742,902) (742,902)Taxes other than on income (2) (20,373) (18,396) (18,396)Other recurring operating income and expenses:
Other income 11,922 11,520 11,520Other expenses (7,781) (6,950) (6,950)
RECURRING OPERATING PROFIT BEFORE DEPRECIATION, AMORTISATION, PROVISIONS AND IMPAIRMENT LOSSES 74,924 70,216 68,570
Depreciation and amortisation, net (20,240) (18,942) (1,152) (17,790)Provisions and impairment losses, net 3,240 (896) 859 (1,755)RECURRING OPERATING PROFIT 57,924 50,378 49,025Other operating income 3,294 3,294Other operating expenses
OPERATING PROFIT 57,924 53,672 52,319
(1) Error corrections are described in Note 2.3(2) CVAE is included within “Income tax expense” in the income statement.
ANNUAL FINANCIAL STATEMENTS 2013/2014

NOTE 13FINANCE COSTS, NET & OTHER FINANCIAL
INCOME AND EXPENSES
13.1. BREAKDOWN OF FINANCE COSTS, NET (35,612)
13.2. BREAKDOWN OF OTHER FINANCIAL INCOME AND EXPENSES (1,474)
Year ended 31 Aug. 2013
Year ended 31 Aug. 2012
Dividends received from non-consolidated companies 67 11Net (additions to)/reversals of provisions for financial items (358) (39)Waivers of current accounts, gains and losses on disposals of non-consolidated shares and other financial assets, net interest other than on debt, foreign exchange gains and losses, and other
(1,183) (666)
OTHER FINANCIAL INCOME AND EXPENSES (1,474) (694)
Year ended 31 Aug. 2013
Year ended 31 Aug. 2012 restated
Financial expenses (35,715) (25,201)Produits de trésorerie et liés aux instruments financiers 103 177FINANCE COSTS, NET (35,612) (25,024)Analysis:
Net interest on borrowings (23,981) (15,446)Capitalised interest (8,867)Interest on finance leases (1,129) (711)Non-recurring expenses related to former financing
(swap and issuance costs)(10,502)
SOUS-TOTAL (35,612) (25,024)
114 - 115

NOTE 14 INCOME TAX EXPENSE
14.1. BREAKDOWN OF THE NET TAX CHARGE
14.2. RECONCILIATION BETWEEN THEORETICAL AND EFFECTIVE TAX CHARGE (TAX PROOF)
2013 2012
Profit for the period before income tax and CVAE 20,837 26,855CVAE (13,389) (12,487)Pre-tax profit 7,448 14,368Theoretical tax rate 34.43% 34.43%Theoretical tax charge (2,564) (4,947)Net impact of the recognition/non-recognition of tax loss carryforwards (3,963) 1,104Permanent differences 3,275 1,855Taxes not based on taxable incomeTemporary differences not generating deferred taxes 2,195 (1,748)Other (difference between French and foreign tax rates etc.) 1,268 453Total difference 211 (3,283)CVAE (13,389) (12,487)TOTAL CURRENT AND DEFERRED TAXES (13,178) (15,770)
Year ended 31 Aug. 2013 Year ended 31 Aug. 2012
France OTHER TOTAL France Étranger TOTAL
. Current income taxes (20) (1,530) (1,550) (589) (1,754) (2,343)
. Deferred taxes 1,697 64 1,761 (1,005) 65 (940)
. CVAE (13,389) (13,389) (12,487) (12,487)TOTAL (11,712) (1,466) (13,178) (14,081) (1,689) (15,770)
Under new French tax legislation, tax losses carried forward are only available to offset against €1 million of taxable profit, plus 50% of taxable profit for the year exceeding that amount.The portion that cannot be offset in a given year may, however, be carried forward to subsequent years in which the losses will be offset subject to the same conditions (i.e. offset against €1 million in taxable profit + 50% of taxable profit for the year > €1 million).In the case of a tax consolidation group, this rule is applicable at the level of the head of the tax group. The Atalian Group has three tax groups.No corporate income tax was recognised by the Group in FY 2012-2013 as the three tax groups - «La Financière Atalian», «TFN Val» and «TFN SI» - all recorded tax losses for the year.
ANNUAL FINANCIAL STATEMENTS 2013/2014

NOTE 15FINANCIAL INSTRUMENTS
15.1. INTEREST RATE HEDGES
For information purposes, the table below shows the aggregate of notional amounts outstanding at 31 August 2013 of each type of financial instrument used, with a breakdown by residual maturity for interest rate instruments and by currency for exchange rate instruments.
In view of the debt refinancing carried out in January 2013, substantially all of the Group’s hedging instruments were no longer in place at 31 August 2013.
Maturity analysis
Expiry date 2013 2014 à 2018
TOTAL 31 Aug. 2013
TOTAL 31 Aug. 2012
Interest rate swaps on financial assets on financial liabilities 70,000
Future Rate Agreements on financial assets on financial liabilities
Caps/Floors on financial assets purchase of caps on financial liabilities 858 858 41,143 tunnels on financial liabilities 30,000
The Group’s hedges were unwound during the year following the repayment of the underlying debt. This involved an unwind payment corresponding to the fair value of the unwound instruments. The termination of the hedges resulted in a financial expense of €2,378 thousand.
At 31 August 2013, the Group’s only financial instruments (corresponding to caps) were used to hedge the debt of an international subsidiary, representing €858 thousand.
At that date, the market value of the Group’s portfolio of hedging instruments was a negative €11 thousand.
in thousands of euros
116 - 117

NOTE 16OFF-BALANCE SHEET COMMITMENTS
16.1. GUARANTEE COMMITMENTS
16.2. MISCELLANEOUS CONTRACTUAL COMMITMENTS
The notes below provide a summary of the Group’s guarantee commitments, miscellaneous contractual commitments and finance lease commitments.
See Note 8 for further details of commitments given and received under financing contracts.
16.3. COLLATERAL GRANTED
31 Aug. 2012
Due within 1 year
Due in 1 to 5 years
Due beyond 5 years
Discounted trade notesOtherTOTAL MISCELLANEOUS CONTRACTUAL COMMITMENTS GIVEN 0 0 0 0
Discounted billsCommitments from factoring companies (1) 130,000 130,000 TOTAL MISCELLANEOUS CONTRACTUAL COMMITMENTS RECEIVED 130,000 130,000 0 0 (1) Of which €67.8 million have been used.
31 Aug. 2012
Due within 1 year
Due in 1 to 5 years
Due beyond 5 years
Pledges, mortgages and collateralGuarantees and endorsements given 16,616 1,662 14,954 0 TOTAL GUARANTEE COMMITMENTS GIVEN 16,616 1,662 14,954 0 Pledges, mortgages and collateralGuarantees and endorsements receivedTOTAL GUARANTEE COMMITMENTS RECEIVED 0 0 0 0
The Group has granted the following collateral as guarantees for the payment/repayment of financial obligations:1. Collateral granted by La Financière Atalian:• Pledge of La Financière Atalian shares representing 50.01% of the Company’s capital
2- Collateral granted by Atalian:• Pledges of receivables• Pledge of CA, CIC, BNP Paribas, LCL, Banque Palatine, HSBC, BP, and Crédit du Nord bank accounts
• Pledge of shares in Groupe TFN Pôle Sécurité, Ingénièrie des services, and International and TFN Val
ANNUAL FINANCIAL STATEMENTS 2013/2014

NOTE 17 HEADCOUNT
17.1. AVERAGE NUMBER OF EMPLOYEES (FULL-TIME EQUIVALENT)
Year ended31 Aug. 2013
Year ended31 Aug. 2012
France: Managers 646 673 Supervisors 1,872 1,760 Other 22,291 22,246
TOTAL - FRANCE 24,809 24,679
INTERNATIONAL EMPLOYEES 9,699 8,132
TOTAL AVERAGE NUMBER OF EMPLOYEES 34,508 32,811
118 - 119

NOTE 18LIST OF CONSOLIDATED COMPANIES
COMPANY% CONTROL % INTEREST Consolidation
methodaugust 2013 august 2013
FULLY CONSOLIDATED COMPANIESCORPORATEATALIAN (TFN DÉVELOPPEMENT) 100.00 100.00 IG ATALIAN SERVICES PARTAGÉS 100.00 100.00 IG ATALIAN SERVICES FINANCIERS 100.00 100.00 IGATALIAN SERVICES COMPTABLES 100.00 100.00 IGATALIAN SERVICES DES RESSOURCES HUMAINES 100.00 100.00 IGATALIAN SERVICES INFORMATIQUES ET QUALITÉ 100.00 100.00 IGATALIAN DIRECTION RELATIONS CLIENTS (ex TFN services relations clients) 100.00 100.00 IGTFN VAL 89.74 89.74 IGSCI RICHWILLER. 99.80 99.80 IGSCI ST JEAN D’ILLIAC 99.50 99.50 IGSCI SAINT APOLLINAIRE 99.95 99.95 IGSCI PESSAC 90.00 89.89 IGSCI ALPHA DU CENTAURE II 85.00 85.00 IGATALIAN AIRPORT SERVICES 100.00 100.00 IGTFN LOGISTIK 33.33 33.33 IPATALIAN SERVICE PAYE 100.00 100.00 IGATALIAN SERVICES SÉCURITÉ ET QUALITÉ 100.00 100.00 IGCLEANING SERVICESATALIAN PÔLE PROPRETÉ 100.00 100.00 IGRIP 100.00 100.00 IGDRX 100.00 100.00 IGTNEX 100.00 100.00 IGTFN IDF ( EX VPNM ÎLE-DE-FRANCE) 100.00 89.74 IGTFN APPROS ET TECHNIQUES (EX VPNM APPROS ET TECHNIQUES) 100.00 89.74 IGTFN SUD EST (EX VPNM SUD EST) 100.00 89.74 IGCOMATEC 100.00 89.74 IGEPPSI 100.00 89.74 IGUSP NETTOYAGE 100.00 89.74 IGTFN P NORD NORMANDIE 100.00 89.74 IGTFN P OUEST 100.00 89.74 IGTFN P SUD OUEST 100.00 89.74 IGTFN P EST 100.00 89.74 IGTFN PROPRETÉ CENTRE 100.00 90.00 IGANAPURNA 100.00 89.98 IGCARRARD SERVICES 100.00 89.98 IGTRANSPORT/LOGISTICSTFN AFFRÈTEMENT ET LOGISTIQUE 100.00 100.00 IGPARISIENNE D’AFFRÈTEMENT ET DE MESSAGERIE (PAM) 100.00 100.00 IGGROUPE STAR 100.00 89.74 IGSTAR SARL 100.00 89.74 IGMUNOZ EURL 100.00 89.74 IGLOGISMARK 99.90 89.65 IGTFN PROPRETÉ LOGISTIQUE 100.00 89.74 IGTECHNICALTFN BÂTIMENT 100.00 100.00 IGEL ALE 99.43 89.23 IGSCI AMPÈRE LA MAINE 99.90 99.90 IGSCI OPALI 99.00 98.90 IGSECURITYATALIAN SÛRETÉ 99.43 99.43 IGLANCRY PROTECTION SÉCURITÉ (LPS) 100.00 99.43 IGLANCRY FORMATION 100.00 99.43 IGAIRPORT PASSENGERS & FREIGHT SECURITY 100.00 94.85 IGSCI CHAPELLE 2000 99.80 99.46 IG
ANNUAL FINANCIAL STATEMENTS 2013/2014

COMPANY% CONTROL % INTEREST Consolidation
methodaugust 2013 august 2013
HYGIENEATALIAN HYGIÈNE 100.00 100.00 IGATALIAN FACILITIES (ex CELT HYGIÈNE) 100.00 100.00 IGLANDSCAPINGATALIAN PÔLE ESPACES VERTS 99.76 99.76 IGPINSON PAYSAGE 100.00 99.76 IGARPAJA 100.00 99.76 IGSUPERSOL 100.00 99.76 IGPINSON MIDI PYRENNEES (ex PAYSAGES ET ENVIRONNEMENTS SARL)
100.00 89.74 IG
PINSON PAYSAGE RHONE ALPES (ex PROST PAYSAGE) 100.00 89.74 IGPINSON PAYSAGE NORD (ex SNBM) 100.00 100.00 IGPHYTO ENVIRONNEMENT 100.00 89.74 IGFIRE SAFETYATALIAN PÔLE SECURITE INCENDIE (SI) 78.29 94.85 IGSPF 100.00 94.85 IGINTERNATIONALFR-ANSWER PLUS GLOBAL SERVICES 50.00 50.00 IGFR-ATALIAN INTERNATIONAL 100.00 100.00 IGBE-DEPLO SCHOONMAK 92.05 92.05 IGBE-ATALIAN INTERNATIONAL BELGIQUE 100.00 100.00 IGBE-ATALIAN CLEANING SERVICES (ex Multiservices) 51.00 51.00 IGBE-TFN CLEANING SERVICES 95.00 95.00 IGCZ-ATALIAN CZ sro (tfn ex-Jana) 94.40 94.40 IGCZ-ZETA HOLDING 80.00 75.52 IGCZ-ATALIAN EKOLOGICKY SERVIS (Zeta CZ) 80.00 75.52 IGCZ-ATALIAN SERVIS CZ sro (ex TFN SECURITY) 100.00 94.40 IGCZ-KAF 85.00 80.24 IGES-PÔLE INTERNATIONAL TFN ESPANA 100.00 100.00 IGES-MARTONET 100.00 100.00 IGES-NETEGES MARESME 100.00 100.00 IGHU-TFN HUNGARIA 99.80 99.80 IGHU-MTO HUNGARIA 100.00 99.98 IGHU-ATALIAN GLOBAL SERVICES HUNGARY (ex BSZF) 100.00 100.00 IGHU-ATALIAN FACILITY MANAGEMENT & GLOBAL SERVICES (ex BFM) 100.00 100.00 IGHU-ATALIAN GLOBAL SERVICES & SECURITY (ex Escort) 100.00 100.00 IGHU-KESMARK 100.00 100.00 IGHR-TFN HRVATSKA 100.00 100.00 IGHR-EKUS 92.00 92.00 IGHR-KADUS PRIVREMENO ZAPOSLJAVANJE 92.00 92.00 IGLU-AVISIA PROPRETÉ 100.00 100.00 IGLU-ATALIAN INTERNATIONAL (Turquie) 100.00 100.00 IGLU-GÉNIE THERM 85.40 85.40 IGLU-CITY ONE Luxembourg 50.00 50.00 IGLU-ATALIAN INTERNATIONAL 98.00 98.00 IGRO-ATALIAN ROMANIA (ex TFN Servicii) 86.00 86.00 IGRO-IQ REAL ESTATE 100.00 86.00 IGSK-ATALIAN (TEST Slovaquia absorbe TFN Slovaquia) 100.00 94.40 IGSK-CI SERVIS 31.00 29.00 IGSK-ATALIAN FACILITY 60.00 60.00 IGPL-TFN POLSKA 100.00 100.00 IGPL-POL-K ATALIAN 90.00 90.00 IGMU-ANSWERPLUS LIMITED 87.00 87.00 IGMA-ATALIAN MAROC 100.00 100.00 IGMA-VIP SURVEILLANCE 70.00 70.00 IGMA-ATALIAN SURVEILLANCE 70.00 70.00 IGTR - ARTEM 51.00 50.00 IG
120 - 121
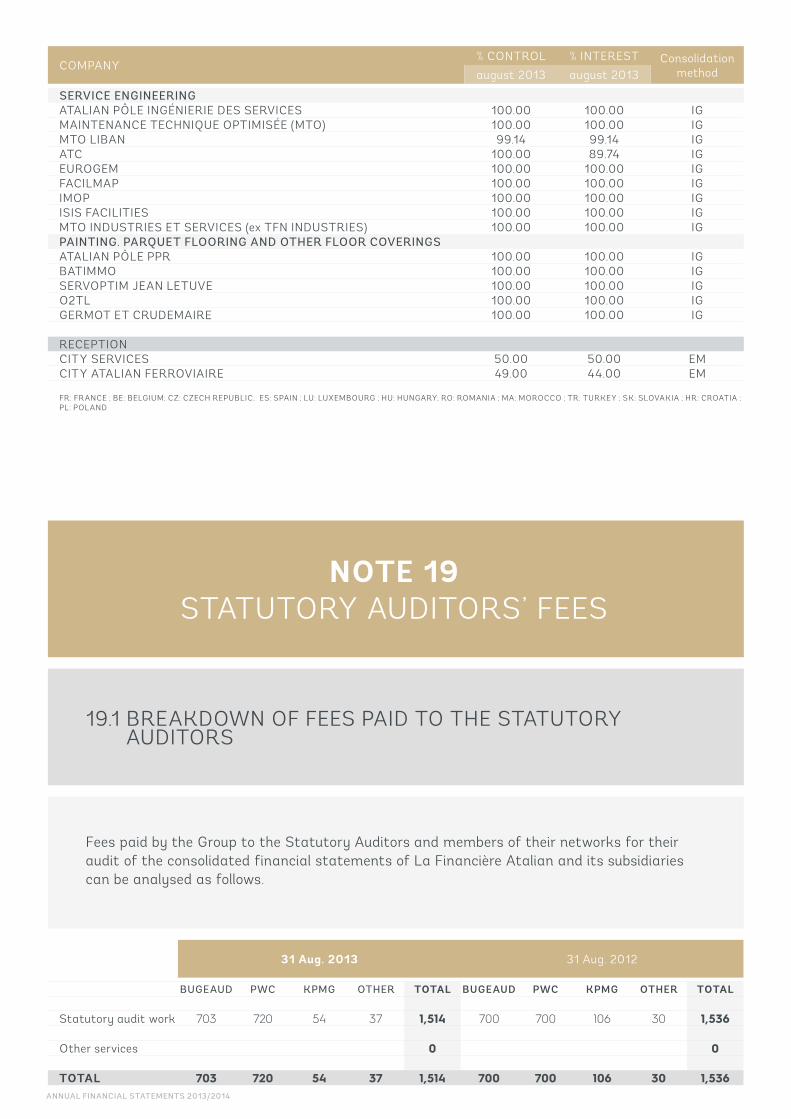
NOTE 19STATUTORY AUDITORS’ FEES
19.1 BREAKDOWN OF FEES PAID TO THE STATUTORY AUDITORS
31 Aug. 2013 31 Aug. 2012
BUGEAUD PWC KPMG OTHER TOTAL BUGEAUD PWC KPMG OTHER TOTAL
Statutory audit work 703 720 54 37 1,514 700 700 106 30 1,536
Other services 0 0
TOTAL 703 720 54 37 1,514 700 700 106 30 1,536
Fees paid by the Group to the Statutory Auditors and members of their networks for their audit of the consolidated financial statements of La Financière Atalian and its subsidiaries can be analysed as follows.
COMPANY% CONTROL % INTEREST Consolidation
methodaugust 2013 august 2013
SERVICE ENGINEERINGATALIAN PÔLE INGÉNIERIE DES SERVICES 100.00 100.00 IGMAINTENANCE TECHNIQUE OPTIMISÉE (MTO) 100.00 100.00 IGMTO LIBAN 99.14 99.14 IGATC 100.00 89.74 IGEUROGEM 100.00 100.00 IGFACILMAP 100.00 100.00 IGIMOP 100.00 100.00 IGISIS FACILITIES 100.00 100.00 IGMTO INDUSTRIES ET SERVICES (ex TFN INDUSTRIES) 100.00 100.00 IGPAINTING. PARQUET FLOORING AND OTHER FLOOR COVERINGSATALIAN PÔLE PPR 100.00 100.00 IGBATIMMO 100.00 100.00 IGSERVOPTIM JEAN LETUVE 100.00 100.00 IGO2TL 100.00 100.00 IGGERMOT ET CRUDEMAIRE 100.00 100.00 IG
RECEPTIONCITY SERVICES 50.00 50.00 EMCITY ATALIAN FERROVIAIRE 49.00 44.00 EM
FR: FRANCE ; BE: BELGIUM; CZ: CZECH REPUBLIC; ES: SPAIN ; LU: LUXEMBOURG ; HU: HUNGARY; RO: ROMANIA ; MA: MOROCCO ; TR: TURKEY ; SK: SLOVAKIA ; HR: CROATIA ; PL: POLAND
ANNUAL FINANCIAL STATEMENTS 2013/2014

122 - 123

www.atalian.com
Administrative Headquarters 111-113 quai Jules Guesde94400 Vitry-sur-SeineT. +33 1 55 53 03 00
www.atalian.com
Con
cept
ion
- cré
atio
n : M
omen
tys
- avr
il 20
14